ANNEXURES

Welcome message from author
This document is posted to help you gain knowledge. Please leave a comment to let me know what you think about it! Share it to your friends and learn new things together.
Transcript
ANNEXURES
125
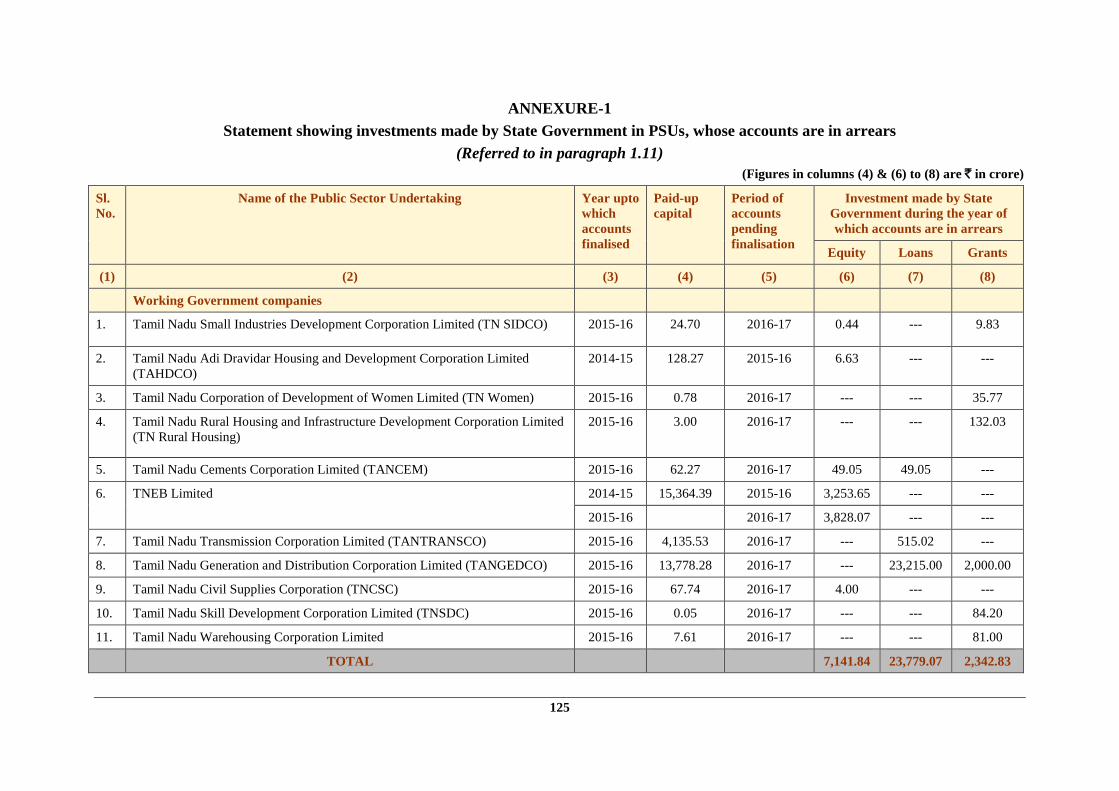
ANNEXURE-1
Statement showing investments made by State Government in PSUs, whose accounts are in arrears
(Referred to in paragraph 1.11)
(Figures in columns (4) & (6) to (8) are ` in crore)
Sl.
No.
Name of the Public Sector Undertaking Year upto
which
accounts
finalised
Paid-up
capital
Period of
accounts
pending
finalisation
Investment made by State
Government during the year of
which accounts are in arrears
Equity Loans Grants
(1) (2) (3) (4) (5) (6) (7) (8)
Working Government companies
1. Tamil Nadu Small Industries Development Corporation Limited (TN SIDCO) 2015-16 24.70 2016-17 0.44 --- 9.83
2. Tamil Nadu Adi Dravidar Housing and Development Corporation Limited
(TAHDCO)
2014-15 128.27 2015-16 6.63 --- ---
3. Tamil Nadu Corporation of Development of Women Limited (TN Women) 2015-16 0.78 2016-17 --- --- 35.77
4. Tamil Nadu Rural Housing and Infrastructure Development Corporation Limited
(TN Rural Housing)
2015-16 3.00 2016-17 --- --- 132.03
5. Tamil Nadu Cements Corporation Limited (TANCEM) 2015-16 62.27 2016-17 49.05 49.05 ---
6. TNEB Limited 2014-15 15,364.39 2015-16 3,253.65 --- ---
2015-16 2016-17 3,828.07 --- ---
7. Tamil Nadu Transmission Corporation Limited (TANTRANSCO) 2015-16 4,135.53 2016-17 --- 515.02 ---
8. Tamil Nadu Generation and Distribution Corporation Limited (TANGEDCO) 2015-16 13,778.28 2016-17 --- 23,215.00 2,000.00
9. Tamil Nadu Civil Supplies Corporation (TNCSC) 2015-16 67.74 2016-17 4.00 --- ---
10. Tamil Nadu Skill Development Corporation Limited (TNSDC) 2015-16 0.05 2016-17 --- --- 84.20
11. Tamil Nadu Warehousing Corporation Limited 2015-16 7.61 2016-17 --- --- 81.00
TOTAL 7,141.84 23,779.07 2,342.83
Audit Report (Public Sector Undertakings) for the year ended 31 March 2017
126
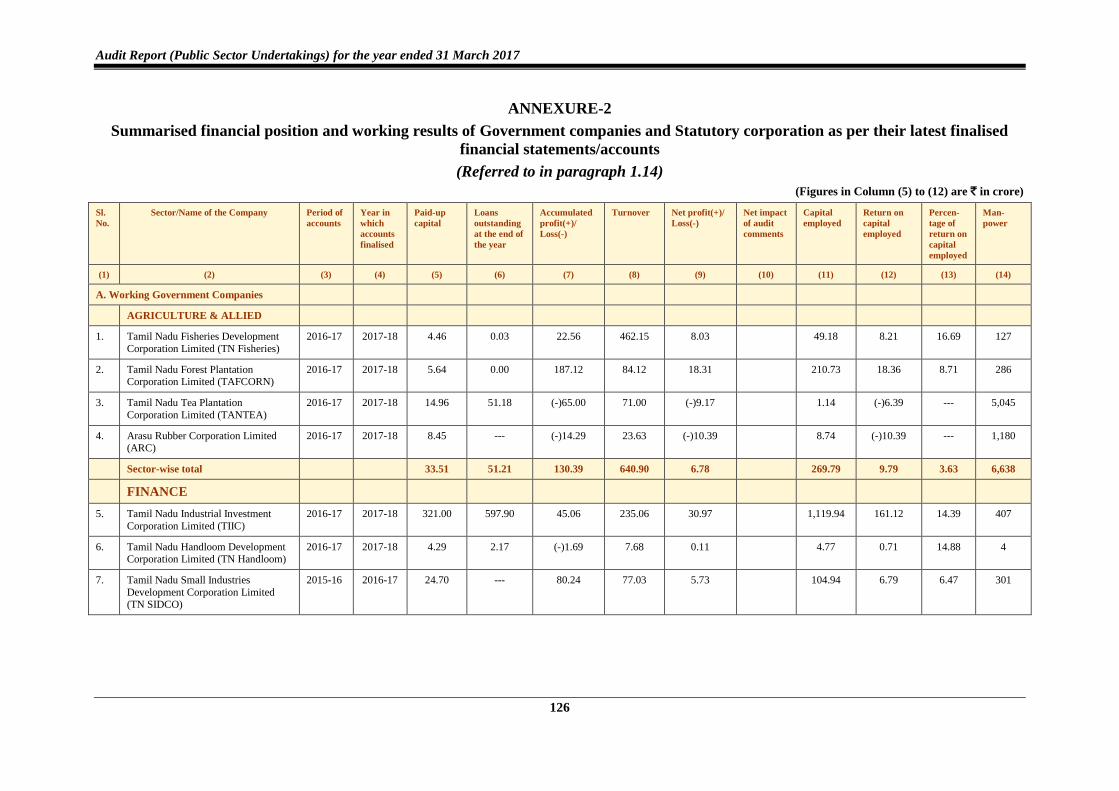
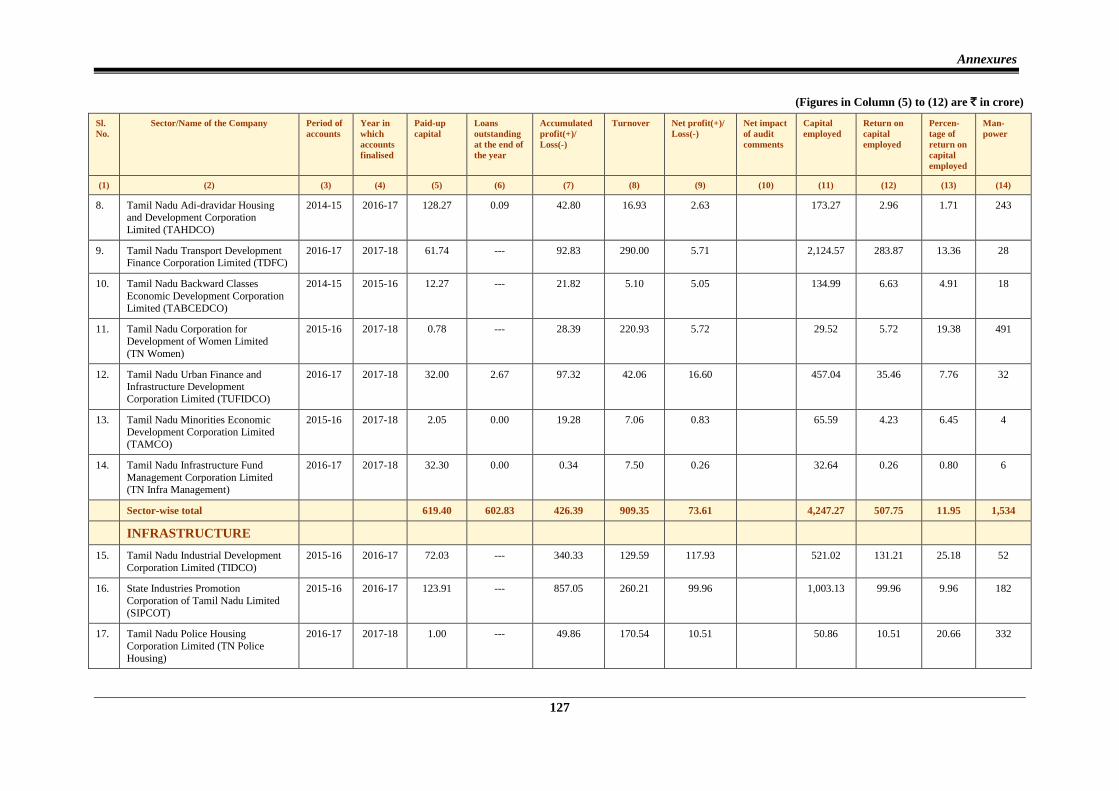
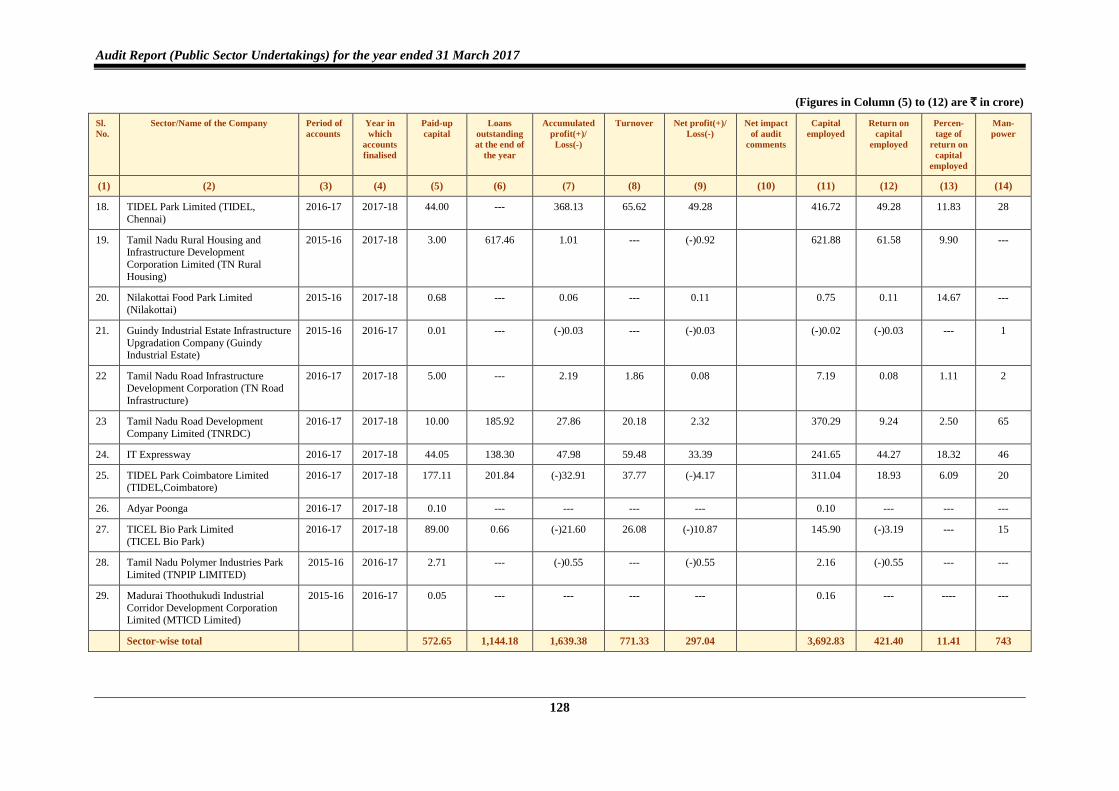
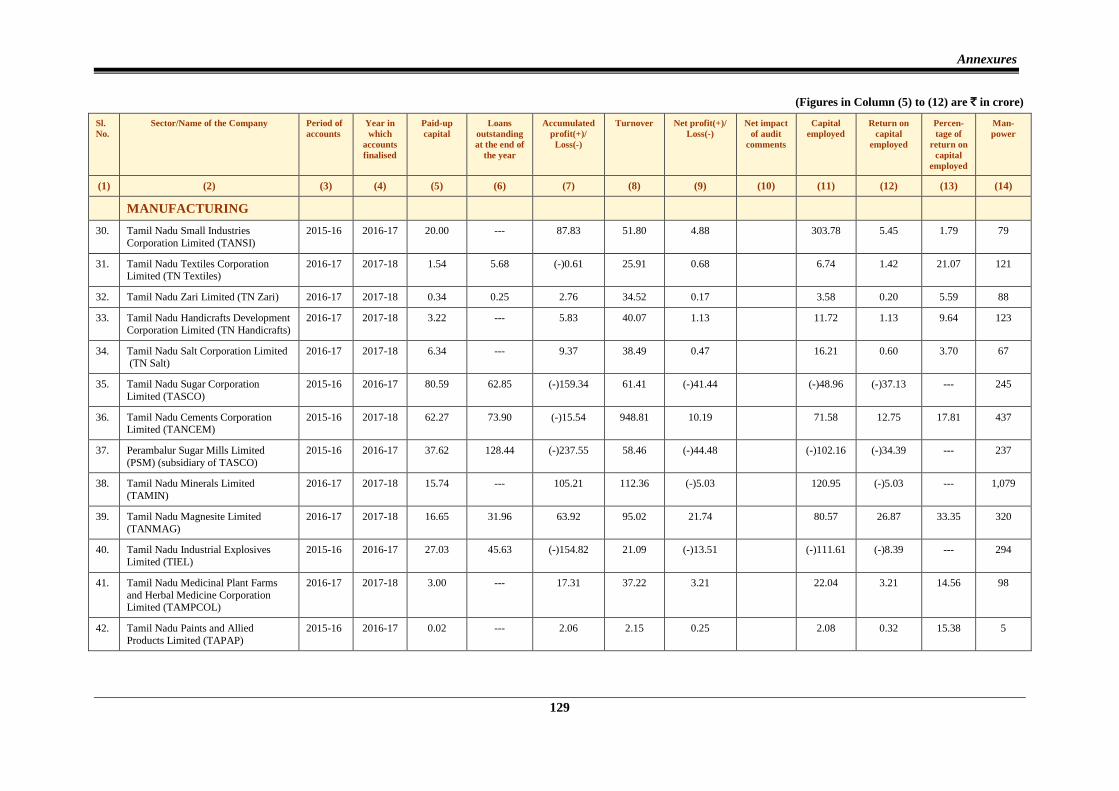
ANNEXURE-2
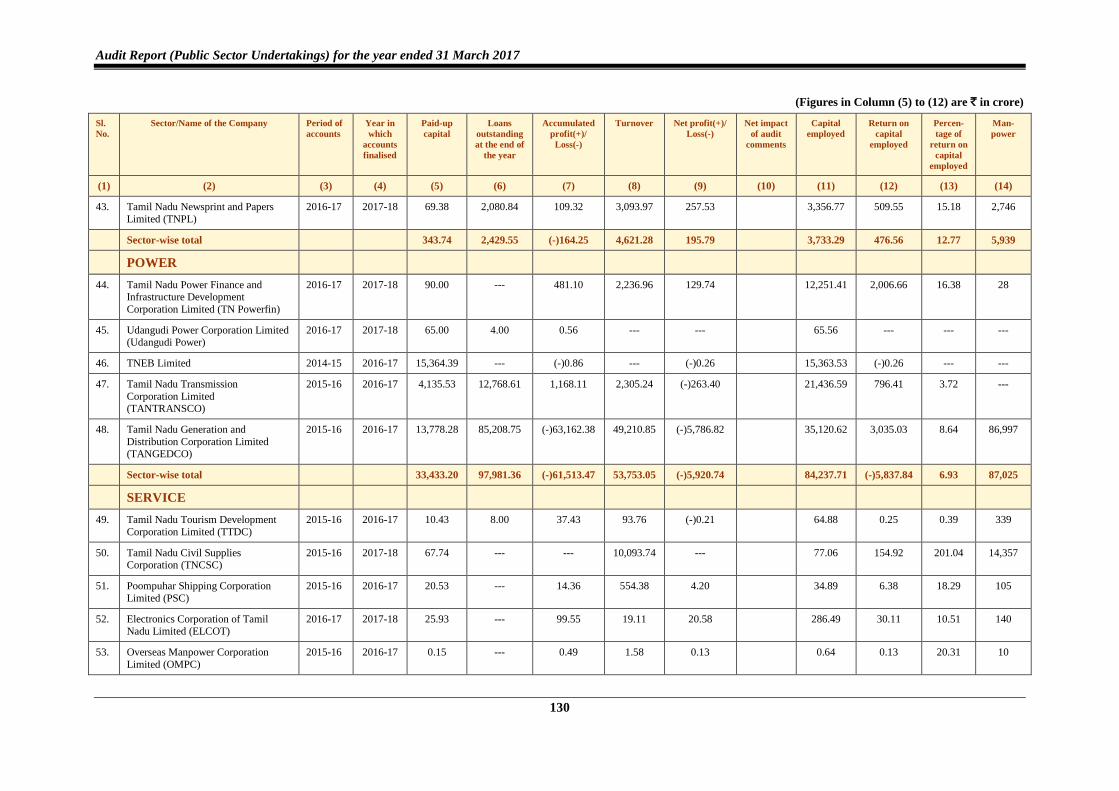
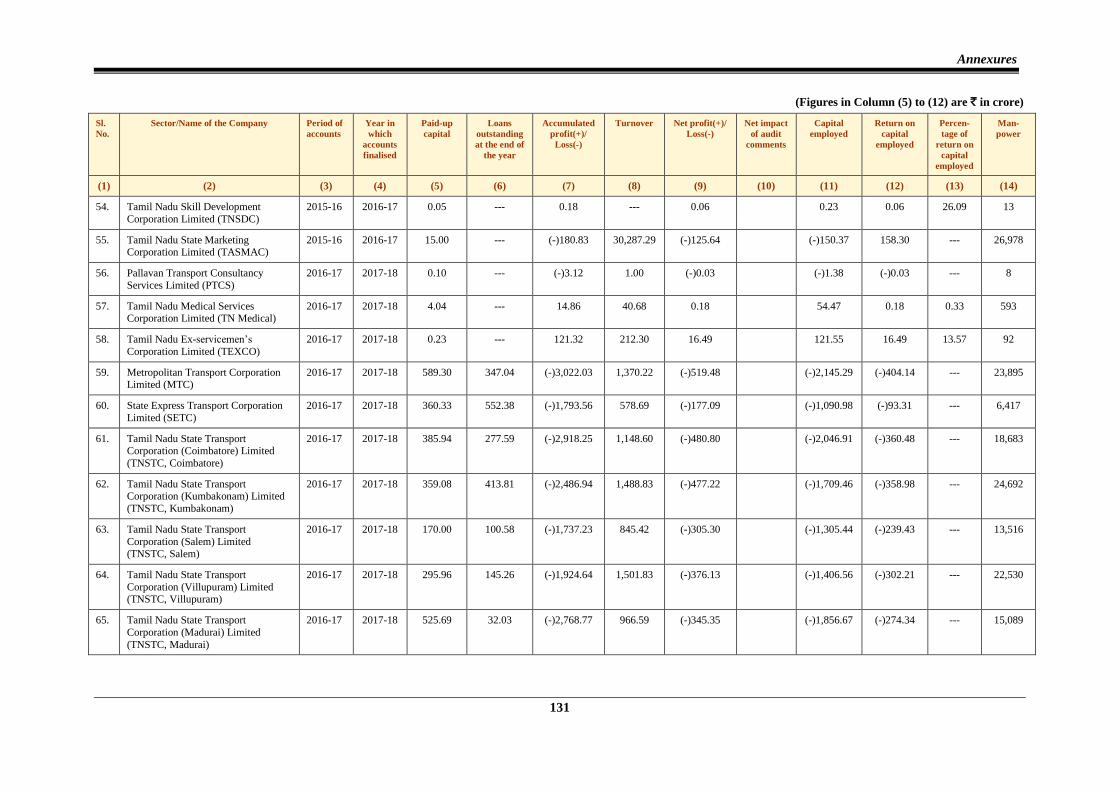
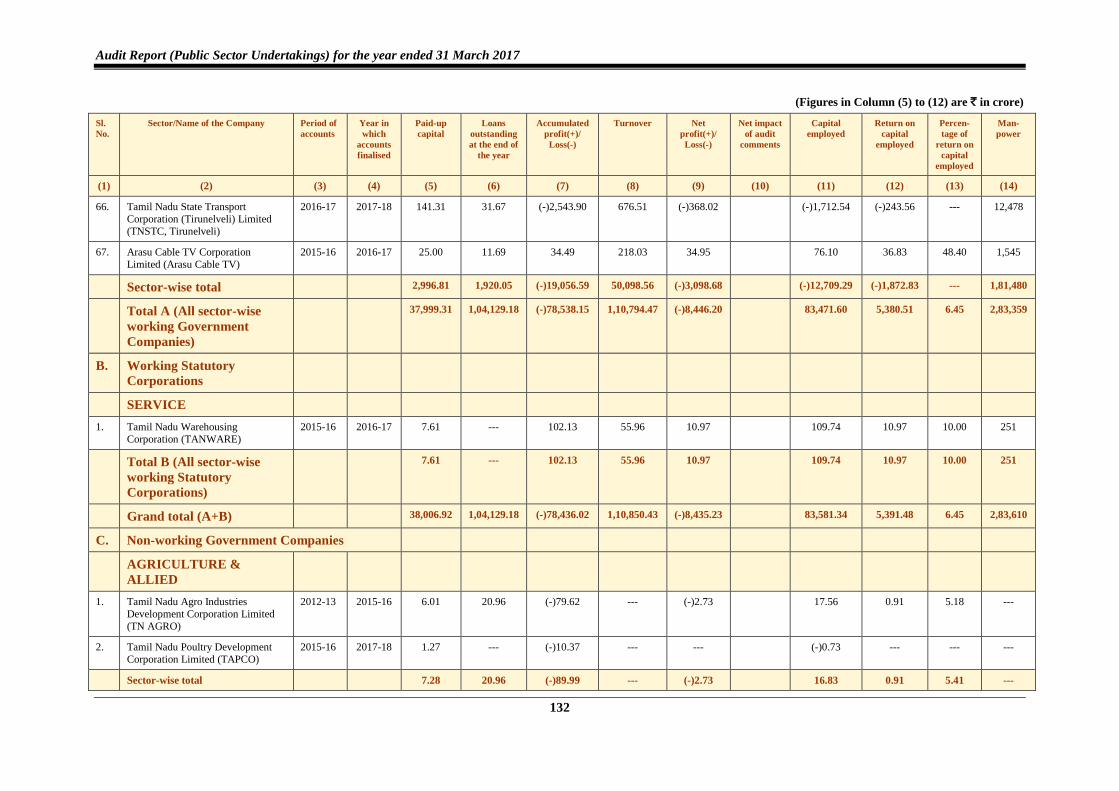
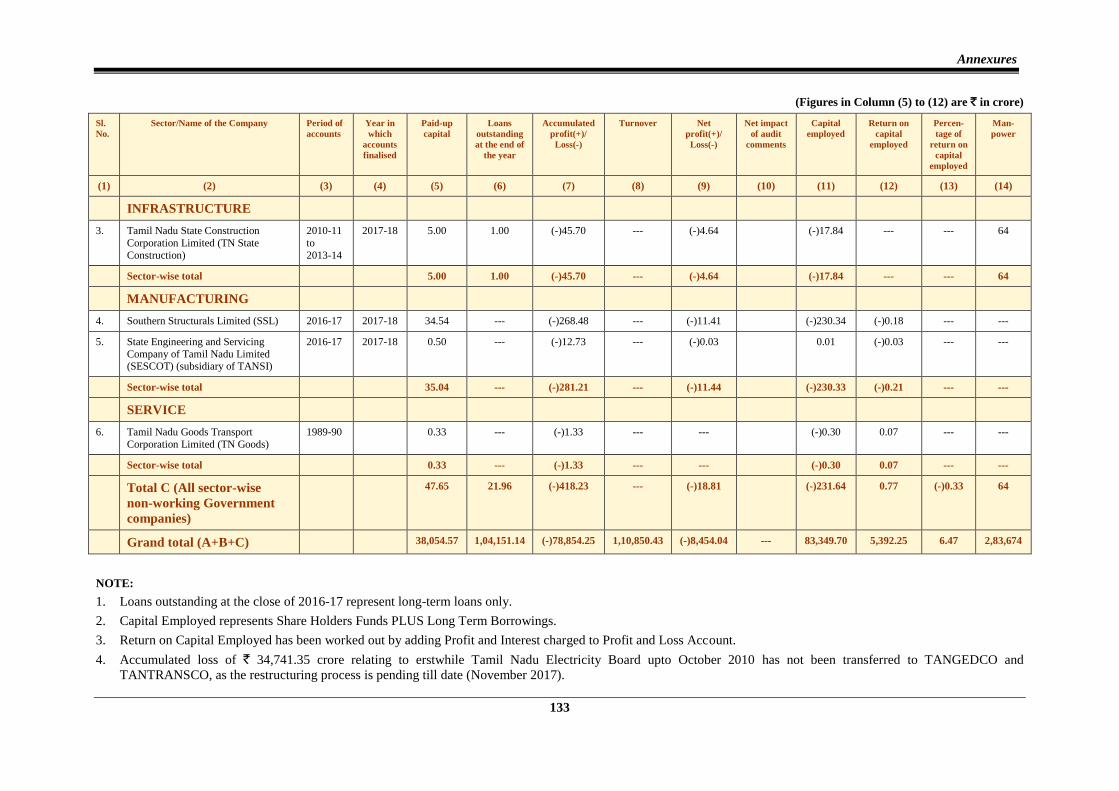
Summarised financial position and working results of Government companies and Statutory corporation as per their latest finalised
financial statements/accounts
(Referred to in paragraph 1.14)
(Figures in Column (5) to (12) are ` in crore)
Sl.
No.
Sector/Name of the Company Period of
accounts
Year in
which
accounts
finalised
Paid-up
capital
Loans
outstanding
at the end of
the year
Accumulated
profit(+)/
Loss(-)
Turnover Net profit(+)/
Loss(-)
Net impact
of audit
comments
Capital
employed
Return on
capital
employed
Percen-
tage of
return on
capital
employed
Man-
power
(1) (2) (3) (4) (5) (6) (7) (8) (9) (10) (11) (12) (13) (14)
A. Working Government Companies
AGRICULTURE & ALLIED
1. Tamil Nadu Fisheries Development
Corporation Limited (TN Fisheries)
2016-17 2017-18 4.46 0.03 22.56 462.15 8.03 49.18 8.21 16.69 127
2. Tamil Nadu Forest Plantation Corporation Limited (TAFCORN)
2016-17 2017-18 5.64 0.00 187.12 84.12 18.31 210.73 18.36 8.71 286
3. Tamil Nadu Tea Plantation
Corporation Limited (TANTEA)
2016-17 2017-18 14.96 51.18 (-)65.00 71.00 (-)9.17 1.14 (-)6.39 --- 5,045
4. Arasu Rubber Corporation Limited (ARC)
2016-17 2017-18 8.45 --- (-)14.29 23.63 (-)10.39 8.74 (-)10.39 --- 1,180
Sector-wise total 33.51 51.21 130.39 640.90 6.78 269.79 9.79 3.63 6,638
FINANCE
5. Tamil Nadu Industrial Investment
Corporation Limited (TIIC)
2016-17 2017-18 321.00 597.90 45.06 235.06 30.97 1,119.94 161.12 14.39 407
6. Tamil Nadu Handloom Development
Corporation Limited (TN Handloom)
2016-17 2017-18 4.29 2.17 (-)1.69 7.68 0.11 4.77 0.71 14.88 4
7. Tamil Nadu Small Industries
Development Corporation Limited (TN SIDCO)
2015-16 2016-17 24.70 --- 80.24 77.03 5.73 104.94 6.79 6.47 301
Annexures
127
(Figures in Column (5) to (12) are ` in crore)
Sl.
No.
Sector/Name of the Company Period of
accounts
Year in
which
accounts
finalised
Paid-up
capital
Loans
outstanding
at the end of
the year
Accumulated
profit(+)/
Loss(-)
Turnover Net profit(+)/
Loss(-)
Net impact
of audit
comments
Capital
employed
Return on
capital
employed
Percen-
tage of
return on
capital
employed
Man-
power
(1) (2) (3) (4) (5) (6) (7) (8) (9) (10) (11) (12) (13) (14)
8. Tamil Nadu Adi-dravidar Housing and Development Corporation
Limited (TAHDCO)
2014-15 2016-17 128.27 0.09 42.80 16.93 2.63 173.27 2.96 1.71 243
9. Tamil Nadu Transport Development Finance Corporation Limited (TDFC)
2016-17 2017-18 61.74 --- 92.83 290.00 5.71 2,124.57 283.87 13.36 28
10. Tamil Nadu Backward Classes
Economic Development Corporation
Limited (TABCEDCO)
2014-15 2015-16 12.27 --- 21.82 5.10 5.05 134.99 6.63 4.91 18
11. Tamil Nadu Corporation for
Development of Women Limited
(TN Women)
2015-16 2017-18 0.78 --- 28.39 220.93 5.72 29.52 5.72 19.38 491
12. Tamil Nadu Urban Finance and Infrastructure Development
Corporation Limited (TUFIDCO)
2016-17 2017-18 32.00 2.67 97.32 42.06 16.60 457.04 35.46 7.76 32
13. Tamil Nadu Minorities Economic Development Corporation Limited
(TAMCO)
2015-16 2017-18 2.05 0.00 19.28 7.06 0.83 65.59 4.23 6.45 4
14. Tamil Nadu Infrastructure Fund
Management Corporation Limited (TN Infra Management)
2016-17 2017-18 32.30 0.00 0.34 7.50 0.26 32.64 0.26 0.80 6
Sector-wise total 619.40 602.83 426.39 909.35 73.61 4,247.27 507.75 11.95 1,534
INFRASTRUCTURE
15. Tamil Nadu Industrial Development
Corporation Limited (TIDCO)
2015-16 2016-17 72.03 --- 340.33 129.59 117.93 521.02 131.21 25.18 52
16. State Industries Promotion
Corporation of Tamil Nadu Limited
(SIPCOT)
2015-16 2016-17 123.91 --- 857.05 260.21 99.96 1,003.13 99.96 9.96 182
17. Tamil Nadu Police Housing
Corporation Limited (TN Police
Housing)
2016-17 2017-18 1.00 --- 49.86 170.54 10.51 50.86 10.51 20.66 332
Audit Report (Public Sector Undertakings) for the year ended 31 March 2017
128
(Figures in Column (5) to (12) are ` in crore)
Sl.
No.
Sector/Name of the Company Period of
accounts
Year in
which
accounts
finalised
Paid-up
capital
Loans
outstanding
at the end of
the year
Accumulated
profit(+)/
Loss(-)
Turnover Net profit(+)/
Loss(-)
Net impact
of audit
comments
Capital
employed
Return on
capital
employed
Percen-
tage of
return on
capital
employed
Man-
power
(1) (2) (3) (4) (5) (6) (7) (8) (9) (10) (11) (12) (13) (14)
18. TIDEL Park Limited (TIDEL,
Chennai)
2016-17 2017-18 44.00 --- 368.13 65.62 49.28 416.72 49.28 11.83 28
19. Tamil Nadu Rural Housing and Infrastructure Development
Corporation Limited (TN Rural
Housing)
2015-16 2017-18 3.00 617.46 1.01 --- (-)0.92 621.88 61.58 9.90 ---
20. Nilakottai Food Park Limited (Nilakottai)
2015-16 2017-18 0.68 --- 0.06 --- 0.11 0.75 0.11 14.67 ---
21. Guindy Industrial Estate Infrastructure
Upgradation Company (Guindy Industrial Estate)
2015-16 2016-17 0.01 --- (-)0.03 --- (-)0.03 (-)0.02 (-)0.03 --- 1
22 Tamil Nadu Road Infrastructure
Development Corporation (TN Road
Infrastructure)
2016-17 2017-18 5.00 --- 2.19 1.86 0.08 7.19 0.08 1.11 2
23 Tamil Nadu Road Development
Company Limited (TNRDC)
2016-17 2017-18 10.00 185.92 27.86 20.18 2.32 370.29 9.24 2.50 65
24. IT Expressway 2016-17 2017-18 44.05 138.30 47.98 59.48 33.39 241.65 44.27 18.32 46
25. TIDEL Park Coimbatore Limited (TIDEL,Coimbatore)
2016-17 2017-18 177.11 201.84 (-)32.91 37.77 (-)4.17 311.04 18.93 6.09 20
26. Adyar Poonga 2016-17 2017-18 0.10 --- --- --- --- 0.10 --- --- ---
27. TICEL Bio Park Limited
(TICEL Bio Park)
2016-17 2017-18 89.00 0.66 (-)21.60 26.08 (-)10.87 145.90 (-)3.19 --- 15
28. Tamil Nadu Polymer Industries Park
Limited (TNPIP LIMITED)
2015-16 2016-17 2.71 --- (-)0.55 --- (-)0.55 2.16 (-)0.55 --- ---
29. Madurai Thoothukudi Industrial
Corridor Development Corporation Limited (MTICD Limited)
2015-16 2016-17 0.05 --- --- --- --- 0.16 --- ---- ---
Sector-wise total 572.65 1,144.18 1,639.38 771.33 297.04 3,692.83 421.40 11.41 743
Annexures
129
(Figures in Column (5) to (12) are ` in crore)
Sl.
No.
Sector/Name of the Company Period of
accounts
Year in
which
accounts
finalised
Paid-up
capital
Loans
outstanding
at the end of
the year
Accumulated
profit(+)/
Loss(-)
Turnover Net profit(+)/
Loss(-)
Net impact
of audit
comments
Capital
employed
Return on
capital
employed
Percen-
tage of
return on
capital
employed
Man-
power
(1) (2) (3) (4) (5) (6) (7) (8) (9) (10) (11) (12) (13) (14)
MANUFACTURING
30. Tamil Nadu Small Industries
Corporation Limited (TANSI)
2015-16 2016-17 20.00 --- 87.83 51.80 4.88 303.78 5.45 1.79 79
31. Tamil Nadu Textiles Corporation Limited (TN Textiles)
2016-17 2017-18 1.54 5.68 (-)0.61 25.91 0.68 6.74 1.42 21.07 121
32. Tamil Nadu Zari Limited (TN Zari) 2016-17 2017-18 0.34 0.25 2.76 34.52 0.17 3.58 0.20 5.59 88
33. Tamil Nadu Handicrafts Development
Corporation Limited (TN Handicrafts)
2016-17 2017-18 3.22 --- 5.83 40.07 1.13 11.72 1.13 9.64 123
34. Tamil Nadu Salt Corporation Limited (TN Salt)
2016-17 2017-18 6.34 --- 9.37 38.49 0.47 16.21 0.60 3.70 67
35. Tamil Nadu Sugar Corporation
Limited (TASCO)
2015-16 2016-17 80.59 62.85 (-)159.34 61.41 (-)41.44 (-)48.96 (-)37.13 --- 245
36. Tamil Nadu Cements Corporation Limited (TANCEM)
2015-16 2017-18 62.27 73.90 (-)15.54 948.81 10.19 71.58 12.75 17.81 437
37. Perambalur Sugar Mills Limited
(PSM) (subsidiary of TASCO)
2015-16 2016-17 37.62 128.44 (-)237.55 58.46 (-)44.48 (-)102.16 (-)34.39 --- 237
38. Tamil Nadu Minerals Limited
(TAMIN)
2016-17 2017-18 15.74 --- 105.21 112.36 (-)5.03 120.95 (-)5.03 --- 1,079
39. Tamil Nadu Magnesite Limited
(TANMAG)
2016-17 2017-18 16.65 31.96 63.92 95.02 21.74 80.57 26.87 33.35 320
40. Tamil Nadu Industrial Explosives
Limited (TIEL)
2015-16 2016-17 27.03 45.63 (-)154.82 21.09 (-)13.51 (-)111.61 (-)8.39 --- 294
41. Tamil Nadu Medicinal Plant Farms
and Herbal Medicine Corporation Limited (TAMPCOL)
2016-17 2017-18 3.00 --- 17.31 37.22 3.21 22.04 3.21 14.56 98
42. Tamil Nadu Paints and Allied
Products Limited (TAPAP)
2015-16 2016-17 0.02 --- 2.06 2.15 0.25 2.08 0.32 15.38 5
Audit Report (Public Sector Undertakings) for the year ended 31 March 2017
130
(Figures in Column (5) to (12) are ` in crore)
Sl.
No.
Sector/Name of the Company Period of
accounts
Year in
which
accounts
finalised
Paid-up
capital
Loans
outstanding
at the end of
the year
Accumulated
profit(+)/
Loss(-)
Turnover Net profit(+)/
Loss(-)
Net impact
of audit
comments
Capital
employed
Return on
capital
employed
Percen-
tage of
return on
capital
employed
Man-
power
(1) (2) (3) (4) (5) (6) (7) (8) (9) (10) (11) (12) (13) (14)
43. Tamil Nadu Newsprint and Papers
Limited (TNPL)
2016-17 2017-18 69.38 2,080.84 109.32 3,093.97 257.53 3,356.77 509.55 15.18 2,746
Sector-wise total 343.74 2,429.55 (-)164.25 4,621.28 195.79 3,733.29 476.56 12.77 5,939
POWER
44. Tamil Nadu Power Finance and Infrastructure Development
Corporation Limited (TN Powerfin)
2016-17 2017-18 90.00 --- 481.10 2,236.96 129.74 12,251.41 2,006.66 16.38 28
45. Udangudi Power Corporation Limited (Udangudi Power)
2016-17 2017-18 65.00 4.00 0.56 --- --- 65.56 --- --- ---
46. TNEB Limited 2014-15 2016-17 15,364.39 --- (-)0.86 --- (-)0.26 15,363.53 (-)0.26 --- ---
47. Tamil Nadu Transmission
Corporation Limited (TANTRANSCO)
2015-16 2016-17 4,135.53 12,768.61 1,168.11 2,305.24 (-)263.40 21,436.59 796.41 3.72 ---
48. Tamil Nadu Generation and
Distribution Corporation Limited (TANGEDCO)
2015-16 2016-17 13,778.28 85,208.75 (-)63,162.38 49,210.85 (-)5,786.82 35,120.62 3,035.03 8.64 86,997
Sector-wise total 33,433.20 97,981.36 (-)61,513.47 53,753.05 (-)5,920.74 84,237.71 (-)5,837.84 6.93 87,025
SERVICE
49. Tamil Nadu Tourism Development
Corporation Limited (TTDC)
2015-16 2016-17 10.43 8.00 37.43 93.76 (-)0.21 64.88 0.25 0.39 339
50. Tamil Nadu Civil Supplies Corporation (TNCSC)
2015-16 2017-18 67.74 --- --- 10,093.74 --- 77.06 154.92 201.04 14,357
51. Poompuhar Shipping Corporation
Limited (PSC)
2015-16 2016-17 20.53 --- 14.36 554.38 4.20 34.89 6.38 18.29 105
52. Electronics Corporation of Tamil Nadu Limited (ELCOT)
2016-17 2017-18 25.93 --- 99.55 19.11 20.58 286.49 30.11 10.51 140
53. Overseas Manpower Corporation
Limited (OMPC)
2015-16 2016-17 0.15 --- 0.49 1.58 0.13 0.64 0.13 20.31 10
Annexures
131
(Figures in Column (5) to (12) are ` in crore)
Sl.
No.
Sector/Name of the Company Period of
accounts
Year in
which
accounts
finalised
Paid-up
capital
Loans
outstanding
at the end of
the year
Accumulated
profit(+)/
Loss(-)
Turnover Net profit(+)/
Loss(-)
Net impact
of audit
comments
Capital
employed
Return on
capital
employed
Percen-
tage of
return on
capital
employed
Man-
power
(1) (2) (3) (4) (5) (6) (7) (8) (9) (10) (11) (12) (13) (14)
54. Tamil Nadu Skill Development
Corporation Limited (TNSDC)
2015-16 2016-17 0.05 --- 0.18 --- 0.06 0.23 0.06 26.09 13
55. Tamil Nadu State Marketing Corporation Limited (TASMAC)
2015-16 2016-17 15.00 --- (-)180.83 30,287.29 (-)125.64 (-)150.37 158.30 --- 26,978
56. Pallavan Transport Consultancy
Services Limited (PTCS)
2016-17 2017-18 0.10 --- (-)3.12 1.00 (-)0.03 (-)1.38 (-)0.03 --- 8
57. Tamil Nadu Medical Services Corporation Limited (TN Medical)
2016-17 2017-18 4.04 --- 14.86 40.68 0.18 54.47 0.18 0.33 593
58. Tamil Nadu Ex-servicemen’s
Corporation Limited (TEXCO)
2016-17 2017-18 0.23 --- 121.32 212.30 16.49 121.55 16.49 13.57 92
59. Metropolitan Transport Corporation Limited (MTC)
2016-17 2017-18 589.30 347.04 (-)3,022.03 1,370.22 (-)519.48 (-)2,145.29 (-)404.14 --- 23,895
60. State Express Transport Corporation
Limited (SETC)
2016-17 2017-18 360.33 552.38 (-)1,793.56 578.69 (-)177.09 (-)1,090.98 (-)93.31 --- 6,417
61. Tamil Nadu State Transport Corporation (Coimbatore) Limited
(TNSTC, Coimbatore)
2016-17 2017-18 385.94 277.59 (-)2,918.25 1,148.60 (-)480.80 (-)2,046.91 (-)360.48 --- 18,683
62. Tamil Nadu State Transport Corporation (Kumbakonam) Limited
(TNSTC, Kumbakonam)
2016-17 2017-18 359.08 413.81 (-)2,486.94 1,488.83 (-)477.22 (-)1,709.46 (-)358.98 --- 24,692
63. Tamil Nadu State Transport
Corporation (Salem) Limited
(TNSTC, Salem)
2016-17 2017-18 170.00 100.58 (-)1,737.23 845.42 (-)305.30 (-)1,305.44 (-)239.43 --- 13,516
64. Tamil Nadu State Transport
Corporation (Villupuram) Limited (TNSTC, Villupuram)
2016-17 2017-18 295.96 145.26 (-)1,924.64 1,501.83 (-)376.13 (-)1,406.56 (-)302.21 --- 22,530
65. Tamil Nadu State Transport
Corporation (Madurai) Limited
(TNSTC, Madurai)
2016-17 2017-18 525.69 32.03 (-)2,768.77 966.59 (-)345.35 (-)1,856.67 (-)274.34 --- 15,089
Audit Report (Public Sector Undertakings) for the year ended 31 March 2017
132
(Figures in Column (5) to (12) are ` in crore)
Sl.
No.
Sector/Name of the Company Period of
accounts
Year in
which
accounts
finalised
Paid-up
capital
Loans
outstanding
at the end of
the year
Accumulated
profit(+)/
Loss(-)
Turnover Net
profit(+)/
Loss(-)
Net impact
of audit
comments
Capital
employed
Return on
capital
employed
Percen-
tage of
return on
capital
employed
Man-
power
(1) (2) (3) (4) (5) (6) (7) (8) (9) (10) (11) (12) (13) (14)
66. Tamil Nadu State Transport
Corporation (Tirunelveli) Limited
(TNSTC, Tirunelveli)
2016-17 2017-18 141.31 31.67 (-)2,543.90 676.51 (-)368.02 (-)1,712.54 (-)243.56 --- 12,478
67. Arasu Cable TV Corporation
Limited (Arasu Cable TV)
2015-16 2016-17 25.00 11.69 34.49 218.03 34.95 76.10 36.83 48.40 1,545
Sector-wise total 2,996.81 1,920.05 (-)19,056.59 50,098.56 (-)3,098.68 (-)12,709.29 (-)1,872.83 --- 1,81,480
Total A (All sector-wise
working Government
Companies)
37,999.31 1,04,129.18 (-)78,538.15 1,10,794.47 (-)8,446.20 83,471.60 5,380.51 6.45 2,83,359
B. Working Statutory
Corporations
SERVICE
1. Tamil Nadu Warehousing
Corporation (TANWARE)
2015-16 2016-17 7.61 --- 102.13 55.96 10.97 109.74 10.97 10.00 251
Total B (All sector-wise
working Statutory
Corporations)
7.61 --- 102.13 55.96 10.97 109.74 10.97 10.00 251
Grand total (A+B) 38,006.92 1,04,129.18 (-)78,436.02 1,10,850.43 (-)8,435.23 83,581.34 5,391.48 6.45 2,83,610
C. Non-working Government Companies
AGRICULTURE &
ALLIED
1. Tamil Nadu Agro Industries
Development Corporation Limited
(TN AGRO)
2012-13 2015-16 6.01 20.96 (-)79.62 --- (-)2.73 17.56 0.91 5.18 ---
2. Tamil Nadu Poultry Development
Corporation Limited (TAPCO)
2015-16 2017-18 1.27 --- (-)10.37 --- --- (-)0.73 --- --- ---
Sector-wise total 7.28 20.96 (-)89.99 --- (-)2.73 16.83 0.91 5.41 ---
Annexures
133
(Figures in Column (5) to (12) are ` in crore)
Sl.
No.
Sector/Name of the Company Period of
accounts
Year in
which
accounts
finalised
Paid-up
capital
Loans
outstanding
at the end of
the year
Accumulated
profit(+)/
Loss(-)
Turnover Net
profit(+)/
Loss(-)
Net impact
of audit
comments
Capital
employed
Return on
capital
employed
Percen-
tage of
return on
capital
employed
Man-
power
(1) (2) (3) (4) (5) (6) (7) (8) (9) (10) (11) (12) (13) (14)
INFRASTRUCTURE
3. Tamil Nadu State Construction
Corporation Limited (TN State
Construction)
2010-11
to
2013-14
2017-18 5.00 1.00 (-)45.70 --- (-)4.64 (-)17.84 --- --- 64
Sector-wise total 5.00 1.00 (-)45.70 --- (-)4.64 (-)17.84 --- --- 64
MANUFACTURING
4. Southern Structurals Limited (SSL) 2016-17 2017-18 34.54 --- (-)268.48 --- (-)11.41 (-)230.34 (-)0.18 --- ---
5. State Engineering and Servicing
Company of Tamil Nadu Limited (SESCOT) (subsidiary of TANSI)
2016-17 2017-18 0.50 --- (-)12.73 --- (-)0.03 0.01 (-)0.03 --- ---
Sector-wise total 35.04 --- (-)281.21 --- (-)11.44 (-)230.33 (-)0.21 --- ---
SERVICE
6. Tamil Nadu Goods Transport
Corporation Limited (TN Goods)
1989-90 0.33 --- (-)1.33 --- --- (-)0.30 0.07 --- ---
Sector-wise total 0.33 --- (-)1.33 --- --- (-)0.30 0.07 --- ---
Total C (All sector-wise
non-working Government
companies)
47.65 21.96 (-)418.23 --- (-)18.81 (-)231.64 0.77 (-)0.33 64
Grand total (A+B+C) 38,054.57 1,04,151.14 (-)78,854.25 1,10,850.43 (-)8,454.04 --- 83,349.70 5,392.25 6.47 2,83,674
NOTE:
1. Loans outstanding at the close of 2016-17 represent long-term loans only.
2. Capital Employed represents Share Holders Funds PLUS Long Term Borrowings.
3. Return on Capital Employed has been worked out by adding Profit and Interest charged to Profit and Loss Account.
4. Accumulated loss of ` 34,741.35 crore relating to erstwhile Tamil Nadu Electricity Board upto October 2010 has not been transferred to TANGEDCO and
TANTRANSCO, as the restructuring process is pending till date (November 2017).
Audit Report (Public Sector Undertakings) for the year ended 31 March 2017
134
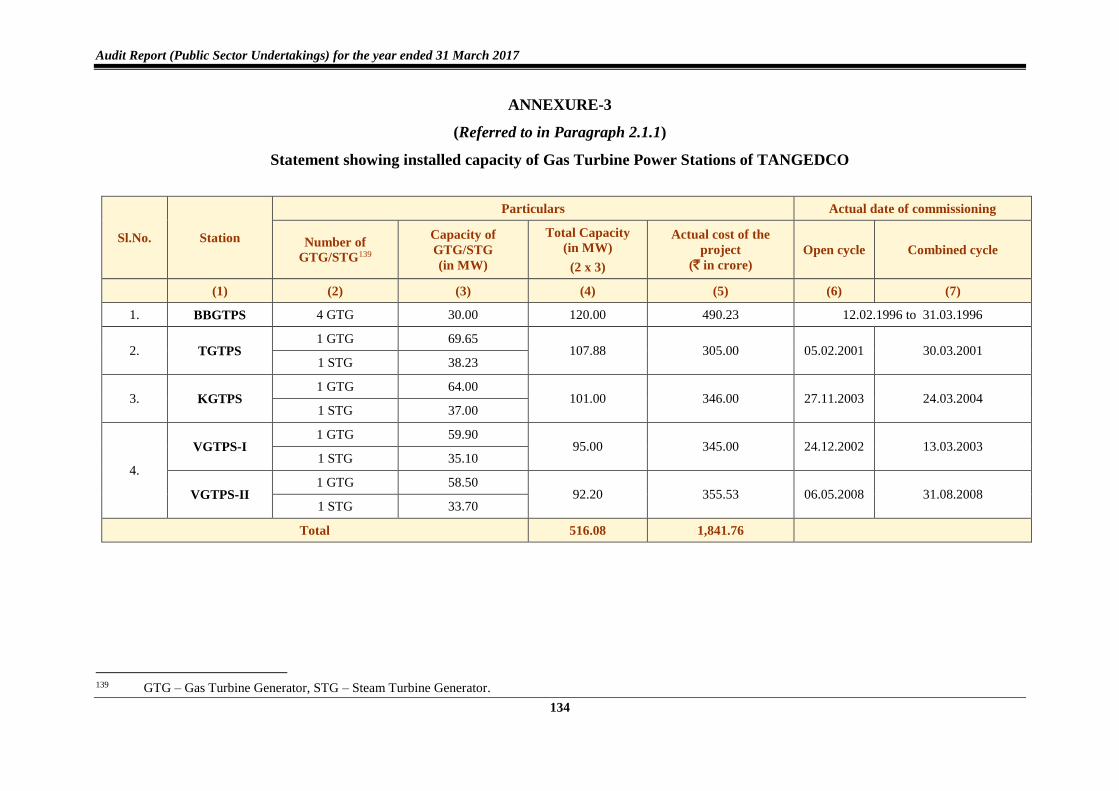
ANNEXURE-3
(Referred to in Paragraph 2.1.1)
Statement showing installed capacity of Gas Turbine Power Stations of TANGEDCO
Sl.No. Station
Particulars Actual date of commissioning
Number of
GTG/STG139
Capacity of
GTG/STG
(in MW)
Total Capacity
(in MW)
(2 x 3)
Actual cost of the
project
(` in crore)
Open cycle Combined cycle
(1) (2) (3) (4) (5) (6) (7)
1. BBGTPS 4 GTG 30.00 120.00 490.23 12.02.1996 to 31.03.1996
2. TGTPS 1 GTG 69.65
107.88 305.00 05.02.2001 30.03.2001 1 STG 38.23
3. KGTPS 1 GTG 64.00
101.00 346.00 27.11.2003 24.03.2004 1 STG 37.00
4.
VGTPS-I 1 GTG 59.90
95.00 345.00 24.12.2002 13.03.2003 1 STG 35.10
VGTPS-II 1 GTG 58.50
92.20 355.53 06.05.2008 31.08.2008 1 STG 33.70
Total 516.08 1,841.76
139 GTG – Gas Turbine Generator, STG – Steam Turbine Generator.
Annexures
135
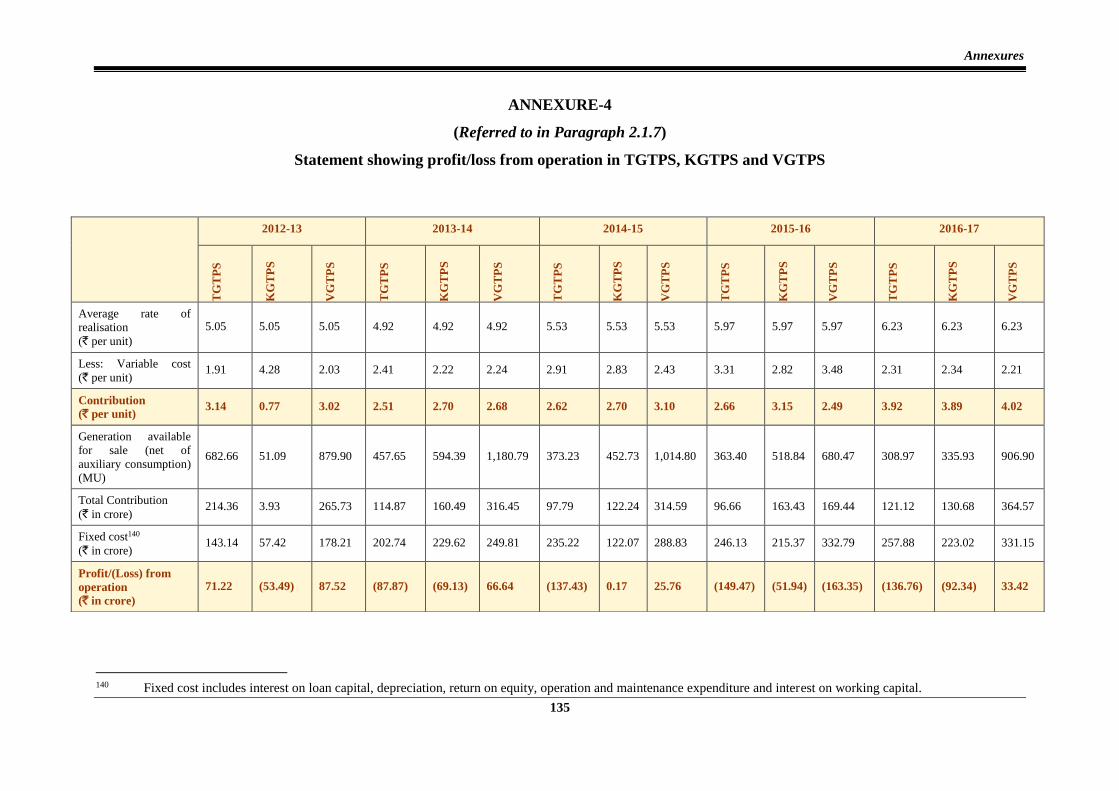
ANNEXURE-4
(Referred to in Paragraph 2.1.7)
Statement showing profit/loss from operation in TGTPS, KGTPS and VGTPS
140 Fixed cost includes interest on loan capital, depreciation, return on equity, operation and maintenance expenditure and interest on working capital.
2012-13 2013-14 2014-15 2015-16 2016-17 T
GT
PS
KG
TP
S
VG
TP
S
TG
TP
S
KG
TP
S
VG
TP
S
TG
TP
S
KG
TP
S
VG
TP
S
TG
TP
S
KG
TP
S
VG
TP
S
TG
TP
S
KG
TP
S
VG
TP
S
Average rate of
realisation
(` per unit)
5.05 5.05 5.05 4.92 4.92 4.92 5.53 5.53 5.53 5.97 5.97 5.97 6.23 6.23 6.23
Less: Variable cost
(` per unit) 1.91 4.28 2.03 2.41 2.22 2.24 2.91 2.83 2.43 3.31 2.82 3.48 2.31 2.34 2.21
Contribution
(` per unit) 3.14 0.77 3.02 2.51 2.70 2.68 2.62 2.70 3.10 2.66 3.15 2.49 3.92 3.89 4.02
Generation available
for sale (net of
auxiliary consumption)
(MU)
682.66 51.09 879.90 457.65 594.39 1,180.79 373.23 452.73 1,014.80 363.40 518.84 680.47 308.97 335.93 906.90
Total Contribution
(` in crore) 214.36 3.93 265.73 114.87 160.49 316.45 97.79 122.24 314.59 96.66 163.43 169.44 121.12 130.68 364.57
Fixed cost140
(` in crore) 143.14 57.42 178.21 202.74 229.62 249.81 235.22 122.07 288.83 246.13 215.37 332.79 257.88 223.02 331.15
Profit/(Loss) from
operation
(` in crore)
71.22 (53.49) 87.52 (87.87) (69.13) 66.64 (137.43) 0.17 25.76 (149.47) (51.94) (163.35) (136.76) (92.34) 33.42
Audit Report (Public Sector Undertakings) for the year ended 31 March 2017
136
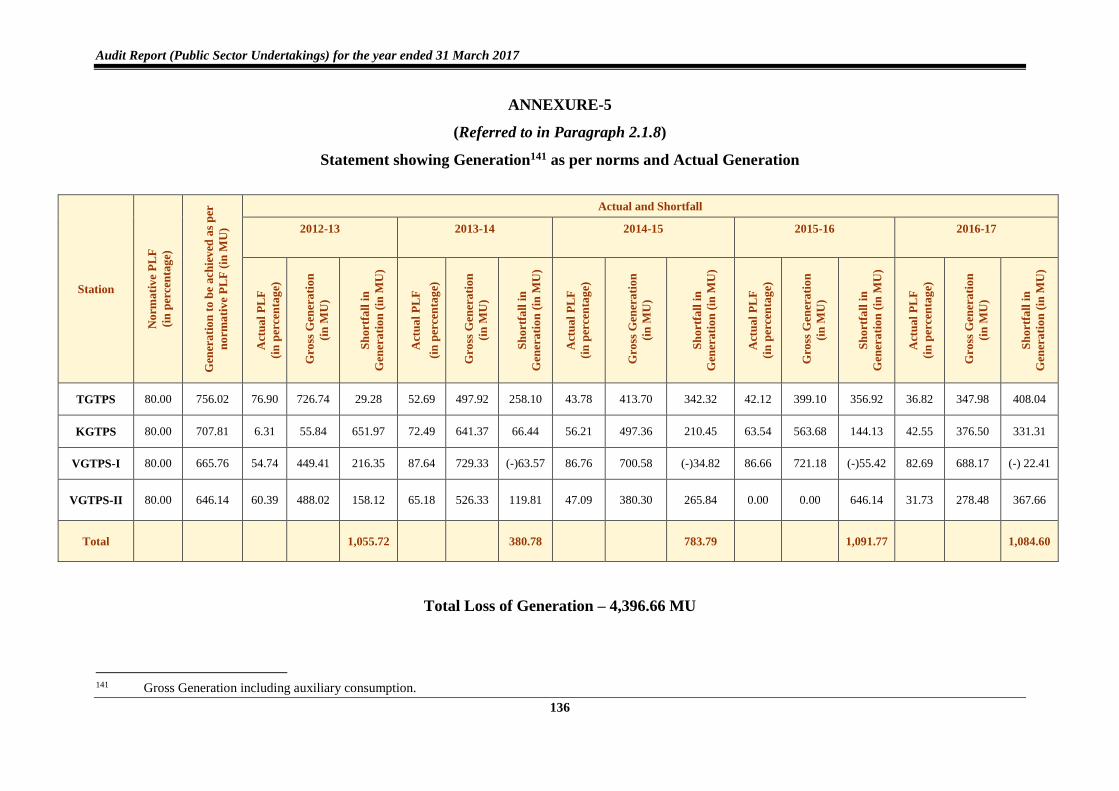
ANNEXURE-5
(Referred to in Paragraph 2.1.8)
Statement showing Generation141 as per norms and Actual Generation
Station
No
rma
tiv
e P
LF
(in
per
cen
tag
e)
Gen
era
tio
n t
o b
e a
chie
ved
as
per
no
rma
tiv
e P
LF
(in
MU
)
Actual and Shortfall
2012-13 2013-14 2014-15 2015-16 2016-17
Act
ua
l P
LF
(in
per
cen
tag
e)
Gro
ss G
ener
ati
on
(in
MU
)
Sh
ort
fall
in
Gen
era
tio
n (
in M
U)
Act
ua
l P
LF
(in
per
cen
tag
e)
Gro
ss G
ener
ati
on
(in
MU
)
Sh
ort
fall
in
Gen
era
tio
n (
in M
U)
Act
ua
l P
LF
(in
per
cen
tag
e)
Gro
ss G
ener
ati
on
(in
MU
)
Sh
ort
fall
in
Gen
era
tio
n (
in M
U)
Act
ua
l P
LF
(in
per
cen
tag
e)
Gro
ss G
ener
ati
on
(in
MU
)
Sh
ort
fall
in
Gen
era
tio
n (
in M
U)
Act
ua
l P
LF
(in
per
cen
tag
e)
Gro
ss G
ener
ati
on
(in
MU
)
Sh
ort
fall
in
Gen
era
tio
n (
in M
U)
TGTPS 80.00 756.02 76.90 726.74 29.28 52.69 497.92 258.10 43.78 413.70 342.32 42.12 399.10 356.92 36.82 347.98 408.04
KGTPS 80.00 707.81 6.31 55.84 651.97 72.49 641.37 66.44 56.21 497.36 210.45 63.54 563.68 144.13 42.55 376.50 331.31
VGTPS-I 80.00 665.76 54.74 449.41 216.35 87.64 729.33 (-)63.57 86.76 700.58 (-)34.82 86.66 721.18 (-)55.42 82.69 688.17 (-) 22.41
VGTPS-II 80.00 646.14 60.39 488.02 158.12 65.18 526.33 119.81 47.09 380.30 265.84 0.00 0.00 646.14 31.73 278.48 367.66
Total 1,055.72 380.78 783.79 1,091.77 1,084.60
Total Loss of Generation – 4,396.66 MU
141 Gross Generation including auxiliary consumption.
Annexures
137
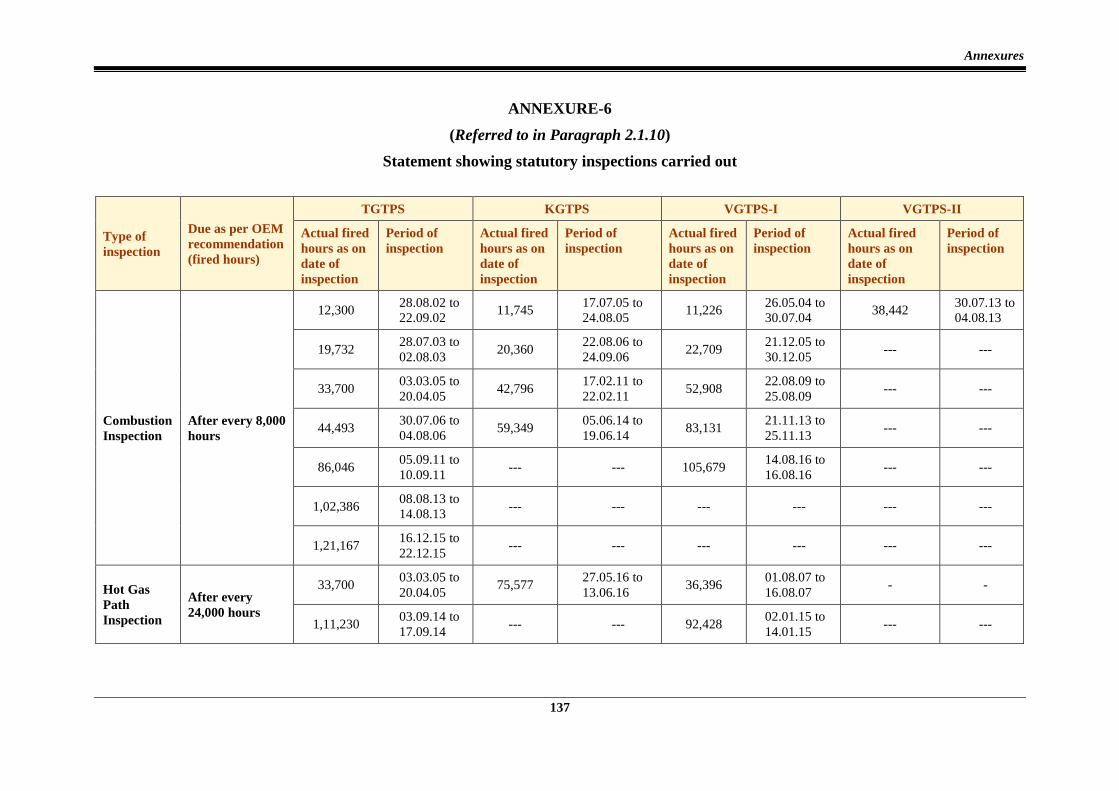
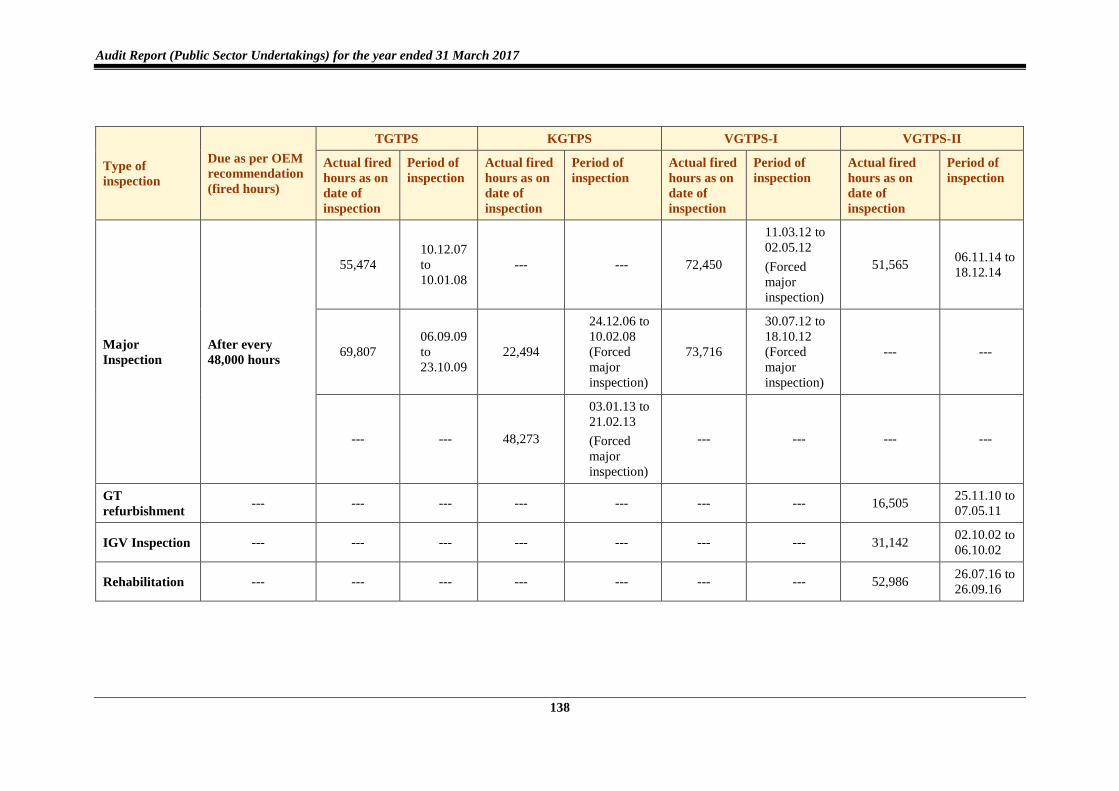
ANNEXURE-6
(Referred to in Paragraph 2.1.10)
Statement showing statutory inspections carried out
Type of
inspection
Due as per OEM
recommendation
(fired hours)
TGTPS KGTPS VGTPS-I VGTPS-II
Actual fired
hours as on
date of
inspection
Period of
inspection
Actual fired
hours as on
date of
inspection
Period of
inspection
Actual fired
hours as on
date of
inspection
Period of
inspection
Actual fired
hours as on
date of
inspection
Period of
inspection
Combustion
Inspection
After every 8,000
hours
12,300 28.08.02 to
22.09.02 11,745
17.07.05 to
24.08.05 11,226
26.05.04 to
30.07.04 38,442
30.07.13 to
04.08.13
19,732 28.07.03 to
02.08.03 20,360
22.08.06 to
24.09.06 22,709
21.12.05 to
30.12.05 --- ---
33,700 03.03.05 to
20.04.05 42,796
17.02.11 to
22.02.11 52,908
22.08.09 to
25.08.09 --- ---
44,493 30.07.06 to
04.08.06 59,349
05.06.14 to
19.06.14 83,131
21.11.13 to
25.11.13 --- ---
86,046 05.09.11 to
10.09.11 --- --- 105,679
14.08.16 to
16.08.16 --- ---
1,02,386 08.08.13 to
14.08.13 --- --- --- --- --- ---
1,21,167 16.12.15 to
22.12.15 --- --- --- --- --- ---
Hot Gas
Path
Inspection
After every
24,000 hours
33,700 03.03.05 to
20.04.05 75,577
27.05.16 to
13.06.16 36,396
01.08.07 to
16.08.07 - -
1,11,230 03.09.14 to
17.09.14 --- --- 92,428
02.01.15 to
14.01.15 --- ---
Audit Report (Public Sector Undertakings) for the year ended 31 March 2017
138
Type of
inspection
Due as per OEM
recommendation
(fired hours)
TGTPS KGTPS VGTPS-I VGTPS-II
Actual fired
hours as on
date of
inspection
Period of
inspection
Actual fired
hours as on
date of
inspection
Period of
inspection
Actual fired
hours as on
date of
inspection
Period of
inspection
Actual fired
hours as on
date of
inspection
Period of
inspection
Major
Inspection
After every
48,000 hours
55,474
10.12.07
to
10.01.08
--- --- 72,450
11.03.12 to
02.05.12
(Forced
major
inspection)
51,565 06.11.14 to
18.12.14
69,807
06.09.09
to
23.10.09
22,494
24.12.06 to
10.02.08
(Forced
major
inspection)
73,716
30.07.12 to
18.10.12
(Forced
major
inspection)
--- ---
--- --- 48,273
03.01.13 to
21.02.13
(Forced
major
inspection)
--- --- --- ---
GT
refurbishment --- --- --- --- --- --- --- 16,505
25.11.10 to
07.05.11
IGV Inspection --- --- --- --- --- --- --- 31,142 02.10.02 to
06.10.02
Rehabilitation --- --- --- --- --- --- --- 52,986 26.07.16 to
26.09.16
Annexures
139
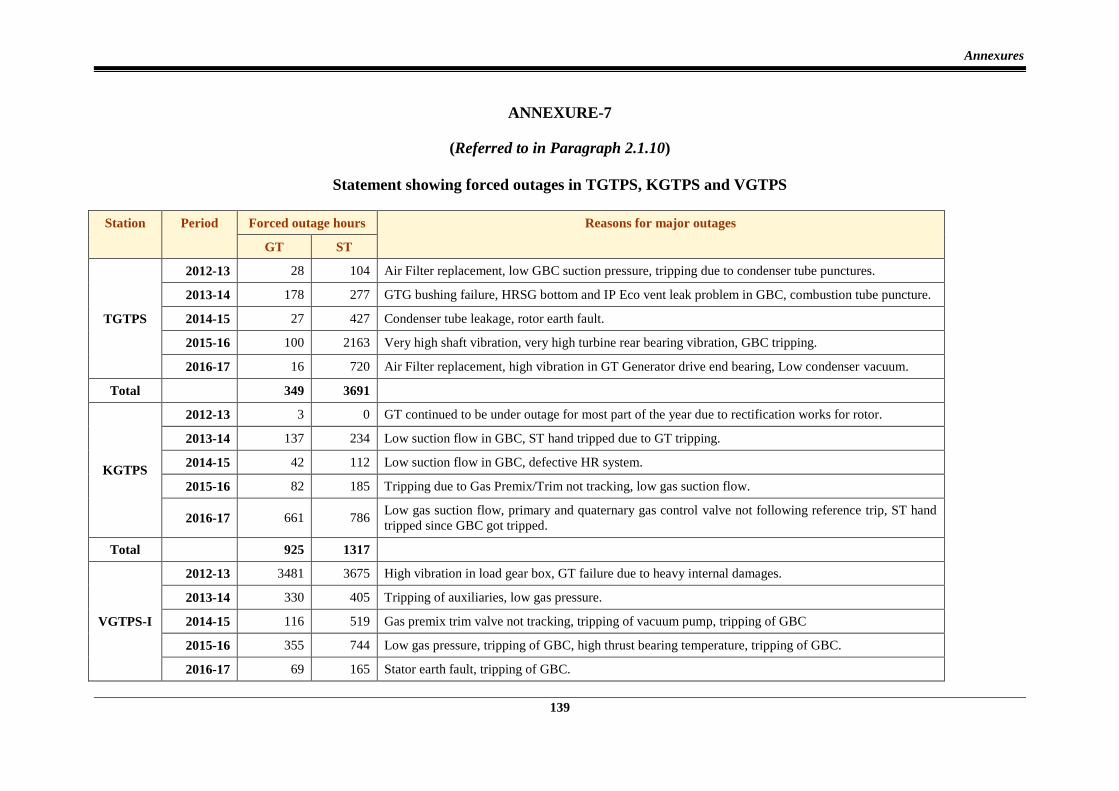
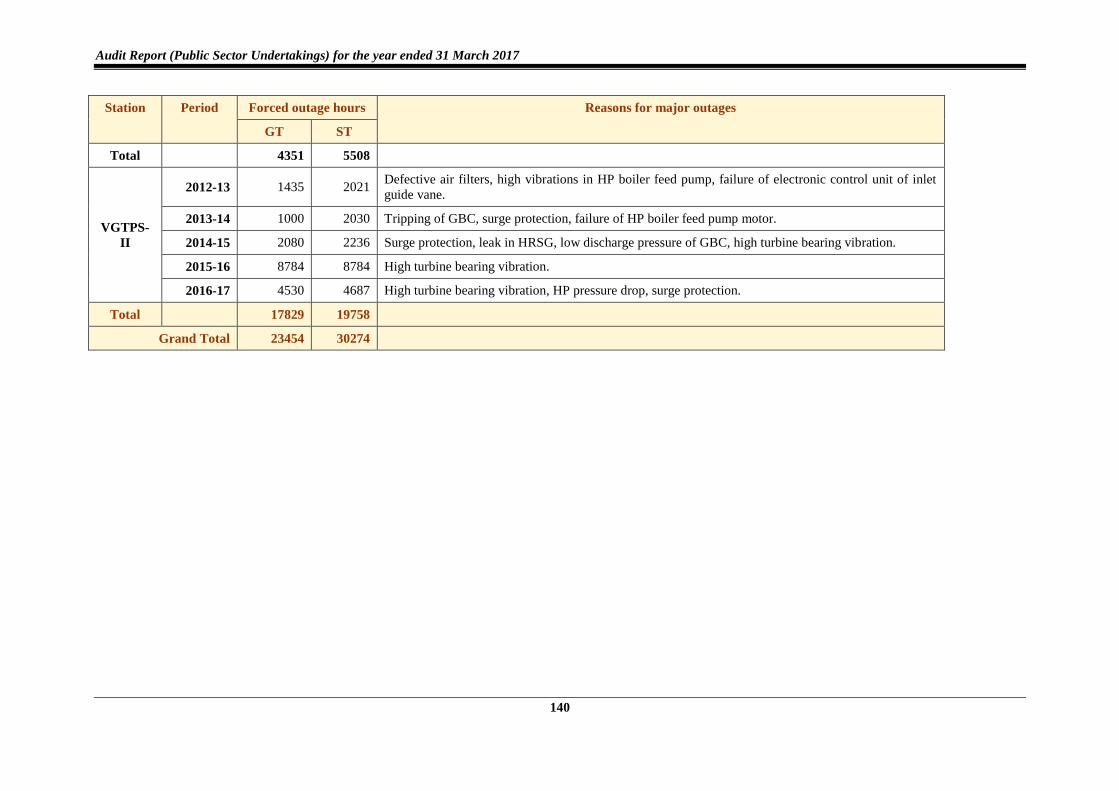
ANNEXURE-7
(Referred to in Paragraph 2.1.10)
Statement showing forced outages in TGTPS, KGTPS and VGTPS
Station Period Forced outage hours Reasons for major outages
GT ST
TGTPS
2012-13 28 104 Air Filter replacement, low GBC suction pressure, tripping due to condenser tube punctures.
2013-14 178 277 GTG bushing failure, HRSG bottom and IP Eco vent leak problem in GBC, combustion tube puncture.
2014-15 27 427 Condenser tube leakage, rotor earth fault.
2015-16 100 2163 Very high shaft vibration, very high turbine rear bearing vibration, GBC tripping.
2016-17 16 720 Air Filter replacement, high vibration in GT Generator drive end bearing, Low condenser vacuum.
Total 349 3691
KGTPS
2012-13 3 0 GT continued to be under outage for most part of the year due to rectification works for rotor.
2013-14 137 234 Low suction flow in GBC, ST hand tripped due to GT tripping.
2014-15 42 112 Low suction flow in GBC, defective HR system.
2015-16 82 185 Tripping due to Gas Premix/Trim not tracking, low gas suction flow.
2016-17 661 786 Low gas suction flow, primary and quaternary gas control valve not following reference trip, ST hand
tripped since GBC got tripped.
Total 925 1317
VGTPS-I
2012-13 3481 3675 High vibration in load gear box, GT failure due to heavy internal damages.
2013-14 330 405 Tripping of auxiliaries, low gas pressure.
2014-15 116 519 Gas premix trim valve not tracking, tripping of vacuum pump, tripping of GBC
2015-16 355 744 Low gas pressure, tripping of GBC, high thrust bearing temperature, tripping of GBC.
2016-17 69 165 Stator earth fault, tripping of GBC.
Audit Report (Public Sector Undertakings) for the year ended 31 March 2017
140
Station Period Forced outage hours Reasons for major outages
GT ST
Total 4351 5508
VGTPS-
II
2012-13 1435 2021 Defective air filters, high vibrations in HP boiler feed pump, failure of electronic control unit of inlet
guide vane.
2013-14 1000 2030 Tripping of GBC, surge protection, failure of HP boiler feed pump motor.
2014-15 2080 2236 Surge protection, leak in HRSG, low discharge pressure of GBC, high turbine bearing vibration.
2015-16 8784 8784 High turbine bearing vibration.
2016-17 4530 4687 High turbine bearing vibration, HP pressure drop, surge protection.
Total 17829 19758
Grand Total 23454 30274
Annexures
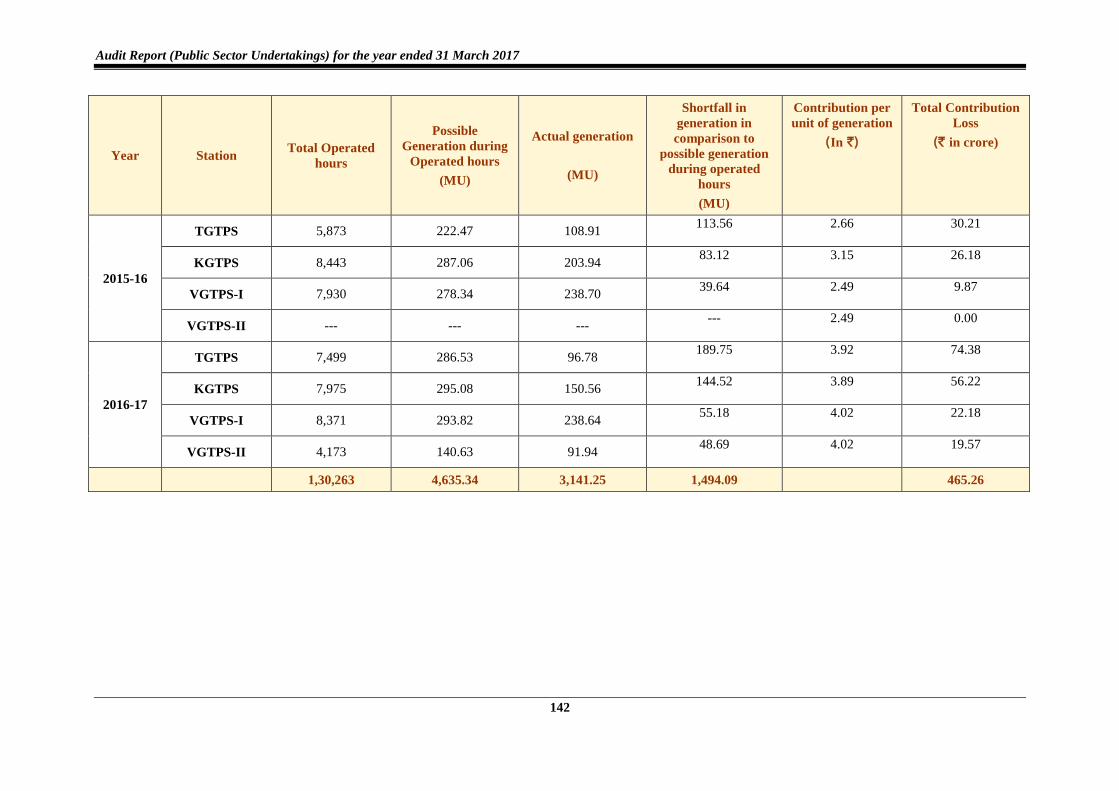
141
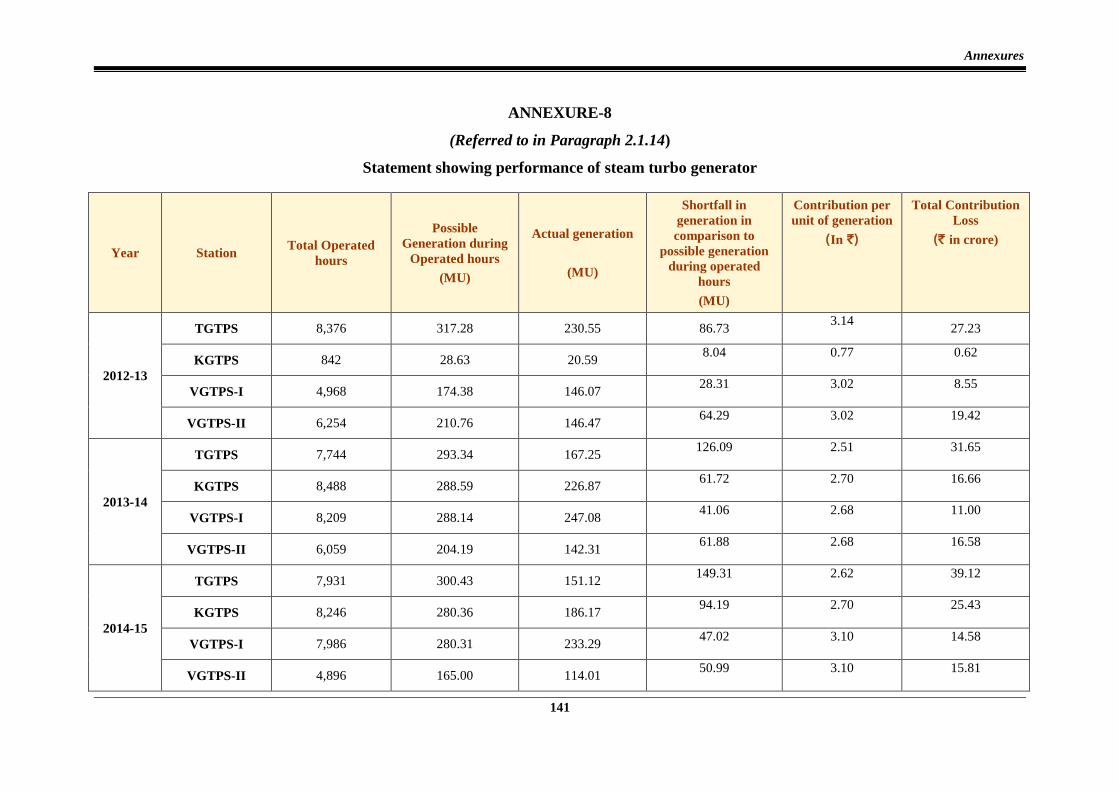
ANNEXURE-8
(Referred to in Paragraph 2.1.14)
Statement showing performance of steam turbo generator
Year Station Total Operated
hours
Possible
Generation during
Operated hours
(MU)
Actual generation
(MU)
Shortfall in
generation in
comparison to
possible generation
during operated
hours
(MU)
Contribution per
unit of generation
(In `)
Total Contribution
Loss
(` in crore)
2012-13
TGTPS 8,376 317.28 230.55 86.73 3.14
27.23
KGTPS 842 28.63 20.59 8.04 0.77 0.62
VGTPS-I 4,968 174.38 146.07 28.31 3.02 8.55
VGTPS-II 6,254 210.76 146.47 64.29 3.02 19.42
2013-14
TGTPS 7,744 293.34 167.25 126.09 2.51 31.65
KGTPS 8,488 288.59 226.87 61.72 2.70 16.66
VGTPS-I 8,209 288.14 247.08 41.06 2.68 11.00
VGTPS-II 6,059 204.19 142.31 61.88 2.68 16.58
2014-15
TGTPS 7,931 300.43 151.12 149.31 2.62 39.12
KGTPS 8,246 280.36 186.17 94.19 2.70 25.43
VGTPS-I 7,986 280.31 233.29 47.02 3.10 14.58
VGTPS-II 4,896 165.00 114.01 50.99 3.10 15.81
Audit Report (Public Sector Undertakings) for the year ended 31 March 2017
142
Year Station Total Operated
hours
Possible
Generation during
Operated hours
(MU)
Actual generation
(MU)
Shortfall in
generation in
comparison to
possible generation
during operated
hours
(MU)
Contribution per
unit of generation
(In `)
Total Contribution
Loss
(` in crore)
2015-16
TGTPS 5,873 222.47 108.91 113.56 2.66 30.21
KGTPS 8,443 287.06 203.94 83.12 3.15 26.18
VGTPS-I 7,930 278.34 238.70 39.64 2.49 9.87
VGTPS-II --- --- --- --- 2.49 0.00
2016-17
TGTPS 7,499 286.53 96.78 189.75 3.92 74.38
KGTPS 7,975 295.08 150.56 144.52 3.89 56.22
VGTPS-I 8,371 293.82 238.64 55.18 4.02 22.18
VGTPS-II 4,173 140.63 91.94 48.69 4.02 19.57
1,30,263 4,635.34 3,141.25 1,494.09 465.26
Annexures
143
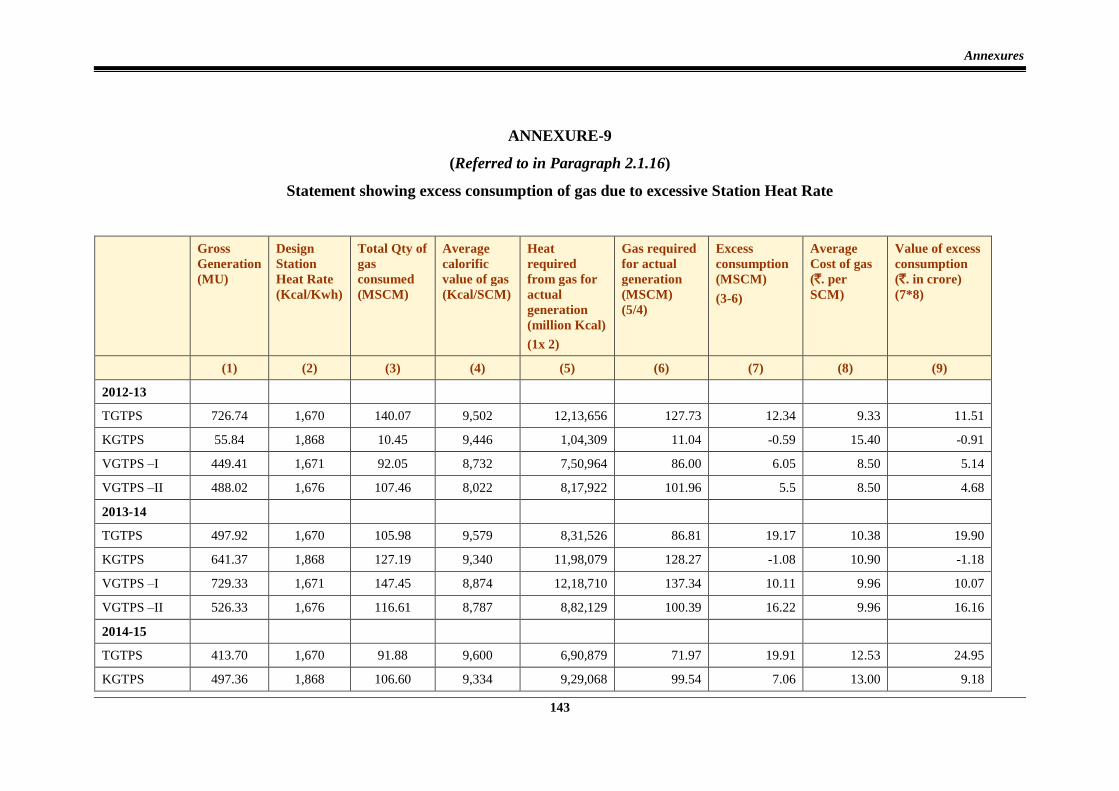
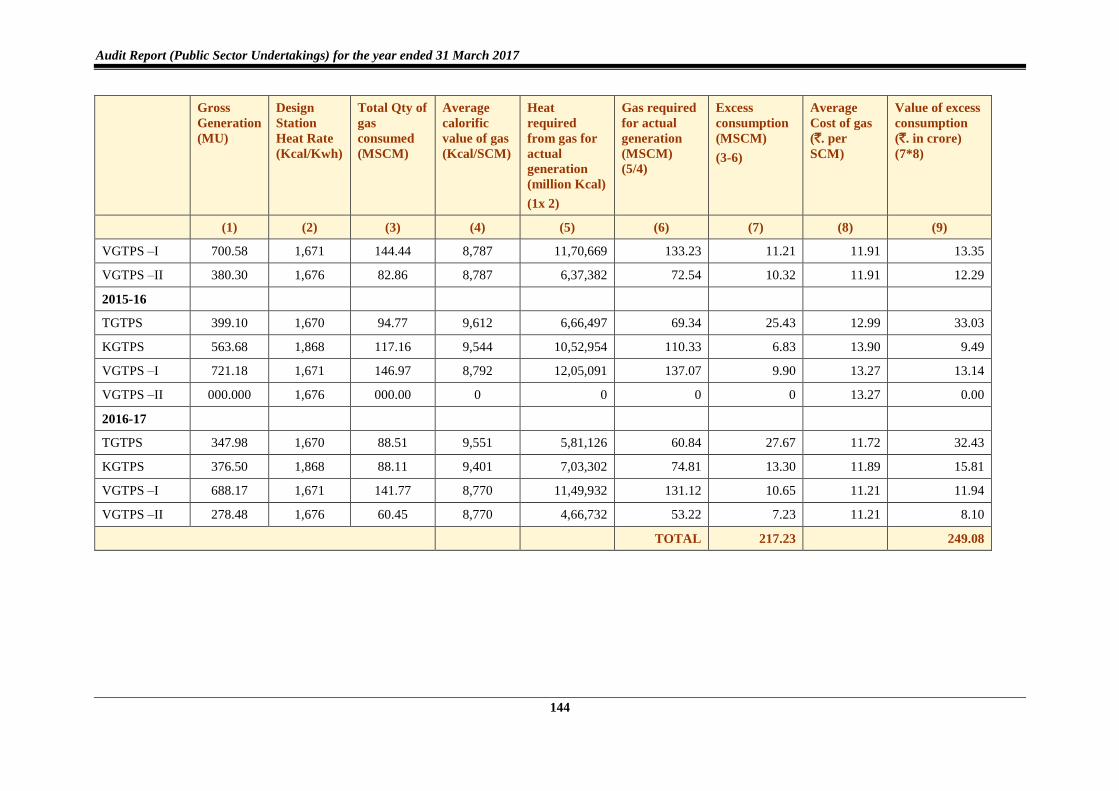
ANNEXURE-9
(Referred to in Paragraph 2.1.16)
Statement showing excess consumption of gas due to excessive Station Heat Rate
Gross
Generation
(MU)
Design
Station
Heat Rate
(Kcal/Kwh)
Total Qty of
gas
consumed
(MSCM)
Average
calorific
value of gas
(Kcal/SCM)
Heat
required
from gas for
actual
generation
(million Kcal)
(1x 2)
Gas required
for actual
generation
(MSCM)
(5/4)
Excess
consumption
(MSCM)
(3-6)
Average
Cost of gas
(`. per
SCM)
Value of excess
consumption
(`. in crore)
(7*8)
(1) (2) (3) (4) (5) (6) (7) (8) (9)
2012-13
TGTPS 726.74 1,670 140.07 9,502 12,13,656 127.73 12.34 9.33 11.51
KGTPS 55.84 1,868 10.45 9,446 1,04,309 11.04 -0.59 15.40 -0.91
VGTPS –I 449.41 1,671 92.05 8,732 7,50,964 86.00 6.05 8.50 5.14
VGTPS –II 488.02 1,676 107.46 8,022 8,17,922 101.96 5.5 8.50 4.68
2013-14
TGTPS 497.92 1,670 105.98 9,579 8,31,526 86.81 19.17 10.38 19.90
KGTPS 641.37 1,868 127.19 9,340 11,98,079 128.27 -1.08 10.90 -1.18
VGTPS –I 729.33 1,671 147.45 8,874 12,18,710 137.34 10.11 9.96 10.07
VGTPS –II 526.33 1,676 116.61 8,787 8,82,129 100.39 16.22 9.96 16.16
2014-15
TGTPS 413.70 1,670 91.88 9,600 6,90,879 71.97 19.91 12.53 24.95
KGTPS 497.36 1,868 106.60 9,334 9,29,068 99.54 7.06 13.00 9.18
Audit Report (Public Sector Undertakings) for the year ended 31 March 2017
144
Gross
Generation
(MU)
Design
Station
Heat Rate
(Kcal/Kwh)
Total Qty of
gas
consumed
(MSCM)
Average
calorific
value of gas
(Kcal/SCM)
Heat
required
from gas for
actual
generation
(million Kcal)
(1x 2)
Gas required
for actual
generation
(MSCM)
(5/4)
Excess
consumption
(MSCM)
(3-6)
Average
Cost of gas
(`. per
SCM)
Value of excess
consumption
(`. in crore)
(7*8)
(1) (2) (3) (4) (5) (6) (7) (8) (9)
VGTPS –I 700.58 1,671 144.44 8,787 11,70,669 133.23 11.21 11.91 13.35
VGTPS –II 380.30 1,676 82.86 8,787 6,37,382 72.54 10.32 11.91 12.29
2015-16
TGTPS 399.10 1,670 94.77 9,612 6,66,497 69.34 25.43 12.99 33.03
KGTPS 563.68 1,868 117.16 9,544 10,52,954 110.33 6.83 13.90 9.49
VGTPS –I 721.18 1,671 146.97 8,792 12,05,091 137.07 9.90 13.27 13.14
VGTPS –II 000.000 1,676 000.00 0 0 0 0 13.27 0.00
2016-17
TGTPS 347.98 1,670 88.51 9,551 5,81,126 60.84 27.67 11.72 32.43
KGTPS 376.50 1,868 88.11 9,401 7,03,302 74.81 13.30 11.89 15.81
VGTPS –I 688.17 1,671 141.77 8,770 11,49,932 131.12 10.65 11.21 11.94
VGTPS –II 278.48 1,676 60.45 8,770 4,66,732 53.22 7.23 11.21 8.10
TOTAL 217.23
249.08
Annexures
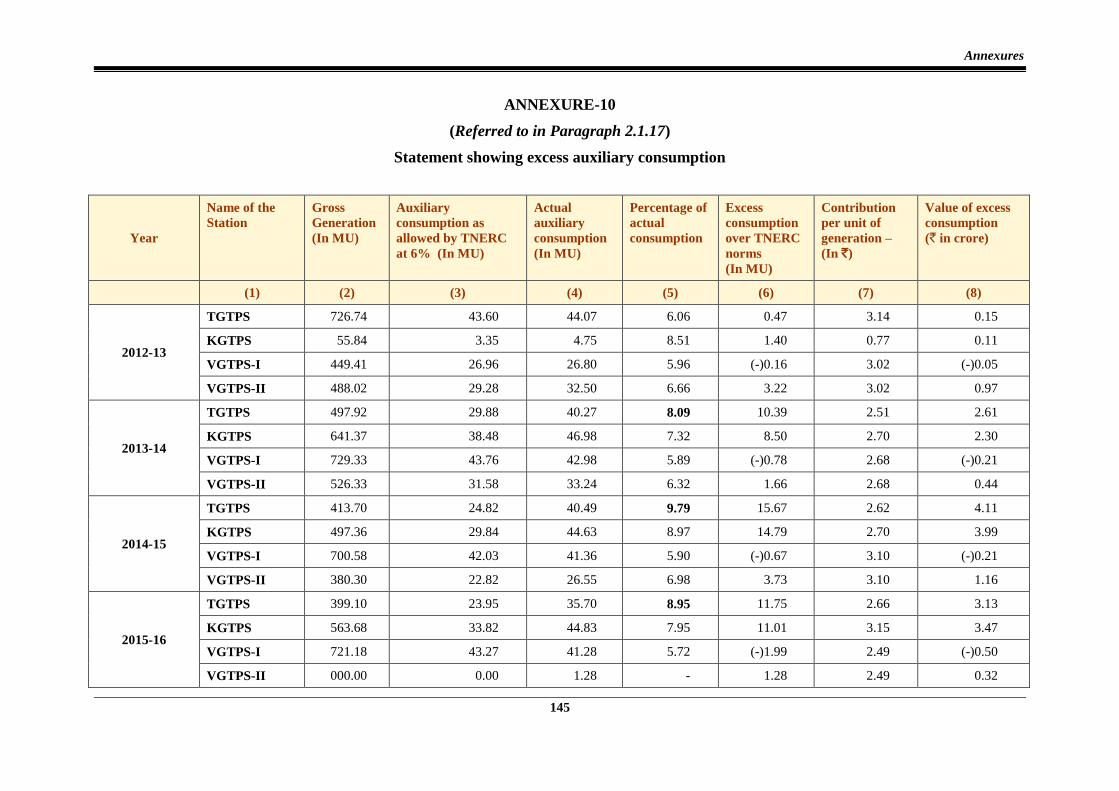
145
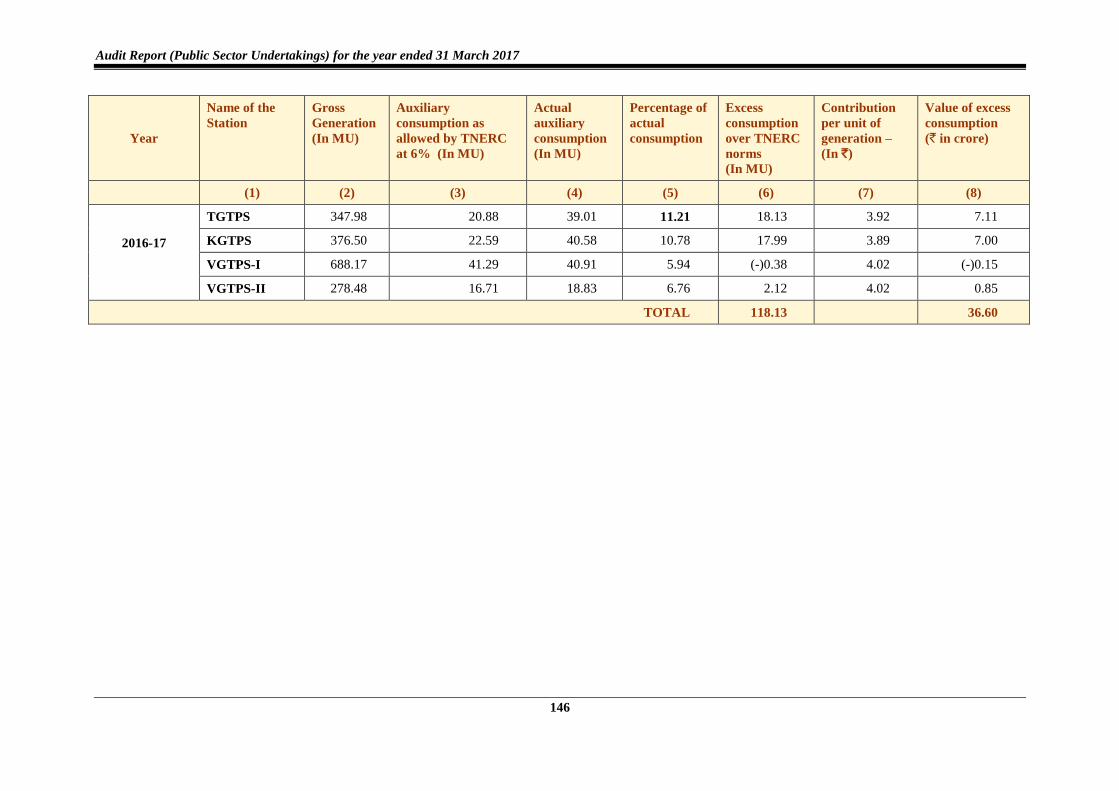
ANNEXURE-10
(Referred to in Paragraph 2.1.17)
Statement showing excess auxiliary consumption
Year
Name of the
Station
Gross
Generation
(In MU)
Auxiliary
consumption as
allowed by TNERC
at 6% (In MU)
Actual
auxiliary
consumption
(In MU)
Percentage of
actual
consumption
Excess
consumption
over TNERC
norms
(In MU)
Contribution
per unit of
generation –
(In `)
Value of excess
consumption
(` in crore)
(1) (2) (3) (4) (5) (6) (7) (8)
2012-13
TGTPS 726.74 43.60 44.07 6.06 0.47 3.14 0.15
KGTPS 55.84 3.35 4.75 8.51 1.40 0.77 0.11
VGTPS-I 449.41 26.96 26.80 5.96 (-)0.16 3.02 (-)0.05
VGTPS-II 488.02 29.28 32.50 6.66 3.22 3.02 0.97
2013-14
TGTPS 497.92 29.88 40.27 8.09 10.39 2.51 2.61
KGTPS 641.37 38.48 46.98 7.32 8.50 2.70 2.30
VGTPS-I 729.33 43.76 42.98 5.89 (-)0.78 2.68 (-)0.21
VGTPS-II 526.33 31.58 33.24 6.32 1.66 2.68 0.44
2014-15
TGTPS 413.70 24.82 40.49 9.79 15.67 2.62 4.11
KGTPS 497.36 29.84 44.63 8.97 14.79 2.70 3.99
VGTPS-I 700.58 42.03 41.36 5.90 (-)0.67 3.10 (-)0.21
VGTPS-II 380.30 22.82 26.55 6.98 3.73 3.10 1.16
2015-16
TGTPS 399.10 23.95 35.70 8.95 11.75 2.66 3.13
KGTPS 563.68 33.82 44.83 7.95 11.01 3.15 3.47
VGTPS-I 721.18 43.27 41.28 5.72 (-)1.99 2.49 (-)0.50
VGTPS-II 000.00 0.00 1.28 - 1.28 2.49 0.32
Audit Report (Public Sector Undertakings) for the year ended 31 March 2017
146
Year
Name of the
Station
Gross
Generation
(In MU)
Auxiliary
consumption as
allowed by TNERC
at 6% (In MU)
Actual
auxiliary
consumption
(In MU)
Percentage of
actual
consumption
Excess
consumption
over TNERC
norms
(In MU)
Contribution
per unit of
generation –
(In `)
Value of excess
consumption
(` in crore)
(1) (2) (3) (4) (5) (6) (7) (8)
2016-17
TGTPS 347.98 20.88 39.01 11.21 18.13 3.92 7.11
KGTPS 376.50 22.59 40.58 10.78 17.99 3.89 7.00
VGTPS-I 688.17 41.29 40.91 5.94 (-)0.38 4.02 (-)0.15
VGTPS-II 278.48 16.71 18.83 6.76 2.12 4.02 0.85
TOTAL 118.13 36.60
Annexures
147
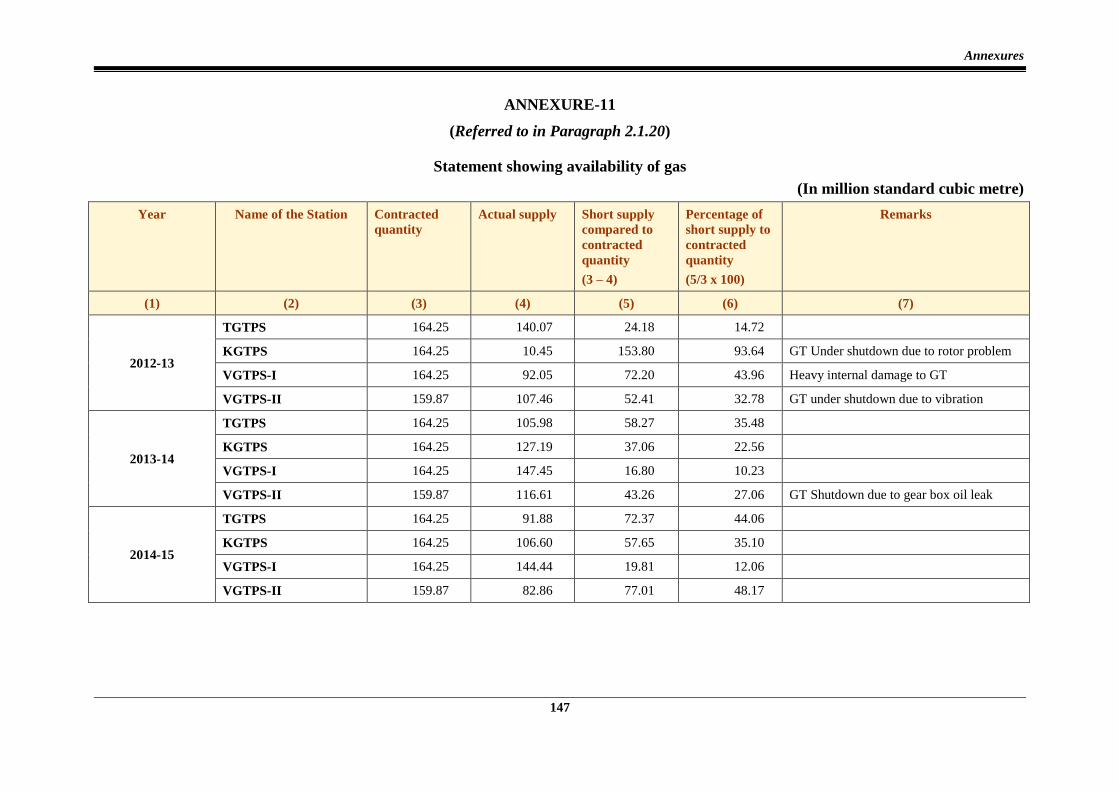
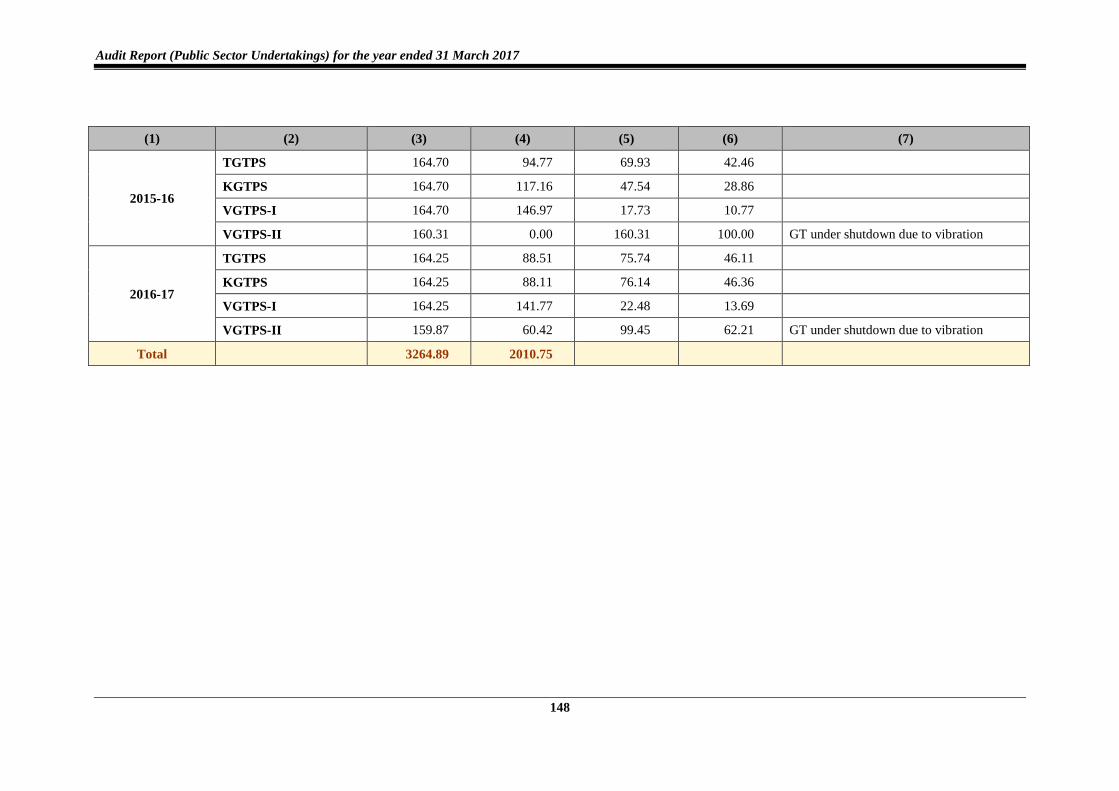
ANNEXURE-11
(Referred to in Paragraph 2.1.20)
Statement showing availability of gas
(In million standard cubic metre)
Year Name of the Station Contracted
quantity
Actual supply Short supply
compared to
contracted
quantity
(3 – 4)
Percentage of
short supply to
contracted
quantity
(5/3 x 100)
Remarks
(1) (2) (3) (4) (5) (6) (7)
2012-13
TGTPS 164.25 140.07 24.18 14.72
KGTPS 164.25 10.45 153.80 93.64 GT Under shutdown due to rotor problem
VGTPS-I 164.25 92.05 72.20 43.96 Heavy internal damage to GT
VGTPS-II 159.87 107.46 52.41 32.78 GT under shutdown due to vibration
2013-14
TGTPS 164.25 105.98 58.27 35.48
KGTPS 164.25 127.19 37.06 22.56
VGTPS-I 164.25 147.45 16.80 10.23
VGTPS-II 159.87 116.61 43.26 27.06 GT Shutdown due to gear box oil leak
2014-15
TGTPS 164.25 91.88 72.37 44.06
KGTPS 164.25 106.60 57.65 35.10
VGTPS-I 164.25 144.44 19.81 12.06
VGTPS-II 159.87 82.86 77.01 48.17
Audit Report (Public Sector Undertakings) for the year ended 31 March 2017
148
(1) (2) (3) (4) (5) (6) (7)
2015-16
TGTPS 164.70 94.77 69.93 42.46
KGTPS 164.70 117.16 47.54 28.86
VGTPS-I 164.70 146.97 17.73 10.77
VGTPS-II 160.31 0.00 160.31 100.00 GT under shutdown due to vibration
2016-17
TGTPS 164.25 88.51 75.74 46.11
KGTPS 164.25 88.11 76.14 46.36
VGTPS-I 164.25 141.77 22.48 13.69
VGTPS-II 159.87 60.42 99.45 62.21 GT under shutdown due to vibration
Total 3264.89 2010.75
Annexures
149
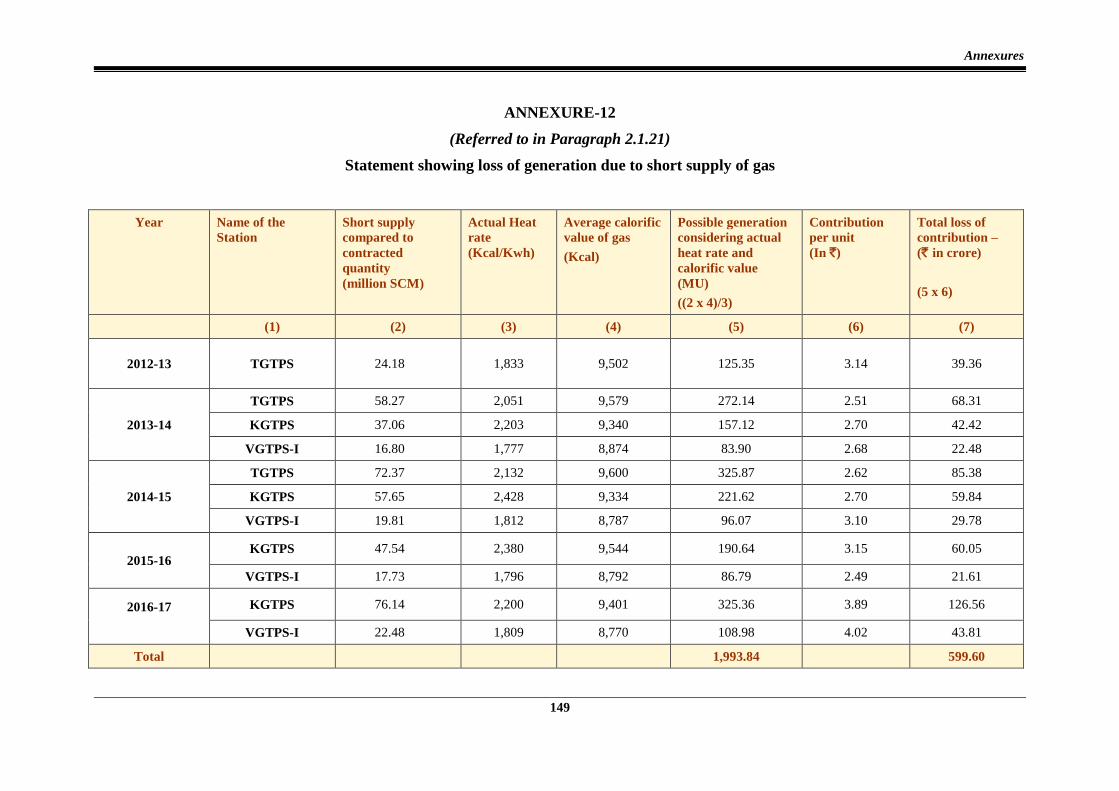
ANNEXURE-12
(Referred to in Paragraph 2.1.21)
Statement showing loss of generation due to short supply of gas
Year Name of the
Station
Short supply
compared to
contracted
quantity
(million SCM)
Actual Heat
rate
(Kcal/Kwh)
Average calorific
value of gas
(Kcal)
Possible generation
considering actual
heat rate and
calorific value
(MU)
((2 x 4)/3)
Contribution
per unit
(In `)
Total loss of
contribution –
(` in crore)
(5 x 6)
(1) (2) (3) (4) (5) (6) (7)
2012-13 TGTPS 24.18 1,833 9,502 125.35 3.14 39.36
2013-14
TGTPS 58.27 2,051 9,579 272.14 2.51 68.31
KGTPS 37.06 2,203 9,340 157.12 2.70 42.42
VGTPS-I 16.80 1,777 8,874 83.90 2.68 22.48
2014-15
TGTPS 72.37 2,132 9,600 325.87 2.62 85.38
KGTPS 57.65 2,428 9,334 221.62 2.70 59.84
VGTPS-I 19.81 1,812 8,787 96.07 3.10 29.78
2015-16 KGTPS 47.54 2,380 9,544 190.64 3.15 60.05
VGTPS-I 17.73 1,796 8,792 86.79 2.49 21.61
2016-17
KGTPS 76.14 2,200 9,401 325.36 3.89 126.56
VGTPS-I 22.48 1,809 8,770 108.98 4.02 43.81
Total 1,993.84 599.60
Audit Report (Public Sector Undertakings) for the year ended 31 March 2017
150
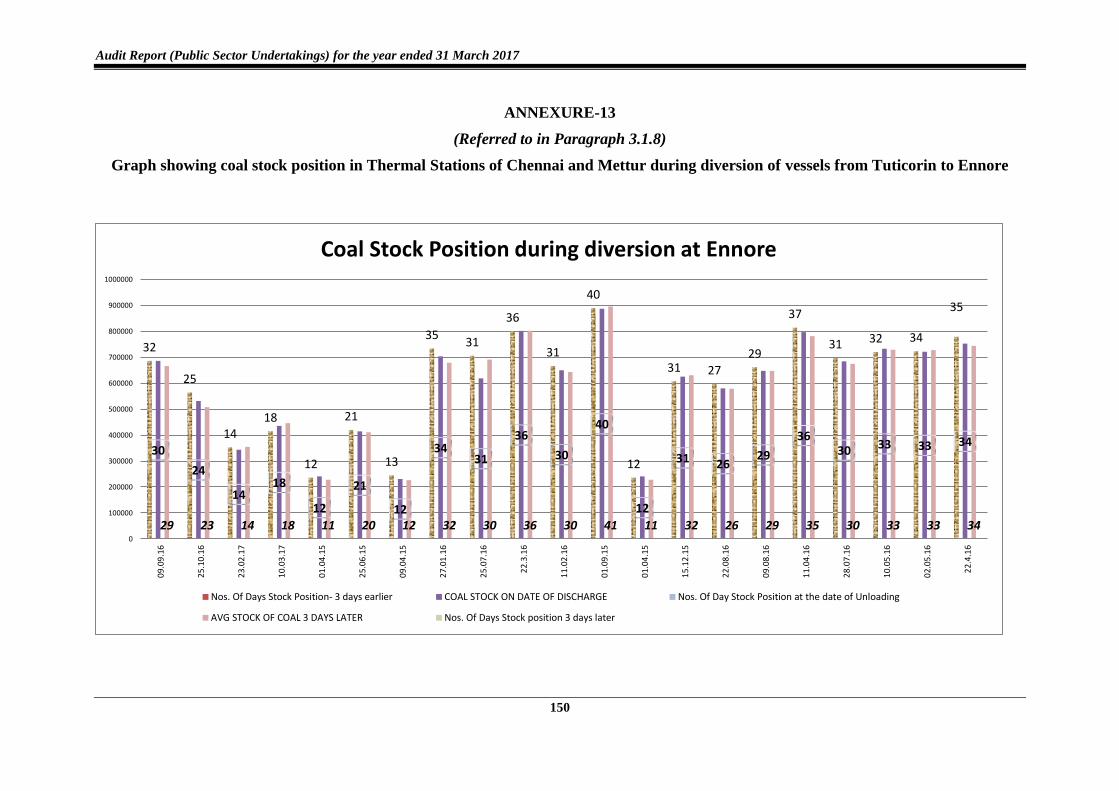
ANNEXURE-13
(Referred to in Paragraph 3.1.8)
Graph showing coal stock position in Thermal Stations of Chennai and Mettur during diversion of vessels from Tuticorin to Ennore
32
25
1418
12
21
13
3531
36
31
40
12
31 27
29
37
31 32 34
35
30
24
1418
12
21
12
3431
36
30
40
12
31 2629
3630 33 33 34
29 23 14 18 11 20 12 32 30 36 30 41 11 32 26 29 35 30 33 33 340
100000
200000
300000
400000
500000
600000
700000
800000
900000
1000000
09.
09.1
6
25.
10.1
6
23.
02.1
7
10.
03.1
7
01.
04.1
5
25.
06.1
5
09.
04.1
5
27.
01.1
6
25.
07.1
6
22.
3.1
6
11.
02.1
6
01.
09.1
5
01.
04.1
5
15.
12.1
5
22.
08.1
6
09.
08.1
6
11.
04.1
6
28.
07.1
6
10.
05.1
6
02.
05.1
6
22.
4.1
6
Coal Stock Position during diversion at Ennore
Nos. Of Days Stock Position- 3 days earlier COAL STOCK ON DATE OF DISCHARGE Nos. Of Day Stock Position at the date of Unloading
AVG STOCK OF COAL 3 DAYS LATER Nos. Of Days Stock position 3 days later
Annexures
151
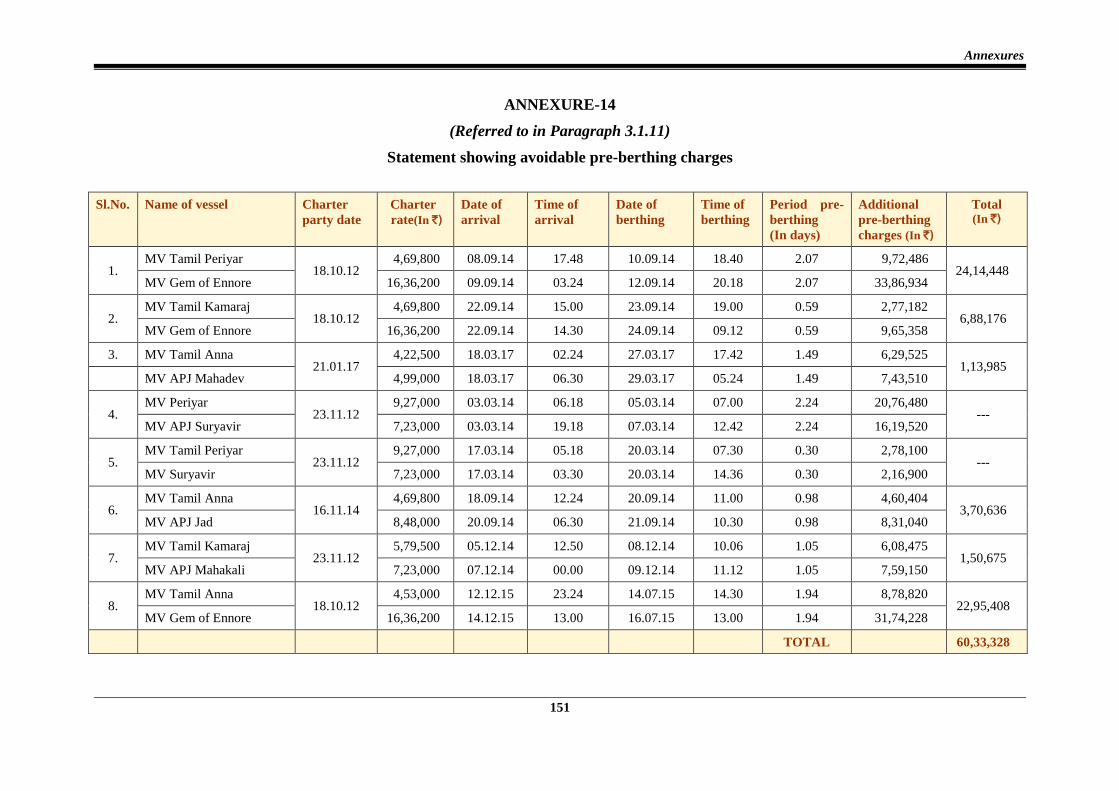
ANNEXURE-14
(Referred to in Paragraph 3.1.11)
Statement showing avoidable pre-berthing charges
Sl.No. Name of vessel Charter
party date
Charter
rate(In `)
Date of
arrival
Time of
arrival
Date of
berthing
Time of
berthing
Period pre-
berthing
(In days)
Additional
pre-berthing
charges (In `)
Total (In `)
1. MV Tamil Periyar
18.10.12 4,69,800 08.09.14 17.48 10.09.14 18.40 2.07 9,72,486
24,14,448 MV Gem of Ennore 16,36,200 09.09.14 03.24 12.09.14 20.18 2.07 33,86,934
2. MV Tamil Kamaraj
18.10.12 4,69,800 22.09.14 15.00 23.09.14 19.00 0.59 2,77,182
6,88,176 MV Gem of Ennore 16,36,200 22.09.14 14.30 24.09.14 09.12 0.59 9,65,358
3. MV Tamil Anna 21.01.17
4,22,500 18.03.17 02.24 27.03.17 17.42 1.49 6,29,525 1,13,985
MV APJ Mahadev 4,99,000 18.03.17 06.30 29.03.17 05.24 1.49 7,43,510
4. MV Periyar
23.11.12 9,27,000 03.03.14 06.18 05.03.14 07.00 2.24 20,76,480
--- MV APJ Suryavir 7,23,000 03.03.14 19.18 07.03.14 12.42 2.24 16,19,520
5. MV Tamil Periyar
23.11.12 9,27,000 17.03.14 05.18 20.03.14 07.30 0.30 2,78,100
--- MV Suryavir 7,23,000 17.03.14 03.30 20.03.14 14.36 0.30 2,16,900
6. MV Tamil Anna
16.11.14 4,69,800 18.09.14 12.24 20.09.14 11.00 0.98 4,60,404
3,70,636 MV APJ Jad 8,48,000 20.09.14 06.30 21.09.14 10.30 0.98 8,31,040
7. MV Tamil Kamaraj
23.11.12 5,79,500 05.12.14 12.50 08.12.14 10.06 1.05 6,08,475
1,50,675 MV APJ Mahakali 7,23,000 07.12.14 00.00 09.12.14 11.12 1.05 7,59,150
8. MV Tamil Anna
18.10.12 4,53,000 12.12.15 23.24 14.07.15 14.30 1.94 8,78,820
22,95,408 MV Gem of Ennore 16,36,200 14.12.15 13.00 16.07.15 13.00 1.94 31,74,228
TOTAL 60,33,328
Audit Report (Public Sector Undertakings) for the year ended 31 March 2017
152
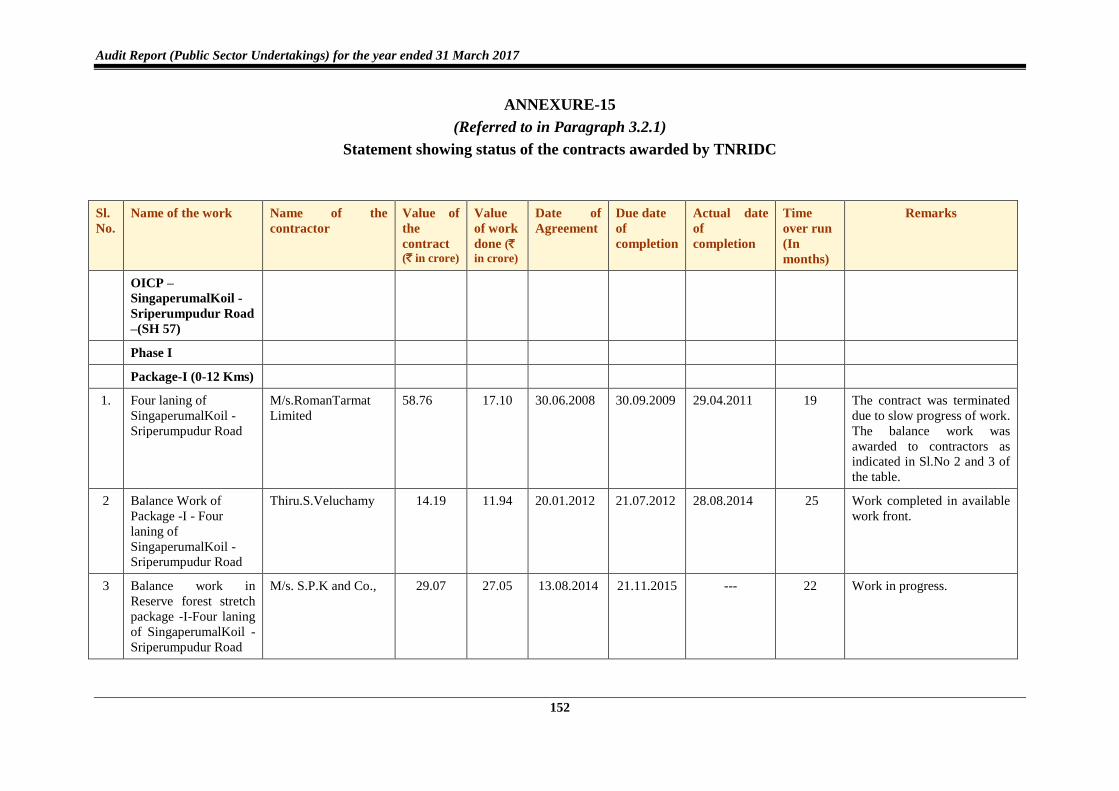
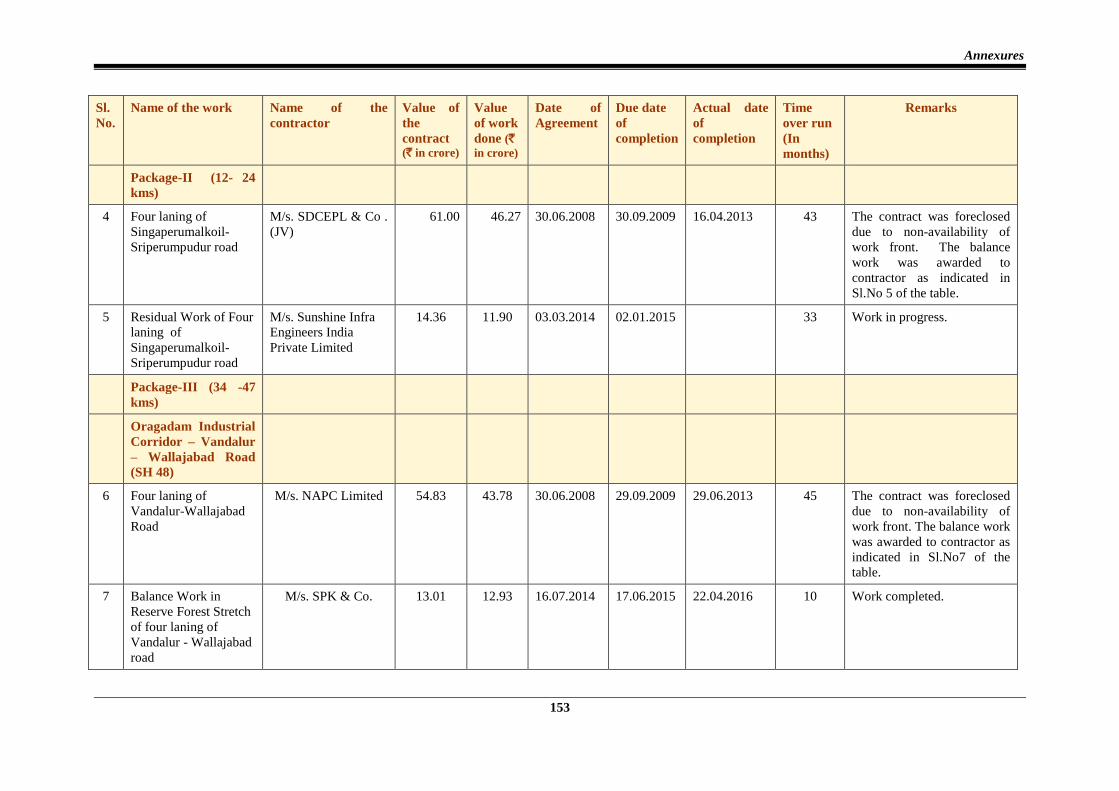
ANNEXURE-15
(Referred to in Paragraph 3.2.1)
Statement showing status of the contracts awarded by TNRIDC
Sl.
No.
Name of the work Name of the
contractor
Value of
the
contract (` in crore)
Value
of work
done (`
in crore)
Date of
Agreement
Due date
of
completion
Actual date
of
completion
Time
over run
(In
months)
Remarks
OICP –
SingaperumalKoil -
Sriperumpudur Road
–(SH 57)
Phase I
Package-I (0-12 Kms)
1. Four laning of
SingaperumalKoil -
Sriperumpudur Road
M/s.RomanTarmat
Limited
58.76 17.10 30.06.2008 30.09.2009 29.04.2011 19 The contract was terminated
due to slow progress of work.
The balance work was
awarded to contractors as
indicated in Sl.No 2 and 3 of
the table.
2 Balance Work of
Package -I - Four
laning of
SingaperumalKoil -
Sriperumpudur Road
Thiru.S.Veluchamy 14.19 11.94 20.01.2012 21.07.2012 28.08.2014 25 Work completed in available
work front.
3 Balance work in
Reserve forest stretch
package -I-Four laning
of SingaperumalKoil -
Sriperumpudur Road
M/s. S.P.K and Co., 29.07 27.05 13.08.2014 21.11.2015 --- 22 Work in progress.
Annexures
153
Sl.
No.
Name of the work Name of the
contractor
Value of
the
contract (` in crore)
Value
of work
done (`
in crore)
Date of
Agreement
Due date
of
completion
Actual date
of
completion
Time
over run
(In
months)
Remarks
Package-II (12- 24
kms)
4 Four laning of
Singaperumalkoil-
Sriperumpudur road
M/s. SDCEPL & Co .
(JV)
61.00 46.27 30.06.2008 30.09.2009 16.04.2013 43 The contract was foreclosed
due to non-availability of
work front. The balance
work was awarded to
contractor as indicated in
Sl.No 5 of the table.
5 Residual Work of Four
laning of
Singaperumalkoil-
Sriperumpudur road
M/s. Sunshine Infra
Engineers India
Private Limited
14.36 11.90 03.03.2014 02.01.2015 33 Work in progress.
Package-III (34 -47
kms)
Oragadam Industrial
Corridor – Vandalur
– Wallajabad Road
(SH 48)
6 Four laning of
Vandalur-Wallajabad
Road
M/s. NAPC Limited 54.83 43.78 30.06.2008 29.09.2009 29.06.2013 45 The contract was foreclosed
due to non-availability of
work front. The balance work
was awarded to contractor as
indicated in Sl.No7 of the
table.
7 Balance Work in
Reserve Forest Stretch
of four laning of
Vandalur - Wallajabad
road
M/s. SPK & Co. 13.01 12.93 16.07.2014 17.06.2015 22.04.2016 10 Work completed.
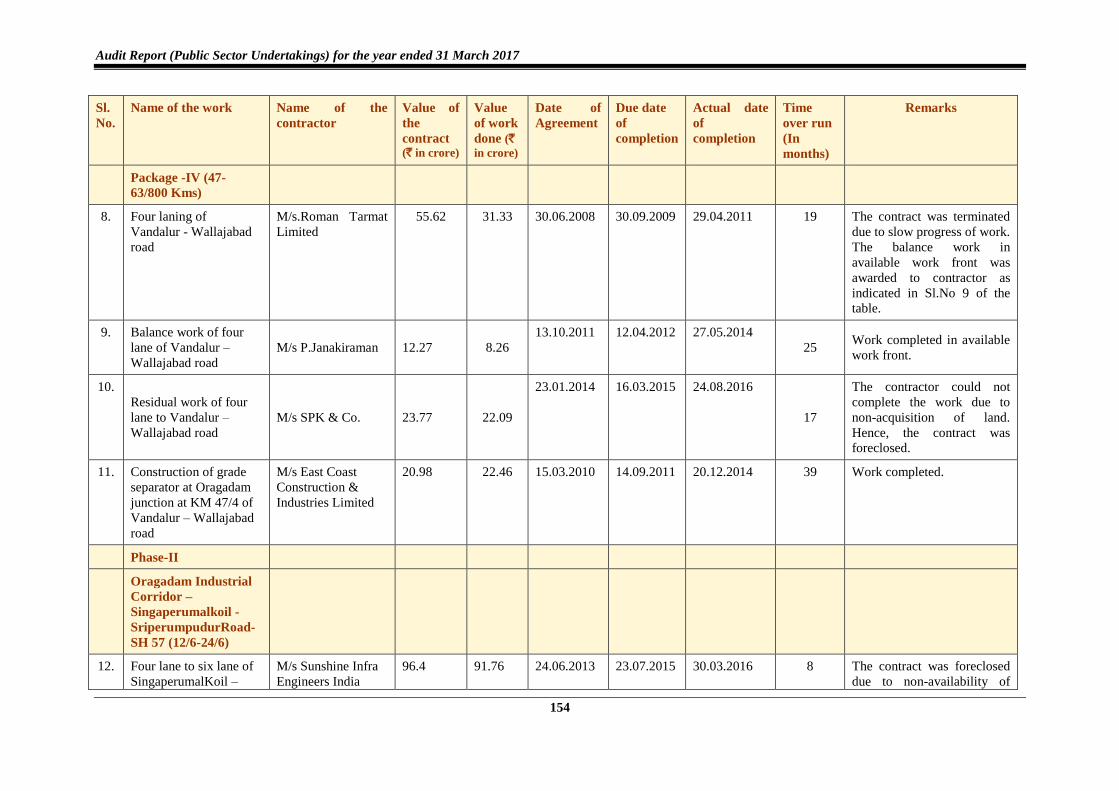
Audit Report (Public Sector Undertakings) for the year ended 31 March 2017
154
Sl.
No.
Name of the work Name of the
contractor
Value of
the
contract (` in crore)
Value
of work
done (`
in crore)
Date of
Agreement
Due date
of
completion
Actual date
of
completion
Time
over run
(In
months)
Remarks
Package -IV (47-
63/800 Kms)
8. Four laning of
Vandalur - Wallajabad
road
M/s.Roman Tarmat
Limited
55.62 31.33 30.06.2008 30.09.2009 29.04.2011 19 The contract was terminated
due to slow progress of work.
The balance work in
available work front was
awarded to contractor as
indicated in Sl.No 9 of the
table.
9. Balance work of four
lane of Vandalur –
Wallajabad road
M/s P.Janakiraman 12.27 8.26
13.10.2011 12.04.2012 27.05.2014
25 Work completed in available
work front.
10.
Residual work of four
lane to Vandalur –
Wallajabad road
M/s SPK & Co. 23.77 22.09
23.01.2014 16.03.2015 24.08.2016
17
The contractor could not
complete the work due to
non-acquisition of land.
Hence, the contract was
foreclosed.
11. Construction of grade
separator at Oragadam
junction at KM 47/4 of
Vandalur – Wallajabad
road
M/s East Coast
Construction &
Industries Limited
20.98 22.46 15.03.2010 14.09.2011 20.12.2014 39 Work completed.
Phase-II
Oragadam Industrial
Corridor –
Singaperumalkoil -
SriperumpudurRoad-
SH 57 (12/6-24/6)
12. Four lane to six lane of
SingaperumalKoil –
M/s Sunshine Infra
Engineers India
96.4 91.76 24.06.2013 23.07.2015 30.03.2016 8 The contract was foreclosed
due to non-availability of
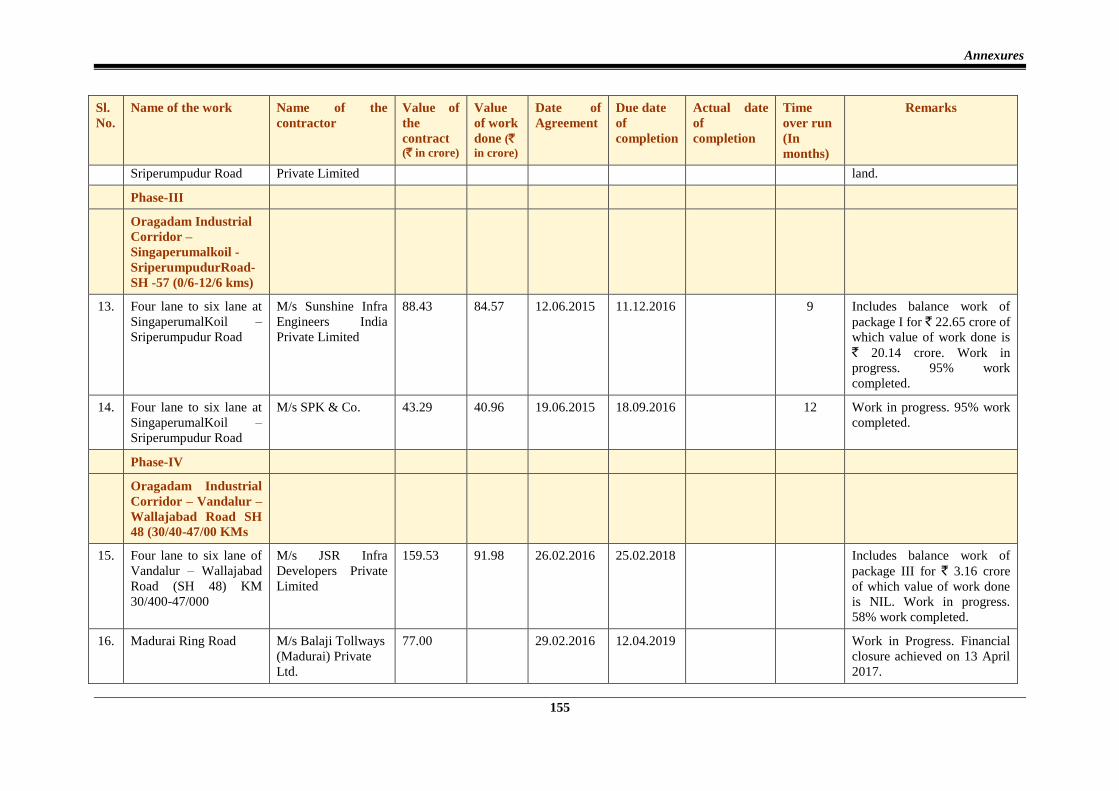
Annexures
155
Sl.
No.
Name of the work Name of the
contractor
Value of
the
contract (` in crore)
Value
of work
done (`
in crore)
Date of
Agreement
Due date
of
completion
Actual date
of
completion
Time
over run
(In
months)
Remarks
Sriperumpudur Road Private Limited land.
Phase-III
Oragadam Industrial
Corridor –
Singaperumalkoil -
SriperumpudurRoad-
SH -57 (0/6-12/6 kms)
13. Four lane to six lane at
SingaperumalKoil –
Sriperumpudur Road
M/s Sunshine Infra
Engineers India
Private Limited
88.43 84.57 12.06.2015 11.12.2016 9 Includes balance work of
package I for ` 22.65 crore of
which value of work done is
` 20.14 crore. Work in
progress. 95% work
completed.
14. Four lane to six lane at
SingaperumalKoil –
Sriperumpudur Road
M/s SPK & Co. 43.29 40.96 19.06.2015 18.09.2016 12 Work in progress. 95% work
completed.
Phase-IV
Oragadam Industrial
Corridor – Vandalur –
Wallajabad Road SH
48 (30/40-47/00 KMs
15. Four lane to six lane of
Vandalur – Wallajabad
Road (SH 48) KM
30/400-47/000
M/s JSR Infra
Developers Private
Limited
159.53 91.98 26.02.2016 25.02.2018 Includes balance work of
package III for ` 3.16 crore
of which value of work done
is NIL. Work in progress.
58% work completed.
16. Madurai Ring Road M/s Balaji Tollways
(Madurai) Private
Ltd.
77.00 29.02.2016 12.04.2019 Work in Progress. Financial
closure achieved on 13 April
2017.
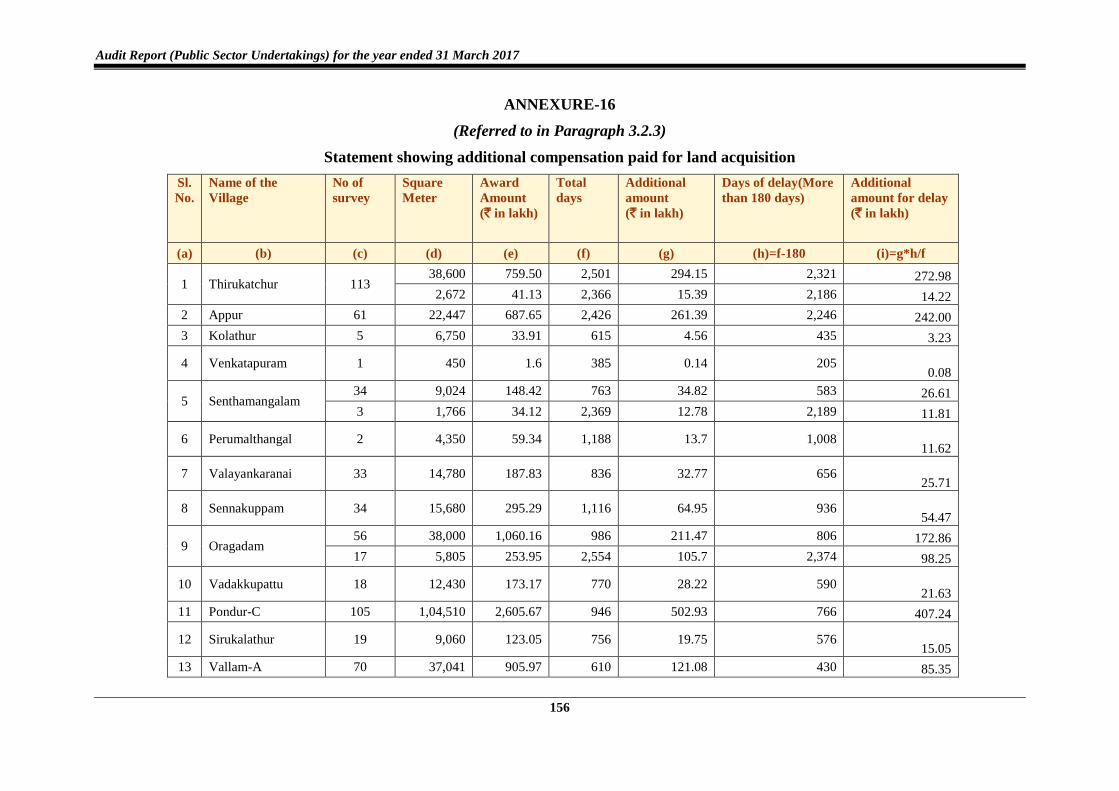
Audit Report (Public Sector Undertakings) for the year ended 31 March 2017
156
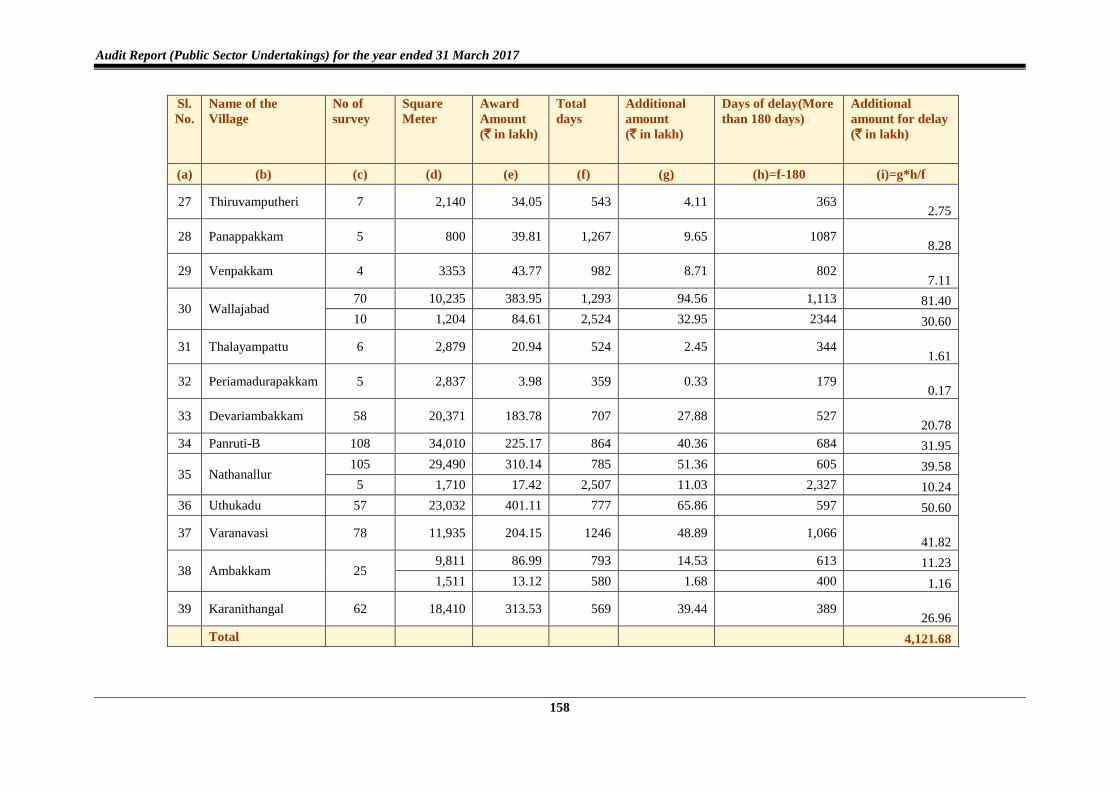
ANNEXURE-16
(Referred to in Paragraph 3.2.3)
Statement showing additional compensation paid for land acquisition
Sl.
No.
Name of the
Village
No of
survey
Square
Meter
Award
Amount
(` in lakh)
Total
days
Additional
amount
(` in lakh)
Days of delay(More
than 180 days)
Additional
amount for delay
(` in lakh)
(a) (b) (c) (d) (e) (f) (g) (h)=f-180 (i)=g*h/f
1 Thirukatchur 113 38,600 759.50 2,501 294.15 2,321 272.98
2,672 41.13 2,366 15.39 2,186 14.22
2 Appur 61 22,447 687.65 2,426 261.39 2,246 242.00
3 Kolathur 5 6,750 33.91 615 4.56 435 3.23
4 Venkatapuram 1 450 1.6 385 0.14 205 0.08
5 Senthamangalam 34 9,024 148.42 763 34.82 583 26.61
3 1,766 34.12 2,369 12.78 2,189 11.81
6 Perumalthangal 2 4,350 59.34 1,188 13.7 1,008 11.62
7 Valayankaranai 33 14,780 187.83 836 32.77 656 25.71
8 Sennakuppam 34 15,680 295.29 1,116 64.95 936 54.47
9 Oragadam 56 38,000 1,060.16 986 211.47 806 172.86
17 5,805 253.95 2,554 105.7 2,374 98.25
10 Vadakkupattu 18 12,430 173.17 770 28.22 590 21.63
11 Pondur-C 105 1,04,510 2,605.67 946 502.93 766 407.24
12 Sirukalathur 19 9,060 123.05 756 19.75 576 15.05
13 Vallam-A 70 37,041 905.97 610 121.08 430 85.35
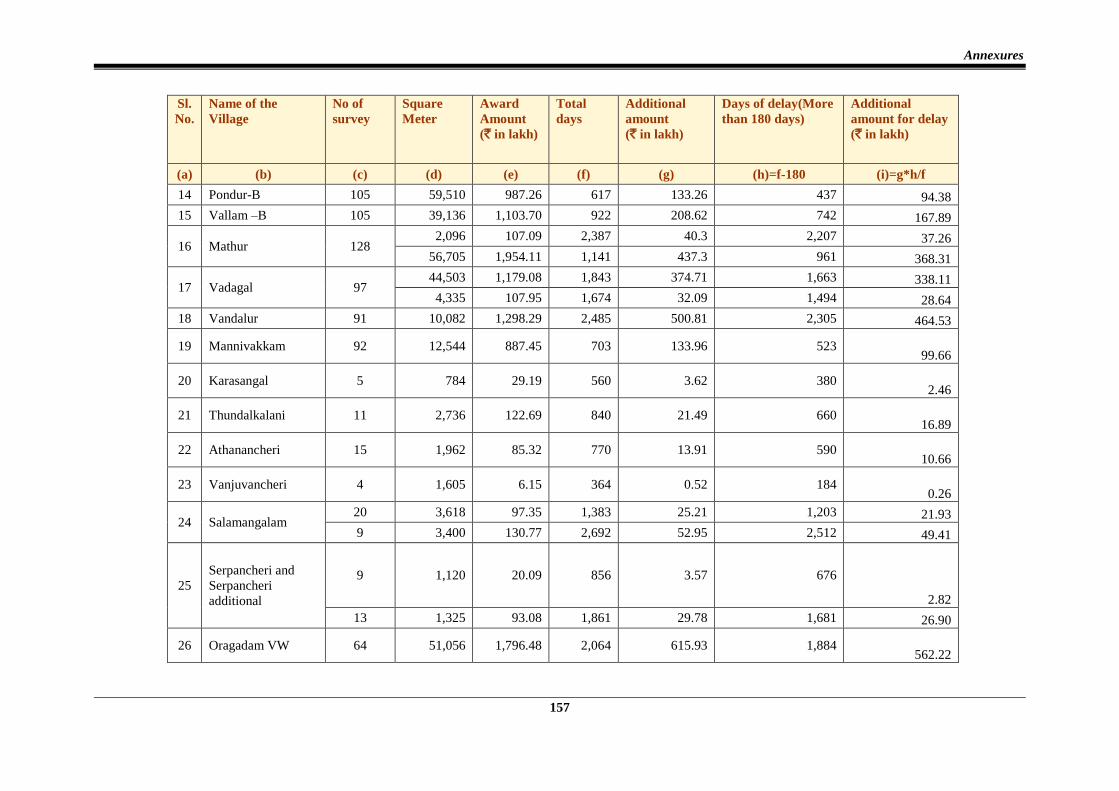
Annexures
157
Sl.
No.
Name of the
Village
No of
survey
Square
Meter
Award
Amount
(` in lakh)
Total
days
Additional
amount
(` in lakh)
Days of delay(More
than 180 days)
Additional
amount for delay
(` in lakh)
(a) (b) (c) (d) (e) (f) (g) (h)=f-180 (i)=g*h/f
14 Pondur-B 105 59,510 987.26 617 133.26 437 94.38
15 Vallam –B 105 39,136 1,103.70 922 208.62 742 167.89
16 Mathur 128 2,096 107.09 2,387 40.3 2,207 37.26
56,705 1,954.11 1,141 437.3 961 368.31
17 Vadagal 97 44,503 1,179.08 1,843 374.71 1,663 338.11
4,335 107.95 1,674 32.09 1,494 28.64
18 Vandalur 91 10,082 1,298.29 2,485 500.81 2,305 464.53
19 Mannivakkam 92 12,544 887.45 703 133.96 523 99.66
20 Karasangal 5 784 29.19 560 3.62 380 2.46
21 Thundalkalani 11 2,736 122.69 840 21.49 660 16.89
22 Athanancheri 15 1,962 85.32 770 13.91 590 10.66
23 Vanjuvancheri 4 1,605 6.15 364 0.52 184 0.26
24 Salamangalam 20 3,618 97.35 1,383 25.21 1,203 21.93
9 3,400 130.77 2,692 52.95 2,512 49.41
25
Serpancheri and
Serpancheri
additional
9 1,120 20.09 856 3.57 676
2.82
13 1,325 93.08 1,861 29.78 1,681 26.90
26 Oragadam VW 64 51,056 1,796.48 2,064 615.93 1,884 562.22
Audit Report (Public Sector Undertakings) for the year ended 31 March 2017
158
Sl.
No.
Name of the
Village
No of
survey
Square
Meter
Award
Amount
(` in lakh)
Total
days
Additional
amount
(` in lakh)
Days of delay(More
than 180 days)
Additional
amount for delay
(` in lakh)
(a) (b) (c) (d) (e) (f) (g) (h)=f-180 (i)=g*h/f
27 Thiruvamputheri 7 2,140 34.05 543 4.11 363 2.75
28 Panappakkam 5 800 39.81 1,267 9.65 1087 8.28
29 Venpakkam 4 3353 43.77 982 8.71 802 7.11
30 Wallajabad 70 10,235 383.95 1,293 94.56 1,113 81.40
10 1,204 84.61 2,524 32.95 2344 30.60
31 Thalayampattu 6 2,879 20.94 524 2.45 344 1.61
32 Periamadurapakkam 5 2,837 3.98 359 0.33 179 0.17
33 Devariambakkam 58 20,371 183.78 707 27.88 527 20.78
34 Panruti-B 108 34,010 225.17 864 40.36 684 31.95
35 Nathanallur 105 29,490 310.14 785 51.36 605 39.58
5 1,710 17.42 2,507 11.03 2,327 10.24
36 Uthukadu 57 23,032 401.11 777 65.86 597 50.60
37 Varanavasi 78 11,935 204.15 1246 48.89 1,066 41.82
38 Ambakkam 25 9,811 86.99 793 14.53 613 11.23
1,511 13.12 580 1.68 400 1.16
39 Karanithangal 62 18,410 313.53 569 39.44 389 26.96
Total
4,121.68
Annexures
159
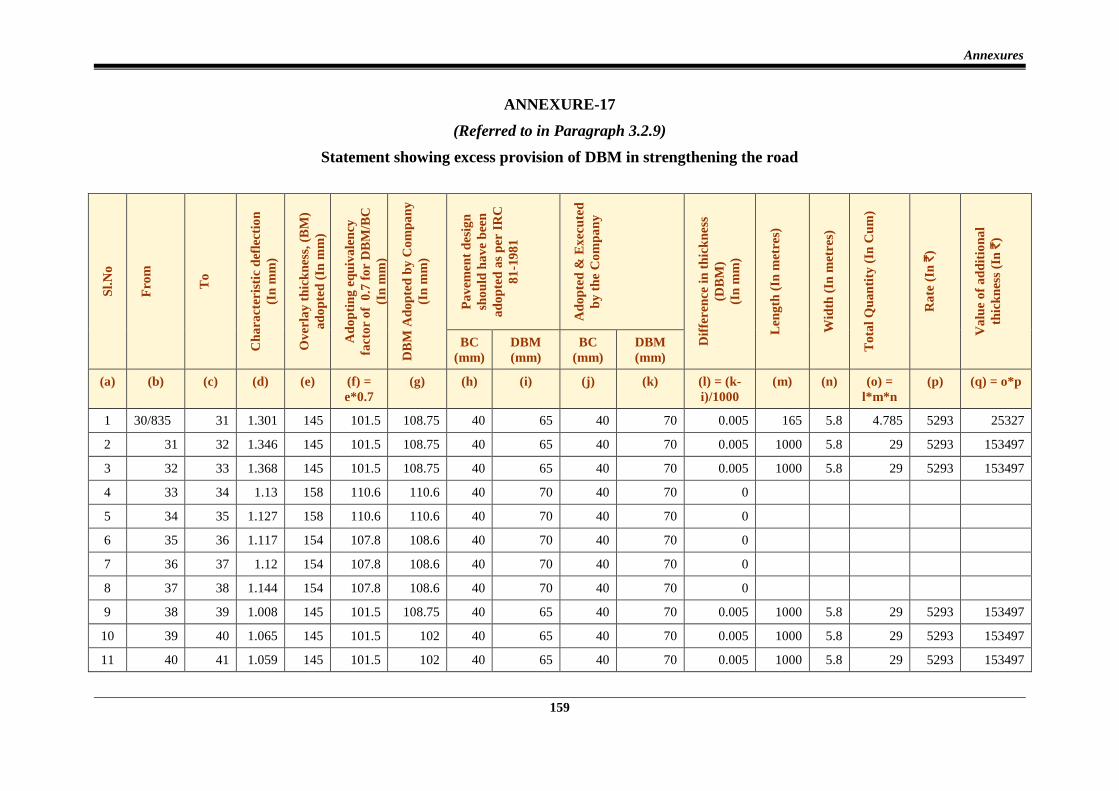
ANNEXURE-17
(Referred to in Paragraph 3.2.9)
Statement showing excess provision of DBM in strengthening the road
Sl.
No
Fro
m
To
Ch
ara
cter
isti
c d
efle
ctio
n
(In
mm
)
Ov
erla
y t
hic
kn
ess,
(B
M)
ad
op
ted
(In
mm
)
Ad
op
tin
g e
qu
iva
len
cy
fact
or
of
0.7
fo
r D
BM
/BC
(In
mm
)
DB
M A
do
pte
d b
y C
om
pa
ny
(In
mm
)
Pa
vem
ent
des
ign
sho
uld
ha
ve
bee
n
ad
op
ted
as
per
IR
C
81
-19
81
Ad
op
ted
& E
xec
ute
d
by
th
e C
om
pa
ny
Dif
feren
ce i
n t
hic
kn
ess
(DB
M)
(In
mm
)
Len
gth
(In
met
res)
Wid
th (
In m
etre
s)
To
tal
Qu
an
tity
(In
Cu
m)
Ra
te (
In `
)
Va
lue
of
ad
dit
ion
al
thic
kn
ess
(In
`)
BC
(mm)
DBM
(mm)
BC
(mm)
DBM
(mm)
(a) (b) (c) (d) (e) (f) =
e*0.7
(g) (h) (i) (j) (k) (l) = (k-
i)/1000
(m) (n) (o) =
l*m*n
(p) (q) = o*p
1 30/835 31 1.301 145 101.5 108.75 40 65 40 70 0.005 165 5.8 4.785 5293 25327
2 31 32 1.346 145 101.5 108.75 40 65 40 70 0.005 1000 5.8 29 5293 153497
3 32 33 1.368 145 101.5 108.75 40 65 40 70 0.005 1000 5.8 29 5293 153497
4 33 34 1.13 158 110.6 110.6 40 70 40 70 0
5 34 35 1.127 158 110.6 110.6 40 70 40 70 0
6 35 36 1.117 154 107.8 108.6 40 70 40 70 0
7 36 37 1.12 154 107.8 108.6 40 70 40 70 0
8 37 38 1.144 154 107.8 108.6 40 70 40 70 0
9 38 39 1.008 145 101.5 108.75 40 65 40 70 0.005 1000 5.8 29 5293 153497
10 39 40 1.065 145 101.5 102 40 65 40 70 0.005 1000 5.8 29 5293 153497
11 40 41 1.059 145 101.5 102 40 65 40 70 0.005 1000 5.8 29 5293 153497
Audit Report (Public Sector Undertakings) for the year ended 31 March 2017
160
Sl.
No
Fro
m
To
Ch
ara
cter
isti
c d
efle
ctio
n
(In
mm
)
Ov
erla
y t
hic
kn
ess,
(B
M)
ad
op
ted
(In
mm
)
Ad
op
tin
g e
qu
iva
len
cy
fact
or
of
0.7
fo
r D
BM
/BC
(In
mm
)
DB
M A
do
pte
d b
y C
om
pa
ny
(In
mm
)
Pa
vem
ent
des
ign
sho
uld
ha
ve
bee
n
ad
op
ted
as
per
IR
C
81
-19
81
Ad
op
ted
& E
xec
ute
d
by
th
e C
om
pa
ny
Dif
feren
ce i
n t
hic
kn
ess
(DB
M)
(In
mm
)
Len
gth
(In
met
res)
Wid
th (
In m
etre
s)
To
tal
Qu
an
tity
(In
Cu
m)
Ra
te (
In `
)
Va
lue
of
ad
dit
ion
al
thic
kn
ess
(In
`)
BC
(mm)
DBM
(mm)
BC
(mm)
DBM
(mm)
(a) (b) (c) (d) (e) (f) =
e*0.7
(g) (h) (i) (j) (k) (l) = (k-
i)/1000
(m) (n) (o) =
l*m*n
(p) (q) = o*p
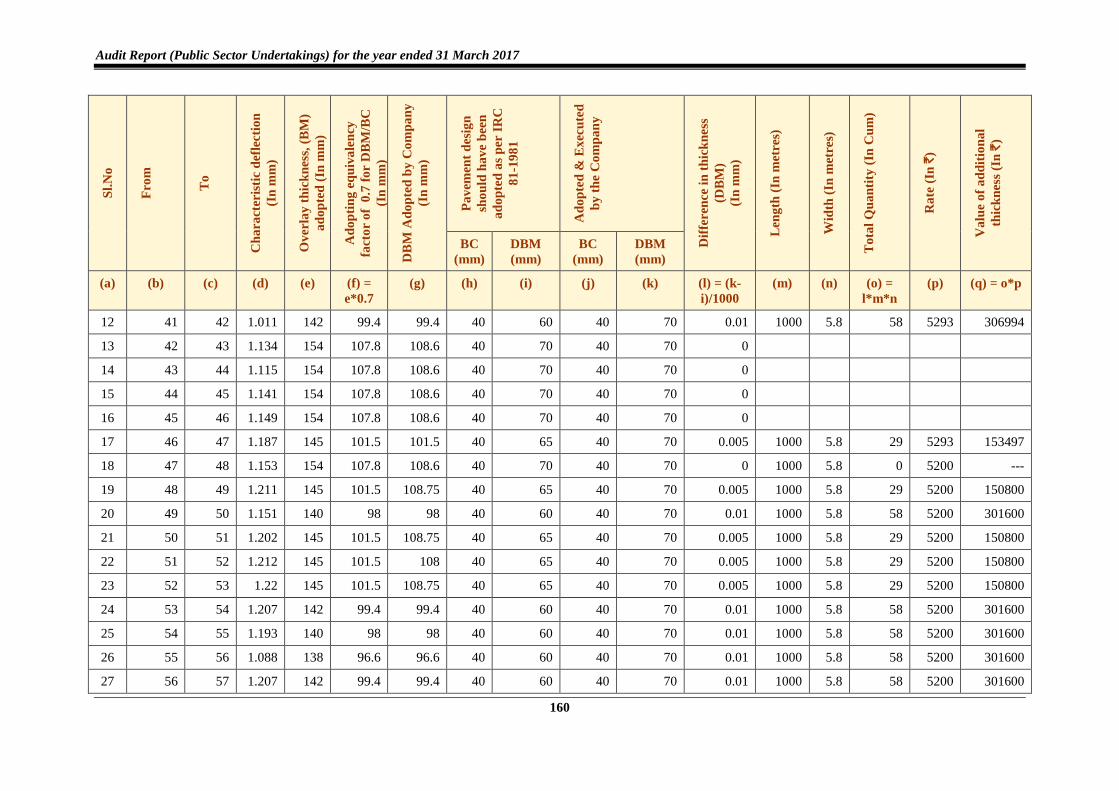
12 41 42 1.011 142 99.4 99.4 40 60 40 70 0.01 1000 5.8 58 5293 306994
13 42 43 1.134 154 107.8 108.6 40 70 40 70 0
14 43 44 1.115 154 107.8 108.6 40 70 40 70 0
15 44 45 1.141 154 107.8 108.6 40 70 40 70 0
16 45 46 1.149 154 107.8 108.6 40 70 40 70 0
17 46 47 1.187 145 101.5 101.5 40 65 40 70 0.005 1000 5.8 29 5293 153497
18 47 48 1.153 154 107.8 108.6 40 70 40 70 0 1000 5.8 0 5200 ---
19 48 49 1.211 145 101.5 108.75 40 65 40 70 0.005 1000 5.8 29 5200 150800
20 49 50 1.151 140 98 98 40 60 40 70 0.01 1000 5.8 58 5200 301600
21 50 51 1.202 145 101.5 108.75 40 65 40 70 0.005 1000 5.8 29 5200 150800
22 51 52 1.212 145 101.5 108 40 65 40 70 0.005 1000 5.8 29 5200 150800
23 52 53 1.22 145 101.5 108.75 40 65 40 70 0.005 1000 5.8 29 5200 150800
24 53 54 1.207 142 99.4 99.4 40 60 40 70 0.01 1000 5.8 58 5200 301600
25 54 55 1.193 140 98 98 40 60 40 70 0.01 1000 5.8 58 5200 301600
26 55 56 1.088 138 96.6 96.6 40 60 40 70 0.01 1000 5.8 58 5200 301600
27 56 57 1.207 142 99.4 99.4 40 60 40 70 0.01 1000 5.8 58 5200 301600
Annexures
161
Sl.
No
Fro
m
To
Ch
ara
cter
isti
c d
efle
ctio
n
(In
mm
)
Ov
erla
y t
hic
kn
ess,
(B
M)
ad
op
ted
(In
mm
)
Ad
op
tin
g e
qu
iva
len
cy
fact
or
of
0.7
fo
r D
BM
/BC
(In
mm
)
DB
M A
do
pte
d b
y C
om
pa
ny
(In
mm
)
Pa
vem
ent
des
ign
sho
uld
ha
ve
bee
n
ad
op
ted
as
per
IR
C
81
-19
81
Ad
op
ted
& E
xec
ute
d
by
th
e C
om
pa
ny
Dif
feren
ce i
n t
hic
kn
ess
(DB
M)
(In
mm
)
Len
gth
(In
met
res)
Wid
th (
In m
etre
s)
To
tal
Qu
an
tity
(In
Cu
m)
Ra
te (
In `
)
Va
lue
of
ad
dit
ion
al
thic
kn
ess
(In
`)
BC
(mm)
DBM
(mm)
BC
(mm)
DBM
(mm)
(a) (b) (c) (d) (e) (f) =
e*0.7
(g) (h) (i) (j) (k) (l) = (k-
i)/1000
(m) (n) (o) =
l*m*n
(p) (q) = o*p
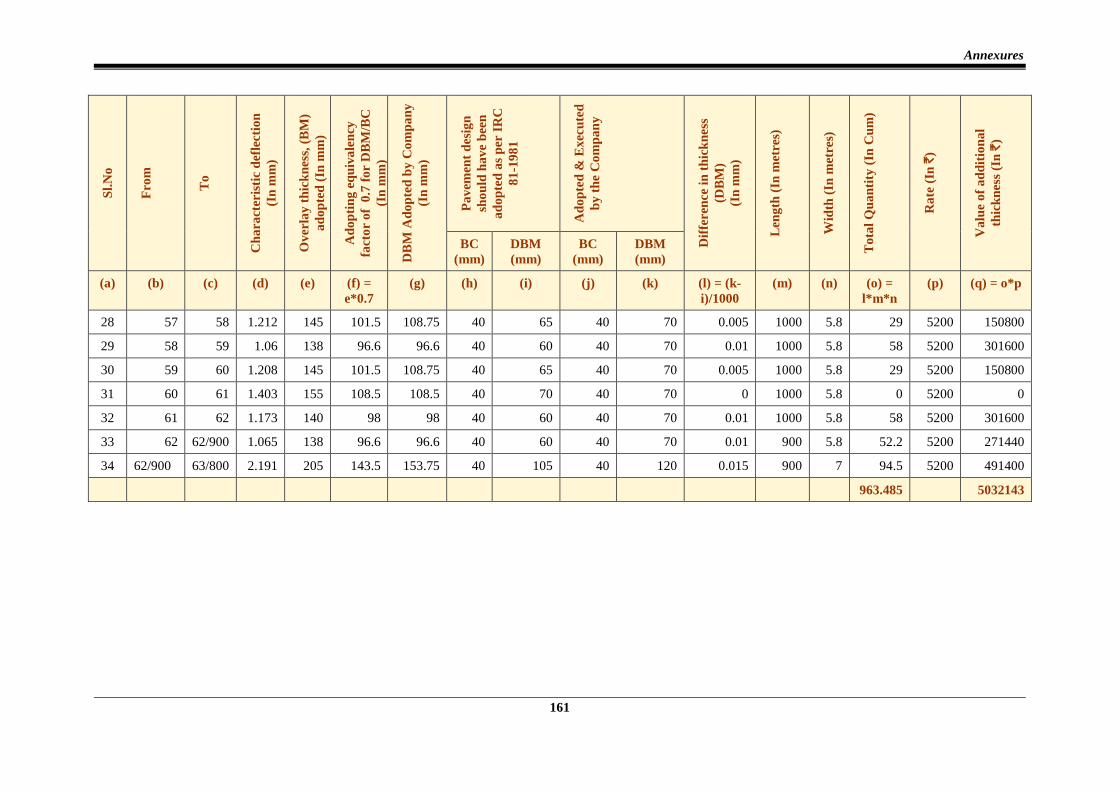
28 57 58 1.212 145 101.5 108.75 40 65 40 70 0.005 1000 5.8 29 5200 150800
29 58 59 1.06 138 96.6 96.6 40 60 40 70 0.01 1000 5.8 58 5200 301600
30 59 60 1.208 145 101.5 108.75 40 65 40 70 0.005 1000 5.8 29 5200 150800
31 60 61 1.403 155 108.5 108.5 40 70 40 70 0 1000 5.8 0 5200 0
32 61 62 1.173 140 98 98 40 60 40 70 0.01 1000 5.8 58 5200 301600
33 62 62/900 1.065 138 96.6 96.6 40 60 40 70 0.01 900 5.8 52.2 5200 271440
34 62/900 63/800 2.191 205 143.5 153.75 40 105 40 120 0.015 900 7 94.5 5200 491400
963.485 5032143
Audit Report (Public Sector Undertakings) for the year ended 31 March 2017
162
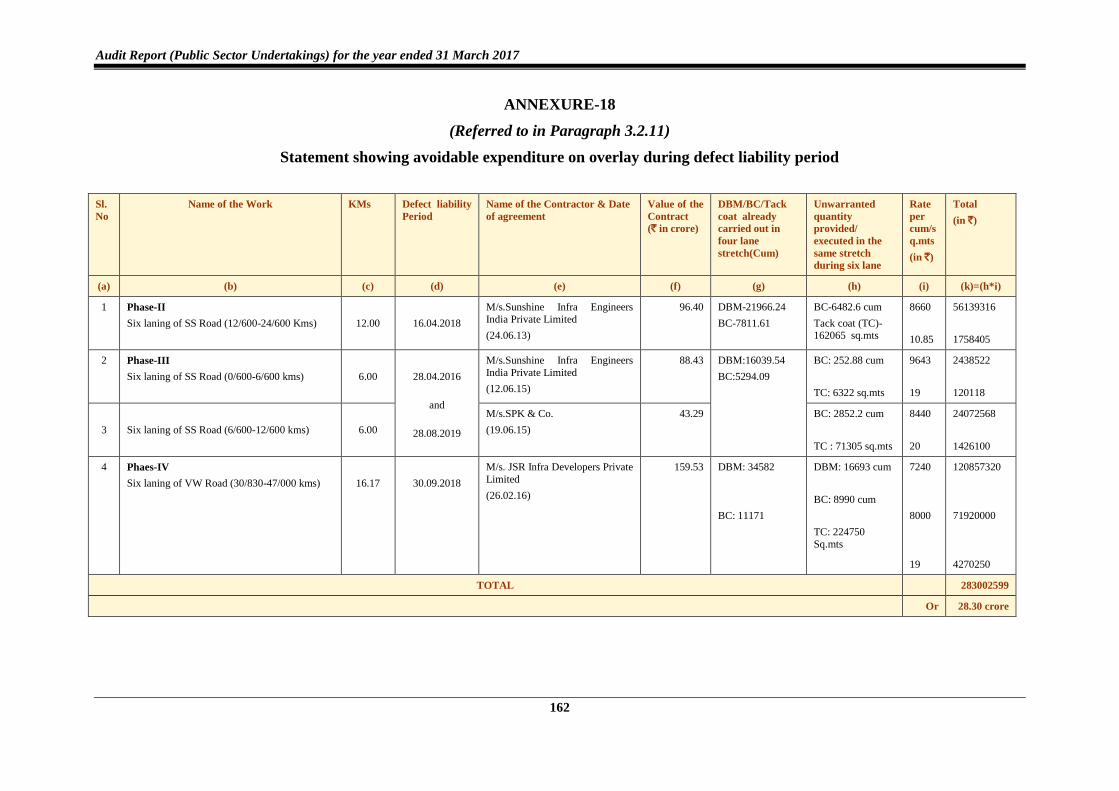
ANNEXURE-18
(Referred to in Paragraph 3.2.11)
Statement showing avoidable expenditure on overlay during defect liability period
Sl.
No
Name of the Work KMs Defect liability
Period
Name of the Contractor & Date
of agreement
Value of the
Contract
(` in crore)
DBM/BC/Tack
coat already
carried out in
four lane
stretch(Cum)
Unwarranted
quantity
provided/
executed in the
same stretch
during six lane
Rate
per
cum/s
q.mts
(in `)
Total
(in `)
(a) (b) (c) (d) (e) (f) (g) (h) (i) (k)=(h*i)
1 Phase-II
Six laning of SS Road (12/600-24/600 Kms)
12.00
16.04.2018
M/s.Sunshine Infra Engineers
India Private Limited
(24.06.13)
96.40 DBM-21966.24
BC-7811.61
BC-6482.6 cum
Tack coat (TC)- 162065 sq.mts
8660
10.85
56139316
1758405
2 Phase-III
Six laning of SS Road (0/600-6/600 kms)
6.00
28.04.2016
and
28.08.2019
M/s.Sunshine Infra Engineers
India Private Limited
(12.06.15)
88.43 DBM:16039.54
BC:5294.09
BC: 252.88 cum
TC: 6322 sq.mts
9643
19
2438522
120118
3
Six laning of SS Road (6/600-12/600 kms)
6.00
M/s.SPK & Co.
(19.06.15)
43.29 BC: 2852.2 cum
TC : 71305 sq.mts
8440
20
24072568
1426100
4 Phaes-IV
Six laning of VW Road (30/830-47/000 kms)
16.17
30.09.2018
M/s. JSR Infra Developers Private
Limited
(26.02.16)
159.53 DBM: 34582
BC: 11171
DBM: 16693 cum
BC: 8990 cum
TC: 224750
Sq.mts
7240
8000
19
120857320
71920000
4270250
TOTAL 283002599
Or 28.30 crore
Annexures
163
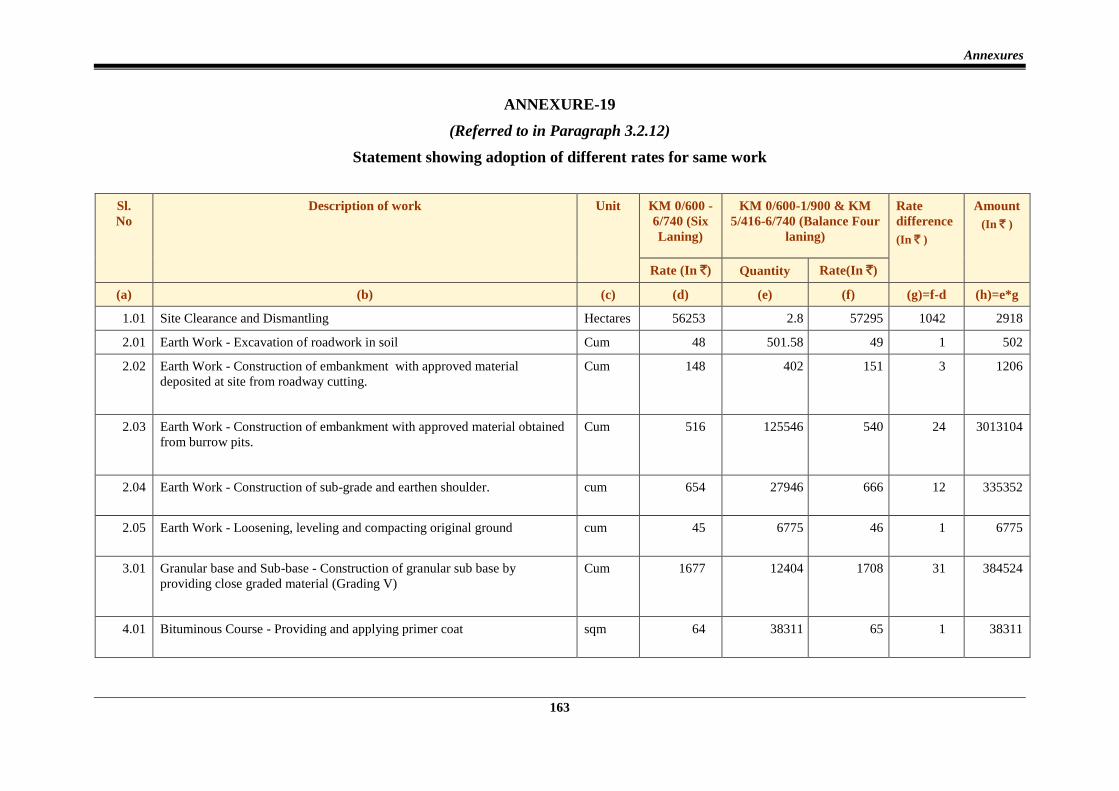
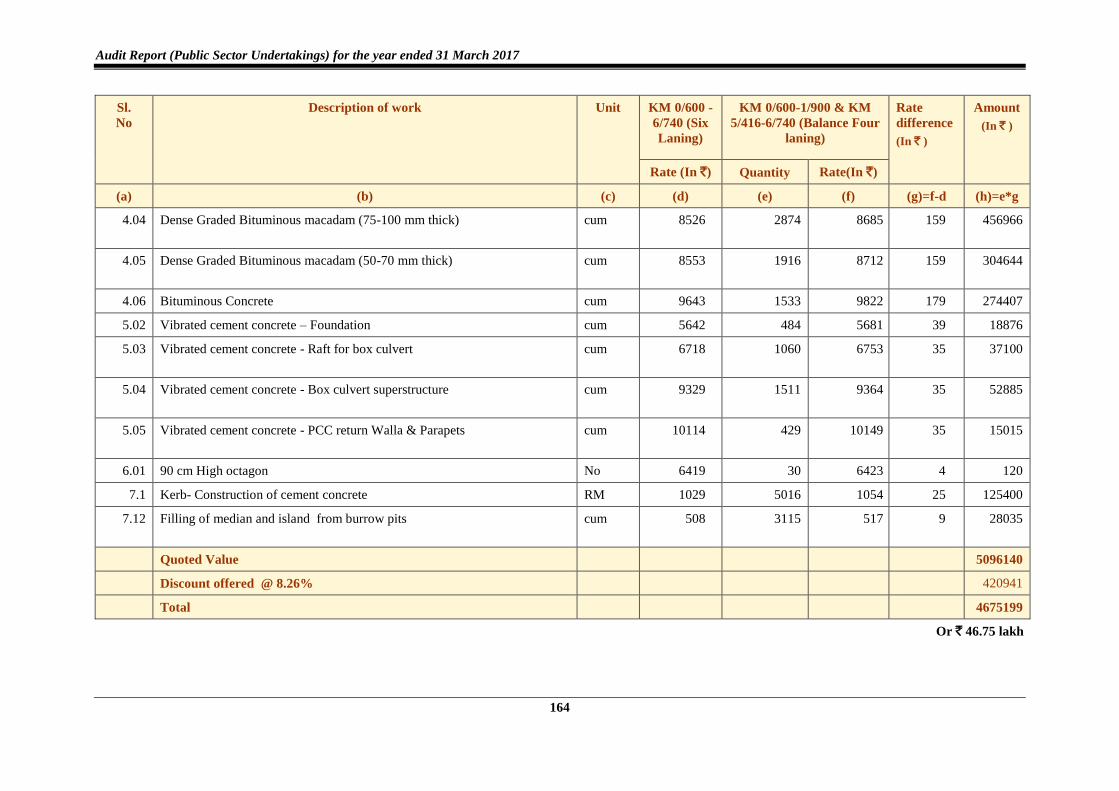
ANNEXURE-19
(Referred to in Paragraph 3.2.12)
Statement showing adoption of different rates for same work
Sl.
No
Description of work Unit KM 0/600 -
6/740 (Six
Laning)
KM 0/600-1/900 & KM
5/416-6/740 (Balance Four
laning)
Rate
difference
(In ` )
Amount
(In ` )
Rate (In `) Quantity Rate(In `)
(a) (b) (c) (d) (e) (f) (g)=f-d (h)=e*g
1.01 Site Clearance and Dismantling Hectares 56253 2.8 57295 1042 2918
2.01 Earth Work - Excavation of roadwork in soil Cum 48 501.58 49 1 502
2.02 Earth Work - Construction of embankment with approved material
deposited at site from roadway cutting.
Cum 148 402 151 3 1206
2.03 Earth Work - Construction of embankment with approved material obtained
from burrow pits.
Cum 516 125546 540 24 3013104
2.04 Earth Work - Construction of sub-grade and earthen shoulder. cum 654 27946 666 12 335352
2.05 Earth Work - Loosening, leveling and compacting original ground cum 45 6775 46 1 6775
3.01 Granular base and Sub-base - Construction of granular sub base by
providing close graded material (Grading V)
Cum 1677 12404 1708 31 384524
4.01 Bituminous Course - Providing and applying primer coat sqm 64 38311 65 1 38311
Audit Report (Public Sector Undertakings) for the year ended 31 March 2017
164
Sl.
No
Description of work Unit KM 0/600 -
6/740 (Six
Laning)
KM 0/600-1/900 & KM
5/416-6/740 (Balance Four
laning)
Rate
difference
(In ` )
Amount
(In ` )
Rate (In `) Quantity Rate(In `)
(a) (b) (c) (d) (e) (f) (g)=f-d (h)=e*g
4.04 Dense Graded Bituminous macadam (75-100 mm thick) cum 8526 2874 8685 159 456966
4.05 Dense Graded Bituminous macadam (50-70 mm thick) cum 8553 1916 8712 159 304644
4.06 Bituminous Concrete cum 9643 1533 9822 179 274407
5.02 Vibrated cement concrete – Foundation cum 5642 484 5681 39 18876
5.03 Vibrated cement concrete - Raft for box culvert cum 6718 1060 6753 35 37100
5.04 Vibrated cement concrete - Box culvert superstructure cum 9329 1511 9364 35 52885
5.05 Vibrated cement concrete - PCC return Walla & Parapets cum 10114 429 10149 35 15015
6.01 90 cm High octagon No 6419 30 6423 4 120
7.1 Kerb- Construction of cement concrete RM 1029 5016 1054 25 125400
7.12 Filling of median and island from burrow pits cum 508 3115 517 9 28035
Quoted Value 5096140
Discount offered @ 8.26% 420941
Total 4675199
Or ` 46.75 lakh
Annexures
165
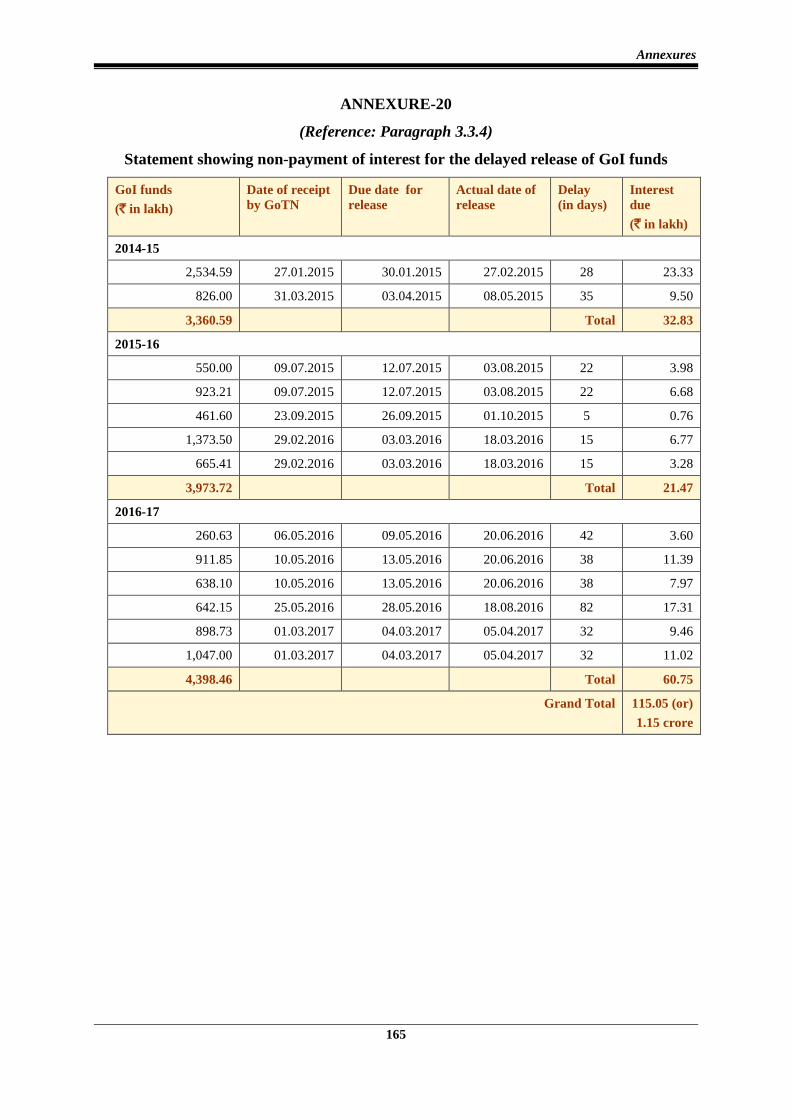
ANNEXURE-20
(Reference: Paragraph 3.3.4)
Statement showing non-payment of interest for the delayed release of GoI funds
GoI funds
(` in lakh)
Date of receipt
by GoTN
Due date for
release
Actual date of
release
Delay
(in days)
Interest
due
(` in lakh)
2014-15
2,534.59 27.01.2015 30.01.2015 27.02.2015 28 23.33
826.00 31.03.2015 03.04.2015 08.05.2015 35 9.50
3,360.59 Total 32.83
2015-16
550.00 09.07.2015 12.07.2015 03.08.2015 22 3.98
923.21 09.07.2015 12.07.2015 03.08.2015 22 6.68
461.60 23.09.2015 26.09.2015 01.10.2015 5 0.76
1,373.50 29.02.2016 03.03.2016 18.03.2016 15 6.77
665.41 29.02.2016 03.03.2016 18.03.2016 15 3.28
3,973.72 Total 21.47
2016-17
260.63 06.05.2016 09.05.2016 20.06.2016 42 3.60
911.85 10.05.2016 13.05.2016 20.06.2016 38 11.39
638.10 10.05.2016 13.05.2016 20.06.2016 38 7.97
642.15 25.05.2016 28.05.2016 18.08.2016 82 17.31
898.73 01.03.2017 04.03.2017 05.04.2017 32 9.46
1,047.00 01.03.2017 04.03.2017 05.04.2017 32 11.02
4,398.46 Total 60.75
Grand Total 115.05 (or)
1.15 crore
Audit Report (Public Sector Undertakings) for the year ended 31 March 2017
166
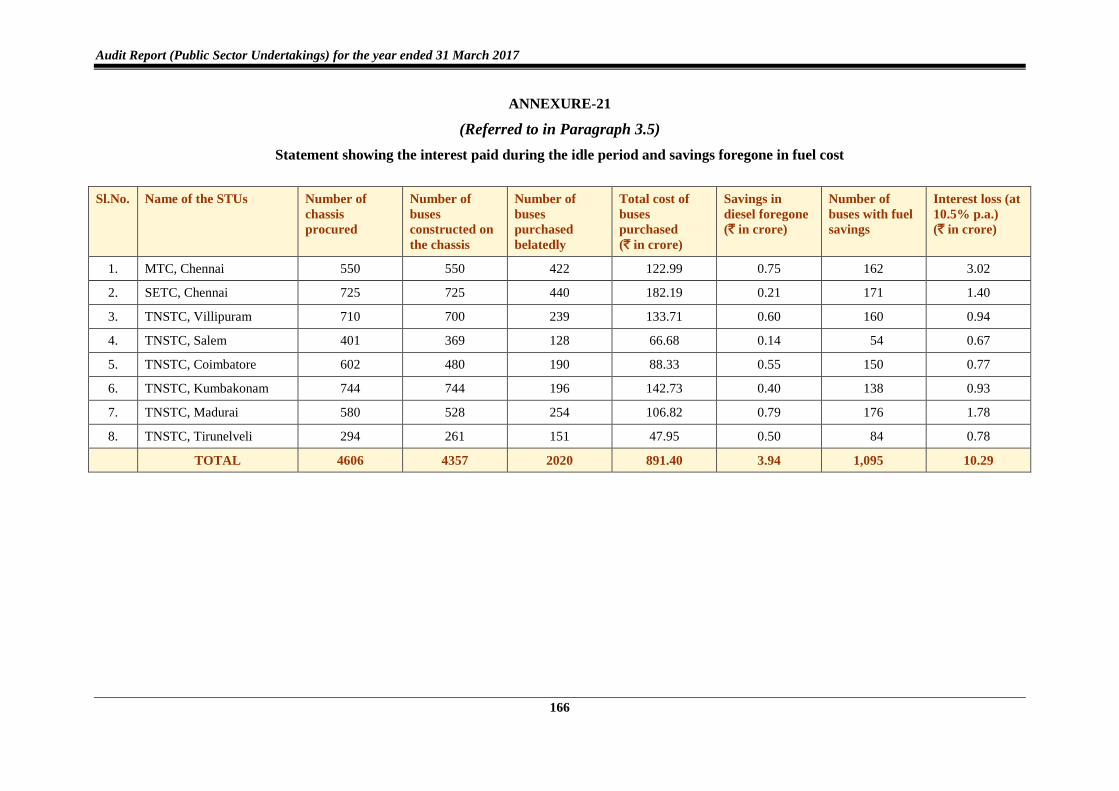
ANNEXURE-21
(Referred to in Paragraph 3.5)
Statement showing the interest paid during the idle period and savings foregone in fuel cost
Sl.No. Name of the STUs Number of
chassis
procured
Number of
buses
constructed on
the chassis
Number of
buses
purchased
belatedly
Total cost of
buses
purchased
(` in crore)
Savings in
diesel foregone
(` in crore)
Number of
buses with fuel
savings
Interest loss (at
10.5% p.a.)
(` in crore)
1. MTC, Chennai 550 550 422 122.99 0.75 162 3.02
2. SETC, Chennai 725 725 440 182.19 0.21 171 1.40
3. TNSTC, Villipuram 710 700 239 133.71 0.60 160 0.94
4. TNSTC, Salem 401 369 128 66.68 0.14 54 0.67
5. TNSTC, Coimbatore 602 480 190 88.33 0.55 150 0.77
6. TNSTC, Kumbakonam 744 744 196 142.73 0.40 138 0.93
7. TNSTC, Madurai 580 528 254 106.82 0.79 176 1.78
8. TNSTC, Tirunelveli 294 261 151 47.95 0.50 84 0.78
TOTAL 4606 4357 2020 891.40 3.94 1,095 10.29
Annexures
167
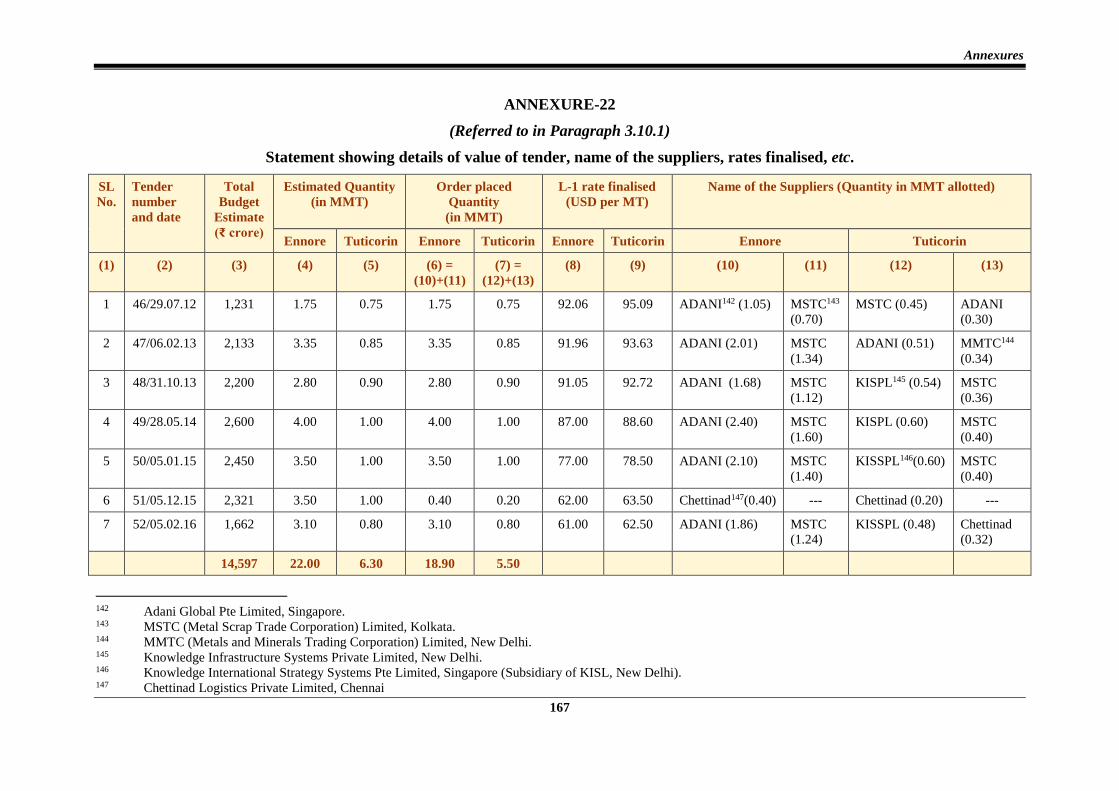
ANNEXURE-22
(Referred to in Paragraph 3.10.1)
Statement showing details of value of tender, name of the suppliers, rates finalised, etc.
SL
No.
Tender
number
and date
Total
Budget
Estimate
(₹ crore)
Estimated Quantity
(in MMT)
Order placed
Quantity
(in MMT)
L-1 rate finalised
(USD per MT)
Name of the Suppliers (Quantity in MMT allotted)
Ennore Tuticorin Ennore Tuticorin Ennore Tuticorin Ennore Tuticorin
(1) (2) (3) (4) (5) (6) =
(10)+(11)
(7) =
(12)+(13)
(8) (9) (10) (11) (12) (13)
1 46/29.07.12 1,231 1.75 0.75 1.75 0.75 92.06 95.09 ADANI142 (1.05) MSTC143
(0.70)
MSTC (0.45) ADANI
(0.30)
2 47/06.02.13 2,133 3.35 0.85 3.35 0.85 91.96 93.63 ADANI (2.01) MSTC
(1.34)
ADANI (0.51) MMTC144
(0.34)
3 48/31.10.13 2,200 2.80 0.90 2.80 0.90 91.05 92.72 ADANI (1.68) MSTC
(1.12)
KISPL145 (0.54) MSTC
(0.36)
4 49/28.05.14 2,600 4.00 1.00 4.00 1.00 87.00 88.60 ADANI (2.40) MSTC
(1.60)
KISPL (0.60) MSTC
(0.40)
5 50/05.01.15 2,450 3.50 1.00 3.50 1.00 77.00 78.50 ADANI (2.10) MSTC
(1.40)
KISSPL146(0.60) MSTC
(0.40)
6 51/05.12.15 2,321 3.50 1.00 0.40 0.20 62.00 63.50 Chettinad147(0.40) --- Chettinad (0.20) ---
7 52/05.02.16 1,662 3.10 0.80 3.10 0.80 61.00 62.50 ADANI (1.86) MSTC
(1.24)
KISSPL (0.48) Chettinad
(0.32)
14,597 22.00 6.30 18.90 5.50
142 Adani Global Pte Limited, Singapore. 143 MSTC (Metal Scrap Trade Corporation) Limited, Kolkata. 144 MMTC (Metals and Minerals Trading Corporation) Limited, New Delhi. 145 Knowledge Infrastructure Systems Private Limited, New Delhi. 146 Knowledge International Strategy Systems Pte Limited, Singapore (Subsidiary of KISL, New Delhi). 147 Chettinad Logistics Private Limited, Chennai
Audit Report (Public Sector Undertakings) for the year ended 31 March 2017
168
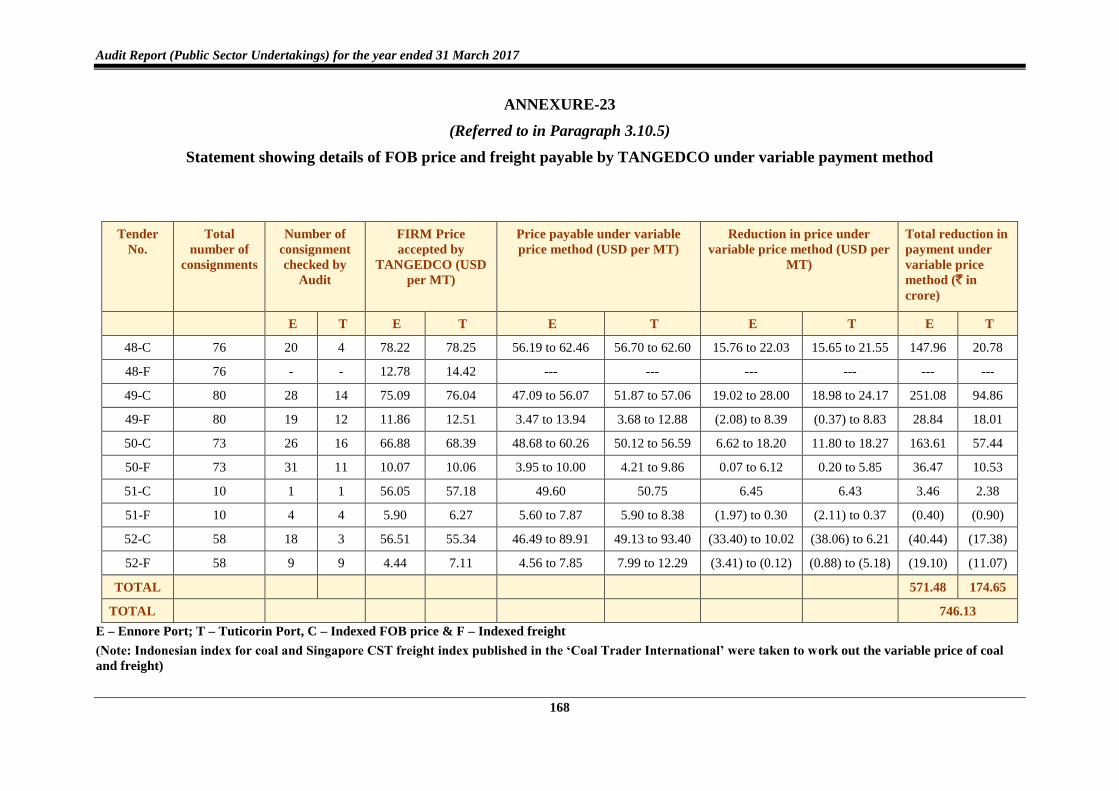
ANNEXURE-23
(Referred to in Paragraph 3.10.5)
Statement showing details of FOB price and freight payable by TANGEDCO under variable payment method
E – Ennore Port; T – Tuticorin Port, C – Indexed FOB price & F – Indexed freight
(Note: Indonesian index for coal and Singapore CST freight index published in the ‘Coal Trader International’ were taken to work out the variable price of coal
and freight)
Tender
No.
Total
number of
consignments
Number of
consignment
checked by
Audit
FIRM Price
accepted by
TANGEDCO (USD
per MT)
Price payable under variable
price method (USD per MT)
Reduction in price under
variable price method (USD per
MT)
Total reduction in
payment under
variable price
method (` in
crore)
E T E T E T E T E T
48-C 76 20 4 78.22 78.25 56.19 to 62.46 56.70 to 62.60 15.76 to 22.03 15.65 to 21.55 147.96 20.78
48-F 76 - - 12.78 14.42 --- --- --- --- --- ---
49-C 80 28 14 75.09 76.04 47.09 to 56.07 51.87 to 57.06 19.02 to 28.00 18.98 to 24.17 251.08 94.86
49-F 80 19 12 11.86 12.51 3.47 to 13.94 3.68 to 12.88 (2.08) to 8.39 (0.37) to 8.83 28.84 18.01
50-C 73 26 16 66.88 68.39 48.68 to 60.26 50.12 to 56.59 6.62 to 18.20 11.80 to 18.27 163.61 57.44
50-F 73 31 11 10.07 10.06 3.95 to 10.00 4.21 to 9.86 0.07 to 6.12 0.20 to 5.85 36.47 10.53
51-C 10 1 1 56.05 57.18 49.60 50.75 6.45 6.43 3.46 2.38
51-F 10 4 4 5.90 6.27 5.60 to 7.87 5.90 to 8.38 (1.97) to 0.30 (2.11) to 0.37 (0.40) (0.90)
52-C 58 18 3 56.51 55.34 46.49 to 89.91 49.13 to 93.40 (33.40) to 10.02 (38.06) to 6.21 (40.44) (17.38)
52-F 58 9 9 4.44 7.11 4.56 to 7.85 7.99 to 12.29 (3.41) to (0.12) (0.88) to (5.18) (19.10) (11.07)
TOTAL
571.48 174.65
TOTAL 746.13
Annexures
169
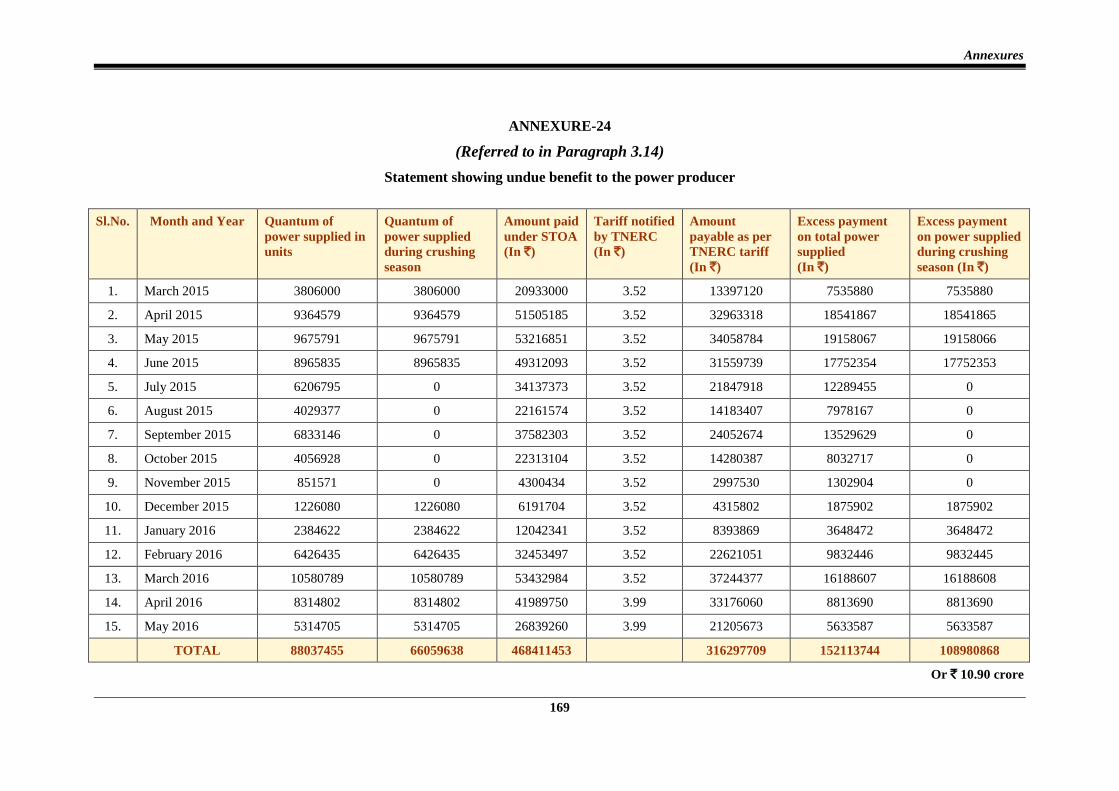
ANNEXURE-24
(Referred to in Paragraph 3.14)
Statement showing undue benefit to the power producer
Sl.No. Month and Year Quantum of
power supplied in
units
Quantum of
power supplied
during crushing
season
Amount paid
under STOA
(In `)
Tariff notified
by TNERC
(In `)
Amount
payable as per
TNERC tariff
(In `)
Excess payment
on total power
supplied
(In `)
Excess payment
on power supplied
during crushing
season (In `)
1. March 2015 3806000 3806000 20933000 3.52 13397120 7535880 7535880
2. April 2015 9364579 9364579 51505185 3.52 32963318 18541867 18541865
3. May 2015 9675791 9675791 53216851 3.52 34058784 19158067 19158066
4. June 2015 8965835 8965835 49312093 3.52 31559739 17752354 17752353
5. July 2015 6206795 0 34137373 3.52 21847918 12289455 0
6. August 2015 4029377 0 22161574 3.52 14183407 7978167 0
7. September 2015 6833146 0 37582303 3.52 24052674 13529629 0
8. October 2015 4056928 0 22313104 3.52 14280387 8032717 0
9. November 2015 851571 0 4300434 3.52 2997530 1302904 0
10. December 2015 1226080 1226080 6191704 3.52 4315802 1875902 1875902
11. January 2016 2384622 2384622 12042341 3.52 8393869 3648472 3648472
12. February 2016 6426435 6426435 32453497 3.52 22621051 9832446 9832445
13. March 2016 10580789 10580789 53432984 3.52 37244377 16188607 16188608
14. April 2016 8314802 8314802 41989750 3.99 33176060 8813690 8813690
15. May 2016 5314705 5314705 26839260 3.99 21205673 5633587 5633587
TOTAL 88037455 66059638 468411453 316297709 152113744 108980868
Or ` 10.90 crore
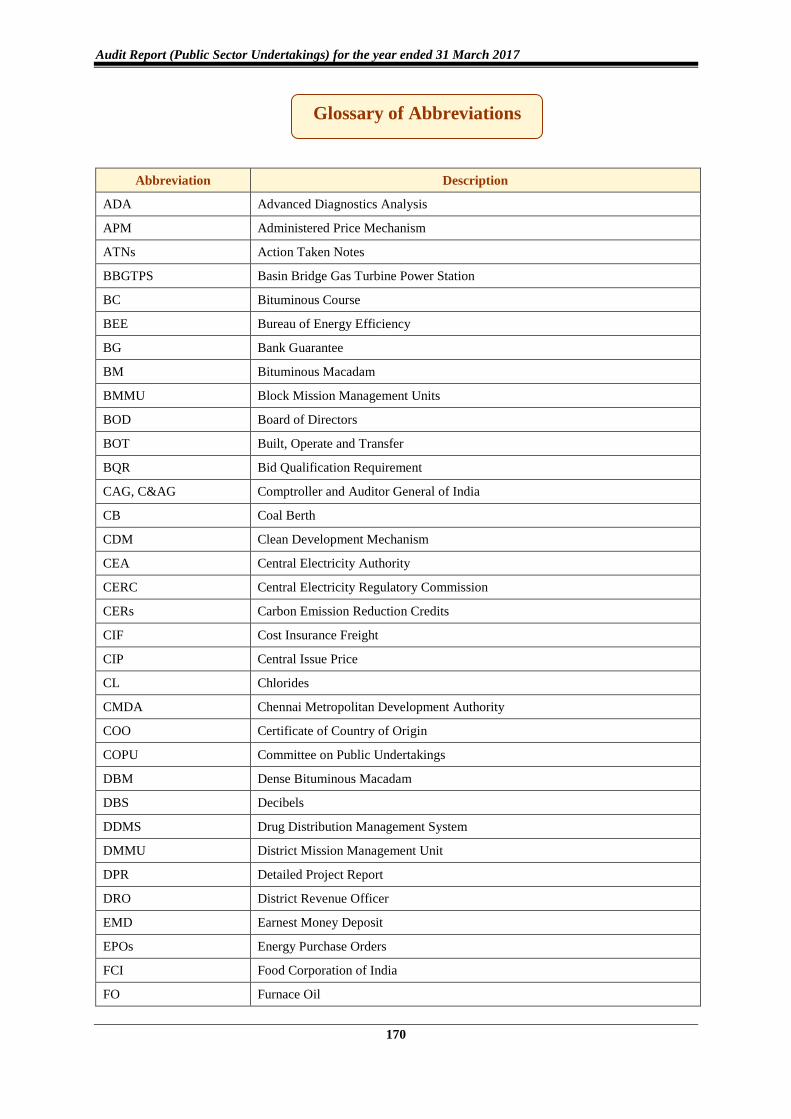
Audit Report (Public Sector Undertakings) for the year ended 31 March 2017
170
Abbreviation Description
ADA Advanced Diagnostics Analysis
APM Administered Price Mechanism
ATNs Action Taken Notes
BBGTPS Basin Bridge Gas Turbine Power Station
BC Bituminous Course
BEE Bureau of Energy Efficiency
BG Bank Guarantee
BM Bituminous Macadam
BMMU Block Mission Management Units
BOD Board of Directors
BOT Built, Operate and Transfer
BQR Bid Qualification Requirement
CAG, C&AG Comptroller and Auditor General of India
CB Coal Berth
CDM Clean Development Mechanism
CEA Central Electricity Authority
CERC Central Electricity Regulatory Commission
CERs Carbon Emission Reduction Credits
CIF Cost Insurance Freight
CIP Central Issue Price
CL Chlorides
CMDA Chennai Metropolitan Development Authority
COO Certificate of Country of Origin
COPU Committee on Public Undertakings
DBM Dense Bituminous Macadam
DBS Decibels
DDMS Drug Distribution Management System
DMMU District Mission Management Unit
DPR Detailed Project Report
DRO District Revenue Officer
EMD Earnest Money Deposit
EPOs Energy Purchase Orders
FCI Food Corporation of India
FO Furnace Oil
Glossary of Abbreviations
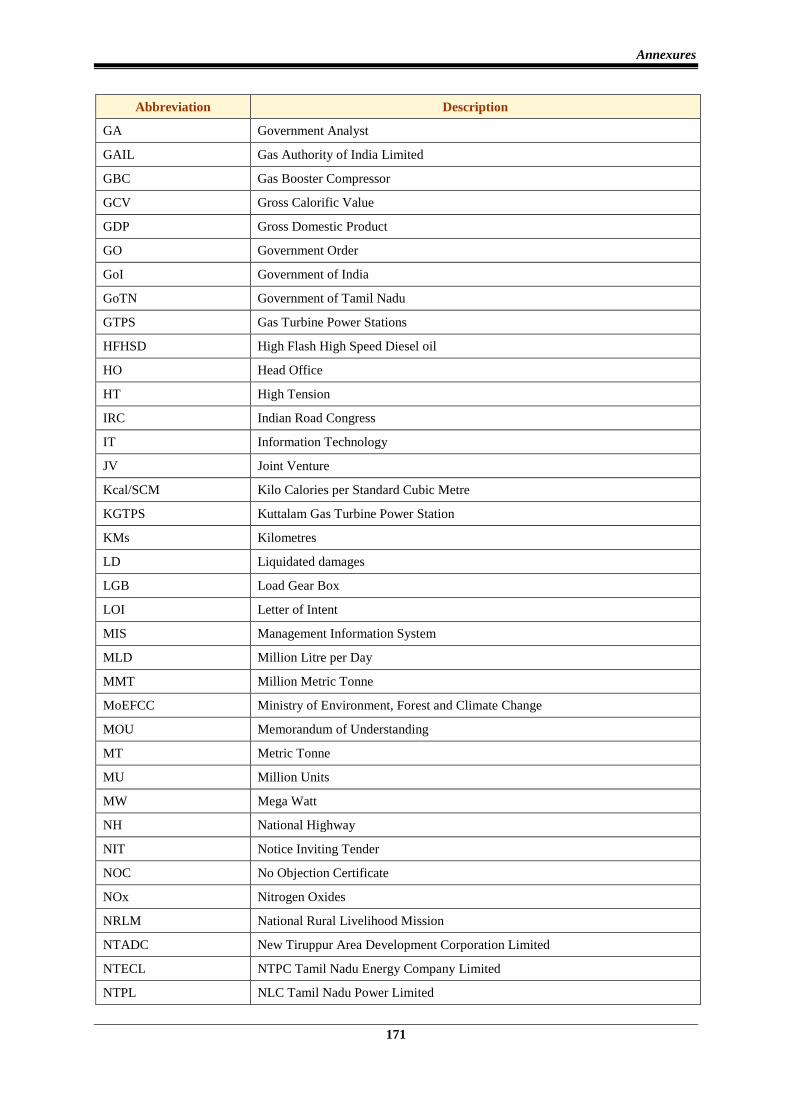
Annexures
171
Abbreviation Description
GA Government Analyst
GAIL Gas Authority of India Limited
GBC Gas Booster Compressor
GCV Gross Calorific Value
GDP Gross Domestic Product
GO Government Order
GoI Government of India
GoTN Government of Tamil Nadu
GTPS Gas Turbine Power Stations
HFHSD High Flash High Speed Diesel oil
HO Head Office
HT High Tension
IRC Indian Road Congress
IT Information Technology
JV Joint Venture
Kcal/SCM Kilo Calories per Standard Cubic Metre
KGTPS Kuttalam Gas Turbine Power Station
KMs Kilometres
LD Liquidated damages
LGB Load Gear Box
LOI Letter of Intent
MIS Management Information System
MLD Million Litre per Day
MMT Million Metric Tonne
MoEFCC Ministry of Environment, Forest and Climate Change
MOU Memorandum of Understanding
MT Metric Tonne
MU Million Units
MW Mega Watt
NH National Highway
NIT Notice Inviting Tender
NOC No Objection Certificate
NOx Nitrogen Oxides
NRLM National Rural Livelihood Mission
NTADC New Tiruppur Area Development Corporation Limited
NTECL NTPC Tamil Nadu Energy Company Limited
NTPL NLC Tamil Nadu Power Limited
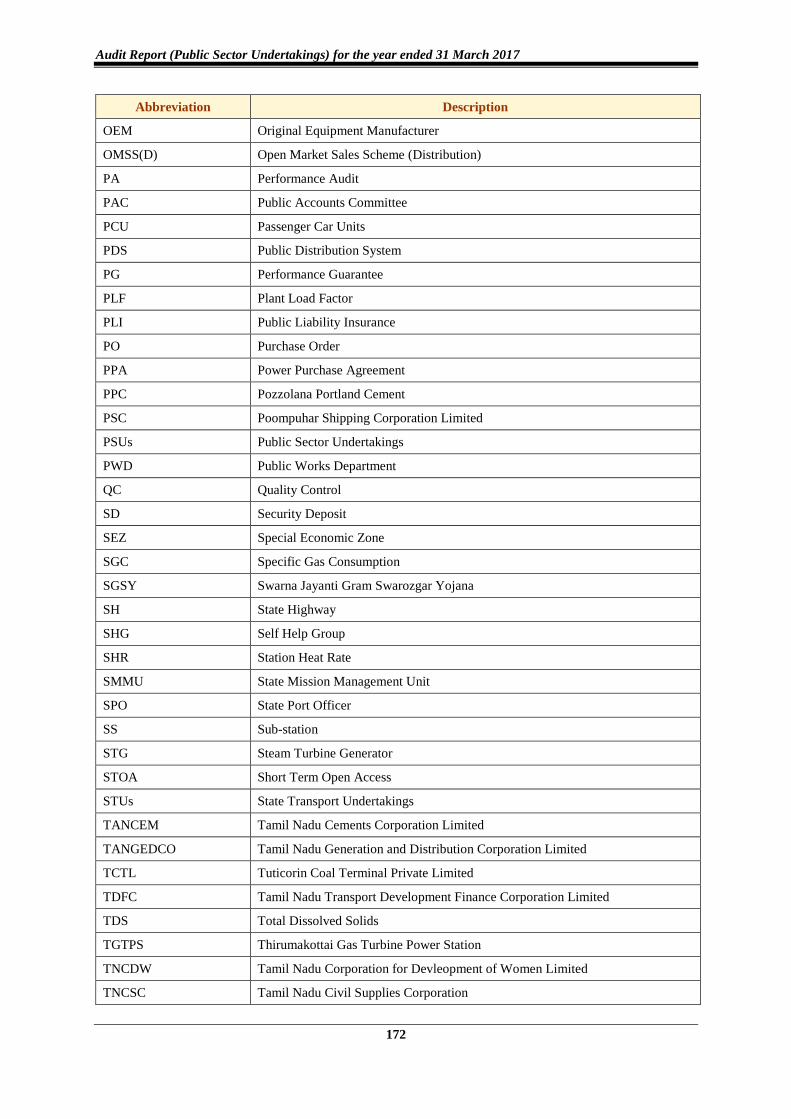
Audit Report (Public Sector Undertakings) for the year ended 31 March 2017
172
Abbreviation Description
OEM Original Equipment Manufacturer
OMSS(D) Open Market Sales Scheme (Distribution)
PA Performance Audit
PAC Public Accounts Committee
PCU Passenger Car Units
PDS Public Distribution System
PG Performance Guarantee
PLF Plant Load Factor
PLI Public Liability Insurance
PO Purchase Order
PPA Power Purchase Agreement
PPC Pozzolana Portland Cement
PSC Poompuhar Shipping Corporation Limited
PSUs Public Sector Undertakings
PWD Public Works Department
QC Quality Control
SD Security Deposit
SEZ Special Economic Zone
SGC Specific Gas Consumption
SGSY Swarna Jayanti Gram Swarozgar Yojana
SH State Highway
SHG Self Help Group
SHR Station Heat Rate
SMMU State Mission Management Unit
SPO State Port Officer
SS Sub-station
STG Steam Turbine Generator
STOA Short Term Open Access
STUs State Transport Undertakings
TANCEM Tamil Nadu Cements Corporation Limited
TANGEDCO Tamil Nadu Generation and Distribution Corporation Limited
TCTL Tuticorin Coal Terminal Private Limited
TDFC Tamil Nadu Transport Development Finance Corporation Limited
TDS Total Dissolved Solids
TGTPS Thirumakottai Gas Turbine Power Station
TNCDW Tamil Nadu Corporation for Devleopment of Women Limited
TNCSC Tamil Nadu Civil Supplies Corporation
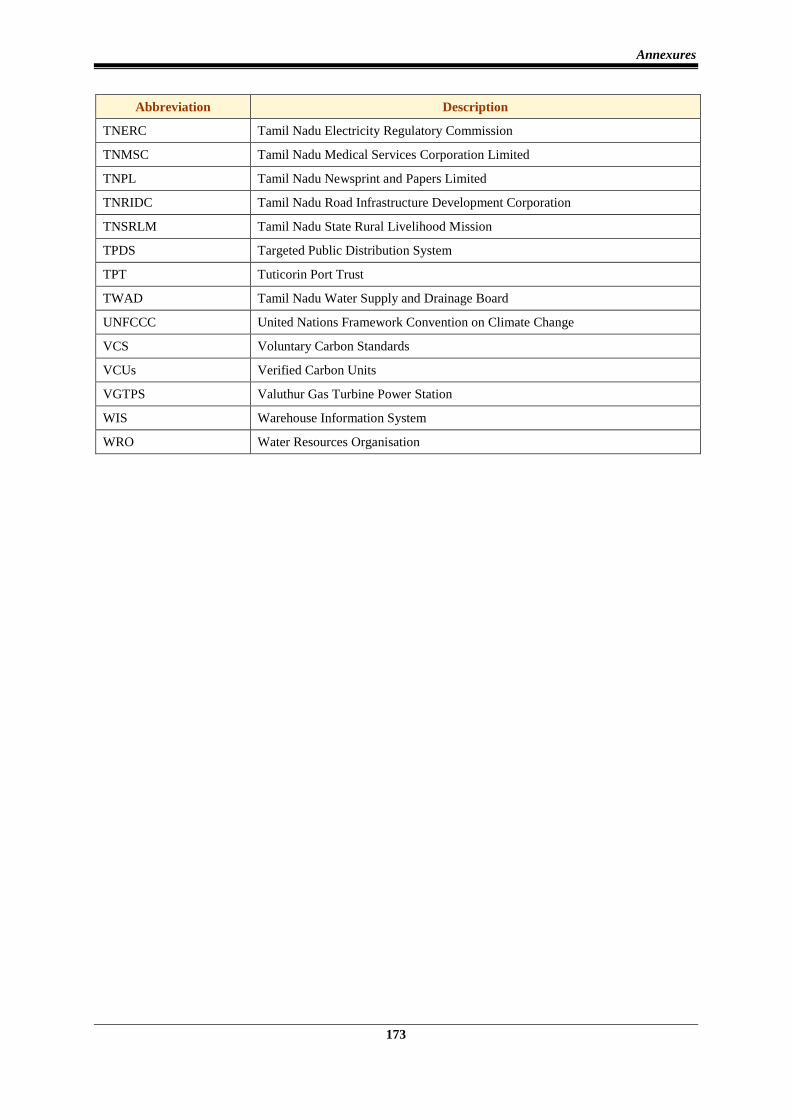
Annexures
173
Abbreviation Description
TNERC Tamil Nadu Electricity Regulatory Commission
TNMSC Tamil Nadu Medical Services Corporation Limited
TNPL Tamil Nadu Newsprint and Papers Limited
TNRIDC Tamil Nadu Road Infrastructure Development Corporation
TNSRLM Tamil Nadu State Rural Livelihood Mission
TPDS Targeted Public Distribution System
TPT Tuticorin Port Trust
TWAD Tamil Nadu Water Supply and Drainage Board
UNFCCC United Nations Framework Convention on Climate Change
VCS Voluntary Carbon Standards
VCUs Verified Carbon Units
VGTPS Valuthur Gas Turbine Power Station
WIS Warehouse Information System
WRO Water Resources Organisation
© COMPTROLLER AND
AUDITOR GENERAL OF INDIA
www.cag.gov.in
http://www.agtn.cag.gov.in
Related Documents