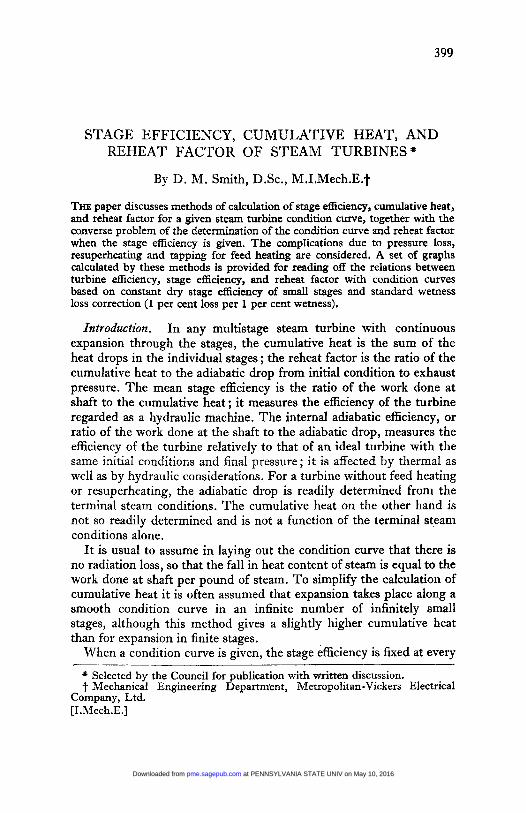
399 STAGE EFFICIENCY, CUMULATIVE HEAT, AND REHEAT FACTOR OF STEAM TURBINES" By D. M. Smith, D.Sc., M.1.Mech.E.t THE paper discusses methods of calculation of stage efficiency, cumulative heat, and reheat factor for a given steam turbine condition curve, together with the converse problem of the determination of the condition curve and reheat factor when the stage efficiency is given. The complications due to pressure loss, resuperheating and tapping for feed heating are considered. A set of graphs calculated by these methods is provided for reading off the relations between turbine efficiency, stage efficiency, and reheat factor with condition curves based on constant dry stage efliciency of small stages and standard wetness loss correction (1 per cent loss per 1 per cent wetness). Introduction. In any multistage steam turbine with continuous expansion through the stages, the cumulative heat is the sum of the heat drops in the individual stages ; the reheat factor is the ratio of the cumulative heat to the adiabatic drop from initial condition to exhaust pressure. The mean stage efficiency is the ratio of the work done at shaft to the cumulative heat ; it measures the efficiency of the turbine regarded as a hydraulic machine. The internal adiabatic efficiency, or ratio of the work done at the shaft to the adiabatic drop, measures the efficiency of the turbine relatively to that of an ideal turbine with the same initial conditions and final pressure ; it is affected by thermaI as well as by hydraulic considerations. For a turbine without feed heating or resuperheating, the adiabatic drop is readily determined from the terminal steam conditions. The cumulative heat on the other hand is not so readily determined and is not a function of the terminal steam conditions alone. It is usual to assume in laying out the condition curve that there is no radiation loss, so that the fall in heat content of steam is equal to the work done at shaft per pound of steam. To simplify the calculation of cumulative heat it is often assumed that expansion takes place along a smooth condition curve in an infinite number of infinitely small stages, although this method gives a slightly higher cumulative heat than for expansion in finite stages. When a condition curve is given, the stage efficiency is fixed at every * Selected by the Council for publication with written discussion. f Mechanical Engineering Departm'ent, Metropolitan-Vickers Electrical - Company, Ltd. [I.Mech.E.] at PENNSYLVANIA STATE UNIV on May 10, 2016 pme.sagepub.com Downloaded from

Welcome message from author
This document is posted to help you gain knowledge. Please leave a comment to let me know what you think about it! Share it to your friends and learn new things together.
Transcript
399
S T A G E EFFICIENCY, CUMULATIVE HEAT, A N D REHEAT FACTOR OF STEAM TURBINES"
By D. M. Smith, D.Sc., M.1.Mech.E.t
THE paper discusses methods of calculation of stage efficiency, cumulative heat, and reheat factor for a given steam turbine condition curve, together with the converse problem of the determination of the condition curve and reheat factor when the stage efficiency is given. The complications due to pressure loss, resuperheating and tapping for feed heating are considered. A set of graphs calculated by these methods is provided for reading off the relations between turbine efficiency, stage efficiency, and reheat factor with condition curves based on constant dry stage efliciency of small stages and standard wetness loss correction (1 per cent loss per 1 per cent wetness).
Introduction. In any multistage steam turbine with continuous expansion through the stages, the cumulative heat is the sum of the heat drops in the individual stages ; the reheat factor is the ratio of the cumulative heat to the adiabatic drop from initial condition to exhaust pressure. The mean stage efficiency is the ratio of the work done at shaft to the cumulative heat ; it measures the efficiency of the turbine regarded as a hydraulic machine. The internal adiabatic efficiency, or ratio of the work done at the shaft to the adiabatic drop, measures the efficiency of the turbine relatively to that of an ideal turbine with the same initial conditions and final pressure ; it is affected by thermaI as well as by hydraulic considerations. For a turbine without feed heating or resuperheating, the adiabatic drop is readily determined from the terminal steam conditions. The cumulative heat on the other hand is not so readily determined and is not a function of the terminal steam conditions alone.
It is usual to assume in laying out the condition curve that there is no radiation loss, so that the fall in heat content of steam is equal to the work done at shaft per pound of steam. To simplify the calculation of cumulative heat it is often assumed that expansion takes place along a smooth condition curve in an infinite number of infinitely small stages, although this method gives a slightly higher cumulative heat than for expansion in finite stages.
When a condition curve is given, the stage efficiency is fixed at every
* Selected by the Council for publication with written discussion. f Mechanical Engineering Departm'ent, Metropolitan-Vickers Electrical
-
Company, Ltd. [I.Mech.E.]
at PENNSYLVANIA STATE UNIV on May 10, 2016pme.sagepub.comDownloaded from
400 STAGE EFFICIENCY OF STEAM TURBINES
stage and the cumulative heat and reheat factor are fixed. When the internal adiabatic efficiency is given, but the condition curve is not specified, the cumulative heat and reheat factor may be varied over a limited range by varying the condition curve although its extremities remain fixed. A condition curve with stage efficiency low at high pres- sures and high at low pressures gives a higher cumillative heat and reheat factor than a condition curve with stage efficiency high at high pressures and low at low pressures.
Turbine test records give the terminal steam conditions and internal efficiency with considerable accuracy, but do not indicate the shape of the condition curve. Turbine tests are therefore frequently analysed and compared on the conventional assumption that the reheat factor is given as for expansion in small stages with uniform dry stage efficiency and a standard wetness loss correction. The uniform dry stage efficiency is not known in advance but must be calculated for consistency with the known internal efficiency. The wetness loss cor- rection usually taken is at the rate of 1 per cent decrease in stage efficiency for each 1 per cent wetness in the stage."
In making general calculations for new projects as to effect on heat consumption of a wide variation in designed steam conditions, it is common practice to base the comparison on a standard dry stage efficiency with standard wetness loss correction. The assumption under- lying this comparison is that for each set of steam conditions a turbine would be specially designed to give the standard dry stage efficiency.
Symbols and General Principles.
P t T i S
Pressure. Temperature. Absolute temperature. Heat content. Entropy.
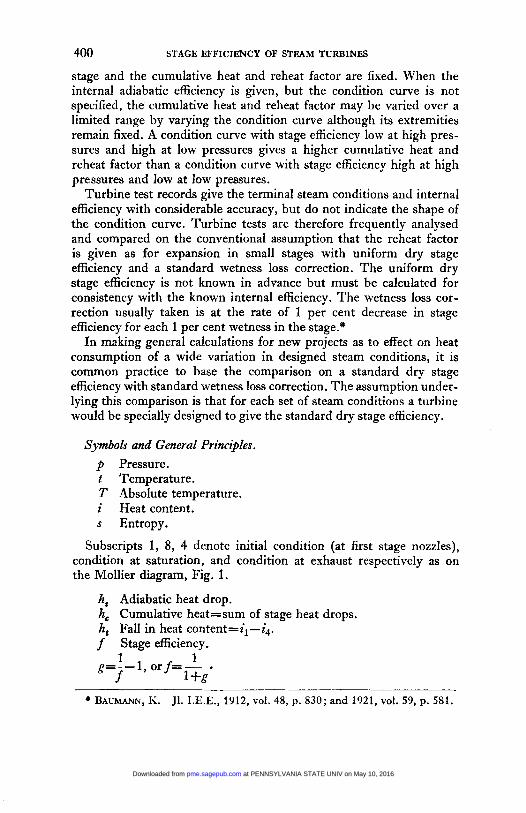
Subscripts 1, 8, 4 denote initial condition (at first stage nozzles), condition at saturation, and condition at exhaust respectively as on the Mollier diagram, Fig. 1.
h, Adiabatic heat drop. h, Cumulative heat=sum of stage heat drops. h, Fall in heat content=il--i4. f Stage efficiency.
I I
~~
BAUMANN, K. J1. I.E.E., 1912, vol. 48, p. 830; and 1921, vol. 59, p. 581.
at PENNSYLVANIA STATE UNIV on May 10, 2016pme.sagepub.comDownloaded from
STAGE EFFICIENCY OF STEAM TURBINES 401
yi Internal adiabatic efficiency=h,/h,. Y Reheat factor=h,/h,. f,,, Mean stage efficiency=h,/hc=yi/r.
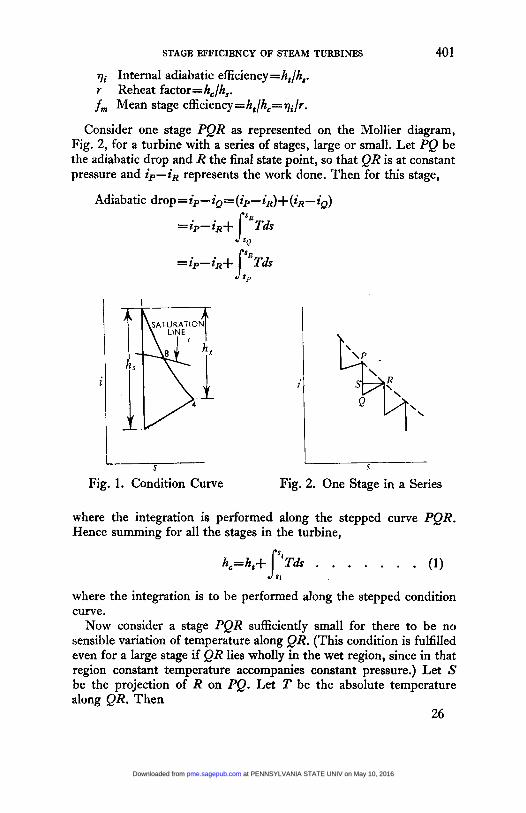
Consider one stage PQR as represented on the Mollier diagram, Fig. 2, for a turbine with a series of stages, large or small. Let PQ be the adiabatic drop and R the find state point, so that QR is at constant pressure and ip-iR represents the work done. Then for this stage,
Adiabatic drop = ip- iQ= (&- j R ) + (iR- iQ)
=ip-iR+ Tds
= ip- iR+ /s:Tds
6 I
\ Lo., \ Fig. 1. Condition Curve Fig. 2. One Stage in a Series
where the integration is performed along the stepped curve PQR. Hence summing for all the stages in the turbine,
h,=h,+ PTdr . . . . . . . (1) J SI
where the integration is to be performed along the stepped condition curve.
Now consider a stage PQR sufficiently small for there to be no sensible variation of temperature along QR. (This condition is fulfilled even for a large stage if QR lies wholly in the wet region, since in that region constant temperature accompanies constant pressure.) Let S be the projection of R on PQ. Let T be the absolute temperature along QR. Then
26
at PENNSYLVANIA STATE UNIV on May 10, 2016pme.sagepub.comDownloaded from
402 STAGE EFFICIENCY OF STEAM TURBINES
hence
a i p is the gradient of the condition curve in s, i co-ordinates. (- ailas) is positive since i falls as s increases. Hence
(2)
which gives a general relation between small-stage efficiency and gradient of a condition curve at any point.
Consider next a finite portion AB of a condition curve along which the stage efficiency of small stages is constant, and along which also the relation between heat content and temperature is linear (the “specific heat along the curve” is constant) so that i=C1T+C2 where C, and C, are constants. Then from (2)
- ds -=-=--1- di C dT g T
and integrating
where T,,, is the logarithmic mean of the absolute temperatures TA , TB given by the same formula as for logarithmic mean temperature differ- ence in heat transmission.
I t is to be noted that formula (3) is exact only for the assumed conditions of constant small-stage efficiency and constant “specific heat along the curve”, and that it does not give the condition curve itself but onIy the slope of the line joining the extremities of the condition curve.
Calculation for a Given Condition Curve. The cumulative heat cannot be conveniently or accurately calculated by laying out stage heat drops on the Mollier diagram and adding them up, unless the stages are few and large. I t can, however, be accurately determined by
at PENNSYLVANIA STATE UNIV on May 10, 2016pme.sagepub.comDownloaded from
STAGE EFFICIENCY OF STEAM TURBINES 403
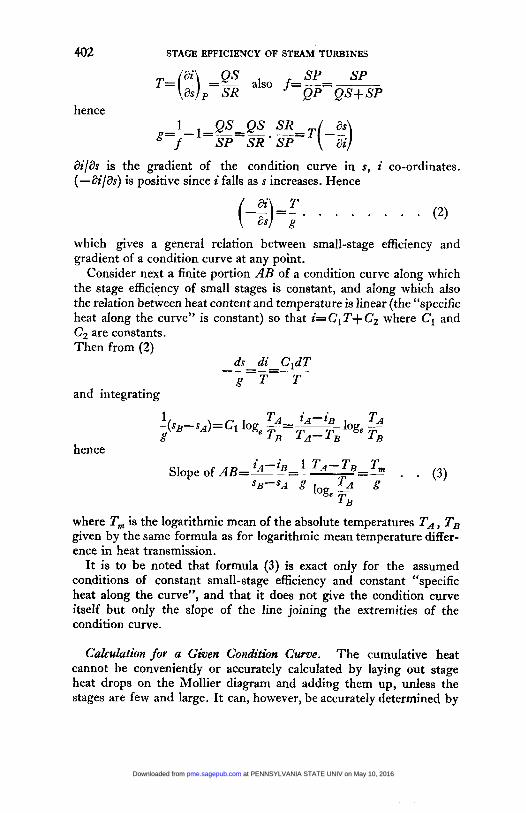
formula (1) whether the stages are small or large. h, is read immediately from the Mollier diagram. If the stages are finite or the condition curve
irregular, the integral Tds is best determined by transferring to a
T-s diagram (see Fig. 3) and measuring the area under the curve. I*:
I ,
SATURATION LINE aB L
S
Fig. 3. Stepped Condition Curve
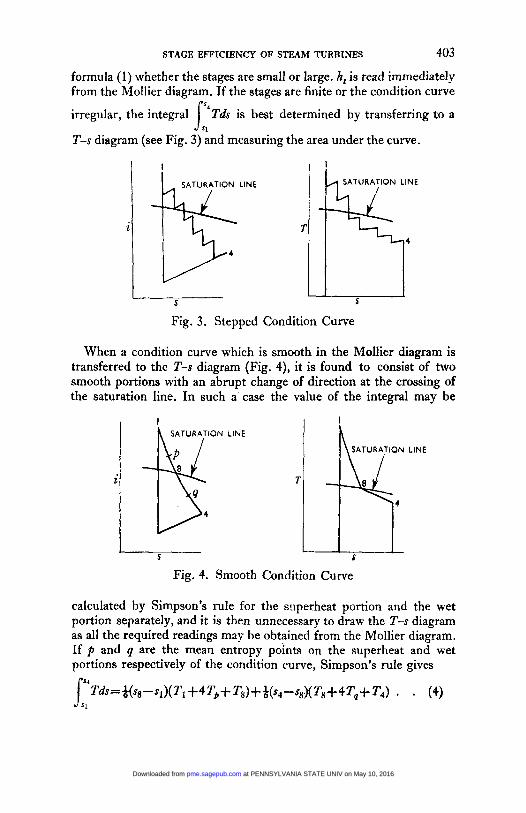
When a condition curve which is smooth in the Mollier diagram is transferred to the T-s diagram (Fig. 4), it is found to consist of two smooth portions with an abrupt change of direction at the crossing of the saturation line. In such a case the value of the integral may be
I I I
ON LINE
i
4
Fig. 4. Smooth Condition Curve
calculated by Simpson’s rule for the superheat portion and the wet portion separately, and it is then unnecessary to draw the T-s diagram as all the required readings may be obtained from the Mollier diagram. If p and q are the mean entropy points on the superheat and wet portions respectively of the condition curve, Simpson’s rule gives
[l*Tds=&(J,-s~)( Ti +4T# + T8)+ 8($4-$s)( Tij +4Tq+ T4) * - (4)
at PENNSYLVANIA STATE UNIV on May 10, 2016pme.sagepub.comDownloaded from
404 STAGE EFFICIENCY OF STEAM TURBINES
When h, has been determined, the reheat factor is obtained from r=hc/hs, and the mean stage efficiency from fm=ht/h6.
Calculation for Constant Small-Stage Eficiency . The determina- tion of a condition curve for constant small-stage efficiency involves the construction on the Mollier diagram of a curve whose gradient is everywhere in- accordance with equation (2). In practice, when the stage efficiency is given, it is usually sufficient to determine the exhaust point (to give h,, the work done) and two or three intermediate points (which may be required for feed-heating calculations) ; similarly, when the internal adiabatic efficiency or terminal points are given, it is usually sufficient to determine the constant small-stage efficiency and then to calculate two or three intermediate points if required. The calculations are best carried out with the aid of approximate formulae ; ;Ic- the method used by the author is given below.
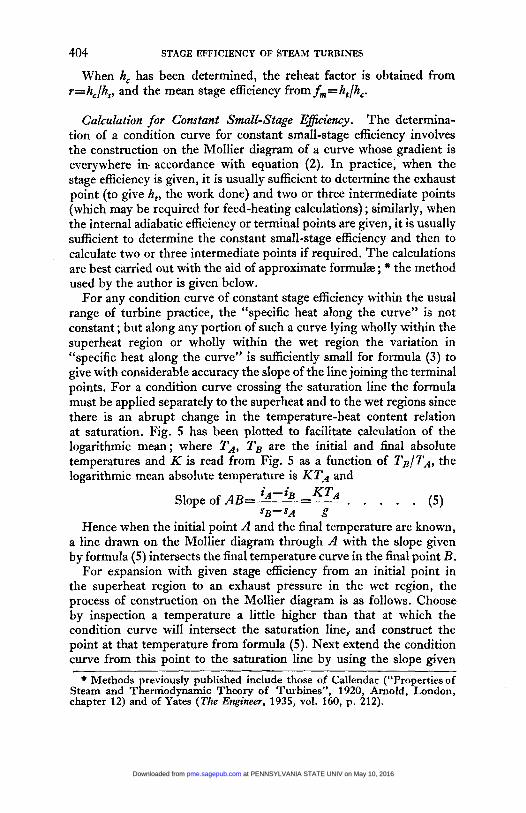
For any condition curve of constant stage efficiency within the usual range of turbine practice, the “specific heat along the curve” is not constant ; but along any portion of such a curve lying wholly within the superheat region or wholly within the wet region the variation in “specific heat along the curve” is sufficiently small for formula (3) to give with considerable accuracy the slope of the line joining the terminal points. For a condition curve crossing the saturation line the formula must be applied separately to the superheat and to the wet regions since there is an abrupt change in the temperature-heat content relation at saturation. Fig. 5 has been plotted to facilitate calculation of the logarithmic mean; where T A , TB are the initial and final absolute temperatures and K is read from Fig. 5 as a function of T B / T A , the logarithmic mean absolute temperature is K T A and
(5) iA-iB K T A Slope of AB=- = __ . . . . . sB-sA g
Hence when the initial point A and the final temperature are known, a line drawn on the Mollier diagram through A with the slope given by formula (5) intersects the final temperature curve in the final point 3.
For expansion with given stage efficiency from an initial point in the superheat region to an exhaust pressure in the wet region, the process of construction on the Mollier diagram is as follows. Choose by inspection a temperature a little higher than that at which the condition curve will intersect the saturation line, and construct the point at that temperature from formula (5). Next extend the condition curve from this point to the saturation line by using the slope given
* Methods previously published include those of Callendar (“Properties of Steam and Therniodynamic Theory of Turbines”, 1920, Arnold, London, chapter 12) and of Yates (The Engineer, 1935, vol. 160, p. 212).
at PENNSYLVANIA STATE UNIV on May 10, 2016pme.sagepub.comDownloaded from
STAGE EFFICIENCY OF STEAM TURBINES 405
by formula (2)) namely -ailas= T/g, where T is the mean temperature by inspection between that point and the saturation line. Then using this point on the saturation line construct from formula ( 5 ) the exhaust point ; only a single step is here required since the exhaust temperature is defined by the exhaust pressure.
When expansion in the wet region is to be taken as carried out, not with constant stage efficiency, but with the dry stage efficiency cor- rected for wetness loss at the standard rate of 1 per cent loss for 1
Fig. 5. Logarithmic Mean Absolute Temperature TA =Initial absolute temperature, T , =Final absolute temperature.
TA-TB- TA log - TI3
Logarithmic mean absolute temperature = - -KTA
per cent wetness, the following approximate method is used. A pro- visional estimate of the final wetness 04' is first made ; then the mean
stage efficiency from saturation line to exhaust is taken as f 1 - -- and an exhaust point is thus constructed from formula (5). If the final wetness so obtained is in agreement with w4' the calculation is correct ; if not, an improved trial wetness w4" must be taken and the calculation repeated.
When the terminal points of a condition curve crossing the saturation
( wi)
at PENNSYLVANIA STATE UNIV on May 10, 2016pme.sagepub.comDownloaded from
406 STAGE EFFICIENCY OF STEAM TURBINES
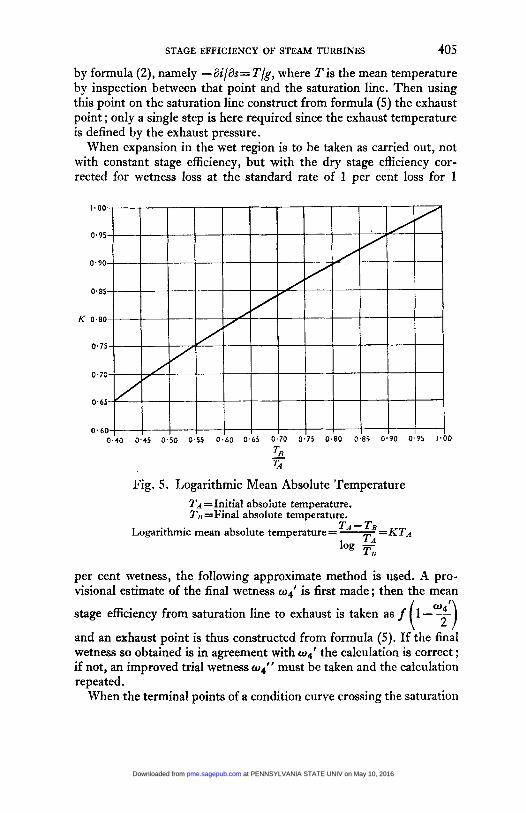
line are given, and it is required to find the constant stage efficiency and the reheat factor, the process is as follows. Choose by inspection a trial value of the point at which the condition curve crosses the saturation line. Rewrite formula ( 5 ) in the form
and hence for the trial point calculate g,‘ for the superheat portion of the curve and gw’ for the wet portion. If g,’ is equal to gw‘, the first trial assumption is correct. If g,’ is not equal tog,’,another trial reading must be taken with the entropy at saturation line increased if g,’<gw‘ or decreased if g,’>g,’. If the second trial gives values of g,”,gw” still
_I
4: CL t-
El Fig. 6. Graphical
-I
a! I-
I
$ Interpolation
unequal, graphical interpolation may be used to determine the value of g which gives constant stage efficiency. This simple process is illus- trated in Fig. 6. Then as before
h,=h,(l+g), r=% 1 f= - 1 +g’ 12,
Eflect of Discontinuities in Expansion through Turbine. The fore- going treatment has been confined to the continuous expansion through turbine stages of a constant steam quantity. When the expansion is interrupted, for instance by pressure loss in cross-over pipes or by resuperheating, the methods given for construction of the condition curve or determination of the cumulative heat remain valid for each
at PENNSYLVANIA STATE UNIV on May 10, 2016pme.sagepub.comDownloaded from
STAGE EFFICIENCY OF STEAM TURBINES 407
continuous portion of the expansion, but complications arise in con- sidering the cycle as a whole and determining the reheat factor. When the steam flow is tapped in the course of the expansion, as in a feed- heating turbine, it is necessary for accurate analysis to determine weighted characteristics taking account of the variation in steam flow. In the following notes each type of discontinuity is considered separately, but it is obvious how to combine the methods when various types of discontinuity occur in the same cycle. In cases of discontinuous expansion the adiabatic drop for the whole cycle is susceptible of various arbitrary definitions, and the reheat factor depends on the definition adopted for the adiabatic drop.
Any pressure drop elsewhere than in a stage does not contribute to the sum of the heat drops through stages and must therefore be excluded from the cumulative heat cal- culation, so far as concerns the stages themselves (e.g. in calculating the mean stage efficiency or the speed ratio). On the other hand, it is not the function of the reheat factor to cover pressure losses between stages. Hence it is convenient to introduce separate definitions of the net cumulative heat h, as the sum of the heat drops in the stages alone, and of the gross cumulative heat hg as the cumulative heat reckoned along the whole condition curve for the same range of pressure as the adiabatic drop. These are connected by the relation h =h,+hp, where hp is the pressure loss expressed in heat units.
Then r =reheat factor=%
(u) Turbine with Pressure Losses.
h f, =mean stage efficiency= 2 h?l
and
where
Y =q(;+$). . . . , . . . . . . . . (7)
b=hp/h,=fractional loss due to pressure drop. Formula (1) still holds good for the cumulative heat, but for the gross
cumulative heat the integral JTdS must be evaluated for the whole condition curve while for the net cumulative heat the integration is carried out only along the portions corresponding to expansion through turbine stages. Generally the adiabatic drop which is considered in connexion with turbine efficiency calculations is that after the governor valve, so that governor valve pressure losses are not included.
In the example shown in Fig. 7, ab represents the pressure drop through the governor valve, cd the pressure drop through the cross-over pipe, and e the exhaust point. Adiabatic drop is taken as bb" after the
governor valve. The gross cumulative heat is h,=h,+
at PENNSYLVANIA STATE UNIV on May 10, 2016pme.sagepub.comDownloaded from
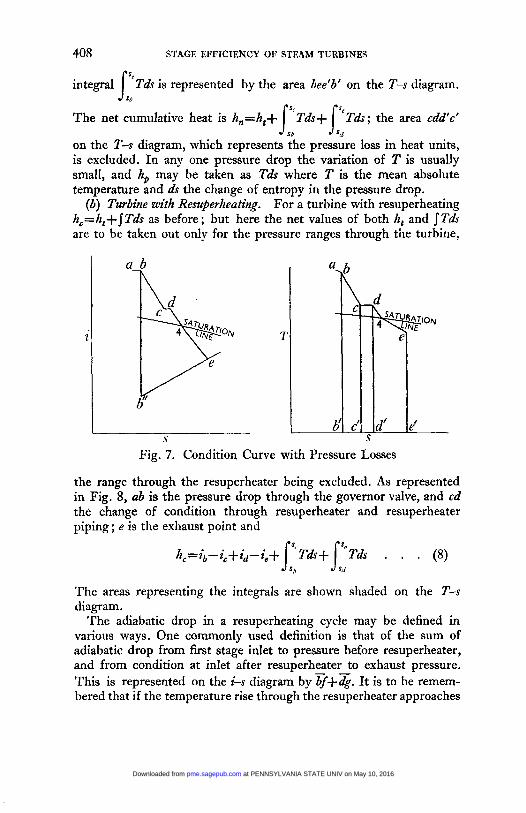
408 STAGE EFFICIENCY OF STEAM TURBINES
integral Tds is represented by the area bee'b' on the T-s diagram.
The net cumulative heat is h,=h,+ Tds; the area cdd'c'
on the T-s diagram, which represents the pressure loss in heat units, is excluded. In any one pressure drop the variation of T is usually small, and hp may be taken as Tds where T is the mean absolute temperature and ds the change of entropy in the pressure drop.
For a turbine with resuperheating h,=h,+JTds as before; but here the net values of both h, and STds are to be taken out only for the pressure ranges through the turbine,
Is: Tds+ s:: 1;
(b) Turbine with Resuperheating.
a
i
Fig. 7. Condition Curve with Pressure Losses
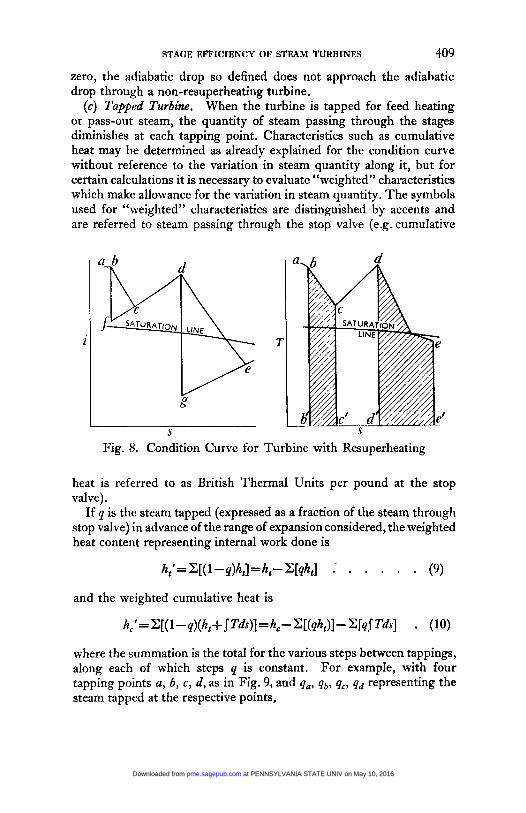
the range through the resuperheater being excluded. As represented in Fig. 8, ab is the pressure drop through the governor valve, and cd the change of condition through resuperheater and resuperheater piping ; e is the exhaust point and
The areas representing the integrals are shown shaded on the T-s diagram.
The adiabatic drop in a resuperheating cycle may be defined in various ways. One commonly used definition is that of the sum of adiabatic drop from first stage inlet to pressure before resuperheater, and from condition at inlet after resuperheater to exhaust pressure. This is represented on the i-s diagram by v+&. It is to be remem- bered that if the temperature rise through the resuperheater approaches
at PENNSYLVANIA STATE UNIV on May 10, 2016pme.sagepub.comDownloaded from
STAGE EFFICIENCY OF STEAM TURBINES 409
zero, the adiabatic drop so defined does not approach the adiabatic drop through a non-resuperheating turbine.
(c) Tapped Turbine. When the turbine is tapped for feed heating or pass-out steam, the quantity of steam passing through the stages diminishes at each tapping point. Characteristics such as cumulative heat may be determined as already explained for the condition curve without reference to the variation in steam quantity along it, but for certain calculations it is necessary to evaluate “weighted” characteristics which make allowance for the variation in steam quantity. The symbols used for “weighted” characteristics are distinguished by accents and are referred to steam passing through the stop valve (e.g. cumulative
Fig. 8. Condition Curve for Turbine with Resuperheating
heat is referred to as British Thermal Units per pound at the stop valve).
If q is the steam tapped (expressed as a fraction of the steam through stop valve) in advance of the range of expansion considered, the weighted heat content representing internal work done is
h,’=-[(l--q)h,]=h,--[q~;J : . . . . . (9)
and the weighted cumulative heat is
h,’ = -[(I - q)(h,+ J- T 4 I = h, - w l h , ) l - zr4.f T 4 * ( 10)
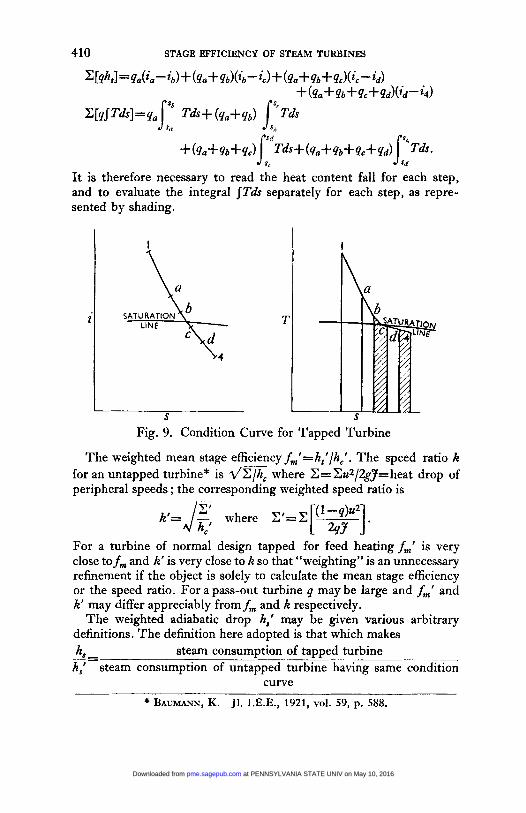
where the summation is the total for the various steps between tappings, along each of which steps q is constant. For example, with four tapping points a, b, c, d, as in Fig. 9, and pa, qb , qc, qd representing the steam tapped at the respective points,
at PENNSYLVANIA STATE UNIV on May 10, 2016pme.sagepub.comDownloaded from
410 STAGE EFFICIENCY OF STEAM TURBINES
2 CqhJ =q,(i,- 47) + (Pa+ q*)(G-- ic) + (4a+ 4*+ d V C - id)
+(4,+4b+qc+4d>(;d-;4)
c[psTdrl=!7ajs~ Tds+ (40+4b) s,”.. + (Pa + Pb+ ! q T d S + (4a+ Qb+ Qc + .)I” Tds.
sd
It is therefore necessary to read the heat content fall for each step, and to evaluate the integral JTds separately for each step, as repre- sented by shading.
Fig. 9. Condition Curve for Tapped Turbine
The weighted mean stage efficiency fm‘=ht’/hc’. The speed ratio k for an untapped turbine’ is dZx where C=Xu2/2gJ=heat drop of peripheral speeds ; the corresponding weighted speed ratio is
For a turbine of normal design tapped for feed heatingf,’ is very close to f , and A’ is very close to K so that “weighting” is an unnecessary refinement if the object is solely to calculate the mean stage efficiency or the speed ratio. For a pass-out turbine q may be large and f,‘ and k’ may differ appreciably from f , and k respectively.
The weighted adiabatic drop h,’ may be given various arbitrary definitions. The definition here adopted is that which makes h* -
h,’ steam consumption of tapped turbine
steam consumption of untapped turbine having same condition curve
--
* BAUMA”, K. J1. I.E.E., 1921, vol. 59, p. 588.
at PENNSYLVANIA STATE UNIV on May 10, 2016pme.sagepub.comDownloaded from
STAGE EFFICIENCY OF STEAM TURBINES 411
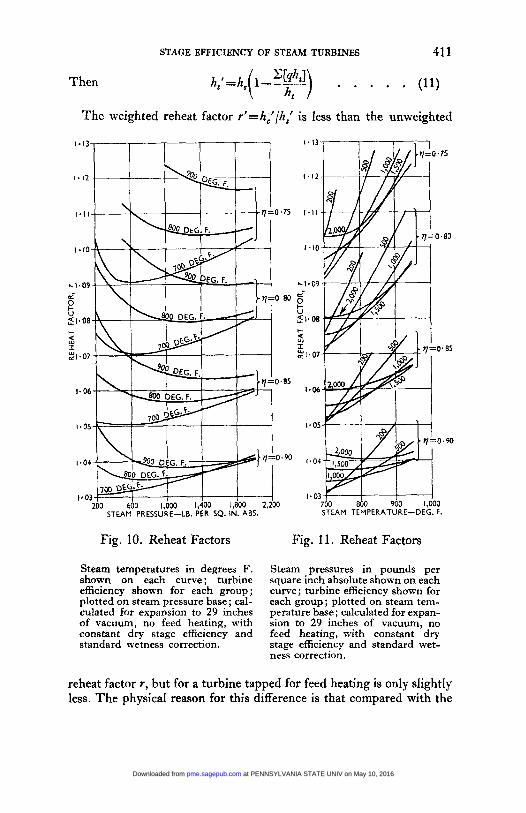
Then h,'=h, ( I-- "PI) . . . . . (11)
The weighted reheat factor r'=hc'/hr' is less than the unweighted
7Ga 800 900 1,000 STEAM TEMPERATURE-DEG. F.
Fig. 10. Reheat Factors Fig. 11. Reheat Factors
Steam temperatures in degrees F. shown on each curve; turbine efficiency shown for each group; plotted on steam pressure base ; cal- culated for expansion to 29 inches of vacuum, no feed heating, with constant dry stage efficiency and standard wetness correction.
Steam pressures in pounds per square inch absolute shown on each curve; turbine efficiency shown for each group ; plotted on steam tem- perature base; calculated for expan- sion to 29 inches of vacuum, no feed heating, with constant dry stage efficiency and standard wet- ness correction.
reheat factor I, but for a turbine tapped for feed heating is only slightly less. The physical reason for this difference is that compared with the
at PENNSYLVANIA STATE UNIV on May 10, 2016pme.sagepub.comDownloaded from
412 STAGE EFFICIENCY OF STEAM TURBINES
0. RBINE EFFICIENCY, 7
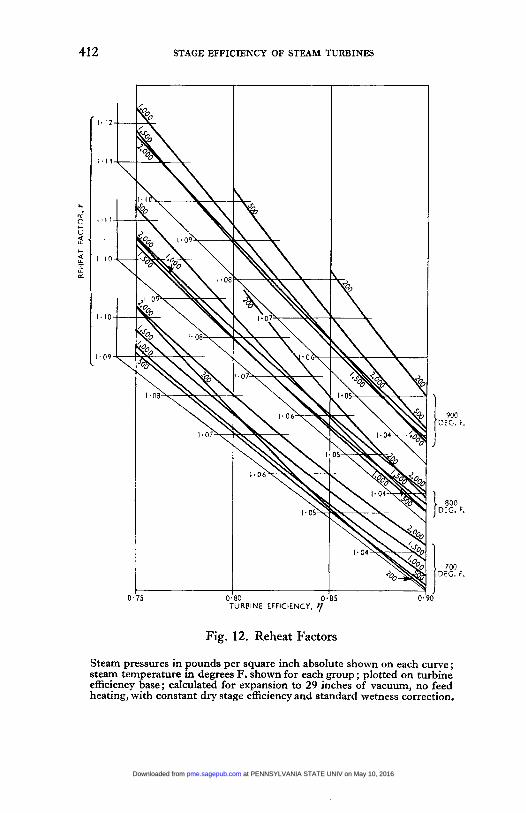
Fig. 12. Reheat Factors
Steam pressures in pounds per square inch absolute shown on each curve; steam temperature in degrees F. shown for each group ; plotted on turbine efficiency base; calculated for expansion to 29 inches of vacuum, no feed heating, with constant dry stage efficiency and standard wetness correction.
at PENNSYLVANIA STATE UNIV on May 10, 2016pme.sagepub.comDownloaded from
STAGE EFFICIENCY OF STEAM TURBINES 41 3
untapped turbine, the tapped turbine has less steam in the lower pressure ranges where the recuperation due to reheat is greatest.
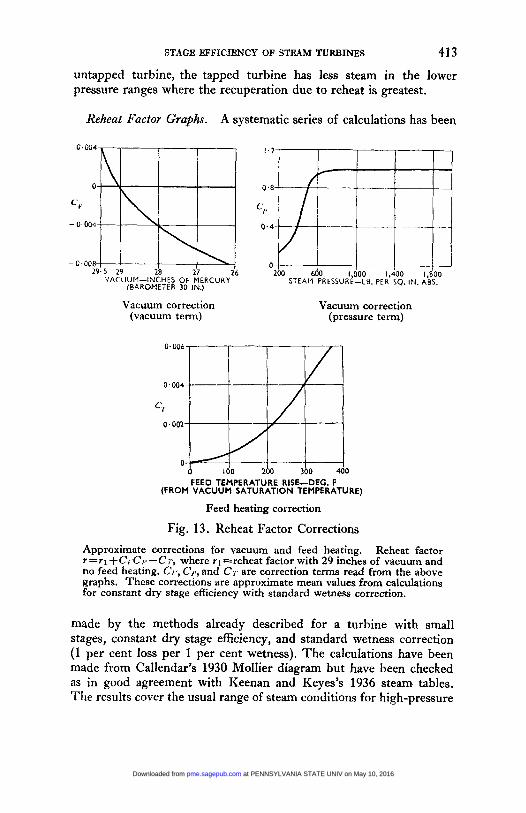
Reheat Factor Graphs. A systematic series of calculations has been
0.004
- 0.004
- cvoRl 0-008 29.5 VACUUM-INCHES 19 OF 27 MERCURY 16
fBAROMETER 30 IN.)
Vacuum correction (vacuum term)
1.2-
~- - ___ - . 0.8
L;, 0.4
0 200 600 1.000 1.400 1.800
STEAM PRESSURE-LB. PER SQ. IN. ABS
Vacuum correction (pressure term)
FEED TEMPERATURE RISE-DEG. F (FROM VACUUM SATURATION TEMPERATURE)
Feed heating correction
Fig. 13. Reheat Factor Corrections Approximate corrections for vacuum and feed heating. Reheat factor z=r l $CCCP-CC, where rl=reheat factor with 29 inches of vacuum and no feed heating. Ct; Cp, and CT are correction terms read from the above graphs. These corrections are approximate mean values from calculations for constant dry stage efficiency with standard wetness correction.
made by the methods already described for a turbine with small stages, constant dry stage efficiency, and standard wetness correction (1 per cent loss per 1 per cent wetness). The calculations have been made from CaIlendar’s 1930 Mollier diagram but have been checked as in good agreement with Keenan and Keyes’s 1936 steam tables. The results cover the usual range of steam conditions for high-pressure
at PENNSYLVANIA STATE UNIV on May 10, 2016pme.sagepub.comDownloaded from
414 STAGE EFFICIENCY OF STEAM TURBINES
condensing turbines and have been plotted for reference in the graphs which follow. With the form of the condition curve thus defined the reheat factor is for straight expansion a function of four independent
200 600 1,000 1,400 1,800 2, STEAM PRESSURE-LB. PER SQ. IN. ABS.
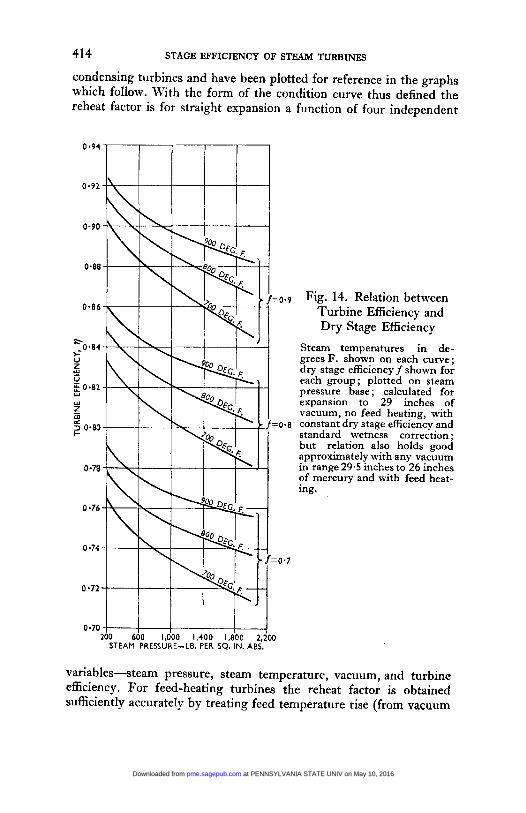
:0.9 Fig. 14. Relation between Turbine Efficiency and Dry Stage Efficiency
Steam temperatures in de- grees F. shown on each curve; dry stage efficiency f shown for each group; plotted on steam pressure base ; calculated for expansion to 29 inches of vacuum, no feed heating, with
:0.8 constant dry stage efficiency and standard wetness correction ; but relation also holds good approximately with any vacuum in range 29.5 inches to 26 inches pf mercury and with feed heat- ing.
variables-steam pressure, steam temperature, vacuum, and turbine - .
b.IIIc . Ic . l l~~ . 1' UI ~ ~ ~ u - 1 l c ~ ~ ~ ~ ~ g iuruines me renear racror is omalnea sufficiently accurately by treating feed temperature rise (from vacuum
at PENNSYLVANIA STATE UNIV on May 10, 2016pme.sagepub.comDownloaded from
STAGE EFFICIENCY OF STEW TURBINES 415
temperature) as a fifth independent variable. The effects of vacuum
0.68 0.70 5 0.80 0.85 0.90 ( Y STAGE EFFICIENCY, f
900 DEG. F. I eoo DEG. F.
700 DEG. F.
9 1
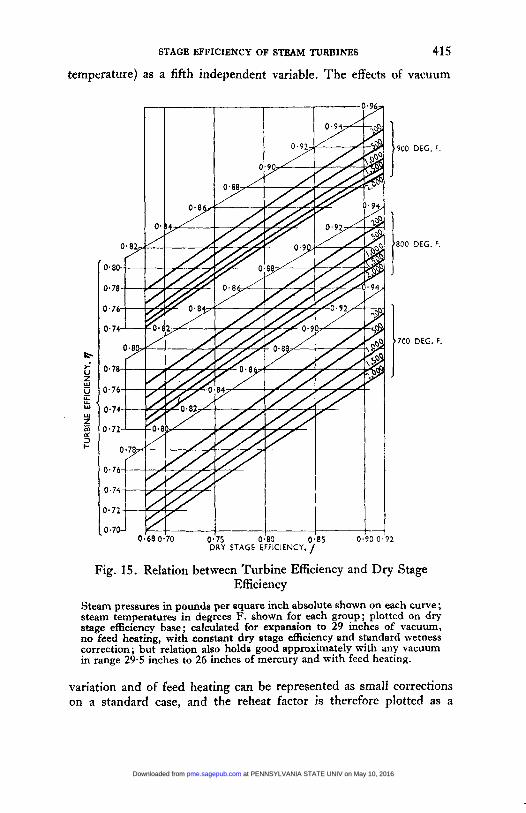
Fig. 15. Relation between Turbine Efficiency and Dry Stage Efficiency
Steam pressures in pounds per square inch absolute shown on each curve ; steam temperatures in degrees F. shown for each group; plotted on dry stage efficiency base; calculated for expansion to 29 inches of vacuum, no feed heating, with constant dry stage efficiency and standard wetness correction ; but relation also holds good approximately with any vacuum in range 29.5 inches to 26 inches of mercury and with feed heating.
variation and of feed heating can be represented as small corrections on a standard case, and the reheat factor is therefore plotted as a
at PENNSYLVANIA STATE UNIV on May 10, 2016pme.sagepub.comDownloaded from
416 STAGE EFFICIENCY OF STEAM TURBINES
function of steam pressure, steam temperature, and turbine efficiency for 29 inches vacuum and no feed heating. The interpolations required with three independent variables are liable to be troublesome to carry out, and the reheat factor graphs are therefore presented in three alternative forms: Fig. 10, plotted on a steam pressure base; Fig. 11, plotted on a steam temperature base ; and Fig. 12, plotted on a turbine efficiency base. The approximate corrections to reheat factor for vacuum and for feed heating are given on Fig. 13. The vacuum correction is strictly a function of all the other independent variables as well as of the vacuum, but it can be represented approximately as the product of two terms, of which one depends on the vacuum alone and the other on the steam pressure alone. Similarly the feed-heating correction can be represented approximately as a function of the feed temperature rise alone.
Graphs have also been plotted showing the relation between the turbine efficiency and the dry stage efficiency with the condition curve as above defined. This relation as a function of steam pressure and steam temperature is plotted in two alternative forms-in Fig. 14 on a steam pressure base, and in Fig. 15 on a dry stage efficiency base. No correction is provided for vacuum or for feed heating, since with standard wetness correction the influence of vacuum and of feed heating on the turbine efficiency-stage efficiency relation is small.
The author is indebted to the Metropolitan-Vickers Electrical Com- pany, Ltd., for permission to publish this paper.
Discussion
Mr. W. T. BOTTOMLEY (Messrs. Merz and McLellan, Ltd., New- castle upon Tyne) wrote that the development of equation (3)) p. 402, and its application to calculating the condition line on the Mollier chart, in both the wet and dry region was of special interest. The method had the advantage that it was independent of the empirical formulze now used for determining the properties of steam. It involved only one assumption, namely, that the specific heat of the steam along the condition line was constant. This assumption might be considered justified for practical purposes, though it was not mathematically accurate in the wet region.
The other point of interest in the paper lay in the method of applying the standard wetness correction and it was to be noted that
at PENNSYLVANIA STATE UNIV on May 10, 2016pme.sagepub.comDownloaded from
STAGE EFFICIENCY OF STEAM TURBINES 417
the author adopted an approximation, and assumed a constant stage efficiency in the wet region, the value of the efficiency depending on the final wetness obtained. For practical purposes there were, how- ever, disadvantages in using the author’s method.
The problem usually took the form of finding the heat drop between two pressures, but the author determined the condition line between two temperatures and entropies, and obtained the heat drop be- tween two pressures from the Mollier chart after the condition line
0
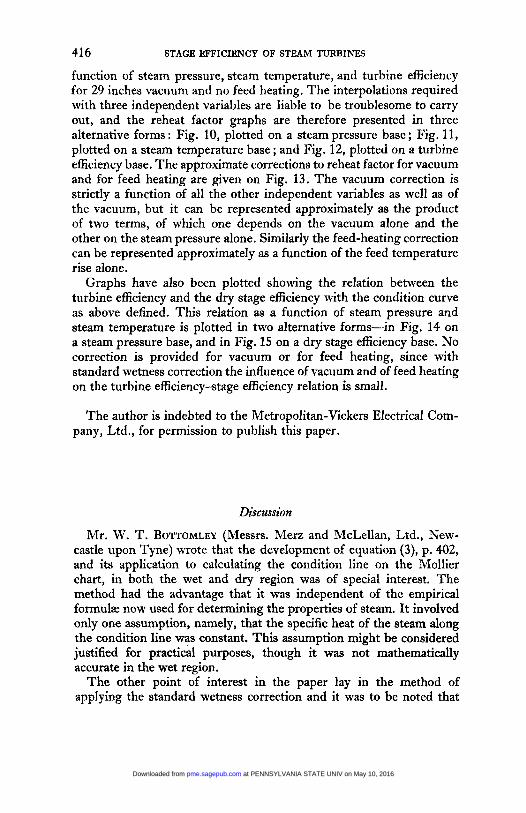
Fig. 16. Wetness Correction Curve Equivalent to Standard Wetness Correction
is$ Heat in steam at terminal pressure, assuming dry steam expansion
is Heat in saturated steam at terminal pressure. ia Heat in steam at terminal pressure, corrected for wetness.
throughout at constant stage efficiency.
had been drawn. In the wet region the author’s method involved two separate determinations by trial and error, one at the point where the condition line crossed the saturation line and the other at the exhaust, to determine the final wetness, which must be known in order to estimate the average stage efficiency in the wet region.
While the method described by the author was nearly thermo- dynamically exact for the conditions assumed, and would be valuable for making special checks, the trial and error process was laborious. He himself found that the same degree of accuracy could be obtained if it was assumed that the steam remained dry throughout the whole of the expansion, a correction being made to the terminal condition
27
at PENNSYLVANIA STATE UNIV on May 10, 2016pme.sagepub.comDownloaded from
418 DISCUSSION ON
as found, in accordance with the curve in Fig. 16, to allow for the condensation which took place. The dry expansion was calculated at constant stage efficiency by means of Callendar’s formula, using a log-log slide rule. The curve in Fig. 16 was very nearly independent of the dry stage efficiency and of the terminal pressure within practical limits, and could also be used to determine the heat in the steam at intermediate stages in the wet region. The curve could be drawn to satisfy any arbitrary correction for wetness, but was actually drawn to fit the wetness correction which the author used. He himself had used a curve of this form for some years, and had found it satisfactory. If
I0
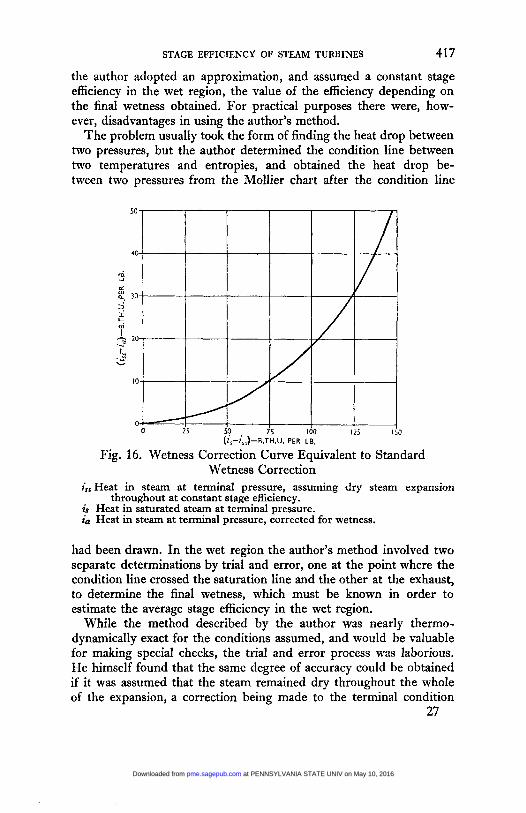
Fig. 17. Condition Line Plotted against Saturation Temperature Showing expansion at 85 per cent stage efficiency on dry basis throughout,
also showing the effect of wetness correction.
the author checked it against his own method he would find that varying the dry stage efficiency had very little effect on the curve.
The author represented the condition line on the Mollier chart. But Mollier charts were not always available. He himself found it more convenient to plot the condition line on ordinary squared paper in the form shown in Fig. 17, where the heat in the steam during expansion was plotted against the saturation temperature corresponding to the pressure. The condition line in this form was very nearly straight. The position of the saturation line was drawn from particulars given in the steam tables.
at PENNSYLVANIA STATE UNIV on May 10, 2016pme.sagepub.comDownloaded from
STAGE EFFICIENCY OF STEAM TURBINES 419
The reheat factors shown in Figs. 10, 11, and 12, pp. 411-2, appeared to be of academic interest only. They could not be used to determine the turbine efficiency unless the mean stage efficiency was known. Since the mean stage efficiency was not the same as the dry stage efficiency and no curves were given showing the mean stage efficiencies, it was difficult to see what purpose was served by these reheat factors. A more useful factor would be the ratio of the turbine efficiency to the dry stage efficiency, which could be obtained from Fig. 14 or Fig. 15 and which might facilitate interpolation for different steaming con- ditions.
Most turbine calculations included feed heating ; and the heat con- sumption could not be obtained direct from Figs. 14 and 15. The interest attached to these two graphs lay in the fact that they indicated the heat in the steam at the turbine exhaust. He would be glad, how- ever, if the author would confirm that the turbine efficiency in Fig. 15 was the same as the internal adiabatic efficiency as defined on p. 401.
The author’s determinations of the cumulative heat, reheat factor, and mean stage efficiency in the wet region were based on the assump- tion that the wetness loss was a loss in stage efficiency. He asked whether there was any justification for this assumption. It appeared that the effect of supersaturation had been ignored. I t was difficult to see how the wetness loss could be a loss in stage efficiency. It meant that all the particles of water at each stage were accelerated to the same velocity as the steam, and that the whole of the kinetic energy of the particles of water was dissipated in heat. This, he thought, would be difficult to explain. One would expect at least that the momentum of the water particles would be transferred to the moving blades.
He regretted that the author had not produced evidence proving the actual amount of wetness correction. It was about 26 years since the standard correction was suggested by Mr. K. Baumann, M.I.Mech.E., and as far as he knew, no experimental evidence had been published to confirm it.
Professor A. G. CHRISTIE (John Hopkins University, Baltimore, and President of the American Society of Mechanical Engineers) and Professor C . G. THATCHER (Swarthmore College, Pennsylvania) wrote that it was indeed a fortunate coincidence that within the past few months at Ieast three independent investigators of this subject had published their findings. In the United States Mr. R. B. Smith, of Jeannette, Pennsylvania, and Professor C. G. Thatcher, approaching the matter with entirely different methods, found themselves in very close agreement on values of reheat factor in the superheat region and again in the saturated region.
at PENNSYLVANIA STATE UNIV on May 10, 2016pme.sagepub.comDownloaded from
420 DISCUSSION ON
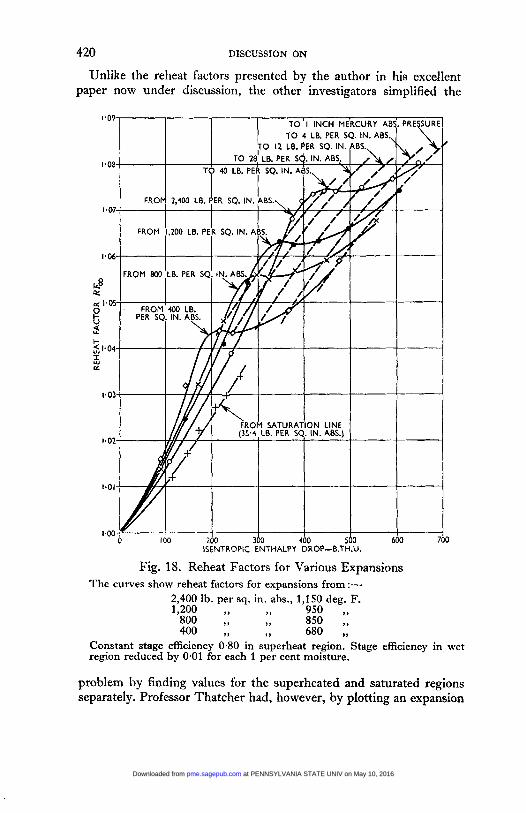
Unlike the reheat factors presented by the author in his excellent paper now under discussion, the other investigators simplified the
/
1
Fig. 18. Reheat Factors for Various Expansions The curves show reheat factors for expansions from:-
2,400 lb. per sq. in. abs., 1,150 deg. F. 1,200 ,, ,, 950 ,, 800 , I ,, 850 I,
400 ,, , 680 ,, Constant stage efficiency 0.80 in superheat region. Stage efficiency in wet region reduced by 0.01 for each 1 per cent moisture.
problem by finding values for the superheated and saturated regions separately. Professor Thatcher had, however, by plotting an expansion
at PENNSYLVANIA STATE UNIV on May 10, 2016pme.sagepub.comDownloaded from
STAGE EFFICIENCY OF STEAM TURBINES 42 1
“down the groove,” starting at 2,400 lb. per sq. in., 1,150 deg. F., and going to 1 inch of mercury absolute pressure, derived a set of reheat factors as shown in Fig. 18. This expansion went through a successive set of values for pressure and temperature now commonly used for throttle conditions, and so represented a well-worn “groove” down the Mollier diagram. The dry stage efficiency was 0.80 and correction was
Reheat factor
Smith)
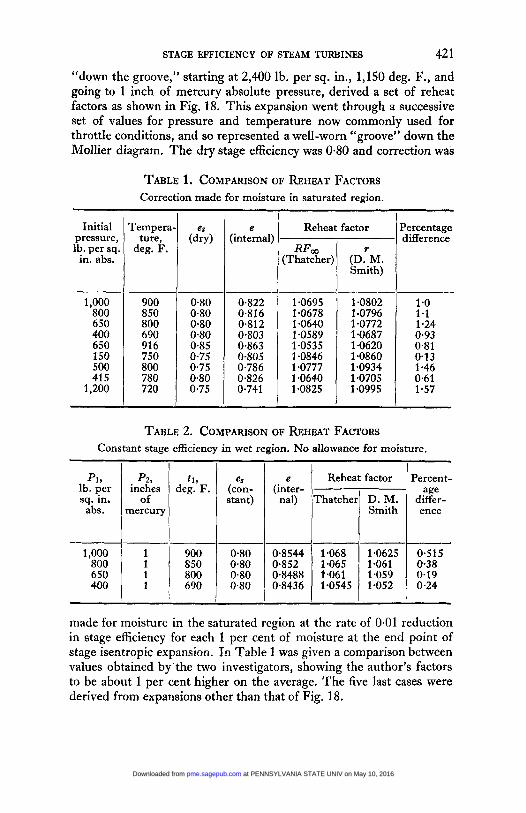
TABLE 1. COMPARISON OF REHEAT FACTORS Correction made for moisture in saturated region.
Percentage difference
Initial pressure, lb. per sq. in. abs.
1,000 800 650 400 650 150 500 41 5
1,200
1,000 800 650 400
Tempera. ture,
deg. F.
900 850 800 690 91 6 750 800 780 720
1 1 1 1
0.80 0.80 0.80 0.80 0.85 0-75 0.75 0.80 0.75
900 850 800 690
e (internal)
0.80 0.8544 1.068 1.0625 0.515 0.80 0.852 1.065 1-061 0-38 0.80 0.8488 1.061 1.059 0.19 0.80 0.8436 1.0545 1.052 I 0.24
0.822 0.816 0.812 0.803 0.863 0.805 0.786 0.826 0.741
1,0695 1.0678 1.0640 1.0589 1.0535 1.0846 1,0777 1.0640 1.0825
1 .Of302 1.0796 1.0772 1.0687 1.0620 1 -0860 1.0934 1.0705 1.0995
1 so 1-1 1.24 0-93 0.81 013 1.46 0.61 1.57
I I
TABLE 2. COMPARISON OF REHEAT FACTORS Constant stage efficiency in wet region. No allowance for moisture.
p1, lb. per sq. In. abs.
p2, inches
of mercury
made for moisture in the saturated region at the rate of 0.01 reduction in stage efficiency for each 1 per cent of moisture at the end point of stage isentropic expansion. In Table 1 was given a comparison between values obtained by‘the two investigators, showing the author’s factors to be about 1 per cent higher on the average. The five last cases were derived from expansions other than that of Fig. 18.
at PENNSYLVANIA STATE UNIV on May 10, 2016pme.sagepub.comDownloaded from
422 DISCUSSION ON
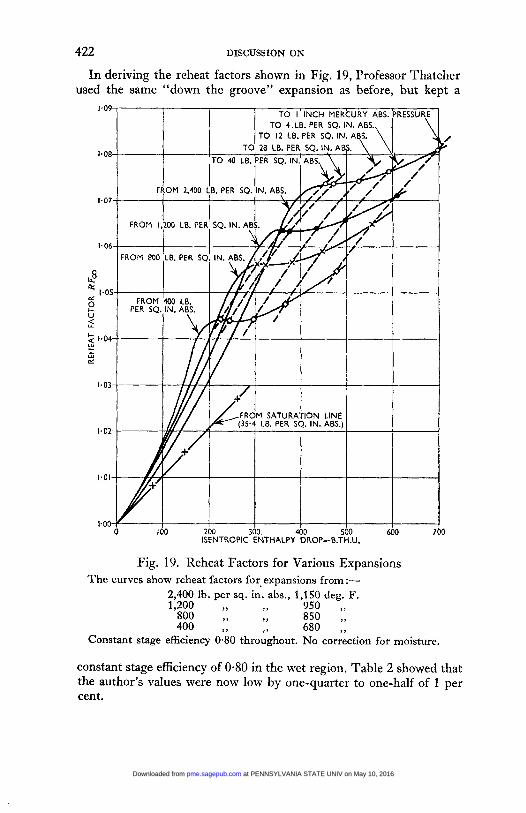
In deriving the reheat factors shown in Fig. 19, Professor Thatcher used the same “down the groove” expansion as before, but kept a
Fig. 19. Reheat Factors for Various Expansions The curves show reheat factors for expansions from :-
2,400 lb. per sq. in. abs., 1,150 deg. F. 1,200 ,, 950 ,, 800 ,, , 850 ,, 400 ,, 680 ..
Constant stage efficiency 0.80 throughout. No correction for moisture.
constant stage efficiency of 0.80 in the wet region. Table 2 showed that the author’s values were now low by one-quarter to one-half of 1 per cent.
at PENNSYLVANIA STATE UNIV on May 10, 2016pme.sagepub.comDownloaded from
STAGE EFFICIENCY OF STEAM TURBINES 423
The work done by both American authors was based on “Thermo- dynamic Properties of Steam”, by Keenan and Keyes. Some part of the discrepancy shown in Tables 1 and 2 might be due to the use of different steam tables and diagrams. The author’s use of a constant “specific heat along the curve” in his equation (3), p. 402, was undoubtedly a source of some error. A comparison made by Professor Thatcher of reheat factors obtained from condition curves drawn by the “step-by- step” method on the one hand with those from the formula
where e,=constant stage efficiency, and (l-e,)/e,=g (as used by the author) showed a fairly close, but by no means perfect, agreement. The above equation was identical with equation (3). Professor Thatcher’s work was based almost entirely on the step-by-step method. The latter method, applied to the wet region part of the “down the groove” expansion of Fig. 18, yielded a final moisture content of 11.95 per cent, as against 12.55 per cent from the author’s method, a difference of about 6.3 B.Th.U. The discrepancy here was largely due to the method of correcting for moisture. Since turbine efficiency was the criterion, the two condition curves must start together and end together, but Thatcher’s curve was steeper in the superheat region, lying to the left of the author’s, and it flattened out in the saturated region to meet the author’s at a pressure of 1 inch mercury abs. The author’s curve would, of course, yield larger reheat factors. The question reduced itself to the problem of accurate correction for moisture.
The comparison given in Table 2, where Professor Thatcher had made no alfowance for moisture, showed a closer correspondence in reheat factor values. Here the author’s condition curve would lie to the left, being steeper in the dry and flatter in the wet region, and yielding lower reheat factors.
They asked whether the author had made any allowance for the phenomenon of undercooling, and whether “leaving loss” entered into the picture. They had assumed that the author’s “turbine efficiency” was the same as internal or “condition curve” efficiency. Since the author’s calculations were for an infinite number of stages, the leaving loss was probably infinitesimal ; and no correction from a finite to an infinite number of stages was required, as was the case when the step- by-step method of calculation was used.
Mr. F. DOLLIN wrote that the paper dealt with thermodynamic relationships applying to the expansion of steam in a turbine, and
at PENNSYLVANIA STATE UNIV on May 10, 2016pme.sagepub.comDownloaded from
424 DISCUSSION ON
presented a series of graphs showing the relationship between reheat factor and the independent variables, steam temperature, steam pres- sure, and turbine efficiency or stage efficiency. Only those who had had occasion to make such calculations could be aware of the amount of work these graphs represented, and he was indebted to the author for making his results available.
The analytical treatment called for little comment. On p. 407, equation (7) needed elucidation.* If the definition of internal adiabatic efficiency as h,/h, was retained, it was not clear how it could be equal
The definition of the weighted adiabatic heat drop h’, for a tapped turbine was a matter of some interest, as this quantity was used to determine the turbine efficiency ratio, which was for many purposes the most convenient criterion for comparing the performance of different turbines. Perhaps the most obvious definition would be
to y ( f m + h ) .
hs’=hs ( 1-- 7). If the values of q for the actual turbine were used
in evaluating ” this expression, the performance of the turbine was determined by comparing its output with that of a perfect turbine using the same quantities of steam through the same pressure ranges. An element of doubt arose here because in these circumstances the perfect turbine would give a lower feed water temperature than the actual turbine, and it might be argued that the tap-off quantities for the perfect turbine should be increased to maintain the same feed water temperatures as the actual turbine. The definition adopted by the author had the merit of evading this difficulty, and he thought it would be worth while for the committees which dealt with such matters to consider whether it should be adopted as a standard.
From a utilitarian point of view, probably the most interesting feature of the paper lay in the graphs which enabled the reheat factor to be determined for any given steam conditions and turbine efficiency. Most of the published data on reheat factors dealt separately with expansions in the dry region and in the wet region. In many cases, if not most, expansions which started in the dry region and finished in the wet had to be dealt with; for these the method of considering separately the dry and wet ranges was inconvenient and slow. The author’s curves were very convenient when dealing with expansions from pressures above 200 Ib. per sq. in. and temperatures above 700 deg. F., down to condenser pressure, but gave no data for smaller ranges of expansion. Mr. E. L. Robinson had published? a graph
* Since modified by author. t Mechanical Engineering, 1928, vol. SO, p. 155.
at PENNSYLVANIA STATE UNIV on May 10, 2016pme.sagepub.comDownloaded from
STAGE EFFICIENCY OF STEAM TURBINES 425
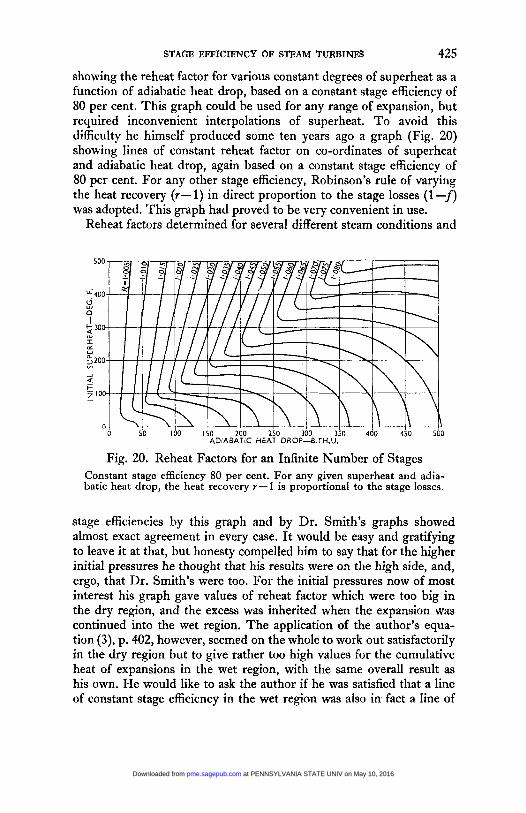
showing the reheat factor for various constant degrees of superheat as a function of adiabatic heat drop, based on a constant stage efficiency of 80 per cent. This graph could be used for any range of expansion, but required inconvenient interpolations of superheat. To avoid this difficulty he himself produced some ten years ago a graph (Fig. 20) showing lines of constant reheat factor on co-ordinates of superheat and adiabatic heat drop, again based on a constant stage efficiency of 80 per cent. For any other stage efficiency, Robinson’s rule of varying the heat recovery (r- 1) in direct proportion to the stage losses (1 -f) was adopted. This graph had proved to be very convenient in use.
Reheat factors determined for several different steam conditions and
Constant stage efficiency 80 per cent. For any given superheat and adia- batic heat drop, the heat recovery r-1 is proportional to the stage Iosses.
stage efficiencies by this graph and by Dr. Smith’s graphs showed almost exact agreement in every case. It would be easy and gratifying to leave it at that, but honesty compelled him to say that for the higher initial pressures he thought that his results were on the high side, and, ergo, that Dr. Smith’s were too. For the initial pressures now of most interest his graph gave values of reheat factor which were too big in the dry region, and the excess was inherited when the expansion was continued into the wet region. The application of the author’s equa- tion (3), p. 402, however, seemed on the whole to work out satisfactorily in the dry region but to give rather too high values for the cumulative heat of expansions in the wet region, with the same overall result as his own. He would like to ask the author if he was satisfied that a line of constant stage efficiency in the wet region was also in fact a line of
at PENNSYLVANIA STATE UNIV on May 10, 2016pme.sagepub.comDownloaded from
426 DISCUSSION ON
constant specific heat, dhldt, and whether the postulate of such a relationship was based on analytical or empirical grounds.
The plotting of lines of constant reheat factor on co-ordinates of superheat and adiabatic heat drop was open to one or two theoretical objections, of which the most important was that any line of constant reheat factor in the dry region was true only for one initial pressure. In this respect a better theoretical base for plotting was pressure ratio, the drawback to it being that it required a logarithmic scale. The possibility of producing a graph of this kind was being investigated.
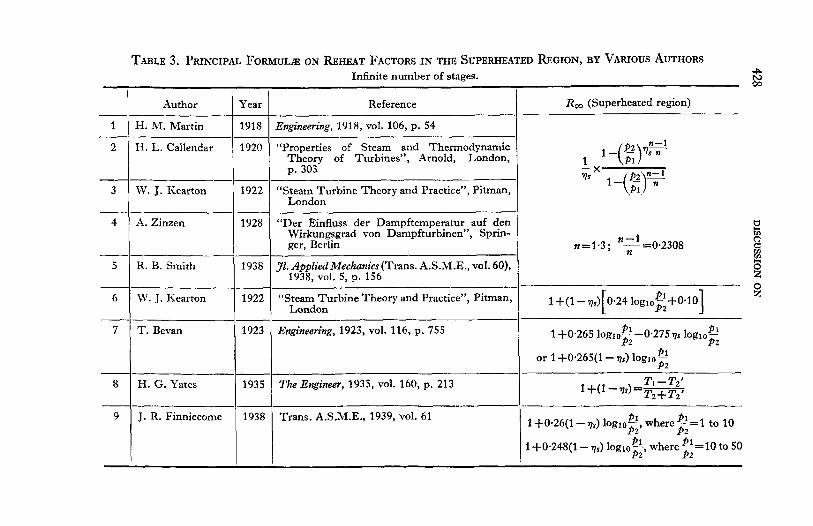
Mr. J. R. FINNIECOME wrote that the author had succeeded in pre- senting in a convenient form, to those associated with turbine design, the principal data on reheat factors at various operating conditions. His comprehensive treatise had undoubtedly been prepared with meticulous care and accuracy, and the series of useful curves would be welcomed, for they gave quickly and accurately the relationship between the reheat factor, the stage, and turbine efficiency at the specified operating conditions.
(1) The Condition Line. Attention was focused primarily on the determination of the condition line, for the superheated and the saturated regions, by calculating the slope by the step-by-step method. This was followed by the application of Simpson’s rule for the integra- tion of Tds, used for calculating the reheat factor. As far as his own knowledge went, J. H. Keenan and E. L. Robinson, in U.S.A., and T. Bremi, in Switzerland, derived and applied equation (3), p. 402, in 1928 for determining the condition line. However, the application of Simpson’s rule for calculating the reheat factor was new and deserved to receive attention.
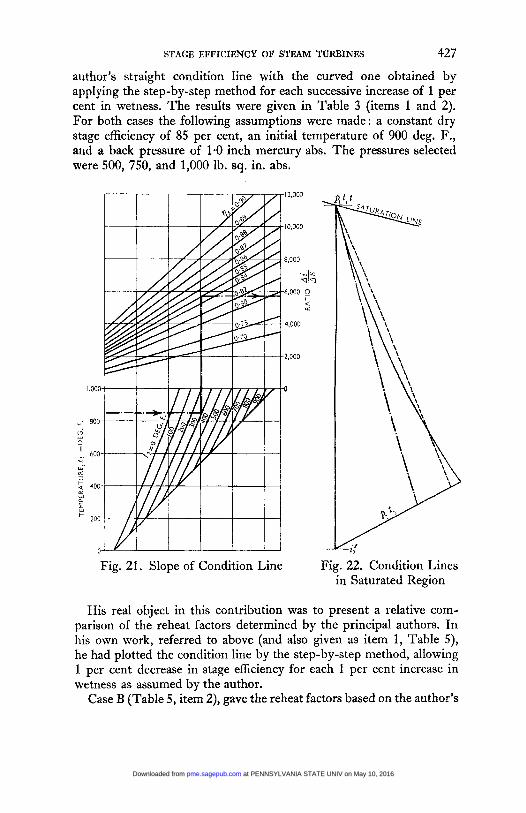
He himself presented graphically the author’s equation (3) in Fig. 21, to enable engineers to determine quickly and most accurately the slope of the condition line. This graph had been used with success by himself, for a set of condition lines to which he would refer in a later paragraph. By following the arrows in Fig. 21, one could determine, for an initial temperature t l , a final temperature t2, and a specified dry stage efficiency, the slope of the condition line based on the ratio Ai/AS so obtained. By applying the step-by-step method the condition line could thus be plotted on the Mollier chart. Its curvature depended, in the superheat region, on the stage efficiency and in the saturated region also on the wetness correction.
The author had based the slope of the condition line in the saturated region on the mean wetness, as indicated on p. 405, and thus obtained a straight line. He himself, however, had made an analysis, based on the author’s method of calculating the reheat factor, comparing the
at PENNSYLVANIA STATE UNIV on May 10, 2016pme.sagepub.comDownloaded from
STAGE EFFICIENCY OF STEAM TURBINES 427
author’s straight condition line with the curved one obtained by applying the step-by-step method for each successive increase of 1 per cent in wetness. The results were given in Table 3 (items 1 and 2). For both cases the following assumptions were made: a constant dry stage efficiency of 85 per cent, an initial temperature of 900 deg. F., and a back pressure of 1.0 inch mercury abs. The pressures selected were 500, 750, and 1,000 Ib. sq. in. abs.
Fig. 21. Slope of Condition Line Fig. 22. Condition Lines in Saturated Region
His real object in this contribution was to present a relative com- parison of the reheat factors determined by the principal authors. In his own work, referred to above (and also given as item 1, Table 5), he had plotted the condition line by the step-by-step method, allowing 1 per cent decrease in stage efficiency for each 1 per cent increase in wetness as assumed by the author.
Case B (Table 5 , item 2), gave the reheat factors based on the author’s
at PENNSYLVANIA STATE UNIV on May 10, 2016pme.sagepub.comDownloaded from
Author Year Reference
H. M. Martin 1918 Engineering, 1918, vol. 106, p. 54
2
Ra, (Superheated region)
3
H. L. Callendar
W. J. Kearton
A. Zinzen 4
- 5
1920 “Properties of Steam and Thermodynamic Theory of Turbines”, -4rnold, London, 1 p. 303 - x
London 1922 “Steam Turbine Theory and Practice”, Pitman,
“Der Einfluss der Dampftemperatur auf den Wirkungsgrad von Dampfturbinen”, Spnn-
1928
C n-1 ger, Berlin n=1.3; -=0.2308
%
6
- 7
- 8 H. G. Yates
9
or 1 +0*265(1-7~) logloP--l P 2
T I - T2’ 1 +(I - 7d=T2+T2’ 1935 The Engineer, 1935, vol. 160, p. 213
~~- ~-
J. R. Finniecome
8 2
R. B. Smith 1938 Jl . Applied Mechanics (Trans. A.S.M.E., vol. 60), I I 1938, vol. 5, p. 156
~ ~ ~~
1938 Trans. A.S.M.E., 1939, vol. 61
. .
8 l+( l -vs) 0.2410glo- +0.10 [ x: I M’. J. Kearton 1x1 “Steam Turbine Theory and Practice”, Pitman, /___I
London
T. Bevan 1 1923 1 Engineering, 1923, vol. 116, p. 755
PI 1 +0-26(1- vS) log10-, where &=1 to 10 P 2 P 2
1 +0.248(1- qs) loglo&, where @ = l o to 50 P2 P 2
at PENNSYLVANIA STATE UNIV on May 10, 2016pme.sagepub.comDownloaded from
STAGE EFFICIENCY OF STEAM TURBINES 429
straight condition line in the saturated region. He himself found that the final point at 1.0 inch mercury abs. for the step-by-step method in the saturated region gave only a slightly lower turbine efficiency. The difference in the reheat factors for cases A and B was extremely minute. The author’s assumption of the straight line in the saturated region was thus found to be in very close agreement with the ideal step-by-step method.
The three condition lines used in the saturated region for the initial conditions (1,OOO lb. per sq. in. abs. and 900 deg. F.) were indicated in Fig. 22. The chain-dotted line showed the condition curve with no allowance for wetness ; the full line curve indicated an allowance for wetness of 1 per cent per 1 per cent loss ; and the dotted line repre- sented the mean wetness line proposed by the author.
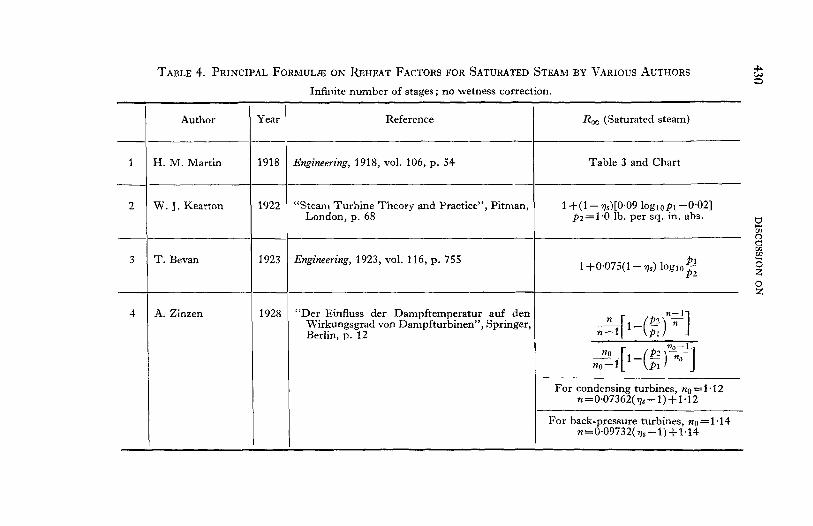
Tables 3 and 4 gave a brief summary of the formulae published during the last twenty years, and a series of important curves by various authors, for the super- heated and saturated regions respectively. For the former, complete agreement was found with the formula proposed by Martin and Callender. The others, with the exception of Yates, had only simplified the rather complicated exponential function of Martin ; they differed only in the degree of accuracy with which they approached his values. Yates had considered the subject from a slightly different angle, for he gave the reheat factors as a function of the initial and final absolute temperature, and the final adiabatic absolute temperature. I t would be found later that Yates’s formuia gave considerably higher values, well above the others, for both the superheated and the saturated regions.
Much more attention had recently been given to determine more accurately the reheat factor in the saturated region, for a glance at Table 4 showed distinctly the surprisingly different formulae. Prior place had been given in the list to Martin, who in 1918 published with characteristic thoroughness the first really exhaustive analysis of the reheat factor. Kearton’s and Bevan’s formulae had been’ derived from Martin’s values. He himself had specially modified to a simpler form the value of the exponential coefficient n, used in the rather involved formula published in Germany by Zinzen in his book in 1928 (Table 4, item 4). It would be found that the formula for condensing turbines gave lower, and that for back-pressure turbines, higher, values than Martin’s.
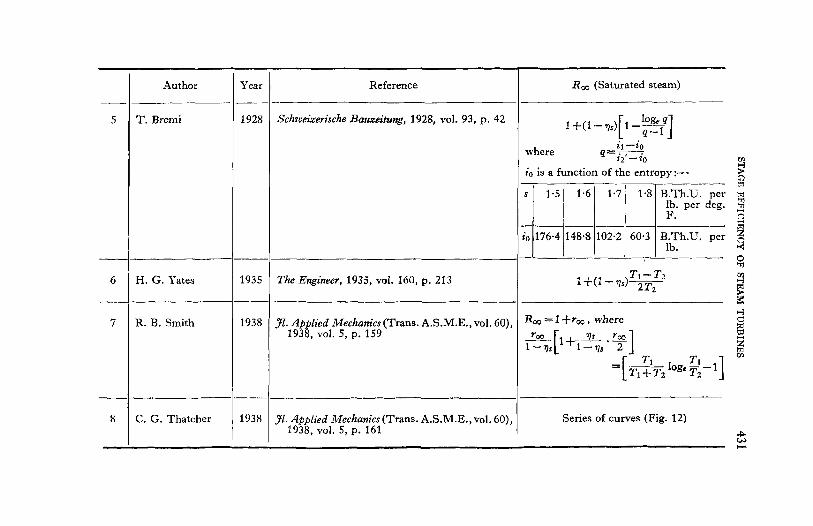
A very interesting and original step forward in the knowledge of reheat factors for the saturated region was made by Bremi in 1928. The basic formula was exactly the same as the author’s. It differed, however, in this respect, that he had introduced a mathematical
(2) Formula and Curves by Various Authors.
at PENNSYLVANIA STATE UNIV on May 10, 2016pme.sagepub.comDownloaded from
P 3
TABLE 4. PRINCIPAL FORMULIE ON REHEAT FACTORS FOR SATURATED STEAM BY VARIOUS AUTHORS w
Infinite number of stages; no wetness correction.
~
2
~ ~~
I Author
W. J. Kearton
-I
3
4
I H. M. Martin
T. Bevan
A. Zinzen
Year
1918
1922
- 1923
- 1928
Reference
Engineering, 1918, vol. 106, p. 54
“Steam Turbine Theory and Practice”, Pitman, London, p. 68
Rm (Saturated steam)
Table 3 and Chart
Engineering, 1923, vol. 116, p. 755
“Der Einfluss der Dampftemperatur auf den Wirkungsgrad von Dampfturbinen”, Springer, Berlin, p. 12
I For condensing turbines, no=1.12 n =0.07362( 7s - 1) + 1.1 2
For back-pressure turbines, no = 1.14 ~=0.09732( 7s-1) +1.14
at PENNSYLVANIA STATE UNIV on May 10, 2016pme.sagepub.comDownloaded from
-_ 5
- 6
_I
7
8
-
Author
T. Bremi
H. G. Yates
- ~
R. B. Smith
C. G. Thatcher
Year __
1928
__ 1935
1938
1938
Reference ~~ ~~
Schweizwische Baweitung, 1928, vol. 93, p. 42
The Engineer, 1935, vol. 160, p. 213
31. Applied Mechanics (Trans. A.S.M.E., vol. 60), 1938, vol. 5, p. 159
31. Applied Mechanics (Trans. A.S.M.E.,vol. 60), 1938, vol. 5, p. 161
Rar (Saturated steam)
io i s a function of the entropy :-
s 1 1.5 I 1.61 1.71 1.81 B.Th.U. per Ib. per deg. F. -----
io 176.4 148.8 102.2 60.3 B.Th.U. per I 1 1 1 I I b .
Roo = 1 + Y ~ , where
Series of curves (Fig. 12)
at PENNSYLVANIA STATE UNIV on May 10, 2016pme.sagepub.comDownloaded from
432 DISCUSSION ON
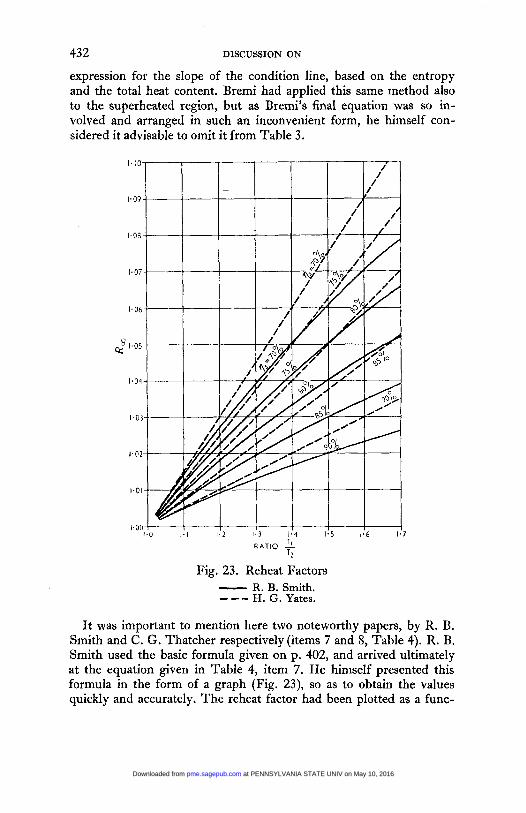
expression for the slope of the condition line, based on the entropy and the total heat content. Bremi had applied this same method also to the superheated region, but as Bremi’s final equation was so in- volved and arranged in such an inconvenient form, he himself con- sidered it advisable to omit it from Table 3.
1.10-
1.09
1.08
1.07
1.06
2 1.05
1.04
I 03
1 . ~ 2
1.01
1.00 J 1
RATIO -!L T2
Fig. 23. Reheat Factors - R. B. Smith. - -- H. G. Yates.
It was important to mention here two noteworthy papers, by R. B. Smith and C. G. Thatcher respectively (items 7 and 8, Table 4). R. B. Smith used the basic formula given on p. 402, and arrived ultimately at the equation given in Table 4, item 7. He himself presented this formula in the form of a graph (Fig. 23), so as to obtain the values quickly and accurately. The reheat factor had been plotted as a func-
at PENNSYLVANIA STATE UNIV on May 10, 2016pme.sagepub.comDownloaded from
STAGE EFFICIENCY OF STEAM TURBINES 433
tion of the absolute temperature ratio, based on the initial and final temperature conditions. The curves applied to the saturated region only.
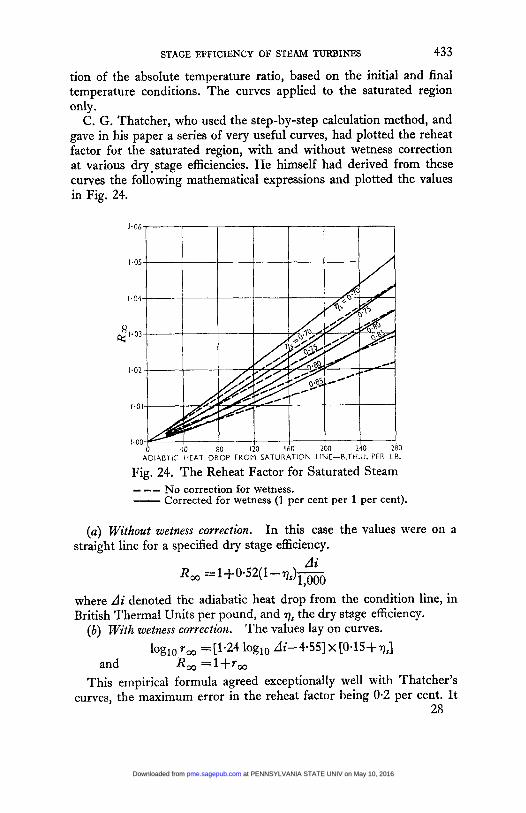
C . G. Thatcher, who used the step-by-step calculation method, and gave in his paper a series of very useful curves, had plotted the reheat factor for the saturated region, with and without wetness correction at various dry-stage efficiencies. He himself had derived from these curves the following mathematical expressions and plotted the values in Fig. 24.
0 ADlAETlC HEAT DROP FROM SATURATION LINE-6.TH.U. PER LB.
Fig. 24. The Reheat Factor for Saturated Steam - -- No correction for wetness. - Corrected for wetness (1 per cent per 1 per cent).
(a) Without wetness correction. In this case the values were on a straight line for a specified dry stage efficiency.
Ai 1,000 R , =1+0*52(1-7) -
where Ai denoted the adiabatic heat drop from the condition line, in British Thermal Units per pound, and qs the dry stage efficiency.
( b ) With wetness correction. The values lay on curves. loglo Y , =[la24 loglo d i - 4 . 5 5 1 ~ [O.15+qs]
This empirical formula agreed exceptionally well with Thatcher’s curves, the maximum error in the reheat factor being 0.2 per cent. I t
and R , =l+r ,
28
at PENNSYLVANIA STATE UNIV on May 10, 2016pme.sagepub.comDownloaded from
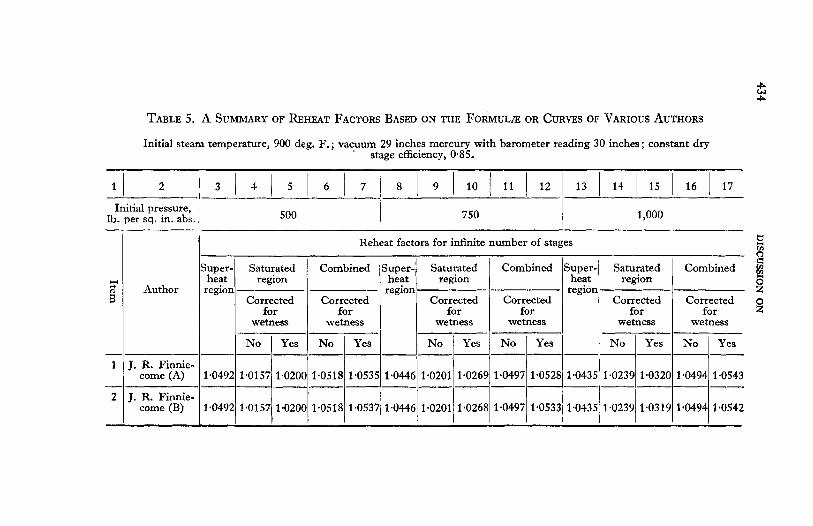
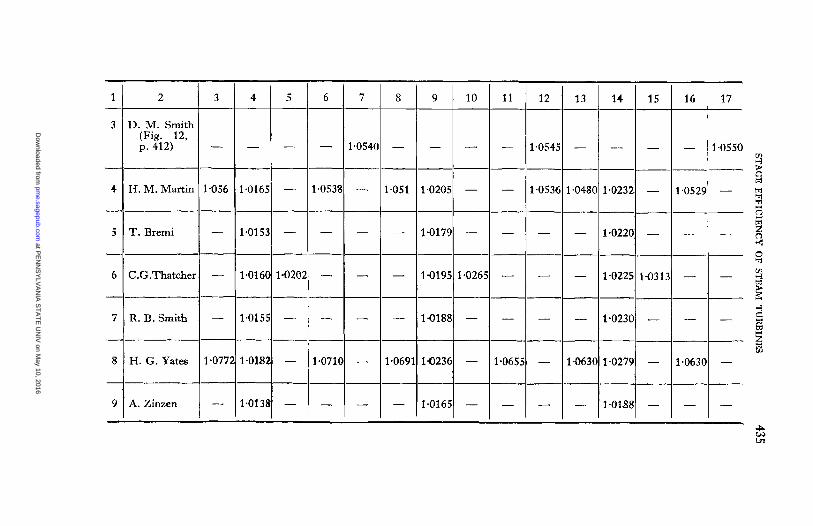
TABLE 5 . A SUMMARY OF REHEAT FACTORS BASED ON THE FORMULIE OR CURVES OF VARIOUS AUTHOFS
Super- heat region
Initial steam temperature, 900 deg. F. ; vacuum 29 inches mercury with barometer reading 30 inches ; constant dry stage efficiency, 0.85.
Saturated region
Corrected for
wetness
NO 1 Yes
500 750 Initial pressure, Ib. per sq. in. abs. 11
Super- heat region
1,000
Saturated region
Corrected for
WetneSS
Author
1.0446
1.0446
1.0201 1*026! --- 1.0201 1.0261
1 J. R. Finnie-
- 1.0497 -- 1.0497
2 J. R. Finnie-
1.052,
1.053
Reheat factors for infinite number of stages
1.0435
1.0435
Combined
1.0239 1.032C ---
1.0239 1.0315
Corrected for
wetness
:W94
t.0494
1.0518 1.053. 1-0543 -- 1.0542 1.0518 1.053’
iuper- Saturated heat region region
Corrected
wetness
Combined
Corrected for
wetness
No I Yes
~.
Combined
Corrected for
wetness
NO I Yes
at PENNSYLVANIA STATE UNIV on May 10, 2016pme.sagepub.comDownloaded from
43 5 STA
GE EFFIC
IENC
Y OF STEA
M TU
RB
INES
I 9, m 3
m
In N
ra
.-d $3
I a 0
0
M
I N
m
11
8
yr
w
0
$1
1
3
I
I I 9,
-
3
I
I
-qT
3
I p 3
0
si
,
I
I-
I
-1
I
'I
'
in
at PE
NN
SY
LVA
NIA
ST
AT
E U
NIV
on May 10, 2016
pme.sagepub.com
Dow
nloaded from
0.5
at PENNSYLVANIA STATE UNIV on May 10, 2016pme.sagepub.comDownloaded from
STAGE EFFICIENCY OF STEAM TURBINES 437
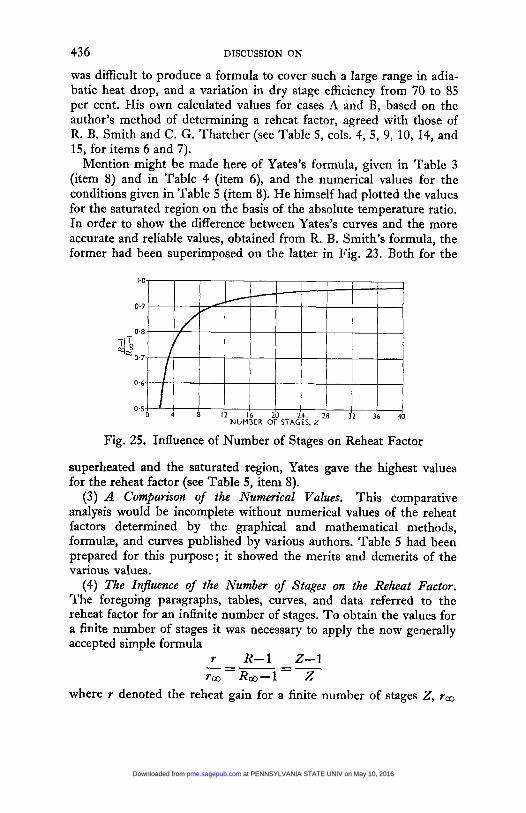
the reheat for an infinite number of stages, 2 the number of stages, R= 1 f r , the reheat factor for a finite number of stages, and Ra= I +rw the reheat factor for an infinite number of stages.
The relationship of the reheat gain ratio was plotted as a function of the number of stages 2 in Fig. 25. It would be found from this curve that the correction was very small down to ten stages, but in- creased very quickly below ten.
Professor L. F. C . A. G E N ~ wrote that he had been engaged for some time on an attempt to predict the steam consumption at varying loads of low-pressure multistage impulse turbines such as were mainly used for pass-out work. For this the first requirement was, of course, an accurate estimation of the internal efficiency, and this necessitated the setting out of the condition line in order to obtain the final state of the steam. The usual step-by-step method was very laborious on the ordinary i-s chart, and the wetness correction for efficiency did not improve matters in the wet region. He had therefore read with considerable interest the author’s investigation in this direction, but had found that it still relied on trial and error to reach a solution. Equation (3) or (5), however, helped considerably, and certainly gave quite close values for the final point ; but the calculation for this, and intermediate points, still involved much work, especially as small differences in the tentative values assumed gave considerable differences in the results.
He had himself attempted a direct solution of the problem, especially for the wet region, but had proceeded on a scheme which differed materially from the one followed in the paper. He had adopted a system of definite steps, each step being based on a fixed adiabatic heat drop of 50 B.Th.U., instead of the infinitely small steps assumed in the paper. This gave about seven stages from 100 lb. per sq. in. to 0.5 lb. per sq. in. ; and he believed that by the use of definite steps of this magnitude a rather closer agreement with the condition lines of actual turbines could be reached. Of course, the use of a constant adiabatic heat drop for each step meant a gradual reduction in the stage work, since the efficiency decreased with the increase of wet- ness ; but the effect of such differences on the condition line was quite negligible. He had in fact checked a set of figures with another cal- culation involving steps of 25 B.Th.U., and had found a very small difference in the results.
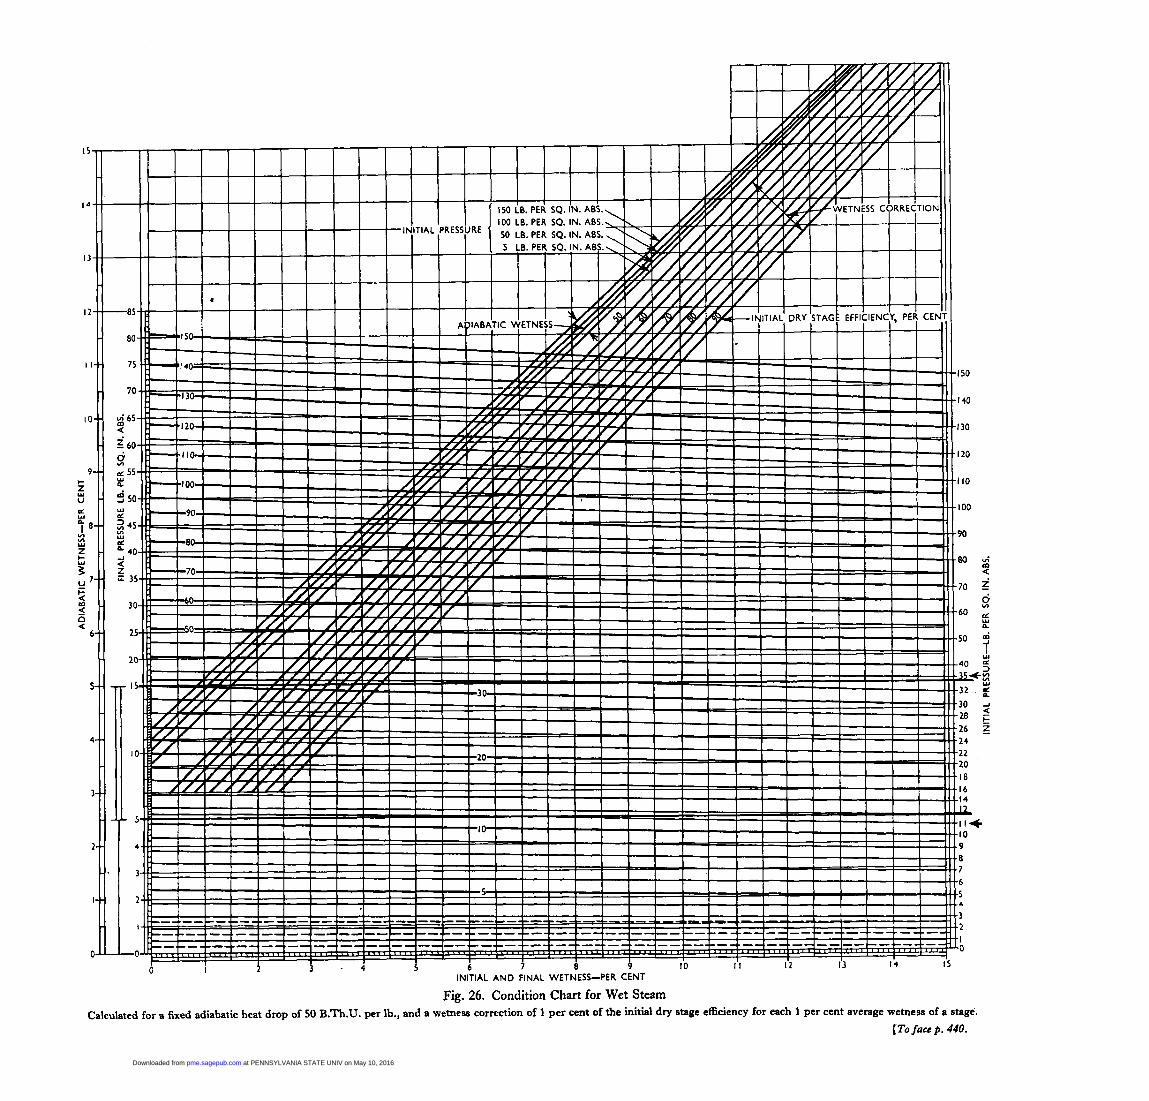
He had embodied the figures obtained so far for the wet region in the graphical chart, Fig. 26, facing p. 440, which covered the range 0-150 lb. per sq. in. and zero to 15 per cent initial wetness. He had selected this range to cover approximately usual practice for the low-
at PENNSYLVANIA STATE UNIV on May 10, 2016pme.sagepub.comDownloaded from
438 DISCUSSION ON
pressure part of a pass-out turbine, and the present chart would be supplemented later by another chart dealing with the superheat region.
Before explaining the method used in obtaining the graphs, it might be as well to define clearly the so-called “wetness correction” originally given by Baumann, and now generally accepted as standard. This was necessary, as he had found in some recent treatises different interpre- tations of Baumann’s statement, which was as follows : “The thermo- dynamic efficiency is corrected by multiplying the stage efficiency of every stage working with saturated steam by the dryness factor.” E. A. Kraft * also said: “It is often assumed that the stage efficiency can be obtained approximately by multiplying the efficiency for super- heated or dry steam by the dryness.”
He had therefore used the correction in the following manner: Iff1 per cent was the “dry stage” efficiency at the saturation line, then the stage efficiency for any “wet” stage having wetnesses of w1 and w2 per cent initially and finally was equal to
j p e r cent =ft(1-~&2) 200
For the pressure drops corresponding to the constant adiabatic drop of 50 B.Th.U., he had made use of an equation given by Callendar,? namely,
i-B’ B i“= (;) for steam dry saturated at the initial pressure P’, the constant B’ being given (in British Thermal Units) as 548-6-0.27t’.
In a series of trial calculations, he had found, however, that the results with the given value of B’ gave appreciable discrepancies when compared with those obtained by the orthodox methods with the Callendar (1931) tables ; and he had therefore determined some fresh constants for B‘ for the actual heat drops desired over the range 0-150 Ib. per sq. in. The revised expression for B‘ was found to be
and with this value he had obtained results which were in very close agreement with those calculated from the tables.
The pressures reached after a drop of 50 B.Th.U. from the satura- tion line could now be easily calculated for the whole range ; but, as he desired to explore the range of initial wetness from zero to 15 per cent, he had introduced some special corrections since Callendar’s
* “The Modem Steam Turbine”, 1931, V.D.1.-Verlag, Berlin. t “Properties of Steam and Thermodynamic Theory of Turbines”, 1920,
B’= 563.36- 0.3156t’
Arnold, London, p. 227.
at PENNSYLVANIA STATE UNIV on May 10, 2016pme.sagepub.comDownloaded from
STAGE EFFICIENCY OF STEAM TURBINES 439
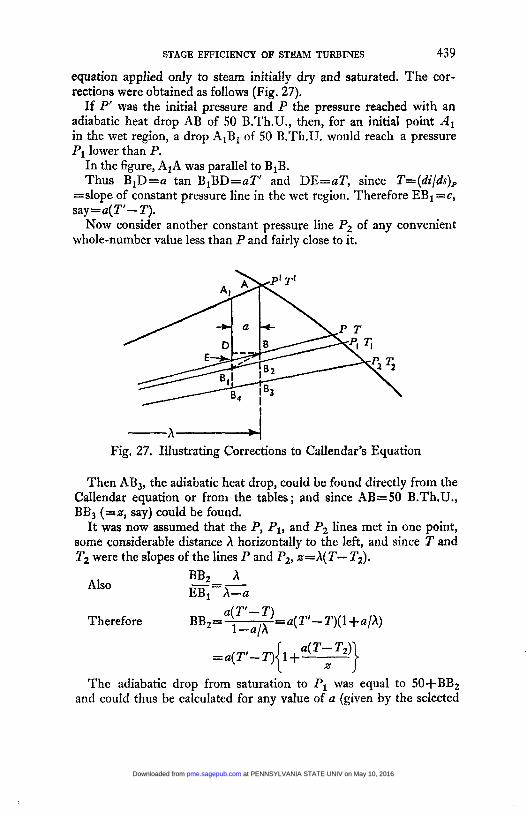
equation applied only to steam initially dry and saturated. The cor- rections were obtained as follows (Fig. 27).
If P‘ was the initial pressure and P the pressure reached with an adiabatic heat drop AB of 50 B.Th.U., then, for an initial point A1 in the wet region, a drop AIBI of 50 B.Th.U. would reach a pressure P1 lower than P.
In the figure, AIA was parallel to BIB. Thus BID=a tan BIBD=aT‘ and DE=aT, since T=(di/ds),
=slope of constant pressure line in the wet region. Therefore EB1=c, say=u(T‘- T).
Now consider another constant pressure line Pz of any convenient whole-number value less than P and fairly close to it.
4 a k \ P
-4-4 Fig. 27. Illustrating Corrections to Callendar’s Equation
Then AB,, the adiabatic heat drop, could be found directly from the Callendar equation or from the tables; and since AB=50 B.Th.U., BB3 (=z, say) could be found.
It was now assumed that the P, PI , and Pz lines met in one point, some considerable distance h horizontally to the left, and since T and T, were the slopes of the lines P and Pz, x=h( T- Tz).
Also
Therefore u(T’-
u( T’- T)( 1 + a p > BBz=
The adiabatic drop from saturation to P1 was equal to 50+BB2 and could thus be calculated for any value of a (given by the selected
at PENNSYLVANIA STATE UNIV on May 10, 2016pme.sagepub.comDownloaded from
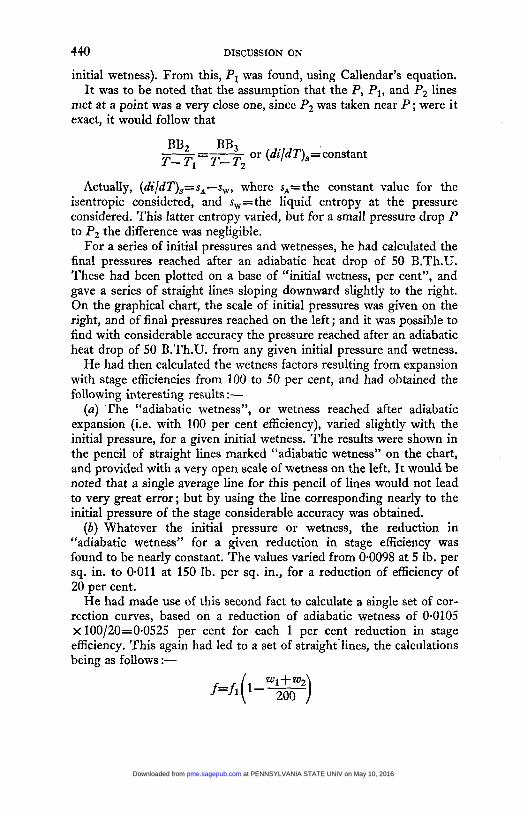
440 DISCUSSION ON
initial wetness). From this, P, was found, using Callendar’s equation. It was to be noted that the assumption that the P, PI, and Pz lines
met at a point was a very close one, since P2 was taken near P; were it exact, it would follow that
-=- BB2 BB3 or (di/dT),=constant T-Ti T-7’2
Actually, (di/dT),=s,-s,, where s,=the constant value for the isentropic considered, and s,= the liquid entropy at the pressure considered. This latter entropy varied, but for a small pressure drop P to Pz the difference was negligible.
For a series of initial pressures and wetnesses, he had calculated the final pressures reached after an adiabatic heat drop of 50 B.Th.U. These had been plotted on a base of “initial wetness, per cent”, and gave a series of straight lines sloping downward slightly to the right. On the graphical chart, the scale of initial pressures was given on the right, and of final pressures reached on the left ; and it was possible to find with considerable accuracy the pressure reached after an adiabatic heat drop of 5 0 B.Th.U. from any given initial pressure and wetness.
He had then calculated the wetness factors resulting from expansion with stage efficiencies from 100 to 50 per cent, and had obtained the following interesting results :-
(u) The “adiabatic wetness”, or wetness reached after adiabatic expansion (i.e. with 100 per cent efficiency), varied slightly with the initial pressure, for a given initial wetness. The results were shown in the pencil of straight lines marked “adiabatic wetness” on the chart, and provided with a very open scale of wetness on the left. It would be noted that a single average line for this pencil of lines would not lead to very great error ; but by using the line corresponding nearly to the initial pressure of the stage considerable accuracy was obtained.
(6) Whatever the initial pressure or wetness, the reduction in “adiabatic wetness” for a given reduction in stage efficiency was found to be nearly constant. The values varied from 0-0098 at 5 Ib. per sq. in. to 0.011 at 150 lb. per sq. in., for a reduction of efficiency of 20 per cent.
He had made use of this second fact to calculate a single set of cor- rection curves, based on a reduction of adiabatic wetness of 0.0105 ~100/20=0-0525 per cent for each 1 per cent reduction in stage efficiency. This again had led to a set of straighciines, the calculations being as follows :-
f = fi(1 - w e )
at PENNSYLVANIA STATE UNIV on May 10, 2016pme.sagepub.comDownloaded from
11 I
0
Fie. 26. Condition Chart for Wet Steam
I50
I40
I30
I20
I10
I00
90
8 o i
s <
70
,60 Y n.
- ,J
Calculated for a fixed adiabatic heat drop of SO B.Th.U. per lb., and a wetness correction of 1 per cent of the initial dry stage efficiency for each 1 per cent average wetness of a stage, [To face p. 440.
at PENNSYLVANIA STATE UNIV on May 10, 2016pme.sagepub.comDownloaded from
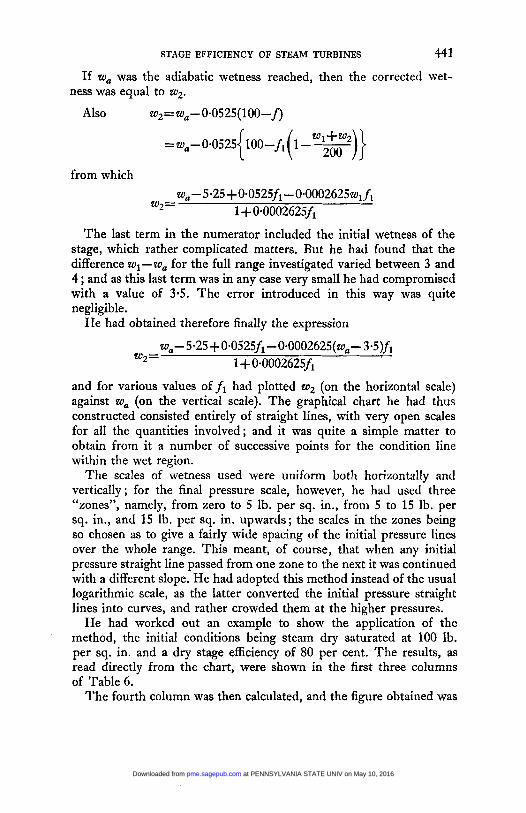
STAGE EFFICIENCY OF STEAM TURBINES 441
If wa was the adiabatic wetness reached, then the corrected wet- ness was equal to w,.
Also w,=wa-0~0525(100-j)
=wa-O*0525 { 100-ji ( 1-- wz7)} from which
wa- 5.25 + 0-0525fl- 0.0002625~, fi
1 + O*OOO2625f, W2 =
The last term in the numerator included the initial wetness of the stage, which rather complicated matters. But he had found that the difference wl-wa for the full range investigated varied between 3 and 4 ; and as this last term was in any case very small he had compromised with a value of 3-5. The error introduced in this way was quite negligible.
He had obtained therefore finally the expression
w,- 5.25 + 0.0525f1 - 0*0002625(~~- 3.5)fI 1 +0*0002625f1 W,=
and for various values of f1 had plotted w2 (on the horizontal scale) against wa (on the vertical scale). The graphical chart he had thus constructed consisted entirely of straight lines, with very open scales for all the quantities involved; and it was quite a simple matter to obtain from it a number of successive points for the condition line within the wet region.
The scales of wetness used were uniform both horizontally and vertically; for the final pressure scale, however, he had used three
zones”, namely, from zero to 5 lb. per sq. in., from 5 to 15 lb. per sq. in., and 15 lb. per sq. in. upwards; the scales in the zones being so chosen as to give a fairly wide spacing of the initial pressure lines over the whole range. This meant, of course, that when any initial pressure straight line passed from one zone to the next it was continued with a different slope. He had adopted this method instead of the usual logarithmic scale, as the latter converted the initial pressure straight lines into curves, and rather crowded them at the higher pressures.
He had worked out an example to show the application of the method, the initial conditions being steam dry saturated at 100 lb. per sq. in. and a dry stage efficiency of 80 per cent. The results, as read directly from the chart, were shown in the first three columns of Table 6.
The fourth column was then calculated, and the figure obtained was
6 6
at PENNSYLVANIA STATE UNIV on May 10, 2016pme.sagepub.comDownloaded from
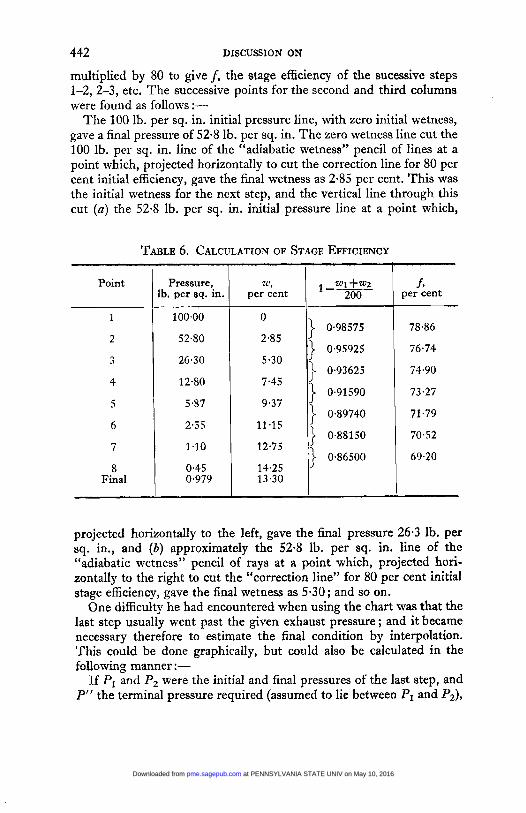
442 DISCUSSION ON
multiplied by 80 to give f, the stage efficiency of the sucessive steps 1-2,2-3, etc. The successive points for the second and third columns were found as follows :-
The 100 lb. per sq. in. initial pressure line, with zero initial wetness, gave a final pressure of 52.8 lb. per sq. in. The zero wetness line cut the 100 lb. per sq. in. line of the “adiabatic wetness” pencil of lines at a point which, projected horizontally to cut the correction line for 80 per cent initial efficiency, gave the final wetness as 2-85 per cent. This was the initial wetness for the next step, and the vertical line through this cut (u) the 52.8 lb. per sq. in. initial pressure line at a point which,
TABLE 6. CALCULATION OF STAGE EFFICIENCY
Point
1
2
3
4
5
6
7
8 Final
Pressure,. b. per sq. in.
100~00
52.80
26.30
12-80
5.87
2.55
1.10
0.45 0.979
0
2.85
5.30
7.45
9.37
11.15
12.75
} 0.98575
0.95925
] 0.93625
} 0.91590
} 0.89740
} 0.88150
I > 0.86500
13.30 14.25 li
f, per cent
78.86
76.74
74.90
73.27
71.79
70.52
69.20
projected horizontally to the left, gave the final pressure 26.3 lb. per sq. in., and (b) approximately the 52.8 lb. per sq. in. line of the “adiabatic wetness” pencil of rays at a point which, projected hori- zontally to the right to cut the “correction line” for 80 per cent initial stage efficiency, gave the final wetness as 5-30 ; and so an.
One difficulty he had encountered when using the chart was that the last step usually went past the given exhaust pressure ; and it became necessary therefore to estimate the final condition by interpolation. This could be done graphically, but could also be calculated in the following manner :-
If PI and Pz were the initial and final pressures of the last step, and P“ the terminal pressure required (assumed to lie between PI and P2),
at PENNSYLVANIA STATE UNIV on May 10, 2016pme.sagepub.comDownloaded from
STAGE EFFICIENCY OF STEAM TURBINES 443
then the adiabatic heat drop il-i” from P1 to P” was calculated from
where il, i2, and it‘ were the total heats at pressures PI, Pz, and P”, measured on the isentropic line through the initial point of the last step.
For the chart given, il-i2 was always 50 B.Th.U., and the adiabatic heat drop to the intermediate pressure PIt was thus readily calculated. To obtain the final point, it was only necessary to multiply this by the stage efficiency, which could be assumed with little error by judgement from the values for the last two steps.
This procedure was followed for the example given, and the last line added for a pressure of 0.979 lb. per sq. in. (28 inches of mercury), the value of il-i” being 6-80 B.Th.U.
Finally, the cumulative heat drop=(6 x 50) + 6.80=306.8 B.Th.U. Net work done
50(78*86+76.74+ 74.90+73*27+71*79+70-52) 6.80 x 70 + 100
- 100
- =227.8 B.Th.U.
The final total heat of the steam at a vacuum of 28 inches of mercury was obtained from this result as 1,190-7-227.8=962.9 B.Th.U. The corresponding wetness was 13.47 per cent. When the points were plotted on the large-scale Callendar (1930) chart, the final point gave a wetness of 13-05 per cent, corresponding to a total heat of 966 B.Th.U. The accumulated error due to the various assumptions made for the chart was thus about 3 B.Th.U. ; and a slight shifting of the condition line to give an intermediate wetness of, say, 13-3 per cent should give almost exactly the line required for the assumed initial data.
He had examined a number of “condition lines” given in American publications, and had found that very few of these crossed the satura- tion line above 150 Ib, per sq. in. ; so the chart could be utilized also for the wet stages of ordinary turbines. He had made n~ allowance for supersaturation conditions past the saturation line ; but it should be noted that the chart was so constructed that the starting point of the curve in the wet region could be taken where desired-for instance, at the point reached on the assumption that the “dry stage” efficiency applied to the first stage after (or to the step including) the saturation point.
at PENNSYLVANIA STATE UNIV on May 10, 2016pme.sagepub.comDownloaded from
444 DISCUSSION ON
Mr. 13. L. GUY, F.R.S. (Vice-president) wrote that the paper had been published shortly before two interesting communications on the subject to the Transactions of the American Society of Mechanical Engineers.”
While the reheat factor for a particular turbine might be calculated from the properties of each particular stage in that machine, such cal- culations were liable to error arising from summation of small quantities which for particular turbines were not usually determined accurately.
The curves given in the latter part of the paper provided a very valuable check on the accuracies of estimates of reheat factors for individual turbines, and enabled errors, of the kind previously referred to, to be detected. For this purpose many engineers had previously used the method developed by the late Professor Callendar, but the author’s method had the advantage that it could be applied continuously throughout the whole expansion curve in the superheat and wet steam area of the expansion, whereas Professor Callendar’s method was dis- continuous at the saturation point. The method developed in Mr. Ronald B. Smith’s paper was also subject to the disadvantage that the calculation was discontinuous and particulars were not given of the method to be followed in making a calculation for the complete expansion. On the other hand, Professor Thatcher’s paper, like the author’s, outlined a complete method that could be applied to the whole expansion.
Both the author’s and Professor Thatcher’s calculations included the influence of wetness on stage efficiency, whereas those of the late Professor Callendar and Mr. Ronald B. Smith ignored this as a separate factor.
One of the special values of the author’s paper lay in the series of curves given in Figs. 10-15, pp. 411-5, which were of immediate service both to those concerned with the design of turbines and to those concerned with various questions arising in their operation.
The values assigned to the reheat factor derived from the late Professor Callendar’s method and that of Mr. Ronald B. Smith for expansion in the superheat region alone and in the wet region alone, were found on trial to be the same as those given by the author’s methods for the same sets of conditions. Table 7 gave a comparison of the assessment of reheat factor for two particular conditions derived from the methods of Professor Thatcher and of the author, and again showed a very close correspondence.
# SMITH, RONALD B. Jl. Applied Mechanics (Trans. A.S.M.E., vol. 60), 1938, vol. 5, p. A-156, “The Calculation of Steam Turbine Reheat Factors”; and THATCHER, CHARLES G.,JZ. Applied Mechanics (Trans. A.S.M.E., vol. 60), 1938, vol. 5, p. A-161, “Reheat Factors for Expansion of Superheated and Wet Steam”.
at PENNSYLVANIA STATE UNIV on May 10, 2016pme.sagepub.comDownloaded from
STAGE EFFICIENCY OF STEAM TURBINES
TABLE 7. ASSESSMENT OF REHEAT FACTORS
Condition :- Initial pressure, lb. per sq. in. gauge Initial temperature, deg. F. . Vacuum, inches of mercury . Dry stage efficiency, per cent
.
. Reheat Factors:-
C. G. Thatcher (detail calculation) D. M. Smith (from curves) . D. M. Smith (detail calculation)
.
.
600 800 29 85
1.052 1.0515 1.052
445
- 1,200
800 29 80
1.072 1.071 1.071
Mr. B. HODKINSON wrote that the diagrams given related to an infinite number of small stages and therefore in an actual case the reheat factor, by careful addition on a heat chart, would fall short by a discrepancy which was difficult to measure exactly on the heat- entropy chart, even if the condition line was chosen strictly to the data, chiefly because a draughtsman’s measurement of such a number of small heat drops could not be perfectly reliable. Moreover, the more numerous and smaller the stages, the greater the difficulty, though this could be dealt with, as the author showed, by summing the cumulative heat (h,+lTds) on a temperature-entropy diagram. Having known by experience that the reheat factor data of Callendar and of Martin, for example, gave factors always higher than those worked out on a chart, he himself tested the above-mentioned origin of the discrepancy by choosing small stages and making their adiabatic verticals cross the condition line as shown. This was just a mathematical fiction, but by careful drawing and the use of a lens to read the heat drops perfect checks were achieved for what amounted to the case of an infinite number of stages. A formula for assessing the discrepancy as a function of the number of stages was given by the late Mr. A. E. Devey, who made careful drawings for several numbers of stages and by plotting reheat against 1/n instead of n arrived at the very simple rule
(rn- l)/(Yw - l)=(n-- I)/.
The reason for this was explained as follows, using a few simplifi- cations with very little error. If isobars were straight without being parallel, then the excess of CD over AB was proportional to AC (Fig. 28) and, by addition, the complete reheat would be seen to be proportional to the area of the triangle XYZ minus the little triangles such as CDE. For stages which were all equal, the sum of the areas of these small triangles equalled half the strip BXYE, that is, 1 / ~ of the area XYZ. Thus the reheat was (1- l ln ) of the ideal. The formula had been found
at PENNSYLVANIA STATE UNIV on May 10, 2016pme.sagepub.comDownloaded from
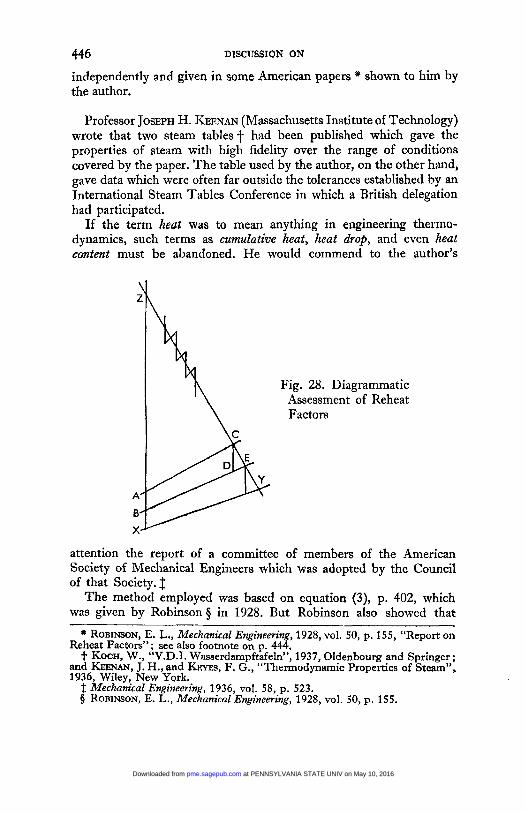
446 DISCUSSION ON
independently and given in some American papers * shown to him by the author.
Professor JOSEPH H. KEENAN (Massachusetts Institute of Technology) wrote that two steam tables+ had been published which gave the properties of steam with high fidelity over the range of conditions covered by the paper. The table used by the author, on the other hand, gave data which were often far outside the tolerances established by an International Steam Tables Conference in which a British delegation had participated.
If the term heat was to mean anything in engineering thermo- dynamics, such terms as cumulative heat, heat drop, and even heat content must be abandoned. He would commend to the author’s
Fig. 28. Diagrammatic Assessment of Reheat Factors
attention the report of a committee of members of the American Society of Mechanical Engineers which was adopted by the Council of that Society. 3
The method employed was based on equation (3), p. 402, which was given by Robinson in 1928. But Robinson also showed that
* ROBINSON, E. L., Mechanical Engineering, 1928, vol. 50, p. 155, “Report on Reheat Factors”; see also footnote on p. 444. + KOCH, W., “V.D.I. Wasserdampftafeln”, 1937, Oldenbourg and Springer ; and KEENAN, J. H., and h s , F. G., “Thermodynamic Properties of Steam”. 1936, Wiley, New York.
t: Mechanical Engineering, 1936, vol. 58, p. 523. 0 ROBINSON, E. L., Mechanical Engineering, 1928, vol. 50, p. 155.
at PENNSYLVANIA STATE UNIV on May 10, 2016pme.sagepub.comDownloaded from
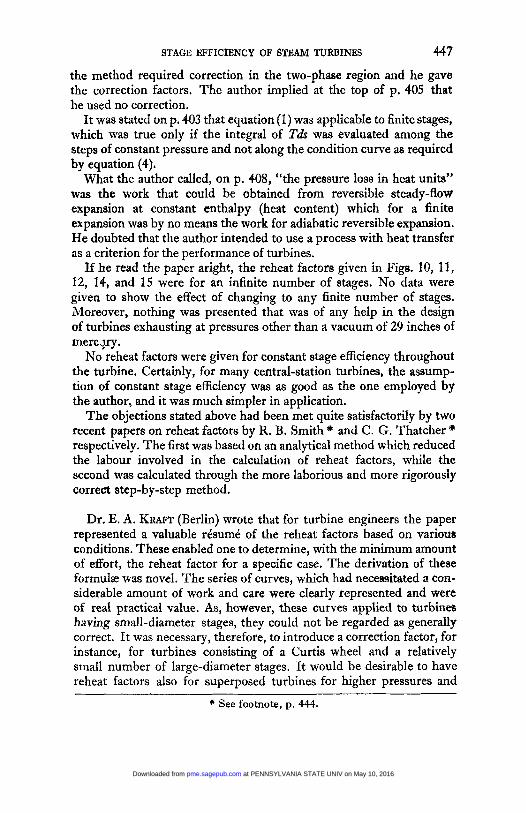
STAGE EFFICIENCY OF STEAM TURBINES 447 the method required correction in the two-phase region and he gave the correction factors. The author implied at the top of p. 405 that he used no correction.
It was stated on p. 403 that equation (I) was applicable to finite stages, which was true only if the integral of Tds was evaluated among the steps of constant pressure and not along the condition curve as required by equation (4).
What the author called, on p. 408, “the pressure loss in heat units” was the work that could be obtained from reversible steady-flow expansion at constant enthalpy (heat content) which for a finite expansion was by no means the work for adiabatic reversible expansion. He doubted that the author intended to use a process with heat transfer as a criterion for the performance of turbines.
If he read the paper aright, the reheat factors given in Figs. 10, 11, 12, 14, and 15 were for an infinite number of stages. No data were given to show the effect of changing to any finite number of stages. Moreover, nothing was presented that was of any help in the design of turbines exhausting at pressures other than a vacuum of 29 inches of mercpy.
No reheat factors were given for constant stage efficiency throughout the turbine. Certainly, for many central-station turbines, the assump- tion of constant stage efficiency was as good as the one employed by the author, and it was much simpler in application.
The objections stated above had been met quite satisfactorily by two recent papers on reheat factors by R. B. Smith and C. G. Thatcher * respectively. The first was based on an analytical method which reduced the labour involved in the calculation of reheat factors, while the second was calculated through the more laborious and more rigorously correct step-by-step method.
Dr. E. A. KRAFT (Berlin) wrote that for turbine engineers the paper represented a valuable rCsumC of the reheat factors based on various conditions. These enabled one to determine, with the minimum amount of effort, the reheat factor for a specific case. The derivation of these farmuh was novel. The series of curves, which had necessitated a con- siderable amount of work and care were clearly represented and were of real practical value. As, however, these curves applied to turbines having small-diameter stages, they could not be regarded a8 generally correct. It was necessary, therefore, to introduce a correction factor, for instance, for turbines consisting of a Curtis wheel and a relatively small number of large-diameter stages. It would be desirable to have reheat factors also for superposed turbines for higher pressures and
# See footnote, p. 444.
at PENNSYLVANIA STATE UNIV on May 10, 2016pme.sagepub.comDownloaded from
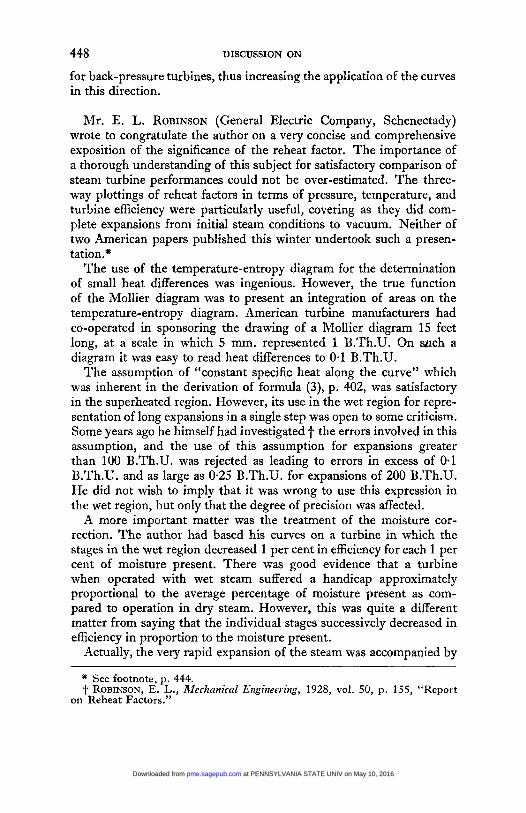
448 DISCUSSION ON
for back-pressure turbines, thus increasing the application of the curves in this direction.
Mr. E. L. ROBINSON (General Electric Company, Schenectady) wrote to congratulate the author on a very concise and comprehensive exposition of the significance of the reheat factor. The importance of a thorough understanding of this subject for satisfactory comparison of steam turbine performances could not be over-estimated. The three- way plottings of reheat factors in terms of pressure, temperature, and turbine efficiency were particularly useful, covering as they did com- plete expansions from initial steam conditions to vacuum. Neither of two American papers published this winter undertook such a presen- tation.*
The use of the temperature-entropy diagram for the determination of small heat differences was ingenious. However, the true function of the Mollier diagram was to present an integration of areas on the temperature-entropy diagram. American turbine manufacturers had co-operated in sponsoring the drawing of a Mollier diagram 15 feet long, at a scale in which 5 mm. represented 1 B.Th.U. On wch a diagram it was easy to read heat differences to 0.1 B.Th.U.
The assumption of “constant specific heat along the curve” which was inherent in the derivation of formula (3), p. 402, was satisfactory in the superheated region. However, its use in the wet region for repre- sentation of long expansions in a single step was open to some criticism. Some years ago he himself had investigated t the errors involved in this assumption, and the use of this assumption for expansions greater than 100 B.Th.U. was rejected as leading to errors in excess of 0.1 B.Th.U. and as large as 0.25 B.Th.U. for expansions of 200 B.Th.U. He did not wish to imply that it was wrong to use this expression in the wet region, but only that the degree of precision was affected.
A more important matter was the treatment of the moisture cor- rection. The author had based his curves on a turbine in which the stages in the wet region decreased 1 per cent in efficiency for each 1 per cent of moisture present. There was good evidence that a turbine when operated with wet steam suffered a handicap approximately proportional to the average percentage of moisture present as com- pared to operation in dry steam. However, this was quite a different matter from saying that the individual stages successively decreased in efficiency in proportion to the moisture present.
Actually, the very rapid expansion of the steam was accompanied by
* See footnote, p. 444. t ROBINSON, E. T;.., Mechanical Engineering, 1928, vol. 50, p. 155, “Report
on Reheat Factors.
at PENNSYLVANIA STATE UNIV on May 10, 2016pme.sagepub.comDownloaded from
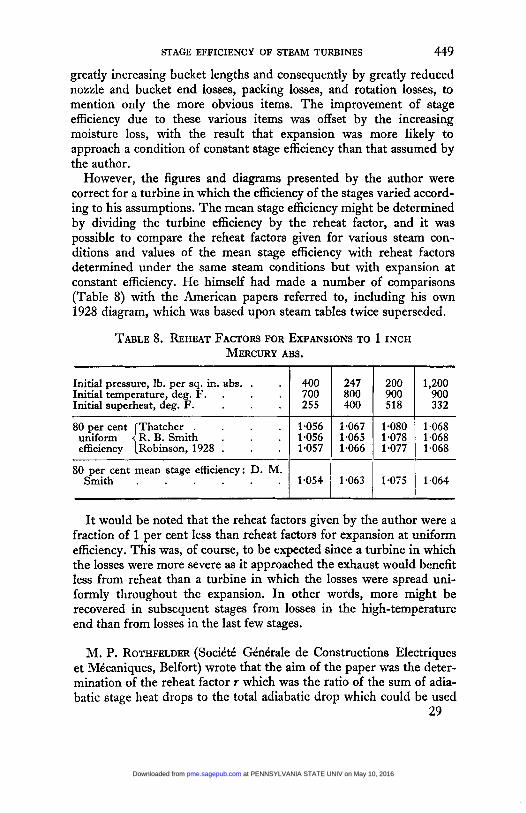
STAGE EFFICIENCY OF STEAM TURBINES 449
greatly increasing bucket lengths and consequently by greatly reduced nozzle and bucket end losses, packing losses, and rotation losses, to mention only the more obvious items. The improvement of stage efficiency due to these various items was offset by the increasing moisture loss, with the result that expansion was more likely to approach a condition of constant stage efficiency than that assumed by the author.
However, the figures and diagrams presented by the author were correct for a turbine in which the efficiency of the stages varied accord- ing to his assumptions. The mean stage efficiency might be determined by dividing the turbine efficiency by the reheat factor, and it was possible to compare the reheat factors given for various steam con- ditions and values of the mean stage efficiency with reheat factors determined under the same steam conditions but with expansion at constant efficiency. He himself had made a number of comparisons (Table 8) with the American papers referred to, including his own 1928 diagram, which was based upon steam tables twice superseded.
TABLE 8. REHEAT FACTOFU FOR EXPANSIONS TO 1 INCH MERCURY ABS.
80 per cent mean stage efficiency: D. M. Smith . .
Initial pressure, lb. per sq. in. abs. . Initial temperature, deg. F. . Initial superheat, deg. F. .
1.054 1.063 1-075 1.064
M. P. ROTHFELDER (Socittt Gtndrale de Constructions Electriques et Mtcaniques, Belfort) wrote that the aim of the paper was the deter- mination of the reheat factor Y which was the ratio of the sum of adia- batic stage heat drops to the total adiabatic drop which could be used
29
at PENNSYLVANIA STATE UNIV on May 10, 2016pme.sagepub.comDownloaded from
450 DISCUSSION ON
in a steam turbine. This value was a function of the initial pressure and temperature of the steam entering the turbine, of the vacuum or back pressure at exhaust, and of the efficiency of each stage. The reheat factor, therefore, differed from one turbine to another and could not be exactly determined except by a special calculation for the machine.
The investigation of general laws enabling account to be taken of the influence exercised by each of the characteristics (pressure, tempera- ture, vacuum, efficiency) on the value of the reheat factor had led the author to make certain assumptions. He assumed :-
(1) That the number of stages was very great ; that is to say, that each of the stage heat drops was very small.
(2) That the stage efficiency was the same for all stages (this efficiency was that corresponding to dry steam, a special correction being made for the portion of the expansion in wet steam).
(3) That the specific heat of the steam remained constant through- out the expansion.
On the basis of these assumptions, the author determined by inte- gration the sum of the stage heat drops and deduced the reheat factor. A large number of calculations had enabled the author to draw curves on which the reheat factor was given as a function of the initial pressure, the initial temperature, and the constant stage efficiency of the turbine. The curves of Fig. 10-15, pp. 411-5, were particularly interesting and brought out clearly the influence of the different variables on the reheat factor.
However, in practice the author’s assumptions were not realized because on the one hand the number of stages was often far from great and on the other hand the stage efficiency was never constant. In the high-pressure part of a turbine the stage efficiency was lower (par- ticularly when a Curtis wheel was employed for the first stage) than in the low-pressure part.
Now the curves showed that the influence of efficiency on the reheat factor was very important. It was evident that the unequal stage efficiency modified the results given by the author’s calculations and that it was not possible to settle directly with the aid of curves the true value of the reheat factor.
Nevertheless the graphs permitted of the determination by com- parison of the reheat factor of a turbine whose characteristics differed from those of a known turbine by only one variable (such as pressure or temperature). Moreover, the curves might equally be utilized for the calculation of test correction coefficients. In consequence the paper was interesting both from the theoretical and the practical points of view.
at PENNSYLVANIA STATE UNIV on May 10, 2016pme.sagepub.comDownloaded from
STAGE EFFICIENCY OF STEAM TURBINES 45 1
Dr. D. M. SMITH wrote in reply that he appreciated the value of the further information brought to light by the discussion. The compari- sons of reheat factors calculated by different methods made by various contributors were of great interest ; the results given were generally in reasonable agreement. He was grateful for the references given to earlier articles, not all of which had previously come to his attention, and also for the references to the contemporary papers by R. B. Smith and C. G. Thatcher. A few misprints to which attention was drawn had been corrected in the text.
In reply to Mr. Bottomley and to Professor Christie and Professor Thatcher, the turbine efficiency given in Figs. 10-15 was the same as the internal adiabatic efficiency defined earlier in the paper. Leaving loss was ignored in the calculations.
Mr. Dollin inquired whether a line of constant stage efficiency in the wet region was also a line of constant specific heat. This was an approximate relationship used by himself; it had been further examined by other contributors to the discussion. Professor Genke’s interpre- tation of the wetness loss rule was in accordance with his own. Ques- tions were raised by various contributors as to the accuracy and the physical basis of the wetness loss rule of 1 per cent fall in efficiency for 1 per cent wetness. This was an empirical rule which gave results in good agreement with experience, and it was therefore taken as being sufficiently nearly representative of what happened in practice ; no hypothesis was involved as to whether the loss arose from supersatura- tion or from friction or otherwise.
Professor Keenan was correct in assuming that the reheat factors given in the summary graphs applied only with an infinite number of stages. For a finite number of stages of approximately equal heat drop the rule given by Mr. E. L. Robinson in his paper of 1928 * might be applied to the results given by the graphs ; this rule was reproduced in the discussion by several contributors. Equation (1) was applicable to finite stages, provided the integral was evaluated along the stepped condition curve. Equation (4) was not applicable to a stepped condition curve, but only, as stated, to a smooth condition curve representing infinitesimal stages. He did not understand Professor Keenan’s refer- ence to the graphs being of no help for turbines exhausting at vacua other than 29 inches; Fig. 13 gave a vacuum correction applicable to Figs. 10, 11, and 12, while the relations of Figs. 14 and 15 were explicitly stated to be approximately independent of vacuum over a certain range.
Dr. Kraft and M. Rothfelder pointed out the inapplicability of the
* See footnote, p. 446.
at PENNSYLVANIA STATE UNIV on May 10, 2016pme.sagepub.comDownloaded from
452 STAGE EFFICIENCY OF STEAM TURBINES
graphs to expansions employing Curtis wheels or only a small num- ber of stages. Such cases should be worked out by the graphical method given in section 3 of the paper, but even in such cases the graphs were of some use in establishing the influence of change of reheat factor for small changes of steam conditions, as M. Rothfelder pointed out.
at PENNSYLVANIA STATE UNIV on May 10, 2016pme.sagepub.comDownloaded from
Related Documents