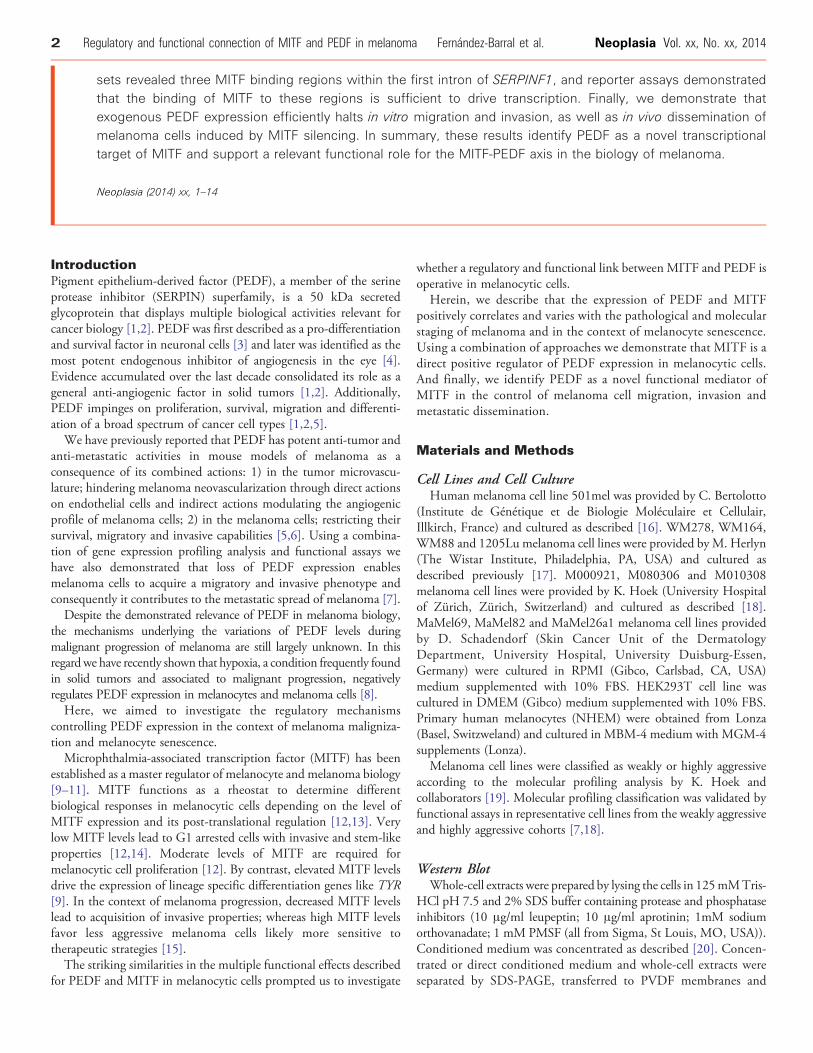
Regulatory and Functional Connection of Microphthalmia- Associated Transcription Factor and Anti-Metastatic Pigment Epithelium Derived Factor in Melanoma 1 Asunción Fernández-Barral *, † , Jose Luis Orgaz *, †, ††,2 , Pablo Baquero *, †, ‡‡,2 , Zaheer Ali ‡ , Alberto Moreno †,§§ , María Tiana *, † , Valentí Gómez *, †,¶¶ , Erica Riveiro-Falkenbach §,## , Carmen Cañadas ¶ , Sandra Zazo ¶ , Corine Bertolotto # , Irwin Davidson ** , Jose Luis Rodríguez-Peralto §,## , Ignacio Palmero † , Federico Rojo ¶ , Lasse Dahl Jensen ‡ , Luis del Peso *, † and Benilde Jiménez *, †,## * Department of Biochemistry, Universidad Autónoma de Madrid, Spain; † Instituto de Investigaciones Biomédicas Alberto Sols, CSIC-UAM Madrid, Spain; ‡ Division of Cardiovascular Medicine, Department of Medical and Health sciences, Linköping University, Linköping, Sweden; § Department of Pathology, Hospital Universitario 12 de Octubre, Universidad Complutense, Madrid, Spain; ¶ Department of Pathology, Capio-Fundación Jimenez Díaz, Madrid, Spain; # INSERM U895 Team 1 and Department of Dermatology, CHU Nice, France ** Institute de Génétique et de Biologie Moléculaire et Cellulaire, CNRS, INSERM, Université de Strasbourg, Illkirch, France; †† Randall Division of Cell and Molecular Biophysics, New Hunt’s House, Guy’s Campus, King’s College London, London SE1UL, United Kingdom; ‡‡ Paul O’Gorman Leukaemia Research Centre, Institute of Cancer Sciences, College of Medical, Veterinary and Life Sciences, University of Glasgow, Glasgow, United Kingdom; §§ Centre for Gene Regulation & Expression, College of Life Sciences, Universtity of Dundee, Dundee DD1 5EH, United Kingdom; ¶¶ Tumor Suppressor Signaling Networks Laboratory, UCL Cancer Institute, University College London, WC1E 6BT, London, United Kingdom; ## Instituto de Investigación I+12, Madrid, Spain Abstract Pigment epithelium-derived factor (PEDF), a member of the serine protease inhibitor superfamily, has potent anti- metastatic effects in cutaneous melanoma through its direct actions on endothelial and melanoma cells. Here we show that PEDF expression positively correlates with microphthalmia-associated transcription factor (MITF) in melanoma cell lines and human samples. High PEDF and MITF expression is characteristic of low aggressive melanomas classified according to molecular and pathological criteria, whereas both factors are decreased in senescent melanocytes and naevi. Importantly, MITF silencing down-regulates PEDF expression in melanoma cell lines and primary melanocytes, suggesting that the correlation in the expression reflects a causal relationship. In agreement, analysis of Chromatin immunoprecipitation coupled to high throughput sequencing (ChIP-seq) data www.neoplasia.com Volume xx Number xx Month 2014 pp. 1–14 1 Abreviations: PEDF, pigment epithelium-derived factor; MITF, microphthalmia- associated transcription factor; RGP, radial growth phase of melanoma; VGP, vertical growth phase of melanoma; CM, cutaneous metastasis of melanoma; VM, visceral metastasis of melanoma; BRAF, v-raf murine sarcoma viral oncogene homolog B; NRAS, neuroblastoma RAS viral (v-ras) oncogene homolog; OIS, oncogene induced senescence; hnRNA, heterogeneous nuclear RNA. Address all correspondence to: Benilde Jiménez, Department of Biochemistry, Universidad Autónoma de Madrid (UAM) and Instituto de Investigaciones Biomédicas Alberto Sols, CSIC-UAM, Arturo Duperier 4, Madrid 28029, Spain. E-mail: [email protected] 1 Conflict of interests The authors declare no conflict of interests.The following are the supplementary data related to this article. 2 These authors equally contributed to this work. © 2014 Published by Elsevier Inc. on behalf of Neoplasia Press, Inc. This is an open access article under the CC BY-NC-ND license (http://creativecommons.org/licenses/ by-ncnd/3.0/) 1476-5586/14 http://dx.doi.org/10.1016/j.neo.2014.06.001

Welcome message from author
This document is posted to help you gain knowledge. Please leave a comment to let me know what you think about it! Share it to your friends and learn new things together.
Transcript
www.neoplasia.com
Volume xx Number xx Month 2014 pp. 1–14 1
Abreviatioassociatedgrowth phmetastasisNRAS, nesenescenceAddress aUniversidaBiomédica
Regulatory and FunctionalConnection of Microphthalmia-Associated Transcription Factorand Anti-Metastatic PigmentEpithelium Derived Factorin Melanoma1
ns: PEDF, pigment epithelium-derived factor; MITF, microphthalmia-transcription factor; RGP, radial growth phase of melanoma; VGP, verticalase of melanoma; CM, cutaneous metastasis of melanoma; VM, visceralof melanoma; BRAF, v-raf murine sarcoma viral oncogene homolog B;uroblastoma RAS viral (v-ras) oncogene homolog; OIS, oncogene induced; hnRNA, heterogeneous nuclear RNA.ll correspondence to: Benilde Jiménez, Department of Biochemistry,d Autónoma de Madrid (UAM) and Instituto de Investigacioness Alberto Sols, CSIC-UAM, Arturo Duperier 4, Madrid 28029, Spain.
Asunción Fernández-Barral*,†, Jose Luis Orgaz*,†,††,2,Pablo Baquero*,†,‡‡, 2, Zaheer Ali‡,Alberto Moreno†, §§, María Tiana*,†,Valentí Gómez*,†,¶¶, Erica Riveiro-Falkenbach§,##,Carmen Cañadas¶, Sandra Zazo¶, Corine Bertolotto#,Irwin Davidson**, Jose Luis Rodríguez-Peralto§,##,Ignacio Palmero†, FedericoRojo¶, LasseDahl Jensen‡,Luis del Peso*,† and Benilde Jiménez*,†,##
*Department of Biochemistry, Universidad Autónoma deMadrid, Spain; †Instituto de Investigaciones BiomédicasAlberto Sols, CSIC-UAM Madrid, Spain; ‡Division ofCardiovascular Medicine, Department of Medical and Healthsciences, Linköping University, Linköping, Sweden;§Department of Pathology, Hospital Universitario 12 deOctubre, Universidad Complutense, Madrid, Spain;¶Department of Pathology, Capio-Fundación Jimenez Díaz,Madrid, Spain; #INSERM U895 Team 1 and Department ofDermatology, CHU Nice, France**Institute de Génétique et de Biologie Moléculaire etCellulaire, CNRS, INSERM, Université de Strasbourg, Illkirch,France; ††Randall Division of Cell and Molecular Biophysics,New Hunt’s House, Guy’s Campus, King’s College London,LondonSE1UL,UnitedKingdom; ‡‡PaulO’GormanLeukaemiaResearch Centre, Institute of Cancer Sciences, College ofMedical, Veterinary and Life Sciences, University of Glasgow,Glasgow, United Kingdom; §§Centre for Gene Regulation &Expression, College of Life Sciences, Universtity of Dundee,Dundee DD1 5EH, United Kingdom; ¶¶Tumor SuppressorSignaling Networks Laboratory, UCL Cancer Institute,University College London, WC1E 6BT, London, UnitedKingdom; ##Instituto de Investigación I+12, Madrid, Spain
AbstractPigment epithelium-derived factor (PEDF), a member of the serine protease inhibitor superfamily, has potent anti-metastatic effects in cutaneous melanoma through its direct actions on endothelial and melanoma cells. Here weshow that PEDF expression positively correlates with microphthalmia-associated transcription factor (MITF) inmelanoma cell lines and human samples. High PEDF and MITF expression is characteristic of low aggressivemelanomas classified according to molecular and pathological criteria, whereas both factors are decreased insenescent melanocytes and naevi. Importantly, MITF silencing down-regulates PEDF expression in melanoma celllines and primary melanocytes, suggesting that the correlation in the expression reflects a causal relationship. Inagreement, analysis of Chromatin immunoprecipitation coupled to high throughput sequencing (ChIP-seq) data
E-mail: [email protected] of interests The authors declare no conflict of interests.The following are thesupplementary data related to this article.2These authors equally contributed to this work.
© 2014 Published by Elsevier Inc. on behalf of Neoplasia Press, Inc. This is an openaccess article under the CC BY-NC-ND license (http://creativecommons.org/licenses/by-ncnd/3.0/) 1476-5586/14http://dx.doi.org/10.1016/j.neo.2014.06.001
2 Regulatory and functional connection of MITF and PEDF in melanoma Fernández-Barral et al. Neoplasia Vol. xx, No. xx, 2014
sets revealed three MITF binding regions within the first intron of SERPINF1, and reporter assays demonstratedthat the binding of MITF to these regions is sufficient to drive transcription. Finally, we demonstrate thatexogenous PEDF expression efficiently halts in vitro migration and invasion, as well as in vivo dissemination ofmelanoma cells induced by MITF silencing. In summary, these results identify PEDF as a novel transcriptionaltarget of MITF and support a relevant functional role for the MITF-PEDF axis in the biology of melanoma.
Neoplasia (2014) xx, 1–14
IntroductionPigment epithelium-derived factor (PEDF), a member of the serineprotease inhibitor (SERPIN) superfamily, is a 50 kDa secretedglycoprotein that displays multiple biological activities relevant forcancer biology [1,2]. PEDF was first described as a pro-differentiationand survival factor in neuronal cells [3] and later was identified as themost potent endogenous inhibitor of angiogenesis in the eye [4].Evidence accumulated over the last decade consolidated its role as ageneral anti-angiogenic factor in solid tumors [1,2]. Additionally,PEDF impinges on proliferation, survival, migration and differenti-ation of a broad spectrum of cancer cell types [1,2,5].
We have previously reported that PEDF has potent anti-tumor andanti-metastatic activities in mouse models of melanoma as aconsequence of its combined actions: 1) in the tumor microvascu-lature; hindering melanoma neovascularization through direct actionson endothelial cells and indirect actions modulating the angiogenicprofile of melanoma cells; 2) in the melanoma cells; restricting theirsurvival, migratory and invasive capabilities [5,6]. Using a combina-tion of gene expression profiling analysis and functional assays wehave also demonstrated that loss of PEDF expression enablesmelanoma cells to acquire a migratory and invasive phenotype andconsequently it contributes to the metastatic spread of melanoma [7].
Despite the demonstrated relevance of PEDF in melanoma biology,the mechanisms underlying the variations of PEDF levels duringmalignant progression of melanoma are still largely unknown. In thisregard we have recently shown that hypoxia, a condition frequently foundin solid tumors and associated to malignant progression, negativelyregulates PEDF expression in melanocytes and melanoma cells [8].
Here, we aimed to investigate the regulatory mechanismscontrolling PEDF expression in the context of melanoma maligniza-tion and melanocyte senescence.
Microphthalmia-associated transcription factor (MITF) has beenestablished as a master regulator of melanocyte and melanoma biology[9–11]. MITF functions as a rheostat to determine differentbiological responses in melanocytic cells depending on the level ofMITF expression and its post-translational regulation [12,13]. Verylow MITF levels lead to G1 arrested cells with invasive and stem-likeproperties [12,14]. Moderate levels of MITF are required formelanocytic cell proliferation [12]. By contrast, elevated MITF levelsdrive the expression of lineage specific differentiation genes like TYR[9]. In the context of melanoma progression, decreased MITF levelslead to acquisition of invasive properties; whereas high MITF levelsfavor less aggressive melanoma cells likely more sensitive totherapeutic strategies [15].
The striking similarities in the multiple functional effects describedfor PEDF and MITF in melanocytic cells prompted us to investigate
whether a regulatory and functional link between MITF and PEDF isoperative in melanocytic cells.
Herein, we describe that the expression of PEDF and MITFpositively correlates and varies with the pathological and molecularstaging of melanoma and in the context of melanocyte senescence.Using a combination of approaches we demonstrate that MITF is adirect positive regulator of PEDF expression in melanocytic cells.And finally, we identify PEDF as a novel functional mediator ofMITF in the control of melanoma cell migration, invasion andmetastatic dissemination.
Materials and Methods
Cell Lines and Cell CultureHuman melanoma cell line 501mel was provided by C. Bertolotto
(Institute de Génétique et de Biologie Moléculaire et Cellulair,Illkirch, France) and cultured as described [16]. WM278, WM164,WM88 and 1205Lu melanoma cell lines were provided by M. Herlyn(The Wistar Institute, Philadelphia, PA, USA) and cultured asdescribed previously [17]. M000921, M080306 and M010308melanoma cell lines were provided by K. Hoek (University Hospitalof Zürich, Zürich, Switzerland) and cultured as described [18].MaMel69, MaMel82 and MaMel26a1 melanoma cell lines providedby D. Schadendorf (Skin Cancer Unit of the DermatologyDepartment, University Hospital, University Duisburg-Essen,Germany) were cultured in RPMI (Gibco, Carlsbad, CA, USA)medium supplemented with 10% FBS. HEK293T cell line wascultured in DMEM (Gibco) medium supplemented with 10% FBS.Primary human melanocytes (NHEM) were obtained from Lonza(Basel, Switzweland) and cultured in MBM-4 medium with MGM-4supplements (Lonza).
Melanoma cell lines were classified as weakly or highly aggressiveaccording to the molecular profiling analysis by K. Hoek andcollaborators [19]. Molecular profiling classification was validated byfunctional assays in representative cell lines from the weakly aggressiveand highly aggressive cohorts [7,18].
Western BlotWhole-cell extracts were prepared by lysing the cells in 125mMTris-
HCl pH 7.5 and 2% SDS buffer containing protease and phosphataseinhibitors (10 μg/ml leupeptin; 10 μg/ml aprotinin; 1mM sodiumorthovanadate; 1 mM PMSF (all from Sigma, St Louis, MO, USA)).Conditioned medium was concentrated as described [20]. Concen-trated or direct conditioned medium and whole-cell extracts wereseparated by SDS-PAGE, transferred to PVDF membranes and
Neoplasia Vol. xx, No. xx, 2014 Regulatory and functional connection of MITF and PEDF in melanoma Fernández-Barral et al. 3
incubated with appropriate antibodies. Specific primary antibodiesand dilutions are listed in Supplementary Table 1.
RNA Extraction and Quantitative PCRTotal RNA was extracted and purified with the RNeasy Mini Kit
(Quiagen, Hilden, Germany) and retrotranscribed to cDNA usinghigh-capacity cDNA Archive Kit (Applied Biosystems, Foster City,CA, USA). For hnRNA extraction, samples were pretreated withDNAse I (Quiagen). See Supplementary Methods for TaqManprobes and oligonucleotides used. The quantitative PCR reaction wasperformed in an ABI Prism 7900 HT (Applied Biosystems).
Microarray Data AnalysisPublished DNA microarray data sets comprising series of
melanoma cell lines were downloaded from public database (GEOaccession numbers: Mannheim GSE4843; Philadelphia GSE4841)[19] and analyzed as described in [7].
Lentivirus Production and Transduction of Cell LinesLentiviruses were produced and tittered as previously described [7].
For transduction of target cells, lentiviruses were used at multiplicityof infection (MOI) of 5-100 depending on the cell line, for 5-8 h,resulting in more than 95% transduced (GFP-positive) cells.
RNA Interference and Over-Expression StrategiesMITF silencing was carried out using the lentiviral vector pGIPz
containing shRNAmir sequence V2LHS_257541 fromOpen Biosystems(Thermo Fisher Scientific, Huntsville, AL, USA). Two additionalshRNAmir sequences were used: V2LHS_259964 and V2LHS_76565,fromOpen Biosystems. Non-silencing shRNAmir sequence (shNS), withno homology to knownmammalian genes was used as control, cloned ina pGIPz vector (Open Biosystems). In order to carry out the MITFsilencing in 501mel melanoma cell line over-expressing PEDF, parentalcells were transduced with control lentiviral vector pRRL-GFP (GFP) orlentiviral vector expressing PEDF, pRRL-PEDF (PEDF) [7], at 10MOI.Seventy-two hours later, these melanoma cell lines were infected withshNS or shMITF lentiviral vectors at 100 MOI. For MITF over-expression we generated lentiviral constructs in the pCDH-CMV-MCS-EF1-copGFP (kindly provided byH.Rizos [21]) encoding humanMITFcDNA as indicated in Supplementary Methods.
Oncogene Induced Senescence (OIS)OIS in melanocytes was carried out by transducing the lentiviral
plasmids indicated below at 5 MOI. pCDH-BRAFV600E lentiviralplasmid [21] was provided by H. Rizos. We also generated lentiviralconstructs in the pRRL.CMV.EGFP.wpre.SIN vector encoding thefull-lengthHRASG12V cDNA as described in SupplementaryMethods.
Migration and Invasion AssaysMigration and invasion assays were performed seeding 120.000 cells
in modified Boyden chambers with polycarbonate filters (6.5 mmdiameter, 8.0 μm pore size) (Corning Incorporated, Corning, NY,USA) coated with 0.5 % gelatin (migration assay) [6] or 15 μg growthfactor reducedMatrigel (BDBiosciences, Bedford,MA,USA) (invasionassay) [7] diluted in 100 μl serum-freemedium, and air dried overnight.Thirty or sixty μg/ml of concentrated conditioned medium (CM) fromNIH-3T3 cells was used as chemoattractant. After incubation for 16-24h (migration assays) or 48 h (invasion assays), non-migrated and non-invaded cells were wiped off using a cotton swab, and the filters werestained with Diff Quik (Dade Behring, Newark, DE, USA). Migrated
or invaded cells were counted in 10 fields of maximum migration orinvasion under a light microscope at 40x magnification.
Zebrafish Tumor Cell Dissemination ModelThe metastatic ability of the tumor cell lines derived from
501mel cells in the zebrafish metastasis model was assayed asdescribed by P. Rouhi and collaborators [22,23]. Briefly, 501mel-GFP-shNS, 501mel-PEDF-shNS, 501mel-GFP-shMITF and 501mel-PEDF-shMITF cells were labeled in vitro with DiI dye and approximately100-500 cells were injected per embryo in the perivitelline space of2 days old transgenic Tg (fli1a:EGFP) zebrafish embryos. Z-stackfluorescent micrographs were taken 3 days after melanoma cellimplantation and distally disseminated tumor cells were counted. Allexperiments were performed in accordance with ethical permissionsgranted by the North Stockholm Experimental Animal EthicalCommittee, Sweden.
Proliferation AssayMelanocytes S-phase entry was analyzed by the incorporation of
5-ethynyl-2-deoxyuridine (EdU) at 20 μM for 6 h using the Click-iTEdU Imaging Kit (Invitrogen, Carlsbad, CA, USA) as indicated bythe manufacturer. EdU-positive cells were counted in 10 differentfields at 20x magnification.
ImmunofluorescencePrimary antibodies and dilutions are listed in Supplementary
Table 1. Primary melanocytes were seeded on glass coverslips in 24-well plates at 2.104 cells per well. Cells were washed in PBS twiceand fixed with 4 % paraformaldehyde/PBS for 15 min at roomtemperature. Cells were rinsed three times with PBS, thenpermeabilized with 0.5 % Triton X-100/PBS-0.1 M glycine for 10min, then rinsed and blocked with 3 % BSA/PBS for 1 h. Detectionof H3K9Me was performed incubating cells with rabbit polyclonalantibody to H3K9Me for 16 h at 4ºC, then washed and incubatedwith Alexa Fluor 546-conjugated secondary IgG (Invitrogen) andDAPI (4’,6-diamidino-2-phhenylin-dole) for nuclei detection. Tenfields at 40x magnification were counted. Immunofluorescence inhuman samples for PEDF and MITF expression was performed onformalin-fixed paraffin-embedded 3 μm sections from tissuemicroarrays (TMAs) corresponding to naevus (n = 15),RGP melanoma (n = 13), VGP melanoma (n = 19), cutaneousmetastases (n = 32) and visceral metastases (n = 17), retrieved fromHospital 12 de Octubre Biobank. After deparaffinization, heatantigen retrieval was performed in EDTA buffer, pH 9.0 usingDakoLink platform. Sections were immersed in TBS 5% BSA for 10min to block non-specific binding and then, incubated with a rabbitpolyclonal antibody to PEDF and a mouse monoclonal antibodyagainst MITF. PEDF and MITF were detected using appropriateAlexa Fluor 658 and 488 conjugated anti-rabbit and anti-mouse IgGantibodies (Invitrogen). Sections were incubated with DAPI tovisualize cell nuclei. All incubations were performed at roomtemperature (RT) using a Dako Autostainer. Fluorescence signalswere evaluated blindly by a trained pathologist using a Nuance FXMultispectral Imaging System (Cri Caliper Life Sciences), whichcompensates for unevenness in illumination and background, andthen flat fielded and filtered after image deconvolution the spectraldata. TIFF images were created. A semiquantitative HistoScore(Hscore) was calculated for nuclear MITF and cytoplasmic PEDFexpression in target cells considering the percentage of melanocytic
4 Regulatory and functional connection of MITF and PEDF in melanoma Fernández-Barral et al. Neoplasia Vol. xx, No. xx, 2014
cells showing low, medium, or high fluorescence intensity. The finalscore was determined after applying a weighting factor to eachestimate: Hscore = (low %) x 1 + (medium %) x 2 + (high %) x 3.
The results ranged from 0 to 300. For group comparisons, low,intermediate and high expression categories were defined establish-ing a threshold at Hscores of 100 and 200. Additionally, we
Neoplasia Vol. xx, No. xx, 2014 Regulatory and functional connection of MITF and PEDF in melanoma Fernández-Barral et al. 5
estimated the percentage of area of the lesion positive for PEDF orMITF in each sample. Extension of co-localization was determinedfor each sample as percentage of MITF-positive cells showing PEDFexpression. Percentage of biopsies displaying different degrees of co-localization (b25%, 25%-75% and N75%) was estimated in naevusand pathological stages of human melanoma.
ChIP-SequencingTo identify MITF binding sites in the SERPINF1 locus, we analyzed
publicly available [24] and unpublished ChIP-seq data provided by I.Davidson. Both ChIP-seq experiments were performed on chromatinfrom native 501mel cells according to standard protocols as previouslydescribed [24–26]. Peak detection was performed using the MACSsoftware (http://liulab.dfci. harvard.edu/MACS/; [27]) under settingsin which the HA–ChIP from untagged 501mel cells was used as anegative control. Only peaks with an associated p-value below 10-5
were considered significant. The False Discovery Rate for the MITFbinding sites in the SERPINF1 locus was below 8%. To generate thefigures, the coordinates of the MITF binding sites and peak maximumwere uploaded into the UCSC genome browser (http://genome.ucsc.edu/) as custom tracks in bed format [28].
Reporter AssaysReporter assays were performed using WM278 and MaMel26a1
melanoma cell lines andHEK293T, all of themwith no basal expressionof MITF. Cells were seeded on 24-well plates (6.104 cells/well) 16 h(HEK293T) or 48 h (WM278 and MaMel26a1) prior to transfection.A mixture containing 0.6 μg of MITF expression vector (pCDH-HA-MITF) or its control (pCDH-GFP), 0.15 μg of the indicated reporterconstruct (described in Supplementary Methods) or empty plasmid and0.03μg of a plasmid encoding for renilla luciferase under the control of aminimal promoter (prolactin-) [29] was used for transfection withFugene (Promega). Analysis of firefly and renilla luciferase wasperformed using the Dual Luciferase Reporter System (Promega) in aLumat LB9507 luminometer (Berthold Technologies, Bad Wildbad,Germany). The luciferase activity was normalized to renilla activity(constitutive expression). The results are represented as the average of thefold induction obtained from three independent experiments in each cellline and error bars represent the standard deviation.
Statistical AnalysisStatistical analysis was performed using GraphPad Instat
(GraphPad Software, San Diego, CA, USA). P-values b 0.05 wereconsidered as significant.
Results
MITF and PEDF Expression Positively Correlate DuringHuman Melanoma Progression and Melanocyte Senescence
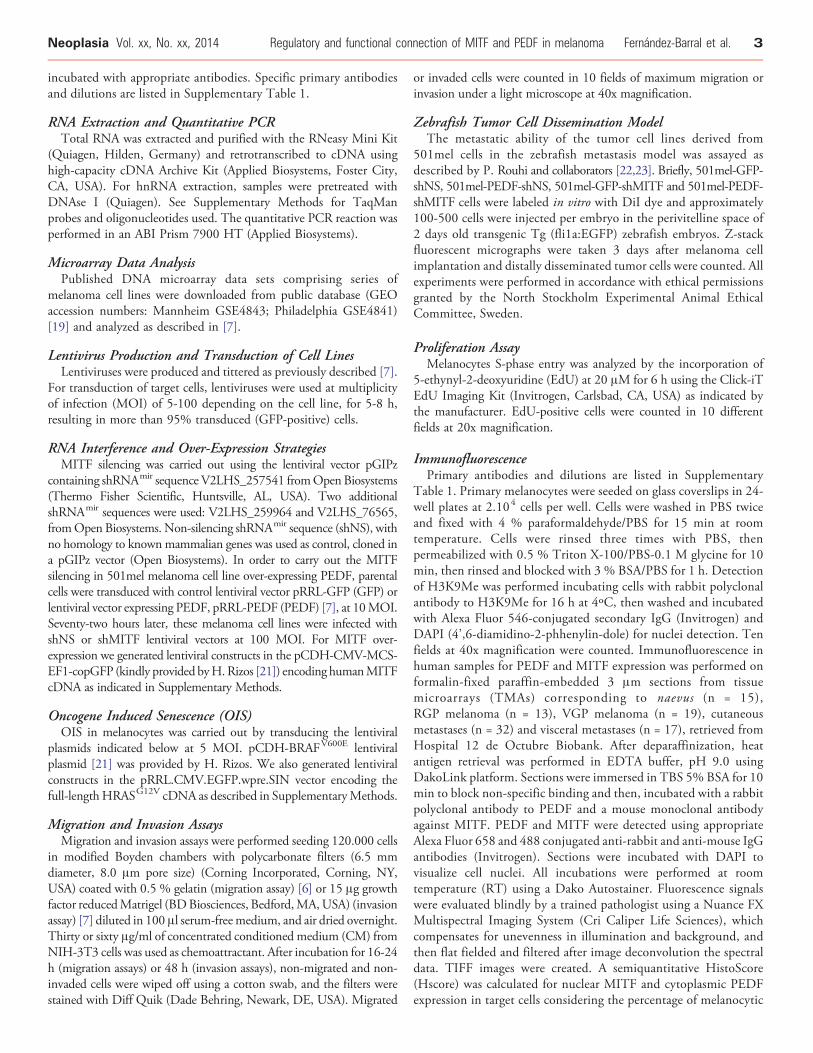
Figure 1. MITF and PEDF expression in weakly aggressive and highexpression using microarray gene expression data of Mannheim sersignature into weakly and highly aggressive cohorts. NormalizedMITFthe sample set. (B) Scattergram showing the positive correlation bseries. Statistical significancewas determined byPearson’s test (r= 0.4(**P b 0.01) (right) expression in weakly and highly aggressive melandetermined by Welch’s test. Boxes in the plots include values in the 25outliers. (D) Analysis of MITF and PEDF expression using microarray g(E) Scattergram showing the positive correlation between MITF andsignificancewas determined by Spearman’s test (r = 0.4762; *P b 0.05)PEDF (Welch’s test; **P b 0.01) (right) expression in weakly and highly
Previously, we used gene expression profiling analysis of large seriesof melanoma cell lines to demonstrate that PEDF expression variedwith the molecular staging of melanoma cells, with high levels ofPEDF being characteristic of the weakly aggressive cohort [7]. Here weextended this analysis to search for factors that positively correlate withPEDF and that could therefore be candidate regulators implicated inmaintaining high PEDF levels in melanocytes and weakly aggressivemelanoma cells. In this analysis we found that expression of PEDFpositively correlated with MITF in two large melanoma sets(Figure 1B and E). Figure 1A and D show that the cohort of weaklyaggressive melanomas is characterized by high levels of PEDF andMITF, whereas the expression of both factors is significantly decreasedin the highly aggressive cohort (Figure 1C and F).
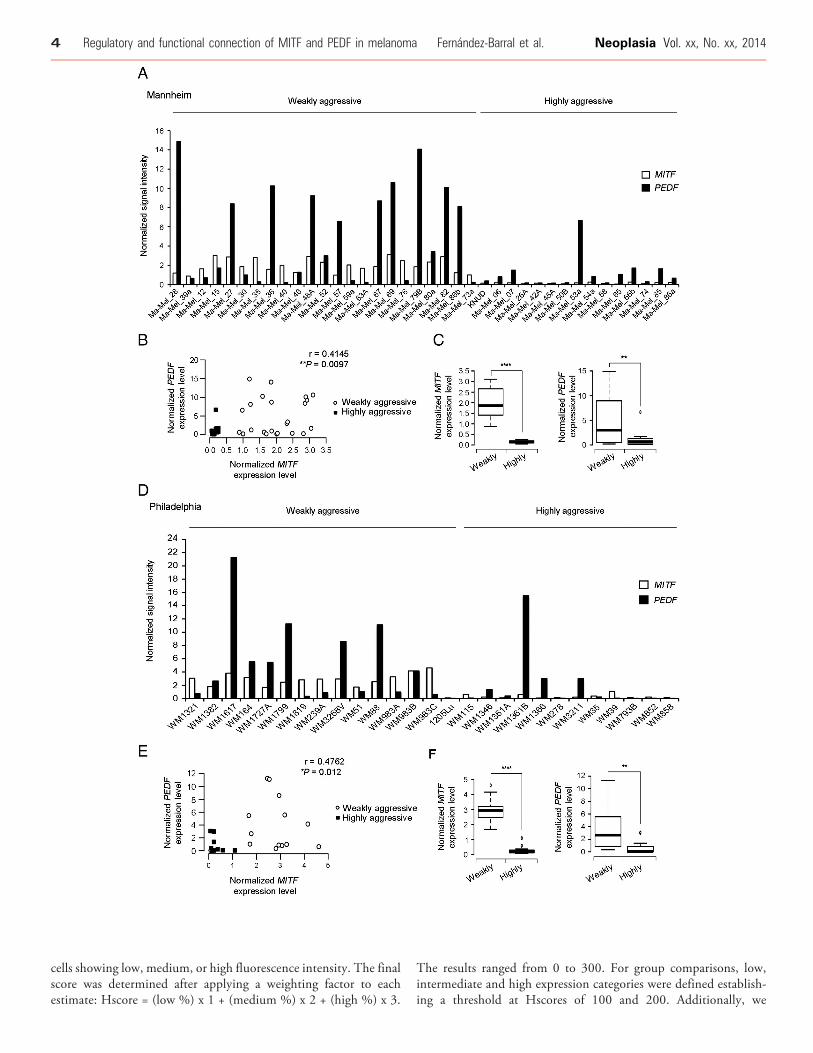
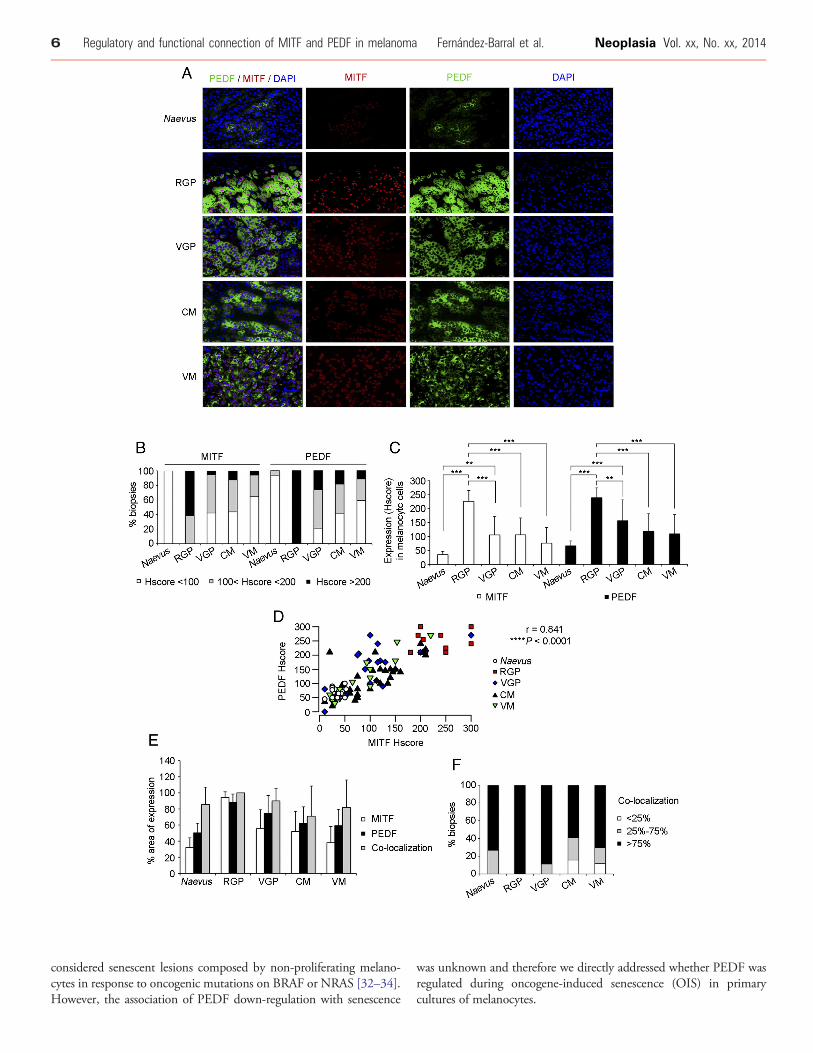
We next evaluated whether both factors also positively correlate inhuman biopsies of different pathological stages of melanoma byperforming double immunoflourescence in tissue microarrays(TMAs) of naevus (n = 15), radial growth phase (RGP) melanoma(n = 13), vertical growth phase (VGP) melanoma (n = 19), cutaneousmetastases (CM) of melanoma (n = 32) and visceral metastases (VM)of melanoma (n = 17) (Figure 2). As expected, we detected nuclearMITF expression and cytoplasmatic PEDF expression (Figure 2A).PEDF and MITF expression was variable in primary melanomas andmetastases, ranging from moderate to high (Figure 2A-B). However,homogeneous and low expression of both factors was detected innaevus; and high expression for either PEDF or MITF was notdetected in any naevus sample (Figure 2A-B). Expression of PEDFand MITF was significantly increased in primary melanoma (RGP orVGP melanoma) compared to naevus (Figure 2C). Also a significantdecrease in PEDF and MITF expression was observed in VGPmelanoma, cutaneous and visceral metastases compared to RGPmelanoma (Figure 2C). Furthermore, a positive correlation of bothfactors was confirmed comparing biopsies of the different pathologicalstages of human melanoma progression (Figure 2D).
These results provide solid evidence for positive correlationbetween PEDF and MITF levels and co-regulation of their expressionaccording to molecular and pathological staging of melanoma.
Additionally, we analyzed by double immunofluorescence PEDFand MITF co-localization within melanocityc cells in samples ofhuman naevus and melanoma (Figure 2A and E-F). In naevus, wherea mean of 50.3% of the total area of the sample expressed PEDF and32.2% MITF, we observed that in average 85.5% of MITF-positivecells also expressed PEDF (Figure 2E). Analysis of distribution of thesamples according to the degree of co-localization showed that PEDFand MITF co-localized in the majority of the samples (Figure 2F).Similar results were also found in primary melanoma and metastases(Figure 2E-F).
In agreement with our results, it has been reported that MITFexpression is decreased in benign naevi [12,30,31]; which are
ly aggressive melanoma cell lines. (A) Analysis ofMITF and PEDFies of melanoma cell lines. Cell lines were classified by their gene(empty bars) and PEDF (filled bars) signal intensity are plotted acrossetween MITF and PEDF levels in each cohort of the Mannheim145; **P b 0.01). (C) Box-plot ofMITF (****P b 0.0001) (left) andPEDFoma cell lines of the Mannheim series. Statistical significance was-75% interval; internal lanes represent the median; circles representene expression data of Philadelphia series of melanoma cell lines.PEDF levels in each cohort of the Philadelphia series. Statistical. (F) Box-plot ofMITF (Mann-Whitney’s test; ****P b 0.0001) (left) andaggressive melanoma cell lines.
6 Regulatory and functional connection of MITF and PEDF in melanoma Fernández-Barral et al. Neoplasia Vol. xx, No. xx, 2014
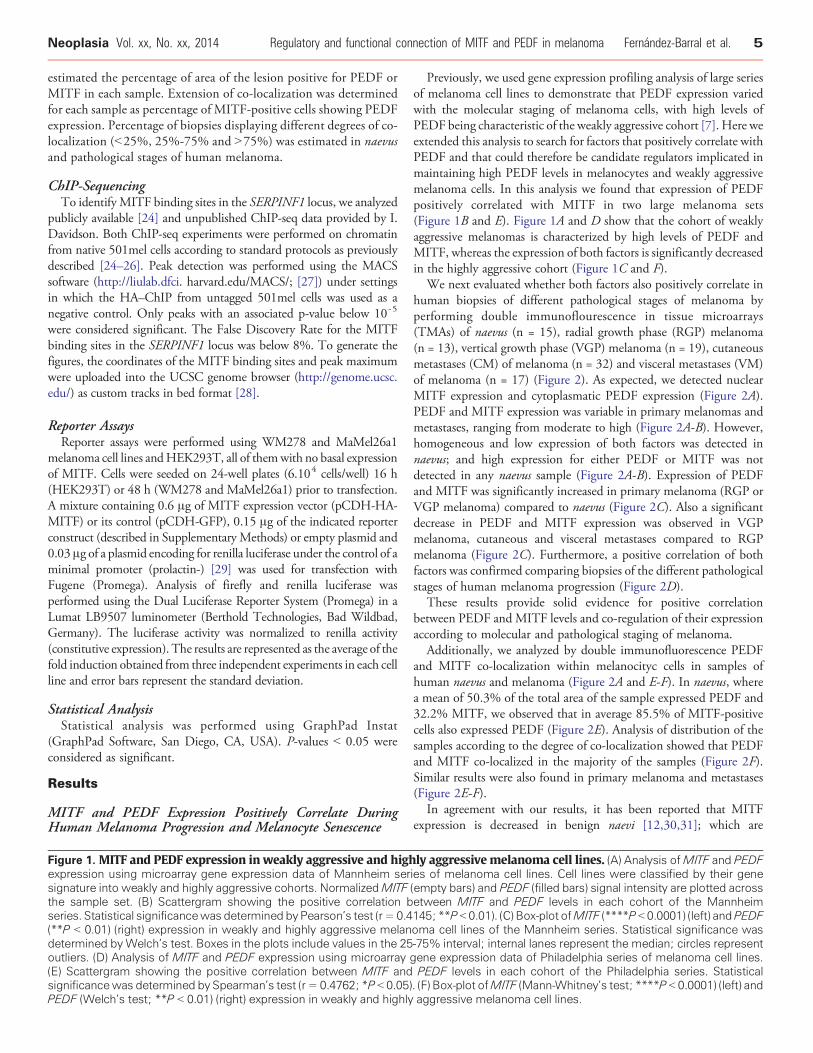
considered senescent lesions composed by non-proliferating melano-cytes in response to oncogenic mutations on BRAF or NRAS [32–34].However, the association of PEDF down-regulation with senescence
was unknown and therefore we directly addressed whether PEDF wasregulated during oncogene-induced senescence (OIS) in primarycultures of melanocytes.
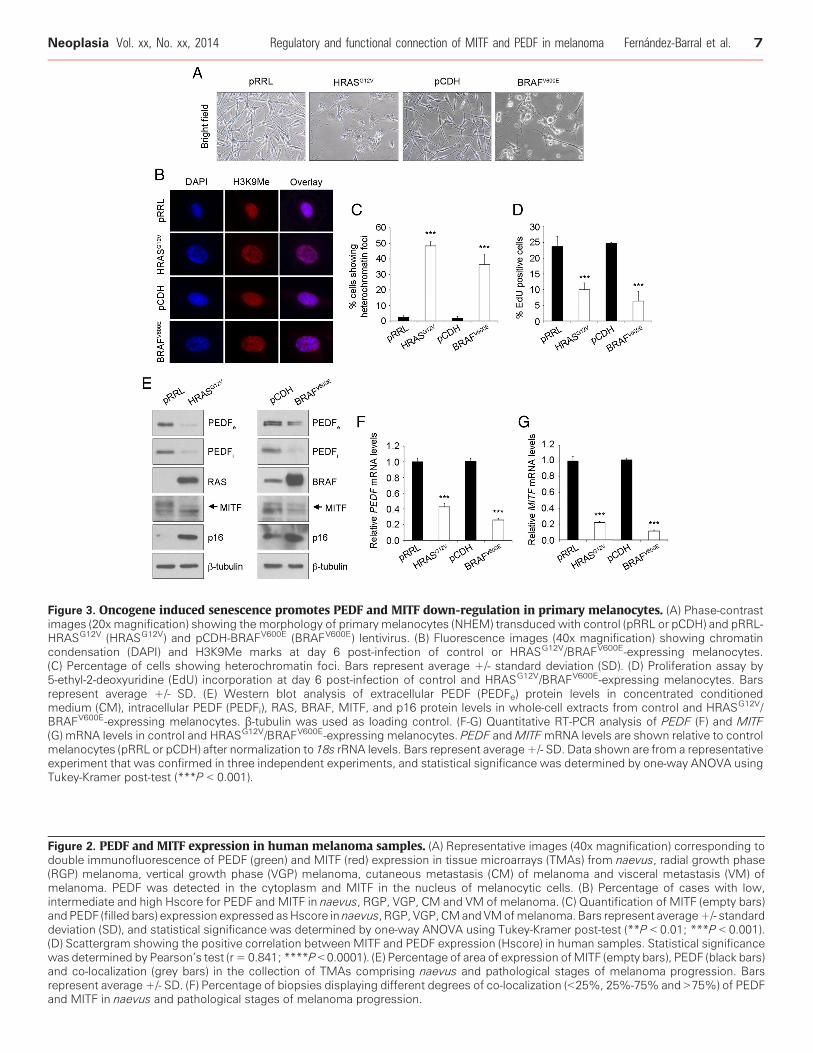
Figure 3. Oncogene induced senescence promotes PEDF and MITF down-regulation in primary melanocytes. (A) Phase-contrastimages (20x magnification) showing the morphology of primary melanocytes (NHEM) transduced with control (pRRL or pCDH) and pRRL-HRASG12V (HRASG12V) and pCDH-BRAFV600E (BRAFV600E) lentivirus. (B) Fluorescence images (40x magnification) showing chromatincondensation (DAPI) and H3K9Me marks at day 6 post-infection of control or HRASG12V/BRAFV600E-expressing melanocytes.(C) Percentage of cells showing heterochromatin foci. Bars represent average +/- standard deviation (SD). (D) Proliferation assay by5-ethyl-2-deoxyuridine (EdU) incorporation at day 6 post-infection of control and HRASG12V/BRAFV600E-expressing melanocytes. Barsrepresent average +/- SD. (E) Western blot analysis of extracellular PEDF (PEDFe) protein levels in concentrated conditionedmedium (CM), intracellular PEDF (PEDFi), RAS, BRAF, MITF, and p16 protein levels in whole-cell extracts from control and HRASG12V/BRAFV600E-expressing melanocytes. β-tubulin was used as loading control. (F-G) Quantitative RT-PCR analysis of PEDF (F) and MITF(G) mRNA levels in control and HRASG12V/BRAFV600E-expressing melanocytes. PEDF andMITFmRNA levels are shown relative to controlmelanocytes (pRRL or pCDH) after normalization to 18s rRNA levels. Bars represent average +/- SD. Data shown are from a representativeexperiment that was confirmed in three independent experiments, and statistical significance was determined by one-way ANOVA usingTukey-Kramer post-test (***P b 0.001).
Figure 2. PEDF and MITF expression in human melanoma samples. (A) Representative images (40x magnification) corresponding todouble immunofluorescence of PEDF (green) and MITF (red) expression in tissue microarrays (TMAs) from naevus, radial growth phase(RGP) melanoma, vertical growth phase (VGP) melanoma, cutaneous metastasis (CM) of melanoma and visceral metastasis (VM) ofmelanoma. PEDF was detected in the cytoplasm and MITF in the nucleus of melanocytic cells. (B) Percentage of cases with low,intermediate and high Hscore for PEDF and MITF in naevus, RGP, VGP, CM and VM of melanoma. (C) Quantification of MITF (empty bars)andPEDF (filled bars) expression expressed asHscore in naevus, RGP, VGP, CMandVMofmelanoma. Bars represent average+/- standarddeviation (SD), and statistical significance was determined by one-way ANOVA using Tukey-Kramer post-test (**P b 0.01; ***P b 0.001).(D) Scattergram showing the positive correlation between MITF and PEDF expression (Hscore) in human samples. Statistical significancewas determined by Pearson’s test (r = 0.841; ****P b 0.0001). (E) Percentage of area of expression ofMITF (empty bars), PEDF (black bars)and co-localization (grey bars) in the collection of TMAs comprising naevus and pathological stages of melanoma progression. Barsrepresent average +/- SD. (F) Percentage of biopsies displaying different degrees of co-localization (b25%, 25%-75% and N75%) of PEDFand MITF in naevus and pathological stages of melanoma progression.
Neoplasia Vol. xx, No. xx, 2014 Regulatory and functional connection of MITF and PEDF in melanoma Fernández-Barral et al. 7
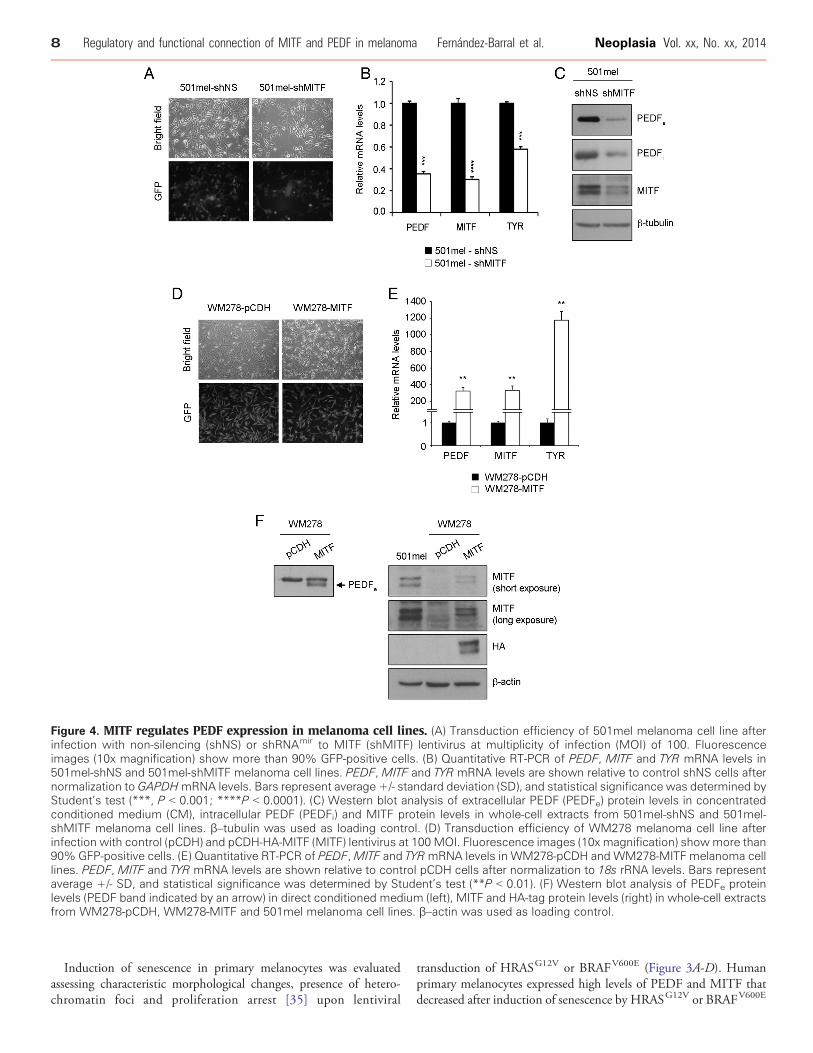
Figure 4. MITF regulates PEDF expression in melanoma cell lines. (A) Transduction efficiency of 501mel melanoma cell line afterinfection with non-silencing (shNS) or shRNAmir to MITF (shMITF) lentivirus at multiplicity of infection (MOI) of 100. Fluorescenceimages (10x magnification) show more than 90% GFP-positive cells. (B) Quantitative RT-PCR of PEDF, MITF and TYR mRNA levels in501mel-shNS and 501mel-shMITF melanoma cell lines. PEDF, MITF and TYR mRNA levels are shown relative to control shNS cells afternormalization to GAPDHmRNA levels. Bars represent average +/- standard deviation (SD), and statistical significance was determined byStudent’s test (***, P b 0.001; ****P b 0.0001). (C) Western blot analysis of extracellular PEDF (PEDFe) protein levels in concentratedconditioned medium (CM), intracellular PEDF (PEDFi) and MITF protein levels in whole-cell extracts from 501mel-shNS and 501mel-shMITF melanoma cell lines. β–tubulin was used as loading control. (D) Transduction efficiency of WM278 melanoma cell line afterinfection with control (pCDH) and pCDH-HA-MITF (MITF) lentivirus at 100 MOI. Fluorescence images (10x magnification) showmore than90% GFP-positive cells. (E) Quantitative RT-PCR of PEDF,MITF and TYRmRNA levels in WM278-pCDH and WM278-MITF melanoma celllines. PEDF, MITF and TYR mRNA levels are shown relative to control pCDH cells after normalization to 18s rRNA levels. Bars representaverage +/- SD, and statistical significance was determined by Student’s test (**P b 0.01). (F) Western blot analysis of PEDFe proteinlevels (PEDF band indicated by an arrow) in direct conditioned medium (left), MITF and HA-tag protein levels (right) in whole-cell extractsfrom WM278-pCDH, WM278-MITF and 501mel melanoma cell lines. β–actin was used as loading control.
8 Regulatory and functional connection of MITF and PEDF in melanoma Fernández-Barral et al. Neoplasia Vol. xx, No. xx, 2014
Induction of senescence in primary melanocytes was evaluatedassessing characteristic morphological changes, presence of hetero-chromatin foci and proliferation arrest [35] upon lentiviral
transduction of HRASG12V or BRAFV600E (Figure 3A-D). Humanprimary melanocytes expressed high levels of PEDF and MITF thatdecreased after induction of senescence by HRASG12V or BRAFV600E
Neoplasia Vol. xx, No. xx, 2014 Regulatory and functional connection of MITF and PEDF in melanoma Fernández-Barral et al. 9
(Figure 3E-G). Down-regulation of both intracellular and secretedPEDF, as well as MITF protein was detected by western blot(Figure 3E). p16INK4A was used as a marker of senescence in thisanalysis [36] (Figure 3E). The changes in protein caused by OIS inprimary melanocytes were paralleled by decreased PEDF and MITFmRNA levels as shown by quantitative RT-PCR (Figure 3F-G).These results, together with the data from naevus, confirm that
PEDF and MITF expression are regulated with the same trend duringmelanocyte senescence, both in vitro and in vivo.
MITF Regulates PEDF Expression in Melanoma Cell Linesand Primary MelanocytesTo directly address the existence of a regulatory link between
MITF and PEDF, we silenced MITF by lentiviral transduction of ashRNAmir specific for MITF in the following weakly aggressivemelanoma cell lines expressing high PEDF and MITF levels: 501mel(Figure 4), WM164, M000921 and WM88 (SupplementaryFigure 1). Interference of MITF led to a significant down-regulationof PEDF mRNA (Figure 4B and Supplementary Figure 1B) andprotein (Figure 4C and Supplementary Figure 1C). The extent ofPEDF down-regulation by MITF interference was similar to thedecrease in tyrosinase (TYR), a well known MITF target (Figure 4Band Supplementary Figure 1B). PEDF down-regulation by MITFinterference was confirmed with two additional shRNAmir sequencesspecific to MITF (data not shown).Primary melanocytes express high levels of PEDF, similar to levels in
the weakly aggressive melanoma cell lines. We also found that MITFinterference decreased PEDF levels in primary human melanocytes(Supplementary Figure 2).Conversely, MITF over-expression by lentiviral transduction of
pCDH-HA-MITF in the WM278 melanoma cell line (which doesnot express significant levels of MITF and PEDF mRNA) resulted inincreased mRNA and protein PEDF levels (PEDF band in WM278cell line is indicated by an arrow) (Figure 4D-F).
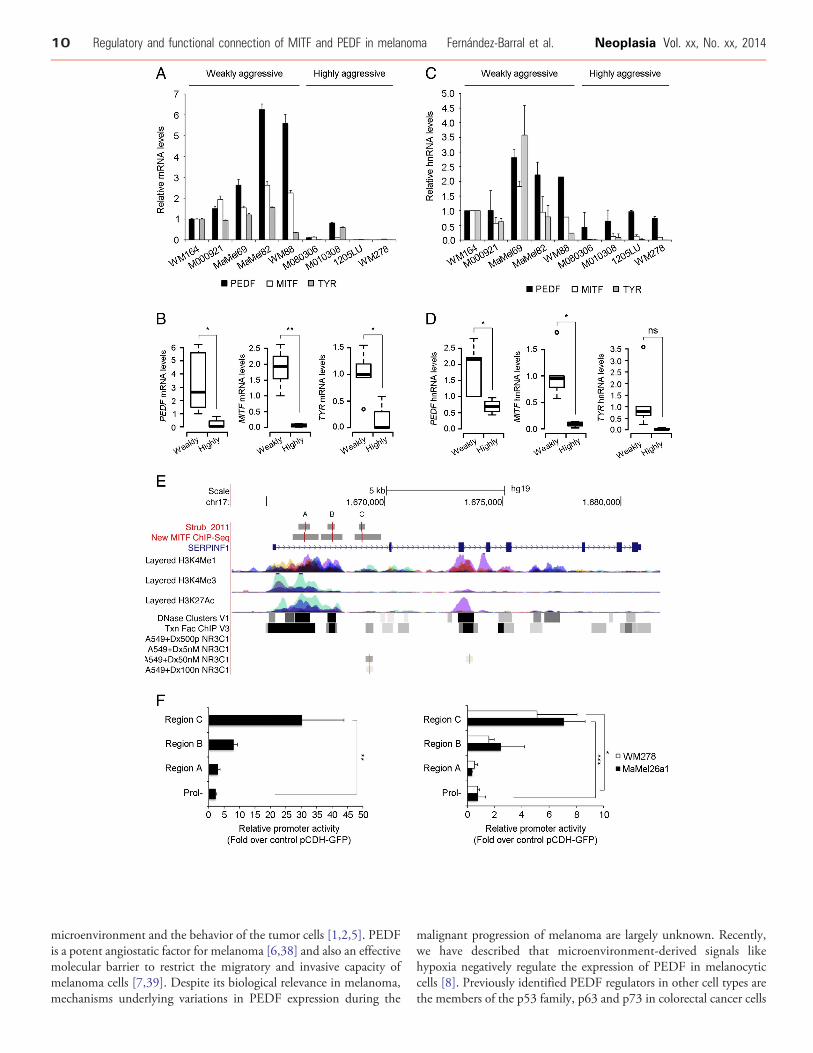
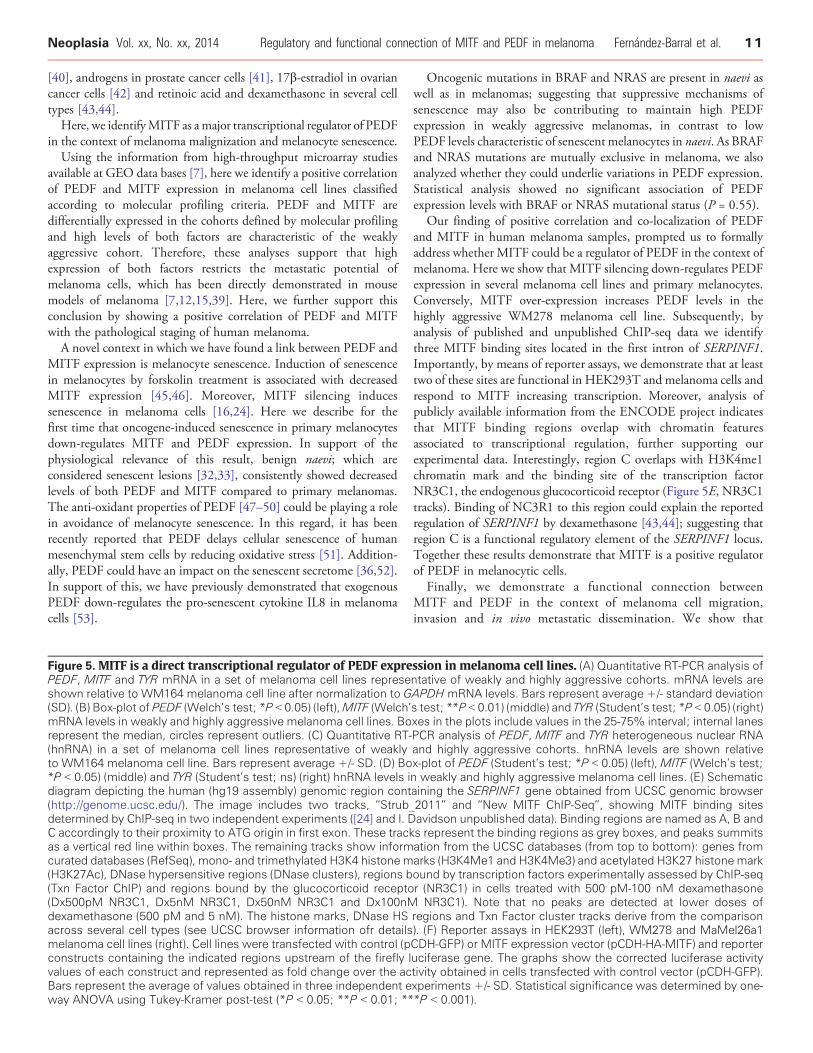
PEDF is a Direct Target of MITF in Human Melanoma CellsWe next tested the hypothesis that PEDF is a direct transcriptional
target of MITF. Changes in gene expression due to increasedtranscription rate are expected to be accompanied by increasedheterogeneous nuclear RNA (hnRNA), whereas changes due toincreased half-life of mRNA should not have an impact on hnRNAlevels. Therefore, we compared levels of hnRNA in a small collectionof melanoma cell lines representative of the weakly and highlyaggressive cohorts. As expected, mRNA levels of PEDF, MITF andthe MITF-target gene TYR were significantly higher in the weaklyaggressive cohort than in the highly aggressive cohort (Figure 5A-B).PEDF and MITF hnRNA levels were significantly decreased in thehighly aggressive melanoma cell lines compared to the weaklyaggressive lines (Figure 5C-D), consistent with transcriptionalregulation. In agreement with the proposed role for MITF in thetranscriptional regulation of TYR, we found the expected trend inhnRNA and mRNA, although it did not reach statistical significancedue to the high TYR hnRNA levels in one sample (MaMel69)(Figure 5C-D).To directly address the transcriptional regulation of PEDF by
MITF, we analyzed the data from a recently published MITF ChIP-Seq (chromatin immunoprecipitation followed by high-throughputsequencing) study [24] to identify MITF binding sites in the SER-PINF1 locus. Three peaks of MITF binding were observed within the
first intron of the SERPINF1 locus (Figure 5E, “Strub2011” track).The binding of MITF to these three regions was confirmed by theanalysis of the unpublished data from an independent ChIP-Seqexperiment (Figure 5E, “New_MITF_ChIP-Seq” track). Important-ly, these MITF binding sites lie within regions probably involved inthe regulation of the expression of this locus as indicated by theirsensitivity to DNase I (“DNase Clusters” track), presence ofexperimentally determined binding sites for multiple transcriptionfactors (“Txn Factor ChIP” track), pattern of H3K27 acetylation(“Layered H3K27Ac” track) and pattern of H3K4 methylation(“Layered H3K4Me1” and “Layered H3K4Me3” tracks).Finally, we performed reporter assays in HEK293T and two
aggressive melanoma cell lines (WM278 and MaMel26a1), which donot express detectable levels of MITF and PEDF, to analyze thefunctionality of the three binding regions identified by ChIP-Seq. Allthree regions had the ability to increase the basal transcription of theluciferase reporter gene under the control of a minimal promoter (datanot shown). However, only regions B and C, responded to exogenousMITF (Figure 5F). Although, both regions B and C increased thetranscription of the reporter gene in response to MITF in HEK293Tand the two melanoma cell lines tested, the differences reachedstatistical significance only in the case of region C (Figure 5F).
Altogether these results demonstrate that MITF regulates PEDFtranscription through direct binding to regulatory regions in the firstintron of SERPINF1 gene encoding for PEDF.
PEDF Mediates MITF Effects on Migration and Invasion ofMelanoma Cells
Regulation of the migratory and invasive potential of melanomacells is a fundamental driver of melanoma progression. Therefore, weexplored a possible functional connection between MITF and PEDFin the control of melanoma cell migration and invasion. Wepreviously demonstrated that PEDF silencing consistently increasesmigration and invasion capacity of melanocytes and melanoma cells[7]. An analogous increase of the migratory ability of melanoma cellswas consistently observed with MITF silencing [12,37] in severalmelanoma cell lines (Figure 6A and Supplementary Figure 3),pointing to a possible functional role for the MITF-PEDF axis.
We next studied whether exogenous PEDF expression couldbypass the increased migration and invasion induced by MITFsilencing. To this end we transduced 501mel cells with lentivirus-PEDF followed by MITF silencing by lentiviral transduction ofshRNAmir specific to MITF (Figure 6B-C). Figure 6D-E show thatexogenous PEDF expression efficiently blocks activation of migrationand invasion induced by MITF interference in 501mel cells,indicating that the effect of MITF in migration and invasion ofmelanoma cells is mediated, at least in part, by the regulationof PEDF.
To further strengthen the functional connection between MITFand PEDF and the relevance of the MITF-PEDF axis in the biologyof melanoma progression we have used the zebrafish metastasismodel. Figure 7 shows that silencing of MITF (501mel-GFP-shMITF cells) increases the number of disseminated cells, whilesimultaneous expression of exogenous PEDF (501mel-PEDF-shMITF cells) efficiently counteracts this functional effect.
DiscussionPEDF has emerged over the last decade as a dual action factor,with a potent capacity to simultaneously modify the tumor
10 Regulatory and functional connection of MITF and PEDF in melanoma Fernández-Barral et al. Neoplasia Vol. xx, No. xx, 2014
microenvironment and the behavior of the tumor cells [1,2,5]. PEDFis a potent angiostatic factor for melanoma [6,38] and also an effectivemolecular barrier to restrict the migratory and invasive capacity ofmelanoma cells [7,39]. Despite its biological relevance in melanoma,mechanisms underlying variations in PEDF expression during the
malignant progression of melanoma are largely unknown. Recently,we have described that microenvironment-derived signals likehypoxia negatively regulate the expression of PEDF in melanocyticcells [8]. Previously identified PEDF regulators in other cell types arethe members of the p53 family, p63 and p73 in colorectal cancer cells
Neoplasia Vol. xx, No. xx, 2014 Regulatory and functional connection of MITF and PEDF in melanoma Fernández-Barral et al. 11
[40], androgens in prostate cancer cells [41], 17β-estradiol in ovariancancer cells [42] and retinoic acid and dexamethasone in several celltypes [43,44].Here, we identifyMITF as amajor transcriptional regulator of PEDF
in the context of melanoma malignization and melanocyte senescence.Using the information from high-throughput microarray studies
available at GEO data bases [7], here we identify a positive correlationof PEDF and MITF expression in melanoma cell lines classifiedaccording to molecular profiling criteria. PEDF and MITF aredifferentially expressed in the cohorts defined by molecular profilingand high levels of both factors are characteristic of the weaklyaggressive cohort. Therefore, these analyses support that highexpression of both factors restricts the metastatic potential ofmelanoma cells, which has been directly demonstrated in mousemodels of melanoma [7,12,15,39]. Here, we further support thisconclusion by showing a positive correlation of PEDF and MITFwith the pathological staging of human melanoma.A novel context in which we have found a link between PEDF and
MITF expression is melanocyte senescence. Induction of senescencein melanocytes by forskolin treatment is associated with decreasedMITF expression [45,46]. Moreover, MITF silencing inducessenescence in melanoma cells [16,24]. Here we describe for thefirst time that oncogene-induced senescence in primary melanocytesdown-regulates MITF and PEDF expression. In support of thephysiological relevance of this result, benign naevi; which areconsidered senescent lesions [32,33], consistently showed decreasedlevels of both PEDF and MITF compared to primary melanomas.The anti-oxidant properties of PEDF [47–50] could be playing a rolein avoidance of melanocyte senescence. In this regard, it has beenrecently reported that PEDF delays cellular senescence of humanmesenchymal stem cells by reducing oxidative stress [51]. Addition-ally, PEDF could have an impact on the senescent secretome [36,52].In support of this, we have previously demonstrated that exogenousPEDF down-regulates the pro-senescent cytokine IL8 in melanomacells [53].
Figure 5. MITF is a direct transcriptional regulator of PEDF exprePEDF, MITF and TYR mRNA in a set of melanoma cell lines represeshown relative to WM164 melanoma cell line after normalization to G(SD). (B) Box-plot of PEDF (Welch’s test; *P b 0.05) (left),MITF (Welch’mRNA levels in weakly and highly aggressive melanoma cell lines. Borepresent the median, circles represent outliers. (C) Quantitative RT-(hnRNA) in a set of melanoma cell lines representative of weaklyto WM164 melanoma cell line. Bars represent average +/- SD. (D) Bo*P b 0.05) (middle) and TYR (Student’s test; ns) (right) hnRNA levels idiagram depicting the human (hg19 assembly) genomic region cont(http://genome.ucsc.edu/). The image includes two tracks, “Strub_determined by ChIP-seq in two independent experiments ([24] and I. DC accordingly to their proximity to ATG origin in first exon. These trackas a vertical red line within boxes. The remaining tracks show informcurated databases (RefSeq), mono- and trimethylated H3K4 histone m(H3K27Ac), DNase hypersensitive regions (DNase clusters), regions b(Txn Factor ChIP) and regions bound by the glucocorticoid recepto(Dx500pM NR3C1, Dx5nM NR3C1, Dx50nM NR3C1 and Dx100nMdexamethasone (500 pM and 5 nM). The histone marks, DNase HSacross several cell types (see UCSC browser information ofr detailsmelanoma cell lines (right). Cell lines were transfected with control (pconstructs containing the indicated regions upstream of the firefly lvalues of each construct and represented as fold change over the acBars represent the average of values obtained in three independent eway ANOVA using Tukey-Kramer post-test (*P b 0.05; **P b 0.01; **
Oncogenic mutations in BRAF and NRAS are present in naevi aswell as in melanomas; suggesting that suppressive mechanisms ofsenescence may also be contributing to maintain high PEDFexpression in weakly aggressive melanomas, in contrast to lowPEDF levels characteristic of senescent melanocytes in naevi. As BRAFand NRAS mutations are mutually exclusive in melanoma, we alsoanalyzed whether they could underlie variations in PEDF expression.Statistical analysis showed no significant association of PEDFexpression levels with BRAF or NRAS mutational status (P = 0.55).
Our finding of positive correlation and co-localization of PEDFand MITF in human melanoma samples, prompted us to formallyaddress whether MITF could be a regulator of PEDF in the context ofmelanoma. Here we show that MITF silencing down-regulates PEDFexpression in several melanoma cell lines and primary melanocytes.Conversely, MITF over-expression increases PEDF levels in thehighly aggressive WM278 melanoma cell line. Subsequently, byanalysis of published and unpublished ChIP-seq data we identifythree MITF binding sites located in the first intron of SERPINF1.Importantly, by means of reporter assays, we demonstrate that at leasttwo of these sites are functional in HEK293T and melanoma cells andrespond to MITF increasing transcription. Moreover, analysis ofpublicly available information from the ENCODE project indicatesthat MITF binding regions overlap with chromatin featuresassociated to transcriptional regulation, further supporting ourexperimental data. Interestingly, region C overlaps with H3K4me1chromatin mark and the binding site of the transcription factorNR3C1, the endogenous glucocorticoid receptor (Figure 5E, NR3C1tracks). Binding of NC3R1 to this region could explain the reportedregulation of SERPINF1 by dexamethasone [43,44]; suggesting thatregion C is a functional regulatory element of the SERPINF1 locus.Together these results demonstrate that MITF is a positive regulatorof PEDF in melanocytic cells.
Finally, we demonstrate a functional connection betweenMITF and PEDF in the context of melanoma cell migration,invasion and in vivo metastatic dissemination. We show that
ssion in melanoma cell lines. (A) Quantitative RT-PCR analysis ofntative of weakly and highly aggressive cohorts. mRNA levels areAPDH mRNA levels. Bars represent average +/- standard deviations test; **P b 0.01) (middle) and TYR (Student’s test; *P b 0.05) (right)xes in the plots include values in the 25-75% interval; internal lanesPCR analysis of PEDF, MITF and TYR heterogeneous nuclear RNAand highly aggressive cohorts. hnRNA levels are shown relativex-plot of PEDF (Student’s test; *P b 0.05) (left), MITF (Welch’s test;n weakly and highly aggressive melanoma cell lines. (E) Schematicaining the SERPINF1 gene obtained from UCSC genomic browser2011” and “New MITF ChIP-Seq”, showing MITF binding sitesavidson unpublished data). Binding regions are named as A, B ands represent the binding regions as grey boxes, and peaks summitsation from the UCSC databases (from top to bottom): genes fromarks (H3K4Me1 and H3K4Me3) and acetylated H3K27 histone markound by transcription factors experimentally assessed by ChIP-seqr (NR3C1) in cells treated with 500 pM-100 nM dexamethasoneNR3C1). Note that no peaks are detected at lower doses of
regions and Txn Factor cluster tracks derive from the comparison). (F) Reporter assays in HEK293T (left), WM278 and MaMel26a1CDH-GFP) or MITF expression vector (pCDH-HA-MITF) and reporteruciferase gene. The graphs show the corrected luciferase activitytivity obtained in cells transfected with control vector (pCDH-GFP).xperiments +/- SD. Statistical significance was determined by one-*P b 0.001).
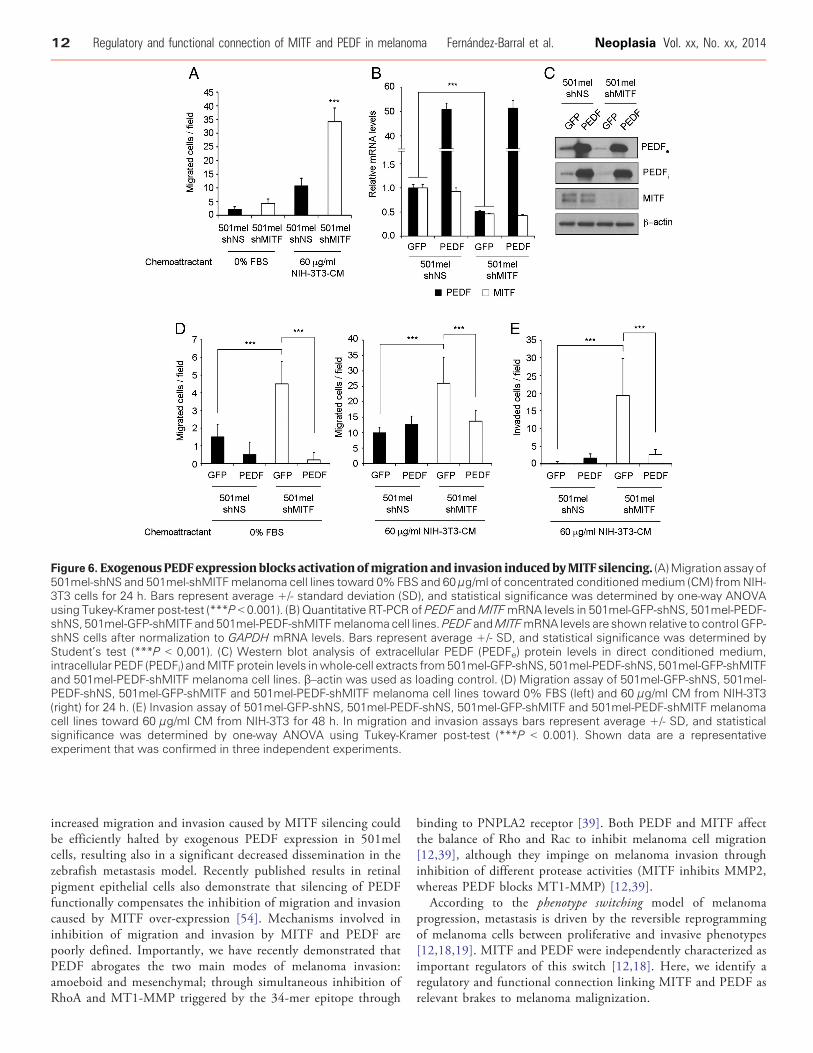
Figure 6. ExogenousPEDF expression blocks activationofmigration and invasion inducedbyMITF silencing. (A)Migration assay of501mel-shNS and 501mel-shMITFmelanoma cell lines toward 0% FBS and 60 μg/ml of concentrated conditionedmedium (CM) fromNIH-3T3 cells for 24 h. Bars represent average +/- standard deviation (SD), and statistical significance was determined by one-way ANOVAusing Tukey-Kramer post-test (***P b 0.001). (B) Quantitative RT-PCR of PEDF andMITFmRNA levels in 501mel-GFP-shNS, 501mel-PEDF-shNS, 501mel-GFP-shMITF and 501mel-PEDF-shMITFmelanoma cell lines.PEDF andMITFmRNA levels are shown relative to control GFP-shNS cells after normalization to GAPDH mRNA levels. Bars represent average +/- SD, and statistical significance was determined byStudent’s test (***P b 0,001). (C) Western blot analysis of extracellular PEDF (PEDFe) protein levels in direct conditioned medium,intracellular PEDF (PEDFi) andMITF protein levels inwhole-cell extracts from501mel-GFP-shNS, 501mel-PEDF-shNS, 501mel-GFP-shMITFand 501mel-PEDF-shMITF melanoma cell lines. β–actin was used as loading control. (D) Migration assay of 501mel-GFP-shNS, 501mel-PEDF-shNS, 501mel-GFP-shMITF and 501mel-PEDF-shMITF melanoma cell lines toward 0% FBS (left) and 60 μg/ml CM from NIH-3T3(right) for 24 h. (E) Invasion assay of 501mel-GFP-shNS, 501mel-PEDF-shNS, 501mel-GFP-shMITF and 501mel-PEDF-shMITF melanomacell lines toward 60 μg/ml CM from NIH-3T3 for 48 h. In migration and invasion assays bars represent average +/- SD, and statisticalsignificance was determined by one-way ANOVA using Tukey-Kramer post-test (***P b 0.001). Shown data are a representativeexperiment that was confirmed in three independent experiments.
12 Regulatory and functional connection of MITF and PEDF in melanoma Fernández-Barral et al. Neoplasia Vol. xx, No. xx, 2014
increased migration and invasion caused by MITF silencing couldbe efficiently halted by exogenous PEDF expression in 501melcells, resulting also in a significant decreased dissemination in thezebrafish metastasis model. Recently published results in retinalpigment epithelial cells also demonstrate that silencing of PEDFfunctionally compensates the inhibition of migration and invasioncaused by MITF over-expression [54]. Mechanisms involved ininhibition of migration and invasion by MITF and PEDF arepoorly defined. Importantly, we have recently demonstrated thatPEDF abrogates the two main modes of melanoma invasion:amoeboid and mesenchymal; through simultaneous inhibition ofRhoA and MT1-MMP triggered by the 34-mer epitope through
binding to PNPLA2 receptor [39]. Both PEDF and MITF affectthe balance of Rho and Rac to inhibit melanoma cell migration[12,39], although they impinge on melanoma invasion throughinhibition of different protease activities (MITF inhibits MMP2,whereas PEDF blocks MT1-MMP) [12,39].
According to the phenotype switching model of melanomaprogression, metastasis is driven by the reversible reprogrammingof melanoma cells between proliferative and invasive phenotypes[12,18,19]. MITF and PEDF were independently characterized asimportant regulators of this switch [12,18]. Here, we identify aregulatory and functional connection linking MITF and PEDF asrelevant brakes to melanoma malignization.
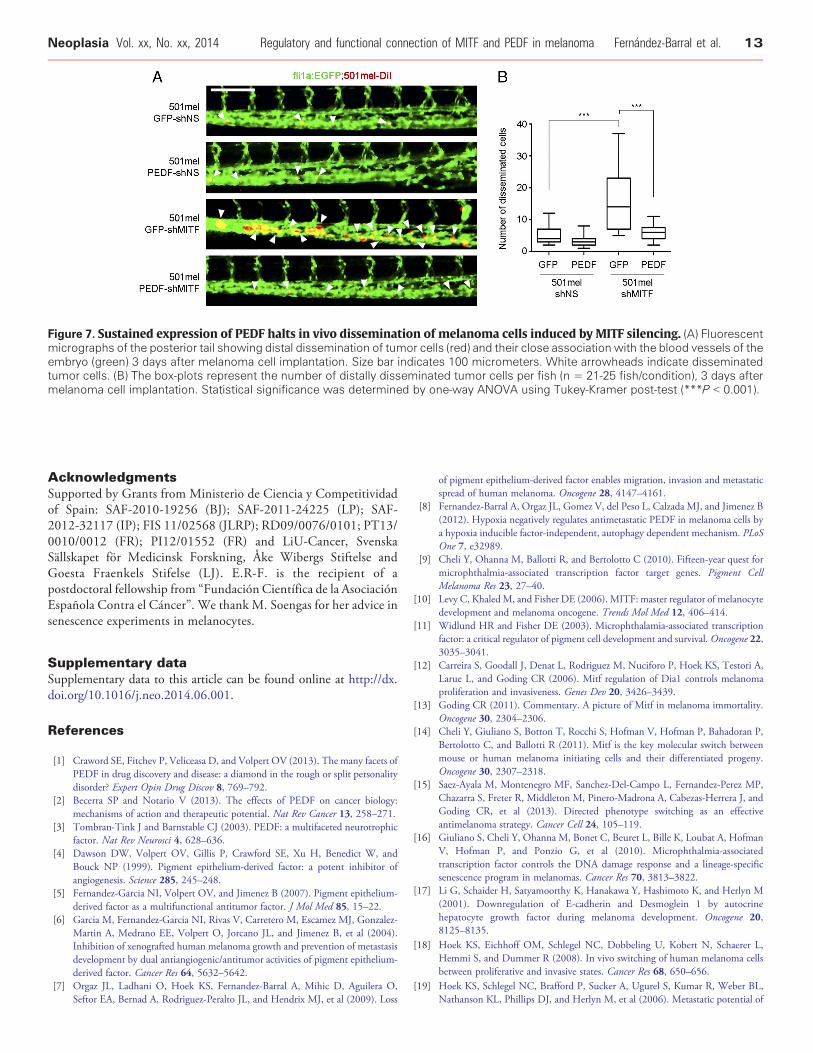
Figure 7. Sustained expression of PEDF halts in vivo dissemination of melanoma cells induced by MITF silencing. (A) Fluorescentmicrographs of the posterior tail showing distal dissemination of tumor cells (red) and their close association with the blood vessels of theembryo (green) 3 days after melanoma cell implantation. Size bar indicates 100 micrometers. White arrowheads indicate disseminatedtumor cells. (B) The box-plots represent the number of distally disseminated tumor cells per fish (n = 21-25 fish/condition), 3 days aftermelanoma cell implantation. Statistical significance was determined by one-way ANOVA using Tukey-Kramer post-test (***P b 0.001).
Neoplasia Vol. xx, No. xx, 2014 Regulatory and functional connection of MITF and PEDF in melanoma Fernández-Barral et al. 13
AcknowledgmentsSupported by Grants from Ministerio de Ciencia y Competitividadof Spain: SAF-2010-19256 (BJ); SAF-2011-24225 (LP); SAF-2012-32117 (IP); FIS 11/02568 (JLRP); RD09/0076/0101; PT13/0010/0012 (FR); PI12/01552 (FR) and LiU-Cancer, SvenskaSällskapet för Medicinsk Forskning, Åke Wibergs Stiftelse andGoesta Fraenkels Stifelse (LJ). E.R-F. is the recipient of apostdoctoral fellowship from “Fundación Científica de la AsociaciónEspañola Contra el Cáncer”. We thank M. Soengas for her advice insenescence experiments in melanocytes.
Supplementary dataSupplementary data to this article can be found online at http://dx.doi.org/10.1016/j.neo.2014.06.001.
References
[1] Craword SE, Fitchev P, Veliceasa D, and Volpert OV (2013). The many facets ofPEDF in drug discovery and disease: a diamond in the rough or split personalitydisorder? Expert Opin Drug Discov 8, 769–792.
[2] Becerra SP and Notario V (2013). The effects of PEDF on cancer biology:mechanisms of action and therapeutic potential. Nat Rev Cancer 13, 258–271.
[3] Tombran-Tink J and Barnstable CJ (2003). PEDF: a multifaceted neurotrophicfactor. Nat Rev Neurosci 4, 628–636.
[4] Dawson DW, Volpert OV, Gillis P, Crawford SE, Xu H, Benedict W, andBouck NP (1999). Pigment epithelium-derived factor: a potent inhibitor ofangiogenesis. Science 285, 245–248.
[5] Fernandez-Garcia NI, Volpert OV, and Jimenez B (2007). Pigment epithelium-derived factor as a multifunctional antitumor factor. J Mol Med 85, 15–22.
[6] Garcia M, Fernandez-Garcia NI, Rivas V, Carretero M, Escamez MJ, Gonzalez-Martin A, Medrano EE, Volpert O, Jorcano JL, and Jimenez B, et al (2004).Inhibition of xenografted human melanoma growth and prevention of metastasisdevelopment by dual antiangiogenic/antitumor activities of pigment epithelium-derived factor. Cancer Res 64, 5632–5642.
[7] Orgaz JL, Ladhani O, Hoek KS, Fernandez-Barral A, Mihic D, Aguilera O,Seftor EA, Bernad A, Rodriguez-Peralto JL, and Hendrix MJ, et al (2009). Loss
of pigment epithelium-derived factor enables migration, invasion and metastaticspread of human melanoma. Oncogene 28, 4147–4161.
[8] Fernandez-Barral A, Orgaz JL, Gomez V, del Peso L, Calzada MJ, and Jimenez B(2012). Hypoxia negatively regulates antimetastatic PEDF in melanoma cells bya hypoxia inducible factor-independent, autophagy dependent mechanism. PLoSOne 7, e32989.
[9] Cheli Y, Ohanna M, Ballotti R, and Bertolotto C (2010). Fifteen-year quest formicrophthalmia-associated transcription factor target genes. Pigment CellMelanoma Res 23, 27–40.
[10] Levy C, KhaledM, and Fisher DE (2006). MITF: master regulator of melanocytedevelopment and melanoma oncogene. Trends Mol Med 12, 406–414.
[11] Widlund HR and Fisher DE (2003). Microphthalamia-associated transcriptionfactor: a critical regulator of pigment cell development and survival. Oncogene 22,3035–3041.
[12] Carreira S, Goodall J, Denat L, Rodriguez M, Nuciforo P, Hoek KS, Testori A,Larue L, and Goding CR (2006). Mitf regulation of Dia1 controls melanomaproliferation and invasiveness. Genes Dev 20, 3426–3439.
[13] Goding CR (2011). Commentary. A picture of Mitf in melanoma immortality.Oncogene 30, 2304–2306.
[14] Cheli Y, Giuliano S, Botton T, Rocchi S, Hofman V, Hofman P, Bahadoran P,Bertolotto C, and Ballotti R (2011). Mitf is the key molecular switch betweenmouse or human melanoma initiating cells and their differentiated progeny.Oncogene 30, 2307–2318.
[15] Saez-Ayala M, Montenegro MF, Sanchez-Del-Campo L, Fernandez-Perez MP,Chazarra S, Freter R, Middleton M, Pinero-Madrona A, Cabezas-Herrera J, andGoding CR, et al (2013). Directed phenotype switching as an effectiveantimelanoma strategy. Cancer Cell 24, 105–119.
[16] Giuliano S, Cheli Y, Ohanna M, Bonet C, Beuret L, Bille K, Loubat A, HofmanV, Hofman P, and Ponzio G, et al (2010). Microphthalmia-associatedtranscription factor controls the DNA damage response and a lineage-specificsenescence program in melanomas. Cancer Res 70, 3813–3822.
[17] Li G, Schaider H, Satyamoorthy K, Hanakawa Y, Hashimoto K, and Herlyn M(2001). Downregulation of E-cadherin and Desmoglein 1 by autocrinehepatocyte growth factor during melanoma development. Oncogene 20,8125–8135.
[18] Hoek KS, Eichhoff OM, Schlegel NC, Dobbeling U, Kobert N, Schaerer L,Hemmi S, and Dummer R (2008). In vivo switching of human melanoma cellsbetween proliferative and invasive states. Cancer Res 68, 650–656.
[19] Hoek KS, Schlegel NC, Brafford P, Sucker A, Ugurel S, Kumar R, Weber BL,Nathanson KL, Phillips DJ, and Herlyn M, et al (2006). Metastatic potential of
14 Regulatory and functional connection of MITF and PEDF in melanoma Fernández-Barral et al. Neoplasia Vol. xx, No. xx, 2014
melanomas defined by specific gene expression profiles with no BRAF signature.Pigment Cell Res 19, 290–302.
[20] Fernandez-Garcia NI, Palmer HG, Garcia M, Gonzalez-Martin A, del Rio M,Barettino D, Volpert O, Munoz A, and Jimenez B (2005). 1alpha,25-Dihydroxyvitamin D3 regulates the expression of Id1 and Id2 genes and theangiogenic phenotype of human colon carcinoma cells.Oncogene 24, 6533–6544.
[21] Scurr LL, Pupo GM, Becker TM, Lai K, Schrama D, Haferkamp S, Irvine M,Scolyer RA, Mann GJ, and Becker JC, et al (2010). IGFBP7 is not required forB-RAF-induced melanocyte senescence. Cell 141, 717–727.
[22] Rouhi P, Jensen LD, Cao Z, Hosaka K, Lanne T, Wahlberg E, Steffensen JF, andCao Y (2010). Hypoxia-induced metastasis model in embryonic zebrafish. NatProtoc 5, 1911–1918.
[23] Rouhi P, Lee SL, Cao Z, Hedlund EM, Jensen LD, and Cao Y (2010).Pathological angiogenesis facilitates tumor cell dissemination and metastasis. CellCycle 9, 913–917.
[24] Strub T, Giuliano S, Ye T, Bonet C, Keime C, Kobi D, Le Gras S, Cormont M,Ballotti R, and Bertolotto C, et al (2011). Essential role of microphthalmiatranscription factor for DNA replication, mitosis and genomic stability inmelanoma. Oncogene 30, 2319–2332.
[25] Delacroix L, Moutier E, Altobelli G, Legras S, Poch O, Choukrallah MA, BertinI, Jost B, and Davidson I (2010). Cell-specific interaction of retinoic acidreceptors with target genes in mouse embryonic fibroblasts and embryonic stemcells. Mol Cell Biol 30, 231–244.
[26] Kobi D, Steunou AL, Dembele D, Legras S, Larue L, Nieto L, and Davidson I(2010). Genome-wide analysis of POU3F2/BRN2 promoter occupancy inhuman melanoma cells reveals Kitl as a novel regulated target gene. Pigment CellMelanoma Res 23, 404–418.
[27] Zhang Y, Liu T, Meyer CA, Eeckhoute J, Johnson DS, Bernstein BE, NusbaumC, Myers RM, Brown M, and Li W, et al (2008). Model-based analysis of ChIP-Seq (MACS). Genome Biol 9, R137.
[28] Krebs A, Frontini M, and Tora L (2008). GPAT: retrieval of genomic annotationfrom large genomic position datasets. BMC Bioinformatics 9, 533.
[29] Rincon M and Flavell RA (1994). AP-1 transcriptional activity requires both T-cell receptor-mediated and co-stimulatory signals in primary T lymphocytes.EMBO J 13, 4370–4381.
[30] Garraway LA, Widlund HR, Rubin MA, Getz G, Berger AJ, Ramaswamy S,Beroukhim R, Milner DA, Granter SR, and Du J, et al (2005). Integrativegenomic analyses identify MITF as a lineage survival oncogene amplified inmalignant melanoma. Nature 436, 117–122.
[31] Maldonado JL, Timmerman L, Fridlyand J, and Bastian BC (2004).Mechanisms of cell-cycle arrest in Spitz nevi with constitutive activation of theMAP-kinase pathway. Am J Pathol 164, 1783–1787.
[32] Bennett DC (2003). Human melanocyte senescence and melanoma suscepti-bility genes. Oncogene 22, 3063–3069.
[33] Pollock PM, Harper UL, Hansen KS, Yudt LM, Stark M, Robbins CM, MosesTY, Hostetter G, Wagner U, and Kakareka J, et al (2003). High frequency ofBRAF mutations in nevi. Nat Genet 33, 19–20.
[34] Miller AJ and Mihm Jr MC (2006). Melanoma. N Engl J Med 355, 51–65.[35] Haferkamp S and Rizos H (2010). Oncogene-induced senescence pathways in
melanocytes. Cell Cycle 9, 4778–4779.[36] Bansal R and Nikiforov MA (2010). Pathways of oncogene-induced senescence
in human melanocytic cells. Cell Cycle 9, 2782–2788.[37] Cheli Y, Giuliano S, Fenouille N, Allegra M, Hofman V, Hofman P, Bahadoran P,
Lacour JP, Tartare-Deckert S, and Bertolotto C, et al (2012). Hypoxia and MITFcontrol metastatic behaviour in mouse and human melanoma cells. Oncogene 31,2461–2470.
[38] Abe R, Shimizu T, Yamagishi S, Shibaki A, Amano S, Inagaki Y, Watanabe H,Sugawara H, Nakamura H, and Takeuchi M, et al (2004). Overexpression ofpigment epithelium-derived factor decreases angiogenesis and inhibits the growthof human malignant melanoma cells in vivo. Am J Pathol 164, 1225–1232.
[39] Ladhani O, Sanchez-Martinez C, Orgaz JL, Jimenez B, and Volpert OV (2011).Pigment epithelium-derived factor blocks tumor extravasation by suppressingamoeboid morphology and mesenchymal proteolysis. Neoplasia 13, 633–642.
[40] Sasaki Y, Naishiro Y, Oshima Y, Imai K, Nakamura Y, and Tokino T (2005).Identification of pigment epithelium-derived factor as a direct target of the p53family member genes. Oncogene 24, 5131–5136.
[41] Doll JA, Stellmach VM, Bouck NP, Bergh AR, Lee C, Abramson LP, CornwellML, Pins MR, Borensztajn J, and Crawford SE (2003). Pigment epithelium-derived factor regulates the vasculature and mass of the prostate and pancreas.Nat Med 9, 774–780.
[42] Cheung LW, Au SC, Cheung AN, Ngan HY, Tombran-Tink J, Auersperg N,and Wong AS (2006). Pigment epithelium-derived factor is estrogen sensitiveand inhibits the growth of human ovarian cancer and ovarian surface epithelialcells. Endocrinology 147, 4179–4191.
[43] Tombran-Tink J, Lara N, Apricio SE, Potluri P, Gee S, Ma JX, Chader G, andBarnstable CJ (2004). Retinoic acid and dexamethasone regulate the expressionof PEDF in retinal and endothelial cells. Exp Eye Res 78, 945–955.
[44] Uchida H, Hayashi H, Kuroki M, Uno K, Yamada H, Yamashita Y, Tombran-Tink J, and Oshima K (2005). Vitamin A up-regulates the expression ofthrombospondin-1 and pigment epithelium-derived factor in retinal pigmentepithelial cells. Exp Eye Res 80, 23–30.
[45] Schwahn DJ, Xu W, Herrin AB, Bales ES, and Medrano EE (2001). Tyrosinelevels regulate the melanogenic response to alpha-melanocyte-stimulatinghormone in human melanocytes: implications for pigmentation and prolifera-tion. Pigment Cell Res 14, 32–39.
[46] Schwahn DJ, Timchenko NA, Shibahara S, and Medrano EE (2005). Dynamicregulation of the human dopachrome tautomerase promoter by MITF, ER-alphaand chromatin remodelers during proliferation and senescence of humanmelanocytes. Pigment Cell Res 18, 203–213.
[47] Cao W, Tombran-Tink J, Chen W, Mrazek D, Elias R, and McGinnisJF (1999). Pigment epithelium-derived factor protects cultured retinalneurons against hydrogen peroxide-induced cell death. J Neurosci Res 57,789–800.
[48] Yamagishi S, Inagaki Y, Amano S, Okamoto T, Takeuchi M, and Makita Z(2002). Pigment epithelium-derived factor protects cultured retinal pericytesfrom advanced glycation end product-induced injury through its antioxidativeproperties. Biochem Biophys Res Commun 296, 877–882.
[49] Yamagishi S, Inagaki Y, Nakamura K, Abe R, Shimizu T, Yoshimura A, andImaizumi T (2004). Pigment epithelium-derived factor inhibits TNF-alpha-induced interleukin-6 expression in endothelial cells by suppressing NADPHoxidase-mediated reactive oxygen species generation. J Mol Cell Cardiol 37,497–506.
[50] Nakamura K, Yamagishi S, Matsui T, Yoshida T, Takenaka K, Jinnouchi Y,Yoshida Y, Ueda S, Adachi H, and Imaizumi T (2007). Pigment epithelium-derived factor inhibits neointimal hyperplasia after vascular injury by blockingNADPH oxidase-mediated reactive oxygen species generation. Am J Pathol 170,2159–2170.
[51] Cao Y, Yang T, Gu C, and Yi D (2013). Pigment epithelium-derived factordelays cellular senescence of human mesenchymal stem cells in vitro by reducingoxidative stress. Cell Biol Int. 37, 305–313.
[52] Kuilman T, Michaloglou C, Vredeveld LC, Douma S, van Doorn R, Desmet CJ,Aarden LA, Mooi WJ, and Peeper DS (2008). Oncogene-induced senescencerelayed by an interleukin-dependent inflammatory network. Cell 133, 1019–1031.
[53] Orgaz JL, Benguria A, Sanchez-Martinez C, Ladhani O, Volpert OV, andJimenez B (2011). Changes in the gene expression profile of A375 humanmelanoma cells induced by overexpression of multifunctional pigmentepithelium-derived factor. Melanoma Res 21, 285–297.
[54] Ma X, Pan L, Jin X, Dai X, Li H, Wen B, Chen Y, Ma A, Qu J, and Hou L(2012). Microphthalmia-associated transcription factor acts through PEDF toregulate RPE cell migration. Exp Cell Res 318, 251–261.
Related Documents