Journal of Neurology, Neurosurgery, and Psyy, 1980, 43, 897-906 Regulation of the firing pattern of single motor units STEEN ANDREASSEN AND ANNELISE ROSENFALCK From the Institute of Electronic Systems, Aalborg University Center, Aalborg, Denmark S U MM AR Y The normal control of force in the anterior tibial muscle was reflected by a fast regulation of the interval pattern of single motor units. Short and long intervals alternated, the correlation between successive intervals was negative and "double discharges" were present. The discharge rate at 60 % of maximal effort was at most 20 Hz. As the development of selective electrodes has made it possible to record action potentials from single motor units in man at moderate and high levels of voluntary contraction, an increasing number of workers have used "single unit recording" to study recruitment order and to describe the firing pattern during maintained contraction.'1-2 The aim of this study is to provide a description of the firing pattern of motor units in the anterior tibial muscle during constant isometric contraction. The criteria are the range of firing frequency, the variability of the interspike intervals and the serial correlation coefficient, which describes the relationship between successive intervals. Methods Recording Recordings were obtained from the anterior tibial muscle of four volunteer subjects (table). The subject was lying on a stretcher with the foot firmly strapped to a stiff force transducer. The axis of rotation of the force transducer was aligned with the ankle joint. Thereby only muscles that develop a torque around the ankle contribute to the measured force. The torque at the ankle is mainly due to the anterior tibial muscle. The torque measured by means of a strain gauge was displayed on a large galvanometer suspended in front of the subject. The subject was instructed to keep the reading of the galvanometer constant during a recording. The electromyogram (EMG) from the anterior tibial muscle was recorded with a bipolar electrode, either a "cut-end" or a "side-hole" wire electrode.13 The cut-end electrode consisted of three twisted 25 ,um enamelled stainless steel wires, insulated Address for reprint requests: Dr S Andreassen, Institute of Electronic Systems, Aalborg University Center, Box 159, DK-9100 Aalborg, Denmark. Accepted 1 April 1980 except for the end of the wire. The pair of wires was chosen that gave the most selective recording. The side-hole electrode consisted of two twisted 75 gm stainless steel wires. The wires were threaded medio-laterally across the centre of the belly of the muscle. The recording surfaces were 10-25 gim holes burnt into the Teflon insulation of the wires, with the holes about 75 gm apart. The EMG was amplified by a DISA amplifier (14A30) with pass-band 20 Hz to 10 kHz. EMG and torque were recorded simultaneously on a FM tape recorder with pass-band 0-7 kHz. During playback the force recording was low-pass filtered with an upper limiting frequency of 100 Hz. The EMG was not filtered further. About 25 recordings one to four min in duration were made in each subject in two or more sessions. From each recording a representative section of 20 s or longer was selected for measurement of interspike intervals. The sections were selected to avoid large shifts in torque and pauses in motor unit firing longer than one second. The occurrence of irregular fluctuations in torque less than 5 % was not a criterion either for selecting or rejecting a section. Twenty seconds corresponded to about 200 interspike intervals, and were the shortest recording that gave a sufficiently accurate estimate of the statistical parameters of the interspike intervals.'4 Table Maximal Torque at the ankle joint for ankle dorsiflexion Max torque Subject Sex Age Max torque Normal average Nm Nm MD 16 40 40 MR 17 60 50 SA S 24 60 61 AR $ 51 60 50 *From Asmussen and Heeb0ll-Nielsen (1961)15 897

Welcome message from author
This document is posted to help you gain knowledge. Please leave a comment to let me know what you think about it! Share it to your friends and learn new things together.
Transcript
Journal of Neurology, Neurosurgery, and Psyy, 1980, 43, 897-906
Regulation of the firing pattern of single motor unitsSTEEN ANDREASSEN AND ANNELISE ROSENFALCK
From the Institute of Electronic Systems, Aalborg University Center, Aalborg, Denmark
S U MMAR Y The normal control of force in the anterior tibial muscle was reflected by a fastregulation of the interval pattern of single motor units. Short and long intervals alternated, thecorrelation between successive intervals was negative and "double discharges" were present.The discharge rate at 60% of maximal effort was at most 20 Hz.
As the development of selective electrodes has madeit possible to record action potentials from singlemotor units in man at moderate and high levels ofvoluntary contraction, an increasing number ofworkers have used "single unit recording" to studyrecruitment order and to describe the firing patternduring maintained contraction.'1-2The aim of this study is to provide a description of
the firing pattern of motor units in the anteriortibial muscle during constant isometric contraction.The criteria are the range of firing frequency, thevariability of the interspike intervals and the serialcorrelation coefficient, which describes therelationship between successive intervals.
Methods
RecordingRecordings were obtained from the anterior tibialmuscle of four volunteer subjects (table). The subjectwas lying on a stretcher with the foot firmly strappedto a stiff force transducer. The axis of rotation of theforce transducer was aligned with the ankle joint.Thereby only muscles that develop a torque aroundthe ankle contribute to the measured force. Thetorque at the ankle is mainly due to the anteriortibial muscle. The torque measured by means of astrain gauge was displayed on a large galvanometersuspended in front of the subject. The subject wasinstructed to keep the reading of the galvanometerconstant during a recording.The electromyogram (EMG) from the anterior
tibial muscle was recorded with a bipolar electrode,either a "cut-end" or a "side-hole" wire electrode.13The cut-end electrode consisted of three twisted25 ,um enamelled stainless steel wires, insulated
Address for reprint requests: Dr S Andreassen, Institute ofElectronic Systems, Aalborg University Center, Box 159,DK-9100 Aalborg, Denmark.
Accepted 1 April 1980
except for the end of the wire. The pair of wires waschosen that gave the most selective recording.The side-hole electrode consisted of two twisted
75 gm stainless steel wires. The wires were threadedmedio-laterally across the centre of the belly of themuscle. The recording surfaces were 10-25 gim holesburnt into the Teflon insulation of the wires, withthe holes about 75 gm apart.The EMG was amplified by a DISA amplifier
(14A30) with pass-band 20 Hz to 10 kHz. EMG andtorque were recorded simultaneously on a FM taperecorder with pass-band 0-7 kHz. During playbackthe force recording was low-pass filtered with anupper limiting frequency of 100 Hz. The EMG wasnot filtered further.About 25 recordings one to four min in duration
were made in each subject in two or more sessions.From each recording a representative section of20 s or longer was selected for measurement ofinterspike intervals. The sections were selected toavoid large shifts in torque and pauses in motor unitfiring longer than one second. The occurrence ofirregular fluctuations in torque less than 5% wasnot a criterion either for selecting or rejecting asection. Twenty seconds corresponded to about200 interspike intervals, and were the shortestrecording that gave a sufficiently accurate estimateof the statistical parameters of the interspikeintervals.'4
Table Maximal Torque at the ankle joint for ankledorsiflexion
Max torqueSubject Sex Age Max torque Normal average
Nm Nm
MD 16 40 40MR 17 60 50SA S 24 60 61AR $ 51 60 50
*From Asmussen and Heeb0ll-Nielsen (1961)15897
898
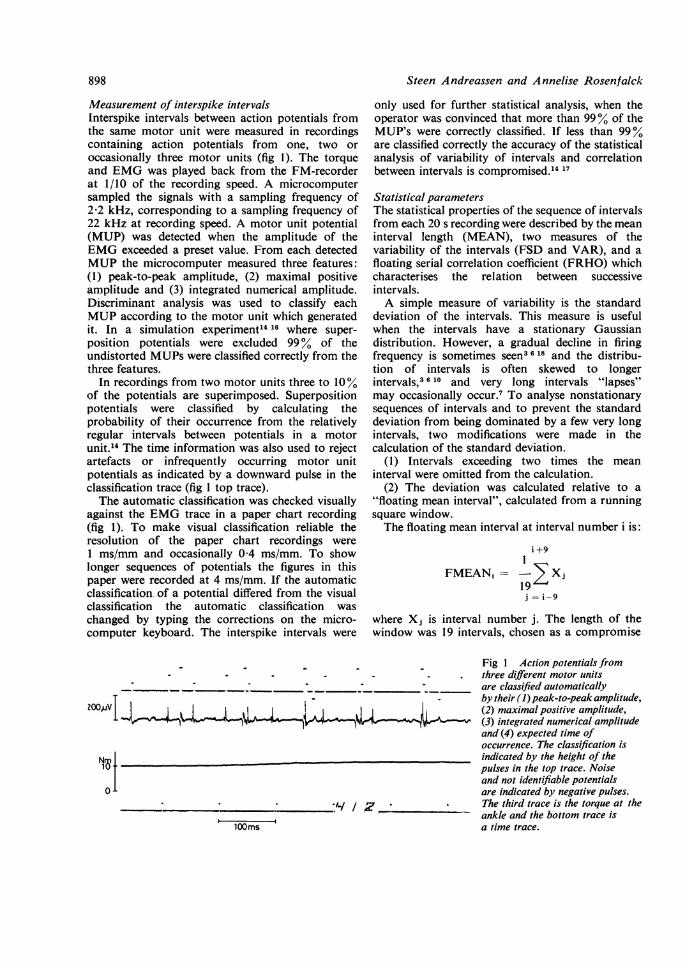
Measurement of interspike intervalsInterspike intervals between action potentials fromthe same motor unit were measured in recordingscontaining action potentials from one, two oroccasionally three motor units (fig 1). The torqueand EMG was played back from the FM-recorderat 1/10 of the recording speed. A microcomputersampled the signals with a sampling frequency of2-2 kHz, corresponding to a sampling frequency of22 kHz at recording speed. A motor unit potential(MUP) was detected when the amplitude of theEMG exceeded a preset value. From each detectedMUP the microcomputer measured three features:(1) peak-to-peak amplitude, (2) maximal positiveamplitude and (3) integrated numerical amplitude.Discriminant analysis was used to classify eachMUP according to the motor unit which generatedit. In a simulation experiment14 16 where super-position potentials were excluded 99% of theundistorted MUPs were classified correctly from thethree features.
In recordings from two motor units three to 10%of the potentials are superimposed. Superpositionpotentials were classified by calculating theprobability of their occurrence from the relativelyregular intervals between potentials in a motorunit.14 The time information was also used to rejectartefacts or infrequently occurring motor unitpotentials as indicated by a downward pulse in theclassification trace (fig 1 top trace).The automatic classification was checked visually
against the EMG trace in a paper chart recording(fig 1). To make visual classification reliable theresolution of the paper chart recordings were1 ms/mm and occasionally 0 4 ms/mm. To showlonger sequences of potentials the figures in thispaper were recorded at 4 ms/mm. If the automaticclassification. of a potential differed from the visualclassification the automatic classification waschanged by typing the corrections on the micro-computer keyboard. The interspike intervals were
Steen Andreassen and Annelise Rosenfalck
only used for further statistical analysis, when theoperator was convinced that more than 99% of theMUP's were correctly classified. If less than 99%are classified correctly the accuracy of the statisticalanalysis of variability of intervals and correlationbetween intervals is compromised.14 17
Statistical parametersThe statistical properties of the sequence of intervalsfrom each 20 s recording were described by the meaninterval length (MEAN), two measures of thevariability of the intervals (FSD and VAR), and afloating serial correlation coefficient (FRHO) whichcharacterises the relation between successiveintervals.A simple measure of variability is the standard
deviation of the intervals. This measure is usefulwhen the intervals have a stationary Gaussiandistribution. However, a gradual decline in firingfrequency is sometimes seen3 6"18 and the distribu-tion of intervals is often skewed to longerintervals,3 6 10 and very long intervals "lapses"may occasionally occur.7 To analyse nonstationarysequences of intervals and to prevent the standarddeviation from being dominated by a few very longintervals, two modifications were made in thecalculation of the standard deviation.
(1) Intervals exceeding two times the meaninterval were omitted from the calculation.
(2) The deviation was calculated relative to a"floating mean interval", calculated from a runningsquare window.The floating mean interval at interval number i is:
i+9
FMEANi=j19
j = i-9
where Xj is interval number j. The length of thewindow was 19 intervals, chosen as a compromise
Fig 1 Action potentials fromthree different motor units
_-___:_ ______ ___ are classified automaticallyby their (J) peak-to-peak amplitude,
200,uv l l I l (2) maximal positive amplitude,(3) integrated numerical amplitudeand (4) expected time ofoccurrence. The classification isindicated by the height of thepulses in the top trace. Noiseand not identifiable potentials
O are indicated by negative pulses.*y*^//z . The third trace is the torque at the
/~ 2 ankle and the bottom trace islOOms a time trace.
Regulation of the firing pattern of single motor units
A longer window will be less efficient in followingtrends in the firing frequency, and a shorter windowwill give the "floating serial correlation coefficient"(FRHO) (see below) a large negative bias. Simula-tion experiments showed that the bias of FRHOwas less than -010 when 19 intervals were used.The "floating standard deviation" was thencalculated as
N
FSD2 = (Xi-FMEAN )2
N-1
where N is the number of intervals.Another measure of variability is VAR, as
suggested by Prochazka et al.19 VAR measures thevariability between successive intervals
N-11 Xi- Xi+1
VAR= ZN-1 (Xi + Xi+j)/2
i=l
To compare this measure of variability with FSD,the variation VARI was introduced, defined as theproduct of VAR and the mean interval
VARI = VAR x MEAN
A more detailed characterisation of the relationbetween successive intervals is provided by the serialcorrelation coefficient RHO
N-11
RHO = (Xi-MEAN)(Xj+1- MEAN)/SD2N-1
i=l
A floating serial correlation coefficient FRHO iscalculated with the same corrections as made in thecalculation of FSD
N-1
FRHO= (Xi - FMEANi)N-I
i=1
(Xi+,- FMEANi+)/FSD2]
Results
Firing-rates Ninety-seven recordings 20 s or morein duration were obtained from 71 motor units. Thevariation in torque was less than ± 5 %. The mean
100
10
0
0 0
0
CD A
x A 0 0 A
0 0E0
\!Xx0 0
xxZs0oc 0 Tx x%x 0 AA0n
x a
x x0
0 0x xx\
A 0 0A
0 0 0 m m003
0
A 0
40 60Mean Interval (ms)
80 100 120 140 160
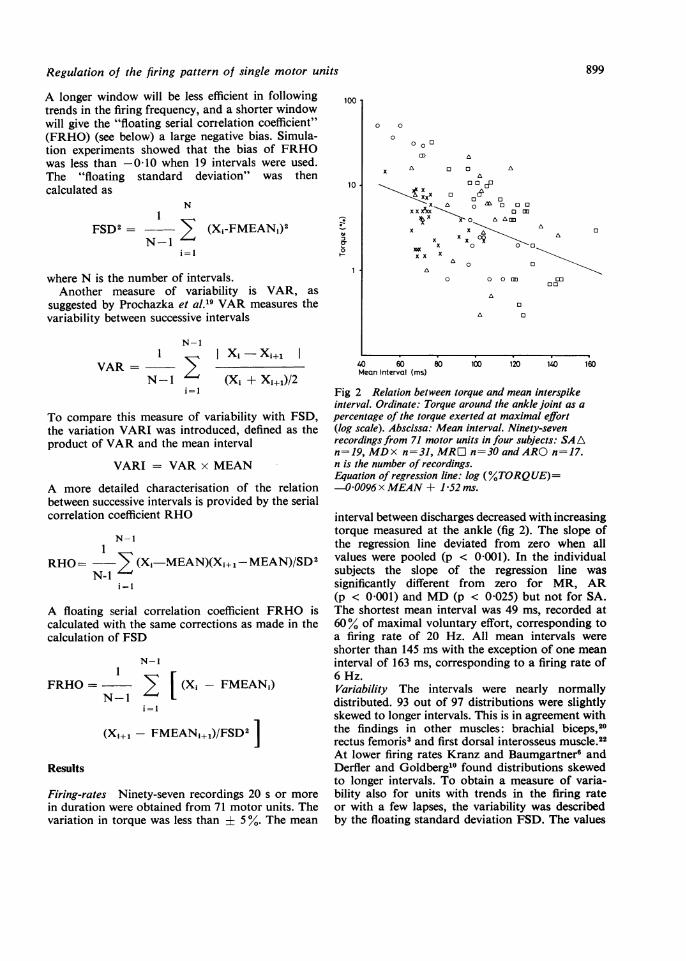
Fig 2 Relation between torque and mean interspikeinterval. Ordinate: Torque around the ankle joint as apercentage of the torque exerted at maximal effort(log scale). Abscissa: Mean interval. Ninety-sevenrecordings from 71 motor units in four subjects: SA An=19, MDx n=31, MRD n=30 and ARO n=17.n is the number of recordings.Equation of regression line: log (%TORQUE)=-0096x MEAN+1±52ms.
interval between discharges decreased with increasingtorque measured at the ankle (fig 2). The slope ofthe regression line deviated from zero when allvalues were pooled (p < 0-001). In the individualsubjects the slope of the regression line wassignificantly different from zero for MR, AR(p < 0-001) and MD (p < 0-025) but not for SA.The shortest mean interval was 49 ms, recorded at60% of maximal voluntary effort, corresponding toa firing rate of 20 Hz. All mean intervals wereshorter than 145 ms with the exception of one meaninterval of 163 ms, corresponding to a firing rate of6 Hz.Variability The intervals were nearly normallydistributed. 93 out of 97 distributions were slightlyskewed to longer intervals. This is in agreement withthe findings in other muscles: brachial biceps,20rectus femoris3 and first dorsal interosseus muscle.22At lower firing rates Kranz and Baumgartner6 andDerfler and Goldberg'0 found distributions skewedto longer intervals. To obtain a measure of varia-bility also for units with trends in the firing rateor with a few lapses, the variability was describedby the floating standard deviation FSD. The values
899
Steen Andreassen and Annelise Rosenfalck
0
A
0] 0
A
0 o0o o /
o 4600
X 0 AXo ,X
xx000XXx
:0 0
VAR
ol a
5 10
17
0l15.
n
20
10
40 60 80 100 120 140 160Mecin interval (ms)
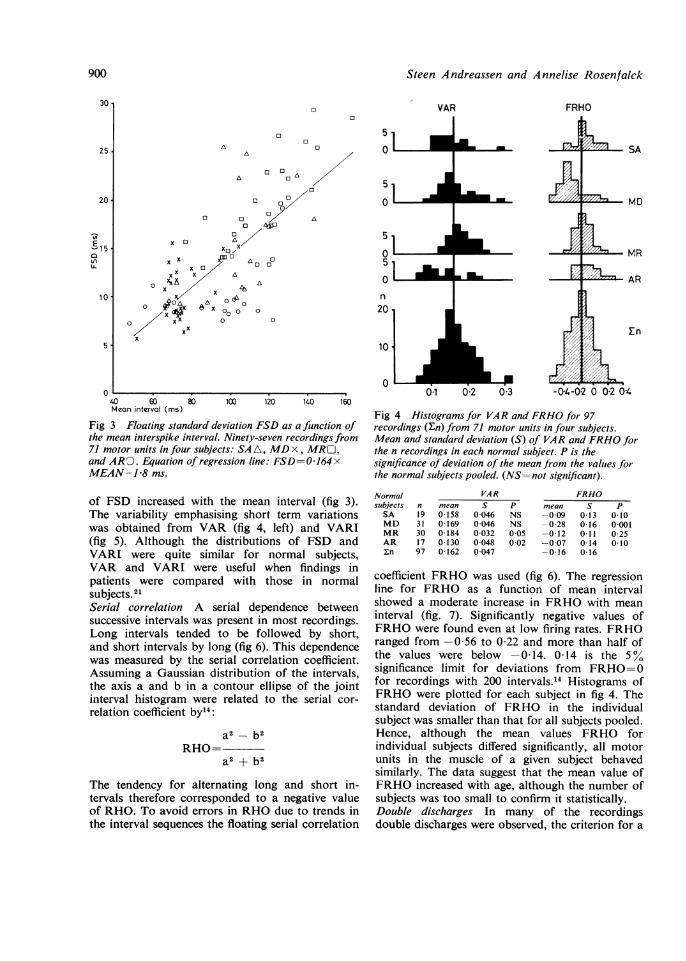
Fig 3 Floating standard deviation FSD as a function ofthe mean interspike interval. Ninety-seven recordings from71 motor units in four subjects: SA A, MD x, MRU,and ARO. Equation of regression line: FSD=0-164 xMEAN-1P8 ms.
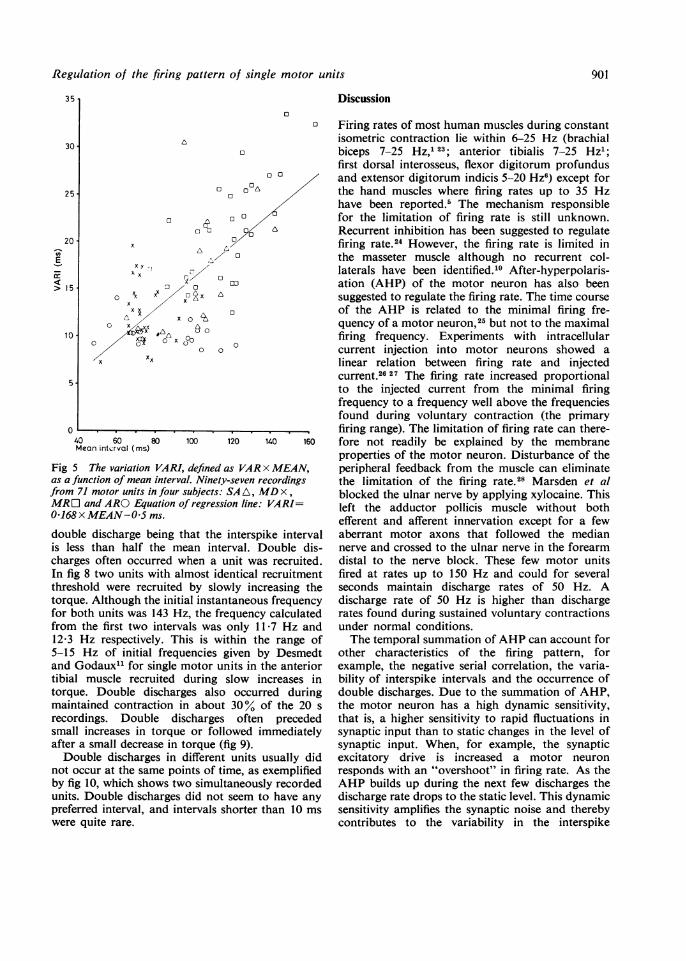
of FSD increased with the mean interval (fig 3).The variability emphasising short term variationswas obtained from VAR (fig 4, left) and VARI(fig 5). Although the distributions of FSD andVARI were quite similar for normal subjects,VAR and VARI were useful when findings inpatients were compared with those in normalsubjects.21Serial correlation A serial dependence betweensuccessive intervals was present in most recordings.Long intervals tended to be followed by short,and short intervals by long (fig 6). This dependencewas measured by the serial correlation coefficient.Assuming a Gaussian distribution of the intervals,the axis a and b in a contour ellipse of the jointinterval histogram were related to the serial cor-relation coefficient by14:
a2 -b2RHO=
a2 + b2
The tendency for alternating long and short in-tervals therefore corresponded to a negative valueof RHO. To avoid errors in RHO due to trends inthe interval sequences the floating serial correlation
0-1
FRHO
EuL-
A
02 0-3
SA
MD
MR
"~-2=AR
ALE-04-02 0 0-2 0-4
Fig 4 Histograms for VAR and FRHO for 97recordings (En) from 71 motor units in four subjects.Mean and standard deviation (S) of VAR and FRHO forthe n recordings in each normal subject. P is thesignificance of deviation of the mean from the values for
the normal subjects pooled. (NS= not significant).
NormalsubjectsSAMDMRARIn
VARn mean S P
19 0 158 0-046 NS31 0 169 0 046 NS30 0 184 0032 0 0517 0-130 0 048 0-0297 0-162 0047
FRHOmean S P
-009 0-13 0-10-028 0-16 0001-0 12 0 11 0-25-007 0-14 0 10--0 16 0-16
coefficient FRHO was used (fig 6). The regressionline for FRHO as a function of mean intervalshowed a moderate increase in FRHO with meaninterval (fig. 7). Significantly negative values ofFRHO were found even at low firing rates. FRHOranged from -0-56 to 0 22 and more than half ofthe values were below -0-14. 0-14 is the 5%significance limit for deviations from FRHO=0for recordings with 200 intervals.'4 Histograms ofFRHO were plotted for each subject in fig 4. Thestandard deviation of FRHO in the individualsubject was smaller than that for all subjects pooled.Hence, although the mean values FRHO forindividual subjects differed significantly, all motorunits in the muscle of a given subject behavedsimilarly. The data suggest that the mean value ofFRHO increased with age, although the number ofsubjects was too small to confirm it statistically.Double discharges In many of the recordingsdouble discharges were observed, the criterion for a
30
25
20-
-150
I-
10
5-
0
I :
900
0
r n
Regulation of the firing pattern of single motor units
35
30
25
20E
> 15
10
5.
0
Discussion
x yxx
0
xx
/I/
0
40 60 80Mean intx;rval (ims)
Fig 5 The variation VARI,as a function of mean intervcfrom 71 motor units in four.MR[O and ARO Equation o
0168 x MEAN-05ms.
double discharge being tis less than half the m(
charges often occurred MIn fig 8 two units with althreshold were recruitedtorque. Although the initifor both units was 143 H;from the first two interv12-3 Hz respectively. Th5-15 Hz of initial frequand Godaux" for single rtibial muscle recruited i
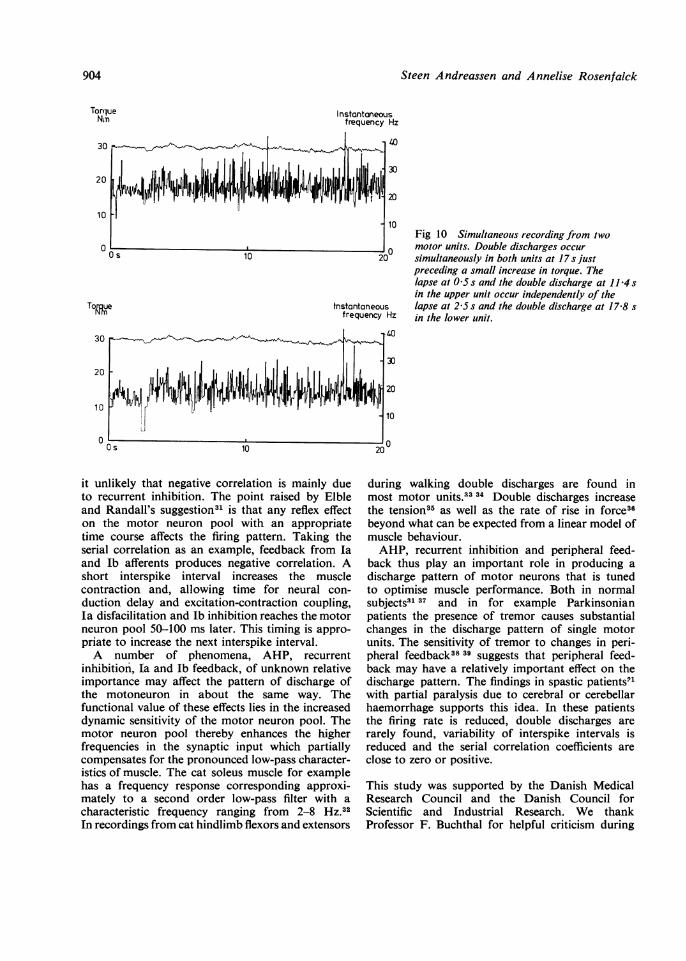
torque. Double dischargmaintained contraction iirecordings. Double dissmall increases in torqueafter a small decrease in tDouble discharges in (
not occur at the same poiby fig 10, which shows twunits. Double dischargespreferred interval, and inwere quite rare.
0
Firing rates of most human muscles during constantisometric contraction lie within 6-25 Hz (brachial
0 biceps 7-25 Hz,1 23; anterior tibialis 7-25 Hz';first dorsal interosseus, flexor digitorum profundus
° ° and extensor digitorum indicis 5-20 Hz6) except for0 Con the hand muscles where firing rates up to 35 Hz
have been reported.5 The mechanism responsiblea ° for the limitation of firing rate is still unknown.
Recurrent inhibition has been suggested to regulatefiring rate.24 However, the firing rate is limited inthe masseter muscle although no recurrent col-laterals have been identified.10 After-hyperpolaris-
I9za m ation (AHP) of the motor neuron has also been0° a x A suggested to regulate the firing rate. The time course
0 of the AHP is related to the minimal firing fre-0 quency of a motor neuron,25 but not to the maximal0 firing frequency. Experiments with intracellular
0 00 current injection into motor neurons showed alinear relation between firing rate and injectedcurrent.26 27 The firing rate increased proportionalto the injected current from the minimal firingfrequency to a frequency well above the frequenciesfound during voluntary contraction (the primaryfiring range). The limitation of firing rate can there-
100 120 140 160 fore not readily be explained by the membraneproperties of the motor neuron. Disturbance of the
defined as VAR x MEAN, peripheral feedback from the muscle can eliminatei1. Ninety-seven recordings the limitation of the firing rate.28 Marsden et alsubjects: SA A, MD x, blocked the ulnar nerve by applying xylocaine. Thisfregression line: VARI= left the adductor pollicis muscle without both
efferent and afferent innervation except for a fewhat the interspike interval aberrant motor axons that followed the medianean interval. Double dis- nerve and crossed to the ulnar nerve in the forearmvhen a unit was recruited. distal to the nerve block. These few motor unitsImost identical recruitment fired at rates up to 150 Hz and could for severalby slowly increasing the seconds maintain discharge rates of 50 Hz. A
al instantaneous frequency discharge rate of 50 Hz is higher than dischargez, the frequency calculated rates found during sustained voluntary contractionsals was only 11 7 Hz and under normal conditions.Iis is within the range of The temporal summation of AHP can account foriencies given by Desmedt other characteristics of the firing pattern, formotor units in the anterior example, the negative serial correlation, the varia-during slow increases in bility of interspike intervals and the occurrence of:es also occurred during double discharges. Due to the summation of AHP,n about 30% of the 20 s the motor neuron has a high dynamic sensitivity,scharges often preceded that is, a higher sensitivity to rapid fluctuations inor followed immediately synaptic input than to static changes in the level of
torque (fig 9). synaptic input. When, for example, the synapticdifferent units usually did excitatory drive is increased a motor neuronints of time, as exemplified responds with an "overshoot" in firing rate. As theio simultaneously recorded AHP builds up during the next few discharges thedid not seem to have any discharge rate drops to the static level. This dynamictervals shorter than 10 ms sensitivity amplifies the synaptic noise and thereby
contributes to the variability in the interspike
901
Steen Andreassen and Annelise Rosenfalck
TorqueNm
TorcNrr
30
Instantaneousfrequency Hz
40.35
30
l + < ,_/_r 4__Su@~~~~~~~I ~-[^;ot20
L 10
Its5Os io 20 0
ue Instantoneous{,.A jnI trequenc
.\4
2-0
U s 10 21
:y Hz40353025
20151050O
0o
150 r
100
ms
50
0
150
100
ms
50
0
142bV
1 22 122 1 1
3246*8 21 57 5 2I1
3 0* 93 7* 82t *42
3 62 2 11
I
FRHO: -0.35 *2aRHO: -0-29
Oms 50 100 150
F 11
2 2bv
22313 l 2
8I 4 4 3 \2I1 I1I204 2112 * 3y2 1120
91'e,2a
FRHO: -0 26RHO: 0-17
ms 50 100 150
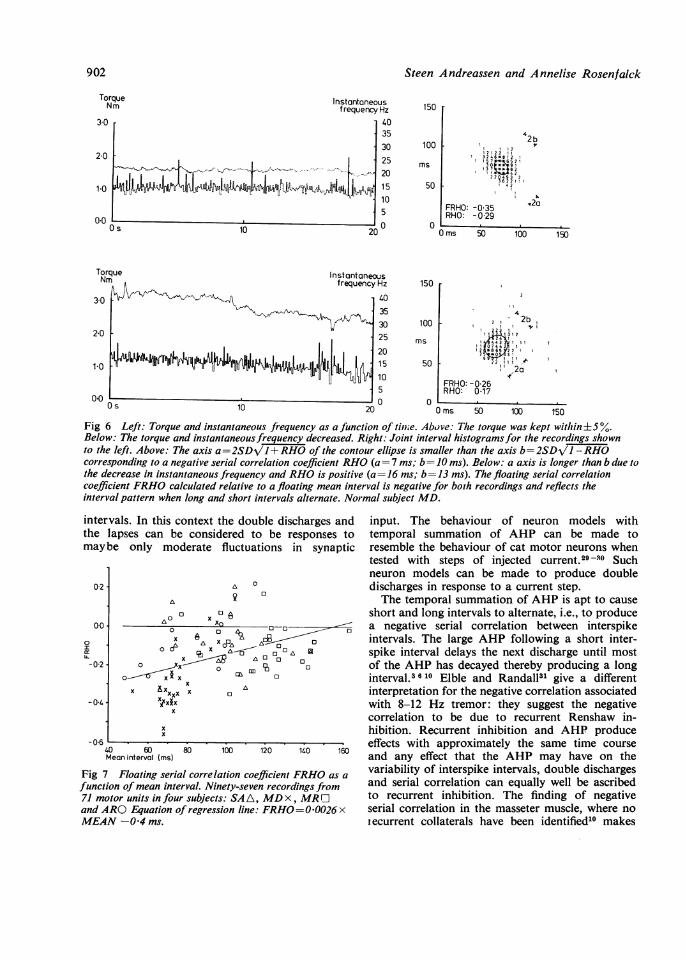
Fig 6 Left: Torque and instantaneous frequency as a function of timie. Above: The torque was kept within±5%.Below: The torque and instantaneous frequency decreased. Right: Joint interval histograms for the recordings shownto the left. Above: The axis a=2SDVJl+RHO of the contour ellipse is smaller than the axis b=2SDJl -RHOcorresponding to a negative serial correlation coefficient RHO (a= 7 ms; b= 10 ms). Below: a axis is longer than b due tothe decrease in instantaneous frequency and RHO is positive (a= 16 ms; b= 13 ms). The floating serial correlationcoefficient FRHO calculated relative to a floating mean interval is negative for both recordings and reflects theinterval pattern when long and short intervals alternate. Normal subject MD.
intervals. In this context 1the lapses can be consicmaybe only moderate
02
0
-0-2
-0-4
A
0 xI
0x 6 0
o cp eAxx ;6
°x--- xx x
x ox AxxXXX X&X
xx
-0-640 60 80Mean interval (ms)
Fig 7 Floating serial correlcfunction of mean interval. Ni,71 motor units in four subject:and ARO Equation of regressMEAN -04 ms.
the double discharges and input. The behaviour of neuron models withlered to be responses to temporal summation of AHP can be made tofluctuations in synaptic resemble the behaviour of cat motor neurons when
tested with steps of injected current.29-SO Suchneuron models can be made to produce double
a 0 discharges in response to a current step.The temporal summation of AHP is apt to cause
D short and long intervals to alternate, i.e., to produce0 -oz ~ a negative serial correlation between interspikeP< A o00 A 0intervals. The large AHP following a short inter-
0 z z°A0a spike interval delays the next discharge until mostof the AHP has decayed thereby producing a long0mO interval.3610 Elble and Randall31 give a different
0 A interpretation for the negative correlation associatedwith 8-12 Hz tremor: they suggest the negativecorrelation to be due to recurrent Renshaw in-hibition. Recurrent inhibition and AHP produceeffects with approximately the same time course
100 120 140 160 and any effect that the AHP may have on theation coefficient FRHO as a variability of interspike intervals, double dischargesety-seven recordings from and serial correlation can equally well be ascribeds: SALA, MD ix,MRfo to recurrent inhibition. The finding of negative{ion line: FRHO=*-0026 x serial correlation in the masseter muscle, where no
iecurrent collaterals have been identified10 makes
902
30
2-0
1-0
0-0
1-0
0.0n I
Regulation of the firing pattern of single motor units
1122 112 2 12 12
looms
1 2 12 21 1 2 1 2 2 1 2 1 2
1 2 1 2 21 1 2
lOms
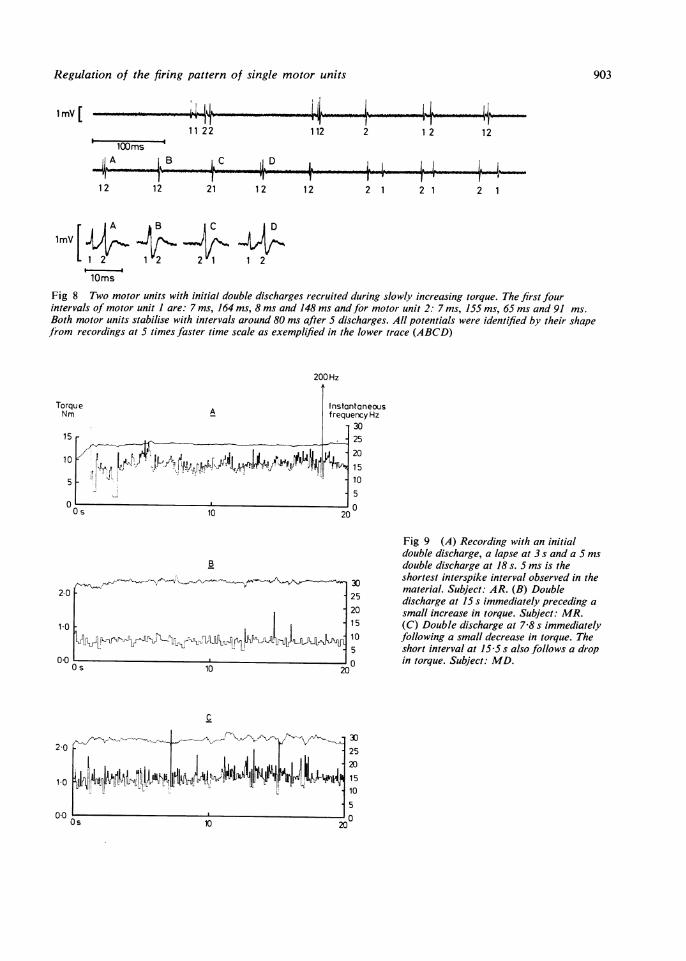
Fig 8 Two motor units with initial double discharges recruited during slowly increasing torque. The first fourintervals of motor unit 1 are: 7 ins, 164 ms, 8 ms and 148 ms andfor motor unit 2: 7 ms, 155 ms, 65 ms and 91 ms.Both motor units stabilise with intervals around 80 ms after 5 discharges. All potentials were identified by their shapefrom recordings at 5 times faster time scale as exemplified in the lower trace (ABCD)
200 Hz
e AInstaA ~~~~~~~~~freqL
I d _F\/4I-)t /- FJ I L 1IL
10
ontaneousluerrcy Hz3025201510
O0
B
-1"Nz'' ~~- ' ~ 3025
-20' 15
10-5
Os 120
Fig 9 (A) Recording with an initialdouble discharge, a lapse at 3 s and a 5 msdouble discharge at 18 s. 5 ms is theshortest interspike interval observed in thematerial. Subject: AR. (B) Doubledischarge at 15 s immediately preceding asmall increase in torque. Subject: MR.(C) Double discharge at 7-8 s immediatelyfollowing a small decrease in torque. Theshort interval at 15 5 s also follows a dropin torque. Subject: MD.
C
~~~~30
I ~~~~.25
%1.44PL1k|{ 101 5
10 20~~~~~~~0-0
1 mv [
15
10
5
0
20
1 0
0-0
2-0
1-0
a
903
TorquNm
222(
Os _ u2010
Steen A ndreassen and Annelise Rosenfalck
Torq-ueNmn
30
20
10
0
Tow
30
20
10
0
nstantaneousfrequency Hz
10 2
tnstontoneoufrequency
40
30
10Fig 10 Simultaneouts recording from two
0 motor units. Double discharges occurD simultaneously in both units at 17s just
preceding a small increase in torque. Thelapse at 0 5 s and the double discharge at 11 4 sin the upper unit occur independently of the
s lapse at 2-5 s and the double discharge at 17 8 sHz in the lower unit.
it unlikely that negative correlation is mainly dueto recurrent inhibition. The point raised by Elbleand Randall's suggestion31 is that any reflex effecton the motor neuron pool with an appropriatetinme course affects the firing pattern. Taking theserial correlation as an example, feedback from Iaand lb afferents produces negative correlation. Ashort interspike interval increases the musclecontraction and, allowing time for neural con-duction delay and excitation-contraction coupling,la disfacilitation and lb inhibition reaches the motorneuron pool 50-100 ms later. This timing is appro-priate to increase the next interspike interval.A number of phenomena, AHP, recurrent
inhibition, la and lb feedback, of unknown relativeimportance may affect the pattern of discharge ofthe motoneuron in about the same way. Thefunctional value of these effects lies in the increaseddynamic sensitivity of the motor neuron pool. Themotor neuron pool thereby enhances the higherfrequencies in the synaptic input which partiallycompensates for the pronounced low-pass character-istics of muscle. The cat soleus muscle for examplehas a frequency response corresponding approxi-mately to a second order low-pass filter with acharacteristic frequency ranging from 2-8 Hz.32In recordings from cat hindlimb flexors and extensors
during walking double discharges are found inmost motor units.33 34 Double discharges increasethe tension35 as well as the rate of rise in force38beyond what can be expected from a linear model ofmuscle behaviour.AHP, recurrent inhibition and peripheral feed-
back thus play an important role in producing adischarge pattern of motor neurons that is tunedto optimise muscle performance. Both in normalsubjects31 37 and in for example Parkinsonianpatients the presence of tremor causes substantialchanges in the discharge pattern of single motorunits. The sensitivity of tremor to changes in peri-pheral feedback38 39 suggests that peripheral feed-back may have a relatively important effect on thedischarge pattern. The findings in spastic patients"'with partial paralysis due to cerebral or cerebellarhaemorrhage supports this idea. In these patientsthe firing rate is reduced, double discharges arerarely found, variability of interspike intervals isreduced and the serial correlation coefficients areclose to zero or positive.
This study was supported by the Danish MedicalResearch Council and the Danish Council forScientific and Industrial Research. We thankProfessor F. Buchthal for helpful criticism during
1-
904
0
LI'
Regulation of the firing pattern of single motor units
the work and in the preparation of the manuscript.The work was initiated at the Institute of Neuro-physiology, University of Copenhagen and at theElectronics Institute, Technical University ofDenmark.
References
1 Clamann, PH. Statistical analysis of motor unitfiring patterns in a human skeletal muscle.Biophys J 1969; 9:1233-51.
2 Freund, HJ, Wita CW. Computeranalyse desIntervallmusters einzelner motorischer Einheitenbei Gesunden und Patienten mit supraspinalenmotorischen Storungen. Arch Psychiat Nervenkr1971; 214:56-71.
3 Person RS, Kudina LP. Discharge frequency anddischarge pattern of human motor units duringvoluntary contraction of muscle. Electroen-cephalogr Clin Neurophysiol 1972; 32:471-83.
4 Tanji J, Kato M. Recruitment of motor units involuntary contraction of a finger muscle in man.Exp Neurol 1973a; 40:759-70.
5 Tanji J, Kato M. Firing rate of individual motorunits in voluntary contraction of abductor digitiminimi muscle in man. Exp Neurol 1973b; 40:771-83.
6 Kranz H, Baumgartner G. Human alpha moto-neurone discharge, a statistical analysis. BrainRes 1974; 67:324-9.
7 Petajan JH. Clinical electromyographic studiesof diseases of the motor unit. ElectroencephalogrClin Neurophysiol 1974; 36:395-401.
8 Freund HJ, Budingen HJ, Dietz V. Activity ofsingle motor units from human forearm musclesduring voluntary isometric contractions. J Neuro-phvyiol 1975; 38:933-46.
9 Budingen HJ, Freund HJ. The relationshipbetween the rate of rise of isometric tension andmotor unit recruitment in a human forearmmuscle. Pflugers Archiv 1976; 362:61-7.
10 Derfler B, Goldberg LJ. Firing rate charac-teristics of SMU's in the human massetermuscle. Society for Neuroscience. 7th AnnualMeeting, 1977; 3:Abstr. 856.
11 Desmedt JE, Godaux E. Ballistic contraction inman: Characteristic recruitment pattern of singlemotor units of the tibialis anterior muscle.J Physiol 1977; 264:673-93.
12 Grimby L, Hannerz J. Firing rate and recruit-ment order of toe extensor motor units indifferent modes of voluntary contraction. JPhysiol 1977; 264:865-79.
13 Andreassen S, Rosenfalck A. Recording from asingle motor unit during strong effort. IEEETransactions on Biomedical Engineering, 1978;BME-25:501-8.
14 Andrea%-en S. Interval pattern of single motorunits. PhD thesis revised. Aalborg UniversityPress 1978: 1-220.
15 Asmussen E, Heeb0l-Nielsen K. Isometric muscle
strength of adult men and women. DanishNational Association for Infantile Paralysis(Polio). Communication 11, 1961.
16 Andreassen S. Automatic classification ofmuscle action potentials. Proceedings of XIIInternational Conference on Medical andBiological Engineering, part IV: 1979: 93. 5.
17 Shiavi R, Negin M. The effect of measurementerrors on correlation estimates in spike-intervalsequences. IEEE Transaction on BiomedicalEngineering. BME-20, 1973; 374-8.
18 Kranz H. Dynamic aspects of motoneuronecontrol and its disturbance. In: Desmedt, ed.Progress in Clinical Neurophysiology, vol. 9,Karger. (In press).
19 Prochazka VJ, Conrad B, Sindermann F. Com-puterized single-unit interval analysis and itsclinical application. In: Desmedt, ed. NewDevelopment in Electromyography and ClinicalNeurophysiology, Vol. 2, 462-8. Karger. 1973.
20 Rosenfalck P, Madsen A. Preferred intervals ofmuscle action potentials in voluntary contraction.Acta Physiol Scand 1954; 31: suppl, 114, 47.
21 Rosenfalck A, Andreassen S. Impaired regulationof force and firing pattern of single motor unitsin patients with spasticity. J Neurol NeurosurgPsychiat 1980; 43:907-16.
22 Freund HJ, Wita CW, Sprung C. Dischargeproperties and functional differentiation of singlemotor units in man. In: Somjen, ed. Neuro-physiology Studied in Man, Amsterdam:Excerpta Medica, 1972; 305-13.
23 Gydikov A, Kosarov D. Some features ofdifferent motor units in human biceps brachii.Pflugers Archiv 1974; 347:75-88.
24 Granit R, Haase J, Rutledge LT. Recurrentinhibition in relation to frequency of firing andlimitation of discharge rate of extensor moto-neurones. J Physiol 1960; 154:308-28.
25 Kernell D. The limits of firing frequency in catlumbosacral motoneurones possessing differenttime course of afterhyperpolarization. ActaPhysiol Scanf 1965a; 65:87-100.
26 Granit R, Kernell D, Shortess GK. Quantitativeaspects of repetitive firing of mammalian moto-neurons, caused by injected currents. J Physiol1963; 168:911-31.
27 Kernell D. High frequency repetitive firing ofcat lumbosacral motoneurones stimulated bylong-lasting injected currents. Acta Physiol Scand1965b; 65:74-86.
28 Marsden CD, Meadows JC, Merton PA. Isolatedsingle motor units in human muscle and theirrate of discharge during maximal voluntaryeffort. Proc Physiolog Soc 1971; May, 12-13 P.
29 Baldissera F, Gustafsson B, Parmiggiani F.Adaption in a simple neurone model comparedto that of spinal motoneurones. Brain Res 1973;52:382-4.
30 Baldissera F, Gustafsson B, Parmiggiani F. Amodel for refractoriness accumulation and
905
906
secondary range firing in spinal motoneurones.Biological Cybernetics 1976; 24:61-5.
31 Elbe RJ, Randall JE. Motor-unit activityresponsible for 8- to 12-Hz component of humanphysiological finger tremor. J Neurophysiol 1976;39:370-83.
32 Mannard A, Stein RB. Determination of thefrequency response of isometric soleus musclein the cat using random nerve stimulation.J Physiol 1973; 229:275-96.
33 Zajac FE, Young JL. Motor unit dischargepatterns during treadmill walking and trotting inthe cat. Neuroscience Abstracts 1975; 1:164.
34 Zajac FE, Young JL. Discharge pattern ofmotor units during cat locomotion and theirrelation to muscle performance. In: Herman,Grillner, Stein & Stuart, ed. Neural Control ofLocomotion, New York: Plenum Press, 789-93.
35 Burke RE, Roudomin P, Zajac FE. The effect of
Steen Andreassen and Annelise Rosenfalck
activation history on tension production byindividual muscle units. Brain Res 1976; 109:515-29.
36 Baldissera F, Parmiggiani F. Relevance ofmotoneuronal firing adaptation to tensiondevelopment in the motor unit. Brain Res 1975;91:315-20.
37 Mori S. Discharge patterns of soleus motor unitswith associated changes in force exerted by footduring quiet stance in man. J Neurophysiol 1973;36:458-71.
38 Lippold OCJ. Oscillation in the stretch reflex arcand the origin of the rhythmical, 8-12 c/scomponent of physiological tremor. J Physiol1970; 206:359-82.
39 Joyce AJ, Rack PMH. The effects of load andforce on tremor at the normal human elbowjoint. J Physiol 1974; 240:375-96.
Related Documents