AN ABSTRACT OF THE THESIS OF Shan-Hsin, Angie. Ho for the degree of Master of Science in Apparel. Interiors, Housing and Merchandising presented on February 5. 1991 Title: A Comparative Study of Apparel Shopping Orientations between Asian Americans and Caucasian Americans Abstract approved: .Redacted for Privacy V /Gi1OL y 1. UL cacti a Very little empirical research has been conducted on Asian Americans as a whole in relation to their consumer behavior, specifically their clothing behavior. A review of literature demonstrated that Asian Americans have been studied from different psychographic and sociological aspects. However, the apparel shopping behavior of this market has received only slight research attention. The purpose of this study was to compare Asian Americans and Caucasian Americans with regards to apparel shopping orientations. This study also examined the relationship between apparel shopping orientations and intensity of ethnic identification among Asian Americans. The multimediation model of consumer behavior (EKB model) proposed by Engel, Kollat and Blackwell (1973) was used as a theoretical framework for the present study. Based on the EKB model, it was expected that people of different cultural backgrounds were different in terms of

Welcome message from author
This document is posted to help you gain knowledge. Please leave a comment to let me know what you think about it! Share it to your friends and learn new things together.
Transcript

AN ABSTRACT OF THE THESIS OF
Shan-Hsin, Angie. Ho for the degree of Master of Science in
Apparel. Interiors, Housing and Merchandising presented
on February 5. 1991
Title: A Comparative Study of Apparel Shopping Orientations
between Asian Americans and Caucasian Americans
Abstract approved: .Redacted for PrivacyV /Gi1OL y 1. UL cacti a
Very little empirical research has been conducted on
Asian Americans as a whole in relation to their consumer
behavior, specifically their clothing behavior. A review of
literature demonstrated that Asian Americans have been
studied from different psychographic and sociological
aspects. However, the apparel shopping behavior of this
market has received only slight research attention. The
purpose of this study was to compare Asian Americans and
Caucasian Americans with regards to apparel shopping
orientations. This study also examined the relationship
between apparel shopping orientations and intensity of
ethnic identification among Asian Americans.
The multimediation model of consumer behavior (EKB
model) proposed by Engel, Kollat and Blackwell (1973) was
used as a theoretical framework for the present study.
Based on the EKB model, it was expected that people of
different cultural backgrounds were different in terms of

their consumer behavior. Another conceptual framework used
in the present study was the concept of shopping
orientations, introduced by Stone (1954). Apparel shopping
orientations refer to motivations, interests and attitudes
toward apparel shopping.
Seven shopping orientations were selected for the
present study. They were: economic shopping, personalizing
shopping, recreational shopping, social shopping (including
friend social shopping and family social shopping), brand
loyal shopping, impulse shopping and fashion orientations.
The fashion orientation included four factors: fashion
leadership, fashion interest, fashion importance and anti-
fashion attitude.
The nature of the study was observational, in which no
variables were manipulated. The data collection method
involved a mailed questionnaire. The questionnaire included
questions measuring seven shopping orientations, Asian
Americans' intensity of ethnic identification and questions
on demographic characteristics. A purposive sample of 300
Asian American and 300 Caucasian American students were
drawn from the students enrolled at Oregon State University
for 1990 Fall term.
A pretest was conducted before the data were collected.
Dillman's "Total Design Method" (1978) was used as a
guideline when implementing the data collection procedures.
The response rates were 75.9% for the total sample, with
72.6% for the Asian group and 79.0% for the Caucasian group.

The collected data were analyzed by multivariate analysis of
variance (MANOVA), t-test and Pearson correlation.
Significant differences were found between Asian and
Caucasian American respondents on social shopping, including
both friend social and family social shopping, brand loyal
shopping, and fashion leadership orientations.
The Asian respondents were found to be significantly
more brand loyal and liked to shop with friends or family
members than were the Caucasian respondents. The Asian
American students were also found to be more likely to
regard themselves as fashion leaders than were the Caucasian
students in this study.
Also a negative correlation was found between intensity
of ethnic identification and fashion importance among Asian
American respondents. This finding indicated that the more
an Asian respondent identified with Asian ethnicity, the
less (s)he considered being well-dressed to be important.

A Comparative Study of Apparel Shopping Orientationsbetween Asian Americans and Caucasian Americans
by
Shan-Hsin, Angie, Ho
A THESIS
submitted to
Oregon State University
in partial fulfillment ofthe requirements for the
degree of
Master of Science
Completed February 5, 1991
Commencement May 1991

APPROVED:
Redacted for PrivacyAssistant '1;,d4'essor of Apparel, Interiors, Housing andMerchandising in charge of major
Redacted for PrivacyHead ou)department of Apparel, Interiors, Housing andMerchandising
A
Redacted for PrivacyDean of Sch441
Date thesis is presented February 5, 1991
Typed by Shan-Hsin, Angie, Ho

ACKNOWLEDGEMENT
I would like to thank my major professor, Dr. Cheryl
Jordan, for her precious guidance, suggestions and
encouragement during the process of completing this study.
Also appreciation is extended for the help and input from my
committee members, Dr. Leslie Davis, Dr. Boris Becker and
Dr. Clinton Brown. Special appreciation is extended to Pam
Bodenroeder and Suzy Maresh of the Survey Research Center at
Oregon State University. Without the assistance from all
these people, this study would not have been conducted and
completed as planned.
Most of all, I offer my deepest gratitude to my
husband, Kenneth Guo. Although he was thousands of miles
away in another country while I was conducting and writing
this thesis, his love, spiritual and financial support
always backed me up along the way.
To my dearest four-year-old son, Li-Wei, my
appreciation for him is beyond words. Many days and nights,
he spent the time with baby sitters and friends so that I
could work on my thesis. Also, to my new-born baby, which
was born one week before the completion of this study, I
thank him for going through all this with me very
cooperatively.
To God and all my friends, I am so grateful for all of
your help.

TABLE OF CONTENTS
Chapter PaceINTRODUCTION 1
Purpose of the Study 2
Asian American Demographic Profile 3
Ethnic Groups and Population Projection 4
Scholastic Achievement 5Occupational Status 6
Economic Achievement 7
Market Research on Asian Americans 8
Significance of the Study 10Definition of Terms 14
II REVIEW OF LITERATURE 16Culture, Ethnicity and Clothing Behavior 16Intensity of Ethnic Identification 26Asian Americans 30Shopping Orientations 33Shopping Orientations for the Present Study 47
Economic Shopping 48Personalizing Shopping 49Recreational Shopping 49Social Shopping 50Brand Loyal Shopping 50Impulse Shopping 51Fashion Orientation 51
III METHOD 53Hypotheses 53Research Design 54Sample 55Research Instrument 56Data Collection 62Data Analyses 63Summary 64
IV FINDINGS AND DISCUSSION 66Questionnaire Response Rate 66Demographic Characteristics of the Respondents 67Reliability and Validity of the Scales 75Descriptive Analysis of Variables 82Results of Hypotheses Testing 85
MANOVA Test Results for Shopping 85Orientations by Ethnicity
T-test Results of Each Sub-hypothesis 86under Hypothesis 1
Correlation Test of Hypothesis 2 90Additional Analyses 94Summary 99
V SUMMARY AND RECOMMENDATIONSFindings and Marketing ImplicationsConclusionsLimitationsRecommendations for Future Research
REFERENCE
APPENDICESAppendix A -Appendix B -Appendix c -
103104111115116
118
Correspondence for the Survey 126Questionnaire 130Application for Exemption Review 140Protection of Human Subjects

LIST OF TABLES
Table Page
1 Oregon State University Asian American vs White 57American Student Population
2 Questionnaire Response Rate
3 Demographic Characteristics of(Categorical Data)
4 Demographic Characteristics of(categorical Data)
5 Demographic Characteristics of(Continuous Data)
6 Demographic Characteristics of(Categorical Data)
7 Estimates of Reliability of the Scales 76
8 Factor Loadings of Shopping Orientations 79
9 Factor Loadings of Fashion Orientation 81
10 Descriptive Statistics of Variables 83
11 MANOVA Test Results for Shopping Orientations 87by Ethnicity
12 Results of T-test for Each Orientation by Ethnicity 89
13 Mann-Whitney Test of Each Orientation by Ethnicity 91
14 Correlation Analysis of Shopping Orientations 93by Intensity of Ethnic Identification
15 One-way ANOVA of Shopping Orientations by Sex 97
16 One-way ANOVA of Fashion Orientation by Sex 98
17 Two-way ANOVA of Shopping Orientations by 100Ethnicity & Sex
18 Two-way ANOVA of Fashion Orientation by Ethnicity 101& Sex
the Respondents
the Respondents
the Respondents
the Respondents
68
69
71
73
74

A COMPARATIVE STUDY OF APPAREL SHOPPING ORIENTATIONS BETWEEN
ASIAN AMERICANS AND CAUCASIAN AMERICANS
CHAPTER I
INTRODUCTION
Since the revision of the U.S. immigration law in 1965,
Asian Americans have been the fastest growing ethnic group
in the U.S (Bouvier & Agresta, 1985). Asian Americans,
constituting 2.7 percent of the total U.S. population,
ranked third by size among minorities in 1985 as compared to
blacks (12% of U.S. population) and Hispanics (7%) (U.S.
Department of Commerce, 1987).
In addition to having the fastest population growth,
Asian Americans in recent decades have made remarkable
socioeconomic gains, which have resulted in changing
societal perceptions of Asian Americans (Hirschman & Wong,
1984). Therefore, Asian Americans have become a viable
ethnic target market, after blacks and Hispanics, for
marketers and retailers.
Do Asian Americans differ from the majority Caucasian
Americans in apparel shopping behavior? This question is
crucial to market planning for a given product category,
such as apparel, for it will influence whether to consider
Asian Americans as a distinct apparel market segment. If

2
they are a distinct segment, how are they different from the
majority of Caucasian Americans? In addition, if ethnicity
as a variable influences apparel shopping behavior, what is
the relationship between the intensity of ethnic
identification (how strong Asian Americans identify
themselves with Asian ethnicity) and their apparel shopping
behavior?
Purpose of the Study
The purpose of this study was to compare Asian
Americans and Caucasian Americans with regard to apparel
shopping orientations. Apparel shopping orientations refer
to motivations, interests and attitudes toward apparel
shopping as well as shopping activities. This study also
examined the relationship between apparel shopping
orientations and intensity of ethnic identification among
Asian Americans.
The following research questions were answered when
this study was completed:
1. What is the pattern of apparel shopping orientations
of Asian American in comparison with Caucasian American
students at Oregon State University (OSU)?
2. Is there any correlation between apparel shopping
orientations and intensity of ethnic identification among
OSU Asian American students?
3
Asian American Demographic Profile
In Asia, societies such as those in Hong Kong, Taiwan,
Japan, Singapore and South Korea all have one thing in
common. They are influenced to some extent by values and
norms of Confucian philosophy (Tan & McCullough, 1984).
Confucius, the founder of Confucianism, was born in the year
of 551 B.C. in China. Confucianism is a system of teachings
of Confucius and his disciples characterized by central
emphasis on the practice and cultivation of the virtues of
filial piety, kindness, righteousness, propriety,
intelligence and faithfulness. Confucianism has
historically formed the basis of much of Chinese ethics,
education and religion. As Chinese political power advanced
to neighboring countries, such as Korea and Japan,
Confucianism spread and won new converts in many Oriental
countries (Starr, 1930).
Today, Confucianism still remains a vital part of these
Oriental cultures. The relationships of family members,
husband, wife and relatives still show strong evidence of
Confucian influence. Many values regarding a man's role in
society and a woman's role at home, beliefs in the rights
and wrongs, attitudes toward human behavior in general, are
still strongly rooted in the traditional Oriental culture
(Nivison & Wright, 1959).
In order to better understand Asian Americans in the
4
United States, demographic characteristics and market
research on Asian Americans need to be reviewed.
Ethnic Groups and Population Projection.
During the past fifteen years, immigrants of Asian
ancestry have been arriving in the United States in
phenomenal numbers. According to the most current data
available (U.S. Department of Commerce, 1987), immigrants
from Asia accounted for 50 percent of all alien immigrants
in 1983. Asian Americans from the traditional sending
countries of China (including Taiwan), Hong-kong, Japan,
Korea and the Philippines are well represented. Refugees-
turned-immigrants from Vietnam, Kampuchea and Laos, however,
represent another new and important proportion of the Asian
immigrant stream (Gould, 1988; Nee and Sanders, 1985; Patel,
1988; Robery, 1985; Wong, 1986).
The major ethnic groups of Asian Americans in 1985 were
Chinese (21%), Philippino (20%), Japanese (15%), Vietnamese
(12%), Korean (11%) and Asian Indian (10%). Asian Americans
include a number of diverse ethnic groups who differ in
language, nationality, recency of immigration and
socioeconomic achievement (Patel, 1988).
Asian Americans, in the 1980's, have had growth rates
higher than either black or white Americans. It is
immigration that is principally responsible for the high
growth rate. This population group grew from 5.2 million to
7.1 million, or 37.5 percent, between 1980 and July 1, 1985

5
(U.S. Department of Commerce, 1987).
The U.S. Bureau of the Census projected that Asian
Americans (including Other races) together with Hispanics
and blacks will continue to increase during the next
century. The Asian and Other races population was projected
to increase from 6.4 million to 23.4 million in 2080, or
from 2.7 percent in 1985 to 7.5 percent in 2080 (U.S.
Department of Commerce, 1987).
The Asian American population is highly concentrated
regionally. About 52 percent of the total Asian population,
compared to about 28 percent of the U.S. population, resides
in the western states. Five states (California, Hawaii, New
York, Illinois and Washington) are home to about three-
quarters of all Asian Americans (Bouvier & Agresta, 1985).
Scholastic Achievement
Recent Asian immigrants merit attention, not only
because of their increasing numbers, but also because of
their scholastic and socioeconomic achievement. They tend
to be more educated and more likely to be in professional
and managerial occupations than either other immigrants or
native-born Americans (McLeod, 1986).
According to the 1980 Census, Asian Americans are a
very highly educated population. The proportion of Asian
immigrants with college degrees and with postgraduate
training is almost double the proportion for the total U.S.
population. Among Asian immigrants, those from China,

6
Japan, Korea and the Philippines have a much higher
proportion of college degrees than immigrants from Vietnam,
Kampuchea and Laos (Gould, 1988; Wong, 1986).
Another indicator of educational achievement is the
mean number of years of schooling completed. Post-1965
Asian Americans completed about two more years of schooling
than U.S. native-born counterparts (Wong, 1986). Moreover,
it was reported that, by the mid-Eighties, Asian Americans
had come to represent about 10 percent of the student body
at prestigious schools such as Harvard and Brown, and about
20 percent in California schools, such as Berkeley ("Quotas
on... ", 1989). Asian Americans are also accomplished in
more than science and math, they represent a quarter of the
students at the Juilliard School of Music in New York
(Gergen, 1988).
Occupational Status
Partly as a consequence of their higher educational
achievements, Asian Americans tend to be slightly more
advantaged occupationally than their American counterparts.
About 22 percent of Asian Americans, compared to 13 percent
of the U.S. population, are involved in professional
occupations (Wong, 1986). Another indicator of occupational
advantage is the proportion involved in white-collar
occupations. From 62 to 77 percent of the Chinese,
Japanese, Korean and male Filipino Americans are involved in
white-collar occupations, compared to about 46 percent of

7
the U.S. population (Wong, 1986).
Economic Achievement
Based on the 1980 census information, the average
family income of Asian Americans (US $23,600) exceeded the
level (US $19,000) reported for whites (Foote, 1987).
However, both Wong (1986) and Gould (1988) argued that this
one-sided viewpoint was misleading. Instead of analyzing
income by family, Wong analyzed the Asian American income by
individual. It was found that in terms of total income per
capita, Asian immigrants tended to earn less than their
white American counterparts. The family income of Asian
Americans is higher than that of the general U.S. population
due to multiple workers in the Asian household.
Zinsmeister (1988) also reported that Asians averaged
more workers per family (2, versus 1.5 for non-Asians) and
that they worked longer hours or that Asian Americans had
higher than average levels of education. Therefore, the
relatively high earnings of Asian American households are a
function of their high levels of training, effort and number
of workers per household.
Manning and O'Hare (1988) reported that Asian Americans
were more likely to own a business than were other
minorities. For every 1,000 Asian and Pacific Islanders in
the population, 54.8 owned a business, far above the rate
for blacks (12.5 per 1,000) or for Hispanics (17 per 1,000)
(Manning & O'Hare, 1988).

8
Market Research on Asian Americans
In the early 1980's, some insurance companies, consumer
goods manufacturers and Asian-oriented media started tapping
the Asian market. As one of the pioneers in targeting Asian
Americans, Metropolitan Life Insurance, Inc. (Met Life)
conducted focus group research with Asians. Met Life found
that Asian families routinely save as much as one-fifth of
their income and follow time-honored traditions of respect
for elders and love of children, which is referred as "the
finest quality market an insurance company could hope for"
("Asian-Americans...", 1986, p.34).
In spite of the diversity of ethnic groups among Asian
Americans, Met Life discovered from their research that
Asian Americans were similar to each other and in many ways.
The most noteworthy similarity is that Asian Americans are
family oriented, with a strong need to protect their
survivors and educate their children. The powerful
traditions of respect for elders and love of children
observed in the Far East have largely been continued in the
U.S. ("Asian-Americans..." , 1986).
Zinsmeister (1988) reported that Asian Americans have
extremely low rates of divorce and family break-up.
Moreover, they are disproportionately likely to live in
extended families with relatives. It was also reported that
the Chinese preferred shopping in large family groups, with

9
buying decisions usually made by the family elders (Kotkin,
1987).
Met Life profiled Asian Americans as hard-working,
ambitious and knowing little about insurance, which was
turned into a market niche by Met Life ("Asian-
Americans...", 1986). It was also found that Asian
householders might be well educated and hold skilled jobs,
but they usually chose conservative savings and investment
plans because financial security was of critical importance.
Furthermore, Asian Americans tended to buy from people or
companies that spoke their language and understood their
culture (Edmondson, 1986).
Remy Martin Cognac's success story demonstrated that
consumer goods can also profit from targeting the Asian
market. Remy reported that a $400,000 advertising campaign
targeted at Chinese Americans doubled its sales; at the
expense of Johnnie Walker Red Label, which had been the
favorite among the Chinese, since red symbolizes good
fortune (Foote, 1987). Remy has been taking great pains to
understand the Asian psyche, using advertising messages that
stress things like quality, security, family and longevity
(Kern, 1988).
Very little market research has been conducted on Asian
Americans in relation to their clothing behavior. For
example, fashion has been found to be a personal expression
for young blacks who select color combinations and fashion-

10
oriented styling over traditional classics (Less, 1987).
Hispanics traditionally like to dress little girls in very
feminine fashion and boys in dress-up suits. Hispanics as a
group are shorter, and older girls' sizes can be a problem
as their figure tend to be heavier and fuller than the
middle-American size specification (Less, 1987). However,
the Asian market, being viewed as affluent and well
educated, has not been explored by the apparel industry
(Less, 1987).
Significance of the Study
Very little empirical research has been conducted on
Asian Americans as a whole in relation to their consumer
behavior, specifically their clothing behavior. A review of
literature demonstrates that Asian Americans have been
studied from different psychographic and sociological
aspects, such as acculturation, family characteristics,
socioeconomic status, mental health and counseling
practices, self concept and coping behavior. However, the
consumer behavior specifically the apparel shopping behavior
of this market has received only slight research attention.
Gim (1988) investigated Oriental women's clothing
acquisition behaviors and their body measurements. She
found that Oriental women were not impulsive buyers and
patronized department stores more frequently than other

11
types of stores. It was also found that fit was the most
important consideration for Asian Americans in purchasing a
garment.
Another study conducted by Forney and Rabolt (1986)
indicated a relationship between ethnic identity and ethnic
dress usage. The results suggested that individuals with
higher ethnic identities used family, ethnics other than
family, ethnic fashion magazines, and ethnic fashion shows
as sources of information on dress.
Hoffman (1982) studied the clothing transitions of the
Mien, immigrants from Laos (Southeast Asia). The results of
her study indicated that Western garb had largely replaced
traditional Mien garments for everyday use, except by the
elderly. Also dress was found to be indicative of the
maintenance of ethnic identity, which meant that the
subjects who fully identified (versus partially identified)
with the ethnic group used traditional clothing more
frequently. Hoffman also concluded that forms transferred
before meanings associated with the forms, since incomplete
usage of adopted apparel items was found in some cases.
In addition, some studies on Japanese Americans
(Robertson, Dalrymple, & Yoshino, 1969), Korean immigrants
(Kim, 1987; Kwon, 1982) and Filipino immigrants (Mendoza,
1965; Senga, Brown, & Gonzales, 1987) provide insight into
the study of Asian Americans. Given these research
findings, the questions of whether Asian Americans, in

12
general, behave differently from the major Caucasian
American market in shopping for apparel and how they differ
remain unanswered. Therefore, to study Asian Americans in
regard to apparel shopping behavior will add to the body of
knowledge on Asian Americans. The findings will also
provide apparel manufacturers and retailers some basis for
the development of marketing strategies to attract the Asian
American market.
To explore the Asian American fashion market, shopping
orientations provide a general but practical perspective.
Shopping orientation is a concept first proposed by Stone in
1954. Studies of consumer shopping orientations typically
seek to identify a limited set of distinct shopper types to
which retail management may direct differentiated marketing
efforts (Westbrook & Black, 1985).
Shopping orientations have been found to be good
predictors of various aspects of shopping behavior (Darden &
Reynolds, 1971) and a better, than personality, for example,
objective way to describe consumer characteristics (Wilson,
1966). Moreover, researchers have suggested that shopping
orientations could be used as a basis for market
segmentation and marketing planning (Boone, Kurtz, Johnson,
& Bonno, 1974).
One dimension of investigating consumer shopping
orientations is to identify differences in shopping
orientation patterns between different ethnic groups, such
13
as Hispanics compared to Caucasians (Valencia, 1982) or
Korean immigrants compared to whites (Kim, 1988). However,
most of the studies are about general shopping orientations
and do not specifically examine apparel shopping
orientations. Moreover, no research could be found that
compared differences in apparel shopping orientations among
Asian Americans and other ethnic groups.
When using ethnicity as an independent variable to
study consumer behavior, it was found that within the same
ethnic group there are differences between individuals of
varying intensity of ethnic identification (Hirschman, 1981;
Deshpande, Hoyer & Donthu, 1986). Intensity of ethnic
identification refers to how strong an ethnic member
identifies with the ethnic group. The concept of intensity
of ethnic identification leads to the belief that there must
be a relationship between the intensity of identification
and consumer behavior.
Deshpande et al. (1986) suggested that, in reality, the
intensity of ethnic identification is a continuum. However,
they found empirical support for classifying subjects into
two levels of identification, strong and weak identifiers.
The level of ethnic identification influences the values and
norms being held, which in turn influences the overt
consumer behavior, such as shopping behavior (Hutnik, 1986).
Hence, besides comparing Asians to Caucasians in regard to
their apparel shopping orientations, correlation between

14
apparel shopping orientations and different levels of ethnic
identification among Asian Americans may also be found.
In conclusion, the purpose of this study was two-fold.
Practically and managerially, it would assist apparel
manufacturers and retailers to better understand the Asian
American market and to develop marketing strategies.
Academically, it added to the body of research on Asian
Americans as well as apparel shopping orientations relating
to different ethnic groups.
Definition of Terms
The following definitions are relevant to this study:.
Asian American - According to the 1980 U.S. Census
definitions of subject characteristics, the category "Asian
and Pacific Islander" includes American citizens who
indicated their race as Chinese, Filipino, Japanese, Asian
Indian, Korean, Vietnamese, Hawaiian, Samoan, Guamanian,
Cambodian, Laotian, Pakistani, Fijian and the ones under
"Others" race category.
The concept of race as used by the Census Bureau
reflects self-identification by respondents; it does not
denote any clear-cut scientific definition of ethnic groups.
These data represent self-classification by people according
to the race with which they identify (U.S. Department of
Commerce, 1984). The definition for Asian Americans in this

15
study followed 1980 Census definition of "Asian and Pacific
Islanders".
Caucasian Americans - Caucasian Americans were defined
as white Americans who were of white race or European
descent. Respondents who identified themselves as
"Caucasians" and "Americans" were included in this study as
Caucasian Americans.
Culture - Culture refers to the complex of values,
ideas, attitudes and other meaningful symbols created by a
group of people to shape human behavior and the artifacts of
that behavior as they are transmitted from one generation to
the next (Engel, Kollat and Blackwell, 1973, p. 72).
Ethnicity - The term "ethnicity" refers to shared
culture and background. Shared background includes common
ancestry and the shared culture embraces language, religion,
customs and national or political identification (Bahr,
Chadwick & Stauss, 1979).
Intensity of ethnic identification - refers to a
subjective, self-reported intensity of identification with a
specific ethnic group.
Shopping orientation - Shopping orientation refers to
motivations for shopping, attitudes toward and interest in
shopping (Howell, 1979; Valencia, 1982).
Apparel - Broadly defined as any body covering, which
includes clothes as well as other forms of adornment.

16
CHAPTER II
REVIEW OF LITERATURE
This chapter reviews relevant literature and research.
The following four topics are covered: culture, ethnicity,
and clothing behavior, intensity of ethnic identification,
Asian Americans and shopping orientations. In the end, the
shopping orientations used in this study are specified and
discussed.
Culture, Ethnicity And Clothing Behavior
The multimediation model of consumer behavior proposed
by Engel, Kollat and Blackwell (EKB model) (1973) was used
as a theoretical framework for this study. Figure 1. is an
illustration of the complete EKB model.
The term "multimediation" as applied to this model of
consumer behavior refers to the fact that many processes
intervene or mediate between exposure to a stimulus and
final outcomes of behavior. The EKB model suggests that
four types of variables affect the extent of decision-
making. They are situational variables, product
characteristics, consumer characteristics and environmental
factors. As one characteristic of environmental factors
which influence consumer behavior, culture was the focus of
this study.

Figure 1
The EKB Model (Engel et al, 1973, p.58)Complete Model of Consumer Behavior Showing
Purchasing Processes and Outcomes
Information Processing Central Control Unit
ExternalSearch I
JL_
Attention
Comprehension
Retention
r
Informationand
Experience
EvaluativeCriteria
Attitude
c
Information' FeedbackL
rI
r--
ProblemRecognition
9Internal Search
andAlternativeEvaluation
Hold
EnvironmentalInfluences
Income
Culture
Family
SocialClass
Physical
Other
.
4External Search
andAlternativeEvaluation
Hold
4
Purchasing
Processes
Outcomes
Hold
PostpurchaseEvaluation
FurtherBehavior
OutputDecisionProcess
17

18
In this model, culture plays an important role in
influencing consumer behavior. Culture refers to
...the complex of values, ideas, attitudes, andother meaningful symbols created by men to shapehuman behavior and the artifacts of that behavioras they are transmitted from one generation to thenext. (p. 72)
Engel et al. (1973) stated that culture is the
underlying determinant of human decision-making. A
realistic analysis of consumer behavior must include
understanding of the cultural context which molds human
desires and shapes human decision-making. Based on the
theoretical framework of the EKB model, it is expected that
people of different cultural backgrounds are different in
terms of their consumer behavior.
As one of the social and cultural influences, ethnicity
exerts influence on consumer behavior. Engel, Blackwell and
Miniard (1986) further explored ethnicity as a sub-culture,
although the term "sub-culture" was avoided because of the
connotation of "sub" with "inferior". The norms and values
of specific groups within the larger society are called
ethnic patterns. Individual consumers may be slightly
influenced through identity with ethnic groups or the ethnic
group may be a dominant force on the life style and
consumption patterns of an individual (Engel, Blackwell &
Miniard, 1986).
The term "ethnicity" refers to shared culture and

19
background (Bahr, Chadwick, & Stauss, 1979). Ethnic groups
may be formed around nationality, religion, physical
attributes, geographic location or other factors (Engel,
Blackwell and Miniard, 1986). The essential determinant of
ethnic group membership is social identification. If the
group identifies a person as similar enough to belong to it,
and if that person identifies with that group, then he or
she belongs to that group, whatever his or her real ancestry
may be (Bahr, Chadwick, & Stauss, 1979). Hence, an ethnic
group may include members of various racial or nationality
groups (Mcdonagh & Richards, 1972).
Many studies have focused on the relationship between
ethnicity and consumer behavior (Choe, 1984; Feldman & Star,
1968; Gillett & Scott, 1974; Henry, 1976; Hirschman, 1981).
The investigation conducted by Hirschman (1981) clearly
indicated that ethnicity (Jewish or otherwise) is a variable
of potential influence on marketing and consumption. The
more an individual consumer identified with an ethnic group,
the greater the influence was likely to be. Hirschman
further suggested that marketers who desire to understand
consumers in a more predictive and comprehensive manner may
find it useful to view ethnicity as a determinant of
consumption patterns.
According to Engel, Blackwell and Miniard (1986),
values are "...shared beliefs or group norms that have been
internalized by individuals." (p. 363). As values affect

20
behavior and the decisions an individual makes, the study of
values is also of interest to researchers who wish to
understand particular aspects of behavior, such as clothing
behavior. Creekmore (1963) completed an exploratory study
in regard to clothing behavior, human needs and general
values. The results showed that clothing behavior and
attitudes were related to certain needs and certain general
values.
Blumer's (1969) human collective theory suggests that
fashion is a process of collective selection and formation
of collective tastes among a mass of people. Blumer also
argued that fashion leadership is no longer confined
strictly to the upper class. In her book of The Social
Psychology of Clothing, Kaiser (1985) stated:
The purchase and use of clothing (symbolicconsumption) by collective groups of peoplelargely reflects cultural norms and social values.Clothing norms are forms of collectivebehavior....Collective clothing behavior hasimplications for the manufacturing and marketingof apparel products, as well as for a basicunderstanding of cultural aesthetics.(p. 9)
It has been widely accepted that dress varies from one
culture to another (Roach & Eicher, 1965). Cultural values
are expressed through material objects, such as clothing.
Clothing can be a valuable tool in the study of different
cultures. Conversely, culture or ethnicity can be used as a
variable to study clothing behavior. Clothing values have
been shown to be positively related to general values, and

21
also have been shown to influence clothing interest and
selection (Creekmore, 1963; Lapitsky, 1961). Ryan (1966)
noted that:
Values are derived from an individual'sexperience, part of which is determined by theculture in which he lives. Thus certain valueswill be commonly held by members of a specificculture.... and they operate in determiningclothing choices and clothing behavior. (p.98)
Therefore, shopping for apparel is one type of behavior that
is part of an overall life pattern; it reflects attitudes
toward fashion, shopping behavior and store patronage, as
well as, broader values and interests (Tatzel, 1982).
In a qualitative research study on the Karen, a tribe
in northwest Thailand, Hamilton and Hamilton (1989)
described Karen dress in relation to culture. The data were
collected in a field study from 1959 to 1960. The results
suggested that dress may serve as a symbolic metaphor of the
relationship of the individual to the cultural system.
In a cross-cultural study comparing Korean and American
fashion leaders, Schrank, Sugawara and Kim (1982) sampled
college women in Korea and the United States respectively.
The results implied that there were different attitudinal
and socioeconomic characteristics between these two samples
despite their similar fashion leadership characteristics.
Chen (1970) compared clothing attitudes of a group of
female college students at National Taiwan University and
Pennsylvania State University respectively. Also Chen

22
explored the relationship between rigidity and clothing
attitudes. Rigidity was defined in her study as the
"...relative inability to change one's action or attitude
when the objective conditions demand it." (p.72). The
results showed that the Chinese group was more conforming,
conservative and in favor of expressing status through
clothing and also in favor of less exposure of the body than
the American group.
Chowdhary and Dickey (1988) examined the concept of
fashion leadership among college women in India by assessing
the attention given to media exposure. The sample consisted
of 509 college women from four universities in northwestern
India. The findings revealed that fashion opinion leaders
used significantly more sources of fashion information and
more often than nonleaders. Most of the findings were
consistent with Western literature regarding the fashion
adoption process. But the author concluded that the role of
parents and family members in legitimating the fashion
choices of the respondents did reflect a cultural
difference.
The black ethnic group has received the most research
attention in the U. S. in regard to clothing. Previous
research has suggested that black consumers were more
fashion-conscious, more fashion-innovative, and more likely
to be fashion opinion leaders than whites. After two
decades since the pioneering studies were conducted, legal,

23
social, and economic changes may have altered these
relationships (Goldsmith, Stith, & White, 1987).
Goldsmith, Stith and White (1987) re-examined sex and
racial influences on fashion attitudes. The findings
suggested that within the middle class, levels of fashion
consciousness and fashion innovativeness in blacks and
whites may be closer than they were in the past. The
results also supported the generalization that middle-class
blacks are no more innovative than middle-class whites.
The authors also suggested that a linear measurement of
ethnicity, rather than the categorical measure of race,
should be included. The measurement of ethnicity can lead
to finer segmentation than the categorical measure of race.
Ethnicity allows the researcher to measure a deep feeling
and value orientation toward oneself.
Dardis, Derric and Lehfeld (1981) investigated the
factors influencing clothing expenditures by households in
the United States using the data from the 1972-1973 Bureau
of Labor Statistics Consumer Expenditure Survey. The
results indicated expenditures were positively related to
income and education and negatively related to age of
household head. Also ethnicity was found to be a major
variable. Households headed by non-blacks, other variables
held constant, spent from 20 to 30 percent less on clothing
than did households headed by blacks.
Besides the cross-cultural studies of people in

24
different countries, an understanding of clothing behavior
would be enhanced by examining the clothing behavior of
different ethnic groups that have migrated to another
country (Senga, Brown, & Gonzales, 1987). Senga, Brown and
Gonzales assessed the relative importance of culture as an
influence on clothing values by sampling 500 Filipino women
in Winnipeg, Canada.
The results demonstrated that culture is one of the
social variables that influences individual decision-making
and clothing values. The results were further compared to
Mendoza's (1965) cross-cultural study regarding clothing
values and general values of women attending the Filipino
University in the Philippines. With a time lapse of 20
years between these two studies, the values of the Filipinos
in Canada were quite similar to those of the Filipino
University women in the Philippines. This similarity was
explained by the authors to be a result of much western
influence in the Philippines. Therefore, cultural changes
after immigration were not marked.
Hoffman (1982) studied the clothing transitions of the
Mien, who immigrated from Laos (Southeast Asia) and settled
in Portland, Oregon. The purpose of her study was to
provide historical documentation of a unique period of
transition in Mien history as well as to explore the
interplay between dress, ethnicity and acculturation.
Literature survey, questionnaire, open-ended interview and

25
participant observation were used as methods to collect data
on thirty Portland Mien subjects.
The results of Hoffman's study indicated that the
Western garb has largely replaced traditional garments for
everyday use by all Portland Mien, except the elderly. Also
dress was found to be indicative of the maintenance of
ethnic identity, which meant that the subjects who fully
identified (versus partially identified) with the ethnic
group used traditional clothing more frequently. In her
study, ethnic identification was measured by religion,
holiday celebration, food preference, household living
patterns and English proficiency.
Also, the results of Hoffman's study supported the
acculturation theory proposed by Linton (1945) that tangible
objects were more easily adopted than intangible things such
as patterns of behavior. In some cases, incomplete patterns
of usage of adopted elements were observed. For example,
wristwatches, were worn without use as a timing mechanism;
shoes were worn, not to protect the feet but to impress
onlookers. Therefore, the researcher concluded that forms
may be transferred before meanings associated with the
forms.
Sletten and Petrich (1983) investigated clothing
problems as perceived by Mexican American migrant women.
Personal interviews were conducted throughout Wisconsin,
Minnesota and North Dakota. Six general problem categories

26
were established and a questionnaire was designed to obtain
data. The study revealed that the perceived problem
category that Mexican migrants encountered most often was
"quality" and they needed more knowledge and skill to
identify quality of clothes. However, overall, Mexican
migrant women did not perceive themselves as having
encountered many clothing problems.
Clothing practices of Korean female immigrants in
Chicago were studied by Kwon (1982). The data were
collected from 219 Korean female immigrants in Chicago. The
results revealed that the frequency of usage of western
dress over Korean traditional dress was significantly
related to pre-immigration factors, such as level of
education and work experience in Korea. The transition from
Korean made dress to American dress was found to be
significantly related to the post-immigration factors, such
as work experience and number of years of stay in United
States. These findings suggested that the sudden change of
cultural environment has a definite impact on the
abandonment of Korean traditional dress.
Intensity of Ethnic Identification
Cross-cultural studies in the U.S. often pre-select the
ethnic groups and simply assign subjects into them (Tan &
McCullough, 1984). The common assumption is that subjects

27
of an ethnic group are alike in cultural values and
orientation, and they are different from subjects of another
ethnic category (Tan & McCullough, 1984). Such an
assumption is easily challenged. Linton (1945) pointed out:
Actually, it would be impossible to find anyelement of culture which had been shared byall members of a society throughout that society'sentire duration. Cultures change and grow,discarding certain elements and acquiring newones in the course of their history. (p. 36)
Prior research concerning the effects of ethnicity upon
consumer behavior may be characterized as primarily
descriptive in nature and having inadequate controls for the
degree of ethnic identification (Hirschman, 1981).
Hirschman (1981) tested five hypotheses concerning Jewish
ethnicity. The subjects were asked to indicate how strong
their identification was with the group they had identified
using a five point scale ranging from very strong to very
weak. Moreover, subjects were asked to indicate with which
of five religious categories they were affiliated.
Therefore, ethnicity was measured multi-dimensionally for
each individual, first as ethnic/racial identification and
second as religious affiliation. Further, degree of
ethnicity as perceived by the individual was measured for
both dimensions.
The data suggested that the higher one's Jewish
ethnicity, the greater the adherence to norms favoring
innovativeness and the higher the level of innovativeness

28
expressed by the individual. It was also concluded that
ethnicity, Jewish, or otherwise, should perhaps be viewed as
a variable having large potential influence on marketing and
consumption.
Tan and Farley (1984) studied the relationship between
ethnic attitudes and consumption values in a Chinese society
of Singapore. By the researchers' observation, consumers in
Singapore can be divided into the more traditionally Chinese
shoppers versus those that are more Westernized. It was
proposed by the authors that the "more Chinese" consumers
are thrifty, quality minded, spend less on conspicuous items
and shop more at stores that carry Chinese goods. On the
contrary, the "more Westernized" Chinese consumers tend to
be sophisticated, brand name conscious and have shopping
habits more like their Western counterparts.
The researchers conducted a survey of 132 subjects in
Singapore. Several questions regarding one's attitudes
toward tradition and Confucian norms were included to
measure ethnicity. The Rosenbeiv expectancy-value model was
adopted in this study to measure value importance of four
product attributes: price, quality, brand image and
convenience (brand availability).
The results of the study indicated that price and image
attributes exhibit significant overall differences between
low ethnic attitude and high ethnic attitude groups. In
general, the low group or those more Westernized, place

29
greater value on image and convenience importance. The high
group or those more traditional in Chinese values, placed
more importance on price and quality. The results of this
study suggested that within a given ethnic group there will
be differences in consumption values. To conclude, Tan and
Farley invited more research on differences in actual
consumption patterns within an ethnic group.
Recognizing the fact that there was no measure of the
intensity of affiliation with an ethnic group, Deshpande,
Hoyer and Donthu (1986) studied the sociology of Hispanic
consumption with the intensity of ethnic affiliation. The
concept of intensity of ethnic identification leads to the
belief that consumption-related differences might exist
between strong or weak identifiers.
In their study, ethnicity was operationalized with two
questions. First, subjects were asked to indicate the
ethnic or racial groups to which they belonged. Second,
they were asked to indicate how strongly they identified
with this ethnic group. Accordingly, subjects were
classified as strong Hispanic identifiers or weak Hispanic
identifiers with very few respondents falling in the middle
of the five-point scale.
The results appeared to confirm the importance of using
the intensity of ethnic identification as a measure of
ethnicity. Not only were there the expected differences
between the dominant Caucasian group and the entire Hispanic

30
group, but the latter group itself was found to be
heterogeneous. Differences between Hispanics appeared to be
especially strong in terms of their attitudes toward
institutions, use of Spanish-language media, brand loyalty
and preferences for prestige and ethnically advertised
brands. To some extent, there appeared to be more
similarity between weak Hispanic identifiers and Caucasians
than between the two Hispanic groups.
Asian Americans
A major portion of the research on Asian Americans has
investigated psychological or sociological aspects. Asian
Americans have been studied on various topics, such as
immigration history, assimilation, academic achievement,
socioeconomic achievement, residential segregation, self
concept, sexual experience and attitude, family
characteristics, labor force participation and counseling
practices. Other cross-cultural research studies have been
conducted to compare Asian Americans with other ethnic
groups, such as whites, blacks or Hispanics (Hirschman &
Wong, 1984; Thornton & Taylor, 1988).
For example, in a study examining the passive-
methodical image of Asian American students, Bannai & Cohen
(1985) found that Asian students were better listeners,
better organized in what they said and more tolerant of

31
differences, but less capable of leadership and verbal
communication. By comparing family characteristics of Asian
American and white high achievers, Yao (1985) concluded that
the family life of Caucasian-American students tended to be
less structured and provided less formal educational
experience for children after school and on weekends.
There has been limited research on the consumer
behavior of Asian Americans as a group. Gim (1988)
investigated Asian women's clothing acquisition behaviors
and compared their body measurements with the measurements
listed in the Voluntary Product Standard, PS 42-70, which is
a set of body measurements published by the Bureau of
Standards to aid in consistent sizing of women's ready-to-
wear apparel.
In Gim's study, a questionnaire was administered to 101
Asian women residing in Tucson, Arizona. The results
suggested that Asian women patronized department stores more
frequently than other types of stores. The study also found
that Asian women were not impulsive buyers or influenced by
suggestive selling techniques. Fit was the most important
consideration in purchasing a garment and newspapers were
the major information source of apparel fashion for Asian
women.
Gim's (1988) study also showed significant fitting
problems in garment length when Asian women purchased ready-
to-wear clothing. Larger differences were found in the

32
vertical than in the circumference body measurements for
Asian women when the means of those body measurements were
compared with those of the PS 42-70 measurements.
Forney and Rabolt (1986) conducted a study on the
relationship between ethnic identity and contemporary dress.
This study investigated ethnic identity as it relates to
traditional ethnic dress patterns, and use of ethnic
reference persons and ethnic market sources as information
on contemporary dress. A sample of 117 students identifying
with one of seven ethnic groups was analyzed as a pooled
group with separate analyses for the Chinese and Japanese.
Results indicated a relationship between ethnic
identity and ethnic dress usage. Individuals with higher
ethnic identities used family, ethnics other than family,
ethnic fashion magazines, and ethnic fashion shows as
sources of information on dress. No significant differences
were found between the Chinese and Japanese with their use
of ethnic reference persons and ethnic market sources as
information on dress.
Although the study of Asian Americans' clothing
behavior has received only slight attention, the studies of
Japanese, Chinese, Filipino and Korean Americans' general
consumer behavior provide valuable insight into Asian
Americans shopping behavior. In a study comparing blacks',
Japanese-Americans' and whites' adoption patterns for three
product categories - food, clothing and appliances;

33
Robertson, Dalrymple & Yoshino (1969) found that high-income
Japanese Americans were most likely to be small appliance
innovators. Conversely, low income Japanese-Americans and
blacks were more likely to buy food innovations than were
high income consumers in these categories. In general,
whites appeared to own more total innovations, followed by
Japanese-Americans and then blacks.
Shopping Orientations
Another theoretical framework used in this study was
the concept of shopping orientation, introduced by Stone
(1954). In his pioneering study on city shoppers and urban
identification, Stone categorized urban shoppers by four
types of shopping orientations: economic, personalizing,
ethical and apathetic. Stone (1954) defined orientation as
" the theme underlying the complex of social roles performed
by an individual" (p. 37).
Using in-depth interviews with 124 female department
store shoppers, Stone found that each type of shopper is
distinguished by a specific pattern of social
characteristics reflecting her position in the social
structure of her residential community. Economic shoppers
were characterized by a careful approach to shopping, giving
more attention to merchandise variety, price and quality.
Personalizing shoppers appeared to seek personal

34
relationships with retail personnel. Ethical shoppers were
found to be more willing to sacrifice lower prices and wider
assortments to behave consistently with moralistic beliefs,
such as "helping little retailers". Finally, apathetic
shoppers were not interested in shopping and viewed shopping
as a necessity. In an attempt to supplement the theories on
urban identification, Stone suggested that personalizing
shoppers drew on their relationships with clerks to form
subjective identifications with a community.
In order to measure buyer attributes more germane to
the purchase situation, shopping orientations were studied
in relation to shopping behaviors, such as product usage
rates (Darden & Reynolds, 1971), uses of information
(Moschis, 1976) and store patronage (Darden & Ashton, 1974-
1975; Stephenson and Willett, 1969). In an analysis of
consumers' shopping and patronage behavior, Stephenson and
Willett (1969) presented a taxonomy of consumers shopping
styles by four orientations: store loyal, convenience,
compulsive/recreational and price/bargain conscious.
Different from the previous study, in which shopping
orientations were determined by shoppers' attitudes,
feelings and opinions, the orientations Stephenson and
Willett proposed were based upon actual patronage and
shopping behavior. Their study focused on six product
categories. Personal interviews, telephone interviews and
mail questionnaires were used as data collecting methods.

35
In their study, the data collected from the subjects
included: the specific store patronized, dollar value of the
purchase, method by which the purchase was paid, whether the
item(s) was/were on sale, etc. The focus of the study was
the relationship between shoppers' orientations and the
major transaction characteristics, such as method of
payment. The authors concluded that by studying the
differences among consumer's shopping orientations, instead
of their demographic and psychographic characteristics, a
meaningful relationship between shopping orientations and
patronage behaviors could be established.
Darden and Reynolds (1971) explored the importance of
shopping orientations to patterns of product usage. One
hundred and sixty seven housewives of middle to upper middle
class in Athens, Georgia were sampled. Data were collected
on the usage rates of twelve health and personal care
products. Psychographic scales were developed to measure
five shopping orientations. The results indicated that
economic shoppers had high usage rates of products which
were socially visible or produced socially visible effects,
such as liquid face makeup base and hair spray. Apathetic
shoppers used a lot of medicated face makeup base and hair
shampoo and were less likely to use hair spray or cream
deodorant.
Moschis (1976) investigated six shopping orientations
in relation to six functional variables of communication

36
behavior. The six shopping orientations were: special
shopper, brand-loyal shopper, store-loyal shopper, problem-
solving shopper, psycho-socializing shopper and name-
conscious shopper. The six functional variables were
sources of information, source credibility, preferences for
kinds of information, quality of media used and types of
media used.
It was found by Moschis that shoppers possessing
different orientations exhibited different communication
behavior. It was concluded that the concept of shopping
orientation can be used to segment a market and is a
valuable approach to retail strategy formulation.
Darden and Ashton (1974-1975) explored another aspect
of the interface between shopping orientation and store
patronage. It was hypothesized that there were groups of
shoppers with distinctly different supermarket attribute
preference profiles, and those attribute preference groups
had different shopping orientations. As a result, six
preference groups were identified and the data indicated
that traditional marketing variables, such as age, education
and income were not significantly different among the seven
preference clusters. The results showed that patronage can
be segmented by store attribute preferences and that these
preference groups have different shopping orientations.
Different from the previous studies, in which shopping
orientations were defined or measured by shoppers'

37
attitudes, feelings, opinions or patronage behavior,
Westbrook and Black (1985) developed a motivation-based
shopper typology. The authors proposed a theoretical model
of shopping motivations. The authors stated that
motivations are relatively enduring characteristics of
individuals, hence manifesting themselves on a regular basis
over a wide range of shopping occasions.
In their study, personal interviews were conducted with
a sample of 203 adult female shoppers of department stores
in Tucson, Arizona. Structured questionnaires were
administered by trained professional interviewers.
Operational definitions for underlying motivations were the
levels of satisfaction received by consumers from various
outcomes and aspects of shopping behavior.
The analysis of the data suggested seven motivation-
based shopping orientations: anticipated utility of
prospective purchases, enactment of an economic shopping
role, negotiation to obtain price concessions from the
seller, optimization of merchandise choice in terms of
matching shoppers' needs and desires, affiliation with
reference groups, exercise of power and authority in
marketplace exchanges and sensory stimulation from the
marketplace itself. While modestly successful in confirming
the existence of theoretically rooted dimensions of shopping
motivation, the authors also pointed out the difficulty of
measuring shopping motivations.

38
In order to develop a "policy" oriented typology of
shoppers, a study was conducted by Williams, Painter and
Nicholas (1978) to examine grocery shoppers with four
shopping orientations: involved, convenience, price and
apathetic. The four orientations stem from customer
involvement along either the "price" or "customer service"
store policy dimensions. In this study, four major types of
shoppers were identified with each group representing a
unique shopping orientation.
Owing to the changing consumer and environment,
Bellenger and Korgaonkar (1980) added another dimension,
recreational shopping, to the shopping orientations
postulated by previous studies. It was suggested that
viewing shopping orientations in terms of alternative uses
of time and preferences may be very helpful in classifying
shoppers and can be generalized across different retail
settings.
Holbrook and Hirschman (1982) also recognized the
important experiential aspects of consumption. Since the
study of consumer behavior has evolved from an early
emphasis on rational choice (microeconomics and classical
decision theory), phenomena including various playful
leisure activities, sensory pleasure, daydream, aesthetic
enjoyment and emotional responses had been ignored. In
contrast with information processing models, Holbrook and
Hirschman recognized and focused on the symbolic, hedonic

39
and aesthetic nature of consumption. This view regards the
consumption experience as a phenomenon directed toward the
pursuit of fantasies, feelings and fun.
Bellenger and Korgaonkar (1980) took the time-related
shopping orientation into account and suggested a two-fold
shopping orientation: economic (convenience) versus
recreational. Recreational shoppers were defined as those
who enjoyed shopping as a leisure-time activity. Shopping
enjoyment was used as a dependent variable in their study
and 69 percent of the 224 respondents fell into the
recreational shopper segment. The researchers concluded
that it could be a significant force in the retail market.
The analysis also showed that recreational shopping and
information seeking were closely associated.
Korgaonkar (1981) was the first to study a specific
type of retail institution in relation to general shopping
orientations. In the 1970s the catalog showroom experienced
rapid sales growth. Korgaonkar studied and developed a
profile of catalog showroom patrons based on customers'
general shopping orientations and the showroom's method of
operation. The results indicated that catalog showrooms
were successful in attracting economic shoppers, rather than
recreational shoppers.
Among all the shopping orientations suggested by
various studies, convenience-oriented consumers were singled
out and studied by Anderson (1971) Convenience-oriented

40
consumers were identified by patterns of convenience food
consumption and use of durable goods. It was concluded that
consumers with convenience orientation can be identified.
Second, stages in the family life cycle and socioeconomic
status are significant determinants of convenience
orientation. Third, annual family income alone is not
sufficient to explain convenience orientation.
"Deal-prone" consumers were studied by Webster (1965).
Deal orientation was defined as a function of both.the
consumer's buying and the frequency with which a given brand
is sold on a deal or bargain basis. In this study, the
measure of consumer deal orientation was developed and then
the measure was analyzed in relation to families'
demographic, socioeconomic and purchasing characteristics.
The results obtained, accounted for only a small amount of
the variability in deal orientation. The results also
indicated that deal-orientation tended to increase with age
and high-deal oriented consumers switched brands more
frequently.
Taking spatial aspects of consumer shopping behavior
into consideration and identifying outshoppers as one type
of shoppers, Darden and Perreault (1976) studied outshoppers
by various outshopping orientations. Based on the broad
definition of outshopping as shopping outside town, the
authors operationalized outshopping by types of purchases
and their dollar magnitude. Outbuying behavior across 13
41
product categories was analyzed to determine whether there
were natural outshopping types. Five outshopping groups
were suggested in this study and outshoppers were found to
be, in general, more fashion conscious and demonstrated
greater patronage innovative behavior.
To examine the perceptual and preference dimensions of
television programming, Lumpkin (1980) related television
preference viewing to shopping orientations and life-styles.
One of the objectives of the study was to identify segments
which have similar television program preferences and
investigate how these preference groups differ with respect
to shopping orientation and life-style.
The data was gathered through the Arkansas Household
Research Panel using a self-administered questionnaire.
Multivariate Analysis of Variance indicated that the
preference groups differed with respect to life-styles and
demographics but not in shopping orientations. These
results suggested that there was not a direct link between
shopping orientations and television viewing.
Miller (1982) studied sex-role orientation (SRO) in
relation to shopping and lifestyles. Since marketers had
been convinced that a relationship exists between sex-role
and various aspects of buyer behavior, one of the purposes
of Miller's study was concerned with how SRO relates to
individual shopping orientations.
The analysis of data suggested two different SRO
42
groupings: the "traditional" and the "nontraditional". The
shopping orientations of these two groupings were very
different; the "traditional" grouping enjoyed the shopping
process, while the "nontraditional " grouping did not. This
finding was thought by the researcher to be significant for
marketing managers.
In summary, the general goal of shopping orientations
research has been to identify a limited set of distinct
shopper types to which retailers and marketers may direct
differentiated marketing efforts (Westbrook & Black, 1985).
Many of these studies have suggested that shopping behavior
is better predicted by those measures, which are closer to
the marketing function (Stephenson & Willett, 1969; Darden &
Ashton, 1974-1975 ; Moschis, 1976).
The orientations which have been used most frequently
are: economic, personalizing, ethical, apathetic, store
loyal, brand loyal, convenience, compulsive and
recreational. It was also demonstrated in many studies
(Stone, 1954; Darden & Reynolds, 1971; Moschis, 1976) that
shoppers may possess more than one orientation
simultaneously.
It was also found that the term "shopper types" was
used in many studies interchangeably with "shopping
orientations" for the same concept. The bases which were
used to determine shopping orientations or shoppers' types
include shoppers' attitudes, feelings and opinions, shopping

43
behavior, psychographic measurement, extent of shopping
enjoyment or underlying motivations. The product categories
or activity investigated in these studies ranged from
individual product classes (e.g., cosmetics), broad product
assortments (e.g. grocery products or supermarket products),
shopping centers and shopping as a general activity
(Westbrook & Black, 1985).
Another dimension of studying shopping orientations has
been to compare differences among ethnic groups in their
shopping orientations, such as Hispanics compared to
Caucasians in the United States (Bellenger & Valencia, 1982;
Valencia, 1982) or Korean immigrants compared to whites
(Kim, 1987).
Boone, Kurtz, Johnson and Bonno (1974) conducted a
cross-cultural experiment based on the Stone (1954) study
and the results revealed important variations in shopper
orientations. The purpose of their study was to examine
similarities and differences that might exist between
different ethnic groups (Mexican-American compared to white)
residing in different areas of the United States.
A sample of 147 middle-class white households and 317
middle-class Mexican-American households were drawn from two
suburban areas of different states: Oklahoma and Texas. A
questionnaire containing 13 statements with Likert-type
scales was used to measure shopping orientations in the
purchase of health and personal care items.
44
The findings suggested that the percentage of ethical
shoppers had decreased during the 20 years since Stone's
(1954) study. Moreover, it was found that the differences
in shopping orientations between Caucasian and Mexican-
American shoppers were striking. The percentage of
apathetic and personalizing shoppers among Mexican-Americans
was less than that of Caucasian-American shoppers.
Valencia (1982) focused his study on consumer shopping
orientations because of the practical and theoretical
implications of delineating an ethnic shopper portrait. The
purpose of his study was to investigate the consumer
behavior of the rapidly growing Hispanic minority in the
United States. A cross-cultural sample of 482 respondents
were drawn from New York, Los Angeles, Miami and San Antonio
using a mail questionnaire. Special procedures were
exercised in the research method to ensure cross-cultural
comparability of the shopping orientation scales.
Additionally, a test for cultural value orientations was
conducted to validate the assumption that the two ethnic
groups are indeed culturally different.
It was found that Hispanics and Caucasians, as consumer
groups, differ significantly in their shopping orientations.
The differences in shopping orientations can be attributed
to ethnic cultural differences rather than socioeconomic
status. Also, it was found that high-socioeconomic and low-
socioeconomic status Hispanics and Caucasians differ from

45
each other along parallel shopping orientations. Moreover,
the four major Hispanic subgroups appeared to be
heterogenous in their shopping orientations.
Hispanics were reported (Bellenger and Valencia, 1982)
to be more likely to shop at smaller stores, dislike
impersonal stores and were cautious (do not buy unknown
brands). They were less likely to be skeptical of
advertisements, were venturesome, impulse buyers, apathetic
about shopping and credit card holders.
Another cross-cultural study of shopping orientations
was conducted by Kim (1987). This study examined the
shopping orientations of Korean immigrants in comparison to
that of whites. Eleven specific shopping orientations were
used: brand loyalty, national brand proneness, shopping
interest, coupon proneness, advertised/special shopper,
unplanned purchasing, ethical shopper, shopping center
enthusiast, economic shopping, personalizing shopping and
shopping sex-roles.
The cross-cultural sample included 147 Korean
immigrants and 167 whites and special procedures such as
Korean translation and back-translation were exercised to
insure the reliability and validity of the measure. The
major conclusion was that Korean immigrant shoppers
manifested certain shopping behaviors that could be
distinguished from that of whites.
Other findings of Kim's (1987) study are as follows:

46
Korean immigrants had stronger national brand proneness than
whites; Whites were more coupon oriented than Korean
immigrants; Korean immigrants were more ethically oriented
than whites; Korean immigrants more strongly perceived the
importance of shopping as a part of the woman's role than
whites. Korean immigrants were more interested in shopping
at shopping centers than whites.
Shopping orientation has also been used as a tool to
study apparel shopping behavior and fashion market
segmentation. For example, Lumpkin and Greenberg (1982)
investigated the shopping patterns of the elderly by
focusing on shopping orientations, information sources and
patronage behavior. In this study, a national probability
sample was used.
The authors found the shopping orientations of the
elderly and the importance they attach to various store
attributes provide insight into their shopping behavior
patterns. The results indicated that the elderly tended to
enjoy shopping (recreational type of shoppers) and enjoyed
interacting with store personnel (personalizing oriented).
They were not very price conscious and did not have a
propensity to shop around compared to their younger
counterparts. To the elderly, store reputation was more
important than apparel brand name.
An integrative analysis was conducted by Gutman and
Mills (1982) studying the relationship between fashion life-

47
style, shopping orientations, self-concept and demographics
as these relate to store patronage and shopping behavior.
Sponsored by the Los Angeles Times, around 6300 female
subjects responded from eleven major geographic areas of Los
Angeles.
One of the four instruments used in this study was the
Fashion Life-style Battery composed of "general shopping
behavior orientation" and "fashion orientation". The
development of the instrument was guided by previous
research on the underlying dimensionality of the fashion
spectrum and the fashion change-agent process. Seven
profiles of target segments emerged as a result of scores on
the fashion-orientation factors. The analysis of these
fashion segments related self-concept and shopping
orientation to store patronage. The results were regarded
by the investigators to have immediate, specific
applications for fashion retailers.
Shopping Orientations for the Present Study
Today, there is no generally accepted set of shopping
orientations (Kim 1987; Valencia, 1982). Many recent
studies have selected shopping orientations that are
meaningful to the researchers' purposes or that could be
applied to test hypotheses derived from prior research
(Valencia, 1982).

48
In selecting the set of shopping orientations for the
present study three criteria were used. First, the selected
shopping orientations had an empirical research foundation.
Second, the selected shopping orientations were judged to be
pertinent to apparel shopping. Third, based on previous
research findings, the selected shopping orientations were
expected to be the ones distinguishing Asian Americans from
Caucasian Americans. However, since most of the shopping
orientations previously tested were not specifically
designed for apparel items, measures of shopping
orientations were modified for apparel shopping
considerations.
Based on the above criteria, the following seven
shopping orientations were selected: economic shopping,
personalizing shopping, recreational shopping, brand loyal
shopping, social shopping, impulse shopping and fashion
orientation. Each orientation and the rationale for
selection are discussed below.
Economic Shopping
This shopping orientation is primarily directed to the
purchase of the goods. As such, an economic oriented
shopper evaluates stores and products (apparel items, in
this study), in terms of price, quality, value and
merchandise assortment. Store personnel are merely a
vehicle for the expedient processing of the sale. This is
one of the most widely used shopping orientations in related

49
research, no matter what category of product was being
studied.
Personalizing Shopping
The personalizing shopper is defined as one whose
shopping behavior is fundamentally and positively
interpersonal (Stone, 1954). Shoppers with this orientation
tend to develop personal relationships with store personnel,
relationships which in turn determine store selections.
Other store attributes are secondary to their personalizing
preferences.
This is also one of the most widely used shopping
orientations in previous research. In addition, it has been
reported that Asian Americans tend to buy from people or
companies that speak their language and understand their
culture (Edmondson, 1986). Therefore, it was probable that
personalizing shopping was one of the orientations that
distinguished Asian American shoppers from Caucasians.
Recreational Shopping
This shopping orientation was first proposed by
Bellenger and Korgaonkar (1980). Recreational shoppers were
defined as those who enjoyed shopping as a leisure-time
activity. This orientation can differentiate recreational
apparel shoppers (shopping for apparel as fun) from
utilitarian or economic apparel shoppers (shopping for
apparel as a necessity).
In the present study, this orientation measured the
50
enjoyment of shopping for apparel. Bellenger and Valencia
(1982) found a significant ethnic effect on the shopping
interest orientation, which can be interpreted as the
recreational orientation in this study.
Social Shopping
This shopping orientation measures the degree of
shopping as a social activity. For example, the social
shopper is likely to shop with friends, discuss shopping
matters with friends and to combine shopping with eating at
a restaurant.
It was reported that the Chinese preferred shopping in
large family groups, with buying decisions usually made by
the family elders (Kotkin, 1987). By examining Asian
Americans on this orientation, the above mentioned Chinese
shopping habit was studied for its generalizability to all
Asian Americans.
Brand Loyal Shopping
Brand loyal shoppers tend to have biased choice
behavior toward particular brands of merchandise (apparel)
while shopping. Westernman (1989) reported that minority
consumers typically had strong brand loyalties and they were
willing to pay extra for name brands.
It has been widely argued that Hispanics are brand-
loyal because heads-of-households feel pride in providing
the best for their families (Passante, 1976). Valencia's
(1982) research findings supported the hypothesis that there

51
were significant differences in patronage loyalty
orientations between Hispanics and Caucasian Americans.
Black and other low-income groups have generally been
described as brand-loyal, possibly as a means to reduce
perceived risk (Valencia, 1982). Kim's (1987) study
evidenced that Korean immigrants have stronger national
brand proneness than whites.
Impulse Shopping
This shopping orientation measures the tendency to buy
products (apparel in this study) on the spur of the moment
without planning beforehand. This shopping orientation was
explored and first proposed by Valencia (1982).
Bellenger and Valencia (1982) found significant ethnic
background and income effects on this shopping orientation.
In Gim's (1988) study of Oriental female immigrants'
clothing behavior, the subjects were found to be less likely
to be impulse clothing shoppers. These data indicate strong
support for including this orientation in the present study.
Fashion Orientation
This orientation was specifically selected because of
the nature of this study. According to Gutman and Mills'
(1982) study, "fashion" referred to a set of activities
revolving around spending money and other resources to keep
up to date with what is fashionable in clothing.
In their study, four factors were identified for
fashion orientation: fashion leadership, fashion interest,

52
fashion importance and antifashion attitude. These factors
were used in the present study to examine the subjects'
fashion orientation. The following chapter outlines the
method being implemented to accomplish the objectives of
this study.
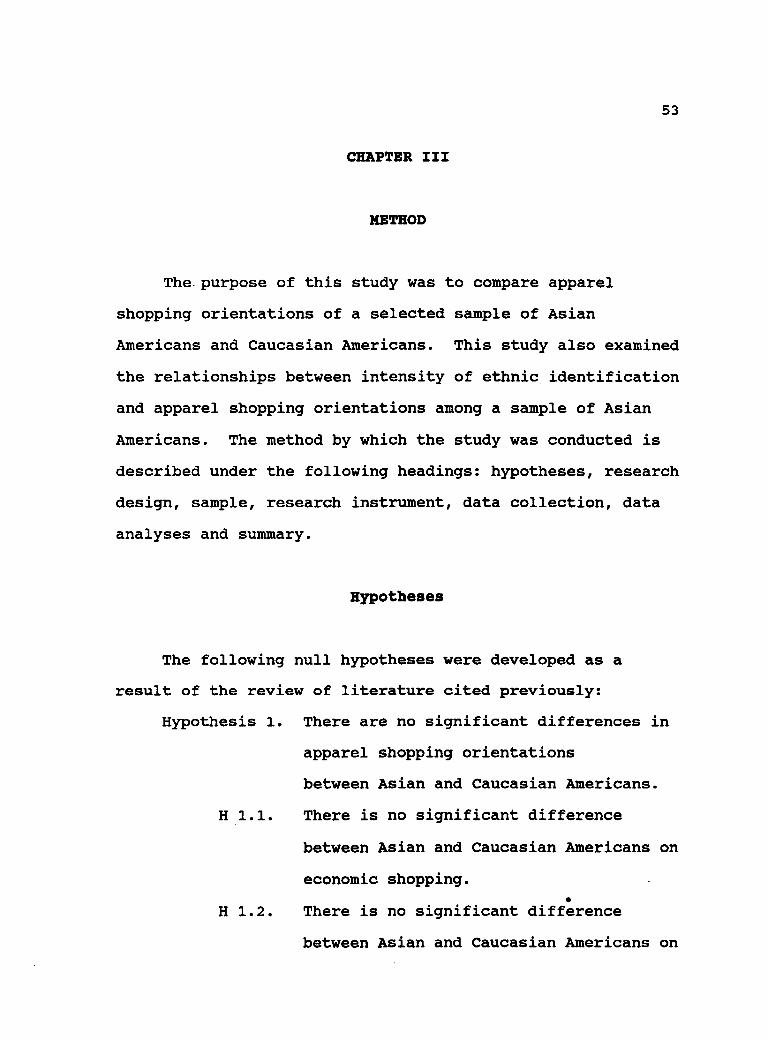
53
CHAPTER III
METHOD
The purpose of this study was to compare apparel
shopping orientations of a selected sample of Asian
Americans and Caucasian Americans. This study also examined
the relationships between intensity of ethnic identification
and apparel shopping orientations among a sample of Asian
Americans. The method by which the study was conducted is
described under the following headings: hypotheses, research
design, sample, research instrument, data collection, data
analyses and summary.
Hypotheses
The following null hypotheses were developed as a
result of the review of literature cited previously:
Hypothesis 1. There are no significant differences in
apparel shopping orientations
between Asian and Caucasian Americans.
H 1.1. There is no significant difference
between Asian and Caucasian Americans on
economic shopping.
H 1.2. There is no significant difference
between Asian and Caucasian Americans on

54
personalizing shopping.
H 1.3 There is no significant difference
between Asian and Caucasian Americans on
recreational shopping.
H 1.4 There is no significant difference
between Asian and Caucasian Americans on
social shopping.
H 1.5 There is no significant difference
between Asian and Caucasian Americans on
brand loyal shopping.
H 1.6 There is no significant difference
between Asian and Caucasian Americans on
impulse shopping.
H 1.7 There is no significant difference
between Asian and Caucasian Americans on
fashion orientation.
Hypothesis 2. There is no correlation between apparel
shopping orientations and the intensity
of ethnic identification among Asian
Americans.
Research Design
The purpose of this study was to compare Asian
Americans' apparel shopping orientations with those of
Caucasian Americans. When analyzing the data, the

55
independent variable was ethnicity (Asian versus Caucasian).
Dependent variables were the seven orientations: economic
shopping, personalizing shopping, recreational shopping,
social shopping, brand loyal shopping, impulse shopping and
fashion orientation.
The nature of the study was observational in which no
variables were manipulated. The data collection method
involved a mailed questionnaire survey. To test the
research hypotheses, the following data were collected: 1)
ratings on seven shopping orientations and 2) Asian
Americans' intensity of identification with their ethnicity.
In order to describe the sample, demographic characteristics
of the respondents were also collected.
Sample
A nonprobability, purposive sample was used in this
study because of the following two reasons: 1) Owing to the
nature of this study, Asian Americans must be purposively
identified and 2) Because of the racial discrimination
issue, race (or ethnicity) information is not a requirement
for many forms of data. There is not a readily available
way, such as DMV (Department of Motor Vehicles) data or
telephone book listings to identify Asian Americans.
Under the approval of the Affirmative Action Office of
Oregon State University (OSU), a computer generated random

56
sample was purchased from the Registrar's Office. This
random sample consisted of 300 Asian American and 300
Caucasian American students' names and mailing addresses.
This sample was drawn from the students enrolled at OSU for
1990 Fall Term.
In this study "Asian American" and "Caucasian American"
were defined as those who were U.S. citizens or permanent
residents (Resident Aliens) and those who identified
themselves with either Asian or Caucasian ethnicity.
Although the sample size was 600 in total, seventeen
respondents were found to be ineligible (neither Asian nor
Caucasian, or not U.S. citizens or permanent residents) and
were excluded from the study.
The demographic profile of the Asian versus Caucasian
student population at Oregon State University in 1990 is
presented in Table 1.
Research Instrument
Data were collected by means of a mailed questionnaire
survey. The questionnaire (Appendix B.) included questions
measuring seven apparel shopping orientations, intensity of
ethnic identification and questions on demographic
characteristics. Only the Asian American respondents were
asked to rate their intensity of ethnic identification.
The instrument used to measure the first six shopping

57
Table 1
Oregon State UniversityAsian American vs White American Student Population
(Fall, 1990)
CollegesAsian White Others
Sub-Total
Grand
TotalGrad Under Sub-T Grad Under Sub-T
Agriculture 3 12 15 122 549 671 366 1052
Business 8 133 141 64 1,884 1,948 519 2,608
Education 6 3 9 176 160 336 164 509
Engineering 12 263 275 137 1,675 1,812 778 2,865
Forestry 1 3 4 50 256 306 128 438
GraduateSchool 9 0 9 261 0 261 164 434
Health & HP 2 13 15 47 453 500 94 609
HomeEconomics 2 45 47 47 604 651 139 837
Liberal Arts 0 138 138 9 2,648 2,657 583 3,378
Oceanography 2 0 2 35 0 35 45 82
Pharmacy 2 89 91 6 326 332 91 514
Science 12 113 125 265 1,251 1,516 513 2,154
UESP 0 26 26 0 332 332 111 469
VeterinaryMedicine 2 0 2 64 0 64 9 75
Grand Total(Male)
(Female)
61 838 899(521)(378)
1283 10138 11421 3,704 16,024
Source: Institutional Research and Planning,Oregon State University (Fall, 1990)

58
orientations was adopted from Valencia's (1982) study. The
original instrument was used by Valencia to study shopping
orientations of Hispanics compared to those of whites. This
instrument measures shopping orientations on 5-point Likert
scales (see Appendix B, questions A.1 - A.27). Valencia's
instrument evolved from the findings of several previous
studies on shopping orientations, such as Bellenger and
Korgaonkar (1980), Bellenger and Valencia (1982), Boone,
Kurtz, Johnson and Bonno (1974), Darden and Ashton (1974-
1975), Darden and Perreault (1976), Darden and Reynolds
(1971), Gillett and Scott (1974), Howell (1979), Moschis
(1976), Powell (1980). For the nature and purpose of the
present study, some questions were modified to concentrate
more on the shopping for apparel.
The internal reliability reported by Valencia (1982)
were measured by Cronbach's coefficient alpha. For each
orientation the reported coefficients were: economic
shopping, 0.73; personalizing shopping, 0.78; recreational
shopping, 0.87; social shopping 0.71; brand loyal shopping,
0.68 and impulse shopping, 0.71.
For the measurement of the seventh shopping
orientation, fashion orientation, the instrument developed
by Gutman and Mills (1982) was used (see Appendix B.,
questions B.1 - B.17). This instrument was based on Yang's
(1979) conceptual life style framework, which employed seven
dimensions of consumer's life style and a context-specific

59
approach to study behavior.
In Gutman and Mills' study, four factors were
identified for fashion orientation: fashion leadership,
fashion interest, fashion importance and antifashion
attitude. Fashion orientation is measured on 5-point Likert
scales. However, the reliability and validity of the
instrument was not reported by the researchers.
In Hirschman's (1981) work on the intensity of ethnic
identification and the more recent study by Valencia(1982),
the intensity of ethnic identification was measured by a
single-item. Hirschman combined ethnic identification with
religious affiliation to measure Jewish ethnicity
multidimensionally. In Valencia's study (1982), ethnic
identification was considered as part of an index of
acculturation (Deshpande, Hoyer and Donthu, 1986).
In the present study, intensity of ethnic
identification was measured as a distinct construct apart
from religious or other socio-cultural correlates, as
suggested by Deshpande et al. (1986). The measurement of
the intensity of ethnic identification was operationalized
with two questions, which were used in Hutnik's (1986)
research to study patterns of ethnic minority identification
and modes of social adaptation. First, subjects were asked
to choose one ethnic group that they identified with and
then only those who identified themselves with Asian
Americans were asked to answer two questions measuring the
60
intensity of identification on 5-point Likert scales
(Appendix B, questions C.la and Cl.b). However, the
reliability and validity of this measure were not reported
by Hutnik (1986).
Cronbach's coefficient alpha was used to estimate the
reliability of the instrument in this study. It was
reported by Peter (1979) that Cronbach's coefficient alpha
was the most commonly accepted formula for assessing the
reliability of a measurement scale with multi-point items.
It was also referred to as a most useful formula for
assessing the reliability of measures in marketing research
(Peter, 1979).
Face validity is the assessment of the extent to which
the instrument appears to measure the subject matter under
consideration. Factor analysis was conducted to check
factor loadings on each item. Content validity is the
representativeness or sampling adequacy of the content of a
measuring instrument. The estimates of reliability and
factor loadings of the scales used in this study were
compared to the estimates reported in Valencia's (1982)
study and are reported in the next chapter.
Demographic information was collected on the subjects'
age, sex, academic major, class standing (freshman -
graduate), birth place, citizenship, how long they have
resided in the U. S., the occupation of the head of the
household, household size and number of wage earner(s) in

61
the family.
The research instrument was reviewed by several faculty
members in the Apparel, Interiors, Housing and Merchandising
Department, one faculty member in the department of Business
Administration and a consultant at the university Survey
Research Center for content validity, questionnaire
construction and editorial format.
Thirteen potential subjects pretested the
questionnaire before data collection. Seven of them were
Caucasian American and six were Asian American students on
the OSU campus. The pretest was conducted in the presence
of the researcher in order to get verbal and nonverbal
feedback on potential problems. Dillman (1978) valued a
pretest technique with the presence of the researcher
because of two crucial aspects. One is immediate verbal
feedback, which might not be provided without the presence
of the researcher. The other is the observations made while
the respondent fills out the questionnaire. The nonverbal
feedback, which might not be expressed consciously by
respondents, proves most valuable.
Based on the feedback from the pretest, several
modifications were made to the instrument. First, the
wording was modified to be as simple and concise as possible
in consideration of the English proficiency of some of the
Asian American subjects. Second, two questions about
apparel shopping with family members, but not friends, were

62
added to the questionnaire for measuring social shopping
orientation. Since some pretest respondents stated they
liked to go shopping with their family members instead of
friends, and this should be included as one dimension of the
social shopping orientation (in addition to shopping with
friends) according to the definition of social shopping used
in Valencia's study.
Data Collection
Dillman's (1978) "Total Design Method (TDM)" was used
as a guideline for assuring a reasonably good response rate
and higher probability of complete response to the
questionnaire. The construction, order and grouping of the
questions, length of the questionnaire, and the
implementation process also followed Dillman's guidelines.
The initial mailing of 600 was sent to the 300 Asian
American and 300 Caucasian American students on the random
sample list. This initial mailing included a cover letter
introducing the research purpose as well as the importance
of the study (Appendix A). Also, it included a
questionnaire and a self-addressed, postage-paid business-
reply envelope. The questionnaires were numbered
sequentially in the upper right hand corner. The numbers
were used as identification numbers of respondents to
facilitate the follow-up procedures.

63
The follow-up sequence included two mailings, not three
mailings as recommended by Dillman (1978), because of the
time constraint of a shorter 1990 Fall Term at OSU. A
postcard was sent to everyone one week after the first
mailout as a thank you note or a reminder (Appendix A). Two
weeks after, a second cover letter (Appendix A), reply
envelope and replacement questionnaire were sent to
nonrespondents. One week after the second follow-up, a 76%
return rate was generated and by this time, final
examinations were about to begin. Therefore, the third
follow-up was considered neither helpful nor necessary by
the researcher and was not implemented.
Data Analyses
The major data analysis techniques for testing the
hypotheses were multivariate analysis of variance (MANOVA),
t-test and Pearson correlation. For hypothesis 1, more than
one dependent variable (seven shopping orientations) were
analyzed simultaneously to test the null hypothesis. The
overall shopping orientations construct for each ethnic
group was tested for differences in multivariate group means
by MANOVA. For each sub-hypothesis, mean differences by
ethnic group were tested for each of the seven shopping
orientations by t-test.
However, before testing the hypotheses by MANOVA or t-

64
test, two assumptions, homogeneity of dispersion and
normality were checked by a histogram and goodness of fit
test. It was found that on some of the orientations the
distributions were not normal. Therefore, the non-parametric
Mann-Whitney Test was also used as a backup to check the
findings that resulted from the t-tests. These two tests
reached the same findings and they are both reported in the
next chapter.
Since both intensity of ethnic identification and
shopping orientations are continuous data, the two variables
were analyzed for their correlation to test hypothesis 2.
The nominal (categorical) data derived from the demographic
characteristics section were analyzed by descriptive
statistics. Descriptive statistics including central
tendency, frequency and variability (dispersion) were used
to describe the two sample populations.
Summary
The research questions under investigation were: what
is the pattern of apparel shopping orientations of Asian
American in comparison with Caucasian American students at
Oregon State University? Is there any correlation between
apparel shopping orientations and intensity of ethnic
identification among Asian American students at OSU? The
consumer behavior model proposed by Engel, Kollat and
65
Blackwell (1973) served as the theoretical
framework for this study. Seven apparel shopping
orientations were investigated: economic shopping,
personalizing shopping, recreational shopping, social
shopping, brand loyal shopping, impulse shopping and fashion
orientation. A purposive sample of 300 Asian American and
300 Caucasian American students was drawn from the students
enrolled at OSU for 1990 Fall Term. The data collection
method involved a mailed questionnaire survey. Dillman's
(1978) Total Design Method served as a guideline when
implementing data collection procedures. MANOVA, t-test and
correlation were used to test the two research hypotheses.

66
CHAPTER IV
FINDINGS AND DISCUSSION
In this chapter, questionnaire response rate and
demographic characteristics of the respondents are
presented. Also estimates of reliability and factor
loadings of the scales are reported. Finally, the results
of MANOVA, t-tests and Pearson correlation analyses used to
test the hypotheses are discussed.
Questionnaire Response Rate
The data collection method utilized in this study was a
mailed questionnaire survey. A total of 600 questionnaires
were mailed to 300 Asian American and 300 Caucasian American
students. Forty of the questionnaires were returned as non-
deliverable. Among the 560 deliverable questionnaires, 425
were returned after two follow-up mailings. Among them, 199
were from the Asian group and 226 from the Caucasian group.
Seventeen out of the 425 returned questionnaires were found
ineligible for use in this study since the respondents did
not identify themselves as either Asian or Caucasian, or
they were not Americans (neither an American citizen nor
permanent resident). As a result, data from 408
questionnaires were used for analysis in this
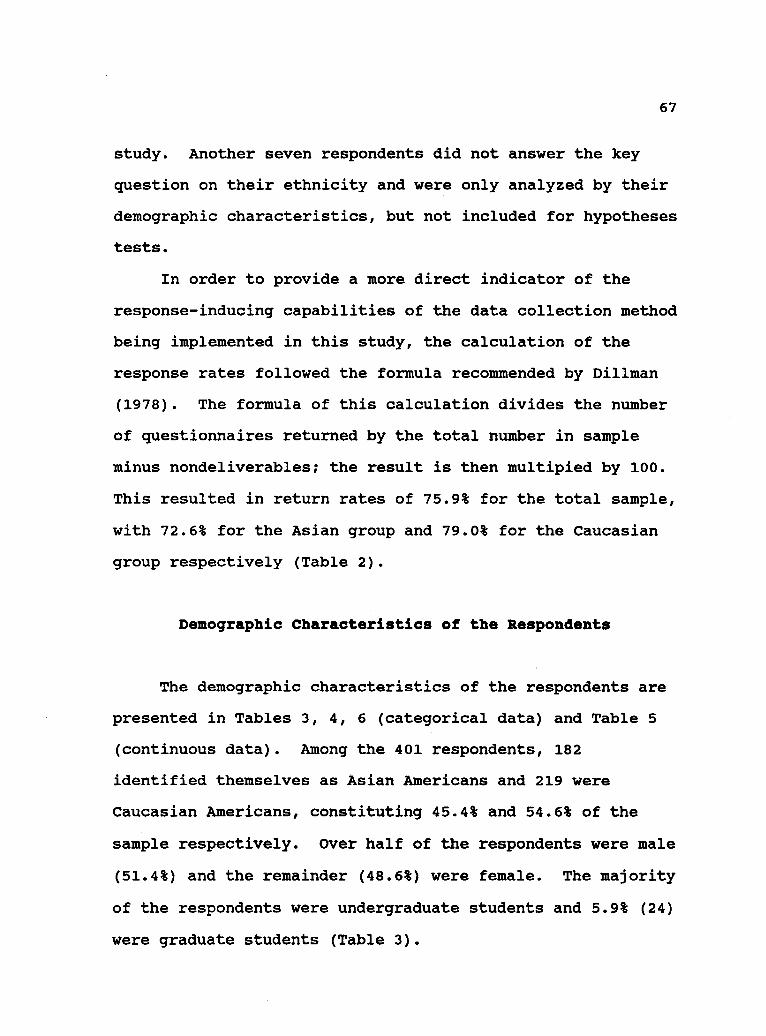
67
study. Another seven respondents did not answer the key
question on their ethnicity and were only analyzed by their
demographic characteristics, but not included for hypotheses
tests.
In order to provide a more direct indicator of the
response-inducing capabilities of the data collection method
being implemented in this study, the calculation of the
response rates followed the formula recommended by Dillman
(1978). The formula of this calculation divides the number
of questionnaires returned by the total number in sample
minus nondeliverables; the result is then multipied by 100.
This resulted in return rates of 75.9% for the total sample,
with 72.6% for the Asian group and 79.0% for the Caucasian
group respectively (Table 2).
Demographic Characteristics of the Respondents
The demographic characteristics of the respondents are
presented in Tables 3, 4, 6 (categorical data) and Table 5
(continuous data). Among the 401 respondents, 182
identified themselves as Asian Americans and 219 were
Caucasian Americans, constituting 45.4% and 54.6% of the
sample respectively. Over half of the respondents were male
(51.4%) and the remainder (48.6%) were female. The majority
of the respondents were undergraduate students and 5.9% (24)
were graduate students (Table 3).

68
Table 2
Questionnaire Response Rate
Item Number Percentage
Total Number of Ouestionnaires Mailed 600Asian American 300Caucasian American 300
Total Number Returned 425Asian American 199Caucasian American 226
Nondeliverables 40Asian American 26Caucasian American 14
Total Response Ratea 425 75.9%Asian American . 199 72.6%Caucasian American 226 79.0%
a Response rate = Total Number Returned
Sample Number - Nondeliverable(100)

69
Table 3
Demographic Characteristics of the Respondentspategorical Data)
CharacteristicAsian
Number Percentage°Caucasian
Number Percentage°
Ethnicity 182 100% 219 100%
SexMale 104 57.1% 103 47.0%Female 78 42.9% 116 E30 1Total 182 100% 219 100%
Class StandingFreshman 45 24.7% 37 16.9%Sophomore 45 24.7% 41 18.7%Junior 34 18.7% 49 22.4%Senior 48 26.4% 70 32.0%Graduate 7 3.8% 17 7.8%Other(special,
post-bac)3 I-Al 5 2221
Total 182 100% 219 100%
CollegeAgriculture 4 2.2% 11 5.1%Business 28 15.6% 42 19.4%Education 1 0.6% 9 4.2%Engineering 70 38.9% 34 15.7%Forestry 1 0.6% 6 2.8%Health & Human Perf 4 2.2% 5 2.3%Home Economics 7 3.9% 19 8.8%Liberal Arts 21 11.7% 53 24.5%Oceanography 0 0.0% 0 0.0%Pharmacy 12 6.7% 5 2.3%Science 31 17.2% 31 14.4%Vet. Medicine 0 0.0% 0 0.0%Interdis. Prog. 1 0.6% 1 025.1Total 180 100% 216 100%
a The percentages were based on number of responses toeach question (does not include missing data).

70
As to college distribution, 104 of the respondents
were in the College of Engineering, constituting 25.8% of
the sample. Compared to the student population on campus,
only 17.9% of the students are in the College of
Engineering. However, in the present study, 38.9% of the
Asian American students were enrolled in engineering. The
statistics indicated that the high percentage of Engineering
majors in this sample came from the high density (30.59%) of
Asian American engineering majors at OSU.
There were 106 respondents who were not born in the
United States. Among them, six were Caucasian Americans and
100 were Asian Americans. The summary statistics
demonstrated that among Asian Americans who were not born in
the U.S., almost half of them were born in Korea (22%) or
Vietnam (27%) (see Table 4).
The summary statistics also revealed that most (42%) of
the Caucasian Americans reported that their great
grandparents were the first generation to come to the U. S.
(Table 4). Among the Asian group, most (46.7%) stated that
their parents were the first generation to come to U.S. A
Chi-Square test indicated a significant difference between
the Asian and Caucasian American respondents' generation of
family first to come to the U.S (p-value = 0.00).
Obviously, the Asian American respondents were of a younger
generation in the U.S. than were the Caucasian Americans.
This also explained why the statistics showed significant

71
Table 4
Demographic Characteristics of the RespondentsCategorical Data)
CharacteristicAsian
Number PercentageCaucasian
Number Percentagea
Country of BirthbChina 5 5.0%Taiwan 7 7.0%Korea 22 22.0%Vietnam 27 27.0%Cambodia 8 8.0%Hong Kong 7 7.0%Philippines 4 4.0%India 4 4.0%Iran 1 1.0% 1 16.7%Bangladesh 1 1.0%Canada 2 2.0%Laos 1 1.0%Khmer 1 1.0%N. Mariana Isl. 2 2.0%Burma 1 1.0%Thailand 3 3.0% 1 16.7%Nepal 1 1.0%Brunei 1 1.0%Sri Lanka 1 1.0%England 1 1.0% 1 16.7%Others 0 0.0% 3 50.0%Total 100 100.0% 6 100.0%
Generation First to Come to U.S.G. Grand Parents 29 15.9% 92 42.0%Grand Parents 18 9.9% 22 10.0%Parents 85 46.7% 8 3.7%Self 33 18.1%Do Not Know 9 4.9% 70 32.0%Others 8 ill 27 12.3%Total 182 100.0% 219 100.0%
CitizenshipU.S. Citizen 149 81.9% 219 100.0%Perma. Resident 33 11.1 1 0 0.0%(Resident Alien) 182 100.0% 219 100.0%
The percentages were based on number of responses toeach question (does not include missing data).
b Only those respondents who were not born in the U.S. wererequested to answer this question.

72
difference between Asian and Caucasian respondents' years of
residing in the U.S. (p-value = 0.000) with the mean years
of 14.5 for the Asian and 22.7 for the Caucasian
respondents.
The mean age of the respondents was 22.2 years with
the range from 17-67 years. However, the t-test showed that
the Asian respondents were significantly younger than the
Caucasian respondents (p-value = o.000), with the mean age
of 21.0 for the Asian and 23.20 for the Caucasian group
respectively (Table 5).
In regard to marital status, the high percentage
(87.9%) of those indicating single obviously reflected a
common characteristic of the sample population (university
students). A Chi-Square test demonstrated significant
difference (p-value < 0.00) between Asian and Caucasian
respondents' marital status with more Caucasian respondents
married (15.2% for the Caucasian and 3.8% for the Asian
group). Meanwhile, 96.2% of the Asian American students
were single in comparison with 81.6% for the Caucasians
(Table 6).
The statistics revealed that the Asian respondents were
from significantly larger households (number of persons per
household) with more wage earners per household than were
the Caucasians. This finding agreed with what reported by
Zinsmeister (1988) that Asians averaged more workers per
family. Also a Chi-Square test demonstrated there was a

73
Table 5
Demographic Characteristics of the Respondents(Continuous Data)
Characteristic N Range Mean SD
Age 17-67Asian 182 20.9 3.0Caucasian 2 9 23.2 7.5Total 410
Years of Stay in the U.S. 1-67Asian 181 14.5 6.3Caucasian 218 22.7 7.4Total 399

74
Table 6Demographic Characteristics of the Respondents
pategorical Data)
CharacteristicAsian
Number PercentageaCaucasian
Number Percentagea
Marital StatusSingle 175 96.2% 177 81.6%Married 7 3.8% 33 15.2%Separated 0 0.0% 2 9.0%Divorced 0 0.0% 4 1.8%Widowed 0 EISA 1 IJATotal 182 100.0% 217 100.0%
Size of Household (# of Persons)2 4 2.2% 4 1.8%3 14 7.7% 22 10.1%4 47 25.8% 81 37.2%5 39 21.4% 66 30.3%6 33 18.1% 20 9.2%7 20 11.0% 12 5.5%8 8 4.4% 7 3.2%9 5 2.7% 2 0.9%10 6 3.3% 2 0.9%11 0 0.0% 2 0.9%12 4 2.2% 0 0.0%13 1 0.5% 0 0.0%15 1 2.51 0 0,0 1Total 182 100.0% 218 100.0%
Occupation of The Head of HouseholdProfessional 40 22.7% 54 25.0%Technical 30 17.0% 40 18.5%Manag./Superv. 24 13.6% 35 16.2%Self-employed 27 15.3% 16 7.4%Clerical 11 6.3% 30 13.9%Skilled 12 6.8% 10 4.6%Semi-skilled 13 7.4% 20 9.3%Unskilled 13 7.4% 11 5.1%Unemployed 6 LAI 0 2,21Total 176 100.0% 216 100.0%
Number of Wage Earners0 2 1.1% 0 0.0%1 52 29.5% 87 39.7%2 108 61.4% 127 58.0%3 8 4.5% 3 1.4%4 1 0.6% 2 0.9%5 5 211 0Total 176 100.0% 219
__.0,2i100.0%
a The percentages were based on number of responses to eachquestion (does not include missing data)

75
significant difference between the occupations of the heads
of households of these two groups (p-value = 0.007). More
Caucasian household heads (25.0%) were reported to be in the
professional category, compared to 22.7% for the Asians.
More of the Asian heads of household (15.3%) were self-
employed compared to the Caucasians (7.4%).
Reliability and Validity of the Scales
Scales that were developed and tested by Valencia
(1982) were used in this study to measure the first six
shopping orientations. The seventh fashion orientation was
measured by the scales developed by Gutman and Mills (1982).
Two scales adapted from Hutnik's (1986) study were utilized
to measure the intensity of ethnic identification of the
Asian American respondents.
The alpha coefficients calculated from the data to
estimate the reliabilities of the scales are reported and
compared to those reported in Valencia's (1982) study in
Table 7. For the first six apparel shopping orientations,
the reliability coefficient estimates compared favorably to
those reported by Valencia (1982), with all of them higher
than 0.50 except the economic shopping orientation (0.39).
This orientation was measured by question items A.6, A.10,
A.12 and A.18 (Appendix B.). These measured how subjects
evaluated stores and apparel items in terms of price,

76
Table 7
Estimates of Reliability of the Scales
Scale Coefficient Alpha
Apparel Shopping OrientationEconomic Shopping 0.39 (0.73)aPersonalizing Shopping 0.64 (0.55)aRecreational Shopping 0.89 (0.87)aSocial Shopping 0.70 (0.71)aFriend Social Shopping 0.75Family Social Shopping 0.74
Brand Loyal Shopping 0.69 (0.68)aImpulse Shopping 0.80 (0.71)aFashion OrientationFashion Leadership 0.76Fashion Interest 0.77Fashion Importance 0.80Antifashion attitude 0.48
Intensity of Ethnic Identification 0.47b
a Coefficient alpha reported by Valencia (1982).
b The scale reliability was measured by Pearson correlationcoefficient, instead of Cronbach's alpha.

77
quality, value and merchandise assortments. This low
reliability might be attributed to the confusion created by
the categorization of the stores, such as "small stores",
"big chains" and "department stores". It has been almost
ten years since Valencia conducted his study. Owing to the
changing retailing environment, people may define or
perceive these categories of stores differently than they
did ten years ago. Also, the wording of the questions such
as "better bargains" or "more reasonable prices" may be
interpreted differently by individuals. Respondents in the
present study may have understood and/or interpreted them
differently than the Hispanic/white respondents in
Valencia's study.
All four factors of the fashion orientation measure had
alpha coefficients higher than 0.75, except the last one,
antifashion attitude (0.48). For the two items (Appendix B.
questions C.la and C.lb) measuring intensity of ethnic
identification, Pearson correlation coefficients were
calculated to measure the correlation of these two
questions. Since there were only two items measuring this
construct, it would be meaningless to calculate coefficient
alpha for two items only. The resulting coefficient was
0.47 with p-value = 0.000, which indicated that the
reliability of this scale was acceptable.
Moreover, the one-way ANOVA analysis of intensity of
ethnic identification by generation (Appendix B, question
78
D.7) demonstrated that there was a significant difference in
intensity of identification among Asian Americans by their
generation in the U.S. (p-value = 0.000, F = 8.13). The
finding implied that the younger an Asian respondent's
generation was, the more he (she) identified with Asian
ethnicity. This finding implied that the Asian respondents'
intensity of ethnic identification could be reflected from
his (her) generation in the U.S.
In order to compare with the factor loadings reported
by Valencia (1982), Image factor analysis with varimax
rotation was also conducted to analyze the 46 scale items
measuring shopping orientations and the intensity of ethnic
identification. The factor loadings of the scale items are
presented and compared to those reported by Valencia (1982)
in Table 8. Almost all of the items compared favorably to
those reported by Valencia, except two items (A.10 and A.12)
measuring economic orientation, and three items (A.2., A.13
and A.17) measuring friend social orientation.
Since the respondents may have been confused due to
the classification of the stores, the store names being
listed or the wording of the questions, A.10 and A.12 with
lower loadings may not have measured the orientation they
were supposed to measure. Questions A.2 and A.17, with low
loadings on friend social orientation, had higher loadings
on recreational shopping. Question A.13 had higher loading
on personalizing shopping. Respondents in the present study

79
Table 8
Factor Loadings of Shopping Orientations
Scale Question Item # Factor Loading
Shobbina Orientation
Economic A. 6 (R) 0.57 (0.64)aA. 10 0.23 (0.52)aA. 12 0.01 (0.35)aA. 18 0.57 (0.64)a
Personalizing A. 3 0.45 (0.70)aA. 9 0.51 (0.63)aA. 19 (R) 0.39 (0.49)aA. 24 (R) 0.35 (0.71)a
Recreational A. 1 0.79 (0.78)aA. 8 (R) 0.73 (0.76)aA. 14 (R) 0.60 (0.59)aA. 20 (R) 0.62 (0.70)aA. 21 0.55 (0.63)aA. 25 (R) 0.61 (0.56)a
Friend Social A. 2 0.14 (0.55)aA. 13 0.07 (0.36)aA. 17 0.20 (0.55)a
Family Social A. 23 (R) 0.53A. 27 0.55
Brand Loyal A. 4 0.57 (0.53)aA. 7 0.54 (0.51)aA. 16 0.48 (0.44)aA. 22 (R) 0.39 (0.41)a
Impulse A. 5 (R) 0.44 (0.43)aA. 11 0.64 (0.58)a
A. 15 0.64 (0.59)aA. 26 (R) 0.55 (0.45)8
a Factor loadings reported by Valencia (1982)
Note: (R) = Items that were reverse scored.

80
may have interpreted the term "people" in the item stating
shopping as "the chance to talk to people" as store sales
associates, but not friends with whom they shopped. The
respondents in present study obviously interpreted those
questions differently than the respondents in Valencia's
(1982) study.
Given these inconsistent reliability estimates
(economic orientation) and factor loadings (A.10, 12, A.2,
13, 17) from that reported by Valencia (1982), these scales
were neither changed from their original shopping
orientation grouping nor were they eliminated when analyzing
the data. The data were analyzed as they were proposed so
that the results could be compared to Valencia's (1982)
findings.
For another social shopping dimension, family social
shopping, which was added to the instrument (question A.23
and A.27) by the researcher, the reliability estimate
(coefficient alpha = 0.74 ) and factor loadings (0.53 and
0.55) were both acceptable (Table 8). This provided
evidence that an additional dimension of social shopping
(besides shopping with friends) merited exploration. Also
the results of factor analysis suggest that it may be
worthwhile to test the reliability and validity of this
dimension in the future.
All of the scales measuring the four factors of fashion
orientation had loadings higher than 0.30 on fashion
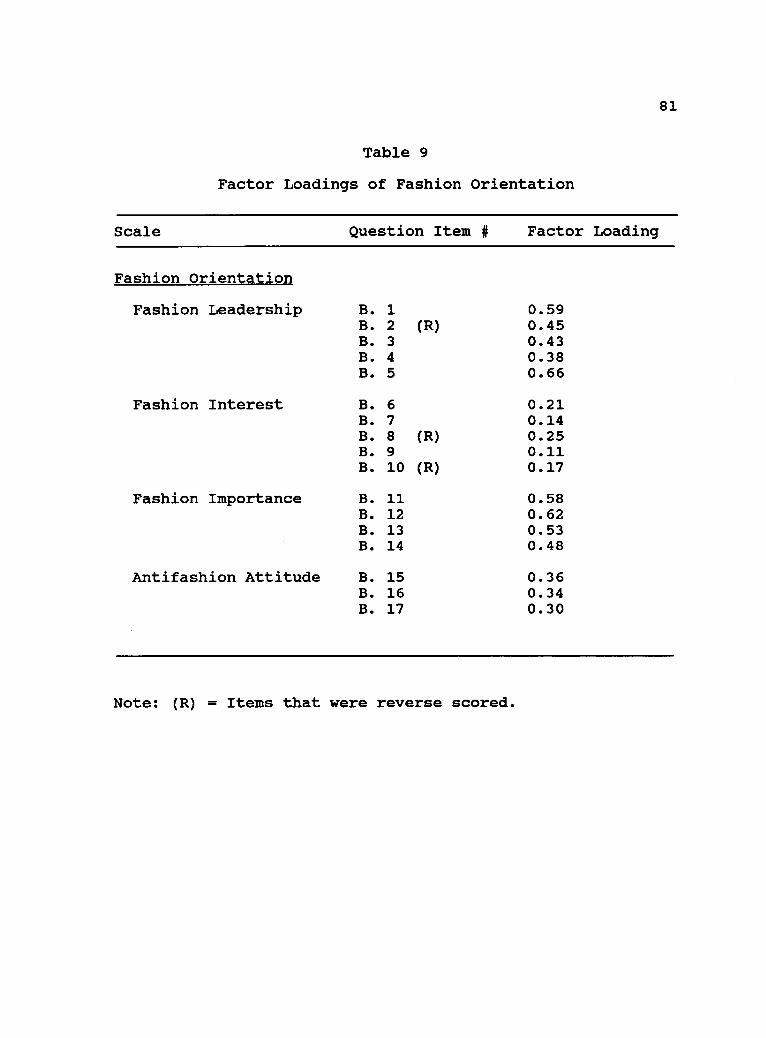
81
Table 9
Factor Loadings of Fashion Orientation
Scale Question Item # Factor Loading
Fashion Orientation
Fashion Leadership B. 1 0.59B. 2 (R) 0.45B. 3 0.43B. 4 0.38B. 5 0.66
Fashion Interest B. 6 0.21B. 7 0.14B. 8 (R) 0.25B. 9 0.11B. 10 (R) 0.17
Fashion Importance B. 11 0.58B. 12 0.62B. 13 0.53B. 14 0.48
Antifashion Attitude B. 15 0.36B. 16 0.34B. 17 0.30
Note: (R) = Items that were reverse scored.

82
leadership, fashion importance and antifashion attitude,
except fashion interest (Table 9). Fashion interest was
measured by five questions, B.6 through B.10 (see Appendix
B). The low loadings on these scales suggested further
revision and improvement are needed when replicating this
study or when this instrument is being used. When analyzing
the data, the fashion interest factor was included but no
significant difference was found on this particular fashion
orientation factor.
Descriptive Analysis of Variables
Before the testing of hypotheses, a descriptive
analysis of all shopping orientation variables is presented.
This analysis included the total sample population (maximum
case number was 408). The purpose of this analysis was to
present a overall picture of how the sample population
(including both Asian and Caucasian students) responded on
those orientations and then the differences between these
two sample groups are presented in the following section.
Means and standard deviations of respondents' responses
to the dependent variables (apparel shopping orientations
and intensity of ethnic identification) are presented in
Table 10. Responses to all the scales ranged from one to
five, from strongly disagree to strongly agree. For the
first six shopping orientations, the means are all below

83
Table 10Descriptive Statistics of Variables
Variable N Mean SD
Shopping Orientations
Economic Shopping 408 3.05 0.62Personalizing Shopping 408 2.35 0.71Recreational Shopping 404 3.48 0.98Social Shopping 404 2.84 0.80Friend Social Shopping 408 2.71 0.96Family Social Shopping 408 1.18 0.46
Brand Loyal Shopping 408 2.78 0.79Impulse Shopping 404 3.02 0.96Fashion OrientationFashion Leadership 404 2.61 0.79Fashion Interest 407 2.81 0.92Fashion Importance 406 3.59 0.66Antifashion Attitude 407 3.75 0.72
Intensity of Ethnic Identifications107 2.92 1.29
8 Only Asian American respondents were asked to respond onthis scale.

84
3.48, with family social shopping the lowest, (mean = 1.18)
and recreational shopping highest (mean = 3.48). Generally
speaking, respondents in this study viewed shopping for
clothes as a recreational activity (mean = 3.48) more than
as a necessity (economic shopping) (mean = 3.05). The
entire sample did not view apparel shopping as a social
activity (mean = 2.84), specifically they did not like
shopping for clothes with family members (mean = 1.18).
The highest mean on fashion orientation was antifashion
attitude, 3.75 with standard deviation of 0.72 and the
lowest mean was fashion leadership, 2.61 with standard
deviation of 0.79. The highest mean on antifashion attitude
meant the entire sample did not like to be told what to wear
by fashion experts and they tended to buy clothes they liked
regardless of current fashion. Interestingly, although they
were antifashion (mean = 3.75) more than the average
(mean = 3.0), they regarded being well-dressed as very
important (mean = 3.59).
Altogether 107 Asian American respondents responded to
the ethnic identification questions. The mean was 2.92,
which implied that in general, these Asian American students
did not strongly identify their ethnicity as either Asian or
American.

85
Results of Hypotheses Testing
In this section, results of the test of two hypotheses
are presented. Hypothesis 1. was tested by MANOVA and then
each sub-hypothesis from H 1.1 to H 1.7 was tested by t-
test. Furthermore, the non-parametric Mann-Whitney test was
conducted to check each sub-hypothesis, since not every
distribution met the assumption of normality for MANOVA and
t-test. The relationship between the continuous variables
of shopping orientations and the intensity of ethnic
identification was tested by Pearson correlation.
MANOVA Test Results for Shopping Orientations by Ethnicity
The first null hypothesis stating that there are no
significant differences in apparel shopping orientations
between Asian and Caucasian Americans was tested by Wilk's
MANOVA. Prior to hypothesis testing, the homogeneity of
dispersion and normality of distribution were checked.
MANOVA assumes homogeneity of dispersion matrices and
multivariate normality of distribution. The dispersion
matrices refer to the error sources from which the SSCP
error is pooled (Barker & Barker, 1983). T-test also
assumes equal variances and normality.
A multivariate test for homogeneity of dispersion
matrices demonstrated that the first assumption was met.
The histogram and Kolmogorov-Smirnov goodness of fit test
demonstrated that some of the distributions were not normal.

86
Therefore, a non-parametric test, the Mann-Whitney test was
used as a back-up test to check each sub-hypothesis in
addition to the t-test.
However, it was indicated by Barker and Barker (1983)
that there appeared to be no compelling reason to be overly
concerned about the assumption of normality of multivariate
distribution. Analyses showed that non-normality was found
to exert little effect on any of the four MANOVA tests
(Wilk's lambda, Hotelling, Roy and Pillai). Besides, the
non-parametric test cannot test the general Hypothesis 1 by
taking all the dependent variables into account at once.
MANOVA was still the most appropriate test for testing the
general Hypothesis 1.
The results of the MANOVA test are presented in Table
11. The p-value was 0.003, which suggested that null
Hypothesis 1. was rejected at the significance level of
p < 0.05. Results indicated that significant differences
were found between Asian and Caucasian American students on
their overall apparel shopping orientations. Therefore,
subsequent t-tests were conducted on each sub-hypothesis to
find out how they were different and on which orientation
they were different.
T-test Results of Each Sub-hypothesis under Hypothesis 1
Since the previous MANOVA test demonstrated that the
null Hypothesis 1. was rejected, t-tests were conducted for
each orientation to find out which of these orientations

87
Table 11
MANOVA Test Results for Shopping OrientationsBy Ethnicity
(N=401)
Test Name Value Approx. F Hypoth. DF p-value
Wilks Lambda 0.93 2.65 11.00 0.003
88
contributes to the overall significant differences on
apparel shopping orientations between Asian and Caucasian
American students. The results are presented in Table 12.
The results suggested that the null sub-hypotheses 1.4,
1.5 and 1.7 be rejected at the significance level of 0.05.
In other words, significant differences were found between
Asian and Caucasian Americans on social shopping, both
friend and family social shopping, brand loyal shopping and
fashion leadership orientations.
Social shopping orientation measures the degree to
which respondents view apparel shopping as a social
activity. The Asians had a significantly higher group mean
(2.94) than did the Caucasian group (2.75), which suggested
that the Asian respondents in this study were more socially
oriented than the Caucasians when shopping for clothes.
The social shopping orientation was further broken down
into two dimensions: shop with friends or shop with family
members. T-tests indicated that the Asians and Caucasians
were significantly different on both dimensions. Again, the
Asians scored higher on both friend social shopping
(M = 2.82) and family social shopping (M = 2.62) than did
the Caucasian (M = 1.23, M = 1.13). Results indicated that
the Asians were more socially oriented than the Caucasians
in terms of apparel shopping. The Asians in the present
study liked to shop for clothes with either friends or
family members more than did the Caucasians.

89
Table 12
Results of T-test for Each Orientationby Ethnicity
Dependent Variable N Group Mean SD t-value P-values
Economic Shopping 0.71 0.478Asian 182 3.07 0.61Caucasian 219 3.02 0.62
Personalizing Shopping -0.40 0.690Asian 182 2.34 0.69Caucasian 219 2.37 0.73
Recreational Shopping 0.37 0.712Asian 181 3.49 0.98Caucasian 216 3.46 1.00
Social Shopping 2.50 0.013Asian 181 2.94 0.77Caucasian 216 2.75 0.81
Friend Social Shopping 2.14 0.033Asian 181 2.82 0.90Caucasian 219 2.62 0.10
Family Social Shopping 2.16 0.032Asian 182 1.23 0.44Caucasian 219 1.13 0.48
Brand Loyal Shopping 2.15 0.012Asian 182 2.90 0.78Caucasian 219 2.70 0.78
Impulse Shopping 0.81 0.420Asian 181 3.06 0.92Caucasian 216 2.99 0.99
Fashion Leadership 2.29 0.023Asian 181 2.71 0.78Caucasian 216 2.53 0.80
Fashion Interest 0.68 0.499Asian 182 2.85 0.87Caucasian 219 2.78 0.96
Fashion Importance -0.91 0.363Asian 181 3.56 0.71Caucasian 219 3.62 0.62
Anti-fashion Attitude -0.14 0.892Asian 182 3.74 0.71Caucasian 219 3.75 0.73

90
Brand loyal shoppers tend to have biased choice
behavior toward particular brands of merchandise (apparel)
while shopping. The higher mean of the Asian group compared
to that of Caucasian's (2.90 vs 2.70) indicated that the
Asian Americans in this study were significantly more brand
loyal than the Caucasian American students.
Fashion orientation was specifically chosen for
investigation in this apparel shopping study. As one of the
factors of fashion orientation, fashion leadership measures
how strong the respondent likes to be regarded or regards
himself (herself) as a fashion leader. T-test with a p-
value of 0.023 suggested there was a significant difference
between Asian and Caucasian respondents on this factor. The
group means were 2.71 and 2.53 for the Asian and the
Caucasian groups respectively, which indicated that the
Asians liked to be and perceived themselves to be fashion
leaders more than the Caucasians.
Since the assumption of normality for t-tests and
MANOVA were not met by some distributions of the
orientations, the non-parametric Mann-Whitney Test, was also
conducted to double check the results of the t-tests. The
results of the Mann-Whitney tests were consistent with those
of the t-tests. The results are presented in Table 13.
Correlation Test of Hypothesis 2
Hypothesis 2 stated that there was no correlation
between apparel shopping orientations and the intensity of

91
Table 13
Mann-Whitney Test of Each Orientationby Ethnicity
Dependent Variable Mean Rank P-value
Economic Shopping 0.51Asian 205.17Caucasian 197.54
Personalizing Shopping 0.92Asian 200.39Caucasian 201.51
Recreational Shopping 0.69Asian 201.47Caucasian 196.93
Social Shopping 0.02Asian 214.22Caucasian 186.25
Friend Social Shopping 0.03Asian 214.71Caucasian 189.60
Family Social Shopping 0.03Asian 214.98Caucasian 189.38
Brand Loyal Shopping 0.01Asian 217.40Caucasian 187.37
Impulse Shopping 0.44Asian 203.86Caucasian 194.93
Fashion Leadership 0.01Asian 214.45Caucasian 186.05
Fashion Interest 0.31Asian 207.48Caucasian 195.62
Fashion Importance 0.61Asian 197.25Caucasian 203.18
Anti-fashion Attitude 0.73Asian 198.84Caucasian 202.79

92
ethnic identification among Asian Americans. Since both
intensity of ethnic identification and shopping orientations
were continuous data, Pearson correlation analysis was
utilized to test hypothesis 2. The results are presented in
Table 14.
For most of the orientations, the results suggested
there was no correlation between shopping orientations and
the intensity of ethnic of identification, except fashion
importance. The results suggested a significant negative
correlation was found (coefficient = -0.28; p-value = 0.00)
between fashion importance and the intensity of ethnic
orientation among Asian American respondents. The findings
indicated that the more an Asian respondent identified with
Asian ethnicity, the less he (she) thought being well-
dressed was important. Or vice versa, the more an Asian
respondent identified himself (herself) as American, the
more he (she) regarded being well-dressed to be important.
When discussing any difference(s) between the Asian and
Caucasian Americans, it should be noted that any difference
found in this study should be interpreted as "group
differences". These differences may be due to a number of
factors (such as ethnicity, age, marital status or socio-
economical level) or the interaction of several variables.
They were not necessarily attributable to ethnicity only.
In other words, the source of variation in the shopping
orientations' distributions may be explained by some other

93
Table 14Correlation Analysis of Shopping Orientations
by Intensity of Ethnic Identification(N=179)
OrientationCorrelationCoefficient P-value
Economic shopping
Personalizing Shopping
Recreational Shopping
Social Shopping
Friend Social Shopping
Family Social Shopping
Brand Loyal Shopping
Impulse Shopping
Fashion Leadership
Fashion Interest
Fashion Importance
Fashion Attitude
-0.08
-0.06
-0.03
-0.27
-0.27
-0.01
- 0.01
0.04
0.03
-0.03
- 0.28
0.00
0.14
0.21
0.36
0.36
0.36
0.45
0.47
0.29
0.35
0.35
0.00
0.49

94
factors which were not investigated in this study. From a
practical point of view, however, these group differences
may be still of interest to apparel marketers, retailers and
other parties who are not concerned with the root cause(s)
of these differences.
Additional Analyses
The initial descriptive statistics showed that the
Asian and Caucasian respondents were different on some of
their demographic characteristics other than ethnicity: age,
marital status, academic major, social-economic status
(including size of household, occupation of the head of
household and number of wage earners in the household).
However, Valencia (1982) concluded that differences in
shopping orientations can be attributed to ethnicity rather
than social-economic variables. Kim (1987) also
demonstrated no overall significant shopping orientation
differences between Korean immigrants and whites across
income and age categories. Scrank (1973) also studied
fashion innovativeness and opinion leadership in relation to
socio-economic variables. She concluded that fashion
opinion leadership was not related to socio-economic level.
In another study on fashion innovativeness and opinion
leadership, Kim and Schrank (1982) studied Korean college
women and found that fashion leadership among Korean college

95
women was not significantly related to social-economic
level.
It was noted that most of the previous studies on
shopping orientations have been conducted only with female
respondents (Stone, 1954; Darden & Reynolds, 1971), few of
them studied the difference between males and females in
regard to their shopping orientations. Kim's research
results showed that there were overall significant shopping
orientation differences between Korean immigrants and whites
across sex. They differed in an overall sense and on the
following shopping orientations: brand loyalty proneness,
shopping interest, coupon proneness, advertised shopper,
shopping sex-roles and shopping center enthusiast.
With respect to fashion related studies, Goldsmith,
Stith and White (1987) noted that no studies seem to have
examined fashion interest or fashion innovativeness for both
sexes simultaneously. Their study results suggested that
sex, as one of many variables, was a better predictor than
race (not ethnicity) and should be taken into consideration
when conducting fashion-related studies.
Based on the results of previous research, Asian and
Caucasian Americans in the present study were not studied by
their socio-economic level. However, the researcher of the
present study singled out "sex" from these demographic
characteristics and investigated its effects on each
shopping orientation and the interaction between ethnicity

96
and sex variables. First, one-way ANOVA was conducted to
analyze shopping orientations by sex and the results are
presented in Tables 15 and 16.
The statistical results suggested that, at the
significance level of 0.05, male and female respondents are
significantly different on the following shopping
orientations: recreational shopping, social shopping, friend
social shopping, family social shopping, brand loyal
shopping, impulse shopping, fashion leadership, fashion
interest and anti-fashion attitude. It was found that the
female respondents enjoyed apparel shopping (M = 3.86) as a
recreational activity more than the males (M = 3.12).
Female shoppers were also more socially oriented (M = 3.07)
than males (M = 2.62) when shopping for clothes. The female
shoppers shop for clothes with either friends or family
members more than the male shoppers. Female respondents
were significantly more likely to be impulse shoppers
(M = 3.35) than male respondents (M = 2.70), which meant
female clothing shoppers had a greater tendency to buy
clothes on the spur of the moment without planning
beforehand. However, the male respondents were found to be
more brand loyal (M = 2.99) in clothes shopping than were
the females (M = 2.57).
As to fashion orientation, the female respondents
preferred to be or regarded themselves to be fashion leaders
more than did the males. Meanwhile, the male respondents in

97
Table 15One-way ANOVA of Shopping Orientations
by Sex
Orientation N Mean SD F-stat. p-value
Economic Shopping 0.09 0.77Male 209 3.05 0.60Female 198 3.03 0.63Total 407 3.04 0.62
Personalizing Shopping 0.74 0.39Male 209 2.39 0.72Female 198 2.31 0.71Total 407 2.36 0.71
Recreational Shopping 0.12 0.00Male 208 3.12 0.96Female 195 3.86 0.86Total 403 3.48 0.98
Social Shopping 37.92 0.00Male 208 2.62 0.74Female 195 3.07 0.79Total 403 2.84 0.80
Friend Social 31.50 0.00Male 209 2.48 0.95Female 198 2.96 0.91Total 407 2.71 0.96
Family Social 6.75 0.01Male 209 1.12 0.43Female 198 1.24 0.49Total 407 1.18 0.46
Brand Loyal 25.76 0.00Male 209 2.99 0.75Female 198 2.57 0.78Total 407 2.78 0.79
Impulse Shopping 55.23 0.00Male 208 2.70 0.90Female 195 3.35 0.91Total 403 3.02 0.96

98
Table 16
One-way ANOVA of Fashion Orientationby Sex
Orientation N Mean SD F-stat. p-value
Fashion Leadership 6.79 0.01Male 208 2.52 0.79Female 195 2.70 0.79Total 403 2.61 0.78
Fashion Interest 35.86 0.00Male 209 2.56 0.84Female 198 3.07 0.93Total 407 2.81 0.92
Fashion Importance 3.51 0.06Male 209 3.53 0.67Female 197 3.65 0.66Total 406 3.59 0.66
Anti-fashion Attitude 9.65 0.00Male 209 3.85 0.76Female 198 3.64 0.66Total 407 3.75 0.72

99
this study were more anti-fashion oriented than were the
females.
In order to investigate if "sex" as a variable
interacts with ethnicity, influencing respondents' apparel
shopping orientations, two-way ANOVA was conducted to
analyze shopping orientations by both sex and ethnicity.
The results are presented in Table 17 and Table 18.
The results indicated that sex influences respondents'
shopping orientations to a greater extent than does
ethnicity (the p-values by sex were smaller or the sum of
squares are bigger than those generated by ethnicity).
However, there were no two-way interactions between sex and
ethnicity on any of the seven shopping orientations.
These findings indicated that sex may be an important
variable in distinguishing respondents on their apparel
shopping orientations. Since there was no interaction
between sex and ethnicity, the previous tests of hypotheses
on respondents' shopping orientation by ethnicity were still
valid although sex was not included as a source of variation
when analyzing the data.
Summary
The statistical analysis revealed that null Hypothesis
1. was rejected. Also the null sub-hypotheses 1.4, 1.5 and
1.7 were rejected at the significance level of 0.05.

100
Table 17
Two-way ANOVA of Shopping Orientationsby Ethnicity & Sex
(N=401)
Orientation Sum ofSquares F-stat.
2-wayp-value interactionSource of Variation
Economic ShoppingEthnicity 0.17 0.46 0.50 0.063Sex 0.03 0.09 0.77
Personalizing ShoppingEthnicity 0.12 0.23 0.63 0.25Sex 0.38 0.38 0.39
Recreational ShoppingEthnicity 1.27 1.51 0.22 0.73Sex 56.08 66.74 0.00
Social ShoppingEthnicity 5.96 10.39 0.00 0.72Sex 21.77 37.92 0.00
Friend Social ShoppingEthnicity 6.58 7.70 0.01 0.60Sex 26.59 31.50 0.00
Family Social ShoppingEthnicity 1.23 5.88 0.02 0.28Sex 1.41 6.75 0.01
Brand Loyal ShoppingEthnicity 2.45 4.24 0.04 0.63Sex 14.87 25.76 0.00
Impulse ShoppingEthnicity 2.14 2.63 0.11 0.94Sex 44.87 55.23 0.00

101
Table 18
Two-way ANOVA of Fashion Orientationby Ethnicity & Sex
(N=401)
Orientations Sum ofSquares F-stat.
2-wayp-value interactionSource of Variation
Fashion LeadershipEthnicity 4.02 6.53 0.01 0.89Sex 4.18 6.79 0.01
Fashion InterestEthnicity 1.33 1.70 0.19 0.32Sex 28.00 35.86 0.00
Fashion ImportanceEthnicity 0.23 0.51 0.48 0.46Sex 1.54 3.51 0.06
Anti-fashion AttitudeEthnicity 0.10 0.20 0.65 0.76Sex 4.91 9.65 0.00
102
Significant differences were found between Asian and
Caucasian Americans on social shopping, including both
friend social and family social shopping, brand loyal
shopping and fashion leadership orientations.
The Asian respondents were found to be significantly
more brand loyal and liked to shop with friends or family
members than were the Caucasian respondents. The Asian
Americans students were also found to be more likely to
regard themselves as fashion leaders than were the Caucasian
students in this study.
The correlation test of Hypothesis 2. found a
significant negative correlation between intensity of ethnic
identification and fashion importance among Asian American
respondents. This finding indicated that the more an Asian
respondent identified with Asian ethnicity, the less (s)he
considered being well-dressed as important.

103
CHAPTER V
SUMMARY AND RECOMMENDATIONS
The purpose of the present study was to compare
differences in Asian American and Caucasian American apparel
shopping orientations. Also this study examined the
relationship between apparel shopping orientations and the
intensity of ethnic identification among Asian Americans.
Seven apparel shopping orientations were studied: economic
shopping, personalizing shopping, recreational shopping,
social shopping (including both shopping with friends and
family), brand loyal shopping, impulse shopping, and fashion
orientation (including fashion leadership, fashion interest,
fashion importance and antifashion attitude factors).
Diliman's (1978) Total Design Method was used as a
guideline in implementing the procedures of data collection.
The data collection method involved a mailed questionnaire
survey. A purposive sample of 300 Asian American and 300
Caucasian American students was drawn from the students
enrolled at Oregon State University for the 1990 Fall Term.
Survey response rates were 75.9% for the total sample, with
72.6% for the Asian group and 79.0% for the Caucasian group
respectively. Hypotheses were tested by MANOVA, t-test and
Pearson correlation analysis.

104
Findings and Marketing Implications
Results of multivariate analysis of variance (MANOVA)
revealed that there were significant differences between
Asian and Caucasian American students' apparel shopping
orientations. Further t-test analyses indicated that they
differed significantly on social shopping, both friend
social and family social shopping, brand, loyal shopping and
fashion leadership orientations. However, they were not
significantly different in terms of economic shopping,
personalizing shopping, recreational shopping and impulse
shopping.
The findings clearly indicated that Asian Americans
tended to view apparel shopping as a social activity more
than did the Caucasian Americans. This implied that Asian
Americans liked to go shopping for clothes with either
friends or family members more than the Caucasian American
students. These findings were consistent with previous
research results reported by Kotkin (1978) about Chinese
shopping behavior. It was concluded by Kotkin that the
Chinese liked shopping in large family groups. The findings
generated from the present study suggested that this social
shopping orientation could be generalized to Asian Americans
at OSU (not only Chinese Americans).
However, it is noteworthy that group means for both
Asians and Caucasians on the family social shopping

105
orientation were the lowest compared to all the other
shopping orientations. These means were 1.23 for the Asian
group and 1.13 for the Caucasian respectively. This implied
that, as a whole, the student sample in this study, did not
favor shopping for clothes with family members.
Therefore, when developing marketing strategies,
marketers and retailers have to be very careful in applying
this finding. In terms of apparel shopping, Asian
Americans' social orientation in this study was not an
absolute preference, but the Asians were more socially
oriented in comparison to the Caucasians.
This finding agreed with part of the results found by
Metropolitan Life Insurance, Inc. that the Asians Americans
were more family oriented ("Asian-Americans...", 1986).
Chowdhary and Dickey (1988) found cultural differences
between Indian college women fashion leaders and those in
Western society. The authors concluded that the role of
parent and family members in legitimating the fashion
choices of the respondents did reflect a cultural
difference. However, the root cause of the significant
difference found between the Asian and Caucasian Americans
on family shopping orientation should be worthy of more
research.
This finding could also be valuable for the apparel
industry since it adds to our knowledge of how Asian
Americans might shop for clothes differently from the
106
Caucasians. At least, this finding implied that the social
aspect of apparel shopping might not be as important as
other orientations when targeting the Asian and Caucasian
college students.
The findings of this study also suggested that Asian
American respondents tended to be more brand loyal than
Caucasian Americans. Previous research on shopping
orientations and ethnicity reached the same result.
Westernman (1989) reported that minority consumers typically
had strong brand loyalties and they were willing to pay
extra for name brands. Valencia (1982) also found that
Hispanics were more brand loyal than whites. Kim's (1987)
study indicated that Korean immigrants had stronger national
brand proneness than whites.
To many marketers, brand loyalty is a valuable
characteristic of a target market and marketers could
benefit from it. First, as suggested by Westerman (1989),
brand loyal shoppers are willing to pay more for name
brands. Second, usually it costs several times more to
attract new customers than to maintain existing customers.
Buyers who are loyal to a specific brand tend to be very
difficult and very costly to convince to try another brand
(Aaker & Myer, 1987). Therefore, apparel manufacturers and
retailers could turn this finding into a key strategy when
targeting the Asian American market segment.
For instance, investing in maintaining existing

107
customers (building brand loyalty among existing customers)
might be a more cost/performance effective way of making
profits than spending money on promotion to attract new
customers from competitive brands. Moreover, having an
Asian American customer might be a different thing than
having a Caucasian customer, since the Asians tend to be
more loyal to a brand than the Caucasians and might stay
with the brand longer. On the other hand, losing an Asian
customer would be different from losing an Caucasian
customer. A lost Asian customer might be a permanent loss,
because they might in turn become very loyal to a
competitor's brand. But a lost Caucasian customer might
come back in time, since compared to the Asians, the
Caucasians are not as loyal to a specific brand.
Kim (1987) suggested that the reason why Korean
immigrants were more brand loyal to certain brands was due
to ego or self-enhancement. Korean immigrants might engage
in conspicuous consumption or buying merely for the status-
symbol a certain brand provides. Further study of the
underlying causes(s) of brand loyal tendencies among
minorities (or a specific ethnic group, such as Asian
Americans) can provide marketers or retailers an important
basis for attracting ethnic groups to a certain brand. Also
it would be helpful for marketers or retailers to know what
kind of brand image must be developed in order to maintain
brand loyalty among the Asian customers.

108
Asian American respondents in this study were also
found to possess more fashion leadership proneness than the
Caucasians. They tended to regard themselves as fashion
leaders more than the Caucasians. Chen's study in 1970
might explain some part of these findings. In her study
Chinese were found to be more in favor of expressing status
through clothing than the American group. However, to
identify the underlying cause and motivation for this
difference will require further study and exploration.
In their integrative analysis of fashion life-style,
self-concept, shopping orientation and store patronage,
Gutman and Mills (1982) profiled fashion leaders as those
who scored higher on the fashion leadership factor, which
set them apart from other segments. They found significant
differences in self-concept between fashion leaders and non-
leaders. Fashion leaders saw themselves as more
sophisticated, modern, different, chance taking, confident,
creative, sociable and having a more complicated life-style
than non-leaders (such as followers, independents or
laggards). Their study results also showed significant
congruence existed between the attitudes expressed by
fashion leaders and their shopping and store patronage
behavior.
However, to determine how much of this portrait of
fashion leaders developed by Gutman and Mills (1982) could
be applied to Asian American students, requires further

109
research. Schrank, Sugawara & Kim (1982) found there were
different attitudal and social-economic characteristics
between Korean and white fashion leader samples despite
their similar fashion leadership characteristics.
The correlation analysis of shopping orientations and
the intensity of ethnic identification found negative
correlation between intensity of identification and fashion
importance orientation among Asian American respondents. To
be more specific, a negative relationship was found on the
attitude towards the importance of being well-dressed among
Asian Americans across the intensity of identification. The
results suggested that the more an Asian American subject
identified with Asian ethnicity, the less he (she)
considered being well-dressed to be important. In other
words, the more an Asian American respondent thought himself
(herself) as an American (not Asian), the more he (she)
considered being well-dressed to be important.
Although the underlying cause of why negative
correlation existed between these two variables needs
further study, this finding in itself should not be
neglected. This finding suggested that how an Asian
American perceived the importance of being well-dressed was
significantly related to his(her) intensity of
identification. In other words, by knowing the background
of an Asian American, specifically which generation (s)he is
in the U.S. might provide clues as to how he (she) perceives

110
the importance of being well-dressed.
From an academic point of view, more interestingly, why
did this negative correlation not exist on other factors of
fashion orientation? Why was it a negative correlation, not
a positive one? All these questions could lead to more
research on the acculturation/assimilation process and would
add to our body of knowledge regarding Asian Americans.
Contrary to the previous findings, significant
differences were not found on personalizing shopping and
impulse shopping orientations. It was reported by Edmondson
(1986) that Asian Americans tended to buy from people or
companies that speak their language and understand their
culture. Valencia (1982) found that Hispanics, as a
minority group, were more likely to shop at smaller stores,
and to dislike impersonal stores. However, in the present
study, Asian American respondents did not show any
significant difference from the Caucasians on personalizing
orientation.
Gim (1988) suggested that Asian women were not
impulsive buyers. Although the present study found that the
female shoppers (of both ethnic groups) were significantly
more impulse-oriented than were the males, the Asians did
not differ from the Caucasians as a group on impulse
shopping orientation.
These inconsistencies of findings may be owing to
either the product type (apparel, specifically in this

111
study) or sample characteristics. Most of previous research
on shopping orientation studied general shopping behavior,
not apparel shopping specifically. Apparel shopping is
often referred to as conspicuous consumption, that an
individual's or family's wealth and status may be displayed
through the consumption of apparel that is visibly expensive
or fashionable (Kaiser, 1985). Apparel shopping has
characteristics which make it different from other types of
shopping, such as grocery shopping, and might not yield the
same results as other studies. The purposive sample in this
study was composed of college students on a West coast
campus. They tended to be younger than the general
population, more of them were single, many of them may not
be totally economically independent of their families and
they reside in a specific region. Due to these
characteristics of the purposive sample, some differences
might not be revealed in this study.
Conclusions
Two research questions were answered when the present
study was completed: 1. What is the pattern of apparel
shopping orientations of Asian American in comparison with
Caucasian American students at OSU? 2. Is there any
correlation between apparel shopping orientations and
intensity of ethnic identification among OSU Asian American

112
students? Significant differences were found between the
Asian American students and Caucasian American students on
their brand loyal, friend social and family social as well
as fashion leadership shopping orientations. The Asian
American respondents were found to be more brand loyal, more
liked to shop with friends and family members and more
tended to view themselves as fashion leaders than did the
Caucasian American respondents in this study. Also a
significant negative correlation was found between the
intensity of ethnic identification and fashion importance
among Asian American respondents. It was found that the
more an Asian respondent identified with Asian ethnicity,
the less (s)he considered being well-dressed to be
important.
The theoretical framework of this study was the
consumer behavior model proposed by Engel, Kollat and
Blackwell (1973). This model was partially supported by the
finding of significant differences between Asian American
and Caucasian American students' apparel shopping
orientations. Results of the present study indicated that
subjects of different ethnicities (Asian vs Caucasian) did
demonstrate differences in their consumer behavior
intentions. As one of the variables influencing decision
process, culture and ethnicity play important roles in
influencing consumer behavior. The significant differences
between Asian and Caucasian students might influence

113
different stages of the decision process, from problem
recognition, search, alternative evaluation to purchase.
Very little empirical research has been conducted on
Asian Americans, as a whole, in relation to their consumer
behavior, specifically their clothing behavior. The
findings of present investigation provided insight as to how
Asian American students at OSU differ from the majority
Caucasian American students in apparel shopping behavior.
The results of this study also provided one more
justification to study Asian Americans as a market segment,
besides their increasing numbers, changing social-economic
levels and massive buying power as discussed in the
introduction. The results are valuable to the apparel
industry and will influence whether to consider Asian
Americans as a distinct apparel market segment.
Also the results of this study provided support for
the use of shopping orientations as a general but practical
way of identifying a limited set of shopper types to which
retail managers or apparel firms may direct differentiated
marketing efforts. Academically, this study added to the
body of literature on shopping orientations in relation to
different ethnic groups, in addition to what has been
investigated regarding Hispanics compared to whites
(Valencia, 1982) or Korean immigrants compared to whites
(Kim, 1987).
A new dimension of social shopping orientation was
114
identified and explored in this study: family social
shopping--to shop with family members. In Valencia's study
social shopping orientation was measured by shopping with
friends only. The findings of present study suggested that
the social shopping orientation may include two dimensions.
The sub-scale developed by the researcher of this study
(questions A.23 and A.27) proved to be successful in terms
of reliability and validity. Moreover, it was found to be
an orientation differentiating the Asians from the
Caucasians with respect to apparel shopping.
This study also tested the reliability and validity of
subjective, self-reported scales measuring intensity of
ethnic identification. The intensity of identification has
been measured multi-dimensionally by language, religion,
generation or as part of an index of acculturation. In the
present study, it was found that there was a significant
difference in the intensity of identification by generation.
The findings indicated that the older the generation of an
Asian American student was in the U.S., the weaker (s)he
identified with Asian ethnicity. This double check of the
relationship between generation and intensity of
identification provided one more reference for further study
of how ethnicity may be measured.
Additional analysis indicated that, sex was an
effective variable, besides ethnicity, in explaining
differences in shopping orientations. This finding would be

115
valuable to fashion related research, since many studies
have focused on female subjects only and their
generalizability to the whole population is questionable.
Limitations
Before making recommendations, limitations of this
study should be discussed. Owing to the time and financial
constraint of the researcher, the sample used in this study
was a purposive sample of Oregon State University students.
The results cannot be generalized to the whole Asian
American population.
The nature of this study was observational, no cause
and effect relationship can be drawn from the findings. It
cannot be concluded that ethnicity is the cause of the
differences which were found in this study. Any difference
found in this study should be interpreted as "group
difference" which might be attributable to a number of
factors other than ethnicity.
The self-reported apparel shopping orientations in the
study indicated general shopper tendencies but may not be
fully reflective of actual shopping behavior. Therefore,
when applying the findings of this study, the results should
be interpreted with caution.
The reliabilities and validity of some scales used in
this study, such as reliability estimates on the economic
116
shopping orientation and the validity on friend social
shopping orientation, need further testing and improvement.
Therefore, the interpretation of findings on these
orientations should be treated with caution, too.
The study focused on apparel shopping specifically.
Therefore, the results might not be applicable to shopping
behavior in regard to other product categories.
Recommendations for Future Research
Based on the results of the present study, the
following recommendations for future research are proposed.
1. Replication of the present study,
a. with the revisions of some scales to improve
the reliability and validity, such as
reliability on economic shopping and validity
on some items measuring friend social
shopping orientation.
b. using a larger sample, a national probability
sample, or a sample in another geographic
area.
c. using shopping orientations which were not
selected and tested in the present study.
2. Qualitative or experimental research is needed to
identify the underlying causes or motivations for
the significant differences found on brand loyal
117
shopping, friend and family social shopping and
fashion leadership orientations in the present
study.
3. More research is encouraged to examine the
relationship between shopping orientations and other
demographic factors (such as age, marital status and
academic major) or the interaction between
demographic factors and ethnicity.
118
REFERENCES
Aaker, D. A. & Myers, J. G. (1987). Advertising Management(3rd). Englewood Cliffs, NJ: Prentice-Hall.
Anderson, W. T., Jr. (1971). Identifying the convenience-oriented consumer. Journal of Marketing Research, 8(2),179-183.
Asian-Americans targeted by insurance firm. (1986, April).Marketing News, p. 34.
Bahr, H. M., Chadwick, B. A., & Stauss, J. H. (1979).American ethnicity. BOston, MA: Health.
Bannai, H., & Cohen, D. A. (1985). The passive - methodicalimage of Asian American students in the school system.Sociology and Social Research, 70(1), 79-81.
Barker, H. R. & Barker, B. M. (1983). Multivariate Analysisof Variance (MANOVA): A practical guide to its use inscientific decision making. Alabama, The University ofAlabama Press.
Bellenger, D. N., & Korgaonkar, P. K. (1980). Profilingthe recreational shopper. Journal of Retailing, 56(3), 77-92.
Bellenger, D. N., & Valencia, H. (1982). Understanding theHispanic market. Business Horizons, 12(3), 47-50.
Blumer, H. (1969). Fashion: From class differentiation tocollective selection. Sociological Quarterly, 10(2), 275-291.
Boone, L. E., Kurtz, D. L. Johnson, J. C., & Bonno, J. A.(1974). "City shopper and urban identification" revised.Journal of Marketing, 38(3), 67-69.
Bouvier, L. F. & Agresta, A. J. (1985, May). The fastestgrowing minority. American Demographics, pp. 30-33, 46.
Chen, J. H. (1970). Clothing attitude of Chinese andAmerican college women. Dissertation AbstractsInternational, 31, 5457B. (University Microfilms No. 71-6293)

119
Choe, S. T. (1984). Acculturation and consumption patternsof ethnic consumers: The case of Korean immigrants inDallas, Texas. Dissertation Abstracts International, 45,2931A.
Chowdhary, U., & Dickey, L. (1988). Fashion opinionleadership and media exposure among college women inIndia. Home Economics Research Journal, 16(3), 183-194.
Creekmore, A. M. (1963). Clothing behavior and theirrelation to general values and to the striving for basicneeds. Dissertation Abstracts International, 24, 1599.(University Microfilms No. 63-6292)
Darden, W. R., & Ashton, D. (1974-1975). Psychographicprofiles of patronage preference groups. Journal ofRetailing, 50(4), 99-112.
Darden, W. R., & Perreault, Jr., W. D. (1976). Identifyinginterurban shoppers: Multiproduct purchase patterns andsegmentation profiles. Journal of Marketing Research,13(1), 51-60.
Darden, W. R., & Reynolds, F. D. (1971). Shoppingorientations and product usage rates. Journal of MarketingResearch, 8(4), 505-508.
Dardis, R., Derrick, F., & Lehfeld, A. (1981). Clothingdemand in the United States: A cross-sectional analysis.Home Economics Research Journal, 10(2), 212-222.
Deshpande, R. Hoyer, W. D., & Donthu, N. (1986). Theintensity of ethnic affiliation: A study of the sociologyof Hispanic consumption. Journal of Consumer Research,12(2), 214-220.
Dillman, D. A. (1978). Mail and telephone surveys: The totaldesign method. New York: John Wiley.
Edmondson, B. (1986, July). Met Life mines minoritymarket. American Demographics, p. 19.
Engel, J. F., Blackwell, R. D., & Miniard, P. W. (1986).Consumer Behavior (5th Ed.).. New York: CBS CollegePublishing.
Engel, J. F., Kollat, D. T., & Blackwell, R. D. (1973).Consumer Behavior (2nd Ed.). New York: Holt, Rinehart andWinston.

120
Feldman, L. P., & Star, A. D. (1968). Racial factors inshopping behavior. In K. Cox & B. M. Enis (Eds.). A newmeasure of responsibility for marketing. 1968 JuneConference Proceedings. Series No. 27. (pp.216-226).Philadelphia, American Marketing Association.
Foote, J. (1987, September, 7). Tapping into a blossomingAsian market. Newsweek, pp. 47-48.
Forney, J. C. & Rabolt, N. J. (1986). Ethnic identity: Itsrelationship to ethnic and contemporary dress. Clothingand Textiles Research Journal, 4(2), 1-8.
Gergen, D. R. (1988, March 14). America's new talent bank.U.S. News & World Report, p.80.
Gillett, P. L., & Scott, R. A. (1974). Shopping opinionsof Mexican-American consumers: A comparative analysis. InR. C. Curhan (Ed.), New marketing for social and economicProgress and marketing's contribution to the firm and tothe society. 1974 Combined Proceedings, Series No 36. (pp.135-141). American Marketing Association.
Gim, G. J. (1988). Clothing acquisition patterns and sizeinformation of Oriental female immigrants. (Masterthesis, the University of Arizona). Masters ThesisAbstracts International, 27, 386.
Goldsmith, R. E., Stith, M. T., & White, J. D. (1987). Raceand sex differences in self-identified innovativenessand opinion leadership. Journal of Retailing, A2(4), 411-424.
Gould, K. H. (1988). Asian and pacific islanders: Myth andreality. Social Work, 33, 142-147.
Gutman, J., & Mills, M. K. (1982). Fashion life style, self-concept, shopping orientation, and store patronage: Anintegrative analysis. Journal of Retailing, 58(2), 64-86.
Hamilton, J. A., & Hamilton, J. W. (1989). Dress as areflection and sustainer of social reality: A cross-cultural perspective. Clothing and Textiles ResearchJournal, 7(2), 16-22.
Henry, W. A. (1976). Cultural values do correlate withconsumer behavior. Journal of Marketing Research, la, 121-127

121
Hirschman, C. & Wong, M. G. (1984). Socioeconomic gains ofAsian Americans, blacks, and Hispanics: 1960-1976.American Journal of Sociology, 90, 584-609.
Hirschman, E. C. (1981). American Jewish ethnicity: Itsrelationship to some selected aspects of consumerbehavior. Journal of Marketing, 45(3), 102-110.
Hoffman, E. L. (1982). Dress and acculturation: Clothingtransitions of the Mien. Unpublished master's thesis,Oregon State University, Corvallis, Oregon.
Holbrook, M. B., & Hirschman, E. C. (1982). Theexperiential aspects of consumption: Consumerfantasies, feelings, and fun. Journal of ConsumerResearch, 9(2), 132-140.
Howell, R. D. (1979). A multivariate examination of apatronage model: The impact of values and life style onshopping orientations (Doctoral dissertation, Universityof Chicago). Dissertation Abstracts International, 40,1660A.
Hutnik, N. (1986). Patterns of ethnic minorityidentification and modes of social adaptation. Ethnic andRacial Studies, 9(2), 151-166.
Kaiser, S. B. (1985). The social psychology of clothing. NewYork: Macmillan.
Kern, R. (1988, May). The Asian market: Too good to be true?Sales & Marketing Management, 140, pp. 38-42.
Kim, S. H. (1987). A comparative study of shoppingorientations between Korean immigrants and whites inAllegheny County. (Doctoral dissertation, University ofPittsburgh). Dissertation Abstracts International, 49,884A.
Korgaonkar, P. K. (1981). Shopping orientations of catalogshowroom patrons. Journal of Retailing, 57(1), 79-91.
Kotkin, J. (1987, July). Selling to the new America. Inc.pp. 45-51.
Kwon, Y. H. (1982). Clothing practices of Korean femaleimmigrants in Chicago. Journal of Consumer Studies andHome Economics, 6(4), 337-349.
122
Lapitsky, M. (1961). Clothing values and their relation togeneral values and to social security and insecurity.Dissertation Abstracts, 22, 244. (University MicrofilmsNo. 61-2382)
Less, J. (1987, August). Throw out the cookie cutter.Apparel Industries, pp. 108-109.
Linton, R. (1945). The cultural background of personality.New York: Appleton-Century-Crofts.
Lumpkin, J. R. (1980). Relating television preferenceviewing to shopping orientations and life styles: Theexamination of perceptual and preference dimensions oftelevision programming. Dissertation AbstractsInternational, 41, 2207A. (University Microfilms No. 80-26, 095)
Lumpkin, J. R., & Greenberg, B. A. (1982). Apparel-shopping patterns of the elderly consumer. Journal ofRetailing, 5a(4), 68-89.
Manning, W. & O'Hare, W. (1988, August). Asian Americanbusiness. American Demographics, pp. 34-37.
Mcdonagh, E. C., & Richards, E. S. (1972). Ethnic relationsin the United States. Connecticut: Negro UniversitiesPress., p.4.
McLeod, B. (1986, July). The oriental express. PsychologyToday, pp. 48-52.
Mendoza, A. R. (1965). Clothing values and their relation togeneral values: A cross-cultural study. DissertationAbstracts International, 23,, 6688. (University MicrofilmsNo. 66-4831)
Miller, S. J. (1982). An examination of sex-roleorientations and their relationships with shopping andlifestyles. Dissertation Abstracts International, 43,3404A. (University Microfilms No.83-05, 160)
Moschis, G. P. (1976). Shopping orientations and consumeruses of information. Journal of Retailing, 52(2), 61-93.
Nee, V. & Sanders, J. (1985). The road to parity:Determinants of the socioeconomic achievement of AsianAmericans. Ethnic and Racial Studies, 8(1), 76-93.
Nivison, D. C., & Wright, A. F. (1959). Confucianism inaction. Palo Alto, CA: Stanford University Press.

123
Oregon State University,. (1990, Fall). Asian Americanversus White American student population. InstitutionalResearch and Planning. Corvallis, OR: Oregon StateUniversity.
Passante, D. L. (1976, October 25). The Hispanic market: Awhole other world for the advertiser. Broadcasting, 9(2),P. 12.
Patel, D. I. (1988). Asian Americans: A growing force. TheJournal of State Government, 61, 71-76.
Peter, J. P. (1979). Reliability: A review of psychometricbasics and recent marketing practices. Journal ofMarketing Research, j_.k (1), 6-17.
Powell, T. E. (1980). An estimation of the structuralparameters of the shopping orientations portion of theDarden model of patronage behavior. (Doctoraldissertation, University of Arkansan, 1980). DissertationAbstracts International, Al, 2268-A.
Quotas on Campus: The new phase. (1989, January 30).Fortune, 119, pp.205-208.
Roach, M. E., & Eicher, J. B. (1965). Dress. adornment andthe social order. New York: Wiley.
Robertson, T. S., Dalrymple, D. J., & Yoshino, M. Y. (1969).Cultural compatibility in new product adoption.Proceedings of the 1969 Fall Conference of AmericanMarketing Association, 30, 70-75.
Robery, B. (1985, May). America's Asians. AmericanDemographics, 7, pp.22-29.
Ryan, M. S. (1966). Clothing. a study in human behavior. NewYork: Holt, Rinehart and Winston.
Schrank, H. L. (1973). Correlates of fashion leadership:Implication for fashion process theory. The SociologicalOuarterly, 14, 534-543.
Schrank, H. L., Sugawara, A. I., & Kim, M. (1982). Fashionleadership: A two-cultural study. Part 2: Comparison ofKorean and American fashion leaders. Home EconomicsResearch Journal, 10(3), 253-240.
Senga, S. S., Brown, S. A., & Gonzales, C. A. (1987).Clothing values of Filipino women residing in Canada.Canadian Home Economics Journal, 37(1), 33-38.

124
Sletten, R. C. G., & Petrich, B. A. (1983). Clothingproblems as perceived by Mexican American migrant women.Home Economics Research Journal, 11(3), 289-294.
Starr, F. (1930). Confucianism: Ethics, philosophy andreligion. New York: Covici-Friede.
Stephenson, P. R., & Willett, R. P. (1969). Analysis ofconsumers' retail patronage strategies. Proceedings ofthe 1969 Fall Conference of the American MarketingAssociation, 30, 316-322.
Stone, G. P. (1954). City shoppers and urban identification:Observations on the social psychology of city life. TheAmerican Journal of Sociology, 60(1), 36-45.
Tan, C. T., & McCullough, J. (1984). Relating ethnicattitudes and consumption values in an Asian context. InE. C. Hirschman & M. B. Holbrook (Eds.). Advances inConsumer Research, 12, 122-125.
Tatzel, M. (1982). Skill and motivation in clothes shopping:Fashion conscious, independent, anxious and apatheticconsumers. Journal of Retailing, 58(4), 90-96.
Thornton, M. C., & Taylor, R. J. (1988). Intergroupattitudes: Black American perceptions of Asian Americans.Ethnic Racial Studies, 11(4), 474-488.
U. S. Department of Commerce, Bureau of the Census (1984).1980 Census of population. Vol. 1. characteristics of thepopulation. chanter D. detailed populationcharacteristics, part I. United States summary. Appendix BWashington D. C.: U. S. Government Printing Office, p.B-3.
U. S. Department of Commerce, Bureau of the Census (1987).Current population reports: Population profile of theUnited States. 1984/1985. Special Studies. Series p-23.no. 150, National population trends. Washington D. C. :
U. S. Government Printing Office, pp. 5-7.
Valencia, H. (1982). Shopping orientations among Hispanicsand Caucasians in the United States. (Doctoraldissertation, Georgia State University). DissertationAbstracts International, 43, 3405A.
Webster, F. E. Jr. (1965, May). The "deal-prone" consumer.Journal of Marketina Research, 2, 186-189.

125
Westbrook, R. A., & Black, W. C. (1985). A motivation-based shopper typology. Journal of Retailing, 61(1), 78-103.
Westernman, M. (1989, March). Death of the Frito Bandito.American Demographics, pp. 28-32.
Williams, R. H., Painter, J. J., & Nicholas, H. R. (1978). Apolicy-oriented typology of grocery shoppers. Journal ofRetailing, 54(1), 27-42.
Wilson, C. L. (1966). Homemaker living patterns andmarketplace behavior - A psychometric approach. In J. S.Wright & J. L. Goldstucker (Ed.), Proceedings of the 1966World Congress of the American Marketing Association (pp.305-331). Chicago: The Palmer House.
Wong, M. G. (1986, September). Post-1965 Asian immigrants:Where do they come from, where are they now, and where arethey going. The Annals of the American Academy ofPolitical and Social Science, 487, 150-168.
Yao, E. L. (1985). A comparison of family characteristics ofAsian-American and Caucasian-American high achievers.International Journal of Comparative Sociology, 26(3-4),199-207.
Zinsmeister, K. (1988, February). Asians and blacks-bittersweet success. Current (Washington D. C.), 300, 9-16.

APPENDICES

126
Appendix A
Correspondence for the Survey

127(Cover Letter -- First Mailing)
October 30, 1990
NameAddress
Do you like to shop? We are interested in finding out whatyou like and dislike about shopping for clothes. Youropinions regarding clothing shopping are also important toapparel manufacturers and retailers in their efforts toaddress consumer needs and concerns.
You have been selected as one of a small number of OSUstudents to give your opinions on shopping. A random samplewas drawn from the students enrolled at Oregon StateUniversity (OSU) Fall Term, 1990. In order that the resultstruly represent the attitudes of students at OSU, it isimportant that each questionnaire be completed and returned.
You may be assured of complete confidentiality. Thequestionnaire has an identification number for mailingpurposes only. Your name will never be placed on thequestionnaire. You may receive a summary of the results bywriting your name and address on the back of the returnenvelope (not on the questionnaire). We would be pleased toanswer any questions you might have. Please write or call.The telephone numbers are (W)737-0986, or (H) 758-7568.
Thank you for your cooperation.
Sincerely,
Angie Ho Dr. Cheryl JordanGraduate Student Assistant Professor

128(Postcard Reminder)
November, 1990
Last week a questionnaire seeking your opinions about shopping forclothes was mailed to you. Your name was drawn in a random sampleof students enrolled at OSU Fall Term, 1990.
If you have already completed and returned It to me please acceptmy sincere appreciation. If not, please do so today. It is soimportant because it has been sent to only a small, but representative,sample of OSU students. Your assistance will contribute a lot to therepresentativeness of the results of the study.
If you did not receive the questionnaire, or it got misplaced, pleasecall me and I will mail another one for you immediately. Mytelephone numbers are (W)737-0986, or (H) 758-7568.
Sincerely,
Angie HoProject Director

(Cover Letter -- Third Mailing)
November 13, 1990
NameAddress
129
About two weeks ago a letter and questionnaire were mailedto you seeking your opinions about clothing shopping. As oftoday I have not received your completed questionnaire.
The purpose of this study is to find out how collegestudents shop for clothes. Apparel manufacturers andretailers who are interested in producing products andservices for young adults will benefit from the results ofthis study. Moreover, as a consumer like you will alsobenefit from the study because your concern and need can beaddressed more precisely.
I am writing to you again because of your significance tothe study. Your name was drawn from a random sample inwhich every student enrolled at OSU Fall Term, 1990 has anequal opportunity to be selected. In order for the resultsof the study to be truly representative of the attitudes ofstudents at OSU, it is essential that each person in thesample return their questionnaire.
In case your questionnaire has been misplaced, a replacementis enclosed. Please fill it out and mail it back today.
Your cooperation is highly appreciated.
Sincerely,
Angie Ho Dr. Cheryl JordanGraduate student Assistant Professor
130
Appendix B
Questionnaire

HOW DO YOU SHOPFOR CLOTHES?
ANGIE HODEPARTMENT OF APPAREL INTERIORS,HOUSING AND MERCHANDISING
OREGON STATTE UNIVERSITYMILAM HALL #224CORVALLIS, OR 97331
131

A. The following is a set of statements describing the way peopleshop for apparel. For each of the statements below, pleasecircle the answer that best describes how much you DISAGREE orAGREE with that statement. Your answer may range fromSTRONGLY DISAGREE (1) to STRONGLY AGREE (5) or anywhere inbetween.
1. In general, I enjoy shoppingfor clothes
2. I like to go shopping forclothes with my friends
3. I like to shop for clotheswhere the sales people knowme by name
4. I prefer buying only specificbrands of clothing
132
(STRONGLY STRONGLY'DISAGREE AGREE
5. I only buy clothing I had inmind before entering thestore
6. Clothes are too expensive insmall stores
7. I normally do not buy unknownbrands of clothes
8. I am not interested inshopping for clothes
9. I try to get to know the salespeople in the stores where Ishop for clothes
10. Big chain stores, such asTarget or Kmart, offer betterbargains on clothing items
1 2 3 4 5
1 2 3 4 5
1 2 3 4 5
1 2 3 4 5
1 2 3 4 5
1 2 3 4 5
1 2 3 4 5
1 2 3 4 5
1 2 3 4 5
1 2 3 4 5
Please go to the next page
-1-

133
'STRONGLY STRONGLY!DISAGREE AGREE
11. When in the store, I often buyclothing on the spur of themoment
12. Department stores, such asMeier & Frank or The Bon, havereasonable prices on clothing..
13. Shopping for clothes gives mea chance to talk to people withsimilar interests
14. Shopping for clothes is aterrible waste of time
15. I often end up buying clothesI had not intended to buy
16. Once I find a brand of apparelI like, I stick with it
17. I like it when my friends askme to go shopping for clotheswith them
18. Prices for clothing are higherat smaller stores
19. I do not like to talk to salespeople in the stores where Ishop for clothes
20. For me, shopping for clothesis fun anywhere
21. I get a psychological liftfrom shopping for clothes
22. If I do not find my brand ofclothes in the store, I willtry some other brands
1 2 3 4 5
1 2 3 4 5
1 2 3 4 5
1 2 3 4 5
1 2 3 4 5
1 2 3 4 5
1 2 3 4 5
1 2 3 4 5
1 2 3 4 5
1 2 3 4 5
1 2 3 4 5
1 2 3 4 5
Please turn the page
-2-

134
IrRONGLY STRONGLY'DISAGREE AGREE
23. I seldom go shopping forclothes with my family
24. I do not care whether peoplein the store know me or notwhen I shop for clothes
25. Shopping for clothes is a realbother in any store
26. I normally stick to my writtenor mental clothing shoppinglist
27. I enjoy shopping for clotheswith my family
1 2 3 4 5
1 2 3 4 5
1 2 3 4 5
1 2 3 4 5
1 2 3 4 5
B. The following questions are about fashion trends and therelationship between fashion and clothes. Please circle thenumber that best describes how much you DISAGREE or AGREE withthat statement.
1. It is important for me to bea fashion leader
2. I am not the first one to trynew fashion trends
3. I am confident in my abilityto recognize fashion trends
4. Dressing is one of the mostimportant ways I have ofexpressing my individuality
5. Many people regard me as beinga fashion leader
rMONGLYGR=
STRONGLY!AGREE
1 2 3 4 5
1 2 3 4 5
1 2 3 4 5
1 2 3 4 5
1 2 3 4 5
Please go to the next page
-3-

135
STRONGLY STRONGLYDISAGREE AGREE
6. Because of my active life style,I need a wide variety ofclothes
7. I always buy at least one outfitof the latest fashion
8. I seldom read fashion magazinesor pay attention to fashiontrends
9. I spend a lot of money onclothes and accessories
10. I do not spend time onfashion-related activities
11. It's important to bewell-dressed
12. If you want to get ahead, youhave to dress the part
13. What you think of yourself canbe reflected by what youwear
14. Wearing good clothes is partof leading the good life
15. I resent being told what towear by so-called fashionexperts 1 2 3 4 5
1 2 3 4 5
1 2 3 4 5
1 2 3 4 5
1 2 3 4 5
1 2 3 4 5
1 2 3 4 5
1 2 3 4 5
1 2 3 4 5
1 2 3 4 5
16. Fashion in clothes is just away to get more money from theconsumer
17. I buy clothes I like, regardlessof current fashion
1 2 3 4 5
1 2 3 4 5
Please turn the page
-4-

136
C. The following three questions will help us understand how youidentify with your ethnic heritage. All answers will be keptconfidential.
1. With which ethnic or racial group do you identify yourself(Circle only one):
1 ASIAN AMERICAN O02 CAUCASIAN3 OTHER (Please specify
(if you choose 2, please skip la and lbl
'STRONGLYDISAGREE
* la At a fundamental level,I really think ofmyself as Asian 1 2 3 4 5
STRONGLYAGREE
--4olb I think of myself asAmerican 1 2 3 4 5
D. A few more questions about yourself so that we can accuratelydescribe our sample. All answers will remain confidential.Please circle or fill in the best answer to each question.
1. How old were you on your last birthday?
YEARS
2. Are you male or female? (Circle one number)
1 MALE2 FEMALE
3. What was your class standing at the beginning of Fall Term,1990? (Circle one number)
1 FRESHMAN2 SOPHOMORE3 SENIOR4 GRADUATE STUDENT5 OTHER (Please specify
Please go to next page
-5-

137
4. What college are you in currently? (Circle one number)
1 COLLEGE OF AGRICULTURAL SCIENCE2 COLLEGE OF BUSINESS3 COLLEGE OF EDUCATION4 COLLEGE OF ENGINEERING5 COLLEGE OF FORESTRY6 COLLEGE OF.HEALTH AND HUMAN PERFORMANCE7 COLLEGE OF HOME ECONOMICS8 COLLEGE OF LIBERAL ARTS9 COLLEGE OF OCEANOGRAPHY10 COLLEGE OF PHARMACY11 COLLEGE OF SCIENCE12 COLLEGE OF VETERINARY MEDICINE13 INTERDISCIPLINARY PROGRAMS
5. Where were you born ? (Circle one number)
1 BORN IN THE UNITED STATES2 BORN IN ANOTHER COUNTRY
Po 5a. In what country were you born?
COUNTRY
6. How many years, altogether, have you lived in the UntiedStates?
YEARS
7. Which generation of your family first came to the UnitedStates? (Circle one number)
1 YOUR GREAT GRAND PARENTS2 YOUR GRAND PARENTS3 YOUR PARENTS4 YOU ARE THE FIRST5 I DO NOT KNOW6 OTHER ( Please specify
Please turn the page
- 6 -

8. What is your citizenship?
1 UNITED STATES2 OTHER (Please specify
9. Are you? (Circle one number)
1 SINGLE, NEVER MARRIED2 MARRIED3 SEPARATED4 DIVORCED5 WIDOWED
10. How many persons, including yourself, were living in thehousehold you grew up in?
PERSONS
138
11. And what was (is) the occupation of the head of the householdyou grew up in?
OCCUPATION
12. When you were growing up how many wage earners were there inyour household?
NUMBER OF WAGE EARNERS
13. Is there anything else you would like to say about shoppingfor clothes? Please use the space below to tell us.
YOUR COOPERATION IS TRULY APPRECIATED.

139
If you would like a summary of the results of this study. Pleasewrite your name and address on the back of the return envelope (noton the questionnaire).
Please return this in the enclosed reply envelope (no postagenecessary) or return to:
Angie HoDepartment of Apparel, InteriorsHousing and MerchandisingOregon State UniversityMilan Hall #224Corvallis, OR 97331
140
Appendix C
Application for Exemption Review
Protection of Human Subjects

OFFICE OF VICE PRESIDENT FOR RESEARCH. GRADUATE STUDIES. AND INTERNATIONAL PROGRAMS
OREGON STATE UNIVERSITYAdministrathe Services A312 Corvallis, Oregon 97331.2140
503 737.3437 FAX 503.737.3093 Tele: 5105960682 OSU COVS
October 25, 1990
141
Principal Investigator:
It has been determined that the following project is exemptfrom review by Oregon State University's Committee for theProtection of Human Subjects under guidelines from the U.S.Department of Health and Human Services:
Principal Investigator: Cheryl Jordan
Student's Name (if any): Angie Ho
Department: AIHM
Source of Funding:
Project Title: A Comparative Study of ShoDoina Orientations
between Asian Americans and Anglo Americans
Comments:
A copy of this information will be provided to the Chair ofthe Committee for the Protection of Human Subjects. If questionsarise, you may be contacted further.
Redacted for Privacyiary w 4.1 CU.CA.111
Research Development Officer
cc: CPHS Chair
Related Documents


![[redacted] - Summer school on real-world crypto and privacy ...[redacted] - Summer school on real-world crypto and privacy 2015 ibenik, Croatia Author Jacob Appelbaum Created Date](https://static.cupdf.com/doc/110x72/60e2954d7f1d5f30c12f568c/redacted-summer-school-on-real-world-crypto-and-privacy-redacted-summer.jpg)