AN ABSTRACT OF THE THESIS OF Charles Craig Haluzak for the degree of Master of Science in Mechanical Engineering, presented May 4, 1989. Title : Experimental Combustion Analysis and Development of Representative Fuel Specifications for Selected Wood and Refuse Derived Fuel Pellets from the Pifi9nNorthwest. Redacted for Privacy Abstract Approved : 1`11.'''`v (ip.. ughdell An experimental biomass combustion facility has been built and established at Oregon State University. The furnace, or Biomass Combustion Unit ( BCU ), uses an auger- type fuel feed system, grate-type fuel support with under and over fire air supply. Fourteen pellet species from five States - Alaska, Washington, Oregon, Idaho, and Montana were analyzed for a large number of physical and chemical variables. These variables included higher heating value, moisture content, ultimate analysis, etc. Three separate combustion experiments were conducted using nine of the available fourteen wood pellets. The overall objective was to simply burn wood biomass pellets under "reasonable" operating conditions and report the relative combustion performance of each fuel.

Welcome message from author
This document is posted to help you gain knowledge. Please leave a comment to let me know what you think about it! Share it to your friends and learn new things together.
Transcript

AN ABSTRACT OF THE THESIS OF
Charles Craig Haluzak for the degree of Master of Science in
Mechanical Engineering, presented May 4, 1989.
Title : Experimental Combustion Analysis and Development of
Representative Fuel Specifications for Selected Wood and
Refuse Derived Fuel Pellets from the Pifi9nNorthwest.
Redacted for PrivacyAbstract Approved :
1`11.'''`v (ip.. ughdell
An experimental biomass combustion facility has been
built and established at Oregon State University. The
furnace, or Biomass Combustion Unit ( BCU ), uses an auger-
type fuel feed system, grate-type fuel support with under
and over fire air supply.
Fourteen pellet species from five States - Alaska,
Washington, Oregon, Idaho, and Montana were analyzed for a
large number of physical and chemical variables. These
variables included higher heating value, moisture content,
ultimate analysis, etc. Three separate combustion
experiments were conducted using nine of the available
fourteen wood pellets.
The overall objective was to simply burn wood biomass
pellets under "reasonable" operating conditions and report
the relative combustion performance of each fuel.

More specifically, the three combustion experiments coupled
with the pellet analysis data supported the following
conclusions :
1. It was possible to construct a simple mathematical
model describing the simultaneous effects of under fire
air and over fire air on pellet efficiency performance.
The model was used to predict the optimal firing
conditions based on thermal efficiency. It is
hypothesized that the model is broadly ( but
approximately ) applicable to all fourteen pellet
species examined in this report.
2. Tests indicate that all nine of the relatively diverse
wood pellet fuels behave similarly under similar
operating conditions.
3. Carbon monoxide and oxides of nitrogen never reached
mean values of over 215 parts per million for all
experiments.
4. Fuel-bound salt was found to cause relatively large
particulate fly ash and opacity readings and resulted
in the only slag formation.
5. Increasing under fire air temperature by 230 deg.F on
average yielded a statistically significant ( but
small ) increase in mean combustion gas temperature.
There was not a statistically significant effect on
combustion efficiency as measured by carbon dioxide
concentration in the exhaust gases.

Experimental Combustion Analysis andDevelopment of Representative Fuel Specificationsfor Selected Wood and Refuse Derived Fuel Pellets
from the Pacific Northwest
by
Charles Craig Haluzak
A THESIS
submitted to
Oregon State University
in partial fulfillment ofthe requirement for the
degree of
Master of Science
Completed May 4, 1989
Commencement June 1989

APPROVED :
A c;Redacted for PrivacyPrroWsgryMechanical' Engineering in charge of major
Redacted for PrivacyHead of department of Mechanical Engineering
Redacted for Privacy
clDean of Graduat chool
Date thesis is presented May 4, 1989

TABLE OF CONTENTS
Page
INTRODUCTION 1
CHAPTER I - Biomass Fuels Concepts andLiterature Review 6
Solid Biomass Fuels 7
Major Components 7
Ultimate Analysis 7
Proximate Analysis 10
Higher Heating Value 15
Moisture Content 18
Bulk Density 33
Minor Components 35
Particle Size 35
Durability 37
Specific Density 38
Combustion of Biomass Fuels 39
The Three Main Steps 40
Simple Combustion Model andEfficiency 42
Problem Fuels : Emissions / EnvironmentalStandards 50
Gaseous and Related Emissions 50Solid Emissions (bottom and fly ash) 56
Problem Fuels : Ash 59
1) Slagging / Deposition 60
2) Erosion 63
3) Corrosion 64
Cofiring 69
Positive Aspects of Cofiring 69
Technical Feasibility 72
Economic Feasibility 73
Negative Aspects of Cofiring 77
Ash 77
Material Handling 78
Boiler Efficiency 79
Furnace Metal Wastage 80
Emissions / Pollutants 80

Page
CHAPTER II - Pellet Fuel Specifications andCombustion Experiments 81
Fuel Specifications 82
Chemical Variables 84
Physical Variables 84
Results 85
Experimental Combustion of Wood BiomassPellets 89
Introduction 89
Apparatus 91
Air Flow 96
Fuel Flow 97
X-Y Table and Probes 98
Methodology 100
Experiment #1 102Qualitative Results 105Quantitative Results 108Numerical/Statistical Modelling 109Conclusion 114
Experiment #2 115Results 116Observational Data 122
Conclusions 125Experiment #3 127
Results 129Analysis 131Conclusion 133
BIBLIOGRAPHY 134
APPENDICES
A. Nomenclature 139
B. Pellet Codes 142
C. Pellet Fuel Data 145
D. Combustion Experiment Data 169
E. Fuel Hopper Figure 228

LIST OF FIGURES
Figure Page
1. Emission of Volatile Carbon as a Functionof Temperature for Douglas Fir Foliage 13
2. H, or the Adsorption Energy VersusMoisture Content 23
3. The Effect of Moisture on the HeatingValues of Wood Biomass 24
4. The Effect of Moisture on the AdiabaticFlame Temp. of Yellow Pine and Douglas Fir. 29
5. Normalized Burning Rate for a PineSpecimenat Different Moisture Contents 32
6. Total Burning Time as a Function ofMoisture Content for 1.5cm Pine Cubes 33
7. Schematic Representation of a Fuel Bed 47
8. Isothermal Corrosion Rates as a Functionof Sulfur Addition to MSW 67
9. Cutaway View of Biomass Combustion Unit 92
10. Scale Drawing of Biomass Combustion unit 93
11. Schematic of Entire Experimental Facility 94
12. Schematic Representation of X-Y ProbeTable 95
13. Parameter Matrix for Experiment #1 104
14. Gas Parameters for Pellet (1) 107
15. Level Curves of CO2-Based Efficiency 111
16. CO2-Based Efficiency Surface 113
17. Plot of Combustion Gas Temperature VersusPellet Fuel Code 120
18. Plot of CO3-Based Efficiency VersusPellet Fuel Code 121
19. Plot of Linear Regression Line forExperiment #2 124

Figure Page
20. Carbon Dioxide Based Efficiency VersusFuel Code for Cold and Hot Tests 130
21. Fuel Hopper, Metering Drum, andHorizontal Auger 229

LIST OF TABLES
Tables Page
1. Ultimate Analysis Data for Selected DryFuels 9
2. Proximate Analysis of Selected DryBiomass Fuels 14
3. Higher Heating Value of Selected BiomassFuels 17
4. High and Low Range of Bulk Density forSelected Biomass Fuels 35
5. EPA Criteria and Non-Criteria EmissionSpecies for Wood Burning Devices 52
6. National Ambient Air Quality Standards 55
7. Typical Effluent Concentrations 57
8. EP Toxicity Parameters and CurrentMaximum Allowable Levels 58
9. Various Chemical Ash Analyses 59
10. Ash Fusion Temperatures for SelectedSpecies of Biomass Fuels 62
11. Economics of Cofiring at SeveralCommercial Boiler Sites 74
12. Pellet Sample Coding 83
13. Ultimate Analysis for Pellets Coded (1-9) 85
14. Proximate Analysis for Pellet Fuels (1-9) 86
15. Ash Fusion Data for Fuels (1-9) 87
16. Physical Pellet Analyses Data for Pellets(1-14) 88
17. Gas Property Values at Optimal Firing 103
18. Fixed Parameters and Coding for Experiment#2 117
19. Combustion gas Data for Experiment #2 118

Tables Page
20. Hot and Cold Under Fire Air Test Matrix.... 128
21. Combustion Gas Temperature and CO3-BasedEfficiency Data for Cold and Hot UnderFire Air Tests 129
22. Pellet Sample Coding 144

EXPERIMENTAL COMBUSTION ANALYSIS ANDDEVELOPMENT OF REPRESENTATIVE FUEL SPECIFICATIONS FOR
SELECTED WOOD AND REFUSE DERIVED FUEL PELLETSFROM THE PACIFIC NORTHWEST
INTRODUCTION
It is general knowledge that man has been using wood
and other forms of organic flammable material to produce
heat energy since before recorded history. Despite the
length of time man has had to study the physical and
chemical nature of this organic ( biomass )(a fuel, there are
considerable gaps in the pure and applied science of solid
biomass fuel combustion. There are several reasons for this
void of information, a few of which will be given below.
This report attempts to bridge some gaps in the areas of
applied or technological understanding and in the pure
science of biomass fuel combustion.
a : Biomass - For this report "biomass" is defined asany organic ( carbon based ) fuel , including wood,agricultural residue, Municipal Solid Waste ( MSW ), and
Refuse Derived Fuel ( "derived" from MSW by mechanical meanssuch as screens and air classifiers ). It does not includefossil fuels such as, coal, oil, and natural gas. Theproperties of coal are used many times in comparisons withbiomass in this report because coal is the most thoroughlyunderstood solid fuel at present.

2
One reason for the lack of knowledge about biomass
combustion is the complexity of solid combustion reactions
in general. The "complete" analytical model of a sustained
biomass combustion reaction requires the solution of many
simultaneous equations from the diverse fields of
conduction, radiation, convection, thermodynamics, and
chemical reaction kinetics. Another problem is that, even
if we could solve this immense set of equations, the
solution would only be valid for the specified boundary and
initial conditions. Unfortunately, there are an infinite
number of sets of these conditions, so, researchers up to
now have made their own decisions about which cases are most
important or yield the most clarifying information. This is
very much like the field of convection heat transfer where
empirical correlations must be determined when pure theory
is not adequate. Fortunately, the introduction of the
digital computer is helping this endeavor.
Another reason for the lack of knowledge is that by the
time engineers and scientists became adept enough to study
the complex phenomena of solid combustion in general, the
primary fuels of interest were coal, gas, and oil ( fossil
fuels ), not wood or municipal solid waste. This has begun
to change since the advent of the idea that non-renewable
energy sources such as coal, oil, and nuclear fission, are
not necessarily the best ways to deal with global energy
needs in the future ; for economic, security, political, and

3
environmental reasons. It has become apparent that large,
centralized, power producing facilities may not be as
efficient at meeting consumer demands as smaller more
regionally designed power systems. This is particularly true
in certain cases where inexpensive biomass fuel is available
in large quantities. It is also true that these same
communities or regions are having difficulty disposing of
their combustible waste streams, i.e. the communities must
PAY to dispose of this "fuel source". This situation
produces a consummate match of raw material to energy demand
in the above scenario. This match is not perfect, it
contains pitfalls such as the possibility of producing acid-
rain , poor air quality in general, and aiding the chemical
degradation of our atmosphere due to heat, carbon dioxide,
and carbon monoxide emissions. These pitfalls however, just
increase the motivation for more advanced solid biomass
fuels study. It is anticipated that the following report
will be both a useful assemblage of "old" information and
also a step forward in biomass fuels research.
The final reason for the current status of biomass fuel
combustion research is rooted in politics and business. A
fair amount of the current research in biomass fuels is
centered on the development of fuel standards or criteria.
The concept behind these criteria is the same as the reason
that safety codes or ingredient labeling arose in our
current law. It is for the protection of the consumer and

4
for the consumer's general knowledge so that he can best
utilize the available resource. These standards are not
always welcomed by the manufacturer or retailer of any such
"labeled" product. There are a number of good reasons for
this. One reason is that it costs the manufacturer both for
research and packaging. Second, it has the potential to
elucidate shortcomings in the product that would otherwise
go unnoticed-( at least initially ! ). Third, it is
difficult enough to get scientists who support industry-wide
criteria development to agree on the variables and methods
of testing, regardless of those who oppose standardization.
This division in the biomass fuels industry has the
consequence of limiting the amount of research dollars that
public institutions such as Oregon State University receive.
This is true because government policy is greatly influenced
by industry lobby. If government does not sense a unified
interest in biomass fuels combustion research it will not
respond by allocation of funds. These funds are needed to
continue basic research that industry either cannot afford
or does not desire to carry out, but may be important to the
security of our energy future.
It is for the above reasons that this endeavor into
biomass fuels combustion has occurred. The thoroughness of
testing and the quantity and quality of information
presented herein should help make this document a good
reference for furnace and boiler design engineers and

5
applied combustion scientists. It is also a good general
reference on the physical and chemical characteristics of
wood-based pellet fuels in the Five State Pacific Northwest
Region". It is anticipated that some questions of interest
will be answered by this research and more importantly we
may learn to ask the right questions.
: The Five State Northwest Region includes : Alaska,Montana, Idaho, Oregon, and Washington. Wood pellet fuelsfrom all five states were analyzed in this report.

6
CHAPTER I
BIOMASS FUELS CONCEPTS AND LITERATURE REVIEW
7
SOLID BIOMASS FUELS
This section describes the five major and three minor
components of solid fuel analysis as relates to combustion
performance. The "major" components are noted as such
because they are used most often in literature and are the
most widely tested [10,15,22,32,36]. The "minor" components
are not as widely mentioned, but, they may also be important
and more work could be done in this area. The five major
components are : ultimate analysis, proximate analysis,
higher heating value, moisture content, and, bulk density.
The three minor components are : particle size, durability,
and, specific density. First, the major components are
discussed.
MAJOR COMPONENTS :
Ultimate Analysis -
The ultimate analysis of a fuel is a record of the
percent by weight of hydrogen(HA, carbon(C), nitrogen(NJ,
oxygen(00, sulfur(S), ash(mineral), and sometimes,
chlorine(C1). Currently, ASTM Standard No. D 3176-84,
"Ultimate Analysis of Coal and Coke", is the procedure used
for laboratory samples of wood and refuse derived fuel (RDF)
biomass fuels. It is usually given on a moisture free

8
basis. The primary importance of ultimate analysis is in
the calculation of air-to-fuel (A/F) ratio. By knowing the
percentage of 0, S, H, and, C, and the primary chemical
reaction equations, it is possible to calculate the
stoichiometric A/F ratio [34]. The stoichiometric A/F ratio
is the theoretical quantity of air required to burn all the
combustible elements in the fuel j, all the oxygen supplied
by the fuel and air were completely consumed.
Another important aspect is that sulfur and chlorine
can be a major cause of emission problems, i.e. ( oxides and
acids containing S and Cl in the flue gasses ). Sulfur and
chlorine are also a major culprit in boiler flue corrosion
due to the acidic nature of their compounds ( primarily
hydrochloric and sulfuric acids ). This will be discussed
more thoroughly in the proceeding sections : "Problem Fuels
: Emissions / Environmental Standards" and "Cofiring". By
comparing any fuels sulfur content with that of coal, one
can make both qualitative and quantitative assessments as
to its problem nature. This is possible because of the vast
data accumulated for coal fired plants burning "high" sulfur
fuels. Sulfur content of most wood based fuels is so low
that sulfur dioxide and other pollutants are not a problem
[15]. Chlorine, like sulfur, is also a very small component
of wood biomass ( except for saltwater soaked logs ),
however; chlorine can play a considerable role in the
corrosive behavior of refuse derived fuel [41].

9
Finally, ultimate analysis can be used to approximate
the higher heating value of fuels because the individual
heating values of the combustible elements, S, Hfl and, C
are known. However, this is not the standard method.
Errors occur due to the fact that these elements are bound
in macro-molecular structures, i.e. cellulose, tars,
plastics, etc., that have their own thermo-chemical
behavior. These compounds do not necessarily produce heat
energy by exothermic reaction with oxygen identically as the
individual components do. The primary cause of this is
dissociation and "other phenomena" [32].
Table 1, lists the ultimate analysis of a number of
different fuels for comparative purposes.
Table 1. Ultimate Analysis Data for Selected DryFuels. Sources [2,13,32,43].
FuelType
C H, 0,
% by wt. - -
S N,
- -
Cl Ash
KY,No.9 coal 65.2 4.6 8.4 4.9 1.4 15.4
WV,Rank D,coal 84.7 4.3 2.2 .6 1.5 -- 4.
Douglas Fir 52.3 6.3 40.5 =0 .1 .8
White Pine 52.5 6.1 41.3 '40 A:0 .1
Black oak 48.8 6.1 45.0 z0 z0 -- .1
RDF, Type A 46.0 6.0 34.5 .4 .7 .4 12.0
RDF, Type D 44.0 6.0 32.6 .3 .7 .4 16.0

10
From Table 1, it is possible to denote some general
trends in the three fuel categories represented above.
Those categories being, coal, wood, and, RDF biomass.
First, coal has a low oxygen and high carbon content
compared with wood and RDF. Second, coal and RDF have high
ash and sulfur content compared to wood. Finally, it is
apparent that only RDF has an appreciable amount of
chlorine.
Proximate Analysis -
Proximate analysis of solid fuel is used to determine
the percentages of volatile material, fixed carbon, and,
ash. Volatile matter is the portion of fuel gasified by
pyrolytic action and responsible for flaming combustion.
Fixed carbon is that portion of fuel, not pyrolyzed, that
burns in solid form ( glowing or char combustion ).
Actually, "fixed carbon" is any combustible residue left
after complete elimination of volatiles, it is primarily but
not all carbon [32].
Proximate analyses are done under rigid test conditions
as prescribed by ASTM Standard No,D 3172-73, "Proximate
Analysis of Coal and Coke". The ASTM standard calls for
heating the sample at 1740°F for seven minutes. This
heating period is what burns or drives off the volatiles.

11
The fundamental importance of proximate analysis is in
the design of combustion systems, especially grates and air
handling equipment. This is true for two primary reasons.
One reason, is that fixed carbon burns at a much slower rate
than volatiles and at a higher temperature [3,4]. This is
very useful information for grate or fuel bed designers who
must choose materials properly for their expected
temperature loading. Secondly, proximate analysis is
important for air handling engineers who must determine the
correct amount of under-fire and over-fire air for efficient
combustion. The under-fire air is used to burn the fixed
carbon and the over-fire air is used to burn the volatiles.
Engineers must also design fire-boxes, ducts, fans, and
pollution abatement devices for the total volume of exhaust
gasses. It is well known that matter in the solid state
takes up much less volume than matter in the gaseous state.
It is known that the volume of gasses from combustion of a
low volatile fuel will be considerably less than for highly
volatile fuels. This is one contributing factor in the
problems encountered in cofiring coal with wood or RDF in a
boiler designed originally for coal. Wood and RDF have a
much higher yield of gasses for the same heat output
required by the boiler. This usually leads to a loss of
efficiency and erosion problems due to high gas velocities.
The high velocities are coupled with increased particulate,
i.e. a "feedback" effect occurs [12]. This topic will be

12
covered more fully in the following "Cofiring" section.
For many years proximate analyses have been used
successfully to determine the ratio of over vs. under fire
air for proper combustion. This is done simply on the basis
of knowing the percentage of fixed carbon to volatile in the
fuel, i.e. once a total quantity of deliverable air( excess
air ) is chosen, it is split into two air streams, under-
fire and over-fire, in the same ratio respectively as
volatile to fixed carbon. This works very well in coal
combustion where the percent volatiles is usually low,
however, there is some doubt now as to the applicability of
this method for higher volatile fuels such as wood and RDF.
Current literature shows that there really is no "true"
ratio of fixed carbon to volatile in any particular solid
fuel [29,40]. During pyrolysis; temperature, rate, and,
inert gas percent, all affect the final quantity of fixed
carbon left after "complete" pyrolysis [40]. That is, these
three factors all tend to decrease char yield when they are
increased. Char yield may be as little as one half the
yield from proximate analysis (ASTM method) [40]. Fuel bed
temperatures in many hogged fuel spreader-stoker boilers are
on the order of 1740-2550xF, which are obviously much
greater than the temperatures called for in the ASTM
standard.
Fig. 1, follows and is an adaptation of the data in
[29].
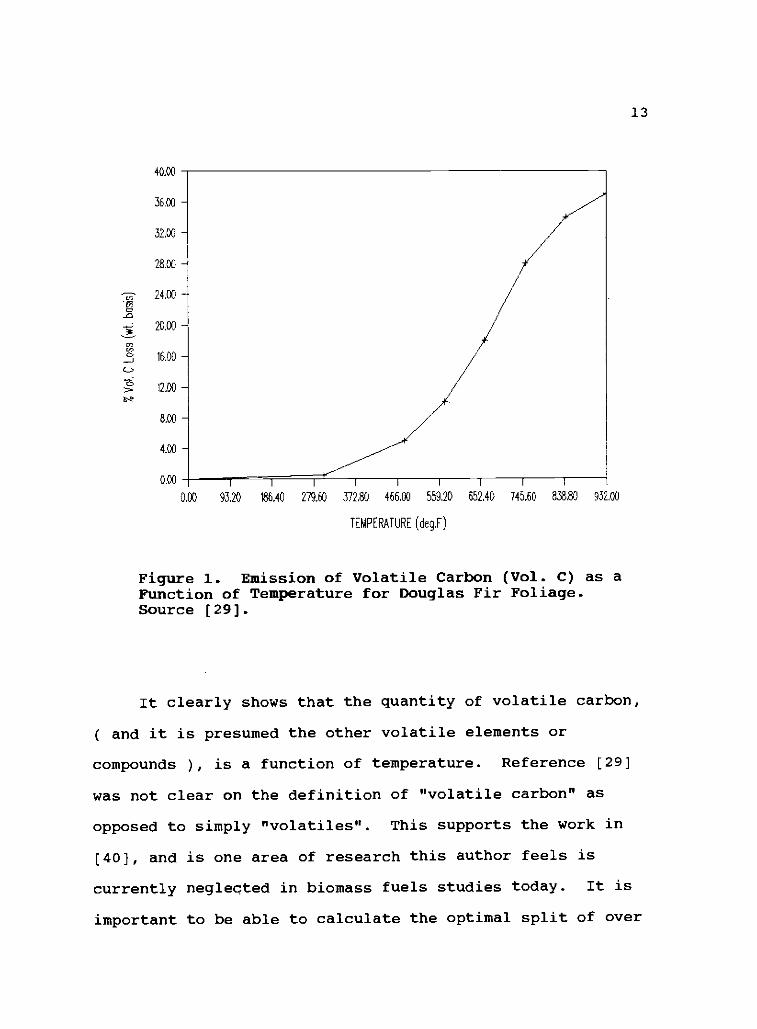
13
40.00
3E00
28.00
-7, 24.00
4 20.00
° 16.00
>. 12.00 -
8.00
4.00
0.00 r I I I 1 I t I t
0.00 93.20 186.40 279.60 372.80 466.00 559.20 652.40 745.60 838.80 932.00
TEMPERATURE (deg.F)
Figure 1. Emission of Volatile Carbon (Vol. C) as aFunction of Temperature for Douglas Fir Foliage.Source [29].
It clearly shows that the quantity of volatile carbon,
( and it is presumed the other volatile elements or
compounds ), is a function of temperature. Reference [29]
was not clear on the definition of "volatile carbon" as
opposed to simply "volatiles". This supports the work in
[40], and is one area of research this author feels is
currently neglected in biomass fuels studies today. It is
important to be able to calculate the optimal split of over

14
and under-fire air for combustion efficiency and emission
control. It may be that the current ASTM method is
inadequate in this regard. This does not detract from the
fact that proximate analysis is still a good way to compare
different fuels, since the test is highly reproducible.
Table 2, lists some proximate analyses data for
selected biomass fuels.
Table 2. Proximate Analyses of Selected Dry BiomassFuels. Sources [3,28,31].
FuelType
----fixed
carbon
% by wt.volatilematter
- - --
ash
RDF Type A 13.0 75.0 12.0
RDF Type D 13.0 71.0 16.0
KY, No. 9 coal 46.1 38.5 15.4
Cedar (wood) 21.0 77.0 2.0
Douglas Fir (wood) 13.7 86.2 .1
Table 2, shows the considerable differences between
RDF, coal, and wood, when it comes to proximate analysis.
The coal is much higher than wood or RDF in fixed carbon,
but is similar in ash to RDF. The two species of wood
shown, illustrate how variable the ratio of fixed carbon to
volatile matter and ash content can be in different species
of wood.

15
Higher Heating Value -
Higher heating value is primarily used as the basis for
energy balance and/or efficiency calculations for boilers
and furnaces and for multiple fuel comparisons.
Higher heating value(HHV), is the quantity of heat
released during complete ( constant volume ) combustion
of a fuel, when the products of combustion are brought to
the same equilibrium temperature as the initial constituents
[7,32,34]. This represents the maximum available energy
output that can be expected of the fuel by combustion
processes. It is called by a variety of names, some of
which are : "gross heating value", "gross calorific value",
"gross heat of combustion", or less frequently, "internal
energy of reaction".
HHV is found by laboratory testing, usually in an
adiabatic bomb calorimeter. The applicable ASTM Standard is
No. D 2015-77,"Gross Calorific Value of a Solid by the
Adiabatic Bomb Calorimeter", and is generally performed on
an oven-dry sample. It is assumed that the water formed by
combustion of hydrogen is in the liquid phase at final
equilibrium, this implies that the heat of vaporization of
water is included in the higher heating value. This heat
( or enthalpy ) is usually denoted, h, in units of Btu/lbm.
The heat of vaporization, (h0, can be found in saturated

16
steam tables and has a value of 1055(Btu/lbm) at 68 °F [25].
There have been a number of other heating values
reported such as : 1) net or lower heating value(LHV),
sources : [4,5,7,15,25,32], and, 2) lower heating value
two(LHV2), sources : [21,24]. These are defined primarily to
account for the energy losses due to the water vapor both
formed during combustion and carried as moisture in the
fuel. Remember, higher heating value (HHV) is based on all
water formed being in the liquid state.
For LHV, the cited references generally agree that
lower heating value is calculated by subtracting the latent
heat of vaporization (h,g) from the higher heating value,
however they do not agree on the value of h,g(Btu/lbm). The
range of values are, 1050(Btu/lbm) [32], to, 1059(Btu/lbm)
depending on the choice of reference temperature [4]. Other
literature suggests that the constant is not hig at all, but,
a value of 1030(Btu/lbm) [7]. This analysis assumes a HHV
based on a 68 °F temperature state, and some calculations
( not available in [7] ) to change from a constant-volume
process(bomb calorimeter) to a constant pressure
(atmospheric) process. These differences are not extreme,
and, the important thing to remember while performing
thermodynamic calculations for any system is that the same
reference state be used throughout the work.
Lower heating value two(LHV2), is a sophisticated
modification to the HHV and accounts for the fact that some

17
of the water in wood or any solid fuel is "bound" by
molecular forces that require more energy to break, i.e.
vaporize, than if the water were "free". This idea is
presented in detail in a later sub-section titled, "Moisture
Content".
Table 3, lists higher heating values for a number of
wood, coal, and, RDF fuels. The samples were chosen to
represent the range of HHV's for these fuel types.
Table 3. Higher Heating Value of Selected BiomassFuels. Sources [7,13,32,43].
FuelType
HHV (dry-basis)(Btu/lbm)
WV, Rank D coal 14,730
ND, Rank J coal 7,210
RDF, Type A 8,100
RDF, Type D 7,700
RDF, Type 3 9,796
Sitka Spruce(wood) 8,100
Ponderosa Pine(wood) 9,100 - 9,140
Ponderosa Pine(bark) 9,415 - 9,616
Douglas Fir(wood) 8,318 - 9,200
Douglas Fir(bark) 9,373 - 10,845
Western Hemlock 8,626
From Table 3, the average (wood-only) HHV is

18
8,747(Btu/lbm), for RDF the average is 8,532(Btu/lbm) and
for coal it is 10,970(Btu/lbm). This illustrates how close
RDF and wood biomass can be in higher heating value and how
coals HHV is larger than either RDF or wood by approximately
twenty percent. Remember, these values are only
representative and by no means are the comparisons made
definitive, only illustrative.
Moisture Content -
Moisture content (MC) of a solid fuel is one of the
most critical parameters controlling combustion [4]. It
affects the rate of burning, flaming temperature, and volume
of gasses during combustion, and consequently changes boiler
performance and emissions. It has been noted by several
authors that combustion of hogged wood fuel in typical
boilers will cease or "black-out" at approximately 67
percent moisture content wet-basis [21,22,23]. Black-out
usually necessitates the use of additional fossil fuel to
maintain combustion such as oil or natural gas. Moisture
also lowers the heat or Btu content per pound of fuel, which
means a greater volume and mass must be fired to achieve the
same steam or heat load as compared to dry fuel. The
following section describes the typical calculations to
account for heat losses due to moisture content and some of

19
the current work being done to study the effect of moisture
on combustion. The applicable ASTM Standard is, No. E 871-
82, "Moisture Analysis of Particulate Wood Fuels".
Nomenclature :
Moisture in fuel is described by one of two equivalent
ways, either on a "wet" or "dry" percentage basis.
Wet Basis(wb) : This is defined as the weight of water
in the sample (water weight), divided by the total
sample weight (sample weight) which includes dry fuel
plus water. Note, this is sometimes called an "as-is"
basis.
%Mew = (water weight / sample weight) X 100 (1)
Dry Basis(db) : Moisture content (MC) on a dry basis is
the weight of water in the sample divided by the dry
sample weight.
%MC® = (water weight / dry sample weight) X 100 (2)
The conversion between %MC and %MCI, can be performed
as follows :
%MC,, = ($MCcm / (Wm+100)) X 100 (3)
and,
%14Cd, = (%14C, / (100-%MC)) X 100 (4)
20
Both measures of moisture content are used widely in
the literature with no definite preference shown.
The following section describes moistures effect on the
performance of solid fuels, it is broken down into sections
by major topic as follows : 1) Heat Losses and Heating Value
Analysis, 2) Volumetric Expansion , 3) Flaming Temperature,
and, 4) Rate of Combustion.
1) Heat losses and heating value analysis. The
following analysis draws heavily from the work given in [4].
Three energy loss terms will be developed here, they are, a)
energy used to vaporize water formed during combustion, b)
energy used to vaporize the "free" and "bound" water in the
fuel respectively.
a) Energy used to vaporize water formed during
combustion. Let, (12(Btu/hr), be the rate of heat loss due
to vaporization of the water formed during combustion by the
oxidation of hydrogen; then, (1,2 can be calculated as
follows :

21
= M11z * h (5)
where, Qm = rate of energy required to vaporize water
at the reference state of 68°F, Mm = mass rate of water
formation by combustion, h = 1055(Btu/lbm-H2O) at 68°F.
The lower heating value, as mentioned in the previous
section-"Higher Heating Value", can now be calculated as
follows :
LHV = HHV - QB2/Md. (6)
where, LHV = lower heating value (Btu/lbm-dry fuel),
HHV = higher heating value (Btu/lbm-dry fuel), Maw = mass
rate of dry fuel into combustor. Note that Qm is divided by
Ma, to keep LHV on a "dry" basis consistent with the
definition of HHV.
b) Energy used to vaporize the "free" and "bound" water
in the fuel. The following discussion deals specifically
with moisture in wood, yet, there is no reason why it is not
generally applicable to any solid fuel that is porous.
First, the distinction between "free" and "bound" water must
be made. Bound water is formed by adsorption along the
interface with cell walls and is rarely more than ten
molecules thick. Adsorption, is the take-up of water by
chemical reaction, i.e. heat is actually evolved by

22
adsorption, energy that later must be replaced if the water
is to vaporize. Free water is formed by absorption.
Absorption is a physical process, due to capillary action,
of water take-up into the porous structure of a solid.
There is only a very small emission of heat due to
absorption and it is considered negligible compared to
adsorption. There is always some water vapor in the porous
cell structure of a fuel, but its effect is also considered
negligible.
The moisture content of wood at which all the free
water is gone but the bound water remains, is called the
fiber saturation point (FSP). For wood, the FSP is
approximately, U.1C., = 21.9. The energy required to bring
the bound water to the energy level of the free water is not
a constant, but a function of moisture content (below FSP).
This function is different for every fuel and can only be
determined experimentally. The equation for the average
energy required to bring the bound moisture in Douglas Fir
wood to the energy level of the free water, NOT to vaporize
it is found in [4]. Hb,, is this required energy and has the
units of (Btu/lb). The equation for 11, is a long polynomial
expression from regression analysis and won't be copied
here, however, Fig. 2, graphically shows the results.

23
3220.00
2941.60
2663.20
2384.80
2P6A
1828.00
1549.60
1271.20
99280
714.40
436.00
0.00
p
1 1 i 1 I
2.40 4.80 7.20 9.60 12.00 14.40 16.80
MOISTURE CONTEN1 7,.. I:rit,I)
19.20 71.60 :400
Figure 2. 11, or the Adsorption Energy VersusMoisture Content (wet-basis). Source [4].
It is now possible to define lower heating value
two(LHV2), as was mentioned in the previous sub-section,
"Higher Heating Value". LHV2 is simply LHV minus the energy
required to vaporize all water carried in by the fuel, both
bound and free. The expression for LHV2 is given as
LHV2 = LHV + 1055) * (MC,b)) (7)

24
where, LHV2 = lower heating value two(Btu/lbm-dry
wood), Ham = specific energy loss due to bound
water(Btu/lbm-water), 1055 = 149(Btu/lbm-water), and, MC, =
moisture content dry-basis(Ibm-water/lbm-dry wood). Fig. 3
shows the effect of moisture on the three heating values as
defined above.
MOW
8550W
8100.00
1650.00
naw
MOM
6300.00
8 58W
5490.00
MOW
4500.00
DAP
HFIV
40.00 20.00 30.00 40.00 50M
MOISTURE COMENT (%Wt)
60.00 70.00
Figure 3. The Effect of Moisture on the HeatingValue(s) of Wood Biomass. Based on Douglas Fir with anAssumed Higher Heating Value of 8800 Btu/lbm.

25
Fig. 3, shows that the bound water has the non-linear effect
of rapidly decreasing the apparent heating value of a fuel,
whereas the effect due to latent heat of vaporization is
constant.
The energy required to vaporize the free water plus the
bound water that has been brought to the energy level of the
free water can be calculated as follows :
Qt. = Mt * hE9 (8)
where, Q, = energy rate required to vaporize the free
water and bound water that has been raised to the energy
level of the free water, i.e. it is now "freen(Btu/hr),
14, = total mass rate of water brought in by the fuel, units
are (lbm/hr), h, = 1055(Btu/lbm-water), as usual.
So in total, the rate of energy required to bring all
moisture to the vapor state at 68°F is Q, where :
Qat = Q,M + 4,2 + Qb,, (9)
It should be noted that these losses occur in the
combustion chamber. When vaporization is calculated or
occurs at 68°F there is no change in gas temperature, thus,
no increase in the available energy of the gasses is
realized. That is why this total heat of vaporization is
considered a loss. However, boiler exhaust temperatures are

26
usually on the order of 400°F [35], and water vapor at 400°F
and 1 atmosphere is superheated. This means that even more
energy is lost due to combustion heat wasted on superheating
vapor that is sent out the stack.
2) Volumetric Expansion. The effect of moisture on the
volume of flue gasses can best be understood by noting that
water undergoes an expansion of approximately 5700 times its
original volume when it goes from being a liquid to being a
vapor in typical furnace operation [4,42]. An easy way to
estimate this expansion is to look up the specific volume of
water in the liquid state, v,(fe/lbm), at the reference
temperature 68°F, then, find v9 ( gaseous specific volume )
in the superheat tables at atmospheric pressure and the
desired/estimated maximum combustion gas temperature. Next,
compute the ratio of (v9/v,) where this value is the expected
volume expansion parameter. For example, data from [34j
gives as values for v, and vg :
v,(68°F,sat.) = .016(ft3 /lbm)
v9(14.7psi,1600°F) = 83.47(ft3/1bm)
vg/v, = 5216.9 (vol.gas/vol.liquid) (10)
Note that this calculated value is close to the number cited
SO,
above, and is primarily a function of the chosen superheat

27
temperature.
The main problem associated with this enormous
expansion is the associated increased gas velocity. Using
the simplest form of the Continuity Equation, Q = VA, where
Q = volumetric flowrate, V = velocity, and, A = area, one
can see that if Q is increased while holding the area A
constant, the velocity V must increase proportionately.
There are a number of problems caused by increased gas
velocities, especially if the furnace and/or boiler was not
designed adequately for high moisture fuel. These problems
are : 1) Reduced combustible gas and combustible particulate
residence time, i.e. increased particulate carryover and
unburned gasses escape [12,15]. 2) Increased erosion by
particulate abrasion action, especially in high ash fuels
[22]. 3) Emission control devices cease to function
properly if undersized for such volumetric and mass
particulate loading. It may also be necessary to increase
the size of induced draft fan motors to "keep-up" with the
required flow [4,12,15]. 4) There is a potential for
increased flue exhaust gas temperature, thus, increased heat
losses by sensible and latent enthalpies [12,42].
3) Flamina Temperature. The method of calculating
adiabatic flame temperature by the "free energy
minimization" method is described in [34]. Adiabatic flame
temperature is the maximum temperature that can be achieved

28
for a given fuel [34]. It is based on the theoretical
concept of no changes in kinetic or potential energy of the
reactants, all energy is released as heat. This condition
is obviously never met in "real-life" , but is very useful
for comparing different fuels potential heat transfer
properties, i.e. higher flame temperature means greater
temperature gradients to drive heat transfer from gasses to
water in boiler tubes. A computer model was used to carry
out the necessary calculations of AFT. After the model was
run for a number of parameter changes, linear regression was
performed on the simulated data. These predictor equations
for Douglas Fir, Poplar, Yellow Pine, Hickory, and Black Oak
are presented in [34]. The largest deviation of predictor
equation vs. computer simulation was four percent, this is
true for the following parameter ranges : 1) percent excess
air from 11% to 100%, 2) moisture from 0% to 50% wet-basis.
Fig. 4, shows the results of the analysis of the effect of
moisture on the adiabatic flame temperature for Douglas Fir
and Yellow Pine. It is interesting that the effect of
moisture on flame temperature is almost entirely linear. If
you calculate the percentage temperature decrease from
fifteen to fifty percent moisture for Douglas Fir and for
twenty to fifty percent moisture for Yellow Pine the
temperature decrease is twenty two percent. That is, the
flame temperature is decreased by twenty two percent in both
cases. This seems considerable, but the results might not

29
be as dramatic in a "real" situation, due to many inter-
related heat loss mechanisms [34]. This type of study will
become much more relevant as attempts are made to squeeze
more and more energy out of wet fuel that has in the past
been considered waste, i.e. hogged fuel being burned because
it is cheaper than landfilling.
3100.00
2985.00 -
2870.00 -
2755.00
2525.00
2410.00
2295.90
2065.00
41.50
% MOISTURE (wet-basis)
Figure 4. The Effect of Moisture on the AdiabaticFlame Temperature of Yellow Pine and Douglas Fir Wood.

30
4) Rate of Combustion. Most of the combustion
experiments examining the rate of burning have been carried
out on small, usually cylindrical or cubic, single particles
[14,17,18,30,31]. These tests are performed in very
sophisticated devices where variables of temperature, mass
loss, and composition, can be controlled and measured
accurately. Tests such as these may not model spreader-
stoker boilers, wood stoves, or dutch ovens, but the
information is still useful, qualitatively, if not
quantitatively.
A study on the effect of moisture on sugar pine and
white oak under conditions meant to simulate a stoker-type
furnace was reported by [30,31]. A single round particle
was subjected to parametric variations in initial
temperature, Reynolds number, oxygen concentration,
moisture, wood type, and, size (10 and 20 mm diam.).
The results of this study for moisture variation are
very interesting. As one would expect, moisture does slow
the rate of mass loss or burning. At zero moisture the peak
reactivity is .045s-1, at 13%MC, it is .031s-1, and, at
71 %MC, the peak reactivity is .018s-1. Reactivity in this
case is defined as the time rate of mass loss divided by the
initial mass, sometimes called the normalized reactivity.
For a saturated 10mm pine specimen, moisture = 71%wb,
the normalized rate of burning or reactivity rises sharply
to a short, constant plateau, then falls steadily until the

31
end of the burn. Previous researchers had postulated that
there would be very little combustion until the "free" water
was evaporated [30]. The data from [30,31] does not support
this. There was also direct visual observation of flaming
to support the fact that combustion took place virtually
during the entire experiment.
Fig. 5, is an adaptation from [6], that shows the
effect of moisture on normalized burning rate.

32
0.05
0.04
D.04 DRY WOOD --->
0.03
0.03
0.02
0.02
0.01
0.07
0.00
13% WObTURE (wet-bass) --->
66.7% NOOK wet-tais) --->
ODO ; r I I ; r ; r I
0.00 0.08 016 0.24 0.32 0.40 0.48 036 0.64
MOSS FRACTION BURNED
0.72 OW
Figure 5. Normalized Burning Rate (Reactivity) for aPine Specimen at Different Moisture Contents.
A very similar study, but on 1.5cm pine cubes at 1454xF, was
performed [14]. The general result is the same, i.e.
moisture slows the rate of burning. The data was displayed
differently and it gives new insight to this problem. Fig.
6, is adapted from [37]. It shows that the total burn time
is virtually a linear function of moisture.

33
3.60
3.49
3.38
3.27 -
3.16,LLJ 325-
2.83
2.72
2.61
2.50
0.00 5.00 10.00 15.00 20.00 25.00 30.00 35.00 40.00 45.00 50 00
VeSTURE (wet-basis)
Figure 6. Total Burning Time as a Function ofMoisture Content for 1.5 cm Pine Cubes.
Bulk Density -
Bulk Density is used to determine the heat content per
unit volume of fuel or Q,(12.tu/ftJ). Q,, is used to compare
different fuels heating values. There are two basic

34
concerns, 1) Will the feed system be able to carry the
necessary volume of fuel to meet steam or heat load? 2) Can
enough fuel be stockpiled to meet demand for extended
periods? ( especially important for pellet fuels which must
be protected from moisture at any cost or they will
disintegrate ).
Qc is determined as follows :
Q. = HHV * D, (11)
Where, D, = bulk density(lbm /ft'), HHV = higher heating
value(Btu/lbm), and Q, = volumetric heat content(Btu/ft3).
Db is determined by an ASTM technique requiring a container
with a volume of one cubic foot(fe) as the basis of
measurement and accurate weighing. The ASTM Standard is
No. E 873-82, "Bulk Density of Densified Particulate Biomass
Fuels". A standard was not found for non-densified biomass
fuels.
Bulk Density is a requirement for the Association of
Pellet Fuel Industries (APFI) Standard, No. APFI-PF-1-88
[36].
This standard requires a bulk density of forty (lbm/ft3) for
residential grade pellet fuel. The Fiber Fuels Institute
(FFI), recommends a bulk density of atleast thirty
six(lbm/ft3) [9]. Table 4, lists the high and low values of
bulk density reported for various fuels.

35
Table 4. High and Low Range of Bulk Density forSelected Biomass Fuels. Sources [9,13].
FUEL D, (low) D, (high)TYPE (lbm/ft3) (lbm/ft3)
WOOD(hogged) 10 20
WOOD(pellet) 32 42
WOOD(chips) 18 26
RDF(all classes) 1.9 12.8
The following discussion on the four "Minor" components
of fuel analysis relates primarily to pelletized fuel, but
some parts are applicable to non-densified fuels.
MINOR COMPONENTS :
Particle Size -
Particle Size is important for two reasons. One reason
is the effect of size on fuel feed systems. This is not so
critical for belt/conveyor type feeders, but is very

36
important for auger type feed systems as found in pellet
stoves. Auger systems are susceptible to bridging if the
fuel is small enough to lodge between the auger tines and
feed tube wall.
Secondly particle size is important is for combustion
efficiency and erosion concerns. This is true for
pelletized and, as-is fuels, i.e hogged wood, chips,
RDF,etc. "Fines" are any particle less than 1/4 inch [33].
There are two major concerns with the quantity of fines in a
fuel source.
1) Fines and the rate of combustion. Since wood and
RDF are usually 70% volatile matter or more, the rate of
combustion is directly proportional to how quickly the
required heat reaches and pyrolyzes the volatile material
[33]. The rate of heating is dependent on the exposed
surface area per unit volume of the particle. Larger
particles have a smaller ratio of surface area to volume and
tend to insulate themselves progressively during combustion
by formation of a char layer with low thermal conductivity
[19,33). Therefore, smaller particles are more reactive
than larger particles. This increased rate of combustion
requires greater air supply and this in turn can decrease
efficiency by a number of mechanisms, being, a) greater flue
gas temperature at exit, b) less particle residence time
(especially the fines), and, c) erosion due to increased gas
velocities.

37
2) Fines effect on transportation and storage. As
particle size decreases there is an increased "dust" problem
due to wind carried biomass. There is a greater fire hazard
due to the explosive nature of fine particulate fuel.
Durability -
Pellet durability is a measure of a pellets propensity
to produce fines while under physical agitation. At
present, there is no ASTM Standard available, however, OSU
is currently performing tests which may become part of an
ASTM Standard. Reference [36], states that pellets must
have fewer than one percent (1%) by weight flow through a
one-eighth inch (1/8in.) screen to meet their residential
pellet standard. Another source, [32], states that the
friability ( another common name for durability ), is
measured as the "percent unbroken". [32], does not state
how one is to determine this percent unbroken, but lists
high and low values for wood pellets as, 98 and 90 percent
respectively.
From the previous discussion, "Particle Size", it is
obvious why durability is a concern for pellet
manufacturers, stove manufacturers, and consumers. Pellets,
many times, are purchase specifically for physical
properties associated with their high specific density, i.e.

38
high Btu value per volume, "feedability", and, general ease
of handling. If they break up during normal handling this
degrades the pellet quality on all these accounts and will
probably degrade combustion efficiency as noted above in the
discussion on "Fines and the rate of combustion".
Specific Density
Similarly to pellet durability, this author was unable
to find a nationally recognized standard for biomass pellet
specific density. Neither was it mentioned in [32] or [36].
Specific density is a measure of a single pellets mass per
unit volume, such as , (lbm/ft3). Biomass users are usually
concerned with bulk density since they deal with quantities
of fuel on a "macro" scale. Bulk density will help them
size feed systems, design grates, and determine volumetric
firing rates to maintain steam load, etc. Specific density
is probably an important independent variable when it comes
to single particle combustion kinetics, but again, virtually
all residential or commercial users burn pellets on a
"macro" scale. There may be some good reasons to be
concerned with specific density and combustion, but the
literature does not support any at present.

39
COMBUSTION OF BIOMASS FUELS
Much of the available literature on biomass combustion
deals with the thermochemistry of burning wood. The
following material discusses the fundamental relationships
and processes as we understand them now. Since wood, corn
husks, straw, refuse derived fuel (RDF), etc., are all
primarily composed of hydrogen(H,), carbon(C), and
oxygen(0,), the fundamentals of wood combustion also
describes the fundamentals of combustion of these other
biomass fuels.
Biomass combustion is an extremely complex phenomena by
which a solid fuel is thermochemically oxidized producing
heat and gaseous by-products. There are really two
approaches to understanding biomass combustion, one is
extremely complex and the other relatively simple. The
complex approach attempts to describe all intermediate
physical and chemical reactions of combustion as they occur
in time and space. The simple approach is based on the
thermodynamic principle of "state". This principle allows
us to determine information about a process such as the
total heat flux from biomass combustion by simply knowing
the beginning and ending "states" of the system. It is only
necessary to know two of the following properties, i.e.

40
temperature, pressure, enthalpy, specific volume, entropy,
and chemical composition ( of reacting systems ) for the
complete state of a system to be determined. This is the
analytical approach used throughout this thesis. For
combustion and other phenomena this is sometimes called the
"black-box" method because only the beginning and ending
states of the process are analyzed, not what occurred
intermediately. It is not that knowing what is occurring
inside is not preferred, but the scope of analytic and
experimental skills to perform such in-depth study is
overwhelming.
THE THREE MAIN STEPS :
There are three main steps in biomass combustion [40].
They are : 1) drying, 2) pyrolysis and flaming combustion,
3) fixed carbon combustion. It should be noted that in a
fuel bed, such as found in a spreader-stoker or dutch oven,
these three processes are occurring simultaneously, but in
different locations.
1) DRYING - Since most biomass contains water, this
is a very critical step. Free and bound water must be
evaporated before sufficient temperatures for steps 2 and 3
occur. This topic is covered in a previous section titled,
"Moisture Content".
2) PYROLYSIS AND FLAMING COMBUSTION - Pyrolysis is

41
the chemical degradation of a solid fuel, due to heating,
that produces char (fixed carbon) and combustible vapors
(volatiles). Pyrolysis consists of endothermic and
exothermic stages.
For wood the endothermic stage has two distinct
temperature ranges [2,23]. For temperatures less than
392 °F, water vapor, formic acid, and acetic acid are
released from the fuel. For temperatures between 392 °F and
536 °F, water vapor, carbon dioxide, carbon monoxide, and a
number of organic acids are released. This is the "slow
pyrolysis" phase where largely non-combustible gasses are
formed [2].
The exothermic stage of pyrolysis occurs between 536 °F
and 932 °F [2,23]. This is the "fast" or "active" pyrolysis
zone. Highly flammable gasses such as carbon monoxide,
methane, aldehydes, methanol, and hydrogen are released,
also, highly flammable tars remain in the solid phase as
residue.
When sufficient oxygen and heat is present, the gaseous
volatile components released during the fast pyrolysis will
burn in flaming combustion. This provides a source of heat
to continue the pyrolysis (heat the solid) and increase the
overall rate of reaction.
3) FIXED CARBON COMBUSTION - Fixed carbon combustion,
also known as glowing combustion, is an exothermic process
occurring at temperatures above 932°F [2]. This type of

42
combustion is typically recognized as charcoal briquets
used in a bar-b-que. For most biomass, fixed carbon
represents only 10-20 percent of the solid fuel, see Table
2. However, this fixed carbon combustion acts as the
primary source of heat for the raw (cold) fuel that is
usually added on top of the fuel pile in grate-type systems.
Glowing combustion releases enough energy to vaporize
moisture and volatiles in hogged wood fuel with up to 50
percent (wet-basis) moisture content [40]. The energy from
flaming combustion is not needed to dry the fuel [40].
There is a discrepancy in the literature as to the
products of glowing combustion. Above 932°F the primary
products are carbon dioxide, water, and oxides of nitrogen
[23]. [32], states that above 1650°F the surface reaction
between oxygen and solid carbon is predominantly to carbon
monoxide. In actual spreader-stokers and other boilers the
temperature on the grate are usually in excess of 1650°F
[40]. This apparent discrepancy may be due to the fact that
[23] assumed an oxygen rich atmosphere for the glowing
combustion and [40] may have assumed an oxygen starved
(reducing) environment, or it may be due to the temperature
differential. Neither text was very clear on this point.
SIMPLE COMBUSTION MODEL AND EFFICIENCY :
Now consider the simplest chemical combustion model.
43
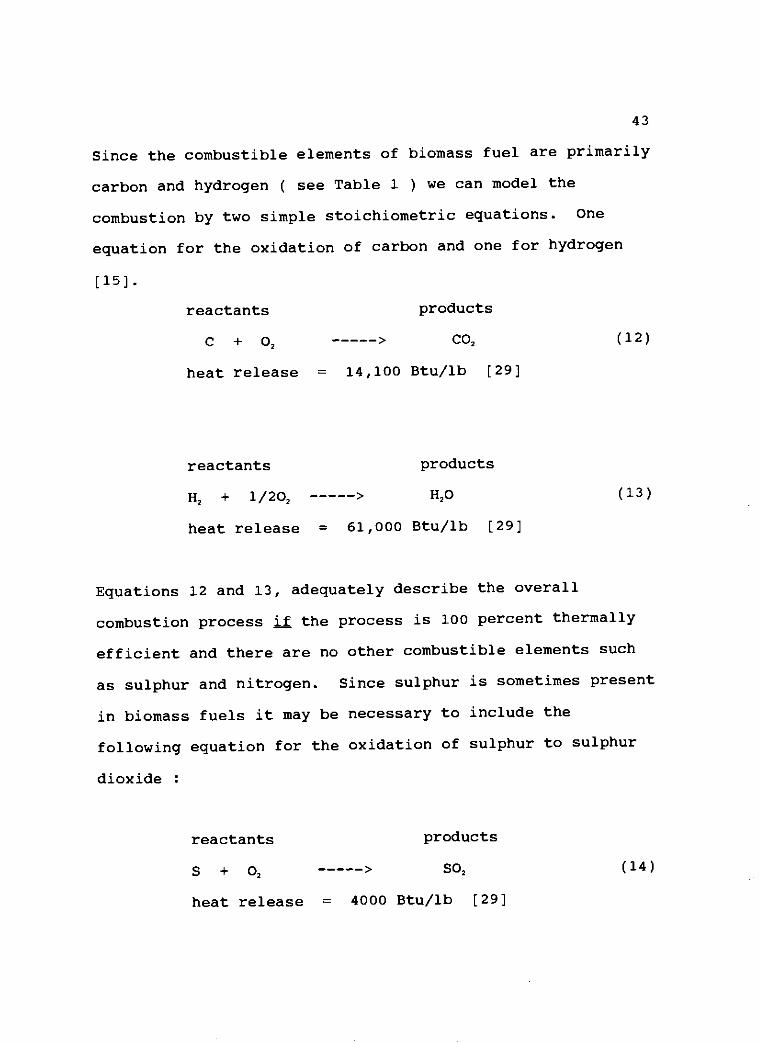
Since the combustible elements of biomass fuel are primarily
carbon and hydrogen ( see Table 1 ) we can model the
combustion by two simple stoichiometric equations. One
equation for the oxidation of carbon and one for hydrogen
[15].
reactants products
C + 0, > CO,
heat release = 14,100 Btu/lb [29]
reactants products
H2 + 1/202 > H2O
heat release = 61,000 Btu/lb [29]
(12)
(13)
Equations 12 and 13, adequately describe the overall
combustion process if the process is 100 percent thermally
efficient and there are no other combustible elements such
as sulphur and nitrogen. Since sulphur is sometimes present
in biomass fuels it may be necessary to include the
following equation for the oxidation of sulphur to sulphur
dioxide :
reactants products
S + 02 > SO, (14)
heat release = 4000 Btu/lb [29]
44
EFFICIENCY - When combustion is 100 percent efficient
it means that all combustible elements have been fully
oxidized to products releasing the greatest possible heat
energy. For biomass fuels this implies that all carbon has
been converted to carbon dioxide and all hydrogen to water.
Maximum temperature will correspond to this point because
optimum efficiency corresponds to reactions with the
greatest heat release per pound of fuel.
Flame Temperature - Combustion or flame temperature
in "real-life" burners will always be less than the
calculated adiabatic flame temperature (AFT), because of
heat losses. These losses include : 1) incomplete carbon
and hydrogen oxidation, 2) combustion less than
instantaneous, 3) radiation, convection, and conduction
losses, 4) other causes including inert ash heated in the
burner. A model of adiabatic flame temperature using the
method of "free energy minimization" was developed in [38].
Simple algebraic equations for estimating the AFT for
Douglas Fir, Yellow Pine, Poplar, Hickory, and Black Oak
were developed. These equations could be very useful for
comparing real burner temperatures to the AFT as a measure
of efficiency.
Carbon Monoxide - Combustion is never 100 percent
efficient in real life. Another indication of this besides
the AFT is the amount of carbon monoxide (CO) in the
exhaust. Remember that one product of fast pyrolysis and

45
possibly even glowing combustion is carbon monoxide. If
this CO is not later oxidized to CO, during combustion then
it exits the burner as a heat loss. This loss is equal to
4340 Btu per pound of carbon in the fuel [4]. This is true
because the oxidation of CO to CO, releases 4340 Btu/lb by
the following equation :
reactants products
CO + 1/20, > CO, (15)
heat release = 4340 Btu/lb
Unburned Hydrocarbons and organic Compounds - This
includes the gaseous products of slow and fast pyrolysis
which for any number of reasons are not broken down and
completely oxidized. They include hydrocarbons, and a wide
class of organic compounds called polycyclic organic matter
(POM) [6]. These emissions can be substantial in low
efficiency burners such as wood-stoves that are "stoked or
damped-down" and other poorly designed equipment. In most
commercial and newer residential appliances there is not
much heat loss from these unburned emissions.
Fig. 7, is a schematic representation of the primary
processes that occur in a fuel bed such as found in a
spreader-stoker or dutch-oven type furnace. The curves to
the right of the picture and text show how combustion gas
46
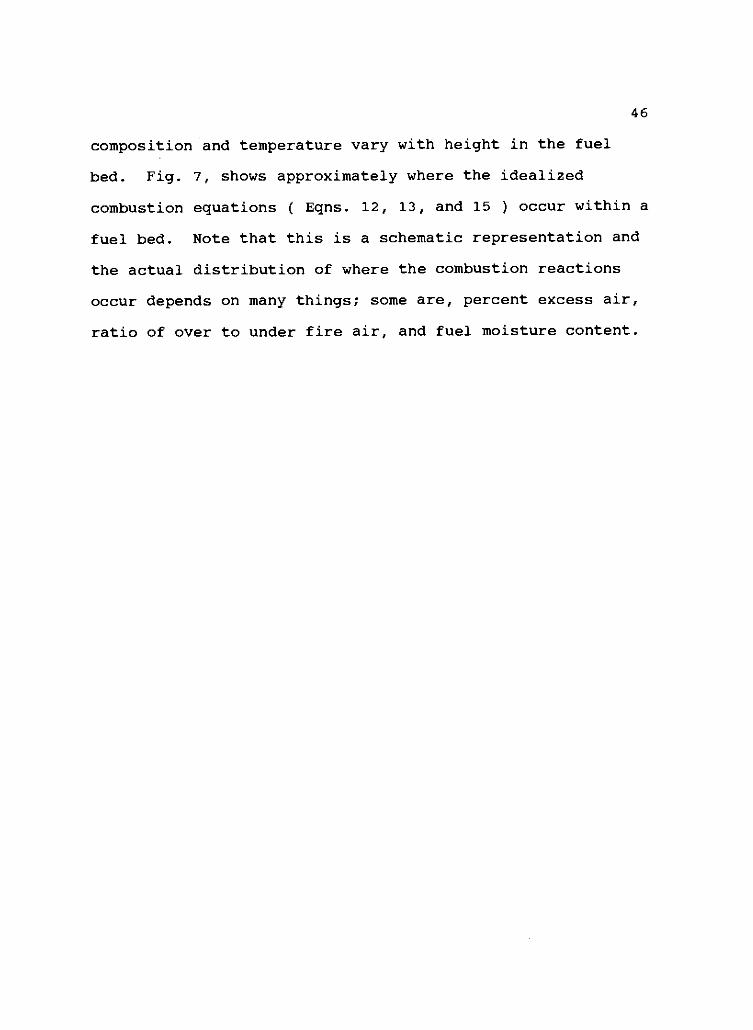
composition and temperature vary with height in the fuel
bed. Fig. 7, shows approximately where the idealized
combustion equations ( Eqns. 12, 13, and 15 ) occur within a
fuel bed. Note that this is a schematic representation and
the actual distribution of where the combustion reactions
occur depends on many things; some are, percent excess air,
ratio of over to under fire air, and fuel moisture content.

EFFLUENTtOVERFIREAIR BED TOP
FUELBED
FUEL (overfed)
SECONDARY OXIDATION ZONE
2C0 02 -> 2CO2C 02 -) CO2
H2 1/202 - H2O
PREHEAT ZONE
ignitionplane
REDUCTION ZONE
CO2 + C -> 2C0
r
OXIDATION ZONE
C + 02 -) CO2
GRATE
kUNDERFIRE AIR
ASH LAYER
CO
0 COMPOSITIONAND TEMPERATURE
PLOTS
Figure 7. Schematic Representation of a Fuel Bed andthe Basic Chemical Equations for the Combustion ofSolid Biomass Fuel, including Composition andTemperature Plots. Source [6]. a
-4
48
Combustibles in Fly Ash - Another widely used measure
of combustion efficiency is the combustible material
remaining in the ash that leaves the burner with the exhaust
gasses ( called fly ash ) [16]. This ash usually contains
inorganic (non-combustible) and organic (combustible)
particulate. If, the combustion were 100 percent efficient
there would be no combustible in the fly ash, it would be
burned to CO, and/or H2O.
Oxides of Nitrogen - Another indicator of combustion
efficiency that is not widely mentioned as such in the
literature are oxides of nitrogen. The presence of oxides
of nitrogen (NCO in the exhaust gasses may prove to be a
useful indicator of combustion temperature. Usually, NO is
discussed for its contributing role in photo-chemical smog
production, [6,11]. However, it is well known that NO,
formation is catalyzed by increasing temperature, and as was
discussed earlier, increasing temperature signifies
increased combustion efficiency.
There is a complicating factor for solids combustion.
It is that NO, can be formed in relatively substantial
quantities by both air-born and fuel-bound nitrogen. In
well-mixed, flaming combustion NO should peak at the
stoichiometric air/fuel ratio, but because of "kinetic non-
equilibrium" effects it is found in a slightly oxygen rich
environment [11]. The NO formed by air-born nitrogen is
sometimes called "thermal NO" because its

49
formation is highly temperature dependent, but it also
depends on local oxygen concentration.
Nitrogen in fuel is usually bound to hydrogen or carbon
atoms and is sometimes called "chemical NO." when it is
burned. Experiments have shown that when fuel nitrogen
compounds are present the overall NO, level can
significantly increase. Most interesting though is that
fuel bound NO formation seems to be only slightly
temperature dependent as opposed to the strong temperature
dependence of thermal NO. formation [11]. Fortunately
from an air quality standpoint ) fuel-bound nitrogen is
usually a very small percentage by weight of the elemental
components of biomass fuel, i.e. = 0.0 - 1.0 %, see Table 1.

50
PROBLEM FUELS : EMISSIONS / ENVIRONMENTAL STANDARDS
GASEOUS AND RELATED EMISSIONS :
This section outlines the gaseous emissions and other
pollutants that are currently regulated by Federal, State or
local agencies. No attempt is made to cite exact emission
standards for all possible situations. This is a very
complex subject which depends on many factors, including:
1) Type of appliance
a) residential wood stove
b) commercial / institutional boilers
2) Size of appliance ( heat or steam rating )
a) Btu/hr
3) Fuel used
a) coal, oil, natural gas
b) cofired; coal + wood etc.
C) RDF / MSW
4) Regulatory Agency
a) area where appliance is situated
b) time of year
c) air quality at any particular time
51
Information on emission standards specific to a
particular installation, can be obtained from the
Environmental Protection Agency (EPA), Federal Register, or
your State Environmental Agency. This discussion does not
cover the pollution abatement equipment that controls these
emission problems; that is another large topic by itself.
Emission regulations are enforced by three levels of
government : Federal, State and local. The Federal agency
in charge of setting standards and enforcing them is the
Environmental Protection Agency (EPA). The EPA sets the
standards for type of emission, sampling method and emission
level. The State agencies (such as Oregons' Department of
Environmental Quality DEQ), and local agencies, are really
the workhorses in the program. Their job is to provide a
permitting process and make sure the EPA standards are met
or exceeded, i.e. each State has authority to raise the
emission level standard above that required by the EPA, but
they may not provide variance for lowering those standards.
Table 5, lists the EPA criteria and non-criteria
emission species for wood fired appliances. "Criteria"
species refers to emissions that are regulated by law and
non-criteria species are those that are not regulated at
present but are being studied extensively for possible
inclusion.

52
Table 5. EPA Criteria and Non-Criteria EmissionSpecies for Wood Burning Devices. Source [6].
Emission Species Criteria Non-Criteria
Particulate *
SOx *
NOx
Hydrocarbons *a
CO *
Condensable Organics
POMb *
Formaldehyde *
Total Carbonyls
Phenol *
a : Typically there is a Primary Ambient Air Quality
Standard (PAAQS) set for all criteria emissions, however,
none exists for hydrocarbons [6]. Some States do have a
standard for hydrocarbons.
b : POM = Polycyclic Organic Matter
It should be noted that the above criteria emission species
are enforced at some level for all combustion devices
53
including those that burn coal, oil, RDF and other biomass
fuels. Following is a brief description of each criteria
emission.
Particulate - This is the total matter in solid phase
that exits the furnace stack. It consists of combustible,
organic and non-combustible (ash) material. The standard
for sampling particulate is EPA Method 5. In many instances
this is the only emission requirement necessary to meet
state certification. Along with particulate, many states
have opacity standards which limit the amount of visible
smoke emissions [15].
Sulphur Oxides (S0.1 - SO, is formed by oxidation of
fuel bound sulphur during combustion. Sulphur content in
wood fuel is usually so low that SO, is immeasurable,
however, this may not be the case with RDF fuels or in coal
+ biomass cofiring applications. See Table 1, in "Solid
Biomass Fuels" chapter. Applicable standard is EPA Method
6. Some work suggests that even in bark combustion with
relatively high sulphur content most of the sulphur
(approximately 95%) remains in the ash [24].
Nitrogen Oxides (NCO - NO, formation was discussed
earlier in the chapter on "Combustion of Biomass Fuels".
Most licensing agencies do not regulate NO, emissions. This
is due to the fact that most local areas are not subject to
the atmospheric conditions leading to photo-chemical smog.
However, regulation seems eminent in areas such as

54
Los Angeles that do have smog problems occasionally.
It should be noted that there are no NO, pollution
abatement methods ( no devices ) that can be employed "on-
line" in the exhaust stream. Only by reduction of flame
temperature can NO, formation be decreased [32]. Operating
at low excess air levels, using low-turbulence diffusion
flame operation and using water cooled furnaces also helps
control NO, formation.
Carbon Monoxide (CO) - CO formation is a result of
poor combustion. It can be a serious problem in boilers
fired with wet fuel because it is caused by low combustion
temperatures, especially in the flaming combustion zone
where much of the CO is converted to CO2 in furnaces using
overtire air ( see Fig 7 in the "Combustion of Biomass
Fuels" chapter ). CO emission tests are not always required
by regulatory agencies, but, it is much more widely tested
then NO,.
Hydrocarbons - Hydrocarbons are volatile gasses that
result from the incomplete combustion of both the carbon and
hydrogen in fuel. Usually they result from incomplete
pyrolysis and combustion of large chain volatiles such as
cellulose and formaldehyde [3]. Similar to carbon monoxide,
hydrocarbon emissions are not usually a test requirement to
meet state licensing laws.

55
Emission Standards for Contaminated RDF \ MSW Type Fuels :
The entire field of combustion technology and
environmental standards for RDF \ MSW is in a rapidly,
growing stage. The information in Table 6 is adapted from
[37]. Table 6, shows the current National Ambient Air
Quality Standards (NAAQS) for any device (including
furnaces) which emit such pollutants.
Table 6. National Ambient Air Quality Standards.Source [37].
Emission Species Averaging Period Primary Standard(mg/m3)
Sulphur Dioxide 24 hr 365
Total Sus. Particulate 24 hr 260
Carbon Monoxide 8 hr 10,000
Photo-Chemical Oxidants 1 hr 240
Nitrogen Dioxide Annual mean 100
Non-Methane Hydrocarbon 3 hr 160
Lead and its compounds 1 calendar quarter 1.5

56
In addition to the NAAQS, another set of standards
called National Emission Standards for Hazardous Air
Pollutants (NESHAP) comes from the Clean Air Act Amendment
of 1977 (CAAA). NESHAP regulates emissions for which no
NAAQS exists. At present the EPA has designated : asbestos,
beryllium, mercury and vinyl chloride as hazardous air
pollutants [37].
Other Pollutants - At this time, major institutions
are studying the gaseous emissions of other pollutants.
Presently there are no regulations concerning these
pollutants. The pollutants include : Silver (Ag), Arsenic
(As), Barium (Ba), Cadmiun (Cd), Chromium (Cr), Copper (Cu),
Nickel (Ni), Antimony (Sb), Selenium (Se), Thallium (T1),
Zinc (Zn), Polyaromatic Hydrocarbons (PAH's),
Polychlorinated Biphonyls (PCB's), Tetra-Chlorinated Furans
("Furans"), and, Tetra-Chlorinated Dioxins ("Dioxins") [1].
SOLID EMISSIONS (Bottom and Fly Ash) :
For solely wood-fired furnaces of institutional or
commercial size there are no ash handling standards similar
to the EPA regulations for gaseous emissions. Many wood
product industry boilers in the five-state Northwest Region
use the ash for roadfill. However, for coal, RDF, or MSW
furnaces there are EPA standards. Many utility size boilers
both coal, co-fired, or pure RDF/MSW fired, use water to

57
quench and transport collected grate and fly ash. Actually,
water ( many times it is done pneumatically ) cannot be used
anymore to transport flyash as can be seen in Table 7 on the
following page.
Table 7. Typical Effluent Concentrations. Adapted from[32].
SPECIES POLLUTANTSOil and Grease ph TSS°
Bottom Ash lmg/1 x max.flow 6 - 9 5mgil x max.flow.75mg/1 x avg.flow 1.5mg/1 x avg.flow
Flyash 0 6 - 9 0
° : TSS - Total suspended solids
Reference [32], states that where siting conditions
permit, ash slurry is pumped to holding ponds where the
process may include water recovery and reuse.
EP Toxicity - For RDF/MSW or cofired plants, the EPA
requires that bottom ash be tested for the following heavy
metals : See Table 8 on the next page.

58
Table 8. EP Toxicity Parameters and Current MaximumAllowable Levels. Source [6].
Metal Contaminant Max. Allowable Concentration(milligrams/milliliter)
1) Arsenic 5.0
2) Barium 100.0
3) Cadmium 1.0
4) Chromium 5.0
5) Lead 5.0
6) Mercury .2
7) Selenium 1.0
8) Silver 5.0
The trace metals Antimony, Beryllium, Copper, Nickel,
Thallium, and Zinc, are also under intense scrutiny as
possible contaminants to add to the EP Toxicity list [1].
SUMMARY A comprehensive document that would describe
the current laws could not be found. Anyone interested in
the current state of environmental regulation of biomass
fueled furnaces must be willing and able to specify all
physical variables of the source of interest and request all
current Federal, State, and possibly local or regional laws
and regulations as regards a particular application.

59
PROBLEM FUELS : ASH
Ash from biomass fuels is the single most destructive
constituent for furnaces and boilers. The following
discussion will help illustrate why this is true. First,
let us consider the chemical make-up of some typical ash.
Table 9, is a listing of the ASTM standard chemical
compounds and their typical values for different fuels. The
ASTM standard is No. D-3174, "Test Method for Ash in the
Analysis Sample of Coal and Coke From Coal".
Table 9. Various Chemical Ash Analyses from SelectedLiterature. Sources [10,20,32]
PERCENTAGE ( dry-basis )
ASTM Coal Wood Pellets RDF
Component (range) (avg.) (range)
SiO, 10 - 70 36.0 7.1 - 14.6
A120, 8 - 38 3.5 2.3 - 7.6
Fe,O, 2 - 50 2.3 1.6 - 3.2
Ca0 .5 - 30 42.0 5.5 - 8.3
Mg0 .3 - 8 5.0 1.2 - 5.0
Na,0 .1 - 8 .6 5.3 - 10.8
K,0 .1 - 3 6.0 7.1 - 7.4
TiO, .4 - 3.5 .25 .6 - 1.1
SO, .1 - 30 3.0 29. - 33.5
P205 unavailable 3.0 1.0 - 1.46

60
The three main problems with ash in fuel are :
1) Slagging / Deposition
2) Erosion
3) Corrosion
Ash, and the symptons mentioned above, are so
problematic in pulverized coal steam generators that the
management of coal ash is one of the major design
considerations for such boilers [32]. Likewise,
these problems can be just as bad in poorly designed home
heating units.
1) SLAGGING / DEPOSITION :
Slagging occurs when ash becomes softened or liquid and
clings tenaciously to grate, ceramic and waterwall surfaces.
"Slagging" is a term that is widely misused to describe two
distinct entities. These entities are - Slagging :
fused matter or re-solidified molten ash that forms on
furnace walls or other surfaces exposed mainly to radient
heat or very high gas temperatures. Deposition :
Cemented or sintered ash build up usually on convection
surfaces like superheater and re-heater tubes, but also on
cooler furnace surfaces.

61
Many parameters have been used to evaluate ash behavior
as they affect slagging and deposition. Some of these are :
ash fusibility
- base / acid ratio
iron / calcium ratio
- iron / dolomite ratio
- silica / alumina ratio
- dolomite percentage
- ferric percentage
It is beyound the scope of this text to describe all
these parameters. However, ash fusion or fusibility
temperature ( which is considered to be the most critical )
will be discused.
Four temperatures are currently used to specify ash
fusion temperature as specified by standards such as ASTM
No. D-1857, " Fusibility of Coal Ash". The exact definition
of these temperatures is not given here, but their names are
the following :
a) Initial Deformation Temperature (IT)
b) Softening Temperature (ST)
c) Hemispherical Temperature (HT)
d) Fluid Temperature (FT)
These definitions refer to the shape of a specified cone of
ash as it is subjected to increasing temperature under

62
"standard" conditions. This test can be performed in an
oxidizing and/or reducing environment. This is important
depending on which environment the ash will be in. Furnaces
operated at low excess air level or with poor mixing would
create local reducing environments. Table 10 below, gives
the ash fusion (fluid) temperatures for a number of species
in oxidizing and reducing environments.
Table 10. Ash Fusion Temperatures for Selected Speciesof Biomass Fuels. Sources [10,20,32].
Species Ash Fusion Temperature (fluid)Oxidizing ('F) Reducing (`F)
ASTM Rank hvA coal Unay. 2660
ASTM Rank subbit.0 Unay. 2310
RDF (range) 2200 - 2420 2160 - 2340
wood (avg) 23908 2410
: Results from OSU's study on selected wood fuels.
It is apparent that ash fusion temperature (fluid) is
not really too different for the fuels considered in Table
10. It is not shown, but there is even less difference
between the four stages within a group, i.e. the IT, ST, HT,
and FT measurements.

63
Major Problems with Slagging and Deposition -
A) Reduces heat transfer on heat exchange surfaces.
B) Can bridge, plug and mechanically destroy grates.
The reduction or redistribution of under fire air from
plugged grate holes is very undersirable for
combustion. It adversely affects efficiency and
emissions.
C) Can actually tear down refractory by repeated
liquidizing and re-solidification.
D) Requires monitary and time expenditure for cleaning
by both mechanical and human intervention.
2) EROSION :
Erosion of furnace and boiler surfaces is largely due
to dense, hard, particulate ash which is in the gas stream.
It is a very important topic because erosion can be rapid if
the right conditions exist of high ash concentration and
high exhaust velocities. Literature such as, [16], have
reported on the mean fly ash particle size and density for
various firing conditions of pelletized Douglas Fir Bark.
Data such as this could be very useful in quantifying rates
of erosion vs. density or particle size.
64
3) CORROSION :
Corrosion has been studied intensively by the coal
furnace and boiler industry. It is also gaining rapid
attention in the cofiring and RDF / MSW industry because of
the highly corrosive nature of the constituents in RDF and
MSW [26]. The major problem with corrosion is metal
wastage. Below, is a list of conclusions on corrosion from
commercial coal-fired unit experience ( adapted from [32] ).
a) Only a small percentage of coal fired units
experience serious corrosion requiring major
operating corrections.
b) For coals that are "corrosive", metal temperature
plays a signifigant part in the corrosion rates.
c) Molten ash from corrosive coal is highly aggresive
and corrosion is not easily preventable.
d) All cost-viable boiler materials are inadequate if
the coal is corrosive.
e) Various tube coatings have been tried but all seem
cost prohibitive and or the raw metals are in short
supply.

65
Chloride as a Corrosion Factor - For salt-soaked wood
fuel and RDF/MSW chlorine can cause severe metal wastage.
Chlorine in refuse is responsible for the most serious
corrosion of boiler tubes [41]. Sulfur, Sodium, potassium,
lead and zinc also do their share.
A very extensive study of chloride corrosion from the
burning of both RDF and MSW cofired with high sulphur coal
was documented in [41]. The tests were condudted at the
Municipal Electric Plant, Columbus, OH. The following
conclusions have been drawn from [41] :
A) The conversion of chlorides to sulfates in ash
deposits by the action of SO, releases chlorine and
hydrochloric acid at the metal surfaces. This causes
serious corrosion.
B) Chloride corrosion can be made negligible by
increasing the available sulfur in fuel to equal
2% by weight of the refuse.
C) Cofiring of MSW with high sulphur coal for up to a
60/40 blend (Btu basis) will not increase the initial
corrosion rate beyound that of coal alone.
Points B and C above are fascinating and potentially very
valuable. There are two major benefits to cofiring high
sulfur coal, MSW/RDF, or salt soaked wood biomass. One
benefit is that decreased high-sulfur coal input means less
66
sulphur oxide emissions and subsequently less acid gas
emission, i.e. H,SO one component of "acid-rain". The
other benefit is that metal wastage by chloride corrosion is
reduced signifigantly, helping reduce maintenance and
material cost.
Fig. 8 shows the isothermal corrosion rate in
(mils/hour) vs. sulphur addition to refuse (MSW). It was
adapted from [37].

0.37
0.34
0.30
0.26
0.22
0.19
0.15
a.11-
0.07
004
1100 deg.F
FURNACE GAS TEMPERATURE = 1430 (deg.F)
0.00
-0 25 -0.05 0.15 0.35 0.55 am 0.95 1.15
PERCENT SULFUR ADDITION
1.35 155 175
67
Figure 8. Isothermal Corrosion Rates as a Function ofSulfur Addition to Municipal Solid Waste. Source [41].
Figure 8, shows that for sulphur additions less than
.75% the result is generally increased corrosion, yet,
beyond .75% there is a dramatic corrosion reduction.
The gaseous emissions were not included in this study,
so a judgement can not be made of the relative merit of
corrosion inhibition vs. emission quality. The overall idea

68
seems very worthwhile and more studies should be done.
As a last comment on corrosion problems for refuse type
fuels, a study was conducted concerning the influence of
lead (Pb) and zinc (Zn) on corrosion in refuse-fired steam
power plants [20]. The final conclusion was that lead and
zinc in the form of chlorides of lead sulphates and
chlorides of zinc, contribute to the corrosion in said power
plants.
Final Remarks on Ash - It should be apparent now that
ash is a very destructive element in operating furnaces and
boilers and may also be a toxic or harmful environmental
disposal problem. Wood fuels, in general, will cause much
fewer problems because of their low ash content, low heavy
metal and usually low chloride concentrations. MSW/RDF
fuels can cause signifigant problems due to their overall
ash content and chemical nature.

69
COFIRING
Cofiring is generally considered to be the combustion
of biomass with coal, but it may also be the concurrent
firing of two dissimilar biomass fuels such as wood and RDF.
Currently published cofiring experience is limited to large
scale steam and electric plants. The reason for this is
that electric utilities have been studying and using biomass
as a real supplement to their normal coal fuel since the
early 1970's. The attractiveness of biomass as a utility
fuel is a function of the price of fossil fuels, the
technology base( especially for retro-fitting ), and system
economics. The following sections draw heavily from work
carried out by a number of private research and engineering
firms, sponsored by the Electric Power Research Institute
(EPRI). Necessarily, most of their discussion is for large
scale (5-50 MW) power plants, but most of the findings are
relevant to cofiring on a smaller scale. Two main sections
follow, one is on the positive aspects of utilizing biomass
for cofiring and the other section discusses the negative
aspects as they have been determined by utility experience.
POSITIVE ASPECTS OF COFIRING :
One of the best reasons for utilizing biomass is the
70
price compared to fossil fuels, also, the price of most
biomass fuels has not increased as rapidly as fossil fuels
[9]. However, there is not sufficient availability in most
localities to completely supply large utilities and that is
why gofiring is the issue here.
Although there does not seem to be an eminent danger of
a shortfall in primary energy, i.e. coal, nuclear, and oil,
it is a possibility and another motivation for at least
studying cofiring. Conversely, in many areas of the U.S.
there is a windfall of biomass, so much in fact that it is a
real disposal problem. For example, Portland, Oregon, has
recently had to perform some rapid economic, societal, and
sometimes painful political planning to determine what to do
when their current landfill becomes inoperable. Their final
decision is to truck their waste outside of the Portland
Metro area to a new landfill. Whole geographic areas may be
afflicted, such as Southeast Alaska, where both MSW and wood
biomass pose real disposal problems. The two main reasons
for this are the fact that most of Southeast Alaska is
public land, and, the areas that are private are unsuitable
for landfilling ( it is hard rock ). The State of Alaska
also maintains emission standards that exceed the Federal
requirements in some cases.
A major reason for using biomass is to ameliorate the
impact of strict environmental regulations. Biomass can
help because it has shown to be cleaner in use than some

71
fossil fuels [9]. One major problem in burning coal is its
sulphur content. Coal sulphur content ranges from .5 to 5
percent by weight, and generally, 90 percent or more of this
will be converted to sulphur oxide pollutants. These
pollutants are primarily sulphur dioxide SO with one to
four percent sulphur trioxide SO, [32]. Wood and RDF have
sulphur contents that range from 0.0 to .1, and, .1 to .6
percents respectively [13,32]. Obviously, the use of wood
and/or RDF as additives to coal will decrease the overall
output of sulphur oxides on a per Btu fired basis.
The production of biomass may also be less destructive
to the environment, i.e. mill residues, tree and seed farms,
and RDF processing plants, VS. strip mining, nuclear waste
disposal, and the catastrophic dangers of pipe line or
tanker rupture ( as recently occurred in Prince William
Sound, Alaska ).
The presence of biomass processors in a local area that
can act cooperatively is a site-specific advantage for
cofiring [9]. A study was completed of cofiring wood chips
with coal in interior Alaska [28]. An interesting problem
was noted for interior Alaska; they would like to clear more
land for agriculture and thin many stands of existing
timber, but it is not economically advantageous at present.
Currently, the practice is to pile and burn the biomass but
this is expensive since it requires repeat piling and
burning up to four times to sufficiently reduce the volume

72
[28]. A complete technological and economic study was
completed for Fort Wainwright, Alaska, to assess the
feasibility of using wood biomass with coal to produce
steam. The Fort Wainwright tests led to the following
technical and economic conclusions respectively.
Technical Feasibility
Burning wood chips with coal for producing steam is
technologically feasible. The major problems were in fuel
handling prior to burning and in meeting peak demand. One
problem was mixing, but through trial-and-error the Fort
Wainwright group found a suitable solution. Another problem
was inadequate chip hopper volume and freezing. Both of
these problems could be dealt with by a minor investment in
storage technology.
The last major problem was meeting peak steam load.
The stoker at Fort Wainwright was incapable of feeding
enough fuel above an 80% coal + 20% chip mixture to keep
steam rates at desired levels. This was mainly associated
with the Fort Wainwright boiler and could be eliminated with
a high volume stoking system [28]. Very desirable facets of
the operation were emissions all well below the State of
Alaska Standard of .1 grams per dry standard cubic foot for
coal burning installations operating before July 1, 1972.
There was also an eight to sixteen percent reduction in

73
bottom ash.
Economic Feasibility
As long as delivered wood chip moisture content is
below 45% wet-basis ( and all chips during testing were less
than 41.6% moisture ), all harvesting scenarios considered
would result in a cost less than coal per Btu. However, the
harvesting scenarios all assumed annual production of more
than 20,000 tons of chips. With diminished output the
harvesting would become economically infeasible.
Unfortunately, the Fort Wainwright plant could, at best,
only use approximately 50% of this 20,000 tons of chips.
One or more utilities using wood chips would solve this
problem.
In conclusion, the Fort Wainwright study showed promise
as a consummate match of community need and biomass use.
There were problems but these are expected in any
experimental, retro-fitted design.
Another positive aspect of cofiring is in high "load
growth" areas, where rapid industrial and/or residential
growth demands more energy. This growth will necessitate
the building of new electricity generating equipment.
Biomass based cofiring installations may be desirable in
areas with large local biomass supplies. One particular
advantage is that cofiring installations are not as

74
sensitive to economies of scale such as in the nuclear
industry where it is infeasible to build "small" plants
because of the investments in environmental studies, safety
and security engineering.
Table 11, contains economic data and motivational
reasons for cofiring in actual situations.
Table 11. The Economics of Cofiring at SeveralCommercial Boiler Sites. Source [9].
Cofiring° SpeciesPlant Type
PurchaseBasis
Fuel Cost°bio. other
Motivation
1 hardwoodwastes
Btu.6
coal1.5
fay.comm.
economicinterest
2 hardwoodwastes
Btu.6
oil5.0
fay.comm.
economicinterest
3 softwoodsawdust
wt.1.0
coal1.2
marg. economic
4 SoftwoodAspen
wt..7
coal1.7
fay.comm.
economicinterest
5 contaminated NA NA NA fay. economicSeed Corn disposal prob.
: PlantPlant 2)Plant 3)Plant 4)Plant 5)
1) Northern States Power, Red Wing, Minnesota.Northern States Power, French Island, Wisconsin.Grandhaven Board of Light and Power, Michigan.Lake Superior District Power Co.Cedar Falls Utilities.
o : cost figures are dollars per million Btu and notcorrected for inflation.

75
Table 11, demonstrates considerable promise for
cofiring wood wastes with coal and even oil. In fact, there
is very little evidence of technical reasons against
cofiring wood, and the economics look good for site-specific
installations.
The following discussion covers some literature on the
positive aspects of cofiring RDF fuel with coal in utility
boilers.
Madison Gas and Electric Co. (MGE). Blount Station
(BS). Madison. WI. Blount Station has been burning RDF on
a small but continuing scale since 1979. BS burned 13,816
tons of RDF in 1894, and MGE declares that the performance
of the fuel has been satisfactory [26]. BS has experienced
no technical boiler problems not attributable to normal
wear. In fact, stack emissions tests indicate that
particulate emissions were not increased while cofiring and
hydrochloric acid (HCL) emissions were no greater than they
would be while burning a typical Midwest coal.
Despite the rosy technical picture, MGE has not been
able to operate the BS plant for a profit. It should be
mentioned that it continues operation because of support
from the public sector, i.e. the City of Madison is
intimately involved in the project. The primary reason for
operating at a loss is given as the inability to burn 20,000
tons per year of RDF as originally planned. Unfortunately,

76
the author does not say why the 20,000 tons is not being
burned.
Department of Electric and Water Utilities (DEWD), Mcintosh
Power Plant (MPP) City of Lakeland, FL. The MPP facility
processes and burns an average of 150 tons of raw MSW per
day. The "processing" is a complete MSW-to-RDF plant. In
fact, the MPP is the largest refuse-to-energy electric
generating station in the U.S. [26]. The MSW-to-RDF
processing facility is specifically designed to provide a
supplemental fuel (10%) for the MPP boilers. It currently
produces a revenue of $30,000 per month.
Below, is a listing of the technical aspects of this
operation in regards to RDF problems or lack thereof.
Ash - The RDF has three to four times as much ash as
the coal being burned, but since the unit was designed
with this in mind there have been no problems.
Slagging No additional problems.
boiler Efficiency - Efficiency is reduced due to high
moisture content (38%) and cold air introduced by the
RDF pneumatic conveying system. However, it is noted
that SO, emissions are down.
Boiler Corrosion - Tests have shown that RDF burning
could be doubled before significant corrosion occurs.

77
Technically, the operation sounds quite efficient now,
however, it took two years to identify and correct the
initial processing and burning problems. Despite this long
"learning curve" the DEWD predicts the benefits both
environmental and economic to be gained during the lifetime
of the plant show solid waste disposal and power generation
are profitable and compatible. The DEWD believes the
benefits of reducing coal use and slowing landfill expansion
should offset the cost of retro-fitting existing plants, or
building new ones. This seems especially true if valuable
information such as that given in the DEWD report is made
available, i.e. if we learn from others trials.
There are three other RDF cofiring utility experience
papers given in [26], and much more information on actual
cofiring experience. It is highly recommended reading for
anyone interested in this topic.
The preceding discussion shows that cofiring woody or
RDF biomass with coal (or oil) is technically feasible and
economically beneficial in many circumstances. However,
there are serious technological problems that have been
experienced while cofiring RDF in particular. The next
section describes these problems.
NEGATIVE ASPECTS OF COFIRING :

78
There are problems associated with both the quantity
and quality of RDF ash. Extreme values of ash content from
4.3 to 53.8! percent by dry weight are reported in
literature [13]. Secondly, typical ash fusion temperatures
are lower for RDF than coal in an oxidizing environment and
nearly the same in a reducing environment [26]. This means
that RDF ash has a greater potential to soften and stick to
boiler surfaces and reduce heat transfer capability. "High"
heat release boilers should be avoided for cofiring RDF
[26]. Glass and aluminum can cause severe slagging problems
if major quantities are not screened out.
Material Handling -
There have been five problem areas in the past, as
listed below :
1) Dust along transport lines and in receivingstations.
2) RDF compaction and odors in storage bins due to longstorage times.
3) Inconsistent RDF fuel reclaim flow due to bridgingand corrosion.
4) Oversized materials, textiles, and wire plugging airlock feeder and/or transport lines.
5) Variation in RDF heat input to the boiler due tovolumetric feed systems and inconsistent RDF heatingvalue.

79
Boiler Efficiency -
Detailed computer simulations have shown that a typical
200MW boiler will see a 1.9 to 4.2 percent decrease in
efficiency at 20% RDF firing ( heat input basis ) [12].
There are two main reasons for this, 1) increased flue gas
exit temperature, 2) increased flue gas flowrate.
Increased flue gas flowrate is caused by higher excess
combustion air necessary for proper firing of RDF. The
reason for this is probably because of the high moisture
content, i.e. more air is needed for drying, although
reference [12] did not specify exactly why more excess air
was needed. Increased flowrate is also due to higher fuel
mass flowrates to achieve the same Btu output as coal, and
higher moisture content.
Increased flue gas exit temperature is due to the
higher excess air requirements, and, in many installations
the preheat section ( using exhaust gas ) does not heat the
RDF combustion air used for pneumatic transport [12].
Decreased heat transfer due to slagging can also increase
flue gas temperature.
The results of 1) and 2) above is to incur boiler
losses due to dry gas heat loss, water vapor heat loss, and
unburned combustibles ( carried out by increased volumetric
flowrates ).

80
Furnace Metal Wastage -
Steam generator manufacturers recommend maximum RDF
cofiring rates of 20% of the total fuel heat input to insure
HC1 concentrations in the combustion gas are low enough to
avoid increased corrosion on metal boiler surfaces [12].
The primary problem seems to be when bottom ash piles up
onto water wall tubes, especially in tangentially fired
units. Low oxygen levels and a reducing atmosphere next to
the tubes catalyzes tube wastage due to RDF contact.
Fortunately, no increased corrosion of superheater tube
surfaces has been reported.
Emissions / Pollutants -
Currently, RDF cofiring plants have had little
difficulty meeting Federal or State air quality standards.
This may change rapidly however as there is current work on
developing rigorous standards for a host of "new" pollutants
including : acid gasses( H,50 HC1, SO HF, NH, ), heavy
metal particulate, including ( Pb, Zn, Cr, Sn,..), and,
trace organic compounds such as dioxin and furan [26]. The
literature is quite inconclusive at this point, but further
reference to this topic was made in the previous report
section titled, "Problem Fuels : Emissions / Environmental
Standards".

81
CHAPTER II
PELLET FUEL SPECIFICATIONS AND
COMBUSTION EXPERIMENTS

82
FUEL SPECIFICATIONS
One of the objectives of this thesis was to test wood
pellet fuels for a range of pertinent variables and to
report the results of these experiments. This data
represents an expected range for wood pellet fuels from the
Five State Northwest Region. The data would also be useful
for anyone interested in comparing fuel values and/or
designing handling and combustion equipment. Table 12,
contains the codes for the pellet fuels tested as they will
be referred to in the remaining text and Appendices.
The following dual code scheme is listed so that this
document may be used as a reference in conjunction with
other work being done at OSU on the same biomass pellet
project. The codes on the left were used by the researchers
for all phases of the work ( this thesis does not cover all
work performed during the biomass fuel characterization
project ).

83
Table 12. Pellet Sample Coding Used in this Thesisand for Other Work Performed at OSU.
OSU Code Name THESIS Code
BCCPP824-1ABI 1
FHLDF624-1AB 2
FHLDF624-2AB 3
PHCHF706-2AB 4
EVCMX713 -lAB 5
WSPCD715-1AB 6
KMPMX727-2AB 7
SPCDF727-1AB 8
WFPMX920-1AB 9
PHCMX706-1 10
HSIMX824-1 11
BTPMX920-1 12
WDMMX920-1 13
RMMMX920-1 14
: A => Pellets were analyzed for Proximate, UltimateAnalysis, and Ash Fusion Temperature.
B => Pellets were burned for the experimental dataanalyzed in this thesis.
If an "A" or "B" is not present, this means that thepellets were analyzed for a subset of the variablesincluded in this report.
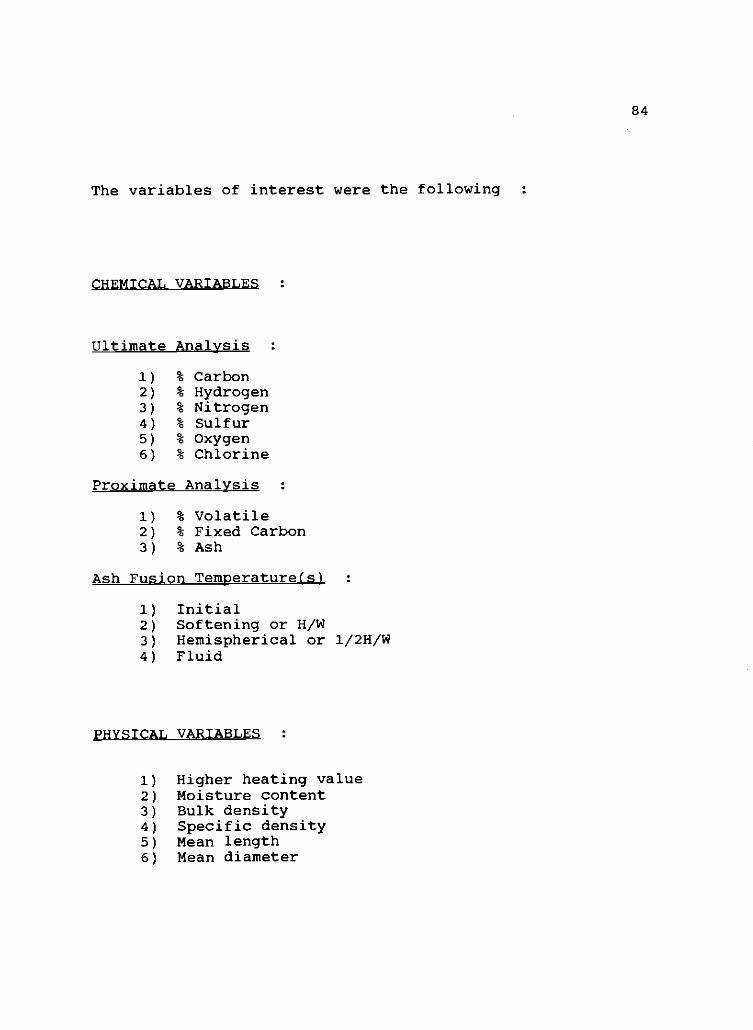
84
The variables of interest were the following
CHEMICAL VARIABLES
Ultimate Analysis
1) % Carbon2) % Hydrogen3) % Nitrogen4) % Sulfur5) % Oxygen6) % Chlorine
Proximate Analysis
1) % Volatile2) % Fixed Carbon3) % Ash
Ash Fusion Temperature(s)
1) Initial2) Softening or H/W3) Hemispherical or 1/2H/W4) Fluid
PHYSICAL VARIABLES
1) Higher heating value2) Moisture content3) Bulk density4) Specific density5) Mean length6) Mean diameter

85
RESULTS :
All pellet fuels were tested for their "Physical
Variables" ( as listed previously ), but only nine of the
fourteen total pellet species were tested for their
"Chemical Variables". A complete report on each fuel ( by
code number ) is found in Appendix C.
Table 13, is a compilation of ultimate analysis data
including the, minimum (MIN), maximum (MAX), mean, and
standard deviation (SDEV).
Table 13. Ultimate Analyses for Pellets Coded ( 1-9 ).
all data are on a (dry-basis)
%C %IL %N, %S %0, %Cl
MIN 50.35 5.82 .10 .01 37.11 .00
MAX 54.16 6.35 .37 .30 42.54 .41
MEAN 51.77 6.09 .21 .05 40.41 .28
SDEV 2.53 .17 .10 .08 1.75 .33
It is evident from Table 13, that the elemental
composition for these pellet fuels is not too different.
The main differences are in chlorine and sulfur, but these

86
are at very small percentages relative to the other
constituents. However, it has been stated earlier that
chlorine, even in small percentages, can be very corrosive
and also increases stack opacity and particulate loading.
Table 14, shows the summary statistics for the
proximate analysis of the wood pellet fuels.
Table 14. Proximate Analyses for PelletFuels ( 1-9 ).
all data are on a (dry-basis)
% Volatile % Fixed Carbon % Ash
MIN 71.60 15.66 .21
MAX 84.13 25.85 2.74
MEAN 77.56 21.03 1.41
SDEV 4.20 3.29 .94
There is more variability in the proximate analysis
data than the ultimate analysis data. This is due to the
chemical structure of the elemental components not the
relative percentages of these elements.
Table 15, lists the range of ash fusion data for the
pellet samples.

87
Table 15. Ash Fusion Data for Fuels ( 1-9 ).
all data are on a (dry- basis)ASH FUSION TEMPERATURE ( oxidizing, eF )°
Initial Softening Hemispherical Fluid
MIN 2150 2160 2170 2195
MAX 2500 2530 2540 2550
MEAN 2340 2352 2363 2381
SDEV 136 137 138 141
a : The various ash fusion temperatures ( Initial, Fluid,etc.) refer to the increasing "flatness" of a specifiedcone of ash as it experiences increasing temperature."Initial" is least deformed and "Fluid" is when the ashappears molten.
It is interesting to note that the mean initial ash
fusion temperature is only 1.7 percent smaller than the mean
fluid temperature. Also, the global average difference
between MIN and MAX values is only 361°F, not a significant
amount considering the temperature variations associated
with combustion in a furnace.
Table 16, displays the remaining ( Physical ) variables
that were measured for all fourteen pellet samples.

88
Table 16. Physical Pellet Analyses Data forPellets ( 1-14 ).
all variables measured (as-is) exceptfor higher heating value measured (dry-basis)
HMV' MCb BLKD` SPE' Length Diameter(Btu/lbm) (%) (lbm/ft0 (lbm/ftA (in.) (in.)
MIN 8637.99 3.40 37.21 75.32 .266 .256
MAX 9284.34 14.40 53.34 83.92 .705 .317
MEAN 8721.26 6.98 41.84 81.26 .464 .287
SDEV 793.65 1.81 11.83 4.04 .174 .078
: HHV = Higher heating valueMC = Moisture Content (wet-basis)
: BLKD = Bulk Densityd : SPD = Specific Density
Some trends are immediately obvious from the data in
Table 16. One can see that bulk density appears more
variable than specific density, in fact the percent standard
deviation ( SDEV/MEAN x 100 ), for specific density is 4.97
whereas for bulk density it is 28.27. The fact that
specific density is so uniform is amazing considering that
each pellet is a different specie and many are made by
different processes. The percent standard deviation for
higher heating value is only 9.10, which shows there is not
a considerable difference in these pellet fuels heating
value.

89
EXPERIMENTAL COMBUSTION OFWOOD BIOMASS PELLETS
INTRODUCTION :
The Department of Mechanical Engineering at Oregon
State University has built a device to burn pelletized
biomass fuels. The device is named the Biomass Combustion
Unit or (BCU) in this report. The BCU was designed to aid
in the thermodynamic analysis of pellet fuel combustion.
This was accomplished by having appropriately placed
flowmeters, pressure gages, thermocouples and a gas analysis
unit with mobile probes. A complete description of the BCU
and accompanying equipment is in the next section titled,
"Experimental Apparatus".
The BCU was used to analyze nine different pellet fuels
under varying conditions of percent excess air (EA%), fuel
flowrate, and percent under fire air (UF%). EA% is the
volumetric quantity (percent) of air above that required for
stoichiometric combustion of the fuel. UF% is the
percentage of the total quantity of air fed to the
combustion chamber that is delivered from below the fuel
pile. For the BCU, the fuel pile was setting on a grate.
The air delivered above the fuel enters the BCU by a
perforated stainless steel tube four inches above the grate.

90
The air delivered this way is called the over fire air (OF).
Note that the percent over fire air (OF%) is simply 100
minus UF%.
are :
Three separate tests were performed with the BCU, they
1) Determine the optimal EA% and UF% for one fuel.
Optimal refers to the most thermodynamically
complete combustion, i.e. combustion that is 100%
efficient by the First Law of Thermodynamics.
2) Test the characteristics and efficiency of multiple
fuels over a range of feed rates and excess air(EA%)
holding UF% constant.
3) Test multiple fuels for the effect of increasing
the under fire air temperature to approximately 300°F.
The following information explains the apparatus,
methodology, and results of using the Biomass Combustion
Unit (BCU) to perform the three experiments as outlined
above.

91
APPARATUS :
There are four figures following this page. Figures 9
and 10 are detailed drawings of the Biomass Combustion Unit
(BCU). Fig. 11, is a schematic of the entire experimental
facility and Fig. 12 is a detailed drawing of the X-Y Table
and gas analysis sensing probes (probes).
Fig. 9, is a cutaway view of the BCU. It shows where
under and over fire air enter below and above the grate
respectively. In the upper-right corner is the feed tube
where wood biomass pellet fuel enters the BCU via a metering
drum ( Appendix E ) and horizontal auger. The fuel then
drops by gravity onto the grate. The "cooling water
feedtube" shown wrapped around the feed system, is there to
prevent overheating of the auger system and pre-combustion
of the pellets. In the upper-left corner of Fig. 9 is the
port where combustion gasses exit the BCU and continue to
other test equipment ( see Fig. 11 ) and eventually are
exhausted to the atmosphere. A detailed drawing of the fuel
hopper and feed system is in Appendix E.
To prevent damage to the stainless steel outer shell of
the BCU and to promote thermal stability, the BCU is lined
with three inches of high temperature ceramic refractory.
Fig. 10, shows this refractory casing in a "stand alone"
fashion.

OVER-FIREAIR
EXHAUST
-.-- COOLING VATER FEED TUBE
FUEL FROMMETERING DRUM
OVER-FIRETUBE
GRATE
92
FEED TUBE / AUGER
STAINLESS STEELCASING
CERAMIC REFRACTORY
UNDER-FIRE AIR
ASH PIT
Figure 9. Cutaway View of the Biomass Combustion Unit( BCU ). Shows Important Components Including : OverFire Air Tube, Under Fire Air Port, Grate, CeramicRefractory, Exhaust Port, and Pellet Fuel FeedMechanism.

93
15.0
REFRACTORY
UNDERFIRE TUBES
1.25 x 6
Figure 10. Scale Drawing (dimensions are in INCHES) ofthe Biomass Combustion Unit ( BCU ), Showing IndividualComponents Including the Cylindrical Refractory Insert.

LEGEND
(I)TEMPERATURE SENSOR
(5 PRESSURE SENSOR
TEMP. L PRESS. SENSOR
"IP GAS ELOV DIRECTION
Tr.. THERMOCOUPLES
AIN EXHAUST
PARTICULATESAMPLING
TRAIN
SipPUMai dif
T,-YPROBEBLE
1i
COMBUSTION GASANALYSIS PROBES
. FUEL HOPPER
l-drifeteitoIke- ast
OPACITY,vu EIREqR
MONITORELKuu
Lrax aBIOMASS
COMBUSTIONUNIT
CONTROL UNITAIR HEATERS
(stop us rtax) na tr. 7131,111311S (TB Alt KATO:
P.C.GAS
ANALYSISUNIT
DATAACQUISITION
UNIT
STEPPERKIM
coma
WATERVARIABLEPWERSUPPLY
AIRDRYER
FROMCOMPRESSOR
Figure 11. Schematic of the Entire ExperimentalFacility. Shows Flows of Inlet Air, Pellet Fuel and
Exhaust Gases. a
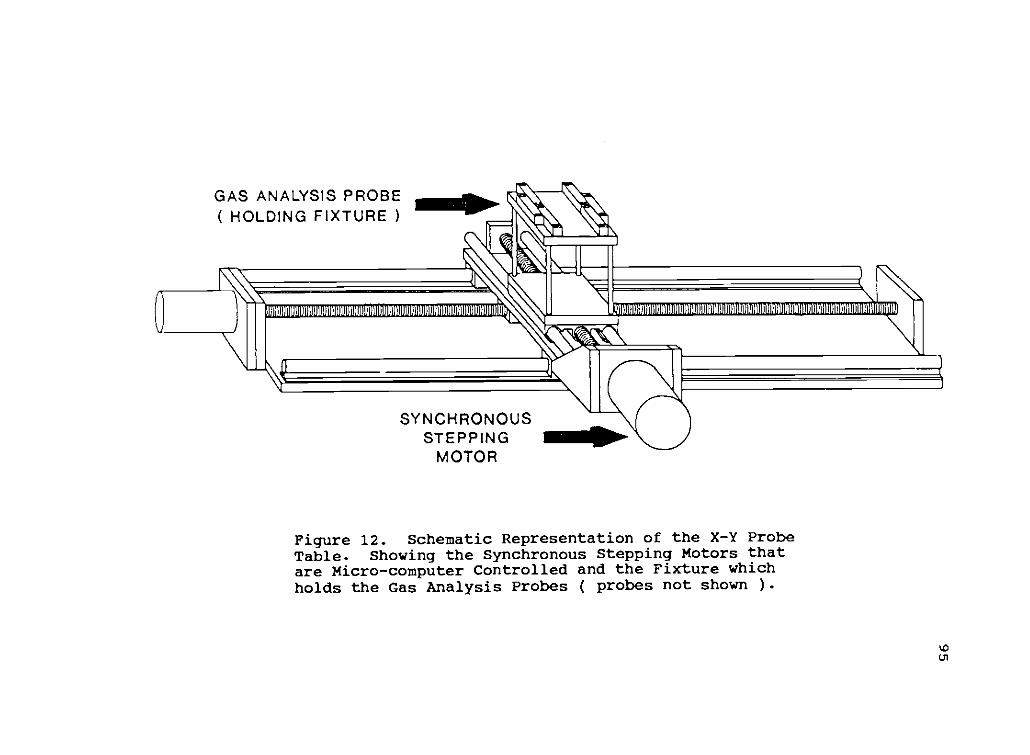
GAS ANALYSIS PROBE( HOLDING FIXTURE )
WOMMMONOPMMUMNOWNWANNOMMUOINk AMOOMMOOMMOOMMMMMMMMMMMMWMMONIONr 77:r 1
SYNCHRONOUSSTEPPING
MOTOR
FigureFigure 12. Schematic Representation of the X-Y ProbeTable. Showing the Synchronous Stepping Motors thatare Micro-computer Controlled and the Fixture whichholds the Gas Analysis Probes ( probes not shown ).

96
At the top of Fig. 10, is the BCU cover plate. This is
very important because there is a rectangular groove cut
through the plate that allows the temperature and gas
analysis probes ( discussed shortly ) to move both
vertically and horizontally within the combustion chamber.
Fig. 11, is an overall schematic of the system.
Following is a description ( by name in quotes as they
appear in Fig. 11 ) of the major components.
AIR FLOW
All combustion air is delivered by an electric
compressor ( not shown ). The air then flows through a
dessicant+cotton-fiber filter ( not shown ) and then into
the "Air Dryer". The air dryer removes moisture and oil
found in the "raw" airstream. It performs this task by
condensation. Removal of moisture helps eliminate another
combustion parameter, i.e. air bound moisture is considered
negligible. Next, the air is metered to various
destinations by four rotometers or "Flowmeters". The
destinations for the air are the following :
1) air heater then to under fire port
2) air heater then to over fire port
3) fuel feed port ( not used in this experiment )
4) cooling port for "opacity Monitor"
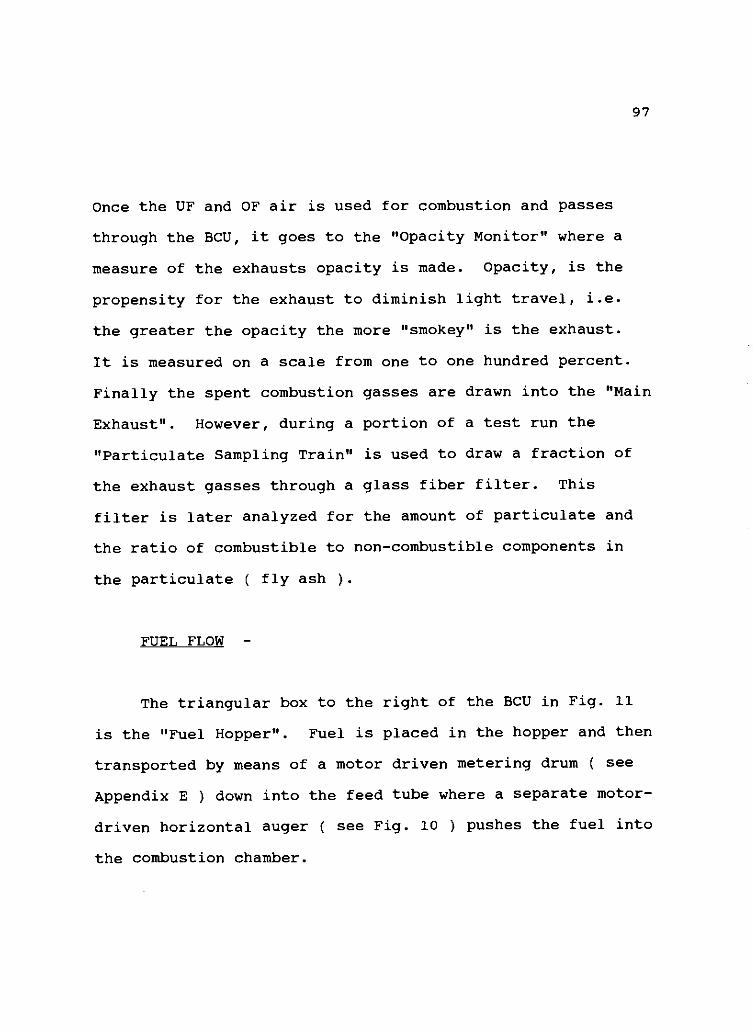
97
Once the OF and OF air is used for combustion and passes
through the BCU, it goes to the "Opacity Monitor" where a
measure of the exhausts opacity is made. Opacity, is the
propensity for the exhaust to diminish light travel, i.e.
the greater the opacity the more "smokey" is the exhaust.
It is measured on a scale from one to one hundred percent.
Finally the spent combustion gasses are drawn into the "Main
Exhaust". However, during a portion of a test run the
"Particulate Sampling Train" is used to draw a fraction of
the exhaust gasses through a glass fiber filter. This
filter is later analyzed for the amount of particulate and
the ratio of combustible to non-combustible components in
the particulate ( fly ash ).
FUEL FLOW -
The triangular box to the right of the BCU in Fig. 11
is the "Fuel Hopper". Fuel is placed in the hopper and then
transported by means of a motor driven metering drum ( see
Appendix E ) down into the feed tube where a separate motor-
driven horizontal auger ( see Fig. 10 ) pushes the fuel into
the combustion chamber.

98
X-Y TABLE AND PROBES -
Above the BCU in Fig. 11 is the X-Y table and gas
analysis probes. The "X-Y Probe Table" consists of computer
controlled stepper motors that turn screw shafts in both the
horizontal and vertical directions. Fig. 12 is a detailed
drawing of the X-Y table and probe attachment arrangement.
The stepper motors allow for extremely accurate probe
placement within the BCU. The movement is accurate to
plus or minus .0005 inches ) in both vertical and horizontal
directions.
The probes are the following :
1) Two ( type-k ) stainless steel clad thermocouples
2) Gas analysis probe
The gas analysis probe is the sampling end of a combustion
gas analysis unit CGAU ( see "Control Unit" ). The CGAU
measures many parameters. The parameters of importance for
this work were :
1) Carbon dioxide
2) Oxygen
3) Carbon monoxide
4) Oxides of nitrogen
5) Sulfur dioxide
6) Combustible hydrocarbons
7) "Real-time" for each sample that was "data-logged"
99
Other sensors provided additional information when
needed. They included, pressure gages, particulate sampling
train, and more type-k thermocouples. See Fig. 11 for
placement of these sensors. Shown schematically in Fig. 11
is the "Control Unit". The heart of this system is a micro-
computer. This computer and some associated data
acquisition hardware are used to gather temperature and gas
composition data from the probes. It also gathers
temperature data from a number of other locations in the
system and gives the commands that move the stepper motors
at the users wish. To recap the Control Units functions,
they are summarized below :
1) Move X-Y Table ( Probe Position ) at users command
2) Sample and store data from as many as ten type-k
thermocouples
3) Sample and store all relevant gas composition data
from the CGAU
To aid the investigation, a Quick-Basic program was written
that combined all three functions listed above. This meant
that most of the data acquisition was automatic and required
no additional work besides setting the initial program

100
parameters such as length of run and sampling rate and
starting the program. Specifically, the only data reported
in this experimental investigation that was not "data-
logged" by the Control Unit was the data from the
"Particulate Sampling Train" ( see Fig. 11 ) and fuel
flowrate.
METHODOLOGY :
The Biomass Combustion Unit (BCU) facility was used to
perform three experiments as stated in the previous
"Introduction". These experiments were performed while
fixing many variables constant and attempting to operate in
a "steady-state" manner. Steady-state implies that no
changes in inlet air or fuel mass flows or properties
occurred and the combustion proceeded with unchanged
characteristics in time. Specifically, the following
variables were held constant for all test runs :
- Under fire air flowrate and temperature
- Over fire air flowrate and temperature
- Approximately atmospheric pressure in the BCU
- Fuel mass flowrate
- The BCU was "warmed-up" ( for at least two hours )
to the approximate operating temperature for all runs
prior to test commencement

101
The following physical/system variables were held constant :
- Temperature and gas analysis probes were positioned
20 inches above the grate for ALL experiments
- Test runs were for either one or one half hour
duration with thirty (30) data points taken equally
spaced in time for all relevant variables'.
- Over fire air tube was placed 4 inches above the
grate.
: Some data, such as that from the Particulate Sampling
Train, was NOT acquired by the computer. It required direct
"human" measurement.

102
EXPERIMENT /1 :
Introduction° This experiment was performed to
determine the "optimal" percentages of under fire air (UF%)
and excess air (EA%) for one pellet specie. The pellet fuel
was code named (1) ( as listed previously ) and found in
Appendix B. "Optimal" denotes the period when the
combustion gasses are highest in measured carbon dioxide
(CO2). When CO, is a maximum, the available carbon in the
fuel is being burned most completely (produces the greatest
liberation of heat). Hydrogen (H,), is the other main
combustible constituent in the wood pellets, but combustion
tests ( all tests found in Appendix D ) indicate very little
combustible hydrocarbons in the measured exhaust. This
proves that "most" H, is burned to water vapor before
reaching the gas analysis probe. Other gas properties will
be analyzed in a more qualitative sense to help support the
findings based on measured CO, percent. Table 17, gives
these other variables.
a : Detailed experimental data for ALL tests performedduring Experiments 11,12, and 13, is found in Appendix D.

103
Table 17. Gas Property Values at Optimal Firing.
Expected Value at OptimalVariable Firing Condition
Temperature Maximum
Carbon Monoxide Minimum
Oxides of Nitrogen Maximum
Particulate (fly ash) Minimum
Combustible (% in fly ash) Minimum
Fig. 13 shows the parameter matrix for Experiment #1.
Inside the blocks are test code numbers, i.e. test 9.2
corresponds to 41.0 UF% and 20.8 EA%.
Methodology - Tests were performed in columns of
blocks with an excess air level chosen and then the five
UF% levels ( chosen as shown ) were randomized in time.
This means, for example, that tests 6.1-6.5 were performed
on the same day but in random UF% order. Due to problems
with the volumetric-type feed system the final EA% for any
column was not the value originally chosen. The
experimental matrix was designed for EAR values of 30%, 40%
and 50%, however the final value varied because of the
slightly variable nature of the fuel feed system. For each
block, 30 data points were collected over one hour.

104
12.6
20.0
UNDERFIRE 30.0AIR
cio
40.0
50.0
EXCESS AIR20.8 41.0 87.2
a9.4 6.4 8.3
9.1 6.2 8.1
9.5 6.3 8.2
9.2 6.5 8.5
9.3 6.1 8.4
Figure 13. Parameter Matrix for Experiment/1.Showing Specified Levels of the Two IndependentVariables, Excess Air Percent ( EA% ) and Under FireAir Percent ( UF% ).
These numbers refer to the specified test numberas listed in Appendix D. Appendix D, contains detailedinformation for all parameters and measured variablesfor Experiment /1, 12 and 13.

105
Fuel Feed Problem During Testing It was planned to
hold the mass flow of pellet (1) constant for all tests.
Tests 8.1-8.5 and 9.1-9.5 have almost identical feed
rates but tests 6.1-6.5 are at a feed rate 15 percent
higher. It will be shown in Experiment #2 that a moderate
change in feed rates is inconsequential compared to the
effects of EA% and UF%.
Preliminary Analysis - Residual plots were checked
for all gas analysis variables ( CO, Temperature, etc. )
and the plots indicated NO time trend. This means that the
Biomass Combustion Unit was operating at steady-state for
all tests ( as assumed ).
QUALITATIVE RESULTS :
Fig. 14 is a plot of six scaled gas parameters versus
UF% at a specified level of EA%. This corresponds to test
blocks 6.1-6.5. The "scaled" variables are the actual
values divided by the largest value in a column, i.e. all
CO, values in a column were divided by the maximum CO2 value
in that column. This yields plots with all the dependent
variables scaled from zero to one which makes qualitative
analysis of trends very easy.
Optimal Firing Point (Qualitative) - At 30 percent
under fire air, Fig. 14, shows that Temperature, CO and
NO, are at maximums, Particulate is near minimum, CO and

106
Combustibles are at true minimums. This corresponds well to
the predicted optimal solution shown in Table 17. At an
excess air level of 41.0 percent and 30 percent under fire
air the combustion of pellet (1) was optimal.

1.30
1.16
1.02 -
0.88
0.74
0.60
0.46
0.32
0.18
0.04
FEEDRATE = 42,246.(Btu/hr) : EXCESS AIR = 41.0 %
-0.10
10 00 14.50 19.00 23.50 28.00 32.50 37.00 41.50 46.00 50.50 55 00
UNDER FIRE AIR ( %)
Figure 14. Gas Parameters for Pellet (1) Scaled
by the Largest Value in the Test Column. The Gas
Parameters are Plotted as a Function of UFO at a Level
of 41.0% Excess Air ( 41.0 EA% ).
0

108
Plots like Fig. 14 were examined for tests 8.1-8.5 and
9.1-9.5, the trends in scaled gas parameters were very
similar. They showed an optimal UF% of near 30 percent.
One major difference occurred at the excess air level of
87.2 percent. At this level all curves were "flat" and
located close to each other around the .8 ( y-axis ) level.
It is hypothesized that this effect is due to the fact that
at very high excess air levels the fuel bed experiences
turbulence and there is no distinguishable "over" or "under"
fire air. This hypothesis is supported by visual
observation. It was observed that only a very thin fuel bed
existed at this EA% level, while at the other two lower
levels there were well developed fuel beds.
QUANTITATIVE RESULTS :
A new variable is defined as the CO3-based efficiency
( CO2EFF ). It is the measured percentage of CO, in the
combustion gases divided by the percentage of CO, calculated
for the complete ( "theoretical" or "stoichiometric" )
combustion of the available fuel. CO2EFF is defined below.
CO2EFF = (COnsaur.d/CO2th.,,reticai) X 100 (16)
It is assumed that the combustion energy losses due to CO
production, Combustibles in fly ash, and Hydrocarbons, is

100.00
95.00-
90.00-
>-
s,2
2 80.00-UJ
7a00-
1-2-) moo-
N 65.00
60.00
CDCD 55.00-
50.00
12 00
I 1 I 1
16.00 20.00 24.00 28.00 32.00 36.00 40.00
PERCENT UNDER FIRE AIR
44.100 48.00
Figure 15. Level Curves of CO3-Based Efficiency as aFunction of Under Fire Air Percent at Different ExcessAir Percents. This is for Tests ( 6.1-6.5 ).
52 00

112
For this model, R2 = 85.68 percent is an indicator of
a fairly strong association between the two independent
variables ( EA% and UF% ) and the dependent variable
( CO2EFF ). Unfortunately, because there is only one
observation at each point there is no error term or variance
for this model. It is assumed that the qualitative evidence
using Figs. 14 and 15 help support the models validity.
Next, Eqn. 17 was differentiated with respect to the
two independent variables and the subsequent equations were
set equal to zero and solved simultaneously. The solution
was a stationary point for the CO2EFF surface and a maximum
by visual observance of Fig. 16. The calculated optimal
firing condition was found to be CO2EFF = 96.22 percent at
EA% = 59.54, and UF% = 35.46. This corresponds fairly well
with the optimal point found by graphical analysis of the
raw data ( Figs. 14 and 15 ) which gave a solution of EA% =
41.0 and UF% = 30.0.

)-(-)
5-*LLLL :0 LU 04Lu 0(f)<--C0
00
1 it
8
60
0
-21
2040
EXCESS AIR(EA%)
611
60160
30
25 UNDER FIREAIR
(U116)
113
60
Figure 16. CO,- -Based Efficiency Surface as a Function
of Excess Air Percent and Under Fire Air Percent. This
Represents a Numerical Approximation of the "True"Functional Relationship and used Fifteen Discrete Datapoints to Fit the Model ( Eqn. 17 ).

114
CONCLUSION :
The optimal firing condition for pellet fuel (1) was
found to be 96.22 percent at an excess air level of 59.54
percent and under fire air level of 35.46 percent. A second
order polynomial equation was fit to the data and produced a
model with R2 = 85.68 percent. This model, Eqn. 17, is
presumed valid for efficiency prediction over at least the
range of the two independent variables despite the fact that
no error term is available.

115
EXPERIMENT 12 :
Introduction - This experiment was performed to
investigate how different wood fuel pellets would perform
during combustion with identical input values of fuel feed
rate (FFR), excess air percent (EA%), and under fire air
percent (UF%). The original plan was to perform the tests
at "exactly" the same feed rate ( mass basis ), and levels
of excess and under fire air percents. However, due to the
fuel feed variability ( mentioned in Exp. #1 ) it was not
possible to hold FFR or EA% constant. Fortunately the UF%
was held constant at 30 percent, and the variability in FFR
and EA% was only 10.2 and 27.4 percent respectively.
Methodology Unlike Exp. #1, each test was for one
half hour. 30 equally spaced gas analysis data points were
taken as before. All but one test was performed on the same
day on fuels coded (2) - (9) and corresponding to test codes
11.1 11.8 respectively. Test 6.3 from Exp. #1 was
included in the set because it was performed at UF% = 30 and
similar FFR and EA%. Test 6.3 also corresponded to the most
optimal point from Exp. #1. The order of fuel pellet firing
was randomized to negate any time series effects. As
mentioned above the FFR and EA% levels were preset to be the
same for all tests but there was variability between tests.
The FFR and EA% during any one test was still controlled
very precisely. This variability in FFR is completely

116
attributable to the difference in feed characteristics
between fuels, however, no attempt was made to correlate
whether this was due to dimensional, density, or other
related pellet physical variables.
Data - The easiest way to compare the performance of
each fuel was to tabulate minimum (MIN), maximum (MAX),
mean, and percent standard deviation (%SDEV) data in tabular
form. Table 18, shows the fuel code and associated test
number along with the input parameters of FFR and EA%.
Remember that UF% was held constant at 30.0. This data
shows that the FFR varied by only 10.2 percent whereas the
EA% varied by 27.4 percent. It is also true that the range
of EA% is within the "starved" or low EA% level ( 20.8% )
and "turbulent" or high EA% level as found in Exp. #1.
Table 19, contains various combustion gas data for
Exp. #2. Figures 17 and 18 are plots of gas temperature and
carbon dioxide-based efficiency versus pellet fuel code.
RESULTS
Table 19, shows that the gas temperature only varied
by 5.2 percent and similarly the CO2-based efficiency varied
by only 5.4 percent. This proves that despite the
difference in ash content, moisture content, elemental,
proximate, and ash fusion analyses, these fuels burn with
very similar properties under similar input conditions.

117
The carbon monoxide levels show a 41.6 percent deviation,
but that is reduced to 33 percent if the far outlier ( 4.1%
CO ) is not considered.
Table 18. Fixed Parameters and Coding for Experiment#2.
CODE TEST # FFR EA%(Btu/hr) (%)
1 6.3 42246.5 41.0
5 11.1 42158.4 29.2
2 11.2 35208.1 50.4
6 11.3 40735.1 33.1
7 11.4 33798.3 52.4
4 11.5 40469.6 28.7
3 11.6 34912.2 52.3
8 11.7 37437.8 47.0
9 11.8 31019.2 68.2
MIN : 31019.2
MAX : 42246.5
MEAN : 37553.9
%SDEW: 10.2
29.2
68.2
44.7
27.4
a : %SDEV = (standard deviation/mean) x 100 ; Thisis used because it is a more meaningful measure of thevariance for comparing different variables.

118
Table 19. Combustion Gas Data for Experiment #2.
GASTEMP.(*F)
CO2EFF(%)
CO(ppm)
PARTICULATE COMBUSTIBLENO, (fly ash) (fly ash)(ppm) (grs./dscf) (%)
MIN : 1337.5 75.9 4.1 79.4 .029 .98
MAX : 1576.8 92.2 188.2 215.0 .705 89.6
MEAN : 1420.1 82.1 125.7 154.4 .204 16.3
%SDEV: 5.2 5.4 41.6 27.2 123.3 166.8
The particulate ( fly ash) data is highly skewed by
pellets coded (4), (8), and (9), which had values of
particulate in the tenth's range while all other pellets had
values in the hundredth's ( see Appendix D ). Opacity was
measured for all experiments but was not reported because it
was zero for all runs except tests 11.8 and 12.5, which
correspond to pellet (8) which has the highest salt content.
The salt content is determined by the percent chlorine by
ultimate analysis. This result is reasonable because
pellets (8) and (9) had the highest ash and chlorine
contents of all pellets. Pellet (8) had; ash = 2.55%, Cl =
.78% , pellet (9) had; ash = 2.43%, Cl = .19%. Pellet (4)
had a moderately high ash content of .96 percent and no

119
chlorine, but its specie is Hemlock Fir which is noted in
the forest products industry for burning with high opacity
and particulate.
The NOx data ranges from 79.4 to 215.0 parts per
million with %SDEV equal to 27.2. It is apparent that the
gas analysis probe variables ( CO and NOx, measured in
parts per million ) display more variability than those
parameters measured in percent (see Appendix D for detail).
Overall, the data on particulate and combustibles in fly ash
has the largest spread. This may be due to the fact that
these quantities were sampled for only 15 minutes for each
test, and had a greater margin for human error than the
"data-logged" variables.

1650.00
1605.00
1560.00
uc:731515.00
S70.00
425.00
(HA380.00
c--1335.00
m1290.001290.0001245.00
1200.00
0.00 1.00 2.00 3.00 4.00 5.00 6.00
PELLET CODE
7.00 8.00 9.00
Figure 17. Plot of Combustion Gas Temperature VersusPellet Fuel Code for Multiple Feed Rates and Excess Air
Percents. ( Experiment #2 ).
10 00
1-N.)0
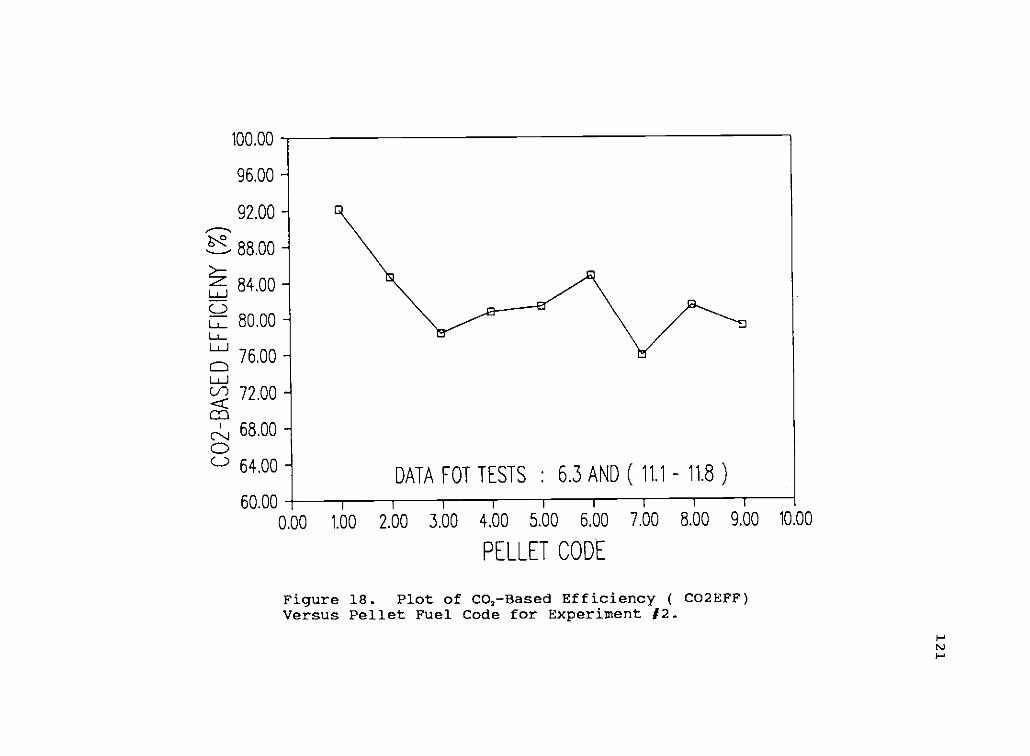
100.00
96.00
92.00
--R°- 88.00
84.00
E380.00
uj 76.00
UJ(I) 72.00<topc.',1 68.00
0c) 64.00
60.00
0.00 1.00
DATA FOT TESTS : 6.3 AND ( 11.1 11.8 )
2.00 3.00 4.00 5.00 6.00
PELLET CODE
7.00 8.00 9.00
Figure 18. Plot of CO, -Based Efficiency ( CO2EFF)Versus Pellet Fuel Code for Experiment /2.
10 00
NJ1-1
122
Result of Feed Rate on CO2EFF - It was mentioned in
Exp. #1 that fuel feed rate has little effect on the CO,-
based combustion efficiency (CO2EFF), at least over the
ranges experienced during these tests. To support this
hypothesis the data in Exp. #2 was examined.
Fig. 19, shows CO2EFF as a function of FFR (Btu/hr). A
linear regression was performed that showed the slope (bl)
was very small ( bl = 4.87E-4). The slope represents the
unit change in CO2EFF expected for a unit change in FFR. If
a test of the null hypothesis that bl equals zero is not
disproved, then this is good evidence that there is no
relationship between FFR and CO2EFF. This assumes that the
linear model is appropriate and by observation of the data
that appears as the best choice, i.e. the data appears to
have no curvature. The probability value (p) was found to
be ( p = .403 ) which is very strong evidence for the null
hypothesis that bl equals zero. This implies NO association
between feed rate and efficiency.
OBSERVATIONAL DATA :
The most striking observation made was that after tests
11.8 and 11.9 there was visible ash in the grate after
"cool-down". For all prior tests, no matter how long the
test sequence, there was never any visibly remaining ash
besides a "few specks". There was also fine crystalline
123
matter deposited on metal surfaces in the BCU combustion
chamber. These surfaces were the gas analysis probes at mid
to upper height and the cooling water feed tube. Both of
these surfaces were relatively "cool" compared to the rest
of the chamber and thus acted as condensing surfaces. Most
dramatically, there was evidence of corrosion ( pitting of
stainless steel surfaces ! ) after less than one hour of
burning these fuels that were high in ash and salt content.
The first and only clinker formations were also experienced
after cleaning the grate.

100.00
96.00
92.00
C.:. 88.00
84.00
c) 80.00L'J.' 76.00CLuccit,2 72.000P
CD68.00
C)64.00
60.00
0
SLOPE (bl) = .00048870 0
0
0
1
30000 31300 32600 33900 35200 36500 37800 39100
FUEL FEEDRATE (Btu/hr)
40400 41700
Figure 19. Plot and Linear Regression Line for CarbonDioxide Based Efficiency ( CO2EFF ) Versus Fuel FeedRate ( FFR ) for Experiment 12.
43000
Ni
125
CONCLUSIONS :
(1) Results show that two very important measures of
combustion efficiency ( gas temperature and carbon dioxide
based efficiency ) varied by only 5.2 and 5.4 percent
respectively. This proves that all nine different wood fuel
pellet types behave very similarly under the prescribed
( similar ) range of operating parameters. The overall mean
efficiency for all tests was 82.1 percent and the overall
mean temperature was 1420.1 deg.F.
(2) Particulate ( fly ash ) and Combustible ( in fly
ash ) data showed the greatest variability. There was
evidence of a relationship between maximum values for both
particulate and combustible and the percentages of ash and
chlorine in the pellet fuel. The greater the percentage of
ash and chlorine ( salt ), the greater was the fly ash
problem, also, combustion efficiency was decreased by
combustible losses ( unburned hydrocarbons ) in the fly ash.
(3) Carbon monoxide and Oxides of Nitrogen showed the
next greatest variability, but neither had data values
greater than 215.0 parts per million ( 215.0 ppm is a very
small quantity, i.e. 1 ppm = .001 grams/liter = 6.2E-5
lbm/ft3 )

126
(4) Visual evidence indicates that pellet fuels coded
(8) and (9) are highly corrosive, produce the largest
quantities of ash, and form the only slag or clinker
formations of all nine fuels. The corrosion is directly
attributable to salt content ( or more specifically,
chloride ions and compounds formed during combustion ).
127
EXPERIMENT 13
Introduction - This experiment was performed to
investigate the effect of increased under fire air
temperature on combustion efficiency. Tests ( "hot-tests" )
were completed on five pellet species coded (1), (2), (4),
(8), and (9). The results of a hot test were compared to
the previous results of a "cold-test" on the same pellet.
Similar to Experiments #1 and #2, there was undesired
variability in the fuel feed rate. The original
experimental plan was to have each pellet fed to the Biomass
Combustion Unit at the same rate ( mass basis ) as the
respective cold-test. The mean difference of cold-test
minus hot-test fuel feed rate was -6611.4 (Btu/hr), or a
decrease of 16.1 percent from the mean hot-test feed rate.
The following analysis assumes that the fuel feed rate
variability is inconsequential compared to the effect of the
heated under fire air.
Methodology - Test methods were identical to
Experiment #2, except that the under fire air temperature
was increased to a mean of 306.4xF. This represents a mean
temperature rise of 230xF above the cold-test temperature,
with a standard deviation of only .18 percent.
The five pellet samples ( codes ) were chosen randomly
except for pellets (8) and (9). These pellets were chosen
because they were the worst fuels in terms of ash and

128
corrosion problems as observed in Exp. #2 and it was desired
to observe them under other operating conditions. All hot-
tests were accomplished in one day and the test ORDER was
randomized to ease time series effects.
Table 20, shows the cold versus hot-test match-ups with
the corresponding pellet code number. See Appendices C and
D, for detailed pellet and combustion test data.
Table 20. Hot and Cold Under Fire Air Test Matrix.
Pellet COLD-TESTS HOT-TESTSCode Test No. Test No.
(1) 12.1 12.2
(2) 11.5 12.3
(4) 11.2 12.4
(8) 11.7 12.5
(9) 11.8 12.6

129
RESULTS :
Table 21, shows the results of the hot under fire air
tests versus the cold under fire air tests.
"GTEMP" is the combustion gas temperature and CO2EFF is the
CO2 -based efficiency as for Experiments #1 and #2.
Table 21. Combustion gas temperature and CO3--basedefficiency data for cold and hot under fire air tests.
PelletCode
COLD-TESTGTEMP(°F) CO2EFF(t)
HOT-TESTGTEMPCF) CO2EFF(t)
(1) 1247.63 96.37 1280.43 93.04
(2) 1354.29 84.67 1485.24 74.66
(4) 1482.34 80.80 1469.99 88.73
(8) 1448.46 81.46 1598.78 95.98
(9) 1348.10 79.24 1483.39 103.90°
MEAN = 1409.60 85.79 1457.00 91.26
SDEV 106.33 6.34 128.1 9.67
° : Theoretically this value cannot be greater than 100%,
but this more extreme value ( 103.90 ) is due to randomexperimental error. The combustion can be considered to benear 100 percent efficient based on measured CO,.
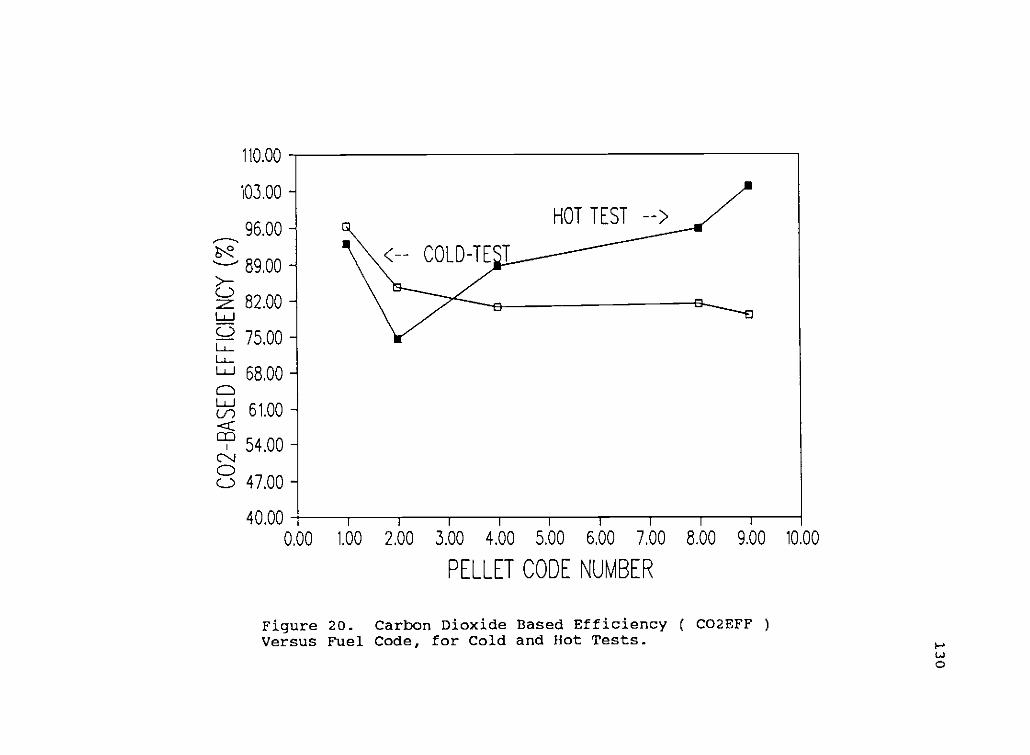
110.00
103.00
96.00
`'89.00-
z 82.00wLy- 75.00LU1-L-1 68.000LLJcn 61.00-cc
clip 54 00cN,
c._.) 47.00
40.00
0.00 1.00 2.00 3.00 4.00 5.00 6.00 7.00
PELLET CODE NUMBER
8.00 9.00
Figure 20. Carbon Dioxide Based Efficiency ( CO2EFF )
Versus Fuel Code, for Cold and Hot Tests.
10.00
O

131
The graphical evidence in Fig. 20, appears to show that
the hot-tests increase efficiency by a fair margin. This
cannot be substantiated by statistical analysis, as will be
shown next.
ANALYSIS :
The "Paired t-Test" was used to compare the values of
gas temperature and CO2-based efficiency for hot and cold
tests. This statistical procedure is useful for data that
is paired in some fashion ( in this case the data is paired
by pellet code ). The paired t-test procedure helps
eliminate many types of statistical dependence between
paired data sets. This test assumes that the differences
are Normally distributed and the samples are randomly
generated.
Confidence intervals were computed at the 95 percent
confidence level. The null hypothesis was that the mean
difference of GTEMP or CO2EFF for the hot-test minus the
cold-test was zero. The alternative hypothesis was that
these mean differences were greater than zero. The
alternative hypothesis ( if true ) would show that increased
under fire air temperature does increase the GTEMP and
CO2EFF.

132
let, DTEMP = hot-test GTEMP - cold-test GTEMP (18)
and, DCO2EFF = hot-test CO2EFF - cold-test CO2EFF (19)
The 95 % Confidence Interval for DTEMP :
18.24 5 DTEMP 5 156.56 ('F) (20)
The 95 % Confidence Interval for DCO2EFF :
-6.41 5 DCO2EFF 5 19.91 (%) (21)
Eqn. 20, shows that the 95 percent confidence interval
for DTEMP does not contain zero ( all values are positive
in the interval ). This is strong evidence for the
alternative hypothesis that mean gas temperature was
increased with increased under fire air temperature.
Eqn. 21, shows the 95 percent confidence interval for
the difference in efficiencies does contain zero. This is
strong evidence that CO2-based efficiency was NOT increased
by a statistically significant amount ( 95% level ).
133
CONCLUSION :
Increasing the under fire air temperature by 230 °F on
average did not increase the combustion efficiency (CO2EFF)
by a statisticly significant amount (95% confidence level).
Increasing the under fire air temperature did however
increase the combustion gas temperature by 87.4 °F on
average, with 95 percent confidence that the mean difference
was greater than zero. This average increase in GTEMP is
only 6.2 percent larger than the mean cold-test GTEMP.
It was expected that increasing the under fire air
temperature by 230 °F on average would have a greater impact
on the combustion efficiency, i.e. greater increases in
GTEMP and CO2EFF. Experiment #3, demonstrates that the
effort of pre-heating the under fire air had negligible
effect on the overall combustion efficiency. Many hogged-
fuel boilers operate with preheated air, indeed it is
necessary, because of the fuels high moisture content. Some
furnaces require as much as 200 percent excess (preheated)
air. They find that this is necessary to sustain combustion
of "wet" fuel. Note that for these experiments the pellets
were "virtually" dry ( 15% moisture or less, Appendix C ).
The particulate ( fly ash ), combustible (in fly ash),
NO and other data was not analyzed because it did not
present much variability from cold to hot tests ( see
Appendix D ).

134
BIBLIOGRAPHY
1) Atili, B., Cueto, H., and Daugherty, K., "DeterminingAcid Gasses, Trace Metals, and Organics from Cofiring Blendsof Coal and Densified Refuse-Derived Fuel(dRDF)," DraftDocument submitted to : Argonne National Laboratory, by,North Texas State University, Contract No. 33071401, October31, 1987.
2) Bench-Scale Combustion Characterization of CleanedKentucky No. 9 Coals, Report No. CS-5070, Research Project2425-4, Electric Power Research Institute, Palo Alto, CA,Feb., 1987.
3) Browne, F.L., "Theories of the Combustion of Wood andits Control," Report 2136, U.S.D.A. Forest ProductsLaboratory, Madison. WI, Dec., 1958.
4) Dadkhah-Nikoo, A., "Analysis of Wood Combustion andCombustion Systems for a Combined Cycle Wood-Fired PowerPlant," Masters Thesis, Dept. of Mechanical Engineering,Oregon State Univ., Aug., 1985.
5) Dadkhah-Nikoo, A., and, Bushnell, D.J., "Analysis ofWood Combustion Based on the First and Second Laws ofThermo-dynamics," Journal of Energy Resources Technoloav,Vol.109, Sept., 1987, pp.129-141.
6) DeAngelis, D.G., Ruffin, D.S., Peters, J.A., and,Reznick, R.B., "Source Assessment : Residential Combustionof Wood," Report No. 68-02-1874. Task No.23, EnvironmentalProtection Agency, EPA-600/2-80-0426, March, 1980.
7) Domalski, E.S., Jobe, T.L.Jr., and, Milne, T.A.,"Thermodynamic Data for Biomass Conversion and WasteIncineration," Report No. SERI/SP-271-2839, Solar EnergyResearch Institute, Golden, CO, Sept. 1986.

135
8) Easterling, J.C., Keenan, D.J., Brenchley, D.L., and,Russell, J.A., "Identifying the Barriers toCommercialization of Low-Btu Gasifiers: Proceedings ofa Workshop," Proceedings, Low-Btu Gasifier Workshop,Southeast Industrial Biomass Conference, U.S. Departmentof Energy, Pacific Northwest Laboratory, BattelleMemorial Institute, CONF-8411156, April, 1985.
9) Evaluation of Biomass Systems for ElectricityGeneration, Report No. EPRI AP-2265, Project 1348-7,Electric Power Research Institute, Palo Alto, CA, Feb.,1982.
10) Fiber Fuels Institute, "Biomass Fuels StandardSpecifications Development Final Report," , Duluth, MN,1988, Department of Energy, Contract No. DE-FG05-830R21390.
11) Glassman, I., "Environmental CombustionConsiderations," Combustion, 2nd.ed., Academic Press, Inc.,Orlando, FL,1987, pp.318-385.
12) GuidelinesUtility BoilersVol.1, ResearchInstitute, Palo
for Cofirina Refuse-Derived Fuel in Electric( Volume 1: Executive Summary ), CS-5754,Project 1861-1, Electric Power ResearchAlto, CA, June, 1988.
13) Guidelines for Cofiring Refuse-Derived Fuel in ElectricUtility Boilers ( Volume 3: Appendixes 1, CS-5754, Vol.3, Research Project 1861-1, Electric Power ResearchInstitute, Palo Alto, CA, June, 1988.
14) Huff, E.R., "Effect of Size, Shape, Density, Moisture,and Furnace Wall Temperature on Burning Times of WoodPieces," Fundamentals of Thermochemical Biomass Conversion,Elsevier Applied Science Publishers, New York, NY, 1982,pp.761-766.
15) Junge, D.C., "Boilers Fired with Wood and BarkResidue," Research Bulletin 17, Forest Research Laboratory,Oregon State Univ., Corvallis, OR., 1975.

136
16) Junge, D.J., "The Combustion Characteristics ofPelletized Douglas Fir Bark," Report No. 12, U.S.Department of Energy, Contract No. EY-76-C-06-2227, TaskAgreement No. 22, Sept, 1979.
17) Kanury, A.M., "Mass Regression in the Pyrolysis of PineWood Macrocylinders in a Nitrogen Atmosphere - AnExperimental Study," Combustion Science and Technology,Vol.9, 1974, pp.31-36.
18) Kanury, A.M., "Thermal Decomposition Kinetics of WoodPyrolysis," Combustion and Flame, Vol.18, 1972, pp.75-83.
19) Kanury, A.M., "Rate of Burning of Wood," CombustionScience and Technology, Vol.5, 1972, pp.135-146.
20) Kerekes, Z.E., Bryers, R.W., and, Sauer, A.R., "TheInfluence of Heavy Metals Pb and Zn on Corrosion andDeposits in Refuse-Fired Steam Generators," Proceedingsof the International Conference on Ash Deposits andCorrosion from Impurities in Combustion Gasses, NewEngland College, Henniker, NH, American Society ofMechanical Engineers, June,26-July,1, 1977, pp.455-471.
21) Levie, B., Diebold, P., and, West, R., "Pyrolysis andCombustion of Refuse Derived Fuel," Solar Energy ResearchInstitute, Golden, CO, 1988.
22) Levi, M.P., and, O'Grady, M.J., "Decisionmaker's Guideto Wood Fuel for Small Industrial Energy Users," Departmentof Energy. Contract No. EG-77-C-01-4042, Solar EnergyResearch Institute, Golden, CO, Feb., 1980.
23) Martin, W., and, Koenigshofer, D.R., "Development andTesting of a Small Wood Combustion System," Fuels fromBiomass and Wastes, Eds. Klass D.L., and Emert, G.H., AnnArbor Science Publishers, Ann Arbor, Michigan, 1981, pp.567-581.
24) Ogelsby, H.S., and, Blouser, R.O., "Information on theSulfur Content of Bark and its Contribution to SO, Emissionswhen Burned as Fuel," Paper 79-6.2, Presented at the 72ndAnnual Meeting of the Air Pollution Control Association,Cincinnati, Ohio, June 24-29, 1979.
137
25) Pacific Northwest and Alaska Bioeneray ProgramGlossary, U.S. Department of Energy, Bonneville PowerAdministration, Portland, OR, March, 1986.
26) Proceedings : Municipal Solid Waste as a Utility Fuel,"Proceedings, Madison, WI, Nov. 1986, Report No. CS-4900-SR,Electric Power Research Institute, Palo Alto, CA.
27) Roberts, A.F., "A Review of Kinetics Data for thePyrolysis of Wood and Related Substances," Combustion andFlame, Vol. 14, 1970, pp.261-270.
28) Sampson, G.R., Richmond, A.P., Brewster, G.A., and,Gasbarro, A.F., "Potential for Co-firing Wood Chips withCoal in Interior Alaska," Bonneville Power AdministrationReport No. DE-AI79-84BP17610, Pacific Northwest ResearchStation(USDA Forest Service), Portland, OR, July, 1987.
29) Shafizadeh, F., "Fuels from Wood Waste," Anderson,L.L., and, Tillman, D.A. Eds., Academic Press, Inc., 1977.
30) Simmons, W.W., and, Ragland, K.W., "Single ParticleCombustion Analysis of Wood," Fundamentals of Thermo-Chemical Biomass Conversion, Elsevier Applied SciencePublishers, New York, 1982, pp.777-792.
31) Simmons, W.W., and, Ragland, K.W., "Burning Rate ofMillimeter Sized Wood Particles in a Furnace," CombustionScience and Technology, Vol. 46, 1986, pp.1-15.
32) Singer, J.G., ed., Combustion. Fossil Power Systems,3rd., ed., Combustion Engineering, Inc., Windsor, CT, 1981.
33) Smith, W.R., "Wood Fuel Preparation," Progress inBiomass Conversion, Vol.2, Academic Press, Inc., 1980,pp.181-211.
34) Sonntag, R.E., and, Van Wylen, G., "ChemicalReactions," Tntroduction to Thermodynamics, Classical andStatistical, 2nd. ed., John Wiley and Sons, New York, 1982,pp.449-500.

138
35) Stafford, J.L., "Drying Bagasse Using Boiler Flue Gas,"Conference : Hawaiian Sugar Technologists Conference,Honolulu, Hawaii, Nov. 1975.
36) Standard for Densified Wood Pellet Fuel for ResidentialUse, Standard No. APFI-PF-1-88, Association of Pellet FuelIndustries, Sparks, NV, May, 1988.
371 Technology Assessment : Municipal Solid Waste as aUtility Fuel, Report No. EPRI CS-2409, Project 1255-3,Electric Power Research Institute, Palo Alto, CA, May, 1982.
38) Tillman, D.A., and, Anderson, L.L., "Computer Modellingof Wood Combustion with Emphasis on Adiabatic FlameTemperature," Journal of Apnlied Polymer Science :
Applied Polymer Symposium 37, John Wiley and Sons, 1983,pp.761-775.
39) Tuttle, K.L., and Junge, D.C., "Combustion Mechanismsin Wood Fired Boilers," Reprint Series No. 123, EngineeringExperiment Station, Oregon State University, July, 1978.
40) Tuttle, K.L., "Combustion Mechanisms in Wood FiredBoilers," Ph.d Thesis, Dept. of Mechanical Engineering,Oregon State Univ., Corvallis, OR, June, 1978.
41) Vaughan, D.A., Krause, H.H., and, Boyd, W.K., "ChlorideCorrosion and its Inhibition in Refuse Firing,"Proceedings of the International Conference on AshDeposits and Corrosion from Impurities in CombustionGasses, New England College, Henniker, NH, AmericanSociety of Mechanical Engineers, June,26-July,l, 1977,pp. 473-493.
42) Westphal, J.A., "Dehydration, Heat Recovery andDensification of Fuel for Direct Combustion," presentedto : North American Sawmill and Panel Clinic Wood EnergyWorkshop, Portland, OR, March, 1980.
43) Wilson, P.L., Funck, J.W., and, Avery, R.B., "FuelwoodCharacteristics of Northwestern Conifers and Hardwoods,"Research Bulletin 60, Forest Research Laboratory, Collegeof Forestry, Oregon State University, Sept., 1987.

APPENDICES

139
APPENDIX A
NOM

140
NOMENCLATURE
%MCth = moisture content ( dry-basis ) (dim.)
%MCm = moisture content ( wet-basis ) (dim.)
%SDEV = percent standard deviation (std. dev./mean )x100
BCU = biomass combustion unit
BLKD = pellet bulk density (lbm/ft3)
CGAU = combustion gas analysis unit
CO2EFF = carbon dioxide-based combustion efficiency (%)
D, = bulk density (lbm/ft3)
DCO2EFF= combustion gas efficiency difference (%)
DTEMP = combustion gas temperature difference (9F)
EA% = excess air percent (%)
FFR = pellet fuel feed rate (Btu/hr) or (lbm/hr)
GTEMP = combustion gas temperature (9F)
= specific energy needed to break adsorption bonds(Btu/lbm)
hth = enthalpy of evaporation for water (Btu/lbm)
HHV = higher heating value (Btu/lbm)
LHV = lower heating value (Btu/lbm)
LHV2 = lower heating value two (Btu/lbm)
MSW = municipal solid waste
OF% = over fire air percent ( %)
Qt. = rate of energy to vaporize free and bound water(Btu/hr)
QH2 = heat loss rate due to vaporization of fuel boundhydrogen (Btu/hr)

Qtot = total rate of energy to vaporize fuel boundmoisture and moisture from combustion of fuelhydrogen (Btu/hr)
141
heat content per unit volume of fuel (Btu/ft')
RDF = refuse (MSW) derived fuel
SPD = pellet specific density (lbm/fts)
UF% = under fire air percent (%)
v, = specific volume of water, fluid state (ft' /lbm)
vg = specific volume of water, liquid state (ft3/1bm)

142
APPENDIX B
PELLET CODES

143
PELLET SAMPLE CODING
The following dual code scheme is listed so that this
document may be used as a reference in conjunction with
other work being done at OSU on the same biomass pellet
project. The codes on the left were used by the researchers
for all phases of the work ( this thesis does not cover All
work performed during the biomass fuel characterization
project ). For this thesis, the coding titled "THESIS
Codes" in Table 22 on the next page will be used.

144
Table 22. Pellet Sample Coding Used in this Thesis
and for Other Work Performed at OSU.
OSU Code Name THESIS Code
BCCPP824-1AB. 1
FHLDF624-1AB 2
FHLDF624-2AB 3
PHCHF706-2AB 4
EVCMX713-1AB 5
WSPCD715-1AB 6
KMPMX727-2AB 7
SPCDF727-1AB 8
WFPMX920-1AB 9
PHCMX706-1 10
HSIMX824-1 11
BTPMX920-1 12
WDMMX920-1 13
RMMMX920-1 14
=> Pellets were analyzed for Proximate and UltimateAnalysis.
B => Pellets were burned for the experimental dataanalyzed in this thesis.
If an "A" or "B" is not present, this means that thepellets were anlayzed for a subset of the variablesincluded in this report excluding ultimate andproximate analysis and experimental burning.
145
APPENDIX C
PELLET FUEL DATA

146
PELLET SAMPLE DATA
Pellet Code : 1
Pellet Species : Ponderosa Pine ( wood only )
Location of Raw Material : Lower "Pan Handle" Idaho
Grade : Commercial Pellet
ULTIMATE ANALYSIS
( dry weight basis )
% Carbon = 51.20 % Hydrogen = 6.35
% Oxygen = 41.97 % Nitrogen = .25
% Sulphur = .01 % Chlorine = .01
% Ash = .22
PROXIMATE ANALYSIS
( dry weight basis )
% Fixed carbon = 16.63 % Volatile = 83.15
% Ash = same as in ultimate analysis
ASH FUSION DATA
Initial = 2450.00 (deg.F)
H/W = 2470.00 (deg.F)
1/2-H/W = 2480.00 (deg.F)
Fluid = 2510.00 (deg.F)
Note : There is more data on the next page for this pellet.
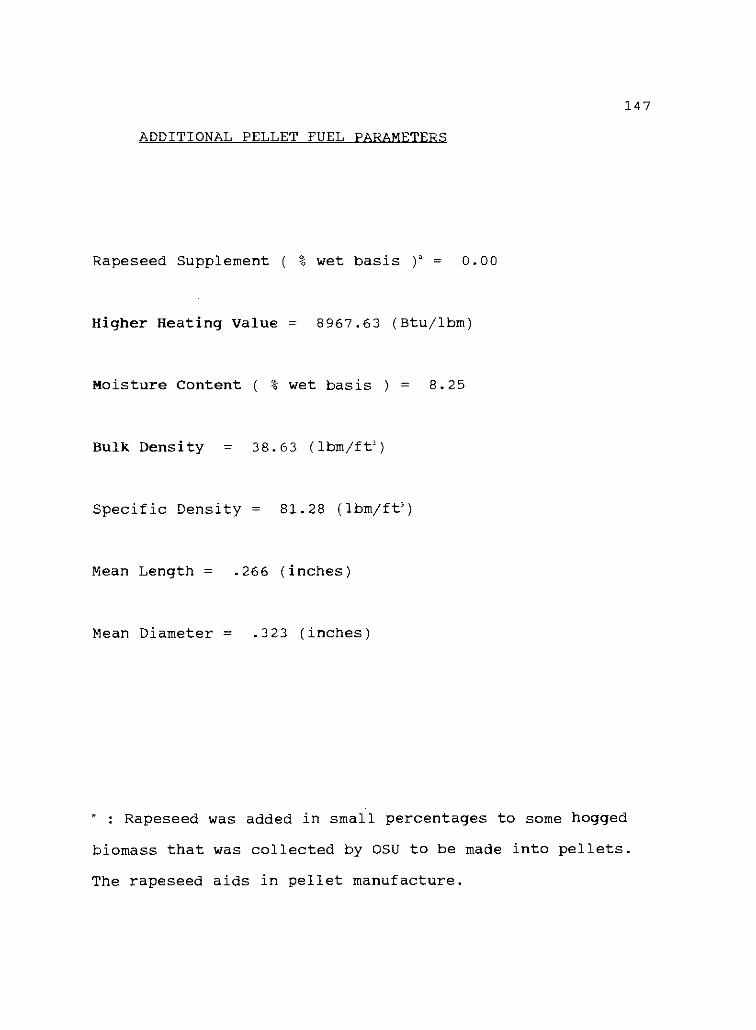
147
ADDITIONAL PELLET FUEL PARAMETERS
Rapeseed Supplement ( % wet basis )' = 0.00
Higher Heating Value = 8967.63 (Btu/lbm)
Moisture Content ( % wet basis ) = 8.25
Bulk Density = 38.63 (lbm /f t3)
Specific Density = 81.28 (lbm/ft')
Mean Length = .266 (inches)
Mean Diameter = .323 (inches)
° : Rapeseed was added in small percentages to some hogged
biomass that was collected by OSU to be made into pellets.
The rapeseed aids in pellet manufacture.

148
PELLET SAMPLE DATA
Pellet Code : 2
Pellet Species : Douglas Fir ( wood + bark )
Location of Raw Material : Central Western Oregon
Grade : Non-Commercial ( made for OSU )
ULTIMATE ANALYSIS
( dry weight basis )
% Carbon = 50.82
% Oxygen = 42.54
% Sulphur = .02
% Ash = .21
PROXIMATE ANALYSIS
( dry weight basis )
% Hydrogen = 6.35
% Nitrogen = .06
% Chlorine = 0.00
% Fixed carbon = 15.66 % Volatile = 84.13
% Ash = same as in ultimate analysis
ASH FUSION DATA
Initial = 2510.00 (sF)
H/W = unay. (SF)
1/2-H/W = unay. (`F)
Fluid = 2540.00 CF)
Note : There is more data on the next page for this pellet.
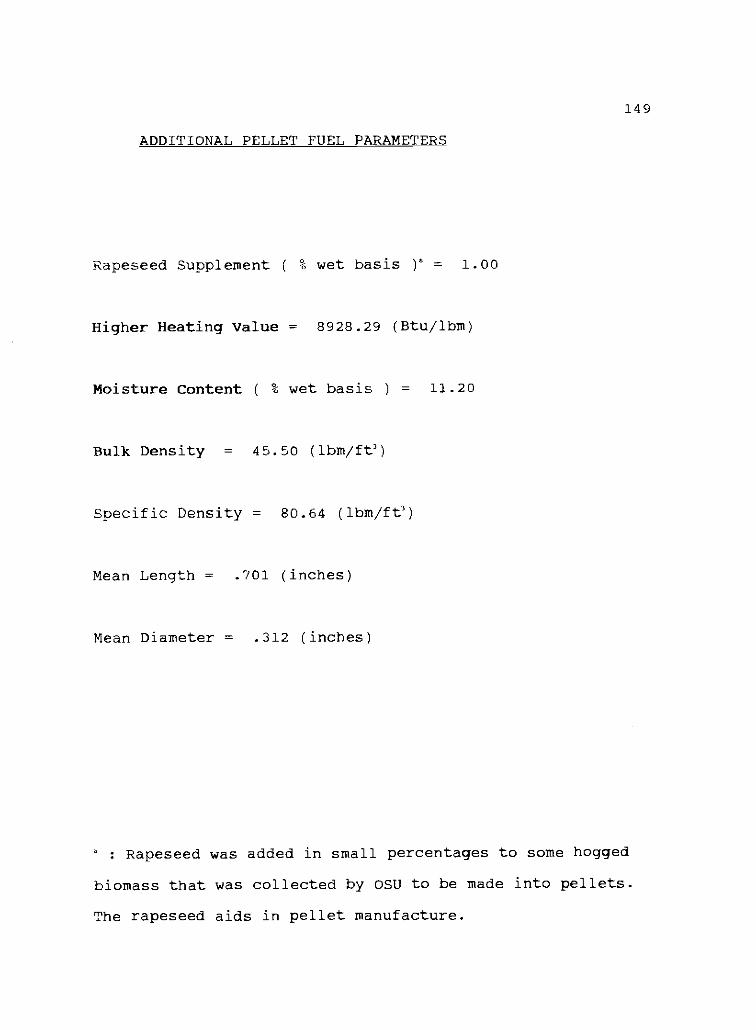
149
ADDITIONAL PELLET FUEL PARAMETERS
Rapeseed Supplement ( % wet basis )" = 1.00
Higher Heating Value = 8928.29 (Btu/lbm)
Moisture Content ( % wet basis ) = 11.20
Bulk Density = 45.50 (lbm/ft3)
Specific Density = 80.64 (lbm/ft3)
Mean Length = .701 (inches)
Mean Diameter = .312 (inches)
: Rapeseed was added in small percentages to some hogged
biomass that was collected by OSU to be made into pellets.
The rapeseed aids in pellet manufacture.

150
PELLET SAMPLE DATA
Pellet Code : 3
Pellet Species : Douglas Fir ( wood + bark )
Location of Raw Material : Central Western Oregon
Grade : Non-Commercial ( made for OSU )
ULTIMATE ANALYSIS
( dry weight basis )
% Carbon = 53.29
% Oxygen = 39.42
% Sulphur = .01
% Ash = .99
PROXIMATE ANALYSIS
( dry weight basis )
% Hydrogen = 6.16
% Nitrogen = .13
% Chlorine = 0.00
% Fixed carbon = 20.88 % Volatile = 78.13
% Ash = same as in ultimate analysis
ASH FUSION DATA
Initial = 2210.00 (CF)
H/W = unay. (*F)
1/2-H/W = unay. CF)
Fluid = 2250.00 (*F)
Note : There is more data on the next page for this pellet.
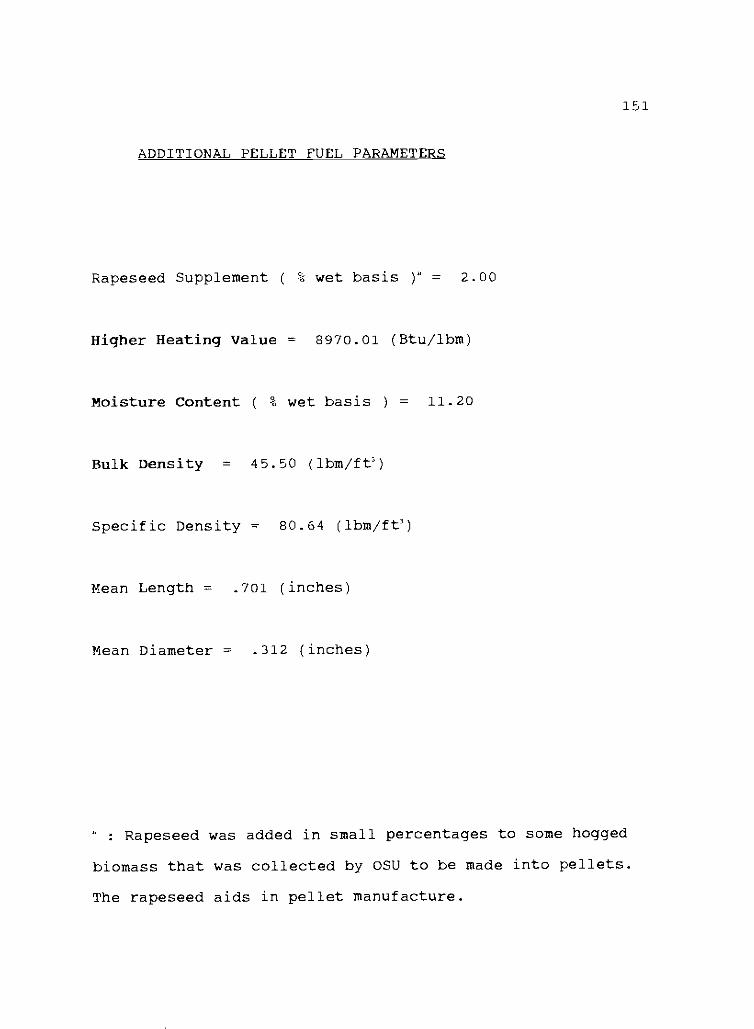
151
ADDITIONAL PELLET FUEL PARAMETERS
Rapeseed Supplement ( % wet basis )" = 2.00
Higher Heating Value = 8970.01 (Btu/lbm)
Moisture Content ( % wet basis ) = 11.20
Bulk Density = 45.50 (lbm/ft3)
Specific Density = 80.64 (lbm/ftl
Mean Length = .701 (inches)
Mean Diameter = .312 (inches)
: Rapeseed was added in small percentages to some hogged
biomass that was collected by OSU to be made into pellets.
The rapeseed aids in pellet manufacture.

152
PELLET SAMPLE DATA
Pellet Code : 4
Pellet Species : Hemlock Fir ( wood + bark )
Location of Raw Material : Central Western Oregon
Grade : Non-Commercial ( made for OSU )
ULTIMATE ANALYSIS
( dry weight basis )
% Carbon = 51.16
% Oxygen = 41.68
% Sulphur = .01
% Ash = .96
PROXIMATE ANALYSIS
( dry weight basis )
% Hydrogen = 6.09
% Nitrogen = .10
% Chlorine = 0.003
% Fixed carbon = 21.06 % Volatile = 77.98
% Ash = same as in ultimate analysis
ASH FUSION DATA
Initial = 2500.00 (sF)
H/W = 2530.00 (*F)
1/2-H/W = 2540.00 (SF)
Fluid = 2550.00 (sF)
Note : There is more data on the next page for this pellet.

153
ADDITIONAL PELLET FUEL PARAMETERS
Rapeseed Supplement ( % wet basis )° = 0.00
Higher Heating Value = 8786.94 (Btu/lbm)
Moisture Content ( % wet basis ) = 8.40
Bulk Density = 48.16 (lbm /f t')
Specific Density = 83.92 (lbm/ft')
Mean Length = .518 (inches)
Mean Diameter = .310 (inches)
: Rapeseed was added in small percentages to some hogged
biomass that was collected by OSU to be made into pellets.
The rapeseed aids in pellet manufacture.
154
PELLET SAMPLE DATA
Pellet Code : 5
Pellet Species:Alder,Hemlock Fir,Doug.Fir,Cedar (wood+bark)
Location of Raw Material : Central Coast Oregon
Grade : Non-Commercial ( made for OSU )
ULTIMATE ANALYSIS
( dry weight basis )
% Carbon = 53.41
% Oxygen = 37.99
% Sulphur = .03
% Ash = 2.24
PROXIMATE ANALYSIS
( dry weight basis )
% Hydrogen = 6.05
% Nitrogen = .27
% Chlorine = 0.00
% Fixed carbon = 23.78 % Volatile = 73.98
% Ash = same as in ultimate analysis
ASH FUSION DATA
Initial = 2260.00 (sF)
H/W = 2270.00 (CF)
1/2-H/W = 2275.00 (SF)
Fluid = 2280.00 (SF)
Note : There is more data on the next page for this pellet.

155
ADDITIONAL PELLET FUEL PARAMETERS
Rapeseed Supplement ( % wet basis )° = 0.25
Higher Heating Value = 9185.71 (Btu/lbm)
Moisture Content ( % wet basis ) = 3.40
Bulk Density = 44.47 (lbm /f t3)
Specific Density = 81.57 (lbm /ft')
Mean Length = .317 (inches)
Mean Diameter = .315 (inches)
6 : Rapeseed was added in small percentages to some hogged
biomass that was collected by OSU to be made into pellets.
The rapeseed aids in pellet manufacture.

156
PELLET SAMPLE DATA
Pellet Code : 6
Pellet Species : Cedar ( wood + bark )
Location of Raw Material : South Central Oregon
Grade : Non-Commercial ( made for OSU )
ULTIMATE ANALYSIS
( dry weight basis )
% Carbon = 52.10
Oxygen = 41.03
% Sulphur = .01
% Ash = .61
PROXIMATE ANALYSIS
( dry weight basis )
% Hydrogen = 6.15
% Nitrogen = .01
% Chlorine = 0.00
% Fixed carbon = 18.69 % Volatile = 80.70
% Ash = same as in ultimate analysis
ASH FUSION DATA
Initial = 2220.00 (`F)
H/W = 2230.00 CF)
1/2-H/W = 2240.00 (CF)
Fluid = 2250.00 ('F)
Note : There is more data on the next pane for this pellet.

157
ADDITIONAL PELLET FUEL PARAMETERS
Rapeseed Supplement ( % wet basis )' = 0.25
Higher Heating Value = 9141.63 (Btu/lbm)
Moisture Content ( % wet basis ) = 7.80
Bulk Density = 48.95 (lbm/f-e)
Specific Density = 82.38 (lbm/fe)
Mean Length = .46 (inches)
Mean Diameter = .307 (inches)
: Rapeseed was added in small percentages to some hogged
biomass that was collected by OSU to be made into pellets.
The rapeseed aids in pellet manufacture.

158
PELLET SAMPLE DATA
Pellet Code : 7
Pellet Species: Red Alder, some Maple/Myrtle ( wood+bark )
Location of Raw Material : Central Coast Oregon
Grade : Non-Commercial ( made for OSU )
ULTIMATE ANALYSIS
( dry weight basis )
% Carbon = 50.35
% Oxygen = 42.29
% Sulphur = .03
% Ash = 1.15
PROXIMATE ANALYSIS
( dry weight basis )
% Hydrogen = 5.92
% Nitrogen = .27
% Chlorine = 0.00
% Fixed carbon = 19.25 % Volatile = 79.60
% Ash = same as in ultimate analysis
ASH FUSION DATA
Initial = 2220.00 ('F)
H/W = 2220.00 (sF)
1/2-H/W = 2230.00 (sF)
Fluid = 2240.00 (SF)
Note : There is more data on the next page for this pellet.

159
ADDITIONAL PELLET FUEL PARAMETERS
Rapeseed Supplement ( % wet basis )8 = 0.50
Higher Heating Value = 8688.26 (Btu/lbm)
Moisture Content ( % wet basis ) = 6.60
Bulk Density = 53.34 (lbm/fta)
Specific Density = 82.86 (lbm/ft3)
Mean Length = .705 (inches)
Mean Diameter = .305 (inches)
: Rapeseed was added in small percentages to some hogged
biomass that was collected by OSU to be made into pellets.
The rapeseed aids in pellet manufacture.

160
PELLET SAMPLE DATA
Pellet Code : 8
Pellet Species : Douglas Fir ( wood + bark )
Location of Raw Material : Central Coast Oregon
Grade : Non-Commercial ( made for OSU )
ULTIMATE ANALYSIS
( dry weight basis )
% Carbon = 54.16
% Oxygen = 37.11
% Sulphur = .07
% Ash = 2.55
PROXIMATE ANALYSIS
( dry weight basis )
% Hydrogen = 5.93
% Nitrogen = .18
% Chlorine = 0.78
% Fixed carbon = 25.85 % Volatile = 71.60
Ash = same as in ultimate analysis
ASH FUSION DATA
Initial = 2450.00 (pF)
H/W = 2460.00 (oF)
1/2-H/W = 2470.00 CF)
Fluid = 2480.00 (CF)
Note : There is more data on the next page for this pellet.

161
ADDITIONAL PELLET FUEL PARAMETERS
Rapeseed Supplement ( % wet basis )a = 0.50
Higher Heating Value = 9284.34 (Btu/lbm)
Moisture Content ( % wet basis ) = 8.00
Bulk Density = 43.14 (lbm/ft?)
Specific Density = 79.70 (lbm/ftl
Mean Length = .376 (inches)
Mean Diameter = .314 (inches)
: Rapeseed was added in small percentages to some hogged
biomass that was collected by OSU to be made into pellets.
The rapeseed aids in pellet manufacture.

162
PELLET SAMPLE DATA
Pellet Code : 9
Pellet Species : Hemlock Fir and Sitka Spruce (wood + bark)
Location of Raw Material : Southeast Coastal Alaska
Grade : Non-Commercial ( made for OSU )
ULTIMATE ANALYSIS
( dry weight basis )
% Carbon = 50.55
% Oxygen = 40.40
% Sulphur = .04
% Ash = 2.43
PROXIMATE ANALYSIS
( dry weight basis )
% Hydrogen = 6.04
% Nitrogen = .35
% Chlorine = 0.19
% Fixed carbon = 24.27 % Volatile = 73.30
% Ash = same as in ultimate analysis
ASH FUSION DATA
Initial = 2150.00 (Et)
H/W = 2160.00 ("F)
1/2-H/W = 2170.00 (CF)
Fluid = 2195.00 ("F)
Note : There is more data on the next page for this pellet.

163
ADDITIONAL PELLET FUEL PARAMETERS
Rapeseed Supplement ( % wet basis )a = 0.25
Higher Heating Value = 8799.78 (Btu/lbm)
Moisture Content ( % wet basis ) = 14.40
Bulk Density = 37.21 (lbm/ftl
Specific Density = 75.32 (lbm/ft3)
Mean Length = .601 (inches)
Mean Diameter = .305 (inches)
a : Rapeseed was added in small percentages to some hogged
biomass that was collected by OSU to be made into pellets.
The rapeseed aids in pellet manufacture.

164
PELLET SAMPLE DATA
Pellet Code : 10
Pellet Species : Douglas Fir and Alder ( wood + bark )
Location of Raw Material : Central Western Oregon
Grade : Non-Commercial ( made for OSU )
PELLET FUEL PARAMETERS
Higher Heating Value = 8960.40 (Btu/lbm)
Moisture Content ( % wet basis ) = 4.90
Bulk Density = 47.70 (lbm/f-e)
Specific Density = 81.76 (Ibm/ft3)
Mean Length = .392 (inches)
Mean Diameter = .309 (inches)

165
PELLET SAMPLE DATA
Pellet Code : 11
Pellet Species : Cedar and Spruce ( wood + bark )
Location of Raw Material : Central "Pan-Handle"
Grade : Commercial
PELLET FUEL PARAMETERS
Higher Heating Value = 8964.52 (Btu/lbm)
Moisture Content ( % wet basis ) = 9.13
Bulk Density = 43.68 (lbm/ftl
Specific Density = 81.08 (lbm/fe)
Mean Length = .545 (inches)
Mean Diameter = .309 (inches)

166
PELLET SAMPLE DATA
Pellet Code : 12
Pellet Species : True Fir and Pine ( wood and bark )
Location of Raw Material : Northwestern Montana
Grade : Commercial
PELLET FUEL PARAMETERS
Higher Heating Value = 8850.21 (Btu/lbm)
Moisture Content ( % wet basis ) = 7.00
Bulk Density = 41.40 (lbm/ft')
Specific Density = 81.56 (lbm/ft')
Mean Length = .500 (inches)
Mean Diameter = .256 (inches)

167
PELLET SAMPLE DATA
Pellet Code : 13
Pellet Species : Douglas Fir and Ponderosa Pine (wood+bark)
Location of Raw Material : Northwestern Montana
Grade : Commercial
PELLET FUEL PARAMETERS
Higher Heating Value = 8755.31 (Btu/lbm)
Moisture Content ( % wet basis ) = 4.60
Bulk Density = 44.77 (lbm /ft')
Specific Density = 82.65 (lbm/ft')
Mean Length = .495 (inches)
Mean Diameter = .314 (inches)

168
PELLET SAMPLE DATA
Pellet Code : 14
Pellet Species : Douglas Fir and Ponderosa Pine (wood+bark)
Location of Raw Material : Northwestern Montana
Grade : Commercial
PELLET FUEL PARAMETERS
Higher Heating Value = 8637.99 (Btu/lbm)
Moisture Content ( % wet basis ) = 6.90
Bulk Density = 46.02 (lbm/f-e)
Specific Density = 81.64 (lbm /ft')
Mean Length = .596 (inches)
Mean Diameter = .317 (inches)

169
APPENDIX D
COMBUSTION EXPERIMENT DATA

170
COMBUSTION TEST DATA
TEST # 6.1 FUEL CODE : 1
OBJECTIVE : One "block" (out of 15) of the experimental
matrix to find optimal firing condition as a function of
excess air and under fire air for fuel #1.
Length of run = 60 (minutes)
FUEL AND AIR PARAMETERS [CONSTANT FOR TEST)
Fuel feedrate 1 (FF1) = 4.711 (lb/hr-dry basis)
Air/Fuel Ratio (A/F) = 6.265 (lb-dry air/lb-dry fuel)
Fuel feedrate 2 (FF2) = 42249.76 (Btu/hr)
Excess Air (%EA) percent = 41.00
Under fire air percent (%UF) = 50.00
Under-fire (UF) air supply temperature (TUF) = 69 (xF)
Over-fire (OF) air supply temperature' (TOF) = 69 CF)
: OF air temperature is measured before entrance to theBiomass Combustion Unit (BCU). This is not the actualsupply temperature. It was not feasible to measure theactual OF supply air (heated as it travels down the OF tubeinside the BCU) because of the difficulty of thermocoupleplacement and lifespan in the harsh combustion gasenvironment.

171
COMBUSTION GAS DATA
( From Enerac Gas Analysis Unit and Separate Temp. Probes )
Note : All data is given as the mean value first and the
standard deviation second, separated by a colon. Example
"mean CO, value" : "standard deviation of mean CO,"
Gas temperature (TO = 1428.25 : 40.45 ("F)
Carbon monoxide (CO) = 431.87 : 638.01 (ppm)
- Oxygen (0,) = 7.85 : 2.82 (% by dry volume)
Carbon dioxide (CO2) = 12.86 : 2.76 (% by dry volume)
Hydrocarbons (HCs) = .60 : 1.80 (% by dry volume)
- Oxides of Nitrogen (NO,) = 68.17 : 21.90 (ppm)
Sulphur dioxide (SO2) = 9.7 : 32.04 (ppm)
Particulate in exhaust (PART.) = .1161 (grains/dscf)°
- Combustible in Particulate (COMB.) = 67.88 (% dry basis)
: dscf = dry standard cubic foot ; grain = 1/7000th ounce;data adjusted to 12% CO,.

172
COMBUSTION TEST DATA
TEST # 6.2 FUEL CODE : 1
OBJECTIVE : One "block" (out of 15) of the experimental
matrix to find optimal firing condition as a function of
excess air and under fire air for fuel #1.
Length of run = 60 (minutes)
FUEL AND AIR PARAMETERS (CONSTANT FOR TEST)
Fuel feedrate 1 (FF1) = 4.711 (lb/hr-dry basis)
Air/Fuel Ratio (A/F) = 6.265 (lb-dry air/lb-dry fuel)
Fuel feedrate 2 (FF2) = 42249.76 (Btu/hr)
Excess Air (%EA) percent = 41.00
Under fire air percent (%UF) = 20.00
Under-fire (UF) air supply temperature (TUF) = 69 (CF)
Over-fire (OF) air supply temperatures (TOF) = 68 (`F)
° : OF air temperature is measured before entrance to theBiomass Combustion Unit (BCU). This is not the actualsupply temperature. It was not feasible to measure theactual OF supply air (heated as it travels down the OF tubeinside the BCU) because of the difficulty of thermocoupleplacement and lifespan in the harsh combustion gasenvironment.

173
COMBUSTION GAS DATA
( From Enerac Gas Analysis Unit and Separate Temp. Probes )
Note : All data is given as the mean value first and the
standard deviation second, separated by a colon. Example -
"mean CO, value" : "standard deviation of mean CO,"
- Gas temperature (fg) = 1468.10 : 48.22 ("F)
Carbon monoxide (CO) = 6.93 : 23.86 (ppm)
- Oxygen (0,) = 8.91 : 1.98 (% by dry volume)
- Carbon dioxide (CO,) = 11.84 : 1.98 (% by dry volume)
- Hydrocarbons (HCs) = 0.0 : 0.00 (% by dry volume)
- Oxides of Nitrogen (NO,) = 79.43 : 16.53 (ppm)
- Sulphur dioxide (S0,) = 0.0 : 0.00 (ppm)
- Particulate in exhaust (PART.) - .0345 (grains/dscf)°
Combustible in Particulate (COMB.) = 58.30 (% dry basis)
: dscf = dry standard cubic foot ; grain = 1/7000th ounce;
data are adjusted to 12% CO,.

174
COMBUSTION TEST DATA
TEST # 6.3 FUEL CODE : 1
OBJECTIVE : One "block" (out of 15) of the experimental
matrix to find optimal firing condition as a function of
excess air and under fire air for fuel #1.
Length of run = 60 (minutes)
FUEL AND AIR PARAMETERS (CONSTANT FOR TEST)
Fuel feedrate 1 (FF1) = 4.711 (lb/hr-dry basis)
Air/Fuel Ratio (A/F) = 6.265 (lb-dry air/lb-dry fuel)
Fuel feedrate 2 (FF2) = 42249.76 (Btu/hr)
Excess Air (%EA) percent = 41.00
Under fire air percent (%UF) = 30.00
Under-fire (UF) air supply temperature (TUF) = 77 ("F)
Over-fire (OF) air supply temperaturea (TOF) = 70 ("F)
: OF air temperature is measured before entrance to theBiomass Combustion Unit (BCU). This is not the actualsupply temperature. It was not feasible to measure theactual OF supply air (heated as it travels down the OF tubeinside the BCU) because of the difficulty of thermocoupleplacement and lifespan in the harsh combustion gasenvironment.

175
COMBUSTION GAS DATA
( From Enerac Gas Analysis Unit and Separate Temp. Probes )
Note : All data is given as the mean value first and the
standard deviation second, separated by a colon. Example -
"mean CO, value" : "standard deviation of mean CO."
Gas temperature (T,) = 1576.80 : 64.85 (CF)
- Carbon monoxide (CO) = 4.07 : 16.14 (ppm)
oxygen (0,) = 7.72 : 2.83 (% by dry volume)
- Carbon dioxide (CO,) = 12.99 : 2.79 (% by dry volume)
Hydrocarbons (HCs) = .10 : 0.51 (% by dry volume)
Oxides of Nitrogen (NO,) = 85.77 : 25.32 (ppm)
- Sulphur dioxide (S0,) = 1.57 : 6.390.00 (ppm)
- Particulate in exhaust (PART.) = .0396 (grains /dscf)'
- Combustible in Particulate (COMB.) = 29.19 (% dry basis)
a : dscf = dry standard cubic foot ; grain = 1/7000th ounce;
data are adjusted to 12% CO,.

176
COMBUSTION TEST DATA
TEST # 6.4 FUEL CODE : 1
OBJECTIVE : One "block" (out of 15) of the experimental
matrix to find optimal firing condition as a function of
excess air and under fire air for fuel #1.
Length of run = 60 (minutes)
FUEL AND AIR PARAMETERS (CONSTANT FOR TEST)
Fuel feedrate 1 (FF1) = 4.711 (lb/hr-dry basis)
Air/Fuel Ratio (A/F) = 6.265 (lb-dry air/lb-dry fuel)
Fuel feedrate 2 (FF2) = 42249.76 (Btu/hr)
Excess Air (%EA) percent = 41.00
Under fire air percent (%UF) = 12.60
Under-fire (UF) air supply temperature (TUF) = 85 ("F)
Over-fire (OF) air supply temperature' (TOF) = 69 ("F)
: OF air temperature is measured before entrance to theBiomass Combustion Unit (BCU). This is not the actualsupply temperature. It was not feasible to measure theactual OF supply air (heated as it travels down the OF tubeinside the BCU) because of the difficulty of thermocoupleplacement and lifespan in the harsh combustion gasenvironment.

177
COMBUSTION GAS DATA
( From Enerac Gas Analysis Unit and Separate Temp. Probes )
Note : All data is given as the mean value first and the
standard deviation second, separated by a colon. Example -
"mean CO, value" : "standard deviation of mean CO,"
- Gas temperature (TO = 1472.80 : 29.84 CF)
Carbon monoxide (CO) = 49.97 : 265.02 (ppm)
- Oxygen (0,) = 10.36 : 1.76 (% by dry volume)
Carbon dioxide (CO2) = 10.13 : 2.53 (% by dry volume)
- Hydrocarbons (HCs) = 0.0 : 0.0 (% by dry volume)
- Oxides of Nitrogen (NCO = 66.83 : 14.23 (ppm)
Sulphur dioxide (S02) = 0.00 : 0.00 (ppm)
- Particulate in exhaust (PART.) = .0305 (grains/dscf)°
Combustible in Particulate (COMB.) = 65.80 (% dry basis)
a : dscf = dry standard cubic foot ; grain = 1/7000th ounce;
data are adjusted to 12% CO,.

178
COMBUSTION TEST DATA
TEST # 6.5 FUEL CODE : 1
OBJECTIVE : One "block" (out of 15) of the experimental
matrix to find optimal firing condition as a function of
excess air and under fire air for fuel #1.
Length of run = 60 (minutes)
FUEL AND AIR PARAMETERS (CONSTANT FOR TEST)
Fuel feedrate 1 (FF1) = 4.711 (lb/hr-dry basis)
Air/Fuel Ratio (A/F) = 6.265 (lb-dry air/lb-dry fuel)
Fuel feedrate 2 (FF2) = 42249.76 (Btu/hr)
Excess Air (%EA) percent = 41.00
Under fire air percent (%UF) = 40.00
Under-fire (UF) air supply temperature (TUF) = 78 ( °F)
Over-fire (OF) air supply temperature' (TOF) = 71 (°r')
a : OF air temperature is measured before entrance to theBiomass Combustion Unit (BCU). This is not the actualsupply temperature. It was not feasible to measure theactual OF supply air (heated as it travels down the OF tubeinside the BCU) because of the difficulty of thermocoupleplacement and lifespan in the harsh combustion gasenvironment.
179
COMBUSTION GAS DATA
( From Enerac Gas Analysis Unit and Separate Temp. Probes )
Note : All data is given as the mean value first and the
standard deviation second, separated by a colon. Example -
"mean CO, value" : "standard deviation of mean CO,"
- Gas temperature (TO = 1520.00 : 52.21 ('F)
Carbon monoxide (CO) = 90.10 : 298.30 (ppm)
- Oxygen (02) = 8.69 : 1.90 (% by dry volume)
- Carbon dioxide (CO,) = 12.06 : 1.96 (% by dry volume)
- Hydrocarbons (HCs) = 5.87 : 21.04 (% by dry volume)
- Oxides of Nitrogen (NO,) = 74.20 : 18.37 (ppm)
- Sulphur dioxide (SO2) = 5.87 : 21.04 (ppm)
Particulate in exhaust (PART.) = .0521 (grains/dscf)'
- Combustible in Particulate (COMB.) = 33.88 (% dry basis)
: dscf = dry standard cubic foot ; grain = 1/7000th ounce;
data are adjusted to 12% CO,.

180
COMBUSTION TEST DATA
TEST if 8.1 FUEL CODE : 1
OBJECTIVE : One "block" (out of 15) of the experimental
matrix to find optimal firing condition as a function of
excess air and under fire air for fuel #1.
Length of run = 60 (minutes)
FUEL AND AIR PARAMETERS (CONSTANT FOR TEST)
Fuel feedrate 1 (FF1) = 4.114 (lb/hr-dry basis)
Air/Fuel Ratio (A/F) = 6.265 (lb-dry air/lb-dry fuel)
Fuel feedrate 2 (FF2) = 36893.46 (Btu/hr)
Excess Air (%EA) percent = 87.23
Under fire air percent (%UF) = 20.00
Under-fire (UF) air supply temperature (TUF) = 76 (°F)
Over-fire (OF) air supply temperaturea (TOF) = 68 CF)
: OF air temperature is measured before entrance to theBiomass Combustion Unit (BCU). This is not the actualsupply temperature. It was not feasible to measure theactual OF supply air (heated as it travels down the OF tubeinside the BCU) because of the difficulty of thermocoupleplacement and lifespan in the harsh combustion gasenvironment.

181
COMBUSTION GAS DATA
( From Enerac Gas Analysis Unit and Separate Temp. Probes )
Note : All data is given as the mean value first and the
standard deviation second, separated by a colon. Example
"mean CO. value" : "standard deviation of mean CO,"
- Gas temperature (;) = 1248.92 : 38.97 (°F)
- Carbon monoxide (CO) = 116.63 : 46.60 (ppm)
Oxygen (0,) = 12.08 : 1.80 (% by dry volume)
- Carbon dioxide (CO,) = 8.69 : 1.82 (% by dry volume)
- Hydrocarbons (HCs) = 0.0 : 0.0 (% by dry volume)
- Oxides of Nitrogen (NCO = 49.00 : 12.04 (ppm)
- Sulphur dioxide (S0,) = 0.0 : 0.0 (ppm)
Particulate in exhaust (PART.) = .0638 (grains /dscf)'
Combustible in Particulate (COMB.) = 38.35 (% dry basis)
a : dscf = dry standard cubic foot ; grain = 1/7000th ounce;
data are adjusted to 12% CO,.

182
COMBUSTION TEST DATA
TEST # 8.2 FUEL CODE : 1
OBJECTIVE : One "block" (out of 15) of the experimental
matrix to find optimal firing condition as a function of
excess air and under fire air for fuel #1.
Length of run = 60 (minutes)
FUEL AND AIR PARAMETERS (CONSTANT FOR TEST)
Fuel feedrate 1 (FF1) = 4.114 (lb/hr-dry basis)
Air/Fuel Ratio (A/F) = 6.265 (lb-dry air/lb-dry fuel)
Fuel feedrate 2 (FF2) = 36893.46 (Btu/hr)
Excess Air (%EA) percent = 87.23
Under fire air percent (%UF) = 30.00
Under-fire (UF) air supply temperature (TUF) = 74 ( °F)
Over-fire (OF) air supply temperature` (TOF) = 68 ( °F)
: OF air temperature is measured before entrance to theBiomass Combustion Unit (BCU). This is not the actualsupply temperature. It was not feasible to measure theactual OF supply air (heated as it travels down the OF tubeinside the BCU) because of the difficulty of thermocoupleplacement and lifespan in the harsh combustion gasenvironment.

183
COMBUSTION GAS DATA
( From Enerac Gas Analysis Unit and Separate Temp. Probes )
Note : All data is given as the mean value first and the
standard deviation second, separated by a colon. Example -
"mean CO, value" : "standard deviation of mean CO,"
- Gas temperature (T9) = 1253.87 : 18.03 ( °F)
- Carbon monoxide (CO) = 102.30 : 22.50 (ppm)
Oxygen (02) = 12.36 : 1.18 (% by dry volume)
- Carbon dioxide (CO2) = 8.37 : 1.06 (% by dry volume)
Hydrocarbons (HCs) = 0.0 : 0.0 (% by dry volume)
- Oxides of Nitrogen (NO,)
- Sulphur dioxide (S0,) =
= 47.23 : 5.25 (ppm)
0.0 : 0.0 (ppm)
Particulate in exhaust (PART.) = .0494 (grains/dscf)a
- Combustible in Particulate (COMB.) = 38.00 (% dry basis)
- : dscf = dry standard cubic foot ; grain = 1/7000th ounce;
data are adjusted to 12% CO,.

184
COMBUSTION TEST DATA
TEST # 8.3 FUEL CODE : 1
OBJECTIVE : One "block" (out of 15) of the experimental
matrix to find optimal firing condition as a function of
excess air and under fire air for fuel #1.
Length of run = 60 (minutes)
FUEL AND AIR PARAMETERS (CONSTANT FOR TEST)
Fuel feedrate 1 (FF1) = 4.114 (lb/hr-dry basis)
Air/Fuel Ratio (A/F) = 6.265 (lb-dry air/lb-dry fuel)
Fuel feedrate 2 (FF2) = 36893.46 (Btu/hr)
Excess Air (;EA) percent = 87.23
Under fire air percent (%UF) = 12.60
Under-fire (UF) air supply temperature (TUF) = 82 (CF)
Over-fire (OF) air supply temperatures (TOF) = 68 CF)
: OF air temperature is measured before entrance to theBiomass Combustion Unit (BCU). This is not the actualsupply temperature. It was not feasible to measure theactual OF supply air (heated as it travels down the OF tubeinside the BCU) because of the difficulty of thermocoupleplacement and lifespan in the harsh combustion gasenvironment.
185
COMBUSTION GAS DATA
( From Enerac Gas Analysis Unit and Separate Temp. Probes )
Note : All data is given as the mean value first and the
standard deviation second, separated by a colon. Example -
"mean CO, value" : "standard deviation of mean CO,"
- Gas temperature (T9) = 1273.57 : 14.76 (*F)
Carbon monoxide (CO) = 122.23 : 24.36 (ppm)
- Oxygen (0,) = 13.19 : 0.67 (% by dry volume)
- Carbon dioxide (CO2) - 7.57 : 0.76 (% by dry volume)
Hydrocarbons (HCs) = 0.0 : 0.0 (% by dry volume)
- Oxides of Nitrogen (NO,) = 42.70 : 2.87 (ppm)
Sulphur dioxide (SOJ = 0.0 : 0.0 (ppm)
- Particulate in exhaust (PART.) = .0328 (grains/dscf)°
Combustible in Particulate (COMB.) = 38.69 (% dry basis)
: dscf = dry standard cubic foot ; grain = 1/7000th ounce;
data are adjusted to 12% CO,.
COMBUSTION TEST DATA
TEST # 8.4 FUEL CODE : 1
186
OBJECTIVE : One "block" (out of 15) of the experimental .
matrix to find optimal firing condition as a function of
excess air and under fire air for fuel #1.
Length of run = 60 (minutes)
FUEL AND AIR PARAMETERS (CONSTANT FOR TEST)
Fuel feedrate 1 (FF1) = 4.114 (lb/hr-dry basis)
Air/Fuel Ratio (A/F) = 6.265 (lb-dry air/lb-dry fuel)
Fuel feedrate 2 (FF2) = 36893.46 (Btu/hr)
Excess Air (%EA) percent = 87.23
Under fire air percent (%UF) = 50.00
Under-fire (UF) air supply temperature (TUF) = 74 (CF)
Over-fire (OF) air supply temperature' (TOF) = 71 CF)
: OF air temperature is measured before entrance to theBiomass Combustion Unit (BCU). This is not the actualsupply temperature. It was not feasible to measure theactual OF supply air (heated as it travels down the OF tubeinside the BCU) because of the difficulty of thermocoupleplacement and lifespan in the harsh combustion gasenvironment.

187
COMBUSTION GAS DATA
( From Enerac Gas Analysis Unit and Separate Temp. Probes )
Note : All data is given as the mean value first and the
standard deviation second, separated by a colon. Example
"mean CO, value" : "standard deviation of mean CO,"
Gas temperature (TO = 1319.38 : 12.04 ('F)
- Carbon monoxide (CO) = 54.90 : 13.13 (ppm)
- Oxides of Nitrogen (NCO = 44.67 : 5.52 (ppm)
- Sulphur dioxide (S0,) = 0.0 : 0.0 (ppm)
- Particulate in exhaust (PART.) = .0741 (grains/dscf)a
Combustible in Particulate (COMB.) = 36.57 (% dry basis)
Oxygen (0,) = 12.95 : 1.17 (% by dry volume)
Carbon dioxide (CO,) = 7.87 : 1.04 (% by dry volume)
Hydrocarbons (HCs) = 0.0 : 0.0 (% by dry volume)
: dscf = dry standard cubic foot ; grain = 1/7000th ounce;
data are adjusted to 12% CO,.

188
COMBUSTION TEST DATA
TEST # 8.5 FUEL CODE : 1
OBJECTIVE : One "block" (out of 15) of the experimental
matrix to find optimal firing condition as a function of
excess air and under fire air for fuel #1.
Length of run = 60 (minutes)
FUEL AND AIR PARAMETERS (CONSTANT FOR TEST)
Fuel feedrate 1 (FF1) = 4.114 (lb/hr-dry basis)
Air/Fuel Ratio (A/F) = 6.265 (lb-dry air/lb-dry fuel)
Fuel feedrate 2 (FF2) = 36893.46 (Btu/hr)
Excess Air (%EA) percent = 87.23
Under fire air percent (%UF) = 40.00
Under-fire (UF) air supply temperature (TUF) = 74 (sF)
Over-fire (OF) air supply temperature' (TOF) = 69 ( °F)
: OF air temperature is measured before entrance to theBiomass Combustion Unit (BCU). This is not the actualsupply temperature. It was not feasible to measure theactual OF supply air (heated as it travels down the OF tubeinside the BCU) because of the difficulty of thermocoupleplacement and lifespan in the harsh combustion gasenvironment.

189
COMBUSTION GAS DATA
( From Enerac Gas Analysis Unit and Separate Temp. Probes )
Note : All data is given as the mean value first and the
standard deviation second, separated by a colon. Example -
"mean CO, value" : "standard deviation of mean CO,"
- Gas temperature (T9) = 1303.73 : 32.39 (°F)
- Carbon monoxide (CO) = 65.93 : 22.52 (ppm)
Oxygen (0,) = 13.39 : 1.21 (% by dry volume)
Carbon dioxide (CO,) = 7.35 : 1.12 (% by dry volume)
Hydrocarbons (HCs) = 0.0 : 0.0 (% by dry volume)
Oxides of Nitrogen (140.) = 40.90 : 6.27 (ppm)
- Sulphur dioxide (S0,) = 0.0 : 0.0 (ppm)
Particulate in exhaust (PART.) = .0521 (grains/dscf)'
Combustible in Particulate (COMB.) = 33.88 (% dry basis)
: dscf = dry standard cubic foot ; grain = 1/7000th ounce;
data are adjusted to 12% CO,.
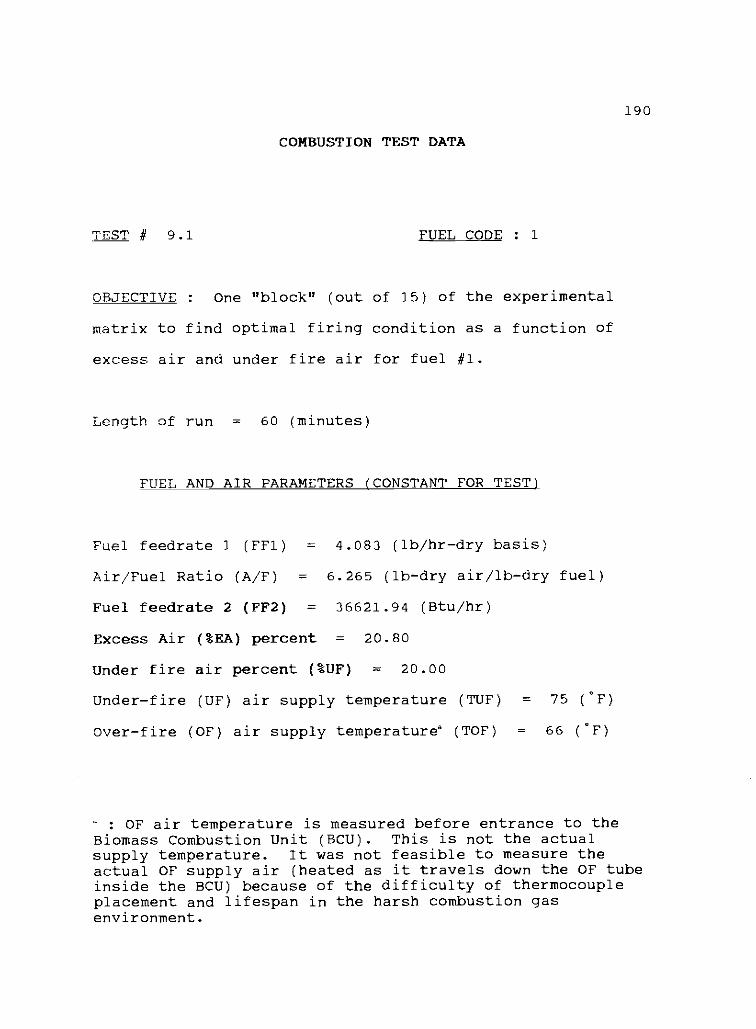
190
COMBUSTION TEST DATA
TEST # 9.1 FUEL CODE : 1
OBJECTIVE : One "block" (out of 15) of the experimental
matrix to find optimal firing condition as a function of
excess air and under fire air for fuel #1.
Length of run = 60 (minutes)
FUEL AND AIR PARAMETERS (CONSTANT FOR TEST)
Fuel feedrate 1 (FF1) = 4.083 (lb/hr-dry basis)
Air/Fuel Ratio (A/F) = 6.265 (lb-dry air/lb-dry fuel)
Fuel feedrate 2 (FF2) = 36621.94 (Btu/hr)
Excess Air (%EA) percent = 20.80
Under fire air percent (%UF) = 20.00
Under-fire (UF) air supply temperature (TUF) = 75 ( °F)
Over-fire (OF) air supply temperature° (TOF) = 66 (CF)
: OF air temperature is measured before entrance to theBiomass Combustion Unit (BCU). This is not the actualsupply temperature. It was not feasible to measure theactual OF supply air (heated as it travels down the OF tubeinside the BCU) because of the difficulty of thermocoupleplacement and lifespan in the harsh combustion gasenvironment.

191
COMBUSTION GAS DATA
From Enerac Gas Analysis Unit and Separate Temp. Probes )
Note : All data is given as the mean value first and the
standard deviation second separated by a colon. Example
"mean CO, value" : "standard deviation of mean CO,"
- Gas temperature (T9) = 1331.83 : 23.00 (°F)
Carbon monoxide (CO) = 57.73 : 5.63 (ppm)
Oxygen (0,) = 12.53 : 1.03 (% by dry volume)
- Carbon dioxide (CO,) = 8.34 : 0.87 (% by dry volume)
Hydrocarbons (HC5) = 0.0 : 0.0 (% by dry volume)
- Oxides of Nitrogen (NCO
- Sulphur dioxide (50,) =
46.23 : 7.08 (ppm)
0.0 : 0.0 (ppm)
Particulate in exhaust (PART.) = .0393 (grains/dscf)'
- Combustible in Particulate (COMB.) = 33.43 (% dry basis)
dscf = dry standard cubic foot ; grain = 1/7000th ounce;
data are adjusted to 12% CO,.

192
COMBUSTION TEST DATA
TEST # 9.2 FUEL CODE : 1
OBJECTIVE : One "block" (out of 15) of the experimental
matrix to find optimal firing condition as a function of
excess air and under fire air for fuel #1.
Length of run = 60 (minutes)
FUEL AND AIR PARAMETERS (CONSTANT FOR TEST)
Fuel feedrate 1 (FF1) = 4.083 (lb/hr-dry basis)
Air/Fuel Ratio (A/F) = 6.265 (lb-dry air/lb-dry fuel)
Fuel feedrate 2 (FF2) = 36621.94 (Btu/hr)
Excess Air (%EA) percent = 20.80
Under fire air percent (%UF) = 40.00
Under-fire (UF) air supply temperature (TUF) = 75 ( °F)
Over-fire (OF) air supply temperature (TOF) = 70 ( °F)
a : OF air temperature is measured before entrance to theBiomass Combustion Unit (BCU). This is not the actualsupply temperature. It was not feasible to measure theactual OF supply air (heated as it travels down the OF tubeinside the BCU) because of the difficulty of thermocoupleplacement and lifespan in the harsh combustion gasenvironment.

193
COMBUSTION GAS DATA
( From Enerac Gas Analysis Unit and Separate Temp. Probes )
Note : All data is given as the mean value first and the
standard deviation second, separated by a colon. Example -
"mean CO, value" : "standard deviation of mean CO,"
- Gas temperature (T9) = 1425.93 : 25.24 CP)
- Carbon monoxide (CO) = 128.37 : 186.70 (ppm)
- Oxygen (02) = 12.31 : 0.83 (% by dry volume)
Carbon dioxide (CO,) = 8.34 : 0.85 (% by dry volume)
Hydrocarbons (HCs) = 0.0 : 0.0 (% by dry volume)
- Oxides of Nitrogen (NO,) = 52.27 : 5.48 (ppm)
Sulphur dioxide (SO2) = 0.0 0.0 (ppm)
- Particulate in exhaust (PART.) = .0747 (grains /dscf)'
Combustible in Particulate (COMB.) - 36.52 (% dry basis)
: dscf = dry standard cubic foot ; grain = 1/7000th ounce;
data are adjusted to 12% CO,.

194
COMBUSTION TEST DATA
TEST # 9.3 FUEL CODE : 1
OBJECTIVE : One "block" (out of 15) of the experimental
matrix tc find optimal firing condition as a function of
excess air and under fire air for fuel #1.
Length of run = 60 (minutes)
FUEL AND AIR PARAMETERS (CONSTANT FOR TEST)
Fuel feedrate 1 (FF1) = 4.083 (lb/hr-dry basis)
Air/Fuel Ratio (A/F) = 6.265 (lb-dry air/lb-dry fuel)
Fuel feedrate 2 (FF2) = 36621.94 (Btu/hr)
Excess Air (%EA) percent = 20.80
Under fire air percent (%UF) = 50.00
Under-fire (UF) air supply temperature (TUF) = 76 (SF)
Over-fire (OF) air supply temperature' (TOF) = 73 (CF)
" : OF air temperature is measured before entrance to theBiomass Combustion Unit (BCU). This is not the actualsupply temperature. It was not feasible to measure theactual OF supply air (heated as it travels down the OF tubeinside the BCU) because of the difficulty of thermocoupleplacement and lifespan in the harsh combustion gasenvironment.

195
COMBUSTION GAS DATA
( From Enerac Gas Analysis Unit and Separate Temp. Probes )
Note : All data is given as the mean value first and the
standard deviation second, separated by a colon. Example -
"mean CO, value" : "standard deviation of mean CO,"
Gas temperature (To) = 1481.13 : 18.47 (*F)
Carbon monoxide (CO) = 258.17 : 372.64 (ppm)
- Oxygen (02) = 11.05 : 1.04 (% by dry volume)
Carbon dioxide (CO,) = 9.75 : 1.02 (% by dry volume)
- Hydrocarbons (HCs) = 0.05 : 0.19 (% by dry volume)
- Oxides of Nitrogen (NO.) = 61.63 : 5.54 (ppm)
- Sulphur dioxide (SO2) = 0.0 : 0.0 (ppm)
- Particulate in exhaust (PART.) = .0798 (grains/dscf)-
Combustible in Particulate (COMB.) = 37.03 (% dry basis)
: dscf = dry standard cubic foot ; grain = 1/7000th ounce;
data are adjusted to 12% CO,.

196
COMBUSTION TEST DATA
TEST # 9.4 FUEL CODE : 1
OBJECTIVE : One "block" (out of 15) of the experimental
matrix to find optimal firing condition as a function of
excess air and under fire air for fuel #1.
Length of run = 60 (minutes)
FUEL AND AIR PARAMETERS (CONSTANT FOR TEST)
Fuel feedrate 1 (FF1) = 4.083 (lb/hr-dry basis)
Air/Fuel Ratio (A/F) = 6.265 (lb-dry air/lb-dry fuel)
Fuel feedrate 2 (FF2) = 36621.94 (Btu/hr)
Excess Air (%EA) percent = 20.80
Under fire air percent (%UF) = 12.60
Under-fire (UF) air supply temperature (TUF) = 87 (CF)
Over-fire (OF) air supply temperature° (TOF) = 72 ( °F)
: OF air temperature is measured before entrance to theBiomass Combustion Unit (BCU). This is not the actualsupply temperature. It was not feasible to measure theactual OF supply air (heated as it travels down the OF tubeinside the BCU) because of the difficulty of thermocoupleplacement and lifespan in the harsh combustion gasenvironment.

197
COMBUSTION GAS DATA
( From Enerac Gas Analysis Unit and Separate Temp. Probes )
Note : All data is given as the mean value first and the
standard deviation second, separated by a colon. Example -
"mean CO, value" : "standard deviation of mean CO,"
Gas temperature CVO = 1510.81 : 22.35 (*F)
Carbon monoxide (CO) = 54.27 : 172.81 (ppm)
- Oxygen (0,) = 11.29 : .95 (% by dry volume)
Carbon dioxide (CO2) = 9.47 : 0.91 (% by dry volume)
Hydrocarbons (HCs) = 0.02 : 0.10 (% by dry volume)
Oxides of Nitrogen (NO,)
- Sulphur dioxide (S0,) =
= 64.77 : 5.73 (ppm)
0.0 : 0.0 (ppm)
- Particulate in exhaust (PART.) = .0264 (grains /dscf)'
Combustible in Particulate (COMB.) = 22.04 (% dry basis)
: dscf = dry standard cubic foot ; grain = 1/7000th ounce;
data are adjusted to 12% CO2.

198
COMBUSTION TEST DATA
TEST # 9.5 FUEL CODE : 1
OBJECTIVE : One "block" (out of 15) of the experimental
matrix to find optimal firing condition as a function of
excess air and under fire air for fuel #1.
Length of run = 60 (minutes)
FUEL AND AIR PARAMETERS (CONSTANT FOR TESTi
Fuel feedrate 1 (FF1) = 4.083 (16/hr-dry basis)
Air/Fuel Ratio (A/F) = 6.265 (lb-dry air/lb-dry fuel)
Fuel feedrate 2 (FF2) = 36621.94 (Btu/hr)
Excess Air (%EA) percent = 20.80
Under fire air percent (%UF) = 30.00
Under-fire (UF) air supply temperature (TUF) = 83 (CF)
Over-fire (OF) air supply temperatures (TOF) = 74 ("F)
: OF air temperature is measured before entrance to theBiomass Combustion Unit (BCU). This is not the actualsupply temperature. It was not feasible to measure theactual OF supply air (heated as it travels down the OF tubeinside the BCU) because of the difficulty of thermocoupleplacement and lifespan in the harsh combustion gasenvironment.

199
COMBUSTION GAS DATA
( From Enerac Gas Analysis Unit and Separate Temp. Probes )
Note : All data is given as the mean value first and the
standard deviation second separated by a colon. Example -
"mean CO value" : "standard deviation of mean CO,"
Gas temperature (Ts) = 1565.61 : 14.16 ('F)
Carbon monoxide (CO) - 71.43 : 208.70 (ppm)
Oxygen (CO = 10.27 : .75 (% by dry volume)
- Carbon dioxide (CO,) = 10.50 : 0.69 (% by dry volume)
Hydrocarbons (HCs) = 0.01 : 0.05 (% by dry volume)
- Oxides of Nitrogen (NO.)
Sulphur dioxide (SO,) =
= 68.23 : 5.54 (ppm)
0.0 : 0.0 (ppm)
- Particulate in exhaust (PART.) = .0854 (grains/dscf)°
Combustible in Particulate (COMB.) = 33.53 (% dry basis)
' : dscf = dry standard cubic foot ; grain = 1/7000th ounce;
data are adjusted to 12% CO,.

COMBUSTION TEST DATA
TEST # 11.1 FUEL CODE : 5
200
OBJECTIVE : To examine the combustion efficiency for a
number of woody biomass fuels ( nine fuels in all, including
test 6.3 from the optimal firing condition test on fuel #1.
Length of run - 30 (minutes)
FUEL AND AIR PARAMETERS fCONSTANT FOR TEST)
Fuel feedrate 1 (FF1) = 4.590 (lb/hr-dry basis)
Air/Fuel Ratio (A/F) = 6.588 (lb-dry air/lb-dry fuel)
Fuel feedrate 2 (FF2) = 42158.44 (Btu/hr)
Excess Air (%EA) percent = 29.18
Under fire air percent (%UF) = 30.00
Under-fire (UF) air supply temperature (TUF) = 73 ( °F)
Over-fire (OF) air supply temperatures (TOF) = 67 (CF)
: OF air temperature is measured before entrance to theBiomass Combustion Unit (BCU). This is not the actualsupply temperature. It was not feasible to measure theactual OF supply air (heated as it travels down the OF tubeinside the BCU) because of the difficulty of thermocoupleplacement and lifespan in the harsh combustion gasenvironment.
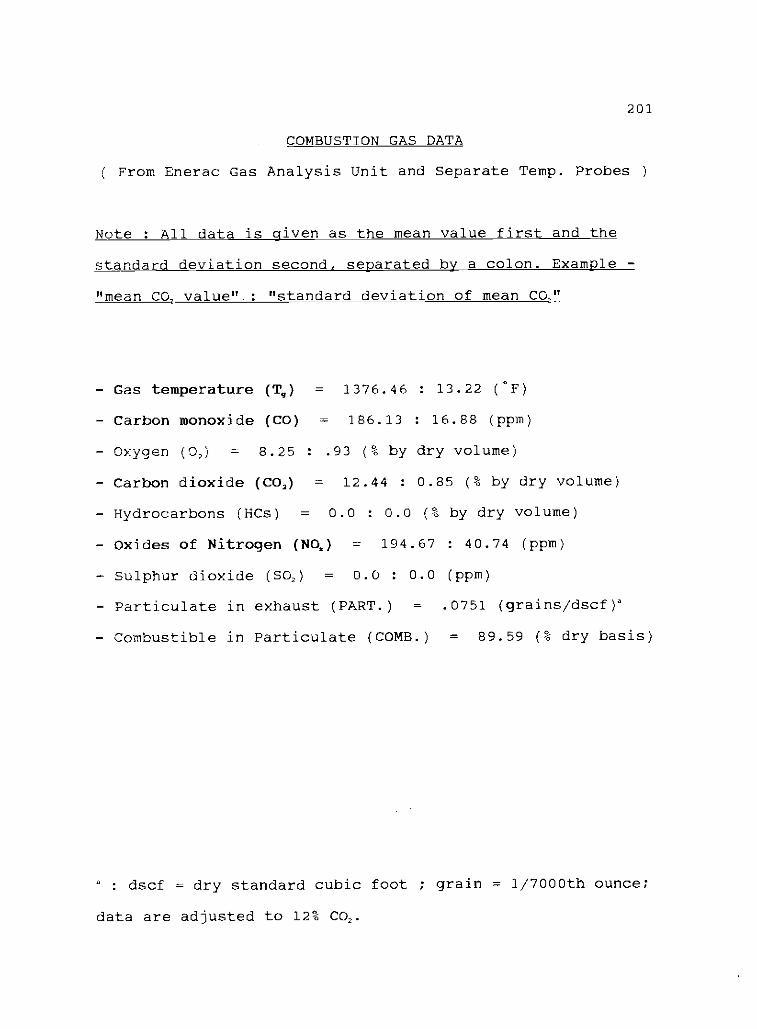
201
COMBUSTION GAS DATA
( From Enerac Gas Analysis Unit and Separate Temp. Probes )
Note : All data is given as the mean value first and the
standard deviation second, separated by a colon. Example -
"mean CO, value ".: "standard deviation of mean CO."
- Gas temperature (C) = 1376.46 : 13.22 (°F)
Carbon monoxide (CO) - 186.13 : 16.88 (ppm)
Oxygen (02) = 8.25 : .93 (% by dry volume)
Carbon dioxide (CO,) = 12.44 : 0.85 (% by dry volume)
Hydrocarbons (HCs) = 0.0 : 0.0 (% by dry volume)
- Oxides of Nitrogen (NO.) = 194.67 : 40.74 (ppm)
- Sulphur dioxide (SO,) = 0.0 : 0.0 (ppm)
Particulate in exhaust (PART.) = .0751 (grains /dscf)a
- Combustible in Particulate (COMB.) = 89.59 (% dry basis)
: dscf = dry standard cubic foot ; grain = 1/7000th ounce;
data are adjusted to 12% CO,.

COMBUSTION TEST DATA
TEST # 11.2 FUEL CODE : 2
202
OBJECTIVE : To examine the combustion efficiency for a
number of woody biomass fuels ( nine fuels in all, including
test 6.3 from the optimal firing condition test on fuel #1.
Length of run = 30 (minutes)
FUEL AND AIR PARAMETERS (CONSTANT FOR TEST)
Fuel feedrate 1 (FF1) = 3.943 (lb/hr-dry basis)
Air/Fuel Ratio (A/F) = 6.197 (lb-dry air/lb-dry fuel)
Fuel feedrate 2 (FF2) = 35208.12 (Btu/hr)
Excess Air (%EA) percent = 50.38
Under fire air percent (%UF) = 30.00
Under-fire (UF) air supply temperature (TUF) = 74 CF)
Over-fire (OF) air supply temperature' (TOF) = 69 (°r')
: OF air temperature is measured before entrance to theBiomass Combustion Unit (BCU). This is not the actualsupply temperature. It was not feasible to measure theactual OF supply air (heated as it travels down the OF tubeinside the BCU) because of the difficulty of thermocoupleplacement and lifespan in the harsh combustion gasenvironment.

203
COMBUSTION GAS DATA
( From Enerac Gas Analysis Unit and Separate Temp. Probes )
Note : All data is given as the mean value first and the
standard deviation second, separated by a colon. Example
"mean CO_ value" : "standard deviation of mean CO,"
Gas temperature UFO = 1354.29 : 22.78 (SF)
- Carbon monoxide (CO) = 114.60 : 30.89 (ppm)
Oxygen (0,) = 9.52 : 1.81 (% by dry volume)
Carbon dioxide (CO,) = 11.21 : 1.79 (% by dry volume)
- Hydrocarbons (HCs) = 0.0 : 0.0 (% by dry volume)
Oxides of Nitrogen (NO,) = 130.30 : 18.39 (ppm)
Sulphur dioxide (SOc) = 0.0 : 0.0 (ppm)
- Particulate in exhaust (PART.) = .0898 (grains/dscf)°
Combustible in Particulate (COMB.) = 7.080 (% dry basis)
: dscf = dry standard cubic foot ; grain = 1/7000th ounce;
data are adjusted to 12% CO2.

204
COMBUSTION TEST DATA
TEST # 11.3 FUEL CODE : 6
OBJECTIVE : To examine the combustion efficiency for a
number of woody biomass fuels ( nine fuels in all, including
test 6.3 from the optimal firing condition test on fuel #1.
Length of run = 30 (minutes)
FUEL AND AIR PARAMETERS (CONSTANT FOR TEST)
Fuel feedrate 1 (FF1) = 4.456 (lb/hr-dry basis)
Air/Fuel Ratio (A/F) = 6.339 (lb-dry air/lb-dry fuel)
Fuel feedrate 2 (FF2) = 40735.10 (Btu/hr)
Excess Air (%EA) percent = 33.06
Under fire air percent (%UF) = 30.00
Under-fire (UF) air supply temperature (TUF) = 76 (*F)
Over-fire (OF) air supply temperature' (TOP) = 71 (*F)
: OF air temperature is measured before entrance to theBiomass Combustion Unit (BCU). This is not the actualsupply temperature. It was not feasible to measure theactual OF supply air (heated as it travels down the OF tubeinside the BCU) because of the difficulty of thermocoupleplacement and lifespan in the harsh combustion gasenvironment.

205
COMBUSTION GAS DATA
( From Enerac Gas Analysis Unit and Separate Temp. Probes )
Note : All data is given as the mean value first and the
standard deviation second, separated by a colon. Example
"mean CO. value" : "standard deviation of mean CC,"
Gas temperature UM = 1460.91 : 21.61 (`F)
Carbon monoxide (CO) - 188.20 : 157.48 (ppm)
- Oxygen (02) = 7.99 : 1.38 (% by dry volume)
Carbon dioxide (CO3) = 12.73 : 1.37 (% by dry volume)
Hydrocarbons (HCs) = 0.0 : 0.0 (% by dry volume)
- Oxides of Nitrogen (NO.) = 203.57 : 22.52 (ppm)
Sulphur dioxide (SO,) = 0.0 : 0.0 (ppm)
- Particulate in exhaust (PART.) = .0623 (grains/dscf)°
- Combustible in Particulate (COMB.) = 3.830 (% dry basis)
: dscf = dry standard cubic foot ; grain = 1/7000th ounce;
data are adjusted to 12% CO,.

206
COMBUSTION TEST DATA
TEST # 11.4 FUEL CODE : 7
OBJECTIVE : To examine the combustion efficiency for a
number of woody biomass fuels ( nine fuels in all, including
test 6.3 from the optimal firing condition test on fuel #1.
Length of run = 30 (minutes)
FUEL AND AIR PARAMETERS (CONSTANT FOR TEST)
Fuel feedrate 1 (FF1) = 3.890 (lb/hr-dry basis)
Air/Fuel Ratio (A/F) = 6.005 (lb-dry air/lb-dry fuel)
Fuel feedrate 2 (FF2) = 33798.29 (Btu/hr)
Excess Air (%EA) percent = 52.42
Under fire air percent (%UF) = 30.00
Under-fire (UF) air supply temperature (TUF) = 78 (pF)
Over-fire (OF) air supply temperatures (TOF) = 72 (CF)
: OF air temperature is measured before entrance to theBiomass Combustion Unit (BCU). This is not the actualsupply temperature. It was not feasible to measure theactual OF supply air (heated as it travels down the OF tubeinside the BCU) because of the difficulty of thermocoupleplacement and lifespan in the harsh combustion gasenvironment.

207
COMBUSTION GAS DATA
( From Enerac Gas Analysis Unit and Separate Temp. Probes )
Note : All data is given as the mean value first and the
standard deviation second, separated by a colon. Example
"mean CO- value" : "standard deviation of mean CO,"
Gas temperature (r.c) = 1337.48 : 31.58 ( °F)
- Carbon monoxide (CO) = 153.07 : 15.94 (ppm)
Oxygen (0:1 = 10.68 : 1.54 (% by dry volume)
Carbon dioxide (CO,) = 10.11 : 1.48 (% by dry volume)
- Hydrocarbons (HCs) = 0.0 : 0.0 (% by dry volume)
Oxides of Nitrogen (NOr) = 214.97 : 34.42 (ppm)
- Sulphur dioxide (SO2) = 0.0 : 0.0 (ppm)
Particulate in exhaust (PART.) = .0372 (grains/dscf)"
Combustible in Particulate (COMB.) = 1.700 (% dry basis)
: dscf = dry standard cubic foot ; grain = 1/7000th ounce;
data are adjusted to 12% CO,.

208
COMBUSTION TEST DATA
TEST # 11.5 FUEL CODE : 4
OBJECTIVE : To examine the combustion efficiency for a
number of woody biomass fuels ( nine fuels in all, including
test 6.3 from the optimal firing condition test on fuel #1.
Length of run = 30 (minutes)
FUEL AND AIR PARAMETERS (CONSTANT FOR TEST)
Fuel feedrate 1 (FF1) = 4.606 (lb/hr-dry basis)
Air/Fuel Ratio (A/F) = 6.187 (lb-dry air/lb-dry fuel)
Fuel feedrate 2 (FF2) - 40469.55 (Btu/hr)
Excess Air (%EA) percent = 28.73
Under fire air percent (%UF) = 30.00
Under-fire (UF) air supply temperature (TUF) = 77 (DE)
Over-fire (OF) air supply temperaturea (TOF) = 73 CF)
" : OF air temperature is measured before entrance to theBiomass Combustion Unit (BCU). This is not the actualsupply temperature. It was not feasible to measure theactual OF supply air (heated as it travels down the OF tubeinside the BCU) because of the difficulty of thermocoupleplacement and lifespan in the harsh combustion gasenvironment.

209
COMBUSTION GAS DATA
( From Enerac Gas Analysis Unit and Separate Temp. Probes )
Note : All data is given as the mean value first and the
standard deviation second, separated by a colon. Example -
"mean CO, value" : "standard deviation of mean CC."
Gas temperature (c) = 1482.34 : 27.48 (°r)
Carbon monoxide (CO) = 134.67 : 192.91 (ppm)
- Oxygen (0.0 = 7.77 : 1.49 (% by dry volume)
Carbon dioxide (CO2) = 12.50 : 2.77 (% by dry volume)
Hydrocarbons (HCs) = 1.70 : 9.16 (% by dry volume)
- Oxides of Nitrogen (NO.) = 125.43 : 28.14 (ppm)
Sulphur dioxide (S02) = 0.0 : 0.0 (ppm)
- Particulate in exhaust (PART.) = .7045 (grains/dscf)"
- Combustible in Particulate (COMB.) = 00.19 (% dry basis)
° : dscf = dry standard cubic foot ; grain = 1/7000th ounce;
data are adjusted to 12% CO,.

COMBUSTION TEST DATA
TEST # 11.6 FUEL CODE : 3
210
OBJECTIVE : To examine the combustion efficiency for a
number of woody biomass fuels ( nine fuels in all, including
test 6.3 from the optimal firing condition test on fuel #1.
Length of run = 30 (minutes)
FUEL AND AIR PARAMETERS (CONSTANT FOR TEST)
Fuel feedrate 1 (FF1) = 3.892 (lb/hr-dry basis)
Air/Fuel Ratio (A/F) = 6.549 (lb-dry air/lb-dry fuel)
Fuel feedrate 2 (FF2) = 34912.21 (Btu/hr)
Excess Air (%EA) percent = 52.34
Under fire air percent (%UF) = 30.00
Under-fire (UF) air supply temperature (TUF) = 78 ( °F)
Over-fire (OF) air supply temperature° (TOF) = 73 (°F)
: OF air temperature is measured before entrance to theBiomass Combustion Unit (BCU). This is not the actualsupply temperature. It was not feasible to measure theactual OF supply air (heated as it travels down the OF tubeinside the BCU) because of the difficulty of thermocoupleplacement and lifespan in the harsh combustion gasenvironment.

211
COMBUSTION GAS DATA
( From Enerac Gas Analysis Unit and Separate Temp. Probes )
Note : All data is given as the mean value first and the
standard deviation second, separated by a colon. Example -
"mean CO, value" : "standard deviation of mean CO,"
Gas temperature (;) = 1395.74 : 20.20 CF)
Carbon monoxide (CO) = 92.83 : 10.20 (ppm)
- Oxygen (02) = 10.52 : 1.13 (% by dry volume)
- Carbon dioxide (CO,) = 10.18 : 1.07 (% by dry volume)
Hydrocarbons (HCs) = 0.00 : 0.00 (% by dry volume)
- Oxides of Nitrogen (NCO = 122.47 : 13.88 (ppm)
Sulphur dioxide (SO2) = 0.0 : 0.0 (ppm)
- Particulate in exhaust (PART.) = .0292 (grains/dscf)a
- Combustible in Particulate (COMB.) = 9.160 (% dry basis)
: dscf = dry standard cubic foot ; grain = 1/7000th ounce;
data are adjusted to 12% CO,.

COMBUSTION TEST DATA
TEST # 12.7 FUEL CODE : 8
212
OBJECTIVE : To examine the combustion efficiency for a
number of woody biomass fuels ( nine fuels in all, including
test 6.3 from the "Optimal Firing Condition Test" on fuel
#1.
Length of run = 30 (minutes)
FUEL AND AIR PARAMETERS (CONSTANT FOR TEST)
Fuel feedrate 1 (FF1) = 4.383 (lb/hr-dry basis)
Air/Fuel Ratio (A/F) = 6.672 (lb-dry air/lb-dry fuel)
Fuel feedrate 2 (FF2) = 37437.80 (Btu/hr)
Excess Air (%EA) percent = 47.04
Under fire air percent (%UF) = 30.00
Under-fire (UF) air supply temperature (TUF) = 78 (°r)
Over-fire (OF) air supply temperature' (TOF) = 73 ( °F)
: OF air temperature is measured before entrance to theBiomass Combustion Unit (BCU). This is not the actualsupply temperature. It was not feasible to measure theactual OF supply air (heated as it travels down the OF tubeinside the BCU) because of the difficulty of thermocoupleplacement and lifespan in the harsh combustion gasenvironment.

213
COMBUSTION GAS DATA
( From Enerac Gas Analysis Unit and Separate Temp. Probes )
Note : All data is given as the mean value first and the
standard deviation second, separated by a colon. Example
"mean CO. value" : "standard deviation of mean CO_"
- Gas temperature (T9) = 1448.46 : 13.40 ('F)
Carbon monoxide (CO) = 138.73 : 30.82 (ppm)
Oxygen (02) = 9.81 : 0.87 (% by dry volume)
- Carbon dioxide (CO,) = 10.94 : 0.92 (% by dry volume)
Hydrocarbons (HCs) = 0.00 : 0.00 (% by dry volume)
- Oxides of Nitrogen (NO,) = 153.80 : 16.46 (ppm)
- Sulphur dioxide (S02) = 0.2 : 1.08 (ppm)
Particulate in exhaust (PART.) = .6311 (grains /dscf)'
- Combustible in Particulate (COMB.) = 00.98 (% dry basis)
: dscf = dry standard cubic foot ; grain = 1/7000th ounce;
data are adjusted to 12% CO,.

214
COMBUSTION TEST DATA
TEST 1 11.8 FUEL CODE : 9
OBJECTIVE : To examine the combustion efficiency for a
number of woody biomass fuels ( nine fuels in all, including
test 6.3 from the "Optimal Firing Condition Test" on fuel
#1.
Length of run = 30 (minutes)
FUEL AND AIR PARAMETERS (CONSTANT FOR TEST)
Fuel feedrate 1 (FF1) = 4.118 (lb/hr-dry basis)
Air/Fuel Ratio (A/F) = 6.152 (lb-dry air/lb-dry fuel)
Fuel feedrate 2 (FF2) = 31019.22 (Btu/hr)
Excess Air (%EA) percent = 68.21
Under fire air percent (%UF) = 30.00
Under-fire (UF) air supply temperature (TUF) = 79 (°F)
Over-fire (OF) air supply temperature' (TOF) = 73 (°F)
: OF air temperature is measured before entrance to theBiomass Combustion Unit (BCU). This is not the actualsupply temperature. It was not feasible to measure theactual OF supply air (heated as it travels down the OF tubeinside the BCU) because of the difficulty of thermocoupleplacement and lifespan in the harsh combustion gasenvironment.

215
COMBUSTION GAS DATA
( From Enerac Gas Analysis Unit and Separate Temp. Probes )
Note : All data is given as the mean value first and the
standard deviation second separated by a colon. Example -
"mean CO, value" : "standard deviation of mean CO,"
Gas temperature (TO = 1348.10 : 46.58 (°F)
Carbon monoxide (CO) = 119.37 : 18.64 (ppm)
Oxygen (0,) = 11.34 : 2.73 (% by dry volume)
Carbon dioxide (CO,) = 9.39 : 2.62 (% by dry volume)
- Hydrocarbons (HCs) = 0.00 : 0.00 (% by dry volume)
Oxides of Nitrogen (NCO = 165.10 : 50.95 (ppm)
- Sulphur dioxide (SO,) = 0.0 : 0.0 (ppm)
Particulate in exhaust (PART.) = .1678 (grains /dscf)"
Combustible in Particulate (COMB.) = 5.090 (% dry basis)
° : dscf = dry standard cubic foot ; grain = 1/7000th ounce;
data are adjusted to 12% CO,.

216
COMBUSTION TEST DATA
TEST # 12.1 FUEL CODE : 1
OBJECTIVE : To analyze the effect of heating the under fire
air on the combustion efficiency of selected pellet fuels.
Fuels tested, by code : 1, 4, 2, 8, 9 )
Length of run = 30 (minutes)
FUEL AND AIR PARAMETERS (CONSTANT FOR TEST)
Fuel feedrate 1 (FF1) - 3.848 (1b/hr-dry basis)
Air/Fuel Ratio (A/F) = 6.265 (lb-dry air/lb-dry fuel)
Fuel feedrate 2 (FF2) = 35346.57 (Btu/hr)
Excess Air (%EA) percent = 50.20
Under fire air percent (%UF) = 30.00
Under-fire (UF) air supply temperature (TUF) = 78 (`F)
Over-fire (OF) air supply temperature° (TOF) = 73 (CF)
: OF air temperature is measured before entrance to theBiomass Combustion Unit (BCU). This is not the actualsupply temperature. It was not feasible to measure theactual OF supply air (heated as it travels down the OF tubeinside the BCU) because of the difficulty of thermocoupleplacement and lifespan in the harsh combustion gasenvironment.

217
COMBUSTION GAS DATA
( From Enerac Gas Analysis Unit and Separate Temp. Probes
Note : All data is given as the mean value first and the
standard deviation second, separated by a colon. Example
"mean CO. value" : "standard deviation of mean CO,"
- Gas temperature (T9) = 1247.63 : 19.06 (`F)
Carbon monoxide (CO) = 123.67 : 16.26 (ppm)
- Oxygen (0,) = 8.02 : 1.28 (% by dry volume)
Carbon dioxide (CO2) = 12.74 : 1.21 (% by dry volume)
Hydrocarbons (HCs) = 0.00 : 0.00 (% by dry volume)
- Oxides of Nitrogen (NO,) = 71.70 : 6.13 (ppm)
Sulphur dioxide (SO2) = 0.0 : 0.0 (ppm)
- Particulate in exhaust (PART.) = .0875 (grains /dscf)"
Combustible in Particulate (COMB.) = 63.83 (% dry basis)
a : dscf = dry standard cubic foot ; grain = 1/7000th ounce;
data are adjusted to 12% CO,.

COMBUSTION TEST DATA
TEST # 12.2 FUEL CODE : 1
218
OBJECTIVE : To analyze the effect of heating the under fire
air on the combustion efficiency of selected pellet fuels.
Fuels tested, by code : 1, 4, 2, 8, 9 )
Length of run = 30 (minutes)
FUEL AND AIR PARAMETERS (CONSTANT FOR TEST)
Fuel feedrate 1 (FF1) = 3.848 (lb/hr-dry basis)
Air/Fuel Ratio (A/F) = 6.265 (lb-dry air/lb-dry fuel)
Fuel feedrate 2 (FF2) = 35346.57 (Btu/hr)
Excess Air (%EA) percent = 50.20
Under fire air percent (%UF) = 30.00
Under-fire (UF) air supply temperature (TUF) = 78 (Cr')
Over-fire (OF) air supply temperature' (TOF) = 307 (`F)
: OF air temperature is measured before entrance to theBiomass Combustion Unit (BCU). This is not the actualsupply temperature. It was not feasible to measure theactual OF supply air (heated as it travels down the OF tubeinside the BCU) because of the difficulty of thermocoupleplacement and lifespan in the harsh combustion gasenvironment.

219
COMBUSTION GAS DATA
( From Enerac Gas Analysis Unit and Separate Temp. Probes )
Note : All data is given as the mean value first and the
standard deviation second, separated by a colon. Example
"mean CO, value" "standard deviation of mean CO-"
Gas temperature (rc) = 1280.43 : 15.89 (`F)
Carbon monoxide (CO) = 71.63 : 9.90 (ppm)
- Oxygen (OA 8.48 : 1.31 (% by dry volume)
Carbon dioxide (CO,) = 12.30 : 1.18 (% by dry volume)
Hydrocarbons (HCs) = 0.00 : 0.00 (% by dry volume)
- Oxides of Nitrogen (NO.)
Sulphur dioxide (SOA =
= 69.67 : 6.17
0.0 : 0.0 (ppm)
(ppm)
Particulate in exhaust (PART.) = .0468 (grains /dscf)"
Combustible in Particulate (COMB.) = 9.62 (% dry basis)
: dscf = dry standard cubic foot ; grain = 1/7000th ounce;
data are adjusted to 12% CO,.

220
COMBUSTION TEST DATA
TEST r 12.3 FUEL CODE : 4
OBJECTIVE : To analyze the effect of heating the under fire
air on the combustion efficiency of selected pellet fuels.
Fuels tested, by code : 1, 4, 2, 8, 9 )
Length of run = 30 (minutes)
FUEL AND AIR PARAMETERS (CONSTANT FOR TEST)
Fuel feedrate 1 (FF1) = 4.977 (lb/hr-dry basis)
Air/Fuel Ratio (A/F) = 6.187 (lb-dry air/lb-dry fuel)
Fuel feedrate 2 (FF2) = 43729.33 (Btu/hr)
Excess Air (%EA) percent = 19.13
Under fire air percent (%UF) - 30.00
Under-fire (UF) air supply temperature (TUF) = 77 CF)
Over-fire (OF) air supply temperature' (TOF) = 306 (oF)
: OF air temperature is measured before entrance to theBiomass Combustion Unit (BCU). This is not the actualsupply temperature. It was not feasible to measure theactual OF supply air (heated as it travels down the OF tubeinside the BCU) because of the difficulty of thermocoupleplacement and lifespan in the harsh combustion gasenvironment.

221
COMBUSTION GAS DATA
( From Enerac Gas Analysis Unit and Separate Temp. Probes )
Note : All data is given as the mean value first and the
standard deviation second separated by a colon. Example -
"mean CO, value" : "standard deviation of mean COil
Gas temperature (C) = 1469.99 : 30.85 (°F)
Carbon monoxide (CO) = 315.18 : 640.11 (ppm)
- Oxygen (02) = 5.68 : 4.76 (% by dry volume)
Carbon dioxide (CO,) = 14.97 : 4.53 (% by dry volume)
Hydrocarbons (HCs) = 0.59 : 1.61 (% by dry volume)
- Oxides of Nitrogen (NO,) = 136.83 : 40.27 (ppm)
Sulphur dioxide (S0,) = 0.40 : 1.47 (ppm)
- Particulate in exhaust (PART.) = .0782 (grains/dscf)'
Combustible in Particulate (COMB.) = 0.49 (% dry basis)
: dscf = dry standard cubic foot ; grain = 1/7000th ounce;
data are adjusted to 12% CO,.
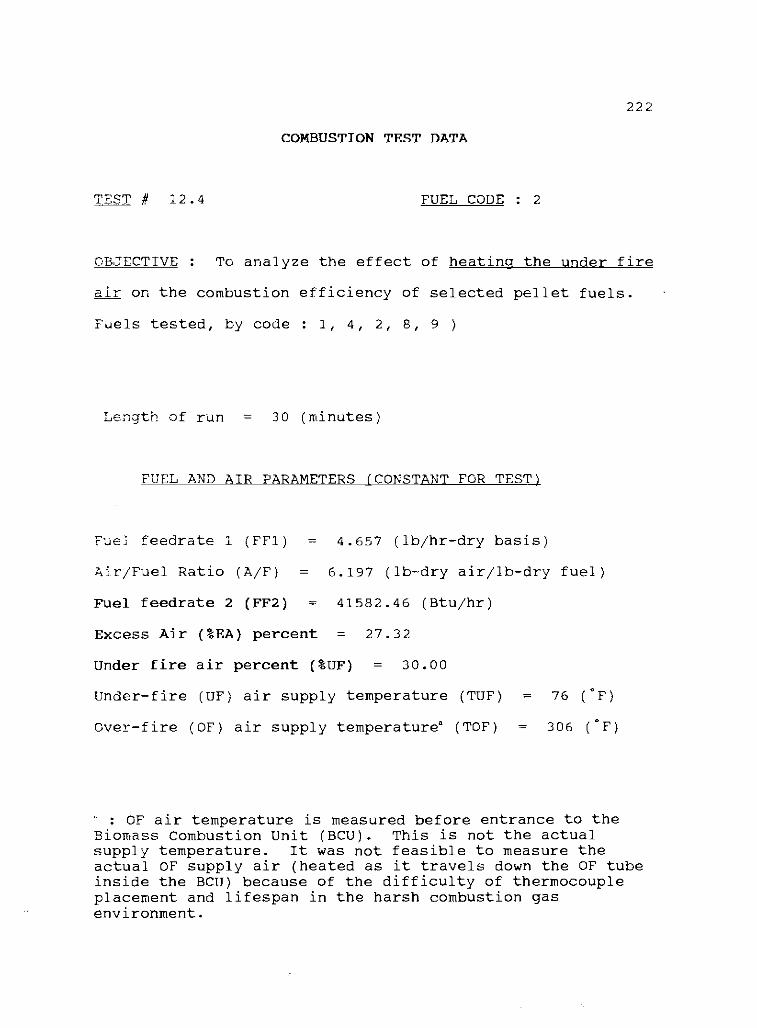
COMBUSTION TEST DATA
TEST # 12.4 FUEL CODE : 2
222
OBJECTIVE : To analyze the effect of heating the under fire
air on the combustion efficiency of selected pellet fuels.
Fuels tested, by code : 1, 4, 2, 8, 9 )
Length of run = 30 (minutes)
FUEL AND AIR PARAMETERS (CONSTANT FOR TEST)
Fuel feedrate 1 (FF1) = 4.657 (lb/hr-dry basis)
Air/Fuel Ratio (A/F) = 6.197 (lb-dry air/lb-dry fuel)
Fuel feedrate 2 (FF2) = 41582.46 (Btu/hr)
Excess Air (%EA) percent = 27.32
Under fire air percent (%UF) = 30.00
Under-fire (UF) air supply temperature (TUF) = 76 ('F)
Over-fire (OF) air supply temperatures (TOF) = 306 (CF)
: OF air temperature is measured before entrance to theBiomass Combustion Unit (BCU). This is not the actualsupply temperature. It was not feasible to measure theactual OF supply air (heated as it travels down the OF tubeinside the BCU) because of the difficulty of thermocoupleplacement and lifespan in the harsh combustion gasenvironment.

223
COMBUSTION GAS DATA
( From Enerac Gas Analysis Unit and Separate Temp. Probes )
Note : All data is given as the mean value first and the
standard deviation second, separated by a colon. Example -
"mean CO, value" : "standard deviation of mean CO,"
Gas temperature (TO = 1485.24 : 52.46 ("F)
Carbon monoxide (CO) = 334.42 : 624.89 (ppm)
Oxygen (0,) = 9.42 : 6.34 (% by dry volume)
Carbon dioxide (CO,) = 11.70 : 5.74 (% by dry volume)
- Hydrocarbons (HCs) = 0.85 : 1.39 (% by dry volume)
Oxides of Nitrogen (NQ) = 128.90 : 62.89 (ppm)
- Sulphur dioxide (SO,) = 0.40 : 1.50 (ppm)
Particulate in exhaust (PART.) - .0575 (grains/dscf)-
- Combustible in Particulate (COMB.) = 6.14 (% dry basis)
: dscf = dry standard cubic foot ; grain = 1/7000th ounce;
data are adjusted to 12% CO,.ZZ

COMBUSTION TEST DATA
TEST # 12.5 FUEL CODE : 8
224
OBJECTIVE : To analyze the effect of heating the under fire
air on the combustion efficiency of selected pellet fuels.
Fuels tested, by code : 1., 4, 2, 8, 9 )
Length of run = 30 (minutes)
FUEL AND AIR PARAMETERS (CONSTANT FOR TEST)
Fuel feedrate 1 (FF1) = 4.971 (lb/hr-dry basis)
Air/Fuel Ratio (A/F) = 6.672 (lb-dry air/lb-dry fuel)
Fuel feedrate 2 (FF2) - 46150.23 (Btu/hr)
Excess Air (%EA) percent = 19.28
Under fire air percent (%UF) = 30.00
Under-fire (UF) air supply temperature (TUF) = 77 ("F.)
Over-fire (OF) air supply temperature' (TOP) = 307 (°F)
OF air temperature is measured before entrance to theBiomass Combustion Unit (BCU). This is not the actualsupply temperature. It was not feasible to measure theactual OF supply air (heated as it travels down the OF tubeinside the BCU) because of the difficulty of thermocoupleplacement and lifespan in the harsh combustion gasenvironment.

225
COMBUSTION GAS DATA
( From Enerac Gas Analysis Unit and Separate Temp. Probes
Note : All data is given as the mean value first and the
standard deviation second separated by a colon. Example -
"mean CO, value" : "standard deviation of mean CO."
- Gas temperature ('F) = 1598.78 : 21.65 (°F)
Carbon monoxide (CO) = 96.932 : 18.92 (ppm)
- Oxygen (0,) = 4.70 : 1.17 (% by dry volume)
- Carbon dioxide (CO,) = 15.94 : 1.13 (% by dry volume)
- Hydrocarbons (HCs) = 0.00 : 0.00 (% by dry volume)
- Oxides of Nitrogen (NCO = 191.80 : 17.52 (ppm)
Sulphur dioxide (SO,) = 0.00 : 0.00 (ppm)
- Particulate in exhaust (PART.) = .7758 (grains/dscf)°
- Combustible in Particulate (COMB.) = 0.35 (% dry basis)
a dscf = dry standard cubic foot ; grain = 1/7000th ounce;
data are adjusted to 12% CO,.

226
COMBUSTION TEST DATA
TEST # 12.6 FUEL CODE : 9
OBJECTIVE : To analyze the effect of heating the under fire
air on the combustion efficiency of selected pellet fuels.
Fuels tested, by code : 1, 4, 2, 8, 9 )
Length of run = 30 (minutes)
FUEL AND AIR PARAMETERS (CONSTANT FOR TEST)
Fuel feedrate 1 (FF1) - 4.413 (lb/hr-dry basis)
Air/Fuel Ratio (A/F) = 6.152 (lb-dry air/lb-dry fuel)
Fuel feedrate 2 (FF2) = 38830.61 (Btu/hr)
Excess Air (%EA) percent = 34.36
Under fire air percent (%UF) = 30.00
Under-fire (UF) air supply temperature (TUF) = 78 (sF)
Over-fire (OF) air supply temperature (TOF) = 306 ( °F)
: OF air temperature is measured before entrance to theBiomass Combustion Unit (BCU). This is not the actualsupply temperature. It was not feasible to measure theactual OF supply air (heated as it travels down the OF tubeinside the BCU) because of the difficulty of thermocoupleplacement and lifespan in the harsh combustion gasenvironment.
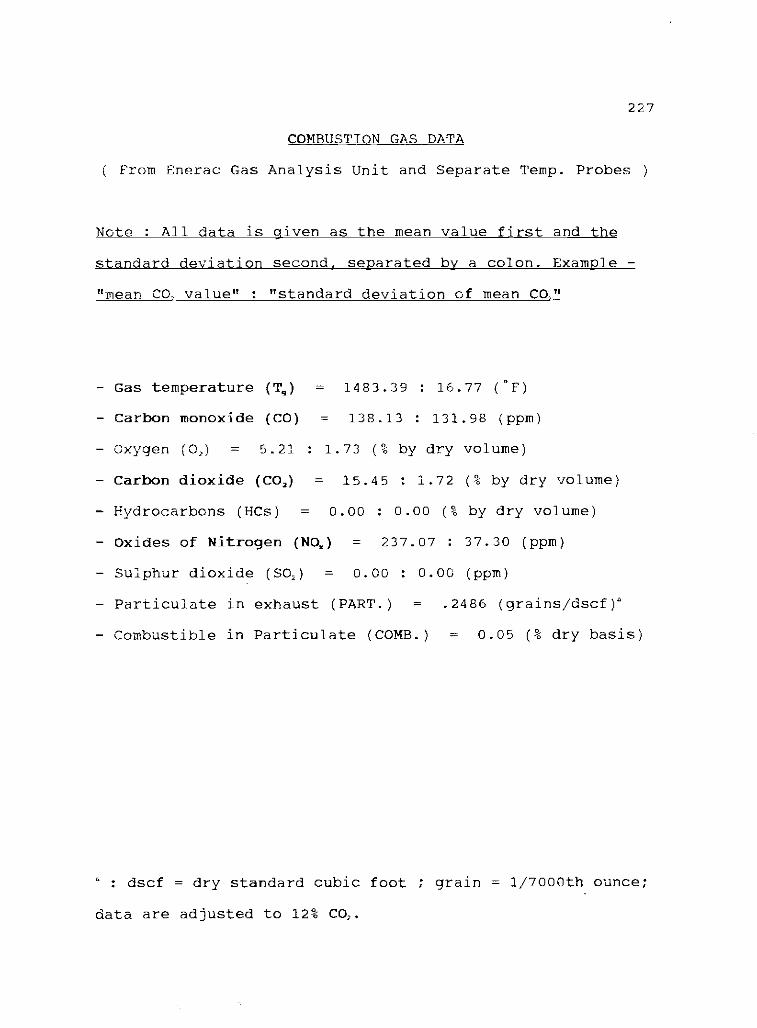
227
COMBUSTION GAS DATA
( From Enerac Gas Analysis Unit and Separate Temp. Probes )
Note : All data is given as the mean value first and the
standard deviation second, separated by a colon. Example
"mean CO, value" : "standard deviation of mean CO,"
Gas temperature (71.;) = 1483.39 : 16.77 (sF)
Carbon monoxide (CO) = 138.13 : 131.98 (ppm)
- oxygen (OA = 5.21 : 1.73 (% by dry volume)
Carbon dioxide (CO,) = 15.45 : 1.72 (% by dry volume)
- Hydrocarbons (HCs) = 0.00 : 0.00 (% by dry volume)
Oxides of Nitrogen (NO.) = 237.07 : 37.30 (ppm)
Sulphur dioxide (SO,) = 0.00 : 0.00 (ppm)
- Particulate in exhaust (PART.) = .2486 (grains /dscf)a
- Combustible in Particulate (COMB.) - 0.05 (% dry basis)
: dscf = dry standard cubic foot ; grain = 1/7000th ounce;
data are adjusted to 12% CO,.

228
APPENDIX E
FUEL HOPPER FIGURE

se,s-c20
MOTOR
FUEL HOPPER
FUEL METERING DRUM<VARIABLE R.P.m.>
MOTOR
FEED TUBE WITH HORIZONTALFUEL AUGER
Figure 21. Fuel Hopper, Metering Drum, and HorizontalAuger. This System Feeds Pellet Fuel to the BiomassCombustion Unit ( BCU ). Dimensions are in INCHES.
NJNJ0 0
Related Documents

![APEX HOME INSPECTIONS · APEX HOME INSPECTIONS (763) 441-446 alan@apexhomemn.com HOME ADDRESS [Redacted for privacy of sample report] CLIENT NAME [Redacted for privacy of sample report]](https://static.cupdf.com/doc/110x72/5fce02a5ec05aa463951b966/apex-home-inspections-apex-home-inspections-763-441-446-alanapexhomemncom-home.jpg)