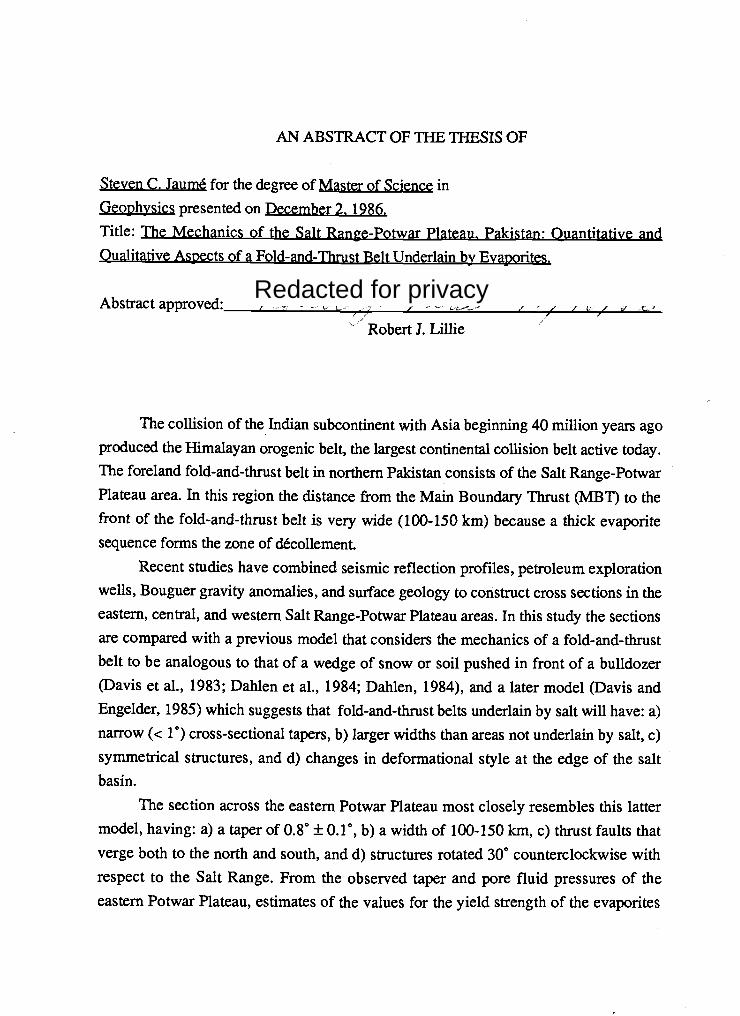
AN ABSTRACT OF THE THESIS OF Steven C. Jaumé for the degree of Master of Science in Geophysics presented on Title: The Mechanics of the Salt Range-Potwar Plateau. Pakistan: Quantitative and Qualitative Aspects of a Fold-and-Thrust Belt Underlain by Evaporites. Abstract approved Robert J. Lillie The collision of the Indian subcontinent with Asia beginning 40 million years ago produced the Himalayan orogenic belt, the largest continental collision belt active today. The foreland fold-and-thrust belt in northern Pakistan consists of the Salt Range-Potwar Plateau area. In this region the distance from the Main Boundary Thrust (MBT) to the front of the fold-and-thrust belt is very wide (100-150 km) because a thick evaporite sequence forms the zone of décollement. Recent studies have combined seismic reflection profiles, petroleum exploration wells, Bouguer gravity anomalies, and surface geology to construct cross sections in the eastern, central, and western Salt Range-Potwar Plateau areas. In this study the sections are compared with a previous model that considers the mechanics of a fold-and-thrust belt to be analogous to that of a wedge of snow or soil pushed in front of a bulldozer (Davis et al., 1983; Dahlen et al., 1984; Dahlen, 1984), and a later model (Davis and Engelder, 1985) which suggests that fold-and-thrust belts underlain by salt will have: a) narrow (< 1°) cross-sectional tapers, b) larger widths than areas not underlain by salt, c) symmetrical structures, and d) changes in deformational style at the edge of the salt basin. The section across the eastern Potwar Plateau most closely resembles this latter model, having: a) a taper of 0.8° ± 0.1°, b) a width of 100-150 kin, c) thrust faults that verge both to the north and south, and d) structures rotated 30° counterclockwise with respect to the Salt Range. From the observed taper and pore fluid pressures of the eastern Potwar Plateau, estimates of the values for the yield strength of the evaporites Redacted for privacy

Welcome message from author
This document is posted to help you gain knowledge. Please leave a comment to let me know what you think about it! Share it to your friends and learn new things together.
Transcript
AN ABSTRACT OF THE THESIS OF
Steven C. Jaumé for the degree of Master of Science in
Geophysics presented on
Title: The Mechanics of the Salt Range-Potwar Plateau. Pakistan: Quantitative and
Qualitative Aspects of a Fold-and-Thrust Belt Underlain by Evaporites.
Abstract approved
Robert J. Lillie
The collision of the Indian subcontinent with Asia beginning 40 million years ago
produced the Himalayan orogenic belt, the largest continental collision belt active today.
The foreland fold-and-thrust belt in northern Pakistan consists of the Salt Range-Potwar
Plateau area. In this region the distance from the Main Boundary Thrust (MBT) to the
front of the fold-and-thrust belt is very wide (100-150 km) because a thick evaporitesequence forms the zone of décollement.
Recent studies have combined seismic reflection profiles, petroleum exploration
wells, Bouguer gravity anomalies, and surface geology to construct cross sections in the
eastern, central, and western Salt Range-Potwar Plateau areas. In this study the sections
are compared with a previous model that considers the mechanics of a fold-and-thrust
belt to be analogous to that of a wedge of snow or soil pushed in front of a bulldozer(Davis et al., 1983; Dahlen et al., 1984; Dahlen, 1984), and a later model (Davis and
Engelder, 1985) which suggests that fold-and-thrust belts underlain by salt will have: a)
narrow (< 1°) cross-sectional tapers, b) larger widths than areas not underlain by salt, c)
symmetrical structures, and d) changes in deformational style at the edge of the saltbasin.
The section across the eastern Potwar Plateau most closely resembles this latter
model, having: a) a taper of 0.8° ± 0.1°, b) a width of 100-150 kin, c) thrust faults that
verge both to the north and south, and d) structures rotated 30° counterclockwise with
respect to the Salt Range. From the observed taper and pore fluid pressures of theeastern Potwar Plateau, estimates of the values for the yield strength of the evaporites
Redacted for privacy

(t0) and the coefficent of internal friction (pt) are calculated as = 1.33-1.50 MPa and
= 0.95-1.04, which are then applied to the other cross sections.
In the central and western sections a basement uplift, the Sargodha High,interferes with the front of the fold-and-thrust belt. This feature causes the ramping ofthe Salt Range Thrust and produces a relatively steep basement slope (2°-4°) beneath the
Potwar Plateau. This dip, together with the weak evaporite layer, allows the thrustwedge of the southern Potwar Plateau to be pushed over the décollement withoutundergoing internal deformation. In detail, the Salt Range ramping is caused by a large
normal fault in the basement in the central section and the basement upwarp of theSargodha High in the western section.
The northern Potwar Plateau is strongly folded and faulted, yet the topographic
slope remains flat. Although the deformation suggests that salt is not present there, the
observed taper in the northern Potwar Plateau is best fitted by the model with salt at the
décollement. Combining this with published paleomagnetic and geologic constraints, a
model for the evolution of the northern Potwar Plateau suggests that the area deformed
as a steeply tapered (3.5°-5.5°) thrust wedge until approximately 2 million years ago,
when the décollement encountered the Salt Range formation. Between 2 m.y.a. and the
present, the northern Potwar Plateau has been pushed along the salt décollement without
deformation, and erosion has reduced its original steep topographic slope to a nearlylevel surface.
The success of the mechanical model in predicting the observed features in the Salt
Range-Potwar Plateau suggests that salt may lie beneath other fold-and-thrust belts in
Pakistan. Two areas, the Sulaiman Lobe and the Karachi Arc, are possible candidates.
Although published subsurface information is lacking in these areas, surfaceobservations show that they both: a) extend far across the foreland, b) exhibit lowtopographic slopes, c) display symmetrical structures, and d) show a change in structural
orientation along what is believed to be the edge of the salt basin.

The Mechanics of the Salt Range-Potwar Plateau, Pakistan:
Qualitative and Quantitative Aspects of a Fold-and-Thrust Belt Underlain by Evaporites
by
Steven C. Jaumé
A THESIS
submitted to
Oregon State University
in partial fulfillment of
the requirements for the
degree of
Master of Science
Completed December 2, 1986
Commencement June 1987

APPROVAL:
Assistant Professor of Geophysics in charge of major
Dean o(College of Oceanography
Dean of Graduate
Date thesis is presented December 2. 1986
Typed by Steven C. Jaumé
Redacted for privacy
Redacted for privacy
Redacted for privacy

ACKNOWLEDGEMENTS
I first and foremost would like to thank my parents, Charles and Marilyn Jaumé,
without whom none of this would have ever been possible. It was primarily theirsupport and devotion that made me realize my capabilities, and the possibility that I could
become something more than just another bump on a cypress log down in the bayous.
My thanks also go out to the chief instigator of this whole mess, my advisor Bob
Lillie. It was his tremendous enthusiasm that first got me interested in this project and his
guidance that has corralled my (near) intelligence into something productive. I would
also like to thank him for showing me that it is possible for even a Tulane graduate to
learn how to write, and that even a crazy Cajun can make an impact upon the world of
science.
I also want to thank the many people of the faculty and staff of the College of
Oceanography and the Department of Geology who have helped me in one way or
another during my stay here at 0. S. U. On this honor roll are my many instructors and
friends among the faculty here: Bill Menke, Dallas Abbott, Randy Jacobson, Dale Bibee,
Shaul Levi, Rob Holman, Dick Couch, Vern Kuim, Bob Duncan, Bob Yeats, Bob
Lawrence, to name a few. I would also like to acknowledge some of my friends and
helpers among the staff here: Deb Jacobson, Marcia Turnbull, Donna Moore,Anne-Marie Fagan, and Anne Poulson. Without the help of these people and many more
like I would have never figured out what I was doing here in the first place.
Next come my many friends among the student body. What can I say? With all the
wild, decadent parties, ski trips, hiking trips, strange games of D&D and Paranoia,
volleyball games, softball games, and general all around weirdness they got me into, it's
a wonder that I found the time to work on a thesis at all. There are a few notablepersonalities that stand out and must be recognized. First, Karen Clemens and her dog
Ripple, for pulling me out my office in the afternoons for a hike, and Karen for pulling
me out the office in the evenings to go to a movie. Without her I may have had to spend
more time in my office (yuck!). I would also like to thank Suzy Leahy for theinnumerable pep talks that kept me going when I thought I was about to lose itcompletely. A special mention goes out to my international ceilmates (officemates) in
OC-il 168; Michel Poujol, Haraldur Audunsson, and Pordur Arason, for making life
very interesting. Also, my many other friends among the Geophysics grad students,
Bruce, Fa, Marijke, Bob, Miguel, Osvaldo, Bymdis, and Pierre. A special thanks goes
to my friends in both the Geology and Geophysics Departments who worked with me on
the Himalayan foreland project, who often were the first to endure the outburst of some
of my wild ideas: Dan Baker, "Leathery" Mike Leathers, Ned(ly) Pennock, and Yannick
Duroy.
This study is part of a cooperative project involving Oregon State University and
the Geological Survey of Pakistan. I am grateful to the Government of Pakistan and the
Oil and Gas Development Coporation of Pakistan for the release of the subsurface data
used in this study. I am also grateful to TEXACO, Inc. for the Texaco Fellowship which
provided much of my student support while here at Oregon State University. This work
was supported by National Science Foundation grants INT-81-18403, INT-86-09914,
EAR-83-18194, EAR-86-08224; by the Petroleum Research Fund of the American
Chemical Society, grant PRF-17932-G2; and gifts from CONOCO, Inc. andCHEVRON International.

TABLE OF CONTENTS
INTRODUCTION 1
TECTONIC SETTING 4
MECHANICS OF FOLD-AND-THRUST BELTS 8
Early work in mechanics of fold-and-thrust belts 8
Recent work in mechanics of fold-and-thrust belts 11
New work in mechanics of fold-and-thrust belts 18
MECHANICS OF THE SALT RANGE-POT WAR PLATEAU 25
Eastern Potwar Plateau 25
Central Salt Range-Potwar Plateau 32Western Salt Range-Potwar Plateau 38
COMPARISIONS WITH OTHER FOLD BELTS OF PAKISTAN 41
Salt Range-Potwar Plateau vs. Kashmir Himalaya 41
Sulaiman Lobe vs. Sulaiman Range 44Karachi Arc vs. Kirthar Range 47Summary of Lobes and Re-entrants in Pakistan 47
CONCLUSIONS 51
BIBLIOGRAPHY 54

LIST OF FIGURES
Figure Page1. Tectonic regimes of Pakistan. 22. Generalized tectonic map of northern Pakistan. 5
3. Davis et al. (1983) model for the mechanics of accretionary 13
wedges and foreland fold-and-thrust belts.
4. A fold-and-thrust belt underlain by salt vs. non-salt substrate. 17
5. Model 1 of a noncohesive Coulomb wedge on top of a 21
curved basement surface.
6. Model 2 of a cohesive Coulomb wedge on top of a curved 22
basement surface.
7. Model 3 of noncohesive Coulomb wedge underlain by salt on 23
top of a curved basement surface.
8. B-B'. Preliminary interpreted cross section across the eastern 26Potwar Plateau.
9. Structural map of the Potwar Plateau, including locations of 27wells cited in text.
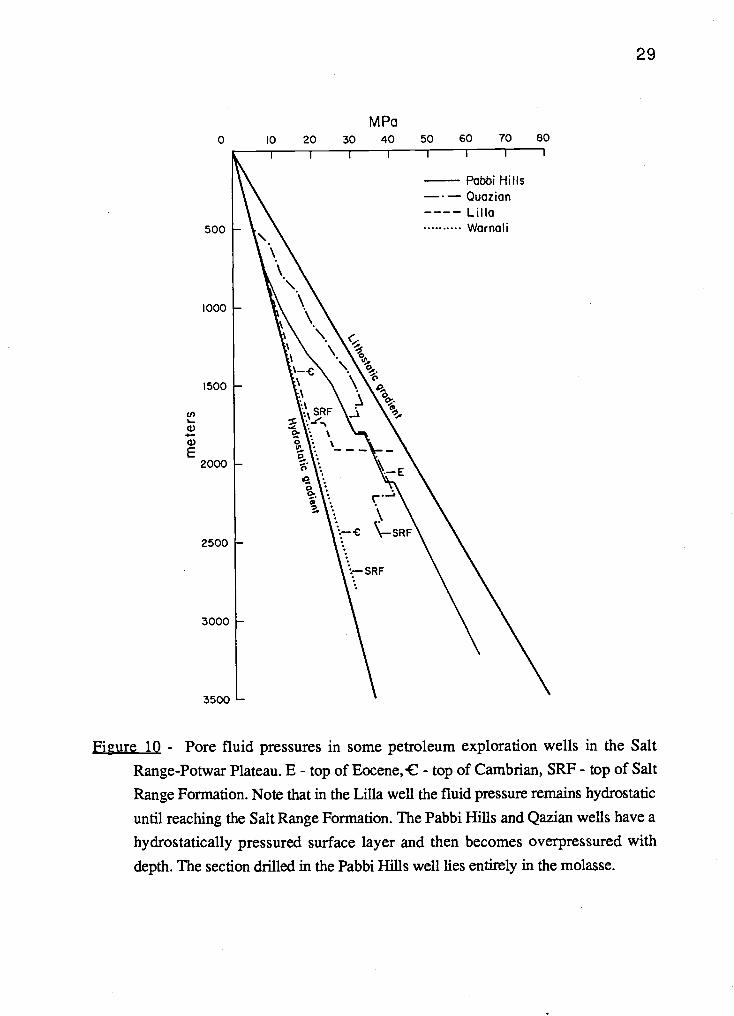
10. Pore fluid pressures in some exploration wells in the Salt 29Range-Potwar Plateau.
11. Tradeoff curve between the coefficent of internal friction and 31
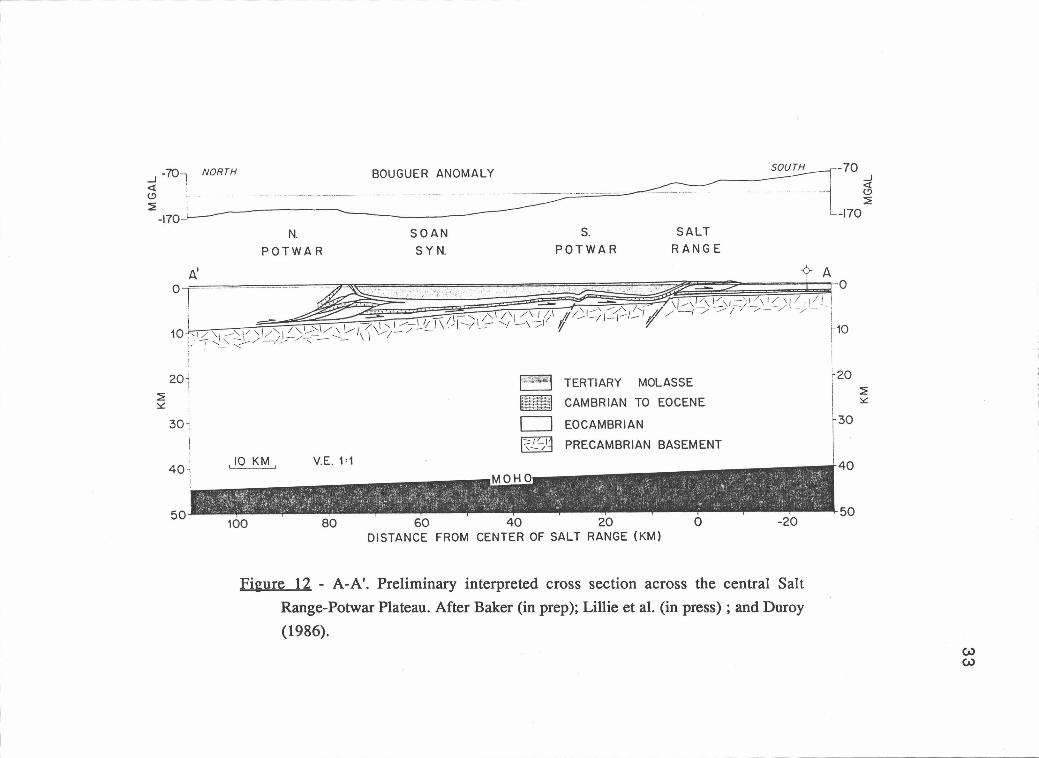
evaporite yield strength for the eastern Potwar Plateau.12. A-A'. Preliminary interpreted cross section across the central 33
Salt Range-Potwar Plateau.
13. Cartoon showing a possible structural evolution of the northern 37
Potwar Plateau.
14. C-C'. Preliminary interpreted cross section across the western 39
Salt Range-Potwar Plateau.
15. Topography of the Salt Range-Potwar Plateau area. 4216. Topography of the Kashmir Himalaya. 4317. Topography of the Sulaiman Range and Sulaiman Lobe. 4518. Structural map of Sulaiman Lobe. 4619. Topography of the Kirthar Range and Karachi Arc. 4820. Structural map of the Karachi Arc. 49
THE MECHANICS OF THE SALT RANGE-POT WAR PLATEAU, PAKISTAN:
QUAN11TATIVE AND QUAL1TATWE ASPECFS OF A FOLD-AND-THRUST
BELT UNDERLAIN BY EVAPORITES
INTRODUCTION
Beginning about 40 million years ago, collision of the Indian subcontinent with
Eurasia produced the spectacular Himalayan arc, along with a series of mountain belts to
the east and west. This study concentrates on one these fringing belts, the SaltRange-Potwar Plateau area of northern Pakistan (figure 1). In northern Paldstan theHimalayan arc changes from a northwest-southeast trend to a nearly east-westorientation, bending around the Hazara-Kashmir syntaxis. The Salt Range, thesouthernmost of these east-west trending ranges, is the active front of deformation.
Immediately to the north, the relatively flat Potwar Plateau separates the Salt Range from
the main Himalayan ranges of northern Pakistan.
This study of the mechanics of the Salt Range-Potwar Plateau of Pakistan stems
from ongoing work by Oregon State University (OSU) on the geology and geophysics
of Pakistan and from recent quantitative modelling of the mechanics of fold-and-thrust
belts by Davis et al. (1983), Dahlen et al. (1984), Dahien (1984), and Davis andEngelder (1985). The release of approximately 3000 km of seismic reflection profiles
(e.g. Khan et al., 1986) to OSU by the Government of Pakistan has allowed, for the
first time, a three dimensional view of this active fold belt. Integration of these data (e.g.
Baker, in prep.; Duroy, 1986; McDougall, in prep.; Leathers, in prep.; and Pennock, in
prep.) with surface geology, borehole, and gravity data have resulted in cross sectionsthat allow for testing and modification of the mechanical models.
In this study, the mechanics of the Salt Range-Potwar Plateau are examined in the
context of the Davis and Engelder (1985) model for a fold-and-thrust belt developed
upon an evaporite layer. Also, it is noted from the cross sections that one of theassumptions of the mechanical model, that the basement slope beneath a thrust wedge is
linear, is not appropriate throughout this area. A generalization of the model to include a
nonlinear basement surface is presented, and its effect on the surface topography of a
thrust wedge is tested.
The observed wedge geometry and structure of the Salt Range-Potwar Plateau are
found to be generally consistent with the Davis and Engelder (1985) model. It has the
MKT710
3
- _j'C'
Pesh
Afghanistan Cli
eIt
E610
/QO
Cflagai Arc
'"
C.
0.
"°'F
CLOB
Iran
Makran RangesU
H
Korach
km 500
B
j'o
0'0,. Lahore
/
India
+ 230710
l 300740
2
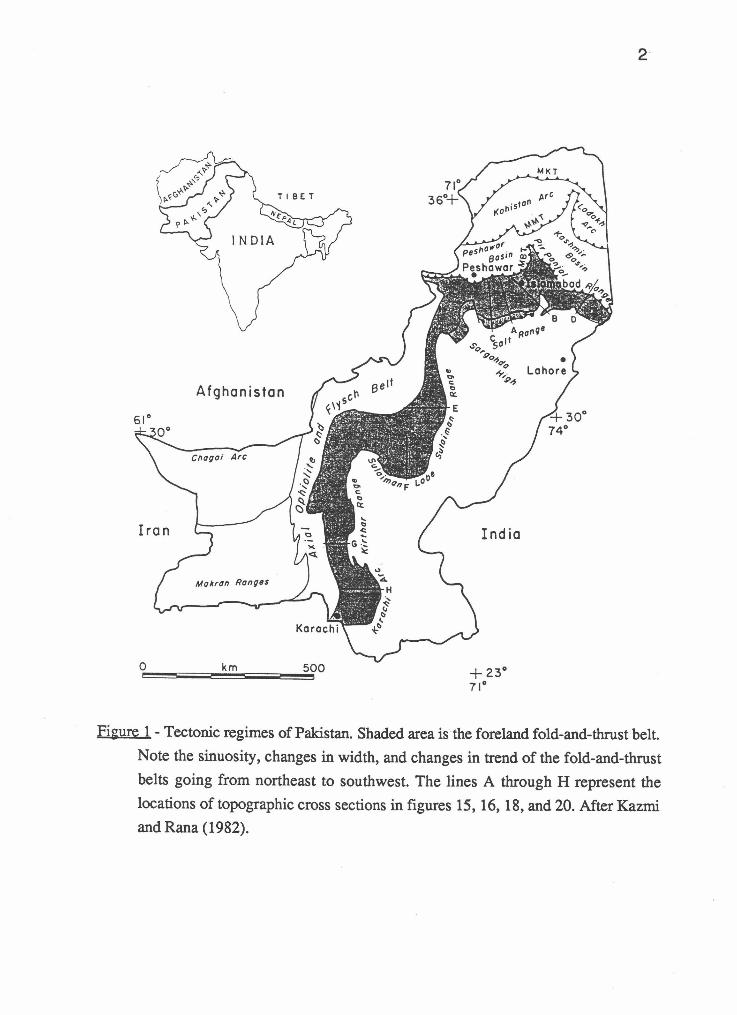
Figure 1 Tectonic regimes of Pakistan. Shaded area is the foreland fold-and-thrust belt.
Note the sinuosity, changes in width, and changes in trend of the fold-and-thrust
belts going from northeast to southwest. The lines A through H represent the
locations of topographic cross sections in figures 15, 16, 18, and 20. After Kazmiand Rana (1982).
3
general characteristics of the model: a) a narrow taper, and b) a broad (100-150 1cm) zone
of overthrusting. The details of the strucure in the Salt Range-Potwar Plateau also agree
with the Davis and Engelder (1985) model, in that: a) there is a lack of surfacedeformation in the central and western Potwar Plateau where the basement dip (13) is
greater than 1°, b) surface deformation is observed in the eastern Potwar Plateau where 13
< 1°, c) the deformation style of the eastern Potwar Plateau consists of narrow,symmetrical anticlines, and thrusts that verge both north and south, and d) there is a
change in the orientation of structural trends at the eastern edge of the salt basin. The
seismic sections show that the Salt Range is the result of ramping along a basement
normal fault. Although the effects of such features are not considered by Davis and
Engelder (1985), their model can be used to show how the low strength evaporites allow
the thrust wedge to be pushed over the ramp with very little internal deformation.
This study shows that for a fold-and-thrust belt underlain by salt it is the dip and
structure of the underlying basement, along with the distribution of the salt, thatprimarily controls the structures developed within the belt. This result should be useful
in the study of other fold-and-thrust belts underlain by salt, but for which subsurface
information is lacking. Also, the generalization of the model for a curved basement is
seen as a possible way of merging the results of plate flexure models derived fromgravity data with mechanical models of thrust belts.
TECTOMC SEllING
From south to north, four major tectonic elements can be defined for the foreland
deformation belt of northern Pakistan (figure 2). They are as follows: a) the Jhelumplain, b) the Salt Range and Trans-Indus Salt Range, c) the Potwar-Kohat Plateaus and
the Bannu Basin, and d) the Main Boundary Thrust bounding the plateaus to the north
(Yeats and Lawrence, 1984). Although this thesis is primarily concerned with the Salt
Range-Potwar Plateau area, it is important to briefly examine all these features toenhance the basic understanding of the tectonics of the region.
A prominent element in the Jhelum plain is the Sargodha High, a basement ridge
that trends obliquely to the Salt Range, but parallel to the overall Himalayan trend. Its
trend is defined both by exposed basement rocks of the Kirana Hills and by a series of
positive gravity anomalies that extend from the foot of the Trans-Indus Salt Range
(Khisor Range) to at least the Pakistan-India border (Farah et al., 1977). There are three
basic interpretations for the Sargodha High: 1) it is caused by flexure due to the Tertiary
underthrusting of the Indian plate beneath Eurasia, similar to an outer trench swell in
oceanic settings (Yeats and Lawrence, 1984), 2) it is an older basement feature similar to
the Aravalli Range of India (Farah et al. 1977), and 3) it is an expression of a recently
activated intracontinental thrust (Lefort, 1975). Seeber et al. (1981) have shown that the
Sargodha High is seismically active, which supports the hypothesis that it is a young
feature associated with continental collision, but observed strike-slip focal mechanisms
leave unanswered the question of its origin (see Duroy, 1986).
The Salt Range and Trans-Indus Salt Range are the southernmost expression of
thrusting in northern Pakistan. They are anomalous in that they bring pre-Tertiary rocks
to the surface at the foreland edge of the thrust belt (the Eocambrian Salt RangeFormation in the Salt Range, Gee, 1980; Permian rocks in the Surghar Range, Meissner
et al., 1974; and the Cambrian Jhelum Group in the Khisor Range, Hemphill andKidwai, 1973). This contrasts sharply with the foreland fold-and-thrust belt in India,
where only Tertiary molasse sediments (Siwalik and Rawalpindi Groups) are exposed.
The central Potwar Plateau can be split into two regions: a) the asymmetric Soan
Syncline occupying the southern part of the Potwar Plateau ,and b) a more deformed
zone to the north. The Soan Syncline has a very gentle southern limb, but the northern
limb is turned up sharply where it meets the first fault of the northern Potwar. In the
northern Potwar Plateau, Tertiary and older rocks are deformed as a classic fold-and-

31
I NORTHERN PAKISTAN ------J--'" 1
GeneralizedTectonic Map / tiaf'
(After Kazml and Rana, 1982)Thru,
L1GENO(O AREa SOUTh OF N!t)
36 EJU..,..w ......
CIOSFOI.
.'_* j "'' iccti TAN
- P,.,.SOn,, S CO,U., SU..OUy AzC r-'
d4SU $NOd
Oregon State Ur.oersity
S I CS PAK -
5. MaIn0.
L.\/
BOSOU PLATEAU
' BANNU
/ BASIN
A
0SOUgoo
JHELUM,
GOOF,,
IP LA I N
9
LytpUr
s
Figure 2 Generalized tectonic map of northern Pakistan. A-A', B-B', and C-C' are
locations of cross sections interpreted by Baker (in prep.), Pennock (in prep.),
and Leathers (in prep.), respectively. F-F' is the line of section for the flexure
model discussed in Duroy (1986). K.F.-Kalabugh Fault, M.B.T.-Main Boundary
Thrust. After Kazmi and Rana (1982).

thrust belt, but even with this more intense deformation the overall topography is as flat
as the less-deformed southern half of the plateau.
West of the Indus River the Kohat Plateau and Bannu Basin correspondstructurally to the northern and southern Potwar Plateau, respectively. The topography
of the Bannu Basin is flat; there is no apparent deformation at the surface and only gentle
folding is observed in the subsurface (Khan et al., 1986). Although the Kohat Plateau is
as deformed as the northern Potwar Plateau, a major difference is that there is significant
topographic relief in the Kohat Plateau. This difference is at least in part due to thepresence in the Kohat Plateau of Eocene evaporites and shales that form an upper level of
detachment and commonly form the cores of anticlines. The rocks in the Kohat Plateau
are strongly folded and faulted, and the topographic relief suggests that the deformation
is recent and may still be occuring.
The Hill Ranges rise sharply along the north side of the Potwar and KohatPlateaus. Along the southern edge of these ranges, thrust faults bring deformed Tertiary,
Cretaceous, Jurassic and Triassic rocks to the surface. In the northern part of the ranges
Paleozoic and Precambrian rocks are exposed. The thrusts of the Hill Ranges have been
correlated with the Main Boundary Thrust (MBT) in the Himalaya, (Yeats andLawrence, 1984). It has been suggested by R. D. Lawrence (pers. comm., 1986) that
the Hill Ranges are the surface expression of a basement ramp.
The stratigraphic section in the Salt Range-Potwar Plateau can be split into four
groups: 1) basement complex, 2) Salt Range Formation, 3) platform section, and 4)
molasse section (Khan et al., 1986). The Precambrian basement complex is believed to
be similar in lithology to the rocks exposed in the Kirana Hills south of the Salt Range,
consisting of metamorphic and volcanic rocks of the Indian shield (Yeats and Lawrence,
1984). Although offset by normal faults associated with flexure (Lillie and Yousuf,
1986; Duroy, 1986), the basement beneath the Salt Range and Potwar Plateau isapparently not involved in thrusting. The Eocambrian Salt Range Formation is an
evaporitic and sedimentary unit that includes the level of décollement for thefold-and-thrust belt. Although there are a number of facies present (mans, anhydrite,
etc.) the dominant facies is halite. The low shear strength of halite makes it the preferred
zone of décollement. The platform section consists of Cambrian to Eocene shallow water
sediments with major unconformities at the base of the Permian and at the base of the
Paleocene. This part of the section has a high acoustic impedence relative to thesurrounding rocks, resulting in a seismic reflection sequence which can be traced
throughout the Salt Range-Potwar Plateau region (Khan et al., 1986; Lillie et al, inpress, 1986). There is also an unconformity between the platform sequence and the
overlying Miocene to Pleistocene synorogenic molasse section. The molasse section
consists of the Rawalpindi and Siwalik Groups, which are over 5000 m thick at the axis
of the Soan Syncine.
The timing of deformation is constrained by paleomagnetic and fission-track
dating information collected in the eastern and central Potwar Plateau (Johnson et al., in
press, 1986). These data record rotation and deformation in the southern Potwar Plateau
4.5-3.0 m.y.a. In the eastern Potwar Plateau, deformation concurrent withcounterclockwise rotation started 3.4 m.y.a. on the northern flank of the Soan Syncline.
This deformation progressed southeastward across the eastern Potwar Plateau to the
Kharian (Pabbi Hills) anticline, which developed surface expression less than 0.4 m.y.a.
In the central Potwar Plateau the data record the uplift of the northern flank of the Soan
Syncline at 2.1-1.9 MyrBP. Based on the timing information from the eastern Potwar
Plateau, Johnson et al. (in press, 1986) date the ramping of the Salt Range as occurring
between 2.2-1.5 MyrBP.
Three cross sections are being constructed, one each in the western (Leathers, in
prep.), central (Baker, in prep.), and eastern (Pennock, in prep.) Salt Range-Potwar
Plateau. These interpretations, especially the shape of the décollement surface, thevariation in thickness of the Salt Range Formation, and the change in thickness of the
overlying wedge, provide important parameters used in this mechanical modeling study.
Bouguer gravity anomaly data provide further constraints on the dip and shape of the
basement surface (Duroy, 1986).
MECHANICS OF FOLD-AND-THRUST BELTS
Early work in mechanics of fold-and-thrust belts
Large overthrusts were first recognized in Europe during the early 1800's and
were soon proven to have displacements of tens to hundreds of kilometers. Theexistence of large, nearly undeformed thrust blocks that have moved great distancesproved to be a mechanical paradox. Smoluchowski (1909) pointed out that a rectangular
block of granite requires a force exceeding its crushing strength to overcome friction at
its base and move over a horizontal plane; he therefore suggested that the bottom of a
thrust block may be weaker than the rest of the block, or that it may have been on aninclined plane at the time of movement.
The problem of overcoming friction at the base of a thrust block without exceeding
the crushing strength of the rock led to the suggestion that a body force, gravity, was
responsible for the movement of thrust blocks. This led to the development of twotheories, gravity sliding and gravity spreading, in an attempt to solve the mechanical
problem posed by overthrusting. The theory of gravity sliding proposes that the thrust
sheet slides down a foreland-dipping regional slope under the influence of gravity(Smoluchowski, 1909). Gravity spreading proposes that some type of orogenic uplift
was created, and that a fold-and-thrust belt forms when this mass collapsed due to its
own weight and spread out in a visco-elastic manner (Bucher, 1956; 1962). Both of
these theories require some sort of pre-existing orogenic uplift to supply a topographicgradient.
A problem with the gravity sliding hypothesis is that it is still necessary toovercome the sliding friction along the base of the thrust block. Hubbert and Rubey
(1959) in their classic paper considered this problem and suggested that abnormal pore
fluid pressures could act to reduce the friction along the base of the thrust block. In their
paper they considered a rectangular two-dimensional thrust block having the Mohr-Coulomb failure criteria
t=S0+atan4 (1)
where 'r is the shear stress at the base of the block, S0 is the cohesive strength of therock, an is the normal stress, is the angle of internal friction (related to the coefficent

of internal friction, j, by = tan 4)). Hubbert and Rubey (1959) considered a case where
a fracture already existed at the base of the block and the basal cohesion is S0 =0. They
showed that in the presence of pore fluid pressure in the rock that the normal stressacross a plane is
a = (a Pf) (2)
where an is the lithostatic pressure and Pf is the pore fluid pressure, i.e., that pore fluid
pressure reduces the normal stress across the plane. They introduce a dimensionlessnumber, A, as the ratio of the pore fluid pressure to the lithostatic pressure
(3)
With this the Mohr-Coulomb failure criteria can be rewritten as
t=(l?.)atan4). (4)
From (4) an equation for the maximum length of an overthrust block of a given
thickness along a horizontal plane can be derived. In the presence of a highlyoverpressured basal surface (?. = 0.90) and a block over 5 km thick, overthrust lengths
over 100 km were predicted (see Table I in Hubbert and Rubey, 1959).
The main interest of Hubbert and Rubey (1959) was to determine if gravity sliding
is possible in the presence of high pore fluid pressures; they did not present a detailed
examination of horizontal compression. The bulk of their paper is concerned withproving the feasibility of gravity sliding.
HsU (1969) studied the same case as Hubbert and Rubey (1959) except that he
considered the cohesive strength of the rock, S0. to be non-negligible in a moving thrust
sheet. He derived an equation for the maximum length of a thrust block moving down a
slope, similar to that of Hubbert and Rubey (1959), but with a cohesive strength of 20
MPa along the base (Handin et al., 1963). Hsü (1969) found that very long (>100 km)
thrusts are not possible without a push from the rear. He concluded that thrust blocks
cannot glide downslope due only to the influence of gravity, except when the cohesive
strength of the décollement is very low.
Forristal (1972) made a re-evaluation of the maximum length of an overthrust

i[.1
block using elasticity theory to determine the state of stress within the thrust block. He
suggested that the maximum length of the thrust block can only be one half of that
calculated by Hubbert and Rubey (1959) and Hsu (1969), due to stress concentrations
that will cause rupture of the block.
Kehle (1970) used a different approach to the problem by considering viscous
flow of a weak zone (décollement) between two higher viscosity layers. Kehie (1970)
notes that many decollements are in evaporites, thin shales, and limestones where pore
fluid pressures would be unimportant. The movement of the thrust block in this model is
due to deformation of the lowest viscosity zone and there is no deformation in the
overlying block as long as its viscosity is one or more orders of magnitude larger thanthe low viscosity zone.
The main objections to the idea of gravity sliding were from field workers (e. g.
Price and Mountjoy, 1970), based upon observations of the geology of thrust belts.
These workers noted the lack of a basement slope dipping towards the foreland and the
lack of the predicted "tectonic gap" where the block broke from the main mountain mass.
In fact, it was often found that the detachment along which the thrust sheet moved dips
towards the hinterland and not the foreland, and that the thrust sheets formed a fairly
continuous mass without any breaks. This led some workers to revive the gravityspreading hypothesis (Price, 1971), but without quantitative evaluation.
Elliot (1976) considered the driving force of thrust sheets to be the topographic
slope of the sheet itself (this is similar to the gravity spreading hypothesis). He avoided
the need for a foreland dipping basement slope by saying the fold-and-thrust belt should
move in the direction of the topographic surface slope, a, regardless of the basement
slope. An important assumption of this model is a pre-existing topographic slope. His
equation for the shear stress caused by the topographic slope is
t pgHa (5)
where t is the shear stress, p is the density of the wedge, g is the acceleration of gravity,
H is the thickness of the thrust sheet, and a is the topographic slope. He related the
influence of horizontal vs. gravitational tectonic forces by the magnitude of adimensionless number k defined by
[t/pgHcoscz}2=(kI2)+[tana+k(H/L)]2 (6)
11
where tm is the strength of the wedge (taken to be 20 MPa) and L is the length of the
thrust sheet. He found that k is far less than 1 for thrust belts, and concludes thatgravitational forces dominate in the movement of thrust sheets.
Recent work in mechanics of fold-and-thrust belts
Chapple (1978) recognized that fold-and-thrust belts share several features in
common, including: a) a characteristic wedge shape, b) a surface of detachment below
which there is no deformation, and c) a large amount of horizontal compression above
this level, especially at the back of the wedge. He proposed a model in which both the
thrust wedge and a weaker basal layer are considered to be perfectly plastic materials
yielding in compressive flow. One important outcome of this work was that Chapple
(1978) showed that horizontal compression is the main driving force in a fold-and-thrust
belt, and that the surface topography is the result and not the cause of the deformation.
This conclusion regarding the surface topography is opposite to the result obtained by
Elliot (1976). Chapple (1978) suggests that a weak basal layer is a necessary factor in
the development of a fold-and-thrust belt. His relationship between the strength of the
basal layer and the overlying wedge is
'V = (7)
where t is the basal shear strength, K is the strength of the overlying wedge, and X is the
ratio of the two strengths. Chapple (1978) states that it is this strength ratio thatdetermines the taper of the wedge.
Stockmal (1983) also used perfectly plastic rheology in a study of accretionary
wedge mechanics. He chose a model in which he assumed a range of yield strengths for
the accretionary wedge and then solved for the basal properties. From the observed
wedge geometry, uplift rates, and rates of tilting he calculated the instantaneous stress
and velocity fields of the Sunda accretionary wedge. Like Chapple (1978) he found that
a weak basal layer is required by the wedge geometry. He noted that variations in
topography and uplift rates indicate variations in basal shear stress.
One problem with models that assume a plastic rheology to describe the mechanics
of fold-and-thrust belts and aecretionary wedges is that the magnitude of the wedge yield

12
strength is not well constrained, as noted by Stockmal (1983). Another problem is that
the observed deformation style in fold-and-thrust belts is usually brittle-elastic, i.e.
deformation by thrusting and folding. Plastic flow generally does not occur in rocks
above the typical brittle-ductile transition (10-15 km for continental crust), with the
exception of such rocks as evaporites .and possibly some shales. The Mohr-Coulomb
failure criteria may therefore be a better method of describing the mechanics of mostfold-and-thrust belts.
Davis et al. (1983) proposed a model in which fold-and-thrust belts are considered
to be analogous to wedges of soil or snow pushed in front of a moving bulldozer (figure
3). Like Hubbert and Rubey (1959), the model was based upon the wedge deforming
according to the Coulomb failure criteria (1). Davis et al.(1983) find that such wedges
deform internally until reaching a critical taper, and then slide forward stably. Following
Hubert and Rubey (1959), Davis et al. (1983) considered a thrust wedge where thecohesion was considered to be negligible. They developed an analytical model relating
the critical taper of fold-and-thrust belts and accretionary wedges to the friction at the
base of the wedge, the pore fluid pressure ratio, the slope of the basement surface, and
the coefficent of internal friction within the wedge. This model can be stated for afold-and-thrust belt as follows:
=
1 (1 -7.)K(8)
where c is the forward topographic slope of the wedge, j3 is the backward slope of the
basement, ? and b are the Hubbert and Rubey (1959) pore fluid pressure ratios within
and at the base of the wedge, .Lb is the coefficent of friction at the base of the wedge, and
K is a dimensionless quantity related to the direction of maximum compression and
dependent upon Lb and j. (coefficent of internal friction). An analytical approximation
for K given by Davis et al. (1983) is
Sifl4 sin2b + COSb(Sifl24Sifl24b)112K= + (9)
1-sin CoS24b cos4b(srn24-sm24b)1"2
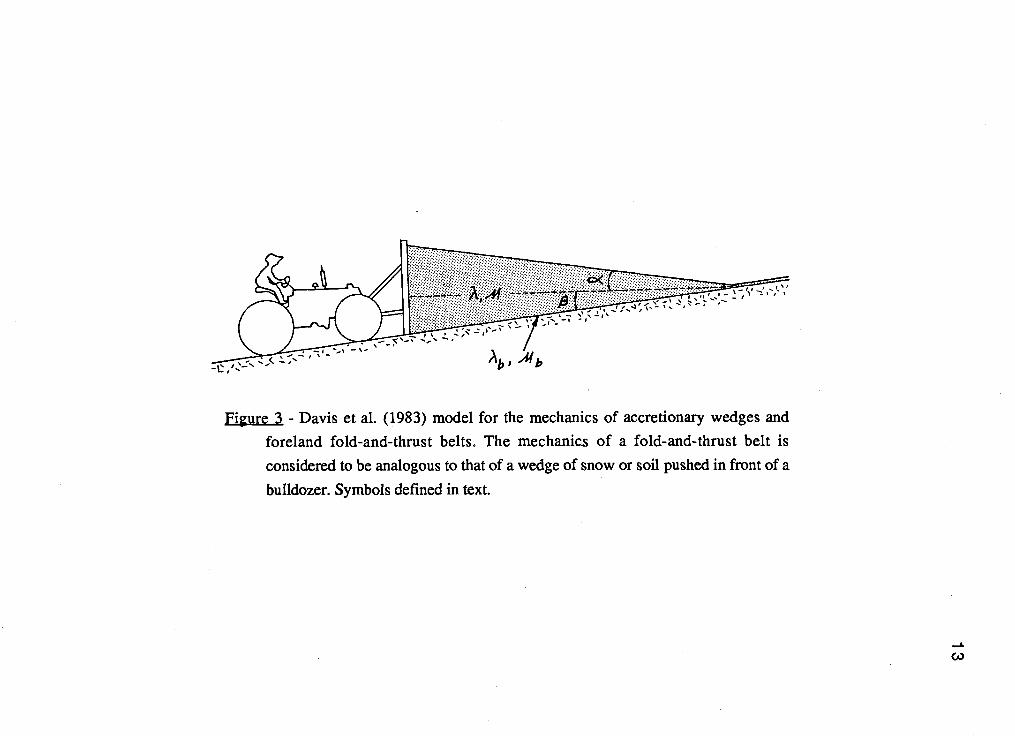
Figure 3 - Davis Ct al. (1983) model for the mechanics of accretionary wedges andforeland fold-and-thrust belts. The mechanic.s of a fold-and-thrust belt isconsidered to be analogous to that of a wedge of snow or soil pushed in front of a
bulldozer. Symbols defined in text.
-0)

14
where 4) is the angle of internal friction within the wedge and is the correspondingterm for the basal friction (b = 4)b) With their model Davis et al. (1983), likeChapple (1978), showed that horizontal compressive forces predominate overgravitational forces in a fold-and-thrust belt.
This model was then applied to the active fold-and-thrust belt in Taiwan where
parameters such as pore fluid pressure ratios (A. 0.675), basement dip (f3 6°), andtopographic slope (a 2.9°) are known. For the basal friction of the wedge Davis et al.
(1983) used Byerlee's "lawt' (Byerlee, 1978), j.Lb = 0.85, which describes the sliding
friction of many types of crustal rocks above the brittle-ductile transition. With this they
were able to compute a best fitting value for the coefficent of internal friction of t =
1.03, about 20% larger than the assumed laboratory value for the base (Davis et al.,
1983). They interpret this to mean that the wedge is not so internally fractured that slip
planes of all possible orientations exist, and that fracturing and slip along suboptimally
oriented surfaces must occur for deformation to proceed. They also conclude that no
extraordinary properties, such as very weak basal layers or extremely high basal pore
fluid pressures, are necessary for the formation of fold-and-thrust belts. Davis et al.
(1983) applied this model to other active thrust belts and accretionary wedges using therock properties % = 0.85 and .t = 1.03 and the observed topographic (or bathymetric)
and basement slopes to predict pore fluid pressure ratios. The agreement with available
fluid pressure data was found to be good, suggesting that this model has a generalapplication.
Dahien (1984) took the theory of noncohesive Coulomb wedges and found an
exact relation between the critical taper a +13 and the parameters A., and A.b. This
is written as
with
a+13=Vb (10)
'Vb = 1/2 arcsin (sin 4)b' / sin 4))- 1/2 4)b (11)
= l/2arcsin(sina'/sin4)) l/2a' (12)
and
15
a'=arctan[{lI(1A)}tana] (13)
= b [(1 b)"U A)]. (14)
With this more exact theory Dahien (1984) recalculated the best fitting value for
the internal coefficent of friction for the Taiwan fold-and-thrust belt and found p. = 1.10,
about 6% larger than that calculated by Davis et al. (1983). Dahlen (1984) stated that this
is not unreasonable in view of the approximate theory used by Davis et al. (1983).
Dahlen et al. (1984) also considered the same model but with the effects of
cohesion taken into account, similar to the work of Hsu (1969) on the model of Hubbert
and Rubey (1959). For this analysis they redefined the geometry of the wedge incylindrical coordinates as opposed to the Cartesian coordinates used in Davis et al.(1983). The model with the effects of finite cohesion is as follows:
+ (1 Xb) Pb Q (S0/pgr) cot4>
(15)
1 (1 -X)K
where S0 is the cohesion, p is the density of the wedge, g is the acceleration of gravity, r
is the radial distance from the front of the wedge, 4> is the angle of internal friction, Q is a
constant defined similar to K, and all of the other variables are the same as in (8). Dahlen
et al. (1984) find that K and Q can be approximated for the case of a very weak basallayer by
K Q 2 / (csc 4> - 1). (16)
It was found by Dahlen et al. (1984) that the effect of cohesion is to decrease the
critical taper in the vicinity of the wedge toe, and that the critical taper asymptotically
approaches the noncohesive value far from the toe, giving the topographic surface a
concave upward shape. Following Davis et al. (1983), this model was applied to the
active fold-and-thrust belt of western Taiwan. The best fitting values for the wedge

16
cohesion and the coefficent of internal friction for western Taiwan were S0 = 5-20 MPa
and .t = 0.9-1.0. Similar to the results of Davis et al. (1983), no extreme rock properties
were necessary to produce the observed thrust wedge.
Evaporites, especially rock salt, are considerably weaker than other rock types. At
depths typical of basal detachments (2-10 kin), salt is in the ductile regime and cannot be
accurately modelled by the Coulomb criteria (1). Work by Carter and Hansen (1983)
show that rock salt deforms at shear stresses between 0.5 MPa andl.5 MPa. Davis and
Engelder (1985) fmd it more appropriate to write
t = t0 1 MPa (17)
as the failure law for an evaporite basal layer in a fold-and-thrust belt instead of the
Mohr-Coulomb law. This makes the strength of rock salt at depths typical of basal
detachments one to two orders of magnitude less than that of most other rocks Davis
and Engelder (1985) developed a model for the formation of fold-and-thrust belts that are
developed on top of salt-dominated detachments (figure 4). This model is mathematically
stated as:
+ (tjpgH)(18)
1+(1-?)(2I[csc4)-1])
where 'r0 is the yield stress along the basal detachment, 4) = tant is the angle of internalfriction, p is the average rock density of the wedge, g is the acceleration of gravity, H is
the thickness of the wedge, and the other variables are as defined in (8) and (15). At
yield stresses appropriate for rock salt (- 1MPa) this means that essentially no taper (l0)
is required for the wedge to be pushed over the foreland. A thrust belt with salt at its
base can therefore be pushed forward without internal deformation if the basement dip is
greater than 1°.
The model proposed by Davis and Engelder (1985) has several importantimplications (figure 4). Fold-and-thrust belts developed upon a basal salt layer should be
narrowly tapered and occur over a very wide belt. As the salt thins at the edges of the
basin, the greater shear traction should lead to the development of drag-related features.
The strength of the décollement also controls 4)b' the angle at which the axis of maximum
SALT
-1 ' ., A
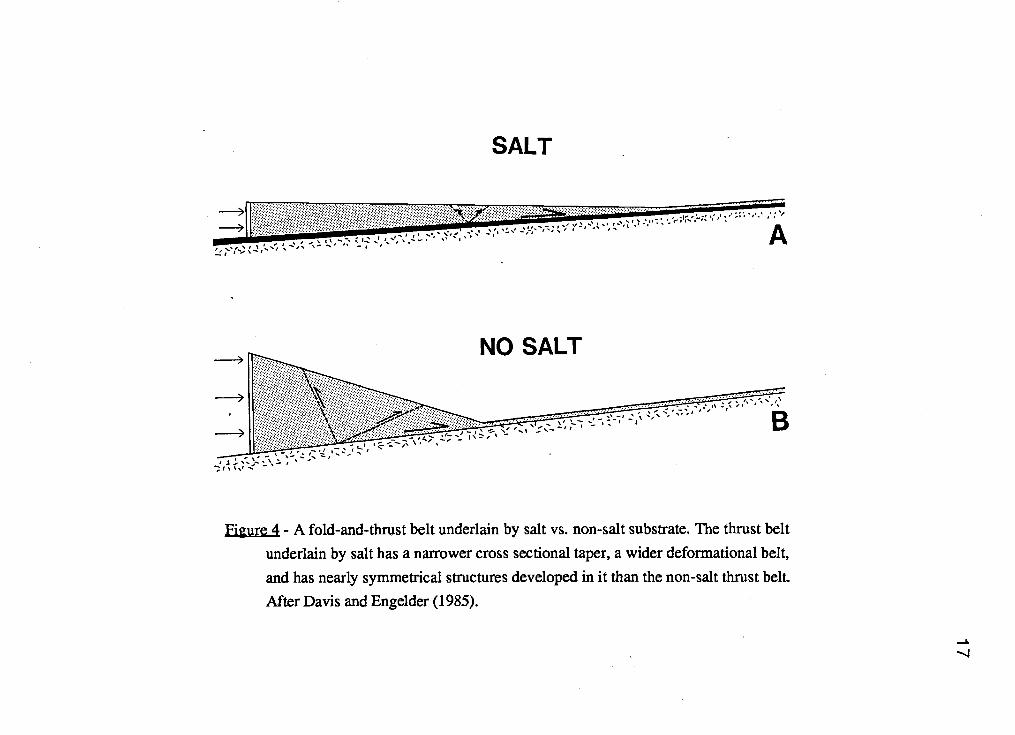
Figure 4- A fold-and-thrust belt underlain by salt vs. non-salt substrate. The thrust belt
underlain by salt has a narrower cross sectional taper, a wider deformational belt,
and has nearly symmetrical structures developed in it than the non-salt thrust belt.
After Davis and Engelder (1985).
-&

II]
compressive stress dips toward the foreland with respect to the basal dip. In the presence
of salt, b is only about P, leading to slip planes (i.e. forward and back thrusts) having
nearly equal dips. This stress orientation leads to the development of symmetrical
structures above the salt layer. The mobility of salt allows it to flow into salt-cored
anticlines that may continue to grow, due to gravitational instability caused by the salt
having a lower density than the overlying sediments.
Another development in the mechanics of fold-and-thrust belts was a study by
Wiltschko and Eastman (1983; in press, 1986) on the effect of basement warps and
faults in localizing thrust ramps. They used a two-dimensional photoelastic model to
look at stress concentrations in the material above a décollement in the presence of
basement warps and faults. Wiltschko and Eastman (1983; in press, 1986) found that the
basement structures act to concentrate stress in the section above, and thus facilitate
failure. Analysis of the stress field predicts natural-looking fault orientations. This work
showed that the positioning of faults in a fold-and-thrust belt may not be haphazard, but
may be controlled by inhomogeneities in the underlying basement.
A problem with the theory developed by Davis et al. (1983), Dahlen et al. (1984),
and Davis and Engelder (1985) is that they used an idealized thrust wedge cross section
that assumes a linear basement slope. Observations of structures within the basement
beneath the décollement show that this is often not the case (e.g. Lillie and Yousuf,1986). It has been found that the loading of a lithospheric plate by thrust sheets causes
the plate to be flexed downward, resulting in a convex upward basement surface (Karner
and Watts, 1983). In the next section, an attempt will be made to generalize the model
for the case where the surface of the underthrusting plate is curved.
New work in mechanics of fold-and-thrust belts
Davis et al. (1983) show that there is a linear realtionship between the basement
and topographic slopes of fold-and-thrust belts that can be expressed in the form:
a+R13=F (19)
This applies to any of the equations for the taper of a fold-and-thrust belt developed by
Davis et al. (1983), Dahlen et al. (1984), and Davis and Engelder (1985). In their

19
models they considered only the case where the basement surface was defined by auniformly dipping slope.
Equation (19) can be important when one considers the response of a lithospheric
plate to either loading by thrust sheets (Kamer and Watts, 1983) or subduction beneath
another plate. It has been found that the lithosphere behaves very much like a thin elastic
plate overlying an inviscid fluid (Walcott, 1970). Thus the curvature of a plate in a
convergent setting can be defined by using elastic plate theory. If the basementunderneath a fold-and-thrust belt is curved according to elastic theory, it may be possible
to use this curvature in the mechanical models of thrusting, instead of a linearapproximation of the basement slope.
Due to the linear relationship between the basement and topographic slopes, a
basement topographic surface defined by a curve can be used in place of a linear slope,
as long as a local basement slope can be defined. Consider a basement surface defined
by a continuous function f(x). The slope of this function can be found at any by taking
the derivative of the function f(x). The angle of the slope is:
(x) = arctan [ f(x) J. (20)
In the presence of a curved basement surface underlying a fold-and-thrust belt, acontinuous function for the topographic slope can be defmed as:
a(x)=F-R3(x) (21)
The value of a(x) can then be found either analytically or numerically.
To test the applicability of this equation to the analysis of fold-and-thrust belts,
three computer models were generated by the author, using the critical taper equations of
1) Davis et al. (1983) for a noncohesive Coulomb wedge; 2) Dahlen et al.(1984) for a
cohesive Coulomb wedge; and 3) Davis and Engelder (1985) for a noncohesiveCoulomb wedge underlain by evaporites. A simple basement slope function, J(x) = 1.00
+ 0.2°x, = 0 - 150 1cm, was used, giving a change of basement slope from 1° at ()
to at 150 km. This approximates the basement curvature seen across the central Salt
Range-Potwar Plateau area (Baker, in prep.; Duroy, 1986; Jaume' et al., 1985).
Model 1 was computed by modifying the critical taper equation of Davis et al.
(1983). Following Davis et al. (1983), ji and ji were chosen as 1.03 and 0.85

20
respectively. = b was arbitrarily chosen as 0.90. The resulting topography shows an
upward convexity similar to, but not as prominent as that of the basement (figure 5).
Subsequent modeling showed that the curvature of the topographic surface can be
increased not only by increasing the basement curvature, but also by decreasing A..
Model 2 was calculated by modifying the critical taper equation of Dahien et al.
(1984). Following Dahien et al. (1984), p. was chosen as 0.95, with f3(x), A., and
A.b being the same as in Model 1. A value of 10 MPa was chosen for the cohesion (5O)
The shape of the resulting wedgeis essentially the same as that predicted by Dahien et al.
(1984) (figure 6). The frontal portion of the wedge is concave upwards and the slope
approaches a constant value. The topographic slope of Model 2 equals that of Model 1
(to within 0.1°) between x = 128 km and x = 150 km.
Model 3 was created using the critical taper equation of Davis and Engelder
(1985), modified for a curved basement surface. Following Davis and Engelder (1985),
was chosen as 1MPa, with the remaining parameters being the same as in Model 1.
The results show a small positive topographic slope for the first 33 km of the wedge
(figure 7). Beyond x =35 km the wedge becomes supercritically tapered (i.e.1 the wedge
taper is larger than the critical taper).
Visually, the results of these simple models suggest that a curved décollement
surface has the most influence on a noncohesive critical Coulomb wedge (Model 1,
figure 5). But numerically, the largest change in a occurs in the first 30 km of Model 3.
This change is 0.015°/km in Model 3; in Model 1 it is only 0.006°/km. In all threemodels the critical taper of the thrust wedge increases as the basement slope increases.
As long as the internal strength of the wedge is greater than that of the décollement, the
critical taper will increase more slowly than the basement slope. It is the difference in
strength between the décollement and the thrust wedge that controls the magnitude of this
change. The larger the strength difference between the décollement and the wedge, the
smaller the change in the critical taper, and therefore the larger the change in topographic
slope. The largest strength difference occurs when salt is present at the décollement, and
therefore the largest changes in topographic slope.
A complete review of the effects of a curved basement surface and its application
to several fold-and-thrust belts is beyond the scope of this study. As shown in the next
section, application to the mechanical study of the Salt Range-Potwar Plateau issomewhat limited. The refined modeling does appear to explain the general topographic
characteristics of the area; deformation at the front of the fold-and-thrust belt (the Salt

U,
E0
120 90 60 30 0
Kilometers
Figure 5 - Model 1 of a non-cohesive Coulomb wedge on top of a curved basementsurface. Model derived using the modified critical taper equation of Davis et al.
(1983) to account for the curved basement.
1\)

5Cl)
'3)4-'3)
E0
120 90 60. 30 0
Kilometers
Figure 6- Model 2 of a cohesive Coulomb wedge on top of a curved basement surface.
Model derived using the modified critical taper equation of Dahien et aL (1984).
Is.)

Ii
5U)
a,4-
E0
120 90 60 30 0
Kilometers
Figure 7 - Model 3 of a non-cohesive Coulomb wedge underlain by a layer of saltdeveloped on top of a curved basement surface. Model derived using the modified
critical taper equation of Davis and Engelder (1985). Note that the topographic
slope is low at the front of the wedge and that it becomes level as the basement dip
steepens and the thickness of the wedge increases.CA)
24
Range) and no deformation deeper into the belt (the southern Potwar Plateau). But in
detail, the Salt Range is observed to be due to smaller scale obstructions in the basement
that the thrust plate has overidden (i.e. basement offset along a normal fault). In the
eastern Potwar Plateau there is more potential for an application of this idea. There is a
topographic slope similar to that of Model 3 in the frontal 100 km of the fold belt, and
then the topography becomes level again. Unfortunately the available seismic coverage is
not extensive enough to see significant curvature of the basement surface.

25
MECHANICS OF THE SALT RANGE-POT WAR PLATEAU: PAKISTAN
The mechanics of the Salt Range-Potwar Plateau was studied along three cross
sections interpreted from seismic reflection profiles, surface geology, and well data.
These interpreted sections are from Baker (in prep.) and Lillie et al. (in press, 1986) for
the central Salt Range-Potwar Plateau (A-A'), Leathers (in prep.) and Pennock (in prep.)
for the eastern Potwar Plateau (B-B'), and Leathers (in prep.) for the western SaltRange-Potwar Plateau (C-C'). The observed taper of the thrust belt, its structure, and
pore fluid pressure ratios are examined in the light of the mechanical models of Davis et
al. (1983), Dahien et al. (1984), and Davis and Engelder (1985).
Eastern Potwar Plateau (B-B')
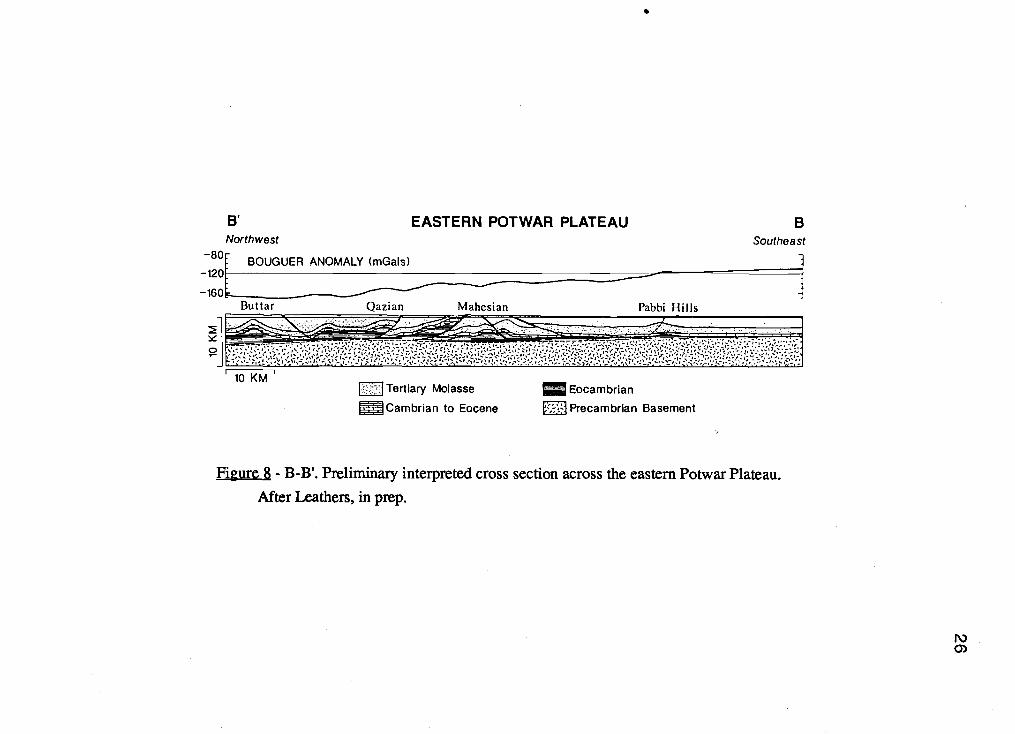
The frontal (southernmost) 100 km of the eastern Potwar Plateau fold belt (figure
8) most closely resembles the salt décollement model of Davis and Engelder (1985). The
thrust wedge has a narrow cross sectional taper (a + < 1°), and internally there is no
consistent direction of thrusting; thrusts verge both to the northwest and the southeast
(figure 8). Also, the anticines developed in the eastern Potwar Plateau, where not cut by
thrust faults, tend to be symmetrical and separated by fairly wide syndines.
In map view (figure 9), a change in structural strike between the Salt Range and
the structures of the eastern Potwar Plateau is evident. The Davis and Engelder (1985)
model predicts a change in deformational style at the edge of the salt basin. This isconsistent with the hypothesis that the salt facies thins eastward (Seeber et al., 1981) and
the eastern Potwar Plateau fold belt is developed at the edge of the Infracambrian salt
basin. A thinning of the Salt Range Formation to the southeast is evident in B-B'. A
change in deformational style in the eastern Potwar Plateau is supported by thepaleomagnetic work of Opdyke et al. (1982), that shows the eastern Potwar Plateau is
differentially rotated 30° relative to the Salt Range and the central and western Potwar
Plateau. Note, however, that the Kharian (Pabbi Hills) structure at the southernmost end
of the eastern Potwar Plateau is rotated only about 10° relative to the Salt Range.
Johnson et al. (in press, 1986) show that the Kharian anticline first had its surfaceexpression only 0.4 MyrBP. This suggests that it may still be active, and has not yetcompleted its rotation.
A problem with interpreting the mechanics of thrusting along this cross section is
0
B EASTERN POTWAR PLATEAUNorthwest
BOUGUER ANOMALY (mGals)
Ritttar Oazian Mahesian Pabbi Hills
BSoutheast
10 KMTertiary Molasse Eocambrian
Cambrian to Eocene Precambrian Basement
Figure 8 - B-B'. Preliminary interpreted cross section across the eastern Potwar Plateau.
After Leathers, in prep.
N)C)

33
072 7qO
_.A_.Thrust Fault Strike Slip Fault '---Normal Fault ''-Buried Normal Fault
4- Welt -4--- Anticline
Figure 9 - Structural map of the Potwar Plateau, including locations of wells cited in
text. The wells are: 1) Pabbi Hills, 2) Qazian, 3) Wamali, 4) Lilla, 5) Dhurnal,and 6) Khaur. A-A', B-B', and C-C' are the same as in figure 2. Note that thestructures in the eastern Potwar Plateau are rotated about 300 counterclockwise
from the strike of the Salt Range. After Baker (in prep.).

that, although the cross section is approximately perpendicular to structural strike, it is
not perpendicular to the presumed direction of transport of the thrust wedge.Unfortunately, available seismic coverage is not able to delineate the basement slope in
the direction of transport in the eastern Potwar Plateau. But examination of Bouguer
gravity anomalies (Farah et al., 1977) and total sediment isopachs (Khan et al., 1986)
suggest that there may be little difference in basement slope between the two directions.
Therefore, the taper of the thrust wedge observed in cross section B-B' will be used as
the critical taper of the eastern Potwar Plateau fold belt. It is noted, however, that adifferent critical taper will change the numerical results.
The parameters necessary to define the mechanics of this wedge using equation 18
(Davis and Engelder, 1985) are the critical taper (a + ), the yield strength of theevaporites (t0), the pore fluid pressure ratio (k), coefficent of internal friction (p. = tan
4)), density (p), and thickness (H) of the wedge. Two of these parameters, 4) and to, are
not available for the eastern Potwar Plateau, and an attempt will be made to define the
best constrained estimates for these parameters.
The topography in the eastern Potwar Plateau rises to the north-northwest at a
gentle slope of 0.2° for the first 100 km. The basement dip () along section B-B' is0.6° ± 0.1° for the same distance. This gives a critical taper of only 0.8° ± 0.1°, less than
1°, as predicted by Davis and Engelder (1985). Seismic reflection profiles north of the
Soan River indicate that the basement slope steepens in the north, but interpretation of
these data has not proceeded to the point where an accurate measure off
can be taken.
The topography north of the Soan River to the foot of the Hill Ranges is very flat (a < ±0.1°).
An estimate of the pore fluid pressure ratio for the southeastern Potwar Plateau is
available from drilling mud densities in the Pabbi Hills-i well and the Qazian-1X well
(figure 10; locations in figure 9). The data show a normally pressured surficial unit
(Pabbi Hills-i: 0-750 meters; Qazian-1X: 0-560 meters) with the formation pressures
increasing rapidly below this level. In the Qazian-1X well the formation pressuresdecrease slightly in the platform section (below -1500 meters), but still remain well
above hydrostatic. An average value of A. = 0.82 for the overpressured section was
calculated using equation (3) for the Pabbi Hills-i well from the drilling mud densities
and sediment densities estimated from sonic logs. The average pore fluid pressure ratio
for the Qazian-iX well is also A. = 0.82, calculated using the same method as the Pabbi
Hills-i well. An average value for the density of the sediments overlying the Salt Range
cv
coI,1
/
c,
c.,
Hydrostatic
gradient
0
'a
,iin'i/li?
ç)ij
£
,Iij,

30
Formation is p = 2330 kg/rn3, taken from model densities for the Potwar Plateau(Duroy, 1986).
With two unknowns (p. and to) in equation 18 it is not possible to uniquely solve
for either one. Fortunately, there are some experimental and observational data from
other sources that help constrain these parameters. Carter et al. (1982) find thatdifferential stresses in some samples of naturally deformed halite are in the range to =0.5-1.1 MPa. Carter and Hansen (1983) state that the yield strength ('ta) of halite is
believed to lie in the range 'r0 = 0.5-1.5 MPa. Davis and Engelder (1985) adopted arange of 0.1-1.0 MPa for 't in their dicussion.
The coefficent of internal friction, p., is harder to constrain. Handin (1969) states
that it should be considered only as the slope of the Mohr envelope for an intact material.
Davis et al. (1983), Dahien et al. (1984), Dahien (1984), Davis and Engelder (1985),
and Thao et al. (1986) use p. as a value to help quantify the internal strength of a thrust
wedge. As such, the only values available to constrain p. are those calculated by Davis et
al. (1983), Dahien et al. (1984), and Dahien (1984). Davis et al. (1983) found p. 1.03
as their best fitting value for the Taiwan fold-and-thrust belt using the approximate
noncohesive Coulomb theory. Later, Dahien (1984) revised this to p. = 1.10 with an
exact noncohesive Coulomb theory. Dahien et al. (1984) found a best fitting value of p. =
0.95 using cohesive Coulomb theory and a value of 5-20 MPa for the cohesion of the
Taiwan wedge.
A tradeoff curve between p. and t0 can be computed using equation 18 to find the
ranges of the parameters that fit the theory and that are comparable with those cited above
(figure 11). Since the Davis and Engelder (1985) model was developed for anoncohesive Coulomb wedge, the best fitting value for p. can be expected to be near the
value calculated by Davis et al. (1983) and larger than that calculated by Dahlen et al.
(1984). From figure 13 the best fitting values of p. and to lie in the range p. = 0.95-1.04
and to = 1.33-1.50 MPa. Following Davis et al. (1983), 1.03 will be adopted for p.,
and correspondingly 1.48 MPa for to. This rather high value of to is not surprising if
the eastern Potwar Plateau is believed to lie at the edge of the salt basin. Although the
interpretations of the seismic data imply that the Salt Range Formation is still relatively
thick underneath the eastern Potwar Plateau, there may be inclusions of facies other than
halite near the edge of the basin that would tend to increase the strength of thedécollement.

1.10
0.92
0.74
0.96
0.38
0.200.5 0.7 0.9 1.1 1.3 1.5
to (MP)
Figure 11 - Tradeoff curve between coefficent of internal friction and evaporite yield
strength for the eastern Potwar Plateau. Best fitting parameters are p.. = 1.03 and
= 1.48 MPa (dotted lines).
c)
32
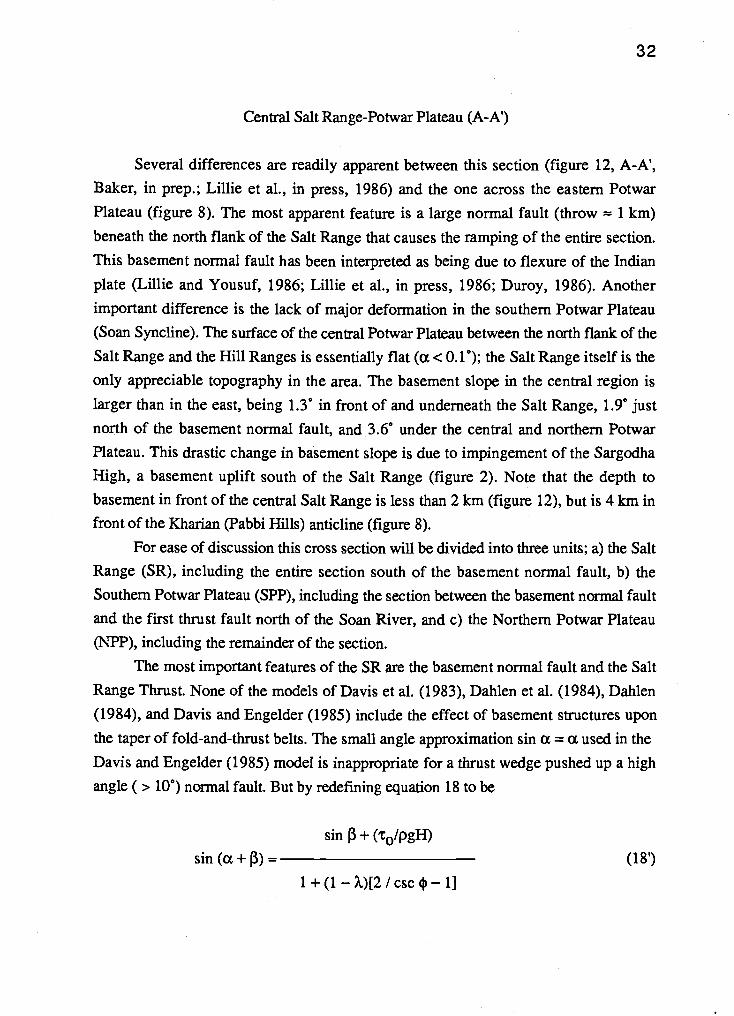
Central Salt Range-Potwar Plateau (A-A')
Several differences are readily apparent between this section (figure 12, A-A',
Baker, in prep.; Lillie et al., in press, 1986) and the one across the eastern Potwar
Plateau (figure 8). The most apparent feature is a large normal fault (throw 1 km)
beneath the north flank of the Salt Range that causes the ramping of the entire section.
This basement normal fault has been interpreted as being due to flexure of the Indian
plate (Lillie and Yousuf, 1986; Lillie et al., in press, 1986; Duroy, 1986). Another
important difference is the lack of major deformation in the southern Potwar Plateau
(Soan Syndine). The surface of the central Potwar Plateau between the north flank of the
Salt Range and the Hill Ranges is essentially flat (a < 0.10); the Salt Range itself is the
only appreciable topography in the area. The basement slope in the central region is
larger than in the east, being 1.30 in front of and underneath the Salt Range, 1.9° just
north of the basement normal fault, and 3.6° under the central and northern Potwar
Plateau. This drastic change in basement slope is due to impingement of the Sargodha
High, a basement uplift south of the Salt Range (figure 2). Note that the depth tobasement in front of the central Salt Range is less than 2 km (figure 12), but is 4 km in
front of the Kharian (Pabbi Hills) anticline (figure 8).
For ease of discussion this cross section will be divided into three units; a) the Salt
Range (SR), including the entire section south of the basement normal fault, b) the
Southern Potwar Plateau (SPP), including the section between the basement normal fault
and the first thrust fault north of the Soan River, and c) the Northern Potwar Plateau
(NPP), including the remainder of the section.
The most important features of the SR are the basement normal fault and the Salt
Range Thrust. None of the models of Davis et al. (1983), Dahlen et al. (1984), Dahlen
(1984), and Davis and Engelder (1985) include the effect of basement structures upon
the taper of fold-and-thrust belts. The small angle approximation sin a = a used in the
Davis and Engelder (1985) model is inappropriate for a thrust wedge pushed up a high
angle (> 10°) normal fault. But by redefining equation 18 to be
sin (a + 1) =
sin j3 + ('r0/pgH)
1+(1 A.)[2/csc4 1](18')
-70-iNORTH BOUGUER ANOMALY
----------------
SOUTH --7O
L170
SOAN S. SALT
P 0 TW A R POTWAR RANGE
TERTIARY MOLASSE20
itl CAMBRIAN TO EOCENE
3O j EOCAMBRIAN 30
PRECAMBRIAN BASEMENT
4OJO KM yE. 11 4O
MflHO
50
DISTANCE FROM CENTER OF SALT RANGE (KM)
Figure 12 - A-A'. Preliminary interpreted cross section across the central SaltRange-Potwar Plateau. After Baker (in prep); Lillie et al. (in press) ; and Duroy
(1986).
50
0)0)

34
an estimate of the critical taper needed to push a wedge up the fault surface can be made.
The coefficent of internal friction, yield strength of the salt, and sediment density are
taken from the eastern Potwar Plateau values (j.t = 1.03; t0 = 1.48 MPa, p = 2330kg/rn3). The sediment thickness (H) is taken as 3250 m, the average over the ramp. The
angle at which the thrust wedge goes up the ramp (t 25°) is used as the basement dip.
Unfortunately there are no available pore fluid pressure data in the SR. If the pore fluid
pressure ratio for the eastern Potwar Plateau, ? = 0.82, is used, the predicted critical
taper is 13°, which would allow for a topographic slope a 12°. It is found that aslong as ? < 0.98, there will be no deformation within the thrust wedge as it overrides the
ramp. Thus the thrust plate is easily able to slide up the ramp with its topographic slope
of a 1.0° (i.e. 1° northward).The Salt Range overthrust appears to move as a fairly coherent block, cut only by
numerous small faults. Compressional structures (mainly folds) appear common at the
front of the range (Yeats et al., 1984; Baker, in prep.) with high angle (normal?) or
stike-slip faults common in the central portion (Baker, in prep.). The level or precise
orientation of the décollement underneath the Salt Range is not known; it may be thatthere is no single shear zone. In any case the frontal topographic slope of the Salt Range
appears to be controlled mainly by erosion of the upper thrust plate, rather than bycompressional tectonics.
South of the Salt Range there is a small salt-cored anticline (figure 12). Lillie et al.
(in press, 1986) have interpreted that this is cored by a "sledrunner" thrust (i.e. asouthward extension of the main décollement). This interpretation is supported by well
pressures in the Lila-i well. The molasse section overlying the Salt Range Formation is
at normal (hydrostatic) pressure, but the pressure jumps to almost lithostatic below 1700
meters (within the Salt Range Formation, figure 10), suggesting compression at thatlevel.
The southern Potwar Plateau (SPP) is remarkable in that, although it has been
pushed at least 16 km southward (Baker, in prep.; Leathers, in prep.), it has undergone
little or no internal deformation. What deformation there is consists of broad, gently
folded anticlines (Khan et al., 1986). This is due both to the weak evaporite layer and to
the increase in13 (1.9°-3.6° in the central Potwar as opposed to 0.6° in the eastern
Potwar). This lack of deformation suggests that the taper of the SPP is either at orgreater than the necessary critical taper. The basement slope (13) is sufficent to provide
the critical taper; no topographic slope is necessary.

35
A test of this hypothesis is to solve equation 18 for ? in the SPP. No pore fluid
pressures are available in the SPP, but Khan et al. (1986) report alternating excessive
and low formation pressures in the Tertiary molasse section and M. Yousuf (pers.
comm., 1985) reports that normal (hydrostatic) pressures are again encountered in the
platform (Cambrian to Eocene) section. The alternating high and low fluid pressures are
similar to those encountered in areas of high sedimentation like the U. S. Gulf coast
(Jones, 1969), and unlike the consistently high pressures found in the fold-and-thrust
belt of Taiwan (Davis et aL, 1983). This suggests that the average pore fluid pressure
ratios in the SPP may be less than those encountered in the eastern Potwar Plateau.
Equation 18 was solved for ?. at two points in the SPP, one just north of the
basement normal fault ([ = 1.9°, H = 3000 meters) and the other at the axis of the Soansyncline (f3 = 3.6°, H = 6000 meters). The topographic slope was taken as a =00 and
the eastern Potwar Plateau values were taken for .t and4. The pore fluid pressure ratios
calculated for a thrust wedge at critical taper were = 0.87 and 2 = 0.97 respectively,
both in excess of the eastern Potwar Plateau values. It is concluded here that the SPP is
a supercritically tapered thrust wedge (i.e., a + is larger than necessary and the wedge
can be pushed forward without internal deformation).
The northern Potwar Plateau (NPP) is radically different in its structural style
when compared to the SPP. It is complexly folded and faulted, with Miocene and older
rocks exposed at the surface. It does share one feature in common with the SPP; the
surface topography is flat. These two features suggest conflicting ideas as to the nature
of the mechanics of the NPP. The intense deformation suggests stronger coupling at the
décollement than is observed to the south. R. S. Yeats (pers. comm., 1986) notes that
there has been considerable uplift and erosion in the NPP. Yet the lack of a surfacetopographic slope suggests that the NPP is underlain by salt, like the SPP.
By applying both equation 8 and equation 18, the best fitting model (salt or no
salt) can be chosen for the NPP. A pore fluid pressure ratio for the NPP is available
from Hubbert and Rubey (1959) for the Khaur well (figure 9). They fmd that ?. = 0.93 ±
0.01, larger than the eastern Potwar Plateau values but less than that calculated for the
northern part of the SPP (see above). Given the value of 7 from the Khaur well,equations 8 and 18 can be solved for the critical taper of the wedge, and the best fitting
model matched to the observations.
In the non-salt case (equation 8) parameters used are .t = 1.03, b = 0.85, 2L
0.93, and J3 = 3.60. The critical taper calculated in this case is a +13=5.3°, predicting a
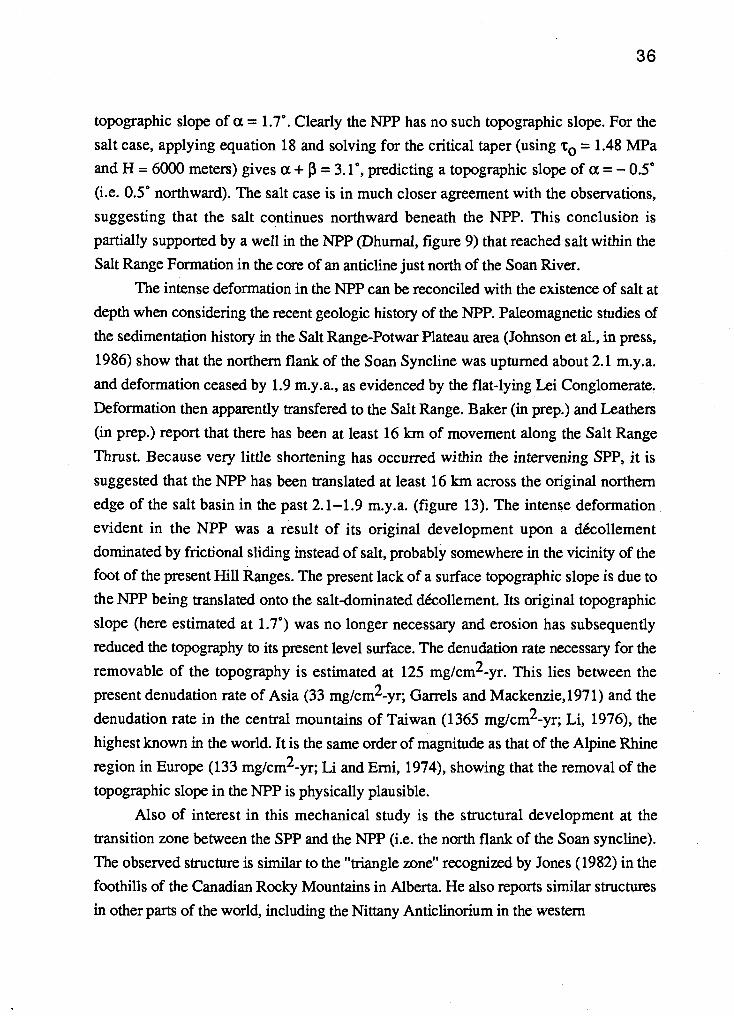
topographic slope of a = 1.7°. Clearly the NPP has no such topographic slope. For the
salt case, applying equation 18 and solving for the critical taper (using t0 = 1.48 MPa
and H = 6000 meters) gives a + 3 = 3.10, predicting a topographic slope of a = - 0.50
(i.e. 0.5° northward). The salt case is in much closer agreement with the observations,
suggesting that the salt continues northward beneath the NPP. This conclusion ispartially supported by a well in the NPP (Dhurnal, figure 9) that reached salt within the
Salt Range Formation in the core of an anticine just north of the Soan River.
The intense deformation in the NPP can be reconciled with the existence of salt at
depth when considering the recent geologic history of the NPP. Paleomagnetic studies of
the sedimentation history in the Salt Range-Potwar Plateau area (Johnson et aL, in press,
1986) show that the northern flank of the Soan Syncline was upturned about 2.1 m.y.a.
and deformation ceased by 1.9 m.y.a., as evidenced by the flat-lying Lei Conglomerate.
Deformation then apparently transfered to the Salt Range. Baker (in prep.) and Leathers
(in prep.) report that there has been at least 16 km of movement along the Salt Range
Thrust. Because very little shortening has occurred within the intervening SPP, it is
suggested that the NPP has been translated at least 16 km across the original northern
edge of the salt basin in the past 2.1-1.9 m.y.a. (figure 13). The intense deformation
evident in the NPP was a result of its original development upon a décollementdominated by frictional sliding instead of salt, probably somewhere in the vicinity of the
foot of the present Hill Ranges. The present lack of a surface topographic slope is due to
the NPP being translated onto the salt-dominated décollement. Its original topographic
slope (here estimated at 1.7°) was no longer necessary and erosion has subsequently
reduced the topography to its present level surface. The denudation rate necessary for the
removable of the topography is estimated at 125 mg/cm2-yr. This lies between the
present denudation rate of Asia (33 mg/cm2-yr; Garrels and Mackenzie,1971) and the
denudation rate in the central mountains of Taiwan (1365 mg/cm2-yr; Li, 1976), the
highest known in the world. It is the same order of magnitude as that of the Alpine Rhine
region in Europe (133 mg/cm2-yr; Li and Erni, 1974), showing that the removal of the
topographic slope in the NPP is physically plausible.
Also of interest in this mechanical study is the structural development at the
transition zone between the SPP and the NPP (i.e. the north flank of the Soan syncine).
The observed structure is similar to the "triangle zone" recognized by Jones (1982) in the
foothills of the Canadian Rocky Mountains in Alberta. He also reports similar structures
in other parts of the world, including the Nittany Anticlinorium in the western
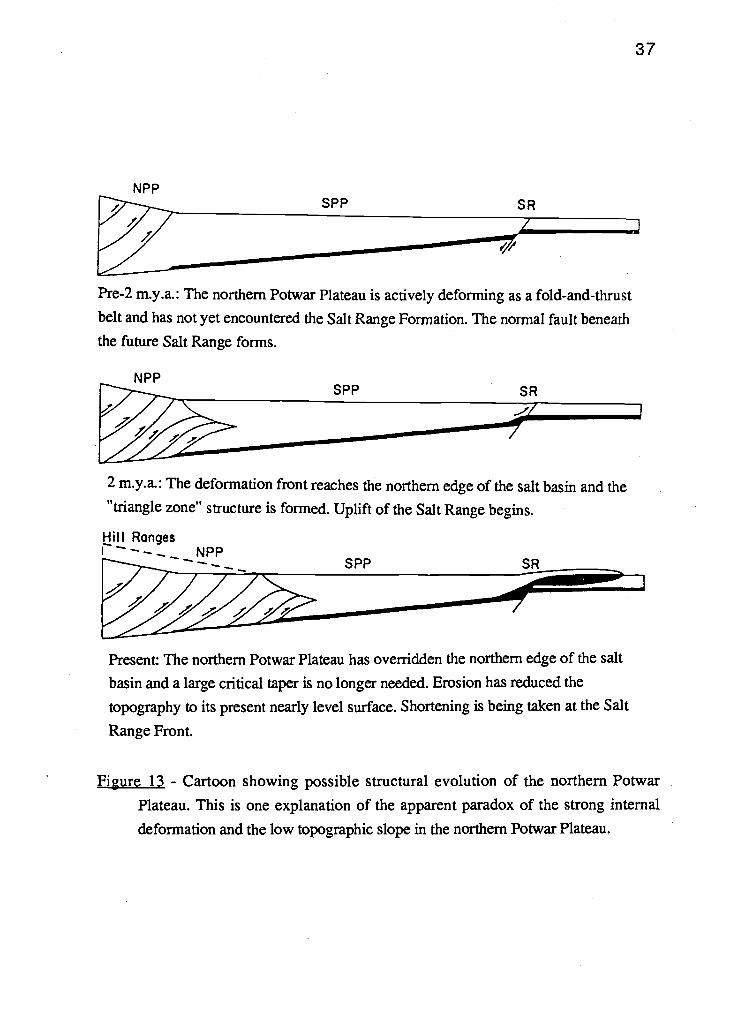
37
NPPSPP SR
Pre-2 m.y.a.: The northern Potwar Plateau is actively deforming as a fold-and-thrust
belt and has not yet encountered the Salt Range Formation. The normal fault beneath
the future Salt Range forms.
NPPSPP SR
2 m.y.a.: The deformation front reaches the northern edge of the salt basin and the
"triangle zone" structure is formed. Uplift of the Salt Range begins.
Hill Rangesr---_ NPP
Present: The northern Potwar Plateau has overridden the northern edge of the salt
basin and a large critical taper is no longer needed. Erosion has reduced the
topography to its present nearly level surface. Shortening is being taken at the Salt
Range Front.
Figure 13 - Cartoon showing possible structural evolution of the northern PotwarPlateau. This is one explanation of the apparent paradox of the strong internal
deformation and the low topographic slope in the northern Potwar Plateau.

Appalachians, the Molasse Basin in Switzerland, and the eastern Carpathian Foothills in
Romania. In these last three areas Davis and Engelder (1985) report them as fold-and-
thrust belts developed on top of a layer of salt. Although these observations are
inconclusive, it is here suggested that there may be a causal relationship between the
development of "triangle zone" structures and the propagation of a fold-and-thrust belt
onto a salt-dominated detachment.
Western Salt Range-Potwar Plateau (C-C')
The western Salt Range-Potwar Plateau section (C-C', figure 14, Leathers, inprep.) is similar to the central Salt Range-Potwar Plateau section (A-A'). These sections
can be readily divided into the same three units: the Salt Range (SR), the SouthernPotwar Plateau (SPP), and the Northern Potwar Plateau (NPP). In almost all respects
the results of the mechanical studies from the central section can be applied equally well
to the section in the west.
One of the few differences between the two sections is the lack of a large basement
normal fault acting as a ramp for the Salt Range thrust in the west. Some sort of ramp
exists, as evidenced by the westward continuation of the Salt Range, but the basement
appears to be gently flexed rather than abruptly faulted (Leathers, in prep.). Using the
same parameters as in the central SR, but with H = 2000 meters and = 22°, the angle at
which the thrust wedge is ramped upwards, a surface topographic slope of a = 10° ispredicted using equation 18'. The upper thrust plate therefore slides just as easily over
the ramp in the western SR as does in the central SR.
Another difference between the central and western SR is the lack of "sledrunner"
thrusts in front of the Salt Range. Examination of Bouguer anomalies (Farah et al.,
1977) shows that part of the Sargodha Gravity High undertbrusts the front of the Salt
Range in the west. A seismic profile that crosses the Sargodha High near Mianwali
shows basement and pre-Miocene strata truncated and unconformably overlain byyounger strata. It is possible that the Salt Range Formation has been eroded away just
south of the Salt Range in the western SR and the décollement is unable to continuesouthward.
In the west the SPP is very similar to the SPP in the central section. Internaldeformation of the thrust plate is minor and consists of gentle folds. The dip of theunderthrusting basement is = just north of the Salt Range ramp and 13=2.2°
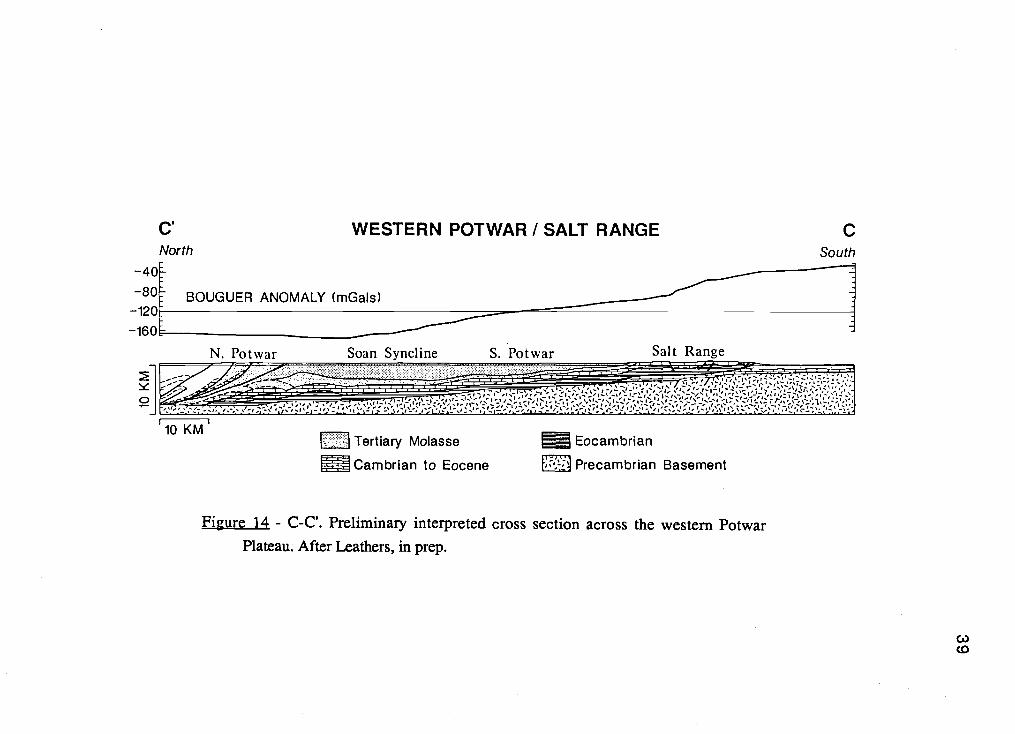
C' WESTERN POTWAR I SALT RANGE CNorth South
-8O BOUGUER ANOMALY (mGals)
-16
]
10KM'
N. Potwar Soan Syncline S. Potwar Salt Range
Tertiary Molasse Eocambrian
Cambrian to Eocene E1' Precambrian Basement
Figure 14 C-C'. Preliminary interpreted cross section across the western PotwarPlateau. After Leathers, in prep.
0)(0

under the Soan Syncline. Solutions of equation 18 yield values of = 0.91 and ? = 0.94
respectively, similar to the central SPP values. The interpretaion is that the western SPP,
like the central SPP, is an overtapered (supercritical) thrust wedge.
The interpreted basement slope under the western part of the NPP is considerably
less than in the central NPP, only 1.3°. Duroy (1986) finds that a shallowing of the
basement dip in the NPP is supported by Bouguer gravity anomalies. Using equation 8,
the critical taper estimated for the no salt case is a + = 3.6°, giving a 2.3°. For the
salt case, equation 18 gives a + 3 = 1.35°. This suggests that the western NPP is near
its critical taper. This also leads to the interpretation that the observed high pore fluid
pressures in the NPP are being maintained by tectonic compression. Also, examination
of seismic profiles in the northeast Potwar Plateau suggest = 1.2°. From this the
preferred interpretation for the entire NPP is a thrust wedge is presently near its critical
taper and the high pore fluid pressures are a result of continued tectonic compression.

41
COMPARISON WITh OTHER FOLD BELTS OF PAKISTAN
The Salt Range has been described as an "anomaly" (Crawford, 1974) in the
tectonics of the Himalayas. As discussed above, the interaction of a weak detachment
and basement topography provide a plausible explanation for the position of the Salt
Range so far south of the MBT, and the exposure of Paleozoic rocks at the very front of
the orogenic belt. It is instructive, therefore, to compare the Salt Range-Potwar Plateau
with nearby regions of the Himalaya.
Several authors (e.g. Sarwar and DeJong, 1979) have commented upon thesystem of lobes and re-entrants in the foreland fold-and-thrust belt of Pakistan (figure 1).
Two explanations for these features have been put forward: a) that the lobes andre-entrants are controlled by features on the underthrusting Indian shield (Wadia, 1953),
and b) that they are related to the distribution of salt in the subsurface (Sarwar and
DeJong, 1979). Davis and Engelder (1985) show that the surface topography, the width
of the thrust belt, and the style of deformation of a fold-and-thrust belt are sensitive to
the presence of salt at depth. With the exception of the Salt Range-Potwar Plateau area,
subsurface data for Pakistan are generally not available, but surface topography and
geology are. A Landsat mosaic (R. D. Lawrence, unpubl. data) is also available for
analysis. The brief discussion of these data may provide some clues as to the role of salt
in other portions of the Pakistan foreland fold-and-thrust belt.
Salt Range-Potwar Plateau vs. Kashmir Himalaya
The most apparent difference between the Kashmir Himalaya and the Salt Range-
Potwar Plateau is the topography. While in the Salt Range-Potwar Plateau a < 1.00
(figure 15), the foreland thrust belt in Kashmir has a = 2.1° (figure 16; Burbank et al.,
in press, 1986). Another readily apparent difference is the width of the thrust belt. The
distance between the Salt Range Thrust and the MBT is 100-150 km, whereas inKashmir, the distance between the deformation front and the MBT is only 40-60 km(figure 1).
Seeber and Armbruster (1981) report the dip of the décollement along theHimalayan front varies between 1.5°-3.0°. This is consistent with plate flexure models
of Lyon-Caen and Molnar (1983, 1985), derived from gravity data, that show the dip of
the Indian plate to be about 3.0° beneath the Lesser Himalaya. This gives a taper a + 3 =

North South
C) Western Salt Range-Potwar Plateau
3rkm I
A) Central Salt Range-Potwar Plateau
rB) Eastern Potwar Plateau
I I I I
150 120 90 60 30 0
Kilometers1 0 X Vertical Exaggeration
Figure 15 - Topography of the Salt Range-Potwar Plateau area. Data is from Army Map
Service (AMS) 1:250,000 topographic maps of India and Pakistan. Dotted lines
are sea level and deformation fronts are at 0 km. Sections correspond to A, B, and
Cinfigurel.1')

North6
D) Kashmir Himalaya
km.:
South
I I I I I I
150 120 90 60 30 0
Kilometers1 0 X Vertical Exaggeration
Figure 16 - Topography of the Kashmir Himalaya. Data is from AMS 1:250,000topographic maps of India and Pakistan. Dotted line is sea level and deformation
front is at 0 km. Section corresponds to D in figure 1.
C)

5.0° for the Kashmir Himalaya, compared with eastern Potwar Plateau where a +1.00.
Seeber and Armbruster (1981) conclude, mainly from earthquake data, that the
thick salt of the Salt Range Formation is lacking east of the Potwar Plateau. They argue
that the lack of major earthquakes in the Salt Range-Potwar Plateau area is due tolubricating effect of the salt, while the 1905 Kangra earthquake (Ms = 8) that occured
about 100 km southwest of section D (figure 1) suggests greater coupling along the
detachment there. In addition, the fairly large (5.00) taper and narrow width of the thrust
belt in Kashmir support this conclusion. Following Davis et al. (1983), the pore fluid
pressure ratio for the thrust wedge in Kashmir is estimated at X = 0.92. Note that this
differs from ? = 0.76 estimated by Davis et al. (1983) for the Nepal Himalaya, due tothe larger taper of the thrust wedge in Nepal (a + = 7.0°). Unfortunately, no pore fluid
pressure data are available to confirm these estimates.
Sulaiman Lobe vs. Sulaiman Range
One of the most striking features of the foreland fold-and-thrust belt in Pakistan is
the Sulaiman Lobe (figure 1). Like the Salt Range-Potwar Plateau, it extends far out of
the foreland when compared to nearby mountain belts. Examination of figure 1 shows
that the foreland fold-and-thrust belt of the Sulaiman Lobe is very wide when comparedwith the Sulaiman Range.
Figure 17 compares the topography of the Sulaiman Lobe and the SulaimanRange. A difference in topography, although not as drastic as between the SaltRange-Potwar Plateau and the Kashmir Himalaya, is apparent. In both areas thetopography rises to a level of a plateau about 1.0-1.5 km above sea level; the difference
is that the Sulaiman Range reaches this level much more quickly. The topographic slope
for the Sulaiman Lobe is a = 0.6°, and that of the Sulaiman Range is much larger, a =1.7°.
The structures in the Sulaiman Lobe, from Landsat photos and surface geology
(Khan, unpubi. data), consist of broad, gentle anticlines that bend at both the eastern and
western ends (figure 18). This is consistent with the Davis and Engelder (1985) model
as to the type of structures to be expected in a fold-and-thrust belt developed on salt.
Taken together with the low (< 1°) surface slope and the wide (100km) thrust belt, it

West
3
0
km. North3
0
E) Sulaiman Range
F) Sulaiman Lobe
East
South
I I I I I
150 120 90 60 30 0
Kilo meters1 0 X Vertical Exaggeration
Figure 17 - Topography of the Sulaiman Range and Sulaiman Lobe. Data is from AMS
1:250,000 topographic maps of India and Pakistan. Dotted lines are sea level and
deformation fronts are at 0 km. Sections correspond to E and F in figure 1.
01

.--Structural trends
30°
29°
Figure 18 Structural map of the Sulaiman Lobe. Structural trends are taken from
Landsat photos, and map units simplified from Kazmi and Rana (1982). Rock
units are: no pattern-Quaternary alluvium, gravel pattern-Neogene molasse, dot
pattern-Jurassic to Oliogene marine and continental sedimentary rocks. Note
changes in structural orientation at the east and west edges of the belt.
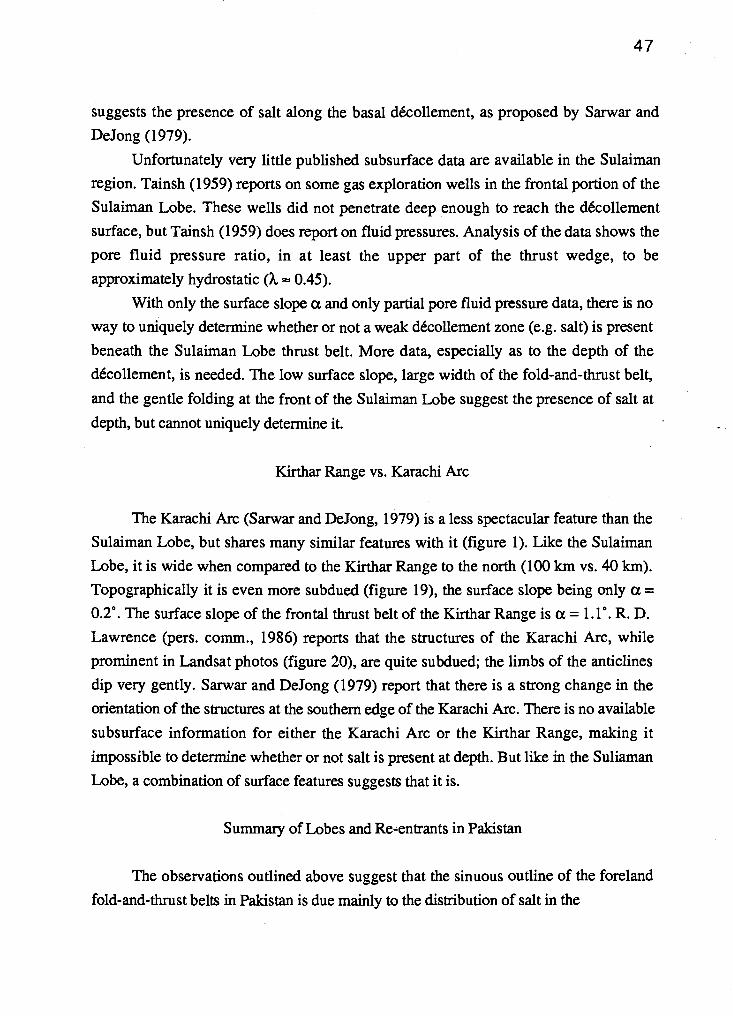
suggests the presence of salt along the basal décollement, as proposed by Sarwar and
DeJong (1979).
Unfortunately very little published subsurface data are available in the Sulaiman
region. Tainsh (1959) reports on some gas exploration wells in the frontal portion of the
Sulaiman Lobe. These wells did not penetrate deep enough to reach the décollement
surface, but Tainsh (1959) does report on fluid pressures. Analysis of the data shows the
pore fluid pressure ratio, in at least the upper part of the thrust wedge, to beapproximately hydrostatic (X 0.45).
With only the surface slope a and only partial pore fluid pressure data, there is no
way to uniquely determine whether or not a weak décollement zone (e.g. salt) is present
beneath the Sulaiman Lobe thrust belt. More data, especially as to the depth of the
décollement, is needed. The low surface slope, large width of the fold-and-thrust belt,
and the gentle folding at the front of the Sulaiman Lobe suggest the presence of salt at
depth, but cannot uniquely determine it.
Kirthar Range vs. Karachi Arc
The Karachi Arc (Sarwar and DeJong, 1979) is a less spectacular feature than the
Sulaiman Lobe, but shares many similar features with it (figure 1). Like the Sulaiman
Lobe, it is wide when compared to the Kirthar Range to the north (100 km vs. 40 km).
Topographically it is even more subdued (figure 19), the surface slope being only a =
0.2°. The surface slope of the frontal thrust belt of the Kirthar Range is a = 1.1°. R. D.
Lawrence (pers. comm., 1986) reports that the structures of the Karachi Arc, while
prominent in Landsat photos (figure 20), are quite subdued; the limbs of the anticines
dip very gently. Sarwar and DeJong (1979) report that there is a strong change in the
orientation of the structures at the southern edge of the Karachi Arc. There is no available
subsurface information for either the Karachi Arc or the Kirthar Range, making itimpossible to determine whether or not salt is present at depth. But like in the Suliaman
Lobe, a combination of surface features suggests that it is.
Summary of Lobes and Re-entrants in Pakistan
The observations outlined above suggest that the sinuous outline of the foreland
fold-and-thrust belts in Pakistan is due mainly to the distribution of salt in the
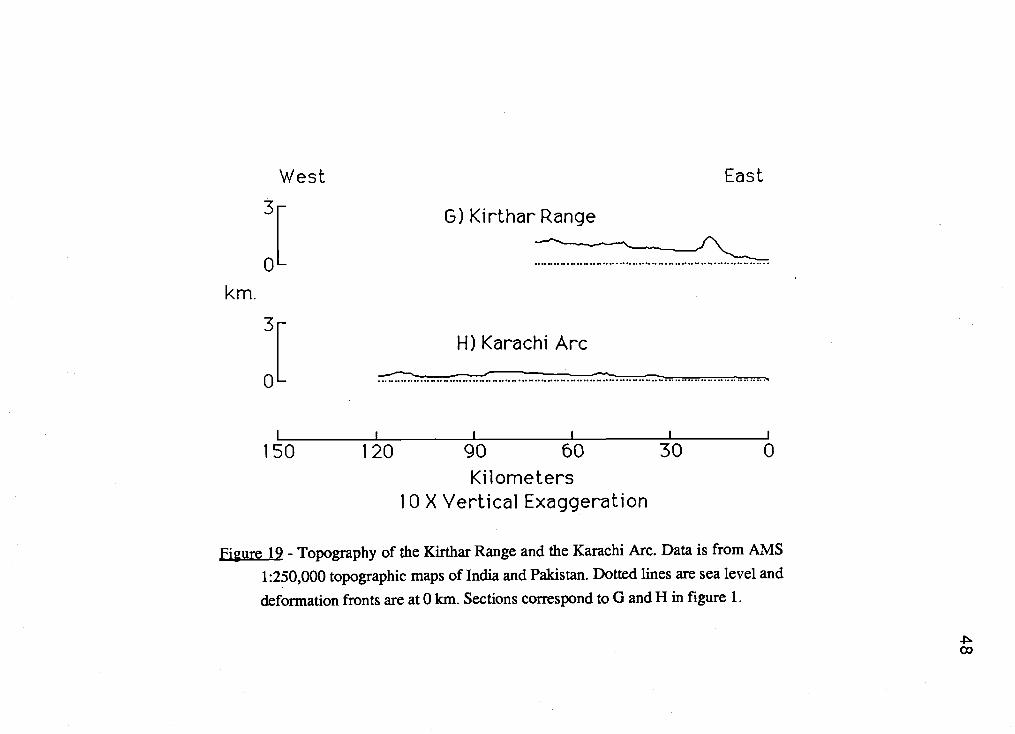
II.!
West East
3[ 0) Kirthar Range
......................................................................
3rIH) Karachi Arc
0L
I I I I
150 120 90 60 30 0
Kilometers1 0 X Vertical Exaggeration
Figure 19 - Topography of the Kirthar Range and the Karachi Arc. Data is from AMS
1:250,000 topographic maps of India and Pakistan. Dotted lines are sea level and
deformation fronts are at 0 km. Sections correspond to 0 and H in figure 1.
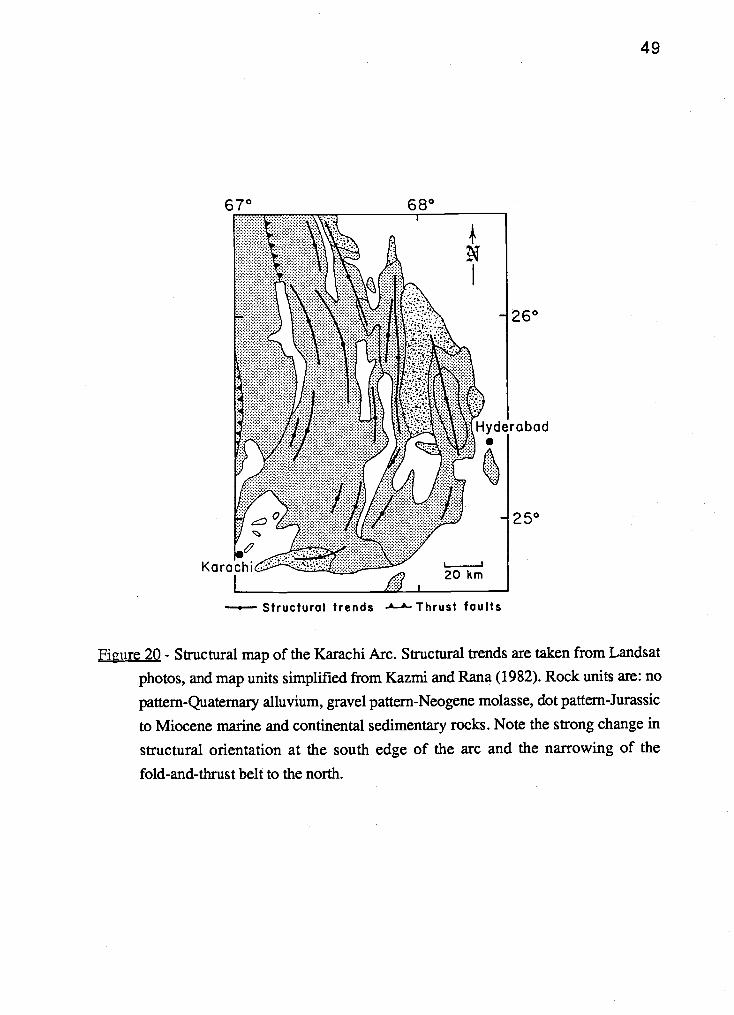
67° 68°
Karo
Structural trends .A_A_Thrust faults
260
rabad
250
Figure 20 - Structural map of the Karachi Arc. Structural trends are taken from Landsat
photos, and map units simplified from Kazmi and Rana (1982). Rock units are: no
pattem-Quaternary alluvium, gravel pattern-Neogene molasse, dot pattern-Jurassic
to Miocene marine and continental sedimentary rocks. Note the strong change in
structural orientation at the south edge of the arc and the narrowing of the
fold-and-thrust belt to the north.

50
subsurface. Besides being in the Salt Range-Potwar Plateau area, salt is also known to
lie in the subsurface south of the Sargodha High near Multan (Cento, 1972, asreferenced by Sarwar and DeJong, 1979). It is possible that the Salt Range Formation
could extend to the south and west far enough to be present in other thrust belts. It is
only the presence of the basement ramp in the Salt Range-Potwar Plateau area that brings
the Salt Range Formation to the surface. A fold-and-thrust belt with a relatively smooth
basement surface, similar to the eastern Potwar Plateau, may not expose the underlying
salt at the surface.

51
CONCLUSIONS
The Salt Range-Potwar Plateau area of Pakistan provides a good test for the Davis
and Engelder (1985) model, in that it is an active fold-and-thrust belt underlain by salt.
The seismic reflection profiles, Bouguer gravity anomalies, and well data provided by
the Government of Pakistan provide a three dimensional view of this thrust belt that
gives the necessary constraints to allow an application of the model.
The model is successful in explaining almost all of the observed features of the
Salt Range-Potwar Plateau. The differences in topography and surface structure across
the Salt Range-Potwar Plateau are mainly due to the response of the fold-and-thrust belt
to changes in the underlying basement. The deformation of the eastern Potwar Plateau
represents an interaction of a shallow basement dip ( < l) with drag along the eastern
edge of the salt basin. The taper of the wedge, together with pore fluid pressure ratios
from petroleum exploration wells, allow the estimation of values for the yield strength of
the evaporites (t0 = 1.48 MPa) and the coefficient of internal friction (p. = 1.03) of the
overlying wedge. These values fall within expected ranges derived from other sources.
In the central and western Salt Range-Potwar Plateau the Sargodha High, abasement uplift in the Indian plate, interferes with the fold-and-thrust belt, causing the
ramping of the décollement. Specifically, the Salt Range is due to a thrust ramp caused
by a basement normal fault in the central Salt Range, and to a basement upwarp in the
western Salt Range. The weak evaporite layer, together with the relative steepness of the
ramp, allow the thrust wedge to override the ramp with only minor deformation. This
coincides with the interpretation that the Salt Range remains a coherent slab (Baker, in
prep.; Leathers, in prep.). The Sargodha Ridge also creates a steeper basement slope (f3
2°-4°) beneath the central and western Potwar Plateau. This relatively steep slope
provides more than the necessary taper for the southern Potwar Plateau, allowing it to be
pushed across the foreland without deformation. This interpretation is consistent with the
undeformed nature of the southern Potwar Plateau.
The northern Potwar Plateau is a strongly deformed thrust wedge, yet it hasessentially no topographic slope. This apparent contradiction is resolved whenconsidering the timing of deformation. Based on paleomagnetic data (Johnson et al., in
press, 1986), the deformation in the northern Potwar Plateau stopped about 2 m.y.a. In
this study it is proposed that the northern Potwar Plateau existed as a strongly tapered

52
fold-and-thrust belt proir to 2 m.y.a., and it has since overridden the north edge of the
salt basin and erosion has removed its former topographic slope.
The discrete offset of the basement beneath the central Salt Range and the general
non-linearity of the basement slope beneath the Salt Range-Potwar Plateau are not
adequately covered by the Davis and Engelder (1985) model. They do not directlyconflict with the model; the model has not been sufficently generalized to deal with them.
All of the models considered by Davis et al. (1983), Dahlen et al. (1984), Davis and
Engelder (1985), and Thao et al. (1986) asssume that the basement is not offset and has
a linear slope. The effect of a basement offset beneath a fold-and-thrust belt has been
considered by Wiltschko and Eastman (1983; in press, 1986), although not for the case
of a salt décollement. It is suggested here that, due to the presence of salt, the thrust
sheet can override the normal fault beneath the Salt Range with little internaldeformation. The effect of basement offsets might be further studied by the continued
use of the "sandbox" model of Davis et al. (1983), together with a "fault" placed along
the bottom surface of the box. To address the second deviation (basement curvature), a
generalization of the Davis et al. (1983) model is proposed here where the basement
surface follows a continuous function, such that the slope can be derived at any point.
This is considered as a way to possibly integrate basement surfaces of underthrusting
slabs derived from plate flexure models (e.g. Lyon-Caen and Molnar, 1983; 1985)together with mechanical models of thrusting.
Another point not adequately discussed by Davis and Engelder (1985) is the nature
of the changes in structural style when a salt/no-salt boundary is encountered. A "triangle
zone" structure is seen in the northern Potwar Plateau; it is considered to have originally
developed at the northern end of the salt basin. The occurence of structures of this type
elsewhere (Jones, 1982) often coincide with the presence of salt at the base of afold-and-thrust belt (Davis and Engelder, 1985). It is suggested here that there may be a
causal relationship between the existence of "triangle zones" and a décollement that
propogates into a salt basin.
With the success of the Davis and Engelder (1985) model in predicting many of
the features in the Salt Range-Potwar Plateau area, a brief look is taken at the rest of the
active fold-and-thrust belt in Pakistan to see if some of these features are presentelsewhere. The Sulaiman Lobe and the Karachi Arc are seen to exhibit several of the
features predicted by the model, including: a) low topographic slopes, b) wide thrust
belts, c) symmetrical structures, and d) changes in structural strike at the edges. Note

53
that one of these areas, the Sulaiman Lobe, was considered in an earlier paper (Sarwar
and DeJong, 1979) to be underlain by the Salt Range Formation. From this it issuggested that the sinuous form of the mountain belts in Pakistan is mainly controlled by
the distribution of salt in the subsurface, as opposed to basement highs in theunderthrusting Indian plate.
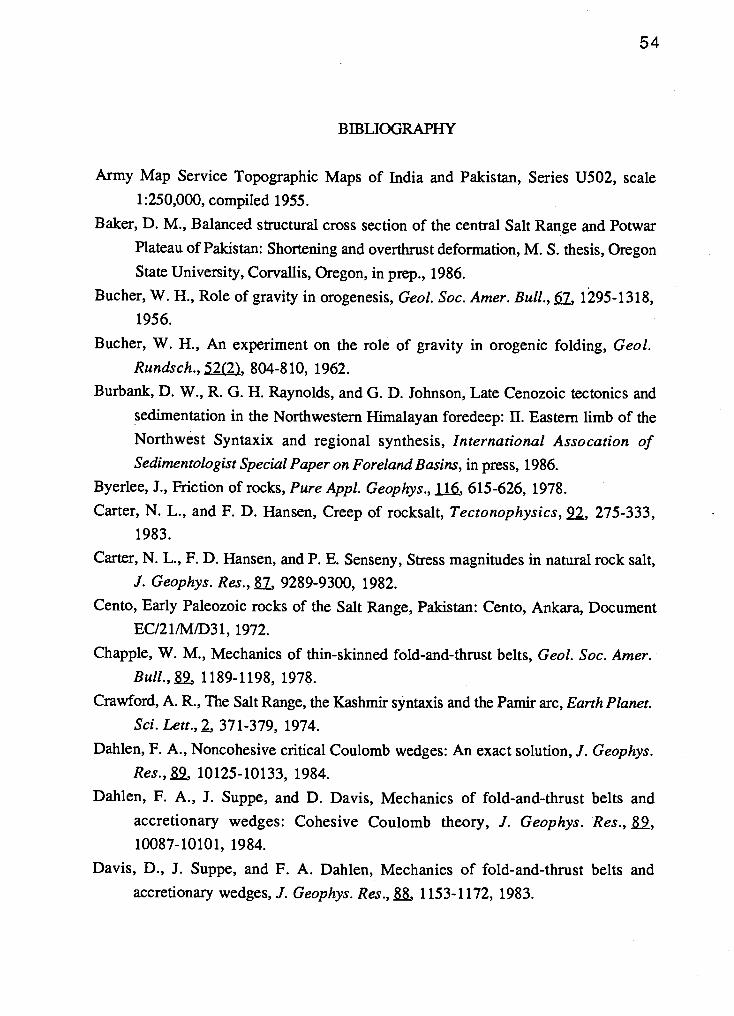
54
P : Vi
Army Map Service Topographic Maps of India and Pakistan, Series U502, scale1:250,000, compiled 1955.
Baker, D. M., Balanced structural cross section of the central Salt Range and Potwar
Plateau of Pakistan: Shortening and overthrust deformation, M. S. thesis, Oregon
State University, Corvallis, Oregon, in prep., 1986.
Bucher, W. H., Role of gravity in orogenesis, Geol. Soc. Amer. Bull., JL, 1295-1318,1956.
Bucher, W. H., An experiment on the role of gravity in orogenic folding, Geol.Rundsch., 52( 804-8 10, 1962.
Burbank, D. W., R. G. H. Raynolds, and G. D. Johnson, Late Cenozoic tectonics and
sedimentation in the Northwestern Himalayan foredeep: II. Eastern limb of the
Northwest Syntaxix and regional synthesis, International Assocation of
Sedimentolo gist Special Paper on Fore/and Basins, in press, 1986.
Byerlee, J., Friction of rocks, Pure Appi. Geophys., fl 6 15-626, 1978.
Carter, N. L., and F. D. Hansen, Creep of rocksalt, Tectonophysics, 92., 275-333,1983.
Carter, N. L., F. D. Hansen, and P. E. Senseny, Stress magnitudes in natural rock salt,J. Geophys. Res., , 9289-9300, 1982.
Cento, Early Paleozoic rocks of the Salt Range, Pakistan: Cento, Ankara, DocumentEC/211M/D31, 1972.
Chapple, W. M., Mechanics of thin-skinned fold-and-thrust belts, Geol. Soc. Amer.
1189-1198, 1978.
Crawford, A. R., The Salt Range, the Kashmir syntaxis and the Paniir arc, Earth Planet.
Sci. Lett., 2., 37 1-379, 1974.
Dahlen, F. A., Noncohesive critical Coulomb wedges: An exact solution, J. Geophys.
Res.,?.9, 10125-10133, 1984.
Dahlen, F. A., J. Suppe, and D. Davis, Mechanics of fold-and-thrust belts andaccretionary wedges: Cohesive Coulomb theory, J. Geophys. Res., £9.,10087-10101, 1984.
Davis, D., J. Suppe, and F. A. Dahien, Mechanics of fold-and-thrust belts andaccretionary wedges, J. Geophys. Res., 1153-1172, 1983.
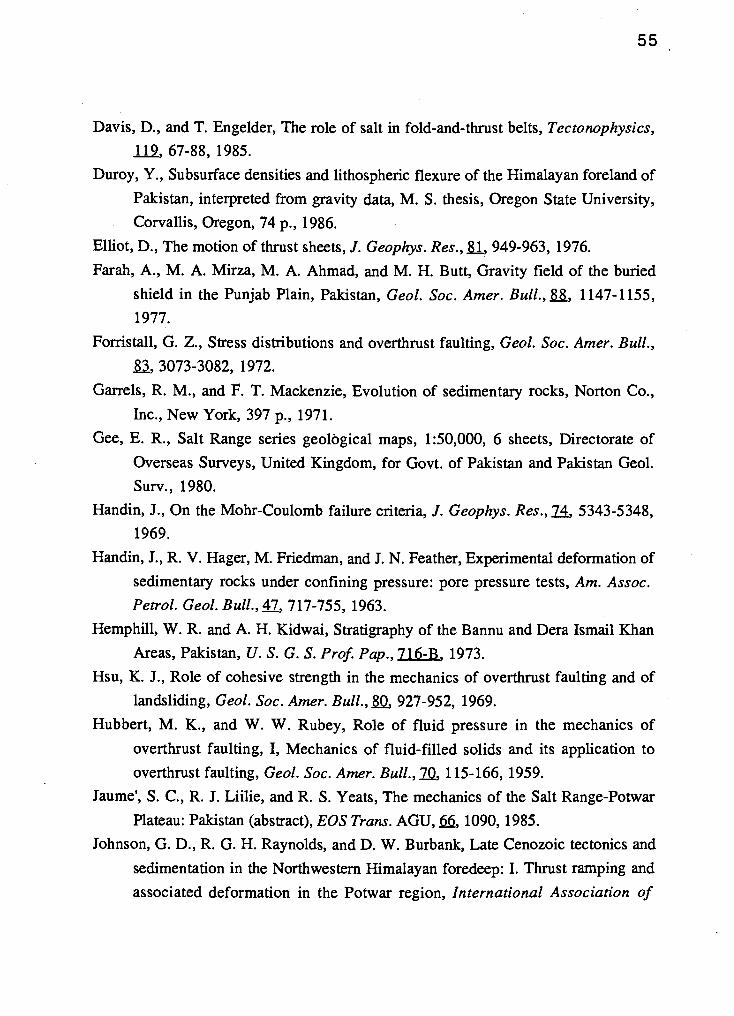
55
Davis, D., and T. Engelder, The role of salt in fold-and-thrust belts, Tectonophysics,119., 67-88, 1985.
Duroy, Y., Subsurface densities and lithospheric flexure of the Himalayan foreland of
Pakistan, interpreted from gravity data, M. S. thesis, Oregon State University,Corvallis, Oregon, 74 p., 1986.
Elliot, D., The motion of thrust sheets, J. Geophys. Res., Li., 949-963, 1976.
Farah, A., M. A. Mirza, M. A. Ahmäd, and M. H. Butt, Gravity field of the buried
shield in the Punjab Plain, Pakistan, Geol. Soc. Amer. Bull., La., 1147-1155,1977.
Forristall, G. Z., Stress distributions and overthrust faulting, Geol. Soc. Amer. Bull.,
£3, 3073-3082, 1972.
Garrels, R. M., and 1. T. Mackenzie, Evolution of sedimentary rocks, Norton Co.,Inc., New York, 397 p., 1971.
Gee, E. R., Salt Range series geological maps, 1:50,000, 6 sheets, Directorate ofOverseas Surveys, United Kingdom, for Govt. of Pakistan and Pakistan Geol.Surv., 1980.
Handin, J., On the Mobr-Coulomb failure criteria, .1. Geophys. Res., 14, 5343-5348,1969.
Handin, J., R. V. Hager, M. Friedman, and J. N. Feather, Experimental deformation of
sedimentary rocks under confining pressure: pore pressure tests, Am. Assoc.Petrol. Geol. Bull., 47., 7 17-755, 1963.
Hemphill, W. R. and A. H. Kidwai, Stratigraphy of the Bannu and Dera Ismail Khan
Areas, Pakistan, U. S. G. S. Prof. Pap., 716-B, 1973.
Hsu, K. J., Role of cohesive strength in the mechanics of overthrust faulting and oflandsliding, Geol. Soc. Amer. Bull., , 927-952, 1969.
Hubbert, M. K., and W. W. Rubey, Role of fluid pressure in the mechanics ofoverthrust faulting, I, Mechanics of fluid-filled solids and its application tooverthrust faulting, Geol. Soc. Amer. Bull., 7, 115-166, 1959.
Jaume', S. C., R. J. Liilie, and R. S. Yeats, The mechanics of the Salt Range-Potwar
Plateau: Pakistan (abstract), EOS Trans. AGU, , 1090, 1985.
Johnson, G. D., R. G. H. Raynolds, and D. W. Burbank, Late Cenozoic tectonics and
sedimentation in the Northwestern Himalayan foredeep: I. Thrust ramping and
associated deformation in the Potwar region, International Association of
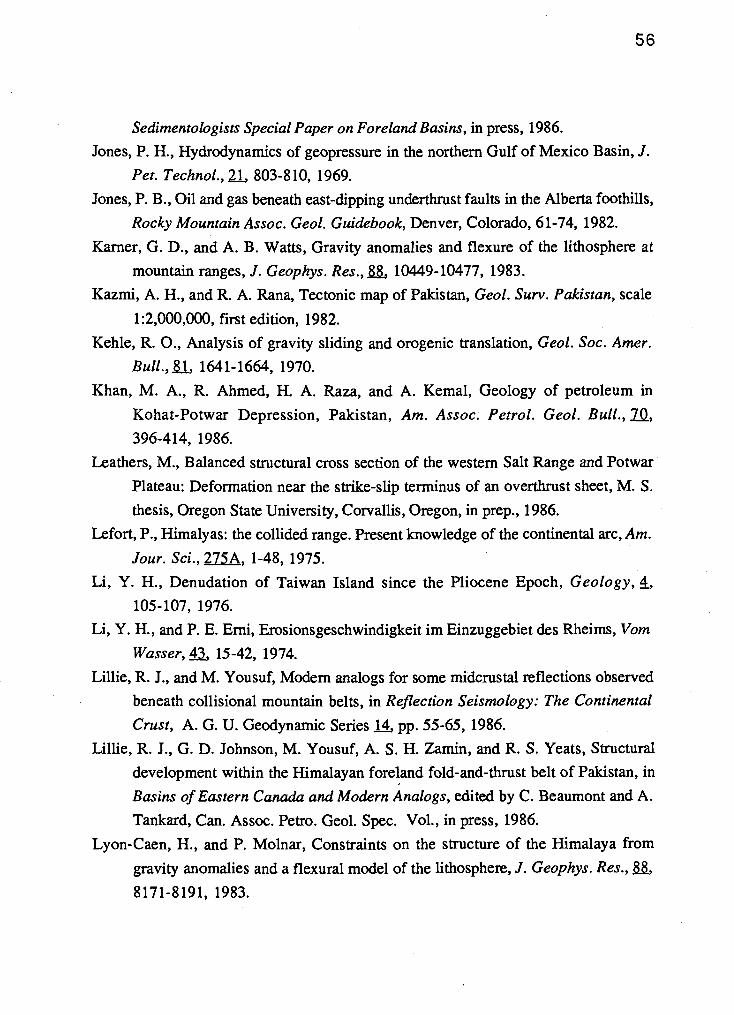
56
Sedimentologists Special Paper on Foreland Basins, in press, 1986.
Jones, P. H., Hydrodynamics of geopressure in the northern Gulf of Mexico Basin, J.
Pet. Technol., 2.1., 803-8 10, 1969.
Jones, P. B., Oil and gas beneath east-dipping underthrust faults in the Alberta foothills,
Rocky Mountain Assoc. Geol. Guidebook, Denver, Colorado, 61-74, 1982.
Karner, G. D., and A. B. Watts, Gravity anomalies and flexure of the lithosphere at
mountain ranges, J. Geophys. Res., 10449-10477, 1983.
Kazmi, A. H., and R. A. Rana, Tectonic map of Pakistan, Geol. Sun'. Pakistan, scale
1:2,000,000, first edition, 1982.
Kehie, R. 0., Analysis of gravity sliding and orogenic translation, Geol. Soc. Amer.
Bull.jJ.., 1641-1664, 1970.
Khan, M. A., R. Ahmed, H. A. Raza, and A. Kemal, Geology of petroleum inKohat-Potwar Depression, Pakistan, Am. Assoc. Petrol. Geol. Bull., 2..,396-414, 1986.
Leathers, M., Balanced structural cross section of the western Salt Range and Potwar
Plateau: Deformation near the strike-slip terminus of an overthrust sheet, M. S.
thesis, Oregon State University, Corvallis, Oregon, in prep., 1986.
Lefort, P., Himalyas: the collided range. Present knowledge of the continental arc, Am.
Jour. Sd., 275A, 1-48, 1975.
Li, Y. H., Denudation of Taiwan Island since the Pliocene Epoch, Geology, £105-107, 1976.
Li, Y. H., and P. E. Erni, Erosionsgeschwindigkeit im Einzuggebiet des Rheims, Vom
Wasser,4.1 15-42, 1974.
Lillie, R. J., and M. Yousuf, Modem analogs for some midcrustal reflections observed
beneath collisional mountain belts, in Reflection Seismology: The Continental
Crust, A. G. U. Geodynamic Series 1.4, pp. 55-65, 1986.
Lillie, R. J., G. D. Johnson, M. Yousuf, A. S. H. Zamin, and R. S. Yeats, Structuraldevelopment within the Himalayan foreland fold-and-thrust belt of Pakistan, in
Basins of Eastern Canada and Modern Analogs, edited by C. Beaumont and A.
Tankard, Can. Assoc. Petro. Geol. Spec. Vol., in press, 1986.
Lyon-Caen, H., and P. Molnar, Constraints on the structure of the Himalaya from
gravity anomalies and a flexural model of the lithosphere, J. Geophys. Res.,
8171-8191, 1983.

57
Lyon-Caen, H., and P. Molnar, Gravity anomalies, flexure of the Indian plate, and the
structure, support and evolution of the Himalaya and Ganga Basin, Tectonics, 4,
513-538, 1985.
McDougall, J., Balanced structural cross section of the Surghar Range and KohatPlateau, in prep., 1986.
Meissner, C. R., J. M. Master, M. A. Rashid, and M. Hussain, Stratigraphy of theKohat Quadrangle, Pakistan, U. S. G. S. Prof Pap., 716-D, 1974.
Opdyke, N. D., N. M. Johnson, G. D. Johnson, E. H. Lindsay, and R. A. K.Tahirkheli, Paleomagnetism of the Middle Siwalik formations of northern Pakistan
and rotation of the Salt Range decollement, Palaeogeogr., Palaeoclimatol.,Palaeoecol., 31, 1-15,1982.
Pennock, N., Balanced structural cross section of the eastern Potwar Plateau, Pakistan:
Shortening and deformation at the edge of a salt basin, M. S. thesis, Oregon State
University, Corvallis, Oregon, in prep., 1986.
Price, R. A., Gravitational sliding and the foreland thrust and fold belt of the North
American Cordillera, discussion, Geol. Soc. Amer. Bull., .az., 1133-1138, 1971.
Price, R. A., and E. W. Mountjoy, Geologic structure of the Canadian RockyMountains between Bow and Athabasca Rivers-Progress report, Geol. Ass. Can.
Spec. Pap.,, 7-25, 1970.Sarwar, G., and K. A. DeJong, Arcs, oroclines, syntaxes: the curvatures of mountain
belts in Pakistan, in Geodynamics of Pakistan, edited by A. Farah and K. A.
DeJong, pp. 34 1-350, Geol. Surv. Pakistan, Quetta, 1979.
Seeber, L., and J. Armbruster, Great detachment earthquakes along the Himalayan arc
and long-term forecasting, in Earthquake Prediction, An International Review,
Maurice Ewing Ser., 4., edited by D. W. Simpson and P. G. Richards, pp.215-242, A. G. U., Washington, D. C., 1981.
Seeber, L., J. G. Armbruster, and R. C. Quitmeyer, Seismicity and continentalsubduction in the Himalayan arc, in Zagros-Hindu Kush-Himalaya Geodynamic
Evolution, Am. Geophys. Un. Geodynamic Series, a, edited by H. K. Gupta and
F. Delaney, pp. 215-242, 1981.
Smoluchowski, M. S., Some remarks on the mechanics of overthrusts, Geol. Mag., ,
204-205, 1909.
Stockmal, G. S., Modeling of large-scale accretionary wedge deformation, .1. Geophys.
Res., B.., 8271-8287, 1983.
Tainsh, H. R., K. V. Stringer, and J. Azad, Major gas fields of west Paldstan, Amer.
Assoc. Petrol. Geol. Bull., 43.., 2675-2700, 1959.
Wadia, D. N., Geology of India, MacMillan and Co., Ltd., London, 531 p., 1953.
Walcott, R. I., Flexural rigidity, thickness and viscosity of the lithosphere, J. Geophys.
Res.,25, 3941-3954, 1970.
Wiltschko, D., and D. Eastman, Role of basement warps and faults in localizing thrust
fault ramps, in Contributions to the Tectonics and Geophysics of Mountain
Chains, Mem. 158, edited by R. D. Hatcher, H. Williams, and I. Zietz, pp.177-190, 1983.
Wiltschko, D. V., and D. B. Eastman, A photoelastic study of the effects of preexisting
faults in basement on the subsequent deformation of the cover, in Interaction of
the Rocky Mountain foreland and Cordilleran thrust belt, Geol. Soc. Amer.Memoir, in press, 1986.
Yeats, R. S., S. H. Khan, and M. Akhtar, Late Quaternary deformation of the SaltRange of Pakistan, Geol. Soc. Amer. Bull., j5., 958-966, 1984.
Yeats, R. S., and R. D. Lawrence, Tectonics of the Himalayan thrust belt in northern
Pakistan, in Marine Geology and Oceanography of Arabian Sea and CoastalPakistan, edited by B. U. Haq and J. D. Milliman, Van Nostrand Reinhold Co.,
New York, pp. 177-198, 1984.
Thao, W. -L., D. M. Davis, F. A. Dahlen, and J. Suppe, Origin of convex accretionary
wedges: Evidence from Barbados, J. Geophys. Res., 21, 10246-10258, 1986.
Related Documents


![[redacted] - Summer school on real-world crypto and privacy ...[redacted] - Summer school on real-world crypto and privacy 2015 ibenik, Croatia Author Jacob Appelbaum Created Date](https://static.cupdf.com/doc/110x72/60e2954d7f1d5f30c12f568c/redacted-summer-school-on-real-world-crypto-and-privacy-redacted-summer.jpg)
![APEX HOME INSPECTIONS · APEX HOME INSPECTIONS (763) 441-446 alan@apexhomemn.com HOME ADDRESS [Redacted for privacy of sample report] CLIENT NAME [Redacted for privacy of sample report]](https://static.cupdf.com/doc/110x72/5fce02a5ec05aa463951b966/apex-home-inspections-apex-home-inspections-763-441-446-alanapexhomemncom-home.jpg)
![Signature redacted for privacy. - [email protected] Home](https://static.cupdf.com/doc/110x72/61fb10252e268c58cd59b7e1/signature-redacted-for-privacy-emailprotected-home.jpg)