AN ABSTRACT OF THE THESIS OF Elliot Leonard Atlas for the degree of Doctor of Philosophy in Oceanography presented on June 5, 1975 Title: PHOSPHATE EQUILIBRIA IN SEAWATER AND INTERSTITIAL WATERS Abstract approved: Ricardo M. Pytkowicz In this thesis, the chemistry of phosphate in seawater is examined in terms of solution and solubility equilibria. Extrapola- tions, based on experimental results, are made which provide a first approximation to the behavior of phosphate in interstitial waters. Such extrapolations are necessary to examine the formation and behavior of marine phosphorites. Solution equilibria are described by an ion-pairing model. Measurements of the three dissociation constants of phosphoric acid were made in seawater and various NaCl-KC1-MgCl2-CaC12 solutions. From the shift in the acid dissociation constants measured in differ- ent solutions, association constants between Na+, Ca+Z, Mg+Z and H2PO4, HP042, and P043 were calculated. The calculations were based on the assumption that K+ association with phosphate is Redacted for privacy

Welcome message from author
This document is posted to help you gain knowledge. Please leave a comment to let me know what you think about it! Share it to your friends and learn new things together.
Transcript
AN ABSTRACT OF THE THESIS OF
Elliot Leonard Atlas for the degree of Doctor of Philosophy
in Oceanography presented on June 5, 1975
Title: PHOSPHATE EQUILIBRIA IN SEAWATER AND
INTERSTITIAL WATERS
Abstract approved:Ricardo M. Pytkowicz
In this thesis, the chemistry of phosphate in seawater is
examined in terms of solution and solubility equilibria. Extrapola-
tions, based on experimental results, are made which provide a first
approximation to the behavior of phosphate in interstitial waters.
Such extrapolations are necessary to examine the formation and
behavior of marine phosphorites.
Solution equilibria are described by an ion-pairing model.
Measurements of the three dissociation constants of phosphoric acid
were made in seawater and various NaCl-KC1-MgCl2-CaC12 solutions.
From the shift in the acid dissociation constants measured in differ-
ent solutions, association constants between Na+, Ca+Z, Mg+Z and
H2PO4, HP042, and P043 were calculated. The calculations
were based on the assumption that K+ association with phosphate is
Redacted for privacy
-2 onegligible. It was found that, at pH = 8.0, HPO4 and Mg PO4
species comprise 70% of the total inorganic phosphate in seawater,
The solubility behavior of apatite in seawater was found to be
dominated by surface reactions. Nine different naturally occurring
apatites were equilibrated in 33%o seawater at 10°C. When equili-
brated, the samples demonstrated a nearly reversible steady-state
phosphate concentration which could be described by an expression
of the type -log P043 K1 + K2 pH. K1 ranged from 8.190 to
13.697; K2, the pH dependence, ranged from -.047 to -.928.
Experiments also demoristrated the uptake and release of alkalinity
arid F on the apatite surface. The results are interpreted in terms
of a surface layer containing vaiying proportions of F and HP042
ions. Calculations using an average value of the solubility of marine
apatites shows seawater to be very near apatite saturation.
The conditions of apatite formation are discussed, and it is
concluded that interstitial waters in modern upwelling regions are
the most favorable locations for phosphorite growth. Data on apatite
precipitation kinetics s1ows that phosphorite formation will not occur
in open seawater. Equilibrium and kinetic conditions for phosphorite
growth are met, however, in the interstitial environment. Oceano-
graphic conditions, also, make upwelling areas likely sites for
phosphorite formation. The saturation state of interstitial waters is
not well defined, though, because of compositional variations in the
fluid. Calculations are made which illustrate the dependence of
apatite solubility on the concentration of Ca+Z and Mg+Z. A decrease
in Mg decreases the solubility, whereas a decrease in Ca
increases the solubility.
Phosphate Equilibria in Seawater andInterstitial Waters
by
Elliot Leonard Atlas
A THESIS
submitted to
Oregon State University
in partial fulfillment ofthe requirements for the
degree of
Doctor of Philosophy
Completed June 5, 1975
Commencement June 1976
APPROVED:
Professor of Oceanography in charge of major
Deanof School of Ocanography
Dean of Graduate School
Date thesis presented June 5, 1975
Typed by Suelynn Williams for Elliot Leonard Atlas
Redacted for privacy
Redacted for privacy
Redacted for privacy
ACKNOW LEDGEMENTS
I would like to briefly thank those who gave me considerable
help in my work on this thesis. Dr. R. M. Pytkowicz served as
thesis advisor and suggested the problem of phosphate solubility.
Discussions with him were very helpful in clarifying many of my
thoughts. Dr. C. Culberson also offered valuable suggestions and
comments. Drs. R. Heath, M. Harward, L. Gordon, and J. Dymond
kindly made available some of the instrumentation used in this study
and helped in other ways, too. R. Gulbrandsen, P. J. Cook, W.
Burnett, D. S. Cronan, R. Siesser, andD. J. Cullen generously
supplied phosphorite samples. R. Vesofsky made surface area
measurements of some apatite samples. J. E. Gibson of the Inter-
national Minerals and Chemical Corporation performed chemical
analyses of the phosphate samples used in this work. S. Williams
patiently typed through several drafts of this thesis. The most
special thanks go to my wife, Holly, for her constant and invaluable
love and support.
The research was supported by Office of Naval Research Grant
N00014-67-A-0369-0007 and National Science Foundation Grant
DES7Z-01631. Cover photo is courtesy of SURFING magazine!
Dan Merkel.
TABLE OF CONTENTS
I. INTRODUCTION 1
II. PHOSPHATE ASSOCIATION WITH Nat, Ca+Z, and Mg2IN SEAWATER 6
Introduction 6
Theory 7
Experimental 11
Results 14Discussion 14Conclusions 31
III. SOLUBILITY BEHAVIOR OF APATITE IN SEAWATER 32Introduction 32Experimental 38Results 40Discussion 60Conclusions 71
IV. FACTORS AFFECTING THE FORMATION OF MARINEPHOSPHORITES 74
Introduction 74Equilibrium Considerations 79Kinetic Considerations 89Discussion 93Oceanographic conditions relating to phos phorite
formation 97Synthesis: apatite formation in the ocean 102
BIBLIOGRAPHY AND RELATED REFERENCES 110
APPENDIX IThermodynamic estimates of phosphate stability inseawater 125
APPENDIX IIMethods and procedures for apatite solubilityexperiments 135
APPENDIX IIIDescription of samples used in apatite solubility studyMicroprobe analysis of apatite sample 138
APPENDIX IVData forapatite solubility studies 146
LIST OF FIGURES
Figure Page
1. 1 Phosphate dissociation in distilled water, 0. 68 KC1,and 34. 8%o SW 3
2. 1 pK* (MgHPO40, CaHPO40) versus ionic strength
2. 2 Temperature and salinity dependence of K2 26
2. 3 Phosphate specation in 34. 8%o seawater at pH 8. 0 29
3. 1 Experimental flow-system for solubility studies 39
3. 2 Time of equilibration in column experiments 41
3. 3 Experimental results (TPO4, F, pH) showing surfacearea effects 43
34 HP042 and P043 concentrations for surface areaexperiments 44
3.5 pHPO42, pPO43, and pH versus surface area 45
3.6 F/TPO4 for surface area experiments 47
3.7 TPO, F, pH, and alkalinity variations versus time forbeaker experiments 49
3.8 TPO, pPO43, and alkalinity for repeated equilibrationsin column experiments 54
3.9 pPO43 versus pH for eight different apatites 55
3.10 pPO43 versus pH, showing effect of C032 onsolubility 59a
3. 11 Steady-state interpretation of experimental results 67
3. 12 Percent saturation with respect to oceanic apatites inthe North Pacific 72
LIST OF FIGURES CONTINUED
Figure Page
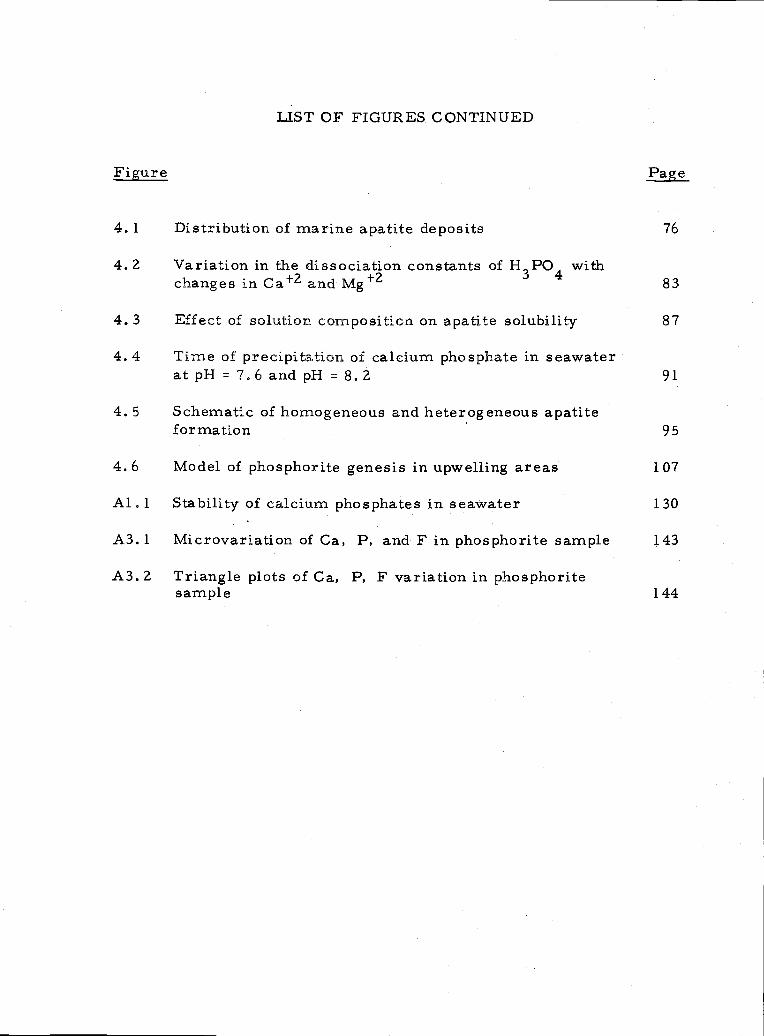
4. 1 Distribution of marine apatite deposits 76
4. 2 Variation in the dissociation constants of H P0 withchanges in Ca and Mg+2 83
4. 3 Effect of solution composition on apatite solubility 87
4. 4 Time of precipitation of calcium phosphate in seawateratpH=7.6andpH=8,2 91
4. 5 Schematic of homogeneous and heterogeneous apatiteformation 95
4. 6 Model of phosphorite genesis in upwelling areas 1 07
Al. 1 Stability of calcium phosphates in seawater 130
A3. 1 Microvariation of Ca, P, and F in phosphorite sample 143
A3. 2 Triangle plots of Ca, P, F variation in phosphoritesample 144
LIST OF TABLES
Table Page
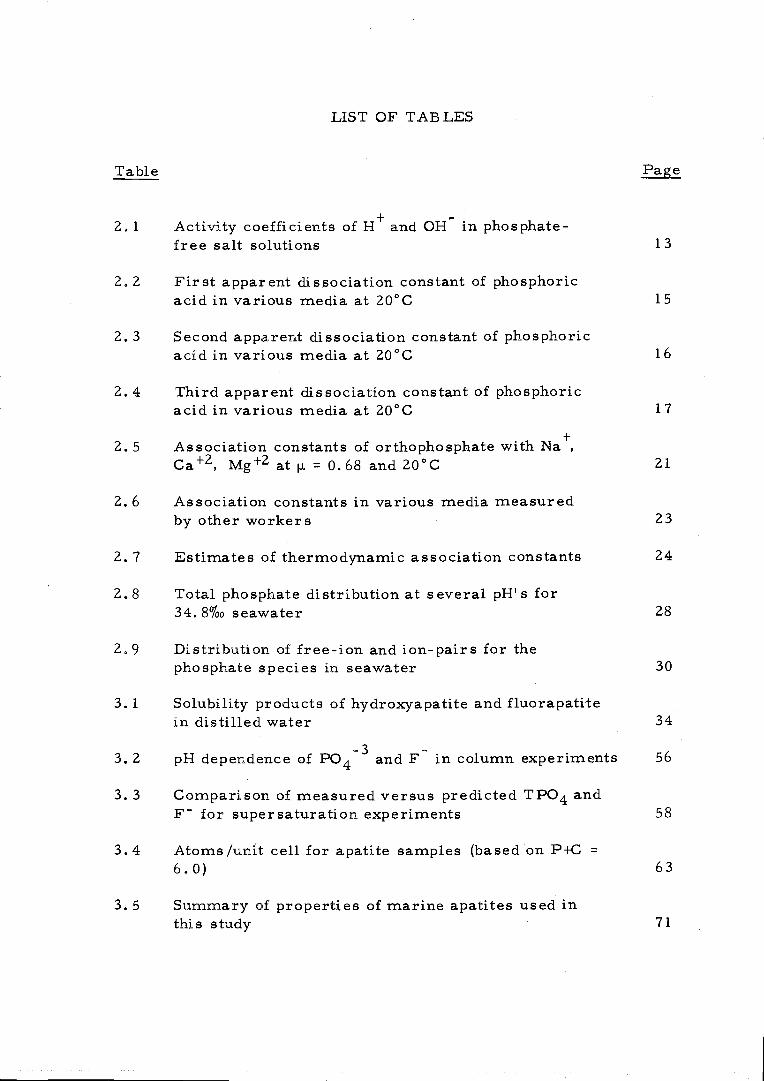
2. 1 Activity coefficients of H+ and 0H in phosphate-free salt solutions 13
2. 2 First apparent dissociation constant of phosphoricacid in various media at 20°C 15
2. 3 Second apparent dissociation constant of phosphoricacid in various media at 20°C 16
2. 4 Third apparent dissociation constant of phosphoricacid in various media at 20°C 1 7
2. 5 Association constants of orthophosphate with Na+,Ca+Z, Mg at = 0.68 and 20°C 21
2.6 Association constants in various media measuredby other workers 23
2. 7 Estimates of thermodynamic association constants 24
2.8 Total phosphate distribution at several pH's for34.8%o seawater 28
2,9 Distribution of free-ion and ion-pairs for thephosphate species in seawater 30
3. 1 Solubility products of hydroxyapatite and fluorapatitein distilled water 34
3. 2 pH dependence of PO4 and F in column experiments 5
3. 3 Comparison of measured versus predicted TPO4 andF for supersaturation experiments 58
3.4 Atoms /unit cell for apatite samples (based on P+C6,0) 63
3. 5 Summary of properties of marine apatites used inthis study 71
LIST OF TABLES CONTINUED
Table Page
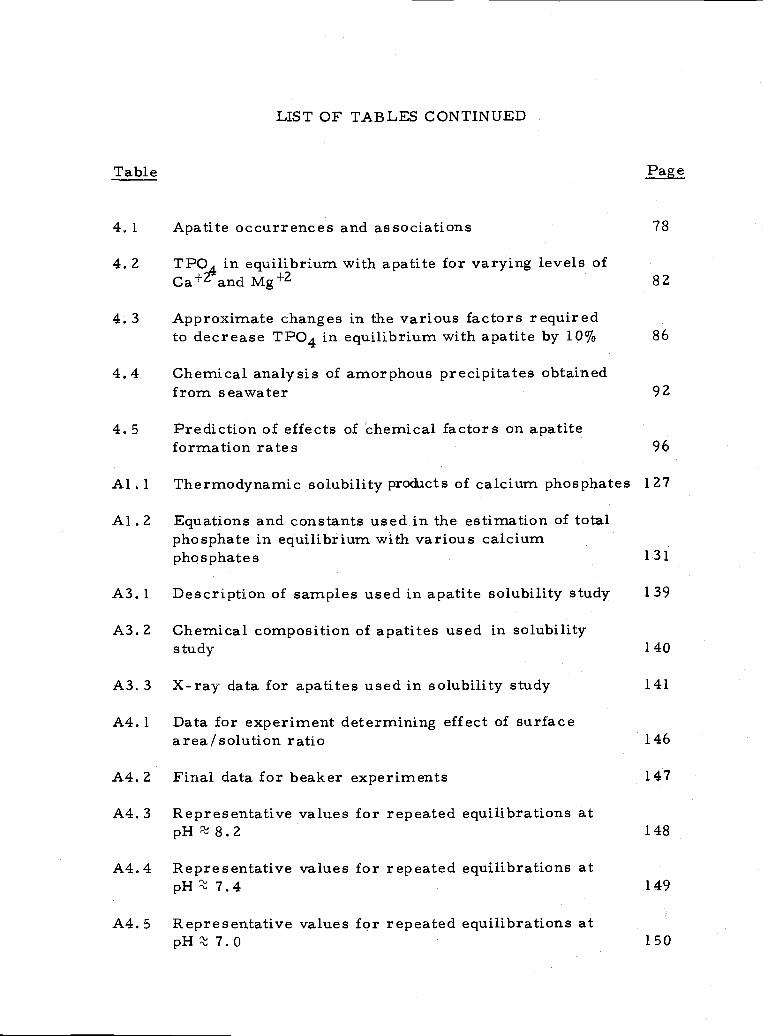
4. 1 Apatite occurrences and associations 78
4. 2 TPO4 in equilibrium with apatite for varying levels ofCa+Z and Mg+Z 8
4. 3 Approximate changes in the various factors requiredto decrease TPO4 in equilibrium with apatite by 10% 86
4.4 Chemical analysis of amorphous precipitates obtainedfrom seawater 92
4.5 Prediction of effects of chemical factors on apatiteformation rates 96
Al. 1 Thermodynamic solubility products of calcium phosphates 127
Al . 2 Equations and constants used in the estimation of totalphosphate in equilibrium with various calciumphosphates 131
A3. 1 Description of samples used in apatite solubility study 1 39
A.3. 2 Chemical composition of apatites used in solubilitystudy 140
A3. 3 X-ray data for apatites used in solubility study 141
A4, 1 Data for experiment determining effect of surfacearea/solution ratio 146
A4, 2 Final data for beaker experiments 147
A4. 3 Representative values for repeated equilibrations atpH8.2 148
A4.4 Representative values for repeated equilibrations atpH7.4 149
A4. 5 Representative values for repeated equilibrations atpH7.0 150
LIST OF TABLES CONTINUED
Table Page
A4.6 pH and pPO4 for samples equilibrated at 25°C 15.1
A4.7 Data for experiments run from TPO4 supersaturation 152
A4..8 Data for experiments using regular seawater andseawater with no alkalinity 153
PHOSPHATE EQUILIBRIA IN SEAWATER ANDINTERSTITIAL WATERS
CHAPTER I
INTRODUCTION
The importance of phosphate as a plant nutrient has led to a vast
amount of descriptive information on the abundance of phosphate
throughout the world's oceans (see, for example, Armstrong, 1963;
Guibrandsen and Roberson, 1974). The spatial variation and overall
distribution of phosphate is, on the whole, quite well known. The
variation in phosphate concentration in the ocean is related to the
biological uptake and release of phosphate and to the general circula-
tion of the oceans. It is through the biological cycle that phosphate is
linked with oxygen (Redfield, 1934, 1948; Redfield, Ketchum and
Richards, 1963). Indeed, some have suggested that phosphate levels
in the ocean, by their influence on the oxygen cycle, are a key factor
in the stability of atmospheric oxygen throughout geological time
(Walker, 1974).
In addition to the biological cycle, phosphate enters into a geo-
chemical cycle. Phosphate enters rivers as a product of weathering
of rocks and is subsequently brought to the oceans. If the oceans ar
approximately at steady-state (Pytkowicz, 1975), an equivalent
amount of phosphate leaves the oceans through the sediments. The
2
phosphate remains in the sediments as a biochemical precipitate
(e.g., fish teeth), as phosphate adsorbed or bound to clays or metal
hydroxides (Berner, 1973), or as a direct chemical precipitate
(apatite) (Burnett, 1974).
Surprisingly little is known, however, of the chemistry of
phosphate in seawater. In solution, phosphate occurs (inorganically)
as phosphoric acid, which undergoes three dissociation steps, i. e.
H3PO4 H + H2PO4 1-1
H2PO4H++HPO4Z 1-2
HPO4ZtH++PO 1-3
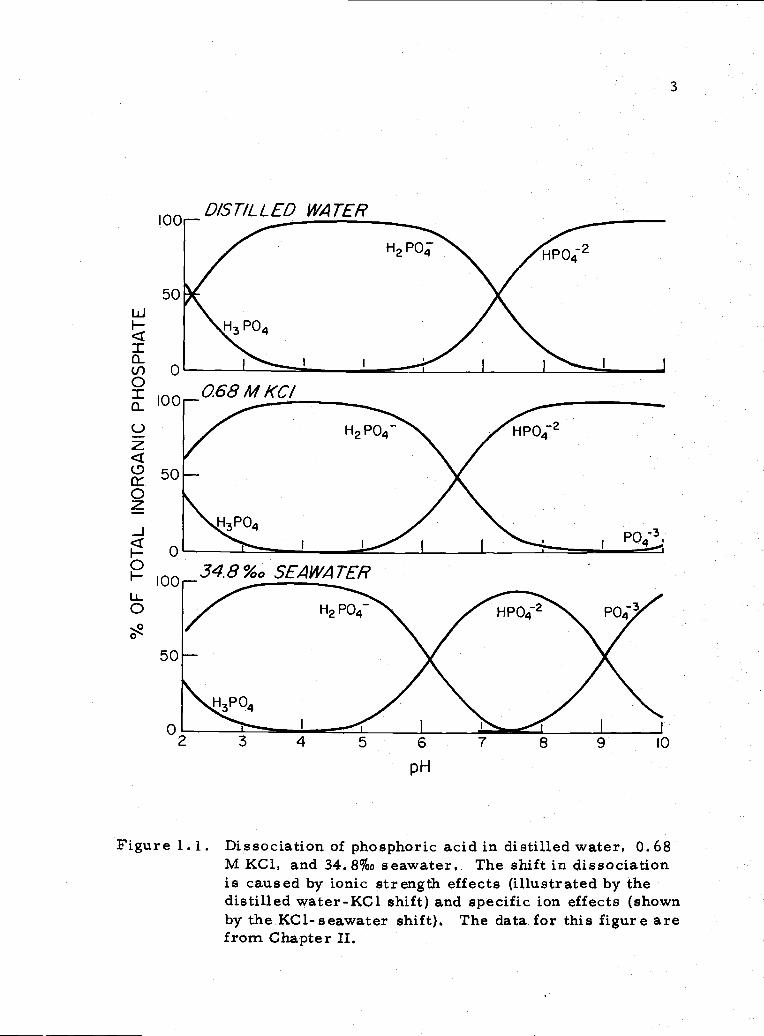
The dissociation of phosphoric acid has been shown to be strongly
influenced by the major cations in seawater (Kester and Pytkowicz,
1967). In effect, there are two major causes of the àhift in phos-
phoric acid equilibria between distilled water solutions and seawater:
ionic strength effects and ion association of phosphate with seawater
cations (see Figure 1. 1). The theoretical basis for these effects
has been discussed by Kester (1970), Kester and Pytkowicz (1969),
and Pytkowicz and Hawley (1974). Knowing the stability of individual
phosphate ion-pairs can give one insight into the of changes in
seawater composition on phosphoric acid dissociation and solubility
equilibria.
3
DISTILLED WA TER
_068/WKC/
iIoo
_34.8
'::
%o SEA WA TER
2Po;3
°24Figure 1. 1. Dissociation of phosphoric acid in distilled water, 0. 68
M KC1, and 34.8% seawater, The shift in dissociationis caused by ionic strength effects (illustrated by thedistilled water-KC1 shift) and specific ion effects (shownby the KC1-seawater shift). The data for this figure arefrom Chapter II.
4
Another aspect to the chemistry of phosphate in seawater
involves the solubility of phosphate minerals. The phosphatic solid
phase found in the ocean is apatite- - specifically a substituted carbon-
ate fluorapatite. The results of only two solubility studies of apatite
in seawater have been reported (Kramer, 1964; Roberson, 1966).
Insufficient precision was attained in the experiments to determirLe
the saturation state of seawater with respect to a carbonate fluorapa-
tite. Though theoretical calculations of phosphate solubility can be
made (Appendix I), it is important to obtain experimental verification
since such calculations often involve the use of quantities of unknown
accuracy. Also, unexpected reactions may occur between the mineral
and seawater which would not be predicted by existing theoretical
relationships. The work in this thesis shows this to be the case for
apatite behavior in seawater.
The objective of this thesis was to provide an experimental
framework on which to base predictions of the chemical behavior of
phosphate in seawater. The approach to this goal was basically two-
fold: 1) toinvestigate the solution (ion-pairing) equilibria of phos-
phoric acid, and 2) to examine the behavior of apatite in seawater.
The investigation of solution equilibria was designed to answer the
following questions: What are the relative stabilities of cation-
phosphate ion-pairs? What are the major phosphate species in sea-
water? Can an ion-pairing model be used to estimate the dissociation
5
equilibria of phosphoric acid? Apatite behavior was examined with
the following questions in mind: If apatite has a well-defined solubility
in seawater, what is it? Are surface effects relevant to apatite-
seawater equilibria? How does apatite solubility vary with changes
in apatite composition? Finally, the results from the ion- pairing
and solubility studies were used to examine theories of marine
phosphorite formation in terms of apatite equilibria and kinetics.
Since the background material for each chapter in this thesis
is considerably different, discussion of the literature on each topic
is presented in the chapter on that topic. The thesis is divided
into three main sections--ion-association of phosphate in seawater,
solubility reactions of apatite, and factors controlling phosphoite
genesis. Additional data and information are presented in appendices.
CHAPTER II
+ +2 +2PHOSPHATE ASSOCIATION WITH Na , Ca , AND Mg
IN SEAWATER
Introduction
Equilibrium calculations of the distribution of inorganic phos-
phate in aqueous solution requires knowledge of the dissociation con-
stants of phosphoric acid in that medium. These constants can be
directly measured in terms of htapparentH equilibrium constants.
This was done by Kester and Pytkowicz (1967) for seawater. As they
point out, the constants they measured are applicable to solutions
of the same relative composition as seawater. Deviations in the
major-ion concentrations will cause a shift in the apparent constants.
This shift can be interpreted in terms of ion-associationof the major
ions with orthophosphate ion. Ion-association models have been
successfully applied to seawater for the major-ion-sulfate system by
Kester (1970) and Kester and Pytkowicz (1969) and for the major-ion-
carbonate-bicarbonate, system by Pytkowicz and Hawley (1974), One
application of phosphate ion association measurements is to the study
of apatite equilibria in interstitial waters (see Chapter IV).
Recent evidence suggests that sedimentary apatite forms in
interstitial waters rather than directly in seawater (Burnett, 1974;
Baturin, 1966). Apatite is also found in sediments as an organic
7
precipitate of teeth, bones, etc. Since the major-ion composition
of interstitial waters can deviate significantly from seawater composi-
tion, saturation calculations cannot be performed using the seawater
constants. Rather, dissociation constants can be derived from an ion-
association model, and subsequent calculation of saturation states of
phosphates can be made. All measurements were made at 20°C and
ionic strength, , = 0. 68 in order for comparison with those obtained
by other workers.
Theory
A full discussion of ion-association models can be found in
Kester and Pytkowicz (1969) and Pytkowicz and Hawley (1974). The
derivation can be made as follows:
The total phosphate in a solution can be written as:
[TPO4] [H3PO4] + [H2PO4 ] + [HPO4 + [PC43] 2-1
+ +2 +2If .on-pairing occurs between Na , Mg , and Ca and the ortho-
phosphate anions then:
[H2PO4] = (H2PO4_)+(MgH2PO4+)+(CaH2PO4+)+(NaH2PO4O) 2-2
[HP042] = (HP042)+(MgHPO4°)+(CaHPO4°)+(NaHPO4) 2-3
[PC43] (P043)+(MgPO4)+(CaPO4)+(NaPO42) 2-4
where [ j refer to total and ( ) to free concentrations. Tle stoichio-*metric association constant, K , between a metal ion, M , and an
anion is: (using HPO4 as an example)
* (MHPO4'2)K MHPO4 (M)(HPO4)
2-5
so that
[H2PO4] = (H2PO4).[1 +
+ (Ca)K*CH+ + (Na+)K*NHPO 2-6
{HP042] = (HPO42)i +(Mg+Z)K*
HPO 0 +
+2 * + *2+ (Ca )K CaHPO4° + (Na )K NaHPO4
[43} = (4)1 + (Mg+Z)K*P0 +
+ (Ca+Z)K*C + (Na+)K*N P02 } 2-8
it is assumed that [H3PO4] = (H3PO4) because it is not charged and
it is not expected to associate. The apparent dissociation constants
of phosphoric acid can be written as:
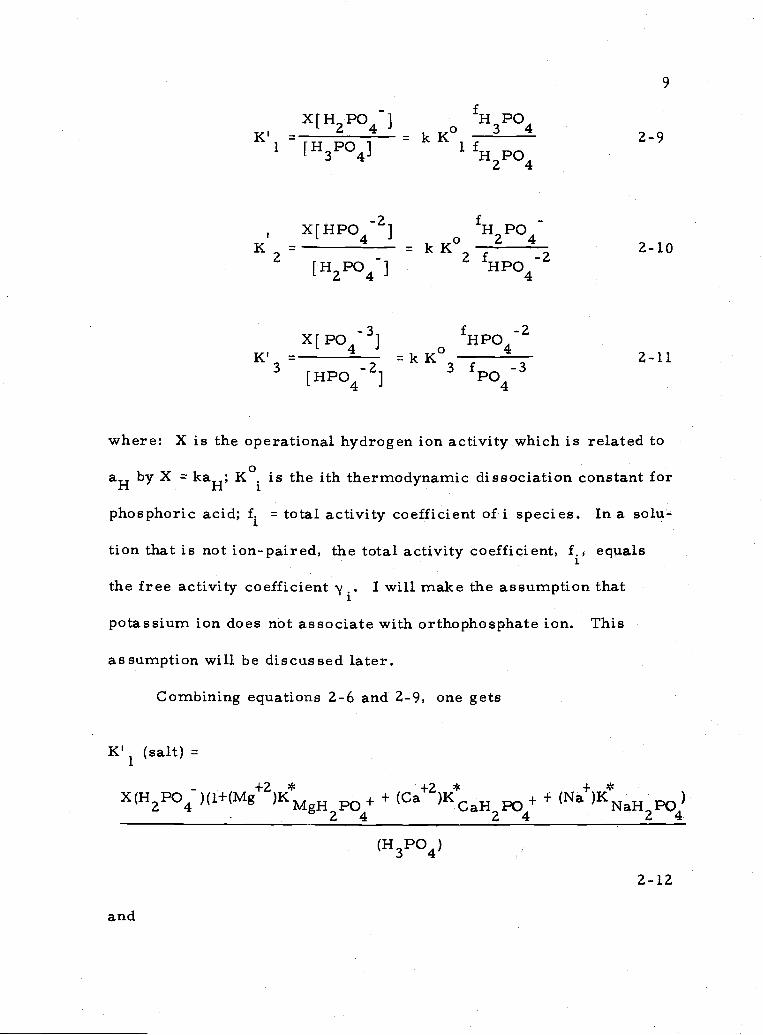
X{H2PO4]lcK° 2-9K
1 {H3PO4] 1 H2PO4
K'
X{HP042]= kK° 2-10
2 [H2PO4] 2
X[P043]K' =- =kK
32-11
[HP042]
where: X is the operational hydrogen ion activity which is related to
aH by X kaH; K°. is the ith thermodynamic dissociation constant for
phosphoric acid; f1 total activity coefficient of i species. In a solu-
tion that is not ion-paired, the total activity coefficient, f., equals
the free activity coefficient y. I will make the assumption that
potassium ion does not associate with orthophosphate ion. This
assumption will be discussed later.
Combining equations 2-6 and 2-9, one gets
K'1
(salt) =
+ (Ca+Z)K*CaH p0+ + (Na+)KaflpO)
(H3PO4)
2-12
and
10
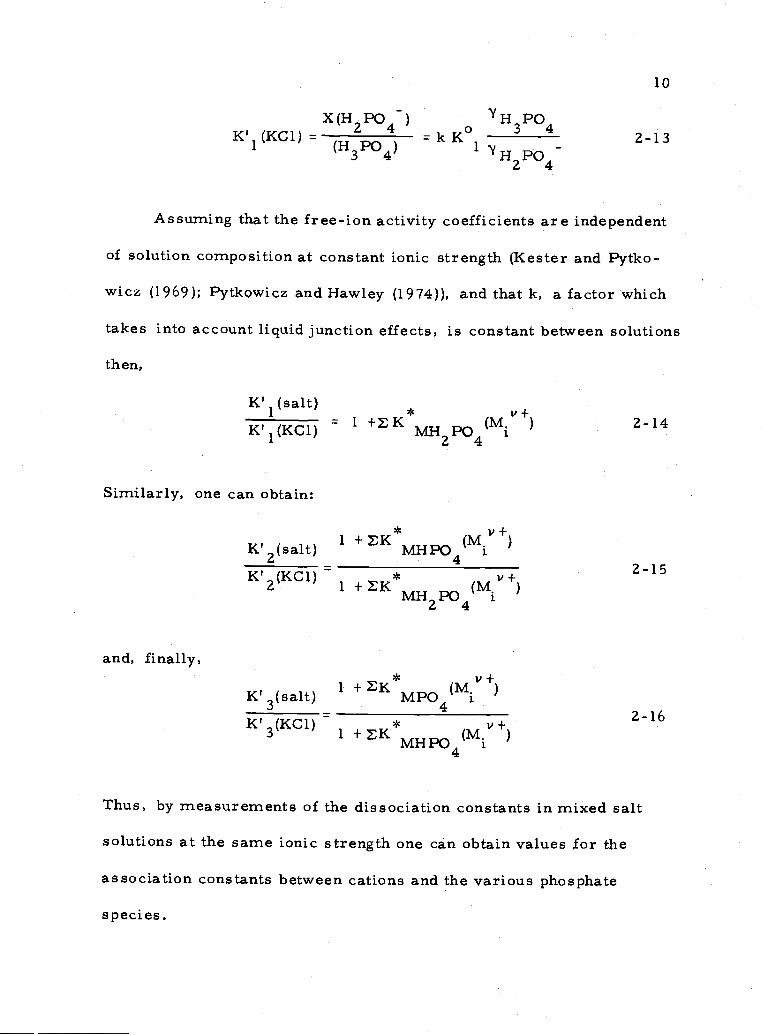
HPOX(HPO )0 3 4 2-132 4 -kKK'1(KC1) (H3PO4) 1 ''H2PO4
Assuming that the free-ion activity coefficients are independent
of solution composition at constant ionic strength (Kester and Pytko-
wicz (1969); Pytkowicz and Hawley (1974)), and that k, a factor which
takes into account liquid junction effects, is constant between solutions
then,
K'1(salt)
K'1(KC1)
Similarly, one can obtain:
and, finally,
1
K' 2(salt) + EK*MH (M.+)
* v+K'2(KC1)1 + MH2PO4(Mi
K' 1+K* (M.)3(salt) MPO4 i
K'3(KC1) 1 + K*MH (M.V +)
2-14
2-15
2-16
Thus, by measurements of the dissociation constants in mixed salt
solutions at the same ionic strength one can obtain values for the
association constants between cations and the various phosphate
species.
11
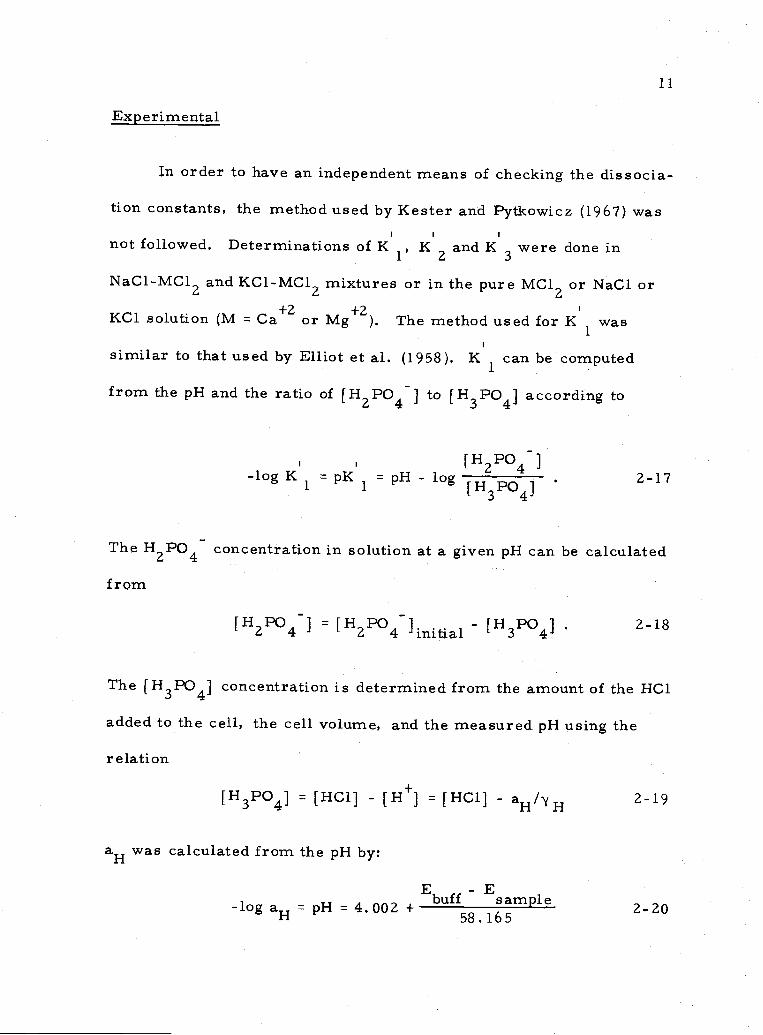
Experimental
In order to have an independent means of checking the dissocia-
tion constants, the method used by Kester and Pytkowicz (1967) was
not followed. Determinations of K1'
K2
and K were done in
NaC1-MC12 and KCI- MCi2 mixtures or in the pure MCi2 or NaCl or
KC1 solution (M Ca+Z or Mg+Z). The method used for K1
was
similar to that used by Elliot et al. (1958). K can be computed
from the pH and the ratio of [H2PO4 ] to [H3PO4J according to
{H2PO4]-log K
1pK
1= pH - log
{H3PO4] 2-17
The H2PO4 concentration in solution at a given pH can be calculated
from
[H2PO4} = [HPO4Iinitiai [H3P041 . 2-18
The [H3PO4] concentration is determined from the amount of the HCI
added to the cell, the cell volume, and the measured pH using the
relation
[H3PO4] = [HC1J [H+] = [HC1] 2-19
aH was calculated from the pH by:
-log aH = pH = 4.002 +EbuffEsample
2-20
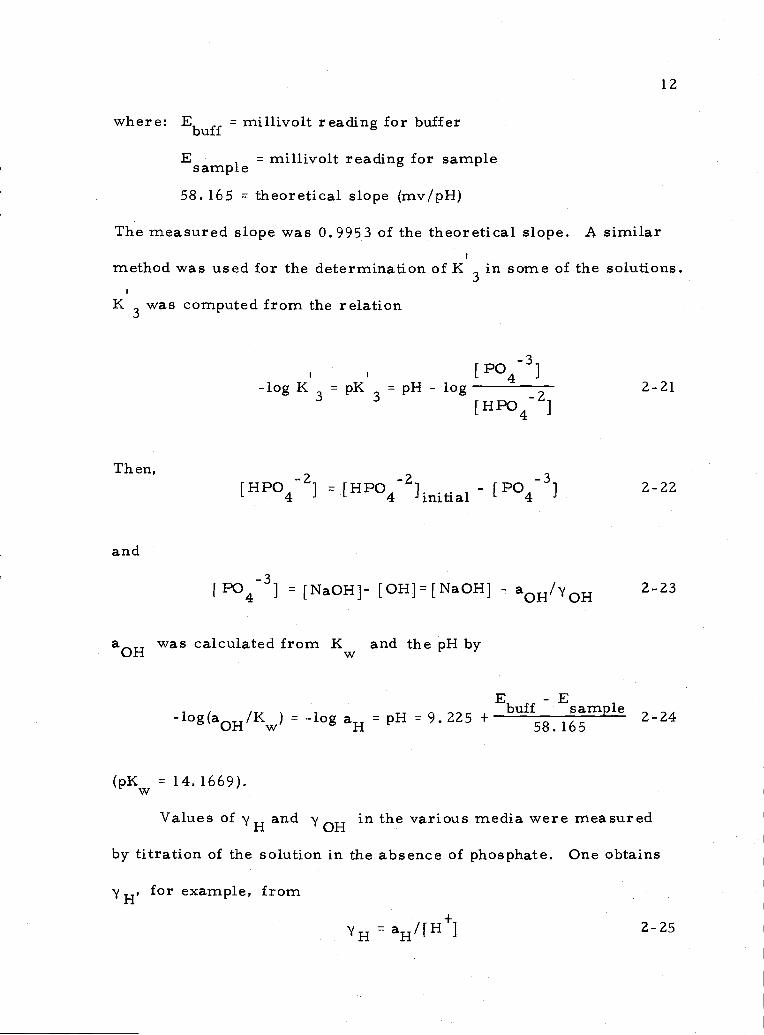
12
where: E = millivolt reading for bufferbuff
E millivolt reading for samplesample
58. 165 = theoretical slope (mv/pH)
The measured slope was 0.9953 of the theoretical slope. A similar
method was used for the determination of K in some of the solutions.
K was computed from the relation
P03-logK3=pK3=pH-log 2-21
[HPO4
Then,[HPO = [HPO 2] - [P0 2-22
4 4 initial 4
and
[P043] = [NaOH]- [OH]=[NaOH] aOH/OH 2-23
aOH was calculated from K and the pH by
log(a0/K) = -log aH = pH = 9.225 +EbifEsamp1e
2-24
(pK 14. 1669).w
Values ofH
andOH
in the various media were measured
by titration of the solution in the absence of phosphate. One obtains
for example, from
aH/[HJ 2-25
13
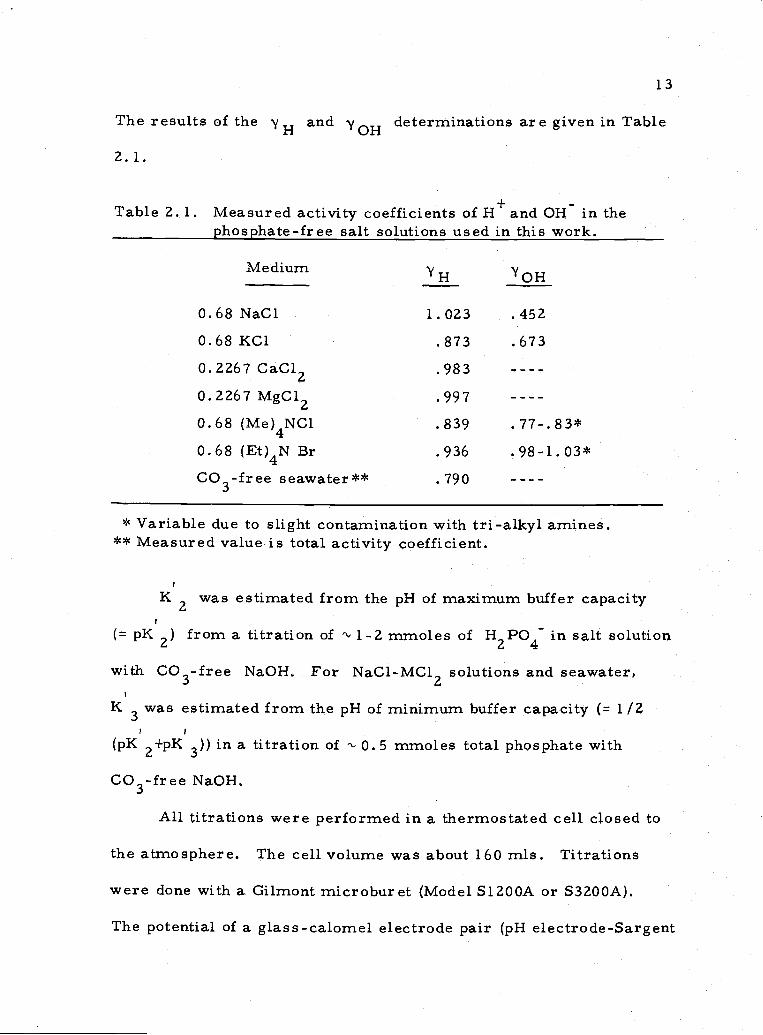
The results of the ''H andOH
determinations are given in Table
2.1.
Table 2. 1. Measured activity coefficients of H+ and OH in thephosphate-free salt solutions used in this work.
MediumOH
0.68 NaC1 1.023 .4520.68 KC1 .873 .673
0.2267 CaC12 .983
0.2267MgCl2 .9970.68 (Me)4NC1 .839 .77_.83*0.68 (Et)4N Br .936 .98-1.03*CO3-free seawater** . 790 - -- -
* Variable due to slight contamination with tri-alkyl amines.** Measured value is total activity coefficient.
K2 was estimated from the pH of maximum buffer capacity
(= pK2) from a titration of ' 1-2 mmoles of H2PO4 in salt solution
with CO3-free NaOH. For NaC1-MC12 solutions and seawater,
K was estimated from the pH of minimum buffer capacity ( 1/2
(pK 2+pK 3)) in a titration of 0.5 mmoles total phosphate with
CO3-free NaOH.
All titrations were performed in a thermostated cell closed to
the atmosphere. The cell volume was about 160 mis. TitratiQns
were done with a Gilmont microburet (Model S1ZOOA or S3200A).
The potential of a glass-calomel electrode pair (pH electrode-Sargent
14
Model S30050-.15c; reference: calornel reference with asbestos fiber
junction Corning Model 476002) was measured with an Orion Model
801 digital pH meter with a resolution of * 0. 1 mV. The temperature
was held constant at 20. 00 C.
Results
The measured dissociation constants for the various media are
listed in Tables 2. 2, 2. 3, 2. 4. Also listed for comparison are
determinations made by others.
Discussion
As was shown above, the calculation of association constants
depends on the comparison of the dissociation constants of H3PO4
in two solutions- -one in which ion-pairing occurs to some unknown
extent versus one in which there is a known or negligible amount of
ion-pairing. It has been assumed, or the purposes of calculation,
that the extent of ion-pairing of orthophosphate with ion is negUgible
compared to the other ions in solution. The reasons behind this
assumption are discussed next.
First, a rough estimate can be made of the expected first
dissociation constant of H3PO4 in 0.68 KCI assuming no ion-pairing.
Kester and Pytkowicz (1975) give approximate free activity-
coefficients for dipolar uncharged species and negative univalent
15
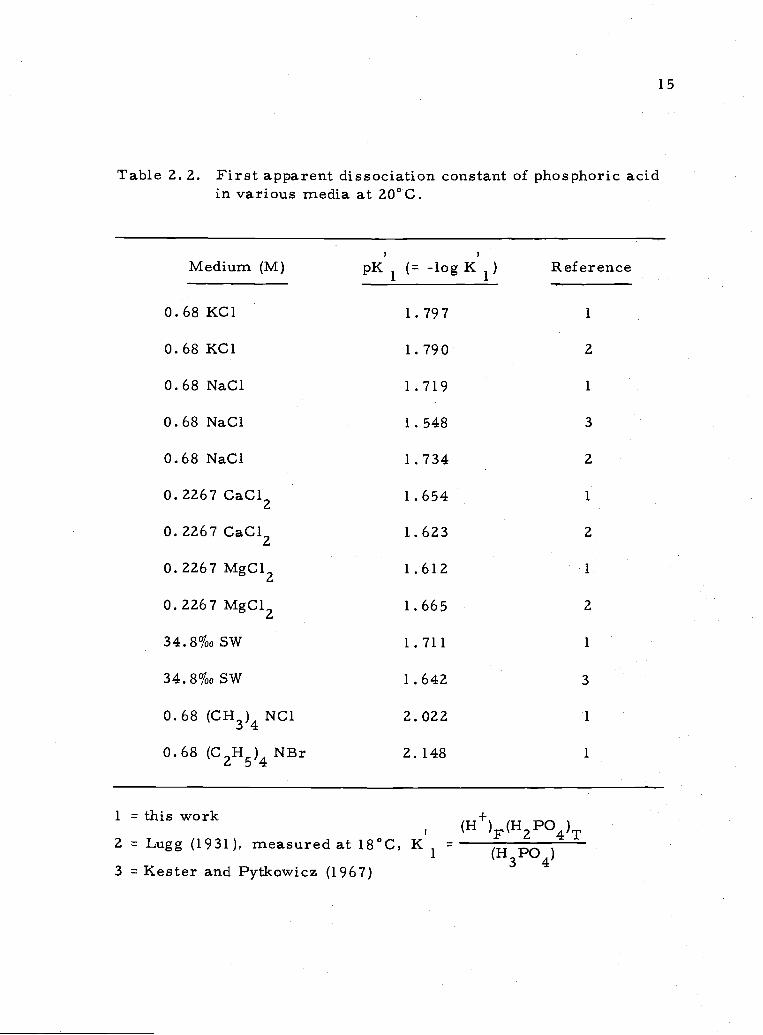
Table 2. 2. First apparent dissociation constant of phosphoric acidin various media at 20°C.
Medium (M) pK1 (= -logK1) Reference
0.68 KC1 1.797 1
0.68KC1 1.790 2
0.68 NaC1 1.719 1
0.68 NaC1 1.548 3
0.68 NaC1 1.734 2
0.2267 CaC12 1.654 1
0.2267 CaC12 1.623 2
0.2267 MgC12 1.612 1
0. 2267 MgC12 1.665 2
34.8%0SW 1.711 1
34.8%0SW 1.642 3
0.68 (CH3)4 NC1 2. 022 1
0.68 (C2H5)4NBr 2.148 1
1 this work (H+)F(HZPO4)T2 Lugg (1931), measured at 18°C, K
1 (H3PO4)3 Kester and Pytkowicz (1967)
16
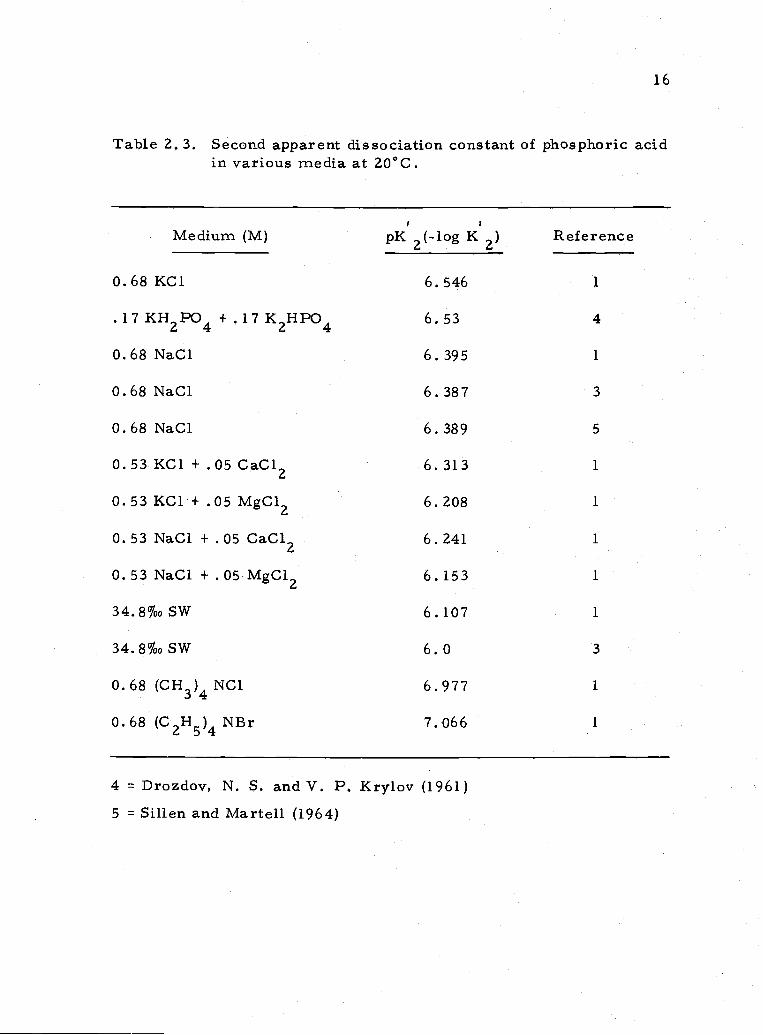
Table 2, 3. Second apparent dissociation constant of phosphoric acidin various media at 20°C.
Medium (M) pK2(-.log K2) Reference
0.68 KC1 6.546 1
.17KH2PO4 +.17K2HPO4 6.53 4
0.68NaCI 6.395 1
0.68 NaC1 6.387 3
0.68 NaC1 6.389 5
0.53 KC1 + .05 CaC12 6. 313 1
0.53 KC1 + .05 MgC12 6.208 1
0.53 NaC1 + .05 CaC12 6.241 1
0.53 NaC1 + .05 MgC12 6.153 1
34.8%0SW 6.107 1
34.8%0SW 6.0 3
0.68 (CH3)4NCI 6.977 1
0.68 (C2H5)4NBr 7.066 1
4 Drozdov, N. S. and V. P. Krylov (1961)5 = Sillen and Martell (1964)
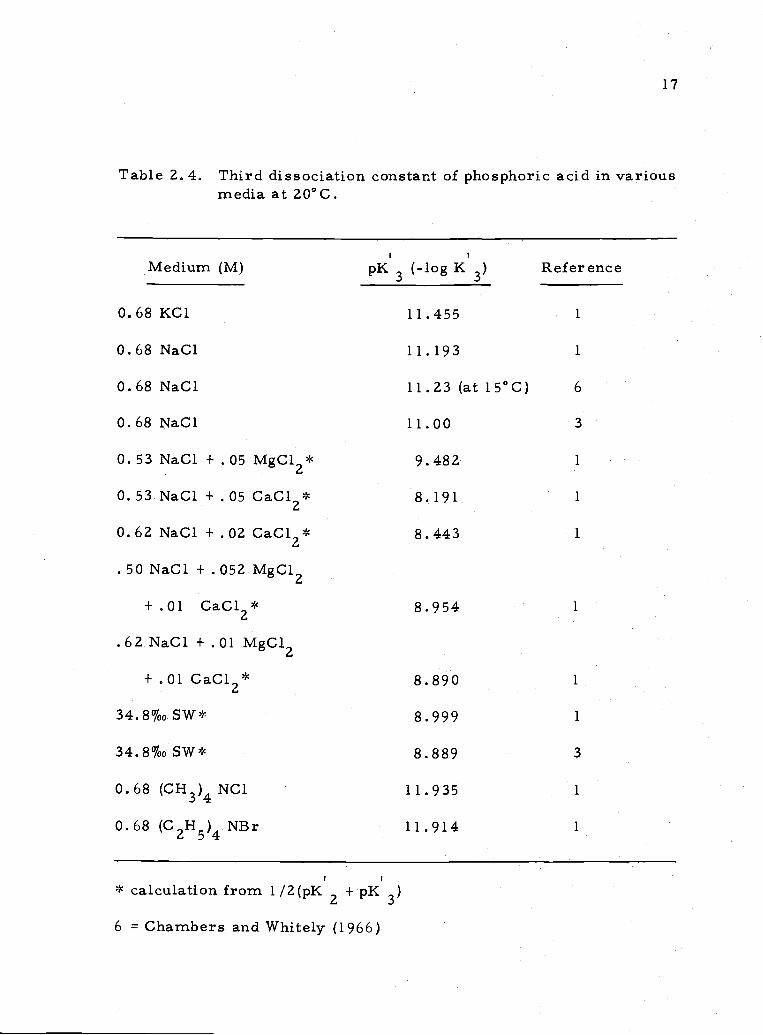
17
Table 2. 4. Third dissociation constant of phosphoric acid in variousmedia at 20°C.
Medium (M)
0.68 KC1
0.68 NaC1
0.68 NaC1
0.68 NaC1
0.53 NaC1 + .05 MgC12*
0. 53 NaC1 + . 05 CaC12*
0.62 NaCJ + .02 CaC12*
.50 NaC1 + .052 MgC12
+ .01 CaC12*
.62 NaC1 + .01 MgC12
+ .01 CaC12*
34.8%o SW*
34.8%o SW*
0. 68 (CH3)4 NC1
0.68 (C2H5)4 NBr
pK3 (-logK3)
* calculation from 1/2(pK2 +pK3)
6 = Chambers and Whitely (1966)
11 . 455
11.193
11.23 (at 15°C)
11.00
9.482
8.191
8,443
8.954
8.890
8.999
8.889
11.935
11.914
Refer ence
1
1
6
3
1
1
1
1
1
1
3
1
1
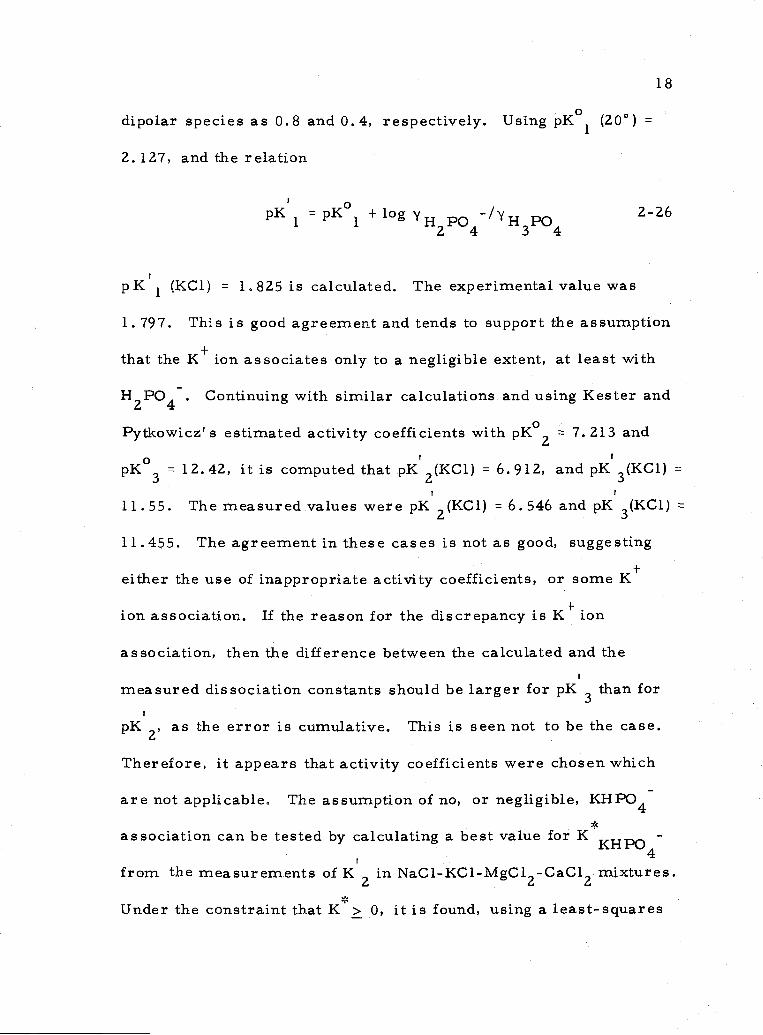
dipolar species as 0.8 and 0.4, respectively. Using pK1
(20°) =
2.127, and the relation
pK1 =pK°1 2-26
p K'1
(KC1) = 1. 825 is calculated. The experimental value was
1. 797. This is good agreement and tends to support the assumption
that the K+ ion associates only to a negligible extent, at least with
H2PO4 . Continuing with similar calculations and using Kester and
Pytkowicz' s estimated activity coefficients with pK°2 7.213 and
pK°3 = 12.42, it is computed that pK2(KC1) 6.912, and pK3(KC1)
11.55. Themeasured values were pK2(KC1) = 6.546 and pK 3(KC1)
11.455. The agreement in these cases is not as good, suggesting
either the use of inappropriate activity coefficients, or some
ion association. If the reason for the discrepancy is K+ ion
association, then the difference between the calculated and the
measured dissociation constants should be larger for pK than for
pK2, as the error is cumulative. This is seen not to be the case.
Therefore, it appears that activity coefficients were chosen which
are not applicable. The assumption of no, or negligible, KHPO4*
association can be tested by calculating a best value for K KHPO4
from the measurements of K in NaCl-KC1-MgC12-CaC12 mixtures.
Under the constraint that K*> 0, it is found, using a least-squares
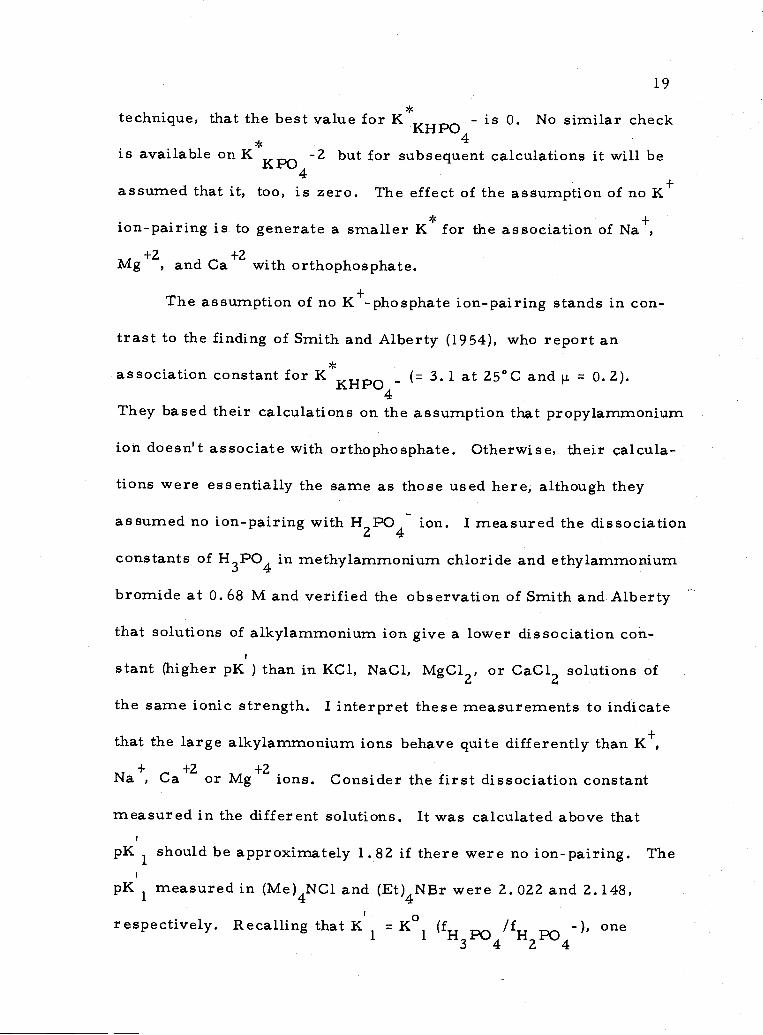
technique, that the best value for KKHPO - is 0. No similar check*is available on KKPO -Z but for subsequent calculations it will be
+assumed that it, too, is zero. The effect of the assumption of no K* +ion-pairing is to generate a smaller K for the association of Na
+2 +2Mg , and Ca with orthophosphate.
The assumption of no Ktphosphate ion-pairing stands in con-
trast to the finding of Smith and A.lberty (1954), who report an
association constant for K'KHPO - (= 3. 1 at 25°C and p = 0.2).4
They based their calculations on the assumption that propylammoniurn
ion doesn't associate with orthophosphate. Otherwise, their calcula-
tions were essentially the same as those used here, although they
assumed no ion-pairing with H2PO4 ion. I measured the dissociation
constants of H3PO4 in methylammonium chloride and ethylammonium
bromide at 0.68 M and verified the observation of Smith and A.lberty
that solutions of alkylammonium ion give a lower dissociation con-
stant (higher pK) than in KC1, NaC1, MgC12, or CaC12 solutions of
the same ionic strength. I interpret these measurements to indicate
that the large alkylamrnonium ions behave quite differently than K+,+ +2 +2Na , Ca or Mg ions. Consider the first dissociation constant
measured in the different solutions. It was calculated above that
pK1 should be approximately 1.82 if there were no ion-pairing. The
pK1
measured in (Me)4NC1 and (Et)4Nr were 2. 022 and 2.148,
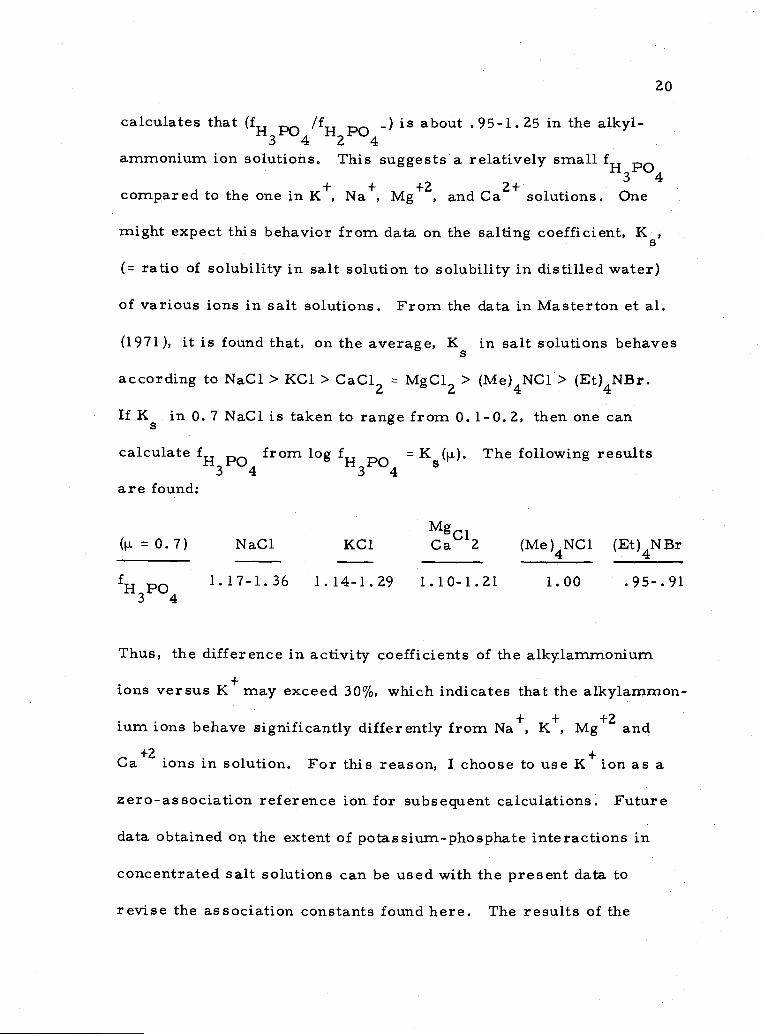
respectively. Recalling that K1 = K°1 one
20
calculates that H3PO41H2PO4- is about .95-1.25 in the alkyl-
ammonium ion solutions. This suggests a relatively small H P034compared to the one in K+, Na+, Mg, and Ca solutions. One
might expect this behavior from data on the salting coefficient, K,
(= ratio of solubility in salt solution to solubility in distilled water)
of various ions in salt solutions. From the data in Masterton et al.
(1971), it is found that, on the average, K in salt solutions behaves
according to NaG 1> KC1 > CaGl2 MgGI2> (Me)4NG1> (Et)4NBr.
If K in 0.7 NaG1 is taken to range from 0. 1-0.2, then one can
calculate HpO from log HpQ = K(ij). The following results
are found:
Mg1(p. = 0.7) NaG1 KC1 Ca 2 (Me)4NG1 (Et)4Nr
P0 1.17-1.36 1.14-1.29 1.10-1.21 1.00 .95-.9134
Thus, the difference in activity coefficients of the alkylamrnoniurn
ions versus K+ may exceed 30%, which indicates that the alkylammon-
ium ions behave significantly differently from Na+, K+, Mg+Z and
Ca+2 ions in solution. For this reason, I choose to use K+ ion as a
zero-association reference ion for subsequent calculations. Future
data obtained on the extent of potassium-phosphate interactions in
concentrated salt solutions can be used with the present data to
revise the association constants found here. The results of the
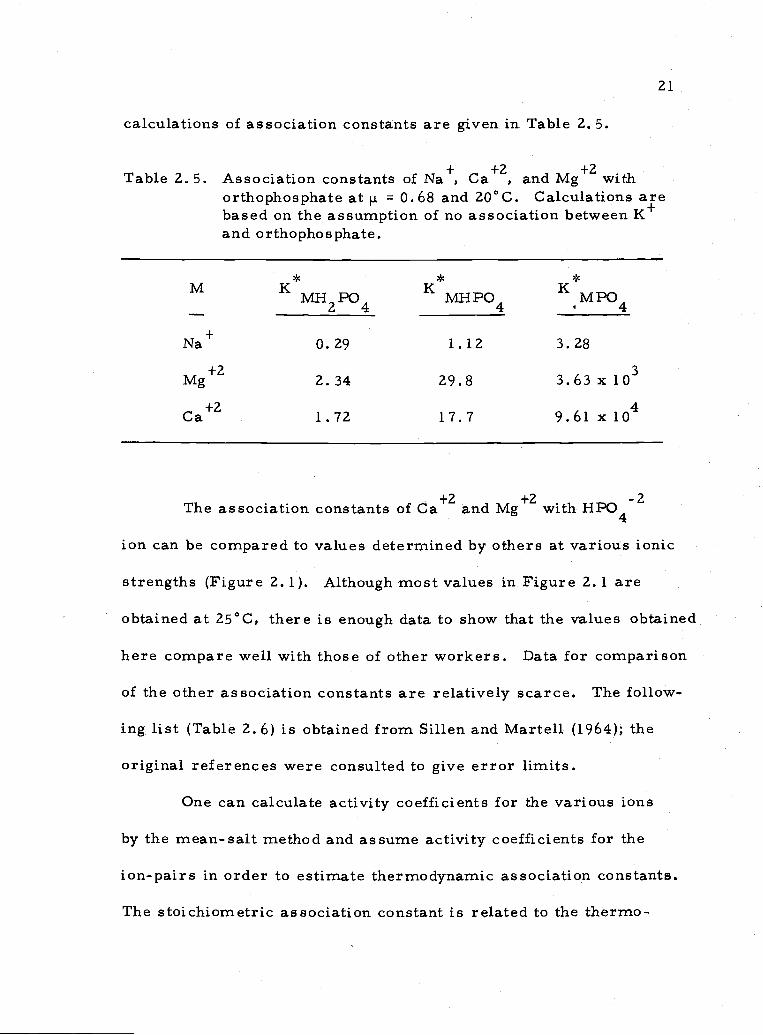
21
calculations of association constants are given in Table 2. 5.
+ +2 +2.Table 2, 5. Association constants of Na , Ca , and Mg withorthophosphate at i. = 0.68 and 20°C. Calculations aebased on the assumption of no association between Kand orthophosphate.
M K*MH K*MHPO KM
Na+ 0.29 1.12 3.28
Mg+Z 2.34 29.8 3.63x10³
Ca+Z 1.72 17.7 9.61 x 1O4
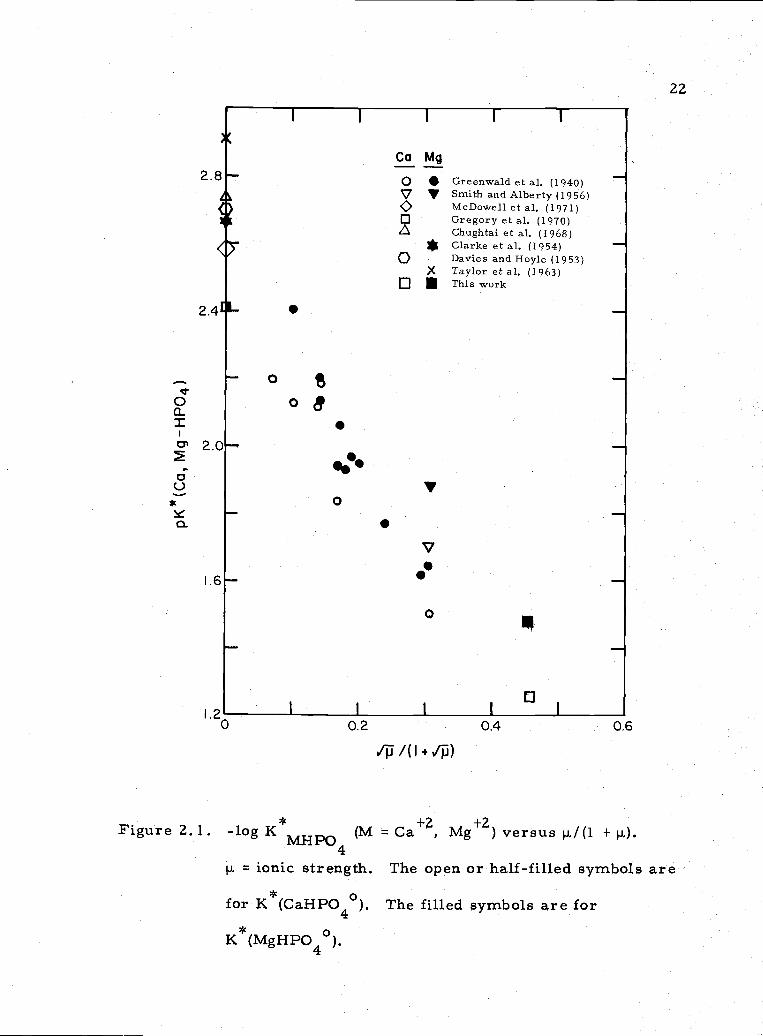
The association constants of Ca+Z and Mg2 with HP042
ion can be compared to values determined by others at various ionic
strengths (Figure 2. 1). Although most values in Figure 2. 1 are
obtained at 25°C, there is enough data to show that the values obtained
here compare well with those of other workers. Data for comparison
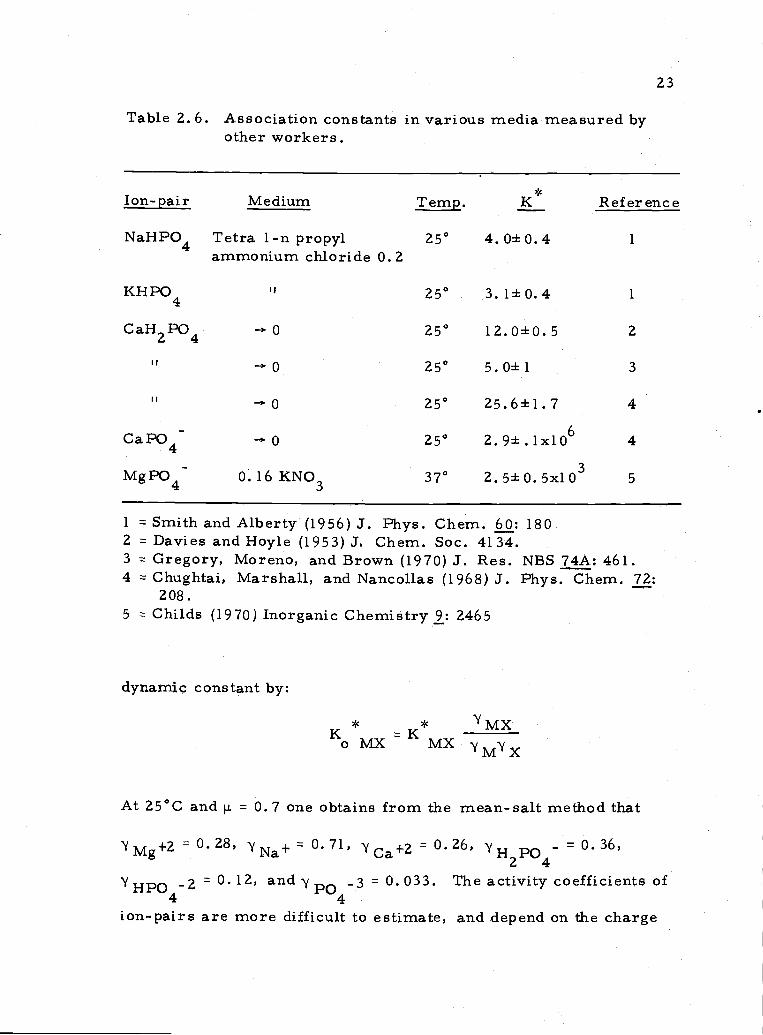
of the other association constants are relatively scarce. The follow-
ing list (Table 2. 6) is obtained from Sillen and Martell (1964); the
original references were consulted to give error limits.
One can calculate activity coefficients for the various ions
by the mean-salt method and assume activity coefficients for the
ion-pairs in order to estimate thermodynamic association constants.
The stoichiometric association constant is related to the thermo-
2.
2.
0a-
DU*
0.
Ca Mg
3 Q Greenwaici et al. (1940)V Smith and Alberty (1956)
McDowell et al. (1971)O Gregory et al. (1970)
Chughtai et al. (1968)* Clarke et al. (1954)
o Davies and Hoyle (1953)X Taylor etal. (1963)
o a This work
o
08.
V0
.
VS.
0m
22
0 0.2 0.4 0.6
Figure 2.1. -log K*MH (lvi = Can, Mg+Z) versus /(1 + hi).
p. = ionic strength. The open or half-filled symbols are* 0for K (CaHPO4 ). The filled symbols are for
K*(MgHPO40).
23
Table 2.6. Association constants in various media measured byother workers.
Ion-pair Medium Temp.*
K Reference
NaHPO4 Tetra 1-n propyl 25° 4. 0± 0. 4 1
ammonium chloride 0. 2
KHPO4 25° 3. 1±0. 4 1
CaH2PO4 -O 25° 12.0±0.5 2
II -Q 25° 5.0±1 3
'I -0 25° 25.6±1.7 4
CaPO4 0 25° 2.9±.1x106 4
MgPO4 0. 16 KNO3 37° 2. 5±0. 5x1 5
1 Smith and Alberty (1956) J. Phys. Chem. 60: 1802 Davies and Hoyle (1953) J. Chem. Soc. 4134.3 = Gregory, Moreno, and Brown (1970) J. Res. NBS 74A: 461.4 Chughtai, Marshall, and Nancollas (1968) J. Phys. Chem. 72:
208.5 Childs (1970) Inorganic Chemistry 9: 2465
dynamic constant by:
* * 'MXK
MX KMX 'M'X
At 25°C and p. = 0.7 one obtains from the mean-salt method that
= 0.28, iNa+ 0.71, 'Ca+Z = 0.26, 'HPO = 0.36,
N HPO4-2 0. 12, and 'y4_3 = 0.033. The activity coefficients of
ion-pairs are more difficult to estimate, and depend on the charge
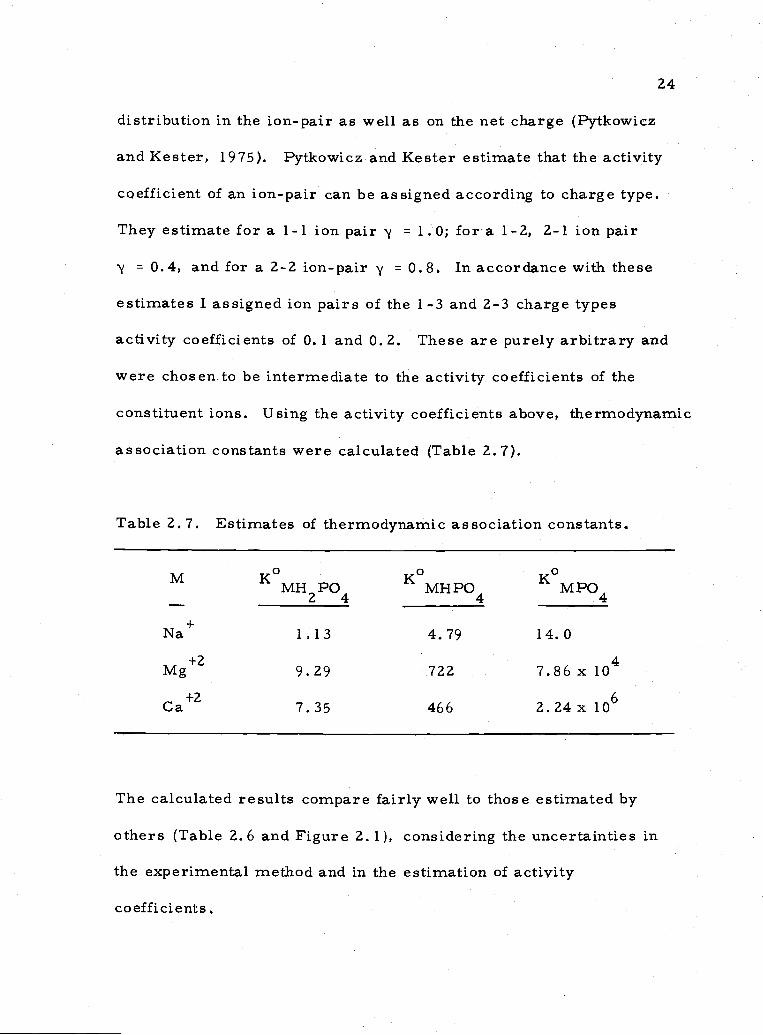
24
distribution in the ion-pair as well as on the net charge (Pytkowicz
and Kester, 1975). Pytkowicz and Kester estimate that the activity
coefficient of an ion-pair can be assigned according to charge type.
They estimate for a 1-1 ion pair y = 1.0; for a 1-2, 2-1 ioi pair
y = 0.4, and for a 2-2 ion-pair y = 0.8. In accordance with these
estimates I assigned ion pairs of the l3 and 2-3 charge types
activity coefficients of 0. 1 and 0. 2. These are purely arbitrary and
were chosen to be intermediate to the activity coefficients of the
constituent ions. Using the activity coefficients above, thermodynamic
association constants were calculated (Table 2.7).
Table 2. 7. Estimates of thermodynamic association constants.
M K°MHPQ K°MHPO K°MPO
Na+ 1.13 4.79 14.0
Mg2 9.29 722 7.86 x 1O4
Ca+Z 7.35 466 2.24x 1O6
The calculated results compare fairly well to those estimated by
others (Table 2.6 and Figure 2.1), considering the uncertainties in
the experimental method and in the estimation of activity
coefficients.
25
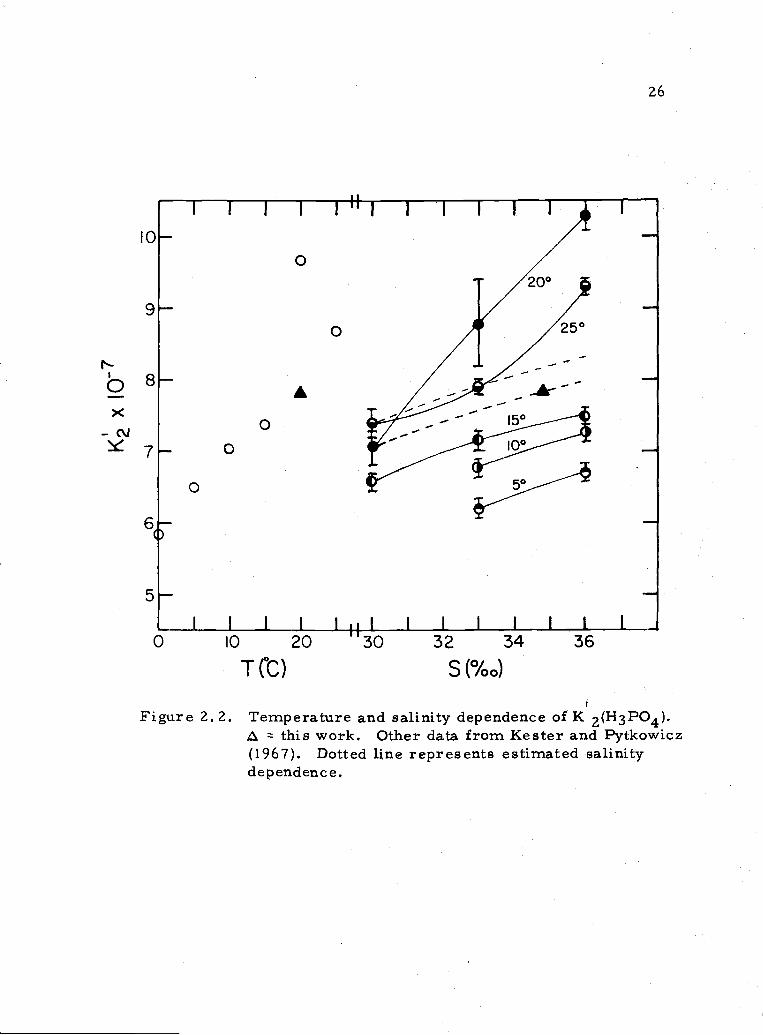
Another comparison which can be made is between the measured
apparent dissociation constants in seawater and those calculated
using the association constants measured here. First, I remeasured
the dissociation constants at 20°C and 34.8%o . There is a difference
between values found in this work and those obtained by Kester and
Pytkowicz (1967). The value of K3 is dependent upon that of K2,
so a difference in K is expected if a difference in K is found.
Plotting the measured and interpolated data of Kester and Pytkowicz
Lor K2 versus temperature at 34. 8%o and versus salinity at various
temperatures (Fig. 2.2), it appears that their value at 20°C and
34. 8%o is somewhat high, and that the value found here fits in more
smoothly with their values at other temperatures. Considering
also the salinity dependence at 50, 10°, and 15°C and where our
value lies, it is possible, though not necessary, that the values of
K'2 determined by Kester and Pytkowicz at 20°, 33%o and 20° and
25° at 36%o are too high.
The dissociation constants K'1'
K2'
K' in seawater can be
calculated from equations (2-14)-(2-16) and the values of K' in KC1.
Using the Cl%o ratios in Pytkowicz and Kester (1971) and the %free-
ion values at 25°C calculated by Hawley (1974) the following calcula-
tions are made:
IC
N-
-c%J
5
LLII±
26
L) IL) .DL) 3. 3'+ 30
TCC) S(%0)
Figure 2. 2. Temperature and salinity dependence of K 2(H3PO4).this work. Other data from Kester and Pytkowicz
(1967). Dotted line represents estimated salinitydependence.
27
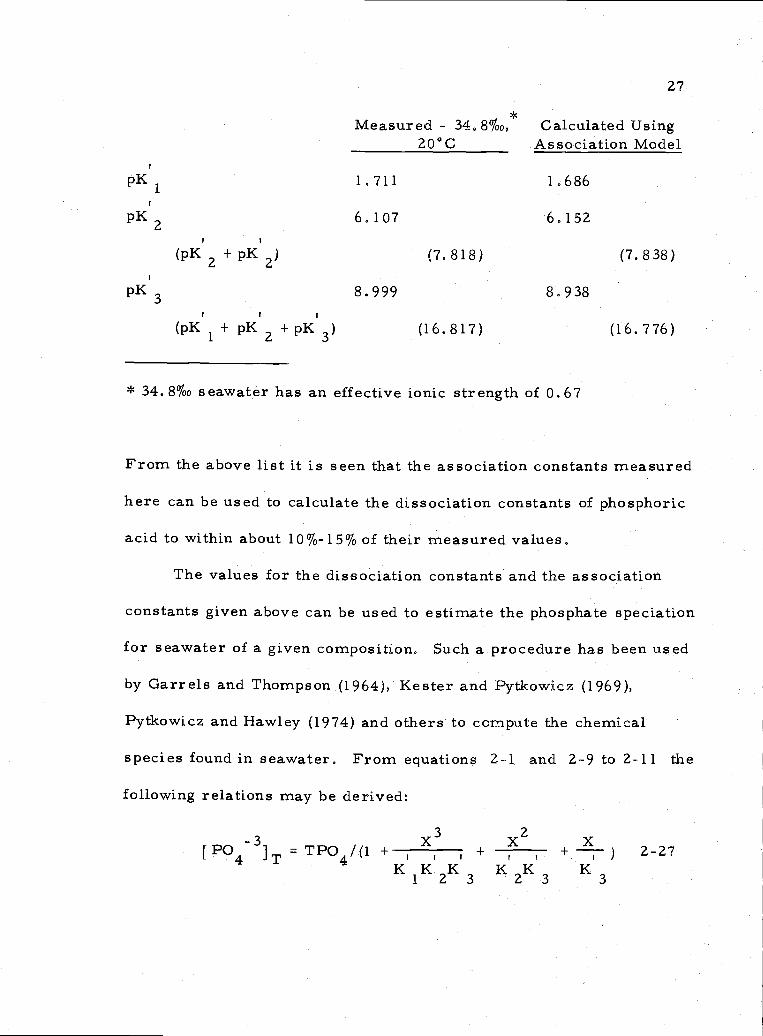
Measured 34. 8%o, Calculated Using20°C Association Model
pK1 1.711 1.686
pl(2 6.107 6.152
(pK2 + pK2) (7.818) (7.838)
pK3 8.999 8.938
(pK1 + pK2 +pK3) (16.817) (16.776)
* 34. 8%o seawater has an effective ionic strength of 0067
From the above list it is seen that the association constants measured
here can be used to calculate the dissociation constants of phosphoric
acid to within about 10%-15% of their measured values.
The values for the dissociation constants and the association
constants given above can be used to estimate the phosphate speciation
for seawater of a given composition. Such a procedure has been used
by Garrels and Thompson (1964), Kester and Pytkowicz (1969),
Pytkowicz and Hawley (1974) and others to compute the chemical
species found in seawater, From equations 2-1 and 2-9 to 2-11 the
following relations may be derived:
x= TPO4/(1 + X+ + --) 2-27
K1K2K3 K2K3 K3
2K x
[HPO4 '1T = TPO4/(1 + + +)
2-28
X K2 K1K2
I I I
X K KK{HZPO4]T = TPO4/(i +--- + + ) 2-29
K X X
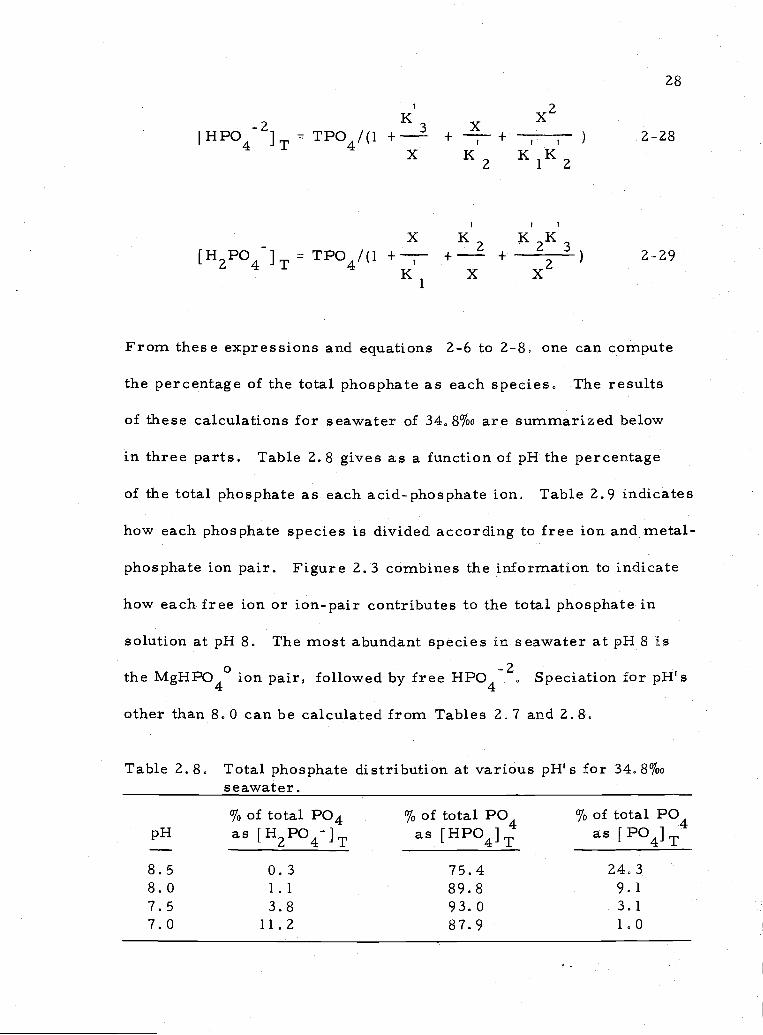
From these expressions and equations 2-6 to 2-8, one can compute
the percentage of the total phosphate as each species. The results
of these calculations for seawater of 34, 8%o are summarized below
in three parts. Table 2.8 gives as a function of pH the percentage
of the total phosphate as each acid-phosphate ion, Table 2,9 indicates
how each phosphate species is divided according to free ion and metal-
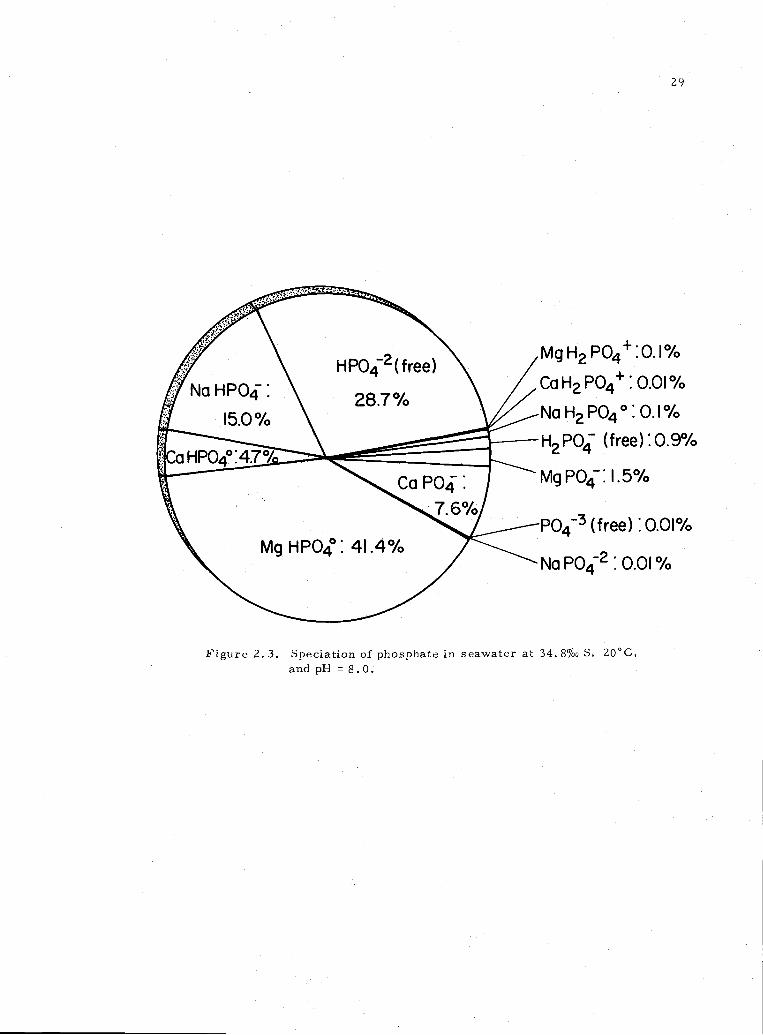
phosphate ion pair. Figure 2. 3 combines the information to indicate
how each free ion or ion-pair contributes to the total phosphate in
solution at pH 8. The most abundant species in seawater at pH 8 is
the MgHPO4° ion pair, followed by free HP0420 Speciation for pH1s
other than 8. 0 can be calculated from Tables 2.7 and 2.8.
Table 2.8. Total phosphate distribution at various pH's for 34.8%oseawater.
% of total PO4 % of total PO4 % of total PO4pH as [HZPO4]T as {HPO4]T as
8.5 0.3 75.4 24,3
8.0 1.1 89.8 9.1
7.5 3.8 93.0 3.1
7.0 11.2 87.9 1.0
NaHPO4
15.0%
H P042 (free)
28.7%
CaPO4
MgHPo: 41.4%
29
Mg H2 PO4:0. 1%
Ca H2 Po4: 0.01%
Na H2 PO400.I%
H2PO4 (freeY0.9%
MgPO4 1.5%
P043 (free) : 0.01%
Na P02 : 0.01 %
Figure 2. 3. Speciation of phosphate in seawater at 34. 8%o S, 20CC,
and pH = 8.0.
30
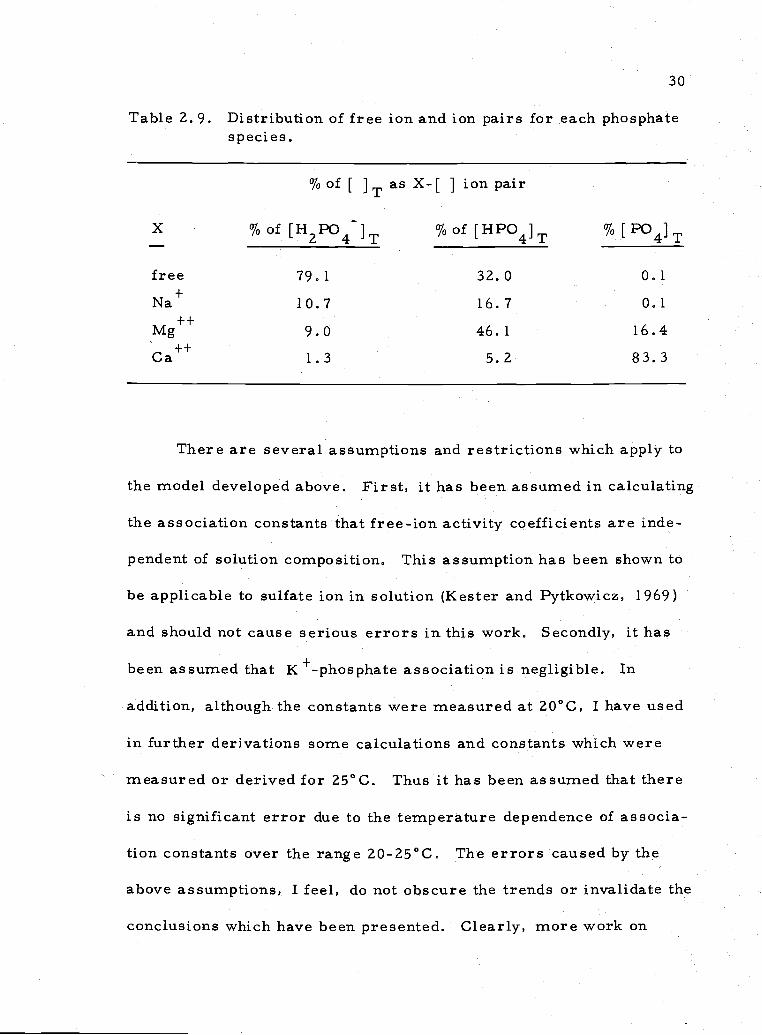
Table 2.9. Distribution of free ion and ion pairs for each phosphatespecies.
% ofII T
as X- [ ion pair
X %of[H2PO4]T %of[HPO4]T
free 79.l 32.0 0.1Na+ 10.7 16.7 0,1
++Mg 9.0 46.1 16.4Ca++ 1.3 5.2 83.3
There are several assumptions and restrictions which apply to
the model developed above. First, it has been assumed in calculating
the association constants that free-ion activity coefficients are inde-
pendent of solution composition. This assumption has been shown to
be applicable to sulfate ion in solution (Kester and Pytkowicz, 1969)
and should not cause serious errors in this work. Secondly, it has
been assumed that K +_phosphate association is negligible. In
addition, although the constants were measured at 20°C, I have used
in further derivations some calculations and constants which were
measured or derived for 25° C. Thus it has been assumed that there
is no significant error due to the temperature dependence of associa-
tion constants over the range 20-25°C. The errors caused by the
above assumptions, I feel, do not obscure the trends or invalidate the
conclusions which have been presented. Clearly, more work on
31
phosphate association as functions of temperature and pressure
would be valuable in understanding the processes affecting phosphate
mineral equilibria in interstitial waters,
Conclusions
From measurements of the dissociation constants of phosphoric
acid in mixed salt solutions, the association constants of ortho-
phosphate ion with Na+, Ca+Z, and Mg (assuming no phosphate
ion association) were calculated, It was found, in agreement with
others, that MgHPO4° ion pairs show a slightly stronger association
than CaHPO4° pairs. CaPO4 ion-pairs, however, are about 25
times more strongly associated than Mg PO4 ion-pairs.
Using the measured association constants the phosphate species
existing in 34. 8%o seawater were computed. MgHPO4° and free
HP042 comprise about 70% of the total dissolved inorganic phosphate
in seawater at pH 8.0.
32
CHAPTER III
SOLtJBILITY BEHAVIOR OF APATITE IN SEAWATER
Introduction
Sillen (1961) has suggested that hydroxyapatite controls the
equilibrium concentration of phosphate in seawater. Kramer (1964)
and Rober son (1966) pointed out that francolite, a carbonate fluor-
apatite, rather than hydroxyapatite is the solid phase which occurs in
seawater. Thus its solubility is the pertinent one to study (Appendix
I). Differences in the results of the solubility studies of Kramer,
Roberson, and Smirnov, Ivnitskaya, and Zalavina (1962), and the
relatively poor precision in the study by Rober son, have made it
impossible to accurately determine the saturation state of seawater
with respect to apatite. It was the goal of this work to better define
the solubility of apatite in seawater, and to examine the differences
in solubility of apatites of different composition. It was found,
though, that the solubility behavior is best described in terms of
complex reactions on the apatite surface rather than by simple solu-
bility theory.
The apatite surface has been shown to be very susceptible to
rearrangement or complex formation in distilled water solutions
(Dietz, Rootore, and Carpenter, 1964; Smith, Posner, and Quirk,
33
1974). Some authors, though, argue that surface reactions do not
prohibit the use of a conventional solubility product (Avnimelech,
Moreno, and Brown, 1973). The solubility products of hydroxy-
and fluor- apatites measured by various workers are presented in
Table 3,1. The results show wide variation, some large deviations
coming from sample treatment. Generally a lower solubility is found
for fluorapatite than hydroxyapatite. Work by Duff (1971) showed that
a relatively small mole-% of F in the solid solution Ca10(PO4)3(F,OH)2
had a relatively large effect in decreasing the solubility.
As early as 1942, Greenwald reported surface area effects in
his studies on the solubility of calcium phosphates, though he used a
poorly defined solid phase in his work. Levinskas and Neumann (1955)
found a decrease in the solubility of hydroxy3patite with a decrease in
surface area of solid and an increasing pH. Rootare, Dietz and Car-
penter (1962) presented experimental evidence suggesting that a
surface complex with the formula Ca2(HPO4)(OH)2 was formed on the
surface of hydroxyapatite. This suggestion was supported by LaMer
(1962), though later work by Dietz, Rootare, and Carpenter (1964)
showed no evidence for the presence of a single solid phase corres-
ponding to Ca2(HPO4)0H2. They interpreted their results in terms
of a two step process, the first of which does not reach equilibrium.
The two step reaction they proposed is:
34
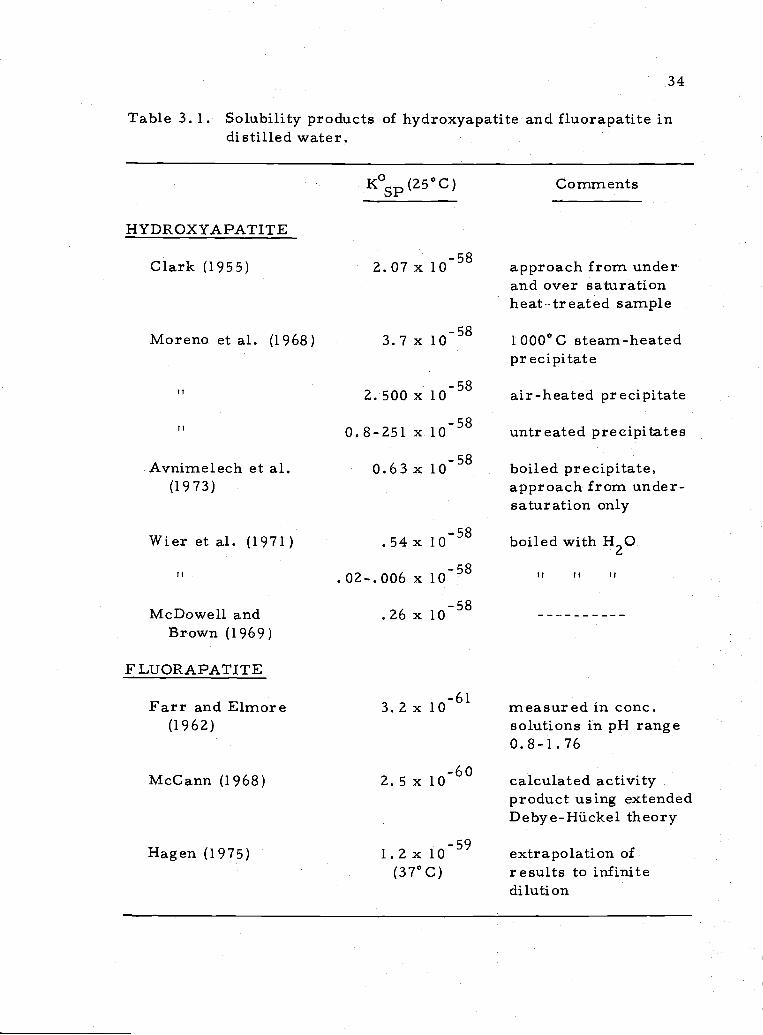
Table 3.1. Solubility products of hydroxyapatite and fluorapatite indistilled water.
HYDROXYAPATITE
Clark (1955)
Moreno et al. (1968)
Avnimelech et al.(1973)
Wier et al. (1971)
McDowell andBrown (1969)
FLIJORAPATITE
Kp(25C)
2.07 io58
3.7 1058
2.500 x 1058
0.8-251 x io58
0.63 x io58
.54x io_58
.02-.006 x io58
.26 io58
Comments
approach from underand over saturationheat-treated sample
1 000°C steam-heatedprecipitate
air-heated precipitate
untreated precipitates
boiled precipitate,approach from under-saturation only
boiled with H20
It II
Farr and Elmore 3. 2 x 10 measured in conc.(1962) solutions in pH range
0.8-1.76
McCann (1968) 2,5 x io60 calculated activityproduct using extendedDebye-Hückel theory
Hagen (1975) 1.2 x 10 extrapolation of(37° C) results to infinite
dilution
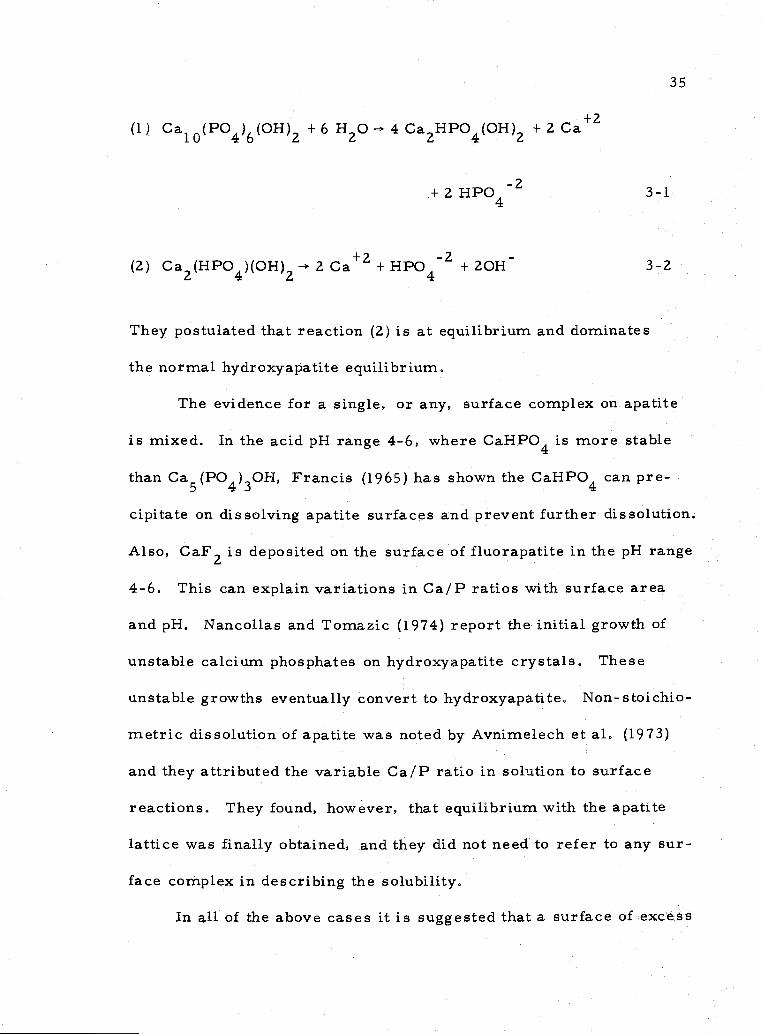
35
(1) Ca1 0(PO4)6(OH)2 + 6 H20 4 Ca2NPO4(OH)2 + 2 Ca+Z
+2HP042 3-1
(2) Ca2(HPO4)(OH)2 2 Ca2 +HPO4 2 + 20H 3-2
They postulated that reaction (2) is at equilibrium and dominates
the normal hydroxyapatite equilibrium.
The evidence for a single, or any, surface complex on apatite
is mixed. In the acid pH range 4-6, where CaHPO4 is more stable
than Ca5(PO4)30H, Francis (1965) has shown the CaHPO4 can pre-
cipitate on dissolving apatite surfaces and prevent further dissolution.
Also, CaF2 is deposited on the surface of fluorapatite in the pH range
4-6. This can explain variations in Ca/P ratios with surface area
and pH, Nancollas and Tomazic (1974) report the initial growth of
unstable calcium phosphates on hydroxyapatite crystals. These
unstable growths eventually convert to hydroxyapatite. Non- stoichio-
metric dissolution of apatite was noted by Avnimelech et al, (1973)
and they attributed the variable Ca/P ratio in solution to surface
reactions. They found, however, that equilibrium with the apatite
lattice was finally obtained, and they did not need to refer to any sur-
face complex in describing the solubility.
In all of the above cases it is suggested that a surface of excess
Ca (or P-deficiency) is formed relative to stoichiometric apatite.
Radio-isotope measurements of the surface concentrations of Ca and
P at the zero-point of charge of hydroxyapatite by Kukura, Bell,
Posner, and Quirk (1972) suggested that there is no excess P or Ca
(or deficiency) on the apatite surface, but this evidence has been
questioned (Smith et al., 1974). Smith et aL postulated a variable
surface layer formed during the preparation of the hydroxyapatite
which can subsequently be dissolved exposing crystal units of normal
composition beneath.
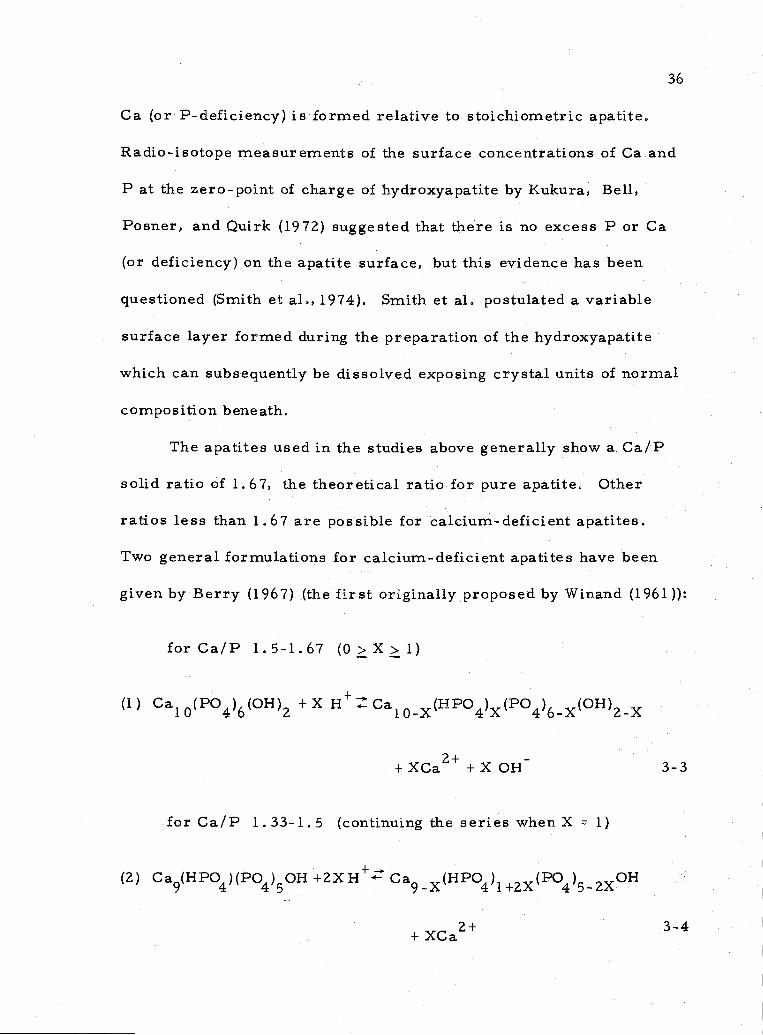
The apatites used in the studies above generally show a Ca/P
solid ratio of 1.67, the theoretical ratio for pure apatite. Other
ratios less than 1.67 are possible for calcium-deficient apatites.
Two general formulations for calcium-deficient apatites have been
given by Berry (1967) (the first originally proposed by Winand (1961 )):
forCa/Pl.5-1.67 (O>X>1)
(1) Ca1 0(PO4)6(OH)2 + X H+ Ca1 ox(HPO4)x(PO4)6x(OH)zx
+XCaZ++XOH 3-3
for Ca/P 1.33-1.5 (continuing the series whenX 1)
(2) Ca9(HPO4)(PO4)50H +2XH Ca9(HPO4)i2(PO4)52OH
2+ 3-4+ XCa
37
Stutman, Posner, and Lippincott (1962) favor a formulation Ca1
Hzx(PO4)6(OH) for structure (1). No solubility studies that I am
aware of have been performed with calcium-deficient apatites. It is
possible, though, that some workers who thought they were using
Ca3(PO4)2(Ca/P = 1.5) were actually using a calcium-deficient
apatite (Ca9(HPO4)(PO4)50H),
One such study may have been that reported by Riviere (1941)
on the solubility of tricalcium phosphate in seawater. Significantly,
he reported alkalinity changes similar to those found in the work
presented here. He assumed, however, that a new phosphocarbonate
phase was being formed.
Other studies of phosphate solubility in seawater have been
made by Roberson (1966), Kramer (1964), and Smirnov et al. (1962).
Kramer gives no account of his experimental work, and reports only
his results, He concludes that seawater is slightly supersaturated
with respect to carbonate fluorapatite. Smirnov et al. measured the
final solution compositions in (assumed) equilibrium after apatite was
precipitated from solution, The solutions he used, however, were
not seawater composition, but rather NaC1-CaC12 mixtures with
additions of F and CO2. Rober son dissolved natural apatites in a
carbonate-free artificial seawater. Recalculating his results for
25°C and 35%o, using the dissociation constants of Kester and Pytko-
wicz (1967), an average ion-product of 36.08 ± 2.03 (2 cr) for
5 pCa + 3 pPO + pF is computed. This pK5 represents the equilib-
rium constant for the idealized solubility reaction:
Ca5(PO4)F 5 Ca2 + 3 P043 + F
Other studies of fluorapatite in the pH range of seawater are
rare. One pertinent study is that of Simpson (1969), who found that
a low-fluoride surface layer is formed on fluorapatite crystals in
alkaline solutions.
Summarizing the observations on apatite behavior in solution:
(1) Precise solubility measurements can be made, but inter-
comparison between measurements is poor.
(2) The surface of apatite is easily susceptible to alteration.
This alteration may be in the form of a surface complex, a calcium-
deficient apatite, and/or fluoride exchange reactions.
(3) Kinetic factors are important in determining the reactions
at the apatite-solution interface.
(4) The formation of a surface-phase does not necessarily
prohibit equilibrium between the bulk phase and the solution.
Experimental
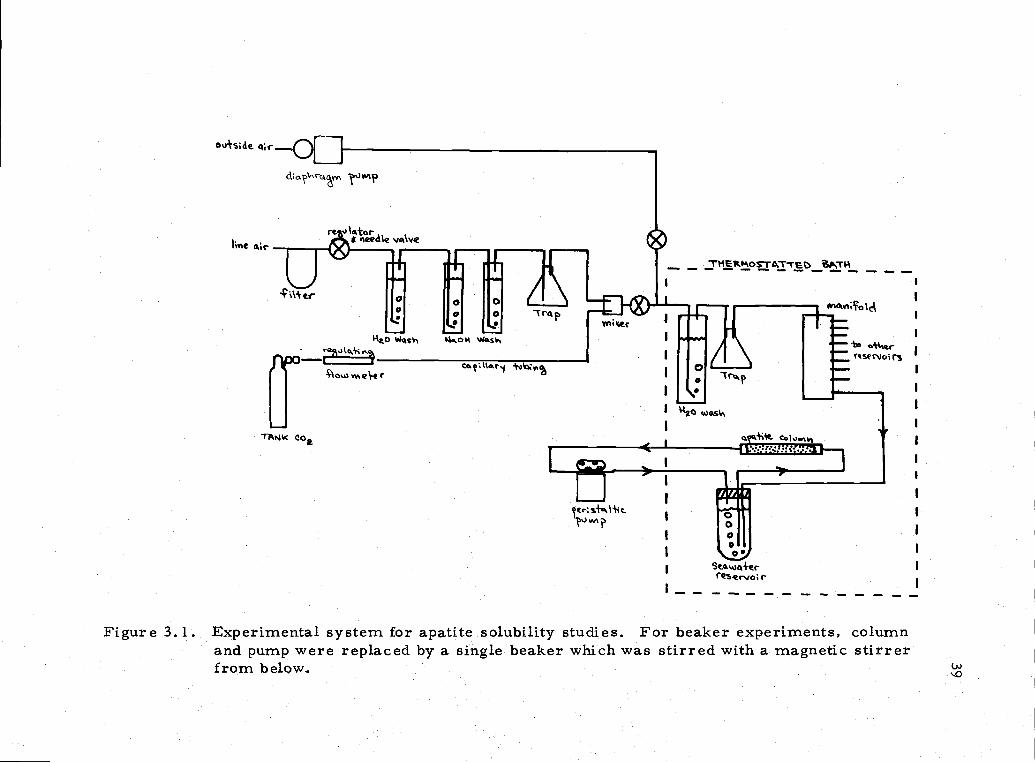
The basic experimental scheme was a flow-system shown in
Figure 3. 1. The pH was held nearly constant by bubbling an air-CO2
mixture through the seawater reservoirs. For one series of
4,f
rw
s neeále vcI\veu,ve -
- -I
I
C0
00 0 I
w oi II
L]
0u
II
II
ThI4( COa it
>1I
0 II
000
I e.
e
--..
Figure 3.1. Experimental system for apatite solubility studies. For beaker experiments, columnand pump were replaced by a single beaker which was stirred with a magnetic stirrerfrom below.
40
experiments the apatite columns and pumping system were replaced
by a sample of apatite suspended in a nylon bag in a 1000 ml
Berzelius beaker. A magnetic stir bar was used to stir the sample.
Discrete samples placed in 100 ml ampoules were also used. Total
phosphate, fluoride, pH, alkalinity, and calcium were measured
using techniques and equipment outlined in Appendix Z. The seawater
was 33. 3%o S and maintained at 10°C unless otherwise specified.
The samples used in the study are described in Appendix 3.
They were obtained from land phosphate deposits as well as from
sedimentary ocean environments.
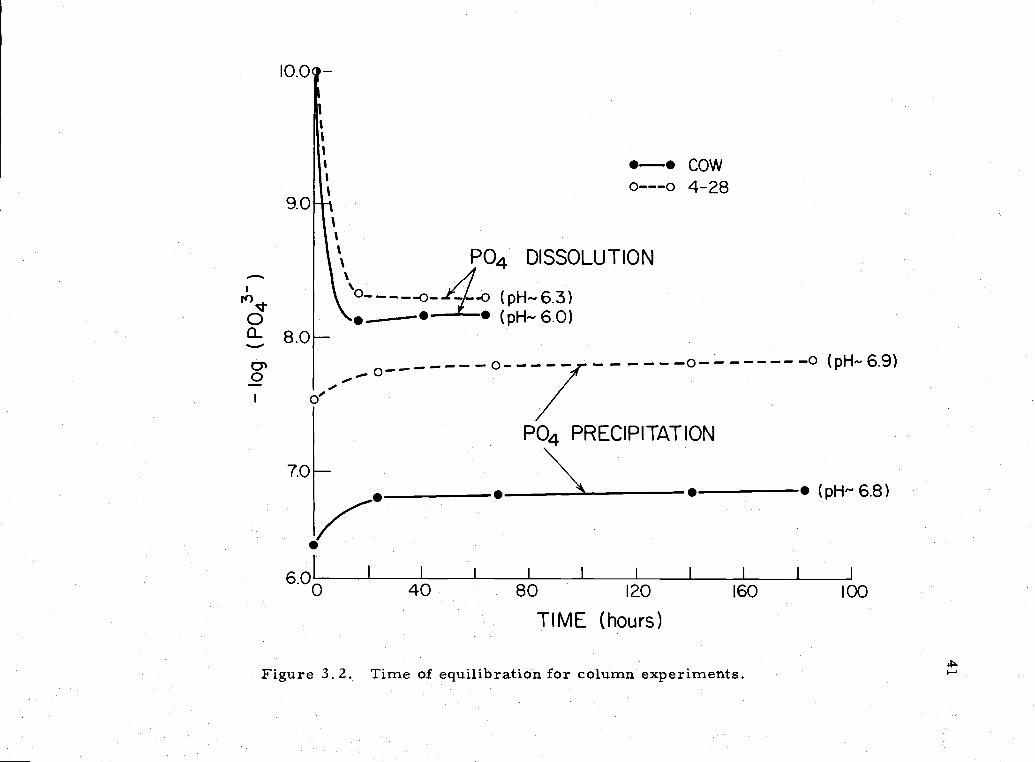
Results
Preliminary experiments showed that a steady value of phos-
phate was reached in a relatively short time in the column experi-
ments (Figure 3. Z), and unless otherwise specified, the column
experiments were terminated at 48 hours. Beaker and ampoule
experiments ran from 30-60 days, and their time behavior was
generally monitored.
In the discussion to follow, the term TPO4 will be used to
designate the total inorganic phosphate. It is defined by:
TPO4 = [H3PO4} + [H2PO4J + + [P043]
10.0
cowJL °---o 4-28
9.0
I
PO4 DISSOLUTION
(pH-6.3)
o .-- (p1-1-6.0)
8.0
-- ------------------0------- -o (pH'6.9)- 0 /
PO4 PRECIPITATION
7.0k. (pH-6.8)
6c.i I I I I I I
0 40 80 120 160 100
TIME (hours)
Figure 3 2 Tune of equilibration for column experiments
42
The individual ionic species will also be referred to. They can be
calculated from the TPO4 by the following relations:
33 2
[P0]= TPO/(1 + +
r
+ ) 3-5K1K2K3 K2K3 K3
2K X X2
[HPO4 ] = TPO4/(l +-- +;--- + ) 3-6X K2 K K2
X K KK[H2PO4] = TPO4/(1 +
2 2 3-7K X X
where K. = ith apparent dissociation constant of phosphoric acid
X = operational hydrogen ion activity lO
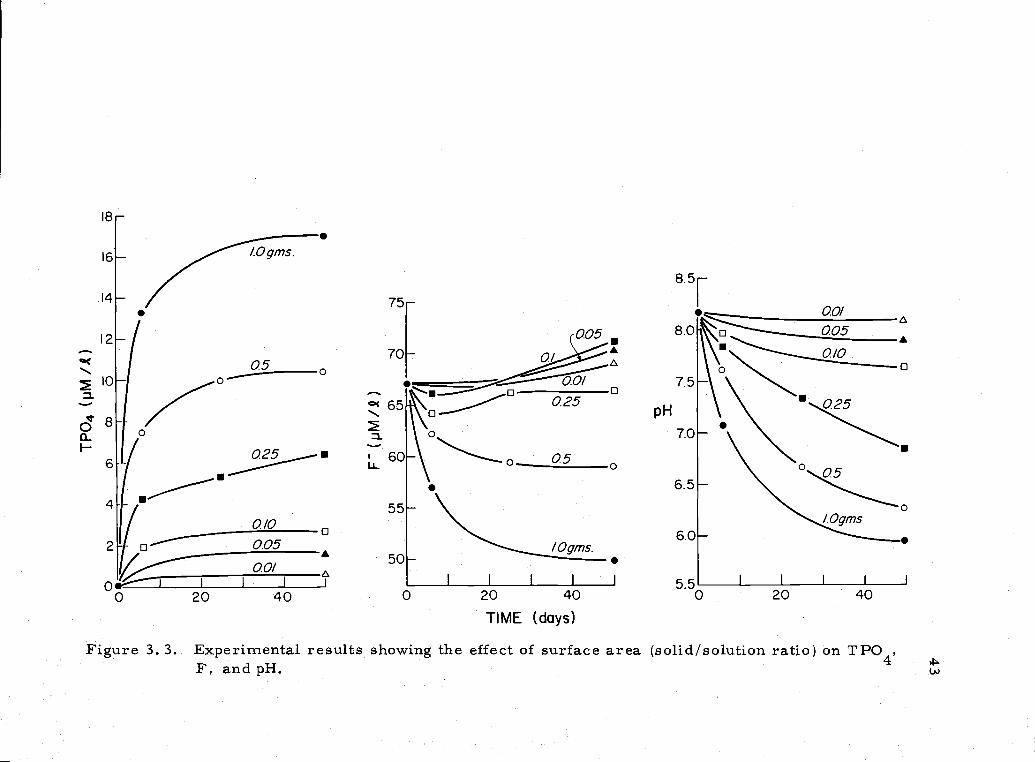
The effect of surface area and surface reactions are best
exemplified in the results of a series of ampoule experiments.
Weighed portions of a sample (COW) were placed in alkalinity free
seawater. One sample was placed in seawater of normal alkalinity
(-' 2.2 rneq/l). The results are shown in Figures 3-3 and 3-4. (Data
for the analyses is given in Appendix 4, Table A.4. 1). A good corre-
lation is seen between the [HPO4 concentration and the amount of
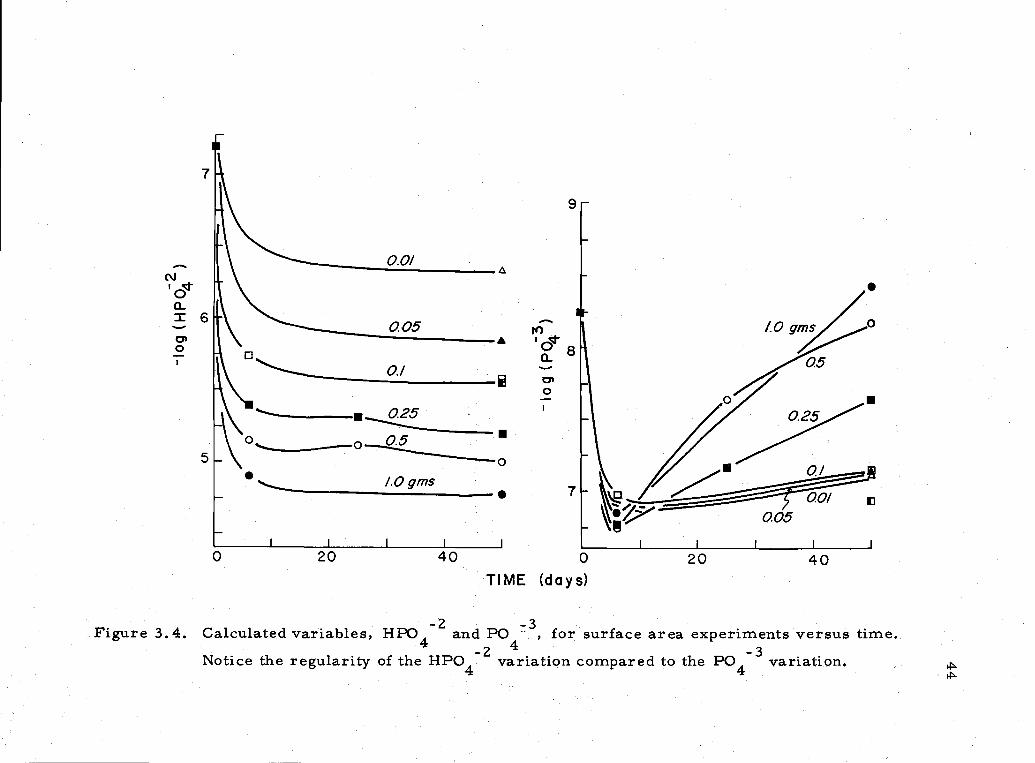
solid used (Figure 3.5). The [P043] concentration showed an
initial increase which was due to the rapid initial increase in the
TPO4 in solution. This increase was followed by a slower decrease
16-
85r
PH025
6 6OO560-50.
I II I I I I I I I I
0 20 40 0 20 40 0 20 40
TIME (days)
Figure 3 3 Experimental results showing the effect of surface area (solid/solution ratio) on TPO4,F, and pH. (J
9
6/ 0
: /-
./0 qrns
7
20 40 0 20
005
TIME (days)
Figure 3 4 Calculated variables, HPO and P0 for surface area experiments versus timeNotice the regularity of the
HPO4 variation compared to the PO4 variation
pHPO5.o
I.0
U,
E00
000.1U,
EDI
I.
45
6.0 70
T'\\\
A
PHPO\ PH\ pPO4
pH 6.0 7.0 8.0 9.0
pPO I I I I I
' 8.5 8.0 7.5 7.0 6.5
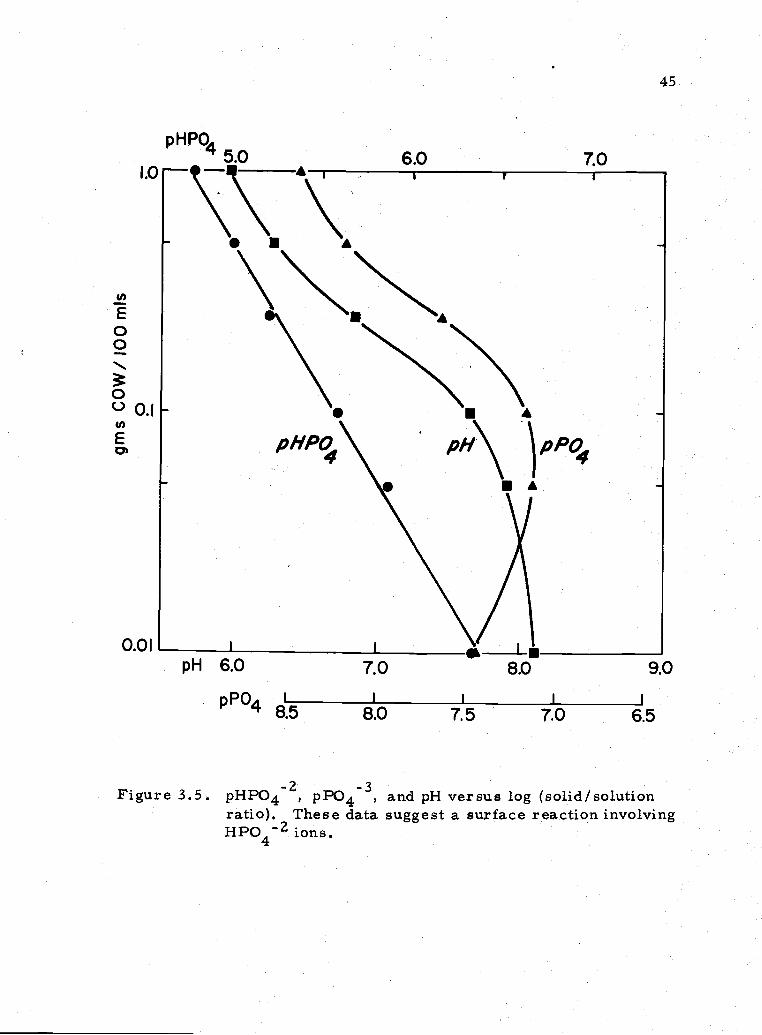
Figure 3 5 pHPO42, pPO43, and pH versus log (solid/solutionratio). These data suggest a surface reaction involvingHP042 ions.
46
in [PO43 caused by a slow decrease in pH which was not ccompanIed
by the necessary increase in TPO4 to increase or even maintain a
constant [PO43] concertration. This manner of [P043] change
versus time was typical of the behavior of the COW sample in other
experiments.
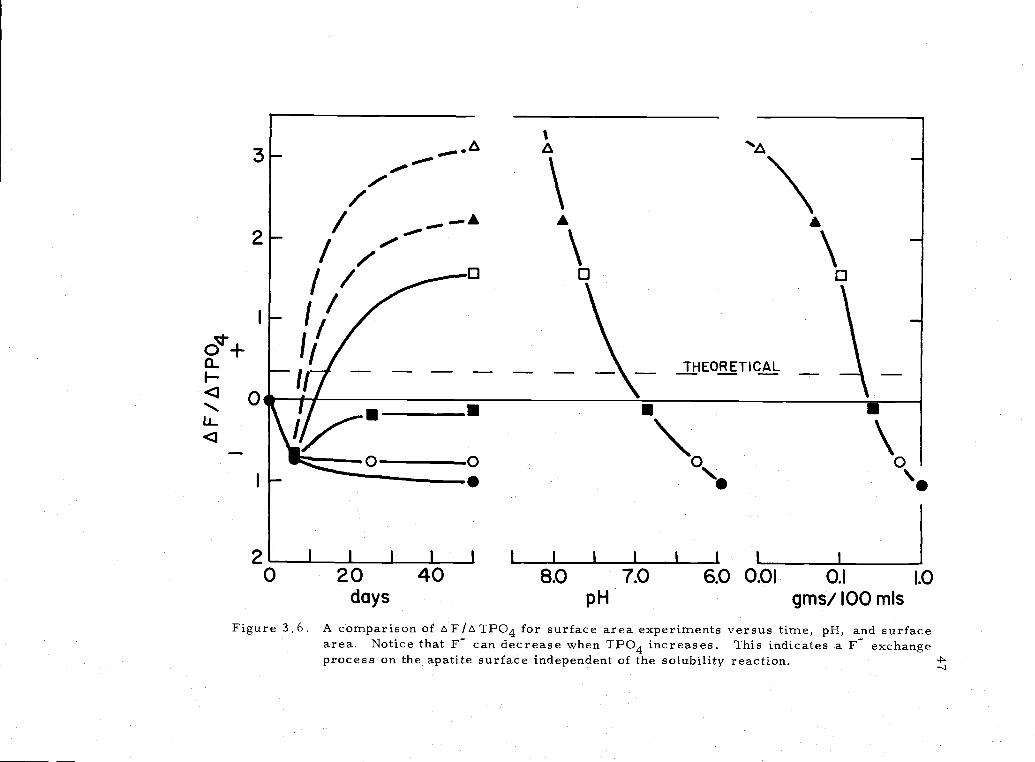
The concentration of fluoride was a function of both pH and
surface area (Figure 3'.6). Most notably, it showed both increases
and decreases in solution even though the TPO4 increased steadily.
These data suggest that there is excessive F dissolution (relative to
P) above pH 7. 1 and excessive P dissolution (relative to F) below
that pH for this sample. Thus, the apatite exhibited an ion-exchange
type behavior with the F in solution. The magnitude of the F
dependence on pH was different for other samples, though all showed
the same trend. The behavior of the sample equilibrated in seawater
of normal alkalinity ( 2. 2 meq/l) is somewhat different from the other
samples. The final [HP042] concentration is very near that of the-6sample with the same surface area (2.85 vs. 2.58 x 10 M/l
HP042) and this is consistent with the behavior of the other samples.
The F concentration, however, is significantly higher than that
in the other samples. This is true even considering the expected
increase in, F with increasing pH. This indicates that CO3 or
HCO3 ion might also substitute for F ion on the apatite surface.
Interaction of CO32 and F is mentioned in the literature, but
3-,,
// £F
4-,
< 0
-Th°fi CAL
:
2 I I I I I I I
0 20 40 8.0 7.0 6.0 0.01 0.1 1.0
days pH gms/ 100 mIs
Figure 3.6. A comparison of A F/A TPO4 for surface area experiments versus time, pH, and surfacearea. Notice that F can decrease when TPO4 increases. This indicates a F exchangeprocess on the apatite surface independent of the solubility reaction.
evidence is conflicting. Cook (1972) showed that an increase in
C032 of apatites correlates with a decrease in F, however, the
data of McClellan and Lehr (1969) show the reverse trend. Apatite
precipitation studies by Legeros et al. (1968) showed no C032/F
interaction.
Further experiments were performed with samples of COW
(5.5 g - 20 to 30 mesh), FAP (35 g - 50 to 100 mesh), and 4-28
(16. 5 g - 18 to 30 mesh) suspended in nylon bags in 700 mIs of
seawater. The samples were continuously bubbled wtth outside air
or an air-CO2 mixture. Approximately 50-mi aliquots were removed
periodically for analysis of F, TPO4, and alkalinity. The results
are il1ustated in Figure 3.7, and the final data is given in Appendix 4,
Table A4. 2.
The striking feature of the first equilibration, notably with
COW, is the difference in the rates of change of TPO4, F, and
alkalinity. The comparison can only be qualitative since pH also is
changing, and each of the processes changing F, TPO4, and alka-
unity is likely pH dependent. Even so, the difference in rates mdi-
cates a different process dominating the concentration of these
variables. Certainly, other processes than stoichiornetric apatite
solution and dissolution are operating here.
During the second equilibration, changes in alkalinity and F
are virtually absent in 4-28 and FAP. The alkalinity loss in COW
2.4
AJk 20(meq/I)
8.
pH
7.
c.o
Alk
24
(meg/I) ._. AIk 2.0 \____________* 2.4j ______k_.A (meqJl)
i
.S..
-a
8____* I___ _ *
pH.-___.____ a
7
a00-.______
-
-'-U----- (pM/I)F80- U 6((pM/I)
-è
60 /U U_______
TPO44t TPO4(pM/I)
'- (pM/I)
*=0 00 200 300 0
.7.0
pH._.__ l___..--
a1U
(pM/I)
-
-.e-è
.I
.__ .-
200 400
TIME (hours)
B
aa.- . .
-E
TPO4(pM/I) I4 /
1/A AJ
600 0 200 400 600 800
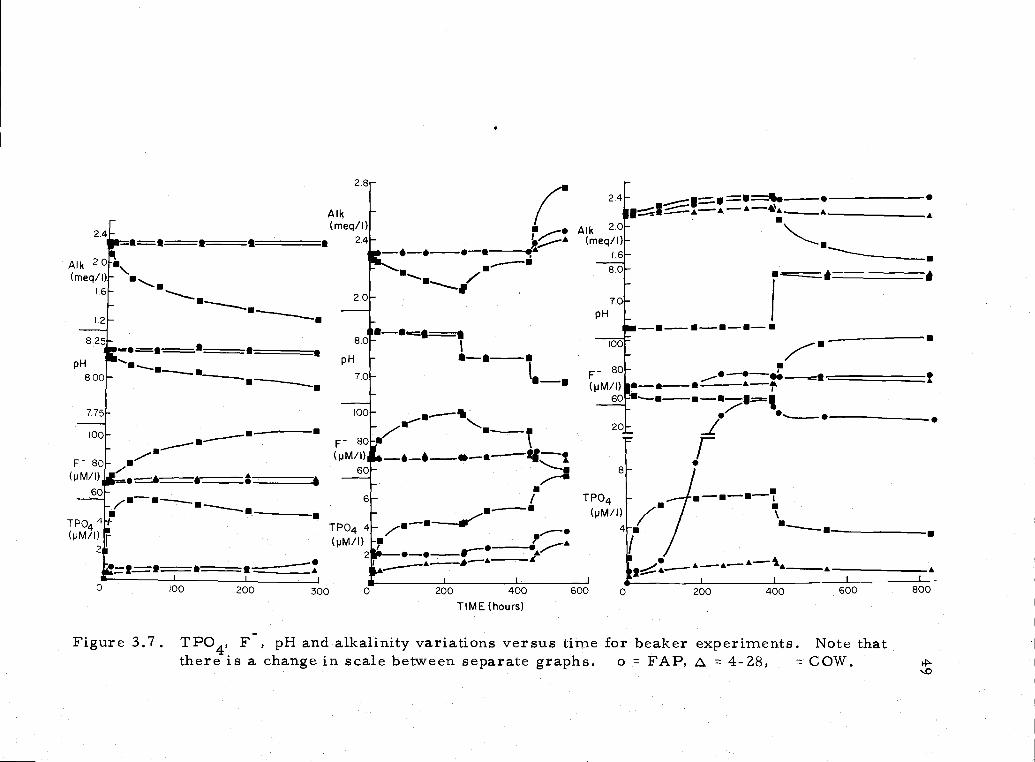
Figure 3.7. TPO4, F, pH and alkalinity variations versus time for beaker experiments. Note thatthere is a change in scale between separate graphs o = FAP, = 4-Z8, COW
50
is only 1/3 of that in the first equilibration, indicating that certain
sites on the apatite are being used up with each equilibration. The
F concentration, however, is nearly as great as in experiment #1.
This shows that the F reaction is not wholly tied to the alkalinity
reaction. A drop in pH caused by CO2 addition is followed by a
relatively small increase in TPO4, a decreasing F concentration,
and an increase in alkalinity. The third equilibration began at a low
pH, and the pH was then raised. This made the system super-
saturated with respect to PO4. Decreases in TPO4 in this case were
accompanied by decreasing alkalinity and increasing F.
The behavior of dissolved phosphate for these apatites can be
summarized in equations of the form: -log(PO4 ) = pPO =
const1 + const2 pH. For ideal behavior of apatite const2 = 0.
From beaker experiments 2 and 3, the following equations are
found (by the method of least-squares):
COW Expt 2 pP043 = 13.46 - .857 pH 3-8aExpt 3 = 13.41 - .835 pH 3-8b
4-28 Expt 2 pPO = 13.65 - .818 pH 3-9aExpt 3 = 13.94 - .819 pH 3-9b
FAP Expt 2 pP043 = 13.74 - .851 pH 3-lOaExpt 3 13.74- .975 pH 3-lOb
Except for FAP (Expt 3), the pH dependence of the phosphate concen
tration going from low to high TPO4 is very close to that found when
51
approaching the final state from high to low TPO4. During Expt 3,
some of the fine mesh FAP escaped from the nylon bag and grinding
by the stir bar caused enhanced solubility, which did not exhibit the
degree of reversibility seen in the behavior of COW. In the equations
above (3-8, -9, -10), a negative pH coefficient (const2) near unity
indicates the influence of HP042 ion rather than P043 ion. This
can be seen from the following derivation:
The definition of K3 can be written as:
[HP042]pK3=pH+log
33-U
[41
or
pK3 pH + pPO4 - pHPO42 3-12
then
pPO43 + pH = pK3 + pHPO42 3-13
Equations 3-8, -9, -10 can be rearranged to the form:
(1 + const2) pPO4 - const2 (pH + p?043) = const1 3-14
so, substituting from Eq. 3-13
(1 + const2) pPO43 - const2 (pHPO4 2) = const1 + const2 pK3
3-15
52
or,
A pPO43 + B pHPO4 2C 3-16
Thus const2 shows the influence of HPO4 2 ion on the dissolution and
precipitation behavior on apatite. Equations (3-8, -9, -10) can then
be recast in the form of equation 3-16 (pI(3 = 9.215), which yields
the following:
cow z .143 .857 5.56cow 3 .165 .835 5.72
4-282 .182 .818 6.114-28 3 .181 .819 6.39
FAP2 .149 .851 5.89FAP3 .025 .975 4.76
The final constant, C, should be constant for each sample if there is
a constant solubility product for a phase of constant relative P043/
HPO4 2 composition. This comparison can be made not including
the influence of F ion because F is approximately equal at corres-
ponding pH' s in experiments 2 and 3.
Since it was observed that the solubility of apatites depended to
some extent on the HPO4 concentration, a series of experiments
was designed to examine the HPO4 dependence for a range of
apatite samples. Eight different apatites (described in Appendix 3)
were simultaneously equilibrated in a column-flow apparatus.
53
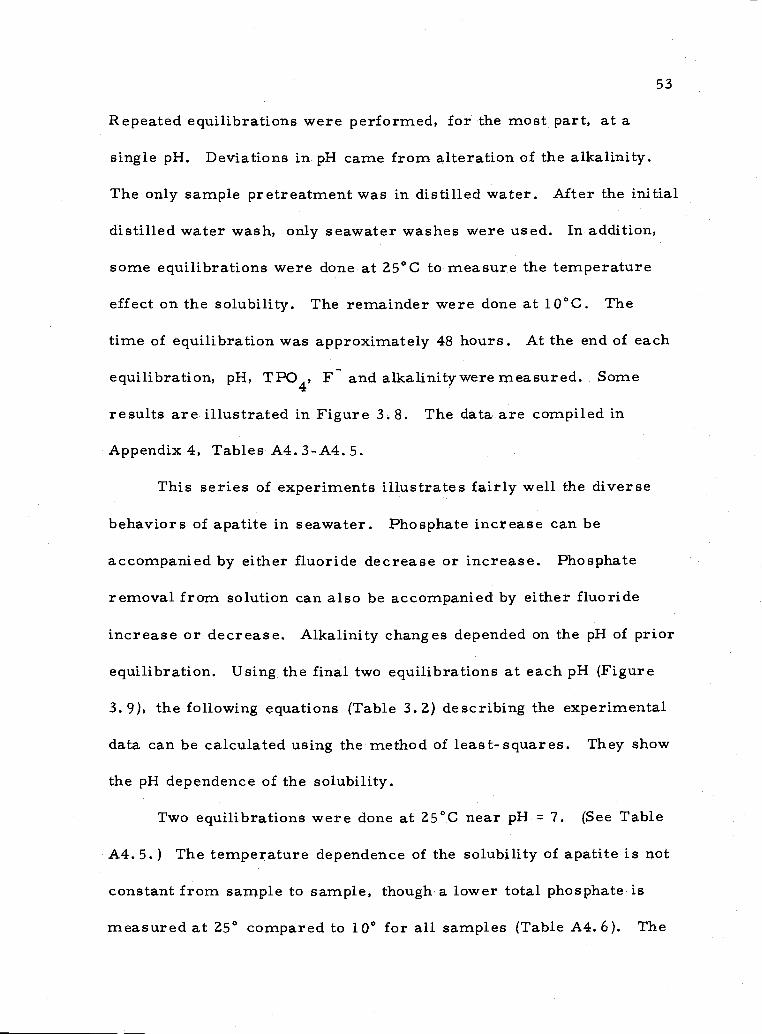
Repeated equilibrations were performed, for the most part, at a
single pH. Deviations in pH came from alteration of the alkalinity.
The only sample pretreatment was in distilled water. After the initial
distilled water wash, only seawater washes were used. In addition,
some equilibrations were done at 25°C to measure the temperature
effect on the solubility. The remainder were done at 10°C. The
time of equilibration was approximately 48 hours. At the end of each
equilibration, pH, TPO4, F and alkalinitywererneasured. Some
results are illustrated in Figure 3. 8. The data are compiled in
Appendix 4, Tables A4. 3-A4. 5.
This series of experiments illustrates fairly well the diverse
behaviors of apatite in seawater. Phosphate increase can be
accompanied by either fluoride decrease or increa.se. Phosphate
removal from solution can also be accompanied by either fluoride
increase or decrease. Alkalinity changes depended on the pH of prior
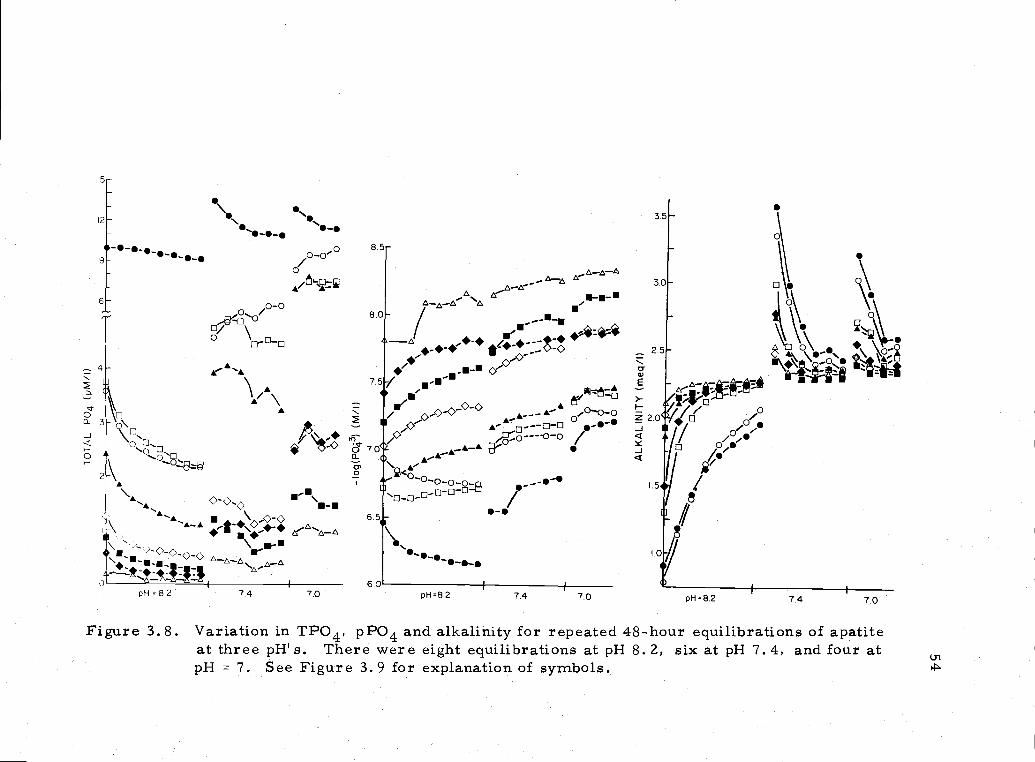
equilibration. Using the final two equilibrations at each pH (Figure
3. 9), the following equations (Table 3, 2) describing the experimental
data can be calculated using the method of least-squares. They show
the pH dependence of the solubility.
Two equilibrations were done at 25°C near pH = 7. (See Table
A4. 5.) The temperature dependence of the solubility of apatite is not
constant from sa.mple to sample, though a lower total phosphate is
measured at 25° compared to 10° for all samples (Table A4.6). The
15
2
9
6
-4
0
-J
H0H
._'
/O-0
AA' A
LA.. \ c>-<>
I
\\ A-A 4\<>$..\...pH82 74 7.0
8
80
7
o7l
6.
__L.4
.
-:ii-.-.'-.,; 2
.' --.E
U' ;U'
A--A_A ,O_O Z 2A 0 -. --
A_A
-_::
_1So_0_0_o__8 I 500_0--D-/
p1-I 8.2 7.4 7.0
S
0
4-.
pH=8.2 7.4 7.0
Figure 3.8. Variation in TPO4, pPO4 and alkalinity for repeated 48-hour equilibrations of apatiteat three pH' s. There were eight equilibrations at pH 8. 2, six at p1-1 7.4, and four atpH = 7. See Figure 3.9 for explanation of symbols.
Ui
r)
00
0
8.
1i
7.5
6.5
L
UU
-4
AUS L- LA _____
3b 8.00 7.75 7.50 7.25 7.00 6.75
pH
Figure 3 9 pPO4 versus pH for different apatites in column experiments "Ideal" apatitesolubility is a horizontal line on this type of graph Ui
Ui
56
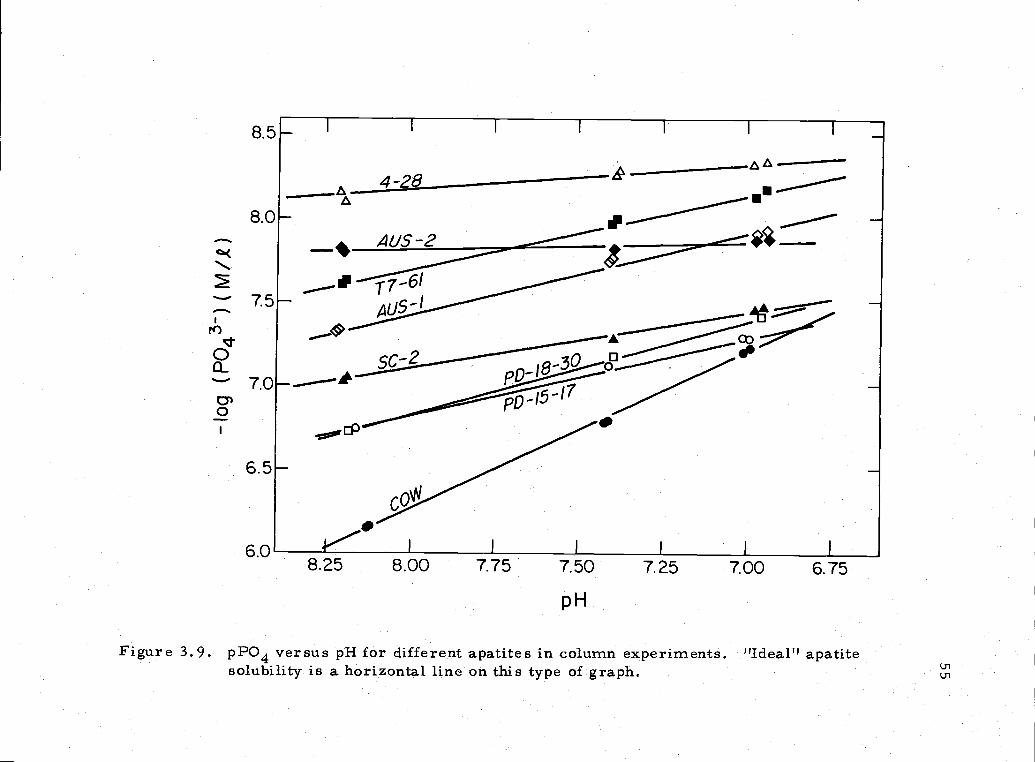
Table 3.2. pH dependence of P043 and F in column experiments.
pP043=A+BpHcorrelatLon sranaarci
A B coefficient error
PD-15-17 10.533 -.4625 -.9993 .0082COW 13.697 -.9283 -.9991 .01864-28 9.518 -.1693 -.9729 .0208SC-2 9.929 -.3550 -.9982 .0119PD-18-30 11.470 -.5796 -.9988 .0144T7-61 11.295 -.4495 -.9986 .0122AUS-1 11.262 -.4777 -.9943 .0266AUS-2 8.190 -.0466 -.8805 .0123
(A = 8.135 + 6.001 B R = .97928
pF=C+DpHC D
PD-15-17 5.363 -.1484cow 6.518 -.32274-28 4.342 -.0217SC-2 4.602 -.0548PD-18-30 4.684 -.0618T7-61 4.303 -.0142AUS-1 4.205 -.0031AUS-2 4.359 -.0210
(C = 4.208 +7.271 D
.3048)
correlation standardcoefficient, R error
-.9927 .0087-.9981 .0092-.9035 .0053-.9889 .0046-.8841 .0166-.9421 .0026-.1219 .0131-.5580 .0162
.9989 .0338
reduction in TPO4 ranged from 30-50% for a 15°C temperature
increase.
Two experimental runs approached equilibrium from
57
supersaturation with respect to phosphate. The final phosphate con-
centration of these equilibrations (Table A4. 7) can be compared to the
phosphate predicted using the equations presented in Table 3. 2. The
results are given in Table 3. 3. A least-squares regression of the
expected TPO4 versus the measured TPO4 (excluding 1 sample) gives
TPO4(measured) = 1.182 TPO4(expected). Thus, most samples
remained 18% higher in PO4 than predicted. This discrepancy is
somewhat lessened when one considers the effect of the relatively
lower levels of F in these runs compared to the predicted F. The
levels of phosphate for each sample were, however, reduced to close
to the concentrations of phosphate approached from undersaturation.
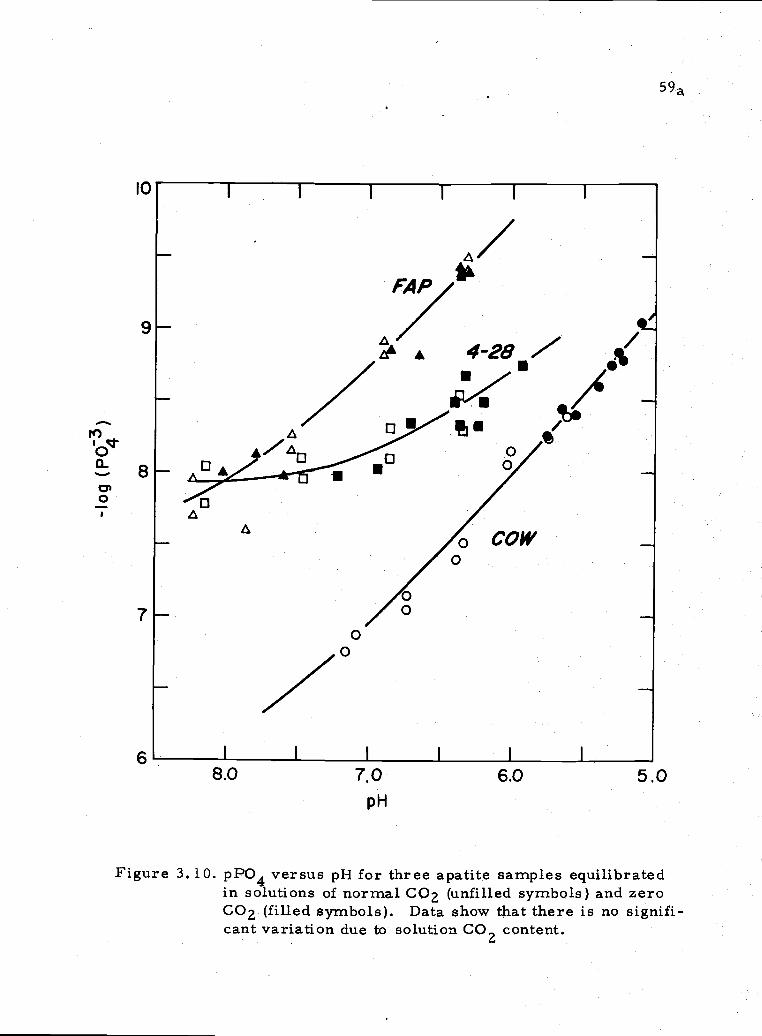
Early experiments were done to estimate the eUect of CO32
levels on the apatite solubility. It was found that C032 had no
appreciable effect on the final phosphate in solution (Figure 3.10).
(See data in Table A4.8.) Greenwald (1945), on the other hand,
reports an increase in phosphate solubility with an increasing solution
carbonate content.
Riviere (1941) attributed alkalinity changes in his phosphate
solubility experiments to the formation of a phosphocarbonate phase.
I tested that hypothesis in a solubility experiment allowing no
atmospheric CO2 exchange. If the alkalinity change observed in the
experiment was due to carbonate dissolution or precipitation, the
change would be reflected in the total carbon dioxide (TCO2). If
58
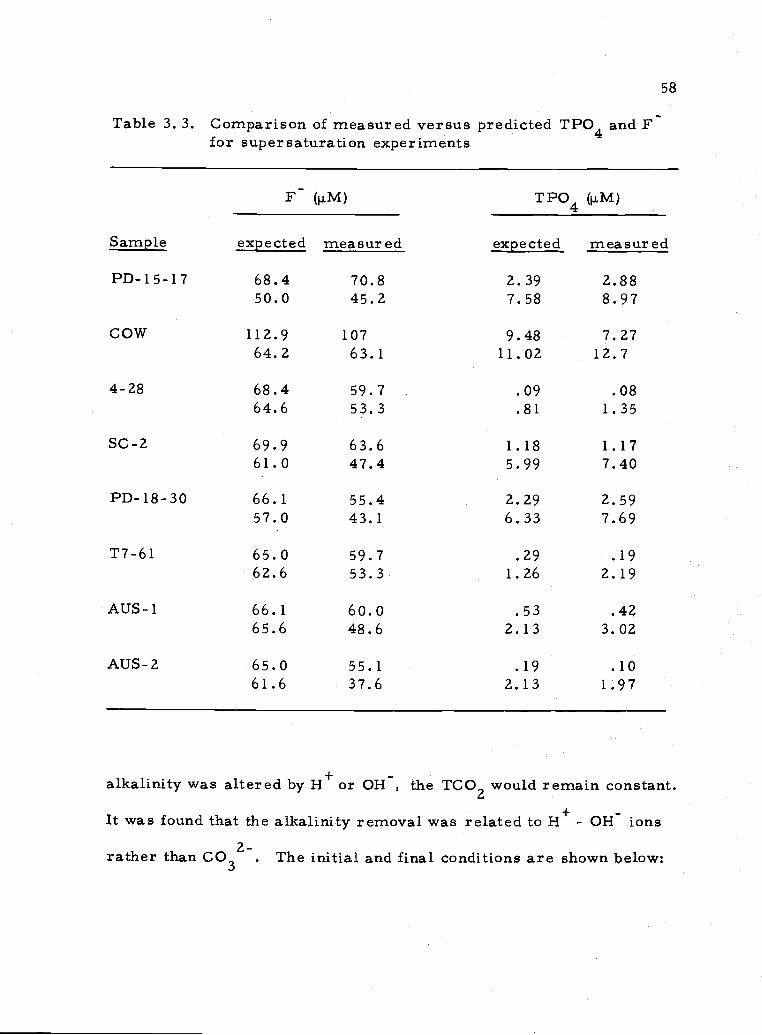
Table 3. 3. Comparison of measured versus predicted TPO4 and Ffor supersaturation experiments
F (PM) TPO4 (ii.M)
Sample expected measured expected measured
PD-15-17 68.4 70.8 2.39 2.8850.0 45.2 7.58 8.97
COW 112.9 107 9.48 7.2764.2 63.1 11.02 12.7
4-28 68.4 59.7 .09 .0864.6 53.3 .81 1.35
SC-2 69.9 63.6 1.18 1.1761.0 47.4 5.99 7.40
PD-18-30 66.1 55.4 2.29 2.5957.0 43.1 6.33 7.69
T7-61 65.0 59.7 .29 .1962.6 53.3 1.26 2.19
AUS-1 66.1 60.0 .5365.6 48.6 2.13 3.02
AUS-2 65.0 55.1 .19 .1061.6 37.6 2.13 1.97
alkalinity was altered by H+ or 0H, the TCO2 would remain constant.
It was found that the alkalinity removal was related to - 0H ions
rather than C032. The initial and final conditions are shown below:
59
Initial Final
pH 8.118 7.302
TPO4 (p.M) 0.02 10.2
Alk (meq/l) 2.2?i 2.038
TCO2 (1iM/1) 2.11 2.14
If there had been C032 precipitation the final TCO2 would have been
2.00 iM/l.
To summarize the experimental work, I will list the observed
behavior of apatite in seawater:
(1) For the sample "COW," the amount of phosphate in solution
was a function of the surface area of the solid material. The dissolu--2hon curves approached a constant {HPO4 }/sfc area ratio rather
than a constant [?043] or {P0431/sfc area ratio.
(2) The rates of phosphate, fluoride, and alkalinity changes in
solution indicate different processes acting to alter each component.
(3) A more soluble surface layer dissolved (or is replaced)
upon successive equilibrations of apatites after washing in distilled
water. The final equilibrations of packed columns of apatite exhibit
a pH dependence ranging from nearly constant (P043) to nearly
constant (HP042). The computed pH dependence shows a fair degree
of reversibility when approached from under- or supersaturation with
respect to phosphate.
0
-[iJ
7
-i
593
PAP
A 4-287
/ 47/
A AcowA
8.0 7.0 6.0 5.0
p1-I
Figure 3.10. pPO4 versus pH for three apatite samples equilibratedin solutions of normal CO2 (unfilled symbols) and zeroCO2 (filled symbols). Data show that there is no signifi-cant variation due to solution CO2 content.
(4) Fluoride concentrations are a function of pre-equilibration
and pH. Final fluoride concentrations are increased with increasing
pH. Alkalinity is a function of pre-equilibration and pH, also. A
change from low to high pH will cause a decrease in.alkalinity, and
vice versa.
(5) Temperature affects the solubility of apatite as well as the
fluoride and alkalinity reactions with apatite. Apatite becomes less
soluble with increasing temperature.
(6) The presence or absence of dissolved CO2 has a relatively
minor effect on the level of dissolved phosphate. Other factors
predominate.
(7) The uptake (release) of alkalinity is not related to the
precipitation (dissolution) of a carbonate mineral.
Discussion
I have suggested that the apatite surface which equilibrates with
seawater is different from the bulk apatite. Because data were
obtained in a solution of constant Ca, however, the Ca/P ratio cannot
be used to ascertain the nature of the equilibrating phase. The only
means of analysis is through the pH-dependence of the solubility. A
constant -log (PO4 3)(= pPO43) is the expected condition for equilib-
rium with a pure apatite. This is seen by the ideal dissolution reaction
Ca5 (PO4)3F 5 Ca+Z + 3 P043 + F. Rather, a constant pPO4 + XpH
61
was observed for each different apatite studied. This implies a
solid phase containing HP042 ions, or a surface coating of some
type containing HPO42 ions, There is also some F/OH variation
on the solid surface. Assuming that the F/OH variation is associated
with the equilibrating phase, then a simplified representation of the
surface can be given by:
CaA(HPO4)B(PO4)C(OH)D(F)E
Other ions, such as CO3 and Na+, are likely involved on the
surface; they are excluded because I am not trying to completely
describe the surface but rather to simply illustrate the effect of pH
on the solubility. The pH variation of the solubility of the hypo-
thetical phase will be a function on the relative proportions of
HP042, P043, and 0H. There are several possible cases:
(1) B = D (see formula) From stoichiometric dissolution of the
solid surface one writes: CaA(HPO4)B(PO4)C(OH)D(F)E
A Ca+Z + B HPO42 + C PO43 + D OH + E F
The reaction between HP042 and OH leads to
B HPO4 + D 0H = B P043 + D H20
Therefore if B = D, the solubility is represented by
62
A (B+C) P043+E F+(D) H20
This leads to a constant concentration and would be indistjn-
guishable from equilibrium with a pure apatite under our experi-
mental conditions.
(2) B > D If there is an excess of HP042 over OH with the
magnitude of the excess = (B-D), then one can write the net dissolution
reaction as:
A Ca+2+(BD)HPO4Z+(C+D) P03+E F+D H20
Therefore, this would give the appearance of the dissolution of a
surface of the composition CaAHBDPO4 C+BFE. The solution
would then show the property of a constant sum of
(B-D)pH + (C+B)pPO4[(B-D) >0].
(3) D> B. The excess of 0H over HP042 would neutralize all
HPO4 2,thus giving the net dissolution reaction of:
A Ca+Z + (C+B) PC43 + E F + (D-B) OH + B H2O
This would lead to a constant composition in the solution of
(C+B) pPO4 + (D-B) pOH = constant [(D-B)> 0]
Introducing pH + pOH = pK, then
63
(C+B)pPO43 - (D+B)pH = constant
The second condition is observed for all of the samples. There-
fore, if equilibration occurs with a phase represented as above, then
for samples used in this study B > D.
Exact correlation of the pH dependence with composition is not
possible for the several reasons discussed above: lack of quantitative
information on admixed impurities; lack of quantitative information on
ions which are substituted for Ca and PO4 and F; some uncertainty
as to composition of the solid relative to microvariations in the
apatite composition (see Appendix 3). If one assumes that all Ca,
PO4, CO3 and F measured in the bulk sample belong to the
apatite, then average compositions can be formulated. For bulk
apatite, composition calculations are based on P043 + CO3 6.0
atoms/unit cell (McConnell, 1970). Using this procedure, the
following data (atoms/unit cell) are computed (see also Table A.3. 2):
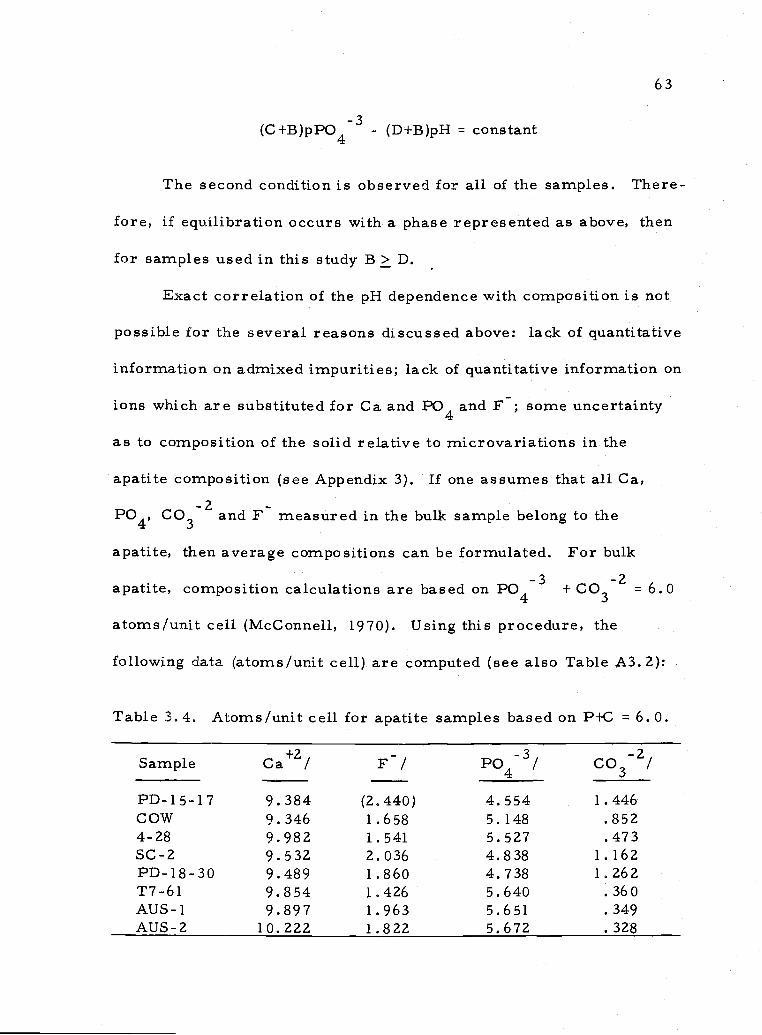
Table 3.4. Atoms/unit cell for apatite samples based on P+C = 6. 0.
Sample Ca+Z/ F/ P043/ CO32/
PD-15-17 9.384 (2.440) 4.554 1.446COW 9.346 1.658 5.148 .8524-28 9.982 1.541 5.527 .473SC-2 9,532 2.036 4.838 1.162PD-18-30 9.489 1.860 4.738 1.262T7-61 9.854 1.426 5.640 .360AUS-1 9.897 1.963 5.651 .349AUS-2 10.222 1.822 5.672 .328
Only in a very rough sense are the solubilities correlated with the
bulk average composition. This is to be expected from general solu-
bility considerations. The pH-dependence, though, is not apparently
correlated with the bulk composition. Arbitrary assignment of Ca+Z
to some other non-apatitic phase would be necessary to construct a
bulk composition which would dissolve according to the measured
pH-dependence.
One is left with the possibility that a surface reaction or complex
controls the solubility behavior of apatite in seawater. Surface
reactions seem to be a characteristic of apatite in aqueous solution.
The exact nature of these reactions, however, has been elusive.
One reaction is apparently the dissolution of a more soluble
surface coating formed during crystal preparation or, in our case,
pretreatment. This was also observed by Smith et al. (1974). The
behavior of 4-28 in the beaker experiments can be compared to its
behavior in the column experiments. The sample showed a considera-
bly higher solubility and greater dependence on HPO4 2 in the beaker
experiments. It is possibly this type of reaction which was observed
in the experiment with COW on varying surface areas. The initial
decrease in solubility in the column experiments may also be related
to the dissolution of this coating. Roberson (1966) also remarked on
the dissolution of a more soluble surface layer.
The second reaction is the formation of a surface material
65
containing relatively more H+ ion than the solid. This coating thus
shows an apparent equilibrium with a surface of some proportion of
HPO4 2 to PC4 ions. it may be qualitatively similar to the first
layer, but acts as if it is more closely bound to the surface. The
apparent relative proportions of HPO4 2 and PO43 show only slight
correlation with the average composition. One would predict this
behavior on the basis of a calcium-deficient apatite structure as
described above. The magnitude of the HPO4 dependence, however,
cannot be predicted from the bulk composition. Using COW, for
example, there is no apparent way to formulate (from the average
composition) an apatite having a 9:1 ratio of HPO4 to P043 ions.
This is another indication that the surface of apatite has a different
composition from the bulk apatite. This surface shows a fair degree
of reversibility with respect to dissolved phosphate.
One should also consider that the pH-dependence and absolute
level of solubility measured here does not represent true equilibrium.
The final measured solubility could represent the balance between the
reaction rates of the solubility of the bulk phase and the solubility
reaction of the surface layer. An apparent equilibrium (steady-state)
could be obtained which is intermediate between the true equilibrium
for each reaction. Wollast (1974) discusses this concept in reference
to the solubility of dissolved silica versus silica uptake by clay
minerals. He shows that the rate of change of dissolved silica can
vary over a wide range of silica concentrations and, for many cases,
can appear to be at equilibrium when, in fact, the relative kinetics
of the two different processes are controlling the final state.
If this kind of process is translated to the solubility behavior of
apatite, one would predict much of the same behavior which was
observed. A hypothetical reaction diagram based on Wollast's (1974)
is presented in Figure 3. 11. Thus, if the precipitation reaction of
apatite dominates, one finds a low solubility. If the surface layer
controls the solubility a higher, but not necessarily equilibrium,
8OlUbility would be measured. As seen, this can roughly explain the
observed behavior.
The kinetics of these reactions will be dependent on many factors.
The pH, the surface area, the degree of crystallithty, the composi-
tion, and possibly other factors will all contribute to the rates of
these two reactions - the surface layer reaction and the "true" solu-
bility reaction.
Finally, an alternative way to explain the experimental results is
to interpret the behavior totally in terms of ion-exchange rather than
solubility processes. Because of the overwhelming amount of Ca
in seawater, there is no evidence here that the apatite is actually
dissolving or precipitating. Or, the amount of actual dissolution may
be so small as to be masked by other processes, such as ion-exchange,
on an active apatite surface.
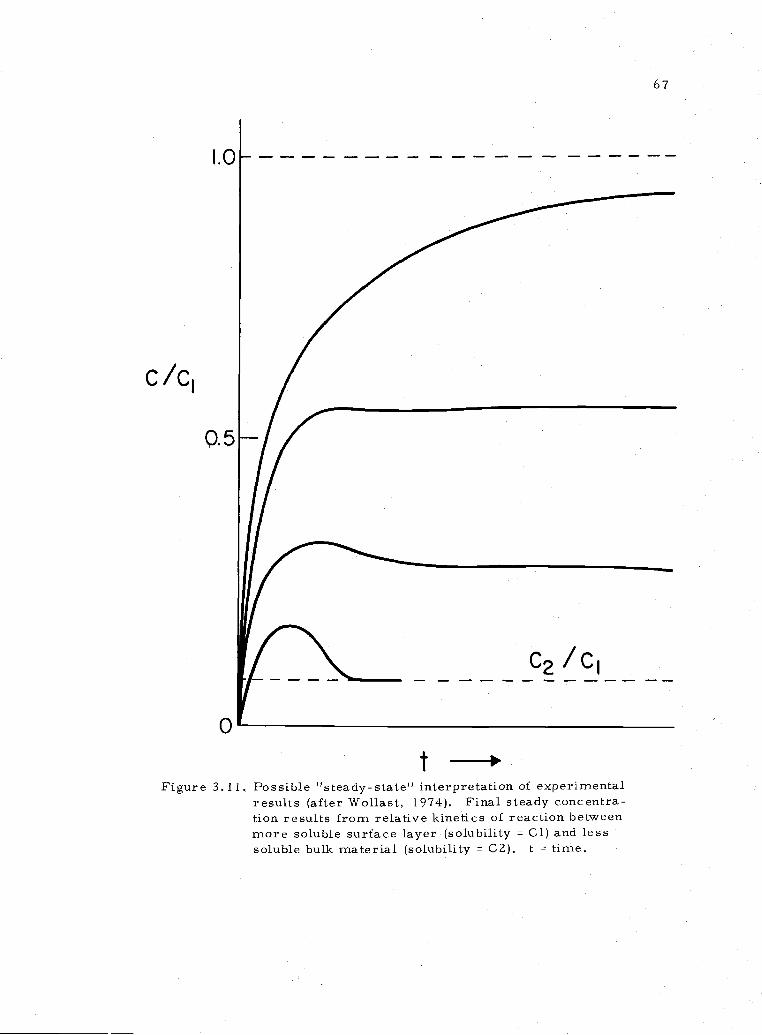
c/cl
I.J
0.5
67
t
Figure 3.11. Possible "steady-state" interpretation of experimentalresults (after Wollast, 1974). Final steady concentra-tio results from relative kinetics of reaction betweenmore soluble surface layer (solubility = Cl) and lesssoluble bulk material (solubility = CZ). t = time.
The interaction and participation of Fion in the altered-
surface apatite phase is undetermined and cannot be estimated from
the data. There is considerable amount of uptake and release of
F by the apatite, but this can be easily accounted for by the normal
apatite structure. In addition to the expected exchange at the normal
hydroxyl position in the apatite structure, there is also the possibility
that the reaction F + HPO4 FPO3 + 0H occurs on the apatite
surface (Simpson, 1969). Ingram (1968) demonstrates the ability of
apatite to incorporate FPO3 ion. A. difference in reaction rates of
F and PO4 has been found, which indicates the involvement of the
ions in different reactions on the apatite. The extent of F reaction is
a function of pretreatment of the apatite, and F uptake is enhanced at
lower pH's. Assuming that the final F concentrations in the column
experiments represent equilibrium values, we should be able to
compute a constant for the exchange reaction. No such constant is
found. Furthermore, the equations derived do not correlate with the
average F on the samples. This could be due to micro-variation in
F content of the apatite samples (see A.ppendix 3, Figure A3. 1).
An estimate of stoichiometric apatite solubility can be made
Lrom a manipulation of equations in Table 3.2. If the constant A is
related to B, the pH dependency, A can be extrapolated to B 0.
This was done for P043 and F, and the results are pPO4 8.135
and pF = 4.208. From the salinity, p(Ca+Z) is found as 1.999. Thus,
69
a stoichiometric solubility product may be computed for 5pCa +
3p4 + pF 9 995 + 24. 405 + 4.208 = PKSp 38, 608. At 33. 3%o
10°C, and pH 8 this corresponds to approximately 0.13 p.M TPO4.
The same type of correlation for the change in solubility between 1 0°
and 25° versus pH dependence can also be made. The correlation,
however, is much poorer. At B = 0, ApPO4 is .322 (see Table A4.6).
Using this value yields a stoichiometric PKp (assuming the same pF)
as above of 37.64 at 25°. A PKp of this magnitude corresponds to
an equilibrium value of .075 p.M TPO4 at pH = 8.0. This value can
be compared to that obtaiied by Rober son (1966). An equivalent cal-
culation of his results shows pKp = 36. 08 ± 2. 03. My value lies
within his range, but, on the average, shows a considerably lower
solubility, roughly 3 x in TPO4 at a given pH and salinity.
The exchange of alkalinity on the apatite surface was also
observed. For some samples there was considerable exchange
resulting in removal or addition of alkalinity amounting to 1-2 meq/l.
This exchange on the apatite surface was found to be pH-dependent,
and may be an important reaction in the buffering of pore waters of
phosphatic sediments (Culberson et al., 1975). A change in pH is
opposed by the uptake or release of H+ ions. The reaction likely
occurs on the surface phosphate groups (Stumm and Morgan, 1970),
but at least some of the changes in alkalinity will arise from reactions
of the. admixed impurities. The extent to which the changes in
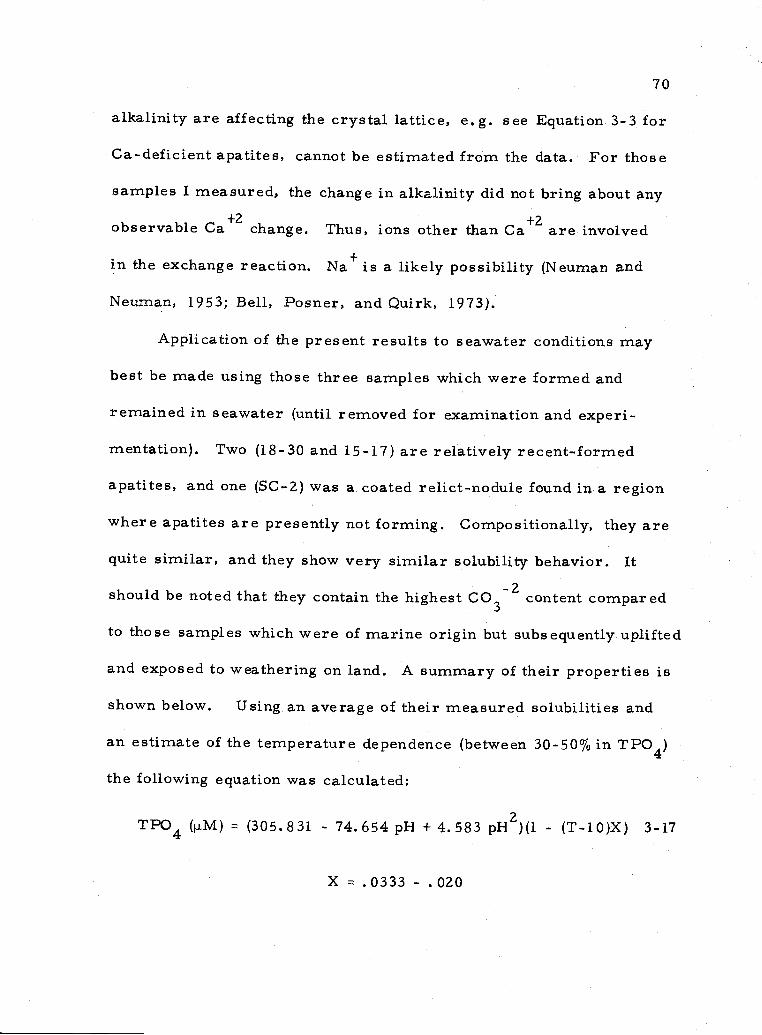
70
alkalinity are affecting the crystal lattice, e.g. see Equation 3-3 for
Ca-deficient apatites, cannot be estimated from the data. For those
samples I measured, the change in alkalinity did not bring about any
observable Ca change. Thus, ions other than Ca+Z are involved
in the exchange reaction. Na+ is a likely possibility (Neuman and
Neuman, 1953; Bell, Posner, and Quirk, 1973).
Application of the present results to seawater conditions may
best be made using those three samples which were formed and
remained in seawater (until removed for examination and experi-
rnentation). Two (18-30 and 15-17) are relatively recent-formed
apatites, and one (SC-Z) was a coated relict-nodule found in a region
where apatites are presently not forming. Compositionally, they are
quite similar, and they show very similar solubility behavior. It
should be noted that they contain the highest CO3'2 content compared
to those samples which were of marine origin but subsequently uplifted
and exposed to weathering on land. A summary of their properties is
shown below, Using an average of their measured solubilities and
an estimate of the temperature dependence (betweer 30-50% in TPO4)
the following equation was calculated:
TPO4 (hiM) = (305.831 - 74. 654 pH + 4.583 pH2)(l - (T-10)X) 3-17
X = .0333 - .020
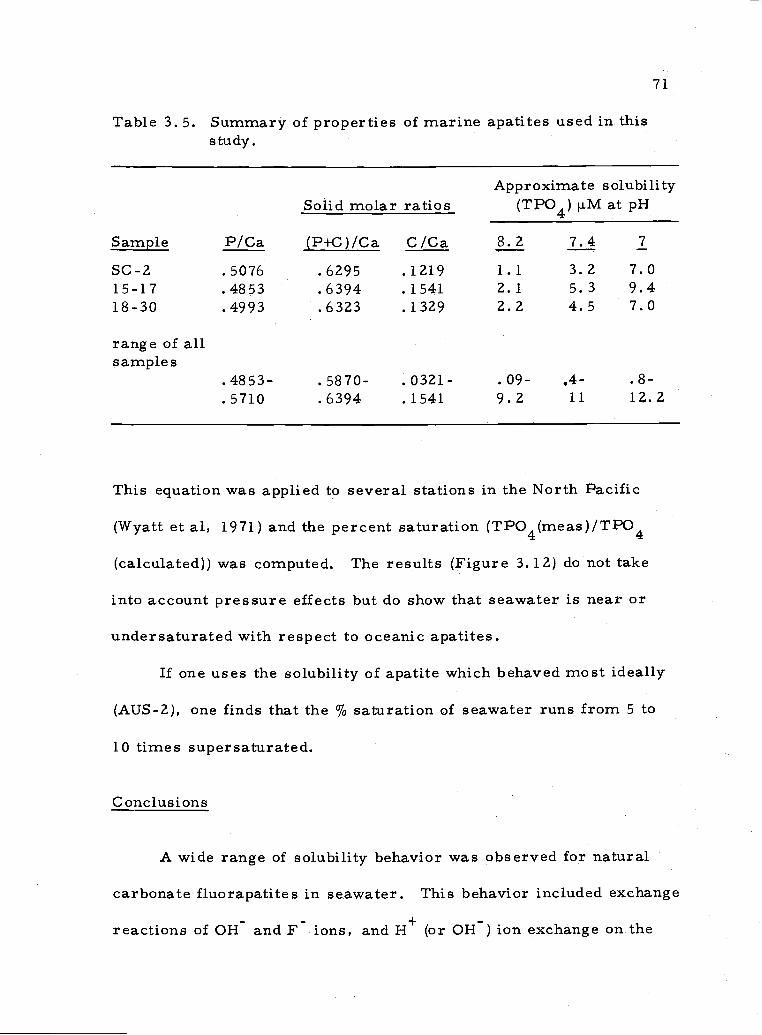
71
Table 3.5. Summary of properties of marine apatites used in thisstudy.
Approximate solubilitySolid molar ratios (TPO4) 1.j.M at pH
Sample P/Ca (P+C)/Ca C/Ca 8.2 7.4 7
SC-2 .5076 .6295 .1219 1.1 3.2 7.015-17 .4853 .6394 .1541 2.1 5.3 9.418-30 .4993 .6323 .1329 2.2 4.5 7.0
range of allsamples
.4853- .5870- .0321- .09- .4- .8-
.5710 .6394 .1541 9.2 11 1Z.2
This equation was applied to several stations in the North Pacific
(Wyatt et al, 1971) and the percent saturation (TPO4(meas)/TPO4
(calculated)) was computed. The results (Figure 3. 1 2) do not take
into account pressure effects but do show that seawater is near or
under saturated with respect to oceanic apatites.
if one uses the solubility of apatite which behaved most ideally
(AIJS-2), one finds that the % saturation of seawater runs from 5 to
10 times supersaturated.
Conclusions
A wide range of solubility behavior was observed for natural
carbonate fluorapatites in seawater. This behavior included exchange
reactions of 0H and F ions, and H+ (or 0H) ion exchange on the
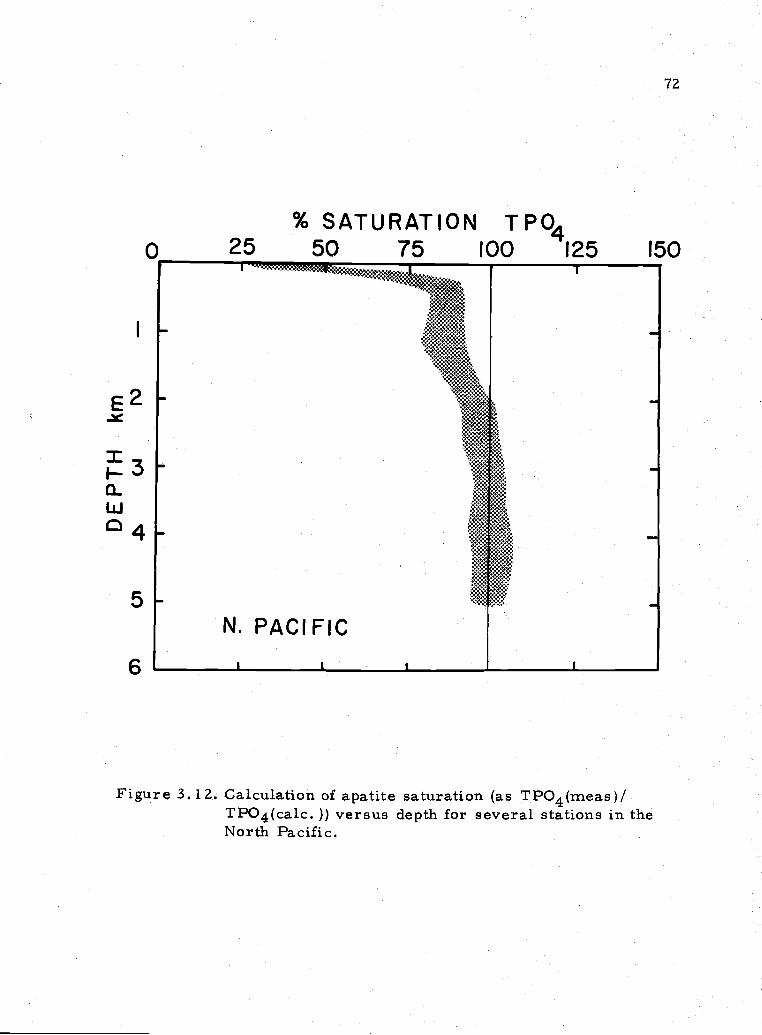
72
% SATURATION TPO4o 25 50 75 100 125 150
E2
=F-30w
1
I
N. PACIFIC
Figure 3.12. Calculation of apatite saturation (as TPO4(meas)/TPO4(calc.)) versus depth for several stations in theNorth Pacific.
73
apatite surface with seawater ions. It is postulated that one, or
possibly two, surface layers are involved when apatite reacts with
seawater. The first is a disorganized, highly soluble layer. The
second type of layer, possibly a reorganization of the first, is more
closely bound to the bulk apatite. The exact nature of this layer
could not be determined from the experimental data. The composition
of the bulk phase is apparently one factor in determining the composi-
tion of the surface layer. One characteristic of the surface layer is
its apparent HPO42 content. The relative kinetics of apatite versus
surface reactions may also be important in determining the steady-
state values of phosphate in seawater equilibrated with apatite.
Further studies on the properties of the apatite surface in
seawater and on the kinetics of apatite reactions in seawater would
obviously be very useful in predicting the behavior of phosphate in
seawater.
74
CHAPTER IV
FACTORS AFFECTING THE FORMATION OFMARINE PHOSPHORITES
Introduction
The unique circumstances which combine to bring about the
formation of sedimentary apatite in the oceans have long interested
oceanographers and geologists. Since the early 1800's scientists
have been describing and hypothesizing about various phosphatic
deposits and formations around the world. Guibrandsen (1969) gives
a concise historical review of the significant geological work done
during the 1800's and early 1900's, and references later papers (up
to 1969) which discuss apatite formation. This chapter will concen-
trate on the work done after the 19 30's and especially on recent find-.
ings pertaining to apatite formation. This will include some of my
recent experimental work. In addition to the review by Gulbrandsen,
Bushinskii (1966), Tooms, Summerhayes and Cronan (1969), and
Burnett (1974) have also discussed factors influencing phosphorite
formation. The terms apatite and phosphorite will be used inter-
changeably. Both of these terms will refer to francolite, the primary
phosphate mineral of phosphorites. Francolite is a carbonate fluor-
apatite, having a general composition of (Ca, Na)5 (PO4, CQ3)(F, OH).
In this chapter, it will be demonstrated that kinetic factors, in
75
addition to equilibrium considerations, are required for any compre-
hensive explanation of phosphorite formation. The emphasis here will
be on the chemistry of phosphorite formation, as others have pre-
sented comprehensive discussions of the geology of phosphorites.
Phosphorites are found only in limited areas of the present ocean
(Figure 4, 1). The primary locus of apatite deposits is the coastal
zone in the low to midlatitudes. Those are areas of high biological
activity associated with upwelling. The phosphorite facies studied on
land deposits also indicated that deposition took place in a near-shore,
shallow environment. Kazakov (1938) was the first to combine rele-
vant information on geology, oceanography, and the physical chemistry
of apatites into an overall theory of phosphorite deposition in the
oceans. His hypothesis has been the basis for much of the present
understanding of apatite forrnatior and has been widely accepted with
only minor modifications since it was presented. Kazakov recognized
the shallow, coastal nature of the deposits; he knew of the higher
dissolved phosphate content of deep ocean water; he also knew that
high pH and high temperature favored apatite precipitation. He con-
cluded that phosphorites were precipitated from seawater when cold,
phosphate-rich seawater was upwelled along the edge of a basin. As
the water upwelled, the temperature rose and the pH rose (due to loss
of GO2). This combination of relatively high temperature, high pH,
and high phosphate induced the precipitation of apatite. The area of
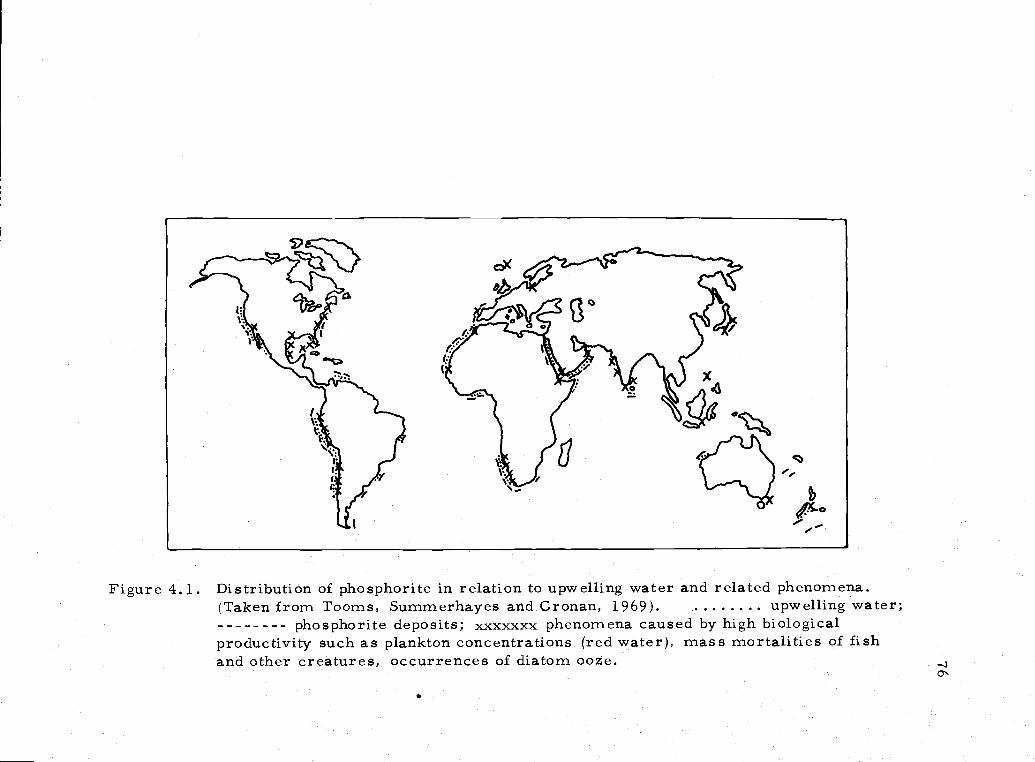
Figure 4. 1. Distribution of phosphorite in relation to upwelling water and related phenomena.(Taken from Tooms, Summerhayes and Cronan, 1969). ........ upwelling water;-------- phosphorite deposits; xxxxxxx phenomena caused by high biologicalproductivity such as plankton concentrations (red water), mass mortalities of fishand other creatures, occurrences of diatom ooze.
e
J
77
phosphate deposition moved as the sea level fluctuated over time. It
was a very elegant work which combined and explained many of the
observed features of sedimentary apatite deposits. It will be shown,
though, that Kazakov's main conclusion--that apatite is precipitated
from open seawater--is incorrect.
First, I wish to emphasize that a single theory will not explain
the several modes of occurrence of apatite. Rather, there will be
several broad features in common for the formation of all apatite
deposits, while details and mechanisms of apatite formation will vary
from place to place. Gulbrandsen (1969) summarizes the various types
of apatites and their geologic associations. These are reproduced in
Table 4. 1.
Basically, submarine apatite can be grouped into two main
categories--biogenic apatite (hard parts of organisms) and inorganic
apatite. Biogenic apatite occurs in sediments world wide, and rarely
accounts for more than a percent or so of the bulk sediment. Even in
small amounts, though, biogenic apatite can cause significant compo-
sitjonal variations in marine sediments (Dymond et al., 1973). Its
origin, however, is clear, and it is the formation of inorganic apatite
which has been the topic of much controversy.
The inorganic apatite may be subdivided into phosphate replace-
ment of existing structures, relict phosphorites (phosphorites either
not forming in the present ocean or reaching the ocean floor as
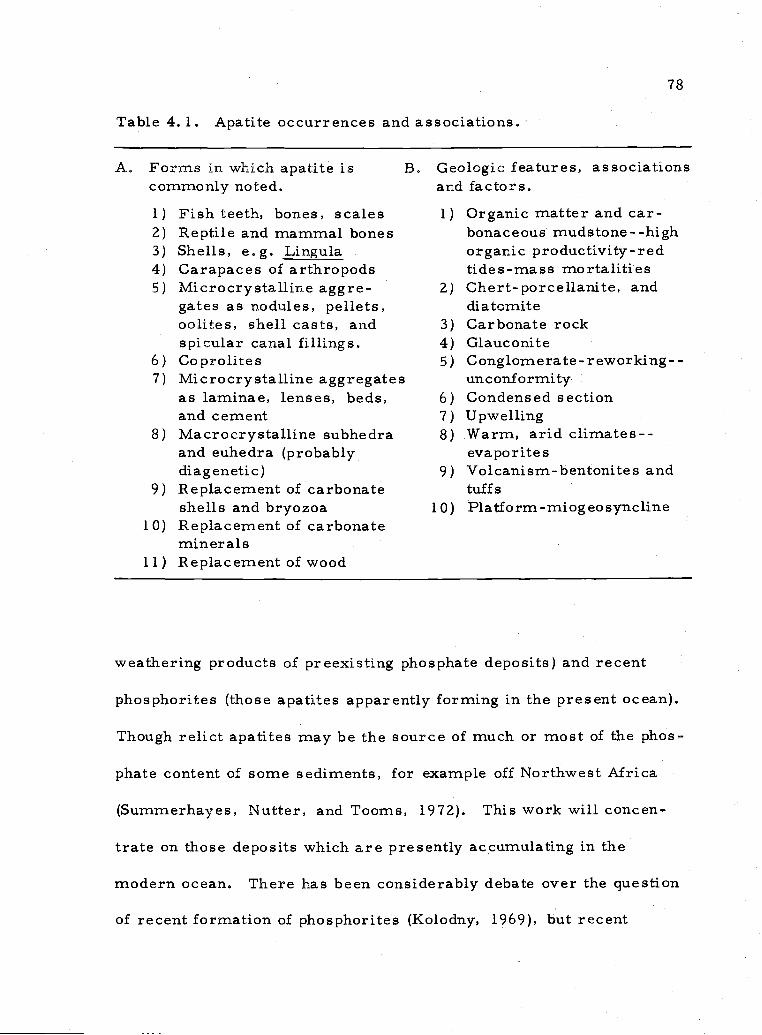
Table 4. 1. Apatite occurrences and associations.
A, Forms in which patite iscommonly noted.
1) Fish teeth, bones, scales2) Reptile and mammal bones3) Shells, e.g. Lingula4) Carapaces of arthropods5) Microcrystalline aggre-
gates as nodules, pellets,oolites, shell casts, andspicular canal fillings.
6) Coprolites7) Microcrystalline aggregates
as laminae, lenses, beds,and cement
8) Macrocrystalline subhedraand euhedra (probablydiagenetic)
9) Replacement of carbonateshells and bryozoa
10) Replacement of carbonateminerals
11) Replacement of wood
r11
B. Geologic features, as sociationsand factors.1) Organic matter and car-
bonaceous mudstone- -highorganic productivity'-redtides-mass mortalities
2) Chert-porceflanite, anddiatomite
3) Carbonate rock4) Glauconite5) Conglomerate-reworking- -
unconformity6) Condensed section7) Upwelling8) Warm, arid climates--
evaporites9) Volcanism-bentonites and
tuffs10) Platform-miogeosyncline
weathering products of preexisting phosphate deposits) and recent
phosphorites (those apatites apparently forming in the present ocean).
Though relict apatites may be the source of much or most of the phos-
phate content of some sediments, for example off Northwest Africa
(Summerhayes, Nutter, and Tooms, 1972). This work will concen-
trate on those deposits which are presently accumulating in the
modern ocean. There has been considerably debate over the question
of recent formation of phosphorites (Kolodny, 1969), but recent
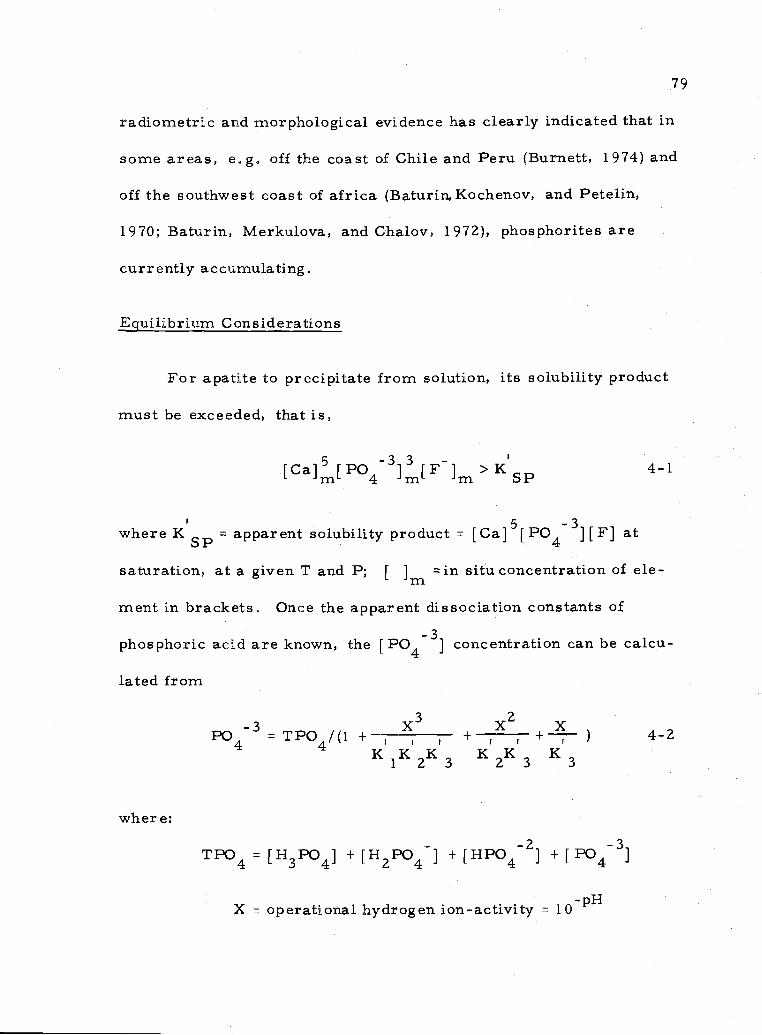
79
radiometric and morphological evidence has clearly indicated that in
some areas, e.g. off the coast of Chile and Peru (Burnett, 1974) and
off the southwest coast of africa (Baturin,Kochenov, and Petelin,
1970; Baturin, Merkulova, and Cha].ov, 1972), phosphorites are
currently accumulating.
Ecuilibrium Considerations
For apatite to precipitate from solution, its solubility product
must be exceeded, that is,
rCal5 [P0 1F] >Kp 4-1I -'mt 4 -'mi- m
where K5p = apparent solubility product = [Ca]5[PO4 3][F] at
saturation, at a given T and P; [ ] =in situ concentra.tion of ele-m
ment in brackets. Once the apparent dissociation constants of
phosphoric acid are known, the [P043] concentration can be calcu-
lated from
where:
TPO4/(1 + + +4 ) 4-2K1K2K3 K2K3 K3
TPO4 = [H3PO4] + [H2PO4] + [HPO4 2] [P03]
X = operational hydrogen ion-activity
K. = ith apparent dissociation constant of H3PO4.
Equation 4-2 shows that the quantity [PO4 ] is increased by either
an increase in the total phosphate, TPO4, or by an increase in pH
(decrease in X). Given equations 4-1 and 4-2 several conditions
which will increase the ion-product of apatite beyond its solubility
product can be listed. These are:
1. increase total dissolved phosphate,
2. increase pH,+2
3. increase Ca , and
4. increase F.
The K as described above is valid only for seawater of
normal composition since it is measured in normal seawater. Inter-
stitial waters can have its relative major-ion composition significantly
altered from that of seawater. Deviations from normal composition
will set different conditions for apatite precipitation. This can be
illustrated using an ion-pairing model (Garrels and Thompson, 1962;
Pytkowicz and Hawley, 1974), Ben-Yaakov and Goldhaber (1973)
discuss how deviations from normal composition affect the carbonate
system.
The total concentration of an ion in solution may be expressed
as the sum of its free plus ion-paired concentrations. The relevant
sums in this case(not including carbonate) are:
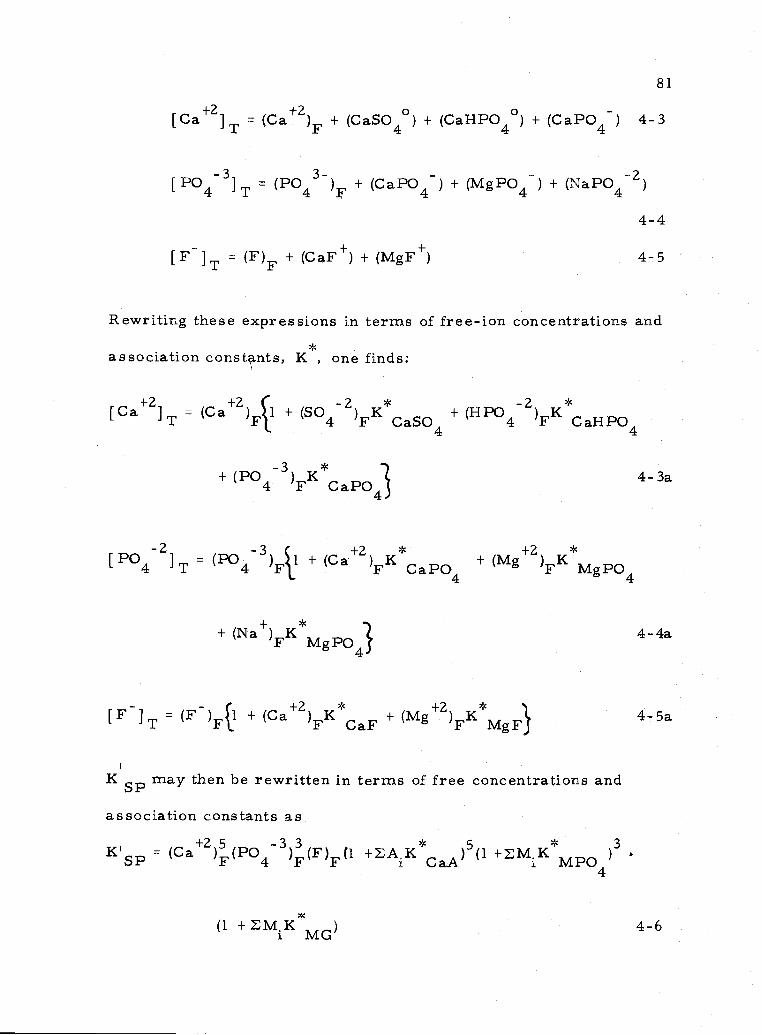
[Ca]T = (Ca+Z)F + (CaSO40) + (CaHPO40) + (CaPO4) 4-3
[P043]T (P043)F + (CaPO4 ) + (MgPO4 ) + (NaPO42)
[F]T (F)F + (CaF+) + (MgF+)
4-4
4-5
Rewriting these expressions in terms of free-ion concentrations and"-
association constnts, K, one finds:
[Ca+Z]T - (Ca+2)F1 + (S02)K*CSO + (HPOHPO
+ (PO3)FK*CpO 4-3a
[P042]T + (Ca+Z)FK*CpO +
+ 4-4a
[FiT = (F)F1 + (Ca+Z)FK F +(Mg+Z)K*
4-5a
K may then be rewritten in terms of free concentrations and
association constants as
= (Ca+Z)(P043)(F)F(1 +AiK*CaA)S(1 +MjK*Mpo )3
(1 +M.K*MG) 4-6
From these equations, one can see that (Mg+Z) and (SO42) concen-
trations will affect the free concentrations of Ca , PO4 and F
This means that the concentration of Mg+Z and, to a lesser extent,
SO42 can affect the equilibrium conditions under which apatite will
precipitate. xamination of equations 4-2 and 4-4a shows that the-3 +2 +2[PO4 ] concentration is a function of Mg , Ca , and the apparent
constants of phosphoric acid. The apparent constants, in turn, are
also dependent upon Mg2 and Ca+Z. One can calculate this depen-
dence using the association constants measured in Chapter II of this
work (Figure 4. 2). The changes in the apparent dissociation constants
can be used along with the simplifying assumption that (Ca)F/(Ca)T is
constant to show how the TPO4 in equilibrium with apatite at constant
F (total) varies with changes in Ca+Z and Mg+2 concentrations
(Table 4.2).
Table 4, 2. TPO4 (x 1 O) M/l in equilibrium with apatite for varying
levels ofCa+ZandMg+Z. PK5p(25°) = 37.64. FT =
8OM, pH = 8.0*.
CaFNF 0 .01 .02 .03 .04 .05
.001 37.3 40.5 43.6 46.7 49.6 52.4
.002 12.1 13.0 14.0 15.0 15.9 16.7
.005 2.8 3.0 3.2 3.4 3.6 3.8.010 .98 1.04 1.10 1.16 1.22 1.27.015 .55 .57 .60 .63 .66 .69
* Association constants from Elgquist (1970), Kester and Pytkowicz(1969) and Chapter II of this work.
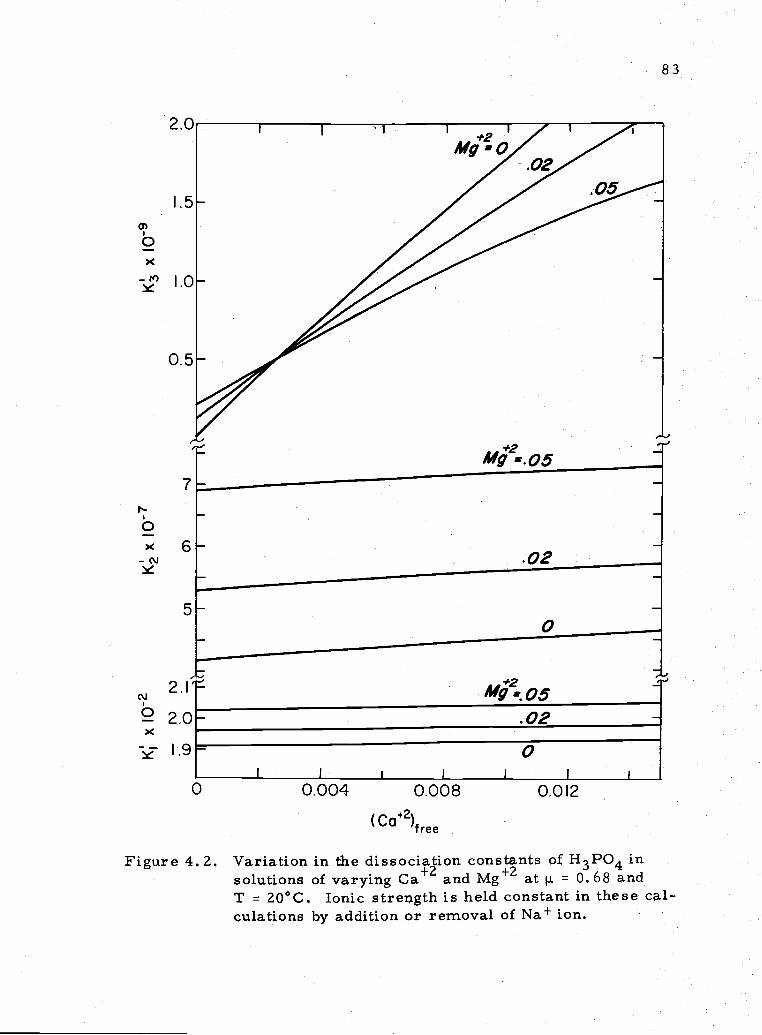
2.0
I';I .
0)
bxrd)
0.
71b)< 6
('J
5
2.1
22.0
E 1.9
*21
Mg-C.02
.05
12
iwgQ5.02
I
0
83
I
0 0.004 0.008 0.0 12
(Ca2)free
Figure 4. 2. Variation in the dissociation constants o H P0 insolutions of varying Ca and Mg at p. 0. 68 andT = 20°C. Ionic strength is held constant in these cal-culations by addition or removal of Na+ ion.
Table 4. 2 shows that the net effect of reducing the (Mg+Z) in solution
is to decrease the solubility of apatite in terms of TPO4, This net
effect due to lower Mg+Z ion zepresents a balance between the reduc-
tion in (TPO4)eq due to decreased ion-pairing (Eq. 4-4) and an
increase in (TPO ) due to the smaller dissociation constants of4 eq
H P0 in media with lower Mg+2. The increase in (TPO ) would3 4 4eq
come from a change in (P043)T (Eq. 4-2); a rediction in (TPO4)eq
a.rises from a change in °4F (Eq. 4-4a). Of course, these two
effects cannot be separated or operate independently of each other.
I present these two effects to contrast to the case where an acid dis-
sociation is unaffected, for example the F species. The change in
solubility is a direct function of the amount of F which is ion-paired
(Eq. 4-5a). Because Ca+Z ion enters into the computation of the solu-
bility product as (Ca+Z)5, changes in its concentration cause the most
significant changes in the equilibrium TPO4. In addition to its effect
on TPO4 as a constituent ion of apatite (mass-action principle), Ca+Z
ion also acts to change (TPO4)eq by the same mechanisms as+2described for Mg . Changes in the major ion composition of sea-
water can alter the TPO4 in equilibrium with apatite in three ways:
a) the direct effect of ion-pairing on the free-ion concentration of a
constituent ion (Eq. 4-5a); b) the direct effect plus the indirect effect
of ion-pairing on the dissociation of H3PO4 (Eq. 4-4a); and c) the
direct effect of Ca+2 ion on the solubility according to the solubility
product (Eq. 4-1).
The above conclusions allow additional equilibrium considerations
to be added to the list of factors which will promote apatite
precipitation.
5. Factors which reduce the (Mg) ion concentration and do
not reduce the (Ca)F ion concentration significantly.
6. Indirect (ion-pairing) reactions which will increase the+2 -3(Ca F or (PO4
F concentrations.
Temperature is another important equilibrium factor which
must be considered. The experiments described in Chapter III showed
that a temperature increase of 15°C (10-25°C) could decrease the
solubility of apatite by up to 50%. Assuming that the solubility is a
linear function of temperature, then approximately a 1. 50 C tempera-
ture increase would decrease the solubility of apatite as much as a
decrease of .01 Mu of Mg+Z,
The effect of pressure on apatite solubility has not yet been
measured. Pressure effects would play only a very minor role in
phosphate deposition, since phosphorites are formed in shallow
waters. If apatite behaves as other minerals, then an increase in
pressure will increase the solubility of apatite. It is possible that
pressure effects are dominant in determining the saturation state
of deep ocean waters with respect to apatite.
The relative importance of the factors mentioned above can be

compared by estimating the change in that factor required to change
the TPO4 in equilibrium with apatite by a given percentage (Table 4. 3).
Figure 4. 3 illustrates the changes in ideal apatite solubility which can
be caused by compositional changes and changes in pH and tempera-
ture. A factor of 5 increase in F decreases the equilibrium solu-
bility by approximately 40%; a factor of 5 decrease in Mg decreases
the solubility by 20-25%. The solubility is most sensitive to
Table 4. 3. Approximate changes in various factors required todecrease TPO4 in equilibrium with apatite by 10%.
Approximate Change Required % Change fromto Decrease Equilibrium Normal Seawater
Factor TPO4 by 10% Composition
1) Ca+2 + .0008 Mu +8%
2) F + 25 ElM/i + 35%
3) pH + .04 pH units 9%
4) Mg .02 Mu 35%
5) Temperature + 3°C 50% **
6) Pressure Unknown
7) SO42 - .02 Mu * - 80%
* Calculated from ion-pairing model of Pytkowicz and Hawley (1974).** Estimated from maximum temperature change between glacial and
interglacial periods (J. Thiede, pers. comm. ).
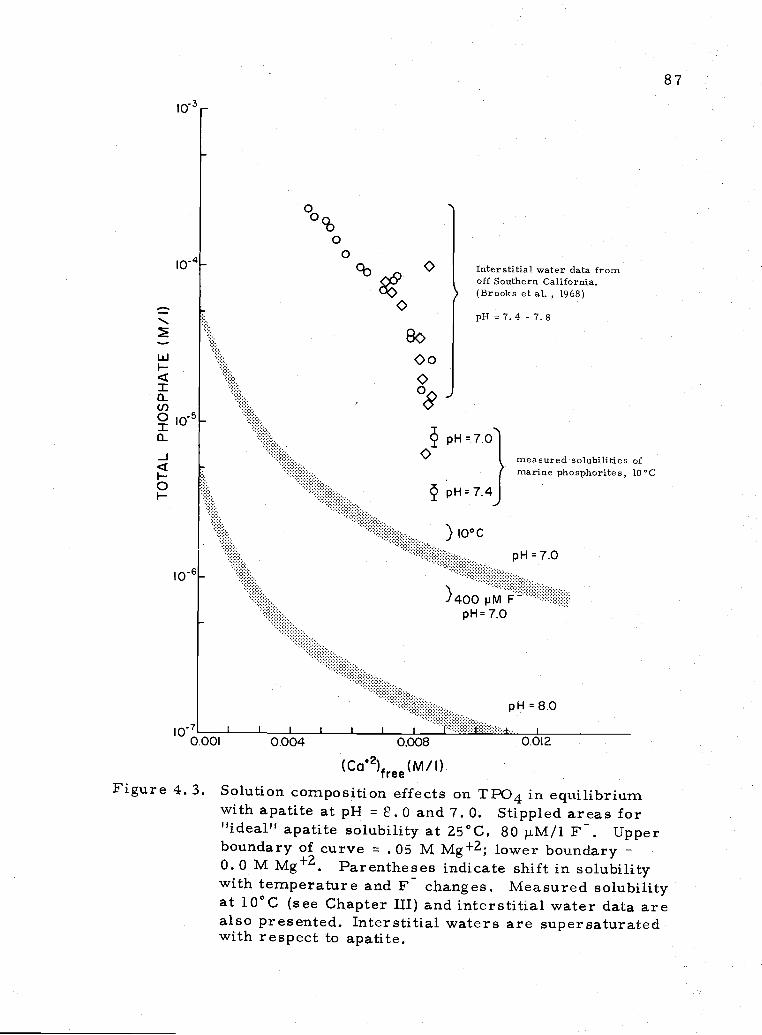
i o
00
c 0 Interstitial water data fromoff Southern California.
00 (Brooks et al. , 1968)0- .- pIl=7.4-7.8
000I f.f.:.,
U)o i-
pH70')0 measured so1ubiljties of
(rnari.ne phosphorLtes 10 C
PH74J
) io°c
pH 70106
) 400 pMpH=7.0
pH8.0
i I I .1 I
0.001 0.004 0.008 0.012
(CO2)free (M / I)
Figure 4. 3. Solution composition effects on TPO4 in equilibriumwith apatite at pH = E. 0 and 7.0. Stippled areas forIidealU apatite solubility at 25°C, 80 jiM/l F. Upper
boundary of curve = .05 M Mg+2; lower boundary0. 0 M Mg2. Parentheses indicate shift in solubilitywith temperature and F changes. Measured solubilityat 10°C (see Chapter III) and interstitial water data arealso presented. Interstitial waters are supersaturatedwith respect to apatite.
The calculations above assume that the solution is in equilibrium
with an ideal apatite whose solubility can be represented by the ion-
product [Ca]5[P043]3[F]. Changes in the composition of the bulk
apatite due to substitution reactions will alter the computed saturation
state by a factor approximately equal to the change in the activity of
the solid. No quantitative information is available as yet to determine
the effect of heteroionic substitution on the activity of apatite.
The experimental evidence presented in the previous chapter
suggested that a surface reaction controlled, or moderated, the solu-
bility of apatite, at least over short time periods. The surface
reaction was characterized by a constant product [HPO4]X[PO4]Y
rather than by { P043] and by a variable rather than constant F
content. No information was obtained on the Ca+Z content of the
surface. Thus, the effect on the solubility due to changes in solution
composition cannot be quantitatively estimated.
Gulbrandsen (1969) discusses the equilibria of the apatite-
calcite-seawater system and shows, to a first approximation, the
factors which will promote precipitation of either apatite or calcite.
He notes that the calcite equilibria should control the Ca in solution,
making apatite equilibrium dependent on it. Replacement of calcite
by apatite has been shown to be a widespread mechanism for producing
phosphorite (D'Anglegan, 1968; Ames, 1959; Parker and Siesser,
1972). The ideal equilibrium which needs to be considered is:
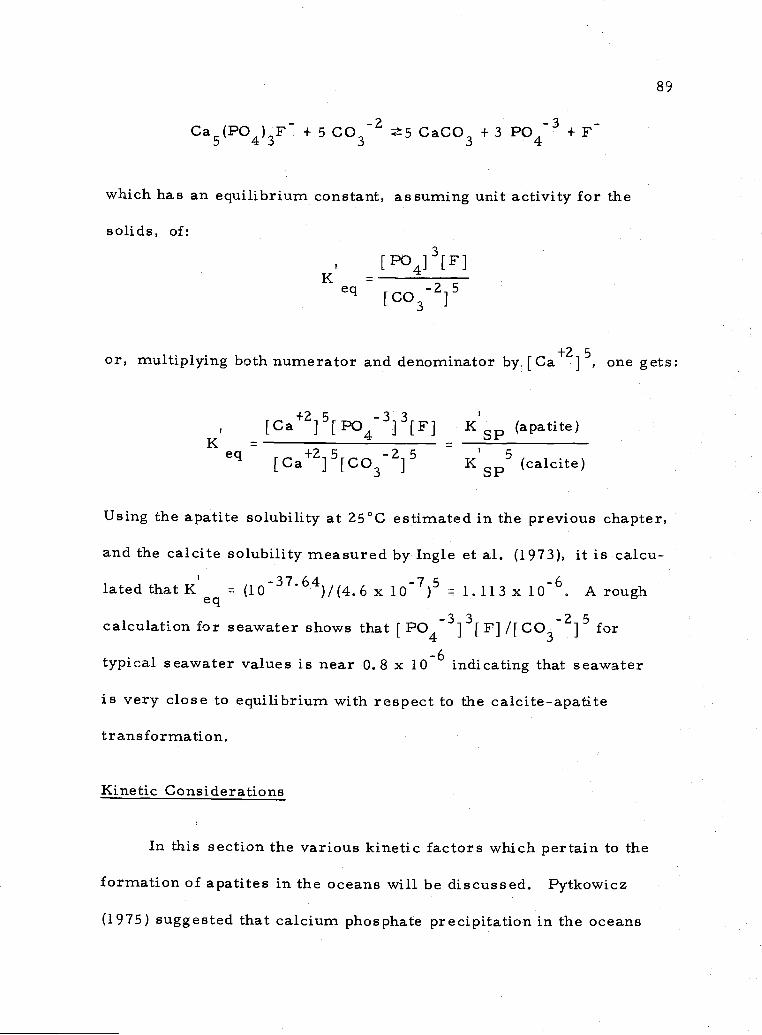
Ca5(PO4)3F + 5 CO32 5 CaCO3 + 3 P043 + F
which has an equilibrium constant, assuming unit activity for the
solids, of:
[PO4]3FK eq {CO3]5
or, multiplying both numerator and denominator by [Ca+Z]S, one gets:
K[Ca+Z}S[PO4 3J3[F] K8(apatite)
q [Ca ] [CO3 ] K (calcite)
using the apatite solubility at 25°C estimated in the previous chapter,
and the calcite solubility measured by Ingle et al. (1973), it is calcu-
lated that Keq = 037.64(4.6 x lO) = 1.113 x 1O6. A rough
calculation for seawater shows that [PO43]3[F /[CO3 for
typical seawater values is near 0.8 x lo_6 indicating that seawater
is very close to equilibrium with respect to the calcite-apatite
transformation.
Kinetic Considerations
In this section the various kinetic factors which pertain to the
formation of apatites in the oceans will be discussed. Pytkowicz
(1975) suggested that calcium phosphate precipitation in the oceans
may behave in a similar manner to calcium carbonate. That is, the
time of (homogeneous) nucleation of calcium carbonate in surface
waters at that present state of supersaturation is very much longer
than the replacement time of these waters. Experiments were per-
formed to measure the time of onset of calcium phosphate precipi-
tation. Samples were adjusted to a specified total phosphate concen-
tration, and the pH was adjusted with a small quantity of sodium
borate solution. The two series of sealed vials, one at pH 8.2 and
the other at pH 7. 6, were observed, and the time of appearance of
a visible precipitate was recorded. The results are shown in Figure
4.4. If the data can be extrapolated to low concentrations, they
indicate that precipitation at 30 1j.M/l of phosphate would take on the
order of 2 x 10⁶ years at pH = 8.2 and ' 2 x years at pH 7.6.
Therefore, inorganic homogeneous precipitation of a calcium phos-
phate from normal seawater is not a viable alternative for phosphorite
formation.
Larger volumes of seawater treated in a similar manner to the
samples just described in order to obtain a larger amount of
precipitate. One sample was precipitated from a carbonate-free
seawater, and two other seawater samples were spiked to obtain 5
and 10 mM/i of fluoride. The precipitate which was obtained was
kept in contact with the supernatant solution for 3-5 days. In all
cases, the precipitate was found to be amorphous. The high F
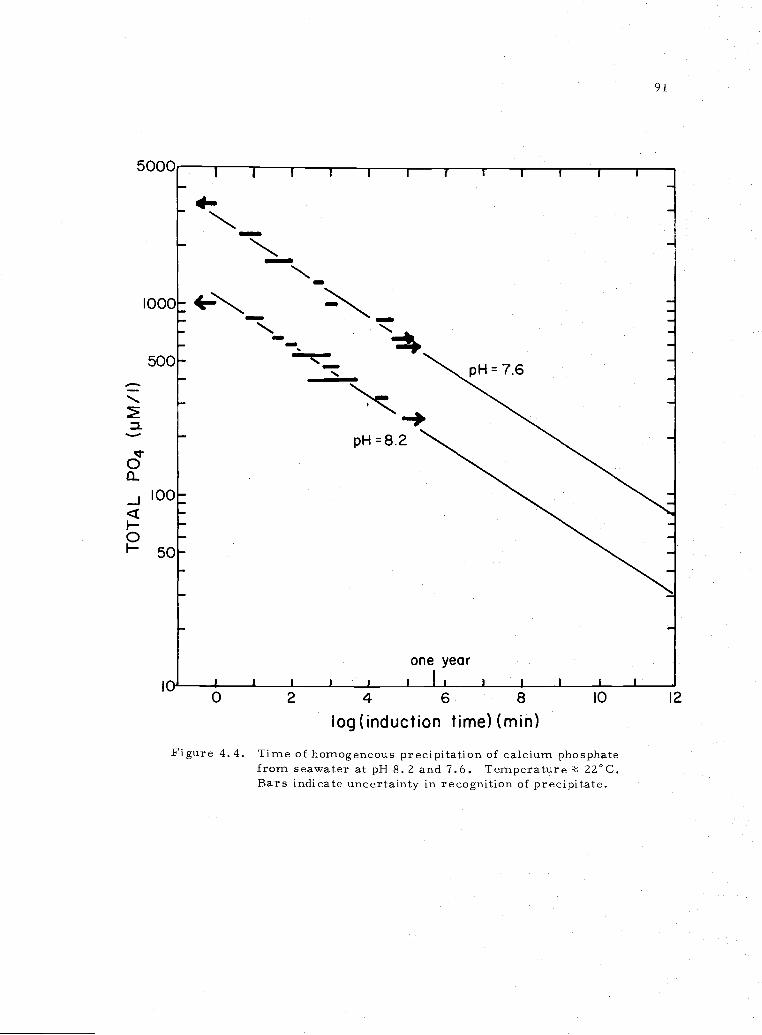
a.
c::1
I-
CI-
91
0 2 4 6 8 10
Iog(induction time) (mm)
Figure 4. 4. Time of homogeneous precipitation of calcium phosphatefrom seawater at pH 8.2 and 7.6. Temperature 22°C.Bars indicate uncertainty in recognition of precipitate.
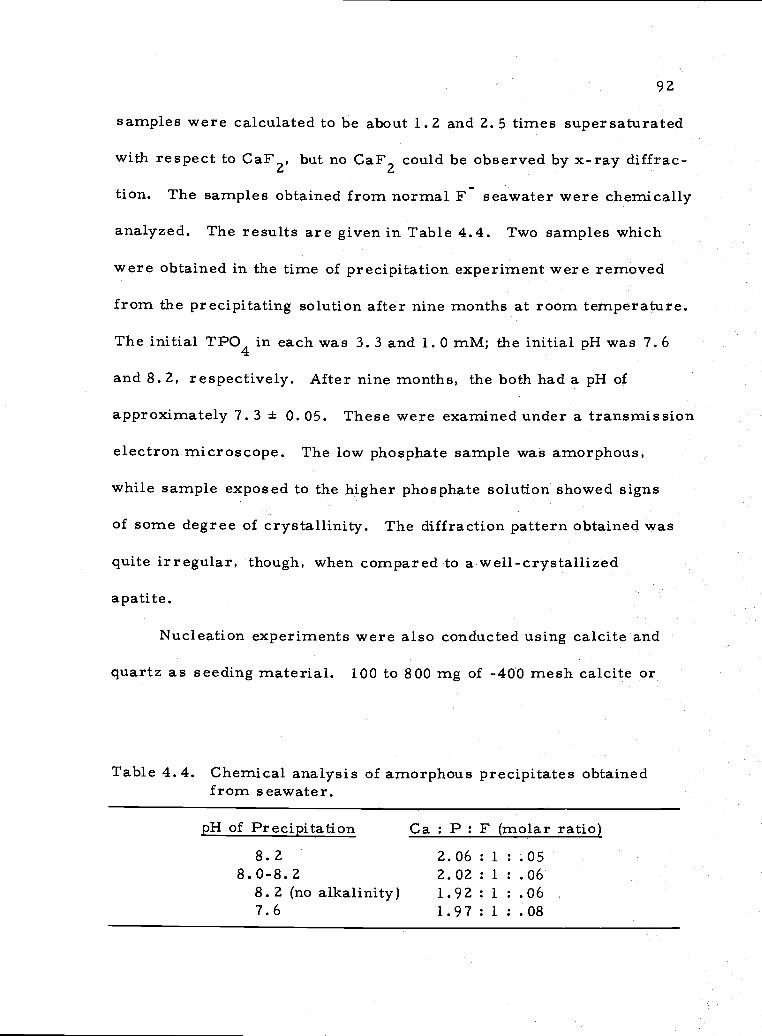
92
samples were calculated to be about 1. 2 and 2. 5 times supersaturated
with respect to CaF2, but no CaF2 could be observed by x-ray diffrac-
tion. The samples obtained from normal F seawater were chemically
analyzed. The results are given in Table 4.4. Two samples which
were obtained in the time of precipitation experiment were removed
from the precipitating solution after nine months at room temperature.
The initial TPO4 in each was 3.3 and 1.0 mM; the initial pH was 7.6
and 8. 2, respectively. After nine months, the both had a pH of
approximately 7. 3 ± 0. 05. These were examined under a transmission
electron microscope. The low phosphate sample was amorphous,
while sample exposed to the higher phosphate solution showed signs
of some degree of crystallinity. The diffraction pattern obtained was
quite irregular, though, when compared to awell-crystallized
apatite.
Nucleation experiments were also conducted using calcite and
quartz as seeding material. 100 to 800 mg of -400 mesh calcite or
Table 4. 4. Chemical analysis of amorphous precipitates obtainedfrom seawater.
pH of Precipitation Ca : P : F (molar ratio)8.2 2.06 : 1 .05
8.0-8.2 2.02 : 1 .068.2 (no alkalinity) 1.92 : 1 .067.6 1.97 : 1 : .08
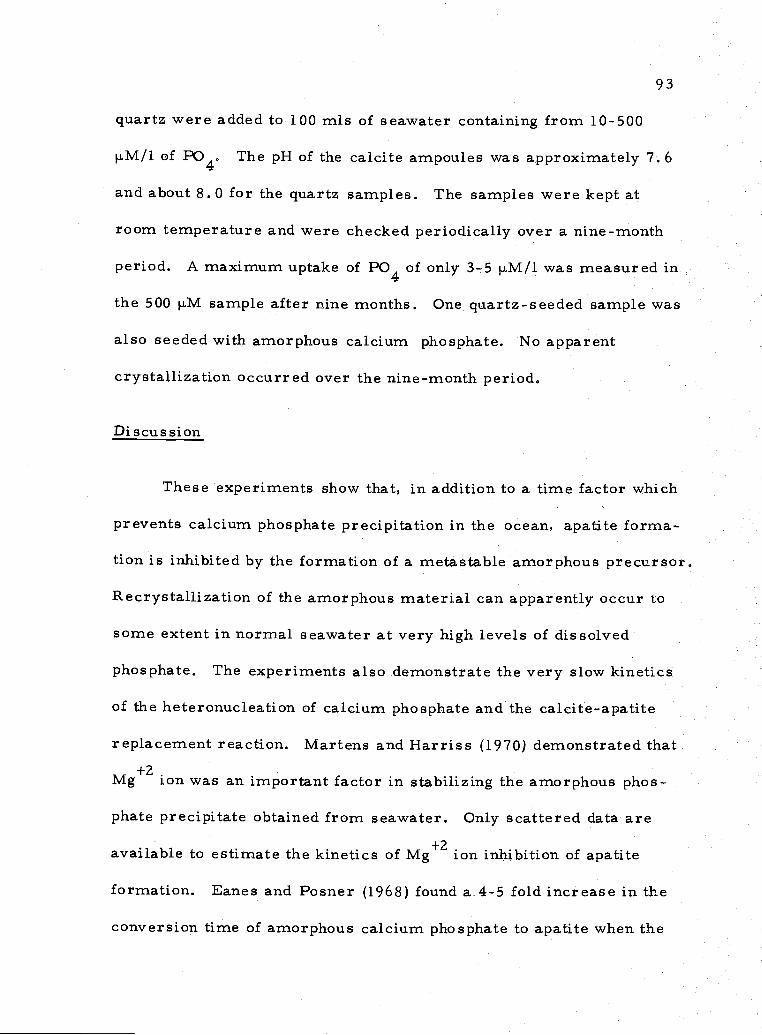
93
quartz were added to 100 mis of seawater containing from 10-500
p.M/i of PO4. The pH of the calcite ampoules was approximately 7. 6
and about 8.0 for the quartz samples. The samples were kept at
room temperature and were checked periodically over a nine-month
period. A maximum uptake of PO4 of only 3-5 p.M/i was measured in
the 500 p.M sample after nine months. One quartz-seeded sample was
also seeded with amorphous calcium phosphate. No apparent
crystallization occurred over the nine-month period.
Discussion
These experiments show that, in addition to a time factor which
prevents calcium phosphate precipitation in the ocean, apatite forma..
tion is inhibited by the formation of a metastable amorphous precursor.
Recrystallization of the amorphous material can apparently occur to
some extent in normal seawater at very high levels of dissolved
phosphate. The experiments also demonstrate the very slow kinetics
of the heteronucleation of calcium phosphate and the calcite-apatite
replacement reaction. Martens and Harriss (1970) demonstrated that
Mg ion was an important factor in stabilizing the amorphous phos-
phate precipitate obtained from seawater. Only scattered data are
available to estimate the kinetics of Mg ion inhibition of apatite
formation. Eanes and Posner (1968) found a 4-5 fold increase in the
conversion time of amorphous calcium phosphate to apatite when the
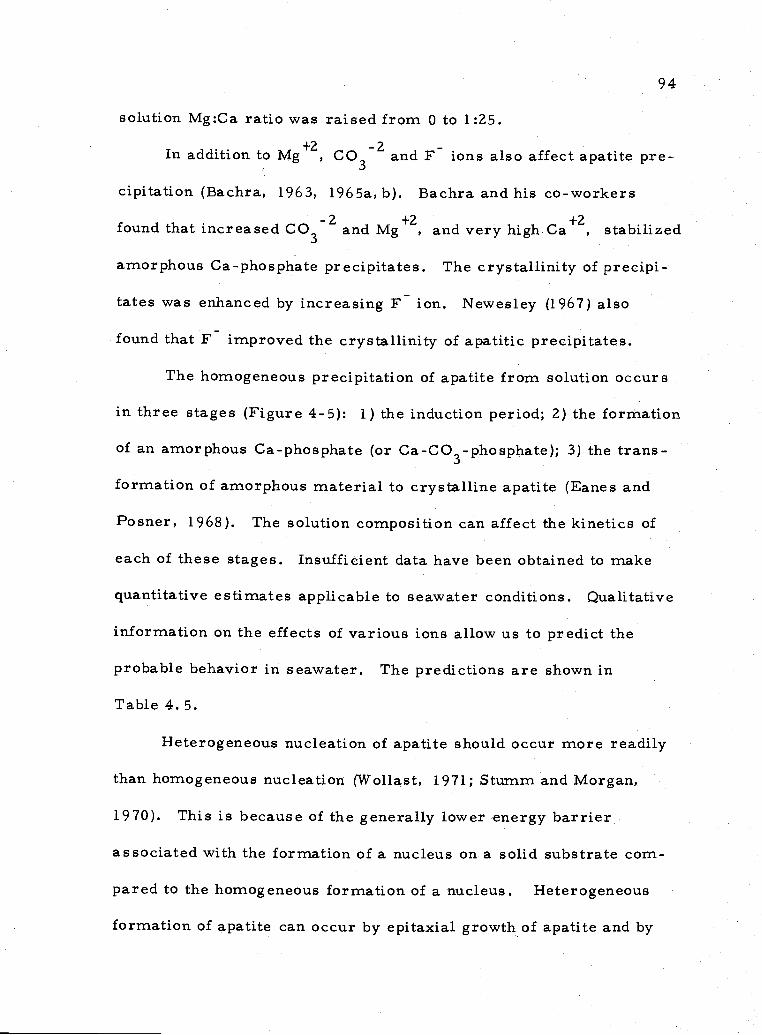
94
solution Mg:Ca ratio was raised from 0 to 1:25.
In addition to Mg+Z, C032 and F ions also affect apatite pre-
cipitation (Bachra, 1963, 1965a, b). Bachra and his co-workers
found that increased CO32 and Mg+Z, and very high Ca+Z, stabilized
amorphous Ca-phosphate precipitates. The crystallinity of precipi-
tates was enhanced byincreasing F ion. Newesley (1967) also
found that F improved the crystallinity of apatitic precipitates.
The homogeneous precipitation of apatite from solution occurs
in three stages (Figure 4-5): 1) the induction period; 2) the formation
of an amorphous Ca-phosphate (or Ca-0O3-phosphate); 3) the trans-
formation of amorphous material to crystalline apatite (Eanes and
Posner, 1968). The solution composition can affect the kinetics of
each of these stages. Insufficient data have been obtained to make
quantitative estimates applicable to seawater conditions. Qualitative
information on the effects of various ions allow us to predict the
probable behavior in seawater. The predictions are shown in
Table 4.5.
Heterogeneous nucleation of apatite should occur more readily
than homogeneous nucleation (Wollast, 1971; Stumm and Morgan,
1970). This is because of the generally lower energy barrier
associated with the formation of a nucleus on a solid substrate corn-
pared to the homogeneous formation of a nucleus. Heterogeneous
formation of apatite can occur by epitaxial growth of apatite and by
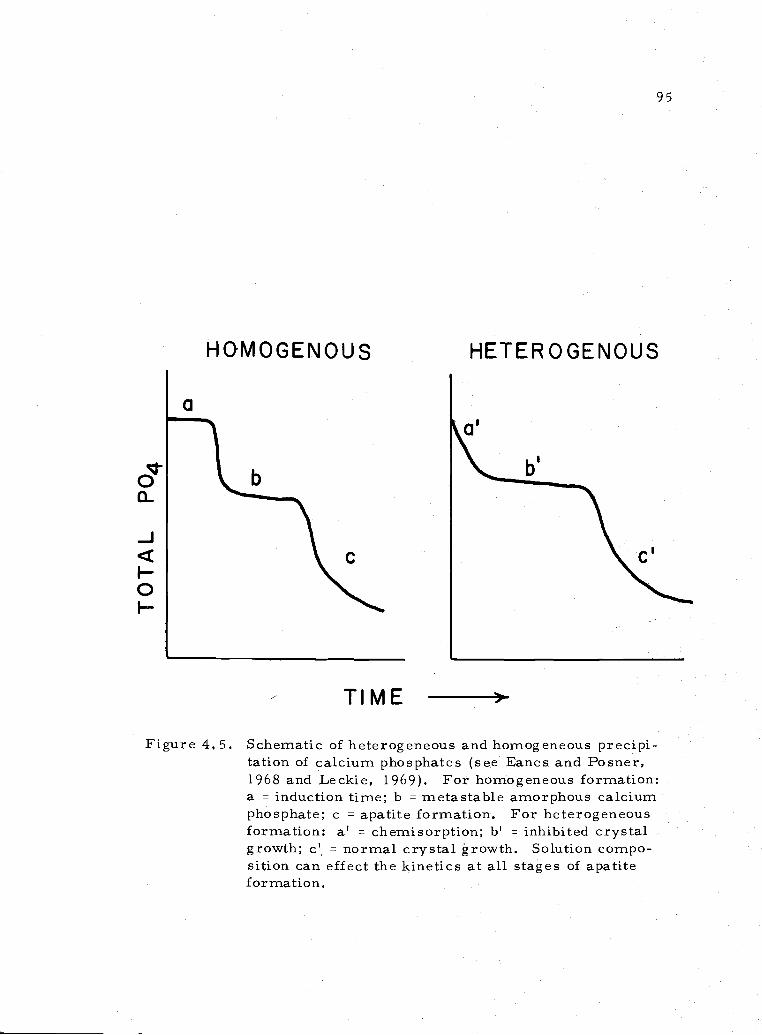
-J
I-0F-
HOMOGENOU3
TIME
95
HETEROGENOUS
Figure 4.5. Schematic of heterogeneous and homogeneous precipi-tation of calcium phosphates (see Eanes and Posner,1968 and Leckie, 1969). For homogeneous formation:a = induction time; b = metastable amorphous calciumphosphate; c = apatite formation. For heterogeneousformation: aT = chemisorption; b' = inhibited crystalgrowth; c' normal crystal growth. Solution compo-sition can effect the kinetics at all stages of apatiteformation.
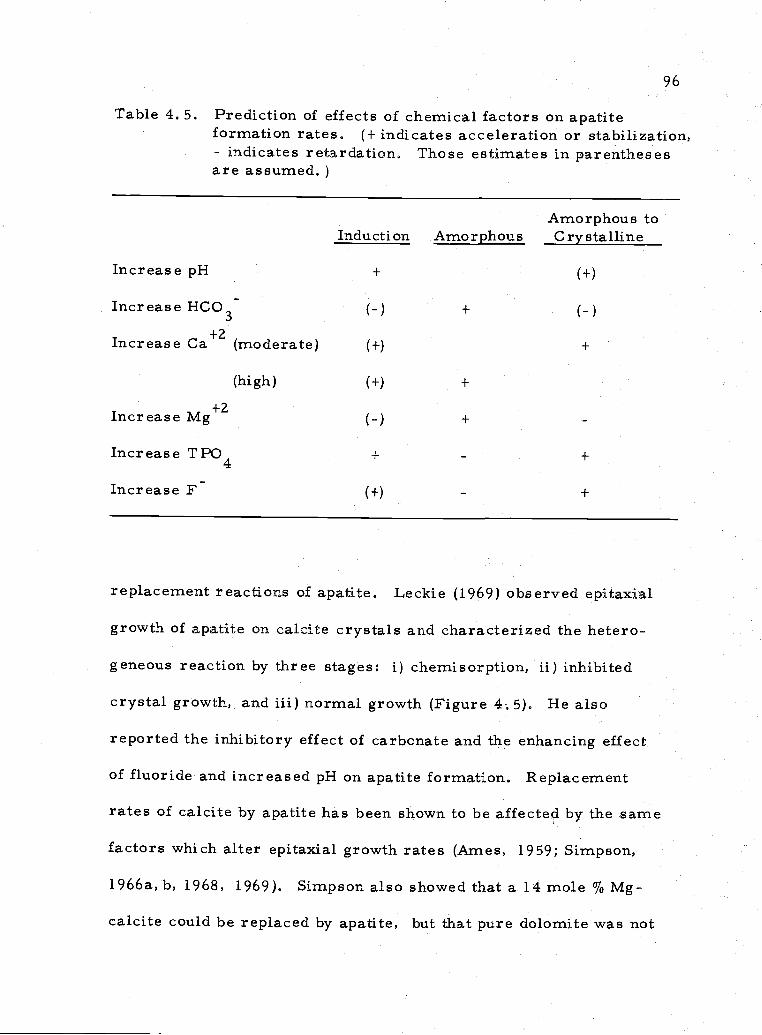
96
Table 4. 5. Prediction of effects of chemical factors on apatiteformation rates. (+ indicates acceleration or stabilization,
indicates retardation, Those estimates in parenthesesare assumed.)
Amorphous toInduction Amorphous Crystalline
Increase pH + (+)
Increase HCO3 (-) + (-)
+2Increase Ca (moderate) (+) +
(high) (+) +
+2Increase Mg (-) +
Increase TPO4 + - +
Increase F (i-) - +
replacement reactions of apatite. Leckie (1969) observed epitaxial
growth of apatite on calcite crystals and characterized the hetero-
geneous reaction by three stages: i) chemisorption, ii) inhibited
crystal growth, and iii) normal growth (Figure 4. 5). He also
reported the inhibitory effect of carbonate and the enhancing effect
of fluoride and increased pH on apatite formation. Replacement
rates of calcite by apatite has been shown to be affected by the same
factors which alter epitaxial growth rates (Ames, 1959; Simpson,
1966a, b, 1968, 1969), Simpson also showed that a 14 mole % Mg-
calcite could be replaced by apatite, but that pure dolomite was not
97
replaced. Simpson further demonstrated that the fluorine content of
replaced calcites varied with the F content of the replacing solution.
To obtain fluorapatites similar to those found in the ocean, fluoride
levels significantly greater than those found in seawater were needed.
From this observation he concluded that apatites were metastable
with respect to normal ocean water.
Chemical factors which affect the formation kinetics of apatite
are, as expected, close to those which alter apatite equilibria. The
link between kinetics and equilibria is, however, an uncertain one,
It should be kept in mind, too, that the factors affecting apatite forma-
tion are closely linked. For example an increase in pH favors apatite
formation, but the effect of fluoride is greatest at lower pH' s
(Leckie, 1969). What then is the optimum combination of F and pH,
given oceanic conditions, for apatite formation?
Oceanographic conditions relating to pho sphorite formation
Most often noted in the literature is the association of areas of
oceanic upwelling with phosphorite deposits. Some authors have
explained this association using modifications of the Kazakov hypothe-
sis presented earlier. Mansfield (1940) focused on the effect of
increased volcanic activity in increasing the F of seawater, thus
decreasing apatite solubility. It has been shown, however, that
direct precipitation from a supersaturated water column is ruled out
98
by kinetic factors. There must be other factors associated with
upwelling areas which play an important rolein phosphate deposition.
Upwelling areas are regions of extremely high primary produc-
tivity. This is a direct consequence of the input of high nutrient
waters to the photic zone. The continual supply of phosphate is used
by organisms in photosynthesis. The oxidation and decay of the
organisms occurs to some extent in the water column but a considera
ble portion of the oxidation occurs after the dead organisms settle to
the bottom either directly or in fecal pellets. Bottom regeneration
of nutrients has been reported off the Oregon coast (Atlas, 1973;
Gordon, 1973) and off the coast of Southwest Africa (Calvert and Price,
1971). It may be typical for other upwelling areas as well, such as
in the Peru-Chile region. Such regeneration would serve to further
reduce the oxygen content of the waters which bathe the sediments in
the upwelling area. Even in the absence of local bottom regeneration,
the waters covering the sediments are usually quite low in dissolved
oxygen (< 1-2 ml Oz/l). This feature makes upwelling areas similar
to stagnant basins, which have been proposed as major areas for
phosphate deposition by some authors (Blackwelder, 1916; Brooks,
Presley and Kaplan, 1968). Sholkovitz (1973) suggests that the
dissolved oxygen content of the water overlying sediments plays a
significant role in determining early sediment diagenesis and inter-
stitial waters where apatite must be forming.
99
The shallow depths associated with coastal upwelling areas can
result in significant warming of the water, which would tend to
promote apatite formation. In addition, shallow areas of the modern
ocean would undergo significant temperature fluctuations due to the
many changes in sea level over geologic history. Gulbrandsen (1969)
discusses the temperature effect, and Bushinskii (1964, 1966)
presents geological evidence for sea level changes associated with
phosphorite formation. Burnett (1974) also correlates warming
periods with periods of phosphate deposition.
There is a notable lack of data on the interstitial water chemis-
try in areas of phosphorite formation. Relevant studies are those of
Brooks et al. (1968), Sholkovitz (1973), Baturin (1972), Baturin and
Shishkina (1973), and Shishkjna, Baturin, and Bykova (1972). A
feature in common to all of these studies was the dramatic increase
in dissolved phosphate in the interstitial fluids. Concentrations
ranged as high as several hundred 1j.M PO4/l, compared to 3 }J.M in
the water column. Fluorine also was found to be significantly enriched
in the interstitial waters of upwelling areas Shishkina et al found
interstitial F concentrations of up to 580 .i.M. This is near or above
saturation with respect to CaF2. Normal sea water contains 80
- +2 +2FiM/l of F . Depletions of Ca and Mg were observed in the inter-
stitial waters of the Santa Barbara Basin. The pH's in the interstitial
waters generally ranged from 7.2-8. 0. Approximate calculations
1 00
show the interstitial waters in that area to be supersaturated with
respect to apatite (see Figure 4. 3), Overall, one can see in the
areas of coastal upwelling many of the necessary ingredients for
phosphorite formation.
Generally the sediments showed some SO4 reduction. In
addition to the effect of SO4 reduction mentioned earlier, the formation
of S2 will cause the precipitation of metal sulfides. This will free
the PO4 which may have been adsorbed onto the metal (hydroxide)
before it precipitated as a sulfide (Brooks et al., 1968).
Some have suggested that the formation of apatite occurs in
estuarine, rather than in open ocean, waters or sediments (Martens
and Harris, 1970; Bushinskji, 1964; Pevear, 1966, 1967). I tend to
favor the upwelling area for several reasons. There is a great deal
of similarity between the circulation and nutrient behavior in an
upwelling area compared to an estuary (Sverdrup, Johnson, and
Fleming, 1942). Also, it has been observed that direct precipitation
of apatite can occur in interstitial waters of marine sediments
(Burnett, 1974). Finally, the phosphate levels in current estuarine
sediments are found to be controlled generally by Fe or Al-phosphates,
rather than Ca-phosphates (Bray, Bricker and Troup, 1973).
The phosphorites found in upwelling areas have been described
in the works of Dietz, Emery and Shepard (1942), Bushinskii (1964,
1966), Baturin (1966), Burnett (1974) and others. Most of the basic
1 01
structures were listed in Table 4. 1. In an interesting study, Baturin
and Dubinchuk (1974) examined an Aghulas Bank phosphorite by
electron microscopy. Even within the same phosphorite, they found
evidence of different stages of phosphate growth. Baturin and Dubin-
chuk concluded that phosphatization depends on the diagenetic environ-
ment of various macro- and micro-environments in the sediment.
The precipitation of phosphates in certain microenvironments in
the sediments has also been mentioned by others (e.g. Burnett, 1974).
The physico-chemical conditions inside a foramjniferal test, for
example, may be quite different from the surrounding sediment.
Possibly the pH at the surface of a mineral grain would be raised
sufficiently to promote apatite precipitation. Wollast (1971) shows
that heterogeneous precipitation may occur in small cracks at
reactant concentrations less than saturation because of surface energy
effects. Persistence of the apatite in the long-run, though, requires
that the sediment be at or above apatite equilibrium. Even though a
sediment is, on the average, saturated or supersatured with respect
to apatite, it may be that the required energy barriers are overcome
only at surfaces, in cavities, or in other special micro-environments
in the sediment. In any event, the type of phosphorite found will bea
function of the sediment type in which it formed. Where there is con-
siderable limy mud or limestone, the phosphorite will likely appear
as a replaced limestone. In the diatomaceous sediments off the coast
1 02
of Chile and Peru, apatite is found mainly as a chemical precipitate
on the surface of diatoms or mineral grains (Burnett, 1974).
Synthesis: apatite formation in the ocean
The most recent discussion of apatite formation, pertaining
especially to the Peru-Chile shelf, is that of Burnett (1974). He con-
siders many of the factors which were discussed above in his model
for authigenic apatite formation, Much of the discussion to follow
will incorporate his observations and conclusions, as well as those of
Tooms et al. (1969), Bushjnskj.j. (1964, 1966), and Guibrandsen (1969).
Upwelling areas are favored regions for modern apatite forma-
tion. They receive a continual source of nutrients from deeper
waters which is assimilated by phytoplan.kton during photosynthesis.
The phytoplankton eventually settle to the sediment floor either
directly or in the fecal material of grazing organisms. Their decay
on the relatively shallow shelf area is determined by the temperature
and oxygen content of the waters which cover the sediment. The low
oxygen water bathing the sediments is also high in phosphate, The
low and high PO4 causes much of the phosphate release to occur
in the sediments while producing a slight barrier to back diffusion
of phosphate out of the sediment. The continual supply of phosphate
to the sediments is necessary to maintain the high level of dissolved
phosphate. Without the fairly steady supply of organic phosphorous
103
to the sediments, much of the phosphate would diffuse back into the
water column. In addition, since apatite formation is very slow, a
steady supply of phosphate must be provided. Apatite formation,
per Se, occurs in the sediments by direct precipitation or by replace-
ment of existing sediment. Precipitation in normal seawater is pro-
hibited by kinetic barriers.
The upwelling area should provide a sediment of high biogenic
content relative to terrigenous, clayey material for optimum apatite
formation. Not only will clays dilute the sediment, preventing high
concentrations of dissolved phosphate, but clays can also adsorb
significant quantities of dissolved phosphate.
Apatite formation will depend on a number of factors as outlined
in the first sections of this chapter. The data In Table 4. 2 and
Figure 4. 3 show that sediments in an upwelling area should be highly
super saturated with respect to an ideal apatite, even considering
temperature and pH changes. Even the measured (non-ideal) solu-
bility of an actual apatite taken from an upwelling area (see Chapter
III) is only 3-5 M PO4 at pH 7.4 and 10°C. Though the effect of
solution composition on the solubility is unknown, I estimate that the
apatite solubility (as TPO4) in a Ca+Z depleted, F enriched sediment
would increase by possibly a factor of 3-5. This would still make
most sediments in upwelling areas supersaturated with respect to
apatite More data on the exact nature of the equilibrating phase and
104
of the pore water composition is required before quantitative esti-
mates can be made.
The kinetic factors discussed above indicate that apatite
crystallization is most likely to occur on surfaces of other mineral
grains (or on detrital fish-bone apatite), in micro-cracks, or along
grain boundaries. I feel that the most likely combination of chemical
factors to accelerate nucleation and crystallization are a lowered
Mg/Ca arising from diagenetic reactions and sulfate reduction,
increased F/Ca (near fluorite saturation) at moderate pH's (7.2-7.8),
and increased dissolved phosphate. High F levels are required,
according to the data of Simpson (1969), to form apatites of normal
F content. Temperature will also play a decisive role in the kinetics
of apatite formation. The critical Mg/Ca ratio for apatite formation
(1:4. 2) proposed by Martens and Harris is a kinetic barrier which will
be altered under interstitial water conditions (high F, heteronuclea-
tion). The range of solution compositions which define the metastable
amorphous calcium phosphate region and the field of apatite crystal-
lization remains to be determined. The definition of such a field at
various temperatures in terms of Ca-Mg-F-PO4-pH-0O3 under con-
ditions of homogeneous and heterogeneous nucleation would be most
enlightening (not to mention time-consuming) in unraveling the princi-
pal factors controlling apatite formation.
Phosphorite formation has apparently occurred at only certain
105
times in the earth's history (Burnett, 1974; Tooms et al., 1969).
The discussions of Burnett and Tooms et al. suggest that temperature
may be the key factor in promoting apatite precipitation. Burnett
correlates maximum of sea level (interglacial, warm periods) with
the most active phosphorite formation, suggesting that the decrease
in solubili.ty accompanying the warming would be sufficient to induce
precipitation. Cook (1970) stresses pH in addition to temperature in
apatite formation and transformations. At periods of low sea level,
the phosphorite would be concentrated by winnowing (Bushinskii,
1964). In fact, evidence of periodic winnowing is common to many
phosphate deposits (Cook, 1967; Bushinskii, 1964). Estimates have
been made (J. Thiede, personal communication) that the sea surface
temperature off Northwest Africa has increased by about 6°C since
the last glacial maximum. If this change is assumed to also represent
the change in bottom and interstitial water temperature then a
decrease in apatite solubility of 15-25% since the last glacial would
be predicted. Although the change in temperature may be enough to
shift the balance in favor of apatite precipitation, I suspect that there
are factors relating to the circulation and biology of the oceans which
will more strongly influence phosphate formation. The commonly
noted association of phosphorites with high surface organic productiv-
ity and the suspected influence (on phosphate formation) of the dis-
solved oxygen content of the waters intersecting the sediments
106
(Sholkovitz, 1973) leads to this conclusion, Global and local reduction
of primary production during glacial periods and the consequent rise
in (also increased solubility in glacial periods) would tend to
inhibit apatite formation. The theme of biological interaction of N,
P, and was considered by Piper and Codispoti (1975) in their
discussion of the association of phosphorite deposits and black shale.
They focused on the possible effects of altered denitrification rates on
the precipitation of apatite in the oceans. I agree with their emphasis
on the broad interrelationships between biological activity and the
chemistry of the oceans, especially in relation to phosphorite
formation.
Thus far the possible role of organic catalysis in apatite forma-
tion has not been mentioned, McConnell (1965) emphasizes the effect
which enzymes may have in accelerating apatite precipitation. Too
little is known about the nature of the organic matter in the sediments
of upwelling areas, however, to assess the importance of such
mechanisms, They remain a possibility, though.
I have summarized the above discussion on apatite formation
in the modern ocean as a schematic diagram shown in Figure 4. 6.
It does not necessarily represent the exact conditions of deposition
for all phosphorite formations. For example, the shelf area may be
considerably wider for some phosphate deposits. Circulation patterns
may also be altered in the case of deposition in an epicontinental sea
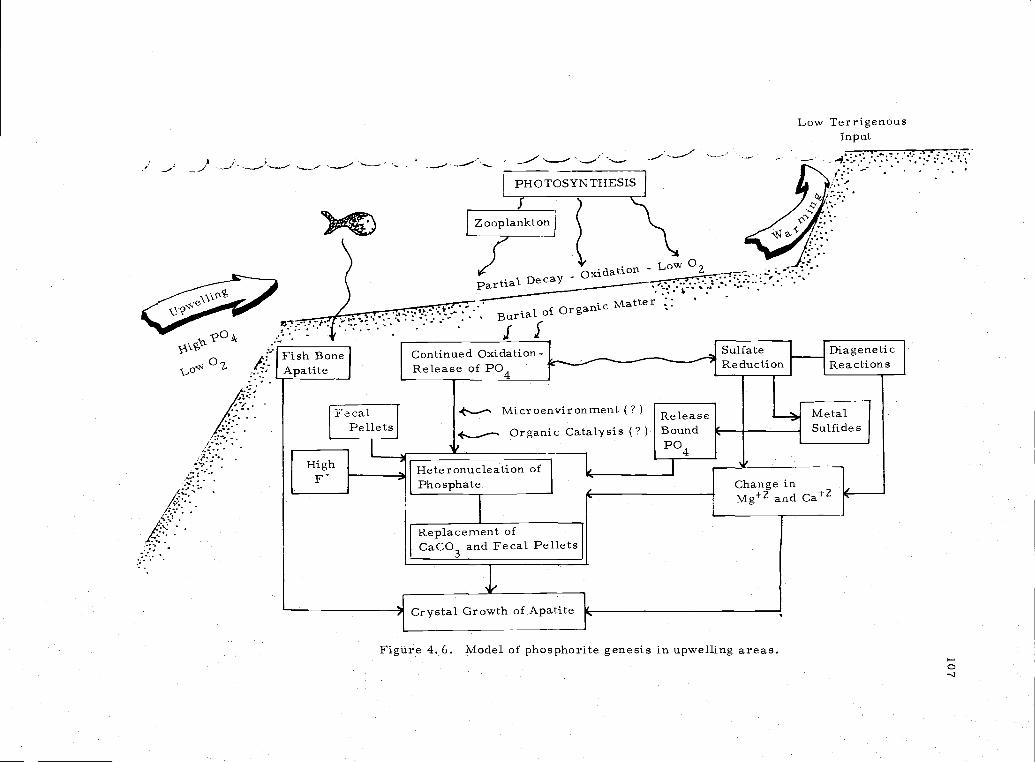
Low TerrigenousInput
- - - -
1zoop1atonJ
Oxidat1 - LoW 2 .
-
P_.::1D:.::i_______N:__:te
oJoi
/
Figure 4. 6. Model of phosphorite genesis in upwelling areas.
-J
108
or as in Australia as suggested by deKeyser and Cook (1972). The
model does attempt to correspond to current conditions in the ocean.
The model incorporates many of the ideas of others who have studied
phosphorite formation as well as my own. It is likely that at one
time or another scientists have suggested all possible mechanisms
and relationships concerning phos phorite formation.
The main feature of the model is that apatite formation occurs
in the sediments, rather than in the water column or at the sediment
water interface. In the sediments of upwelling areas one finds the
necessary phosphate supply and also a highly elevated F level. The
source of the high F may be volcanic but is uncertain at this time;
only its presence is verified. A quantitative estimate of the changes
in Ca , Mg , and SO4 required to initiate apatite precipitation
cannot yet be made. Only qualitative data are available to indicate,
for example, that lower levels of Mg+Z not only increase the rate of
phosphate precipitation and crystallization, but also will reduce the
equilibrium solubility of apatite. Other factors, as indicated in the
discussion above, will moderate the rate of apatite formation as well
as its equilibrium solubility in the sediments. Both rate and equilib-
rium factors need to be considered in studying apatite formation.
With time, diagenetic reactions will bring the interstitial waters to
a certain condition of supersaturation, a condition which is defined by
a combination of factors, rather than any single factor. The factors
109
will include Ca+Z, F, TPO4, pH, Mg+Z, SO4'2, and temperature.
Particular combinations of these factors will allow apatite precipi-
tation to occur at a reasonable rate. Other combinations will inhibit
the formation of apatite. Again, quantitative estimates of the con-
ditions of formation cannot yet be made. A study of the interstitial
water composition in regions of apatite formation would be most
valuable in determining the chemical factors necessary for phosphorite
formation. I feel that in addition to chemical (equilibrium and
kinetic) factors, physical and biological factors need to be con-
sidered in studying the phosphorite problem. This study could
include the global cycling of nitrogen and phosphorous down to the
microchemistry of the inter stitial environment.

110
BIBLIOGRAPHY AND RELATED REFERENCES
Ames, L. L. Jr. 1959. The genesis of carbonate apatites. EconomicGeology 54, 829-841.
Armstrong, F. A.. J. 1965. Phosphorous. In: Chemical Oceanog-raphy Vol. 1, (J. P. Riley and G. Skirrow, eds.) London,Academic Press. p. 323-364.
Arnold, P. W. 1950. The nature of precipitated calcium phosphates.Transactions of the Faraday Society. , 1061-1072.
Atlas, E. L. 1973. Changes in chemical distributions and relation-ships during an upwelling event off the Oregon coast. M. S.thesis. Oregon State University, Corvallis. 100 pp.
Atlas, E. L., S. W. Hager, L. I. Gordon, P. K. Park. 1971. Apractical manual for the use of the Technicon Autoanalyzer inseawater nutrient analyses; revised. Oregon State University,Department of Oceanography, Technical Report 215, Ref. No.71-22.
Avnimelech, Y., E. C. Moreno, andW. E. Brown. 1973. Solubilityand surface properties of finely divided hydroxyapatite. Journalof Research of the National Bureau of Standards. 77A, 149-155.
Bachia, B. N. 1963. Precipitation of calcium carbonates and phos-phates from metastable solutions. Annals of the New YorkAcademy of Sciences. 109, 251-255.
Bachra, B. N., 0. R. Trautz, andS. L. Simon. 1963. I. Spontane-ous precipitation of calcium carbonates and phosphates underphysiological conditions. Archives of Biochemistry and Bio-physics, 103, 124-138.
Bachra, B. N., 0. R. Trautz, and S. L. Simon. 1965a. II, A pre-cipitation diagram for the system calcium-carbonate phosphateand the heterogeneous nucleation of solids in the metastabilityregion. Advances in Fluorine Research and Dental Caries Pre-vention3, 101-118.
Ill
Bachra, B. N., 0. R. Trautz, and S. L. Simon. 1965b. UI. Theeffect of magnesium and fluoride ions on the spontaneous precipi-tation of calcium carbonates and phosphates. Archives of OralBiology 10, 731-738.
Bates, R. 0. 1951. First dissociation constant of phosphoric acidfrom 0-60°C; Limitations of the electromotive force method formoderately strong acids. Journal of Research of the NationalBureau of Standards 47(3), 127-134.
Bates, R. G. and S. F. Acree. 1943. values of certain phosphatechloride mixtures, and the second dissociation constant of phos-phoric acid from 0° to 60°C. Journal of Research of the NationalBureau of Standards. 30, 129-155.
Baturin, G. N. 1971. Stages of phosphorite formation on the oceanfloor. Nature (Physical Science) 232, 61-62.
Baturin, G. N. 1972. Phosphorus in interstitial waters of sedimentsof the southeastern Atlantic. Oceanology 12, 849-8 55.
Baturin, G. N. and V. T. Dubinchuk. 1974. Microstructures ofAguihas Bank phosphorites. Marine Geology 16, M63-M70.
Baturin, G. N., A. V. Kochenov, and V. P. Petelin. 1970. Phos-phorite formation on the shelf of southwest Africa. Trans. fromLitologiya i Poleznye Iskopaemye 3, 15-26.
Baturin, G. N., K. I. Merkulova, and P. I. Chalov, 1972. Radio-metric evidence for recent formation of phosphatic nodules inmarine shelf sediments. Marine Geology 13, 37-41,
Baturin, G. N. and 0. V. Shishkina. 1973. Behavior of fluorineduring phosphorite formation in the ocean. Oceanology 4, 523-526.
Bell, L. C., A.. M. Posner, and 3. P. Quirk. 1973. The point ofzero charge of hydroxyapatite and fluorapatite in aqueous solu-
tions. Journal of Colloid and Interface Science 42(2), 250-261.
Ben-Yaakov, S. and M. Goldhaber. 1973. The influence of seawatercomposition on the apparent constants of the carbonate system.Deep-Sea Research 20(1), 87-100.
112
Berner, R. A. 1973. Phosphate removal from sea water by adsorp-tion on volcanogenic ferric oxides. Earth and Planetary ScienceLetters, 18, 77-86.
Berry, E. E. 1967. The structure and composition of some calcium-deficient apatites-Il. Journal of Inorganic and Nuclear Chemistry29, 1585-1590.
Blackwelder, E. 1916. The geologic role of phosphorus. AmericanJournal of Science (4th series) 17(250), 285-298.
Bjerrum, N. and A.. Unmack, 1929, Elektrometrische Messungenmit wasserstoffelektroden in mischungen von säuren und basenmit salzen. Die dissoziations konstanten von wasser, phos-phorsaure, citronensäure und glycin. Det. Danske Viden-skabernes Seiskab; Mathematisk-fysiske Meddelelser 9(1), 1-208.
Blitz, R. M., E. D. Pellegrino, S. T. Miller, and A.. Moffitt, 1971.Solubility behavior of the mineral substance of bone, tooth, andshell. Clinical Orthopedics and Related Research, Philadelphia71, 219-228.
Borneman-Starinkevitch, I. D. and N. N. Belov. 1953. On carbonateapatite. Doklady Akademjj Nauk SSSR, 90(1), 89-9 2.
Bray, J. T., 0. P. Bricker, and B. N. Troup. 1973. Phosphate ininterstitial waters of anoxic sediments: oxidation effects duringsampling procedure, Science, 180, 1362-1364.
Bricker, 0. P. and R. M. Garrels. 1967. Mineralogic factors innatural water equilibria. In: Principles and Applications ofWater Chemistry, (S. D. Faust and J. V. Hunter, eds.) Wiley-Interscience, New York, 449-468,
Brooks, R. R., B. J. Presley, and I. R. Kaplan. 1968. Traceelements in the interstitial waters of marine sediments. Geo-chimica et Cosmochimjca Acta 32, 397-414.
Brown, W. E. 1966. Crystal growth of bone mineral. ClinicalOrthopedics 44, 205-220.
Brown, W. E. 1973. Solubjlj.tjeg of phosphates and other sparinglysoluble compounds. In Environmental Phosphorus Handbook(Griffith, E. J, ed.) Wiley-Intersci.ence, New York. 203-239.
113
Burnett, W. C. 1974. Phosphorite deposits from the sea floor offPeru and Chile: Radiochemical and geochemical investigationsconcerning their origin, Ph, D. thesis. Hawaii Institute ofGeophysics. University of Hawaii. 163 pp.
Bushinskii, G. I. 1964. On shallow water origin of phosphoritesediments, In: L.M.J.U. Van Straaten (ed.), Deltaic andShallow Marine Deposits. Elsevier, Amsterdam, 62-69.
Bushinskii, G. I. 1966. The origin of marine phosphorites. Trans.from Litologiya i Poleznye Iskopaemye 3, 23-48.
Calvert, S. E. and N. B. Price. 1971. Upwelling and nutrient regen-eration in the Benguela Current, October, 1968. Deep-SeaResearch 18, 505-523.
Chambers, and Whiteley. 1966. Phosphate Transport in Sea UrchinEggs. I. Kinetic Aspects (Appendix). Journal of CellularPhysiology 68, 289-308,
Chave, K. E., K. S. Deffeyes, P. K. Weyl, R. M. Garrels, andM. E. Thompson. 1962. Observations on the solubility ofskeletal carbonates in aqueous solutions. Science 33-34.
Childs, C. W. 1970. A potentiometric study of equilibria in aqueousdivalent metal ortho- pho s phate solutions. Inorganic Chemis try9(11), 2465-2469.
Chughtai, A,, R. Marshall, andG. H. Nancollas. 1968. Complexesin calcium phosphate solutions. Journal of Physical Chemistry72(1), 208-211.
Clark, J. S. 1955. Solubility criteria for the existence of hydroxy-apatite. Canadian Journal of Chemistry 33, 1696-1700.
Clark, J. S. and R. C. Turner. 1955. Reactions between solidcalcium carbonate and orthophosphate solutions. CanadianJournal of Chemistry 33, 665-671.
Clarke, H. B., D. C. Cusworth, and S. P. Datta. 1954. Thermo-dynamic quantities for the dissociation equilibria of biologicallyimportant compounds. 3. The dissociation of the magnesiumsalts of phosphoric acid, glucose 1-phosphoric acid and glycerol2-phosphoric acid, Journal of the American Chemical Society 58,1 46 -1 54,
114
Church, T. M. 1970. Marine barite. Ph. D. thesis. University ofCalifornia at San Diego. 100 PP.
Cook, P. J. 1967. Winnowing - an important process in the concen-tration of the stairway sandstone (Ordovician) phosphorites ofCentral Australia. Journal of Sedimentary Petrology 37(3), 818-828.
Cook, P. J. 1970. Repeated diagenetic calcitization, silicification,and phosphoritization in the Meade Peak Member of the Phos-phoria Formation. Bulletin of the Geological Society of America,80, 2107-2116.
Cook, P. J. 1972. Petrology and geochemistry of the phosphatedeposits of Northwest Queensland, Australia. Economic Geology,67, 1193-1213.
Culberson, C., R. M. Pytkowi.cz, andE. L. Atlas. In press. Hydro-gen-ion exchange on amorphous silica in seawater. MarineChemistry.
D1Anglejan, B. F. 1967. Origin of marine phosphorites off BajaCalifornia, Mexico. Marine Geology 5, 15-44.
D'Anglegan, B. F. 1968. Phosphate diagenesis of carbonate sedi-ments as a mode of in situ formation of marine phosphorites:observations in a core from the Eastern Pacific. CanadianJournal of Earth Sciences, 5, 81-87.
Davies, C. W. and B. E. Hoyle. 1953. The interaction of calciumions with some phosphate and citrate buffers. Journal of theChemical Society, 4134-4136.
deKeyser, F. and P. J. Cook. 1972. Geology of the Middle Cam-brian Phosphorites and Associated Sediments of NorthwesternQueensland, Bulletin 138. Bureau of Mineral Resources,Geology and Geophysics, Australian Government Publishing Ser-vice, Canberra, 79 pp.
Dj.etz, R. S., K. 0. Emery, and F. P. Shepard, 1942. Phosphoritedeposits on the sea floor off Southern California. Bulletin of theGeological Society of America 53, 8 15-848.
115
Dietz, V. R., H, M. Rootare, and F. G. Carpenter. 1964. Thesurface composition of hydroxylapatite derived from solutionbehavior of aqueous suspensions. Journal of Colloid Science,19, 87-101.
Dmitrenko, 0. I. and G. A. Paviova. 1962. On the chemistry ofthe phosphorus in the sea. Trudy Instituta Okeanolgii 54, 99-114.
Drozdov, N. S. and. V. P. Krylov. 1961. Determination of thedissociation constants of weak acids. Zhurnal PhyzicheskoiChimii. 35(11), 2557-2560.
Duff, E. J. 1971. Orthophosphates. Part V. Phase equilibria inthe system calcium oxide-phosphorus pentoxide-calcium fluoride-water along the fluorapatite-hydroxyapatite join under aqueousconditions. Journal of the Chemical Society (A.), 1895-1898.
Dymond, J., J, B. Corliss, G. R. Heath, C. W. Field, E. J. Dasch,and E. H. Veeh. 1973. Origin of metalliferous sediments fromthe Pacific Ocean. Geological Society of America Bulletin3355-3372.
Eanes, E. D. and A. 5. Posner, 1965. Kinetics of conversion ofnoncrystalline calcium pho s phate to cry stalline hydroxyapatite.Transactions of the New York Academy of Sciences, Ser, II.28(2), 233-241.
Eanes, E. D., I. H. Gillessen, and A.. S. Posner. 1965. Inter-mediate states in the precipitation of hydroxyapatite. Nature208(5008), 365-367.
Eanes, E. D. and A.. S. Posner, 1968. Intermediate phases in thebasic solution preparation of alkaline earth phosphates. CalcifiedTissue Research 2, 23-48.
Elgquist, B. 1970. Determination of the stability constants of MgF+and CaF+ using a fluoride ion selective electrode. Journal ofInorganic and Nuclear Chemistry 32, 9 37-944.
Elliot, J. S., R. F. Sharp and L. Lewis. 1958. The apparent dis-sociation constants of phosphoric acid at 38° at ionic strengthsfrom 0,1 to 0.5. Journal of Physical Chemistry 62, 686-689.
116
Farr, T. D, and K. L. Elmore. 1962. System CaO-P205-HF-H20:Thermodynamic properties. Journal of Physical Chemistry 66,315 -318,
Francis, M. D. 1965. Solubility behavior of dental enamel andother calcium phosphates. Annals of the New York Academy ofSciences 131(2), 694-712.
Garrels, R. M. and C. L. Christ, 1965. Solutions, Minerals, andEquilibria. Harper and Row, New York, 450 pp.
Garrels, R. M. and M. E. Thompson. 1962. A. chemical model forseawater at 25°C and one atmosphere total pressure. AmericanJournal of Science 260, 57-66.
Goldberg, E. D. andR. H. Parker. 1960. Phosphatizedwoodfromthe Pacific sea floor, Bulletin of the Geological Society ofAmerica 71, 631-632.
Gordon, L. I. 1973. A study of carbon dioxide partial pressures insurface waters of the Pacific Ocean. Ph. D. thesis. OregonState University, Corvallis. 216 pp.
Gosselin, R. E. and E. R. Coghlan. 1953. The stability complexesbetween calcium and orthophosphate, polymeric phosphate, andphytate. Archives of Biochemistry and Biophysics. 45, 301-311.
Greenhaigh, R. and J. P. Riley. 1961. The determination of fluoridesin natural waters, with particular reference to seawater. A.nalyticaChimica Acta 25, 179-188.
Greenwald, I. 1942, The solubility of calcium phosphate I. The effectof pH and of amount of solid phase. Journal of Biological Chemis-try 143, 703-710.
Greenwald, I. 1945. The effect of phosphate on the solubility ofcalcium carbonate and of bicarbonate on the solubility of calciumand magnesium phosphates. Journal of Biological Chemistry jj,697-704.
Greenwald, I., J. Redish, andA. C. Kibrick. 1940. The dissociationof calcium and magnesium phosphates. Journal of BiologicalChemistry 135, 65-76.
117
Gregory, T. M., E. C. Moreno, andW. E. Brown. 1970. Solu-bility of CaHPO4' 2H20 in the system Ca(OH)2-H3PO4-H20 at5, 15, 25, and 37. 5°C. Journal of Research of the NationalBureau of Standards, 74A.(4), 461-475.
Gulbrandsen, R. A. 1969. Physical and chemical factors in theformation of marine apatite. Economic Geology 64, 365-382.
Guibrandsen, R. A. and C. E. Roberson. 1973. Inorganic phos-phorus in seawater. In: Environmental Phosphorus Handbook.(Griffith, E. J, , ed. ) p. 117-140.
Hagen, A.. R. 1975. Studies of fluorapatite: II. The solubilitybehavior. Journal of Dental Research 54(2), 384-393.
Ingle, S. E., C. H. Culberson, J. E. Hawley, andR. M. Pytkowicz.1973. The solubility of calcite at atmospheric pressure and 35%osalinity. Marine Chemistry 1, 295-307.
Ingram, G. S. 1968. Some heteroionic exchange reactions of hydroxy-apatite. Bulletin de la Socit Chimique de France: SpecialNumber: Colloque international sur les phosphates minerauxsolides. Toulouse 16-Z0mai 1967, 1841-1844.
Kazakov, A.. 1938. Phosphorite facies and the genesis of naturalphosphates. Soviet Geology 8(6), 33-47 (translated by L. Gordon).
Kazakov, A. 1950. The fluorapatite system equilibria under condi-tions of formation of sedimentary rocks. Trudy Instituta Geologi-cheskix Nauk, Akademia Nauk SSSR, No. 114, GeologicheskayaSeriallo. 40, 1-21.
Kester, D. R. 1970. Ion association of sodium, magnesium, andcalcium with sulfate in aqueous solution. Ph. D. thesis. Cor-vallis, Oregon State University. 116 numbered pages.
Kester, D. R. 1975. Data on marine chemical kinetics and equilibria.To appear in "Oceans Handbook."
Kester, D. R. and R. M. Pytkowicz. 1967. Determination of theapparent dissociation constants of phosphoric acid in seawater.Limnology and Oceanography 12, 243-252.
118
Kester, D. R. and R. M. Pytkowicz. 1969. Sodium, magnesium andcalcium sulfate ion-pairs in seawater at 25°C. Limnology andOceanography 14, 682-686.
Kolodny, Y. 1969. Are marine phosphorites forming today? Nature224(5223), 1017-1019,
Kramer, J. R. 1964. Sea water: saturation with apatites andcarbonates. Science 146, 6 37-638.
Kukura, M,, L. C. Bell, A.. M, Posner, andJ. P. Quirk. 1972.Radioisotope determination of the surface concentrations ofcalcium and phosphorus on hydroxyapatite in aqueous solution,Journal of Physical Chemistry 76(6), 900-904.
LaMer, V. K. 1962, The solubility behavior of hydroxylapatite.Journal of Physical Chemistry 66, 973-978.
Leckie, J. 0. 1969. Interaction of calcium and phosphate at calcitesurfaces. Ph. D. thesis. Cambridge, Harvard University.
Leckie, J. and W. Stumm. 1970. Phosphate precipitation. In:Advances in Water Quality Improvement-Physical and ChemicalProcesses, (E. Gloyna and E. W. Eckemfelder, Eds.) Universityof Texas Press, Houston, p. 237-249.
Legeros, R. Z,, D. R. Trautz, J. P. Legeros, E, Klein. 1968,Carbonate substitution in the apatite structure. Bulletin de laSocit Chimique de France, special number. Colloque inter-national sur les phosphates mineraux solides. Toulouse 16-20mai. 1967. p. 1712-1718,
Levinskas, G. J. and W. F. Neuman. 1955. The solubility of bonemineral, I. Solubility studies of synthetic hydroxylapatite.Journal of Physical Chemistry 59, 164-168.
Lugg, Joseph W. H. 1931. The first dissociation of phosphoric acidin aqueous salt solutions at 18°. Journal of the AmericanChemical Society 53, 2554-2561.
Manheim, F. T. and F. L. Sayles. 1974. Composition and originof interstitial waters of marine sediments, based on deep seadrill cores. In: The Sea, v. 5 (E. D. Goldberg, ed. ) Wiley-Interscjence, New York, p. 527-568.
119
Mansfield, G. R. 1940. The role of fluorine in phosphate deposition.American Journal of Science 2.38, 863-879.
Martens, C. S. and R. C. Harriss. 1970. Inhibition of apatite pre-cipitation in the marine environment by magnesium ions. Geo-chimica et Cosmochimica Acta 34, 621-625.
Masterton, W. L., D. Bolocofsky, and T. P. Lee. 1971. Ionic radiifrom scaled particle theory of the salt effect. Journal of PhysicalChemistry. 75(18), 2809-2815.
McCann, H. G. 1968. The solubility of fluorapatite and its relation-ship to that of calcium fluoride. Archives of Oral Biology 13,987-1001.
McClellan, G. H. and J. R. Lehr. 1969. Crystal chemical investi-gation of natural apatites. AmericanMineralogist54, 1374-1391.
McConnell, D. 1965. Precipitation of phosphates in seawater.Economic Geology 60, 1059-1062.
McConnell, D. 1970. Crystal chemistry of bone mineral: hydratedcarbonate apatites. American Mineralogist 55, 1659-1669.
McConnell, D. 1973. Apatite. Its Crystal Chemistry, Mineralogy,Utilization, and Geologic and Biologic Occurrences.Springer-Verlag, New York. 111 p.
McDowell, H. and W. E. Brown. 1969. (IADR Abstract #340)Cited in Avuimelech, Y., E. C. Moreno, andW. E. Brown.Journal of Research of NBS, 77A(1), 149-155.
McDowell, H., W. E. Brown, and J. R. Sutter. 1971. Solubilitystudy of calcium hydrogen phosphate. Ion-pair formation.Inorganic Chemistry 10, 1638-1643.
McKelvey, V. E. 1967. Phosphate Deposits. U. S. GeologicalSurvey Bulletin 1252-D, p. D1-D21.
McKelvey, V. E., R. W. Swanson, andR. P. Sheldon. 1953. ThePermian phosphorite deposits of the western United States.International Geological Congress, 19th, Algiers, 1952, ComptesRendus, sec. 11, pt. 11, 45-64.
1 20
Moreno, E. C., W. E. Brown, and G. Osborn. 1960. Solubility ofdicalcium phosphate dihydrate in aqueous systems. Soil Scienceof America Proceedings. 24(2), 94-98,
Moreno, E. C., T. M. Gregory, andW. E. Brown. 1968. Prepara-tion and solubility of hydroxyapatite. Journal of Research of theNational Bureau of Standards, 72A, 773-782.
Nancollas, 0. H. and B. Tomazic. 1974. Growth of calcium phos-phate on hydroxyapatite crystals. Effect of supersaturation andionic medium. Journal of Physical Chemistry 78(22), 2218-2225.
Nathan, Y. and J, Lucas. 1972. Synthse de l'apatite partir dugypse; application au probleine de la formation des apatitescarbonates par precipitation directe. Chemical Geology ,
99-112.
Neuman, W. F. and M. W. Neuman. 1953. The nature of themineral phase of bone. Chemical Reviews 53(1), 1-46.
Newesely, H. 1967. 1st Fluor em essentieller Spurenbestandteil desPhysiologischen Milieus? Deutsch Zahnertzl Z. (1l), 1483-1 486.
Parker, R. J. and W. G. Siesser. 1972. Petrology and origin ofsome phosphorites from the South African continental margin.Journal of Sedimentary Petrology 42(2), 434-440.
Pevear, D. R. 1966. The estuarine formation of the United StatesAtlantic Coastal Plain phosphorite. Economic Geology j(2),251 -256.
Pevear, D. R. 1967. Shallow-water phosphorites. EconomicGeology 62, 562-567.
Piper, D. Z. and L. A. Codispoti. 1975. Marine phosphoritedeposits and the nitrogen cycle. Science 188(4183), 15-18.
Pytkowicz, R. M. 1975. Some trends in marine chemistry and geo-chemistry. Earth Science Reviews 11, 1-46.
Pytkowicz, R. M. and J. E. Hawley. 1974. Bicarbonate and carbon-ate ion-pairs and a model of seawater at 25° C. Limnology andOceanography 19(2), 223-234.
1 21
Pytkowicz, R. M. and D. R. Kester. 1967. Relative calcium phos-phate saturation in two regions of the North Pacific Ocean.Limnology and Oceanography 12, 714-718.
Pytkowicz, R. M. and D. R. Kester. 1971. The physical chemistryof seawater. Oceanography and Marine Biology Annual Reviews.(H. Barnes, ed.)9, 11-60.
Pytkowicz, R. M. and D. R. Kester. 1975. Theoretical test for theexistence of ion-pairs in seawater. Marine Chemistry, in press.
Pytkowicz, R. M., I. W. Duedall, andD. N. Connors. 1966.Magnesium ions: activity in seawater. Science 640-642.
Redfield, A. C. 1934. On the proportions of organic derivatives insea water and their relation to the composition of plankton.James Johnstone Memorial Volume, Liverpool, p. 176-192.
Redfield, A. C., B. H. Ketchum, F. A. Richards. 1963. Theinfluence of organisms on the composition of seawater. In: TheSea, Vol 2 (M N Hill, ed ) New York, John Wiley and Sons,p. 26-77.
Rivire, A. 1941. Sur la solubilit du phosphate tricalciquedansl'eau de mer. Cornpte. Rendu. Sommaire des Seances de laSociet Geologique de France, 19 mai-19 juin 1941. p. 50-51.
Roberson, C. E. 1966. Solubility implications of apatite in seawater. In: Geological Survey Research 1966: U. S. GeologicalSurvey Professional Paper 550-D, D178-D185.
Rootare, H. M., V. R. Deitz, and F. G. Carpenter. 1962. Solu-bility product phenomena in hydroxyapatite-water systems.Journal of Colloid Science 17, 179-206.
Shishkina, 0. V., G. N. Baturin, and V. S. Bykova. 1972,Fluorine in the sediments and ooze water of highly productiveparts of the oceans. Geochemistry International 1972, 682-689.Trans. from Geokhimiya, 8, 988-996 (1972).
Sholkovitz, E. 1973. Interstitial water chemistry of the SantaBarbara Basin sediments. Geochimica et Cosmochimica Acta37, 2043-2073.
1 22
Sillen, L G 1961 The physical chemistry of seawater in Sears,Mary, ed., Oceanography: International Oceanographic Congress,New York, American Association for the Advancement of SciencePub. 67, pp. 549-581.
Sillen, L. G. and A. E. Martell, 1964. Stability Constants of Metal-Ion Complexes. The Chemical Society, Special Pub. No. 17,London (2nd ed.)
Simpson, D. R. 1966a. Effects of magnesium on the formation ofapatite. American Mineralogist 51, 205-209.
Simpson, D. R. 1966b. Apatite and octa-calcium phosphate: Effectsof carbon dioxide and halogens on formation. Science 154(3757),1660-1661.
Simpson, D. R. 1968. Substitution in apatite: II. Low temperaturefluoride-hydroxyl apatite. American Mineralogist 53, 1953-1964.
Simpson, D. R. 1969. Partitioning of fluoride between solution andapatite. A.merican Mineralogist 54, 1711 -1719.
Smirnov, A. I., Ivnitskaya, R. B., and T. P. Zalavina. 1962.Experimental data on the possibility of the chemical precipitationof phosphate from seawater. Trans. State Scientific ResearchInstitute for Chemical Raw Materials, No. 7, 289-302.
Smith, A. N., A. M. Posner, andJ. P. Quirk. 1974. Incongruentdissolution and surface complexes of hydroxyapatite. Journal ofColloid and Interface Science 48(3), 442-449.
Smith, J. P. andJ. R. Lehr. 1966. Anx-rayinvestigationofcarbonate apatites. Journal of Agricultural Food Chemistry j(4), 342-349.
Smith, R. M. and R. A. Alberty. 1956. The apparent stabilityconstants of ionic complexes of various adenosine phosphates withmonovalent cations. Journal of Physical Chemistry , 180-184.
Stumm, W. andJ. 0. Leckie. 1970. Phosphate exchange with sedi-ments: its role in the productivity of surface waters. Advancesin Water Pollution Research 2, Pergamon Press, New York,111-26/1-26/16.
1 23
Sturnm, W. and J. J. Morgan. 1970. Aquatic Chemistry. Wiley-Interscience, New York. 583 pp.
Stump, A. D. 1963. The microstructure of marine sediments. Ph. D.thesis, Oregon State University, Corvallis, 114 pp.
Stutman, 3. M., A. S. Posner, andE. R. Lippincott. 1962. Hydro-gen bonding in the calcium phosphates. Nature 193(4813), 368-369.
Summerhayes, C. P., A. H. Nutter, andJ. S. Tooms. 1972. Thedistribution and origin of phosphate in sediments off northwestAfrica. Sedimentary Geology 8, 3-28.
Taylor, A. W., A. W. Frazier, E. L. Gurney, J. P. Smith. 1963.Solubility products of di- and tn magnesium phosphates and thedissociation of magnesium phosphate solutions. Transactions ofthe Faraday Society 59(487), 1585-1589.
Toorns, J. S., C. P. SummerhayesandD. S. Cronan. 1969. Geo-chemistry of marine phosphate and manganese deposits.Oceanography and Marine Biology Annual Reviews, H. Barnes,Ed. 7, 49-100,
Veeh, H. H., W. C. Burnett, and A. Soutar. 1973. Contemporaryphosphorite on the continental margin of Peru. Science845-8 47.
Walker, J. C. G. 1974. Stability of atmospheric oxygen. AmericanJournal of Science 274, 19 3-214.
Walton, A. C. 1967. The Formation and Properties of Precipitates.Wiley-Interscience, New York. 232 pp.
Walton, A. G., W. J. Bodin, H. Furedi, and A. Schwartz. 1967.Nucleation of calcium phosphate from solution. CanadianJournal of Chemistry 45, 2695-2701.
Wier, D. R., S. H. Chien, and C. A. Black. 1971. Solubility ofhydroxyapatite. Soil Science 111(2), 107-112.
Wina.nd, L. 1963. Etude physico-chimique de diverges carbonatapa-tites. Bulletin de la Socit Royale des Sciences de Liege, 32,575-596.
124
Winand, L., M. J. Dallemagne, andG. Duyckaerts. 1961. Hydrogenbonding in apatitic calcium phosphates. Nature 190, 164-165.
Wollast, R. 1971. Kinetic aspects of the nucleation and growth ofcalcite from aqueous solutions. In: Carbonate Cements.(Bricker, 0. P., Ed.). Johns Hopkins Press, Baltimore, p.264-273.
Wollast, R. 1974. The Silica Problem. In: The Sea, V. 5. (E. D.Goldberg, Ed.) 359-392. Wiley-Interscience, New York.
Young, E. J., A. T. Myers, E. L. Munson, and N. M. Conklin.196 9. Mineralogy and geochemistry of fluorapatite from Cerrode Mercado, Durango, Mexico. U. S. Geological Survey Pro-fessional Paper 650-D, D84-D93.
Youssef, M. I. 1965. Genesis of bedded phosphates. EconomicGeology 60, 590-600.
Wyatt, B., R. Tomlinson, W. Gilbert, L. Gordon, and D. Barstow.1971. Hydrographic Data from Oregon Waters, 1970. DataReport 49, Reference 71 -23, Oregon State University,Corvallis, 134 pp.

APPENDICES
1 25
APPENDIX I
Thermodynamic estimates of phosphate stability on seawater
Thermodynamic solubility products and estimates of activity
coefficients can be used to calculate the solubility of calcium phos-
phates in seawater. If the solid is represented by X1YZ then the
thermodynamic reaction quotient for its dissolution is:
0 1 mnK =aaya/ay A-i
where:
= the activity of the ith ion raised to the Jth power
ay the activity of the solid phase
This qua.ntity can be related to an apparent (stoic1iometric) solubility
product, K by
Ksp = [X]l{Y]m[Z]n
= K0Sp/fff A-2
where:
[I] = total concentration of ion I
K°p = K°ay = thermodynamic solubility product
f = total activity coefficient of ith ion raised to jth power
Alternately, the solubility product can be expressed as -logK
(= pK so that
PKsp = 1 p[X] + m p{Y] + n p[ Z]
and
PK5p = 1 pa + m + n . pa Pay
126
A-3
A-4
The solubilities of the following pure phases in seawater at
33. 3%o and 2° will be calculated: fluorapatite, hydroxyapatite,
octacalcium phosphate, brushj.te, monetite, and a postulated hydroxy-
apatite "surface complex" (Rootare et al., 1962). The solubility
products are given in Table Al. 1. The (P043) and (HP042 ) concen-
trations are functions of pH (at constant temperature and salinity) and
can be calculated from the following relations:
3 x(PO4 ) = TPO4/(1 + +
1+T ) A-5
K3K2K1 K2K3 K3
-2 I 2(HPO4 ) = TPO4/(1 +K +X/K2
+X /K 1K A-6
where TPO4 = (1-13PO4) + (H2PO4) i- (HPO4 2) (P03)
X = the operational hydrogen ion activity (X 101)
K = the ith apparent dissociation constant of H3PO4 (Kester
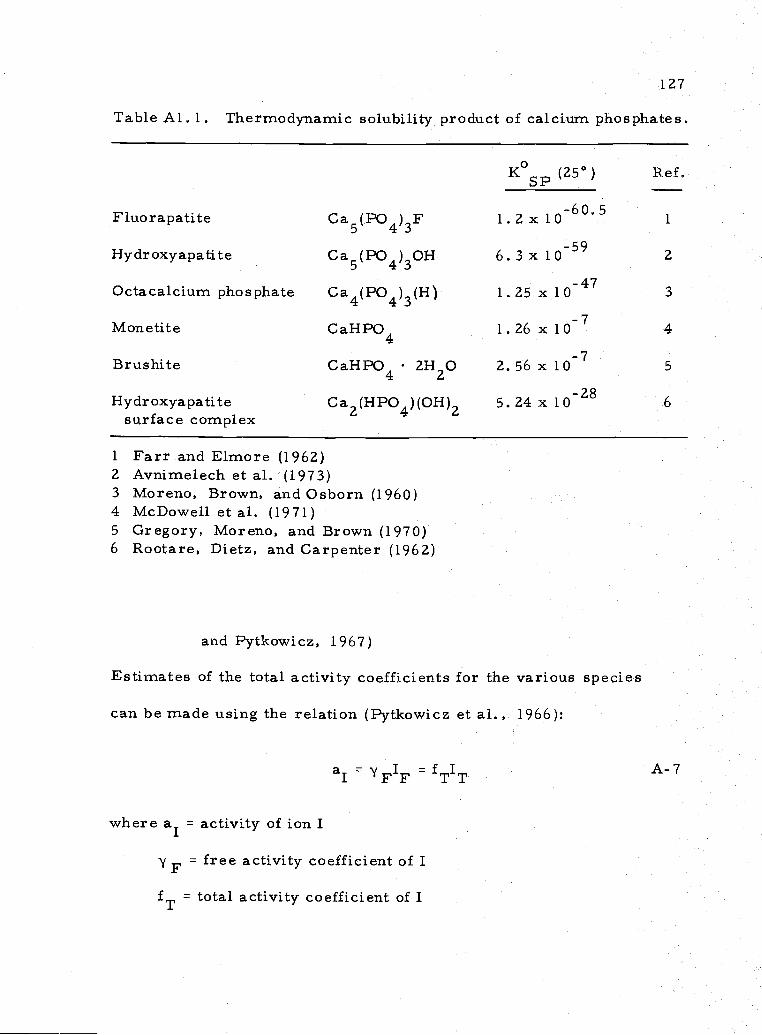
127
Table Al. 1. Thermodynamic solubility product of calcium phosphates.
K°p (25°) Ref.
Fluorapatite Ca5(PO4)3F 1. 2 x io60.
i
Hydroxyapatite Ga5(PO4)30H 6.3x1059 2
Octacalcium phosphate Ca4(PO4)3(H) 1. 25 x 1 0 3
Monetite CaHPO4 1. 26 x 1 4
Brushite CaHPO4 2H20 2.56 X 10 5
Hydroxyapatite Ca2(HPO4)(OH)2 5.24x1028 6surface complex
1 Farr and Elmore (1962)2 Avnimelech et al. (1973)3 Moreno, Brown, and Osborn (1960)4 McDowell eta1. (1971)5 Gregory, Moreno, and Brown (1970)6 Rootare, Dietz, and Carpenter (1962)
and Pytkowicz, 1967)
Estimates of the total activity coefficients for the various species
can be made using the relation (jtkowicz et al , 1966)
a1 F1F T'T
where a1 = activity of ion I
F = free activity coefficient of I
total activity coefficient of I
A-7
1 Z8
= total (free + ion-paired) concentration of I
'F free concentration of I
Total concentrations of Ca+Z and F can be estimated from the
salinity using chlorinity ratios (Pytkowicz and Kester, 1971). Free
concentrations have been calculated by Pytkowicz and Hawley (1974)
and estimates for the free-ion activity coefficients can be made using
the mean-salt method. Use of the mean-salt method for anjons, such
as F, involves the calculation
±KF A-8F '±KCl
One assumes in this calculation that KF solutions are completely
dissociated. aH is simply 10-pH (pH is measured on the NBS scale)
and aOH can be calculated from
a =aK°/a A-9OH w w H
where K° = thermodynamic ion product of water
a = activity of waterw
Finally, and HPo4 can be obtained from
K°1K°2K°3
PO4KI K K'H3PO4 A-JO
1 29
fK°1K°2
HPO4 KK H3PO4A-il
and we take 'jH C
= 1, although this is uncertain and may be higher3 4
(C. Culberson, private communication). Equations A-5 to A-il above
can be combined to give the expressions shown in Table A1.2for the
total phosphate in equilibrium with each of the phases mentioned. The
values of the constants used in the calculations are also given in the
table.
The results of these calculations are shown in Figure Al. 1.
According to these calculations, which do not account for pressure
effects, the bulk of seawater is supersaturated with respect to a pure
hydroxyapatite and a pure fluorapatite, and it is highly undersaturated
with respect to non-apatitic phosphates. Kramer (1964) made a similar
calculation for pure hydroxyapatite and reached the same conclusion.
He used a K°p calculated from free energy data and obtained a value
of 1.0 x l0 for the solubility product of hydroxyapatite.
One can see from Figure Al. 1 that pure fluorapatite should be
the most st.ble phase in seawater. According to our calculations,
hydroxyapatite is more stable than fluorapatite only at pH' s greater
than about 11. 5, though this pH will vary according to the solubility
products used in the calculation.
The solubility relationships described above apply to seawater
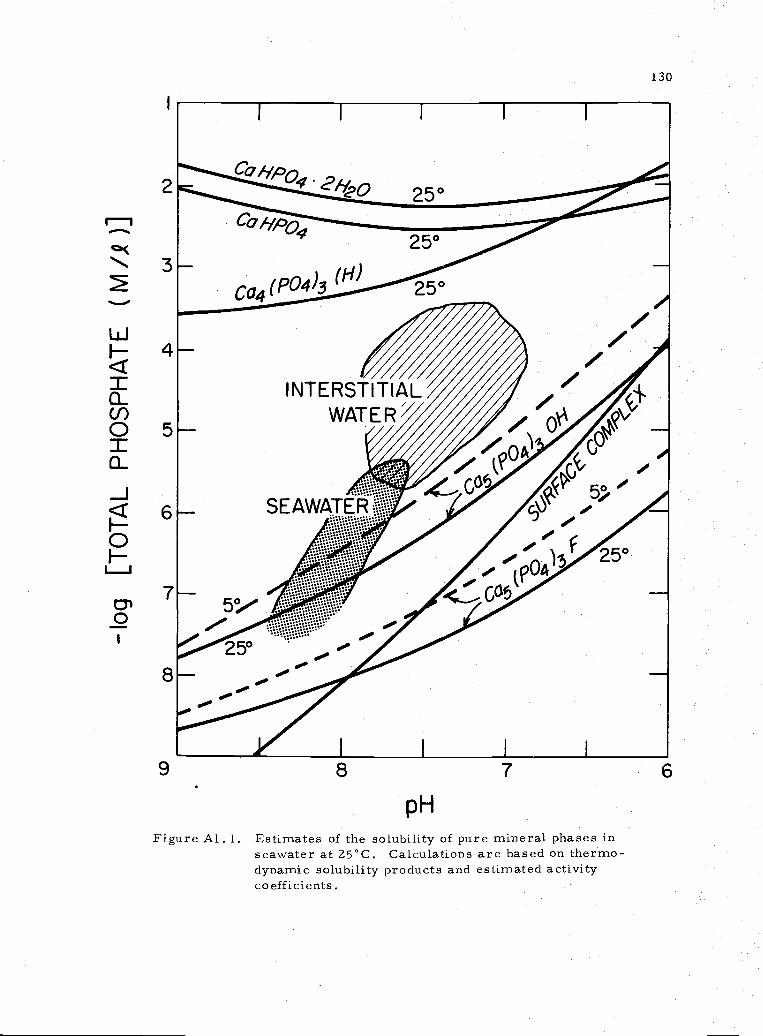
2
,qta-
27
.2
L!i
It-
.1. 8tiThat
P/-I
Seawof the
at 25ocSbi2ityof
COeff.SOlUbiliPr:
atbo::ar1a1Phases
c/or1tifl
aCt1Vjty
-I
6
3o
7
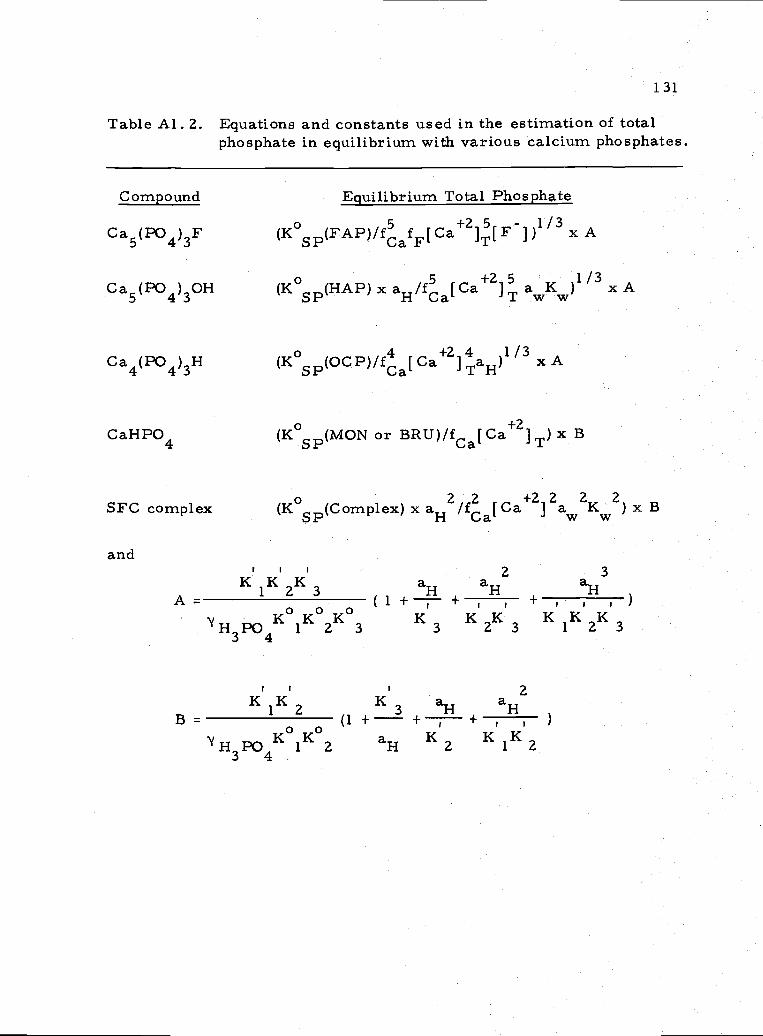
1 31
Table Al. 2. Equations and constants used in the estimation of totalphosphate in equilibrium with various calcium phosphates.
Compound Equilibrium Total Phosphate
Ca5(PO4)3F (K0Sp(FAP)/ffF[Ca+Z],[F])l/3 x A
Ca5(PO4)30H (K°sp(HAP) x aH/fa[Ca+ZJ aK)1 x A
Ca4(PO4)3H (K0Sp(QCP)/f[Ca+Z]faH)l x A
CaHPO4 (K°sp(MON or BRU)/fC [C2I1T) x B
SFC complex (K°p(ComPlex) x aHZ/fa[Ca+Z1ZawZKwZ) x B
andII I 2 3K1K2K3 aH aN aN
A= (1-1----i--+ , + , ,
H3PO4KlK2K3 K K 2K K 1K 2K
I I I 2K1K2 K aN aN1
+I I )
NPOKlKz aH K2 K1K2
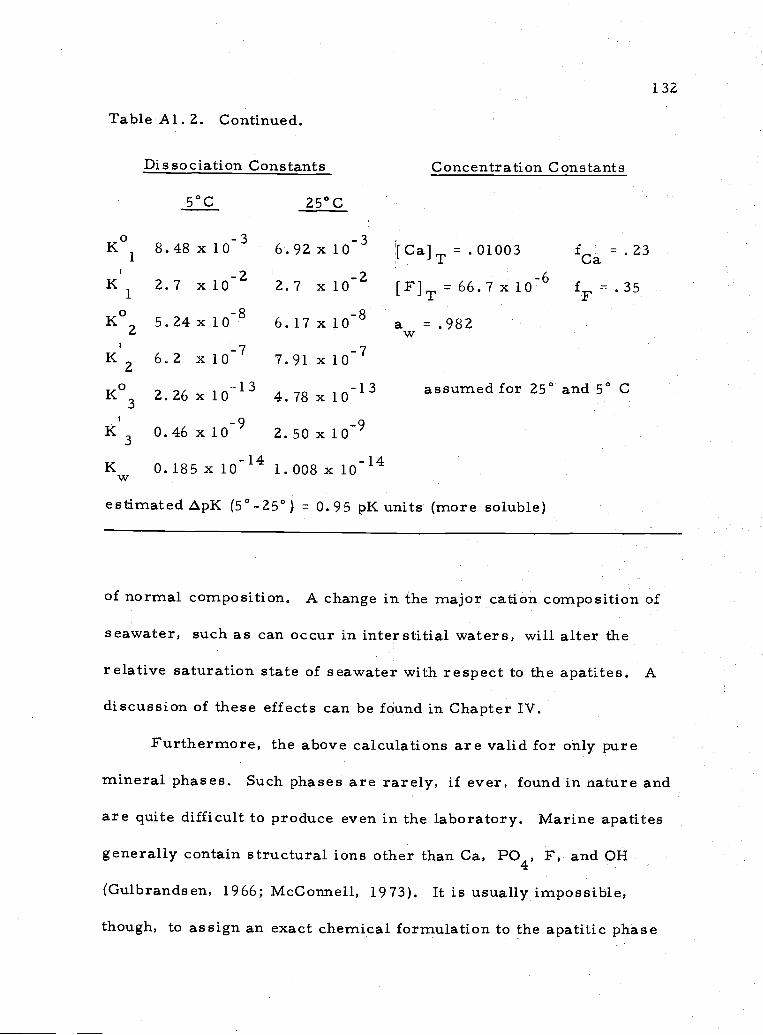
Table Al. 2. Continued.
Dissociation Constants
5°C 25°C
Concentration Constants
1 32
K° 8.48 x 1O 6.92x l0 [Ca] = .01003 f .23
K1 2.7 l0 2.7 x i02 [F]= 66.7K° 5.24 x io8 6.17 x 10⁸ a = .982
K2 6,2 x10⁷ 7.91 x1070
K -132.26x10 4.78x10 -13 assumed for 25° and 5° C
K 0.46 x l0 2.50 x
K 0.185x 1.008x iol4w
estimated pK (5°-25°) = 0.95 pK units (more soluble)
of normal composition, A change in the major cation composition of
seawater, such as can occur in interstitial waters, will alter the
relative saturation state of seawater with respect to the apatites. A
discussion of these effects can be found in Chapter IV.
Furthermore, the above calculations are valid for only pure
mineral phases. Such phases are rarely, if ever, found in nature and
are quite difficult to produce even in the laboratory. Marine apatites
generally contain structural ions other than Ca, PO4, F, and OH
(Gulbrandsen, 1966; McConnell, 1973). It is usually impossible,
though, to assign an exact chemical formulation to the apatitic phase
1 33
of a marine phosphorite because of the complicating presence of
undetermined amounts of other, non-apatitic, phases. Still, sub-
stitution in the apatite lattice is known to occur to some extent, and
it is useful to consider how compositional variation will affect the
solubility of apatite. The compositional variation in apatites can,
perhaps, be likened to that in magnesian calcites, Ca Mg1 CO3.
Magnesian calcites are organically precipitated in the marine environ-
ment but they are unstable and eventually convert to calcite (Land,
1967). Magnesian calcites are more soluble than pure calcite, but
they don't have a true reversible, equilibrium solubility (Chave et al.,
1962). Bricker and Garrels (1967) discuss the effect of solid solution
and other factors affecting the solid phase on mineral equilibria in
natural environments. If the analogy between Mg-calcites and sub-
stituted apatites holds, then one would expect an enhanced solubility
of substituted apatites over the pure mineral phase. A. higher solu-
bility for substituted apatites is often mentioned in the literature on
apatite, but only recently have data become available to substantiate
this observation (Chien, 1972).
Finally, to illustrate a consequence of using apparent constants
in describing the solubility of apatite I will consider the effect on the
apparent solubility product of a pure fluorapatite for a change in
temperature from 5°C to 25°C at pH 8.0. One can calculate the
[P043] concentration from TPO4 and the pH according to Eq
1 34
using the values listed in Table A.1 . 2. If an equilibrium TPO4 of 1. 0
.iM is measured at 5° and 0. 5 pM TPO4 at 25° one finds that at 5°
-log (PO4 3) = 7. 36 and -log(P043) = 7.00 at 25°. So the apparent
solubility product at these two temperatures is (expressed as pK5):
at 5°, PKp = 5 pCa + 3 + pF = 36.26
at 25°, = 5 pCa + 3 pPO + pF = 35. 18
One normally expects thatthe lower solubility product (higher pK5)
will have the lower solubility. It is seen that this is not necessarily
the case when one uses apparent constants, as the apatite was more
soluble at lower temperatures but showed a smaller solubility product.
Therefore, to determine the solubility, in terms of total dissolved
phosphate, one must use the apparent dissociation constants of-3phosphoric acid for conversion of PO4 to TPO4. One cannot assume,
in comparing s at different temperatures and salinities, that a
lower PO43 implies a lower total phosphate,
1 35
APPENDIX U
Methods and procedures for aatite solubilitv experiments
Solubility experiments on natural apatites were performed using
several different methods. One method involved sealing small
amounts (0. 1 - 1. 0 g) of apatite in 100 ml Pyrex ampoules filled
with seawater. These arnpoules were either heat sealed or sealed with
a rubber septum. They were then placed in a water bath (at 10.0 ±
0. 1°C) unless otherwise indicated and either rotated continuously on
their sides at about 12 rpm, or rotated end over end daily.
The second method used employed a continuous pumping appara-
tus. This method was used to collect most of the data. Eight glass
columns (30 cm x 0. 7 cm) were each packed with 15 g of apatite
and glass wool was inserted in both ends of the tube. Each glass
column was connected by tygon tubing to a 75 ml water reservoir on
one end and a peristaltic pump on the other end. The pump pulled the
water from the reservoir, through the apatite column, and then
returned the water to the reservoir. The pumping rate was 1.0 ml!
mm. A rubber stopper was mounted on each reservoir and had holes
for ingoing and outgoing liquid as well as holes for a gas bubbling tube
and a larger hole for the pH probe and for drawing samples from the
reservoir. The reservoirs and apatite columns were immersed in
the water bath, but the pump was nOt.
1 36
Water-saturated air with a constant pCO2 was bubbled through
reservoirs during the course of each experiment. This was done to
adjust and maintain the pH at a constant value. This procedure was
only effective when the alkalinity remained nearly constant. Several
methods of gas mixing were tried. The one used with the most success
is illustrated in Figure 3. 1 which also shows the pumping arrangement
for the samples.
During early experiments only pH and total inorganic dissolved
phosphate were measured. Later experiments included measurement
of fluoride, alkalinity, and occasionally calcium. The pH was meas-
ured with a Corning Model 476050 micro-combination pH electrode
and a Corning Model 112 Digital pH meter. Dissolved inorganic
phosphate was measured with a Technicon AutoAnalyzer using the
method described in Atlas et al (1971) The alizarin- blue method of
Greenhaigh and Riley (1961) was used to determine the fluoride con-
centrations. Alkalinity was measured by titration of a 10-15 ml sam-
pie with HC1 using a Gran extrapolation to determine the endpoint. A.
Sargent Model S30072-15 combination electrode was used to determine
the pH during the alkalinity titrations. Calcium was measured on a
diluted sample with a Jarrell-Ash Model 810 atomic absorption
spectrophotometer. The seawater was 33. 3%o, and was filtered
through a 0.45 .i filter before use. The seawater ws preserved with
15 drops/i of HgCl2 (saturated).
1 37
Before the beginning of each experiment, the columns were
washed with the seawater to be used in the experiment. Sometimes
this wash was preceded by a wash with . 01 N HC1, followed by a
distilled water wash. Occasionally, only a distilled water wash
preceded the seawater wash. The sample pretreatment was found
to affect the final results, so the wash sequence used will be given
in the description of each experiment. The reservoirs were then
filled with the seawater and pumping was begun. In some experi-
ments samples were withdrawn periodically for measurement of
phosphate. In other experiments, the pumping was stopped after a
specified time interval andpH, phosphate, fluoride, and alkalinity
were measured.
1 38
APPENDIX III
Description of samples used in apatite solubility study.Microprobe analysis of apatite sample.
A total of nine different apatites were used in this solubility
study. Most were examined in thin section and all were x-rayed to
confirm the presence of apatite and to try to detect the presence of
other phases. Chemical analyses were performed on all the apatites.
Data on the apatites is given in Tables A3. 1 -A3. 3. In addition, BET
surface areas were determined for 20-30 mesh samples of COW,
4-8 and FAP (Stump, 1963). They were found to be about 15 m2/g,
0. 5 m2/g and 0 m2/g, respectively.
Of the apatites used in this study, none conform to the ideal
stoichiometry as described earlier. Since there are other phases
present, I thought it would be useful to examine the relationship of the
bulk composition to the composition of the apatite on a microscopic
scale. This could be accomplished by the use of an electron micro-
probe. Burnett (1974) used the microprobe to analyze the apatitic
component of the sediments off the coast of Chile and Peru. He
showed that calcium, for example, was not confined solely to the
apatite phase. He also indicated compositional variation between
light and dark sections of phosphorite ovules.
A section of 4-28 was used for microprobe analysis, and the
results were rather surprising. The sample consisted of closely
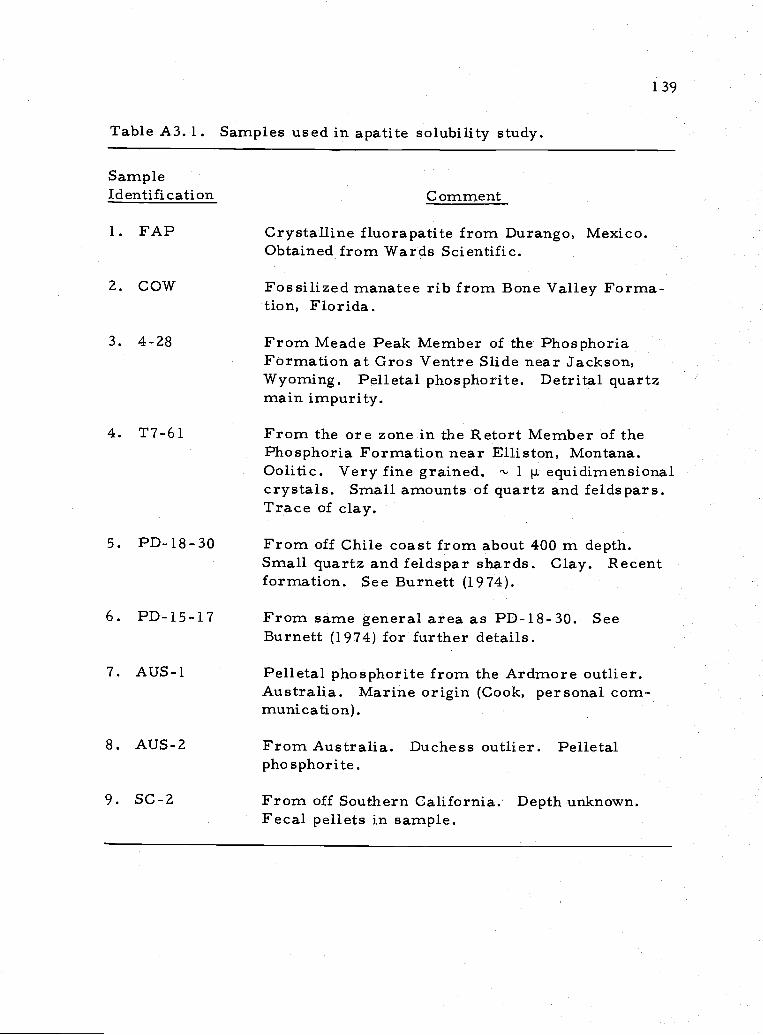
1 39
Table A3. 1. Samples used in apatite solubility study.
SampleIdentification Comment
1. FAP Crystalline fluorapatite from Durango, Mexico.Obtained from Wards Scientific.
2. COW Fossilized manatee rib from Bone Valley Forma-tion, Florida.
3. 4-28 From Meade Peak Member of the PhosphoriaFormation at Gros Ventre Slide near Jackson,Wyoming. Pelletal phosphorite. Detrital quartzmain impurity.
4. T7-61 From the ore zone in the Retort Member of thePho sphoria Formation near Fill ston, Montana.Oolitic. Very fine grained. 1 .i. equidimensionalcrystals. Small amounts of quartz and felds pars.Trace of clay.
5. PD-18-30 From off Chile coast from about 400 m depth.Small quartz and feldspar shards. Clay. Recentformation. See Burnett (1974).
6. PD-15-17 From same general area as PD-18-30. SeeBurnett (1974) for further details.
7. AUS-1 Pelletal phosphorite from the Ardmore outlier.Australia. Marine origin (Cook, personal com-munication).
8. AUS-2 From Australia. Duchess outlier. Pelletalphosphorite.
9. SC-2 From off Southern California. Depth unknown.Fecal pellets in sample.
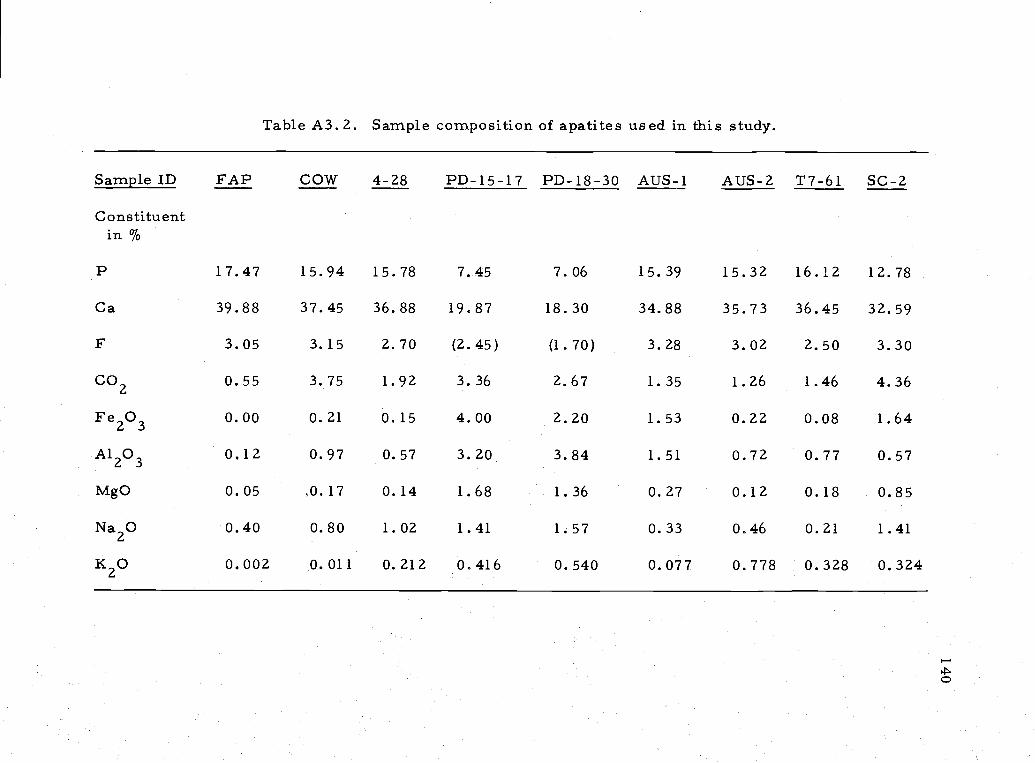
Sample ID
Constituentin%
P
Ca
F
Co2
Fe203
Al 203
MgO
Na20
K20
Table A3. 2. Sample composition of apatites used in this study.
FAP COW 4-28 PD-15-17 PD-18-30 AUS-1 AUS-2 T7-61 SC-2
17.47 15.94 15.78 7.45 7.06 15.39 15.32 16.12 12.78
39.88 37.45 36.88 19.87 18.30 34.88 35.73 36.45 32.59
3.05 3.15 2.70 (2. 45) (1.70) 3.28 3.02 2.50 3.30
0.55 3.75 1.92 3.36 2.67 1.35 1.26 1.46 4.36
0.00 0.21 0.15 4.00 2.20 1.53 0.22 0.08 1.64
0.12 0.97 0.57 3.20 3.84 1.51 0.72 0.77 0.57
0.05 0.17 0.14 1.68 1.36 0.27 0.12 0.18 0.85
0.40 0.80 1.02 1.41 1.57 0.33 0.46 0.21 1.41
0.002 0.011 0.212 0.416 0.540 0.077 0.778 0.328 0.324
I-
0
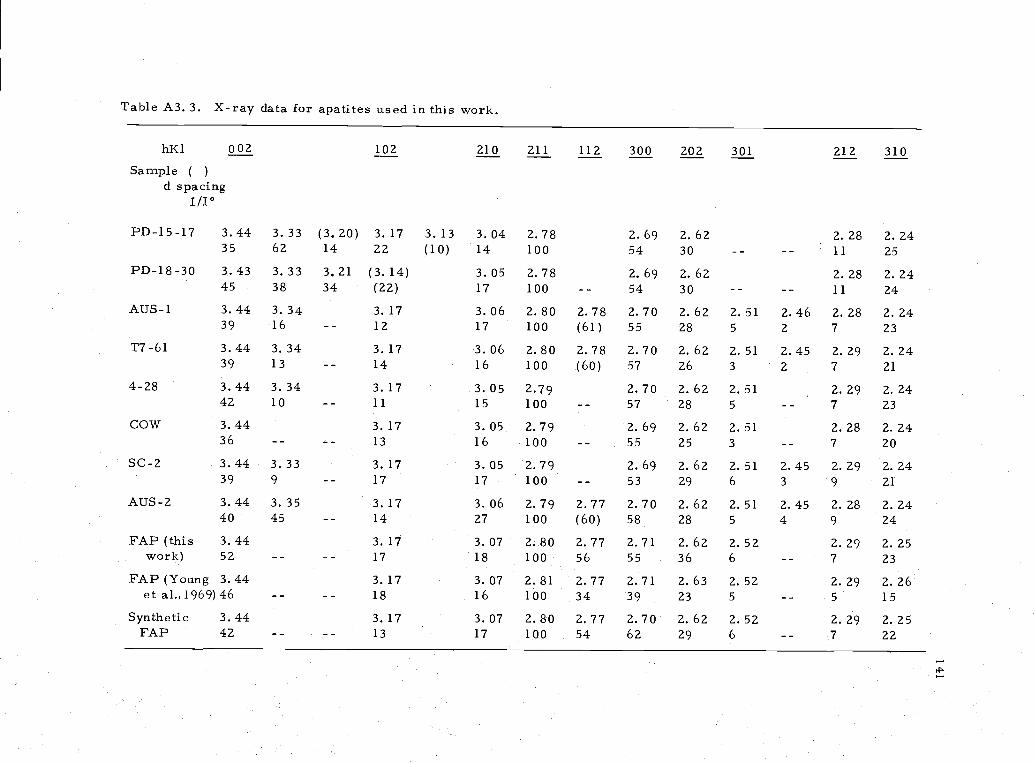
Table A3. 3. X-ray data for apatites used in this work.
hKl 002 102 210 211 112 300 202 301 212 310Sample
d spacingI/b
PD-15-17 3.44 3. 33 (3. 20) 3. 17 3. 13 3. 04 2.78 2. 69 2. 62 2. 28 2. 2435 62 14 22 (10) 14 100 54 30 -- 11 25
PD-18-30 3.43 3. 33 3. 21 (3. 14) 3.05 2.78 2. 69 2. 62 2. 28 2. 2445 38 34 (22) 17 100 -- 54 30 -- -- 11 24
AUS-1 3. 44 3. 34 3. 17 3. 06 2. 80 2. 78 2. 70 2. 62 2. 51 2. 46 2. 28 2. 2439 16 -- 12 17 100 (61) 55 28 5 2 7 23
T7-61 3.44 3. 34 3. 17 3. 06 2.80 2.78 2.70 2. 62 2. 51 2.45 2. 29 2. 2439 13 -- 14 16 100 (60) 57 26 3 2 7 21
4-28 3.44 3. 34 3. 17 3. 05 2.79 2.70 2. 62 2. 51 2. 29 2. 2442 10 -- 11 15 100 -- 57 28 5 -- 7 23
cow 3. 44 3. 17 3. 05 2. 79 2. 69 2. 62 2. 51 2. 28 2. 2436 -- -- 13 16 100 -- 55 25 3 -- 7 20
SC-2 3. 44 3. 33 3. 17 3. 05 2.79 2. 69 2. 62 2. 51 2.45 2. 29 2. 2439 9 -- 17 17 100 -- 53 29 6 3 9 21
AUS-2 3. 44 3. 35 3. 17 3. 06 2. 79 2. 77 2. 70 2. 62 2. 51 2. 45 2. 28 2. 2440 45 -- 14 27 100 (60) 58 28 5 4 9 24
FAP (this 3. 44 3. 17 3. 07 2. 80 2. 77 2. 71 2. 62 2. 52 2. 29 2. 25work) 52 -- -- 17 18 100 56 55 36 6 -- 7 23
FAP (Young 3.44 3. 17 3.07 2. 81 2.77 2.71 2. 63 2. 52 2. 29 2. 26et al.,1969)46 -- -- 18 16 100 34 39 23 5 -- 5 15
Synthetic 3. 44 3. 17 3. 07 2. 80 2. 77 2. 70 2. 62 2. 52 2. 29 2. 25FAP 42 -- -- 13 17 100 54 62 29 6 -- 7 22
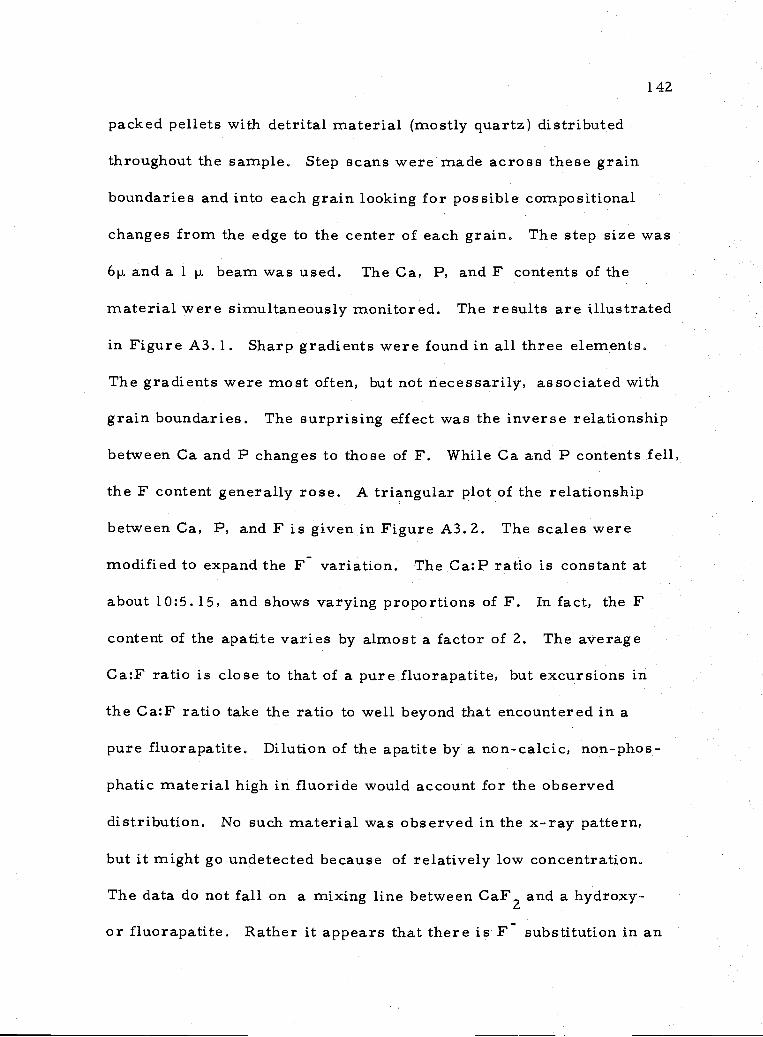
142
packed pellets with detrital material (mostly quartz) distributed
throughout the sample. Step scans were made across these grain
boundaries and into each grain looking for possible compositional
changes from the edge to the center of each grain. The step size was
6i and a 1 p. beam was used. The Ca, P, and F contents of the
material were simultaneously monitored. The results are illustrated
in Figure A3. 1. Sharp gradients were found in all three elements.
The gradients were most often, but not necessarily, associated with
grain boundaries. The surprising effect was the inverse relationship
between Ca and P changes to those of F. While Ca and P contents fell,
the F content generally rose. A triangular plot of the relationship
between Ca, P, and F is given in Figure A3. 2. The scales were
modified to expand the F variation. The Ca:P ratio is constant at
about 10:5. 15, and shows varying proportions of F. In fact, the F
content of the apati.te varies by almost a factor of 2. The average
Ca:F ratio is close to that of a pure fluorapatite, but excursions in
the Ca:F ratio take the ratio to well beyond that encountered in a
pure fluorapatite, Dilution of the apatite by a non-calcic, non-phos-
phatic material high in fluoride would account for the observed
distribution. No such material was observed in the x-ray pattern,
but it might go undetected because of relatively low concentration.
The data do not fall on a mixing line between CaF2 and a hydroxy-
or fluorapatite. Rather it appears that there is F substitution in an
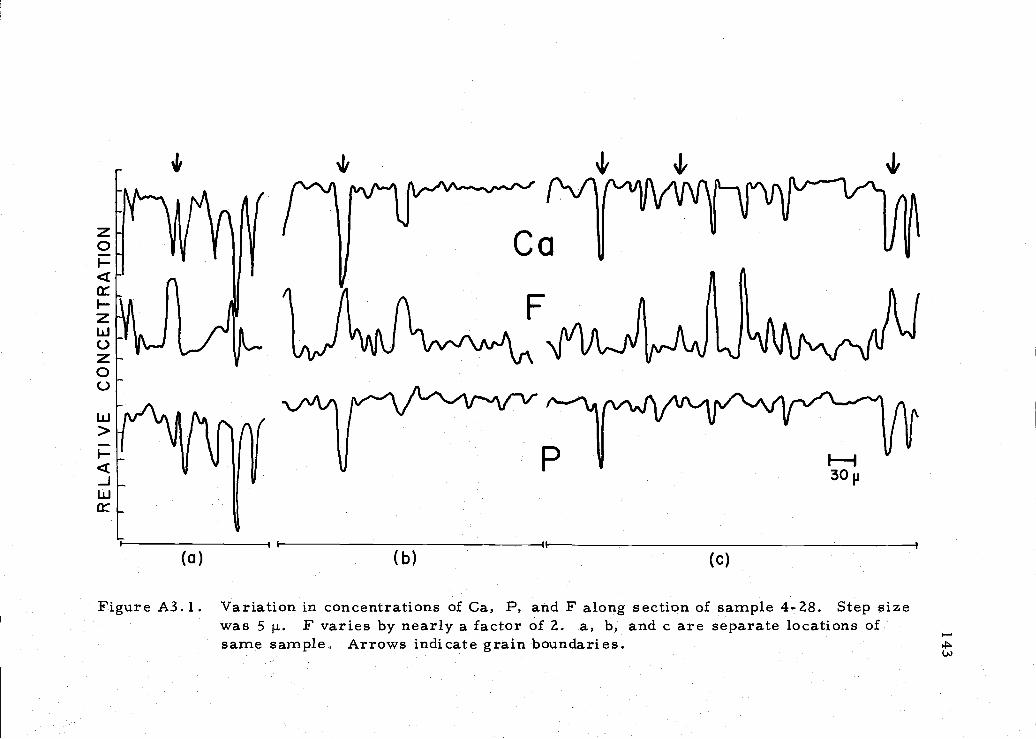
z0I
HzLU0z00
LU
>H-jLii
'if
(a) (b) (C)
Figure A3 1 Variation in concentrations of Ca, P, and F along section of sample 4-28 Step sizewas 5 ji F varies by nearly a factor of 2 a, b, and c are separate locations ofsame sample Arrows indicate grain boundaries
P F
C
F'
Ca50
30
Figure A3 2 Triangle plots of data in Figure A3 1 Scales have been adjusted to clearly show largEvariation in F at constant Ca P ratio Plot on right is expanded scale of portion ofother diagram Slope of data points indicates that F variation is not the result ofmixing with CaF2
3
145
apatitic phosphate with a Ca:P ratio of 2:1. Ideal apatite has a Ca:P
ratio of 1,67:1, though it is higher when CO32 substitutes for P043
in the apatite lattice. This behavior is similar to that proposed by
Borneman-Starjnkevitch and Belov (1953) for carbonate apatite as a
solid solution of x . Ca10(PO4)6F2 + y a10(PO4)5CO3F3.
In summary, the samples we studied are all apatitic but have
different compositions. An exact stoichiometry cannot be assigned
definitely for each apatite because of two reasons: undetermined
amounts of non-apatitic phases; and micro-compositional variation
in the apatitic phase.
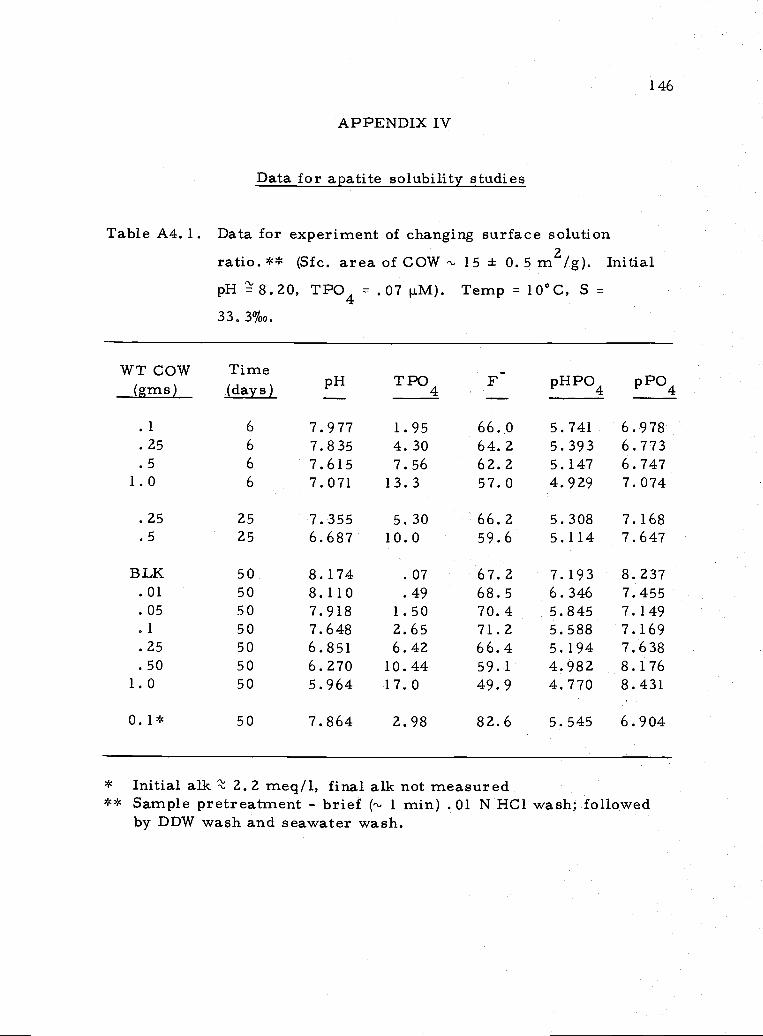
146
APPENDIX IV
Data for apatite solubility studies
Table A4. 1. Data for experiment of changing surf3ce solution
ratio. ** (Sfc. area of COW 15 ± 0. 5 m2Ig). InitialpH 8.20, TPO4 = .07 SM). Temp = 10°C, S =
33. 3%o,
WT COW Time(grns) (days) pH TPO
4F
.1 6 7.977 1.95 66.0
.25 6 7.835 4.30 64.2
.5 6 7.615 7.56 62.21.0 6 7.071 13.3 57.0
.25 25 7.355 5.30 66.2
.5 25 6.687 10.0 59.6
BLK 50 8.174 .07 67.2.01 50 8.110 .49 68.5.05 50 7.918 1.50 70.4.1 50 7.648 2.65 71.2.25 50 6.851 6.42 66.4.50 50 6.270 10.44 59.1
1.0 50 5.964 17.0 49.9
0.1* 50 7.864 2.98 82.6
pHPO4 pPO4
5.741 6.978
5.393 6.7735.147 6.747
4.929 7.074
5.308 7.1685.114 7.647
7.193 8.2376.346 7.455
5.845 7.149
5.588 7.1695.194 7.638
4.982 8.176'.((U 3.'Ji1
5.545 6.904
* Initial alk 2. 2 meq/1, final alk not measured** Sample pretreatment - brief ( 1 mm) . 01 N HC1 wash; followed
by DDW wash and seawater wash.
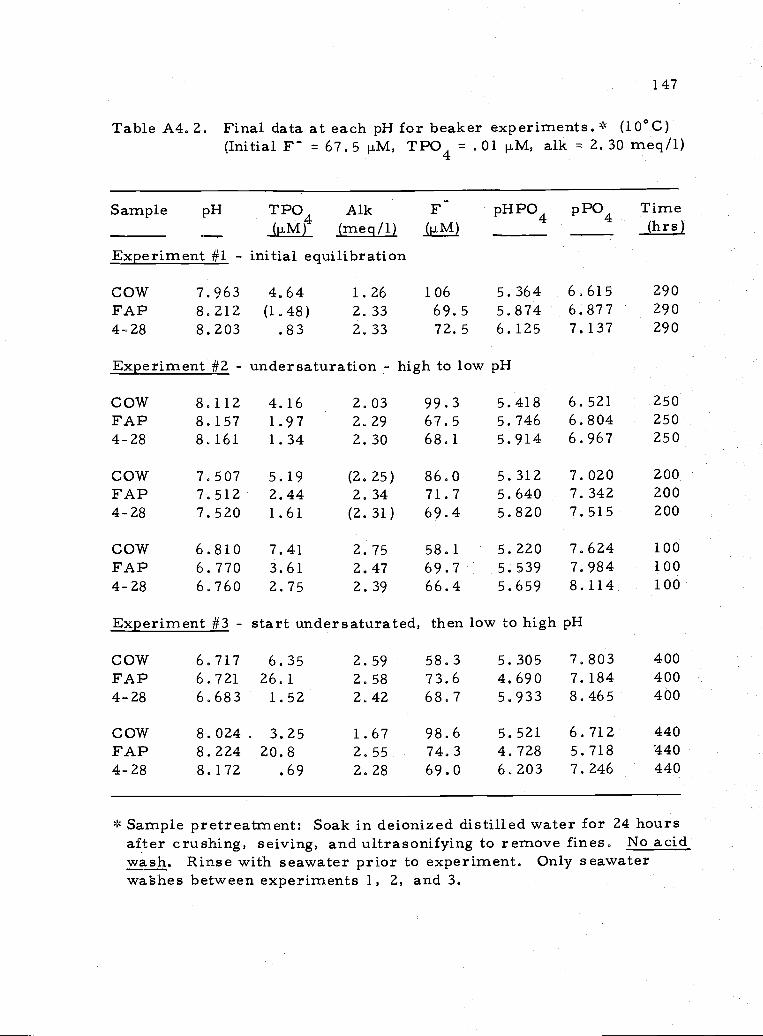
147
Table A4. 2. Final data at each pH for beaker experiments. * (100 C)
(Initial F = 67.5 M, TPO4 = .01 j.M, alk = 2. 30 meq/l)
Sample pH TPO4 Alk F pHPO4 pPO4 TimeJpM) (meg/i) (1AM) (hrs)
çperiment #1 - initial equilibration
COW 7.963 4.64 1.26 106 5.364 6.615 290FAP 8.212 (1.48) 2.33 69.5 5.874 6.877 2904-28 8.203 .83 2.33 72.5 6.125 7.137 290
Experiment #2 - undersaturation - high to low pH
COW 8.112 4.16 2.03 99.3 5.418 6.521 250FAP 8.157 1.97 2.29 67.5 5.746 6.804 2504-28 8.161 1.34 2.30 68.1 5.914 6.967 250
COW 7.507 5.19 (2.25) 86.0 5.312 7.020 200FAP 7.512 2.44 2.34 71.7 5.640 7.342 2004-28 7.520 1.61 (2.31) 69.4 5.820 7.515 200
COW 6.810 7.41 2.75 58.1 5.220 7,624 100FAP 6.770 3.61 2.47 69.7 5.539 7.984 1004-28 6.760 2.75 2.39 66.4 5.659 8.114 100
Experiment #3 start undersaturated, then low to high pH
COW 6.717 6.35 2.59 58.3 5.305 7.803 400FAP 6.721 26.1 2.58 73.6 4.690 7.184 4004-28 6.683 1.52 2.42 68.7 5,933 8.465 400
COW 8.024. 3.25 1.67 98.6 5.521 6.712 440FAP 8.224 20.8 2.55 74.3 4.728 5.718 4404-28 8.172 .69 2.28 69.0 6.203 7.246 440
* Sample pretreatment: Soak in deionized distilled water for 24 hoursafter crushing, seiving, and ultrasonifying to remove fines. No acidwash. Rinse with seawater prior to experiment. Only seawaterwa'shes between experiments 1, 2, and 3.
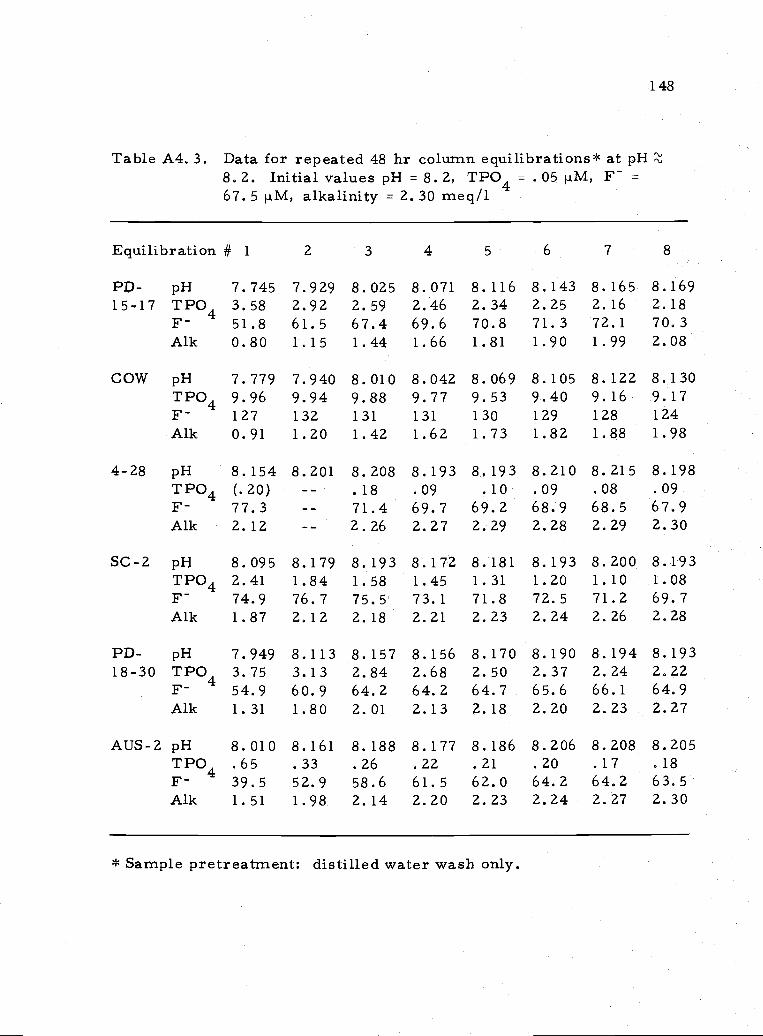
148
Table A4. 3. Data for repeated 48 hr column equilibrations* at pH8.2. Initial values pH = 8.2, TPO4 = . 05 1.LM, F67. 5 1.tM, alkalinity 2. 30 meq/l
Equilibration # 1 2 3 4 5 6 7 8
PD- pH 7.745 7.929 8.025 8.071 8.116 8.143 8.165 8.16915-17 TPO4 3.58 Z.92 2.59 2.46 2.34 2.25 2.16 2.18
F- 51.8 61.5 67.4 69.6 70.8 71.3 72.1 70.3Alk 0.80 1.15 1.44 1.66 1.81 1.90 1.99 2.08
COW pH 7.779 7.940 8.010 8.042 8.069 8.105 8,122 8.130TPO4 9.96 9.94 9.88 9.77 9.53 9.40 9.16 9.17F- 127 132 131 131 130 129 128 124Alk 0.91 1.20 1.42 1.62 1.73 1.82 1.88 1.98
4-28 pH 8.154 8.201 8.208 8.193 8.193 8.210 8.215 8.198TPO4 (.20) -- .18 .09 .10 .09 .08 .09F- 77.3 -- 71.4 69.7 69.2 68.9 68.5 67.9Alk 2.12 -- 2.26 2.27 2.29 2.28 2.29 2.30
SC-2 pH 8.095 8.179 8.193 8.172 8 181 8.193 8.200 8.193TPO4 2.41 1.84 1.58 1.45 1.31 1.20 1.10 1.08F 74.9 76.7 75.5 73.1 71.8 72.5 71.2 69.7Alk 1.87 2,12 2.18 2.21 2,23 2.24 2.26 2.28
PD- pH 7.949 8.113 8.157 8.156 8.170 8.190 8.194 8.19318-30 TPO 3.75 3.13 2.84 2.68 2.50 2.37 2.24 2.22
F- 54.9 60.9 64.2 64.2 64.7 65.6 66.1 64.9Alk 1.31 1.80 2.01 2.13 2.18 2.20 2.23 2.27
AUS-2 pH 8.010 8.161 8.188 8.177 8.186 8.206 8.208 8.205TPO4 .65 .33 .26 .22 .21 .20 .17 .18F- 39.5 52,9 58.6 61.5 62.0 64.2 64.2 63.5Alk 1.51 1.98 2.14 2.20 2.23 2.24 2.27 2.30
* Sample pretreatment: distilled water wash only.
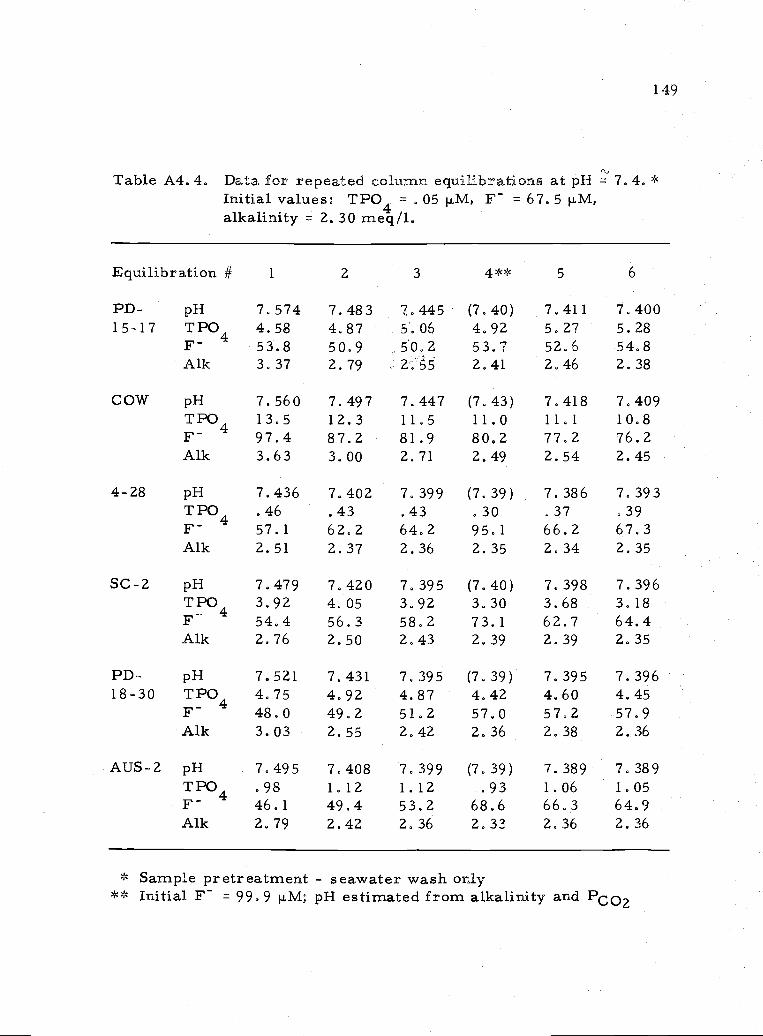
149
Table A4. 4. Data for repeated column equilibrations at pH 7. 4. *
Initial values: TPO4 , 05 tiM, F = 67. 5 ti.M,alkalinity = 2. 30 meq/l.
Equilibration # 1 2 3 4** 5 6
PD- pH 7.574 7.483 7.445 (7,40) 7.411 7.40015-17 TPO4 4.58 4.87 5.0. 4.92 5.27 5.28
F- 53.8 50.9 50.2 53.7 52.6 54.8Alk 3,37 2,79 2'5 2,41 2.46 2.38
COW pH 7.560 7,497 7.447 (7.43) 7.418 7.409TPO4 13.5 12.3 11.5 11.0 11.1 10.8F 97.4 87.2 81.9 80.2 77.2 76.2Alk 3.63 3.00 2.71 2.49 2.54 2.45
4-28 pH 7.436 7.402 7.399 (7.39) 7.386 7.393TPO4 .46 .43 .43 .30 .37 .39F 57.1 62.2 64.2 95.1 66.2 67.3Alk 2.51 2.37 2.36 2.35 2,34 2.35
SC-2 pH 7.479 7.420 7.395 (7.40) 7.398 7.396TPO4 3.92 4.05 3,92 3.30 3.68 3,18F 54,4 56.3 58.2 73,1 62.7 64.4Alk 2.76 2.50 2,43 2.39 2.39 2.35
PD- pH 7,521 7,431 7.395 (7.39) 7.395 7.39618-30 TPO4 4.75 4.92 4.87 4.42 4.60 4.45
F 48.0 49.2 51.2 57.0 57.2 57.9Alk 3.03 2.55 2,42 2.36 2.38 2.36
AUS-2 pH 7.495 7.408 7,399 (7.39) 7.389 7.389TPO4 .98 1.12 1.12 .93 1.06 1,05F 46.1 49,4 53,2 68.6 66.3 64.9Alk 2,79 2,42 2.36 2,33 2.36 2.36
* Sample pretreatment - seawater wash only** Initial F = 99, 9 tiM; pH estimated from alkalinity and
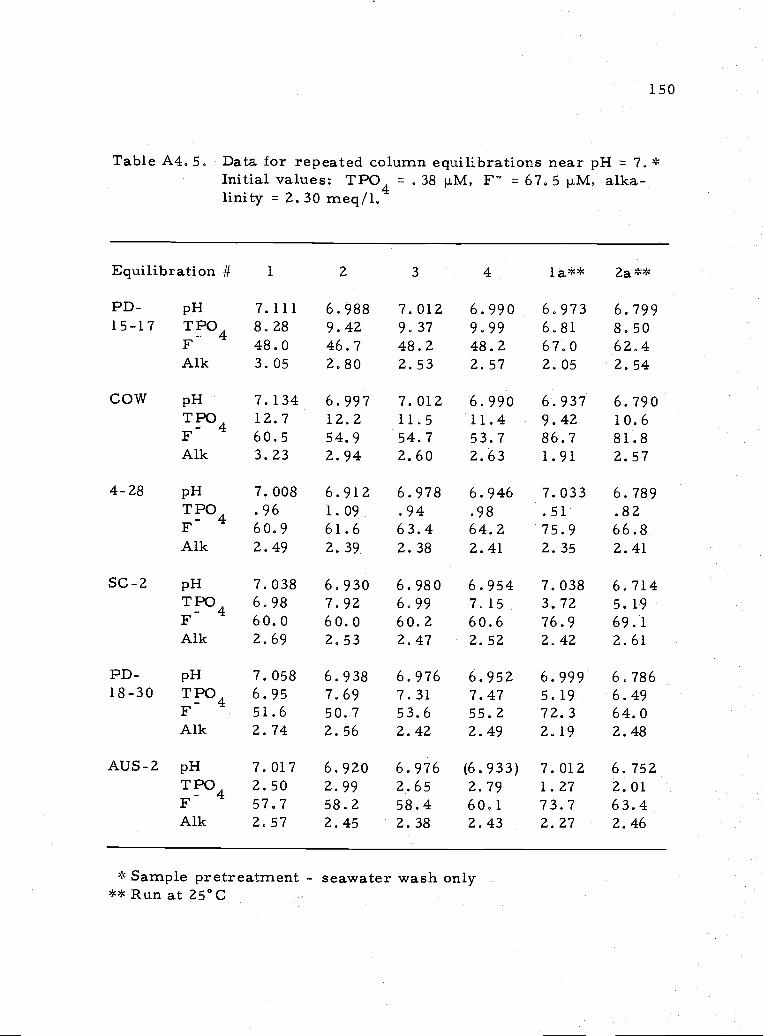
1 50
Table A4, 5. Data for repeated column equilibrations near pH = 7. *Initial values: TPO4 = , 38 F = 67.5 j,M, alka-linity 2.30 meq/l.
Equilibration # 1 2 3 4 la** 2a**
PD- pH 7.111 6.988 7.012 6.990 6.973 6.79915-17 TPO4 8.28 9.42 9.37 9.99 6.81 8.50
F 48.0 46.7 48,2 48.2 67.0 62.4Alk 3.05 2.80 2.53 2.57 2.05 2.54
COW pH 7.134 6.997 7.012 6.990 6.937 6.790TPO4 12.7 12.2 11.5 11.4 9,42 10.6F 60.5 54.9 54.7 53.7 86.7 81.8Alk 3.23 2.94 2.60 2.63 1.91 2.57
4-28 pH 7.008 6.912 6.978 6.946 7.033 6.789TPO4 .96 1.09 .94 .98 .51 .82
60.9 61.6 63.4 64.2 75.9 66.8Alk .49 2.39 2.38 2.41 2.35 2.41
SC-2 pH 7.038 6.930 6.980 6.954 7.038 6.714TPO 6.98 7.92 6.99 7,15 3.72 5.19F 60.0 60.0 60.2 60.6 76.9 69.1Alk 2.69 2.53 2.47 2,52 2.42 2.61
PD- pH 7.058 6.938 6.976 6.952 6.999 6.78618-30 TPO4 6.95 7.69 7.31 7,47 5.19 6.49
F 51.6 50.7 53.6 55.2 72.3 64.0Alk 2.74 2.56 2.42 2.49 2.19 2.48
AIJS-2 pH 7.017 6.920 6.976 (6.933) 7.012 6.752TPO4 2.50 2.99 2.65 2.79 1,27 2.01F 57.7 58.2 58.4 60.1 73.7 63.4Alk 2.57 2.45 2.38 2,43 2.27 2.46
* Sample pretreatment - seawater wash only**RunatZ5°C
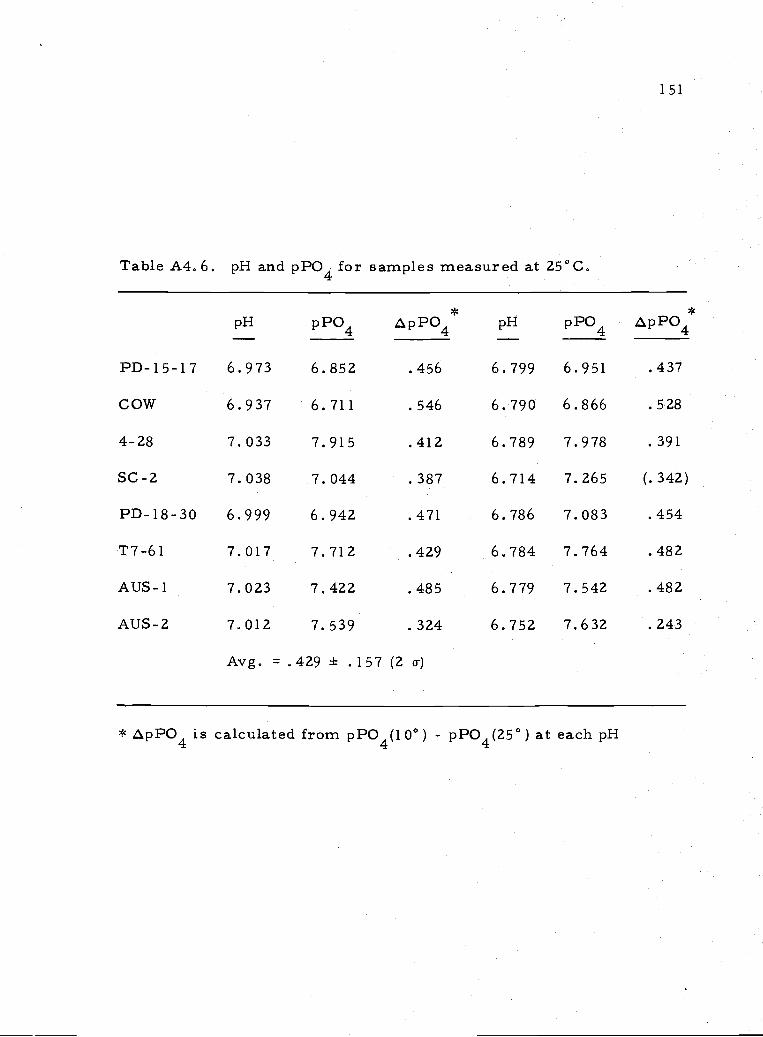
Table A4, 6. pH and pPO4 for samples measured at 25°C.
pH pPO4 pPO4
PD-15-17 6.973 6.852 .456
Cow 6.937 6.711 .546
4-28 7.033 7.915 .412
SC-2 7.038 7.044 .387
PD-18-30 6.999 6.942 .471
T7-6l 7.017 7.712 .429
AUS-1 7.023 7.422 .485
ATJS-2 7,012 7.539 .324
Avg. .429 ± .157 (2 o)
151
pH pPO4 pPO4
6.799 6.951 .437
6.790 6.866 .528
6.789 7.978 .391
6.714 7.265 (.342)
6.786 7.083 .454
6.784 7.764 .482
6.779 7.542 .482
6.752 7.632 .243
* pPO4 is calculated from pPO4(10°) - pPO4(25°) at each pH
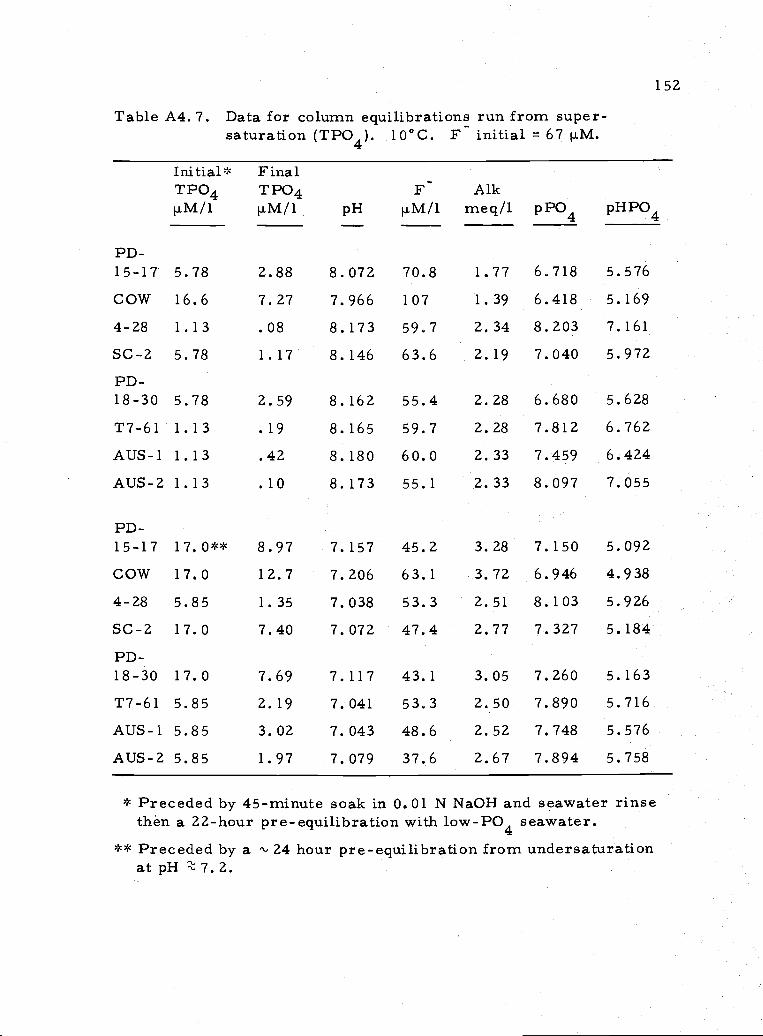
1 52
Table A4. 7. Data for column equilibrations run from super-saturation (TPO4). 10°C. F initial = 67 j.M.
Initial* FinalTPO4 TPO4 F Alk
pH .i.M/l meq/l pPO4 pHPO4
15-17 5.78 2.88 8.072 70.8 1.77 6.718 5.576
Cow 16.6 7.27 7.966 107 1.39 6.418 5.169
4-28 1.13 .08 8.173 59,7 2.34 8.203 7.161
SC-2 5.78 1.17 8.146 63.6 2.19 7.040 5.972
PD-18-30 5.78 2.59 8.162 55.4 2.28 6.680 5.628
T7-61 1.13 .19 8.165 59.7 2.28 7.812 6.762
AUS-1 1.13 .42 8.180 60.0 2.33 7.459 6.424
AUS-2 1.13 .10 8.173 55.1 2.33 8.097 7.055
PD-15-17 17.0** 8.97 7.157 45.2 3.28 7.150 5.092
Cow 17.0 12.7 7.206 63.1 3.72 6.946 4.938
4-28 5.85 1.35 7.038 53.3 2.51 8.103 5.926
SC-2 17.0 7.40 7.072 47.4 2.77 7.327 5.184
PD-18-30 17.0 7.69 7.117 43.1 3.05 7.260 5.163
T7-61 5.85 2.19 7.041 53.3 2.50 7.890 5.716Z QI I Ait ,IQ 2 7 7 7i1 c7A- S 'S 'S 1. .J 5 .5 '.5 S I tJtJ r ¼) ¼) .5 I I 5¼? .5 .5
AUS-2 5.85 1.97 7.079 37.6 2.67 7.894 5.758
* Preceded by 45-minute soak in 0. 01 N NaOH and seawater rinsethen a 22-hour pre-equilibration with low-PO4 seawater.
** Preceded by a '.. 24 hour pre-equilibration from undersaturationat pH 7.Z.
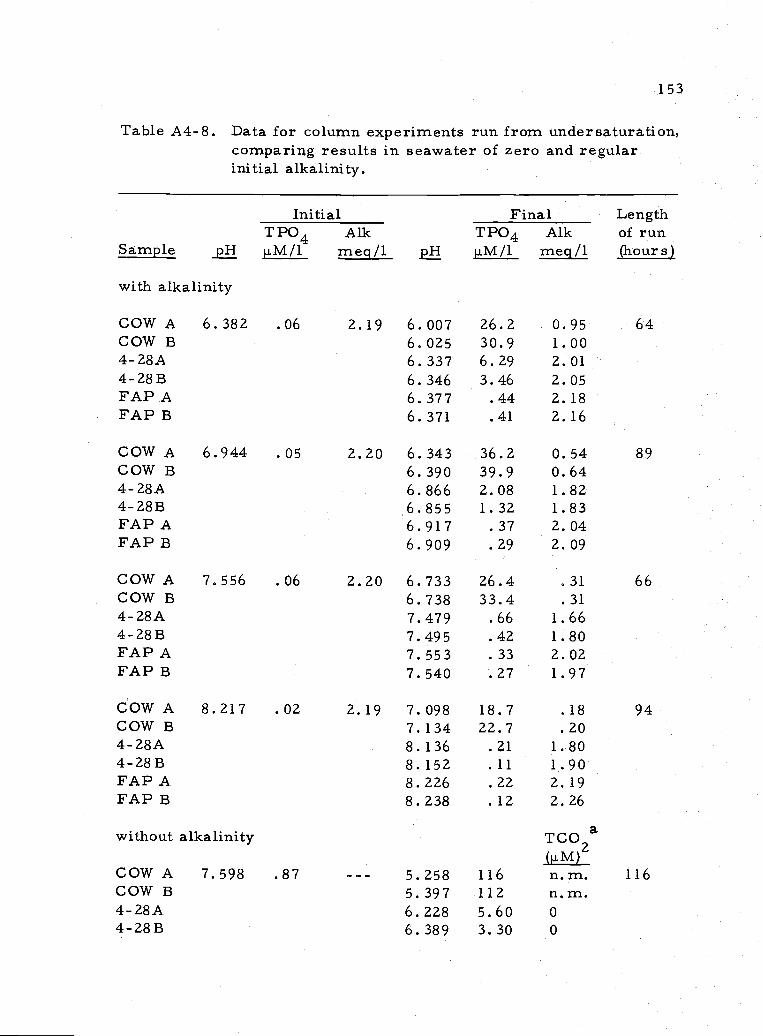
153
Table A.4-8. Data for column experiments run from under saturation,comparing results in seawater of zero and regularinitial alkalinity.
InitialTPO4 Aik
Sample p.M/l meg/i .jwith alkalinity
Final LengthTPO4 Alk of runp.M/i meg/i (hours)
COWA 6,382 .06 2.19 6.007 26.2COW B 6.025 30.94-28A 6.337 6.294-28B 6.346 3.46FAPA 6.377 .44FAPB 6.371 .41
COW A. 6.944 .05 2.20 6.343 36.2COW B 6.390 39.94-28A, 6.866 2.084-28B 6.855 1.32FAPA 6.917 .37FAPB 6.909 .29
COW A 7,556 .06 2.20 6.733 26.4COW B 6.738 33.44-28A 7.479 .664-28B 7.495 .42FAPA 7.553 .33FAPB 7.540 .27
COW A. 8.217 .02 2.19 7.098 18.7COW B 7.134 22.74-28A 8.136 .214-28B 8.152 .11FAPA. 8.226 .22FAPB 8.238 .12
without alkalinity
COW A 7.598 .87 --- 5.258 116COW B 5.397 112428A 6.228 5.604-28B 6.389 3.30
0.951.002.012.052. 182.16
0.540.641. 821.832.042. 09
31
31
1. 661 802.021.97
1820
1. 801.902. 192.26
TCO2a
(p. M)n.m.n.m.00
64
66
94
116
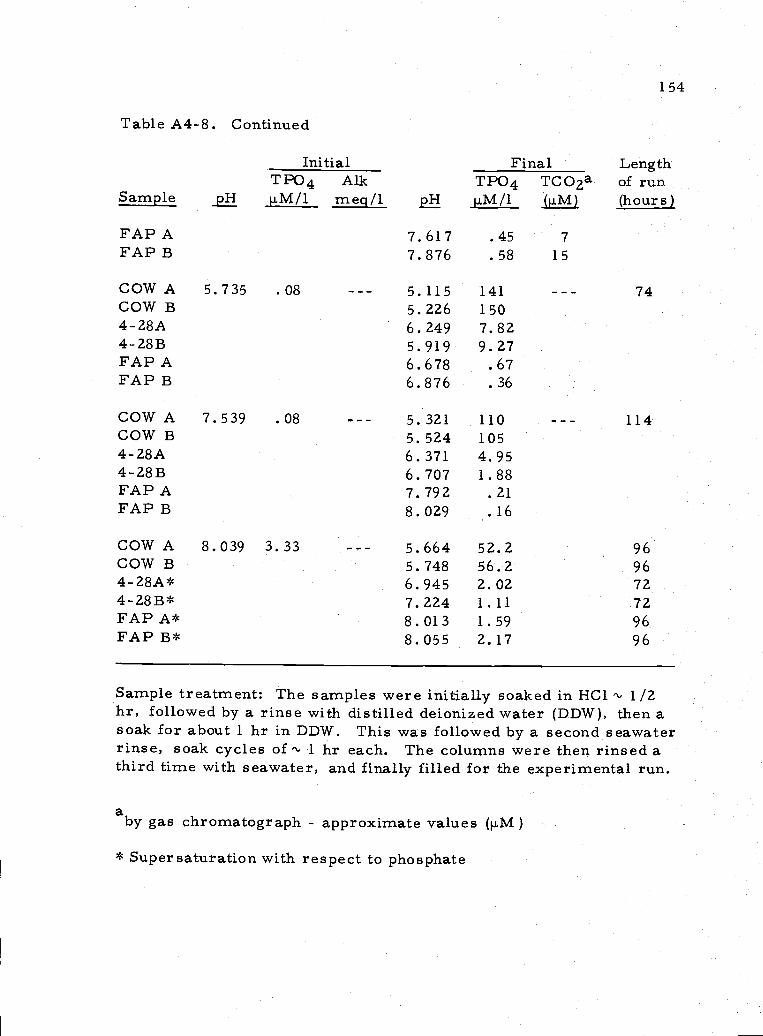
1 54
Table A4-8. Continued
Initial Final LengthTPO4 Alk TPO4 TCQ2 of run
Sample p.M/i meg/i p.M/i (p.M) (hours)
FAPA. 7.617 .45 7FAPB 7.876 .58 15
COW A 5.735 .08 --- 5.115 141 --- 74COW B 5.226 1504-28A 6.249 7.82428B 5.919 9.27FAPA 6.678 .67FAPB 6.876 .36
COWA 7.539 .08 5.321 110 114COW B 5.524 1054-28A 6.371 4.954-28B 6.707 1.88FAPA 7.792 .21FAPB 8.029 .16
COW A. 8.039 3.33 --- 5.664 52.2 96COW B 5.748 56.2 964-28A* 6.945 2.02 724-28B* 7.224 1.11 72FAPA.* 8.013 1.59 96FAP B* 8.055 2,17 96
Sample treatment: The samples were initially soaked in HCI " 1/2hr, followed by a rinse with distilled deionized water (DDW), then asoak for about 1 hr in DDW. This was followed by a second seawaterrinse, soak cycles of 1 hr each. The columns were then rinsed athird time with seawater, and finally filled for the experimental run.
abY gas chromatograph - approximate values (p.M)
* Supersaturation with respect to phosphate
Related Documents