Recent Changes in Life and Disability-Free Life Expectancy in China: Do They Vary by Residence and Education? Zachary Zimmer (University of California San Francisco) Mira Hidajat (Texas Department of State Health Services) Yasuhiko Saito (Nihon University)

Welcome message from author
This document is posted to help you gain knowledge. Please leave a comment to let me know what you think about it! Share it to your friends and learn new things together.
Transcript

Recent Changes in Life and Disability-Free Life Expectancy in China:
Do They Vary by Residence and Education?
Zachary Zimmer (University of California San Francisco) Mira Hidajat (Texas Department of State Health Services)
Yasuhiko Saito (Nihon University)

China is among the world’s most rapidly ageing countries both in terms of numbers of aged and percent of total.
China’s demographic transformation
0
5
10
15
20
25
30
0
50
100
150
200
250
300
350
1950 1960 1970 1980 1990 2000 2010 2020 2030 2040 2050 Pe
rce
nt
of
tota
l po
pu
lati
on
age
d 6
5+
Po
pu
lati
on
65
+ in
mill
ion
s
Year
Population aged 65+ in China, 1950 to 2050
Population in millions
Percent of total
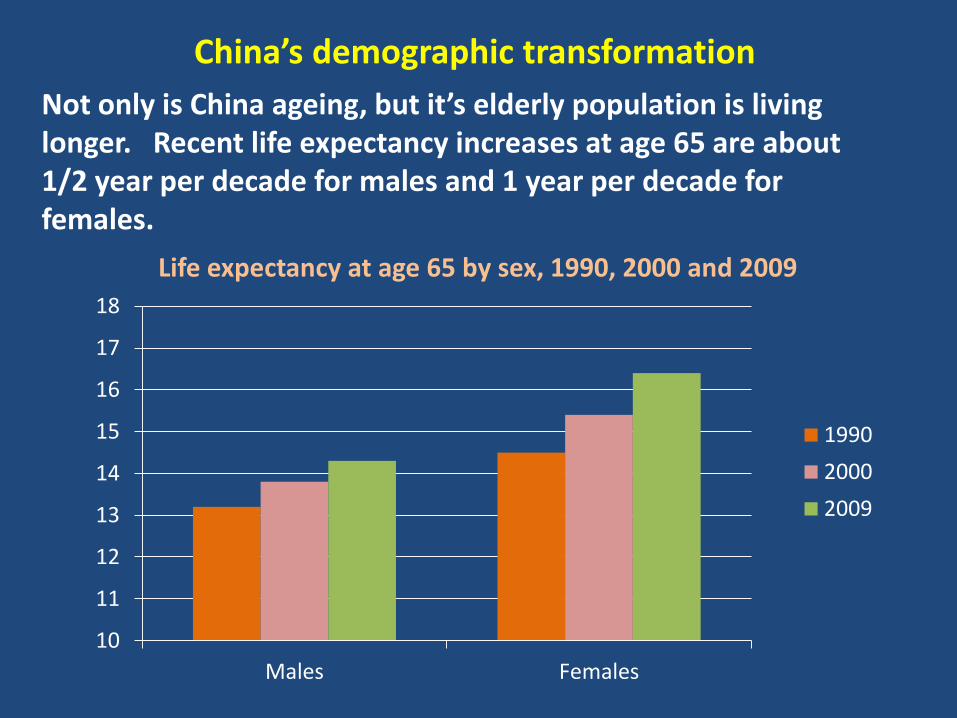
Not only is China ageing, but it’s elderly population is living longer. Recent life expectancy increases at age 65 are about 1/2 year per decade for males and 1 year per decade for females.
China’s demographic transformation
10
11
12
13
14
15
16
17
18
Males Females
Life expectancy at age 65 by sex, 1990, 2000 and 2009
1990
2000
2009

Are increases in old-age longevity accompanied by comparable increases in morbidity free longevity in China, i.e., a compression of morbidity? Thus far, the answer to this question has largely been examined by investigating ‘trends’ in ADL disability. Results have been mixed e.g.,:
Increased longevity and disability-free life expectancy in China
Gu et al. 2009 Feng et al. 2013 Zimmer et al. 2014
Journal Social Science and Medicine
Journal of Gerontology: Social Sciences
Research on Aging
Study years 1992 to 2002 1998 to 2008 1992 to 2007
Coverage Nation wide Shanghai Beijing
Main finding Non-significant ADL declines
Significant ADL declines ADL declines differed by sex. Increased for men; was stable for women

Do recent changes in disability-free life expectancy in China indicate a compression of morbidity? Is a compression of morbidity consistent across key socio-demographic characteristics?
Current study
1. Where you live? Urban population in China is rapidly increasing. Hit the 50% mark in 2010. 2. How much education do you have? Percent educated rapidly increasing, even among elderly populations.
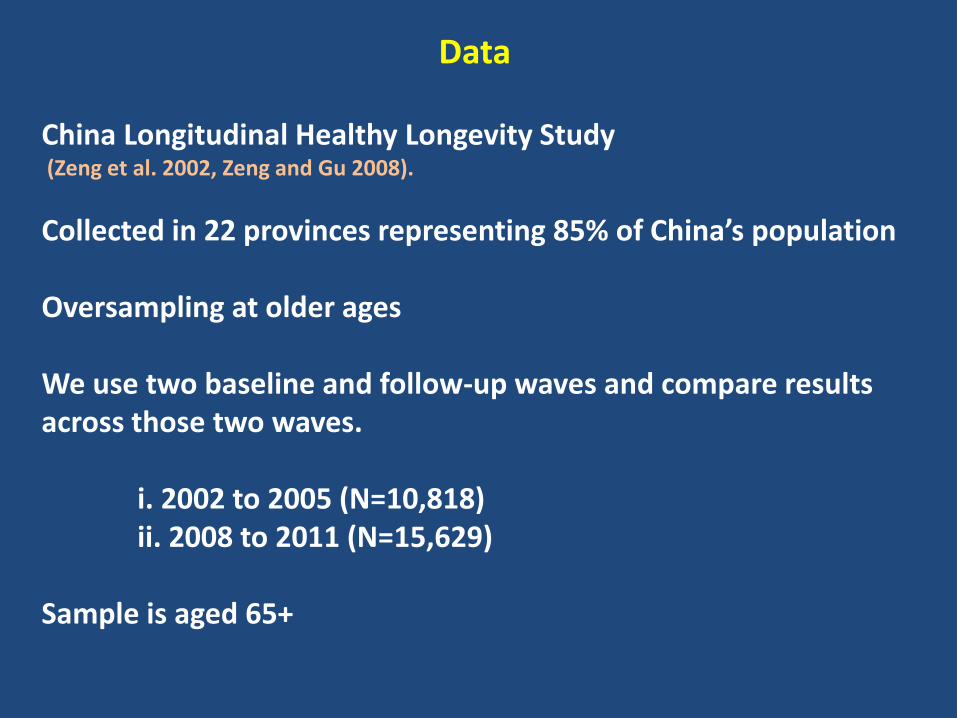
China Longitudinal Healthy Longevity Study (Zeng et al. 2002, Zeng and Gu 2008).
Collected in 22 provinces representing 85% of China’s population Oversampling at older ages We use two baseline and follow-up waves and compare results across those two waves. i. 2002 to 2005 (N=10,818) ii. 2008 to 2011 (N=15,629) Sample is aged 65+
Data

Measures
At baseline (2002 and 2008) At Follow-up (2005 and 2011) Has a disability Status at follow-up yes/no disability bathing, continence, dressing, feeding, no disability getting up from a bed or chair, toileting deceased lost to follow-up Sex male/female Education primary or less/more than primary Residence rural/urban

MALES FEMALES
Baseline year 2002 2008 2002 2008
N 4519 6626 6299 9003
Mean age 72.0 72.8 73.1 73.7
% primary + education
40.7 52.1 11.5 20.3
% urban residents 35.4 44.2 35.0 44.2
Follow-up rate 87.8 86.0 85.8 85.0
Sample characteristics at baseline and follow-up rate

Analytical strategy
1. Examine disability prevalence and mortality across two periods: 2002-05 and 2008-11. 2. Compute TLE and DFLE for the two periods. 3. Compression of morbidity indicated by: a. greater positive increase in DFLE versus TLE between the two period, and; b. higher ratio of DFLE to TLE in the second period

Estimation
1. Survival models estimated using an exponential distribution. 2. Covariates transformed into life table values. 3. Standard errors for ex calculated (Chiang 1984).
4. Disability prevalence determined as average of baseline and follow-up rates in five year age groups. 5. Disability life expectancy computed using Sullivan method as in Jagger et al., 2006.

Two models examined
1. By age and sex 2. By age and sex across four baseline sub-group: I. lower educated rural residents II. higher educated rural residents III. lower educated urban residents IV. higher educated urban residents

Disability prevalence, mortality rates, total life expectancy and disability-free life expectancy by age and sex, comparing 2002-05 to 2008-11
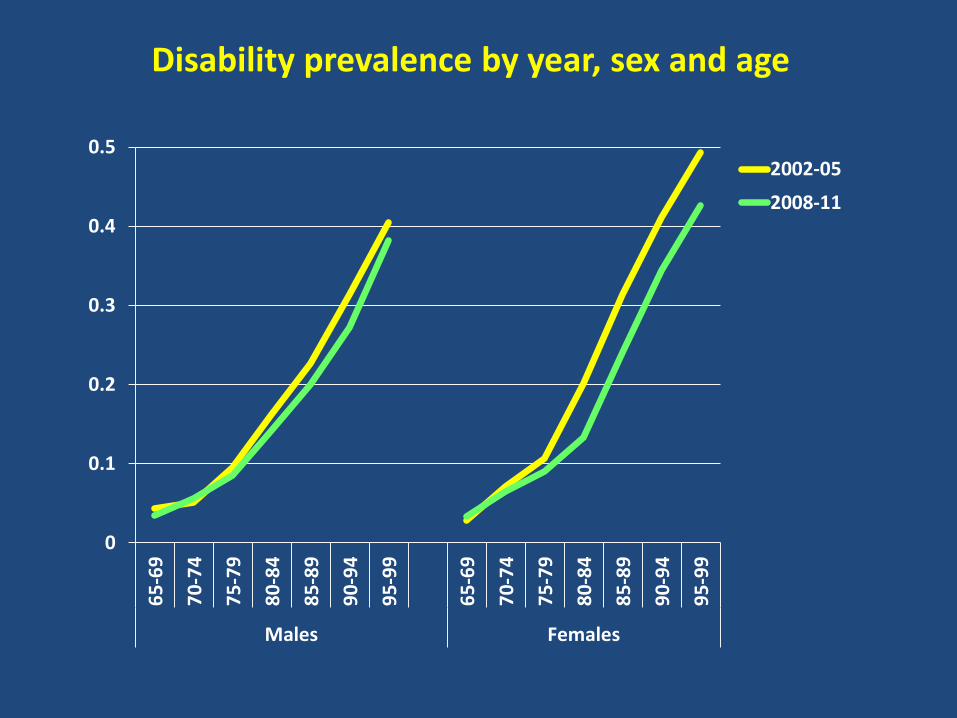
Disability prevalence by year, sex and age
0
0.1
0.2
0.3
0.4
0.56
5-6
9
70
-74
75
-79
80
-84
85
-89
90
-94
95
-99
65
-69
70
-74
75
-79
80
-84
85
-89
90
-94
95
-99
Males Females
2002-05
2008-11

Average annual mortality rate per 1,000 by baseline year, sex and age
0
20
40
60
80
100
120
140
160
180
2006
5-6
9
70
-74
75
-79
80
-84
85
-89
90
+
65
-69
70
-74
75
-79
80
-84
85
-89
90
+
Male Females
2002-05
2008-11

Total and disability free life expectancy estimates, and 95% CI’s, for three age groups, year and sex:
TLE DFLE
11.5
12.0
12.5
13.0
13.5
14.0
14.5
15.0
15.5
16.0
16.5
17.0
17.5
2002 20082002 2008
Males Females
Age 65-69
6.5
7.0
7.5
8.0
8.5
9.0
9.5
10.0
10.5
11.0
2002 20082002 2008
Males Females
Age 75-79
3.5
4.0
4.5
5.0
5.5
6.0
6.5
7.0
2002 20082002 2008
Males Females
Age 85-89
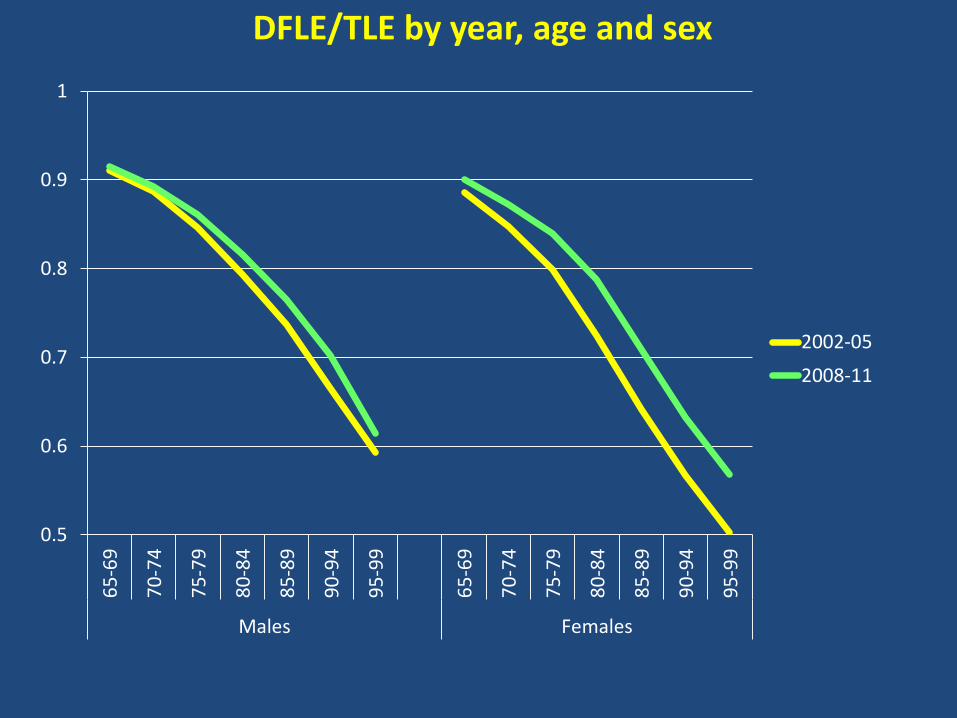
DFLE/TLE by year, age and sex
0.5
0.6
0.7
0.8
0.9
16
5-6
9
70
-74
75
-79
80
-84
85
-89
90
-94
95
-99
65
-69
70
-74
75
-79
80
-84
85
-89
90
-94
95
-99
Males Females
2002-05
2008-11

0
2
4
6
8
10
12
14
16
18
20
65 70 75 80 85 90 95 65 70 75 80 85 90 95
Males Females
Pe
rce
nt
AGE
Percent change in TLE and DFLE, 2002-05 to 2008-11, by age and sex
TLE DFLE

I. Low educated / rural II. High educated / rural III. Low educated /urban IV. High educated /urban
Disability prevalence, mortality, total life expectancy and disability-free life expectancy
by age and sex, comparing 2002-05 to 2008-11, across four groups

Disability prevalence by year, sex, age, education and residence
2002-05 2008-11
0
0.1
0.2
0.3
0.4
0.5
65
-69
70
-74
75
-79
80
-84
85
-89
90
-94
65
-69
70
-74
75
-79
80
-84
85
-89
90
-94
Males Females
I. Low education, rural
0
0.1
0.2
0.3
0.4
0.5
65
-69
70
-74
75
-79
80
-84
85
-89
90
-94
65
-69
70
-74
75
-79
80
-84
85
-89
90
-94
Males Females
II. High education, rural
0
0.1
0.2
0.3
0.4
0.5
65
-69
70
-74
75
-79
80
-84
85
-89
90
-94
65
-69
70
-74
75
-79
80
-84
85
-89
90
-94
Males Females
III. Low education, urban
0
0.1
0.2
0.3
0.4
0.5
65
-69
70
-74
75
-79
80
-84
85
-89
90
-94
65
-69
70
-74
75
-79
80
-84
85
-89
90
-94
Males Females
IV. High education, urban
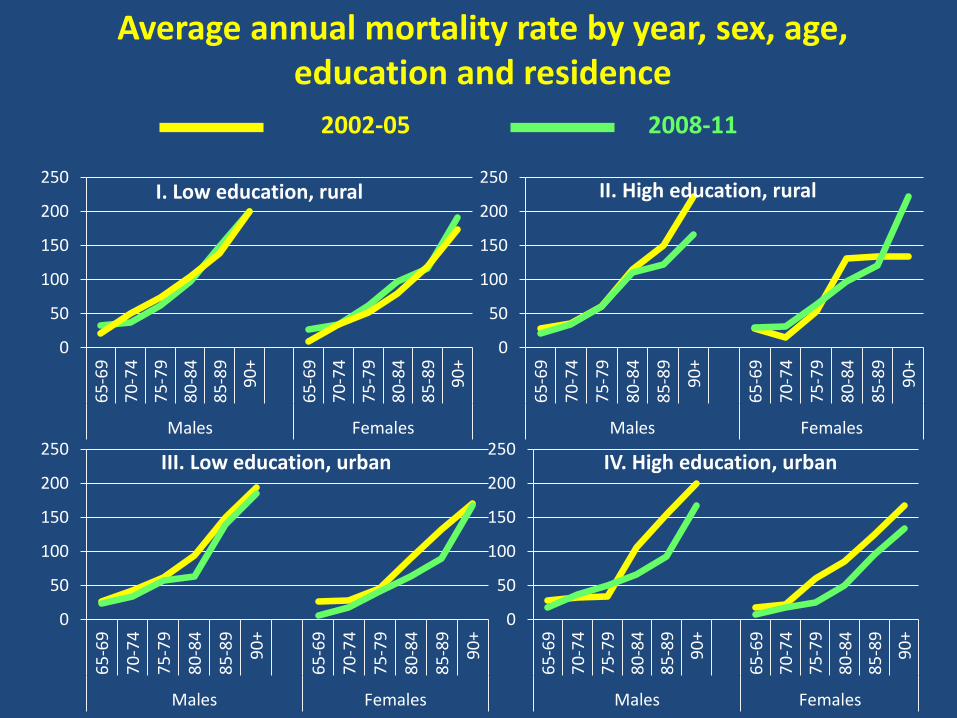
Average annual mortality rate by year, sex, age, education and residence
2002-05 2008-11
0
50
100
150
200
250
65
-69
70
-74
75
-79
80
-84
85
-89
90
+
65
-69
70
-74
75
-79
80
-84
85
-89
90
+
Males Females
I. Low education, rural
0
50
100
150
200
250
65
-69
70
-74
75
-79
80
-84
85
-89
90
+
65
-69
70
-74
75
-79
80
-84
85
-89
90
+
Males Females
II. High education, rural
0
50
100
150
200
250
65
-69
70
-74
75
-79
80
-84
85
-89
90
+
65
-69
70
-74
75
-79
80
-84
85
-89
90
+
Males Females
III. Low education, urban
0
50
100
150
200
250
65
-69
70
-74
75
-79
80
-84
85
-89
90
+
65
-69
70
-74
75
-79
80
-84
85
-89
90
+
Males Females
IV. High education, urban
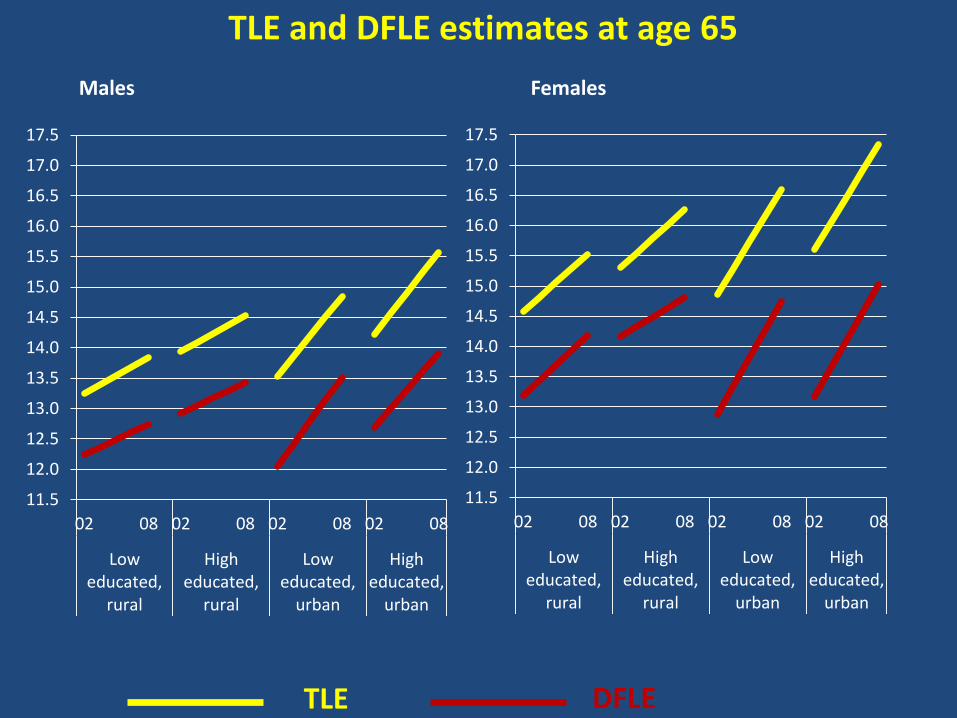
TLE and DFLE estimates at age 65
11.5
12.0
12.5
13.0
13.5
14.0
14.5
15.0
15.5
16.0
16.5
17.0
17.5
02 08 02 08 02 08 02 08
Loweducated,
rural
Higheducated,
rural
Loweducated,
urban
Higheducated,
urban
Males
11.5
12.0
12.5
13.0
13.5
14.0
14.5
15.0
15.5
16.0
16.5
17.0
17.5
02 08 02 08 02 08 02 08
Loweducated,
rural
Higheducated,
rural
Loweducated,
urban
Higheducated,
urban
Females
TLE DFLE

DFLE/TLE by year, sex, age, education and residence
2002-05 2008-11
0.4
0.5
0.6
0.7
0.8
0.9
1.0
65
-69
70
-74
75
-79
80
-84
85
-89
90
-94
65
-69
70
-74
75
-79
80
-84
85
-89
90
-94
Males Females
I. Low education, rural
0.4
0.5
0.6
0.7
0.8
0.9
1.0
65
-69
70
-74
75
-79
80
-84
85
-89
90
-94
65
-69
70
-74
75
-79
80
-84
85
-89
90
-94
Males Females
II. High education, rural
0.4
0.5
0.6
0.7
0.8
0.9
1.0
65
-69
70
-74
75
-79
80
-84
85
-89
90
-94
65
-69
70
-74
75
-79
80
-84
85
-89
90
-94
Males Females
III. Low education, urban
0.4
0.5
0.6
0.7
0.8
0.9
1.0
65
-69
70
-74
75
-79
80
-84
85
-89
90
-94
65
-69
70
-74
75
-79
80
-84
85
-89
90
-94
Males Females
IV. High education, urban
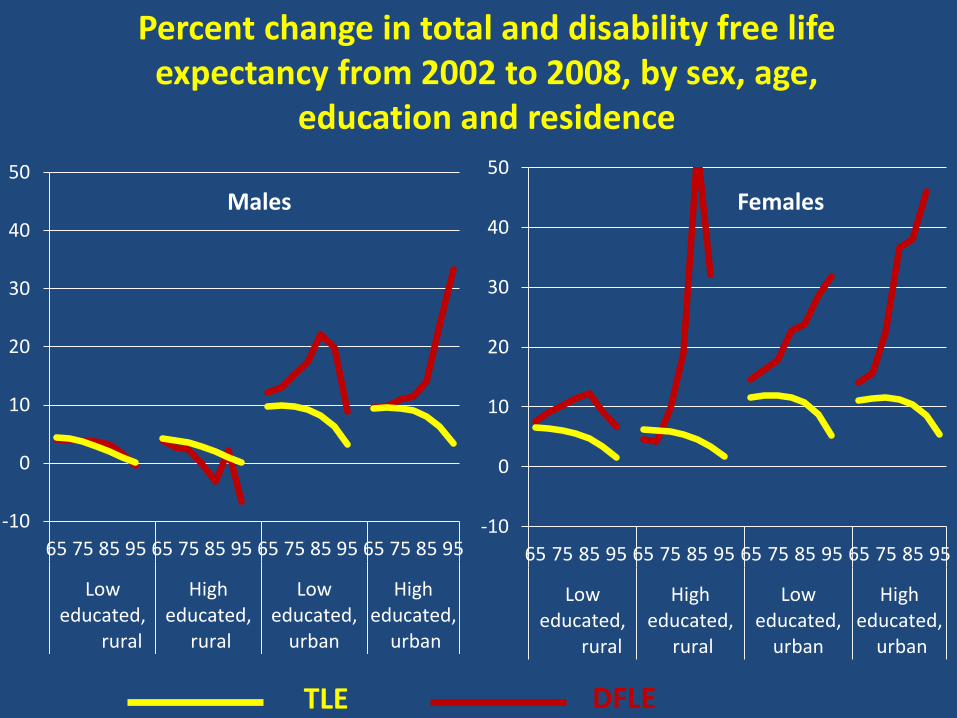
-10
0
10
20
30
40
50
65 75 85 95 65 75 85 95 65 75 85 95 65 75 85 95
Loweducated, rural
Higheducated,
rural
Loweducated,
urban
Higheducated,
urban
Males
-10
0
10
20
30
40
50
65 75 85 95 65 75 85 95 65 75 85 95 65 75 85 95
Loweducated, rural
Higheducated,
rural
Loweducated,
urban
Higheducated,
urban
Females
Percent change in total and disability free life expectancy from 2002 to 2008, by sex, age,
education and residence
TLE DFLE

Conclusions 1. Overall, a compression of morbidity is seen among older persons in China. 2. The compression of morbidity is more robust for women versus men. 3. The compression of morbidity for men is concentrated among those in urban areas. For women, the compression is robust for urbanites as well. Limitations to the study include: - Short follow-up period - Small N’s for educated females - Loss to follow up means mortality likely underestimated
Related Documents