Quantitative expression profiling of highly degraded RNA from formalin-fixed, paraffin-embedded breast tumor biopsies by oligonucleotide microarrays Maria Ravo 1, * , Margherita Mutarelli 1,2,3, * , Lorenzo Ferraro 1 , Olı ´ Maria Victoria Grober 1,2 , Ornella Paris 1,2 , Roberta Tarallo 1,2 , Alessandra Vigilante 1 , Daniela Cimino 4 , Michele De Bortoli 5 , Ernesto Nola 1 , Luigi Cicatiello 1 and Alessandro Weisz 1,2 Microarray-based gene expression profiling is well suited for parallel quantitative analysis of large numbers of RNAs, but its application to cancer biopsies, particularly formalin-fixed, paraffin-embedded (FFPE) archived tissues, is limited by the poor quality of the RNA recovered. This represents a serious drawback, as FFPE tumor tissue banks are available with clinical and prognostic annotations, which could be exploited for molecular profiling studies, provided that reliable analytical technologies are found. We applied and evaluated here a microarray-based cDNA-mediated annealing, selection, extension and ligation (DASL) assay for analysis of 502 mRNAs in highly degraded total RNA extracted from cultured cells or FFPE breast cancer (MT) biopsies. The study included quantitative and qualitative comparison of data obtained by analysis of the same RNAs with genome-wide oligonucleotide microarrays vs DASL arrays and, by DASL, before and after extensive in vitro RNA fragmentation. The DASL-based expression profiling assay applied to RNA extracted from MCF-7 cells, before or after 24 h stimulation with a mitogenic dose of 17b-estradiol, consistently allowed to detect hormone-induced gene expression changes following extensive RNA degradation in vitro. Comparable results where obtained with tumor RNA extracted from FFPE MT biopsies (6 to 19 years old). The method proved itself sensitive, reproducible and accurate, when compared to results obtained by microarray analysis of RNA extracted from snap-frozen tissue of the same tumor. Laboratory Investigation (2008) 88, 430–440; doi:10.1038/labinvest.2008.11; published online 25 February 2008 KEYWORDS: breast cancer; estrogen; expression profiling; FFPE; microarrays Breast cancer (MT) is a heterogeneous and complex disease, characterized by molecular and genetic diversity, which causes qualitatively and quantitatively aberrant gene expression, and, as a result, significantly divergent biological and clinical be- haviors. Subtle differences in the expression of a limited number of genes among otherwise undistinguishable MTs may indeed underscore substantial differences in the prognostic outcome of the disease, in particular concerning its recurrence and responsiveness to therapy. Treatment decisions, as well as prognostic evaluation, are currently guided by efforts to de- termine ‘ a priori,’ at the time of diagnosis or surgical removal of the primary lesion, the metastatic potential of the disease. Clinical variables that reflect this potential, including tumor size, histological grade and lymph node status, or that help predict responsiveness to chemotherapy or targeted therapy (hormone receptor status, HER-NEU oncogene amplification/ overexpression, and so on) are routinely used to classify tumors into subtypes predictive of outcome. These parameters, how- ever, are unable to predict with sufficient accuracy patients that will primarily benefit from a given therapy, and it is currently accepted that the ability to precisely determine the molecular profile of a tumor at diagnosis would provide the clinician with information relevant for an individualized medicine, including selection of the most appropriate therapy regimen. Received 03 November 2007; accepted 18 January 2008 1 Dipartimento di Patologia generale and Centro Grandi Apparecchiature, Seconda Universita ` degli Studi di Napoli, Napoli, Italy; 2 AIRC Naples Oncogenomics Center, Napoli, Italy; 3 Istituto di Scienze dell’Alimentazione, Consiglio Nazionale delle Ricerche (ISA-CNR), Avellino, Italy; 4 Istituto per la Ricerca e la Cura del Cancro, Candiolo (TO), Italy and 5 Dipartimento di Scienze Oncologiche and Centro Interdipartimentale Sistemi Complessi in Biologia e Medicina Molecolare, Universita ` degli Studi di Torino, Turin, Italy Correspondence: A Weisz, MD, Dipartimento di Patologia generale, Seconda Universita ` degli Studi di Napoli, vico L De Crecchio 7, Napoli 80138, Italy. E-mail: [email protected] *These authors contributed equally to this work, and should thereby both considered as first author. Laboratory Investigation (2008) 88, 430–440 & 2008 USCAP, Inc All rights reserved 0023-6837/08 $30.00 430 Laboratory Investigation | Volume 88 April 2008 | www.laboratoryinvestigation.org

Welcome message from author
This document is posted to help you gain knowledge. Please leave a comment to let me know what you think about it! Share it to your friends and learn new things together.
Transcript
Quantitative expression profiling of highly degradedRNA from formalin-fixed, paraffin-embedded breasttumor biopsies by oligonucleotide microarraysMaria Ravo1,*, Margherita Mutarelli1,2,3,*, Lorenzo Ferraro1, Olı Maria Victoria Grober1,2, Ornella Paris1,2,Roberta Tarallo1,2, Alessandra Vigilante1, Daniela Cimino4, Michele De Bortoli5, Ernesto Nola1, Luigi Cicatiello1
and Alessandro Weisz1,2
Microarray-based gene expression profiling is well suited for parallel quantitative analysis of large numbers of RNAs,but its application to cancer biopsies, particularly formalin-fixed, paraffin-embedded (FFPE) archived tissues, is limitedby the poor quality of the RNA recovered. This represents a serious drawback, as FFPE tumor tissue banks are availablewith clinical and prognostic annotations, which could be exploited for molecular profiling studies, provided that reliableanalytical technologies are found. We applied and evaluated here a microarray-based cDNA-mediated annealing,selection, extension and ligation (DASL) assay for analysis of 502 mRNAs in highly degraded total RNA extracted fromcultured cells or FFPE breast cancer (MT) biopsies. The study included quantitative and qualitative comparison of dataobtained by analysis of the same RNAs with genome-wide oligonucleotide microarrays vs DASL arrays and, by DASL,before and after extensive in vitro RNA fragmentation. The DASL-based expression profiling assay applied to RNAextracted from MCF-7 cells, before or after 24 h stimulation with a mitogenic dose of 17b-estradiol, consistently allowedto detect hormone-induced gene expression changes following extensive RNA degradation in vitro. Comparable resultswhere obtained with tumor RNA extracted from FFPE MT biopsies (6 to 19 years old). The method proved itself sensitive,reproducible and accurate, when compared to results obtained by microarray analysis of RNA extracted from snap-frozentissue of the same tumor.Laboratory Investigation (2008) 88, 430–440; doi:10.1038/labinvest.2008.11; published online 25 February 2008
KEYWORDS: breast cancer; estrogen; expression profiling; FFPE; microarrays
Breast cancer (MT) is a heterogeneous and complex disease,characterized by molecular and genetic diversity, which causesqualitatively and quantitatively aberrant gene expression, and,as a result, significantly divergent biological and clinical be-haviors. Subtle differences in the expression of a limitednumber of genes among otherwise undistinguishable MTs mayindeed underscore substantial differences in the prognosticoutcome of the disease, in particular concerning its recurrenceand responsiveness to therapy. Treatment decisions, as well asprognostic evaluation, are currently guided by efforts to de-termine ‘a priori,’ at the time of diagnosis or surgical removal ofthe primary lesion, the metastatic potential of the disease.
Clinical variables that reflect this potential, including tumorsize, histological grade and lymph node status, or that helppredict responsiveness to chemotherapy or targeted therapy(hormone receptor status, HER-NEU oncogene amplification/overexpression, and so on) are routinely used to classify tumorsinto subtypes predictive of outcome. These parameters, how-ever, are unable to predict with sufficient accuracy patients thatwill primarily benefit from a given therapy, and it is currentlyaccepted that the ability to precisely determine the molecularprofile of a tumor at diagnosis would provide the clinician withinformation relevant for an individualized medicine, includingselection of the most appropriate therapy regimen.
Received 03 November 2007; accepted 18 January 2008
1Dipartimento di Patologia generale and Centro Grandi Apparecchiature, Seconda Universita degli Studi di Napoli, Napoli, Italy; 2AIRC Naples Oncogenomics Center,Napoli, Italy; 3Istituto di Scienze dell’Alimentazione, Consiglio Nazionale delle Ricerche (ISA-CNR), Avellino, Italy; 4Istituto per la Ricerca e la Cura del Cancro, Candiolo(TO), Italy and 5Dipartimento di Scienze Oncologiche and Centro Interdipartimentale Sistemi Complessi in Biologia e Medicina Molecolare, Universita degli Studi diTorino, Turin, ItalyCorrespondence: A Weisz, MD, Dipartimento di Patologia generale, Seconda Universita degli Studi di Napoli, vico L De Crecchio 7, Napoli 80138, Italy.E-mail: [email protected]*These authors contributed equally to this work, and should thereby both considered as first author.
Laboratory Investigation (2008) 88, 430–440
& 2008 USCAP, Inc All rights reserved 0023-6837/08 $30.00
430 Laboratory Investigation | Volume 88 April 2008 | www.laboratoryinvestigation.org
Several studies using gene expression profiling of tumorsamples with microarrays have shown that clinical hetero-geneity of MT may be resolved at the molecular level and,more important, that gene expression signatures underlyingspecific biological properties of cancer cells provide betterstratification of patients than established prognostic vari-ables.1–5 However, the different molecular predictor geneprofiles discovered so far were not found always concordantfor classification of the risk of recurrence and death, whenevaluated in a single MT cohort.6,7 Furthermore, the twomain prognostic gene signatures derived so far2,5 do notvalidate in the other’s data set, even when cohort differencesare taken into account,8,9 raising questions about the trueclinical usefulness of the molecular signatures being currentlyproposed.10
The basis for such uncertainties can be only partly ex-plained on technical and conceptual grounds. The wide dif-ferences in inclusion criteria of patients, evaluation of diseaseoutcome and protocols of treatment among the different MTcohorts from different studies make it difficult to correctlycompare the effective prognostic power of each molecularsignature, while comparison of gene expression data gener-ated with different microarray platforms and evaluated withdifferent statistical tools is, at present, quite unreliable. Thelatter problem is being addressed by the MicroArray QualityControl (MAQC) project,11 which aims at improvinginter- and intraplatform reproducibility of gene expressionmeasurements, but the former one needs a substantial im-provement in study design. Ein-Dor et al8 suggested that verylarge numbers of samples, analyzed in parallel under identicalassay conditions, are required to generate a robust gene listfor predicting outcome in cancer. In addition, as functionalgene expression and functional data relative to MTs are al-ready available, such as in the case of estrogen- and anti-estrogen-responsive gene sets for example,12,13 selection ofgene lists based upon known biological functions of MTs(molecular classifiers)14 may, in some specific circumstances,yield more accurate and reliable gene expression results, di-rectly linked to functional data. Indeed, this approach allowsexcluding from analysis a large number of unrelated anduninformative genes, thereby decreasing background noiseduring statistical evaluation of the microarray data.15
The possibility to use RNA from archived formalin-fixed,paraffin-embedded (FFPE) samples would greatly help solvemany of these problems. Indeed, given the wide availability ofparaffin-embedded tissue blocks dating back several yearsand including valuable clinical annotation, such as thosederived from clinical trials, would provide enough materialfor large and uniform retrospective studies. Unfortunately,FFPE samples provide in most cases RNA unfit for standardanalysis by microarray-based methods,16 due to extensiveRNA degradation by formalin treatment and duringstorage.17,18
We tested here the recently developed cDNA-mediatedannealing, selection, extension and ligation (DASL) methodology
for gene expression profiling of highly degraded human RNAsamples,19,20 applying it to in vitro degraded RNA fromhuman MTs and FFPE MT biopsies. In the DASL assay,total RNA is converted into cDNA in a reverse transcriptionreaction using biotinylated primers, followed by hybridiza-tion to query oligonucleotides (in general up to three distinctfor each mRNA), primer extension and ligation, fluorescencelabeling by polymerase chain reaction (PCR) and annealing(capture) into the array substrate (beads). The limited size ofthe RNA target sequence and the use of random primingduring cDNA synthesis allow analysis of very small RNAfragments, whereas fluorescence labeling by PCR yields highspecific activity probes and greatly increases sensitivity of theassay, allowing detection of low-abundance transcripts.
Comparison of results obtained for the same RNA sampleson standard vs DASL arrays, and of intact vs highly degradedsamples, showed that this assay provides parallel quantifica-tion of large numbers of RNAs derived from FFPE sampleswith excellent sensitivity, high reproducibility and accuracy.
MATERIALS AND METHODSCell CulturesHuman MT MCF-7 cells (ATCC, Cat No. HTB-22) werecultured in Dulbecco’s modified Eagle’s medium, supple-mented with 10% fetal bovine serum (FBS) (both fromInvitrogen SpA, San Giuliano, Milanese, Italy), 100 U/mlpenicillin, 100 mg/ml streptomycin and 250 ng/ml Amfoter-icin-B at 371C in a humidified atmosphere composed of 95%air and 5% CO2. Cells were provided with fresh mediumevery 2 days and after reaching a confluence of 40–60%, theywere used for the experiment. To evaluate the effect ofestrogens, cells were grown in phenol red-free Dulbecco’smodified Eagle’s medium containing 5% dextran-charcoal-stripped FBS for 5 days and stimulated with 10�8 M17b-estradiol (E2) as described previously.12,13
Tumor Tissue SamplesAll bioptic tissues for this study were obtained from differentpatients following their informed consent and belong to theTumor Bank collections of the Department of Obstetrics andGynecology, University of Turin. All samples were FFPE in-vasive ductal carcinomas, according to standard tissueacquisition protocols. We obtained 13 FFPE MT samples, ofwhich 3 were also available as cryopreserved samples in liquidnitrogen, and 2 FFPE bladder cancer (BLT) samples. Theparaffin blocks were prepared 6 to 19 years before analysis.
RNA Extraction, Purification and Quality AssessmentRNA was extracted from MCF-7 cells before or after stimu-lation with E2 for 24 h, using the standard RNA Extractionwith TRIzol (Invitrogen SpA) method, as describedpreviously.12,13
FFPE tissue samples were cut into 5 mm-thick sections on amicrotome with a disposable blade, and the sections were
Array analysis of highly degraded RNA
M Ravo et al
www.laboratoryinvestigation.org | Laboratory Investigation | Volume 88 April 2008 431
stored in xylene at room temperature until use, beforewashing in fresh xylene and RNA extraction.
Up to four RNA extractions were performed either fromthree or eight sequential sections from the same paraffinblock using the High Pure RNA Paraffin Kit (Roche Diag-nostics GmbH, Mannheim, Germany). An initial depar-affinization was first performed with xylene, sections werethen extracted in ethanol and homogenized by overnightincubation in Proteinase K. Solubilized nucleic acids werebound to a glass fiber filter in the presence of guanidine salts,and filter-bound nucleic acids were washed and RNA wasselectively eluted. DNase I was then used to digest residualDNA, followed by an additional Proteinase K digestion step.RNA was bound to another glass fiber filter, washed andeluted for higher purification.
Total RNA from three FFPE MT tissues was isolated fromcryopreserved tissue samples of the same tumors, accordingto standard protocols, as described earlier,21 total RNA wasthen precipitated at �201C with isopropyl alcohol and RNApellet was washed with 75% ethanol and dissolved in water.
RNA concentration was determined with a ND-1000spectrophotometer (NanoDrop, Wilmington, DE, USA), andits quality was assessed with an Agilent 2100 Bioanalyzerusing Agilent RNA 6000 Nano kit (Agilent Technologies,Santa Clara, CA, USA). To estimate its level of degradation,the RNA integrity number (RIN22) was calculated. This valuetakes into consideration the whole electrophoretic profileof the RNA sample, including the presence or absence ofdegradation products.
RNAs from MCF-7 cells and from one of the FFPE MTsamples were degraded by incubation at 951C, as follows:MCF-7 cell RNA was exposed to heat degradation for 0, 15,30, 60 or 90 min and FFPE MT RNA was treated for 0, 5, 10,20, 30 or 40 min.
A series of mixings of MT and BLT RNAs were alsoprepared, according to the following MT RNA:BLT RNAproportions: 100:0, 80:20, 60:40, 40:60, 20:80 and 0:100. RNAwas stored at �801C until use.
Quantitative Real-Time Reverse TranscriptionPolymerase Chain ReactioncDNA synthesis was performed with the Qiagen QuantiTectReverse Transcription kit (Qiagen SpA, Milano, Italy).Fluorescent quantitative real-time reverse transcription-PCR(RT-qPCR) analyses were performed with an ABI Prism7900HT sequence detection system (Applied Biosystems,Foster City, CA, USA). PCR primers for the ribosomal pro-tein L13a (RPL13A) transcript (RefSeq Accession Number:NM_012423.2) were designed to amplify 82 and 112 bpfragments, with two probes sets (28 and 43) from the ExiqonHuman Probe Library (Exiqon S/A, Vedbaek, Denmark).The following primers were used for PCRs:
RPL-28: GAGGCCCCTACCACTTCC (forward) and CTCGCTTGGTTTTGTGG (reverse), RPL-43: GAGGCCCCTAC
CACTTCC (forward) and AACACCTTGAGACGGTCCAG(reverse).
Each reaction contained 4 ml of RealMasterMix (Eppen-dorf, Hamburg, Germany), 12 ng of cDNA template and0.2 nM of each forward and reverse primers, in a total reac-tion volume of 10 ml. The PCR consisted of 45 cycles of 941Cfor 9000, 941C for 2000 and 601C for 6000.
Microarray AnalysesFor DASL arrays, the Illumina DASL Human Cancer Panelgene set (Illumina Inc., San Diego, CA, USA) were used,represented by a pool of selected probe groups that target 502gene mRNAs collected from publicly available cancer genelists (SNP500 Cancer Database and Cancer Genome Ana-thomy Project; see Table 1 in Supplementary Information),each mRNA being targeted in three locations by three sepa-rate probes. A 200 ng portion of total RNA was convertedinto cDNA using biotinylated random nonamers, oligo-deoxythymidine 18 primers and Illumina-supplied reagents,according to manufacturer’s instructions. The resulting bio-tinylated cDNA was annealed to assay oligonucleotides andbound to streptadivin-conjugated paramagnetic particles toselect the cDNA/oligo complexes. After oligo hybridization,mis-hybridized and non-hybridized oligos were washed away,while bound oligos were extended and ligated to generatetemplates to be subsequently amplified with shared PCRprimers. The fluorescent-labeled complementary strand washybridized at 451C for 18 h to Illumina Sentrix Universal-96Array Matrix (SAM) platform and Universal-16 BeadChips.The SAM platform is a fiber-optic assembly composed of 96individual arrays, while the Universal-16 BeadChip platformis composed of 16 individual arrays manufactured on amicroscope slide-shaped substrate. For each sample, at leastthree technical replicates were performed. After hybridiza-tion, the arrays were scanned by laser confocal microscopyusing the Illumina BeadArrary Reader 500 system.
Illumina HumanRef-8_V1 Expression BeadChip micro-arrays (whole genome (WG)), including 24 613 gene-specificoligonucleotide probes, were used. RNA samples were pre-pared for array analysis using the Illumina TotalPrep RNAAmplification Kit (Ambion, Austin, TX, USA). To synthesizethe first cDNA strand, 500 ng total RNA were reverse tran-scribed using T7 Oligo (dT) Primers, dNTP Mix, RNase in-hibitor and an engineered Reverse Transcription ArrayScript.Samples were incubated at 421C for 2 h. The second cDNAstrand synthesis reaction employed DNA polymerase andRNase H. After incubation at 161C for 2 h, double-strandedcDNA was purified and biotinylated cRNA was synthesized byin vitro transcription with T7 RNA polymerase and biotin-NTP, purified and its concentration and quality were assessedas described above. For each sample, 700 ng of cRNA werehybridized at 551C for 18 h to the array, followed by washingand staining with streptavidin-conjugated cyanine 3 (GEHealthcare Italy SpA, Milano, Italy). BeadChips were dried
Array analysis of highly degraded RNA
M Ravo et al
432 Laboratory Investigation | Volume 88 April 2008 | www.laboratoryinvestigation.org
and subsequently scanned with the Illumina BeadArrayReader 500.
Data AnalysisData analyses were performed with BeadStudio software andR/BioConductor programming environment for statisticalcomputing.23 A quality control (QC) report was generatedfor all arrays and outliers were discarded on the basis ofinternal BeadStudio controls. Data were normalized with theaverage normalization algorithm and genes were consideredas detected if the detection P-value was lower than 0.01.Arrays with less than 50% detected genes were not includedin further analyses.
Differential expression analysis was performed with Illu-mina Diffscore, a proprietary algorithm24 that uses beadstandard deviation to build an error model.
Cluster analysis of samples was carried out in Bead-Studio,24 using the Average Linkage method, and distancewas expressed as correlation coefficient.
Heat maps were generated with the MultiexperimentViewer 4.0 software25 after median centering signal intensityvalues and performing hierarchical clustering of genes withthe average linkage method and Euclidian distance.
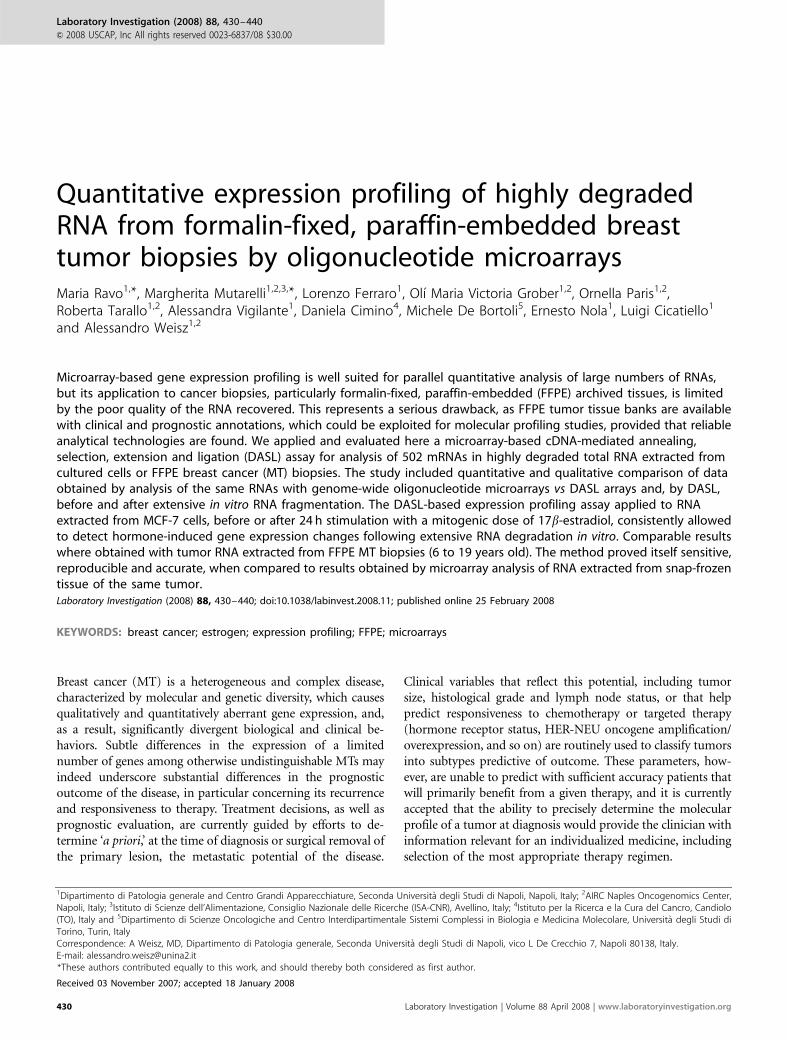
RESULTSTest of DASL Assay Performance withIn Vitro-Fragmented RNA from Human BreastCancer Cells and FFPE Breast Cancer SamplesWith the aim of verifying DASL protocol performance upondegraded mRNA, two samples of RNA extracted fromestrogen-deprived and -stimulated (24 h) MCF-7 cells werefragmented in vitro to various extent by exposure to 951C fordifferent times and profiled by microarray, according to theDASL method (Figure 1). Samples containing RNA at variouslevel of degradation were obtained in this way, as shown bythe loss of ribosomal RNAs and the accumulation of RNAmolecules of decreasing average size, that by 90 min reacheda plateau (Figure 1a; data not shown). As an indicator ofmRNA degradation, the transcript encoded by the house-keeping gene encoding the ribosomal protein L13a (RPL13A)was monitored in all samples by RT-qPCR (Figure 1a). RT-qPCR protocol was set first by determining the appropriateamount of RNA to start with (12 ng) and by using two dif-ferent probe sets (data not shown). As shown by side-by-sidecomparison of the gel-like image of micro-capillary electro-pherograms (Figure 1a, left panel) with the quantity ofRPL13A mRNA detectable in the same sample, representedby the (threshold cycle) Ct of the RT-qPCR (Figure 1a, rightpanel), this method provides a reliable way to measure pre-cisely the degree of RNA degradation in a sample. Datadisplayed in Figure 1a refer to RNA extracted from E2-treatedMCF-7 cells. The same analysis was carried out also on theRNAs from hormone-starved cells, yielding essentially thesame results (data not shown).
DASL analysis of these RNA samples was then performedin replicate with either 16� BeadChip and 96� SAM arrayformats, for a total of 36 arrays of which only one did notpass the array quality verification. All technical replicatesshowed a remarkable reproducibility, with a correlationindex (r2) ranging between 0.95 and 0.99 (data not shown).
Figure 1 Evaluation of DASL array technology with intact and in vitro-
degraded RNA from MCF-7 cells. (a) QC of MCF-7 RNA samples at different
stages of heat-induced degradation was carried out by micro-capillary
electrophoresis (gel-like image of the electropherogram in the left panel)
and RT-qPCR evaluation of RPL-13A mRNA (right panel). (b) Representative
fluorescence intensity scatter plots of non-degraded vs fragmented RNA
samples. (c) Scatter plot data analyses showing the results of pair-wise
comparison of the estrogen-induced gene expression changes measured
with non-degraded vs degraded RNAs. Fold-change values of detected
genes in samples showing different levels of RNA were plotted against
those obtained with intact RNA samples. To improve visualization of the
differences between samples, genes with an absolute fold change value
lower than 1.2 were excluded from the plot. Dashed lines in (b and c) point
to identity (x¼ y) between samples and solid lines the ‘best fit’ linear
regression experimentally calculated. In each panel are also reported the r2
value resulting from comparison of the two (non-degraded vs degraded)
samples and the number (n) of genes in common between all datasets used
for statistical evaluations.
Array analysis of highly degraded RNA
M Ravo et al
www.laboratoryinvestigation.org | Laboratory Investigation | Volume 88 April 2008 433
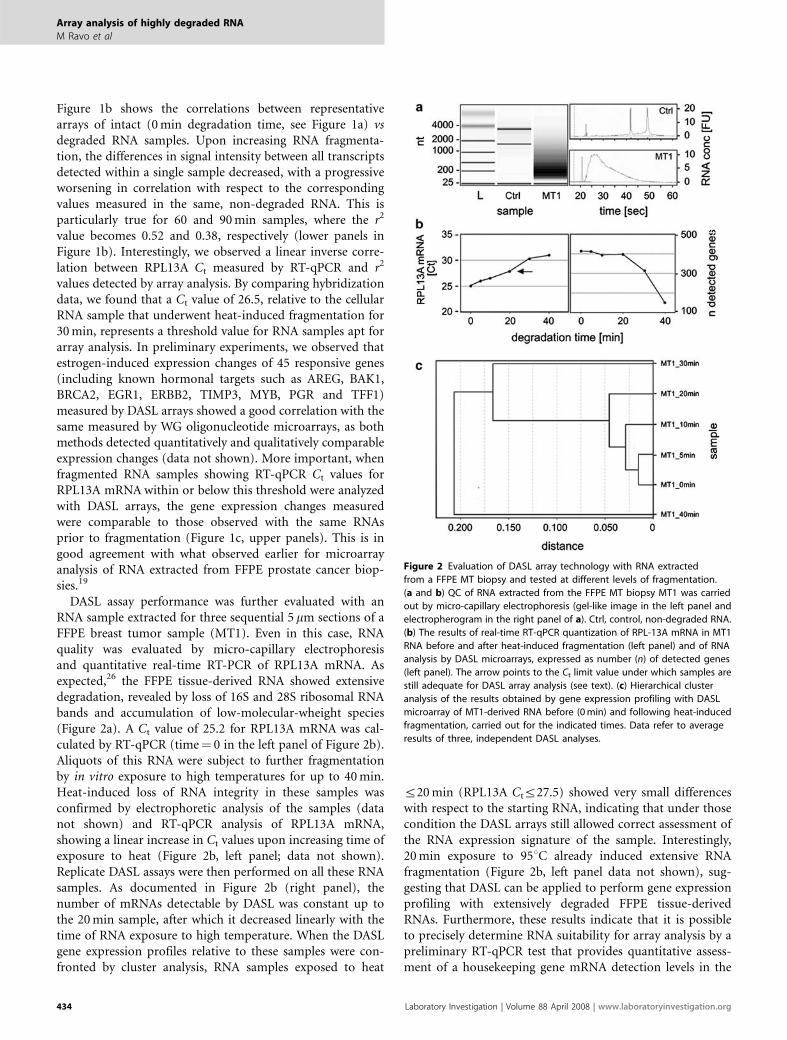
Figure 1b shows the correlations between representativearrays of intact (0 min degradation time, see Figure 1a) vsdegraded RNA samples. Upon increasing RNA fragmenta-tion, the differences in signal intensity between all transcriptsdetected within a single sample decreased, with a progressiveworsening in correlation with respect to the correspondingvalues measured in the same, non-degraded RNA. This isparticularly true for 60 and 90 min samples, where the r2
value becomes 0.52 and 0.38, respectively (lower panels inFigure 1b). Interestingly, we observed a linear inverse corre-lation between RPL13A Ct measured by RT-qPCR and r2
values detected by array analysis. By comparing hybridizationdata, we found that a Ct value of 26.5, relative to the cellularRNA sample that underwent heat-induced fragmentation for30 min, represents a threshold value for RNA samples apt forarray analysis. In preliminary experiments, we observed thatestrogen-induced expression changes of 45 responsive genes(including known hormonal targets such as AREG, BAK1,BRCA2, EGR1, ERBB2, TIMP3, MYB, PGR and TFF1)measured by DASL arrays showed a good correlation with thesame measured by WG oligonucleotide microarrays, as bothmethods detected quantitatively and qualitatively comparableexpression changes (data not shown). More important, whenfragmented RNA samples showing RT-qPCR Ct values forRPL13A mRNA within or below this threshold were analyzedwith DASL arrays, the gene expression changes measuredwere comparable to those observed with the same RNAsprior to fragmentation (Figure 1c, upper panels). This is ingood agreement with what observed earlier for microarrayanalysis of RNA extracted from FFPE prostate cancer biop-sies.19
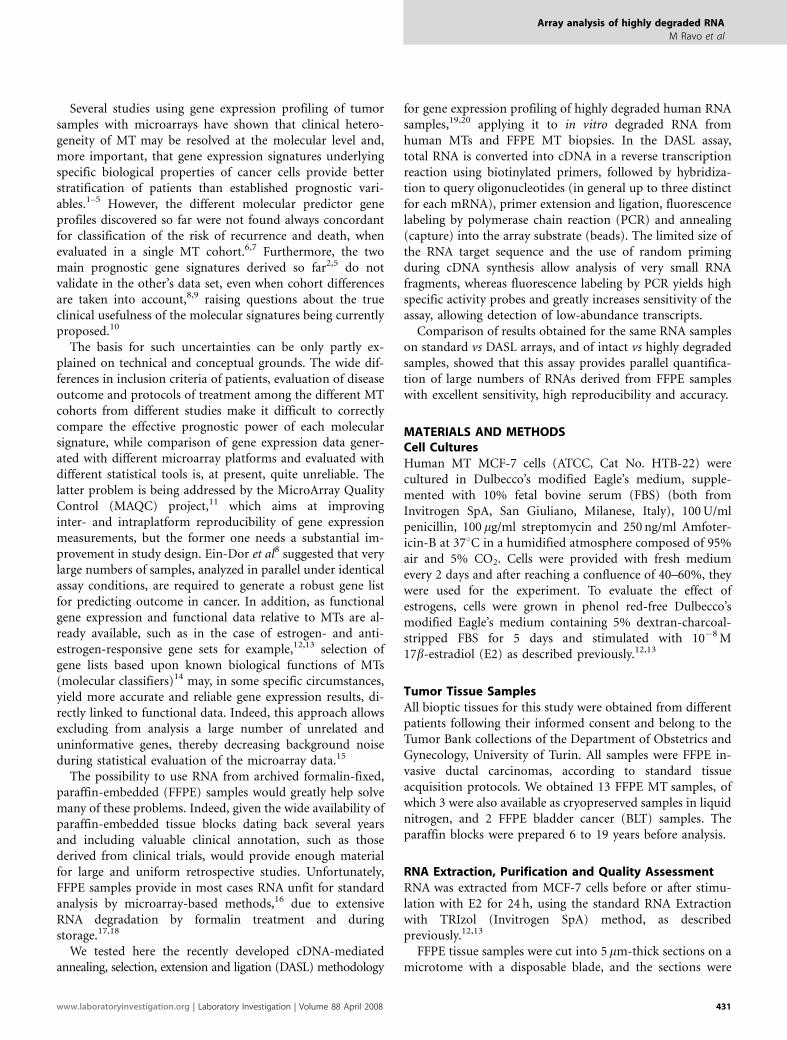
DASL assay performance was further evaluated with anRNA sample extracted for three sequential 5 mm sections of aFFPE breast tumor sample (MT1). Even in this case, RNAquality was evaluated by micro-capillary electrophoresisand quantitative real-time RT-PCR of RPL13A mRNA. Asexpected,26 the FFPE tissue-derived RNA showed extensivedegradation, revealed by loss of 16S and 28S ribosomal RNAbands and accumulation of low-molecular-wheight species(Figure 2a). A Ct value of 25.2 for RPL13A mRNA was cal-culated by RT-qPCR (time¼ 0 in the left panel of Figure 2b).Aliquots of this RNA were subject to further fragmentationby in vitro exposure to high temperatures for up to 40 min.Heat-induced loss of RNA integrity in these samples wasconfirmed by electrophoretic analysis of the samples (datanot shown) and RT-qPCR analysis of RPL13A mRNA,showing a linear increase in Ct values upon increasing time ofexposure to heat (Figure 2b, left panel; data not shown).Replicate DASL assays were then performed on all these RNAsamples. As documented in Figure 2b (right panel), thenumber of mRNAs detectable by DASL was constant up tothe 20 min sample, after which it decreased linearly with thetime of RNA exposure to high temperature. When the DASLgene expression profiles relative to these samples were con-fronted by cluster analysis, RNA samples exposed to heat
r20 min (RPL13A Ctr27.5) showed very small differenceswith respect to the starting RNA, indicating that under thosecondition the DASL arrays still allowed correct assessment ofthe RNA expression signature of the sample. Interestingly,20 min exposure to 951C already induced extensive RNAfragmentation (Figure 2b, left panel data not shown), sug-gesting that DASL can be applied to perform gene expressionprofiling with extensively degraded FFPE tissue-derivedRNAs. Furthermore, these results indicate that it is possibleto precisely determine RNA suitability for array analysis by apreliminary RT-qPCR test that provides quantitative assess-ment of a housekeeping gene mRNA detection levels in the
Figure 2 Evaluation of DASL array technology with RNA extracted
from a FFPE MT biopsy and tested at different levels of fragmentation.
(a and b) QC of RNA extracted from the FFPE MT biopsy MT1 was carried
out by micro-capillary electrophoresis (gel-like image in the left panel and
electropherogram in the right panel of a). Ctrl, control, non-degraded RNA.
(b) The results of real-time RT-qPCR quantization of RPL-13A mRNA in MT1
RNA before and after heat-induced fragmentation (left panel) and of RNA
analysis by DASL microarrays, expressed as number (n) of detected genes
(left panel). The arrow points to the Ct limit value under which samples are
still adequate for DASL array analysis (see text). (c) Hierarchical cluster
analysis of the results obtained by gene expression profiling with DASL
microarray of MT1-derived RNA before (0 min) and following heat-induced
fragmentation, carried out for the indicated times. Data refer to average
results of three, independent DASL analyses.
Array analysis of highly degraded RNA
M Ravo et al
434 Laboratory Investigation | Volume 88 April 2008 | www.laboratoryinvestigation.org
sample, proving a handy and cost-effective pre-analyticalscreening method for exclusion of RNA samples that, becauseof their poor quality, would give rise to erroneous and mis-leading data (see below).
Application of DASL Arrays to Expression Profiling ofFFPE Breast Cancer SpecimensAccuracy and reproducibility of the DASL assay applied toFFPE cancer specimens were then evaluated. To this aim, 17paraffin blocks, corresponding to 15 distinct biopsies (with astorage age of 6–19 years), were used as source of RNA. Thetests were carried out performing multiple RNA extractionsfrom either three or eight sequential 5 mm sections of thesame paraffin block and, in two cases, from two blocks de-rived from different portions of the same tumor, for a total of48 independent extractions. RNA yield and quality were as-sessed in all cases by optical density (OD) and micro-capil-lary electrophoresis. Thirty-one such samples met theminimal quality pre-requisites for further use, that is, RNAyield of at least 25 ng/ml with OD260/OD280 ratio 41.8,according to criteria slightly more stringent than whatpreviously proposed for similar studies.16 Such values wereset based both on the electrophoretic profile of the startingRNA samples and the results of multiple test DASL assays,where the number of detected genes was taken as parameterfor quantitative evaluation of array performance. It is worthnoting that, in case of failure, inspection of Hematoxylin-eosin-stained microphotographs of a section from the sameparaffin block helped explain most of the cases with low RNA
yield was obtained, as we observed in such cases one or moreof the following conditions: (i) small size of the tissue frag-ment included (o0.5–0.8 cm2); (ii) prevalence in the sampleof fat tissue or (iii) presence of large patches of necrotic orfibrotic tissue (data not shown). Twenty-three of the 31 RNAsamples mentioned above, corresponding to 8 distinct spe-cimens (7 breast and 1 BLT) were included in this study. RNAintegrity was evaluated by RT-qPCR of RPL13A mRNA asdescribed above, which yielded Ct values ranging from 25.38to 28.77. Furthermore, RIN—a parameter based on micro-capillary electrophoresis results that provides quantitativeevaluation of RNA quality,22 was calculated for each sample.RIN values were found to range from 1.0 to 2.6. Each samplewas then assayed on 3–6 array replicates, for a total of 101arrays performed both on 16� BeadChips and a 96� SAMarray formats.
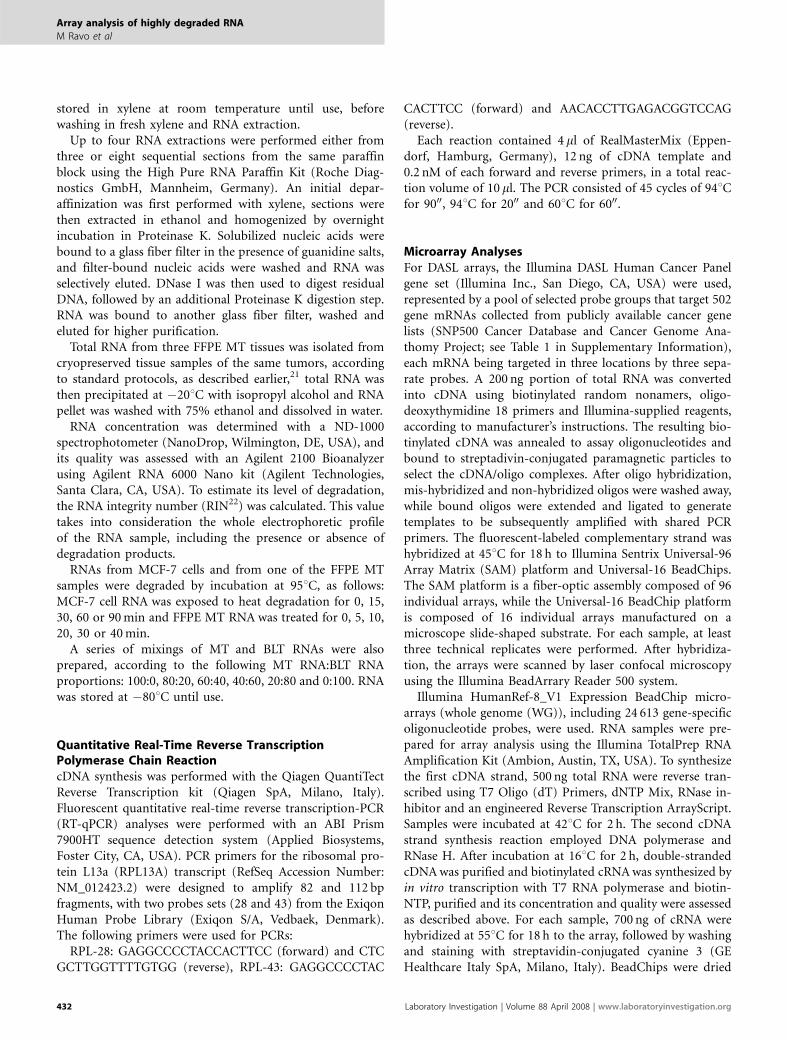
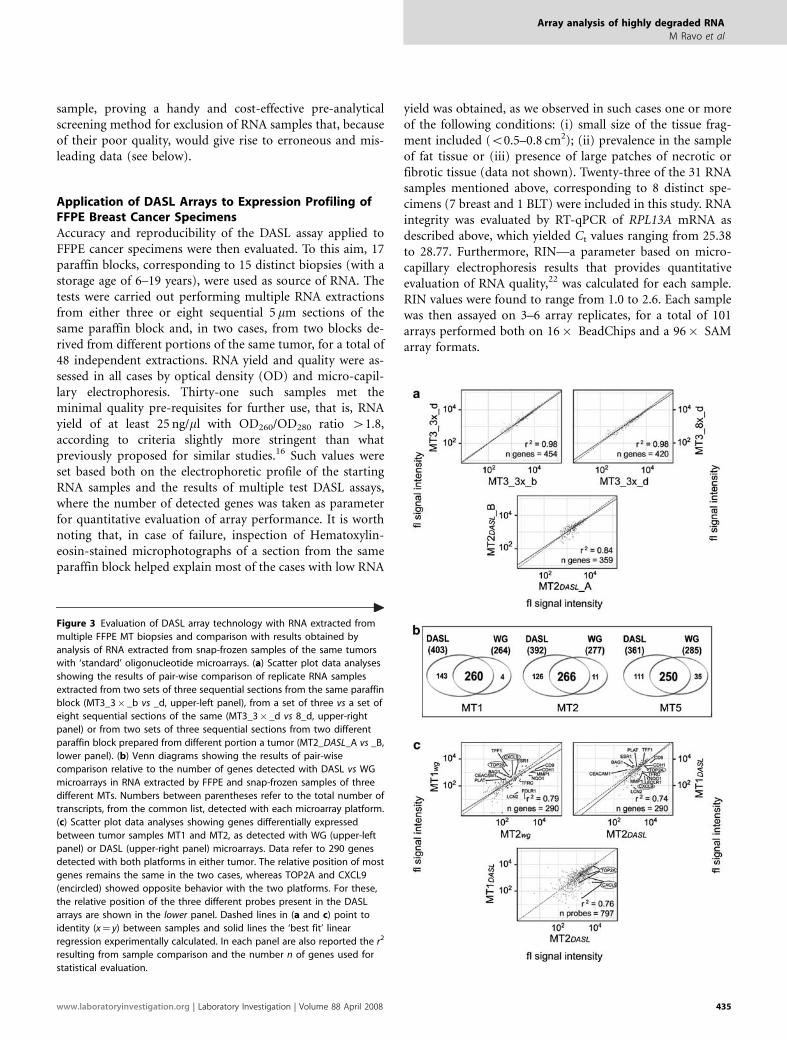
Figure 3 Evaluation of DASL array technology with RNA extracted from
multiple FFPE MT biopsies and comparison with results obtained by
analysis of RNA extracted from snap-frozen samples of the same tumors
with ‘standard’ oligonucleotide microarrays. (a) Scatter plot data analyses
showing the results of pair-wise comparison of replicate RNA samples
extracted from two sets of three sequential sections from the same paraffin
block (MT3_3� _b vs _d, upper-left panel), from a set of three vs a set of
eight sequential sections of the same (MT3_3� _d vs 8_d, upper-right
panel) or from two sets of three sequential sections from two different
paraffin block prepared from different portion a tumor (MT2_DASL_A vs _B,
lower panel). (b) Venn diagrams showing the results of pair-wise
comparison relative to the number of genes detected with DASL vs WG
microarrays in RNA extracted by FFPE and snap-frozen samples of three
different MTs. Numbers between parentheses refer to the total number of
transcripts, from the common list, detected with each microarray platform.
(c) Scatter plot data analyses showing genes differentially expressed
between tumor samples MT1 and MT2, as detected with WG (upper-left
panel) or DASL (upper-right panel) microarrays. Data refer to 290 genes
detected with both platforms in either tumor. The relative position of most
genes remains the same in the two cases, whereas TOP2A and CXCL9
(encircled) showed opposite behavior with the two platforms. For these,
the relative position of the three different probes present in the DASL
arrays are shown in the lower panel. Dashed lines in (a and c) point to
identity (x¼ y) between samples and solid lines the ‘best fit’ linear
regression experimentally calculated. In each panel are also reported the r2
resulting from sample comparison and the number n of genes used for
statistical evaluation.
Array analysis of highly degraded RNA
M Ravo et al
www.laboratoryinvestigation.org | Laboratory Investigation | Volume 88 April 2008 435
Data shown in Figure 3a are representative of the resultsobtained with ‘good-quality’ samples, that is, RNAs that metall the QC criteria in our pre-test screening (see below). Theupper-left panel of the figure shows a comparison betweenreplicate arrays of the same RNA, while the upper-rightpanel shows between two RNAs extracted form either 3(MT3_3� _d) or 8 (MT3_8� _d) sequential sections of thesame paraffin block; the lower panel reports a comparisonbetween two RNAs extracted from sections derived from twodifferent paraffin blocks of the same tumor. In all cases, the r2
revealed a close proximity, to near identity, among the twoexpression profiles being compared. Furthermore, the veryhigh number (n) of genes detected by both arrays, out of the502 analyzed, demonstrates the good reproducibility and re-liability of the assay. Our experience led us to set the followingparameters for evaluation of measures obtained with replicatearrays: (i) results are unreliable when one or more (dependingon the initial number of replicates) replica arrays show outliervalues in its internal controls, indicating technical failureof the assay; (ii) the same applies when n is o200 and r2
between replicas o0.69; (iii) for arrays showing n between200 and 250, data are acceptable only when r2 between re-plicates is Z0.70; (iv) when r2 falls between 0.69 and 0.75,array data quality is good only if n is 4250. In all other cases,gene expression data are to be considered reliable.
Overall, 83% (84/101) successful hybridizations wereachieved here, but array data quality and results were foundto be highly dependent on the initial RNA sample status. Infact, when considering the percentage of success in replicatearrays from the same RNA sample, we observed that thisvaried between 40 and 100%, the main factor influencing theresult being RNA quality. Indeed, apart from few tests thatfailed because of technical problems encountered during ar-ray set up and hybridization, in all cases we were able to linkarray performance to RNA degradation status, with arraysused to analyze ‘poor-quality’ RNAs showing a lower rate ofsuccess that those applied to ‘good-quality’ RNA. As RNAquality is a parameter that can be easily defined in a pre-liminary test, we suggest the following RNA QC criteria todefine in advance suitability of a given sample for DASLassay: (i) RNA with RPL13A Cto26.5 are most suited forDASL array analysis, whereas those with Ct428 should bediscarded; (ii) when RPL13A Ct is between these two values,the RNA sample should be further evaluated by micro-capillary electrophoresis to determine the RIN index; (iii)samples showing a RIN score 42.0 can be considered apt foranalysis, whereas those with RINr2.0 are still suitable whenthe prevalent RNA size is 4200 nt. By applying these simpleQC criteria, we were able to obtain 100% DASL array successrate (data not shown).
To evaluate the functional significance of the gene ex-pression profiles generated by DASL with RNAs from FFPEtissues, we set forth to compare the gene expression dataobtained with this method with the same derived fromWG oligonucleotide microarray analysis (see ‘Materials and
Methods’ section for details). This comparison was carriedout by performing expression profiling of RNA extractedfrom snap-frozen tissue samples from the MTs matchingthree FFPE samples (MT1, MT2 and MT5), analyzed byDASL. Results are displayed in Figure 3b and can be sum-marized as follows. First, a remarkable overlap in gene de-tection between the two methods was evident with all threesamples, as 88–98% of the genes detected with WG arrayswere also detected by DASL. Considering that the portion oftumor mass analyzed by WG and DASL were not the same,the slight differences in gene detection rate between the twoassays can be easily explained with subtle variations in tissuecomposition and/or local gene expression patterns betweenthe two samples. Second, DASL showed a considerably highersensitivity than WG arrays, as the former could detect21–34% more transcripts than the latter. This higher sensi-tivity may be explained by the exponential, specific cDNAamplification step included in the DASL protocol, whichresults in amplification only of the transcripts present in thegene panel for which the specific primers are designed. Thus,any targeted transcript of the gene pool will be amplified anddetected by DASL arrays, even if present in very low amounts.By contrast, with standard WG array platforms all transcriptsundergo linear amplification,27 so that rare transcripts mayremain scarce in the final hybridization mixture, and for thisreason undetectable.
As expression profiling is most useful in clinical oncologyto pinpoint molecular differences and similarities amongtumor samples, we asked whether DASL was reliable also fordifferential analysis between different MTs. As a comparison,we used once again the data derived from WG array analysisof frozen samples of the same tumors. In the upper panels ofFigure 3c, a pair-wise comparison of the expression profilesdetected by either method in breast tumors MT1 vs MT2 isshown. In this case, considering a common list of 290 genesdetected in either tumor with both platforms, distancebetween samples, quantitatively expressed by the r2, wasessentially the same with the two assays. On the other hand,for each transcript considered, the signal detected with theDASL array was significantly higher than that measured withWG arrays and compressed into a lower dynamic range, forthe same reasons mentioned above. When considering thenumber of differentially expressed genes detected by the twoplatforms, we observed a slightly higher number of differ-entially expressed genes in the WG vs the DASL data set (59 vs34 for MT1 vs MT2 comparison) and a good overlap betweenthe two platforms (14 differentially expressed genes in com-mon, in this same case). This last result should not surprise,as different methods for statistical evaluation had to be ap-plied for data analysis in the two cases, due to the fact thatdynamic ranges in the two platforms were different. Never-theless, despite the remarkable difference in signal scalebetween the two data sets, most genes were positioned insimilar regions of the scatter plots, indicating that compar-able qualitative results were obtained with the two assays.
Array analysis of highly degraded RNA
M Ravo et al
436 Laboratory Investigation | Volume 88 April 2008 | www.laboratoryinvestigation.org
This conclusion was confirmed by the results obtained bypair-wise comparisons of the expression profiles of breasttumors MT1 vs MT3 and MT2 vs MT3 detected with DASLand WG arrays (data not shown). Of the 14 differentiallyexpressed genes detected in MT1 vs MT2 biopsies with bothplatforms, two (TOP2A and CXCL9, circled in Figure 3c)showed opposite behavior with the two microarrays. AsDASL arrays included three probes for each of these tran-scripts, we controlled whether the discrepancy could be ex-plained by one or more DASL probe failing to correctly detectthe signal. As shown in the lower panel of Figure 3c, however,this was not the case, as signals relative to all three probesposition, in both cases, near to each other in the scatter plot.It is worth noting that expression of these two genes wasnot very different between the two tumor samples beingcompared, as they showed a fold-difference o2.0, a valueconsidered not significant in most gene expression studies. Itis thus possible to conclude that the apparent discrepancyobserved here between the two methods may depend upondifferences in specific RNA levels intrinsic to the startingbiological materials (snap-frozen and FFPE tissues, respec-tively), as already commented above.
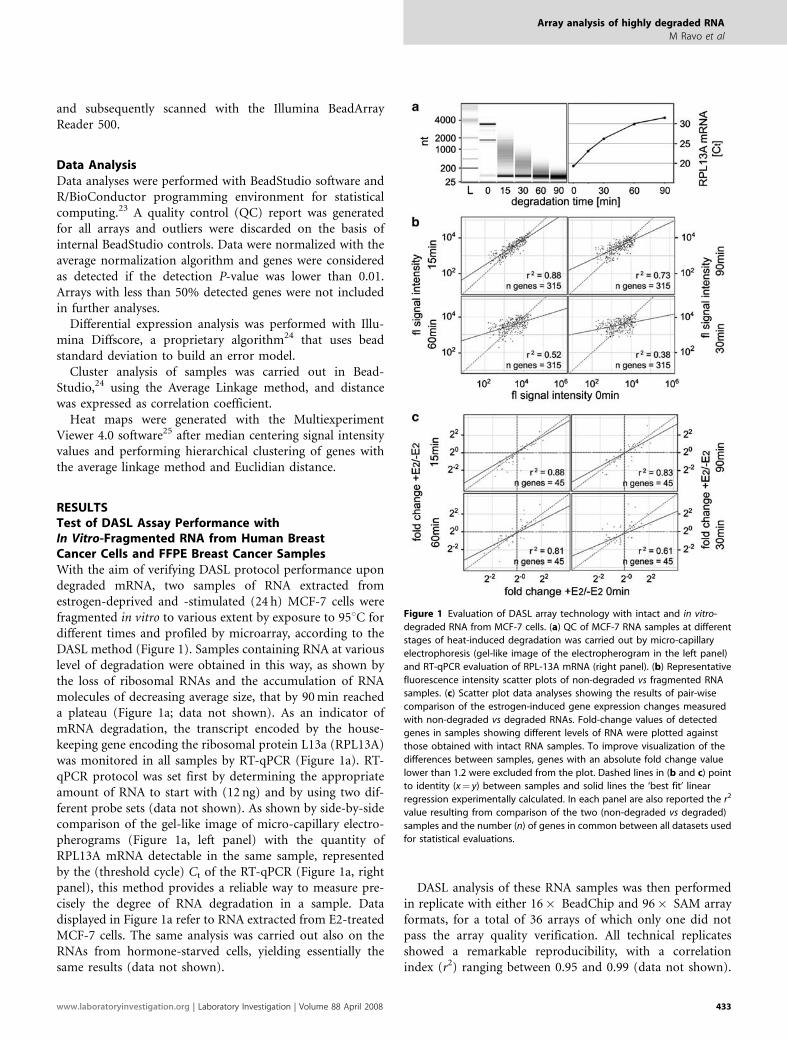
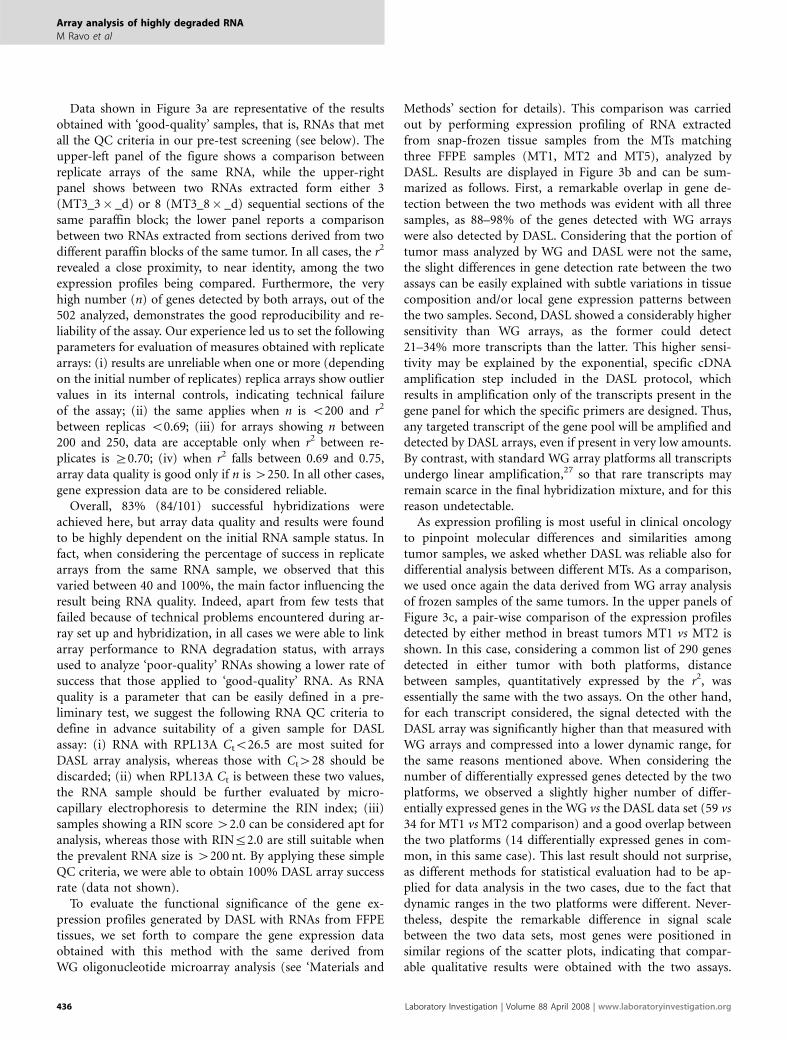
Sensitivity of the DASL Assay for Detection ofDifferences in Gene Expression Patterns Between TissueSamplesTo evaluate sensitivity of the DASL array method im-plemented here for detection of differential gene expressionbetween FFPE tissue samples, we exploited the differences inRNA profiles between BLT and MT (Figure 4a). To this aim, asample dilution experiment was carried out whereby theRNA extracted from the FFPE breast tumor sample MT3were mixed in various proportions (100:0, 80:20, 60:40,40:60, 20:80 and 0:100) with the same extracted from a BLTsample. We then carried out duplicate DASL array analysesof each RNA pool generated in this way and looked foreffectiveness of the method to correctly identify progressivelydivergent gene expression patterns. As shown in Figure 4b,cluster analysis of the data showed a remarkably high cor-relation between array and sample replicates, as already seenin previous experiments, but, more importantly, it revealedthat the DASL assay could indeed discriminate and correctlyidentify slight differences in gene expression patterns betweenclosely related samples, allowing to classify them accordingly.
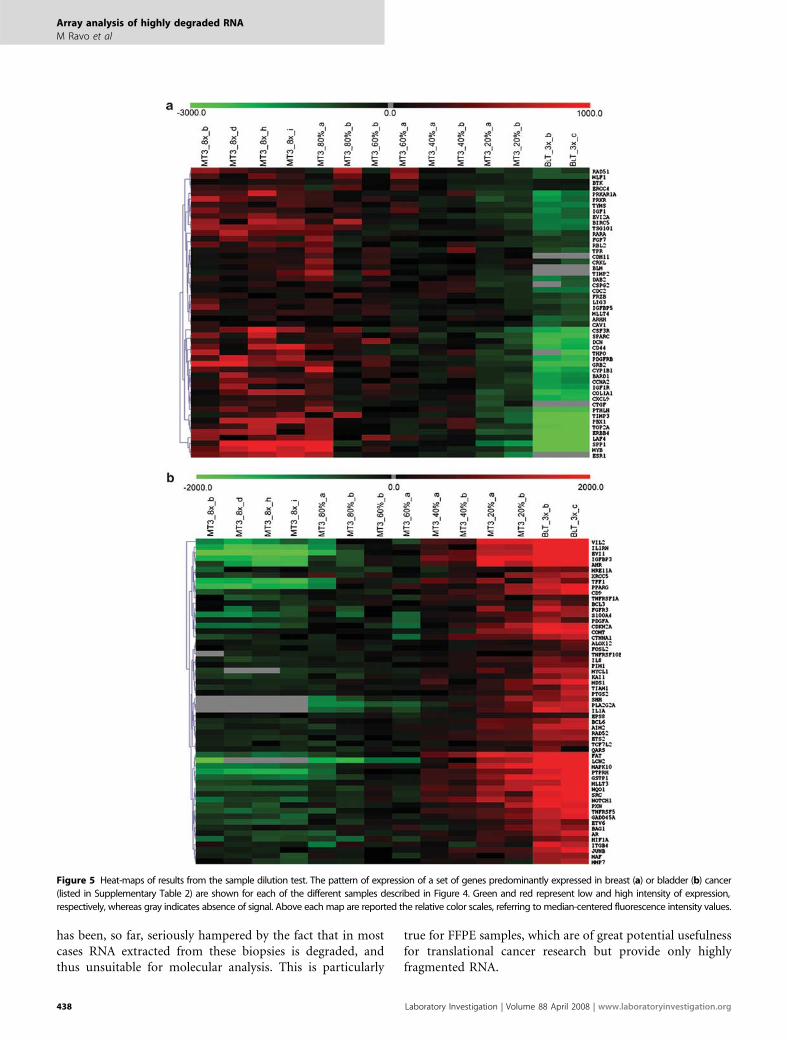
Comparative gene expression analysis between breast andBLT RNAs (Figure 4a) highlighted two lists of differentiallyexpressed genes (listed in Supplementary Table 2), the firstrepresented by mRNAs highly expressed in breast tumors,including also estrogen receptor alpha mRNA (ESR1, Figure5a), and the second including transcripts more abundant inBLTs (Figure 5b). When these gene lists were used to evaluatethe array data generated with the sample dilution test de-scribed above, they both clearly showed how the pattern ofgene expression correlated linearly, in each sample, with theRNA dilution factor (Figure 5). Indeed, we observed that
genes completely absent in one tumor were detected also inas low as 20% of the original RNA, thus confirming thesensitivity and reliability of the DASL assay. This is a sig-nificant result in view of the fact that tumor biopsies maycontain various amounts of cancer cells intermixed with cellof other origin (stromal, vascular, inflammatory, and so on)and that a gene-profiling study must rely on the possibility todetect cancer-specific mRNA expression profiles in extractsshowing a wide range of relative abundance of tumor-derivedRNA.
DISCUSSIONGene expression profiling of tumor biopsies promises to helpimprove clinical management of breast and other cancerpatients by providing new ways to classify tumors and topredict disease outcome and responsiveness to therapy,28,29
but its application to large-scale studies or in clinical settings
Figure 4 Test of DASL assay sensitivity and ability to discriminate large and
subtle differences in the gene expression patterns between FFPE-derived
RNA samples. (a) Scatter plot data analysis showing significant differences
in gene expression patterns between a breast (MT3) and a bladder (BLT)
carcinoma. Dashed lines in a point to identity (x¼ y) between samples and
solid lines the ‘best fit’ linear regression experimentally calculated. In the
panel are also reported the r2 resulting from MT vs BLT sample comparison
and the number n of genes detected in either tumor and used for statistical
evaluation. (b) Sample dilution test. Data clustering of DASL microarray
results obtained by analysis of RNA samples obtained by mixing with each
other MT and BLT RNAs at various relative ratios.
Array analysis of highly degraded RNA
M Ravo et al
www.laboratoryinvestigation.org | Laboratory Investigation | Volume 88 April 2008 437
has been, so far, seriously hampered by the fact that in mostcases RNA extracted from these biopsies is degraded, andthus unsuitable for molecular analysis. This is particularly
true for FFPE samples, which are of great potential usefulnessfor translational cancer research but provide only highlyfragmented RNA.
Figure 5 Heat-maps of results from the sample dilution test. The pattern of expression of a set of genes predominantly expressed in breast (a) or bladder (b) cancer
(listed in Supplementary Table 2) are shown for each of the different samples described in Figure 4. Green and red represent low and high intensity of expression,
respectively, whereas gray indicates absence of signal. Above each map are reported the relative color scales, referring to median-centered fluorescence intensity values.
Array analysis of highly degraded RNA
M Ravo et al
438 Laboratory Investigation | Volume 88 April 2008 | www.laboratoryinvestigation.org
We implemented here a technology for parallel quantita-tive analysis by oligonucleotide microarrays of a large num-ber of transcripts in highly degraded RNAs extracted fromFFPE breast and BLT biopsies that overcomes previouslyencountered limitations, and describe a pre-analytical RNAsample screening protocol providing QC parameters that,when performed, allow to obtain reproducible and biologi-cally relevant gene expression results even with extensivelyfragmented RNAs. The results of this study provide a prac-tical method for carrying out gene expression profilinganalyses in FFPE MT samples by DASL oligonucleotide mi-croarrays, which is applicable also to normal and pathologicalsamples of other origin. Sensitivity, reproducibility andaccuracy of the assay indicate that it is well suited for ret-rospective clinical studies aiming at identifying prognosticand predictive gene profiles in archival FFPE tissue banksand, predictably, also on laser-capture microdissected tissuesamples, following an appropriate set up. Furthermore, themethod described is cost-effective and not labor intensive,making it feasible analysis of even large numbers of samplesat once. Furthermore, as the limiting factor for successfulmolecular profiling of the sample is excessive RNA frag-mentation, protocols for RNA restoration in vitro, such asthat described recently by Loudig et al,30 could be included inthe assay when analysis of particularly informative, or un-ique, specimens is required.
The possibility of using FFPE tissue samples may allow alsoto combine expression profiling of defined sets of genes byDASL with array Comparative Genomic Hybridization andDNA methylation analysis31,32 of the same biopsy, an approachthat has been recently shown to be extremely powerful toidentify functionally and clinically distinct MT subtypes.33
Supplementary Information accompanies the paper on the Laboratory
Investigation website (http://www.laboratoryinvestigation.org)
ACKNOWLEDGEMENT
Research supported by Italian Ministry of University and Research (PRIN
2005063915_003 and 2006069030_003), Italian Ministry of Health (Research
Grants 2003, 2005); Regione Piemonte (Ric. Sanitaria e Scientifica Applicata,
Grants 2006 and 2007), UE (CRESCENDO IP, contract no. LSHM-CT2005-
018652), AIRC (Italian Association for Cancer Research) and PhD Programs:
‘Pathology of Cellular Signal Transduction’ of the Second University of
Naples (O Paris, R Tarallo and OMV Grober) and ‘Toxicology, Oncology and
Molecular Pathology’ of the University of Cagliari (M Ravo). We thank Paola
Bontempo, Nicoletta Raverino, Raffaele Rossiello, Ivana Sarotto and the
pathologists of the IRCC Hospital of Candiolo (TO), Mauriziano ‘Umberto I’
Hospital of Turin and Second University of Naples for the supply of tumor
tissues and their assistance in collection of FFPE samples for analysis. M
Mutarelli is recipient of a Post-doctoral Fellowship of the Second University
of Naples and O Paris of a Doctoral Fellowship from the AIRC Naples
Oncogenomics Center.
DISCLOSURE
The authors have no conflict of interest.
1. Sorlie T, Perou CM, Tibshirani R, et al. Gene expression patterns ofbreast carcinomas distinguish tumor subclasses with clinicalimplications. Proc Natl Acad Sci USA 2001;98:10869–10874.
2. van de Vijver MJ, He YD, van’t Veer LJ, et al. A gene-expressionsignature as a predictor of survival in breast cancer. N Engl J Med2002;347:1999–2009.
3. Paik S, Shak S, Tang G, et al. A multigene assay to predict recurrence oftamoxifen-treated, node-negative breast cancer. N Engl J Med2004;351:2817–2826.
4. Chang HY, Nuyten DS, Sneddon JB, et al. Robustness, scalability, andintegration of a wound-response gene expression signature inpredicting breast cancer survival. Proc Natl Acad Sci USA2005;102:3738–3743.
5. Wang Y, Klijn JG, Zhang Y, et al. Gene-expression profiles to predictdistant metastasis of lymph-node-negative primary breast cancer.Lancet 2005;365:671–679.
6. Fan C, Oh DS, Wessels L, et al. Concordance among gene-expression-based predictors for breast cancer. N Engl J Med 2006;355:560–569.
7. O’Shaughnessy JA. Molecular signatures predict outcomes of breastcancer. N Engl J Med 2006;355:615–617.
8. Ein-Dor L, Zuk O, Domany E. Thousands of samples are needed togenerate a robust gene list for predicting outcome in cancer. Proc NatlAcad Sci USA 2006;103:5923–5928.
9. Naderi A, Teschendorff AE, Barbosa-Morais NL, et al. A gene-expressionsignature to predict survival in breast cancer across independent datasets. Oncogene 2007;26:1507–1516.
10. Brenton JD, Carey LA, Ahmed AA, et al. Molecular classification andmolecular forecasting of breast cancer: ready for clinical application?J Clin Oncol 2005;23:7350–7360.
11. Shi L, Reid LH, Jones WD, et al. The MicroArray Quality Control (MAQC)project shows inter- and intraplatform reproducibility of geneexpression measurements. Nat Biotechnol 2006;24:1151–1161.
12. Cicatiello L, Scafoglio C, Altucci L, et al. A genomic view ofestrogen actions in human breast cancer cells by expression profilingof the hormone-responsive transcriptome. J Mol Endocrinol 2004;32:719–775.
13. Scafoglio C, Ambrosino C, Cicatiello L, et al. Comparative geneexpression profiling reveals partially overlapping but distinct genomicactions of different antiestrogens in human breast cancer cells. J CellBiochem 2006;98:1163–1184.
14. Teschendorff AE, Naderi A, Barbosa-Morais NL, et al. A consensusprognostic gene expression classifier for ER positive breast cancer.Genome Biol 2006;7:R101.
15. Weisz A, Basile W, Scafoglio C, et al. Molecular identification ofERalpha-positive breast cancer cells by the expression profile of anintrinsic set of estrogen regulated genes. J Cell Physiol 2004;200:440–450.
16. Penland SK, Keku TO, Torrice C, et al. RNA expression analysis offormalin-fixed paraffin-embedded tumors. Lab Invest 2007;87:383–391.
17. Karsten SL, Van Deerlin VM, Sabatti C, et al. An evaluation oftyramide signal amplification and archived fixed and frozentissue in microarray gene expression analysis. Nucleic Acids Res2002;30:E4.
18. Benchekroun M, DeGraw J, Gao J, et al. Impact of fixative on recoveryof mRNA from paraffin-embedded tissue. Diagn Mol Pathol2004;13:116–125.
19. Bibikova M, Talantov D, Chudin E, et al. Quantitative gene expressionprofiling in formalin-fixed, paraffin-embedded tissues using universalbead arrays. Am J Pathol 2004;165:1799–1807.
20. Fan JB, Gunderson KL, Bibikova M, et al. Illumina universal bead arrays.Methods Enzymol 2006;410:57–73.
21. Sorbello V, Fuso L, Sfiligoi C, et al. Quantitative real-time RT-PCRanalysis of eight novel estrogen-regulated genes in breast cancer. Int JBiol Markers 2003;18:123–129.
22. Schroeder A, Mueller O, Stocker S, et al. The RIN: an RNA integritynumber for assigning integrity values to RNA measurements. BMC MolBiol 2006;7:3.
23. Gentleman R, Carey V, Huber W. Bioinformatics and ComputationalBiology Solutions Using R and Bioconductor. Heidelberg: Springer,2005.
24. Illumina Inc. BeadStudio User Guide, Doc 1117962 Rev. B., 2004, 2005.25. Saeed AI, Sharov V, White J, et al. TM4: a free, open-source system for
microarray data management and analysis. Biotechniques2003;34:374–378.
Array analysis of highly degraded RNA
M Ravo et al
www.laboratoryinvestigation.org | Laboratory Investigation | Volume 88 April 2008 439

26. Cronin M, Pho M, Dutta D, et al. Measurement of gene expression inarchival paraffin-embedded tissues: development and performance ofa 92-gene reverse transcriptase-polymerase chain reaction assay. Am JPathol 2004;164:35–42.
27. Van Gelder RN, von Zastrow ME, Yool A, et al. Amplified RNAsynthesized from limited quantities of heterogeneous cDNA. Proc NatlAcad Sci USA 1990;87:1663–1667.
28. Gruvberger-Saal SK, Cunliffe HE, Carr KM, et al. Microarrays in breastcancer research and clinical practice—the future lies ahead. EndocrRelat Cancer 2006;13:1017–1031.
29. Morris SR, Carey LA. Gene expression profiling in breast cancer.Curr Opin Oncol 2007;19:547–551.
30. Loudig O, Milova E, Brandwein-Gensler M, et al. Molecular restorationof archived transcriptional profiles by complementary-templatereverse-transcription (CT-RT). Nucleic Acids Res 2007;35:e94.
31. Joosse SA, van Beers EH, Nederlof PM. Automated array-CGHoptimized for archival formalin-fixed, paraffin-embedded tumormaterial. BMC Cancer 2007;7:43.
32. Mehrotra J, Vali M, McVeigh M, et al. Very high frequency ofhypermethylated genes in breast cancer metastasis to the bone,brain, and lung. Clin Cancer Res 2004;10:3104–3109.
33. Chin K, DeVries S, Fridlyand J, et al. Genomic and transcriptionalaberrations linked to breast cancer pathophysiologies. Cancer Cell2006;10:529–541.
Array analysis of highly degraded RNA
M Ravo et al
440 Laboratory Investigation | Volume 88 April 2008 | www.laboratoryinvestigation.org
Related Documents