Experience the difference”

Welcome message from author
This document is posted to help you gain knowledge. Please leave a comment to let me know what you think about it! Share it to your friends and learn new things together.
Transcript

Experience the difference”

Group Members
Arpit Jain - 80
Zil Shah - 81
Khyati Patel - 82
Nikita Bhasin - 83
Deeviash Sharma - 84
Kalpesh Kerai - 85

Table of Content Vision of the company
Introduction
History of the company
Segmentation & Revenue
Competitive Analysis
Acquisitions and mergers
Financial Status
Ratio analysis
Conclusion
Vision of the Company
• The Company's long-term vision is to excel in the retail entertainment domain to maintain its leadership position in the cinema exhibition business

Introduction
• Most premium film entertainment Company in India.• Listed as the “Most Trusted Brand” in the Category of
Entertainment by the “Brand Trust Report, 2013”.
• Incorporated on April 26, 1995 under the Companies Act as "Priya Village Roadshow Limited“.
• Certificate of commencement of business on December 4, 1995.
• On June 28, 2002 "Priya Village Roadshow Limited“ changed to "PVR Limited" consequent to the exit of Village Roadshow Limited from PVR.
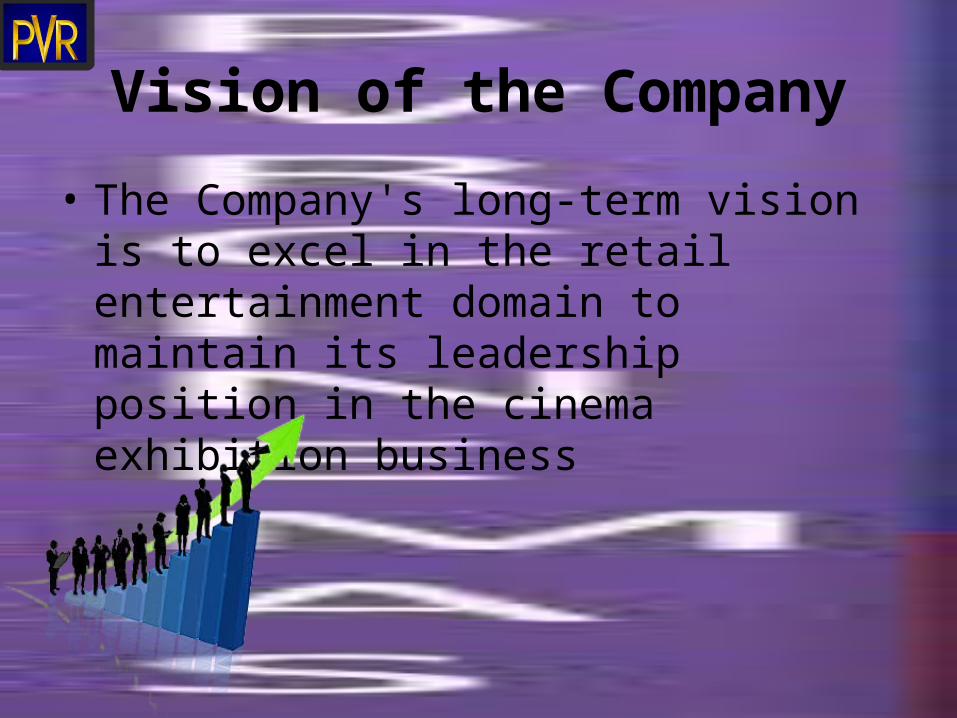
History of the company
1994
• Joint venture agreement executed between Village Roadshow Limited
1996
• 1,199,300 Equity Shares of pvr issued to Ajay Bijli Motor Finance Limited
1997
• Computerized box office operations
2004
• Opened India's largest Multiplex Cinema
2005
• PVR Ltd, a multiplex cinema operator, has fixed its IPO price at Rs 225
2009
• Merged with Sunrise Infotainment Pvt. Ltd • PVR acquires DLF's DT Cinemas for Rs 60 cr
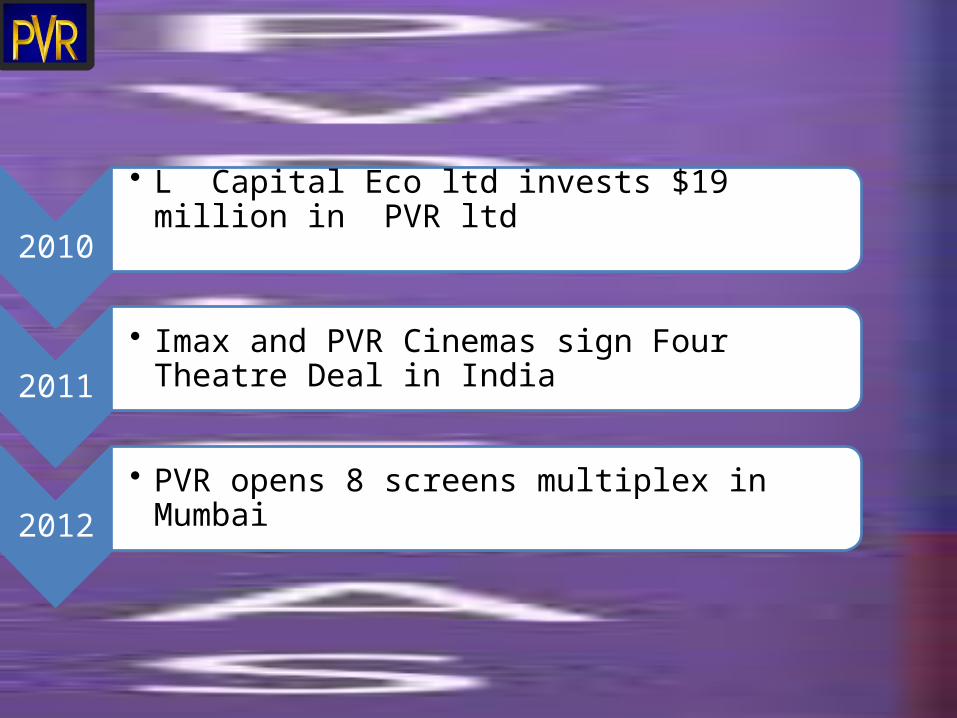
2010
• L Capital Eco ltd invests $19 million in PVR ltd
2011
• Imax and PVR Cinemas sign Four Theatre Deal in India
2012
• PVR opens 8 screens multiplex in Mumbai

Segmentation
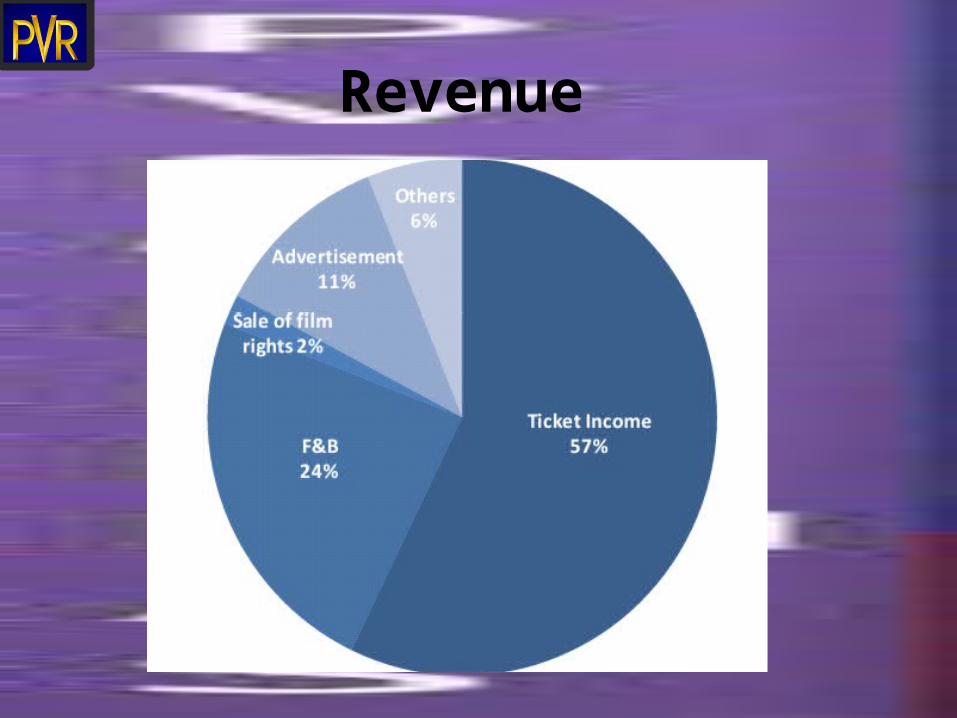
Revenue

Competitive Analysis
28%
20%
16%
5%
5%
3%
23%
Market share (%)
PVRInoxBig Cinemas CinepolisFun CinemasSRS cinemasOthers
Mergers , Acquisitions & Expansion
• L Capital Eco ltd invests $19 million in PVR ltd
• Acquisition of Cinemax – a master stroke
• Only player with aggressive Expansion plans

Financial Status
2010 2011 2012 2013 20140
200
400
600
800
1000
1200
1400
309401
482
678
1285
TOTAL REVENUE

2010 2011 2012 2013 20140
200
400
600
800
1000
1200
1400
305391
468
670
1271
INCOME FROM SALES
2010 2011 2012 2013 20140
2
4
6
8
10
12
14
16
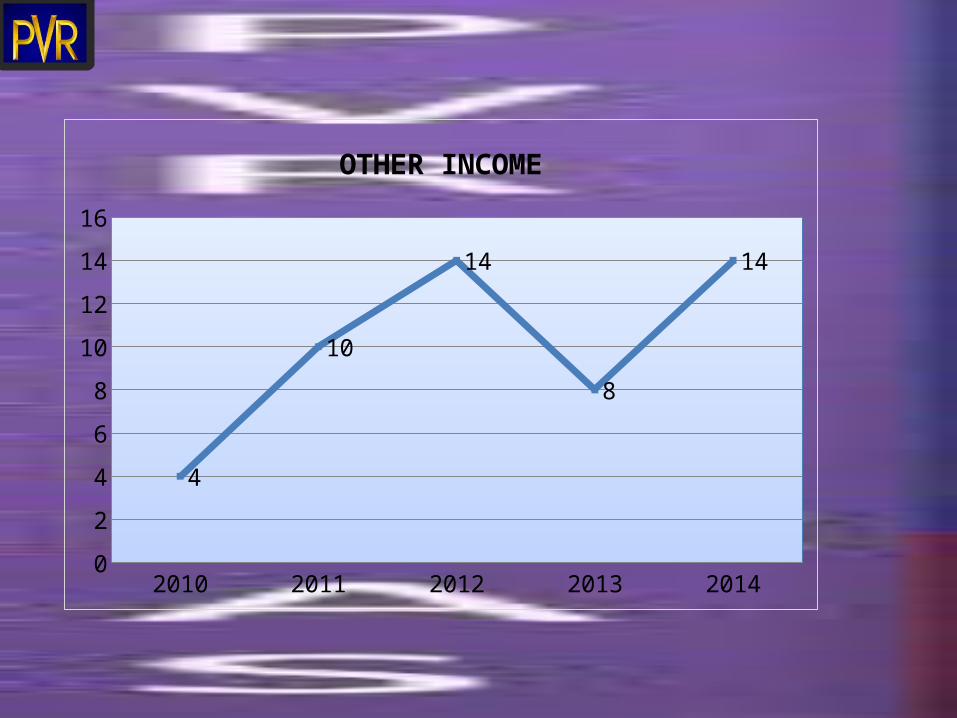
4
10
14
8
14
OTHER INCOME

2010 2011 2012 2013 20140
10
20
30
40
50
60
70
0.26
17
28
5558
PAT
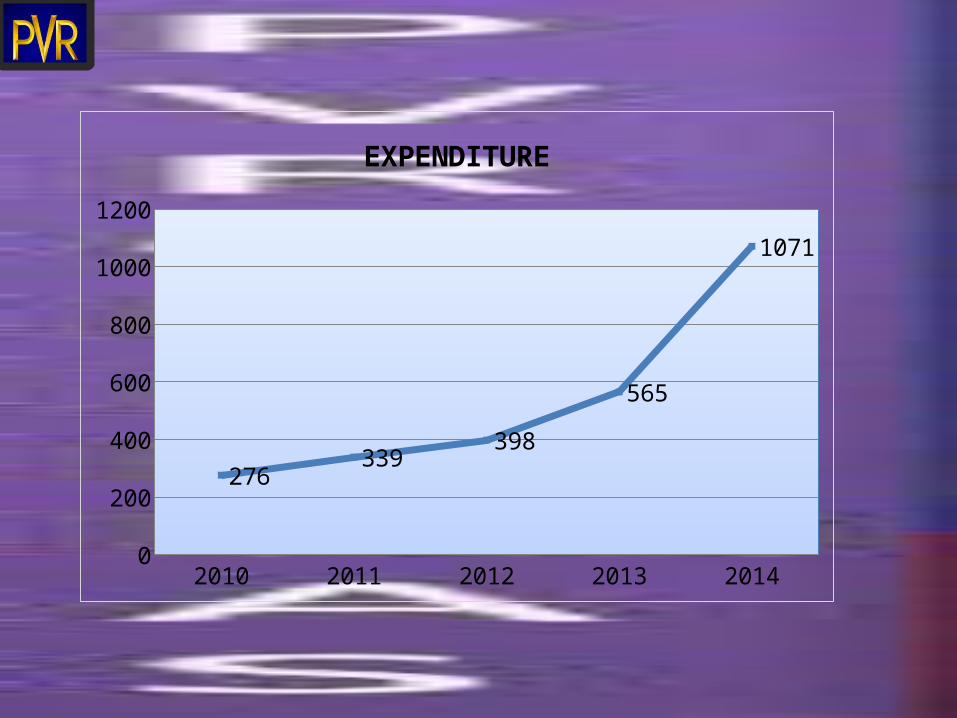
2010 2011 2012 2013 20140
200
400
600
800
1000
1200
276339
398
565
1071
EXPENDITURE
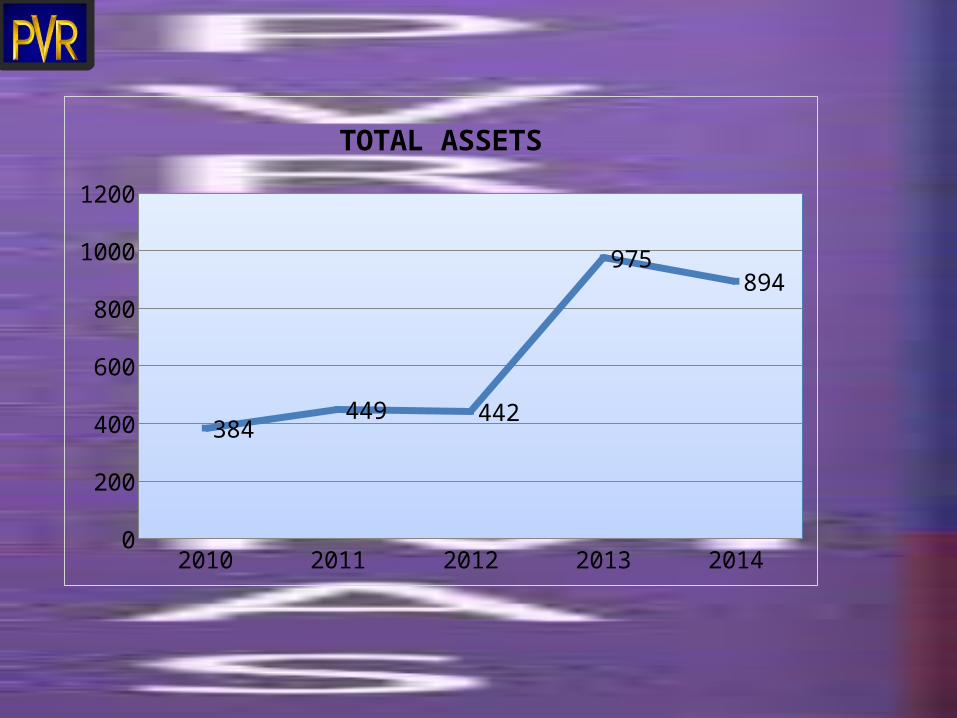
2010 2011 2012 2013 20140
200
400
600
800
1000
1200
384449 442
975894
TOTAL ASSETS
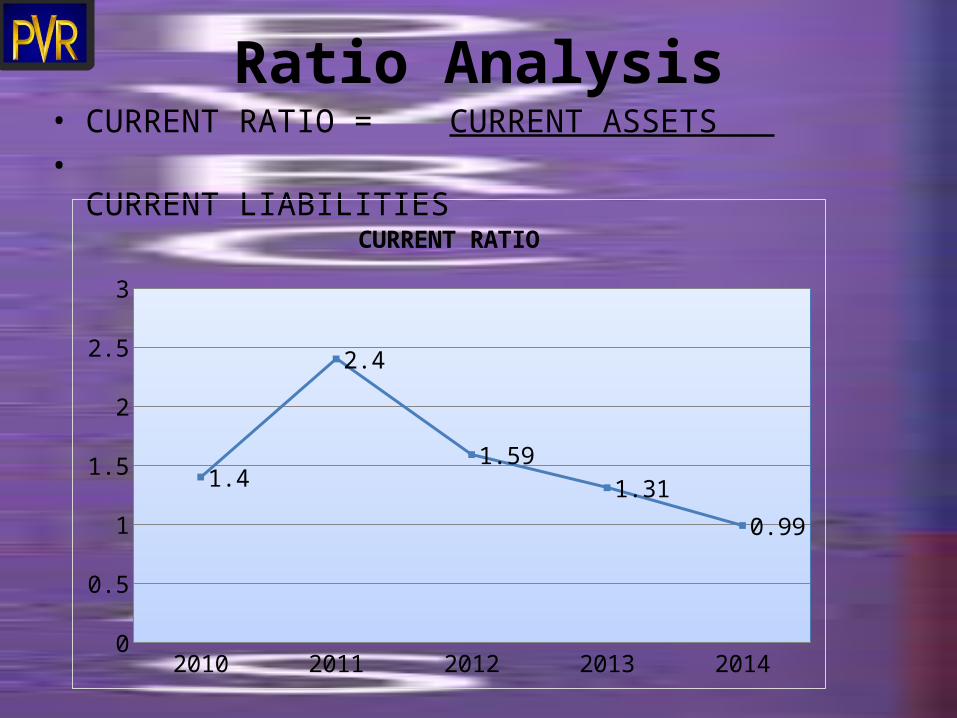
Ratio Analysis• CURRENT RATIO = CURRENT ASSETS • CURRENT LIABILITIES
2010 2011 2012 2013 20140
0.5
1
1.5
2
2.5
3
1.4
2.4
1.591.31
0.99
CURRENT RATIO
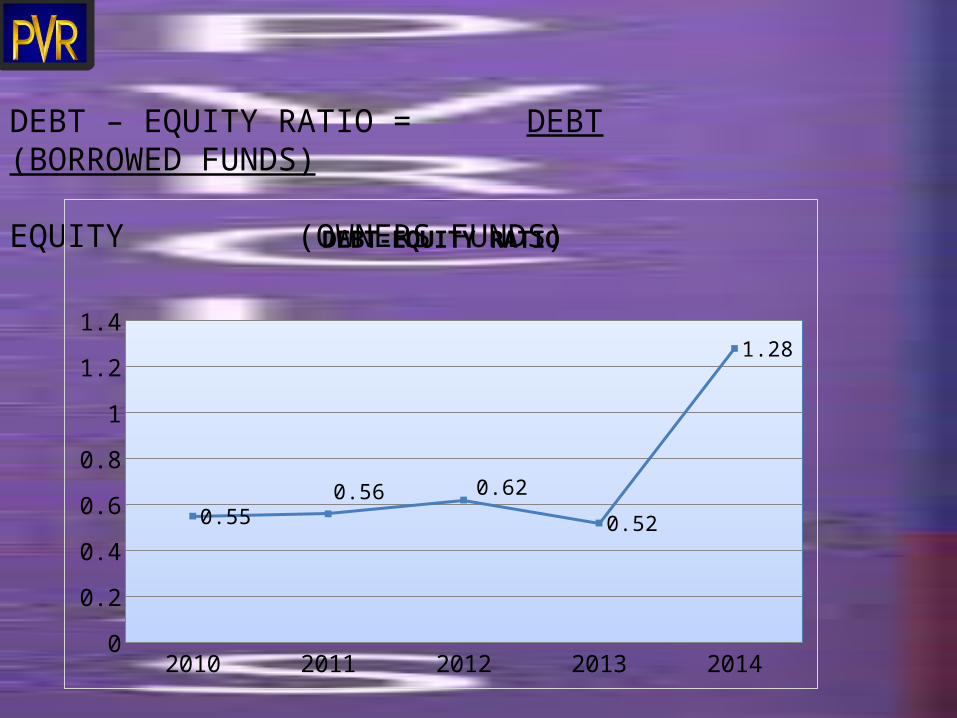
DEBT – EQUITY RATIO = DEBT (BORROWED FUNDS) EQUITY (OWNERS FUNDS)
2010 2011 2012 2013 20140
0.2
0.4
0.6
0.8
1
1.2
1.4
0.550.56 0.62
0.52
1.28
DEBT-EQUITY RATIO

DEBTORS VELOCITY RATIO = ___365 DAYS__ DEBTORS TURNOVER RATIO
DEBTORS TUNROVER RATIO = ___CREDIT SALES___ AVG. DEBTORS + AVG. BILLS RECEIVABLES
2010 2011 2012 2013 20140
5
10
15
20
25
30
35
40
25
29
25
30
37
DEBTORS VELOCITY RATIO (DAYS)

TOTAL ASSETS TURNOVER RATIO = SALES TOTAL ASSETSTOTAL ASSETS = FIXED ASSETS + LONG TERM INVESTMENTS + CURRENT ASSETS
2010 2011 2012 2013 20140
0.2
0.4
0.6
0.8
1
1.2
1.4
1.6
1.8
0.80.88
1.11
0.69
1.69
TOTAL ASSETS TURNOVER RATIO

EARNING PER SHARE = NPAT – PREFERENCE DIVIDEND NUMBER OF EQUITY SHARES
2010 2011 2012 2013 20140
2
4
6
8
10
12
14
16
0.1
6.02
10.85
13.8514.08
EARNING PER SHARE (RS)

THANKYOU
Related Documents