GOLD SEAL- SAARGUMMI India Pvt. Ltd Table of Contents: Part A 1. Industry Profile……………………………………………………………………..... .....1-6 2. Company Profile……………………………………………………………………......... 2.1. Background of the Company…………………………………………………..7-8 2.2. Vision, Mission and Quality Policy……………………………………………9 2.3. Nature of Business……………………………………………………………........9 2.4. Products/Services………………………………………………………………......9 2.5. Area of Operation………………………………………………………………......9 2.6. Ownership Pattern…………………………………………………………….......9 2.7. Competitors Information……………………………………………………......9-10 2.8. Infrastructure Facilities………………………………………………………......9-10 3. Mckinsey’s 7S framework…………………………………………………………......11-12 4. Management Profile.................................................. .........................13 5. SWOT Analysis……………………………………………………………………............14 6. Analysis of Financial Statements…………………………………………….........15-21 7. Learning Experience……………………………………………………………….........22 Part B General Introduction…………………………………………………………………………...........23 1. Statement of Problem………………………………………………………………24 2. Objectives of Study……………………………………………………………….....25 3. Scope of Study…………………………………………………………………….......26 4. Methodology……………………………………………………………………….......26 5. Limitation of Study………………………………………………………………......27 Analysis, interpretation of results findings 1. Interpretation of the Data………………………………………………………….28-55 2. Findings ……………………………………………………………………………..........56 3. Conclusions………………………………………………………………………..........57-58 Page | 1

Welcome message from author
This document is posted to help you gain knowledge. Please leave a comment to let me know what you think about it! Share it to your friends and learn new things together.
Transcript
GOLD SEAL- SAARGUMMI India Pvt. Ltd
Table of Contents:
Part A1. Industry Profile……………………………………………………………………..... .....1-62. Company Profile…………………………………………………………………….........
2.1. Background of the Company…………………………………………………..7-8 2.2. Vision, Mission and Quality Policy……………………………………………92.3. Nature of Business……………………………………………………………........9 2.4. Products/Services………………………………………………………………......9 2.5. Area of Operation………………………………………………………………......92.6. Ownership Pattern…………………………………………………………….......92.7. Competitors Information……………………………………………………......9-102.8. Infrastructure Facilities………………………………………………………......9-10
3. Mckinsey’s 7S framework…………………………………………………………......11-124. Management Profile...........................................................................135. SWOT Analysis……………………………………………………………………............146. Analysis of Financial Statements…………………………………………….........15-217. Learning Experience……………………………………………………………….........22
Part B General
Introduction…………………………………………………………………………...........231. Statement of Problem………………………………………………………………242. Objectives of Study……………………………………………………………….....253. Scope of Study…………………………………………………………………….......264. Methodology……………………………………………………………………….......265. Limitation of Study………………………………………………………………......27
Analysis, interpretation of results findings1. Interpretation of the Data………………………………………………………….28-552. Findings ……………………………………………………………………………..........563. Conclusions………………………………………………………………………..........57-584. Recommendations………………………………………………………………….....59
Bibliography………………………………………………………………………….............60
Page | 1
GOLD SEAL- SAARGUMMI India Pvt. Ltd
PART- A
Page | 2
GOLD SEAL- SAARGUMMI India Pvt. Ltd
I. INDUSTRY PROFILE :
Indian Manufacturing Industry Profile:
The Indian economy is firmly on the path of steady growth. Even during the last decade when other countries were in the grip of a massive slowdown, India continued to enjoy a comfortable economic position. This recent spurt in growth is propelled by radical reforms such as the removal of restrictions on foreign investment and industrial de-licensing. Tailoring the EXIM policy to promote exports and aligning the import duties to meet WTO commitments further contributed to this development. This trend is expected to continue over the next five years, driven by a favourable business policy environment in terms of tax cuts, broadening tax base, and reduced interest rates.
The liberalization of the economy has opened new windows of opportunity for manufacturing sector. Increasingly the success of manufacturing industries is dependent on innovations, research and development. It is critical not only to remain competitive but also, significant advantages can be gained by developing and commercializing new technologies.
With a size of US $ 22 billion, the engineering sector exports stood at US $ 6.6 billion in 2001-02 and imports at US $ 4.9 billion the same year. Indian engineering manufacturing sector employs over 4 million skilled and semi-skilled workers. The engineering manufacturing sector comprises of heavy engineering (70%) and light engineering (30%).
India’s growing integration with the global economy and the government’s recognition that infrastructure needs to be overhauled are likely to ensure that the trend rate of growth increases in the next decade.
Page | 3

GOLD SEAL- SAARGUMMI India Pvt. Ltd
Industrial growth
The manufacturing sector grew by 8.9% in 2004-05, comfortably outperforming the sector’s long term average growth rate of 7%. The sector has remained one of the engines of economic growth since the start of 2005-06.
Industrial growth averaged 7.1% per annum in the 1980s. It accelerated slightly to 7.6% per year in the first five years following the beginning of the economic policy reform process in 1991. In the second half of the 1990s industrial growth trended lower at around 5% per annum. However, since 2002-03 industrial growth has accelerated markedly on the back of recent strong GDP growth. Rising disposable incomes, easy access to finance and the changing attitudes of India’s rapidly rising middle class (with a traditional focus on savings) have resulted in a consumer lending boom. Industrial growth rose above 8% in 2004-05, with consumer durables and non -durables showing exceptionally strong growth. Capital-goods production has been growing at double-digit rates since 2002-03, suggesting increased investment in the industrial sector and the economy as a whole.
Macro-Level Bottlenecks for growth
Critical issues for growth are Historical focus on small scale unorganized manufacturing units, Poor infrastructure and High cost of power.
The other important reasons for the Indian manufacturing being not competitive enough include:
1. Poor quality of transport infrastructure across all sectors including port facilities (where productivity is among the lowest in the world), surface roads, railways, airports and waterways.
2. High cost of power. Industrial power continues to be among the most expensive in the world. It is about 50 per cent more expensive than in China.
3. High cost of capital: It continues to be 10-12 % against international average of 6-8%.
Page | 4
GOLD SEAL- SAARGUMMI India Pvt. Ltd
Manufacturing Technology Status
Technology development is critical to a country's efforts in improving productivity, efficiency and competitiveness of its industrial sector. Factor cost advantages are being replaced by technology - related factors such as zero-defect product quality and international certification of firms' quality assurance systems (e.g., ISO 9000) in determining international competitiveness. Central to maintaining competitiveness is the ability of producers to respond quickly and effectively to the changing demands of the international market.
Technological capabilities can be best described in terms of three levels: the basic level involves the ability to operate and maintain a new production plant based on imported technology, the intermediate level consists of the ability to duplicate and adapt the design for an imported plant and technique elsewhere in the country or abroad, while an advanced level involves a capability to undertake new designs and to develop new production systems and components.
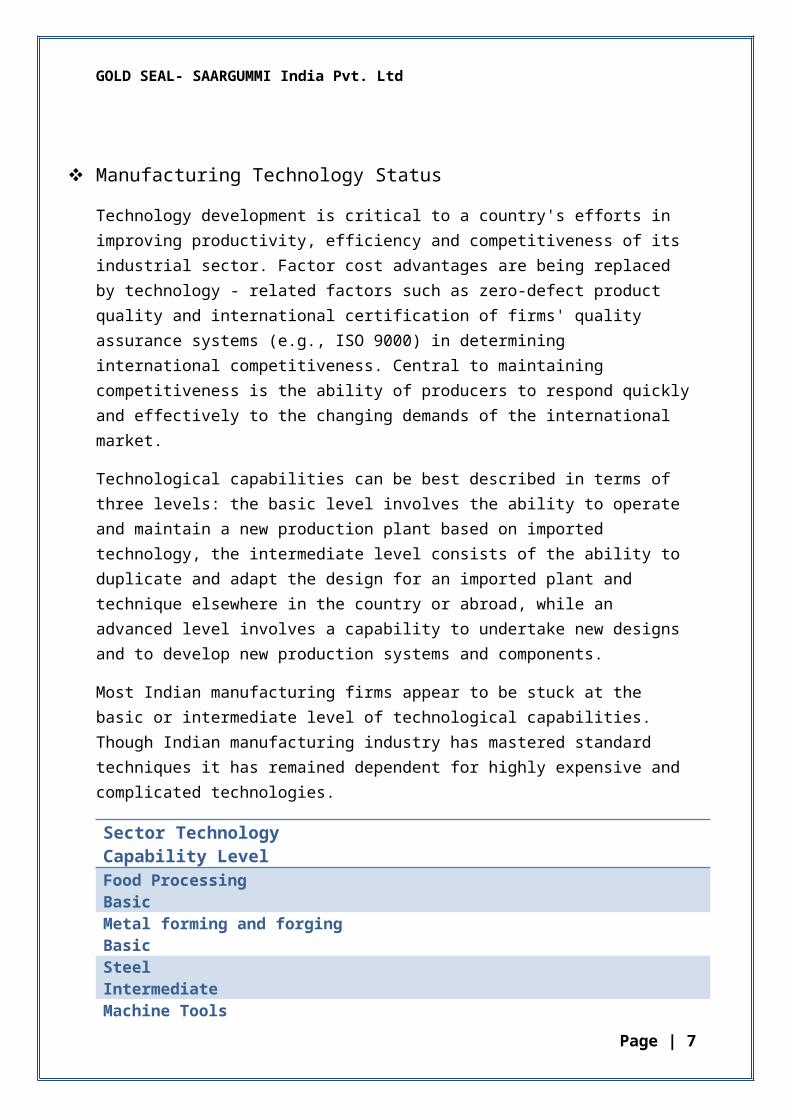
Most Indian manufacturing firms appear to be stuck at the basic or intermediate level of technological capabilities. Though Indian manufacturing industry has mastered standard techniques it has remained dependent for highly expensive and complicated technologies.
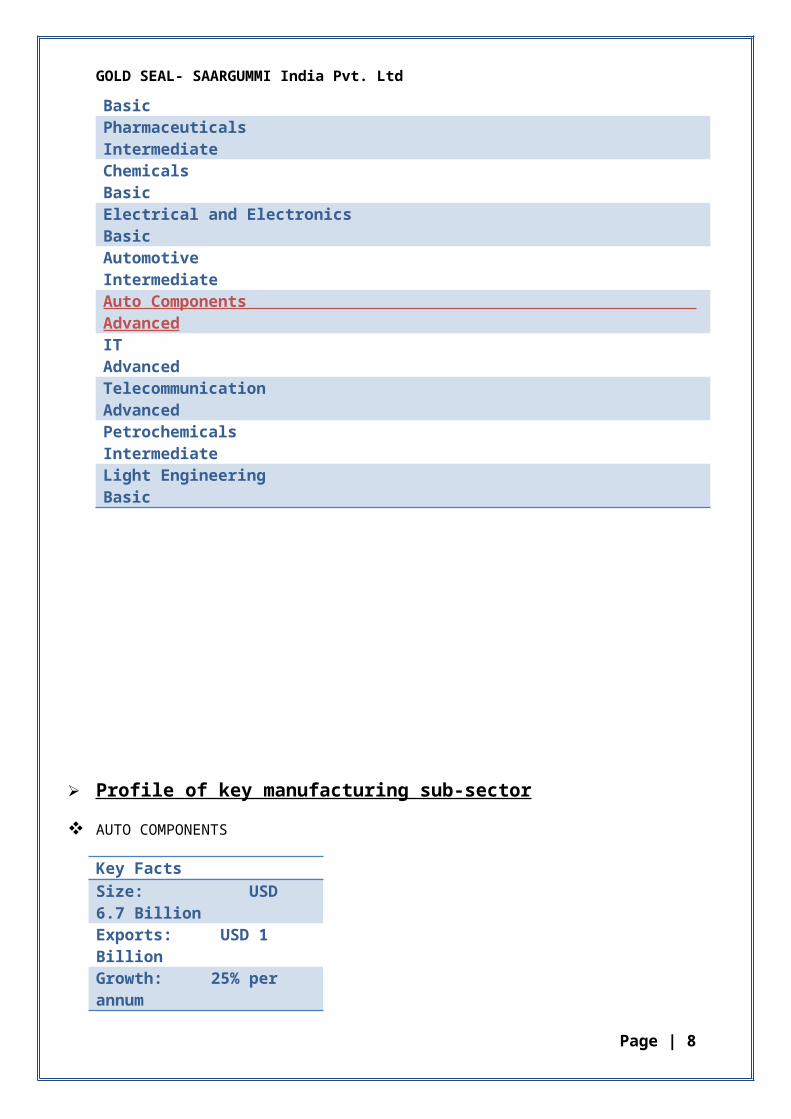
Sector Technology Capability LevelFood Processing BasicMetal forming and forging BasicSteel IntermediateMachine Tools BasicPharmaceuticals IntermediateChemicals BasicElectrical and Electronics BasicAutomotive IntermediateAuto Components AdvancedIT AdvancedTelecommunication AdvancedPetrochemicals IntermediateLight Engineering Basic
Page | 5
GOLD SEAL- SAARGUMMI India Pvt. Ltd
Profile of key manufacturing sub-sector
AUTO COMPONENTS
Key Facts
Size: USD 6.7 BillionExports: USD 1 BillionGrowth: 25% per annum
Indian auto component industry has grown from USD 3.9 Billion to USD 6.7 Billion in 3 years (2003-04) as India is becoming a preferred destination for sourcing by Original Equipment Manufacturers and growth of domestic auto industry. The attractiveness of Indian industry can be explained by the fact that presently around 12 global auto giants have set up international purchasing offices in India and 150 more are expected by 2010.
India offers OEMs (original equipment manufacturers) a great cost -quality proposition, thus making it a preferred destination for outsourcing. Indian manufacturers enjoy the advantages of cheaper raw materials and availability of educated, qualified and skilled labour as well as engineers and designers at much lower costs. Technological advancements made by some of these domestic players have allowed them to become integrated partners rather than mere outsourcing partners. Indian automobiles and components are gaining increasing acceptance in world markets due to their cost -competitiveness. Auto components exports have shot up from $578 million in 2001-02 to $1000 million in 2003-04. The industry expects the growth to continue as domestic manufacturers acquire greater technological skills.
Technology Status
Indian companies are no longer restricting themselves to component manufacturing. They are also focusing on using their expertise in CAD/CAM and in designing and engineering capabilities by entering into designing and development of components for new product.
India’s automotive component industry manufactures the entire range of parts required for vehicle manufacture. To meet international quality requirements and for tapping the global markets, the Indian auto ancillary units have entered into joint ventures with MNCs.
II. COMPANY PROFILE :
Page | 6
GOLD SEAL- SAARGUMMI India Pvt. Ltd
Gold Seal- SAARGUMMI India Pvt. Ltd. is a JV between 2 technology leaders - Gold Seal of India and SAARGUMMI of Germany.
Name of the company: GOLD SEAL – SAARGUMMI INDIA (P) LTD.
CEO : Cyrus H. Aga
Directors : Pilloo Aga
Khursheed Aga Urvaksh Aga
Registered Office : GOLD SEAL HOUSE,
OPP. NAHUR STATION (W),
VILLAGE ROAD, BHANDUP,
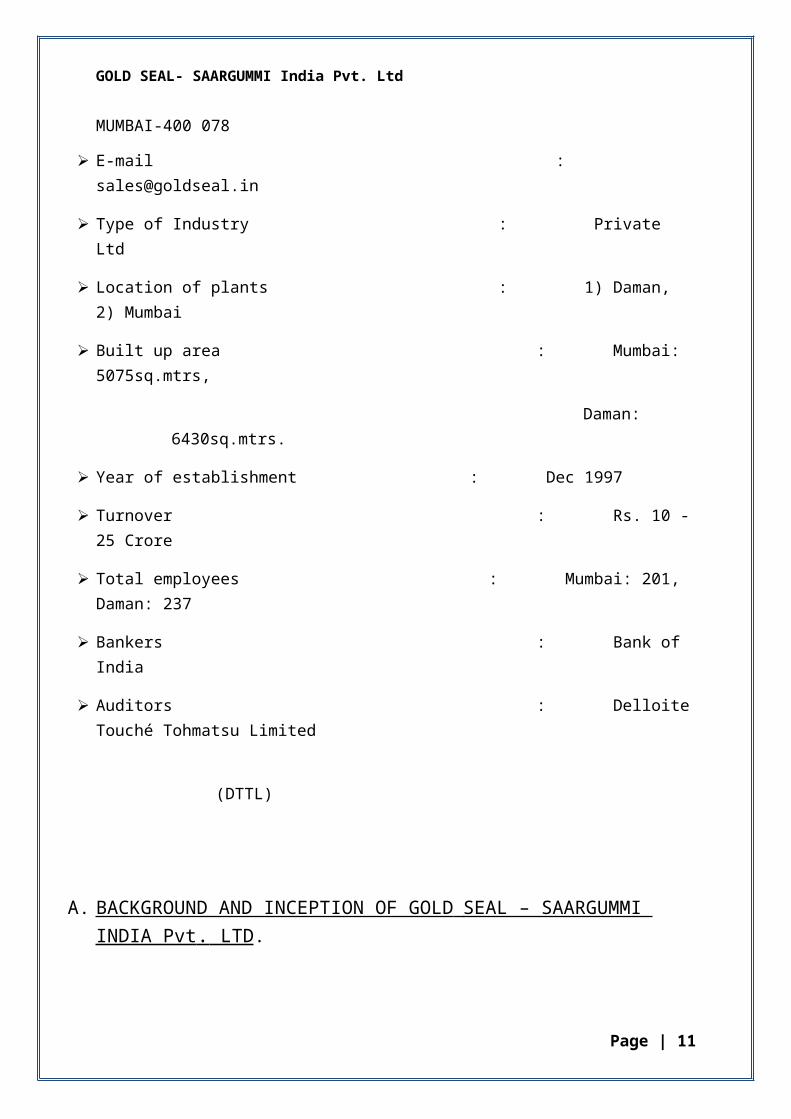
MUMBAI-400 078
E-mail : [email protected]
Type of Industry : Private Ltd
Location of plants : 1) Daman, 2) Mumbai
Built up area : Mumbai: 5075sq.mtrs,
Daman: 6430sq.mtrs.
Year of establishment : Dec 1997
Turnover : Rs. 10 - 25 Crore
Total employees : Mumbai: 201, Daman: 237
Bankers : Bank of India
Auditors : Delloite Touché Tohmatsu Limited
(DTTL)
Page | 7
GOLD SEAL- SAARGUMMI India Pvt. Ltd
A. BACKGROUND AND INCEPTION OF GOLD SEAL – SAARGUMMI INDIA Pvt . LTD .
Gold Seal started operations in 1958 and manufactured the first Indian Door Seal and Window Channel, fitted as OEM on the first Indian car.
Gold Seal has maintained its Quality & Brand Leadership with leading Indian OEMs and supplies its ever expanding range of products of EPDM (Ethylene Propylene Diene Monomer) rubber, PVC (Poly Vinyl Chloride), Nit rile, and TPE (Thermoplastic Elastomer/Rubbers) extruded sealing profiles to more than 25 OEM locations all over India from its 2 plants in Mumbai and Daman.
Gold Seals continuous focus on quality and innovation ensures OEM customer satisfaction & the ever growing export markets in Africa, Australia, European Union, Middle East, South East Asia, and the United Kingdom are testimony to the same.
SAARGUMMI is the innovation leader for body sealing systems with 14 manufacturing locations worldwide. SAARGUMMI is the 5th largest sealing system supplier worldwide and the 3rd largest in Europe.
Recently SAARGUMMI won the prestigious “Factory of the year/ Global excellence in operations” award for its outstanding innovations. SAARGUMMI has competence within the complete value added chain including material development, product design and manufacturing of complex sealing systems.
Gold Seal- SAARGUMMI India Pvt. Ltd. is JV between 2 technology leaders - Gold Seal of India and SAARGUMMI of Germany.
GSSG has TS16949 / ISO14001 certified plant in Daman for extrusion of complex and Innovative EPDM Weather strips & a plant in Mumbai for finishing operation. GSSG works closely with Indian OEM’s from design to final Production.
Page | 8
GOLD SEAL- SAARGUMMI India Pvt. Ltd
B. NATURE OF BUSINESS CARRIED
The Organization is the Largest Manufacturers, O.E.M. Suppliers & Exporters of Automobile Body Trimmings.
C. i) OBJECTIVE
The objective of Gold Seal Engineering is to consistently achieve customer requirements with minimum variability at the lowest cost possible by harnessing the potential of all employees in the organization.
ii) QUALITY POLICY
Gold Seal Management practices and employee work activities will, without expectation promote on time delivery of products & services which are consistently in conformance with customer requirements to achieve high levels of customer’s satisfaction.
The company is committed to a policy of right first time and continual improvements in all activities, especially in the quality of product, management systems and services throughout its supply chain.
Cyrus H. Aga- C.E.O.
iii) BUSINESS PHILOSOPHY
Excellence through Quality, Honesty & Transparency in all RELATIONSHIPS.
Page | 9

GOLD SEAL- SAARGUMMI India Pvt. Ltd
D. PRODUCTS/ SERVICES PROFILE
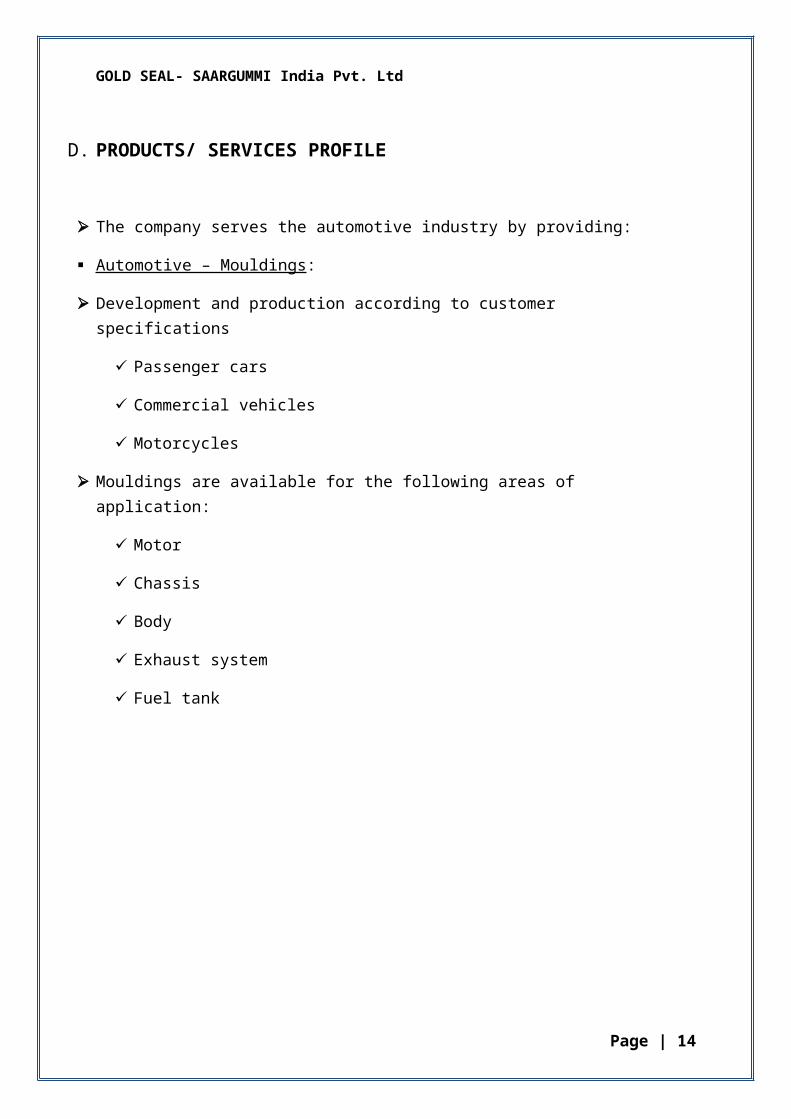
The company serves the automotive industry by providing:
Automotive – Mouldings :
Development and production according to customer specifications
Passenger cars
Commercial vehicles
Motorcycles
Mouldings are available for the following areas of application:
Motor
Chassis
Body
Exhaust system
Fuel tank
Page | 10
GOLD SEAL- SAARGUMMI India Pvt. Ltd
Products:
Rubber Products -
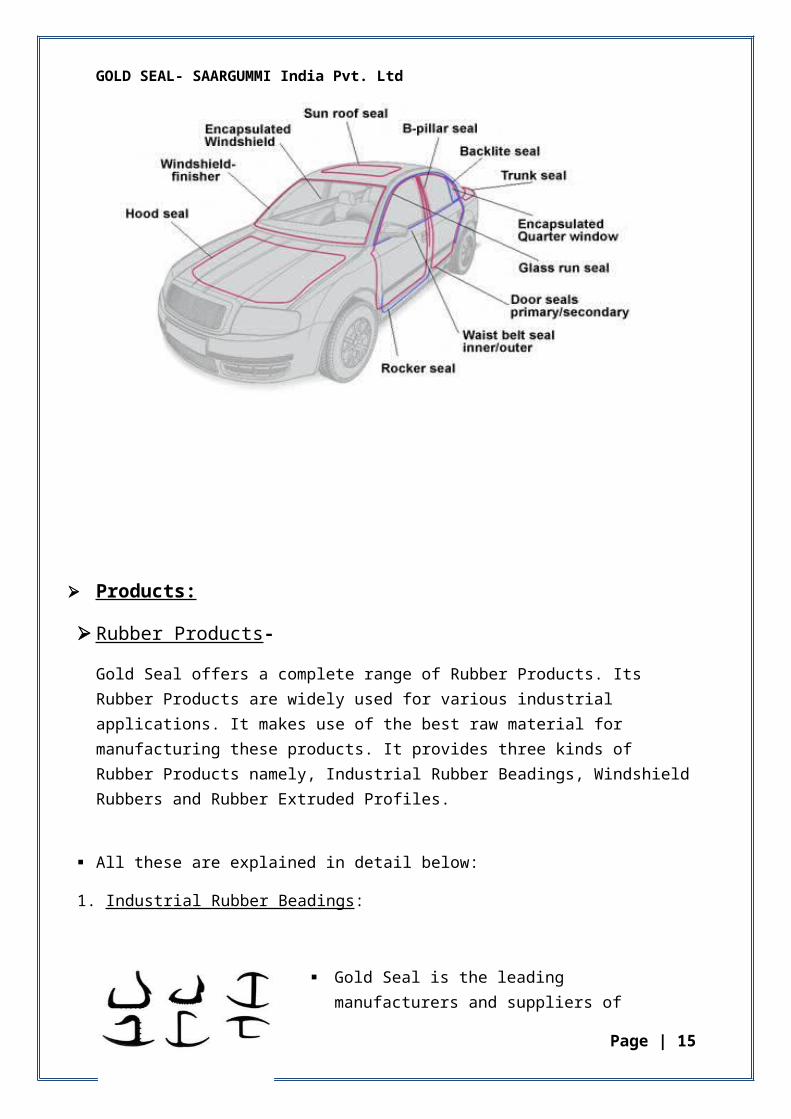
Gold Seal offers a complete range of Rubber Products. Its Rubber Products are widely used for various industrial applications. It makes use of the best raw material for manufacturing these products. It provides three kinds of Rubber Products namely, Industrial Rubber Beadings, Windshield Rubbers and Rubber Extruded Profiles.
All these are explained in detail below:
1. Industrial Rubber Beadings:
Gold Seal is the leading manufacturers and suppliers of qualitative container seals that are widely used in the automobile industry. These container seals are offered in various specifications as per the requirement of the clients.
2. Windshield Rubbers
The robust windshield rubbers are made of single component Solid rubber. The EPDM compound is formulated for long lasting resistance to weathering forces like Ozone, salt spray etc. The range extends from small size automobiles to large and heavy trucks as well, applicable on Indian as well as foreign range of vehicles.
Page | 11
GOLD SEAL- SAARGUMMI India Pvt. Ltd
3. Rubber Extruded Profiles
The solid or sponge rubber profiles of varying hardness, find their application as Windshield Finishers, Backlight Finishers, Sunroof Seals, Rocker Panel Seals etc. They are also supplied with heat bond laminated 3M self adhesive tapes, as per customer requirements. This allows for easy application on the body, for sealing any gaps, between the panels of the vehicle.
Mechanical seals
Gold Seal offers a wide range of Mechanical Seals. Its range of mechanical seals is used variedly according to its types. It makes use of the best raw material for manufacturing these products. Gold Seal offers its clients with many types of Seals that are described in detail below:
Car Seals and Weather-strips:
Gold Seal is one of the leading manufacturers and suppliers of high quality EPDM Rubber extruded a wide range of car sealing systems. Its range includes:
Sun roof seal
Rocker seal
Sun roof seal
Windshield finisher
Door-to-door seal
Rear window finisher
Trunk seal
Glass run seal
Page | 12
GOLD SEAL- SAARGUMMI India Pvt. Ltd
Flocked Channels
Primary deal seal
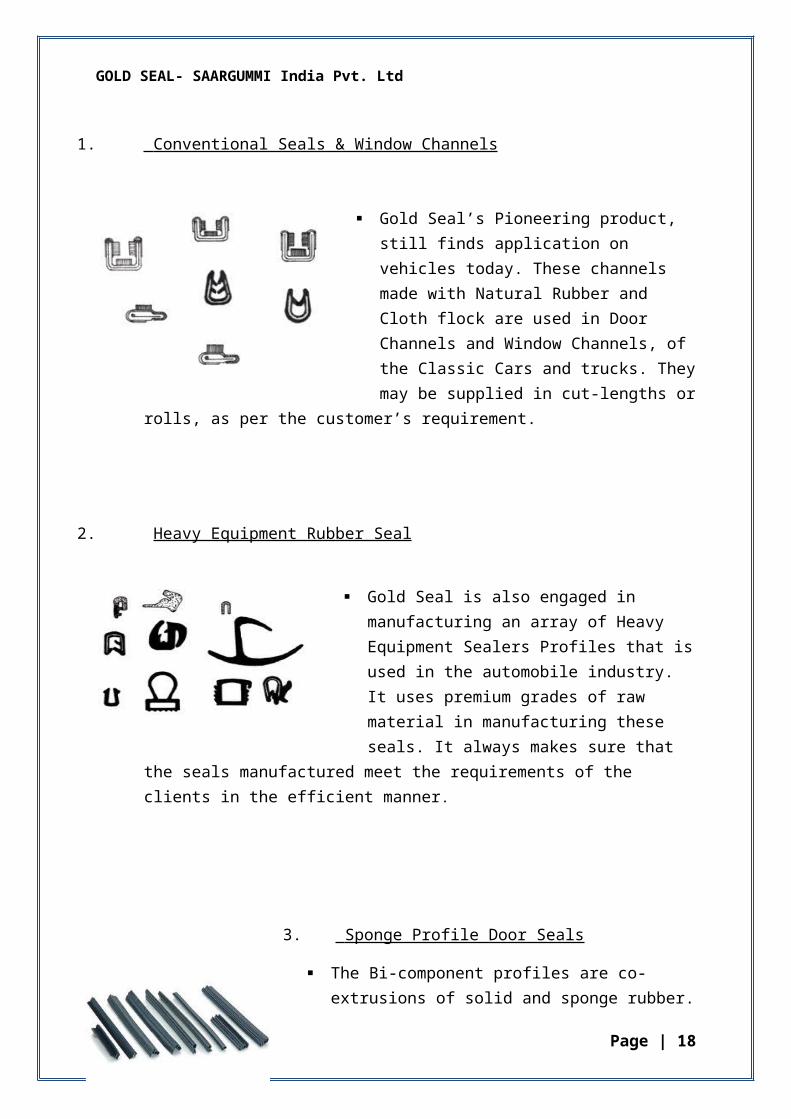
1. Conventional Seals & Window Channels
Gold Seal’s Pioneering product, still finds application on vehicles today. These channels made with Natural Rubber and Cloth flock are used in Door Channels and Window Channels, of the Classic Cars and trucks. They may be supplied in cut-lengths or rolls, as per the customer’s requirement.
2. Heavy Equipment Rubber Seal
Gold Seal is also engaged in manufacturing an array of Heavy Equipment Sealers Profiles that is used in the automobile industry. It uses premium grades of raw material in manufacturing these seals. It always makes sure that the seals manufactured meet the requirements of the clients in the efficient manner.
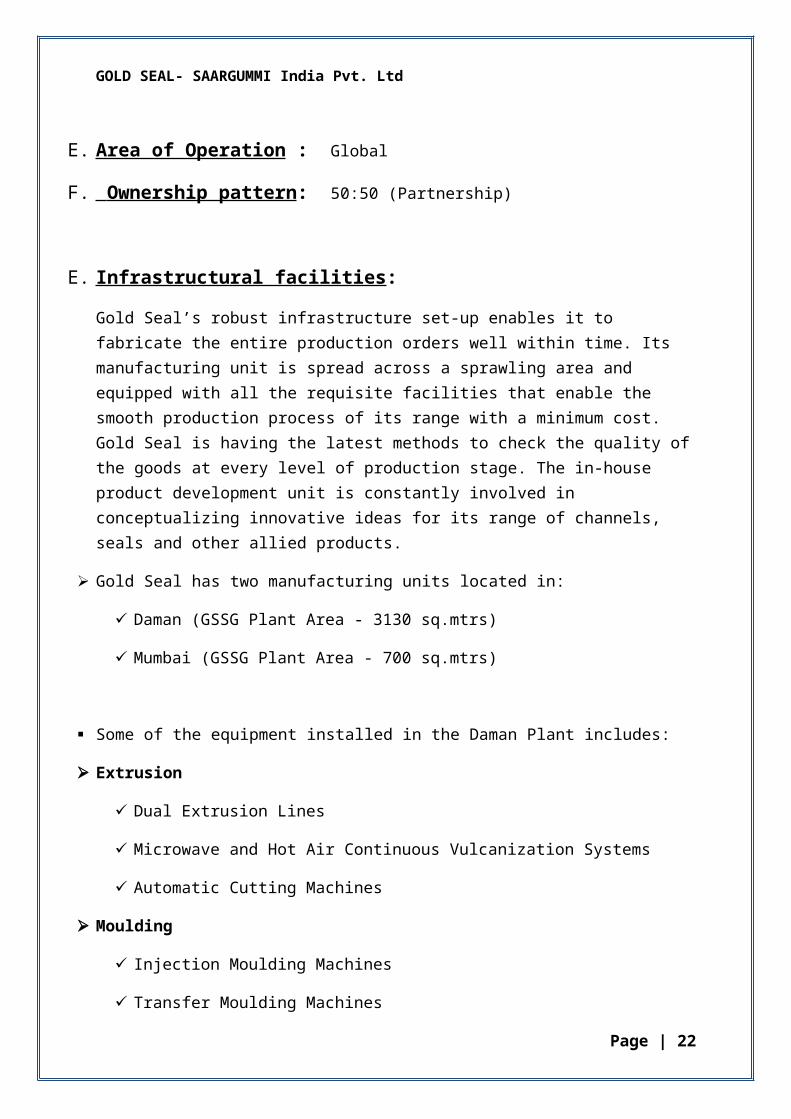
3. Sponge Profile Door Seals
The Bi-component profiles are co-extrusions of solid and sponge rubber. They may be designed with or without flexible metal reinforcement, or with single or double bulbs, as per the application requirements. Mainly used as primary and secondary door seals, B-pillar seals, boot or bonnet seals or roof line seals. Also supplied with specialised slip - coatings to reduce noise and vibrations.
Page | 13
GOLD SEAL- SAARGUMMI India Pvt. Ltd
Page | 14
GOLD SEAL- SAARGUMMI India Pvt. Ltd
4. Bonnet & Dicky Seals
Gold seal manufactures a wide range of boot and bonnet seals that is widely used in the automobile industry. Its range of boot and bonnet seals is widely used in the renowned brands such as Opel, Fiat, Ford and many others. The boot seals are used in Opel, Ford Icon and Fiat-124 models. These can also be customized as per the specifications provided by our clients. Our range of bonnet seals is used in the models such as Opel Astra, Opel Corsa and Suzuki 800.
5. Building Construction Rubber Seals
These seals are specially designed and developed by experts in order to meet the specific requirement of the clients. It also can develop parts according to customer’s samples or drawing etc.
Page | 15

GOLD SEAL- SAARGUMMI India Pvt. Ltd
E. Area of Operation : Global
F. Ownership pattern : 50:50 (Partnership)
E. Infrastructural facilities :
Gold Seal’s robust infrastructure set-up enables it to fabricate the entire production orders well within time. Its manufacturing unit is spread across a sprawling area and equipped with all the requisite facilities that enable the smooth production process of its range with a minimum cost. Gold Seal is having the latest methods to check the quality of the goods at every level of production stage. The in-house product development unit is constantly involved in conceptualizing innovative ideas for its range of channels, seals and other allied products.
Gold Seal has two manufacturing units located in:
Daman (GSSG Plant Area - 3130 sq.mtrs)
Mumbai (GSSG Plant Area - 700 sq.mtrs)
Some of the equipment installed in the Daman Plant includes:
Extrusion
Dual Extrusion Lines
Microwave and Hot Air Continuous Vulcanization Systems
Automatic Cutting Machines
Moulding
Injection Moulding Machines
Transfer Moulding Machines
Compression Moulding Machines
Finishing
Cutting Presses
Page | 16
GOLD SEAL- SAARGUMMI India Pvt. Ltd
Quality Assurances
Rheometer
Viscometer
Universal Tensile Tester
Profile Projector
Flock Abrasion Tester
The equipment installed in the Mumbai plant includes:
Injection Moulding Machines
Heat Bond Laminators
Cutting & Finishing machinery
Highlights of Gold Seal’s infrastructural facilities :
Imported Dual Extrusion Lines with continuous vulcanization with microwave technology.
Fully Fledged Laboratory and QUALITY Assurance Equipment.
In-house Capability from Design to Manufacture of Products & Equipment's.
Established backward integration for sub components.
Versatile Machinery to make Custom made profiles at Competitive rates.
Page | 17
GOLD SEAL- SAARGUMMI India Pvt. Ltd
H) Awards and Achievements:
Gold Seal has won numerous Export Awards over the years from All India Rubber Industries Assoc. (AIRIA), Chemical and Allied Products Export Promotion Council (CAPEXIL) & Engineering Export Promotion Council (EEPC).
Gold Seal also got an Award from President of India in Silver Jubilee year.
Saargummi won the prestigious “Factory of the Year/ Global excellence in Operations” award for its outstanding innovations.
I) Customer Information: Gold Seal & SAARGUMMI Worldwide Customers:
TATA Motors
Volkswagen (VW)
Swaraj Mazda
Visteon
Suzuki
SMART
Skoda Auto
SERT
SAAB
Porsche
OPEL
Mercedes Benz
Man Force Trucks Pvt. Ltd
Mahindra & Mahindra
Audi
HONDA
Page | 18
GOLD SEAL- SAARGUMMI India Pvt. Ltd
General Motors (GM)
FORD
FORCE
EICHER
FIAT
DAIMLER
BMW (Bavarian Motor Works)
BAJAJ
AOGL
Page | 19

GOLD SEAL- SAARGUMMI India Pvt. Ltd
J) WORK FLOW MODEL: RAMCO “ERP” SYTEMS. (IN SYSTEM PROCESS)
Page | 20
SUPPLIER
DISPATCH TO CUSTOMERS
PRODUCTION PLAN (GENERATED BY MRP)
RM TO SF
SF (SEMI-FINISHED)
FG (FINISHED GOODS)
QUICK WORK ORDER (QWO)
PACKSLIP/ INVOICE
FG BOOKED TO FGWH (FINISHED GOOD WAREHOUSE)
PURCHASE ORDER
INWARDS GOODS RECEIPT (IGR)
MATERIAL RESOURCE PLANNING (MRP)
STOCK TO PRWH (STOCK TRANSFER TO PRODUCTION WAREHOUSE)
PURCHASE REQUEST
RAW MATERIAL WAREHOUSE (RMWH)
SALES ORDER
FORECAST
R.M. CONVERSION INTO S.F.
S.F. INTO F.G.

GOLD SEAL- SAARGUMMI India Pvt. Ltd
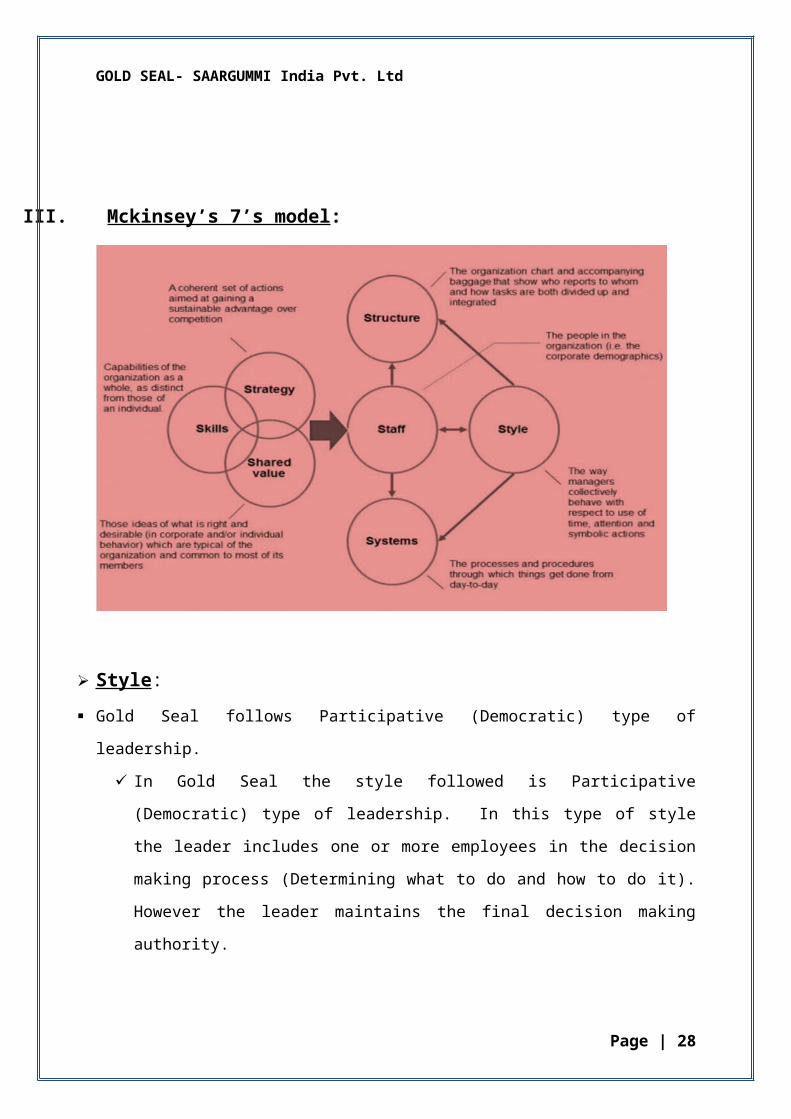
III. Mckinsey’s 7’s model:
Style :
Gold Seal follows Participative (Democratic) type of leadership.
In Gold Seal the style followed is Participative (Democratic) type of leadership. In this
type of style the leader includes one or more employees in the decision making process
(Determining what to do and how to do it). However the leader maintains the final
decision making authority.
Gold Seal uses this type of leadership style because the leader possesses a part of the
information, and his employees have other parts.
Note that a leader is not expected to know everything; this is why he employs
knowledgeable and skilful employees.
This style used is of mutual benefit as it allows the gold seal employees to become part
of the team and allows the leader to make better decisions.
Page | 21
GOLD SEAL- SAARGUMMI India Pvt. Ltd
Strategy :
Adopting good manufacturing practices in order to obtain export approvals from MNC
OEM’s, and, projecting better image while competing.
Keeping Quality as the main criterion and meeting the global quality standards, in order
to get the contracts and maintain their current customers by providing standard
products.
Shared Values :
The company is committed to a policy of continual improvement in all activities.
Mutual trust and prosperity to determine healthy vender relationship.
High concern for quality, safety and work environment in managing operations.
Ethical, promptness, hard work, social responsibility.
Customer satisfaction is of cordial value of Gold Seal.
System:
Is equipped with all modern equipments.
TS16949 / ISO14001 certified for quality assurance.
Staff:
It selects those position or specialised people who have ability or skills to perform their
duties as per the requirements of the company such as expert supervisor in their
respective works, departmental heads such as Finance, HR, Quality control and
Marketing & Sales etc.
The company has hired eligible people, trains them well and assigned them the right
jobs.
Selection, training, reward and recognition, motivation and assignment of works to
appropriate people are all key issues.
Page | 22
GOLD SEAL- SAARGUMMI India Pvt. Ltd
Skills:
Gold Seal is mainly recommended for the quality assurance purpose.
The company is adopting new technology to develop the productivity and to have an
effective control over the activities of the company.
It ensures of securing Quality, Timing and Cost.
The company has hired eligible people, trains them well and assigned them the right
jobs so the current employees/team members have the ability to do the job very well.
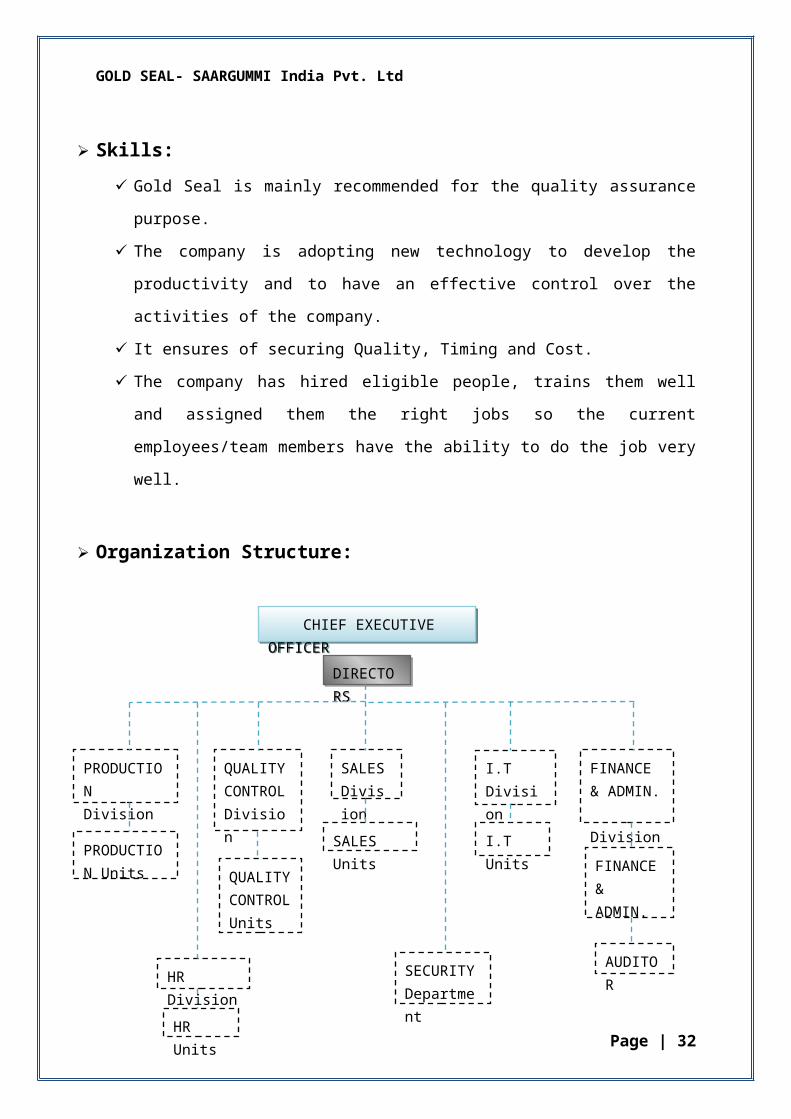
Organization Structure:
Page | 23
CHIEF EXECUTIVE OFFICER CHIEF EXECUTIVE OFFICER
DIRECTORSDIRECTORS
QUALITY CONTROL Division
HR Division
I.T Division
SALES Division
FINANCE & ADMIN. Division
PRODUCTION Division
PRODUCTION Units
HR Units
FINANCE & ADMIN. Units
SALES Units I.T Units
SECURITY Department
QUALITY CONTROL Units
AUDITOR

GOLD SEAL- SAARGUMMI India Pvt. Ltd
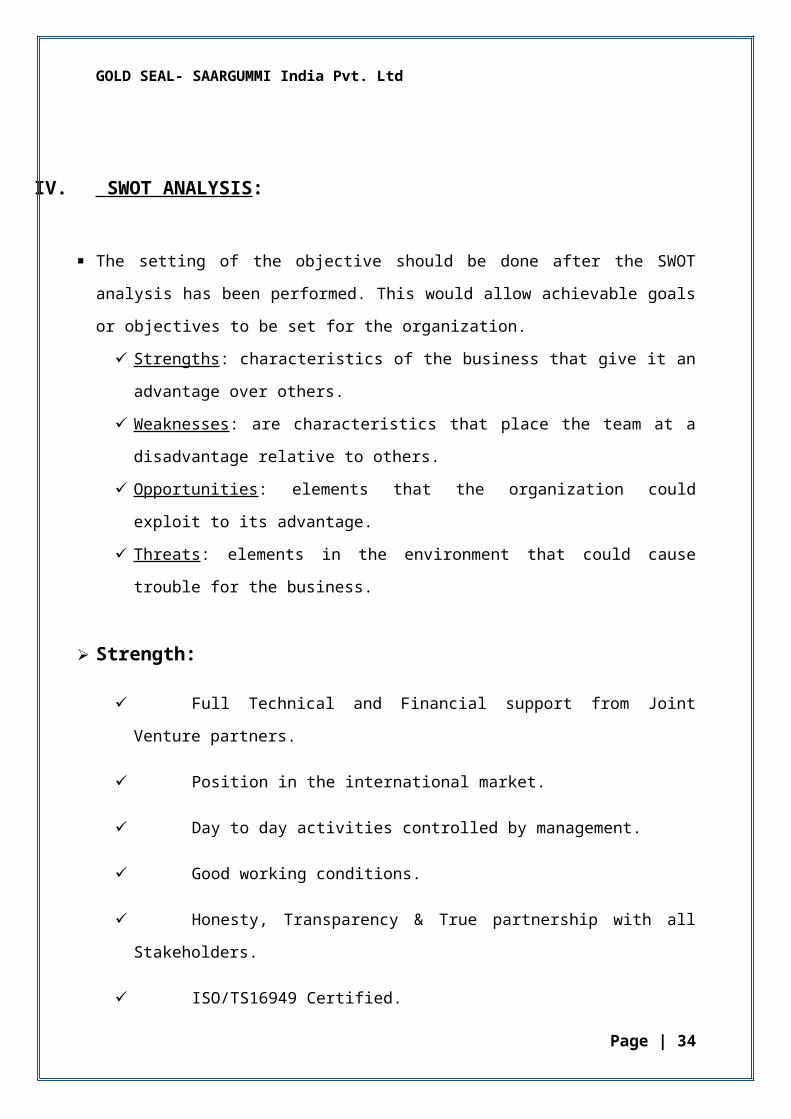
IV. SWOT ANALYSIS :
The setting of the objective should be done after the SWOT analysis has been performed.
This would allow achievable goals or objectives to be set for the organization.
Strengths : characteristics of the business that give it an advantage over others.
Weaknesses : are characteristics that place the team at a disadvantage relative to others.
Opportunities : elements that the organization could exploit to its advantage.
Threats : elements in the environment that could cause trouble for the business.
Strength:
Full Technical and Financial support from Joint Venture partners.
Position in the international market.
Day to day activities controlled by management.
Good working conditions.
Honesty, Transparency & True partnership with all Stakeholders.
ISO/TS16949 Certified.
The Company has a good reputation among its customers and suppliers.
Reliable suppliers with superior quality assurance.
Weakness:
Fluctuating government policies.
Inflation.
Page | 24
GOLD SEAL- SAARGUMMI India Pvt. Ltd
Opportunities:
Continuous pressure on global OEMs and Tier 1s to reduce cost and source from low
cost countries.
The growing need to outsource.
Leverage on product engineering expertise to improve the worthiness and exports of
auto component.
Global market opportunity.
Higher frequency of introducing of newer models by automakers.
Cheap labour.
Threats:
Exchange-rate variations.
Developments of new technologies like fuel cell, hydrogen powered vehicles.
Free Trade Agreements / Preferential Trade Agreements (FTA’s).
Tax structure especially the disparity in custom and excise duties on the raw material of
auto components.
Page | 25

GOLD SEAL- SAARGUMMI India Pvt. Ltd
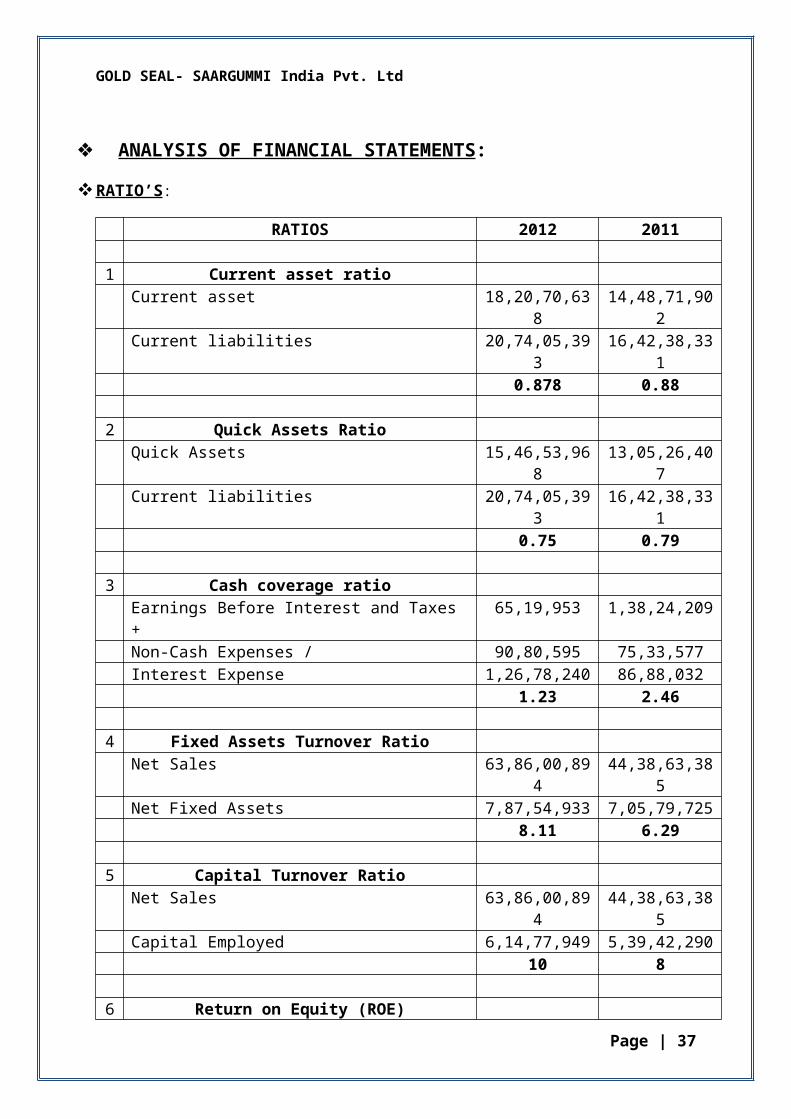
ANALYSIS OF FINANCIAL STATEMENTS:
RATIO’S :
RATIOS 2012 2011
1 Current asset ratioCurrent asset 18,20,70,638 14,48,71,902Current liabilities 20,74,05,393 16,42,38,331
0.878 0.88
2 Quick Assets RatioQuick Assets 15,46,53,968 13,05,26,407Current liabilities 20,74,05,393 16,42,38,331
0.75 0.79
3 Cash coverage ratioEarnings Before Interest and Taxes + 65,19,953 1,38,24,209Non-Cash Expenses / 90,80,595 75,33,577Interest Expense 1,26,78,240 86,88,032
1.23 2.46
4 Fixed Assets Turnover RatioNet Sales 63,86,00,894 44,38,63,385Net Fixed Assets 7,87,54,933 7,05,79,725
8.11 6.29
5 Capital Turnover RatioNet Sales 63,86,00,894 44,38,63,385Capital Employed 6,14,77,949 5,39,42,290
10 8
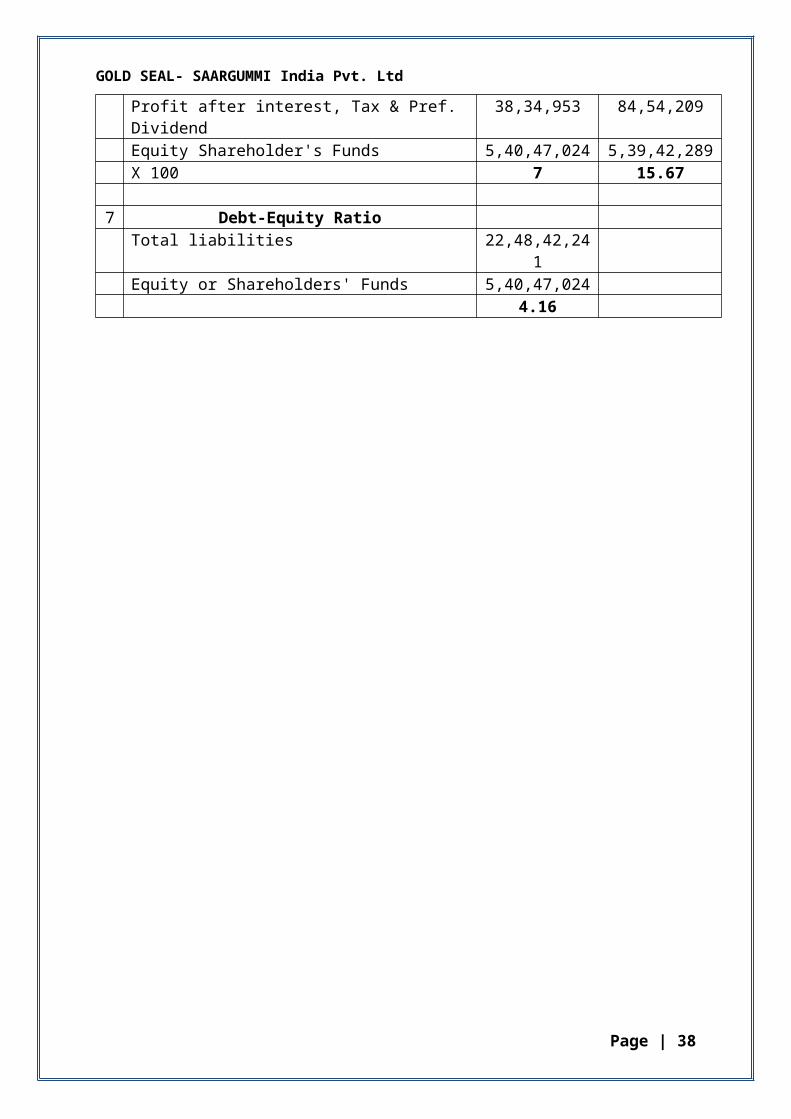
6 Return on Equity (ROE)Profit after interest, Tax & Pref. Dividend 38,34,953 84,54,209Equity Shareholder's Funds 5,40,47,024 5,39,42,289X 100 7 15.67
7 Debt-Equity RatioTotal liabilities 22,48,42,241Equity or Shareholders' Funds 5,40,47,024
4.16
Page | 26

GOLD SEAL- SAARGUMMI India Pvt. Ltd
Ratio analysis:
1. Current ratio
The current ratio for the year 2011 is indicating 0.88 and for the year 2012 it is 0.87. As the ratio is under 1 the company will be unable to pay off its obligations if they came due at that point. While this shows the company is not in good financial health, it does not mean that it will go bankrupt.
2. Quick assets ratio
Quick ratio is 0.75 for 2012 and for 2011 it is 0.79, as calculated. The short term liquidity of the company is reduced against the previous year liquidity i.e. of 2011; the company is not quite capable of meeting its short term obligations with its most liquid assets. However, the company is stable in its financial standing.
3. Cash coverage ratio
The cash coverage ratio indicates a stable standing of the company, as the company is capable of paying its interest expenses with the available amount of cash they possess.
The ratio calculated is, for 2012- 1.23:1 and for 2011- 2.46:1.
Evidently, there has been reduction, comparatively.
4. Fixed Assets turnover ratio
The company has posted a higher fixed asset turnover ratio, which means, the company has been more effective in using the investments in fixed assets to generate revenues.
5. Capital turnover ratio
The capital turnover ratio is high, which shows the companies effectiveness in using its invested capital and generating good revenues from capital employed.
Page | 27
GOLD SEAL- SAARGUMMI India Pvt. Ltd
6. Return on equity
The company’s Return on net worth is 7% as a percentage of shareholders equity, the company possess a good profitability by using the money shareholders have invested but evidently the returns to equity have been reduced to a high extent in 2012, compared to the ROE of 2011.
7. Debt-Equity ratio
The debt equity ratio, i.e. 4.16 in 2012, shows that the company has been aggressive in financing its growth by debt. As this company is in auto component manufacturing, they tend to have a debt/ equity ratio above 2.
Page | 28

GOLD SEAL- SAARGUMMI India Pvt. Ltd
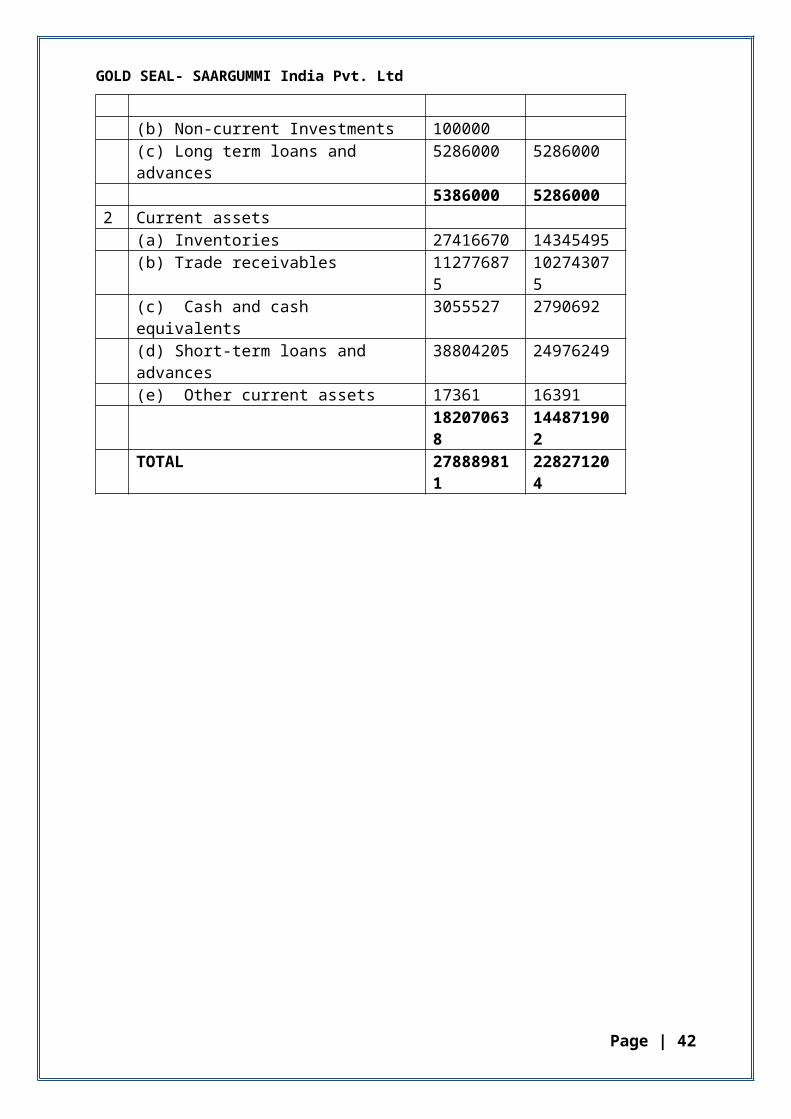
BALANCE SHEET as on 31March 2012 and 31MARCH 2011:
Particulars As on 31 March 2012 Rs.
As on 31 March 2011 Rs.
A EQUITY AND LIABILITIES 1 Shareholders’ funds (a) Share Capital 31883580 3,18,83,580 (b) Reserves and Surplus 22163444 2,20,58,709 54047024 5,39,42,2892 Non-current liabilities (a) Long Term borrowings 6538737 (b) Deferred Tax liabilities 10005923 91,35,923 (c) Long-Term provisions 892188 9,54,661 17436848 100905843 Current liabilities (a) Short-term borrowings 110148844 97405353 (b) Trade payables 83318550 48266796 (c) Other current Liabilities 11656359 16907366 (d) Short-term provisions 2282186 1658816 207405393 164238331 TOTAL 278889811 228271204 B ASSETS 1 Non-current assets (a) Fixed Assets (i) Tangible assets 90086641 78113302 (ii) Intangible assets 631175 (iii) Capital work-in-progress 715357 91433173 78113302 (b) Non-current Investments 100000 (c) Long term loans and advances 5286000 5286000 5386000 52860002 Current assets (a) Inventories 27416670 14345495 (b) Trade receivables 112776875 102743075 (c) Cash and cash equivalents 3055527 2790692 (d) Short-term loans and advances 38804205 24976249 (e) Other current assets 17361 16391 182070638 144871902 TOTAL 278889811 228271204
Page | 29
GOLD SEAL- SAARGUMMI India Pvt. Ltd
Profit and Loss A/C as on 31March 2012 and 31MARCH 2011:
ParticularsFor the year
ended 31 March 2012 Rs.
For the year ended 31 March
2011 Rs.A CONTINUING OPERATIONS1 Revenue from operations (gross) 70,66,88,072 47,92,58,100
Less: Excise duty 6,80,87,178 3,53,94,715Revenue from operations (net) 63,86,00,894 44,38,63,385
2 Other income37,642 2,12,951
3 Total revenue (1+2) 63,86,38,536 44,40,76,336
4 Expensesa) cost of materials consumed 47,78,09,379 30,67,95,394b) changes in inventories of finished goods, work-in-progress and stock in trade
-66,39,179 30,89,062
c) employee benefits expense 4,31,48,074 2,92,04,029d) finance costs 1,26,78,240 86,88,032e) depreciation and amortisation expense 90,80,595 75,33,577f) other expenses 9,60,41,474 7,49,42,033
TOTAL EXPENSES 63,21,18,583 43,02,52,127
5 Profit / (Loss) before tax (3 -+ 4) 65,19,953 1,38,24,209
6 Tax expenses:a) Current tax expense for current year 18,15,000 51,00,000b) Deferred tax 8,70,000 2,70,000
26,85,000 53,70,000
7 Profit/ (Loss) for the year (5+-6) 38,34,953 84,54,2098 Earnings per share (of Rs.10/- each): Basic and diluted 1.2 2.65
Page | 30

GOLD SEAL- SAARGUMMI India Pvt. Ltd
V. Learning Experience:
I was very fortunate to undergo project at GOLD SEAL Engineering Products Pvt. Ltd, Mumbai. It is India’s Pioneer & Leader in Rubber Weather-strips together with Global Leaders in Technology & Innovation. I could understand various dynamics of this, manufacturing sector during my industry study.
This project has made me realize what additional competencies & skills I may have to develop to be a successful professional. I learned how communication is essential in corporate world.
By and large it was a new and very helpful experience, of undergoing project at, GOLD SEAL Engineering Products Pvt. Ltd, as I could observe the way in which an organisation of its size actually functioned.
Page | 31
GOLD SEAL- SAARGUMMI India Pvt. Ltd
PART-B
Page | 32

GOLD SEAL- SAARGUMMI India Pvt. Ltd
STANDARD COST
&
VARIANCE ANALYSIS
Page | 33
GOLD SEAL- SAARGUMMI India Pvt. Ltd
A) General Introduction
Statement of the problem:
In India the setup of multinational companies has given rise to cut throat competition and strive to survive and grow continuously from its present state and becoming competitive in nature. Decrease in costs in turns increases profits, so the manufacturer has to keep a close watch and control over the costs.
A manufacturer incurs cost in conversion of raw materials into finished goods and selling the same to the consumer. It is essential to keep a careful watch on such costs incurred and check upon the variances in cost which has an effect on the profits.
Thus, cost analysis will make us understand the cost variances and also help us to find out measures to optimise them.
Objective of the Study:
The objective of the study is:To understand the Standard cost and variance analysis procedures followed in Gold Seal, comparing the standard costs with actual costs to find out favourable or unfavourable variances and analysing those variances to understand what are the reasons for such variances.
To achieve this purpose, I have chosen Gold Seal-Saargummi India Private Ltd, and studied Sales margin report, trial balance for the month of JANUARY 2013 and its financial statement.
Page | 34
GOLD SEAL- SAARGUMMI India Pvt. Ltd
Scope of the study:
The scope of study is confined to the information disclosed by each and every department head. The study is concerned to the Financial Department of Gold Seal Ltd. Mumbai unit. The attempt is made to understand Standard Cost and Variance analysis procedures implemented in Gold Seal Ltd. Regular assignments are assigned to understand the financial work process and gain necessary information on the respective topic. Access to resources helped me to acquire information to the best of my need. The study is confined only to Gold Seal-SAARGUMMI India Pvt. Ltd.
Methodology:
Data sources: Both Primary & Secondary sources have been used.
Primary data: Primary data are the data’s collected for the first time and are not available in the secondary source. Face to face interactions with Concern persons of respective departments and through discussions with my external guide Mr. Irshad Bahadursha.
Secondary data: Secondary data are the data’s that are developed for some purpose other than helping to solve problem at hand.
The secondary sources of data are: Through company’s financial statements, Trial balances, Cost reports, Sales Margin
Reports, Bill of materials. Visiting Company’s official website, and ERP systems i.e. Ramco systems of the
company. By referring journals & PPT’s prepared by the company personnel.
Page | 35
GOLD SEAL- SAARGUMMI India Pvt. Ltd
Limitations:
The study is concluded based on the information provided by my external guide, the facts and figures claimed in the company’s record.
Much interaction with company personnel was limited due to their busy schedules. The organization study is based in the discussions with the company personnels This report is prepared for academic purpose.
Page | 36
GOLD SEAL- SAARGUMMI India Pvt. Ltd
THEORETICAL ASPECTS OF
STANDARD COST AND VARIANCE ANALYSIS
Introduction to Cost Accounting
COST ACCOUNTING: MEANING
Cost accounting is regarded as the process of collecting, analyzing, summarizing and evaluating various alternative courses of action involving costs and advising the management on the most appropriate course of action based on the cost efficiency and capability of the management.
COST SHEET: MEANING
Cost sheet is a statement, which shows various components of total cost of a product. It classifies and analyses the components of cost of a product. Previous period’s data is given in the cost sheet for comparative study. It is a statement which shows per unit cost in addition to Total Cost. Selling price is ascertained with the help of cost sheet. The detail of total cost presented in the form of a statement is termed as Cost sheet. Cost sheet is prepared on the basis of:
1. Historical Cost 2. Estimated Cost
1. Historical Cost: Meaning
Historical Cost sheet is prepared on the basis of actual cost incurred. A statement of cost prepared after incurring the actual cost is called Historical Cost Sheet.
2. Estimated Cost: Meaning
Estimated cost sheet is prepared on the basis of estimated cost. The statement prepared before the commencement of production is called estimated cost sheet. Such cost sheet is useful in quoting the tender price of a job or a contract.
Page | 37
GOLD SEAL- SAARGUMMI India Pvt. Ltd
Importance of Cost Sheet:
The importance of cost sheet is as follows:
1. Cost ascertainment
The main objective of the cost sheet is to ascertain the cost of a product. Cost sheet helps in ascertainment of cost for the purpose of determining cost after they are incurred. It also helps to ascertain the actual cost or estimated cost of a Job.
2. Fixation of selling price
To fix the selling price of a product or service, it is essential to prepare the cost sheet. It helps in fixing selling price of a product or service by providing detailed information of the cost.
3. Help in cost control
For controlling the cost of a product it is necessary for every manufacturing unit to prepare a cost sheet. Estimated cost sheet helps in the control of material cost, labour cost and overheads cost at every point of production.
4. Facilitates managerial decisions
It helps in taking important decisions by the management such as: whether to produce or buy a component, what prices of goods are to be quoted in the tender, whether to retain or replace an existing machine etc.
Sales
If the profit margin is added to the total cost, sales are arrived at. Excess of sales over total cost is termed as profit. When total cost exceeds sales it is termed as Loss.
Sales = Total Cost + Profit
Page | 38

GOLD SEAL- SAARGUMMI India Pvt. Ltd
Elements of cost:
Material (Material is a very important part of business) Direct material Labour Direct labour Overhead (Variable/Fixed) Indirect material Indirect labour Maintenance & Repair Supplies Utilities Other Variable Expenses Salaries Occupancy (Rent) Depreciation Other Fixed Expenses
(In some companies, machine cost is segregated from overhead and reported as a separate element)
They are grouped further based on their functions as:
Production or works overheads Administration overheads Selling overheads Distribution overheads
Classification of costs
Classification of cost means, the grouping of costs according to their common characteristics. The important ways of classification of costs are:
By nature or element: materials, labour, expenses. By functions: production, selling, distribution, administration, R&D. By traceability: direct and indirect. By variability: fixed, variable, and semi-variable. By controllability: controllable, uncontrollable. By normality: normal, abnormal. By Decision making Costs. Time of Occupation.
Page | 39

GOLD SEAL- SAARGUMMI India Pvt. Ltd
COST ACCOUNTING APPROACHES
Standardized or standard cost accounting Lean accounting Activity-based costing Resource consumption accounting Throughput accounting Marginal costing/cost-volume-profit analysis
STANDARDIZED OR STANDARD COST ACCOUNTING :
Standard costing is an important subtopic of cost accounting. Standard costs are usually associated with a manufacturing company's costs of direct material, direct labour, and manufacturing overhead.
Rather than assigning the actual costs of direct material, direct labour, and manufacturing overhead to a product, many manufacturers assign the expected or standard cost. This means that a manufacturer's inventories and cost of goods sold will begin with amounts reflecting the standard costs, not the actual costs, of a product. Manufacturers, of course, still have to pay the actual costs. As a result there are almost always differences between the actual costs and the standard costs, and those differences are known as variances.
REASONS FOR USING A STANDARD COSTING SYSTEM:
Cost Control. Smooth out short-term fluctuations in direct costs. Costing systems that use budgeted data are economical.
Page | 40

GOLD SEAL- SAARGUMMI India Pvt. Ltd
VARIANCE ANALYSIS
In accounting, a variance is defined as the difference between the expected amount and the actual amount of costs or revenues. Variance analysis uses this standard or expected amount versus the actual amount to judge performance. The analysis includes an explanation of the difference between actual and expected figures as well as an evaluation as to why the variance may have occurred. The purpose of this detailed information is to assist managers in determining what may have gone right or wrong and to help in future decision-making.
Variance analysis helps the management to understand the present costs and then control future costs.
FORMS OF VARIANCES
Positive/ Favourable Variance: (F)
A variance can be put into the favourable category when the results are better than expected. This means that revenues were more than the expected amount or costs were below the budgeted amount. In accounting practice, a favourable variance is shown by noting a letter F in parenthesis on the reports. A favourable variance might earn a bonus for a manger, or perhaps a move up the corporate ladder.
Negative/ Unfavourable Variance: ( A / U)
In contrast, the variance can be judged as unfavourable if the results are worse than expected. If the revenues were below expectations or the costs were higher than standard, the variance would be termed unfavourable or adverse. This would be denoted on the reports with the letter A or U, usually in parenthesis. Consistently creating an unfavourable variance might result in a manger being reprimanded or losing their job. However, the analysis is typically used to help mangers prevent a negative situation from recurring by providing information about what went wrong.
The standard cost of a finished product is the sum of the standard costs of the inputs :
Direct material Direct labour Manufacturing overhead
Variable manufacturing overhead Fixed manufacturing overhead
Page | 41
GOLD SEAL- SAARGUMMI India Pvt. Ltd
STANDARD COST AND VARIANCE ANALYSIS PROCEDURE IN GOLD SEAL LTD.:
Sales margin report is generated for the company’s ERP systems, i.e. Ramco systems.
The sales margin report consists of the quantity of items will be manufactured and sold during the particular month and the total value, total costs and profit of all the items.
The total cost is manually bifurcated into material cost and process cost. The material cost of each item is extracted by the help item code from Ramco systems one by one or using bill of materials prepared by finance personnel for convenience.
The scraps are separated from the total material costs according to the scrap provision made by the company.
Allocation of estimated expenses to each component of manufacturing expense are prepared considering the full capacity (70%), the estimated expenses are than calculated for the actual utilised capacity(53%) for the purpose of variance analysis.
Using the trial balance the actual costs incurred are extracted.
A cost sheet is prepared comprising of standard costs and actual costs, than variance percentage & amount is found, using this cost sheet.
Analysis and interpretation of the results is carried out, to understand the reasons for the variances and finding more efficient methods to controlling future costs.
Page | 42

GOLD SEAL- SAARGUMMI India Pvt. Ltd
Cost Analysis January 2013
P&L(Actual Costs)
Costing(Standard Costs)
Variance (%) Comments
SALES 5,94,00,935 5,90,66,596 -3,34,339 -0.56% VW YOY 5% NOT REDUCED FROM 1 TO 20-1-13
Less: Sales Returned
71,904 2,95,333 2,23,429 311%
Price diff 10,67,469 Supplementary BillsSale of scraps
4,14,681.98
NET REVENUE 5,93,29,031 5,87,71,263 5,57,768 0.94%
DIRECT MATERIAL
3,64,88,117 3,64,61,035 -27,082 -0.07% E-rate Variations is Rs.49,208
SCRAP 52,88,493 46,90,504 -5,97,989 -11.31%
Excess scraps
70.42% 70.02%
DIRECT LABOUR 22,04,292 24,28,831 2,24,539 10.2%POWER 12,81,962 16,33,564 STORES AND SPARES
3,83,534 5,92,661
LEASE RENT 17,09,050 13,49299INDIRECT LABOUR
14,25,352 20,43,057 10%
REPAIRS 1,42,044 2,49,686 INSURANCE 1,41,654 70,152 DEPRECIATION 11,70,000 10,37,873
(1,32,127)-11% Depreciation is provided
on the 5th line without full utilisation. Underutilisation of capacity 53%
PLANT O/H 76,929 1,10,825 Professional charges & License fees
TOTAL COST 5,03,11,428 5,06,67,48884.80% 86.21%
DIRECT PROFIT 90,17,603 81,03,776 9,13,827 10.13% Excluding Price differences
SELLING 12,09,588 FINANCIAL 1099930DISTRIBUTION 3,18,430
NET PROFIT 63,89,655 81,03,776 STANDARD COSTS AND VARIANCE ANALYSIS FOR THE MONTH OF
JANUARY 2013.
Page | 43

GOLD SEAL- SAARGUMMI India Pvt. Ltd
Allocated Expenses Total Capacity Utilised Capacity70% 53%
Direct labour 26,66,973.0 24,28,831 Indirect labour 22,43,375.0 20,43,057 Stores and spares 6,50,770.0 5,92,661 Power 17,93,732.0 16,33,564 Lease rent 14,81,595 13,49,299Repairs 2,74,167.0 2,49,686 Depreciation 9,86,776.0 10,37,873 Insurance 77,030.0 70,152 Administrative O/H 1,21,691.0 1,10,825 TOTAL 1,02,96,109 93,76,739
Estimates of Expenses Calculated for the actual utilised capacity:
Page | 44

GOLD SEAL- SAARGUMMI India Pvt. Ltd
CALCULATION OF VARIANCE :
Item code-S10031014Item description- BOLERO BACK DOOR (M&M)
DIRECT MATERIAL PRICE VARIANCE :
Definition: The Direct Materials Price Variance is the difference between the actual and budgeted cost to acquire materials, multiplied by the total number of units purchased.
The material price variance is expressed as (AP – SP)AQ
Where:(AP) = actual price per unit of material.(SP) = standard price per unit of direct material.(AQ) = actual quantity of material purchased.
If actual price > standard price, then the variance is unfavorable. If actual price < standard price, then the variance is favorable
HERE,AP= 118.42 PER KGSP=118.31 PER KGAQ= 4639.86 KG
Therefore,
MPV= (118.42-118.31)*4639.86MPV= 0.11*4639.86MPV= 510.38 (A)
Page | 45
STANDARD [Production: 4470 units]
ACTUAL [Production: 4470 units]
Quantity(Kgs) 4,635.39 4,639.86 Price per Kg 118.31 118.42 Value/Cost (Rs) 5,48,412.99 5,49,452.22
GOLD SEAL- SAARGUMMI India Pvt. Ltd
DIRECT MATERIAL QUANTITY VARIANCE :
Definition:The Direct Materials Quantity Variance is a measure of the difference between the actual quantity of materials used in production and the standard quantity allowed, multiplied by the standard price per unit of materials.
Direct Materials Quantity Variance is also known as direct materials efficiency variance and direct materials usage variance.
The material quantity variance is expressed as (AQ – SQ)SP
Where:(AQ) = actual quantity of material used.(SQ) = standard quantity of material allowed.(SP) = standard price of material.
If actual quantity > standard quantity, then the variance is unfavorable. If actual quantity < standard quantity, then the variance is favorable.
HERE,AQ = 4639.86SQ = 4635.39SP = 118.31
Therefore,
MQV= (4639.86-4635.39)*118.31MQV= 4.47*118.31MQV=528.85 (A)
Page | 46

GOLD SEAL- SAARGUMMI India Pvt. Ltd
SALES:
Sales Returns
Description Budget Actual VarianceSales Returns 2.95 Lacs 71.90 K 2.23 Lacs
INTERPRETATION:
This chart indicates, the budgeted sales return is Rs.2.95 Lacs and the actual being Rs.71.9 K. Sales returns show Favourable variance.
There is a sales return of Rs.71.90K which is 0.12% of sales, as against cost support of 0.5%. As we notice in actually that the sales returns are down, showing efficiency, and the variance being 2.23 lacs.
The Sales amount in P & L A/c also includes re-imbursement of Rs.10 lacs, which are of earlier period and are not to be included for cost sheet analysis.
Page | 47
GOLD SEAL- SAARGUMMI India Pvt. Ltd
Material Cost:
Direct Material Cost :
Description Budget Actual VarianceDirect material cost 364.61 Lacs 364.88 Lacs -27.08 K
INTERPRETATION:
As against the budget allowed of Rs.364.61 lacs and actual expenditure works out to Rs. 364.88 lacs, resulting in excess expenditure of Rs.27.08 K. Hence, there exists an Un-favourable variance.
There exists a slight increase in direct material actual cost i.e. by 0.10%, as compared to Standard cost, the reason being the Exchange Rate variations of Rs.49.20K.
Page | 48

GOLD SEAL- SAARGUMMI India Pvt. Ltd
SCRAPS :
Description Budget Actual VarianceScraps 46.90 Lacs 52.88 Lacs 5.98 Lacs
INTERPRETATION:
The chart shows the actual scraps to be Rs.52.88 Lacs and budgeted is Rs.46.90 Lacs. The actual scraps are 14.5% of material cost and the provisioned scraps are 12.86% on net material cost. Thus, there is an excess in scraps of Rs. 5.98 lacs (11%). The scraps show an Un-favourable Variance.
Scraps are increased by Rs.5.98lacs; the scrap provision is made 5% on all the parts except VW (Volkswagen) which is 25%. The scrap needs to be brought down to 13% of material cost or required to be revised, in standard cost sheets, to take care of 15%, or more realistic figures, as management finds ok with.
Page | 49
GOLD SEAL- SAARGUMMI India Pvt. Ltd
Material cost is 70.42%, when compared to standard material cost i.e. 70.02%, of sales value. Hence the actual material cost is more by Rs. 6.25 lacs (Refer Cost-Variation Table)
Hence, Total Material cost is unfavourable; the company paid more than its standard cost for the direct materials it purchased and also there includes excess scraps.
Page | 50
GOLD SEAL- SAARGUMMI India Pvt. Ltd
Direct Labour Cost:
Description Budget Actual VarianceDirect Labour Cost 24.28 Lacs 22.04 Lacs 2.25 Lacs
INTERPRETATION:
The chart indicates the actual direct labour cost Rs. 22.04 lacs, against standard cost of Rs. 24.28 lacs, resulting in savings of Rs. 2.25 lacs, in respect of estimates.
The actual labour cost is lower by Rs. 2.25 lacs, though plant was underutilized its capacity, i.e. 53% OEE as against 70%. However, it could not establish whether this is quantity variation or price variation, due to limited information available.
Hence, direct labour rate is favourable, the Company paid less than its standard cost for the direct labour it used.
Page | 51
GOLD SEAL- SAARGUMMI India Pvt. Ltd
Manufacturing Overheads Spending including indirect labour :
Description Budget Actual VarianceManufacturing overheads
70.87 Lacs 63.30 Lacs 7.57 Lacs
INTERPRETATION:
Against the budget allowed of Rs. 70.87 lacs and the actual overheads works out to be Rs. 63.30 lacs resulting in savings of Rs. 7.57 Lacs.
Hence, the manufacturing overhead spending has a favourable variance; the company’s actual manufacturing overhead costs are less than the budgeted costs.
Page | 52

GOLD SEAL- SAARGUMMI India Pvt. Ltd
Actual Manufacturing Overheads:
Estimated Manufacturing Overheads:
Page | 53
Indirect labour 20,43,057 Stores and spares 5,92,661 Power 16,33,564 Lease rent 13,49,299 Repairs 2,49,686 Depreciation 10,37,873 Insurance 70,152 Administrative O/H 1,10,825
TOTAL OVERHEADS 70,87,117
Indirect labour 14,25,352 Stores and spares 3,83,534 Power 12,81,962 Lease rent 17,09,050 Repairs 1,42,044 Depreciation 11,70,000 Insurance 1,41,654 Administrative O/H 76,929
TOTAL OVERHEADS 63,30,525
GOLD SEAL- SAARGUMMI India Pvt. Ltd
Total Cost :
Description Budget Actual VarianceTotal Cost 506.67 Lacs 503.11 3.56 Lacs
INTERPRETATION:
Against the budget allowed of Rs. 506.67 lacs and the actual expenditure cost works out to be Rs. 503.11 lacs resulting in the savings of Rs.3.56 Lacs i.e. the company is having 1% savings.
Hence, there is a favourable Total cost variance.
Page | 54
GOLD SEAL- SAARGUMMI India Pvt. Ltd
The cost variations for the period are as under :
Cost sheet comparison
Rs. In Lacs
P&L A/C %Std Costs % Variation %
Sales 593.29 100% 587.71 100% 5.58 0.95%Mat Cost 417.77 70.42% 411.52 70.02% -6.25 -1.52%Direct Labour 22.04 3.72% 24.29 4.13% 2.25 9.24%Mfg Overheads 63.31 11% 70.87 12% 7.57 10.68%Total Cost 503.11 85% 506.67 86% 3.56 0.70%
Gross Profit 90.18 15% 81.04 14% -9.14-
11.28%
The above chart shows that, the actual cost are more by 0.40% compare to standard cost sheets. This is on account of additional scraps 11%, exchange rates variation 0.07%.
Page | 55

GOLD SEAL- SAARGUMMI India Pvt. Ltd
FINDINGS :
Page | 56
GOLD SEAL- SAARGUMMI India Pvt. Ltd
CONCLUSIONS & RECOMMENDATIONS:
Page | 57

GOLD SEAL- SAARGUMMI India Pvt. Ltd
BIBLIOGRAPHY
WWW.GOOGLE.COM WWW.INVESTOPEDIA.COMWWW.WIKIPEDIA.COMWWW.ACCOUNTINGTOOLS.COM
COMPANY’S MAGAZINES AND JOURNALS. PPT’S COMPANY’S OFFICIAL WEBSITE.
Page | 58
Related Documents