PRIVATIZATION AND FINANCIAL SYSTEM • Demand for and supply of assets during privatization • Costs and benefits of different ways of privatization – restitution – auctioning – managers’ and employees’ buyouts – vouchers • Market-based versus institution-based financial system • Banking and financial system in transition

PRIVATIZATION AND FINANCIAL SYSTEM
Dec 31, 2015
PRIVATIZATION AND FINANCIAL SYSTEM. Demand for and supply of assets during privatization Costs and benefits of different ways of privatization restitution auctioning managers’ and employees’ buyouts vouchers Market-based versus institution-based financial system - PowerPoint PPT Presentation
Welcome message from author
This document is posted to help you gain knowledge. Please leave a comment to let me know what you think about it! Share it to your friends and learn new things together.
Transcript
PRIVATIZATION AND FINANCIAL SYSTEM
• Demand for and supply of assets during privatization
• Costs and benefits of different ways of privatization – restitution– auctioning– managers’ and employees’ buyouts– vouchers
• Market-based versus institution-based financial system
• Banking and financial system in transition
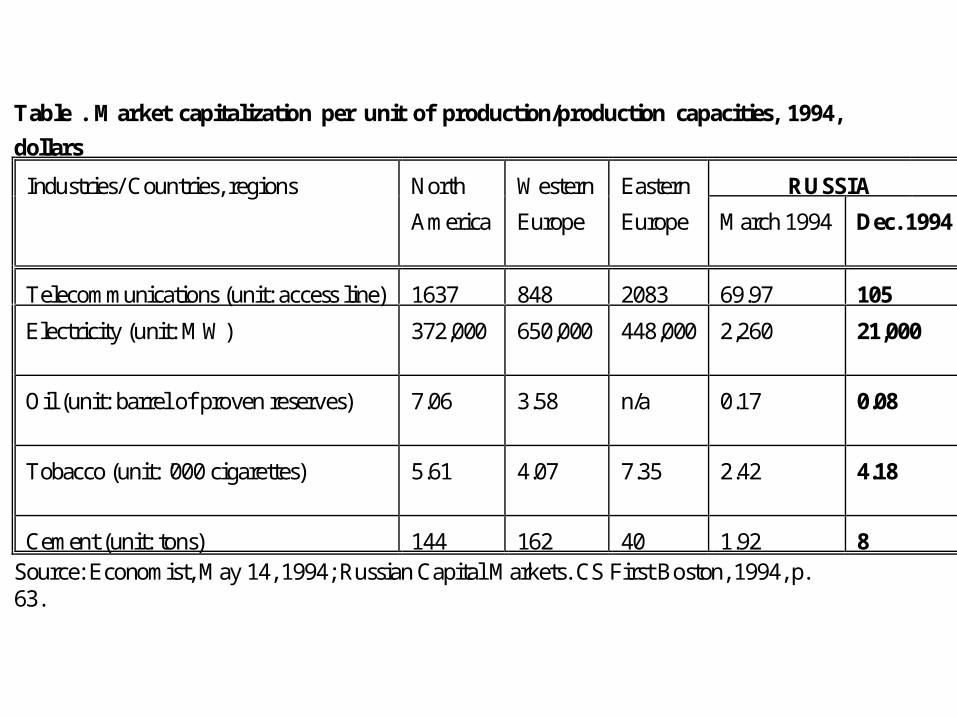
Table . Market capitalization per unit of production/production capacities, 1994,
dollars
Industries/ Countries, regions North Western Eastern RUSSIA
America Europe Europe March 1994 Dec. 1994
Telecommunications (unit: access line) 1637 848 2083 69.97 105
Electricity (unit: MW) 372,000 650,000 448,000 2,260 21,000
Oil (unit: barrel of proven reserves) 7.06 3.58 n/a 0.17 0.08
Tobacco (unit: '000 cigarettes) 5.61 4.07 7.35 2.42 4.18
Cement (unit: tons) 144 162 40 1.92 8Source: Economist, May 14, 1994; Russian Capital Markets. CS First Boston, 1994, p.63.
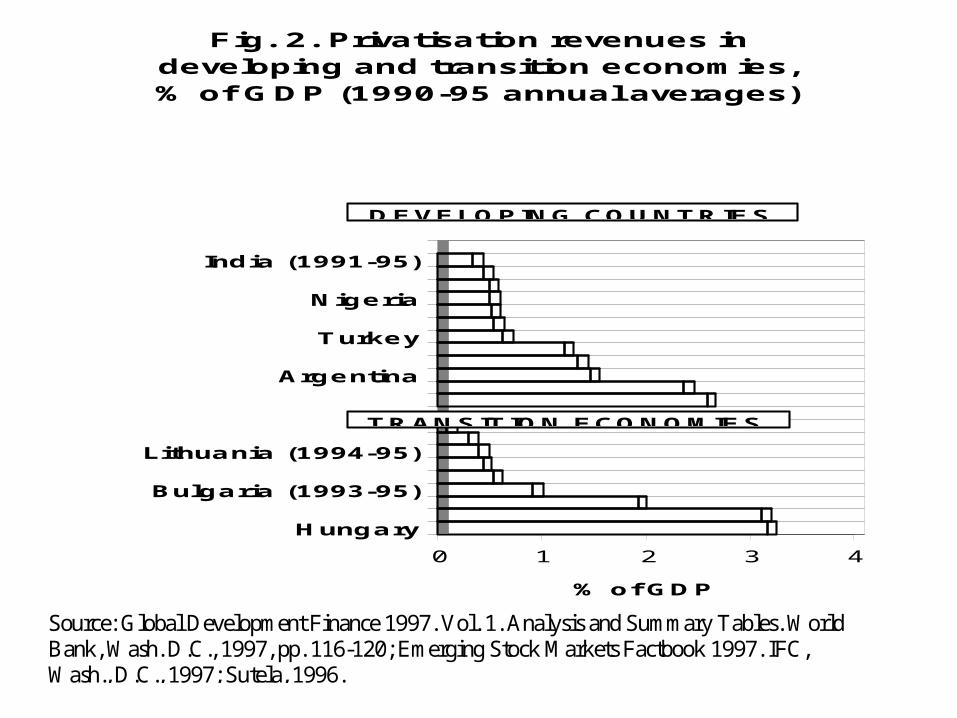
0 1 2 3 4
% of GDP
Hungary
Bulgaria (1993-95)
Lithuania (1994-95)
Argentina
Turkey
Nigeria
India (1991-95)
Fig. 2. Privatisation revenues in developing and transition economies, % of GDP (1990-95 annual averages)
DEVELOPING COUNTRIES
TRANSITION ECONOMIES
Source: Global Development Finance 1997. Vol. 1. Analysis and Summary Tables. WorldBank, Wash. D.C., 1997, pp. 116-120; Emerging Stock Markets Factbook 1997. IFC,Wash., D.C., 1997; Sutela, 1996.
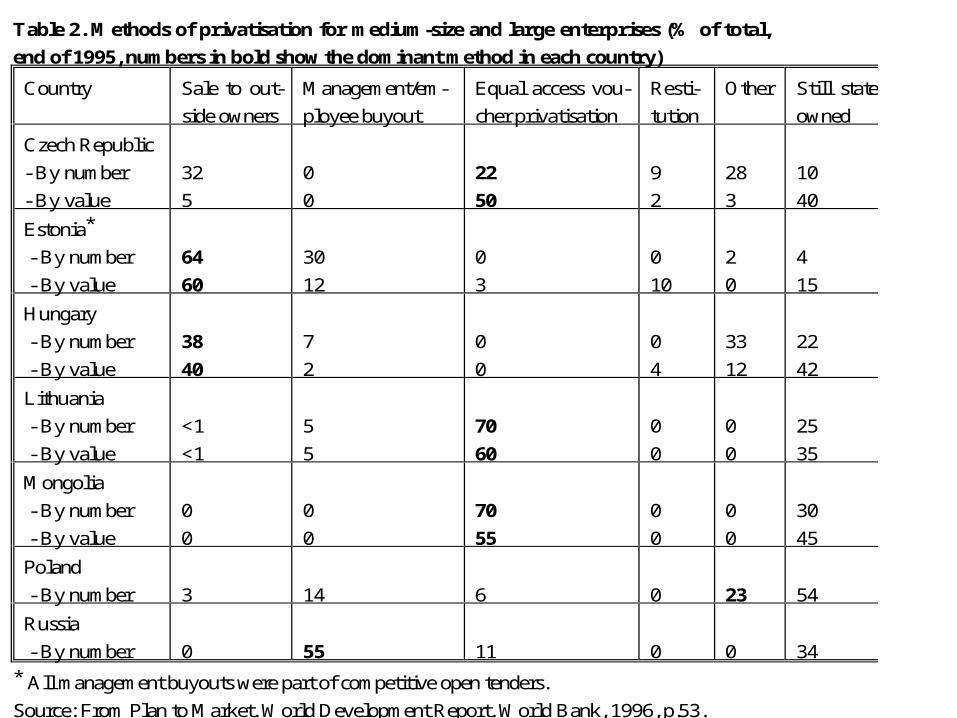
Table 2. Methods of privatisation for medium-size and large enterprises (% of total,
end of 1995, numbers in bold show the dominant method in each country)
Country Sale to out-
side owners
Management/em-
ployee buyout
Equal access vou-
cher privatisation
Resti-
tution
Other Still state
owned
Czech Republic
- By number
- By value
32
5
0
0
22
50
9
2
28
3
10
40
Estonia*
- By number
- By value
64
60
30
12
0
3
0
10
2
0
4
15
Hungary
- By number
- By value
38
40
7
2
0
0
0
4
33
12
22
42
Lithuania
- By number
- By value
<1
<1
5
5
70
60
0
0
0
0
25
35
Mongolia
- By number
- By value
0
0
0
0
70
55
0
0
0
0
30
45
Poland
- By number 3 14 6 0 23 54
Russia
- By number 0 55 11 0 0 34
* All management buyouts were part of competitive open tenders.
Source: From Plan to Market. World Development Report. World Bank, 1996, p.53.
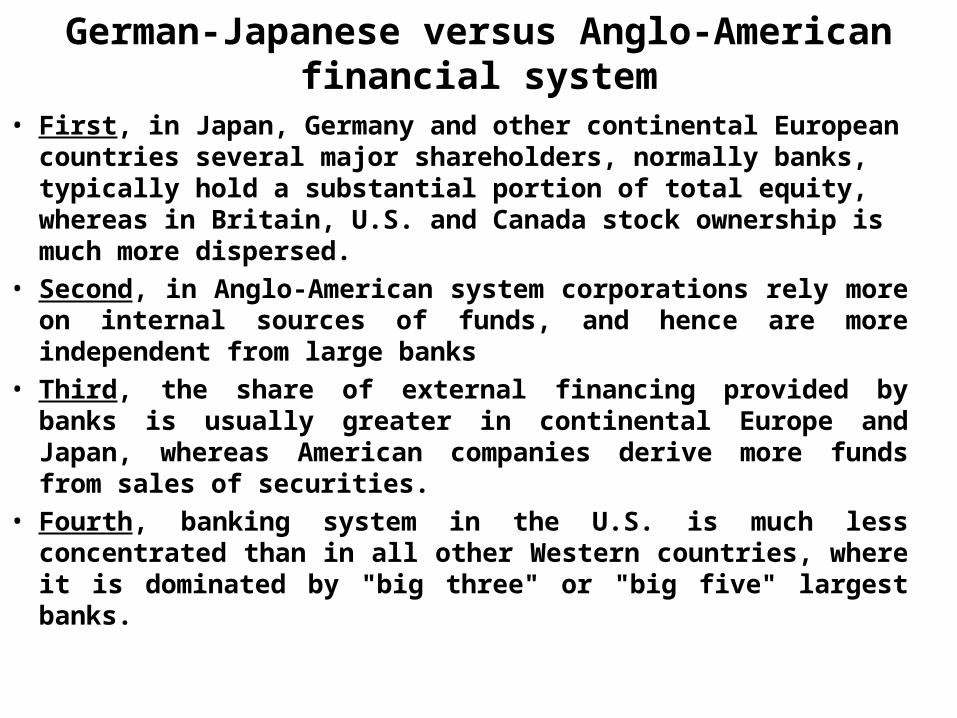
German-Japanese versus Anglo-American financial system
• First, in Japan, Germany and other continental European countries several major shareholders, normally banks, typically hold a substantial portion of total equity, whereas in Britain, U.S. and Canada stock ownership is much more dispersed.
• Second, in Anglo-American system corporations rely more on internal sources of funds, and hence are more independent from large banks
• Third, the share of external financing provided by banks is usually greater in continental Europe and Japan, whereas American companies derive more funds from sales of securities.
• Fourth, banking system in the U.S. is much less concentrated than in all other Western countries, where it is dominated by "big three" or "big five" largest banks.
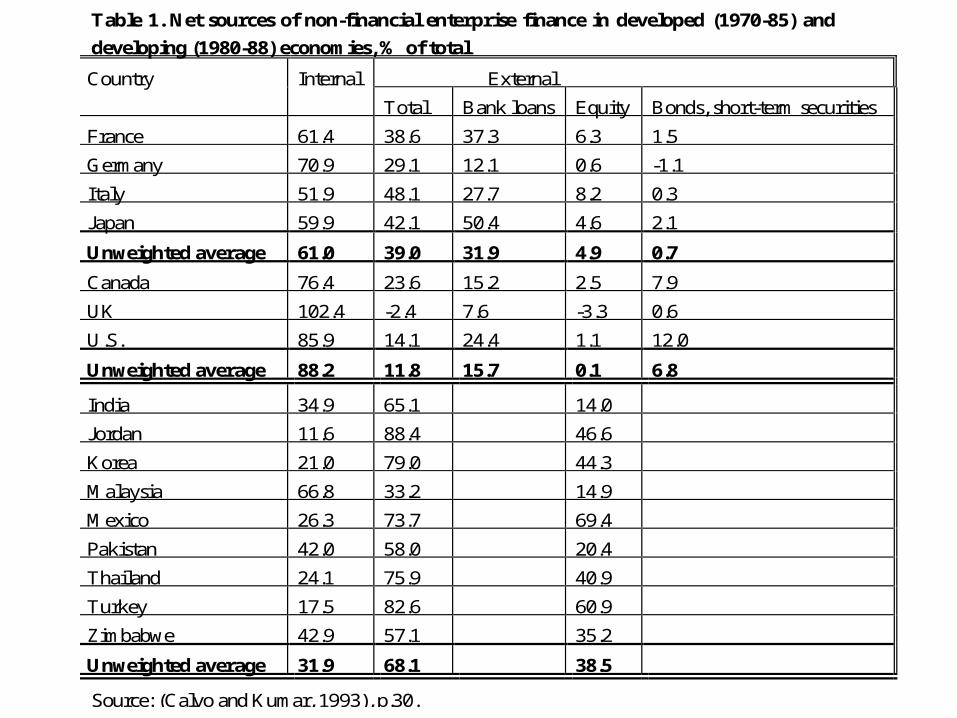
Table 1. Net sources of non-financial enterprise finance in developed (1970-85) and
developing (1980-88) economies, % of total
Country Internal External
Total Bank loans Equity Bonds, short-term securities
France 61.4 38.6 37.3 6.3 1.5
Germany 70.9 29.1 12.1 0.6 -1.1
Italy 51.9 48.1 27.7 8.2 0.3
Japan 59.9 42.1 50.4 4.6 2.1
Unweighted average 61.0 39.0 31.9 4.9 0.7
Canada 76.4 23.6 15.2 2.5 7.9
UK 102.4 -2.4 7.6 -3.3 0.6
U.S. 85.9 14.1 24.4 1.1 12.0
Unweighted average 88.2 11.8 15.7 0.1 6.8
India 34.9 65.1 14.0
Jordan 11.6 88.4 46.6
Korea 21.0 79.0 44.3
Malaysia 66.8 33.2 14.9
Mexico 26.3 73.7 69.4
Pakistan 42.0 58.0 20.4
Thailand 24.1 75.9 40.9
Turkey 17.5 82.6 60.9
Zimbabwe 42.9 57.1 35.2
Unweighted average 31.9 68.1 38.5
Source: (Calvo and Kumar, 1993), p.30.
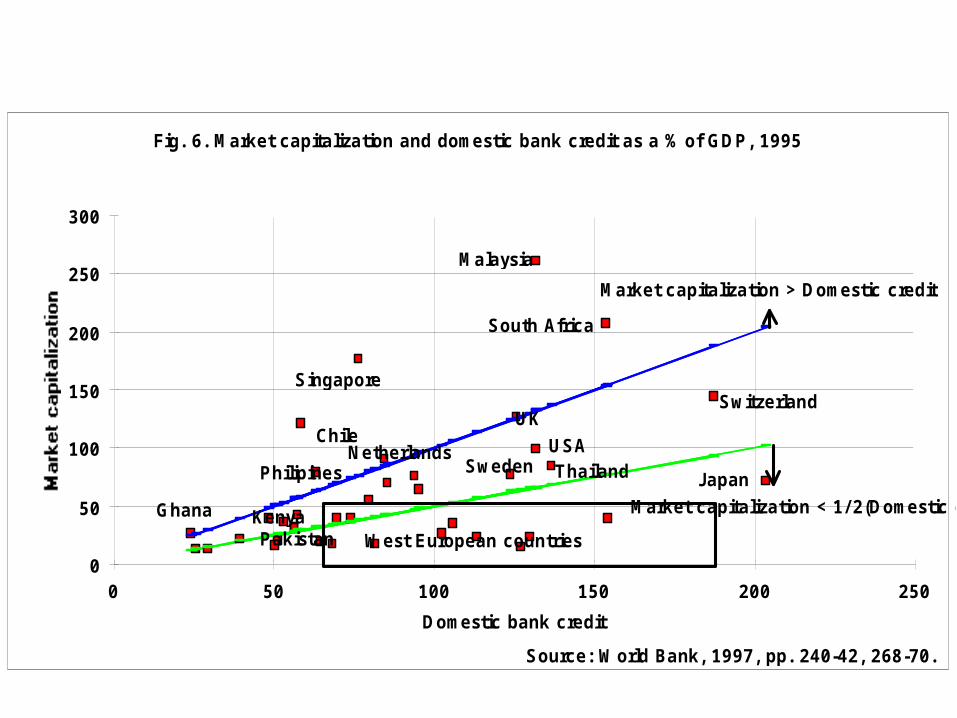
Fig. 6. Market capitalization and domestic bank credit as a % of GDP, 1995
0
50
100
150
200
250
300
0 50 100 150 200 250
Domestic bank credit
Malaysia
South Africa
Singapore
ChileUK
USANetherlands
Ghana
Philipines
Switzerland
Japan
West European countriesKenyaPakistan
Sweden Thailand
Market capitalization > Domestic credit
Market capitalization < 1/ 2(Domestic credit)
Source: World Bank, 1997, pp. 240-42, 268-70.
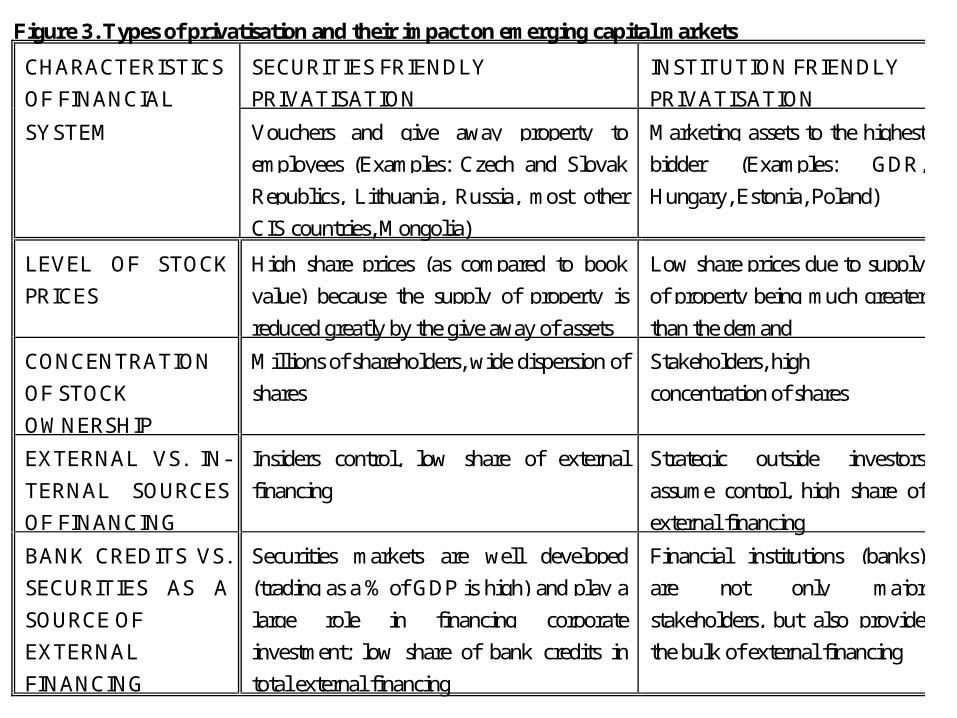
Figure 3. Types of privatisation and their impact on emerging capital markets
CHARACTERISTICS
OF FINANCIAL
SECURITIES FRIENDLY
PRIVATISATION
INSTITUTION FRIENDLY
PRIVATISATION
SYSTEM Vouchers and give away property to
employees (Examples: Czech and Slovak
Republics, Lithuania, Russia, most other
CIS countries, Mongolia)
Marketing assets to the highest
bidder (Examples: GDR,
Hungary, Estonia, Poland)
LEVEL OF STOCK
PRICES
High share prices (as compared to book
value) because the supply of property is
reduced greatly by the give away of assets
Low share prices due to supply
of property being much greater
than the demand
CONCENTRATION
OF STOCK
OWNERSHIP
Millions of shareholders, wide dispersion of
shares
Stakeholders, high
concentration of shares
EXTERNAL VS. IN-
TERNAL SOURCES
OF FINANCING
Insiders control, low share of external
financing
Strategic outside investors
assume control, high share of
external financing
BANK CREDITS VS.
SECURITIES AS A
SOURCE OF
EXTERNAL
FINANCING
Securities markets are well developed
(trading as a % of GDP is high) and play a
large role in financing corporate
investment; low share of bank credits in
total external financing
Financial institutions (banks)
are not only major
stakeholders, but also provide
the bulk of external financing
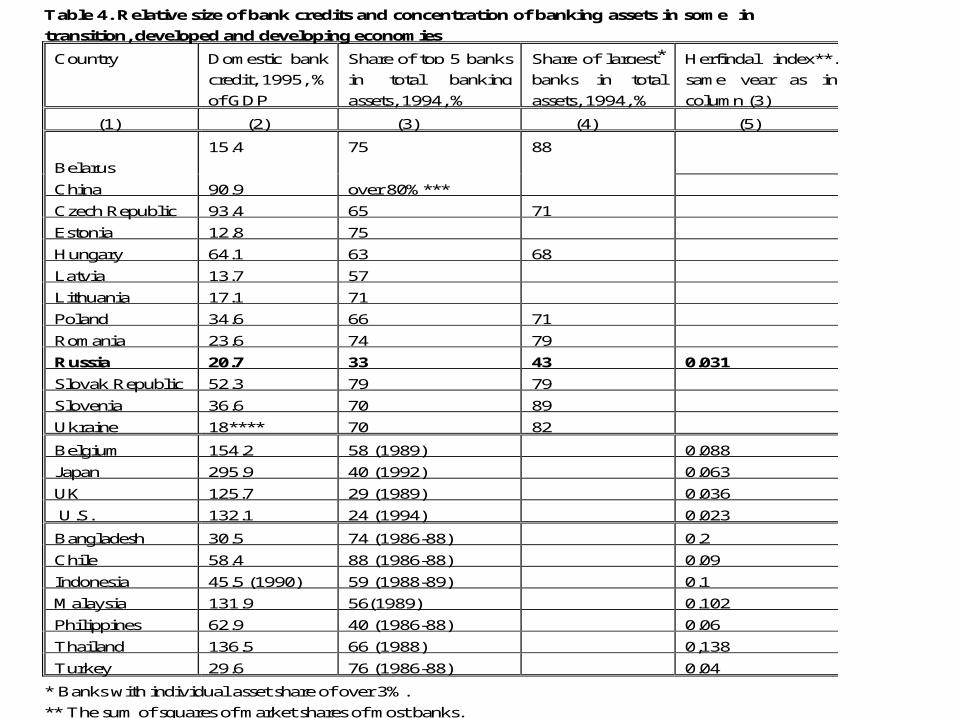
Table 4. Relative size of bank credits and concentration of banking assets in some in
transition, developed and developing economies
Country Domestic bank
credit, 1995, %
of GDP
Share of top 5 banks
in total banking
assets, 1994, %
Share of largest*
banks in total
assets, 1994, %
Herfindal index**,
same year as in
column (3)
(1) (2) (3) (4) (5)
Belarus
15.4 75 88
China 90.9 over 80%***
Czech Republic 93.4 65 71
Estonia 12.8 75
Hungary 64.1 63 68
Latvia 13.7 57
Lithuania 17.1 71
Poland 34.6 66 71
Romania 23.6 74 79
Russia 20.7 33 43 0.031
Slovak Republic 52.3 79 79
Slovenia 36.6 70 89
Ukraine 18**** 70 82
Belgium 154.2 58 (1989) 0.088
Japan 295.9 40 (1992) 0.063
UK 125.7 29 (1989) 0.036
U.S. 132.1 24 (1994) 0.023
Bangladesh 30.5 74 (1986-88) 0.2
Chile 58.4 88 (1986-88) 0.09
Indonesia 45.5 (1990) 59 (1988-89) 0.1
Malaysia 131.9 56(1989) 0.102
Philippines 62.9 40 (1986-88) 0.06
Thailand 136.5 66 (1988) 0,138
Turkey 29.6 76 (1986-88) 0.04
* Banks with individual asset share of over 3%.
** The sum of squares of market shares of most banks.
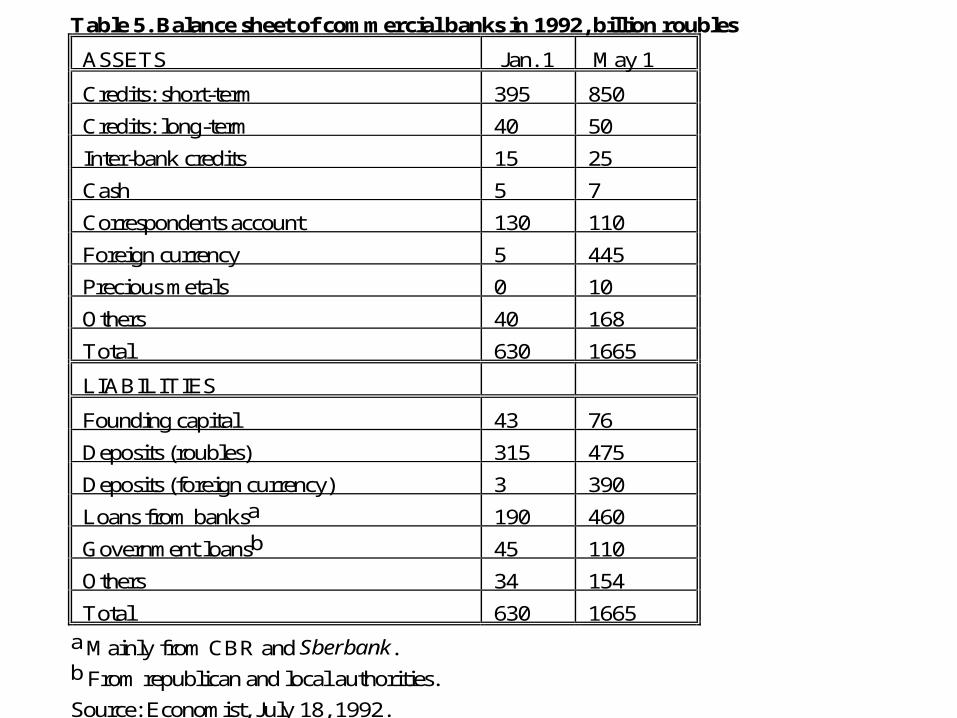
Table 5. Balance sheet of commercial banks in 1992, billion roubles
ASSETS Jan. 1 May 1
Credits: short-term 395 850
Credits: long-term 40 50
Inter-bank credits 15 25
Cash 5 7
Correspondents account 130 110
Foreign currency 5 445
Precious metals 0 10
Others 40 168
Total 630 1665
LIABILITIES
Founding capital 43 76
Deposits (roubles) 315 475
Deposits (foreign currency) 3 390
Loans from banksa 190 460
Government loansb 45 110
Others 34 154
Total 630 1665
a Mainly from CBR and Sberbank.b From republican and local authorities.
Source: Economist, July 18, 1992.
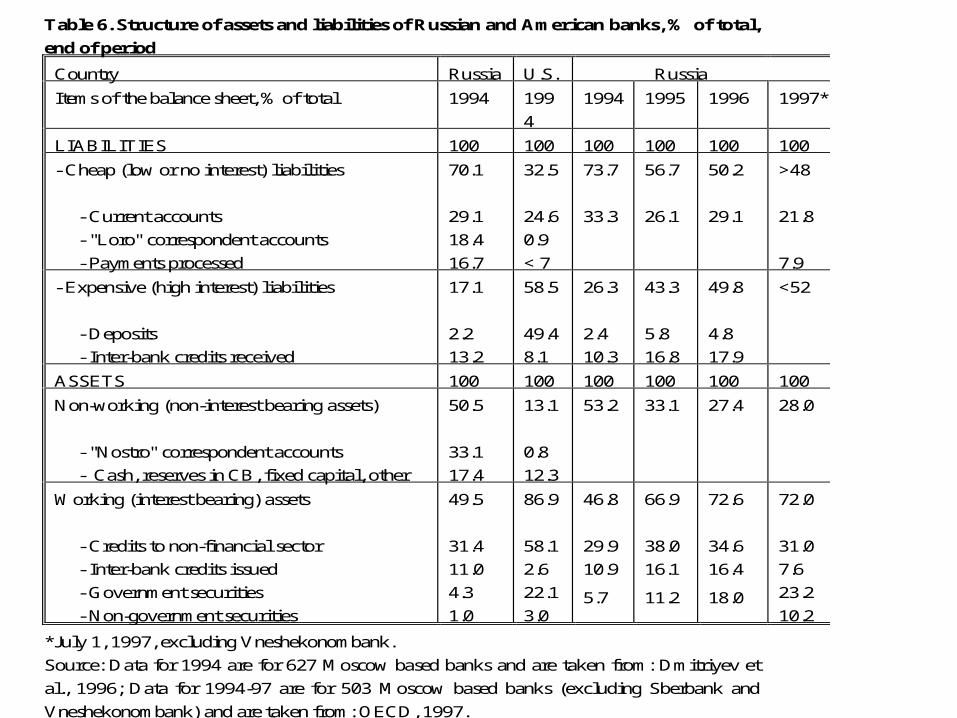
Table 6. Structure of assets and liabilities of Russian and American banks, % of total,
end of period
Country Russia U.S. Russia
Items of the balance sheet, % of total 1994 199
4
1994 1995 1996 1997*
LIABILITIES 100 100 100 100 100 100
- Cheap (low or no interest) liabilities
- Current accounts
- "Loro" correspondent accounts
- Payments processed
70.1
29.1
18.4
16.7
32.5
24.6
0.9
< 7
73.7
33.3
56.7
26.1
50.2
29.1
>48
21.8
7.9
- Expensive (high interest) liabilities
- Deposits
- Inter-bank credits received
17.1
2.2
13.2
58.5
49.4
8.1
26.3
2.4
10.3
43.3
5.8
16.8
49.8
4.8
17.9
<52
ASSETS 100 100 100 100 100 100
Non-working (non-interest bearing assets)
- "Nostro" correspondent accounts
- Cash, reserves in CB, fixed capital, other
50.5
33.1
17.4
13.1
0.8
12.3
53.2 33.1 27.4 28.0
Working (interest bearing) assets
- Credits to non-financial sector
- Inter-bank credits issued
- Government securities
- Non-government securities
49.5
31.4
11.0
4.3
1.0
86.9
58.1
2.6
22.1
3.0
46.8
29.9
10.9
5.7
66.9
38.0
16.1
11.2
72.6
34.6
16.4
18.0
72.0
31.0
7.6
23.2
10.2
*July 1, 1997, excluding Vneshekonombank.
Source: Data for 1994 are for 627 Moscow based banks and are taken from: Dmitriyev et
al., 1996; Data for 1994-97 are for 503 Moscow based banks (excluding Sberbank and
Vneshekonombank) and are taken from: OECD, 1997.
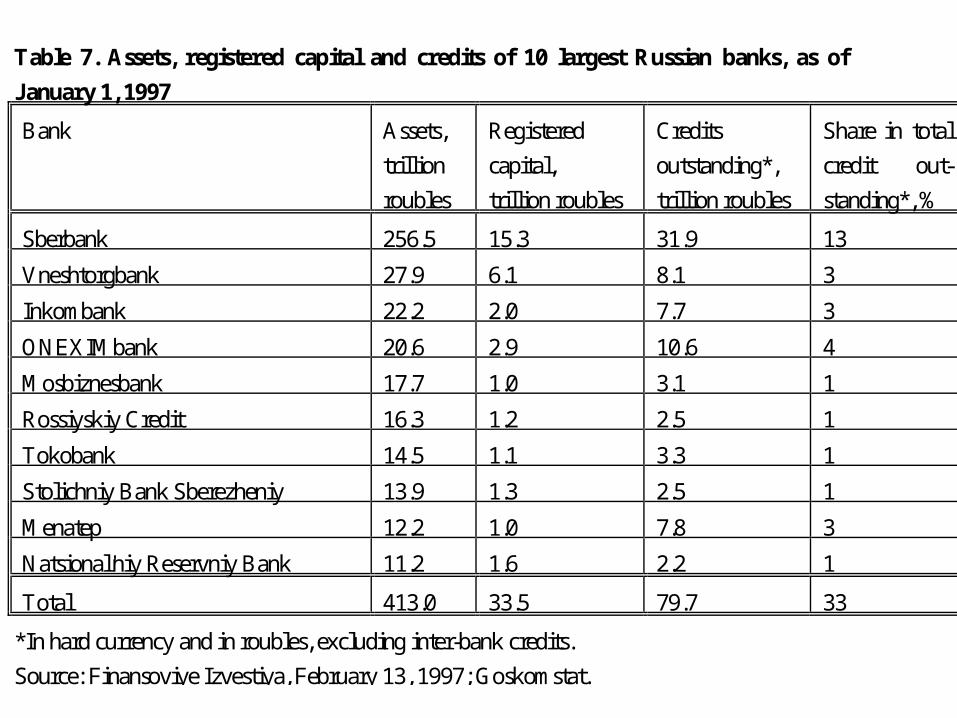
Table 7. Assets, registered capital and credits of 10 largest Russian banks, as of
January 1, 1997
Bank Assets,
trillion
roubles
Registered
capital,
trillion roubles
Credits
outstanding*,
trillion roubles
Share in total
credit out-
standing*, %
Sberbank 256.5 15.3 31.9 13
Vneshtorgbank 27.9 6.1 8.1 3
Inkombank 22.2 2.0 7.7 3
ONEXIMbank 20.6 2.9 10.6 4
Mosbiznesbank 17.7 1.0 3.1 1
Rossiyskiy Credit 16.3 1.2 2.5 1
Tokobank 14.5 1.1 3.3 1
Stolichniy Bank Sberezheniy 13.9 1.3 2.5 1
Menatep 12.2 1.0 7.8 3
Natsional'niy Reservniy Bank 11.2 1.6 2.2 1
Total 413.0 33.5 79.7 33
*In hard currency and in roubles, excluding inter-bank credits.
Source: Finansoviye Izvestiya, February 13, 1997; Goskomstat.
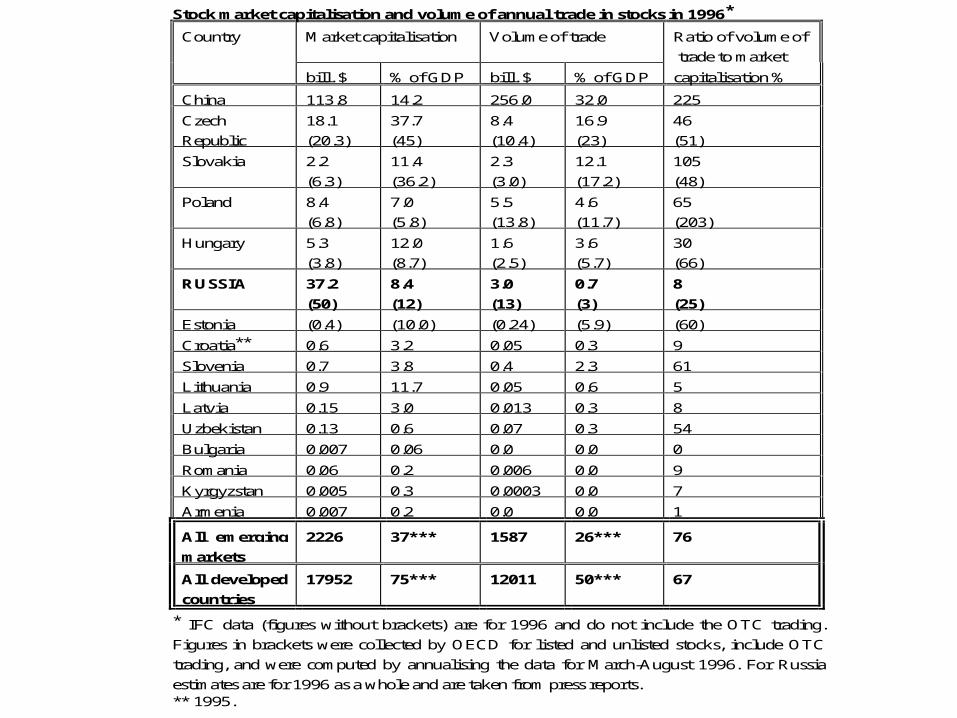
Stock market capitalisation and volume of annual trade in stocks in 1996*
Country Market capitalisation Volume of trade Ratio of volume of
trade to market
bill. $ % of GDP bill. $ % of GDP capitalisation %
China 113.8 14.2 256.0 32.0 225
Czech
Republic
18.1
(20.3)
37.7
(45)
8.4
(10.4)
16.9
(23)
46
(51)
Slovakia 2.2
(6.3)
11.4
(36.2)
2.3
(3.0)
12.1
(17.2)
105
(48)
Poland 8.4
(6.8)
7.0
(5.8)
5.5
(13.8)
4.6
(11.7)
65
(203)
Hungary 5.3
(3.8)
12.0
(8.7)
1.6
(2.5)
3.6
(5.7)
30
(66)
RUSSIA 37.2
(50)
8.4
(12)
3.0
(13)
0.7
(3)
8
(25)
Estonia (0.4) (10.0) (0.24) (5.9) (60)
Croatia** 0.6 3.2 0.05 0.3 9
Slovenia 0.7 3.8 0.4 2.3 61
Lithuania 0.9 11.7 0.05 0.6 5
Latvia 0.15 3.0 0.013 0.3 8
Uzbekistan 0.13 0.6 0.07 0.3 54
Bulgaria 0.007 0.06 0.0 0.0 0
Romania 0.06 0.2 0.006 0.0 9
Kyrgyzstan 0.005 0.3 0.0003 0.0 7
Armenia 0.007 0.2 0.0 0.0 1
All emerging
markets
2226 37*** 1587 26*** 76
All developed
countries
17952 75*** 12011 50*** 67
* IFC data (figures without brackets) are for 1996 and do not include the OTC trading.
Figures in brackets were collected by OECD for listed and unlisted stocks, include OTC
trading, and were computed by annualising the data for March-August 1996. For Russia
estimates are for 1996 as a whole and are taken from press reports.** 1995.

0
200
400
600
800
1000
1200
1400
De
c.9
2
Ma
r.9
3
Ju
n.9
3
Se
p.9
3
De
c.9
3
Ma
r.9
4
Ju
n.9
4
Se
p.9
4
De
c.9
4
Ma
r.9
5
Ju
n.9
5
Se
p.9
5
De
c.9
5
Ma
r.9
6
Ju
n.9
6
Se
p.9
6
De
c.9
6
Ma
r.9
7
Ju
n.9
7
Se
p.9
7
De
c.9
7
Czech Republic
Hungary
Poland
Russia
Fig. 5. Dollar stock prices indices, Dec. 1993 = 100%
Source: Economist, 1993-98; For Russia, 1992-93, - authors estimates.
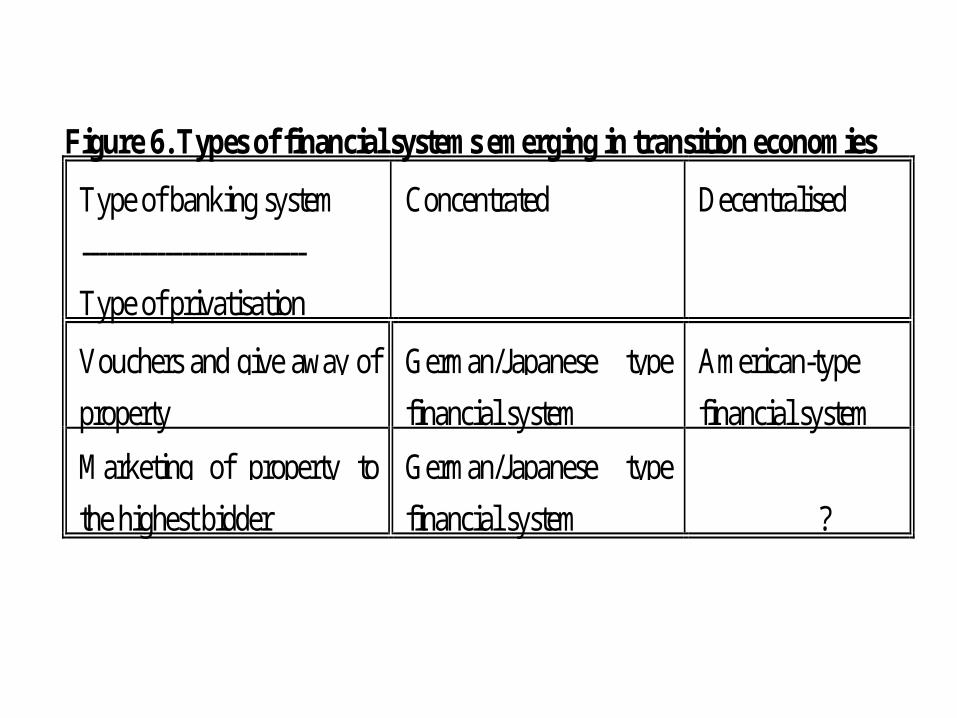
Figure 6. Types of financial systems emerging in transition economies
Type of banking system
---------------------------
Type of privatisation
Concentrated Decentralised
Vouchers and give away of
property
German/Japanese type
financial system
American-type
financial system
Marketing of property to
the highest bidder
German/Japanese type
financial system ?
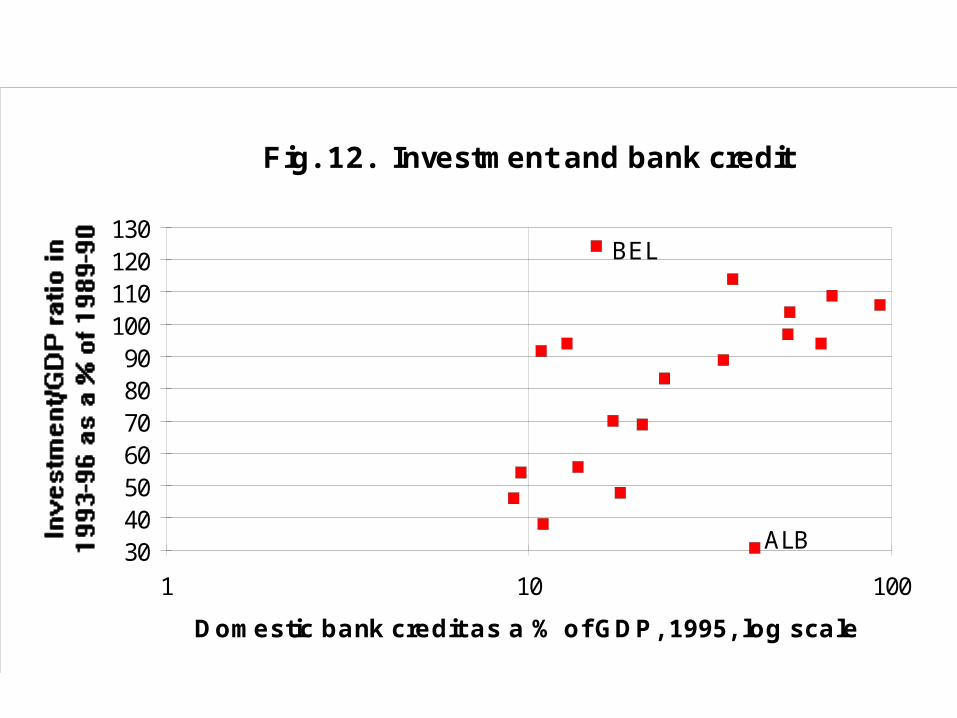
Fig. 12. Investment and bank credit
Domestic bank credit as a % of GDP, 1995, log scale
30405060708090100110120130
1 10 100
BEL
ALB
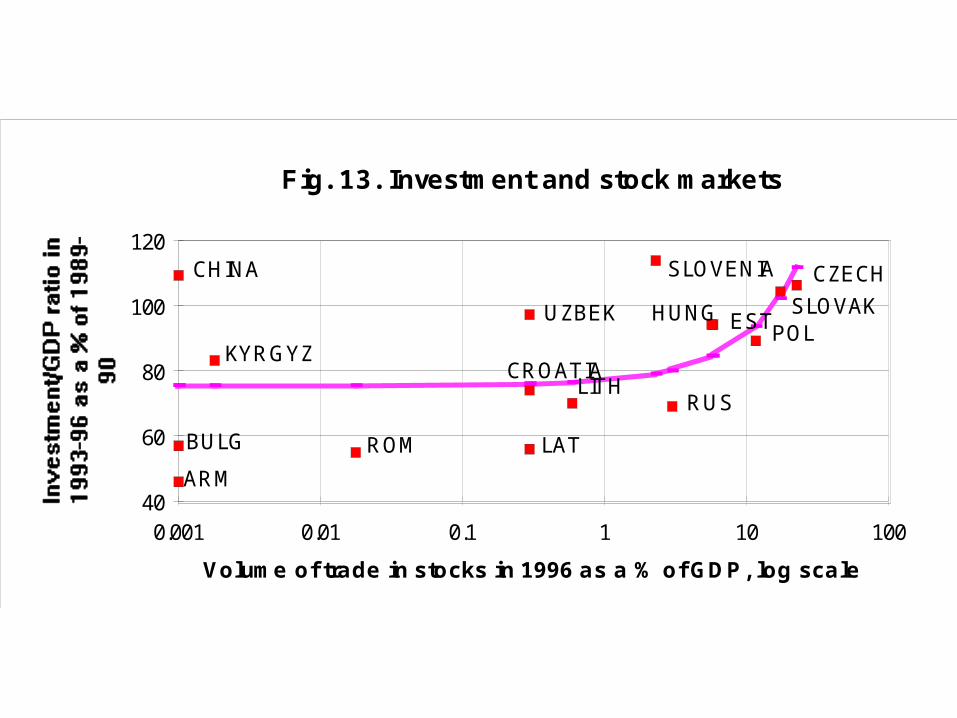
Fig. 13. Investment and stock markets
Volume of trade in stocks in 1996 as a % of GDP, log scale
40
60
80
100
120
0.001 0.01 0.1 1 10 100
CZECH
SLOVAKPOL
HUNG EST
RUS
SLOVENIA
LITHCROATIA
LAT
UZBEK
ROM
KYRGYZ
CHINA
BULG
ARM
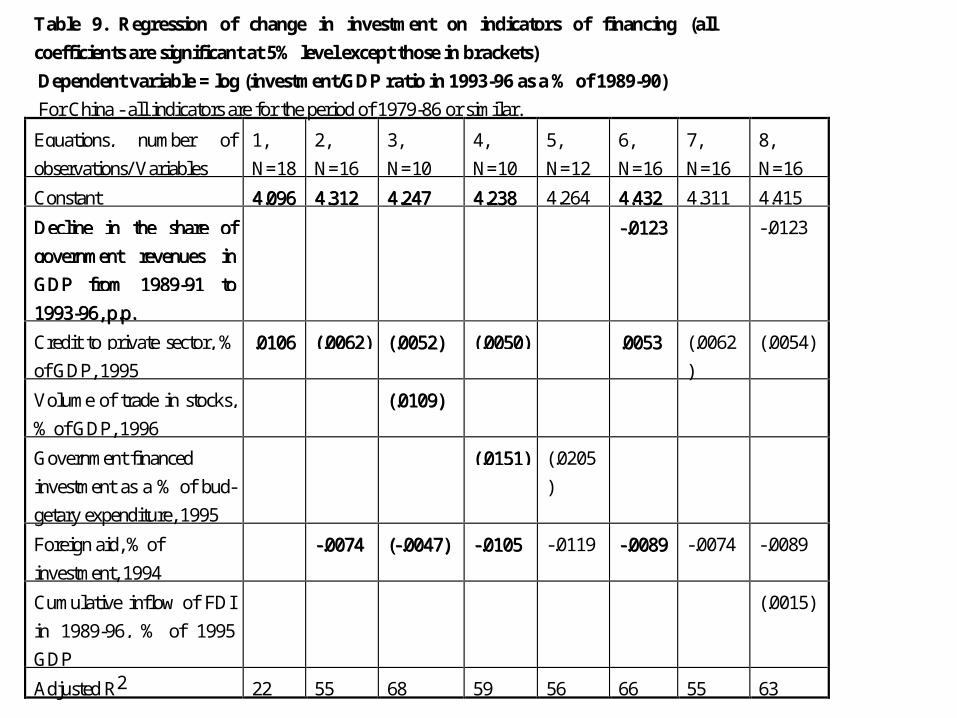
Table 9. Regression of change in investment on indicators of financing (all
coefficients are significant at 5% level except those in brackets)
Dependent variable = log (investment/GDP ratio in 1993-96 as a % of 1989-90)
For China - all indicators are for the period of 1979-86 or similar.
Equations, number of
observations/ Variables
1,
N=18
2,
N=16
3,
N=10
4,
N=10
5,
N=12
6,
N=16
7,
N=16
8,
N=16
Constant 44..009966 44..331122 44..224477 44..223388 4.264 44..443322 4.311 4.415
DDeecclliinnee iinn tthhee sshhaarree ooff
ggoovveerrnnmmeenntt rreevveennuueess iinn
GGDDPP ffrroomm 11998899--9911 ttoo
11999933--9966,, pp..pp..
--..00112233 -.0123
Credit to private sector, %
of GDP, 1995
..00110066 ((..00006622)) ((..00005522)) ((..00005500)) ..00005533 (.0062
)
(.0054)
Volume of trade in stocks,
% of GDP, 1996
((..00110099))
Government financed
investment as a % of bud-
getary expenditure, 1995
((..00115511)) (.0205
)
Foreign aid, % of
investment, 1994
--..00007744 ((--..00004477)) --..00110055 -.0119 --..00008899 -.0074 -.0089
Cumulative inflow of FDI
in 1989-96, % of 1995
GDP
(.0015)
Adjusted R2 22 55 68 59 56 66 55 63
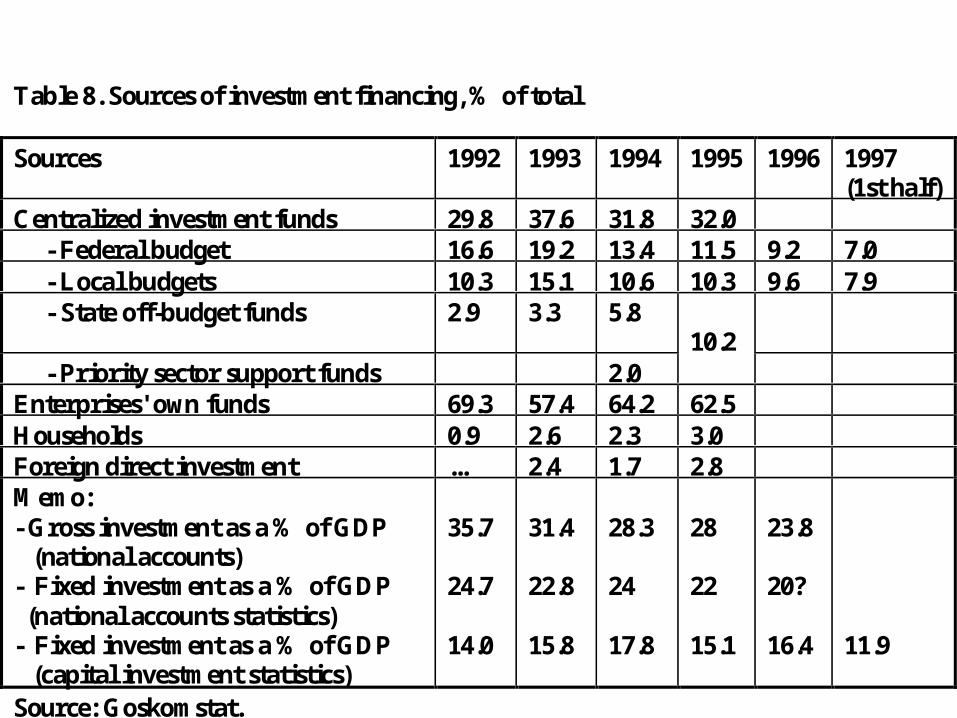
Table 8. Sources of investment financing, % of total
Sources 1992 1993 1994 1995 1996 1997(1st half)
Centralized investment funds 29.8 37.6 31.8 32.0 - Federal budget 16.6 19.2 13.4 11.5 9.2 7.0 - Local budgets 10.3 15.1 10.6 10.3 9.6 7.9 - State off-budget funds 2.9 3.3 5.8
10.2 - Priority sector support funds 2.0Enterprises' own funds 69.3 57.4 64.2 62.5Households 0.9 2.6 2.3 3.0Foreign direct investment ... 2.4 1.7 2.8Memo:- Gross investment as a % of GDP (national accounts)- Fixed investment as a % of GDP (national accounts statistics)- Fixed investment as a % of GDP (capital investment statistics)
35.7
24.7
14.0
31.4
22.8
15.8
28.3
24
17.8
28
22
15.1
23.8
20?
16.4 11.9
Source: Goskomstat.
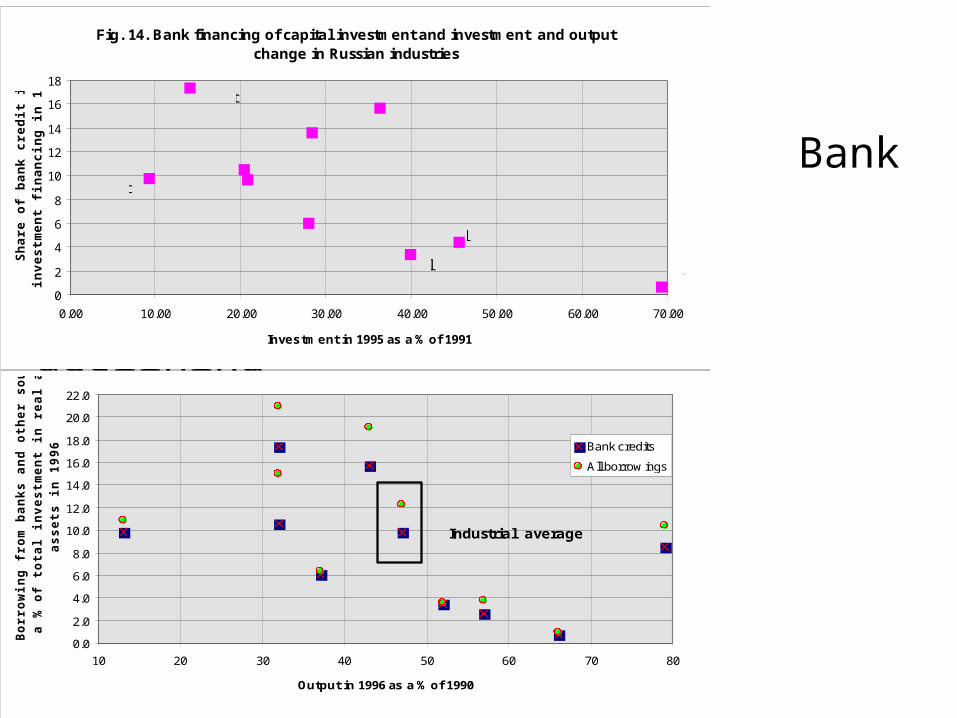
Bank credits
go to declining
industries
0.0
2.0
4.0
6.0
8.0
10.0
12.0
14.0
16.0
18.0
20.0
22.0
10 20 30 40 50 60 70 80
Output in 1996 as a % of 1990
Bo
rro
win
g f
rom
ban
ks a
nd
oth
er
so
urc
es a
s
a %
of
tota
l in
vestm
en
t in
real an
d f
inan
cia
l
assets
in
1996
Bank credits
All borrow ings
Industrial averageIndustrial average
Fig. 14. Bank financing of capital investment and investment and output change in Russian industries
0
2
4
6
8
10
12
14
16
18
0.00 10.00 20.00 30.00 40.00 50.00 60.00 70.00
Investment in 1995 as a % of 1991
Sh
are
of
ban
k cr
edit
in
inve
stm
ent
fin
anci
ng
in 1
996,
%
Electric energy
Fuel
Steel
Non-ferrous metals
Chemicals
Macinery and equipment
Wood
Construction materialsLight
Food
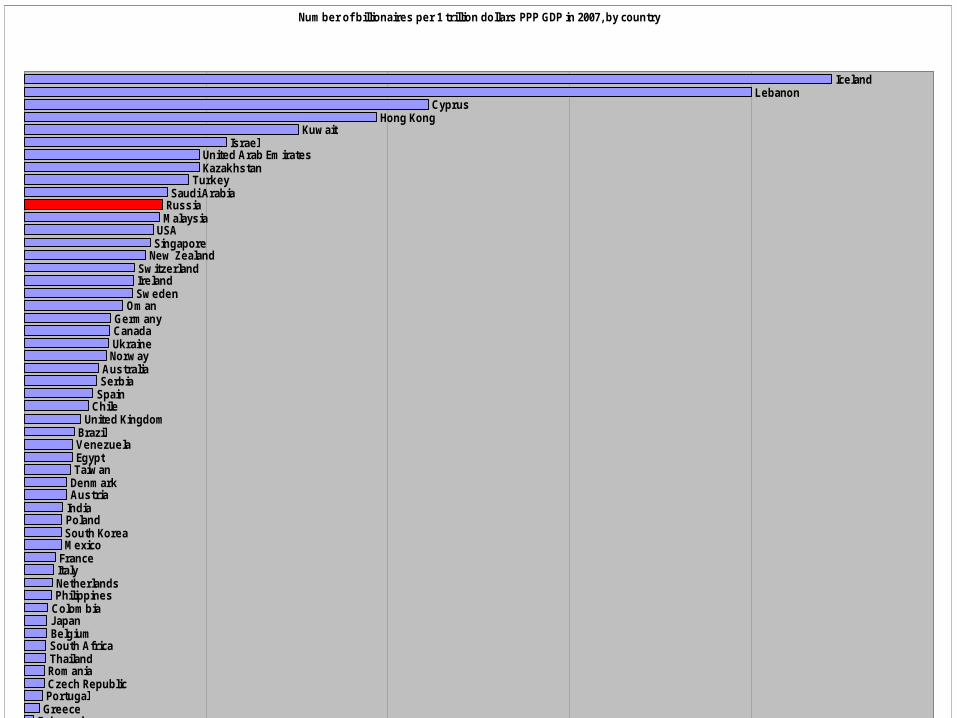
Number of billionaires per 1 trillion dollars PPP GDP in 2007, by country
ArgentinaChina MainlandIndonesiaGreece PortugalCzech RepublicRomaniaThailandSouth AfricaBelgiumJapanColombia PhilippinesNetherlandsItalyFranceMexicoSouth KoreaPolandIndiaAustriaDenmarkTaiwanEgyptVenezuelaBrazil
United KingdomChileSpainSerbiaAustralia
NorwayUkraineCanadaGermany
OmanSwedenIrelandSwitzerland
New ZealandSingaporeUSA
MalaysiaRussiaSaudi Arabia
TurkeyKazakhstanUnited Arab Emirates
IsraelKuwait
Hong KongCyprus
LebanonIceland
0 50 100 150 200 250
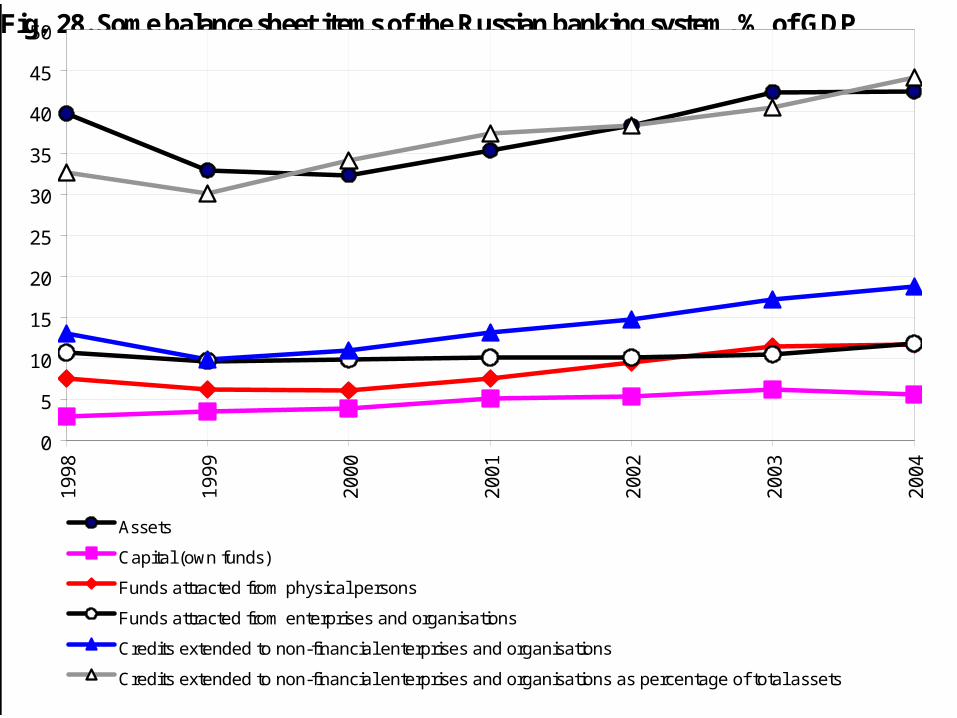
Fig. 28. Some balance sheet items of the Russian banking system, % of GDP
0
5
10
15
20
25
30
35
40
45
50
19
98
19
99
20
00
20
01
20
02
20
03
20
04
Assets
Capital (own funds)
Funds attracted from physical persons
Funds attracted from enterprises and organisations
Credits extended to non-financial enterprises and organisations
Credits extended to non-financial enterprises and organisations as percentage of total assets
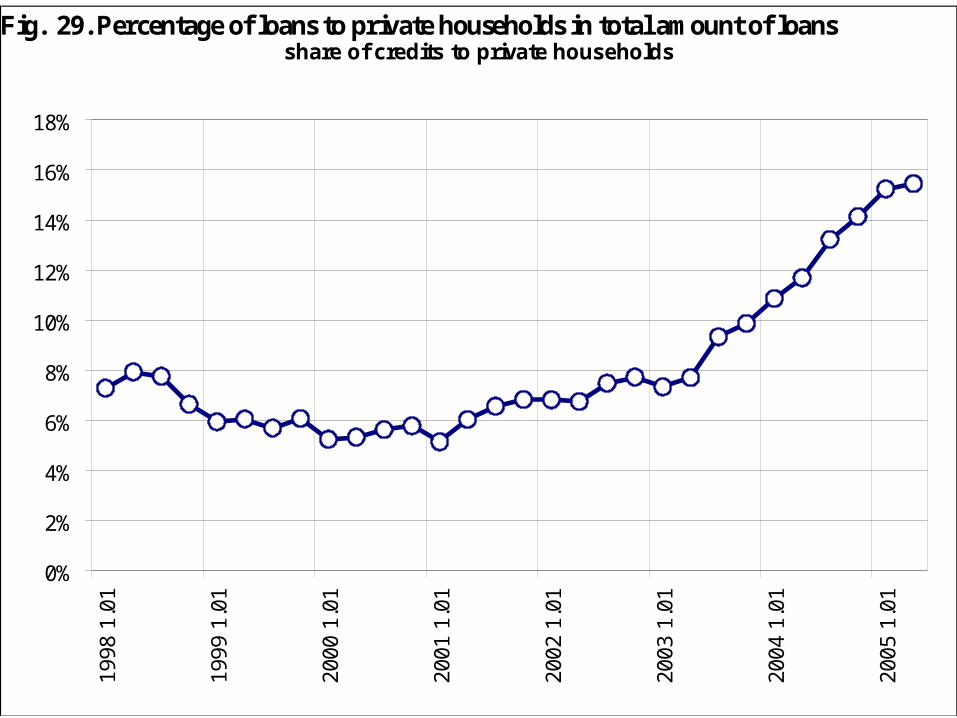
Fig. 29. Percentage of loans to private households in total amount of loansshare of credits to private households
0%
2%
4%
6%
8%
10%
12%
14%
16%
18%19
98 1
.01
1999
1.0
1
2000
1.0
1
2001
1.0
1
2002
1.0
1
2003
1.0
1
2004
1.0
1
2005
1.0
1
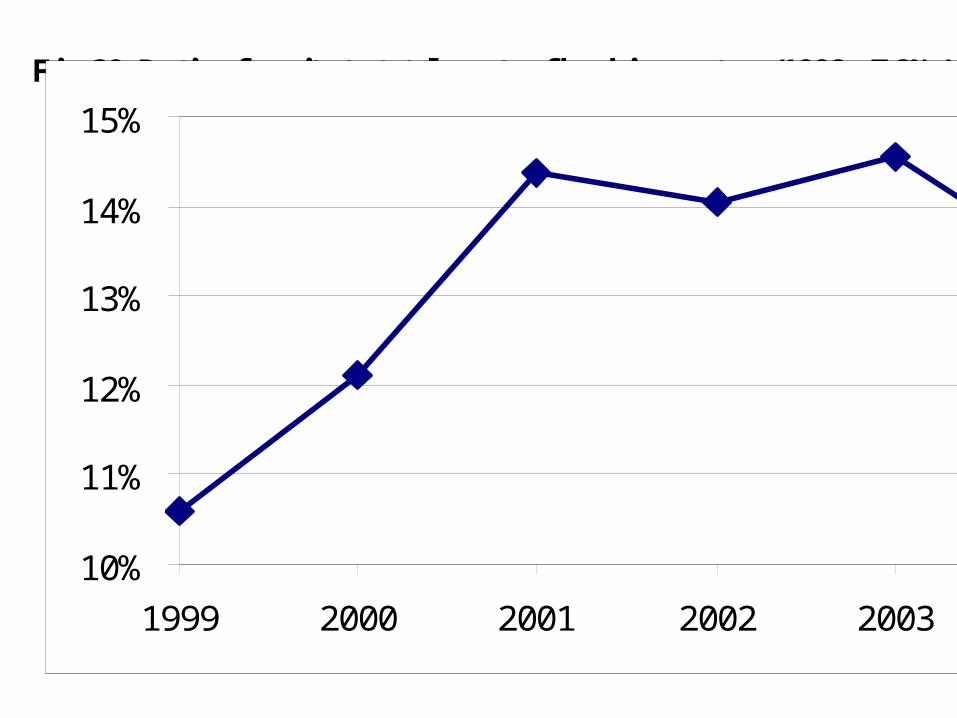
Fig. 30. Ratio of equity to total assets of banking system (1998 - 7.2%)
10%
11%
12%
13%
14%
15%
1999 2000 2001 2002 2003 2004
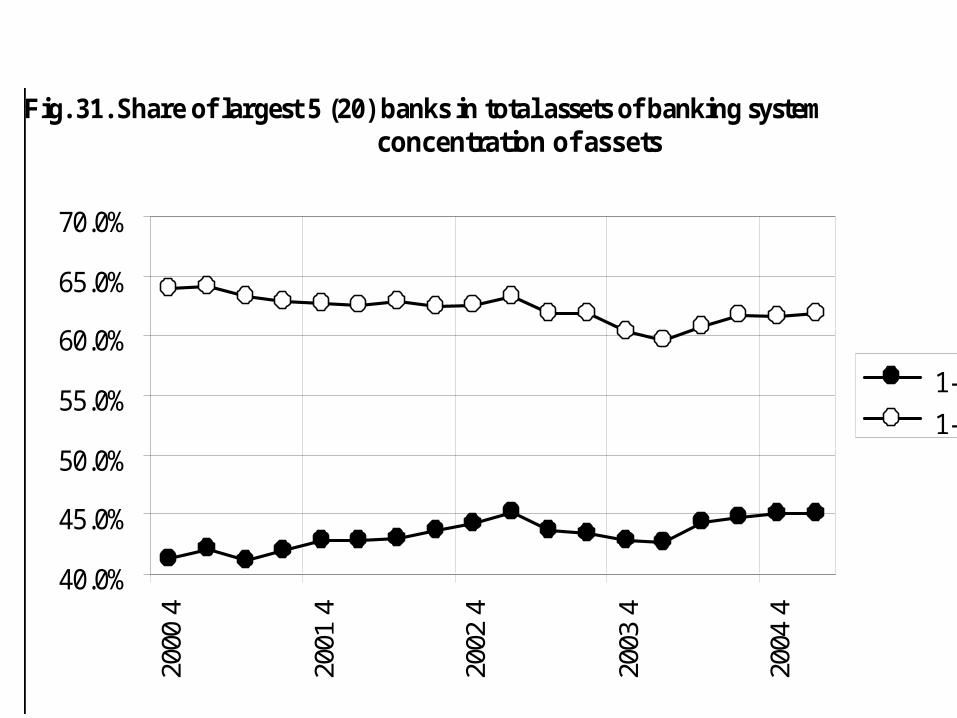
Fig. 31. Share of largest 5 (20) banks in total assets of banking systemconcentration of assets
40.0%
45.0%
50.0%
55.0%
60.0%
65.0%
70.0%
2000
4
2001
4
2002
4
2003
4
2004
4
1-5
1-20
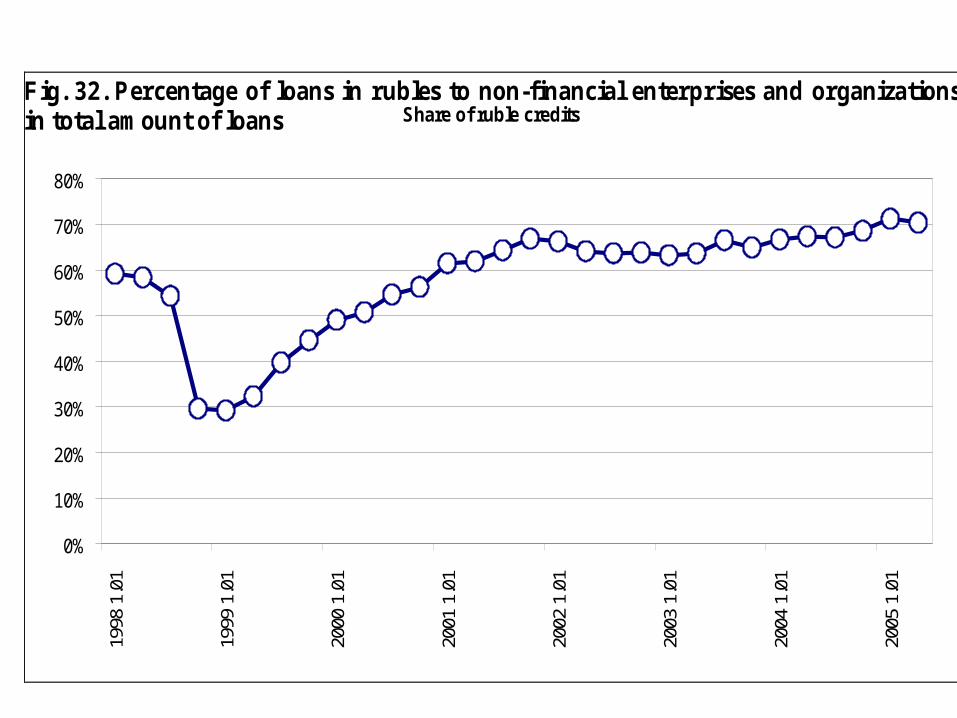
Fig. 32. Percentage of loans in rubles to non-financial enterprises and organizationsin total amount of loans Share of ruble credits
0%
10%
20%
30%
40%
50%
60%
70%
80%
1998
1.0
1
1999
1.0
1
2000
1.0
1
2001
1.0
1
2002
1.0
1
2003
1.0
1
2004
1.0
1
2005
1.0
1
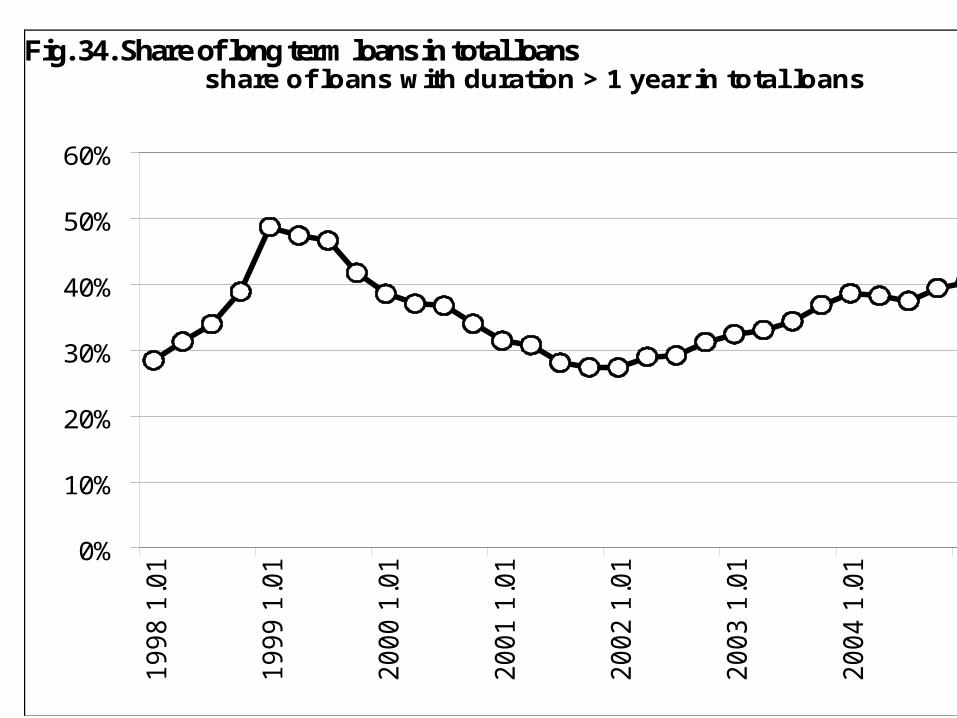
Fig. 34. Share of long term loans in total loansshare of loans with duration > 1 year in total loans
0%
10%
20%
30%
40%
50%
60%1
99
8 1
.01
19
99
1.0
1
20
00
1.0
1
20
01
1.0
1
20
02
1.0
1
20
03
1.0
1
20
04
1.0
1
20
05
1.0
1
Related Documents