PRIVATIZATION AND FINANCIAL PERFORMANCE OF GOVERNMENT FIRMS IN KENYA BY GEORGE MIGWI MUCHIRI UNITED STATES INTERNATIONAL UNIVERSITY-AFRICA SPRING 2020

Welcome message from author
This document is posted to help you gain knowledge. Please leave a comment to let me know what you think about it! Share it to your friends and learn new things together.
Transcript
PRIVATIZATION AND FINANCIAL PERFORMANCE OF GOVERNMENT
FIRMS IN KENYA
BY
GEORGE MIGWI MUCHIRI
UNITED STATES INTERNATIONAL UNIVERSITY-AFRICA
SPRING 2020
PRIVATIZATION AND FINANCIAL PERFORMANCE OF GOVERNMENT
FIRMS IN KENYA
BY
GEORGE MIGWI MUCHIRI
A Research Project Report Submitted to the School of Business in Partial
Fulfillment of the Requirement for the Degree of Degree of Master of Business
Administration.
UNITED STATES INTERNATIONAL UNIVERSITY-AFRICA
SPRING 2020
i
STUDENT`S DECLARATION
I, George Migwi Muchiri, declare that this is my original work and has not been submitted
to any other college, institution or university other than the United States International
university-Africa.
Signed………………………….. Date……………………………………………..……
George Migwi Muchiri (ID 656165)
This proposal has been presented for academic purposes with my approval as the appointed
supervisor
Signed …………………………….. Date……………………………………...…………..
Dr. Francis Gatumo
Signed……………………………… Date…………………………………...…………….
Dean Chandaria School of Business

ii
COPYRIGHT
All rights for this proposal are reserved. Printing or reproduction in any form is prohibited
without express permission from the author.
© George Migwi Muchiri, 2020

iii
ABSTRACT
The main purpose of the study was to establish the impact of privatization on the financial
performance of government firms in Kenya. The study was guided by three research
questions which were; 1.4.1 what is the Performance of Firms before Privatization? What
is the Performance of Firms after Privatization? and what are Measures of Improving
Privatization Processs?.
The study applied a quasi-experimental (event study) to carry out the study. The researcher
observed the pre and post-privatization performance of several government firms that were
privatized between 1991 to 2008. The sampling frame for this study was the 6 privatized
government firms. Simple random sampling was used in this study so as to ensure that each
element in the population of an equal chance of being included in the sample. Data forms
were used to collect data for the period of six years. Descriptive statistics such as mean and
standard deviation were used to test the data for its ability to be relied upon for valid
conclusion. Inferential statistic used in the study was regression analysis.
The first research question addressed the performance of government firms before
privatization. The performance was measured by the use of mean and standard deviation.
The study discovered that companies performed better after privatization. This indicated
that they became more stable after privatization. The return on turnover increased after
privatization. Return on assets increased after privatization of the companies. Return on
equity also signified a great improvement after privatization compared to the period before
privatization.
The second research question was to address the financial performance of the privatized
companies. This section used return on assets, return on turnover and return on equity to
measure the financial performance. Each company was analyzed individually. The study
revealed that in the first three years before privatization, KENGEN performed poorly
compared to the three years after privatization. Return on turnover kept on increasing and
decreasing after privatization. National Bank of Kenya performed better after privatization
although all the measures kept on fluctuating from high to low. Kenya Airways Limited
showed an improved financial performance after privatization. Return on total assets kept
on changing from high to low and vice-versa. Kenya Re-insurance Corporation limited
improved its financial performance after privatization. Although the return on assets

iv
improved in the first year, it dropped in the second year after privatization. Housing Finance
Corporation of Kenya`s financial performance improved drastically after the privatization.
Generally, the performance improved although some measures like return on turnover and
return on equity kept on decreasing and increasing after privatization. Mumias Sugar
Company financial performance improved generally after privatization. In the second year
after privatization, all the measures of financial performance decreased and rose
significantly in the third year.
The third research question was to establish the measures which can be used to improve
privatization process. The study revealed that; conducive environment by government
improves privatization process, conducive environment encourages competition in the
market, conducive environment improves the performance of privatized companies and
favorable government policies favor privatization process. The study further revealed that
employment of qualified staff enables smooth privatization process, government should
streamline the privatization process to make it easier and that privatization process should
be short and simple.
The conclusion of the study was that all firms should work hard without considering the
issue of privatization in mind. The government should put measures to ensure that its firms
perform well even before privatization. The privatized firms should motivate its employees
and management throughout the operations so as to ensure healthy and stable performance
of the firm. There should be a good relationship between the management and the
government to avoid conflicts of interests.
The study recommends state owned companies to monitor their performance and that the
companies use both financial and non-financial measures to monitor the performance of
the firms after privatization. The study recommends further research to be done for a longer
period more than five years before and after privatization.

v
DEDICATION
This project is dedicated to my mom, family and friends for their untiring support
throughout my master’s degree and their inspiration that assisted me complete this research
proposal.

vi
ACKNOWLEDGEMENT
I thank God for guiding me through my education journey. I also appreciate my supervisor
Dr. Francis Gatumo for support and guidance through this research study. Finally I give
special thanks to my wife and children for their continued support and inspiration all
through my studies. God bless them all abundantly.

vii
ABBREVIATIONS
ROT- Return on Turnover
ROE- Return on Equity
ROTA- Return on Total Assets
IMF- International Monetary Fund
HFCK- Housing Finance Corporation of Kenya
viii
TABLE OF CONTENTS
STUDENT`S DECLARATION ......................................................................................... i
COPYRIGHT ..................................................................................................................... ii
ABSTRACT ....................................................................................................................... iii
DEDICATION.................................................................................................................... v
ACKNOWLEDGEMENT ................................................................................................ vi
ABBREVIATIONS .......................................................................................................... vii
TABLE OF CONTENTS ............................................................................................... viii
LIST OF TABLES ............................................................................................................. x
LIST OF FIGURES .......................................................................................................... xi
CHAPTER ONE ................................................................................................................ 1
1.0 INTRODUCTION........................................................................................................ 1
1.1 Background of the Study ............................................................................................... 1
1.2 Statement of the Problem ............................................................................................... 5
1.3 Purpose of the Study ...................................................................................................... 6
1.4 Research Objectives ....................................................................................................... 6
1.5. Importance of the Study ................................................................................................ 6
1.6 Scope of the Study ......................................................................................................... 7
1.7 Definition of Terms ........................................................................................................ 7
1.8 Chapter Summary .......................................................................................................... 8
CHAPTER TWO ............................................................................................................... 9
2.0 LITERATURE REVIEW ............................................................................................ 9
2.1 Introduction .................................................................................................................... 9
2.2 Performance of Firms before Privatization .................................................................... 9
2.3. Performance of Firms after Privatization .................................................................... 13
2.4. Measures of Improving Privatization Processs ........................................................... 17
2.5. Chapter Summary ....................................................................................................... 21
CHAPTER THREE ......................................................................................................... 22
3.0. RESEARCH METHODOLOGY ............................................................................ 22
3.1. Introduction ................................................................................................................. 22
3.2. Research Design.......................................................................................................... 22
3.3. Population and Sampling Design ................................................................................ 22
3.4. Data Collection Method .............................................................................................. 24

ix
3.5. Research Procedures ................................................................................................... 24
3.6. Data Analysis Methods ............................................................................................... 25
3.7. Chapter Summary ....................................................................................................... 26
CHAPTER FOUR ............................................................................................................ 27
4.0 RESULTS AND FINDINGS ..................................................................................... 27
4.1 Introduction .................................................................................................................. 27
4.2 Demographic Information ............................................................................................ 27
4.3 Performance of Firms before Privatization .................................................................. 31
4.4 Performance of the Privatized Companies after Privatization ..................................... 45
4.5 Measures of Improving Privatization Process ............................................................. 58
4.6 Chapter Summary ........................................................................................................ 66
CHAPTER FIVE ............................................................................................................. 67
5.0 DISCUSSION, CONCLUSIONS AND RECOMMENDATIONS ........................ 67
5.1 Introduction .................................................................................................................. 67
5.2 Summary of the Study ................................................................................................. 67
5.3 Discussion .................................................................................................................... 68
5.4 Conclusions .................................................................................................................. 75
5.5 Recommendation ......................................................................................................... 76
REFERENCES ................................................................................................................. 78
APPENDIX A: INTRODUCTION LETTER
APPENDIX B: QUESTIONNAIRE
APPENDIX C: CORRELATION TABLE

x
LIST OF TABLES
Table 4. 1 Years of Experience .......................................................................................... 29
Table 4. 2 Financial Performance before Privatization ..................................................... 32
Table 4. 3 Financial Performance after Privatization ........................................................ 45
Table 4. 4 Conducive Environment Encourages Competition in the Market .................... 59
Table 4. 5 Favorable Government Policies Favor Privatization Process ........................... 60
Table 4. 6 Government Streamlining Privatization Process to Make It Easier ................. 62
Table 4. 7 Better Compensation Package for the Retrenched Employees ........................ 63
Table 4. 8 Retrenchment of Ghost Workers before Privatization ...................................... 64
Table 4. 9 Coefficient of Determination ............................................................................ 65
Table 4. 10 Model Coefficients ......................................................................................... 65

xi
LIST OF FIGURES
Figure 4. 1 Management Level .......................................................................................... 27
Figure 4. 2 Gender ............................................................................................................. 28
Figure 4. 3 Age of the Respondents ................................................................................... 28
Figure 4. 4 Marital Status................................................................................................... 29
Figure 4. 5 Years of Company Operation .......................................................................... 30
Figure 4. 6 Industry of Operation ...................................................................................... 30
Figure 4. 7 Mean and Standard Deviation before Privatization ......................................... 33
Figure 4. 8 Return on Turnover for KENGEN before Privatization .................................. 33
Figure 4. 9 Return on Total Assets for KENGEN before Privatization ............................. 34
Figure 4. 10 Return on Equity for KENGEN .................................................................... 34
Figure 4. 11 Return on Turnover for NBK before Privatization ........................................ 35
Figure 4. 12 Return on Total Assets for NBK before Privatization................................... 36
Figure 4. 13 Return on Equity for NBK before Privatization ............................................ 36
Figure 4. 14 Return on Turnover for KQ before Privatization ......................................... 37
Figure 4. 15 Returns on Total Assets for KQ before Privatization .................................... 38
Figure 4. 16 Return on Equity for KQ before Privatization .............................................. 38
Figure 4. 17 Returns on Turnover for Kenya Re before Privatization ............................... 39
Figure 4. 18 Returns on Total Assets for Kenya Re before Privatization.......................... 40
Figure 4. 19 Returns on Equity for Kenya Re before Privatization ................................... 40
Figure 4. 20 Returns on Turnover for HFCK before Privatization .................................... 41
Figure 4. 21 Returns on total assets for HCFK before Privatization ................................. 42
Figure 4. 22 Returns on Equity for HCFK before Privatization ........................................ 42
Figure 4. 23 Returns on Turnover for Mumias before Privatization ................................. 43
Figure 4. 24 Returns on Total Assets for Mumias before Privatization ............................ 44
Figure 4. 25 Returns on Equity for Mumias before Privatization ...................................... 44
Figure 4. 26 Mean and standard deviation After Privatization .......................................... 46
Figure 4. 27 Return on Turnover for KENGEN after Privatization .................................. 47
Figure 4. 28 Return on Total Assets for KENGEN after Privatization ............................. 47
Figure 4. 29 Return on Equity for KENGEN after Privatization ....................................... 48
Figure 4. 30 Return on Turnover for NBK after Privatization .......................................... 49
Figure 4. 31 Return on Total Assets for NBK after Privatization ..................................... 49
Figure 4. 32 Return on Equity for NBK after Privatization .............................................. 50

xii
Figure 4. 33 Return on Turnover for KQ after Privatization ............................................. 50
Figure 4. 34 Returns on Total Assets for KQ after Privatization ....................................... 51
Figure 4. 35 Return on Equity for KQ after Privatization ................................................. 52
Figure 4. 36 Returns on Turnover for Kenya Re after Privatization ................................. 53
Figure 4. 37 Returns on Total Assets for Kenya Re after Privatization ............................ 53
Figure 4. 38 Returns on Equity for Kenya Re after Privatization ...................................... 54
Figure 4. 39 Returns on Turnover for HFCK after Privatization ....................................... 55
Figure 4. 40 Returns on total assets for HCFK after Privatization .................................... 55
Figure 4. 41 Returns on Equity for HCFK after Privatization ........................................... 56
Figure 4. 42 Returns on Turnover for Mumias after Privatization .................................... 57
Figure 4. 43 Returns on Total Assets for Mumias after Privatization ............................... 57
Figure 4. 44 Returns on Equity for Mumias after Privatization ........................................ 58
Figure 4. 45 Conducive Environment Improves Privatization Process ............................. 59
Figure 4. 46 Conducive Environment Improves Performance .......................................... 60
Figure 4. 47 Employment of Qualified Staff ..................................................................... 61
Figure 4. 48 Privatization Process should be short and simple.......................................... 62

xiii

1
CHAPTER ONE
1.0 INTRODUCTION
1.1 Background of the Study
Privatization is the act of reducing the responsibility of the government and increasing the
responsibility of the private sector in an activity or in the ownership of the states (Osman,
2014). According to Mercille and Murphy (2017) privatization is the political context in
which there is shift of activities of functions from the state to the private sector or transfer
of production of goods and services from public sector to private. The privatization of state-
owned enterprises (SOEs) has become a common process all over the world and was
considered a major component of the New Public Management (Bachiller, 2017).
Privatization, began in 1979 in the UK and spread to European and developing countries in
South America, Asia and Africa alike, has become a major economic phenomenon in recent
decades (Alipour, 2013).
Privatization of state-owned enterprises is considered one of the most important changes in
the structure of the capital market .However, SOEs lack essential efficiency and this can be
improved by the privatization process. The main importance of privatization is to offer
room for competition, develop the market system, and advance the performance of private
businesses. A Study done in UK about impact of privatization on firm performance found
out that companies privatized by public offerings obtain a better performance than
companies privatized using other methods, such as private sale or voucher privatization,
and do not support the common-place assumption that privatization in developing countries
does not improve financial performance (Bachiller, 2017).
Europe is under privatization trend which began in the 1970s in Britain and most of the
other European countries have realized the exceptional benefits which privatization
provides (Wright, 2015). Government can privatize its state owned corporations through
sale of shares where the government sells its shares through public flotation, pre-emptive
rights, competitive sale and sale of assets through open tenders, direct sale, public auction
and liquidation of assets (Lesorogol, 2010). The government can also privatize through
management buyouts and employee buyouts, equity dilutions, transfer of assets and shares,
joint ventures, restitutions and management contracts (Makokha, 2013). Over the last
decade, privatization has become a common phenomenon in the developing countries
2
whereby SOE`s are being privatized at an increasing percentage (Mercille and Murphy,
2017).
Privatization became common in the developing and transition countries due to the debt
crisis which emerged in 1981 to 1982 (Lieberman, 2007). Developing countries were
unable to continue absorbing the fiscal burden of their State Owned Enterprises.
Ramamurti (2016) argued that privatization increases government cash flows by reducing
subsidies and capital infusions to SOE`s, refining resource deployment, improving profits
and encouraging common capitalism through possession of shares. Privatization also
confines power of trade unions in the public sector, reallocates incomes and rents within
the society, satisfies foreign donors through decreasing of government`s role in the
economy and specifically improving effectiveness and the performance of SOE`s based on
the basis that the private sector performs well compared to the public sector (Schiffler,
2015).
According to Chari (2015), privatization began in the 1990`s in Kenya immediately after
modification by International Monetary Fund (IMF) in 1980`s on Sub Saharan African
countries. The International Monetary Fund conditions for African countries were to assist
in evaluating credit and support in funds (Lurie, 2018). African countries encouraged
privatization to take advantage of the conditions given by IMF. In 1992, the Kenyan
government wrote a paper which defined the policies and guidelines for privatization of
public companies in Kenya. In 1994, the Kenyan government came up with a committee to
supervise the process of privatization (Otieno, 2015). In the year 2002, the Kenyan
government committed itself with the privatization process of Kenya Commercial Bank,
Telkom Kenya and Kenya Rail ways.
Since privatization was introduced in Kenya, company like Kenya Airways has improved
in terms of efficiency and increased profits. Boehmer, Nash and Netter (2005), concluded
that empirical research reveals that private owned companies are more efficient and
profitable compared to the public owned companies. There is that assumption that
privatization generates enough funds and operate efficiently after privatization. Profits from
private owned companies are used to repay the public debt and this has led to high rate of
disassociation of public owned companies from production of goods and services
(Boubakri, Cosset & Guedhami, 2005). Privatizations pressurizes managers to pay close
attention in achieving the goals and objectives of the company as they are under private
3
ownership and the management is always responsible to the shareholders wealth (Crowder,
2012).
In privatization, control rights and cash flow rights are transferred from politicians to the
managers of the company. Privatization changes the role of government to provision of
social and economic services in an efficient manner (Michigan, 2001). After privatization,
firms employ their own human resources, financial resources and information technology
resources efficiently so as to improve the profits of the company (Lurie, 2018). After
privatization, the sales revenue are expected to rise as the company is able to offer fair
incentives, more access to financing opportunities and great entrepreneurial initiatives. A
study done by Shiffer (2018) in Israel about the impact of privatization in public companies
established that debts in the capital structure decreased as the cost of borrowing increased
and the companies were able to access public equity markets.
After the privatization process takes place, bankruptcy costs are removed to the newly
privatized firm and therefore this leads to reduced debts (Bachiller, 2017). Most of the
public owned companies experience the problem of over-staffing and after privatization,
the level of employment decreases as the private company is no longer able to receive
government subsidies. However, a newly-privatized company productivity increases and
also the employees income is improved (Worsnop, 1992). With privatization, the policies
allows more firms to present their products in the market and therefore increasing
competition in the market (Lurie, 2018). Most firms consider the aggressiveness to enter
into the competitive markets and increasing risk taking to develop new services, products
and processes (Zarei, Amanati, & Amanati, 2017) .It is through this competition whereby
efficiency is improved. On the other hand competition in the market is also influenced by
the nature of the industry (Ohemeng & Grant, 2008). Through the selling of shares to the
stock market, government raises revenue and therefore provides better services to the public
(Fungacova & Hanousek, 2006).
Financial performance is the measure of the financial health of a company after a period of
time and can be used for comparison for companies in the same industry or for comparing
different industries (Association of Accounting Technicians, 2013). According to Libby,
Short, Kanaan and Sterling (2017), financial performance are the outcomes of the company
policies and operations in monetary value. Financial performance of the company is
indicated by return on assets, return on investment and return on sales among others.
4
Financial performance can be measured using profitability ratios, Activity ratios, Liquidity
Ratios, shareholder ratios, turnover ratios and solvency ratios (Penning, 2012). Liquidity
ratios measure the ability of the company to meet its short term obligations within the
specified period (Tullio & Wolters, 2004). Shareholder ratios predicts or forecast the
interest of the shareholders and check if they are satisfied. Activity ratios measures if the
assets of the company are effectively and efficiently used by the management.
Kenya is the best performing economy in East Africa and has been privatizing its
companies in order to stay competitive in the market (Anyang'Nyong'o, 2000).
Privatization has been ehnannced in kenya by having a simple privatization process,
engagement of both parties in the privatization process and sensitizing the general ublic on
its importance to the economy. Privatization commission in Kenya helps the government
in privatization through the sale of shares (McGuckin & Dougherty, 2002). Some the
government companies proposed for the privatization include Western sugar companies
like Chemelil sugar company, Nzoia Sugar Company Limited, South Nyanza Sugar
Company Limited, Muhoroni Sugar Company and Miwani Sugar Company (Sammy,
2004). The government affirmed to sell 51% shareholding in each of these companies to
strategic investors and 24%to be sold to employees while the rest to be sold to Kenyan
farmers and members of the public. Although privatization has for some years led to
retrenchment of employees, it has had a great impact to the economic growth of Kenya.
Privatization has also led to the improved performance of the government firms which were
initially performing poorly.
Other companies privatized in Kenya include Kenya Wine Agencies, Kenya Ports
Authority, National Bank of Kenya, Kenya Meat Commission, Kenya Pipeline Company
Limited, New Kenya Co-operative Creameries Limited and Agro Chemical and Food
Company (Debrah & Toroitich, 2005). A good example of successful privatization is
Kenya Airways. It was the first to be privatized in African Airline industry. The whole
process of privatization of Kenya Airways took two years whereby 77% of the shares were
sold to private investors. In the year 1987 to 1996 the company was generating losses due
to the inefficiency in operation. Since 1996 the company has been reporting some profits.
In 2014, Kenyan government invited investors to help in the operations in Eldoret
Container Terminal, construct the new Kipevu Terminal and develop berths 11, 12, 13 and
14 at a cost of US$1.5 billion. Privatization of Kenya Ports Authority was aimed at

5
consolidating East Africa’s biggest sea port as neighboring Eritrea, Djibouti and Tanzania
scaled up efforts to expand their ports.
1.2 Statement of the Problem
Privatization has become an important part of the public policy in the developing countries
since 1980`s. The main aim of the government to encourage privatization to improve
efficiency in the State Owned Firms, reduce the budget of state owned firms and to capital
markets more vibrant. There has been increased privatization of government firms in recent
past and it has become a very widespread phenomenon. This has created a mixed reactions
on the players as to the outcome of this acquisitions. There has been a number of studies
both here in Kenya and the world at large where there has been no agreement as to whether
privatization improve the financial performance of a firm or not. There are studies that have
shown that the financial performance of privatized firms have improved there after
acquisition ( Kithinji, 2007: Azhagaiah and Kumar 2011: Korir, 2006: Ramaswany and
Waegelein, 2003). On the other hand there has been some studies that have point out that
the privatized firms do not have any financial benefits to them (Ndura, 2010). The firm
been privatized in most cases in the short run have its stakeholders get good returns. The
shareholders in the privatized firms on the other hand may have some undervalued share
price in the short run but with no overall wealth gains. There is also decreased EPS by the
privatized firm due to reduced earnings.
After privatization of Kenya Airways, the company realized a gross profit of KES.237,
204,000 from an earlier gross loss of KES.53, 867,000 in the year 1992. For the year ended
December 1994, earnings per share increased from -1.11 to -0.09 in 1993. Return on
investment rose from -0.103 to -0.007 between 1989 to 1998. A study carried out in Kenya,
70% of the respondents believed that efficiency in the public sector improved after
privatization, 20% indicated that expenditure in the public sector reduced after privatization
and 3% held the believe that privatization assisted the former public firms to operate on the
heart of market principles, operational independence and the improvement of
accountability (Augustyniak, Brooks, Rinaldo, Bogner, & Hodges, 2009). A study done to
evaluate the effect of organizational change and privatization on the performance of state-
owned enterprises (SOEs) using the data from Iranian firms during the period 1998-2006,
and to test whether privatization leads to improved performance (Alipour, 2013).
The performance of these firms before and after privatization was examined. The results
6
show that privatization had no positive effect on the profitability of the firms listed on the
Tehran Stock Exchange; rather, the effect was negative.
Empirically, studies have found conflicting results of financial performance before and
after privatization. Due to the above varying results, the question of the impact of
privatization on the performance of firms remains pertinent. This study aimed to close the
gap and give a clear picture on the impact of privatization on the performance of firms.
1.3 Purpose of the Study
The main purpose of the study was to establish the impact of privatization on the financial
performance of government firms in Kenya
1.4 Research Objectives
The research objectives of the study were:
1.4.1 What Is the Performance of Firms before Privatization?
1.4.2 What Is the Performance of Firms after Privatization?
1.4.3 What are t Measures of Improving Privatization Process?
1.5. Importance of the Study
1.5.1 Public Companies
Public companies were able to understand the benefits associated with privatization and the
process involved. They were also in a position to weigh the benefits and disadvantages of
privatization and come up with the best solution.
1.5.2 Researchers
The study was of great benefit to the researchers as they were able to understand better the
meaning of privatization, the challenges involved and also the benefits. In addition they
were in a position to advice the government on the best move to take in regards to
privatization.
1.5.3 Financial managers
Financial managers of public companies were able to understand the benefits of
privatization and were in a position to convince the government to convert from public
owned companies to private own companies.

7
1.5.4 Investors
Foreign and domestic investors gained knowledge about privatization and therefore knew
better whether to invest in public owned companies or private companies. It is only through
this research whereby they were able to make wise decisions concerning investments.
1.5.5 Business People
This study enabled business people to get a clear understanding of privatization and how it
can affect the performance of the businesses. From this study business people were able to
know if carry out business with private company or private owned companies.
1.6 Scope of the Study
The study was carried out in privatized government firms in Kenya. This study was limited
to the importance of privatization of government firms on financial performance,
performance of government firms before and after privatization and Measures of Improving
Privatization Process. The study was carried out between August 2018 to December 2019.
1.7 Definition of Terms
1.7.1 Privatization
Privatization is the process of transferring an enterprise or industry from the public sector
to the private sector (Crowder, 2012). This leads to a reduced scope, limits the functions
and weakens the influence of government on the operations of the privatized company. In
this study privatization refers to the possession of public firms by private firms or investors.
1.7.2 Firm
A firm is a business organization, such as a corporation, limited liability company or
partnership, which sells goods or services to make a profit (Lesorogol, 2010). A firm can
be a corporation, Limited Liability Company, public limited company, partnership business
or a sole proprietor business which has either products or services for sale. In this study, a
firm refers to the government companies who desire to privatize.
1.7.3 International Monetary Fund (IMF)
The International Monetary Fund (IMF) is an international organization created for the
purpose of standardizing global financial relations and exchange rates. The IMF generally

8
monitors the global economy, and its core goal is to economically strengthen its member
countries. (International Monetary Fund & International Monetary Fund, 2014).
1.7.4 Financial Performance
Financial performance is the measure of financial health of a firm after a period of time and
can be used for comparison for companies in the same industry or for comparing different
industries (Association of Accounting Technicians, 2013). In this study, financial
performance refers to the financial health of the firm.
1.7.5 Efficiency
Comparison of what is actually produced or performed with what can be achieved with the
same consumption of resources (Chen, 2017). Efficient firms are capable of maximizing
outputs from the available resources while at the same time minimizing the costs.
Therefore, it means that firms can improve efficiency by cost reduction.
1.8 Chapter Summary
Chapter one has described the background of the study, specific objectives, and statement
problem. The introduction and background of the study has reviewed the benefits of
privatization and different types of privatization in the world. The scope of the study has
been outlined with the aim of investigating impact of privatization of government firms in
regards to the importance, challenges and measure of improving privatization in
government firms Performance of before and after Privatization and the Measures of
Improving Privatization Process. The importance of the study has also been identified and
the definition of words as well. Chapter two reviews literature review based on the three
research questions: what is the Performance of Firms before Privatization? What is the
Performance of Firms after Privatization? What are Measures of Improving Privatization
Process?. Chapter two covers literature review, chapter three research methodology,
chapter four analyses results and findings of the study and chapter five covers discussion,
conclusions and recommendations of the study.
9
CHAPTER TWO
2.0 LITERATURE REVIEW
2.1 Introduction
This chapter reviews literature on the effect of privatization on the financial performance
of government firms. The literature discusses the Performance of Firms before
Privatization, Performance of Firms after Privatization, The Measures of Improving
Privatization Process.
2.2 Performance of Firms before Privatization
Improved performance of privatized firms cannot be taken for granted merely by
ownership change. Privatization must be accompanied by other economic adjustments such
as adjustment of the capital market and formulation of corporate rules and regulations
(Bachiller, 2017). A study done to evaluate the effect of organizational change
and privatization on the performance of state-owned enterprises (SOEs) using the data
from Iranian firms during the period 1998-2006, and to test whether privatization leads to
improved performance (Alipour,2013).The performance of these firms before and
after privatization was examined. The results show that privatization had no positive effect
on the profitability of the firms listed on the Tehran Stock Exchange; rather, the effect was
negative. Moreover, the results revealed that privatization of these firms has had no effect
on their sales effectiveness and efficiency; instead, the debts and risks of these firms has
increased.
2.2.1 Profits
Privatization usually affects the profits generated. Many studies have been done about
privatization and found out that privatization usually improve the profitability of a company
resulting from proper management. Bachiller (2017) argued that companies privatized by
public offerings obtain a better performance than companies privatized using other
methods, such as private sale or voucher privatization, and do not support the assumption
that privatization in developing countries does not improve financial performance . A study
by Astami, Tower, Rusmin, and Neilson, (2010) to investigate whether partially privatized
companies perform significantly better than fully public owned companies in the
developing country of Indonesia found out that private owned companies had higher levels
10
of performance than those fully owned by the government. The study also established that
there were significant differences in financial leverage, firm size, assets‐in‐place, financial
statement reliability, and industry variances between private companies and public owned
companies.
2.2.2 Liquidity
Liquidity is the ability of a company to pay its short term obligations (Bachiller, 2017).
Liquidity ratio usually evaluates the incurred liabilities of a company and the assets it has
to cover them. Example of liquidity ratio is the current ration which is calculated by
dividing current assets by the current liabilities. Privatization improves the liquidity of the
company. When the company is public owned, the government is always liable for the debts
and therefore the managers don’t mind whether the company performs well or not (Clark,
Munro, & Sumaila, 2010). This is what explains well the difference between balance sheet
of public and private owned companies. Private companies have high levels of liquidity
compared to public companies (Vo, Swierczek, & Nguyen, 2013).
A research done by Huang, Watson and Chen (2013), to investigate the relationship
between privatization and share market capitalization, liquidity and share ownership found
out that privatizations considerably increased share market capitalization and had impact
on the market liquidity. In general, anyone investing in privatized companies' portfolios
should receive higher returns than investing in public company`s portfolio (Kerr & Qiu,
2007). As the managers of privately owned companies are more focused than those of
private companies, the liquidity ratio increases as they are accountable for anything which
transpires in the company (Arcas & Bachiller, 2010). A study done to analyze how
privatization influenced corporate culture and employee wellbeing in the privatized
companies revealed that although, the employees were pressurized in private companies,
privatization prepared them to a change in corporate culture and also reduce work place
stress. In addition, corporate culture changed the employees towards a greater emphasis on
performance and people orientation and on organizational integration (Cunha & Cooper,
2002).
2.2.3 Efficiency in Operations
Efficiency in firms operations results from good management of the firm. Most public
companies suffer from inefficiency due to poor management. Bachiller (2009) did a
11
research on the impact of privatization on the efficiency of five of the biggest Spanish state‐
owned companies and found out that the improvements in efficiency were related to the
privatization. Public owned firms faced challenges of inefficiency in operations and
therefore decreased profits and the government of Malaysia decided to privatize those firms
and by the end of two years the companies started yielding profits (Linz & Rakhovsky,
2011). Another study by Hidalgo-Gallego, Román and Núñez-Sánchez (2017) about
Allocative Efficiency in Airports for a Pre-Privatization Period found out that in the initial
period, when the government encouraged decentralized management of airports and
privatization of the largest airports, allocative efficiency improved from 2009 to 2012. In
addition, during the second period when the government focused on centralized airport
management and privatization of the system as a whole from 2012 to 2014, inefficiencies
slightly increased again.
Ownership of company greatly influences the performance of a company. A study done to
examine the effects of ownership on companies` performance in Malaysia revealed that
private owned companies performed better than government owned companies due to
efficiency in operations (Fauzi & Musallam, 2015). A study done by Tiemann and
Schreyögg (2012) about Changes in hospital efficiency after privatization found out that
the efficiency gains after a conversion to private for-profit status were achieved through
substantial decreases in staffing ratios in all analyzed staff categories with the exception of
physicians and administrative staff. Type of ownership can affect efficiency of operations
in companies. Arocena and Oliveros (2012) did a research to establish if the type of
ownership makes any difference in the efficiency of firms. The study found out that the
efficiency of newly privatized firms significantly increased after their privatization, while
private competitors showed no significant improvement during the same post-privatization
period.
2.2.4 Company Leverage
Leverage is the ability of the firm to meet its obligations whether long term or short term
(Hutton et al., 2012). It gives an overview on how likely the company will be able to meet
its obligations. It usually gives an overview of the relationship between finances provided
by owners of the company and the ones provided by the creditors of that company
(Paramasivan & Subramanian, 2009). Privatization of companies leads to decreased debts
because the government will not be liable again. A study done in large US companies to

12
investigate their capital structures established that private firm capital structure is not
measured by leverage but also the issuance of specific debt instruments (Adrian &
Boyarchenko, 2018). Leverage, debt type usage, and debt specialization are dynamic and
strongly related to observable firm characteristics and industry characteristics are strong
determinants of leverage levels and debt specialization (McCumber, 2015).
Relationship of employees and management of company also influences the level of
leverage. A research by Wieland and Flavel (2015), to investigate the relationship between
employee orientation and both financial performance and leverage found out that
investments in employee-orientated activities, such as career opportunities, and secondary
benefits and work–life balance, lead to improved financial performance. A study done by
Ims and Seiffert (2015) on the effects of post-privatization government divestments on the
financial and operating performance of state owned enterprises in Scandinavia found out
that Leverage levels increased, while capital investment, dividend payouts and employment
levels decrease as the state divested its shares.
2.2.5 Dividend Payout
Dividend in private companies increase because investors demand their dividend payments
to be paid and this therefore improves concentration of managers and their employees
(Ohemeng & Grant, 2008). Newly privatized firms increase dividends and also pay
significantly higher dividends compared to public firms. A study done across 26 in US
countries showed that the dividend premium is significantly positively related to new
agency costs induced by privatization and is associated with levels of increased operating
efficiency and higher earnings (Baker, Chang, Dutta, & Saadi, 2012).
Private companies usually pay dividends so as to maintain Return on Equity (ROE) rather
than accumulating excess assets in the company (McCumber, 2015). Accumulation of
excess assets dampens returns for all owners, so dividends help shareholders with current
returns and the maintenance of acceptable returns going forward. A study done at
Australian firms revealed that returns tend to be large if no dividends are paid and then
decrease with the dividend payout ratio (Li, 2016). Another study in China found out that
momentum profit is the largest for the stocks that do not make dividend payment but appear
similar for the stocks that pay dividends and that stock momentum tends to be much
stronger than value stock momentum and no dividend stock momentum beats dividend
stock momentum (Zhang, 2013).
13
Another reason why private companies pay dividends is to provide shareholders with
regular returns. The most important determinants of a firm’s dividend policy are the level
of current earnings, stability of earnings, and needs of current shareholders (Baker &
Jabbouri, 2016). A study done to investigate the factors influencing dividend policy,
dividend issues, and explanations for paying dividends in Moroccan firms and those of
USA, Canadian, Indonesian, and Indian firms found out that dividend policy affects firm
value Managers viewed multiple theories including signaling, agency, catering, and life
cycle explanations as credible and contribute in explaining why their firms pay dividends
(Anastassiou, 2017).
2.3. Performance of Firms after Privatization
2.3.1 Profits
Few studies have examined the functioning and financial performance of freshly privatized
corporations in developing countries. A study done by Alipour (2013) to evaluate the gains
or losses resulting from the privatization of 12 firms operating mostly in non-competitive
marketplaces in 4 countries which included Chile, Malaysia, Mexico and United Kingdom.
They found net welfare gains in 11 of the 12 cases. Productivity improved in 9 of the 12
cases and stayed unchanged in the other three. The study established that no case in which
employees lost completely from privatization. They appealed that the results offered
evidence in sustenance of net welfare gains even when they strained to isolate the effect of
privatization from the effects of other factors like changes in market structures and in
macroeconomic situations.
In contrast, a done by study by Arcas and Bachiller (2010) to compare the pre- and post-
privatization financial and operating performance for 61 companies from 18 countries over
the period between 1961 and 1990 found out that there was a prove or evidence that, after
privatization, the firms became more profitable, improved their real sales and their
investment expenditure and enhanced their operating efficiency. In addition, the firms
significantly decreased their debt levels and improved dividend payments. More
unexpectedly, they found that no proof that employment levels decreased after
privatization. As an alternative, they reported a growth in the mean and median
employment and they discovered that 64 percent of the companies hired more workers after
privatization. Privatization of public companies makes the managers to be focused on
creating more profits as they are the ones responsible to the shareholders in case the

14
company makes losses (Winston, 2010). A study done to investigate the effect of
privatization on corporate entrepreneurship in Telecommunication Company of Iran found
out that after privatization, the company acts more entrepreneurially and becomes
aggressive in competition through entering competitive markets and increasing risk taking
to develop new services, products and processes (Zarei, Amanati, & Amanati, 2017).
Government owned firms comprise of a large and speedily growing sector of the economy
in most of the countries in the world (Obadan, 2008). He further argued that there are many
reasons which included organizing industrialization in the countries with small sacle
industries, promotion of industries seemed to be of importance, creation of lines of tasks
with inadequate incentives for private investments, establishments of projects which need
large amounts of capital, unable to raise privately in the current structure of capital markets,
securing of the threatened jobs, prevention of foreign firms, expansion of the public sector,
raising of more capital for the government, elimination of monopoly power over strategic
firms, reduction of prices of goods and services especially for the poor customers and for
other political or social reasons.
2.3.2 Operational Efficiency
Chari (2015) did a study in 75 newly privatized companies in 21 developing countries that
experienced full or partial privatization between 1980 and 1992. The study compared
operating efficiency, capital investment, actual sales, entire employment and dividends.
Furthermore they used both raw and market accustomed performance measures so as to
segregate the effect of privatization from the effect of macroeconomic changes on the
financial and operating performance of government owned firms. Performance of
government owned firms had been poor as observed by (Augustyniak, Brooks, Rinaldo,
Bogner, & Hodges, 2015). Specifically, financial rates of return had been generally lower
for government enterprises compared to the private sector, financial profitability of the
firms had been affected by price controls, government firms had over and over again put
large burdens on government budgets, government firms influenced the intensification of
the external debt in most developing countries and countries in which government firms
accounted for higher shares of gross domestic investment which led to lower rates of
economic growth (Wieland & Flavel, 2015).
According Domney, Wilson and Chen (2015), several reasons led to the poor performance
of government firms and one of the reasons was lack of incentives to the management.

15
Some countries used performance bonuses or sharing of profits to motivate the top
management. Other countries managers were made to be part of the civil service so that
they can work hard. Even where they were not part of profit sharing and being part of the
civil service, their pay was lower compared to the one of private sector (Maude, 2014).
Despite the prestige and difficulty of managing what were often the biggest corporations in
the country, would occasionally reimburse for lower pay, low salaries tended to discourage
experienced managers and therefore increased employee turnover (Crump, 2011).
Lesorogol (2010) did a study to compare pre- and post-privatization financial and operating
performance of 85 companies in the period between 1990 to 1996. The study compared
output, operating efficiency and dividend payments. The findings of the study were that
profits, outputs, operating efficiency and dividend payments increased significantly and
leverage ratios decreased immediately after privatization. Shortage of skilled managers was
another cause for the poor performance in government firms as observed by (Baggiarini,
2015). He argued that the increasing number of government firms in most of Sub-Saharan
African and other countries, led to a chronic deficiency of management. This shortage was
sometimes worsened by program for speedy indigenization. Majority of senior posts were
left vacant and filled by unqualified employees. The organization therefore became too
reliant on its principal executive. The shortage of managers also led to a high rate of
employee turnover as experienced people were shifted around to lead the disturbed
government firms (Bjørnskov and Potrafke, 2011). In addition, the countries who had
shortage of managers changed the managers of state owned firms with damaging frequency
as the selection of top management was based on nepotism and political patronage.
2.3.3 Industry Competition
The other reason for poor performance of government owned firms was due to lack of
competition in the industry. According to Bortolotti and Siniscalco (2014), many
government firms were monopolies producing goods and services that were never traded
globally or that the government desired to manufacture domestically for national security
purposes. In other cases the economy was very small to maintain another domestic
manufacturer. Similarly, managers were not given preference to respond to competitive
pressures which would mean decreasing staff or termination loss-making service (Chari,
2015). Libby, Libby, Short, Kanaan and Sterling (2017) found insignificant changes in the
capital expenditures to sales measures in the post privatization. The study concluded that
16
privatization improved the financial and operating performance of freshly divested firms
and these improvements were the outcomes of socially advantageous perfections in
production efficiency and entrepreneurial effort and that privatization worked in a wide
variety of countries, industries and competitive environments.
An additional contribution to poor performance Mládek (1997) noted, that there was the
little weight put on profitability and efficiency by governments. The government firms were
not instructed to optimize profits or even to decrease costs since fine-tuning administered
prices typically comprised of practical and political difficulties. Additionally, government
owned firms were frequently required to perform non-commercial activities such as
employing extra staff to increase employment in a specific area to improve regional
development to achieve diversification. These contradictory goals often decreased profits
(Ohemeng & Grant, 2008).
According to United States, Hanford Site Wash, United States, Kelly and Fh (2014), only
a few countries made use of organized public pressure as a method of improving the
efficiency of government firms. Governments firms rarely took an action to eradicate
inefficient managers of these firms. Additionally, governments were hardly prepared to use
the authorization of liquidation. This lack of operational accountability led to poor
performance by the government firms. Different government agencies interfered with
government enterprises decisions that were a privilege to the management (Haugen &
Musser, 2011). Also, the management failed to coordinate their actions as they had no
control over them. Policy that fluctuated between autonomy and central control could
prevent intelligible direction of government firms. Many efforts to reduce illogical
interference by government had become counterproductive, replacing one form of
bureaucratic involvement for another.
2.3.4 Internal Management Systems
In many developing countries the internal management information systems of government
firms were lacking or non-existent, noted World Bank (1991). The companies were not
audited according to uniform standards. This was due to lack of a trained body practitioners
and qualified accountants as well as lack of active plans designed to focus efforts on
improving efficiency and monitoring results. Government firms were frequently expected
to contribute to the wide-range goals of government policy. The outcomes could be
perverse. For instance, public enterprises' prices could be controlled to benefit the poor or
17
to assist counter-inflationary policies. But these firms' consumers were often large
industrial users or wealthy people, so they did not benefit the poor most. It is estimated that
three-quarters of the energy and food subsidies in Egypt went to the relatively more affluent
urban areas and about two-thirds of these went to the richer half of the urban population,
observed World Bank.
According to Kay et al., (1986) the main goals of privatization could be summarized
therefore: the reduction of the state sector; promotion of wide share ownership; greater
efficiency within privatized entities, coupled with profit motivated decisions; raising
revenue for the government; reduced government interference, increasing speed of decision
making; introduction or enhancement of competition; exposure to the disciplines and
opportunities of private sector markets for capital and other resources. These objectives
needed not be equally important for all state-owned enterprises. Also, these goals were not
mutually exclusive. Obviously, the government in each country needed to consider local
factors and individual industry circumstances in determining the mix of goals (In Merino,
2014).
2.4. Measures of Improving Privatization Process
2.4.1 Conducive Environment
Government should provide Conducive environment to encourage competition. New
Zealand, Britain, Mexico, and Chile have been successful privateers and the reason behind
their success was that their governments provided Conducive environment which
encouraged competition (Naito, 2013). Another example of successful privatization is in
Chille as the efficiency of operations improved. In the implementation of privatization in
Chille, it first sold the public companies to the large banks. The banks subjected themselves
to risks by giving loans to their own companies when Chille suffered a crisis almost the
same as United States savings and loan crisis. Privatization works well when the programs
are put in place to create an environment which improves efficiency (Haugen & Musser,
2011). Programs may include encouragement of competition through export, price reforms,
regulatory reforms safeguarding competition by removing obstacles to private entry and
exit; and legal reforms assuring proper disclosure, enforcement of contracts, and due
process.
Improved performance of private companies is not effective enough unless other factors
like regulations are considered (Haugen & Musser, 2011). A study at china found out that,
18
Performance improvement of privatized firms cannot be taken for granted merely by
ownership change; instead, the performance gains of privatization could be realized only
in concert with other institutional arrangements, including market openness, the modest
and short‐term bureaucratic control after privatization, and corporate health prior to
privatization (Wu, 2007). For a firm too compete in the global economy, they must become
more efficient, more flexible and, above all, more customer‐oriented (Chaurasia, Garg, &
Agarwal, 2016). The competitive edge of firms is determined not only by their own
strategic choices, but also by what their respective governments do in terms of providing a
supportive infrastructure that helps them compete (Halachmi, 2002).
2.4.2 Government Policies
Government policies should be in a position to favor private companies .They should be
free from political interference and should be handled by specialized professionals with a
full knowledge of how public sectors reform. Government interventions lead inevitably to
both cooperation and conflict with the private sector (Lam, 2016). After privatization it is
very important for the government to ensure that the personnel of the privatized companies
are well trained to ensure efficient management. Privatization process can be better only if
the procedures are not many and few requirements are needed. Mexico successfully sold
its public companies with only seven people carrying out the transactions (Lam, 2016).
Instead of relying on Mexican banks and international banks, the decision making was done
by the seven people while the cabinet secretary acted as government`s watchdog. Mexican
process of privatization was centralized and transparency was exercised and everything was
explained well on how and why the privatization was done. Determining the value of a
public company is usually very difficult and that is why government engages an expert to
give an advice (Naito, 2013). Even in developed countries like Canada face the challenge
of assessing the value of their public companies even after engaging experts
2.4.3 Long Privatization Process
Privatization process in Kenya is usually very long. A good example is the case of the five
government owned sugar factories in Kenya. These factories were embarked on
privatization program and approved by cabinet in the year 2008 and debts written off by
parliament. The purpose of privatization was to transform the industry towards commercial
orientation and injection of new capital from the private investors. However, the
Parliamentary Departmental Committee on Finance, Planning and Trade passed a
19
resolution on 9th January, 2013 “that the privatization of the public Sector Sugar
Companies should be postponed until such a time when all legislation affecting the
Agriculture Sector (sugar) and the County Governments have been put in place”. In order
to kick start the privatization process, the approval of the Parliamentary Committee on
Finance, Planning and Trade is required. The process is already 9 years old since the
privatization began and this can lower the demand of the private investors.
Arcas and Bachiller (2010) argued that governments are good in streamlining firms before
privatization by enhancing the trustworthiness of the process. This trustworthiness view is
important in face of the huge political costs of labor streamlining (Arocena & Oliveros,
2012). This is because willingness to overcome worker resistance may be understood as an
indicator of commitment to change. Another view that supports preceding streamlining is
the social view whereby any social costs of streamlining, particularly labor-related
streamlining, may be solved adequately by governments. For example, by guaranteeing
payment of severance obligations and social safety net measures. Public sector may be in a
better position to bargain with the unions if the government has mechanisms to assist the
retrenched employees. The government can do so by re-educating employees, helping
employees to look for new jobs and paying good compensation (Baggiarini, 2015).
The government should make the public companies more attractive to the buyers so that
they can sell at a good price and investors to be happy to invest in a well-managed entity.
This can be achieved by eliminating debts from the company`s balance sheet (Chaurasia,
Garg, & Agarwal, 2016). Liabilities such as pension funds, claims for environmental
damage, are greater deterrents to privatization due to the inestimable scope of these
liabilities. Removal of these liabilities can be an added advantage to the company.
Government should try to retrench ghost workers and unproductive workers before
privatization (Spearin, 2005). Many buyers usually shy away from the public companies
where they must layoff some employees. Despite that unemployment can result from
privatization, it should not be seen as the bad side of privatization as it helps in cutting the
operational costs and therefore increased profits (Lam, 2016).
2.4.4 Compensation Benefits
When a public function is privatized the employees get paid less and lose benefits, but other
state agencies pick up the costs that occur when people get paid less. Private Managers and
executives get a big chunk of the savings and then there are the costs to the larger economy
20
from ever more people making less and less (Spearin, 2005). Government should prepare
employees for privatization by treating them fairly. Governments usually have programs to
compensate employees for job loss (Chaurasia, Garg, & Agarwal, 2016). These programs
include working within the rate of natural attrition, encouraging or requiring first
consideration by contractors, offering early retirement incentives and allowing public
departments to bid for contracts (Richardson, 1991).
The privatization program is likely to come under fire from various sections of the
community who may challenge the principle of transferring assets out of state control and
criticize the methods and terms of individual sales (Mahmoud, 2012). The government
should embark on a vigorous debate and educational programs focusing on the credible
reasons for privatization such as capital requirements and efficiency argument while
resolving the emotional and political rhetoric regarding Public ownership by offering shares
widely to the public (Lurie, 2018).
An important feature of a successful public offering is that the enterprise under offer must
be observed to be an attractive investment to the public (Alipour, 2013). As such, major
privatizations are no different from other major stock market floatation's and apart from the
special consideration of dealing with the government as a client, there are no fundamentally
different criteria for a privatization issue; the vendor and his advisor will be obliged to
follow the full requirements of securities legislation Profitability is a key criterion in an
assessment of a company suitability for a stock market floatation. In circumstances where
the government wishes to sell off operations which do not meet acceptable standards of
profitability, it may decide to make sale by private tender or by direct negotiation (Adrian
& Boyarchenko, 2018).
The privatization program would not succeed unless the directors of the enterprises not
only supporting the privatization approach in principle, but are also effective in selling the
investment to prospective shareholders (Bachiller, 2017). Since it is often the case that
public companies are run by representatives from political pressure groups rather than a
well-balanced group of directors drawn from the variety of skill bases demanded of a
typical successful company, the board of directors of these enterprises may need expanding
and be of sufficient standing. This is in order to give comfort and confidence to the in
vesting public, endorse the valuation and provide ongoing protection to the investors of the
new shareholders (Chari, 2015). In addition, the management team should be fully prepared

21
for the changes that follow from being in the private sector particularly for those companies
that are floated on the stock exchange. Management of companies being privatized would
be required to devote a substantial proportion of its time and effort in preparation for
privatization.
2.5. Chapter Summary
This chapter has reviewed the literature on the importance of privatization on the financial
performance of government firms, the challenges facing privatization in government firms
and the measures that can improve the challenges facing privatization in government firms.
Each specific objective has been discussed in detail. The next chapter which is chapter three
discusses the research methodology applied in the research.
22
CHAPTER THREE
3.0. RESEARCH METHODOLOGY
3.1. Introduction
Research methodology used in the study was discussed in this chapter. It included the
research design, population and sampling design, data collection methods, research
procedures and data analysis methods to be used in the study. This chapter ends with a
summary.
3.2. Research Design
Research design is an action or plan chosen to incorporate the different constituents of the
study in a logical way, certifying effective address of the research problem (Chari, 2015).
The researcher applied a quasi-experimental (event study) to carry out the study. An event
study conducted on a specific company looks at the changes in its stock price relative to
the news or event. A study on the overall market looks at the effects of the change in supply
and demand. The researcher used both event study and descriptive research design. Event
study was used to assess whether there are any abnormal or excess returns earned by
security holders accompanying specific events where there are an abnormal or excess
return. The researcher observed the pre and post-privatization performance of several
government firms that were privatized between 1991 to 2008.
Descriptive research design was used to explain in detail about the measures of improving
privatization in Kenya. According to Sekaran and Bougie (2009), descriptive studies are
used to gather information that explains the features of a population or event. This study
chose descriptive studies to aid in knowing the characteristics of the population and to
inaugurate all the facets of the study, to draw conclusions and recommendations of the
study grounded on the results and findings of the study. This study was guided by three
research questions which included Performance of Firms before Privatization, Performance
of Firms after Privatization and the Measures of Improving Privatization Process?
3.3. Population and Sampling Design
3.3.1. Population
Population is the total collection of components about which the researcher wishes to make
inferences (Cooper & Schindler, 2008). Target population comprises of all members of a
23
group of people where the researcher intends to generalize results of the study (Kuada,
2012). The target population of the study was the companies which were partially or
substantially owned by the government of Kenya but where the government ownership has
been diluted between 1991 and 2008. Population of the study comprised of 56 employees
in the management department. Primary data was collected from the employees in the
management department of the privatized companies.
3.3.2. Sampling Design
3.3.2.1. Sampling Frame
Sampling frame is a list of elements from which a sample may be drawn (Zikmund, Babin,
Carr and Griffin, 2013). The definition includes the purpose of sampling frames, which is
to provide a means for choosing the specific members of the target population to be
interviewed in the survey. The sampling frame consisted of the targeted population. The
sampling frame for this study was the 6 privatized government firms.
3.3.2.2. Sampling Technique
Sampling techniques include: judgment, simple random, stratified and cluster sampling.
Simple random sampling was used in this study so as to ensure that each element in the
population of an equal chance of being included in the sample.
3.3.2.3. Sample Size
Cooper and Schindler (2008), defined sample as a group of participants, events or records
consisting of a portion of target population, carefully selected to represent that population.
To get a sample size, the firm must been in operation for at least three years before
privatization and has continued in operation for three years after privatization. By use of
this method, only six firms were selected for review.
For the primary data, a sample size formula was used to get the sample size.
Sample size formula n= N/(1+N(e)^2, where
N=the population
n=sample size
e=margin of error, in this case 10%
24
n=56/ (1+ (56*0.1^2)) =56/1.56
=36
Therefore the sample size of the study was 36 employees from the management department.
3.4. Data Collection Method
There are two types of data and they include primary and secondary data (Adrian &
Boyarchenko, 2018). Primary data is the first hand information while secondary data is the
second hand information which is obtained from sources like magazines, journals and
tapes. The study made use of both primary and secondary data. Secondary data which
comprised of annual financial reports for the selected firms was used. Data forms were
designed to record all the key items for the period of six years. The data items listed were
able to provide necessary items to calculate various financial ratios such as return on
turnover, return on equity and return on total assets. The goal was to come up valid
empirical evidence on comparison of financial performance before and after privatization
of the selected firms.
This study used questionnaire to collect primary data. Questionnaire was developed by the
researcher based on the three research questions. The questionnaire included both open and
closed ended questions. The questionnaires had two sections: demographic information and
the measures of improving privatization process. Inferential statistics like correlation
analysis was. Supervisor of the study was consulted for more information.
3.5. Research Procedures
Before commencement of data collection, the researcher requested for data authorization
letter from the university. This was followed by requesting authority from the selected
companies to collect data. Pilot study of 3 companies was conducted to identify any errors,
ambiguities or any unclear information. Feedback from the pilot was used to correct or
remove any ambiguities in the questionnaire. The researcher booked appointments with the
managers in the companies to be involved in the study so as to enable faster collection of
data. The researcher was available to clarify any issue to the respondents. Respondents
were given enough time to fill their questionnaires. The questionnaires were accompanied
by cover letter from the university to assure that confidentiality was highly observed.
25
3.6. Data Analysis Methods
In this study the event was privatization. Financial data of six corporations in which the
Government disposed of its equity holding within the period, 1991 to 2008, was analyzed.
The analysis covered a period of three years before privatization and three years after
privatization for each of the chosen corporations. Descriptive statistics such as mean and
standard deviation were used to test the data for its ability to be relied upon for valid
conclusion. These tests were applied on all the data for the pre-privatization and post-
privatization periods at 95% significance level. SPSS was used to produce descriptive
statistics which was applied to come up with conclusions and generalizations about the
population.
Descriptive analysis is used to summarize large amount of data and uses techniques that
can be understood by the researcher and beneficiaries of the study. For the primary data,
the data was edited and analyzed using SPSS and excel software. Graphical and numerical
techniques were used to summarize the data. Percentages and frequency distribution tables
were also used to summarize the data .For easier interpretation, pie charts and graphs were
be used. Descriptive statistics used in the study were mean and standard deviation.
3.6.1 Model Specification
A multivariate regression model was used to provide a linkage between the Independent
variables to the dependent variable as follows;
Y =β0 + β1X1 + β2X2 + β3X3 + µ
Where;
Y = Financial Performance
X1 =Return on Turnover
X2 = Return on Total Assets
X3 = Return on Equity
µ = Error Term
26
3.7. Chapter Summary
Research methodology which was applied in carrying out the study has been outlined in
this chapter. The study applied descriptive research design. The population of the study was
the privatized government firms. The chapter has described in detail the research design,
population and sampling design, data collection methods, research procedures and data
analysis methods. Chapter four discusses the results and findings of the study.
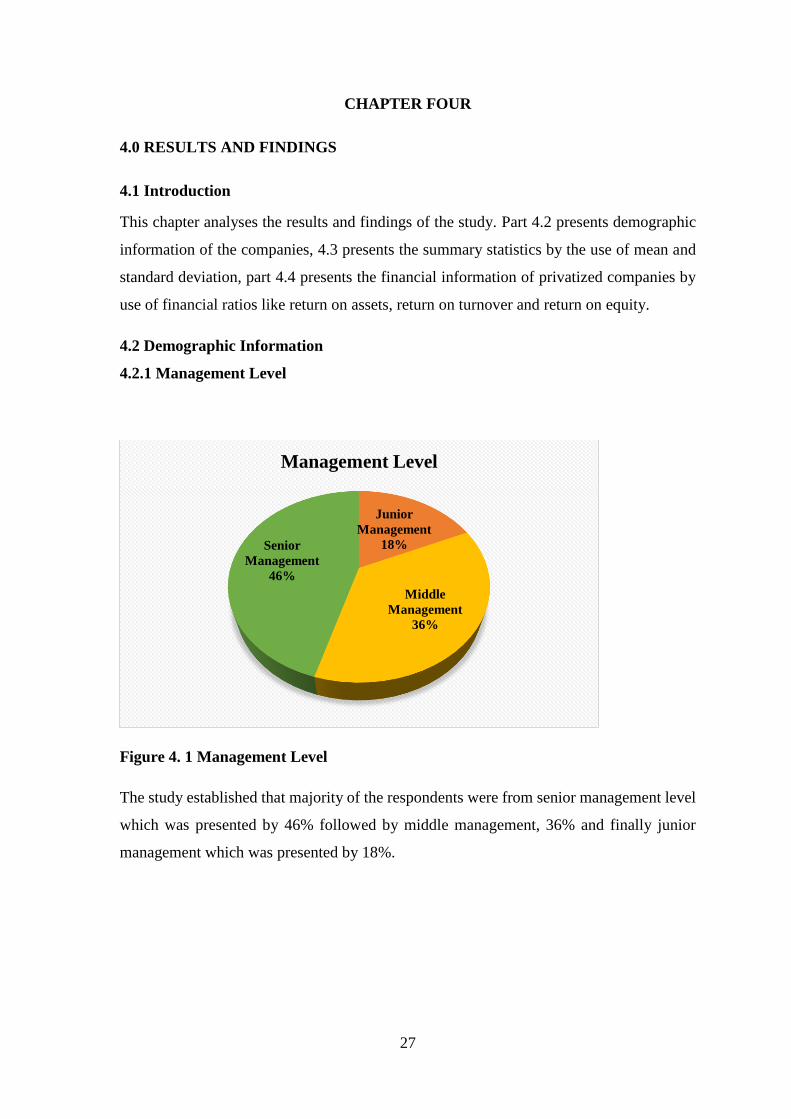
27
CHAPTER FOUR
4.0 RESULTS AND FINDINGS
4.1 Introduction
This chapter analyses the results and findings of the study. Part 4.2 presents demographic
information of the companies, 4.3 presents the summary statistics by the use of mean and
standard deviation, part 4.4 presents the financial information of privatized companies by
use of financial ratios like return on assets, return on turnover and return on equity.
4.2 Demographic Information
4.2.1 Management Level
Figure 4. 1 Management Level
The study established that majority of the respondents were from senior management level
which was presented by 46% followed by middle management, 36% and finally junior
management which was presented by 18%.
Junior
Management
18%
Middle
Management
36%
Senior
Management
46%
Management Level
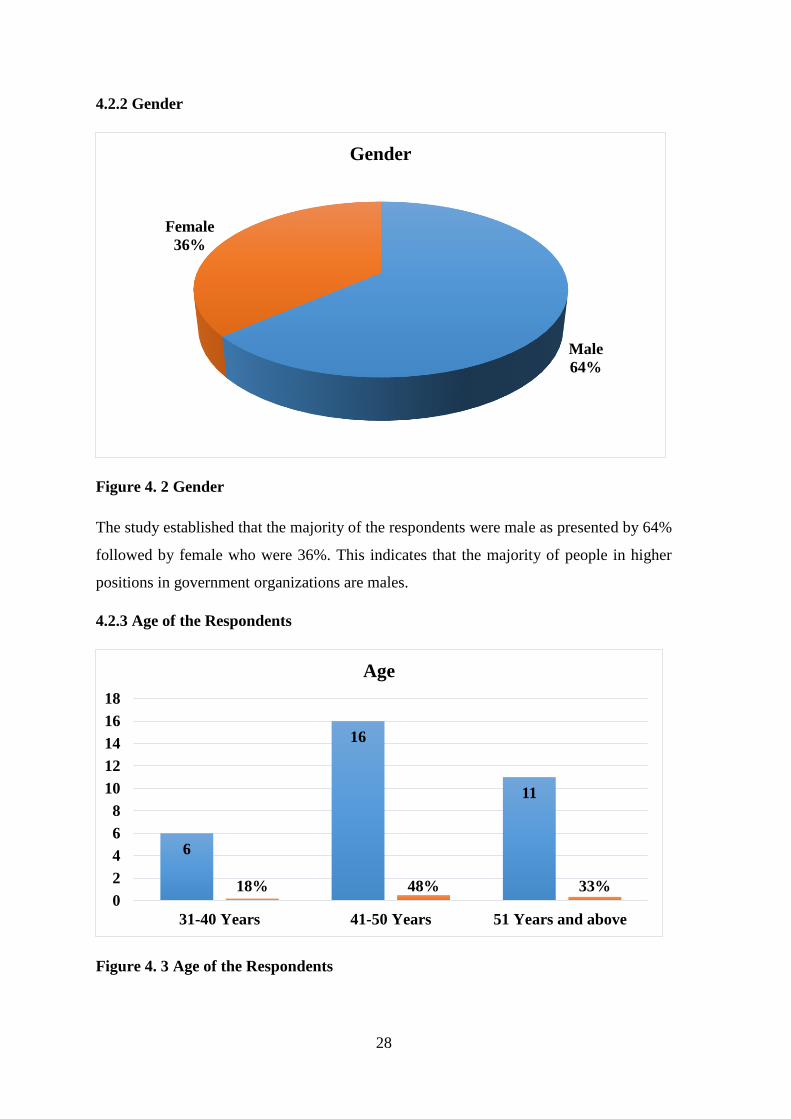
28
4.2.2 Gender
Figure 4. 2 Gender
The study established that the majority of the respondents were male as presented by 64%
followed by female who were 36%. This indicates that the majority of people in higher
positions in government organizations are males.
4.2.3 Age of the Respondents
Figure 4. 3 Age of the Respondents
Male
64%
Female
36%
Gender
6
16
11
18% 48% 33%0
2
4
6
8
10
12
14
16
18
31-40 Years 41-50 Years 51 Years and above
Age
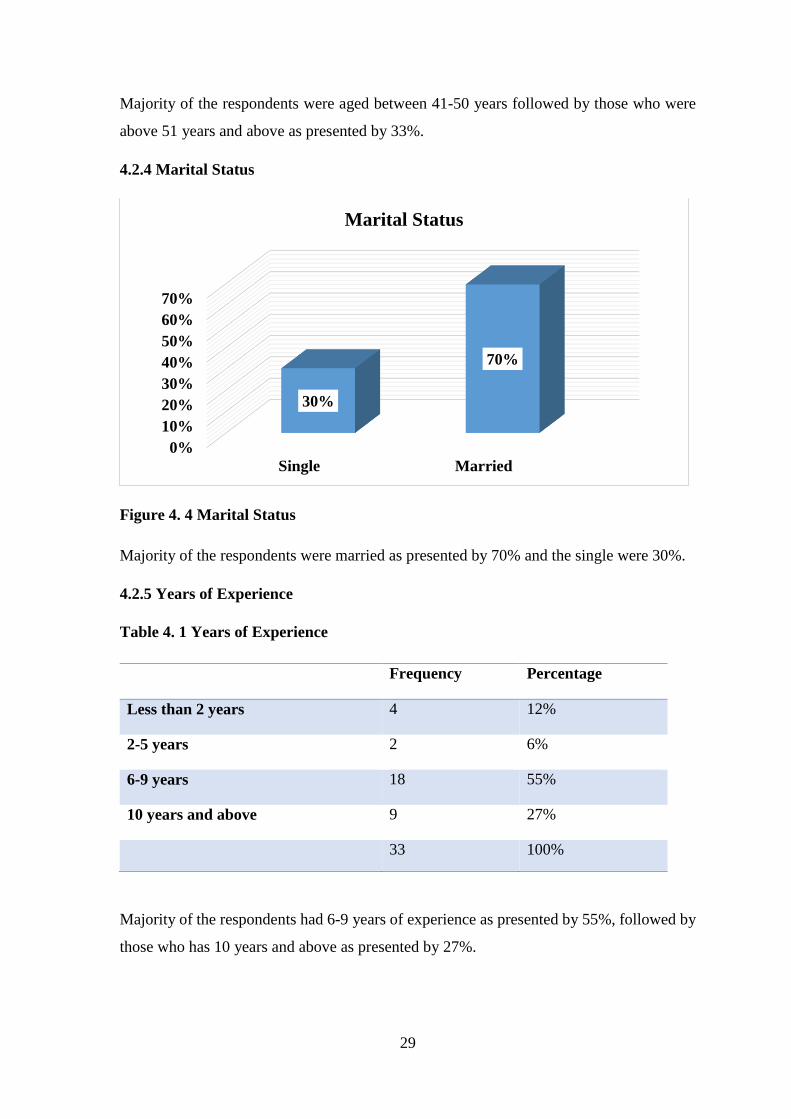
29
Majority of the respondents were aged between 41-50 years followed by those who were
above 51 years and above as presented by 33%.
4.2.4 Marital Status
Figure 4. 4 Marital Status
Majority of the respondents were married as presented by 70% and the single were 30%.
4.2.5 Years of Experience
Table 4. 1 Years of Experience
Frequency Percentage
Less than 2 years 4 12%
2-5 years 2 6%
6-9 years 18 55%
10 years and above 9 27%
33 100%
Majority of the respondents had 6-9 years of experience as presented by 55%, followed by
those who has 10 years and above as presented by 27%.
0%
10%
20%
30%
40%
50%
60%
70%
Single Married
30%
70%
Marital Status
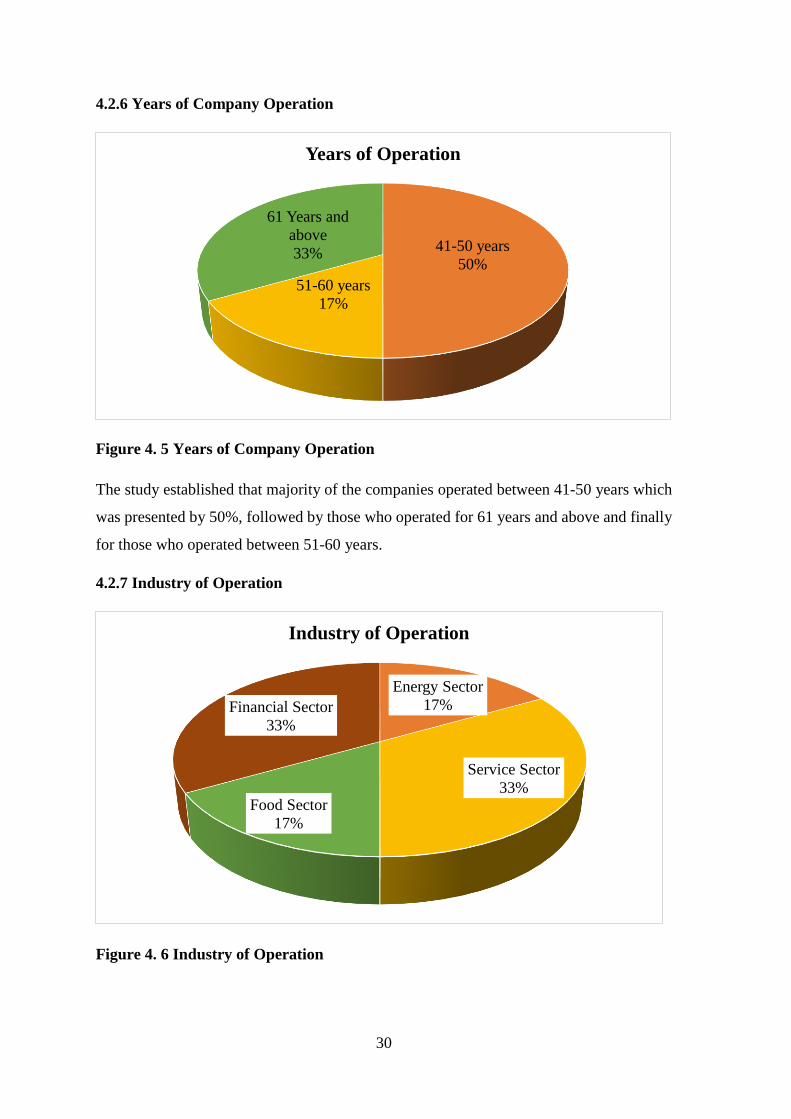
30
4.2.6 Years of Company Operation
Figure 4. 5 Years of Company Operation
The study established that majority of the companies operated between 41-50 years which
was presented by 50%, followed by those who operated for 61 years and above and finally
for those who operated between 51-60 years.
4.2.7 Industry of Operation
Figure 4. 6 Industry of Operation
41-50 years
50%
51-60 years
17%
61 Years and
above
33%
Years of Operation
Energy Sector
17%
Service Sector
33%Food Sector
17%
Financial Sector
33%
Industry of Operation

31
According to the findings of the study, 33% of the companies were in financial sector, 33%
service sector, 17% food sector and 17% in energy sector.
4.3 Performance of Firms before Privatization
4.3.1 Descriptive Statistics
All the companies in the study were analyzed as single units to determine effects of
privatization on the financial performance of government firms in Kenya. Mean and
standard deviation were calculated for the period before privatization.

32
Table 4. 2 Financial Performance before Privatization
Before Privatization
Company Year
Return
on
Turnover
(ROT)
Return
on Total
Assets
(ROTA)
Return
on
Equity
(ROE)
KENGEN
1 32 4 60
2 18 2 29
3 16 1 31
National Bank of Kenya
1 7 1 93
2 4 1 87
3 3.5 1 13
Kenya Airways Limited
1 -8.9 -13 -72
2 0 -1 -2
3 16.7 33 67
Kenya re-insurance corporation limited
1 20 4 32
2 26 7 50
3 11 3 25
Housing Finance Corporation of Kenya
1 16 0 55
2 30 1 24
3 16 1 14
Mumias Sugar Company Ltd
1 -2 -2 -14
2 0 0 -3
3 7.9 5 62
MEAN 11.84 2.67 30.61
STANDARD DEVIATION 11.69 7.81 38.27
The study established that the companies had a mean Return on Turnover (ROT) of 12.29
and a standard deviation of 11.69 for the first three years before privatization. The return
on assets for the companies had a mean of 2.67 and a standard deviation of 7.81 before
privatization. The mean of return on equity before privatization was 30.61 and standard
deviation was 38.27.

33
Figure 4. 7 Mean and Standard Deviation before Privatization
4.3.2 Financial Performance of the Privatized Companies Before Privatization
This section analyzes the financial performance of privatized companies individually using
financial measures such as Return on Turnover (ROT), Return on Total Assets (ROTA)
and Return on Equity (ROE) to measure financial performance before Privatization.
4.3.2.1 KENGEN Financial Performance before Privatization
4.3.2.1.1 Return on Turnover before Privatization
According to the findings of the study, Returns on Turnover three years before privatization
were 32, 18 and 16 while the returns on turnover after privatization were 17, 30, and 15.
Figure 4. 8 Return on Turnover for KENGEN before Privatization
0.00
11.84
2.67
30.61
0
11.69
7.81
38.27
0.00
10.00
20.00
30.00
40.00
50.00
60.00
70.00
80.00
1 2 3 4
Mean and Standard Deviation Before Privatization
MEAN STANDARD DEVIATION
32
1816
0
5
10
15
20
25
30
35
Year 1 Year 2 Year 3
ROT
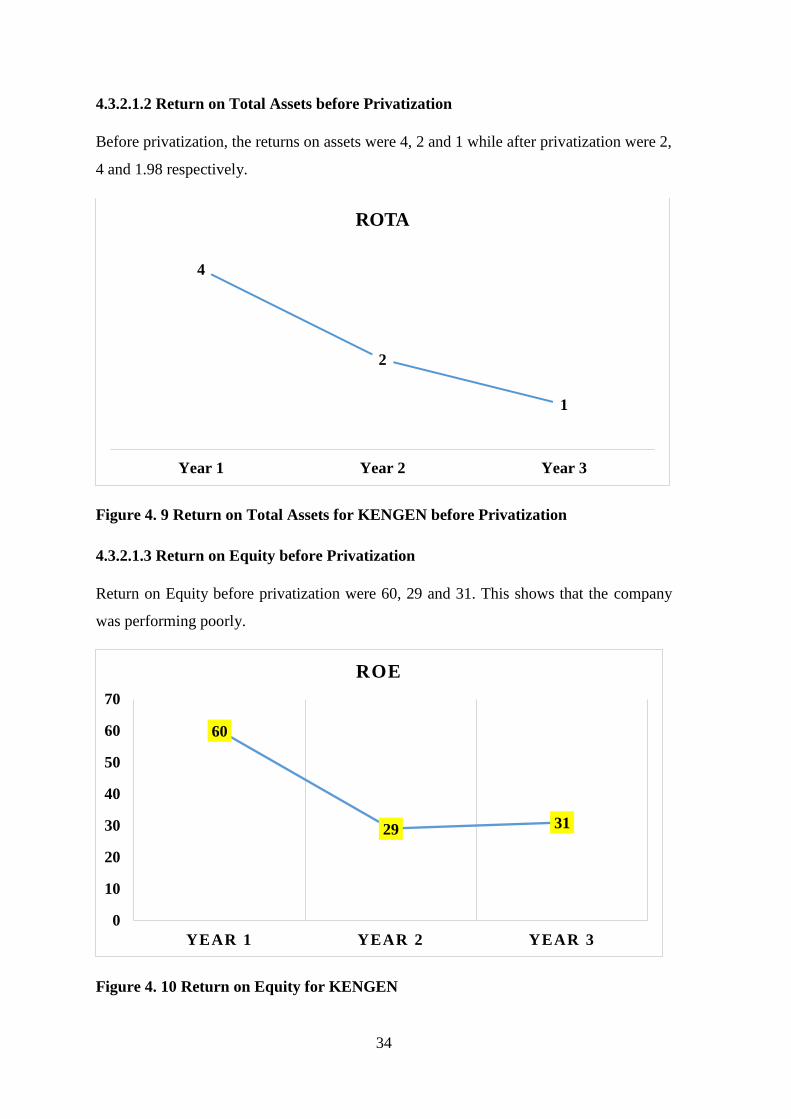
34
4.3.2.1.2 Return on Total Assets before Privatization
Before privatization, the returns on assets were 4, 2 and 1 while after privatization were 2,
4 and 1.98 respectively.
Figure 4. 9 Return on Total Assets for KENGEN before Privatization
4.3.2.1.3 Return on Equity before Privatization
Return on Equity before privatization were 60, 29 and 31. This shows that the company
was performing poorly.
Figure 4. 10 Return on Equity for KENGEN
4
2
1
Year 1 Year 2 Year 3
ROTA
60
29 31
0
10
20
30
40
50
60
70
YEAR 1 YEAR 2 YEAR 3
ROE
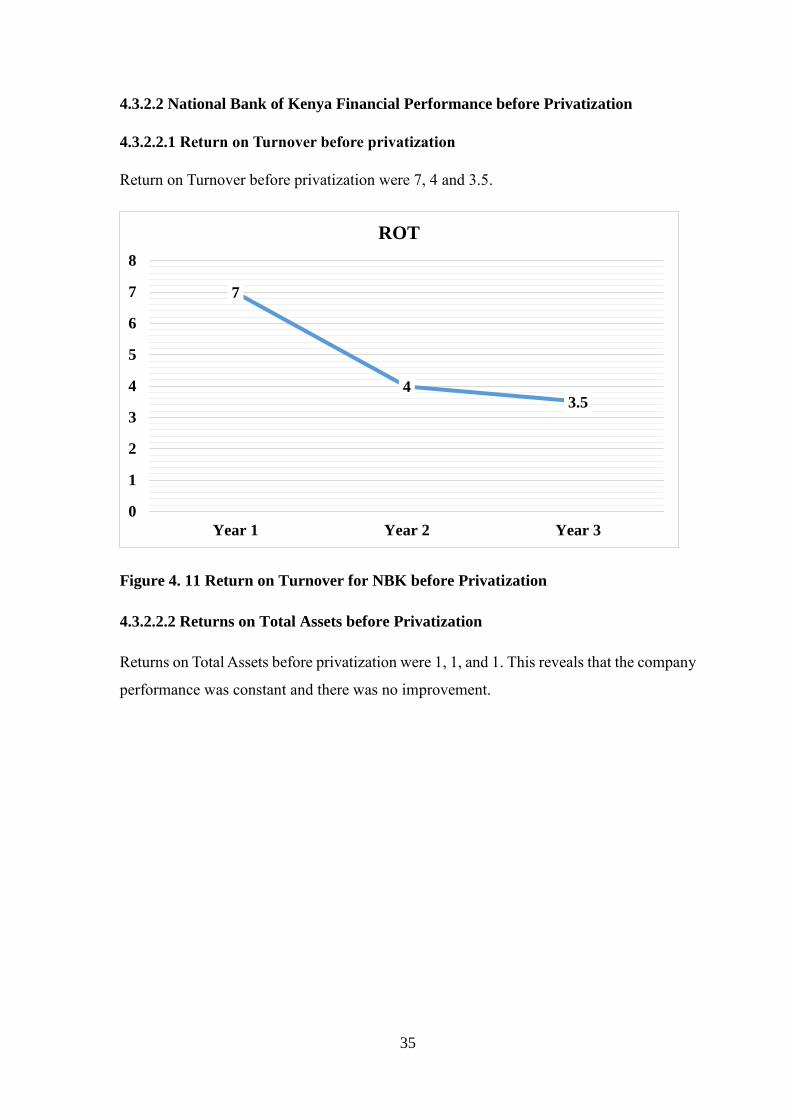
35
4.3.2.2 National Bank of Kenya Financial Performance before Privatization
4.3.2.2.1 Return on Turnover before privatization
Return on Turnover before privatization were 7, 4 and 3.5.
Figure 4. 11 Return on Turnover for NBK before Privatization
4.3.2.2.2 Returns on Total Assets before Privatization
Returns on Total Assets before privatization were 1, 1, and 1. This reveals that the company
performance was constant and there was no improvement.
7
43.5
0
1
2
3
4
5
6
7
8
Year 1 Year 2 Year 3
ROT
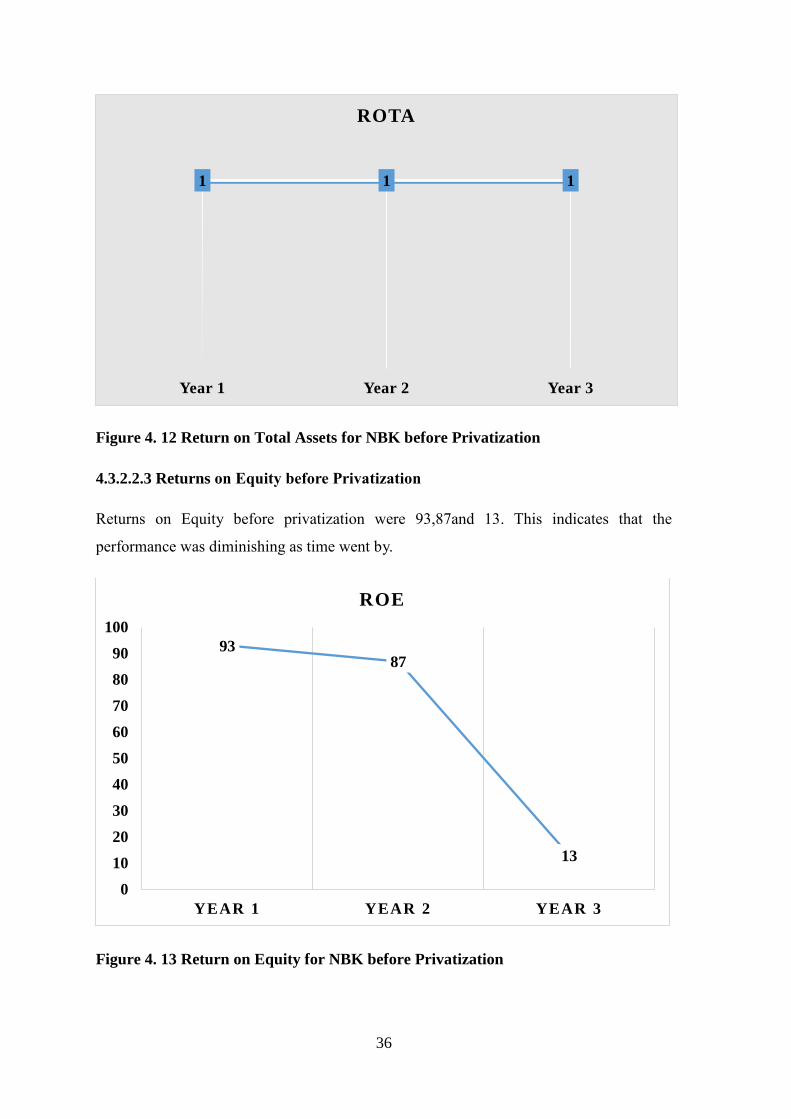
36
Figure 4. 12 Return on Total Assets for NBK before Privatization
4.3.2.2.3 Returns on Equity before Privatization
Returns on Equity before privatization were 93,87and 13. This indicates that the
performance was diminishing as time went by.
Figure 4. 13 Return on Equity for NBK before Privatization
1 1 1
Year 1 Year 2 Year 3
ROTA
9387
13
0
10
20
30
40
50
60
70
80
90
100
YEAR 1 YEAR 2 YEAR 3
ROE
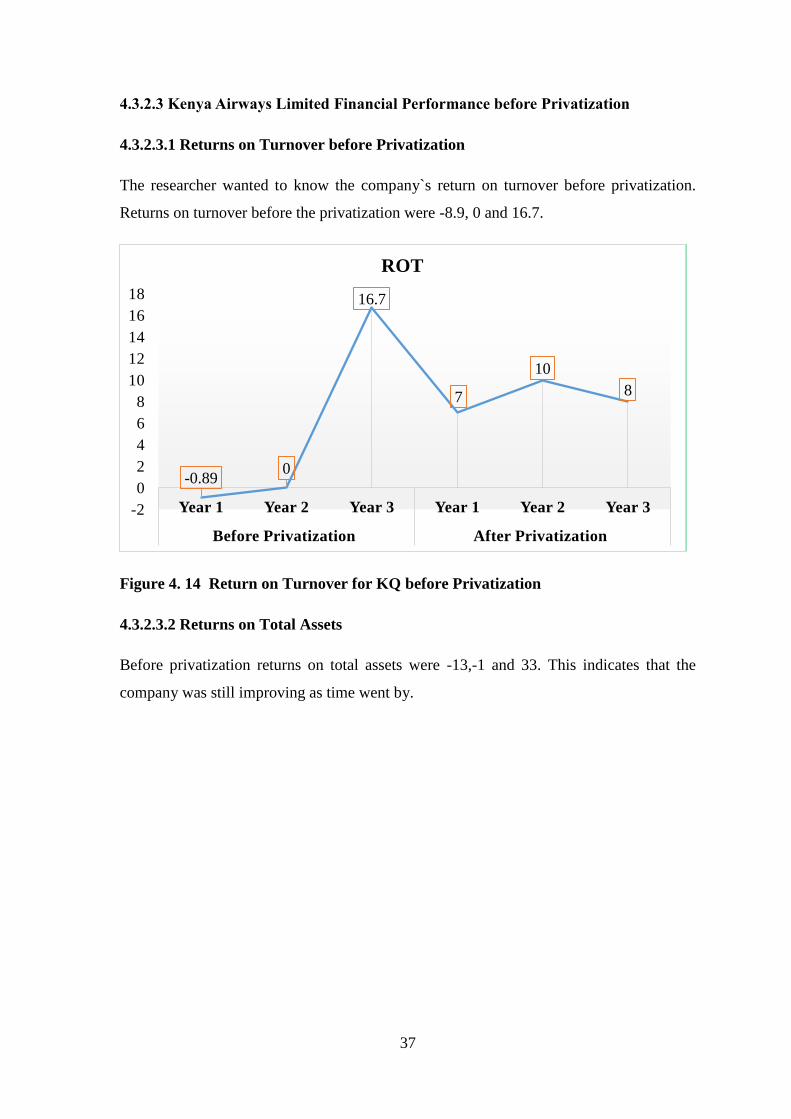
37
4.3.2.3 Kenya Airways Limited Financial Performance before Privatization
4.3.2.3.1 Returns on Turnover before Privatization
The researcher wanted to know the company`s return on turnover before privatization.
Returns on turnover before the privatization were -8.9, 0 and 16.7.
Figure 4. 14 Return on Turnover for KQ before Privatization
4.3.2.3.2 Returns on Total Assets
Before privatization returns on total assets were -13,-1 and 33. This indicates that the
company was still improving as time went by.
-0.890
16.7
7
10
8
-2
0
2
4
6
8
10
12
14
16
18
Year 1 Year 2 Year 3 Year 1 Year 2 Year 3
Before Privatization After Privatization
ROT

38
Figure 4. 15 Returns on Total Assets for KQ before Privatization
4.3.2.3.3 Return on Equity before Privatization
Return on equity before privatization were -72,-2 and 67. In the first two years the company
performed poorly but started improving in the third year.
Figure 4. 16 Return on Equity for KQ before Privatization
-13
-1
33
Year 1 Year 2 Year 3
ROTA
-80
-60
-40
-20
0
20
40
60
80
1 2 3 4
ROE

39
4.3.2.4 Kenya Re-Insurance Corporation Limited Financial Performance before
Privatization
4.3.2.4.1 Return on Turnover before Privatization
Returns on turnover before the privatization were 20, 26 and 11. This indicates that the
firm`s performance was declining with time.
Figure 4. 17 Returns on Turnover for Kenya Re before Privatization
4.3.2.4.2 Return on Total Assets
Returns on total assets before privatization were 4, 7 and 3 respectively. This means that
the firm was trying to perform better but the performance declined in the third year.
20
26
11
0
5
10
15
20
25
30
Year 1 Year 2 Year 3
ROT
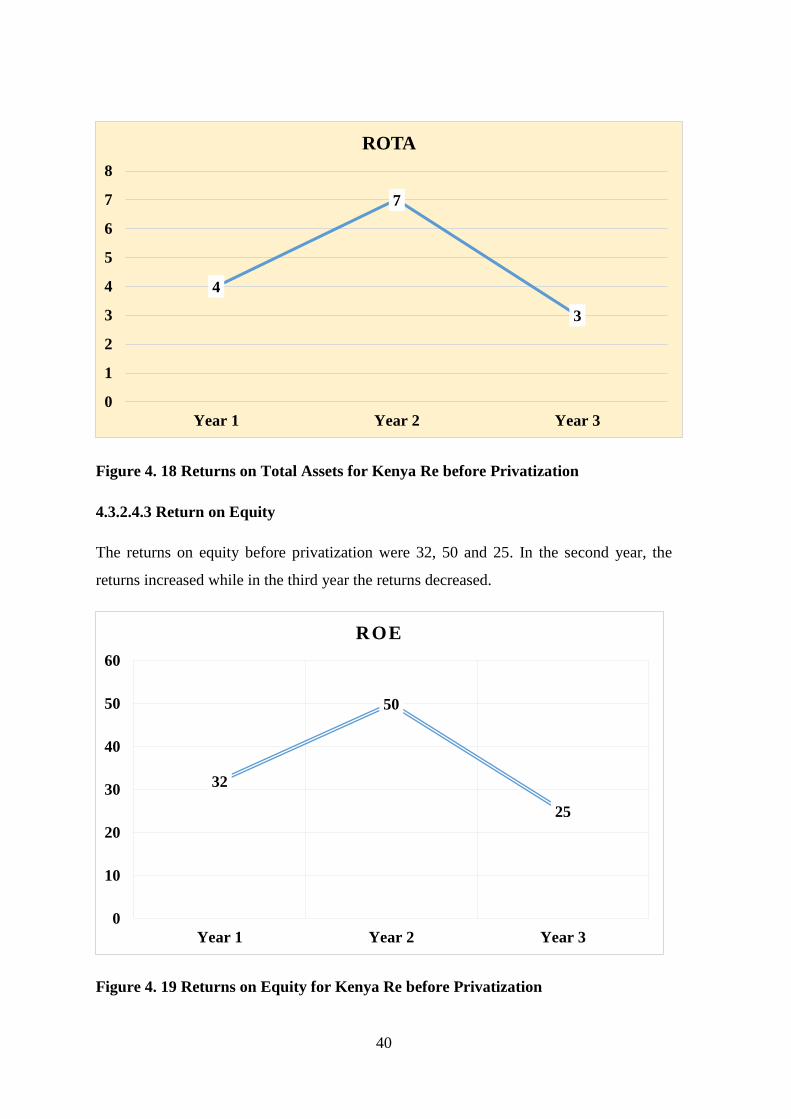
40
Figure 4. 18 Returns on Total Assets for Kenya Re before Privatization
4.3.2.4.3 Return on Equity
The returns on equity before privatization were 32, 50 and 25. In the second year, the
returns increased while in the third year the returns decreased.
Figure 4. 19 Returns on Equity for Kenya Re before Privatization
4
7
3
0
1
2
3
4
5
6
7
8
Year 1 Year 2 Year 3
ROTA
32
50
25
0
10
20
30
40
50
60
Year 1 Year 2 Year 3
ROE
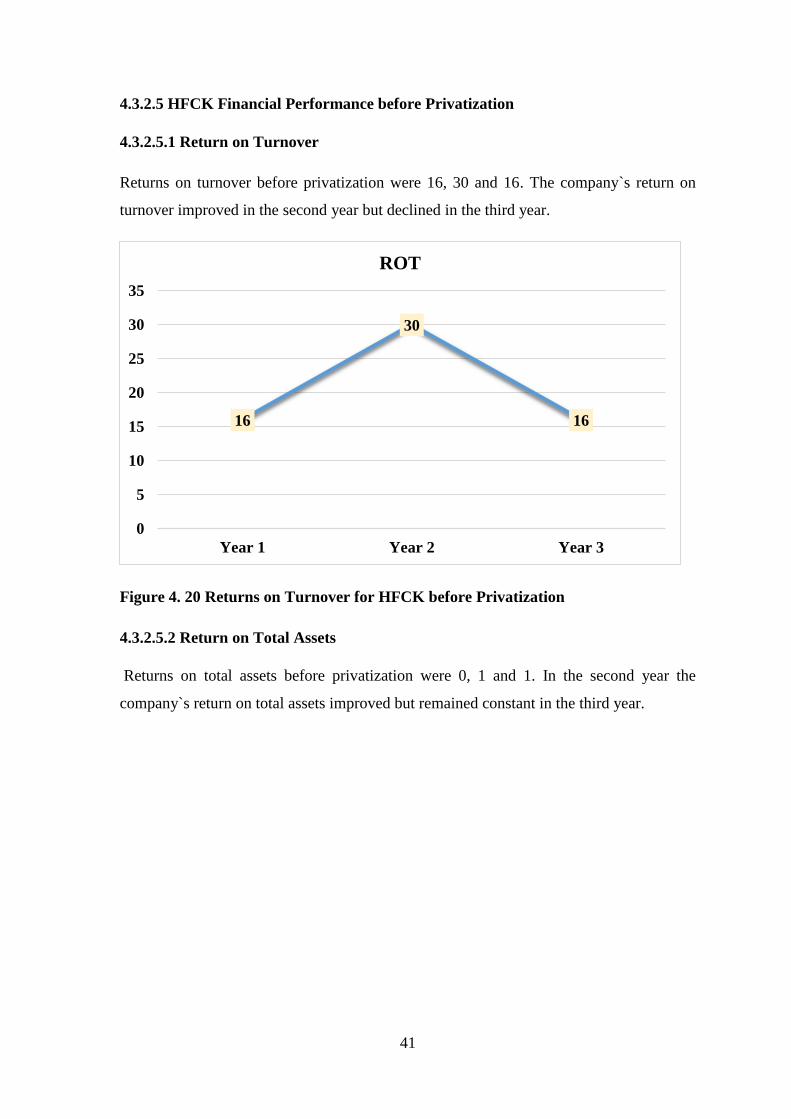
41
4.3.2.5 HFCK Financial Performance before Privatization
4.3.2.5.1 Return on Turnover
Returns on turnover before privatization were 16, 30 and 16. The company`s return on
turnover improved in the second year but declined in the third year.
Figure 4. 20 Returns on Turnover for HFCK before Privatization
4.3.2.5.2 Return on Total Assets
Returns on total assets before privatization were 0, 1 and 1. In the second year the
company`s return on total assets improved but remained constant in the third year.
16
30
16
0
5
10
15
20
25
30
35
Year 1 Year 2 Year 3
ROT

42
Figure 4. 21 Returns on total assets for HCFK before Privatization
4.3.2.5.3 Return on Equity
Returns on equity (ROE) before privatization were 55, 24 and 14 respectively. The returns
started declining from the second year and also the third year.
Figure 4. 22 Returns on Equity for HCFK before Privatization
0
1 1
0
0.2
0.4
0.6
0.8
1
1.2
Year 1 Year 2 Year 3
ROTA
55
24
14
Year 1 Year 2 Year 3
ROE

43
4.3.2.6 Mumias Sugar Company Ltd Financial Performance before Privatization
4.3.2.6.1 Return on Turnover
Returns on turnover before privatization were -2, 0 and 7.9. During the first year, the
company had nil returns on turnover but improved its performance in the third year.
Figure 4. 23 Returns on Turnover for Mumias before Privatization
4.3.2.6.2 Return on Total Assets
Returns on total assets before privatization were -2, 0 and 5 respectively. During the second
year, the company had nil returns on total assets but improved in the third year.
-2
0
7.9
-4
-2
0
2
4
6
8
10
Year 1 Year 2 Year 3
ROT

44
Figure 4. 24 Returns on Total Assets for Mumias before Privatization
4.3.2.6.3 Return on Equity
Returns on equity before privatization were -14, -3 and 62. The returns on equity kept on
fluctuating for the three years before privatization.
Figure 4. 25 Returns on Equity for Mumias before Privatization
-2
0
5
-3
-2
-1
0
1
2
3
4
5
6
Year 1 Year 2 Year 3
ROTA
-14
-3
62
-20
-10
0
10
20
30
40
50
60
70
Year 1 Year 2 Year 3
ROE
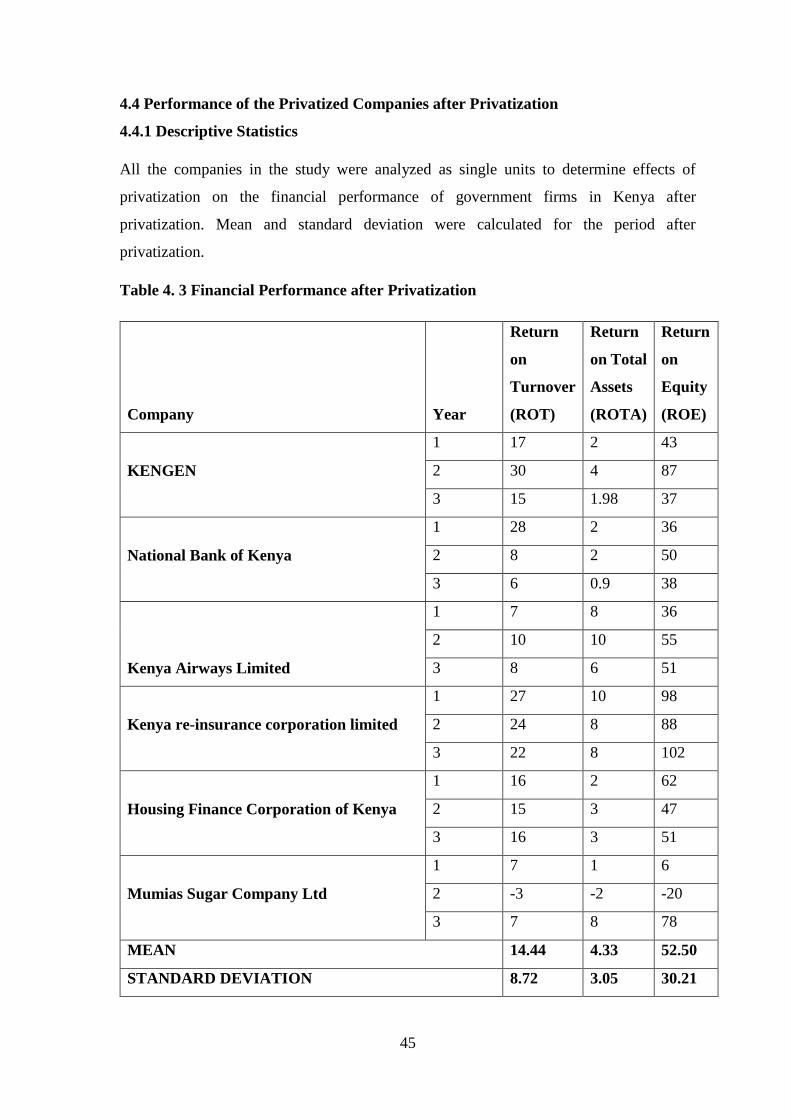
45
4.4 Performance of the Privatized Companies after Privatization
4.4.1 Descriptive Statistics
All the companies in the study were analyzed as single units to determine effects of
privatization on the financial performance of government firms in Kenya after
privatization. Mean and standard deviation were calculated for the period after
privatization.
Table 4. 3 Financial Performance after Privatization
Company Year
Return
on
Turnover
(ROT)
Return
on Total
Assets
(ROTA)
Return
on
Equity
(ROE)
KENGEN
1 17 2 43
2 30 4 87
3 15 1.98 37
National Bank of Kenya
1 28 2 36
2 8 2 50
3 6 0.9 38
Kenya Airways Limited
1 7 8 36
2 10 10 55
3 8 6 51
Kenya re-insurance corporation limited
1 27 10 98
2 24 8 88
3 22 8 102
Housing Finance Corporation of Kenya
1 16 2 62
2 15 3 47
3 16 3 51
Mumias Sugar Company Ltd
1 7 1 6
2 -3 -2 -20
3 7 8 78
MEAN 14.44 4.33 52.50
STANDARD DEVIATION 8.72 3.05 30.21

46
After privatization, the companies has a Return on Turnover mean of 14.44 and a standard
deviation of 8.72 respectively. The companies had a mean of 4.33 and a standard deviation
of 3.05. After privatization, the mean was 52.50 with a standard deviation of 30.21
respectively.
Figure 4. 26 Mean and standard deviation After Privatization
4.4.2 Financial Performance of the Privatized Companies after Privatization
This section analyzes the financial performance of privatized companies individually using
financial measures such as Return on Turnover (ROT), Return on Total Assets (ROTA)
and Return on Equity (ROE) to measure financial performance after Privatization.
4.4.2.1 KENGEN Financial Performance after Privatization
4.4.2.1.1 Return on Turnover
The study found out that in the first year after privatization, return on turnover improved.
0.00
14.444.33
52.50
08.72
3.05
30.21
0.00
20.00
40.00
60.00
80.00
100.00
1 2 3 4
Mean and Standard Deviation after Privatization
MEAN STANDARD DEVIATION

47
Figure 4. 27 Return on Turnover for KENGEN after Privatization
4.4.2.1.2 Return on Total Assets after Privatization
In the first year after privatization, return on total assets were low, rose in the second year
and fell again in the third year.
Figure 4. 28 Return on Total Assets for KENGEN after Privatization
17
30
15
0
5
10
15
20
25
30
35
Year 1 Year 2 Year 3
ROT
2
4
1.98
0
0.5
1
1.5
2
2.5
3
3.5
4
4.5
Year 1 Year 2 Year 3
ROTA
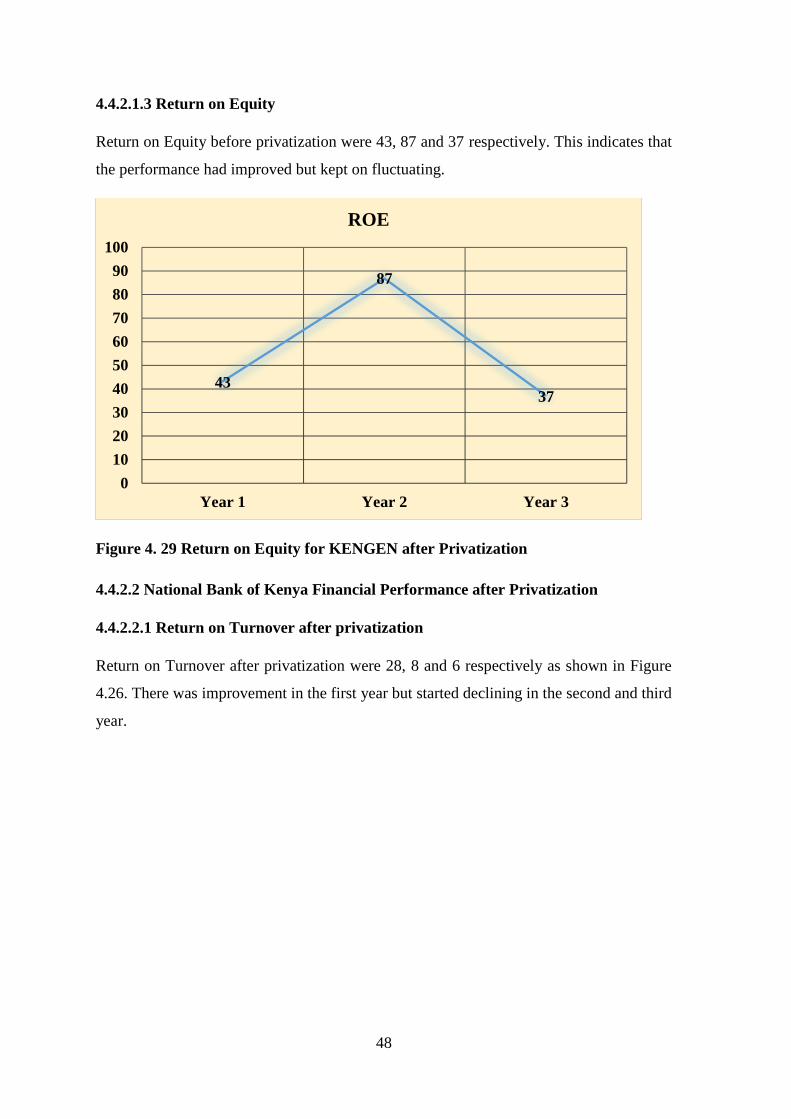
48
4.4.2.1.3 Return on Equity
Return on Equity before privatization were 43, 87 and 37 respectively. This indicates that
the performance had improved but kept on fluctuating.
Figure 4. 29 Return on Equity for KENGEN after Privatization
4.4.2.2 National Bank of Kenya Financial Performance after Privatization
4.4.2.2.1 Return on Turnover after privatization
Return on Turnover after privatization were 28, 8 and 6 respectively as shown in Figure
4.26. There was improvement in the first year but started declining in the second and third
year.
43
87
37
0
10
20
30
40
50
60
70
80
90
100
Year 1 Year 2 Year 3
ROE
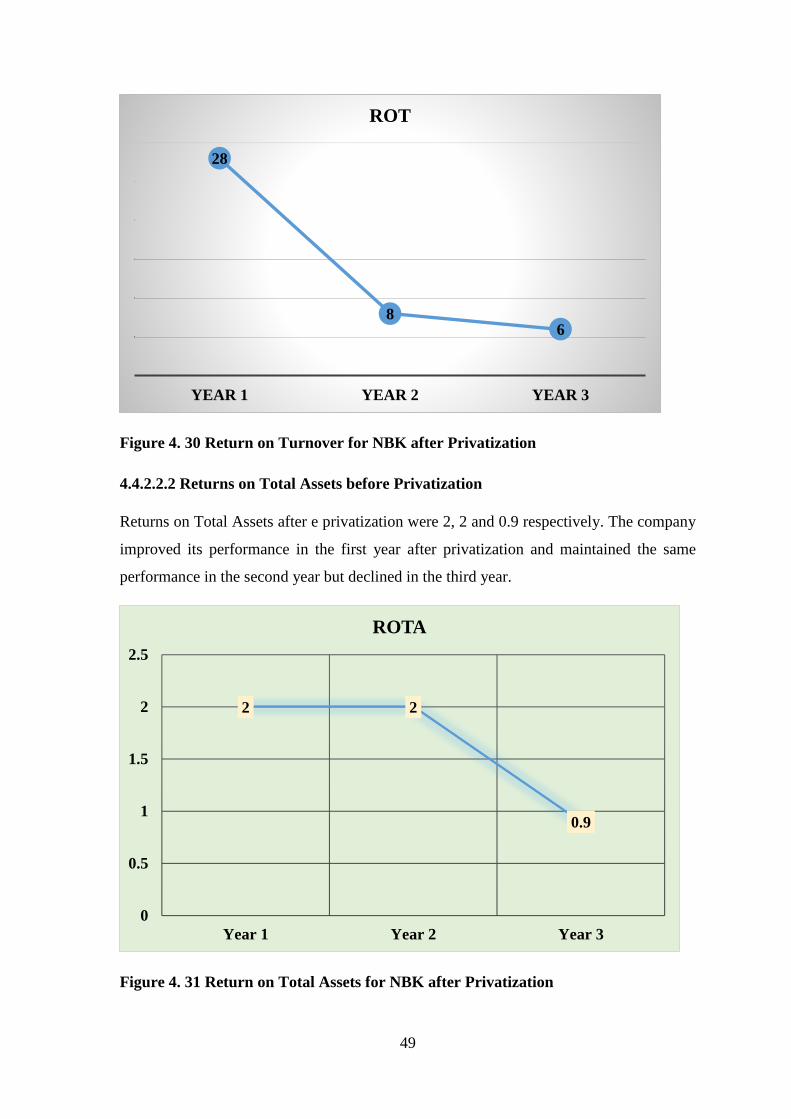
49
Figure 4. 30 Return on Turnover for NBK after Privatization
4.4.2.2.2 Returns on Total Assets before Privatization
Returns on Total Assets after e privatization were 2, 2 and 0.9 respectively. The company
improved its performance in the first year after privatization and maintained the same
performance in the second year but declined in the third year.
Figure 4. 31 Return on Total Assets for NBK after Privatization
28
86
YEAR 1 YEAR 2 YEAR 3
ROT
2 2
0.9
0
0.5
1
1.5
2
2.5
Year 1 Year 2 Year 3
ROTA

50
4.4.2.2.3 Returns on Equity after Privatization
Returns on Equity after privatization were 36, 50 and 38. In the second year after
privatization, the company performed well but the returns started declining in the third year.
Figure 4. 32 Return on Equity for NBK after Privatization
4.4.2.3 Kenya Airways Limited Financial Performance after Privatization
4.4.2.3.1 Returns on Turnover after Privatization
Returns on turnover before the privatization were privatization were 7, 10 and 8
respectively.
Figure 4. 33 Return on Turnover for KQ after Privatization
36
50
38
0
10
20
30
40
50
60
Year 1 Year 2 Year 3
ROE
7
10
8
0
2
4
6
8
10
12
Year 1 Year 2 Year 3
ROT
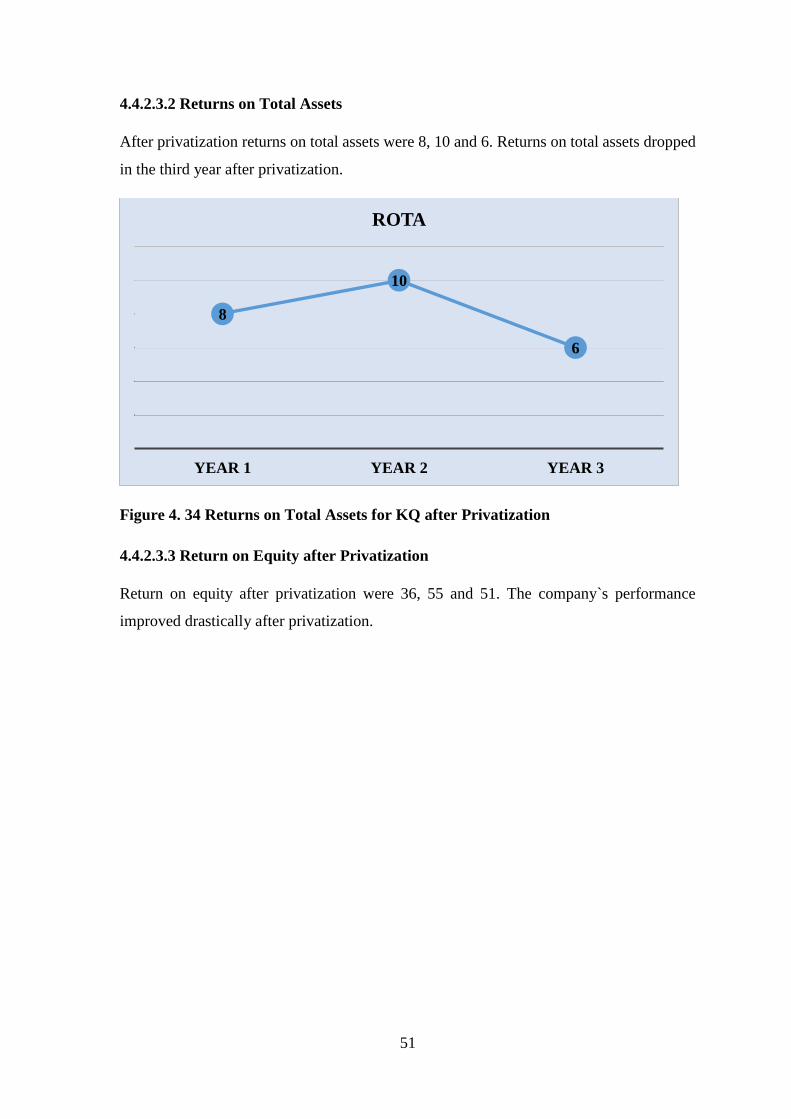
51
4.4.2.3.2 Returns on Total Assets
After privatization returns on total assets were 8, 10 and 6. Returns on total assets dropped
in the third year after privatization.
Figure 4. 34 Returns on Total Assets for KQ after Privatization
4.4.2.3.3 Return on Equity after Privatization
Return on equity after privatization were 36, 55 and 51. The company`s performance
improved drastically after privatization.
8
10
6
YEAR 1 YEAR 2 YEAR 3
ROTA

52
Figure 4. 35 Return on Equity for KQ after Privatization
4.4.2.4 Kenya Re-Insurance Corporation Limited Financial Performance after
Privatization
4.4.2.4.1 Return on Turnover after Privatization
Returns on turnover after the privatization were 27, 24 and 22. This indicates that the firm`s
performance was declining with time but performing better than before the privatization
took place.
36
55
51
0
10
20
30
40
50
60
Year 1 Year 2 Year 3
ROE
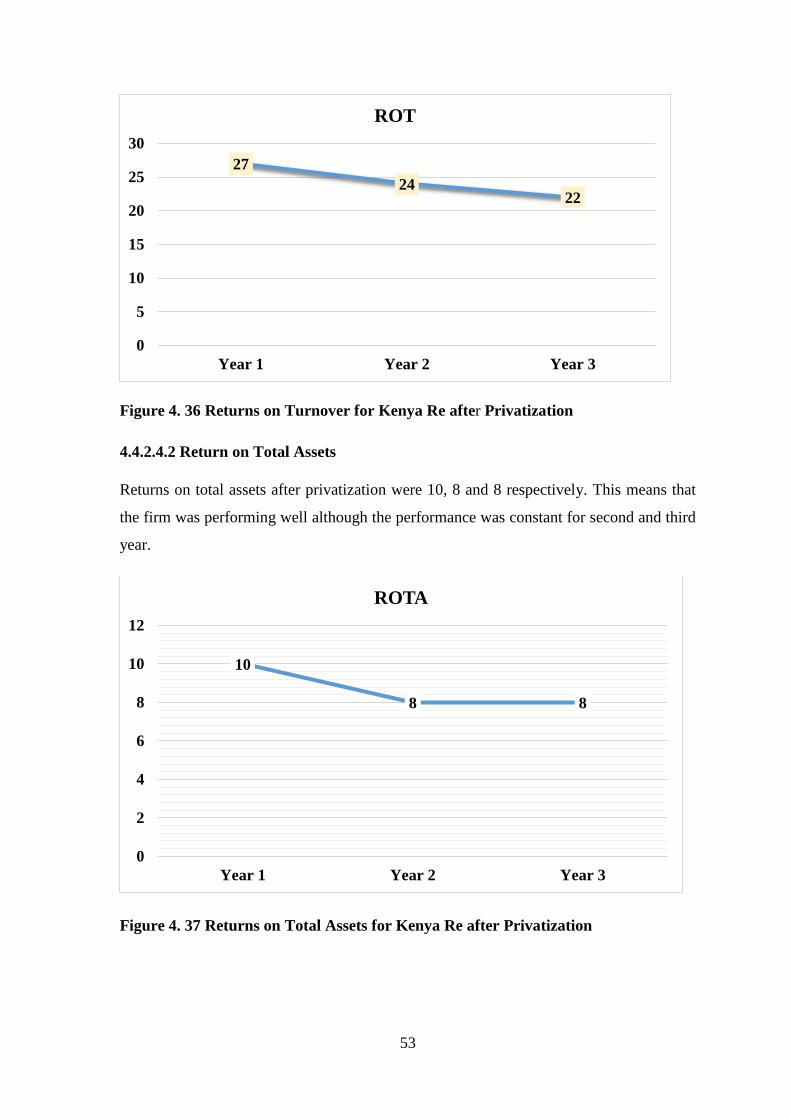
53
Figure 4. 36 Returns on Turnover for Kenya Re after Privatization
4.4.2.4.2 Return on Total Assets
Returns on total assets after privatization were 10, 8 and 8 respectively. This means that
the firm was performing well although the performance was constant for second and third
year.
Figure 4. 37 Returns on Total Assets for Kenya Re after Privatization
27
2422
0
5
10
15
20
25
30
Year 1 Year 2 Year 3
ROT
10
8 8
0
2
4
6
8
10
12
Year 1 Year 2 Year 3
ROTA
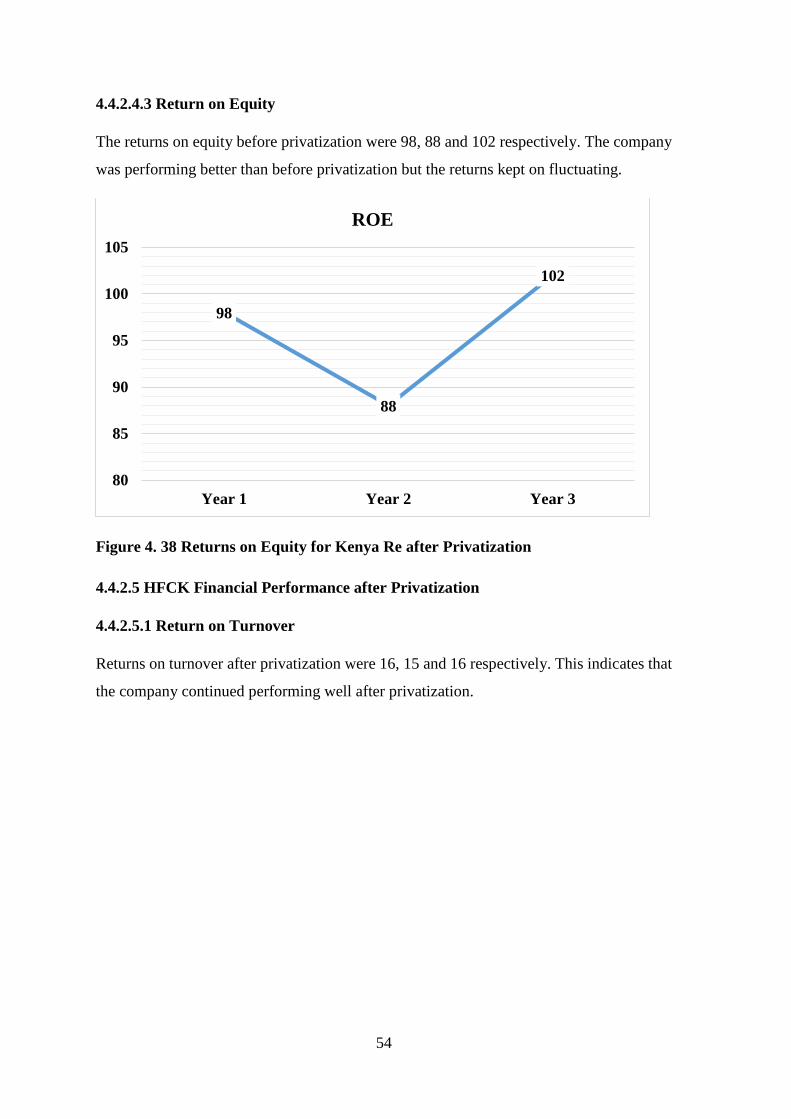
54
4.4.2.4.3 Return on Equity
The returns on equity before privatization were 98, 88 and 102 respectively. The company
was performing better than before privatization but the returns kept on fluctuating.
Figure 4. 38 Returns on Equity for Kenya Re after Privatization
4.4.2.5 HFCK Financial Performance after Privatization
4.4.2.5.1 Return on Turnover
Returns on turnover after privatization were 16, 15 and 16 respectively. This indicates that
the company continued performing well after privatization.
98
88
102
80
85
90
95
100
105
Year 1 Year 2 Year 3
ROE
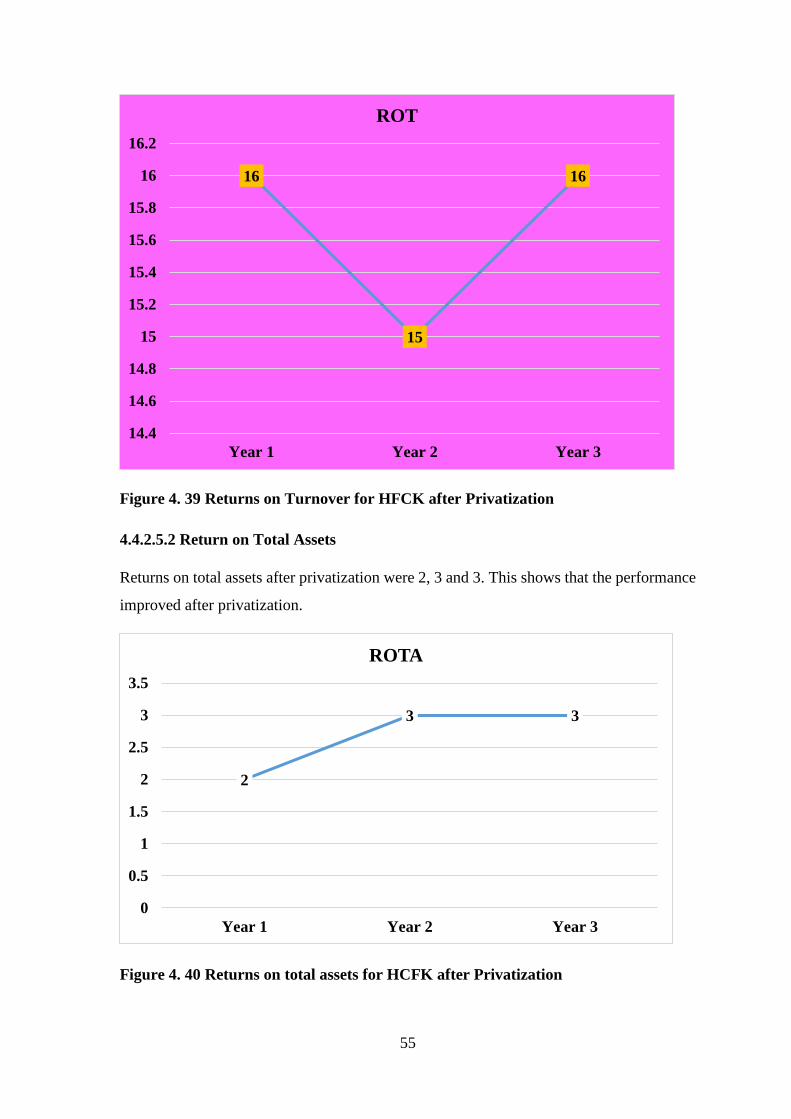
55
Figure 4. 39 Returns on Turnover for HFCK after Privatization
4.4.2.5.2 Return on Total Assets
Returns on total assets after privatization were 2, 3 and 3. This shows that the performance
improved after privatization.
Figure 4. 40 Returns on total assets for HCFK after Privatization
16
15
16
14.4
14.6
14.8
15
15.2
15.4
15.6
15.8
16
16.2
Year 1 Year 2 Year 3
ROT
2
3 3
0
0.5
1
1.5
2
2.5
3
3.5
Year 1 Year 2 Year 3
ROTA

56
4.4.2.5.3 Return on Equity
Returns on equity (ROE) privatization were 62, 47 and 51 respectively. Returns on equity
kept on fluctuating for the three years after privatization.
Figure 4. 41 Returns on Equity for HCFK after Privatization
4.4.2.6 Mumias Sugar Company Ltd Financial Performance after Privatization
4.4.2.6.1 Return on Turnover
Returns on turnover after privatization were 7, -3 and 7 respectively. The returns declined
in the second year and rose again in the third year.
62
4751
0
10
20
30
40
50
60
70
Year 1 Year 2 Year 3
ROE
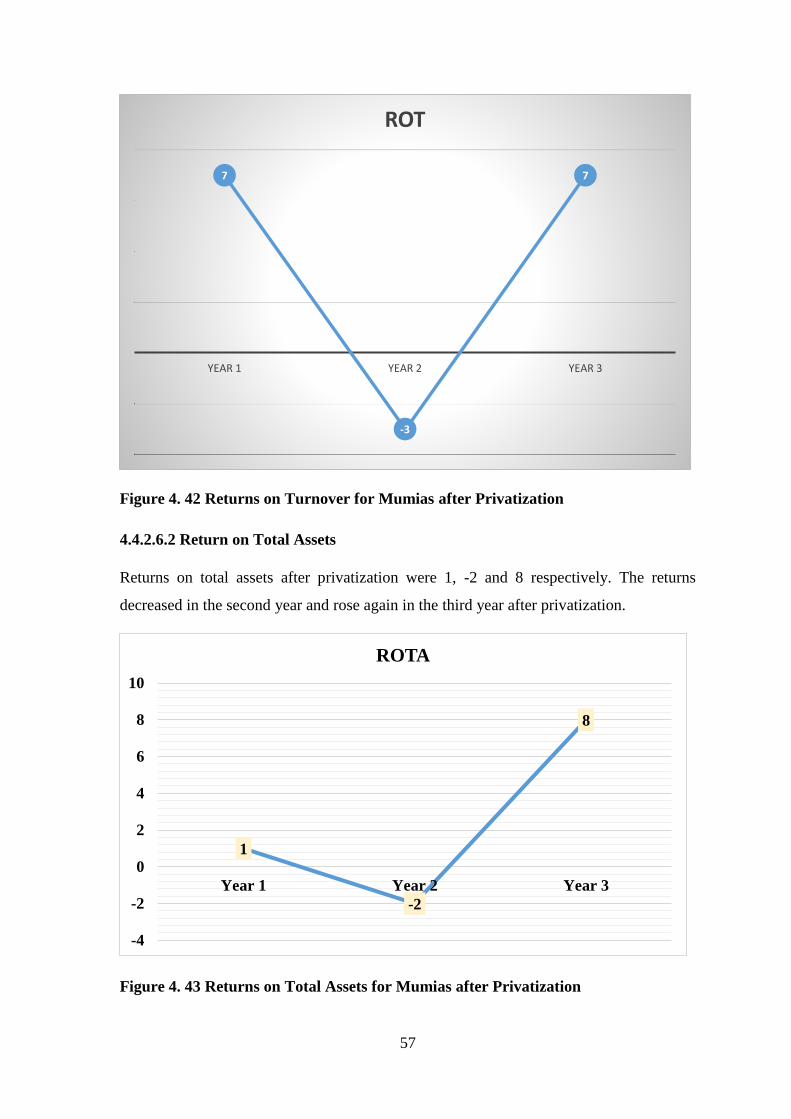
57
Figure 4. 42 Returns on Turnover for Mumias after Privatization
4.4.2.6.2 Return on Total Assets
Returns on total assets after privatization were 1, -2 and 8 respectively. The returns
decreased in the second year and rose again in the third year after privatization.
Figure 4. 43 Returns on Total Assets for Mumias after Privatization
7
-3
7
YEAR 1 YEAR 2 YEAR 3
ROT
1
-2
8
-4
-2
0
2
4
6
8
10
Year 1 Year 2 Year 3
ROTA
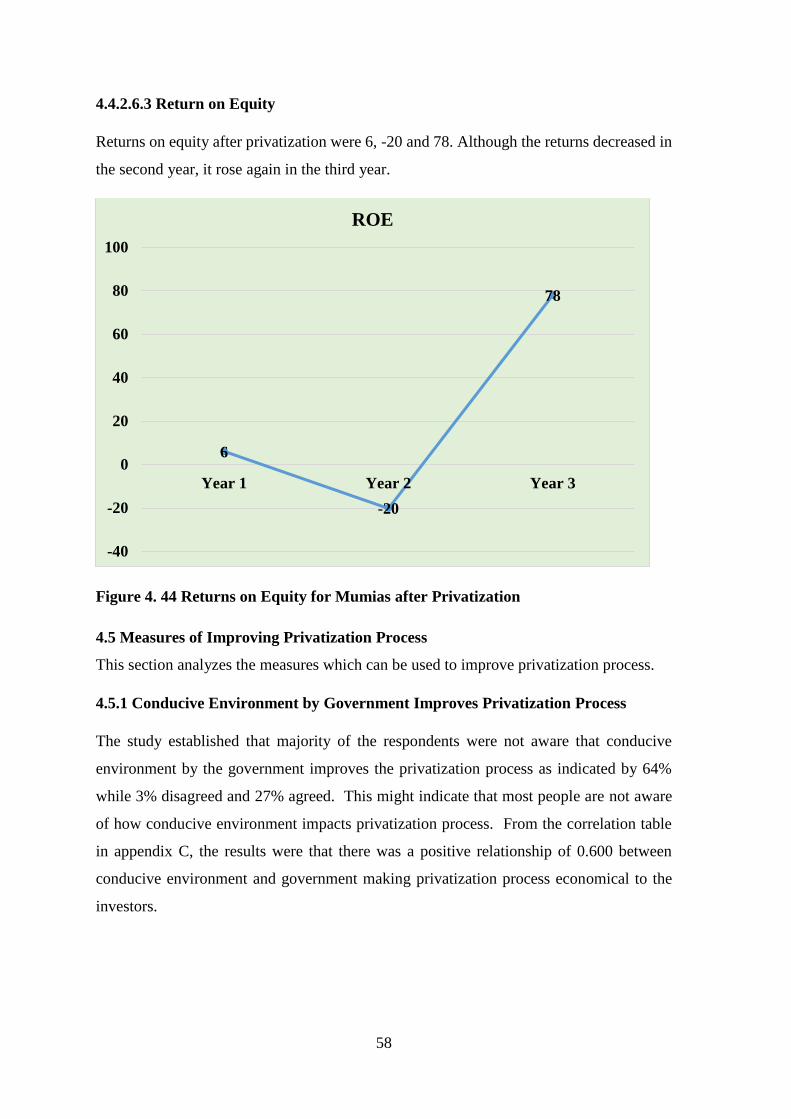
58
4.4.2.6.3 Return on Equity
Returns on equity after privatization were 6, -20 and 78. Although the returns decreased in
the second year, it rose again in the third year.
Figure 4. 44 Returns on Equity for Mumias after Privatization
4.5 Measures of Improving Privatization Process
This section analyzes the measures which can be used to improve privatization process.
4.5.1 Conducive Environment by Government Improves Privatization Process
The study established that majority of the respondents were not aware that conducive
environment by the government improves the privatization process as indicated by 64%
while 3% disagreed and 27% agreed. This might indicate that most people are not aware
of how conducive environment impacts privatization process. From the correlation table
in appendix C, the results were that there was a positive relationship of 0.600 between
conducive environment and government making privatization process economical to the
investors.
6
-20
78
-40
-20
0
20
40
60
80
100
Year 1 Year 2 Year 3
ROE
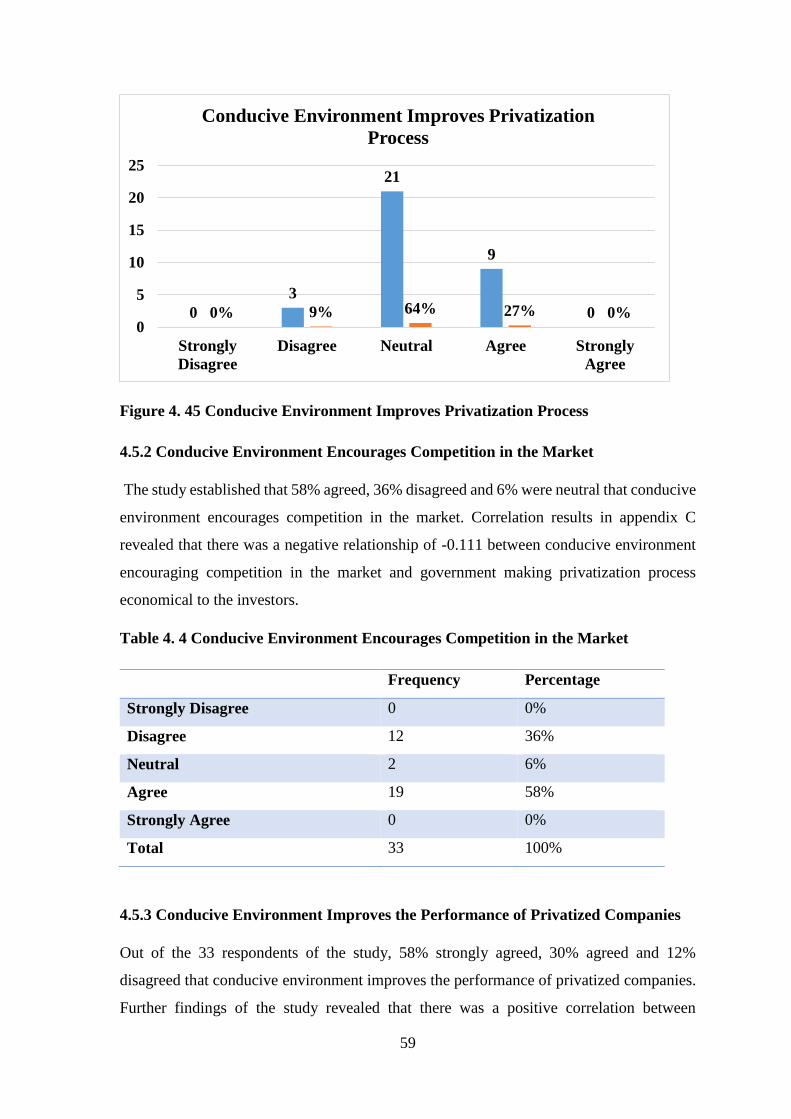
59
Figure 4. 45 Conducive Environment Improves Privatization Process
4.5.2 Conducive Environment Encourages Competition in the Market
The study established that 58% agreed, 36% disagreed and 6% were neutral that conducive
environment encourages competition in the market. Correlation results in appendix C
revealed that there was a negative relationship of -0.111 between conducive environment
encouraging competition in the market and government making privatization process
economical to the investors.
Table 4. 4 Conducive Environment Encourages Competition in the Market
Frequency Percentage
Strongly Disagree 0 0%
Disagree 12 36%
Neutral 2 6%
Agree 19 58%
Strongly Agree 0 0%
Total 33 100%
4.5.3 Conducive Environment Improves the Performance of Privatized Companies
Out of the 33 respondents of the study, 58% strongly agreed, 30% agreed and 12%
disagreed that conducive environment improves the performance of privatized companies.
Further findings of the study revealed that there was a positive correlation between
0
3
21
9
00% 9% 64% 27% 0%0
5
10
15
20
25
Strongly
Disagree
Disagree Neutral Agree Strongly
Agree
Conducive Environment Improves Privatization
Process
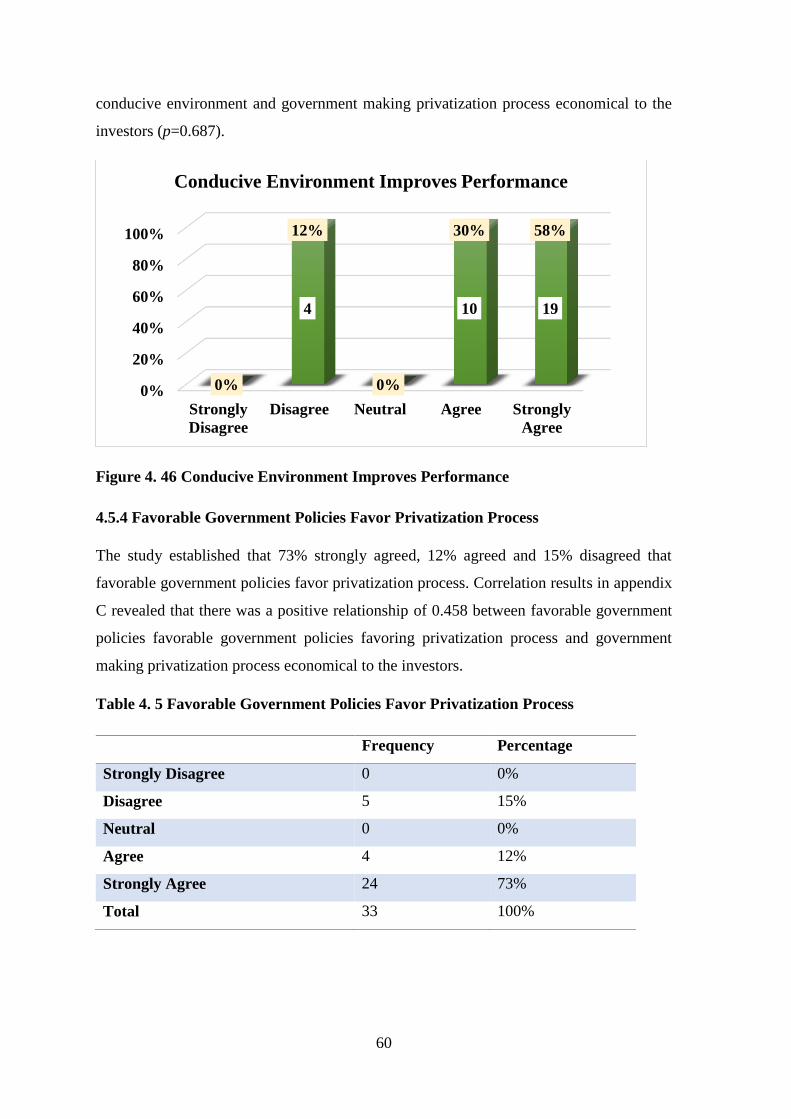
60
conducive environment and government making privatization process economical to the
investors (p=0.687).
Figure 4. 46 Conducive Environment Improves Performance
4.5.4 Favorable Government Policies Favor Privatization Process
The study established that 73% strongly agreed, 12% agreed and 15% disagreed that
favorable government policies favor privatization process. Correlation results in appendix
C revealed that there was a positive relationship of 0.458 between favorable government
policies favorable government policies favoring privatization process and government
making privatization process economical to the investors.
Table 4. 5 Favorable Government Policies Favor Privatization Process
Frequency Percentage
Strongly Disagree 0 0%
Disagree 5 15%
Neutral 0 0%
Agree 4 12%
Strongly Agree 24 73%
Total 33 100%
0%
20%
40%
60%
80%
100%
Strongly
Disagree
Disagree Neutral Agree Strongly
Agree
0
4
0
10 19
0%
12%
0%
30% 58%
Conducive Environment Improves Performance
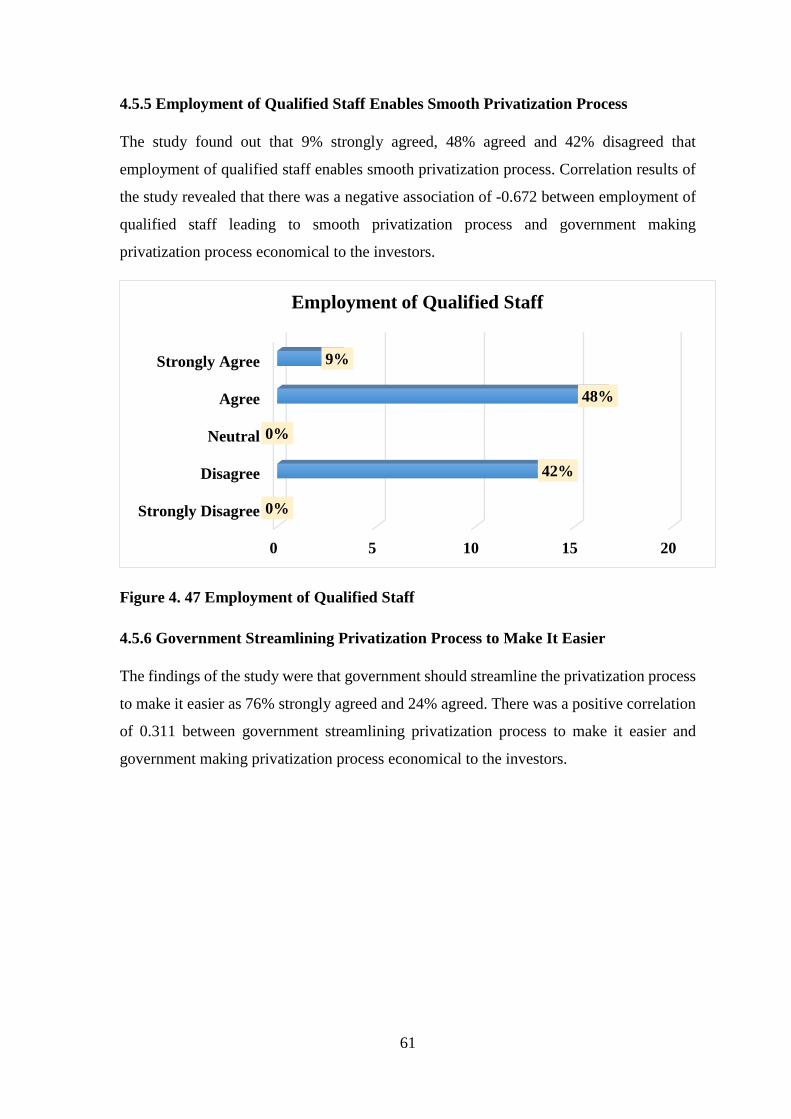
61
4.5.5 Employment of Qualified Staff Enables Smooth Privatization Process
The study found out that 9% strongly agreed, 48% agreed and 42% disagreed that
employment of qualified staff enables smooth privatization process. Correlation results of
the study revealed that there was a negative association of -0.672 between employment of
qualified staff leading to smooth privatization process and government making
privatization process economical to the investors.
Figure 4. 47 Employment of Qualified Staff
4.5.6 Government Streamlining Privatization Process to Make It Easier
The findings of the study were that government should streamline the privatization process
to make it easier as 76% strongly agreed and 24% agreed. There was a positive correlation
of 0.311 between government streamlining privatization process to make it easier and
government making privatization process economical to the investors.
0 5 10 15 20
Strongly Disagree
Disagree
Neutral
Agree
Strongly Agree
0%
42%
0%
48%
9%
Employment of Qualified Staff
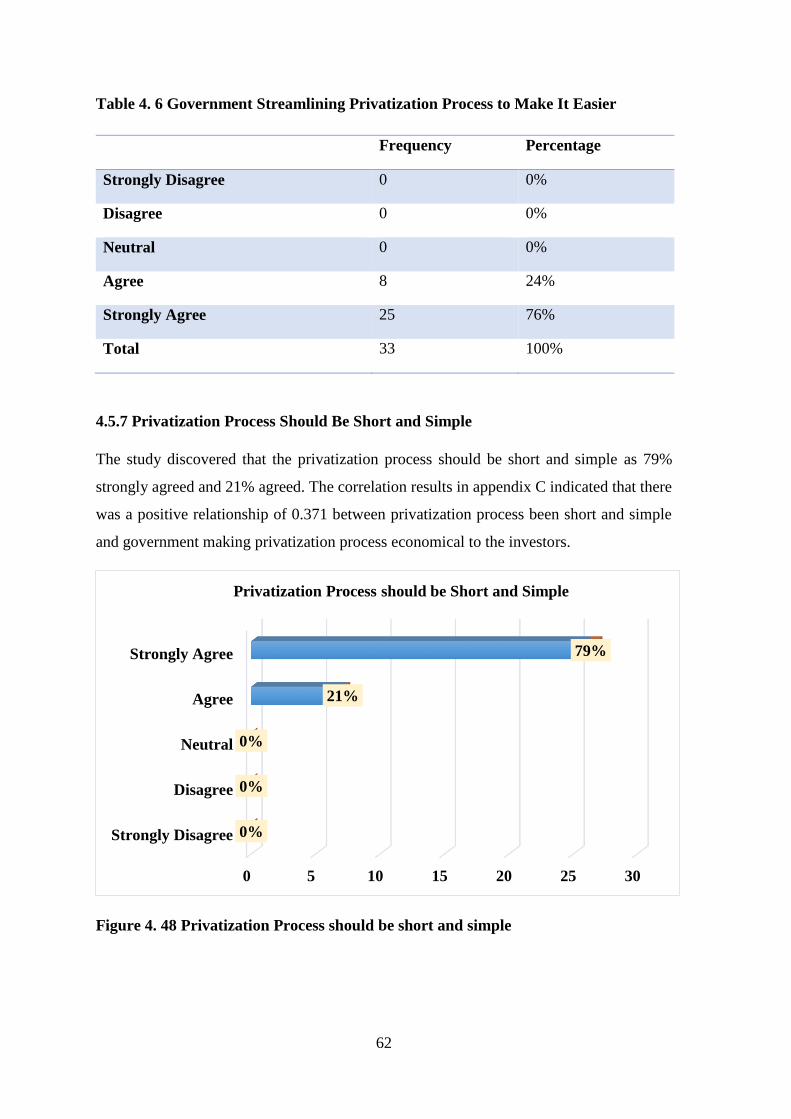
62
Table 4. 6 Government Streamlining Privatization Process to Make It Easier
Frequency Percentage
Strongly Disagree 0 0%
Disagree 0 0%
Neutral 0 0%
Agree 8 24%
Strongly Agree 25 76%
Total 33 100%
4.5.7 Privatization Process Should Be Short and Simple
The study discovered that the privatization process should be short and simple as 79%
strongly agreed and 21% agreed. The correlation results in appendix C indicated that there
was a positive relationship of 0.371 between privatization process been short and simple
and government making privatization process economical to the investors.
Figure 4. 48 Privatization Process should be short and simple
0 5 10 15 20 25 30
Strongly Disagree
Disagree
Neutral
Agree
Strongly Agree
0%
0%
0%
21%
79%
Privatization Process should be Short and Simple

63
4.5.8 Better Compensation Package for the Retrenched Employees after Privatization
The study discovered that the government should provide better compensation package for
the retrenched employees after privatization as 67% strongly agreed and 33% agreed. The
correlation results were that there was a positive relationship of 0.363 between better
compensation packages for the retrenched employees after privatization and government
making privatization process economical to the investors.
Table 4. 7 Better Compensation Package for the Retrenched Employees
Frequency Percentage
Strongly Disagree 0 0%
Disagree 0 0%
Neutral 0 0%
Agree 11 33%
Strongly Agree 22 67%
Total 33 100%
4.5.9 Retrenchment of Ghost Workers before Privatization
The researcher wanted to establish whether the government should retrench ghost workers
before privatization. The findings of the study were that 61% agreed and 39% strongly
agreed that the government should retrench ghost workers before privatization. The
correlation results in appendix C revealed that there was a negative relationship of 0.467
between retrenchments of ghost workers before privatization and government making
privatization process economical to the investors.

64
Table 4. 8 Retrenchment of Ghost Workers before Privatization
Frequency Percentage
Strongly Disagree 0 0%
Disagree 0 0%
Neutral 0 0%
Agree 20 61%
Strongly Agree 13 39%
Total 33 100%
4.5.10 Government Should Make Privatization Process Economical To Investors
The study established that the government should make privatization process economical
to investors as 70% strongly agreed and 21% agreed.
4.5.11 Regression Analysis
The relationship between privatization and financial performance of privatized firms in
Kenya was established by the used of an ordinary regression analysis. Regression results
in Table 4.2 revealed that R squared was 95.6% of the changes in the financial performance
of privatized companies as explained by privatization while only 4.4% changes in the
financial performance is explained by other factors other than privatization. The study
0% 0% 9% 21% 70%
0
5
10
15
20
25
Strongly
Disagree
Disagree Neutral Agree Strongly
Agree
Privatization Process Economical to Investors
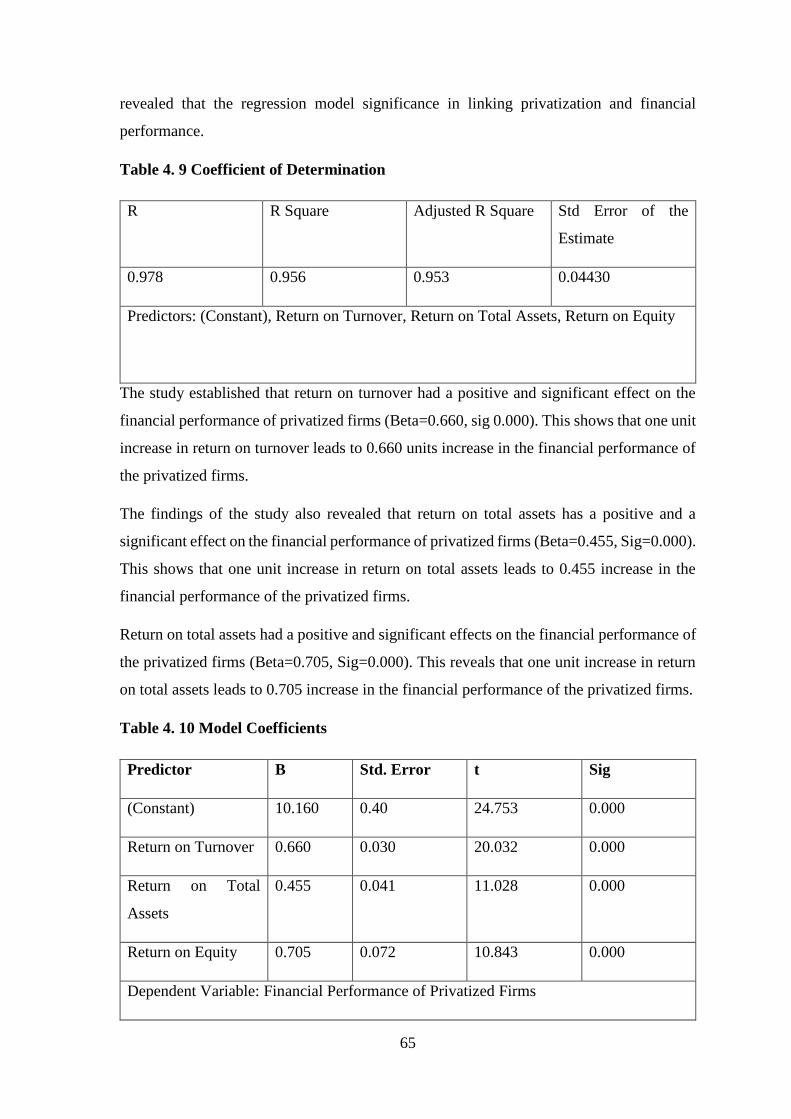
65
revealed that the regression model significance in linking privatization and financial
performance.
Table 4. 9 Coefficient of Determination
R R Square Adjusted R Square Std Error of the
Estimate
0.978 0.956 0.953 0.04430
Predictors: (Constant), Return on Turnover, Return on Total Assets, Return on Equity
The study established that return on turnover had a positive and significant effect on the
financial performance of privatized firms (Beta=0.660, sig 0.000). This shows that one unit
increase in return on turnover leads to 0.660 units increase in the financial performance of
the privatized firms.
The findings of the study also revealed that return on total assets has a positive and a
significant effect on the financial performance of privatized firms (Beta=0.455, Sig=0.000).
This shows that one unit increase in return on total assets leads to 0.455 increase in the
financial performance of the privatized firms.
Return on total assets had a positive and significant effects on the financial performance of
the privatized firms (Beta=0.705, Sig=0.000). This reveals that one unit increase in return
on total assets leads to 0.705 increase in the financial performance of the privatized firms.
Table 4. 10 Model Coefficients
Predictor B Std. Error t Sig
(Constant) 10.160 0.40 24.753 0.000
Return on Turnover 0.660 0.030 20.032 0.000
Return on Total
Assets
0.455 0.041 11.028 0.000
Return on Equity 0.705 0.072 10.843 0.000
Dependent Variable: Financial Performance of Privatized Firms

66
Financial Performance after Privatization =10.160+0.660 (Return on Turnover)
+0.455 (Return on Total Assets) + 0.705 (Return on Equity)
4.6 Chapter Summary
This chapter has discussed in depth the results and findings of the study. It has discussed
the financial information of privatized companies by use of financial ratios like return on
assets, return on turnover and return on equity. Chapter five comprises of discussion,
conclusions and recommendations of the study.

67
CHAPTER FIVE
5.0 DISCUSSION, CONCLUSIONS AND RECOMMENDATIONS
5.1 Introduction
This chapter discusses summary of the study and findings of the study which are based on
the specific objectives. In addition, literature review has been used to support the findings
of the study. Conclusion, recommendations and areas for further studies are also covered
in this chapter.
5.2 Summary of the Study
The main purpose of the study was to establish the impact of privatization on the financial
performance of government firms in Kenya. The study was guided by three research
questions which were; 1.4.1 what is the Performance of Firms before Privatization? What
is the Performance of Firms after Privatization? and what are Measures of Improving
Privatization Processs?.
The study applied a quasi-experimental (event study) to carry out the study. The researcher
observed the pre and post-privatization performance of several government firms that were
privatized between 1991 to 2008. The sampling frame for this study was the 6 privatized
government firms. Simple random sampling was used in this study so as to ensure that each
element in the population of an equal chance of being included in the sample. Data forms
were used to collect data for the period of six years. Descriptive statistics such as mean and
standard deviation were used to test the data for its ability to be relied upon for valid
conclusion. Inferential statistic used in the study was regression analysis.
The first research question addressed the performance of government firms before
privatization. The performance was measured by the use of mean and standard deviation.
The study discovered that companies performed better after privatization. This indicated
that they became more stable after privatization. The return on turnover increased after
privatization. Return on assets increased after privatization of the companies. Return on
equity also signified a great improvement after privatization compared to the period before
privatization.
The second research question was to address the financial performance of the privatized
companies. This section used return on assets, return on turnover and return on equity to
68
measure the financial performance. Each company was analyzed individually. The study
revealed that in the first three years before privatization, KENGEN performed poorly
compared to the three years after privatization. Return on turnover kept on increasing and
decreasing after privatization. National Bank of Kenya performed better after privatization
although all the measures kept on fluctuating from high to low. Kenya Airways Limited
showed an improved financial performance after privatization. Return on total assets kept
on changing from high to low and vice-versa. Kenya Re-insurance Corporation limited
improved its financial performance after privatization. Although the return on assets
improved in the first year, it dropped in the second year after privatization. Housing Finance
Corporation of Kenya`s financial performance improved drastically after the privatization.
Generally, the performance improved although some measures like return on turnover and
return on equity kept on decreasing and increasing after privatization. Mumias Sugar
Company financial performance improved generally after privatization. In the second year
after privatization, all the measures of financial performance decreased and rose
significantly in the third year.
The study carried out a regression analysis to establish how return on assets, return on
turnover and return on equity affects the financial performance of the privatized companies.
The findings of the study were that return on total assets, return on turnover and return on
equity significantly had an effect on the financial performance of the privatized firms.
5.3 Discussion
5.3.1 Performance before Privatization
The findings of the study were reviewed by use of summary statistics which included mean
and standard deviation. They were based on the performance measures which comprised
of return on turnover, return on total assets and return on equity. The study established that
for the six companies the performance was poor before privatization. Return on turnover
for KENGEN Company kept on fluctuating for the first three years before privatization.
This is in contrast with an argument by Alipour (2013), that privatization has no positive
effect on the profitability of the rather, the effect is negative. Moreover, he argued that
privatization of these firms has no effect on the sales effectiveness and efficiency instead,
the debts and risks of these firms s increases. The findings of the study are supported by
Astami, Tower, Rusmin, and Neilson, (2010) that private owned companies have higher

69
levels of performance than those fully owned by the government. In addition, there is
usually a significant differences in financial leverage, firm size, assets‐in‐place, financial
statement reliability, and industry variances between private companies and public owned
companies.
The study discovered that National Bank of Kenya performance was poor before
privatization. Return on assets and return on equity kept on decreasing for the three years
before privatization. Clark, Munro and Sumaila (2010) argued that when the company is
public owned, the government is always liable for the debts and therefore the managers
don’t mind whether the company performs well or not (). This is what explains well the
difference between balance sheet of public and private owned companies. Private
companies have high levels of liquidity compared to public companies (Vo, Swierczek, &
Nguyen, 2013). For the Kenya Airways, the study found out that return on equity kept on
decreasing for the three years before privatization. Also, the company performed poorly in
terms of Return on Total Assets before privatization. This is supported by an argument by
Linz and Rakhovsky (2011) that the public owned companies are faced by challenges of
inefficiency in operations and therefore decreased profits and that’s why the government
decides to privatize those firms and by the end of few years the companies start yielding
profits.
The study established that Kenya Re-insurance Corporation performed poorly before
privatization as the return on assets, return on turnover and return on equity kept on
fluctuating. This could have been necessitated by poor management of the company.
Employee-orientated activities, such as career opportunities, and secondary benefits and
work–life balance, lead to improved financial performance. A study done by Ims and
Seiffert (2015) on the effects of post-privatization government divestments on the financial
and operating performance of state owned enterprises in Scandinavia found out that
Leverage levels increased, while capital investment, dividend payouts and employment
levels decrease as the state divested its shares. Dividend in private companies increase
because investors demand their dividend payments to be paid and this therefore improves
concentration of managers and their employees (Ohemeng & Grant, 2008).
The study discovered that Return on Equity of Housing Finance Corporation of Kenya kept
on decreasing for the first three years before privatization while return on turnover and
return on total assets kept on fluctuating. This fluctuation may be caused by many factors.
70
The findings of the study are supported by an argument by Adrian and Boyarchenko (2018)
ththat private firm capital structure is not measured by leverage but also the issuance of
specific debt instruments. Leverage, debt type usage, and debt specialization are dynamic
and strongly related to observable firm characteristics and industry characteristics are
strong determinants of leverage levels and debt specialization (McCumber, 2015).
Further, the study established that Mumias Sugar Company performed poorly in the first
two years and the performance started improving in the third year before privatization. This
company was almost closing as it had less than zero return on turnover, return on total
assets and return on equity. Returns tend to be large if no dividends are paid and then
decrease with the dividend payout ratio (Li, 2016). According to Zhang (2013), profit is
the largest for the stocks that do not make dividend payment but appear similar for the
stocks that pay dividends and that stock momentum tends to be much stronger than value
stock momentum and no dividend stock momentum beats dividend stock momentum.
5.3.2 Performance after Privatization
The study discovered that for the KENGEN Company, return on turnover and return on
total assets and return on equity improved in the first year after privatization. Arcas and
Bachiller (2010), argued that after privatization, the firms became more profitable, improve
their real sales and their investment expenditure and enhance their operating efficiency. In
addition, the firms significantly decrease their debt levels and improved dividend payments
but there is no proof that employment levels decreased after privatization. Privatization of
public companies makes the managers to be focused on creating more profits as they are
the ones responsible to the shareholders in case the company makes losses (Winston, 2010).
According to Zarei, Amanati and Amanati (2017), after privatization, the company acts
more entrepreneurially and becomes aggressive in competition through entering
competitive markets and increasing risk taking to develop new services, products and
processes.
The study discovered that the financial performance of National Bank of Kenya improved
after privatization. This is because all the measures that were used depicted an
improvement. The findings are supported by an argument by Wieland and Flavel (2015)
that financial rates of return are generally lower for government enterprises compared to
the private sector, financial profitability of the firms are affected by price controls,
government firms over and over again put large burdens on government budgets,
71
government firms influences the intensification of the external debt in most developing
countries and countries in which government firms accounts for higher shares of gross
domestic investment which leads to lower rates of economic growth. The poor
performance of this company before privatization might have been led by lack of incentives
for the management. According Domney, Wilson and Chen (2015), several reasons led to
the poor performance of government firms and one of the reasons was lack of incentives to
the management. Some countries use performance bonuses or sharing of profits to motivate
the top management. Other countries managers are made to be part of the civil service so
that they can work hard.
In the case of Kenya Airways, the general financial performance improved after
privatization. Return on equity improved drastically for all the three years after
privatization. This made that the company was no longer relying on government for
financing and therefore it had to work hard to finance its operations. The study compared
output, operating efficiency and dividend payments. These findings are supported by an
argument by Baggiarini (2015) that the profits, outputs, operating efficiency and dividend
payments increase significantly and leverage ratios decrease immediately after
privatization. In addition, shortage of skilled managers was another cause for the poor
performance in government firms as observed by Lesorogol (2010).
The study discovered that Kenya re-insurance corporation limited performance was better
after privatization. The company`s return on turnover, return on total assets and return on
equity increased after privatization for all the three years. The improved performance was
induced by high competition in the market. Reason for poor performance of government
owned firms is due to lack of competition in the industry. According to Bortolotti and
Siniscalco (2014), many government firms are monopolies producing goods and services
that are never traded globally or that the government desire to manufacture domestically
for national security purposes. Similarly, there is a possibility that the managers were not
given preference to respond to competitive pressures which would mean decreasing staff
or termination loss-making service (Chari, 2015).
For the Housing Finance Corporation of Kenya the return on turnover decreased after
privatization meaning that they had qualified managers and were not leaving the job
anytime while looking for green pastures. . The shortage of managers leads to a high rate
of employee turnover as experienced people shift around to lead the disturbed government
72
firms (Bjørnskov and Potrafke, 2011). In addition, the countries who have shortage of
managers change the managers of state owned firms with damaging frequency as the
selection of top management is mainly based on nepotism and political patronage. In
addition return on total assets and return on equity increased. These findings are supported
by an argument by Ohemeng and Grant (2008) that the government firms are not instructed
to optimize profits or even to decrease costs since fine-tuning administered prices typically
comprise of practical and political difficulties. Additionally, government owned firms are
frequently required to perform non-commercial activities such as employing extra staff to
increase employment in a specific area to improve regional development to achieve
diversification.
For the Mumias sugar company, the overall financial performance improved for the first
three years after privatization. This company performed poorly due to inefficient
management. Governments firms rarely took an action to eradicate inefficient managers of
these firms. Additionally, governments are hardly prepared to use the authorization of
liquidation. This lack of operational accountability leads to poor performance by the
government firms. Different government agencies interfere with government enterprises
decisions that are privilege to the management (Haugen & Musser, 2011). Also, the
management fails to coordinate their actions as they have no control over them. Many
efforts to reduce illogical interference by government have become counterproductive,
replacing one form of bureaucratic involvement for another.
5.3.3 Measures of Improving Privatization Process
Conducive working is very important for the performance of any company. Conducive
environment enables employees to work hard since they are satisfied. The study discovered
that conducive environment by government improves the privatization process. A study at
china found out that, Performance improvement of privatized firms cannot be taken for
granted merely by ownership change; instead, the performance gains of privatization could
be realized only in concert with other institutional arrangements, including market
openness, the modest and short‐term bureaucratic control after privatization, and corporate
health prior to privatization (Wu, 2007). According to Naito (2013), government should
provide Conducive environment to encourage competition. New Zealand, Britain, Mexico,
and Chile have been successful privateers and the reason behind their success was that their
governments provided Conducive environment which encouraged competition.
73
The study discovered that conducive environment provided by the government encourages
competition in the market. For a firm to compete in the global economy, they must become
more efficient, more flexible and, above all, more customer‐oriented (Chaurasia, Garg, &
Agarwal, 2016). The competitive edge of firms is determined not only by their own
strategic choices, but also by what their respective governments do in terms of providing a
supportive infrastructure that helps them compete (Halachmi, 2002). Government may
come up with programs to encourage competition like through export, price reforms,
regulatory reforms safeguarding competition by removing obstacles to private entry and
exit and legal reforms assuring proper disclosure, enforcement of contracts, and due
process.
Further, the findings of the study indicated that conducive environment improves the
performance of the privatized companies. Performance of the company includes both
financial and non-financial measures. Haugen and Musser (2011) argued that improved
performance of private companies is not effective enough unless other factors like
regulations are considered. Privatization works well when the programs are put in place to
create an environment which improves efficiency. The study discovered that favorable
government policies should favor privatization process. Government policies should be in
a position to favor private companies .They should be free from political interference and
should be handled by specialized professionals with a full knowledge of how public sectors
reform. Lan (2016) stipulated that government interventions lead inevitably to both
cooperation and conflict with the private sector.
Employment of qualified staff is very important to every organization. Incompetent
employees diminish the performance of the organization with time. Experience and
academic qualifications should be highly considered. The study found out employment of
qualified staff enables smooth privatization process. After privatization it is very important
for the government to ensure that the personnel of the privatized companies are well trained
to ensure efficient management. Determining the value of a public company is usually very
difficult and that is why government engages an expert to give an advice (Naito, 2013).
Even in developed countries like Canada face the challenge of assessing the value of their
public companies even after engaging experts. Privatization process can be better only if
the procedures are not many and few requirements are needed. For example, Mexico
successfully sold its public companies with only seven people carrying out the transactions
(Lam, 2016).
74
Privatization process should be well streamlined to make the privatization process easier.
The study discovered that the government should streamline its privatization process to
make it easier. Arcas and Bachiller (2010) argued that governments are good in
streamlining firms before privatization by enhancing the trustworthiness of the process.
This trustworthiness view is important in face of the huge political costs of labor
streamlining (Arocena & Oliveros, 2012). This is because willingness to overcome worker
resistance may be understood as an indicator of commitment to change. Another view that
supports preceding streamlining is the social view whereby any social costs of streamlining,
particularly labor-related streamlining, may be solved adequately by governments.
A long privatization process consumes a lot of resources which include both financial and
non-financials. The study found out that privatization process should be short and simple.
Privatization process in Kenya is usually very long. A good example is the case of the five
government owned sugar factories in Kenya. These factories were embarked on
privatization program and approved by cabinet in the year 2008 and debts written off by
parliament. The purpose of privatization was to transform the industry towards commercial
orientation and injection of new capital from the private investors. However, the
Parliamentary Departmental Committee on Finance, Planning and Trade passed a
resolution on 9th January, 2013 “that the privatization of the public Sector Sugar
Companies should be postponed until such a time when all legislation affecting the
Agriculture Sector (sugar) and the County Governments have been put in place”. In order
to kick start the privatization process, the approval of the Parliamentary Committee on
Finance, Planning and Trade is required. The process is already over 9 years old since the
privatization began and this can lower the demand of the private investors.
Retrenched employees after privatization should be given better compensation package to
enable them survive as they search for new jobs. The study found out that the government
should provide better compensation package for the retrenched employees. When a public
function is privatized the employees get paid less and lose benefits, but other state agencies
pick up the costs that occur when people get paid less. Private Managers and executives
get a big chunk of the savings and then there are the costs to the larger economy from ever
more people making less and less (Spearin, 2005). Government should prepare employees
for privatization by treating them fairly. Governments usually have programs to
compensate employees for job loss (Chaurasia, Garg, & Agarwal, 2016). These programs
include working within the rate of natural attrition, encouraging or requiring first

75
consideration by contractors, offering early retirement incentives and allowing public
departments to bid for contracts (Richardson, 1991). Baggiarini (2015) argued that the
public sector may be in a better position to bargain with the unions if the government has
mechanisms to assist the retrenched employees. The government can do so by re-educating
employees, helping employees to look for new jobs and paying good compensation.
Most government organizations have ghost workers who are paid for the work not done.
To make it easier for the privatized companies, the government should retrench all the ghost
workers before the privatization process takes place. This makes it easier for the investors
to know how many real employees they have. The study discovered that the government
should retrench the ghost workers before privatization. Government should try to retrench
ghost workers and unproductive workers before privatization (Spearin, 2005). Many buyers
usually shy away from the public companies where they must layoff some employees.
Despite that unemployment can result from privatization, it should not be seen as the bad
side of privatization as it helps in cutting the operational costs and therefore increased
profits (Lam, 2016).
The study found out that the government should make the privatization process economical
to the investors. The government should make the public companies more attractive to the
buyers so that they can sell at a good price and investors to be happy to invest in a well-
managed entity. This is in order to give comfort and confidence to the in vesting public,
endorse the valuation and provide ongoing protection to the investors of the new
shareholders (Chari, 2015). In addition, the management team should be fully prepared for
the changes that follow from being in the private sector particularly for those companies
that are floated on the stock exchange. Management of companies being privatized would
be required to devote a substantial proportion of its time and effort in preparation for
privatization.
5.4 Conclusions
5.4.1 Performance before Privatization
All firms should work hard without considering the issue of privatization in mind. The
government should put measures to ensure that its firms perform well even before
privatization. The management of the firms should comprise of diverse individuals so as to
ensure there is generation of many ideas which can lead to improved performance.
76
5.4.2 Performance after Privatization
After privatization, firms tend to improve performance in the first year then start dropping
in the second year. The privatized firms should motivate its employees and management
throughout the operations so as to ensure healthy and stable performance of the firm.
Managers of the firms should be given fair compensation so as to meet the needs of the
shareholders.
5.4.3 Measures of Improving Privatization Processs
Firms should have regular meetings with the management of the firms. Regular meetings
ensures effective monitoring of the firm and therefore improved performance. There should
be a good relationship between the management and the shareholders of the firm to avoid
conflicts of interests.
5.5 Recommendation
5.5.1 Recommendation for Improvement
5.5.1.1 Performance before Privatization
The study recommends for the state owned companies to monitor their performance. This
will ensure that management works towards achieving the goals of the firm which is to
have good financial status. There is need for the government to undertake review of the
privatization policy to avoid failures which emerged from the past experience and
implement the important modifications.
5.5.1.2 Performance after Privatization
The study recommends that the companies to use both financial and non-financial measures
to monitor the performance of the firms after privatization. This will ensure that all the
factors which affect performance are captured and therefore non-biased opinions can be
provided. Privatized firms have the desire to achieve positive financial performance and
therefore they should also focus on training of employees and development by having
training programs, having effective cost control and improvement of technology to enhance
productivity.

77
5.5.1.3 Measures of Improving Privatization Process
The study also recommends firms to use different ways of improving performance other
than concentrating on the financial part alone. The study considers management of the firms
as one of the strengths which the firms should consider. A good management of the firm
ensure smooth operation of activities and therefore improved performance. There is urge
of the government to carefully choose the type of privatization which should be based on a
depth examination of the history and nature of the firm. There is also the need of
government encouraging private investors to the privatization process.
5.5.2 Recommendation for Future Research
The study was only done for a period of three years before privatization and three years
after privatization. The study recommends further research to be done for a longer period
more than five years before and after privatization. In addition correlation analysis should
be carried out to establish the relationship between the measures of financial performance.
78
REFERENCES
Adrian, T., & Boyarchenko, N. (2018). Liquidity policies and systemic risk. Journal of Financial
Intermediation, 35(4), 45-60.
Alipour, M. (2013). Has privatization of state-owned enterprises in Iran led to improved
performance? International Journal of Commerce and Management, 23(4), 281-305.
Amadi, H. (2015). Emerging Procurement Laws and Women's Empowerment: Assessing the
Costs and Benefits of the Privatization of the Telecommunications Sector in Kenya. A
Journal of Transnational Women's & Gender Studies, 14(3), 114-120.
Anastassiou, T. A. (2017). A dividend function for Greek manufacturing. Journal of Managerial
Finance, 33(5), 344-347.
Arcas, M., & Bachiller, P. (2010). Operating Performance of Privatized Firms in Europe:
Organizational and Environmental Factors. International Journal of Public
Administration, 33(10), 487-498.
Archambault, C. S. (2015). Gendered perspectives on rangeland privatization among the Maasai
of Southern Kenya. In Global Trends in Land Tenure Reform, 4(11), 417-422.
Arocena, P., & Oliveros, D. (2012). The efficiency of state-owned and privatized firms: Does
ownership make a difference? International Journal of Production Economics, 140(1),
457-465.
Association of Accounting Technicians. (2013). Practical Financial Indicators. Financial
performance, 2(1), 34-38.
Astami, E. W., Tower, G., Rusmin, R., & Neilson, J. (2010). The effect of privatisation on
performance of state‐owned‐enterprises in Indonesia. Asian Review of Accounting, 18(1),
5-19.
79
Augustyniak, K. M., Brooks, M., Rinaldo, V. J., Bogner, R., & Hodges, S. (2015). Emotional
Regulation: Considerations for School-Based Group Interventions. The Journal for
Specialists in Group Work, 34(4), 326-335.
Bachiller, P. (2009). Effect of ownership on efficiency in Spanish companies. Management
Decision, 47(2), 289-307.
Bachiller, P. (2017). A meta-analysis of the impact of privatization on firm
performance. Management Decision, 55(1), 178-202.
Baggiarini, B. (2015). Military Privatization and the Gendered Politics of Sacrifice. Gender and
Private Security in Global Politics, 4(2), 37-54.
Boehmer, E., Nash, R. C., & Netter, J. M. (2005). Bank privatization in developing and developed
countries: Cross-sectional evidence on the impact of economic and political
factors. Journal of Banking & Finance, 29(8-9), 1981-2013.
Bortolotti, B., & Siniscalco, D. (2014). The Challenges of Privatization. Journal of
Privatization, 4(3), 112-116.
Boubakri, N., Cosset, J., & Guedhami, O. (2005). Liberalization, corporate governance and the
performance of privatized firms in developing countries. Journal of Corporate
Finance, 11(5), 767-790.
Chari, R. (2015). Remembering Privatization and Conceptualizing Life Thereafter. Life After
Privatization, 4(1), 1-23.
Chaurasia, B., Garg, D., & Agarwal, A. (2016). Framework to improve performance through
implementing Lean Six Sigma strategies to oil exporting countries during recession or
depression. International Journal of Productivity and Performance Management, 65(3),
422-432.
Chen, H. (2017). Power grid operation in a market environment. Journal of Economic efficiency
and risk mitigation, 34(15), 1222-1247.

80
Clark, C. W., Munro, G. R., & Sumaila, U. R. (2010). Limits to the Privatization of Fishery
Resources. Land Economics, 86(2), 209-218.
Clark, J. B. (2005). The Distribution of Wealth. A Theory of Wages, Interest and
Profits. Economic Drift, 4(34), 85.
Coooper, J., & Schindler, M. (2008). Perfect Sample Size in Research (2nd ed.). Albany, NY:
HarperCollins Publishers.
Crowder, S. (2012). Privatization. Rochester, NY: World Technologies.
Crump, L. (2011). Negotiation Process and Negotiation Context. International
Negotiation, 16(2), 197-227.
Cunha, R. C., & Cooper, C. L. (2002). Does privatization affect corporate culture and employee
wellbeing? Journal of Managerial Psychology, 17(1), 21-49.
Debrah, Y. A., & Toroitich, O. K. (2005). The making of an African success story: The
privatization of Kenya Airways. Thunderbird International Business Review, 47(2), 205-
230.
Domney, M. D., Wilson, H. I., & Chen, E. (2015). Natural monopoly privatisation under different
regulatory regimes. International Journal of Public Sector Management, 18(3), 274-292.
Fauzi, H., & Musallam, S. R. (2015). Corporate ownership and company performance: a study of
Malaysian listed companies. Social Responsibility Journal, 11(3), 439-448.
Halachmi, A. (2002). Performance measurement and government productivity. Work
Study, 51(2), 63-73.
Hanousek, J., & Fungacova, Z. (2006). A Castle Built on Sand: The Effects of Mass Privatization
on Stock Market Creation in Transition Economies. SSRN Electronic Journal, 4(34),
2007-2019. doi:10.2139/ssrn.1002518
Haugen, D. M., & Musser, S. (2011). Unemployment (2nd ed.). Detroit, NY: Greenhaven Press.
Healey, J. (2004). Unemployment (4th ed.). Thirroul, DE: Spinney Press.
81
Hidalgo-Gallego, S., Martínez-San Román, V., & Núñez-Sánchez, R. (2017). Estimation of
Allocative Efficiency in Airports for a Pre-Privatization Period. Advances in Airline
Economics, 4(35), 69-95.
Huang, C., Watson, S., & Chen, J. (2013). Putting 'Why' Before 'How': Evaluating the Rationales
for Partial Privatisation of State-Owned Enterprises in New Zealand. SSRN Electronic
Journal, 5(4), 2356.
Hutton, T., Kane, Bellman, G., Riesgraf, B., & Hodge, A. (2012). Twentieth Century Fox Home
Entertainment. The 4th season, 23(56), 306-308.
Ims, O. K., & Seiffert, T. S. (2015). The effects of post-privatization government divestment on
the financial and operating performance of state owned enterprises in
Scandinavia (Unpublished master's thesis). University of Stavanger, Norway, DE.
International Monetary Fund, & International Monetary Fund. (1999). IMF/Survey Issue. New
York, NY: Rhoyen.
International Monetary Fund. (1999). Direction of trade statistics (14). Albany. NY: Terry
Publishers.
Jelic, R., Briston, R., & Aussenegg, W. (2003). The Choice of Privatization Method and the
Financial Performance of Newly Privatized Firms in Transition Economies. Journal of
Business Finance and Accounting, 30(7), 905-940.
Kerr, J., & Qiu, M. (2007). Privatisation in New Zealand and Australia: an empirical
analysis. Managerial Finance, 34(1), 41-52.
Kuada, J. (2012). Research Methodology: A Project Guide for University Students (2nd ed.).
London, UK: Samfundslitteratur.
La Porta, R., & Lopez-de-Silanes, F. (1999). The Benefits of Privatization: Evidence from
Mexico. The Quarterly Journal of Economics, 114(4), 1193-1242.
82
Lam, N. M. (2016). Business-government relationship in economic development. Asian
Education and Development Studies, 5(4), 362-370.
Lesorogol, C. K. (2010). The Impact of Privatization on Land Inheritance among Samburu
Pastoralists in Kenya. Development and Change, 41(6), 1091-1116.
Libby, R., Libby, P. A., Short, D. G., Kanaan G., & Sterling M. (2017). Financial
accounting (5th ed.). Rochester, NY: Radius Book Group.
Lieberman, I. (2007). Privatization in the Transition Economies: an Introduction. Privatization in
Transition Economies: The Ongoing Story, 5(32), 1-8.
Linz, S. J., & Rakhovsky, I. (2011). Analyzing the efficiency of Russian firms. Journal of
Economic Studies, 38(4), 430-451.
Lurie, L. (2018). Pension Privatization in Israel. The Privatization of Israel, 101-121.
Mahmoud, M. (1992). Privatization: A Solution to Problems of Public Enterprises. Journal of
King Abdulaziz University-Economics and Administration, 5(1), 33-49.
Makokha, R. A. (2013). The Effect of Privatization on Financial Performance of Firms Listed at
the Nairobi Securities Exchange (Unpublished master's thesis). University of Nairobi,
Nairobi, Kenya.
Maude, B. (2014). Negotiation Process. International Business Negotiation, 1(2), 80-103.
McCumber, W. R. (2015). Ownership Matters: The Capital Structure of Private
Firms. International Corporate Governance, 4(21), 207-238.
McGuckin, R. H., & Dougherty, S. M. (2002, July). Restructuring Chinese enterprises: The
effects of federalism and privatization initiatives on business performance. Paper
presented at Chinese enterprises, New York.
Mercille, J., & Murphy, E. (2017). What is privatization? A political economy
framework. Environment and Planning A, 49(5), 1040-1059.
Michigan D. (2001). Privatization (1st Ed.). New York, NY: Lansing Publishers.
83
Mladek, J. (1997). Initialization of Privatization through Restitution and Small
Privatization. International Studies in Economics and Econometrics, 4(30), 45-54.
Mulaku, D. O., & Ahmed, A. H. (2014). The Effects of Privatization on the Financial
Performance of Kenya Airways. International Journal of Business and Commerce,, 3(5),
10-26.
Naito, T. (2011). Urban-rural migration, unemployment, and privatization: a synthesis of Harris-
Todaro model and a mixed duopoly. Letters in Spatial and Resource Sciences, 5(2), 85-
94.
Naito, T. (2013). Privatization of Public Firms and Urban Unemployment in an Integrated
Economy. Review of Urban & Regional Development Studies, 25(2), 93-106.
Nyongo, A. (2000). The context of privatization in Kenya. Journal of African Academy of
Sciences, 1(1), 117-120.
Obadan, M. I. (2008). Economic and social impact of privatization of state-owned enterprises in
Africa. Council for the Development of Social Science Research in Africa, 45(3), 345-346.
Ochieng, M. D., & Ahmed, A. H. (2014). The Effects of Privatization on the Financial
Performance of Kenya Airways. International Journal of Business and Commerce, 3(5),
10-26.
Ohemeng, F. K., & Grant, J. K. (2008). When markets fail to deliver: An examination of the
privatization and de-privatization of water and wastewater services delivery in Hamilton,
Canada. Canadian Public Administration, 51(3), 475-499.
Osman, O. (2014). Emerging Governance and Economic Issues in Construction Industry in
Malaysia (Penerbit USM) (3rd ed.). Penang, Malaysia: Penerbit USM.
Otieno, W. (2015). Privatization of Kenyan Public Universities. International Higher
Education, 3(36), 235-456.

84
Paramasivan, C., & Subramanian, T. (2009). Financial management (3rd ed.). New Delhi, CT:
New Age International Publishers.
Parker, D. (2003). Performance, risk and strategy in privatised, regulated industries. International
Journal of Public Sector Management, 16(1), 75-100.
Patena, W., & Błaszczyk, B. (2016). Post-Privatisation Corporate Performance in Poland.
Evidence from Companies Privatized in 2008-2011. SSRN Electronic Journal, 4(20), 123-
147.
Penning, A. (2012). Financial performance (3rd ed.). Worcester, CT: Osborne Books.
Pi, J., & Yin, J. (2016). Privatization, Unemployment, and Welfare in the Harris-Todaro Model
with a Mixed Duopoly. The B.E. Journal of Economic Analysis & Policy, 16(4), 234-453.
Ramamurti, R. (2016). Internationalization and innovation in emerging markets. Strategic
Management Journal, 37(13), E74-E83.
Richardson, J. (1991). Privatization: A sourcebook. Government Publications Review, 18(3), 290-
291.
Sammy, W. (2004). Water privatization in Kenya (5). Nairobi, KY: Longman Publishers Kenya.
Saunders, M., Lewis, P., & Thornhill, A. (2009). Research methods for business
students (3rd ed.). Mount Vernon, CT: Pearson education.
Schiffler, M. (2015). Water, politics and money: A reality check on privatization. (1st ed.). New
York, NY: HarperCollins Publishers.
Sekaran, U., & Bougie, R. (2016). Research Methods For Business: A Skill Building
Approach (5th ed.). Hoboken, NJ: John Wiley & Sons.
Shiffer, V. (2018). The Impact of Privatization on the Non-profit Sector and on Civil Society in
Israel. The Privatization of Israel, 4(2), 341-364.
Tiemann, O., & Schreyögg, J. (2012). Changes in hospital efficiency after privatization. Health
Care Management Science, 15(4), 310-326.
85
Tullio, G., & Wolters, J. (2004). Domestic and International Determinants of the Bank of
England’s Liquidity Ratios during the Classical Gold Standard, 1876–1913: An
Econometric Analysis. Advances in Computational Economics, 2(23), 221-240.
Vo, T. Q., Swierczek, F. W., & Nguyen, D. K. (2013). Corporate Performance Of Privatized
Firms In Vietnam. Journal of Applied Business Research (JABR), 29(5), 1437.
Wieland, S., & Flavel, B. S. (2015). The relationship between employee orientation, financial
performance and leverage. Social Responsibility Journal, 11(4), 716-733.
Winston, C. E. (2010). Last exit: Privatization and deregulation of the U.S. transportation
system (2nd ed.). Washington, NY: Brookings Institution Press.
The World Bank Annual Report 2013. (2013). World Bank Annual Report, 2(23), 12-34.
Worsnop, R. L. (1992). Privatization (3rd ed.). Washington, DC: Brookings Institution Press.
Zarei, B., Amanati, F., & Amanati, K. (2017). Privatization and corporate entrepreneurship in
telecommunication companies. Journal of Entrepreneurship and Public Policy, 6(1), 60-
71.
Zarei, B., Amanati, F., & Amanati, K. (2017). Privatization and corporate entrepreneurship in
telecommunication companies. Journal of Entrepreneurship and Public Policy, 6(1), 60-
71.
Zhang, G. (2013). Accounting Measures of Value Generation: The Residual Income
Model. Accounting Information and Equity Valuation, 1-17.
Zikmund, W. G., Babin, B. J., Carr, J. C., & Griffin, M. (2013). Business research methods.
Washington, DC: CQ Press.

86
APPENDIX A: INTRODUCTION LETTER
GEORGE MUCHIRI
UNITED STATES INTERNATIONAL UNIVERSITY-AFRICA
P.O BOX 14634-00800
NAIROBI
Dear Respondent,
I am a final year student at United States International University pursuing Masters of
Business Administration in Finance. Am carrying out a research on the Privatization and
Financial Performance of Government Firms in Kenya. The objectives of the study are to
determine financial performance before privatization, financial performance after
privatization and the measures of improving privatization process in government firms.
The target population are the employees in the management department in the privatized
firms in kenya. The data collected will be only used for academic purposes and
confidentiality will be highly observed.
None of your private information will appear in the research. Thank you.
Yours faithfully,
George Muchiri
Researcher

87
APPENDIX B: QUESTIONNAIRE
PART 1: Demographic Information
Please answer the questions by ticking in the correct box which suits your answer or
write in the provided spaces.
1. Management Level
Junior Management Middle Management Senior Management
2. Gender Male Female
3. Age
20-30 years 31-40 years 41-50 years 51 years and above
4. Marital Status
Single Married
5. How many years of experience in the current position?
1) Less than 2 years
2) 2-5 years
3) 6-9 years
4) 10 years and above
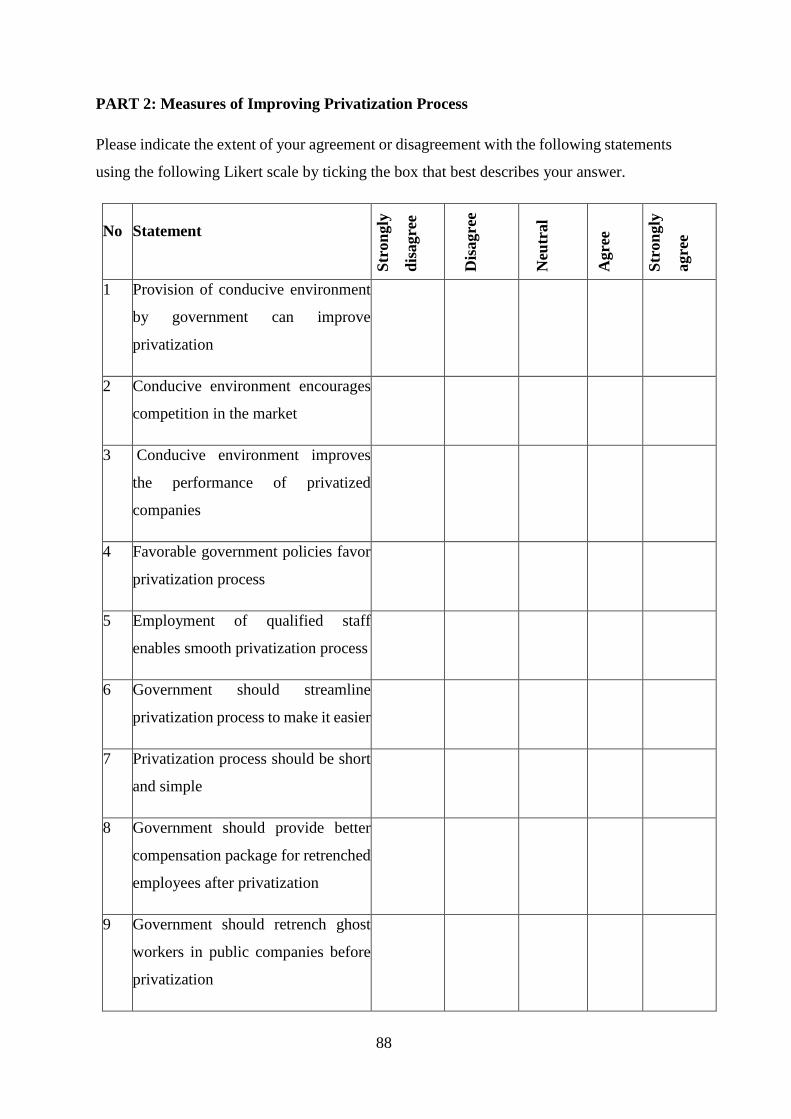
88
PART 2: Measures of Improving Privatization Process
Please indicate the extent of your agreement or disagreement with the following statements
using the following Likert scale by ticking the box that best describes your answer.
No Statement
Str
on
gly
dis
agre
e
Dis
agre
e
Neu
tral
Agre
e
Str
on
gly
agre
e
1 Provision of conducive environment
by government can improve
privatization
2 Conducive environment encourages
competition in the market
3 Conducive environment improves
the performance of privatized
companies
4 Favorable government policies favor
privatization process
5 Employment of qualified staff
enables smooth privatization process
6 Government should streamline
privatization process to make it easier
7 Privatization process should be short
and simple
8 Government should provide better
compensation package for retrenched
employees after privatization
9 Government should retrench ghost
workers in public companies before
privatization

89
10 Government should make
privatization process economical to
investors
11. What other measures can be used to improve privatization process?
………………………………………………………………………………………………
………………………………………………………………………………………………
………………………………………………………………………………………………
………………………………………………………………………………………………
………………………………………………………………………………………………
………………………………………………………………………………………………
Thank you for your cooperation
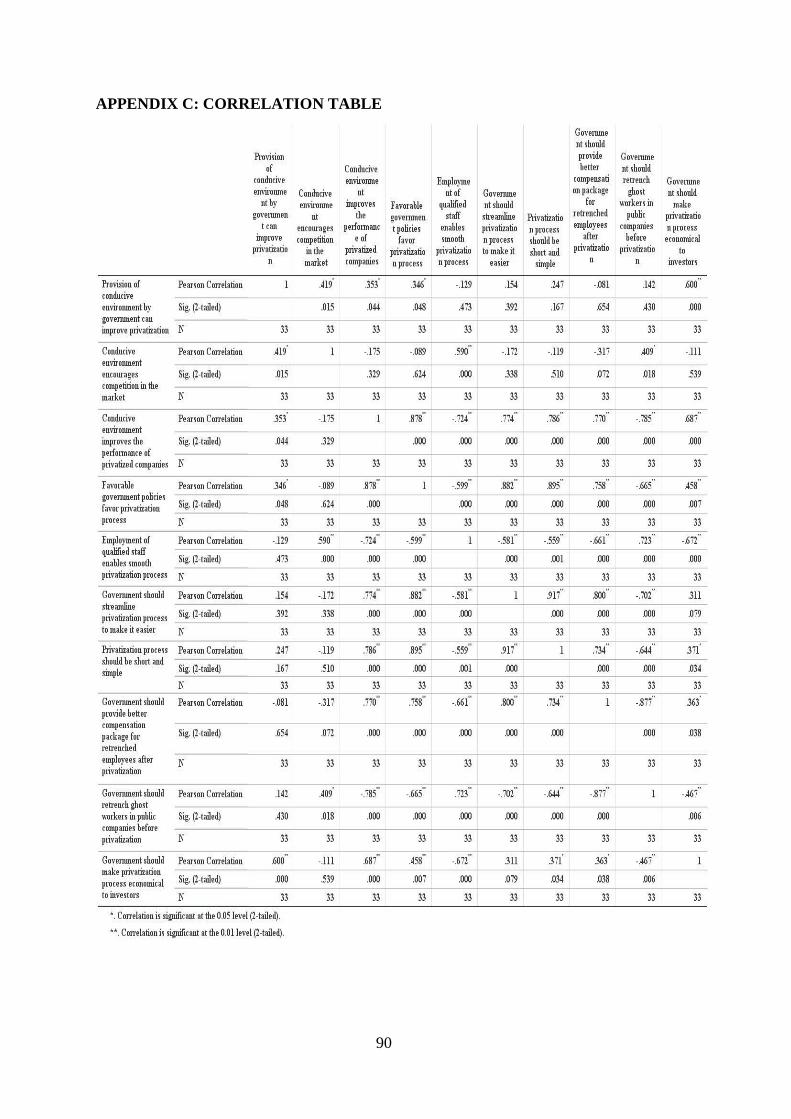
90
APPENDIX C: CORRELATION TABLE
Related Documents