Priority-Based Multidimensional Poverty Christophe Muller (Aix-Marseille University, France) Paper prepared for the 34 th IARIW General Conference Dresden, Germany, August 21-27, 2016 Session 7B: New Approaches to Studying the Causes and Consequences of Poverty, Inequality, Polarization, and Social Conflict Time: Friday, August 26, 2016 [Morning]

Welcome message from author
This document is posted to help you gain knowledge. Please leave a comment to let me know what you think about it! Share it to your friends and learn new things together.
Transcript
Priority-Based Multidimensional Poverty
Christophe Muller (Aix-Marseille University, France)
Paper prepared for the 34
th IARIW General Conference
Dresden, Germany, August 21-27, 2016
Session 7B: New Approaches to Studying the Causes and Consequences of Poverty, Inequality, Polarization, and
Social Conflict
Time: Friday, August 26, 2016 [Morning]

Priority-Based Multidimensional Poverty
Christophe Muller
Aix-Marseille University (Aix-Marseille School of Economics), CNRS & EHESS,
Centre de la Vieille Charité, 2, rue de la Charité, 13 002 Marseille, France.
August 2016
Abstract:
In this paper, we propose a new methodology of multidimensional poverty
measurement based on self-stated responses to household spending priorities. This
information is first used to reveal what the relevant deprivations are. Then, the stated
top priorities allow us to identify the poor. Finally, for each household, the deprivations
are aggregated according to relative weights computed from the data on priorities.
This allows us to: (1) eliminate ‘Command’ variables in favour of ‘Intrinsic’ wellbeing
variables; (2) deal with needs heterogeneity, (3) avoid the arbitrariness typically arising
in multidimensional poverty indices.
Finally, we propose an empirical application to Seychelles that: (1) elicits what the main
deprivation dimensions are, (2) delivers a realistic estimated incidence of poverty, (3)
show the targeting consequences of using multidimensional poverty indicators rather
than one-dimensional poverty indicators.
Keywords: Poverty, Multidimensional Welfare, Priorities.
JEL codes: I32, O15, C83.
2
1. Introduction
1.1. Multidimensional poverty indices
Even if one-dimensional poverty and deprivation measures based on income
dominate the economic literature, many authors argue that multiple wellbeing attributes
must be accounted for.1
In this paper, we propose a new methodology of multidimensional poverty
measurement. Our approach is based on using self-stated responses to household
spending priorities. This information is first used to reveal what the relevant
deprivations are. Moreover, the stated top priorities allow us to identify the poor.
Finally, for each household, the deprivations are aggregated according to relative
weights computed from the data on priorities. We justify this procedure by a set of
axioms.
Using the priorities data in such a way allows us to: (1) eliminate ‘Command variables’
in favour of ‘intrinsic wellbeing variables’, which corresponds better to the ‘basic needs
approach’, (2) deal with needs heterogeneity, and (3) avoid the arbitrariness that
typically arises in many stages of the specification of multidimensional poverty indices.
1 See for example Osberg and Sharpe (2002), Duclos, Sahn and Younger (2006a, 6b), Bourguignon and
Chakravarty (2003), Atkinson (2003), Deutsch and Silber (2005).

3
In the literature, poverty analyses can be extended to multidimensional contexts by
specifying properties of household utilities and to aggregate them, allowing for poverty
thresholds in terms of utility levels.2 However, instead we follow the non-welfarist
approach that expresses poverty directly in terms of observable welfare attributes rather
than unobservable utilities.
Amid the authors that have proposed Multidimensional Poverty Indices (MPI) in the
literature, Chakravarty and Bourguignon (2003), Alkire and Foster (2009, 10, 11),
Alkire and Santos (2010) and Belhadj (2012) all aggregate individual poverty features
into a synthetic ‘individual poverty score’. These scores are summed up at country level
to yield formula for poverty.
However, in practice in many middle-income countries, the applied MPIs used in the
empirical literature may not appear as being terribly relevant. Indeed, in these countries
the general living conditions may be good enough so that in practice almost nobody is
observed in household surveys as living in a shack, having toilets outdoors, having a
house with dirt soil or malnourished children, etc.3 But in these countries there are still
poor people that are legitimate targets for social policy. These poor are missed by the
MPIs, because the used deprivation indicators are not well in phase with the actual
needs as felt by the households themselves.
Another shortcoming of these MPIs is that they are aggregating heterogeneous basic
deprivation indicators, while it is not always clear what the justification of adding such
indicators is, as income per capita and life expectancy for example, and using arbitrary
2 Atkinson and Bourguignon (1982), Muller and Trannoy (2011, 2012), Decanq, Fleurbaey and Maniquet
(2013). 3 This is the case for example in Seychelles (Muller, 2012b).

4
weights.4 Various issues of arbitrariness typically arise with the construction of these
MPIs: Which deprivation dimensions? Command variables or basic needs variables?
How to deal with needs heterogeneity? Which aggregation weights? Moreover, it may
be debatable that, when it is done, counting heterogeneous dimensions constitutes an
accurate basis for incorporating multidimensionality in poverty analyses. Instead, in this
paper we propose to use information on spending priorities, in part because they may be
related to the fulfilment of basic needs.
1.2. Basic needs
The basic needs approach emphasizes human development as first fulfilling a set of
fundamental needs, rather than placing all the attention on income factors. This implies
to separate basic needs from less urgent needs.
Degrees of wellbeing needs
Separating the sets of dimensions for identifying the poor and quantifying poverty
levels can be justified by the existence of two (or several) degrees of wellbeing
priorities. This is often what is done in the development literature dealing with ‘basic
needs’ (as in DasGupta, 1993). For example, it has been claimed that such ‘advanced
needs or rights’ - such as democracy, culture, television, holiday - make only sense for
people that are already able to feed themselves, have reached decent health statuses and
4 See Cavapozzi et al. (2013) and Decancq and Lugo (2013) for dicusssions of the weights. Poverty
measures that follow Alkire and Foster methodology are implemented by Alkire and Santos (2010) based
on ten variables linked to living standards, health and education. A weighted score is calculated from
adding deprivation indices in these ten dimensions. Then, a multidimensional poor is characterised as
someone deprived across at least thirty percent of the weighed score.

5
have moved away from the strict concerns of immediate survival or acute sufferings.
There is an abundant and varied philosophical, psychological, sociological and
economic literature on hierarchies of needs, starting with Aristotle’s Nichomadean
ethics.5
For example, Streeten (1981) claims that ‘the basic needs concept is a reminder that the
objective of the development effort is to provide all human beings with the opportunity
for a full life.’ He defines basic needs in terms of commodities. Instead, Sen (1984,
1987), considers that some functionings can be achieved not only when some
elementary life basis is guaranteed. For example, one may not be able to work or enjoy
normal social life when one is severely ill or badly undernourished, or have no clothes.
Practical definitions of basic needs
The basic needs approach, introduced at an ILO conference in 1976 (Jolly, 1976), is at
the core of most measurement attempts of absolute poverty in LDCs. It requires the
measurement of minimum resources for long term physical wellbeing, or at least
survival. It has shaped poverty alleviation policies of governments and aid agencies all
over the world, although different agencies and administrations often use different
definitions of these needs.
The basic needs required for physiological survival seem to be: nutrition, drinkable
water, medical care, shelter, and perhaps clothing or other environmental resources.
5 Aristotle (IVth century B.C.), Maslow (1943), Vlastov (1962), Rawls (1972), Streeten (1981), Sen
(1984, 1987), Silber et aL. AV, Muller (2016).

6
They can be proposed by rough aggregate indicators, such as the percentage of
households having access to clean water, the proportion of undernourished persons, the
number of doctors per 100 000 individuals, etc. The distribution or the availability of
these kinds of wellbeing inputs often elicits major social policy questions.
Urgency has been used as a way to identify basic needs (Scanlon, 1975). Food is urgent
for hungry people, as medical care is for ill persons. This urgency may justify
separating basic needs from other needs.
Even though basic needs provide a motivation for a certain degree of priority or urgency
at fulfilling these needs, no society has so far chosen to devote all its resources to this
goal, before of turning to other needs. It may partly be because needs are individuals
and the feeling of priority may not be so easy to share with a person that is not deprived,
at the cost of her resources. Also, different priorities may be valued differently by
different persons. Moreover, satisfies basic needs does not necessary implies that life is
enjoyable. So, other goods that would make life enjoyable may enter poverty evaluation
too, albeit perhaps in a second stage.
Being able to distinguish degrees of needs is also useful because it may allow for the
definition of a target population for poverty alleviation policies by only using limited
information.
Moreover, allowing different priorities degrees of attributes may make policy design
easier under budget restrictions and increasing returns to scale in production of social
services. In that case, it may be more efficient to focus on a limited set of attributes
7
rather than spreading interventions too thinly with too few results. This also allows for
two-stage budgeting under weak separability of the social objective. Donner exps
application It seems that this is also how most social systems operate, whether
traditional or modern ones. They are structured around a nomenclature of needs that
roughly correspond to the division of administrations in departments in ministries of
health, education and social security.
1.3. The new method
We now discuss our new method. Spending priority data is used in the specification at
three stages: the revelation of what the deprivation dimensions are, the selection of top
priorities for the identification of the poor, the aggregation of the deprivations by using
information about these priorities. The data on spending priorities come from the survey
question:
“To what would you spend a small additional sum of money?”
Other question framing could be used, although we focus on this one in this paper6. We
believe that the question asked helped us eliciting priorities through the reference to
concrete spending decisions. For example; even if some welfare attributes are not
market goods, say health status, they can generally be improved by acquiring related
goods and services, e.g., health care services, and applying some technological process.
In that sense, the reference to expenditure is not used for anchoring the welfare measure
6 A potential issue is the sensitivity of answers to some implicit or explicit additional amount proposed, or
to many usual framing effects in surveys. Also, one could distinguish the effect of potential changes in
wage income, for example, and the potential changes in constrained consumption expenditure. One could
also examine the effect of taking money away from the respondents. What we propose is therefore to
examine one option among many.
8
on income or expenditure, but rather as a collection device for eliciting some
dimensions of deprivation.
There are multiple advantages to our approach. It eliminates ‘Command variables’ in
favour of ‘intrinsic wellbeing variables’: basic needs. It avoids the arbitrariness that
typically arises in many stages of construction of multidimensional poverty indices. It is
easier to elicit deprivations by looking at expenditure priorities. It avoids issues of needs
heterogeneity by using self-stated deprivation information. Finally, it allows the use of
exclusively discrete information, at least for evaluation poverty incidence.
The interviewed households themselves can sometimes deal with needs heterogeneity
when they assess subjectively their own needs, which they usually know better than
anyone else. In such situations, using direct self-stated deprivation information, even if
discrete and simple, may yield more sensible results than trying to calculate deprivation
indices by comparing measures of dimension-specific household expenditure with
dimension-specific subsistence minima. This is the approach we follow, as a simple
way of dealing with heterogeneity in needs. It is in a sense more general than using
individual wellbeing indicators, and we make it practical by pointing households at their
own spending priorities in a specific questionnaire.
In Section 2, we present the methodology for our new multidimensional poverty
measures, which are based on household spending priorities. In Section 3, we report an
empirical application to Seychelles and Mauritius. Finally, Section 4 concludes.
9
2. Priority-Based Multidimensional Poverty Indicators
2.1. Axiomatics and notations
A study of the interaction of these axioms, when there are several levels of goods,
allows for the dissociation of the identification of the poor and the quantification of
poverty intensity for multidimensional poverty, is in Muller (2016). Defining degrees of
priorities for wellbeing attributes is a special case of such general setting. Many
different combinations of axioms may be considered in this framework. However, for
our current concern, they should all elicit the following features.
First, the complete set of relevant wellbeing attribute to consider must be defined.
Already at this stage, using information on priorities can play a role. For example, one
may restrict the attention to the attributes that have been stated as a priority by at least
one person. Second, there are ‘technical’ axioms, which we do not discuss here, that are
common to most attempts of defining poverty measures: axioms for continuity,
derivability, normalization, population scale invariance, etc. Third, one should use less
information for identifying the poor than quantifying total poverty quantity. In our case,
this suggests to consider a subset of ‘priority’ wellbeing attributes for identifying the
poor, and possibly larger set for quantifying total poverty. They correspond to some
kind of partial focus axioms that can be applied to three levels: poverty incidence,
poverty intensity or global multidimensional poverty. Fourth, some axioms should
restrict the may the individual deprivations on the selected attributes can be gathered to
form individual poverty scores. Typically, transfer axioms or properties specifying
poverty severity varying with some wellbeing attributes can be mobilised at this stage.

10
Fifth, decomposition axioms (or Pareto axioms) can be used for guiding the aggregation
of individual poverty scores.
In this paper, we shall refer to other works for the precise axiomatic discussion for
deriving formulae of poverty measures, so as to focus in this paper on pragmatic and
concrete issues. However, a few notations are useful to clarify later on our formulae for
multidimensional poverty.
Let us consider a population of n individuals. Individual i is characterised by a m-rows
vector of deprivation indices, di in Rm
+. We assume that all the deprivation indices are
non-negative since it is generally the case in applied work7. However, this restriction
does not play a role in the discussion. Let Mn be the set of all n x m matrices of
nonnegative numbers. In order to consider all possible population sizes, one may want
to define M as the union of all sets Mn, for all population sizes n. This set describes all
the relevant poverty situations, one may want to examine.
The matrix D of deprivations is defined by its row-vectors di , i = 1,...,n. Its typical
element is dij, the quantity of the wellbeing deprivation in dimension j suffered by
individual i. Thus, the jth
column of D describes the sample distribution of the jth
deprivation attribute and is denoted dj. A ‘meagre attribute’ j for individual i is defined
by dij > 0, a ‘non-meagre attribute’ by dij = 0.
7 Note that our approach is thus more general than just specifying indicators from wellbeing attributes. In
particular, it includes the case where z is the m-vector of the m dimension-specific poverty lines (zj, for j
= 1,…, m) and an individual i is said ‘poor in the jth
attribute’ if xij < zj, where xij is the jth
welfare attribute
of individual i,
11
2.2. Identifying the wellbeing attributes
A major step in defining multidimensional poverty indicators is the selection of the
relevant wellbeing dimensions to consider. Thorbecke (2011) emphasizes that this
selection is ultimately dependent on the purpose they should serve. First, each
considered welfare dimensions must be meaningful and well-recognized as central to
poverty. This is for example the case for income and health status, or any basic needs.
Second, some corresponding data must be available. There is no use, at least for policy
guidance, to develop indicators that could not be calculated. Finally, only dimensions
for which non-negligible poverty issues have been measured need be included.
Incorporating a dimension for which nobody can be considered poor should not change
the level of the multidimensional poverty indicator.
In theory, wellbeing attributes should be intrinsically good and directly deliver
wellbeing or utility. However, in practice, some variables used as wellbeing attributes in
the literature, such as income and perhaps education, are rather justified by the fact that
they command over commodities, while other variables may instead directly produce
well being. Nonetheless, there may still be good reasons for using variables that
command over well-being attributes in multidimensional poverty analyses. First, these
variables can be observed, while more direct measures of wellbeing or satisfaction may
not come handy. Second, they summarize a great deal of information, as it is case for
total expenditure that encompasses many elementary consumption goods. For example,
the HDI or the MPI in UNDP (2010, 2011) mix information on income, education and
longevity, which are all variables allowing commands. Besides, some of these
command variables may also provide direct wellbeing benefits.
12
However, these justifications for using instruments commanding other wellbeing
variables are only practical. If it is possible, one should rather define poverty in terms of
direct satisfaction of basic needs. As a matter of fact, relevant normative information is
often easier to elicit in terms of dissatisfaction of some basic needs. For example, one
can refer to the budget necessary for acquiring some specific goods or services. This is
our approach.
Our new approach is first based on accounting for priorities in meagre welfare attributes,
as stated by the households themselves; and second, when considering the list of
dimensions, on disconnecting the identification of the poor from the quantification of
the poverty level.
As mentioned below, there are many theoretical ways to consider household priorities
(See Muller, 2014 for a detailed discussion). However, in this paper we adopt a practical
approach by merely considering them as relevant building-block information for
constructing a poverty indicator. In the data that we collected, we use the answers to the
question ‘To what would you spend a small additional sum of money?’ as our
information basis to define each household welfare priority. Then, different surveyed
households may cast different answers.
Finally, note that if subjective information about priorities is the source of the
architecture of our poverty indictors, the precise measures of deprivations are generally
constructed from objective information, which is less sensitive to the psychological
fragility of subjective responses.

13
2.3. Identifying the poor
In traditional monetary poverty analysis, a person is deemed poor if her/his living
standard falls below a given monetary poverty line. Instead, in the ‘Intersection
approach’ of multidimensional analyses, one states that a poor is an individual who is
poor in all wellbeing dimensions. Unfortunately, this approach often leads empirically
to very small estimated numbers of poor persons. Moreover, one would like to consider
as poor some households who may not have a very low income level, while they may be
deprived on other grounds. An important justification of constructing multidimensional
indicators is indeed to rescue miserable households who would not pass a means test of
income used for allocating social benefits.
In the alternative ‘Union approach’, adopted by Bourguignon and Chakravarty (2003), a
person is poor if she falls below at least one of the dimension-specific poverty lines.
This approach is often preferred as it avoids missing a relevant destitute individual. One
issue with this approach in empirical analyses is that encompassing many welfare
dimensions generally yields exaggeratedly high poverty incidence estimates.
Atkinson (2003) points out that the Intersection approach corresponds to so-called
‘ALEP substitute’ attributes, while the Union approach corresponds to ‘ALEP
complement’ attributes. 8
He also shows that only counting deprivations as a basis for
8 The individual poverty function p is the kernel of poverty indicators defined from integrals of this
function over the population of the poor. ALEP substitutes are defined by pjk > 0, for the individual

14
poverty measurement, as in Alkire and Foster (2011), may correspond to indicators such
that correlation increasing switches may increase or reduce poverty, which would
therefore conflict with Union or Intersection approaches.9 In this paper, we pursue
another direction to relax Intersection and Union approaches. Although, we still define
the poor from a Union criterion, the Union operation is carried out only for a subset of
wellbeing attributes, and this subset can be determined by and for each individual.
Moreover, we separately specify the quantity of poverty suffered by the poor, using all
the welfare attributes, in a fashion disconnected with the Union criterion.
Whatever the ultimate source of priority answers, one may choose to identify the poor
by checking if they are first deprived in the wellbeing dimension that is given the
highest priority, and then, if not, if they are deprived in the dimension with the second
highest priority, and so on until the last relevant priority dimension. However, when the
ranking of priorities is fixed a priori and is the same for all individuals, this way of
doing is exactly equivalent to the Union approach of identifying the poor. Such
conclusion is no longer valid if the ranking of priorities is not determined a priori, or if
it varies with time or with the contexts to compare, or if the ranking is heterogeneous
across individuals.
poverty function p(xi1,…,xij,…,xik,…,xim), where xij is the j
th welfare attribute of individual i. ALEP
complements correspond to pjk < 0. 9 Alkire and Foster (2011) and Aaberge and Peluso (2011) count deprivations in order to assess
multidimensional poverty. In each dimension, they use a poverty line to determine the individuals that are
deprived with respect to each given attribute. In addition, the poor are identified by counting the
dimensions in which they are deprived and comparing the resulting count to a chosen threshold k for
counts. Another shortcoming of this approach is that, as soon as k > 1, an individual with extreme
deprivation in one dimension only, e.g., food intakes, may not be considered as poor.
15
As we mentioned before, as soon as a few dimensions are considered, the Union
approach may yield unrealistically high poverty estimates. We deal with this issue in
two ways. First, we estimate from the household’s answers what is a central tendency of
the number of priorities to consider when defining the poor. In many situations, this
approach is likely to deliver a reasonable number of dimensions to consider. This
should attenuate the extreme results of Intersection and Union approaches based on all
possible dimensions. Second, we use a different set of dimensions to identify the poor
and to quantify poverty. That way, keeping only the highest priority deprivations to
identify the poor has the advantage of keeping corresponding estimated Union-approach
head-count index in the range of realistic levels. Besides, extending the number of
dimensions to consider in order to quantify poverty levels allows for a more complete
capture of household living conditions. Doing so also makes the omission of one or
several minor dimensions in the poverty index less dramatic, which corresponds to a
typical feature of data. As a matter of fact, it justifies most poverty analyses that are
typically carried out without observing well all wellbeing attributes.
An important parameter is therefore the number of high-priority dimensions that should
be used for identifying the poor. Diverse practical rules can be used to determine the
value of this parameter. A simple one is to estimate it from the household responses
when several priorities are asked. For example, a truncated count model can be
estimated and the estimated model can be used to estimate a central tendency of the
number of high-priority dimensions. This is likely to mitigate another arbitrary step in
the usual MPIs based on a priori given sets of dimensions.
16
That is not all. Estimates from count data models, or from other estimation methods, can
be obtained conditionally on individual or household characteristics of interest, for
example by region for geographic targeting, or by activity categories for employment
policies. In that sense, the multidimensional poverty notion can be finely tuned to fit
some characteristics of interest of the population. To do it + P-values
In particular, this allows for the variation of poverty criteria across strata, an important
flexibility requirement, for example frequently employed for poverty profiles where
poverty lines vary across regions.
To sum up, our rule for identifying the poor is the Union rule defined on the highest
stated priority dimensions. An estimated threshold is used to define the highest priority
dimensions. Besides, the data should often show obviously what they should be in
practice.
Once the population of the poor has been identified, individual poverty scores can be
constructed, typically in the form of linear combinations of destitution variables. The
shape of individual scores can also be sometimes justified by axioms used for
aggregating individuals and deprivation indices altogether. We now discuss the
aggregation of these individual deprivations over the whole population.
2.4. Aggregating individuals
In order to deal properly with aggregation issues, it is useful to examine which axioms
should be imposed on the multidimensional poverty measure. Bourguignon and
17
Chakravarty (1998, 2003) propose a systematic series of axioms that are formally
defined in the Appendix and are convenient tools for deriving functional forms.10
Most of these axioms are common and familiar to specialists. A few of them deserve
additional comments. The Strong Focus axiom (SF) forbids that an individual could
give up some amount of a non-meagre attribute to improve the level of a meagre
attribute. This axiom is defined by imposing that the poverty measure does not change
when the non-meagre attributes of any individual improve, including for the poor. The
Weak Focus axiom (WF) only assumes that the poverty measure is independent of the
attribute levels of the non-poor.
The One-Dimensional Transfer principle (OTP) assumes that poverty does not increase
under a progressive transfer. It is the usual axiom imposed for one-dimensional
monetary poverty measures such as the FGT severity poverty measure or the Watts
poverty measure.
How are these axioms related to aggregation and individual deprivation? Bourguignon
and Chakravarty show that the Subgroup Decomposability jointly to the One-
Dimensional Transfer principle imply that any differentiable poverty indicator P can be
written as a weighted mean of individual poverty contributions associated with each
individual i and each attribute j.
(*) P = 1/n ∑i ∑j wij gj(dij),
10
Strong Focus (SF), Weak focus (WF), Symmetry, Monotonicity, Continuity, Principle of Population,
Scale Invariance and Subgroup Decomposability, One Dimensional Transfer Principle (OTP),
Multidimensional Transfer Principle (MTP), Non-Decreasing Poverty under Correlation Increasing
Switch (NDCIS).

18
where wij is the priority weight of deprivation j for individual i and gj is a positive
numerical function to determinate.
Under these axioms, what matters for defining a multidimensional poverty measure is
therefore mostly to define the interacted individual-attribute contributions.
One major practical issue is that much of empirical data is available under discrete form.
This much limits the practical interest of specifying precisely the functions gj, and
simple function forms (e.g., the identity function) can probably be the only useful ones
in most empirical situations.
One advantage of using such additive poverty measure is that it allows us to identify the
contribution share of each attribute to global poverty, as well as the contribution share
for any subgroups of individuals, and even the contribution share of any combinations
of attributes interacted with individual subgroups. In this setting, one can also use
homogeneous positive weights wj, which are specific to each attribute j, in order to
account for differences in the importance of each attribute deprivation, without mixing
it with unobserved individual heterogeneity.
Of course, a still simpler way to assess poverty is just to count the poor. Let us consider
the Union approach. Let the dummy variable to identify the poor for individual i with a
vector of destitution di be p0(xi, z) = I[ ᴲ j in {1,…,n}, dij > 0]. Then, the number of the poor in
this approach is equal to H = ∑i p0(di).
19
Even though such a simple aggregation of deprivation indices is criticised in Ravallion
(2011, 2012). In particular, he is much concerned about the arbitrariness of hypotheses,
a pervasive feature of the literature about multidimensional poverty. First, the choice of
the welfare attributes itself is generally arbitrary. Second, the weights used to construct
the aggregate poverty score are also generally arbitrary. Although, many methods of
calculating the weights have been suggested, it seems fair to say to none has reached
general consensus.11
The weights are sometimes assumed to be identical across
dimensions, sometimes obtained from ancillary data and sometimes imposed using
normative opinions. However, the knowledge of which weights should be used remains
elusive.12
We propose an original way of generating weights, which is to refer to the
household self-stated welfare priorities. In the next sub-section, we discuss the use of
priorities data for specifying the dimensions involved in assessing poverty.
However, even if the estimated proportion of priorities can be derived from the data, the
precise derivation rule still requires some non-arbitrary justification. This can be done,
as for the definition of the two obtained sets of priorities, by invoking some vote
principle aggregating the household opinions. Several simple vote systems could thus
yield relevant central tendencies in the proportion of priorities (references).
11
See for example, Bossert, Chakravarty and D’Ambrosio (2009), Decancq and Lugo (2010) 12
Belhadj (2012) proposes an approach based on Fuzzy sets theory to account for such ambiguity.
Namely, he defines an identification (of the poor) function such that: (i) an individual that is not deprived
in any attribute is non-poor and the function takes the value 0; (ii) an individual that is deprived in all the
attributes is poor and the function takes the value 1; (iii) in the other cases the identification function can
take a positive value strictly inferior to 1. Then, the author derives a formula for the weights and the
poverty index by making the aggregation depend on the identification function.

20
2.5.Practical aggregation using priority data
We examine the different weights of each deprivation in the formula of the poverty
measure. One possibility is to consider weighted scores that are additive in all
deprivation indices, with decreasing weights according to decreasing priorities.
However, priority data is not as easy to aggregate without ambiguity as may be thought.
In particular, one cannot state that a person’s first priority is necessarily more important
than another person’s second priority, for example. Axioms about cardinality and
interpersonal comparisons, as for usual welfare analyses, may have to be invoked here
too for convenience.
One may want to specify ‘priority weights’ by deriving them from the statements of
individuals in the population. For example, the percentage of households stating a given
priority can be used as a natural way of specifying weights. One can also imagine some
vote rules that would yield the same result, and would help us getting around
comparability and cardinality issues. As a matter of fact, using observed frequencies of
priorities mimics the result of a proportional vote of relevant households on their
priorities. This procedure can be also be interpreted as reflecting expectations about
priorities when drawing households at random.
Availing of a vote procedure may be attractive for a social planner that would like to
take the information on priorities into account, while respecting individual sovereignty.
Such procedure could also incorporate other relevant useful information such as some
characteristics of these virtual voters.
21
Another perspective is that of the priorities of social planners themselves. One way to
proxy these priorities is, for example, to use the share of public budget allocated to
different social sectors as weights, or alternatively to use the corresponding share of
GDP (or of aggregate consumption) from national accounts.
As a consequence, our pragmatic indicator of multidimensional poverty incidence is the
following proportion of the poor based on the highest p priorities:
IM = 1/n ∑i {1 - П{j in PRi} (1 - Iij)},
where Iij = I[dij > 0] and PRi is the set of priorities retained for individual i. This latter case
corresponds to the Union approach based on the aggregated household priorities and
aggregated to the whole population. IM is merely the proportion of the population that
does not satisfy at least one of their priorities.
Proof: Since dij is the dummy indicator corresponding to deprivation in dimension j
suffered by individual i, we have Iij = I[dij > 0], which is 1 if the individual i is deprived in
dimension j, and 0 otherwise. Then, П{j in PRi} (1 - Iij) is equal to 1 if the individual i is
non-deprived in all priority dimensions, and otherwise. As a consequence, 1 - П{j in PRi}
(1 - Iij) is equal to 0 if the individual i is non-deprived in all priority dimensions, and to
1 if i is deprived at least in one priority dimension. The indicator is the mean of these
indices. QED.
22
Then, once the population of the poor is well defined, it is possible to refine the poverty
indicator by accounting for a certain ‘quantity’ of poverty or ‘poverty intensity’ for each
of the individuals identified as poor. For example, a formula such as above could be
used as a multidimensional poverty indicator that satisfies many useful properties.
A formula to insert
However, in practice, most available deprivation indicators are categorical or even
discrete. In that case, specifying more or less ‘poverty severity’ sensitivity by using a
poverty severity function in the formula of the poverty indicators is not likely to yield
terribly convincing empirical results. Our approach here is instead to introduce further
deprivation indicators corresponding to all levels of priority rather than account for their
counts as in Alkire and Foster. Our ‘poverty quantity’ indicator MP is a weighed sum of
deprivation indicators, albeit focusing only on the poor as defined by their highest
priorities. We obtain:
MP = 1/n ∑i [{ 1 - П{j in PRi} (1 - Iij)}{∑j wj Iij }],
where wj is the ‘priority’ weight allocated to attribute j. Obviously, one could also allow
for priority weights wij varying with the considered individual i, although this may often
be beyond the data possibilities.
Our multidimensional poverty indicator, MP, is therefore generated by first computing
at individual level the sum of all deprivation indices over all dimensions, weighted by
the aggregate priority weights for every dimension. Then, the obtained individual score

23
is multiplied by the dummy variable identifying the multidimensional poor, as above,
again accounting for priorities in the design of the corresponding Union criterion.
Finally, the results are summed over all individuals and divided by the population size.
Rawls (1972, p 5) argues that the conception of justice must be public. This suggests
using priority weights that would represent well the general interest and would be easy
to grasp by citizens. As we mentioned above, a natural candidate for this is to use the
relative frequencies of the different responses, as a basis for computing the wi’s. In a
more general sense, it seems important for the politically legitimate implementation of
poverty alleviation policies that the multidimensional poverty measure corresponds to
public norms in a robust, representative and objective way.
Consistently with these concerns, we choose to specify the weights wj as equal to the
proportion of monetary poor households who stated j as their first priority. Of course,
other rules could be used for the weights, while we show the estimates only for this
example.
AV if doable in fact If PRi and wij were allowed to vary with i, we could obtain an
interesting, but complicated analysis, which deserve a full investigation in itself.
In the present paper, we focus on simple practical rules where these parameters are
uniform over all the individuals. That is: the set of priorities and the weights are
identical for all individuals. Such simplification is mostly motivated by the need to
communicating simple formulae to governments and policy makers. In that case, the
indicator MP is fully defined by some choice of the priority set PR and of the weights wj.

24
Not trueThe fact that our index is a weighted mean of deprivation indices implies that it
is subgroup decomposable. This is important because among the interests of deriving a
measure of multidimensional poverty is the possibility of assessing the contribution of
each component of welfare in the form of a ‘share of poverty’.
2.6. Stochastic dominance
THIS SUBSECTION IS TO FINISH; PLEASE SKIP
However, even in situations in which PR is considered as known and the wj are
unknown, one would like to obtain unambiguous poverty comparison results. In that
case, stochastic dominance approaches imply that it is necessary and sufficient to class
the statistics
A revoir
∑i ∑j wj Ki Iij ,
where Ki = П{j in PRi} Iij and for any positive values of wj.
PB: aV comment traiter le choix de PR dans ces SD
The problem amounts therefore to comparing linear combinations of the AV Lij = Ki Iij
= ∑i Li W, where Li is an 1xJ row vector for individual i, and W is the column vector of
the wj.
25
A verif et exploiter
Voir le lien avec budget dominance
m.d.Since the wj are a basis on (0,1), we have the following results as soon as n>J :
Let ΔU = ∑i ΔLi W, where Δ denotes the difference operator between the two situations
to compare. Then, Let ΔU > 0 for all W is equivalent to:
∑i ΔLij > 0, for all j; which is equivalent to: ∑i Δ(Ki Iij) > 0, for all j; which is
equivalent to: ∑i Δ(I[dij > 0] { П{j in PRi} I[dij > 0] }) > 0, for all j. AV
The occurrence of dummy variables in this formula suggests to define the following
populations of interest.
POP1 = {i | П{j in PRi} I[dij > 0] } = Population of the poor identified by the Union
criterion applied to the priority attributes.
POP2j = {i | dij > 0 } = Population of the deprived in the jth
attribute.
AVThen, the condition ΔPoverty > 0 for all poverty measures in this family is
equivalent to
∑iPOP2j Δ{ П{j in PRi} I[dij > 0] } > 0, for all j,
which is equivalent to
Δ{ Number of poor among the deprived in the jth
attribute} > 0, for all j
A verif
and is equivalent to
26
∑iPOP1 Δ{ I[dij > 0] } > 0, for all j
and is equivalent to
Δ{ Number of the deprived in the jth
attribute among the poor} > 0, for all j.
We now apply our new indicators to the case of Seychelles.
3. Empirical Application
3.1. The context and the data
Seychelles is an upper middle-income country undertaking a transition from a socialist
welfare state to a market-based economy. As a small open and service-based economy,
it remains vulnerable to global shocks, which affect tourist arrivals, the main source of
foreign earnings. A macro-economic stabilization plan was recently carried out, along to
medium-term structural reforms, which were intensified at the end of 2008. These
policies coincided with the global economic slowdown that faded away in 2011, but
reemerged from 2012.
Inefficient targeting of social transfers plagues Seychelles’ generous social security
system (Campling et al., 2011). However, the reforms made the social system less
costly. Public sector transfers fell from 5.5 % GDP in 2005 to 1.9 % in 2009.
For one-dimensional monetary poverty in 1996, the estimated general poverty line was
worth 13554 Rupees per adult-equivalent per year. It corresponds to a broad notion of
27
poverty based on the opinions of Seychelles households on subsistence minima
expressed in terms of total consumption expenditure, including housing expenses. The
monetary poverty rate was of 17 % with 12 % of poor households (Muller, 2012a).
Monetary poverty was found higher in households led by female, little educated or
unemployed heads. In Seychelles, large families and fishermen families are especially
found to be affected by monetary poverty.
Insister plusWe designed the 2011 Living Conditions Survey (LCS), which was
conducted in collaboration with the National Bureau of Statistics, so as to provide
information on basic needs for a large set of welfare dimensions (Muller, 2013). A total
of 1,125 households were who had been randomly selected for the 2006/07 Household
Budget Survey (HBS) were re-surveyed and interviewed from February to June 2011.
The data was collected through 20 minutes interviews conducted in Seychelles Creole.
Households are asked their opinions not only about their own deprivations in diverse
welfare dimensions but also about their spending priorities. Such subjective information
has been used before in poverty analysis, for example for estimating poverty line (e.g.,
Pradhan and Ravallion, 2000). In this paper, we use answers about spending priorities to
provide a comprehensive procedure for multidimensional poverty analysis.
The collected responses show that deprivations in several welfare dimensions affect a
non-negligible population in Seychelles. One third of Seychelles households state that
they have some difficulty to obtain daily food, and another 5 % considerable difficulty.
About 7 % of households admit to wear worn clothes and 10 % not to have adequate
clothing for outing. A proportion of 15 % of persons have stated health problems in the
last twelve months, and this proportion reaches 47 % for the elderlies.
28
That is not all. In Seychelles, almost all households use gas or electricity as the energy
source for cooking or lighting. However, as much as 7 % of households admit to have
had electricity disconnected because of failure of payment during the past 12 months.
Besides, 11 % of households state that they had not been able to pay electricity in time.
In the same fashion, almost all households have access to treated water. Yet, 10 % of
the households state that they could not afford paying their water bill every month in the
last twelve months, and slightly less than 5 % that they suffered water disconnection.
Moreover, one fifth of households encounter difficulties in financing their transport
needs. Other 3 % meet considerable difficulties for paying, or cannot at all pay for their
transport. Unsatisfied education is probably more salient when there is at least one child
of schooling age in the household. Though, adult education is not unknown in the
Seychelles, and currently timely with many laid-off public employees during the recent
structural adjustment plan who are in need of reconversion. However, 21 % of
households state that they cannot afford school items. Moreover, 5.5 % of households
say that they don’t have the means to buy lunch for their children to take to school. This
is worrying in a country like Seychelles where education is mostly free of charge. Now,
these statistics may inform more on schooling needs for children than on current
education deprivation for adults, which could be better described by constrained adult
education levels.
29
3.2. The priorities data
To discuss table 1
We asked the surveyed households about what their first spending priorities would be if
they had a little more money. The needs elicited in this way rank as follows. 31 %
respond that they would spend it on shelter and 15 % on food, with the other response
categories less often chosen. Asking only the monetary poor households13
shows the
same pattern of answers on needs priorities. First, comes Shelter with 34.5 % of
responses, then Food (12.2%), Water and Electricity (9.1 %), Health (7.0 %),
Household appliances (5.6%), Other (3.5 %), Uniform/Shoes/School necessities (1.4 %),
Transportation (1.1 %), Holiday (1.1 %), etc. Focussing on the monetary poor has the
advantage of availing of priority information from households who are generally in dire
straits, and have an accurate perception of what their unsatisfied basic needs are.
We obtain the following rankings of basic needs priorities by the monetary poor: 1.
Shelter; 2. Food; 3. Water/Electricity; 4. Health; 5. Education. Holidays and household
appliances and other ‘non-severe-needs’ expenses also matter for these households,
while we choose not to assimilate them to basic needs. Note that this is an empirical
argument that has led us to the specification of the welfare dimensions, instead of
arbitrary choices as usual. We have also avoided ‘command variables’ like income,
using instead deprivation variables more directly related to basic needs.
13
As defined by comparing their 2005-06 per adult-equivalent total expenditure with the Seychelles
national poverty line deflated to correspond to this year.
30
AD toute la sous-section a partir de la
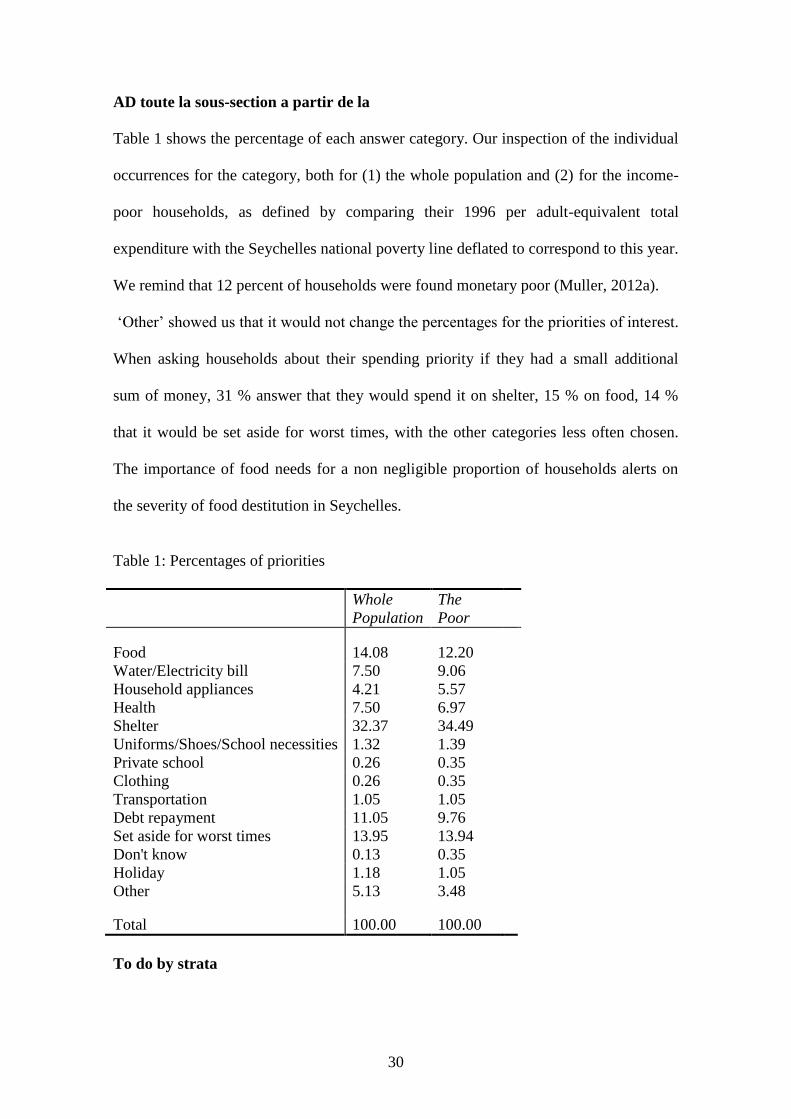
Table 1 shows the percentage of each answer category. Our inspection of the individual
occurrences for the category, both for (1) the whole population and (2) for the income-
poor households, as defined by comparing their 1996 per adult-equivalent total
expenditure with the Seychelles national poverty line deflated to correspond to this year.
We remind that 12 percent of households were found monetary poor (Muller, 2012a).
‘Other’ showed us that it would not change the percentages for the priorities of interest.
When asking households about their spending priority if they had a small additional
sum of money, 31 % answer that they would spend it on shelter, 15 % on food, 14 %
that it would be set aside for worst times, with the other categories less often chosen.
The importance of food needs for a non negligible proportion of households alerts on
the severity of food destitution in Seychelles.
Table 1: Percentages of priorities
Whole
Population
The
Poor
Food 14.08 12.20
Water/Electricity bill 7.50 9.06
Household appliances 4.21 5.57
Health 7.50 6.97
Shelter 32.37 34.49
Uniforms/Shoes/School necessities 1.32 1.39
Private school 0.26 0.35
Clothing 0.26 0.35
Transportation 1.05 1.05
Debt repayment 11.05 9.76
Set aside for worst times 13.95 13.94
Don't know 0.13 0.35
Holiday 1.18 1.05
Other 5.13 3.48
Total 100.00 100.00
To do by strata

31
Obviously, these answers incite us to give more importance to shelter needs than in any
typical poverty analyses in LDCs. Food appears also as a major dimension of the
expressed needs. The next priority is water and electricity payments that are grouped in
the priority questions. Health and education needs are still important, while they may
perhaps be better seen from direct description of the destitution rather than budget
information. Indeed, many health and education expenses are free in Seychelles.
However, despite mostly free health care and fee education, it is interesting to see that
some households still fell highly rationed in their corresponding needs, and would like
to correct this situation by additional spending. Clothing expenses are rarely mentioned
by the surveyed households. Note that the ranking of the welfare dimensions is obtained
from data examination, instead of arbitrary ‘expert opinions’.
In their responses, households have naturally avoided ‘command variables’ like income
and rather state their answers directly in terms of diverse destitution variables related to
basic needs. Some answers such as debt reimbursement or saving are important but they
do not necessary correspond to basic needs.
Which number of priorities? A central tendency for the number of priorities can be
extrapolated from estimating count data models using the number of priorities stated by
respondents: expected number or median number.
Possibly: conditional on some subpopulation characteristics (regions, activities), or
stratified. This is a derived number of attributes, although it still involves a
methodological choice.
Vote rules could help going around comparability and cardinality issues: e.g., median
value. Vote is attractive to public planners as it respects individual sovereignty

32
One may want to allow for possible variations of criteria across strata (here, regions for
example).
Truncated Negative
Binomial Tobit truncated in 0
and 3
Expected number of
priorities: 1.90 1.84
Expected median AF AF
Region 1 .213 (.16)
-.389* (.221)
Region 2 .177* (.10)
-.312** (.130)
Region 3 .077 (.10)
-.135 (.136)
Region 4 .175* (.10)
-.323** (.140)
Region 5 .216** (.10)
-.401*** (.137)
Children -.046* (.026)
.084*** (.033)
Cons. per adult eqt 8.57e-07* (5.43e-07)
-2.06e-06** (8.79e-07)

33
Intercept .52 (.095)
2.05*** (.121)
To aggregate regions in Mahe and others
Nb: Use these estimates to correcgt for some bias
The estimated expected number of priorities in the truncated count data shows that a
benchmark choice of two priorities only seems to be appropriate for all regions. In
contrast, the badly specified model would suggest alternatively one or two priorities,
depending on the considered region.
To compute the median by simulations, and the mode by cancelling the density
formula
Inserer des estimations d un truncated count model conditionally in several categs
of individuals
The multidimensional poor are therefore defined as being the individuals destitute in
food or in shelter. This result corresponds to the common knowledge among social
workers.
34
3.3. The deprivation indicators
Faire un second jeu d estimation avec les reponses aux questions subjectives
One the one hand, the variables that can be used to describe the welfare dimensions are
restricted to the available information in the survey. On the other hand, we want to
favour basic needs information over the use of command variables. We also want to
take advantage of using destitution information to deal directly with needs
heterogeneity. In practice, the sample must be reduced to 783 observations because of
missing values for some of the used destitution variables.
We now discuss the practical construction of the deprivation indicators for each of the
five identified dimensions, under the constraint of the available information. These
variables were the result of extensive discussions and consultations within the National
Committee for Multidimensional Poverty that has been officially set up by the
government of the Seychelles. We believe that it is important to acknowledge the
recommendations of national expert bodies, even though these may differ from our
personal preferences. Indeed, ultimately the national administration will have to
implement the poverty alleviation policies. Then, they need to be convinced and take
ownership of the poverty statistics. The measure of shelter deprivation is based on the
number of persons per room, which ranges from 0.125 to 7, has a mean 1.05 and a
standard deviation 1.07. More precisely, the variable ‘shelter deprivation’ is defined as
the dummy variable for households with four persons per room or more. 3.69 percent of
households are in this situation. A household is deemed ‘food deprived’ if he states
having considerable difficulties in obtaining food. There are 4.72 percent of such

35
households. The ‘water-electricity deprived’ households are defined as those
households who cannot pay either for their electricity bill or for their water bill. 11.72 %
of households are in this case. Households ‘deprived in health’ are the ones who state
that at least one household member suffer from a health problem. They are 26.75
percent of such households, often composed of elderly persons. Households are said
‘deprived in education’ if their head has no education or has only primary education.
They amount to 35.89 percent of all households.
Fournir une construction alternative built from LCS basic needs answers
No household observed in the LCS survey cumulates the five considered deprivations.
Clearly, the Intersection approach to poverty identification is not appropriate for
Seychelles since it would yield a poverty estimate equal to zero. On the other hand, the
typical Union approach, which identifies the poor households as deprived in at least one
dimension, yields a percentage of 42 percent, an exaggerated figure for such a
prosperous society like Seychelles.
Cutting down the number of dimensions used in the Union approach, according to their
stated priorities, yields more sensible estimates. Thus, omitting education and health
reduces the percentage of multidimensional poor households to 17.6 percent. Keeping
only the two main priority dimensions, shelter and food, leads to 8.16 percent, a figure
that is comparable to the estimated incidence of monetary poor households (12 percent).
There is substantial structure in the joint occurrence of difference dimensions. Shelter-
deprived households are sometimes also water-electricity deprived (24 percent of them)
and often health-deprived (i.e., ill: 41 percent of them), but rarely food-deprived (6.9
percent) and almost never education-deprived (i.e., uneducated head). However, this is
36
not enough for strong correlations to emerge, with the larger one being the correlation
of food deprivation with water-electricity deprivation (14 percent). This weak statistical
link is a further motivation for the multidimensional approach that cannot be well
summarized by any dominating dimension. Verif qand meme
Idem avec mes basic needs variables
The respective percentages for each basic need, as stated by the monetary poor
households as their first such expenditure priority, are used as weights for our
multidimensional poverty indicator.
3.3. Poverty estimates
To mentionSEY1
To do by strata
To explain passage between household and indiv data

37
32
Education of
Head
Amount of
Multidimension
al Poverty
Incidence of
Multidimension
al Poverty
Incidence of
Monetary
Poverty
No Schooling 1.8 6.9 33.0
Primary 3.8 8.3 20.7
Secondary 4.0 10.0 14.1
Vocational/
Polytechnic
3.1 5.8 12.0
University (&pre) 2.7 6.5 0.0
Whole Country 3.6 8.1 17.0
Using the additional information on ‘second-priority’ needs, but only for the poor as
defined by the ‘first priority’ needs, makes our approach still more distinct from a pure
Union approach that would be based on the same set of spending priorities14
.
Our multidimensional poverty estimator is obtained in two steps. First, we define our
score of Poverty Intensity for each household:
PI = (34.49 I[shelter deprivation > 0]i + 12.20 I[food deprivation > 0]i + 9.06 I[water or
electricity deprivation > 0]i + 6.97 I[health deprivation > 0]i +1.74 I[education deprivation > 0]i ) /
(34.49 + 12.20 + 9.06 + 6.97 + 1.74 ),
14
if the set of dimensions were defined in terms of priorities, which is usually not the case.
38
for each household i. The poverty intensity PI is a mean deprivation variable, weighted
by the priority percentages of each of the five considered wellbeing dimensions, as
observed for the monetary poor households15
.
The estimated PI has a mean of 0.076 and a standard deviation of 0.13. For 58 % of the
households this indicator is nil, which corresponds to non-poor households in the sense
of the Union identification criterion applied to the five priority dimensions. However, as
mentioned before, we now restrict our set of poor households to be deprived only in
shelter or in food. Thus, our multidimensional poverty function at the household level is
MPi = IMi PIi, where the variable IMi is our multidimensional incidence index for
household i, that is, it is equal to 1 for poor households who are destitute in shelter
or/and food, and 0 otherwise16
. Finally, the mean of the entire household sample is
calculated, possibly weighted by the sampling weight and the household size, as usual
for poverty estimators. We now discuss the estimates of the multidimensional poverty
measures IM and MP, obtained from using the Seychelles data.
The IM and MP estimators are multiplied by 100 in the tables to make them more
legible. Thus, in the tables IM is the percentage of the multidimensional poor, while the
reader must keep in mind that MP cannot be simply interpreted as a percentage in a
15
Other definitions could be substituted if wished. Here, we just give an example of reasonable index
construction. 16
Here, IMi = I[shelter deprivation > 0]i I[food deprivation > 0]i.
39
population. Preliminary estimates in terms of number of poor households and detailed
description of the data and the context are in Muller et al. (2013). AV et m.d.
The household poverty function of our estimated multidimensional poverty indicator
MP, i.e. MPi, has a mean of 3.6 percent and a standard deviation of 13 percent. It
reaches its maximum at 86 percent. It is non-zero only for 8.1 percent of the observed
households, which corresponds to the estimated multidimensional poverty incidence
rate given by IM. Some households are shelter-food poor, but not deprived in other
dimensions (and vice versa, but much less often). Some households are not only shelter-
food poor, but also deprived in other dimensions. The linear correlation coefficient of
the household functions MPi and IMi is very high (0.90). This is also the case when
restricting to households deprived in at least one of the five considered dimensions
(0.89). This is because most of the deprivation originates from food and shelter in
Seychelles and including the other dimensions in the analysis does not affect much the
diagnosis. As a matter of fact, this result is interesting in itself, and could not be found
by using one-dimensional poverty statistics. Note that the correlation of our
multidimensional household poverty functions with the household poverty functions of
the Union poverty rate based on the five priority dimensions is much lower: 0.31 with
MP and 0.35 with IM, which confirms that the simple Union criterion would not work
well here.
At the aggregate level (i.e., over all Seychelles households), our estimates show that
shelter contributes to 56.1 percent of MP, food to 25.4 percent, water and electricity to
9.1 percent, health to 9.0 percent, and finally education only to 0.2 percent. Thus, even
when accounting for other dimensions when quantifying poverty, shelter and food
40
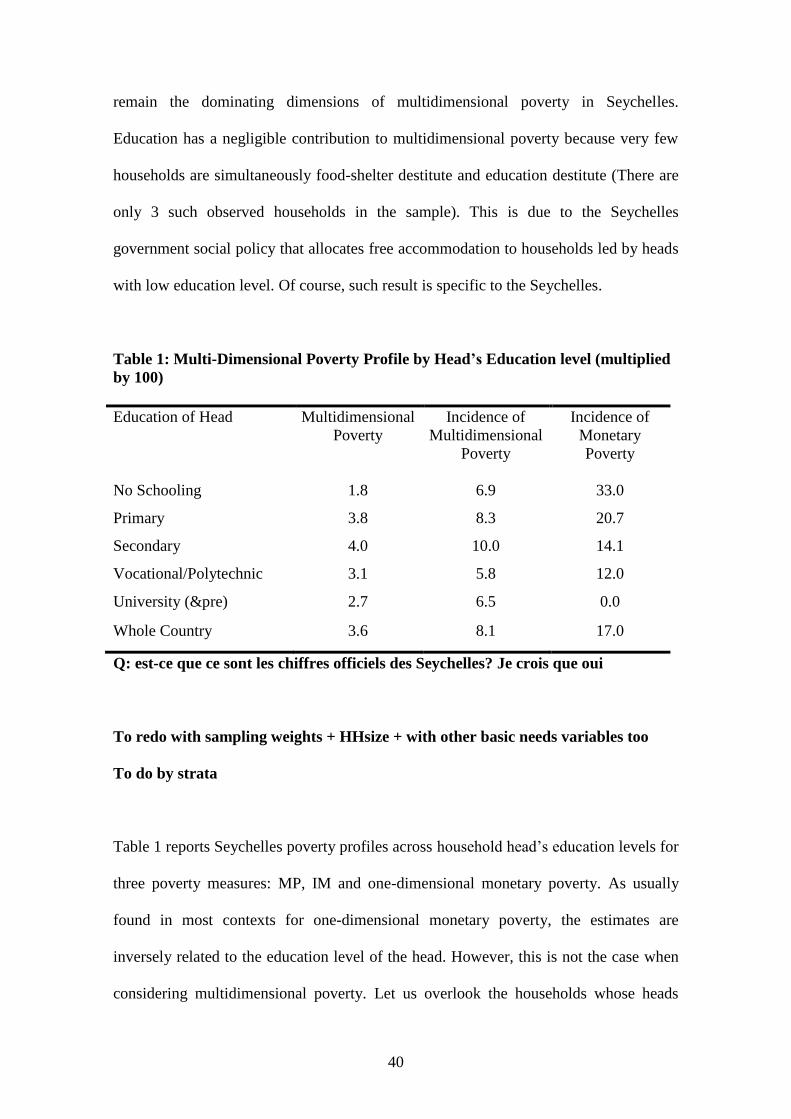
remain the dominating dimensions of multidimensional poverty in Seychelles.
Education has a negligible contribution to multidimensional poverty because very few
households are simultaneously food-shelter destitute and education destitute (There are
only 3 such observed households in the sample). This is due to the Seychelles
government social policy that allocates free accommodation to households led by heads
with low education level. Of course, such result is specific to the Seychelles.
Table 1: Multi-Dimensional Poverty Profile by Head’s Education level (multiplied
by 100)
Education of Head Multidimensional
Poverty
Incidence of
Multidimensional
Poverty
Incidence of
Monetary
Poverty
No Schooling 1.8 6.9 33.0
Primary 3.8 8.3 20.7
Secondary 4.0 10.0 14.1
Vocational/Polytechnic 3.1 5.8 12.0
University (&pre) 2.7 6.5 0.0
Whole Country 3.6 8.1 17.0
Q: est-ce que ce sont les chiffres officiels des Seychelles? Je crois que oui
To redo with sampling weights + HHsize + with other basic needs variables too
To do by strata
Table 1 reports Seychelles poverty profiles across household head’s education levels for
three poverty measures: MP, IM and one-dimensional monetary poverty. As usually
found in most contexts for one-dimensional monetary poverty, the estimates are
inversely related to the education level of the head. However, this is not the case when
considering multidimensional poverty. Let us overlook the households whose heads

41
have no education or have university level education as they only correspond to few
observed households, and let us focus on the central three education levels.
Multidimensional poverty, as measured with MP and IP, is lower for households with
primary education heads as compared to households with secondary education heads.
To understand this result we have to first realize that shelter and food are the
dominating dimensions in both IP and MP. When interacting head’s education with
shelter deprivation, we find that primary education heads live indeed less often in
crowded dwellings. This is the consequence of the abovementioned government social
policy towards providing free accommodation to low education adults, instead of using
unobserved income as a targeting anchor. Thanks to the policy, for an household head
having primary education only somehow protects the household against
multidimensional poverty, as compared to having secondary education or more.
3.4. Targeting
We now turn to the data on Social Welfare benefits as collected during the 2011 Living
Condition Survey. At the time of the survey, only 12 percent of the surveyed
households stated that they were receiving social welfare benefits.
UnclearOur estimates of multidimensional poverty are about twice higher for
households receiving social benefits (15 percent of them are multidimensionally poor)
than for the population at large (8 percent). This pleads in favour of targeting of benefits
towards the multidimensionally poor. However, the efficiency of such targeting is very
low.
42
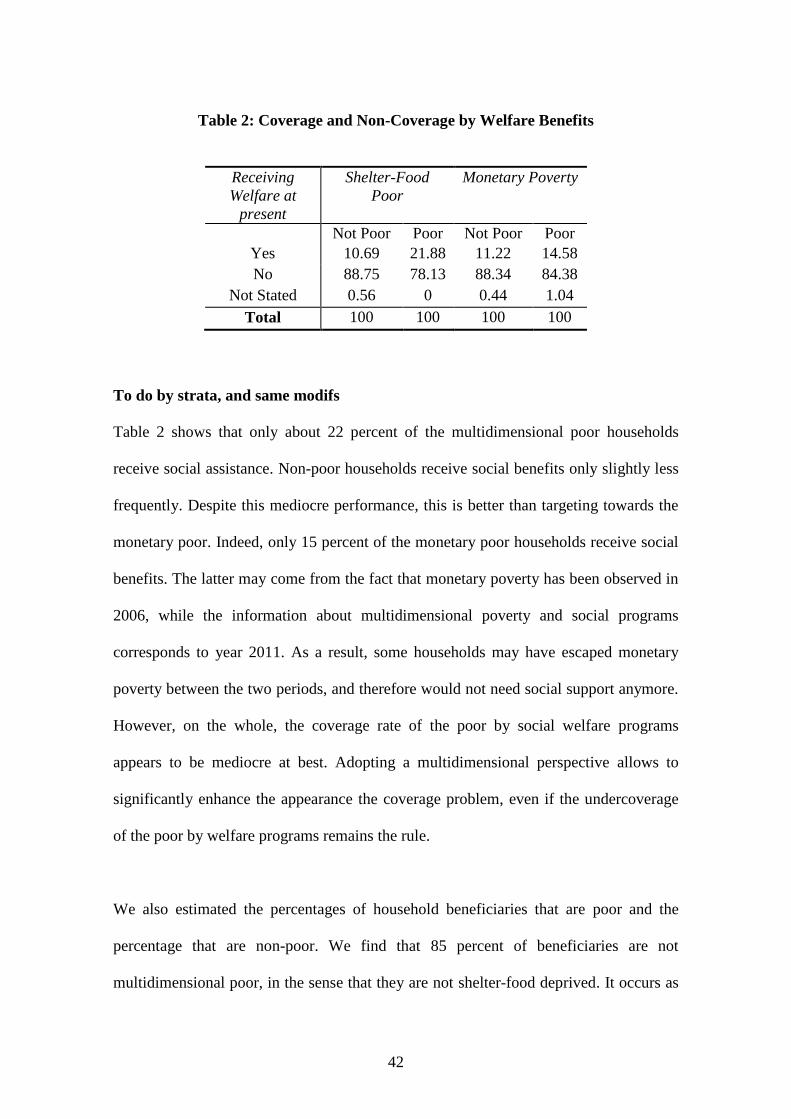
Table 2: Coverage and Non-Coverage by Welfare Benefits
Receiving
Welfare at
present
Shelter-Food
Poor
Monetary Poverty
Not Poor Poor Not Poor Poor
Yes 10.69 21.88 11.22 14.58
No 88.75 78.13 88.34 84.38
Not Stated 0.56 0 0.44 1.04
Total 100 100 100 100
To do by strata, and same modifs
Table 2 shows that only about 22 percent of the multidimensional poor households
receive social assistance. Non-poor households receive social benefits only slightly less
frequently. Despite this mediocre performance, this is better than targeting towards the
monetary poor. Indeed, only 15 percent of the monetary poor households receive social
benefits. The latter may come from the fact that monetary poverty has been observed in
2006, while the information about multidimensional poverty and social programs
corresponds to year 2011. As a result, some households may have escaped monetary
poverty between the two periods, and therefore would not need social support anymore.
However, on the whole, the coverage rate of the poor by social welfare programs
appears to be mediocre at best. Adopting a multidimensional perspective allows to
significantly enhance the appearance the coverage problem, even if the undercoverage
of the poor by welfare programs remains the rule.
We also estimated the percentages of household beneficiaries that are poor and the
percentage that are non-poor. We find that 85 percent of beneficiaries are not
multidimensional poor, in the sense that they are not shelter-food deprived. It occurs as
43
a statistical coincidence that exactly the same percentage of wrongly selected
households is found for monetary poverty. Even if a high degree of leakage of welfare
benefits is relatively common around the world, the situation in the Seychelles seems to
be particularly serious. The huge majority of households benefiting from social benefits
are just not poor according to both poverty approaches, which suggest that social
programs in the Seychelles are badly oriented.
Show what happens if there is a mistake in the number or in the set of priorities
Show also what happens with estimated priority weights stratified by
subpopulations
Ajouter resultats de estimated SD
4. Conclusion
In this paper, we propose a new methodology of multidimensional poverty
measurement. Our approach is based on using self-stated responses to household
spending priorities. This information is first used to know what the relevant deprivations
are. Then, the top priorities self-stated by the surveyed households allow us to identify
the poor. For each household, the deprivations are aggregated according to relative
weights computed from the data on priorities. Finally, the household poverty functions
are aggregated at the country level, or the strata level, as usual for poverty statistics.

44
Using the priorities data in such a way allows us to: (1) eliminate ‘Command variables’
in favour of ‘Intrinsic welfare variables’, which correspond better to the ‘basic needs
approach’ we pursue; (2) directly deals with needs heterogeneity, and (3) avoid the
arbitrariness that typically arises in many stages of the construction of multidimensional
poverty measures.
As expected, our estimates of the multidimensional poverty quantity function and the
multidimensional poverty incidence are highly correlated. However, they are not
correlated with the household poverty function in the Union or Intersection criteria
based on the stated deprivations by Seychelles households. In the Seychelles,
multidimensional poverty is dominated by shelter and food deprivations, which together
contribute to 77 percent of multidimensional poverty. About 8 percent of households
turn out to be multidimensional poor, to be compared with the 12 percent of monetary
poor households. As opposed to the estimation results for monetary poverty, education
is found to be relatively weakly correlated with multidimensional poverty. In particular,
low multidimensional poverty is found for households with low education heads. This
result is the consequence of government social policies providing free accommodation
for households led by low-educated heads. Such insight had escaped from monitoring
poverty just by using monetary statistics, which shows the usefulness of availing of
multidimensional poverty statistics along with the traditional one-dimensional poverty
statistics.
When assessing the performance of the Seychelles welfare social programs, whether in
terms of multidimensional poverty or monetary poverty, we find that the coverage of
the poor by these programs is dramatically low in Seychelles, while the amount of
leakage of social benefits to the non-poor is huge. However, using multidimensional

45
poverty indicators slightly improves the appearance of the coverage of the poor by these
programs. This is because, the decision to include households as beneficiaries of social
programs is typically taken by social welfare officers on the basis of the broadly
observable situation of households rather than on unobservable incomes17
.
Of course, extensions of our methodology are possible to welfare and inequality issues.
Moreover, there is no reason why deriving a multidimensional poverty measure should
prevent the analyst to examine well-chosen dimension-specific deprivation indices. On
the contrary, we believe that these dimension-specific indicators, such as child mortality
or income poverty measures, should still be the basis of poverty-alleviating policies.
What multidimensional poverty measures bring is additional information about the
correlation of these deprivations, and their relative relevance for poverty alleviation.
+ more policy lessons
+ limitations
+ extensions
17
Applicants’ verbal statements, including sometimes lies, about their income situation is part of the
observable information, though.
46
References
Aaberge, R. And E. Pelusio, 2011, “A Counting Approach to Measuring Multidimensional
Deprivation,” Working Paper 7, Department of Economics, University of Verona, June.
Alkire, S. and J. Foster, 2009, "Counting and Multidimensional Poverty,” in Von Braun, J. (ed.),
"The Poorest and the Hungry: Assessment, Analysis and Actions," International Food Policy
Research Institute, Washington D.C.
Alkire, S. and J. Foster, 2010, "Acute Multidimensional Poverty: A New Index for Developing
Countries," OPHI Working Paper No. 38, July, University of Oxford.
Alkire, S. and J. Foster, 2011, "Counting and Multidimensional Poverty,” Journal of Public
Economics, Vol. 95, Nos 7-8, 476-487, August.
Alkire, S. And M.E. Santos, 2010, “Acute Multidimensional Poverty: A New Index for
Developing Countries,” OPHI Working Paper N. 38, July.
Aristotle, 2015, “Nichomean Ethics. Translated by W.D. Ross,” University of Adelaide,
ebooks.
Atkinson, A.B., 2003, “Multidimensional deprivation: contrasting social welfare and counting
approaches,” Journal of Economic Inequality, 1:51-65.
Atkinson, A.B. and F. Bourguignon, The comparison of multi-dimensioned distributions of
economic status, Review of Economic Studies, 49 (1982), 181-201.
Belhadj, B., 2012, "New weighting scheme for the dimensions in multidimensional poverty
indices," Economic Letters, 116, 304-307.
Bossert, W., S. R. Chakravarty and C. D’Ambrosio, 2009, “Multidimensional poverty and
material deprivation,” ECINEQ Working Paper 2009-129, September.
Bourguignon, F. and Chakravarty S.R., 1998, “A Family of Multidimensional Poverty
Measures,” Working Paper Delta 98-03.
Bourguignon, F. and Chakravarty S.R., 2003, "The measurement of multidimensional poverty,"
Journal of Economic Inequality, 1: 25-49.
47
Cavapozzi, D., W. Han and R. Miniaci, Year? “Alternative weighting structures for
multidimensional poverty assessment,” mimeo University of Oxford.
Camping, L., H. Confiance and M.-T. Purvis, 2011, “Social Policies in Seychelles,” UNSRID,
Commonwealth Secretariat, London.
DasGupta, P., 1993, “An Inquiry into Well-Being and Destitution,” Clarendon Press, Oxford.
Decancq, K. and M.A. Lugo, 2010, “Weights in Multidimensional Indices of Well-Being,”
mimeo CORE.
Decancq, K., M., Fleurbaey, and F. Maniquet, 2013, “Multidimensional poverty measurement
with individual preferences,” mimeo CORE, University of Louvain la Neuve.
Deutsch, J. and J. Silber, 2005, “Measuring Multidimensional Poverty: An Empirical
Comparison of various Approaches,” Review of Income and Wealth, Ser. 51, N. 1, March.
Duclos J-C., D. Sahn and S. Younger, 2006a, "Robust multidimensional poverty comparisons,"
Economic Journal, 116(514): 943-968.
Duclos J-C., D. Sahn and S. Younger, 2006b, "Robust multidimensional spatial poverty
comparisons in Ghana, Madagascar, and Uganda," World Bank Economic Review, 20(1): 91-
113.
Jolly, R. 1976, “The World Employment Conference: The Enthronement of Basic
needs,” Development Policy Review, A9(2), 31-44.
Maslow, A. H., 1943, “A Theory of Human Motivation,” Psychological Review, 50,
370-396.
Muller, C., 2010, “Refining Targeting against Poverty: Evidence from Tunisia”, (with S. Bibi),
Oxford Bulletin of Economics and Statistics, Vol. 72, No. 3, June.
Muller, C., 2012a, “Poverty in Seychelles,” UNDP Seychelles, Victoria, May.
Muller, C., 2012b, “The Living Conditions in Seychelles,” UNDP Seychelles, Victoria, August.
Muller, C., 2013, “A New Collection Instrument for Welfare Analysis: The Living Condition
Surveys in Seychelles and Mauritius,” mimeo Aix-Marseille University, December.

48
Muller, C. 2014, “Household Well-Being and Priorities,” mimeo Aix-Marseille
University, July.
Muller, C., 2016, “Dissociating Identification and Quantification of Poverty,” mimeo
Aix-Marseille University, September.
AVMuller, C. and S. Bibi,. “Refining Targeting against Poverty: Evidence from
Tunisia”, (with S. Bibi), Oxford Bulletin of Economics and Statistics, Vol. 72, No. 3,
June 2010.
Muller, C. and A. Trannoy,. “A dominance approach to well-being and inequality across
countries,” Journal of Public Economics, 95, 239-246, 2011.
Muller, C. and A. Trannoy,..“Multidimensional Inequality Comparisons: a
Compensation Perspective”, Journal of Economic Theory, 147, 4, 1427-1449, 2012.
Muller, C., A. Kannan and R. Alcindor, 2016, “Multidimensional Poverty in Seychelles,”
forthcoming in Journal of Developing Areas.
Osberg, L. and A. Sharpe, 2002, “An Index of Economic Well-Being for Selected
OECD Countries,” Review of Income and Wealth, Ser. 48, N. 3, September.
Pradhan, M. and M. Ravallion, 2000, “Measuring Poverty Using Qualitative
Perceptions of Welfare,” Review of Economics and Statistics.
Ravallion, M., 2012, “Troubling Tradeoffs in the Human Development Index,” Journal of
Development Economics, 99, 201-209.
Ravallion, M., 2011, “On Multidimensional Indices of Poverty,” Poverty Research Working
Paper 5580, The World Bank, February.
Rawls, J., 1972, “A Theory of Justice,” Oxford University Press, Oxford.
Scanlon, T. M., 1975, “Preference and Urgency,” The Journal of Philosophy,
11/1975, Vol. 72, N. 19.
Silber, J. et al.
49
Social Welfare Agency, 2012, “Overview of the Current System,” mimeo Social Welfare
Agency, Victoria, Seychelles.
Streeten 1981
Thorbecke, E., 2011, “A comment on multidimensional poverty indices,” Journal of Economic
Inequality, 9, 485-487.
UNDP, 2010, Human Development Report 2010, Palgrave Macmillan, New York.
UNDP, 2011, Human Development Report 2011, Palgrave Macmillan, New York.
Vlastov, 1962, ‘Justice and Equality’AV
Appendix:
A inclure les defs des axioms from Dissociation when ready
Priority axioms to finish

50
SPELLING
Related Documents