Sierra Leone Multidimensional Poverty Index 2019 SIERRA LEONE MULTIDIMENSIONAL POVERTY INDEX 2019

Welcome message from author
This document is posted to help you gain knowledge. Please leave a comment to let me know what you think about it! Share it to your friends and learn new things together.
Transcript
Sierra LeoneMultidimensional Poverty Index
2019
SIERRA LEONE MULTIDIMENSIONAL
POVERTY INDEX 2019
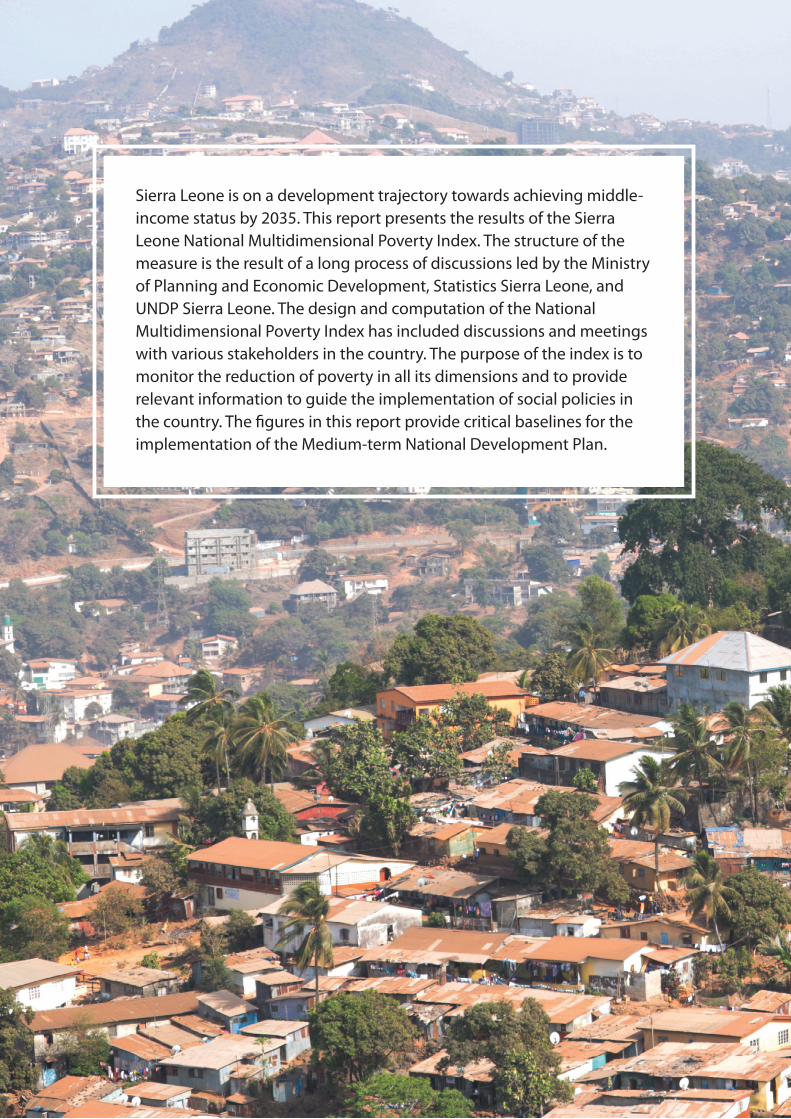
Sierra Leone is on a development trajectory towards achieving middle-income status by 2035. This report presents the results of the Sierra Leone National Multidimensional Poverty Index. The structure of the measure is the result of a long process of discussions led by the Ministry of Planning and Economic Development, Statistics Sierra Leone, and UNDP Sierra Leone. The design and computation of the National Multidimensional Poverty Index has included discussions and meetings with various stakeholders in the country. The purpose of the index is to monitor the reduction of poverty in all its dimensions and to provide relevant information to guide the implementation of social policies in the country. The figures in this report provide critical baselines for the implementation of the Medium-term National Development Plan.
Copyright © UNDP Sierra Leone
Content: Statistics Sierra Leone, Oxford Poverty and Human Development Initiative, United Nations Development ProgrammeImages © UNDP Sierra LeoneEditing and design: Edward Miller
Sierra LeoneMultidimensional Poverty Index
2019
List of tablesList of figuresForewordStatement from the UNDP Resident RepresentativeAcknowledgements
1. Introduction2. Alkire-Foster method3. Structure of the National Multidimensional Poverty Index of Sierra Leone4. Multidimensional Poverty Index results for Sierra Leone
4.1 National uncensored headcount ratios of the National Multidimensional Poverty Index indicators4.2 National Multidimensional Poverty Index results4.3 Disaggregation by rural and urban areas, regions, and districts4.4 Disaggregation by age group4.5 Disaggregation by sex of the household head4.6 Disaggregation by disability status
5. Policy recommendations
Annex
iiiiiivvii
13466
6819222224
25
CONTENTS
i
LIST OF TABLES
Table 1: Dimensions, indicators, deprivation cut-offs, and weights of the National MPITable 2: Incidence, intensity, and MPITable 3: Multidimensional poverty by rural/urban areas, 2017Table 4: Multidimensional poverty by regions, 2017Table 5: Incidence and intensity of poverty and MPI by age group, 2017Table 6: Incidence and intensity of poverty and MPI by age group (Sierra Leone–specific youth categorization)Table 7: Incidence and intensity of poverty and MPI by age group and sex (Sierra Leone–specific youth categorization)Table 8: Incidence and intensity of poverty and MPI by age group and regionTable 9: Incidence and intensity of poverty and MPI by sex of household head and regionTable 10: Incidence and intensity of poverty and MPI by disability
Table A1: Censored headcount ratios by districtTable A2: Censored headcount ratios by district (continued)Table A3: Censored headcount ratios by district (continued)Table A4: Censored headcount ratios by district (continued)Table A5: Censored headcount ratios by district (continued)Table A6: Percentage contribution of each indicator to MPI by districtTable A7: MPI by districtTable A8: Incidence and intensity of poverty and MPI for 14 years and below by districtTable A9: Incidence and intensity of poverty and MPI for youths (15–35 years) by districtTable A10: Incidence and intensity of poverty and MPI for 36–64 years by districtTable A11: Incidence and intensity of poverty and MPI for 65 years and above by districtTable A12: Incidence and intensity of poverty and MPI for male-headed households by districtTable A13: Incidence and intensity of poverty and MPI for female-headed households by district
579131920
20
212323
252626272728292930303131
32
Sierra Leone Multidimensional Poverty Index 2019ii
ACRONYMS
MPI Multidimensional Poverty IndexUN United NationsUNDP United Nations Development Programme
LIST OF FIGURES
79101112131516171718
Figure 1: National uncensored headcount ratios, 2017Figure 2: National censored headcount ratios, 2017Figure 3: Percentage contribution of each indicator to the MPI, 2017Figure 4: Censored headcount ratios by urban and rural areas, 2017Figure 5: Percentage contribution of each indicator to rural and urban MPI, 2017Figure 6: Censored headcount ratios of each indicator by region, 2017Figure 7: Percentage contribution of each indicator to rural and urban MPI, 2017Figure 8: Incidence of multidimensional poverty by district, 2017Figure 9: Intensity of multidimensional poverty by district, 2017Figure 10: MPI by district, 2017Figure 11: Percentage contribution of each indicator to district MPI, 2017
iii
FOREWORD
Sierra Leone is on a development trajectory towards achieving middle-income status by 2035. Achieving this vision will require putting in place policies and institutions to promote inclusive and sustainable growth, diversifying economic activities, develop-ing human capital, promoting the agriculture sector, strengthening governance, and ensuring that natural resources – especially from the extractives sector – are utilized wisely.
The Government of Sierra Leone in February 2019 launched its Medium-term National Development Plan with the theme ‘Education for Development’. The overarching goal of the plan is to reduce poverty in all its forms by improving the lives of the people through education, inclusive sustainable growth, and building a resilient economy. The plan is aligned to the Sustainable Development Goals and Africa Agenda 2063.
The Sierra Leone Multidimensional Poverty Index 2019 has been computed in col-laboration with the Ministry of Planning and Economic Development, Statistics Sierra Leone, and UNDP, and with the support of the Oxford Poverty and Human Development Initiative. I am pleased to note that the Multidimensional Poverty Index (MPI) for Sierra Leone used the Multiple Indicator Cluster Survey data from 2017; it has five dimensions (education, health, housing, living standards, and energy) and 14 indicators, which were the result of several discussions with local experts led by Statistics Sierra Leone. The results presented in this report include national, regional, and district statistics on multidimensional poverty. This is the first MPI to be produced in Sierra Leone and the Mano River Union region.
The results of the analysis show that 64.8 percent of the population in Sierra Leone was multidimensionally poor in 2017 and that there was a particularly high incidence of poverty in Pujehun District. The southern (76 percent), northern (75.8 percent), and eastern (67.6 percent) regions had the highest incidence of poverty, while the western region had the lowest (36.2 percent). It also notes that female-headed households had slightly higher multidimensional poverty incidence (65.9 percent) compared to male-headed households (64.2 percent).
As a government, we will strive to ensure that the Sierra Leone Multidimensional Poverty Index is regularly computed to complement the income poverty estimates produced by the World Bank in collaboration with Statistics Sierra Leone. The Government of Sierra Leone is of the firm conviction that the credible data generated through these regular profiles and estimates is critical to the development planning process.
Sierra Leone Multidimensional Poverty Index 2019iv
In 2018, Sierra Leone joined the Multidimensional Poverty Peer Network, whose objective is to eradicate poverty by bringing poverty measures closer to the realities of poor peoples’ lives. This is done through the promotion of regular MPI estimation as well as through informed policies that are better designed, more accurately targeted, and more effective in alleviating poverty in all its dimensions.
The MPI figures in this profile provide critical baselines for the implementation plan of the Medium-term National Development Plan. Thus, I highly recommend that it is used by all ministries, departments, agencies, and other stakeholders to inform the formulation of service delivery projects. Specifically, it will help identify the most vulnerable people – the poorest among the poor – by revealing poverty patterns within regions and districts, and by so doing empower government and other stake-holders to target resources and design policies more effectively. It will also facilitate the monitoring of the achievement of Sustainable Development Goal 1 (specifically Target 1.2). As a government, we strongly believe that the benefits of growth must reach all segments of society, especially marginalized groups, which further underlines the government’s commitment to upholding the principle of ‘leave no one behind’.
To this end, I wish to thank UNDP for facilitating the support of the Oxford Poverty and Human Development Initiative to undertake this profile in collaboration with the Ministry of Planning and Economic Development and Statistics Sierra Leone. The MPI statistics in this profile were extremely useful in the formulation of the recently launched Medium-term National Development Plan (2019–2023), and we shall continue to remain a committed member of the global Multidimensional Poverty Peer Network in this direction.
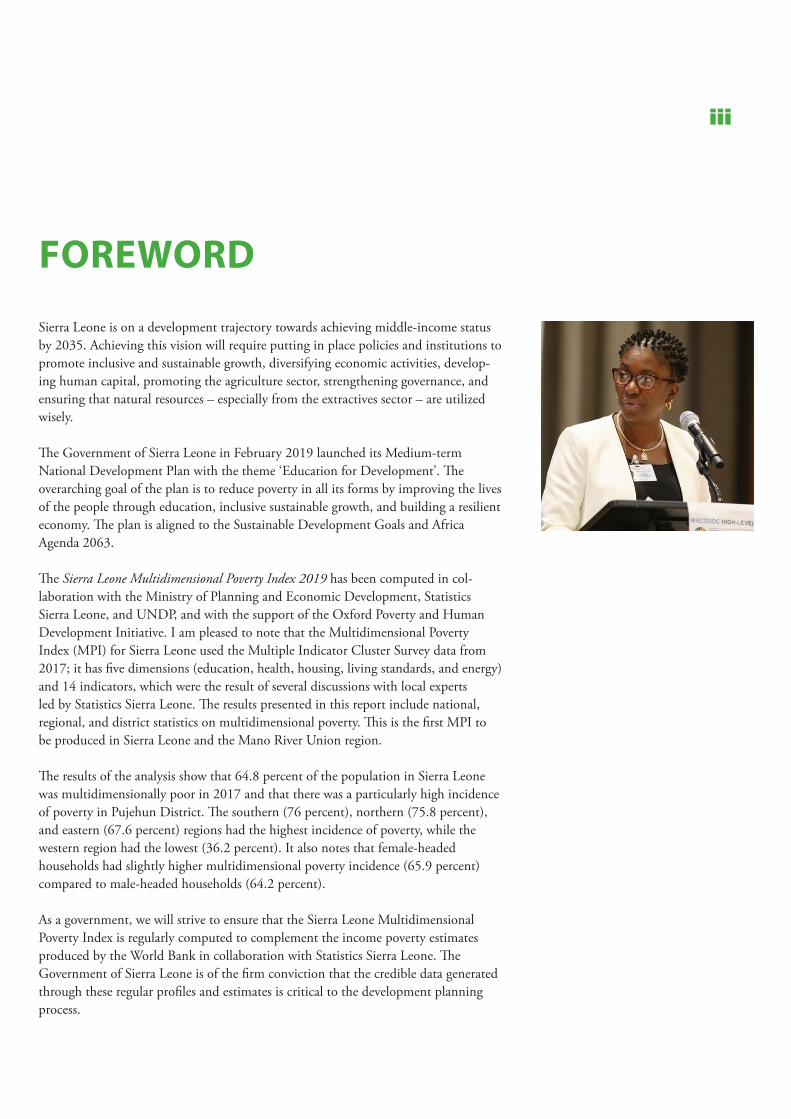
Hon. Nabeela Farida Tunis (Mrs)Minister for Planning and Economic Development
v
The Sierra Leone Multidimensional Poverty Index 2019 was a collaborative effort among the Oxford Poverty and Human Development Initiative, Statistics Sierra Leone, and the Ministry of Planning and Economic Development, with financial and technical support from the United Nations Development Programme.
I am delighted with the publication of the index. As an official National Multidimensional Poverty Index, it sets the baseline for measuring progress in the country’s drive to leave no one behind in the eradication of poverty along with all its miseries and indignities.
The report reveals that while eradicating poverty in Sierra Leone will be a Herculean task, it is not insurmountable. The country remains among those with the highest concentration of poverty: 64.8 percent (about two-thirds) of the population were identified as multidimensionally poor in 2017. Geographically, rural poverty is 86.3 percent, compared to 37 percent in urban areas. Multidimensional poverty among the majority of the rural population means they are deprived of access to affordable quality basic services – services that are critical to lifting and keeping them out of poverty.
President Retired Brigadier Julius Maada Bio has declared that his government is determined to wage war against poverty. The Government of Sierra Leone has already taken steps to address two of the most potent poverty traps through its free quality education initiative and the devolution of most service delivery functions to local authorities. Households headed by educated persons are far more likely to get out of poverty and become resilient to disasters compared to those headed by uneducated persons; access to basic services will meanwhile address many of the deprivations seen in multidimensional poverty.
UNDP has aligned itself with the government’s vision. It will continue to support the people of Sierra Leone to eradicate poverty and build resilience to shocks and stresses. Our next Country Programme Document (2020–2023), which is designed to support the government’s Medium-term National Development Plan 2019–2023, is anchored
STATEMENT FROM THE UNDP RESIDENT REPRESENTATIVE
Sierra Leone Multidimensional Poverty Index 2019vi
on this vision. As part of UNDP’s commitment to building national systems, we are working with the Oxford Poverty and Human Development Initiative to build the capacity of Statistics Sierra Leone to compute future MPIs.
The Multidimensional Poverty Index will serve as a compass to steer UNDP’s support and as a tool to measure progress. I also hope that it will facilitate fruitful discussions among stakeholders (ministries, departments, agencies, development partners, other UN agencies, the private sector, non-governmental organizations, civil society organizations, etc.) as we implement the Medium-term National Development Plan.
I would like to take this opportunity to thank the Government of Sierra Leone – specifically the Ministry of Planning and Economic Development, Statistics Sierra Leone, and all other stakeholders involved in the different stages of producing this index – for their leadership and partnership.
Samuel Gbaydee DoeUNDP Sierra Leone Resident Representative
vii
Many people contributed in different ways to the completion of this report, and we are most grateful for their efforts. First, we are grateful to the Oxford Poverty and Human Development Initiative team, especially Adriana Conconi, Monica Pinilla-Roncancio, and Juliana Milovich, for their technical expertise in the production of this report.
A special thanks to the UNDP Sierra Leone Resident Representative, Samuel Doe, for his guidance, support, and leadership throughout the process. The index owes much to the vision, dedication, coordination, and strategic guidance of Moses Sichei, UNDP Economic Advisor. We are also grateful to Milton Korseh-Hindowa (National Economist), Fodie Musa Sheriff (Research Associate), and Helen Mayelle (Communications Unit) at the UNDP Sierra Leone Country Office for their valuable contributions towards the completion of the report.
The index also benefited from the views of Professor Osman Sankoh, Statistician General of Statistics Sierra Leone; Abu Bakarr Turay, Director of the Economic Statistics Division (Statistics Sierra Leone); and Dr. Sheka Bangura, Director of Research and Planning at the Ministry of Planning and Economic Development.
The data used to compute indices in the report is mainly from the 2017 Multiple Indicator Cluster Survey database, implemented by Statistics Sierra Leone with funding from UNICEF and partners.
ACKNOWLEDGEMENTS
Sierra Leone Multidimensional Poverty Index 20191
1. INTRODUCTION
This report presents the results of the Sierra Leone National Multidimensional Poverty Index (MPI). The structure of the measure is the result of a long process of discus-sions led by the Ministry of Planning and Economic Development, Statistics Sierra Leone, and UNDP Sierra Leone. The design and computation of the National MPI has included discussions and meetings with various stakeholders in the country. The purpose of Sierra Leone’s National MPI is to monitor the reduction of poverty in all its dimensions and to provide relevant information to guide the implementa-tion of social policies in the country.
Since the end of the civil war in 2002, the measurement of poverty in Sierra Leone has become a priority. The Sierra Leone Integrated Household Survey is one of the most important tools to inform national policies on poverty re-duction. This survey is complemented by the Multiple Indicator Cluster Survey and the Demographic and Health Survey, which are done every five years and provide more detailed information on important develop-ment indicators. All three surveys are implemented by Statistics Sierra Leone, the national statistics office.
Traditionally, poverty in Sierra Leone has been measured using the income/expenditure approach, which is the main tool to analyse the levels and distribution of poverty in the country. However, given the importance of other dimensions in the understanding of poverty, non-monetary measures have become an important tool for poverty analysis. Therefore, in 2017 Statistics Sierra Leone published a thematic report on poverty and durables using the National Population and Housing Census 2015, which included the results of a pilot National MPI for Sierra Leone based on the structure of the Global MPI.1,2 The results of that measure revealed that 68.3 percent of the population in Sierra Leone were multidimensionally poor in 2015. This report was the first input for the development of the National MPI of Sierra Leone presented in this document, which responds to national priorities and needs, and aims to measure poverty in all its dimensions, thus complementing the income/expenditure measure of poverty in the country.
The National MPI of Sierra Leone uses the Alkire-Foster method and has 1 For more information, visit https://www.statistics.sl/.2 For more information on the Global MPI, visit https://ophi.org.uk/multidimensional-poverty-index/global-mpi-2018/.
Traditionally, poverty in Sierra Leone has been measured using the income/expenditure approach . . . However, given the importance of other dimensions in the understanding of poverty, non-monetary measures have become an important tool for poverty analysis
2
five dimensions and 14 indicators. Results for 2017 revealed that the rate of multidimensional poverty was 64.8 percent – that is, almost two-thirds of the population in the country was identified as ‘MPI poor’ (deprived in at least 40 percent of indicators). The intensity of poverty was 58.9 percent, meaning that, on average, poor people experience almost 60 percent of the possible weighted deprivations consid-ered. The Multidimensional Poverty Index itself, which is the product of the incidence and the intensity of poverty, was 0.375.
Results also show that the incidence of poverty in rural areas is more than double that of urban areas (86.3 and 37.6 percent, respectively). In addition, the intensity of rural poverty is 10 percent higher than urban poverty (50.9 and 60.3 percent, respectively), and the MPI in rural areas is more than double that in urban areas (0.529 and 0.191, respectively).
When looking at the findings by region, results indicate that the southern (76 percent), northern (75.8 percent), and eastern (67.6 percent) regions had the highest poverty rates, while the western region had the lowest (36.2 percent). Similar results are
observed for the intensity of poverty, with the southern and northern regions presenting the highest average number of deprivations (60 and 59.6 percent, respectively), and the western region presenting the lowest (50.2 percent). Three districts were identified as having the highest incidence of multidimen-sional poverty in the country: Pujehun (87.2 percent), Koinadugu (86.5 percent), and Tonkolili (85.4 percent).
The lowest levels of poverty were found in the two districts of Western Area Urban (28.5 percent) and Western Area Rural (53 percent). Similar results are found for the intensity of poverty, with Western Area Urban as the district with the lowest average percentage of deprivation among the poor (48.9 percent) and Pujehun with the highest (62.4 percent). As expected, this latter district has the highest MPI (0.544) while Western Area Rural has the lowest (0.275).
Almost two-thirds of the population in the country was identified as ‘MPI poor’
Sierra Leone Multidimensional Poverty Index 20193
2. ALKIRE-FOSTER METHOD
Sierra Leone’s National MPI uses the Alkire-Foster method. A poverty profile is constructed for each person. This profile shows in which of the 14 indicators a person is deprived, according to national definitions. Next, the deprivations are aggre-gated for each person into a weighted deprivation score. The weights reflect normative judgements and accord equal importance to each of the five dimensions: education, health, living standards, energy, and housing. Each individual is then identified as poor or non-poor, depending on whether their deprivation score is less than a poverty cut-off (non-poor), or meets or exceeds the poverty cut-off (poor). The poverty cut-off is equal to 40 percent of the weighted indicators, or to be deprived in two or more dimensions.
To estimate the National MPI, information on the poor is aggregated into the adjusted headcount ratio or MPI. The MPI combines two aspects of poverty:
MPI = H x A
1) Incidence (H) ~ the percentage of individuals who are poor, or the poverty rate or headcount ratio.
2) Intensity (A) ~ the average percent-age of dimensions in which poor individuals are deprived, or the average deprivation score of poor persons.
The National MPI can be equivalently computed as the weighted sum of censored headcount ratios, which show the percentage of individuals who were identified as poor and are deprived in an indicator. Because of this structure, the MPI can be broken apart by indicators to show the composition of poverty. This feature of dimensional detail brings added policy relevance to the analysis. In addition, the MPI can be disaggregated by subnational population groups, such as urban/rural areas, regions, gender, age groups, etc.
A poverty profile is constructed for each person and shows in which of the 14 indicators a person is deprived . . . Next, the deprivations are aggregated for each person into a weighted deprivation score

4
3. STRUCTURE OF THE NATIONAL MULTIDIMENSIONAL POVERTY INDEX OF SIERRA LEONE
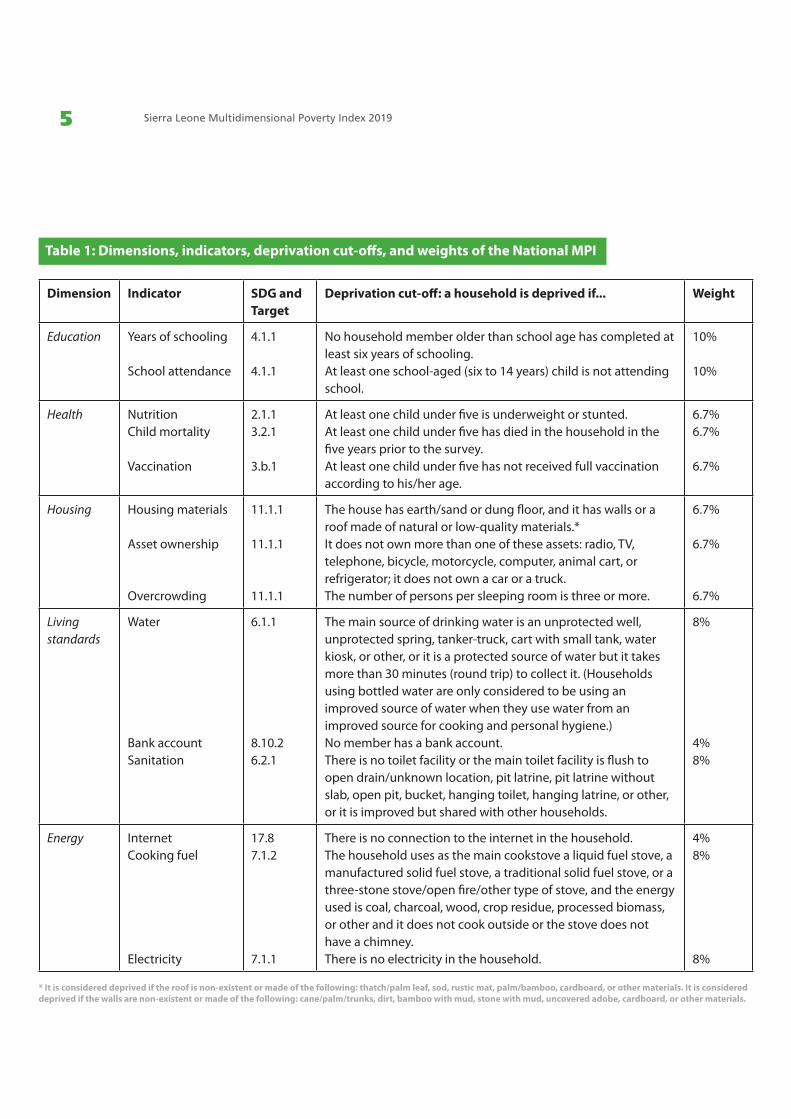
Sierra Leone´s National MPI has five dimensions – health, education, living standards, housing, and energy – and 14 indicators. It uses the same weight for each dimension, and depending on the dimension each indicator will have different weight. For example, the weight of ‘internet access’ and ‘bank account’ is half of the weight of other indicators included in the dimensions of living standards and energy.
The main reason for this normative decision is that internet access and having a bank account are important indicators for tracking Sierra Leone’s progress, but currently basic services such as water and sanitation are still a major priority for the country, and therefore their relative importance is higher.
Finally, the MPI uses a poverty line equal to 40 percent. Therefore, a person is multidimensionally poor if he or she is deprived in two or more dimensions or in more than 40 percent
of the weighted sum of indicators. Table 1 presents the dimensions, indicators, deprivation cut-offs, and weights of the National MPI of Sierra Leone.
Sierra Leone’s National MPI has five dimensions: health, education, living standards, housing, and energy
Sierra Leone Multidimensional Poverty Index 20195
* It is considered deprived if the roof is non-existent or made of the following: thatch/palm leaf, sod, rustic mat, palm/bamboo, cardboard, or other materials. It is considered deprived if the walls are non-existent or made of the following: cane/palm/trunks, dirt, bamboo with mud, stone with mud, uncovered adobe, cardboard, or other materials.
Table 1: Dimensions, indicators, deprivation cut-offs, and weights of the National MPI
Dimension Indicator SDG and Target
Deprivation cut-off: a household is deprived if... Weight
Education Years of schooling
School attendance
4.1.1
4.1.1
No household member older than school age has completed at least six years of schooling.At least one school-aged (six to 14 years) child is not attending school.
10%
10%
Health NutritionChild mortality
Vaccination
2.1.13.2.1
3.b.1
At least one child under five is underweight or stunted.At least one child under five has died in the household in the five years prior to the survey.At least one child under five has not received full vaccination according to his/her age.
6.7%6.7%
6.7%
Housing Housing materials
Asset ownership
Overcrowding
11.1.1
11.1.1
11.1.1
The house has earth/sand or dung floor, and it has walls or a roof made of natural or low-quality materials.*It does not own more than one of these assets: radio, TV, telephone, bicycle, motorcycle, computer, animal cart, or refrigerator; it does not own a car or a truck.The number of persons per sleeping room is three or more.
6.7%
6.7%
6.7%
Living standards
Water
Bank accountSanitation
6.1.1
8.10.26.2.1
The main source of drinking water is an unprotected well, unprotected spring, tanker-truck, cart with small tank, water kiosk, or other, or it is a protected source of water but it takes more than 30 minutes (round trip) to collect it. (Households using bottled water are only considered to be using an improved source of water when they use water from an improved source for cooking and personal hygiene.)No member has a bank account.There is no toilet facility or the main toilet facility is flush to open drain/unknown location, pit latrine, pit latrine without slab, open pit, bucket, hanging toilet, hanging latrine, or other, or it is improved but shared with other households.
8%
4%8%
Energy InternetCooking fuel
Electricity
17.87.1.2
7.1.1
There is no connection to the internet in the household. The household uses as the main cookstove a liquid fuel stove, a manufactured solid fuel stove, a traditional solid fuel stove, or a three-stone stove/open fire/other type of stove, and the energy used is coal, charcoal, wood, crop residue, processed biomass, or other and it does not cook outside or the stove does not have a chimney. There is no electricity in the household.
4%8%
8%
6
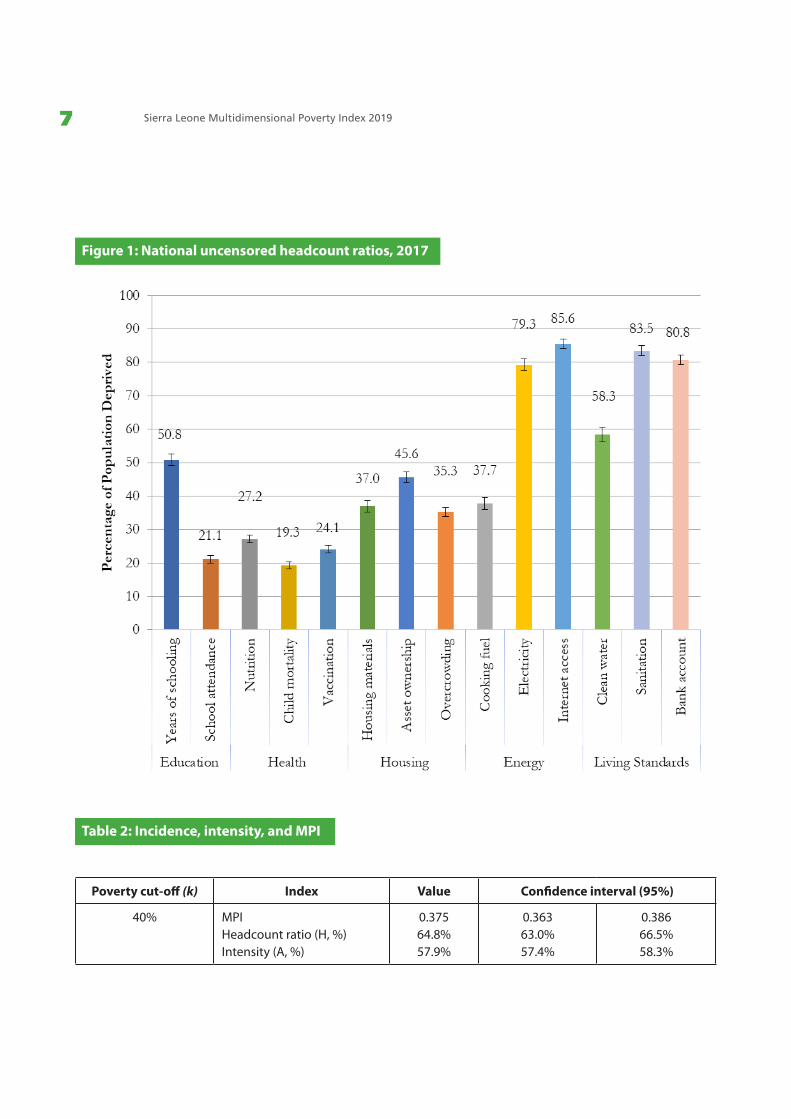
4.1 NATIONAL UNCENSORED HEADCOUNT RATIOS OF THE NATIONAL MULTIDIMENSIONAL POVERTY INDEX INDICATORS
The uncensored headcount ratio of each indicator represents the propor-tion of people in Sierra Leone who are deprived in each indicator, irrespective of their poverty status. As Figure 1 shows, the highest deprivations are found for internet access (with 85.6 percent of people deprived in this indicator), sanitation (83.5 percent), bank account (80.8 percent), electricity (79.3 percent), and clean water (58.3 percent).
In turn, the indicators with the lowest incidence of deprivation are child mor-tality (19.3 percent), school attendance (21.1 percent), vaccinations (24.1 percent), and nutrition (27.2 percent). It is worth noticing that these indica-tors refer to children’s conditions and, although headcounts of deprivation are
4. MULTIDIMENSIONAL POVERTY INDEX RESULTS FOR SIERRA LEONE
still quite high, there is hope in finding that indicators for children are showing better results, on average.
4.2 NATIONAL MULTIDIMENSIONAL POVERTY INDEX RESULTS Table 2 shows Sierra Leone’s National MPI for 2017, as well as its partial indices: the incidence of poverty (or the proportion of people identified as multidimensionally poor – H) and the intensity of poverty (or the average proportion of weighted indicators in which the poor are deprived – A). As can be seen in the table, the incidence of multidimensional poverty is 64.8 percent.
This means that almost two-thirds of the population in Sierra Leone is identified as multidimensionally poor. In turn, the average intensity of poverty, which reflects the share of deprivations each poor person experi-ences on average, is 57.9 percent. That is, each poor person is, on average,
The incidence of multidimensional poverty in Sierra Leone is 64.8 percent
Sierra Leone Multidimensional Poverty Index 20197
Figure 1: National uncensored headcount ratios, 2017
Table 2: Incidence, intensity, and MPI
Poverty cut-off (k) Index Value Confidence interval (95%)
40% MPIHeadcount ratio (H, %)Intensity (A, %)
0.37564.8%57.9%
0.36363.0%57.4%
0.38666.5%58.3%
8
deprived in almost 60 percent of the dimensions included in the MPI. The National MPI, which is the product of the incidence and intensity of poverty, has a value of 0.375. This means that multidimensionally poor people in Sierra Leone experience 37.5 percent of the total deprivations that would be experienced if everyone was deprived in all indicators.
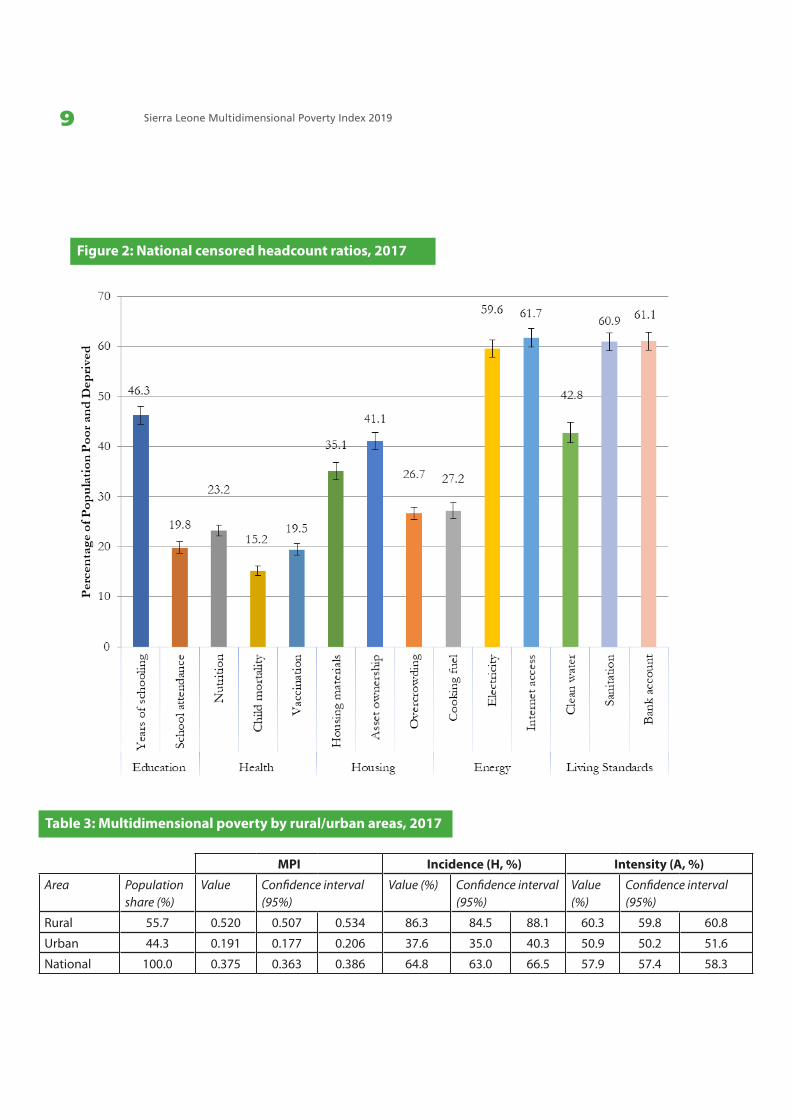
The censored headcount ratio of an indicator represents the proportion of individuals who are multidimension-ally poor and also deprived in that indicator. The National MPI can also be computed as the sum of the weighted censored headcount ratios. Thus, reducing any of the censored headcount ratios reduces poverty. Figure 2 presents the censored head-count ratios for each indicator. Results show that the largest deprivation is in internet access (61.7 percent), bank ac-count (61.1 percent), sanitation (60.9 percent), electricity (59.6 percent), and years of schooling (46.3 percent). The indicator with the lowest deprivation is child morality, with 15.2 percent of individuals living in a multidimension-ally poor household where at least one child has died in the last five years.
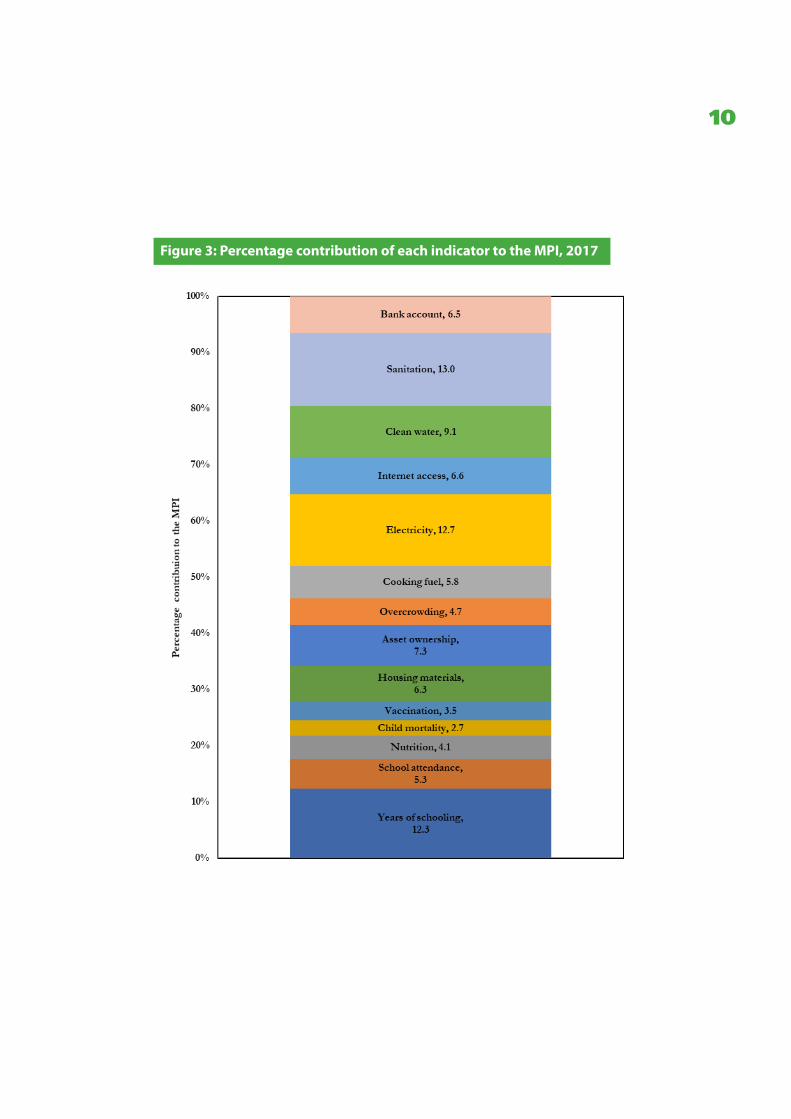
The contribution of each indicator to the National MPI in Sierra Leone revealed that the indicator with the highest contribution is sanitation with 13 percent, follow by electricity with 12.7 percent and years of schooling with 12.3 percent. In turn, the
indicators that contribute the least to the MPI are child mortality (2.7 percent), vaccination (3.5 percent), and nutrition (4.1 percent).
4.3 DISAGGREGATION BY RURAL AND URBAN AREAS, REGIONS, AND DISTRICTSTo better understand the distribution of poverty across Sierra Leone, the profile disaggregated the levels of poverty by rural and urban areas, by regions, by districts, and by age groups. In Table 3, the National MPI and incidence and intensity of poverty are shown by urban and rural areas. As can be seen in the table, the rural poverty headcount ratio is more than double that for urban areas – 86.3 percent and 37.6 percent, respectively.
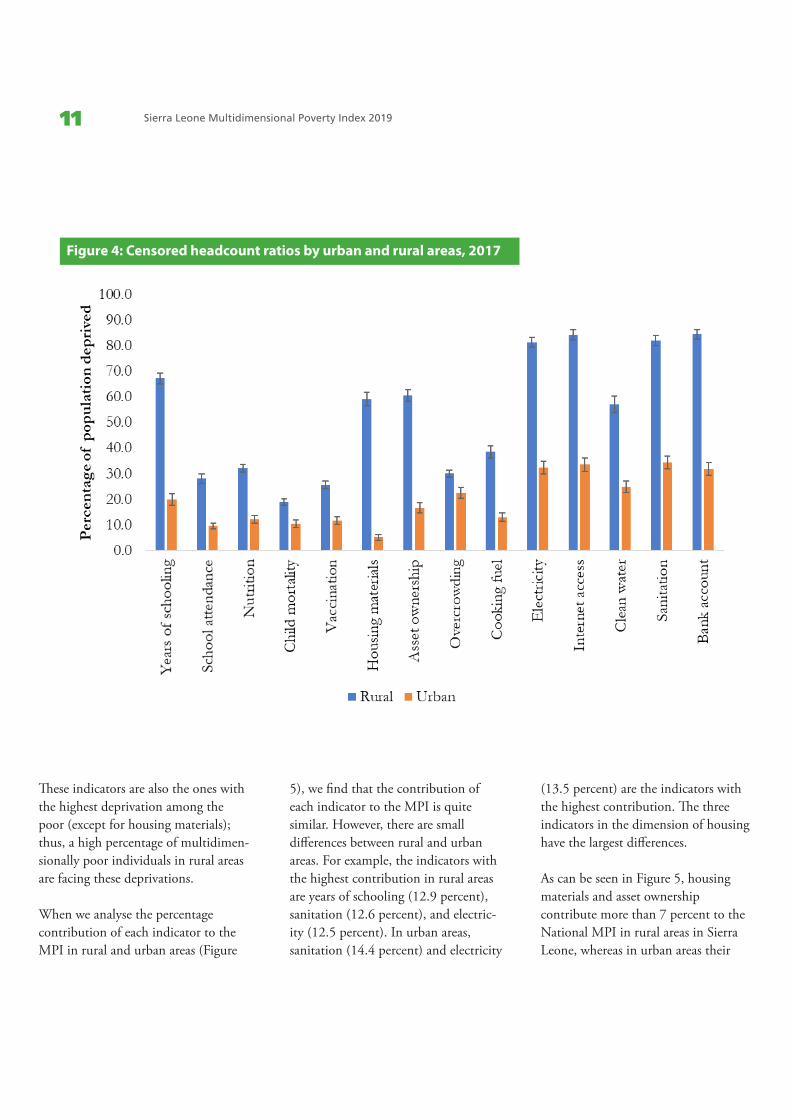
When comparing the levels of depriva-tion in each of the indicators for multidimensionally poor individuals living in rural and urban areas (Figure 4), the largest differences are observed in the indicators related to housing materials (54 percentage points), bank account (52 percentage points), internet access (51 percentage points), and electricity (49 percentage points).
Multidimensionally poor people in Sierra Leone experience 37.5 percent of the total deprivations that would be experienced if everyone was deprived in all indicators
Sierra Leone Multidimensional Poverty Index 20199
Figure 2: National censored headcount ratios, 2017
Table 3: Multidimensional poverty by rural/urban areas, 2017
MPI Incidence (H, %) Intensity (A, %)
Area Population share (%)
Value Confidence interval (95%)
Value (%) Confidence interval (95%)
Value (%)
Confidence interval (95%)
Rural 55.7 0.520 0.507 0.534 86.3 84.5 88.1 60.3 59.8 60.8
Urban 44.3 0.191 0.177 0.206 37.6 35.0 40.3 50.9 50.2 51.6
National 100.0 0.375 0.363 0.386 64.8 63.0 66.5 57.9 57.4 58.3
10
Figure 3: Percentage contribution of each indicator to the MPI, 2017
Sierra Leone Multidimensional Poverty Index 201911
These indicators are also the ones with the highest deprivation among the poor (except for housing materials); thus, a high percentage of multidimen-sionally poor individuals in rural areas are facing these deprivations.
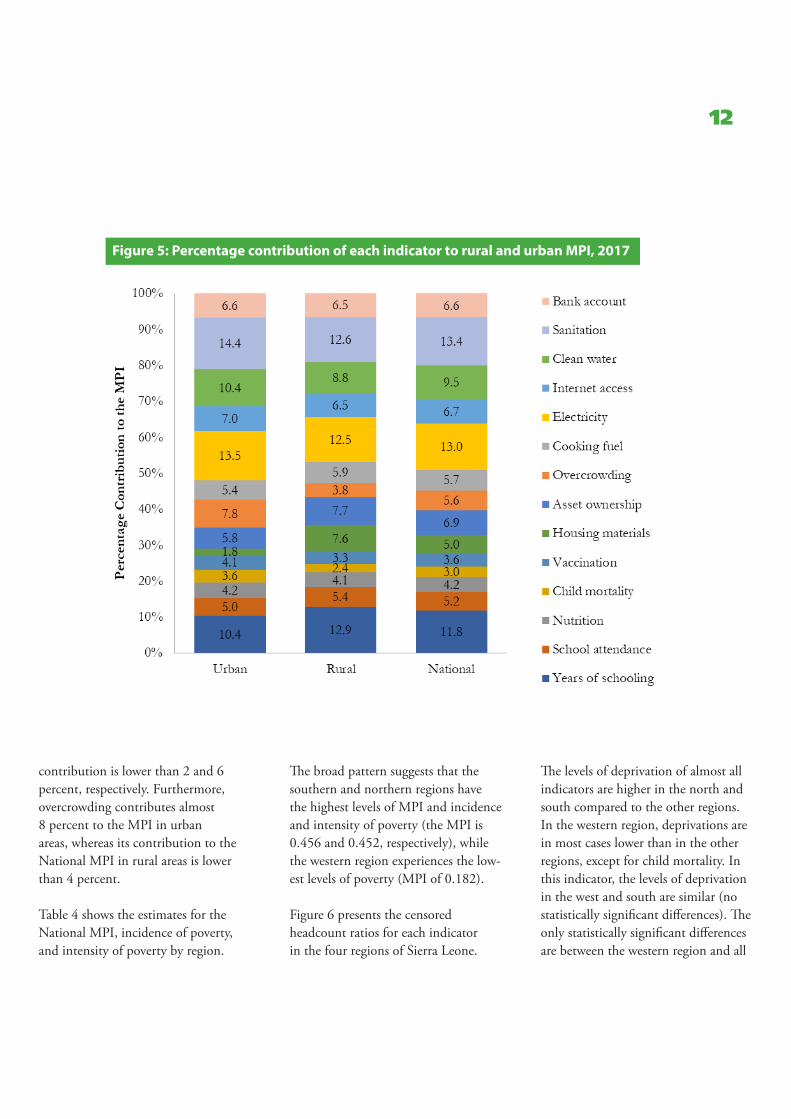
When we analyse the percentage contribution of each indicator to the MPI in rural and urban areas (Figure
5), we find that the contribution of each indicator to the MPI is quite similar. However, there are small differences between rural and urban areas. For example, the indicators with the highest contribution in rural areas are years of schooling (12.9 percent), sanitation (12.6 percent), and electric-ity (12.5 percent). In urban areas, sanitation (14.4 percent) and electricity
Figure 4: Censored headcount ratios by urban and rural areas, 2017
(13.5 percent) are the indicators with the highest contribution. The three indicators in the dimension of housing have the largest differences.
As can be seen in Figure 5, housing materials and asset ownership contribute more than 7 percent to the National MPI in rural areas in Sierra Leone, whereas in urban areas their
12
Figure 5: Percentage contribution of each indicator to rural and urban MPI, 2017
contribution is lower than 2 and 6 percent, respectively. Furthermore, overcrowding contributes almost 8 percent to the MPI in urban areas, whereas its contribution to the National MPI in rural areas is lower than 4 percent.
Table 4 shows the estimates for the National MPI, incidence of poverty, and intensity of poverty by region.
The broad pattern suggests that the southern and northern regions have the highest levels of MPI and incidence and intensity of poverty (the MPI is 0.456 and 0.452, respectively), while the western region experiences the low-est levels of poverty (MPI of 0.182).
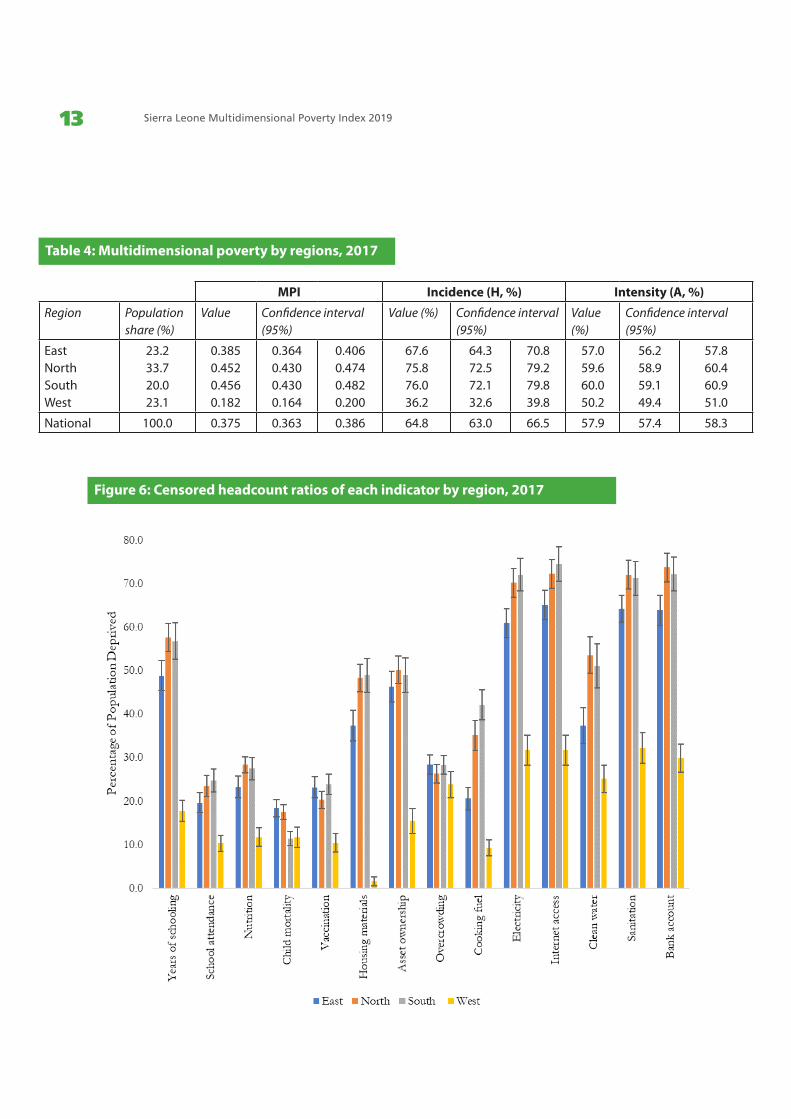
Figure 6 presents the censored headcount ratios for each indicator in the four regions of Sierra Leone.
The levels of deprivation of almost all indicators are higher in the north and south compared to the other regions. In the western region, deprivations are in most cases lower than in the other regions, except for child mortality. In this indicator, the levels of deprivation in the west and south are similar (no statistically significant differences). The only statistically significant differences are between the western region and all
Sierra Leone Multidimensional Poverty Index 201913
Table 4: Multidimensional poverty by regions, 2017
MPI Incidence (H, %) Intensity (A, %)
Region Population share (%)
Value Confidence interval (95%)
Value (%) Confidence interval (95%)
Value (%)
Confidence interval (95%)
EastNorthSouth West
23.233.720.023.1
0.3850.4520.4560.182
0.3640.4300.4300.164
0.4060.4740.4820.200
67.675.876.036.2
64.372.572.132.6
70.879.279.839.8
57.059.660.050.2
56.258.959.149.4
57.860.460.951.0
National 100.0 0.375 0.363 0.386 64.8 63.0 66.5 57.9 57.4 58.3
Figure 6: Censored headcount ratios of each indicator by region, 2017

14
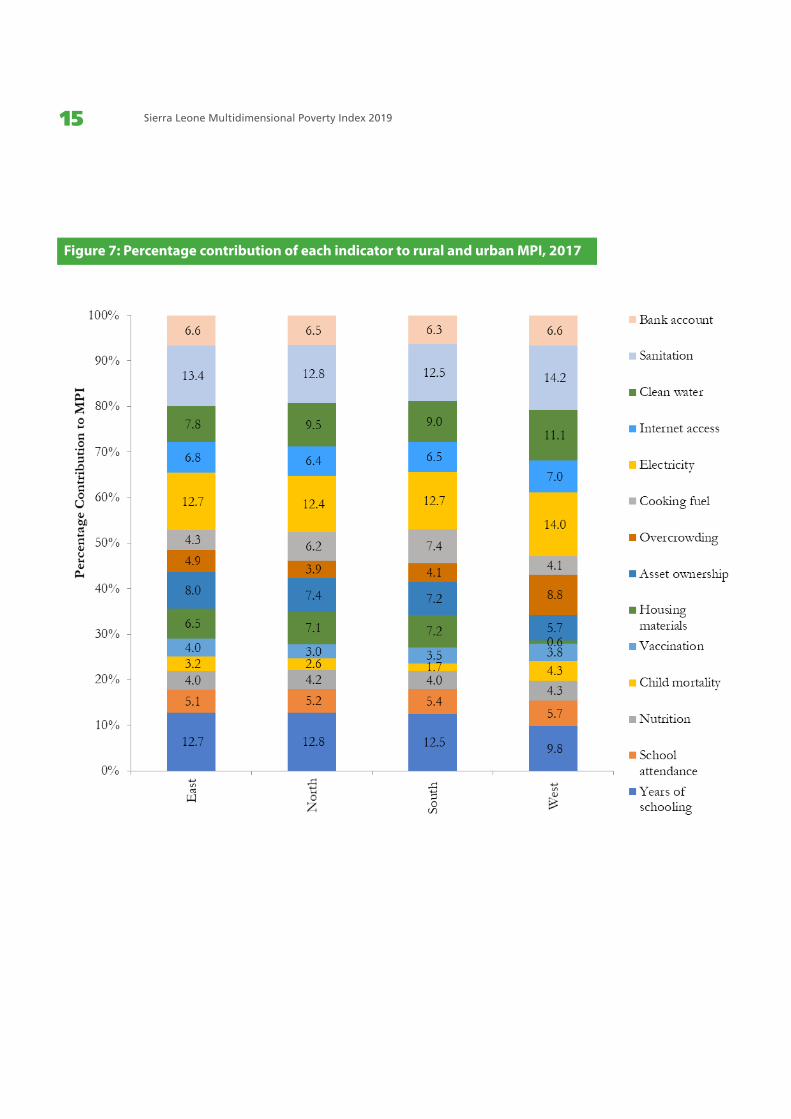
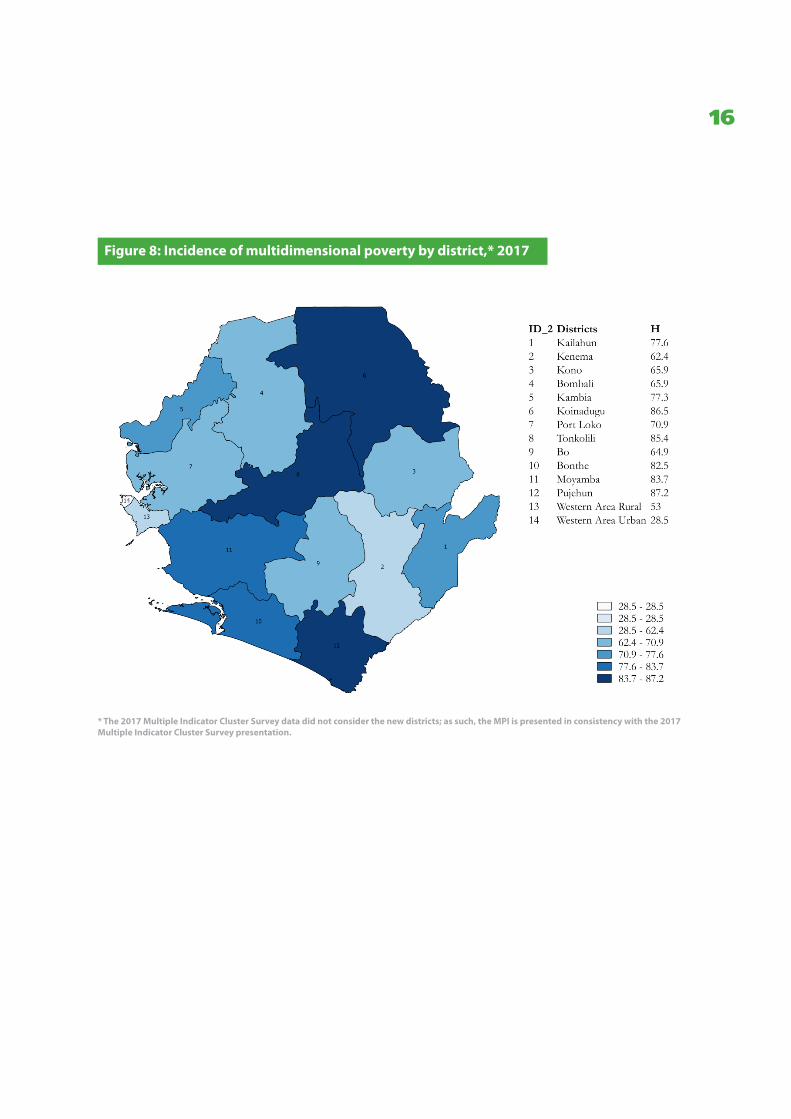
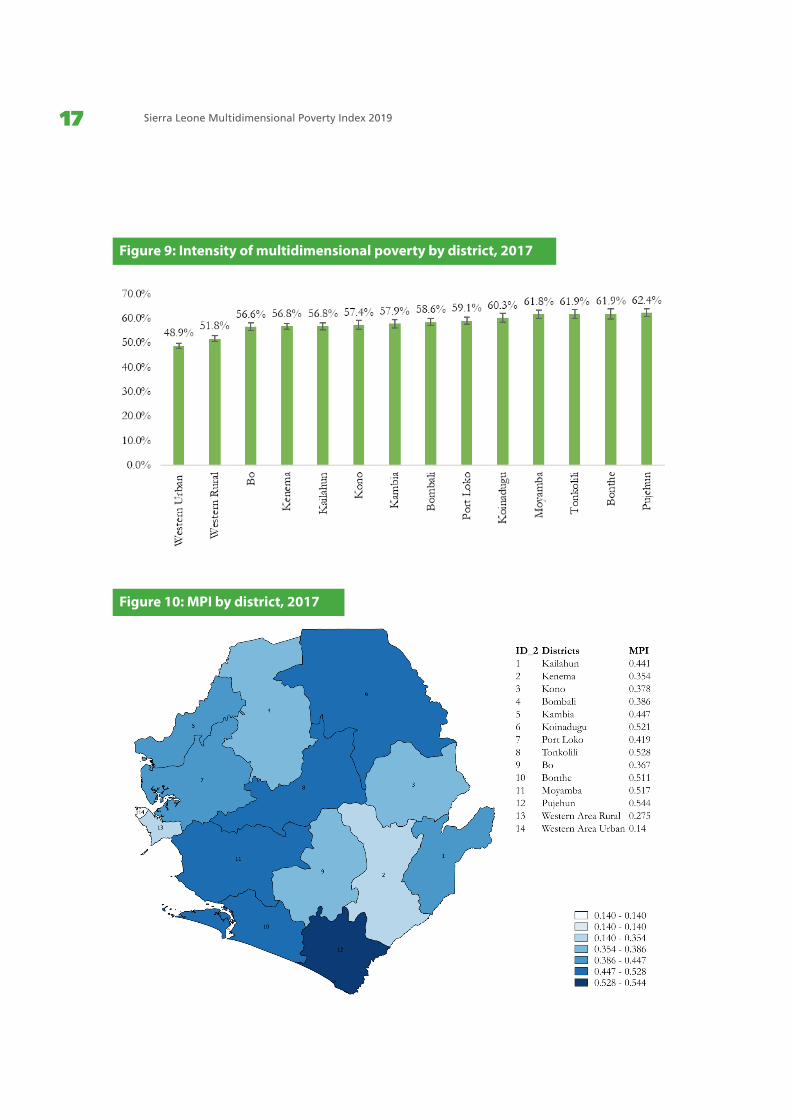
other regions, in all indicators except child mortality and overcrowding. The percentage contribution of each indicator to the regional MPI (Figure 7) reveals that sanitation, electricity, and years of schooling are the indica-tors that contribute the most to the MPI in each of the regions. In the case of the western region, the percentage contribution of housing materials is lower than 1 percent, but the contributions of overcrowding, child mortality, sanitation, clean water, and electricity are larger compared to the contribution of these indicators to the MPI in the northern, southern, and eastern regions. Figure 8 presents the incidence of multidimensional poverty by district.1 The results reveal that Pujehun is the poorest district in Sierra Leone, with an incidence of poverty of 87.2 percent. The second-poorest district in the country is Koinadugu, with 86.5 percent. Western Urban District meanwhile has the lowest levels of poverty, with 28.5 percent of its population living in poverty. Pujehun, Bonthe, and Tonkolili are the three districts with the highest intensity of multidimensional poverty (Figure 9). Figure 10 presents the MPI in each of the 14 districts. As expected, Western Urban has the lowest MPI
1 Given that Multiple Indicator Cluster Survey data was collected previous to the reorganization of the districts, it was only possible to disaggregate the data using information from the 14 districts.
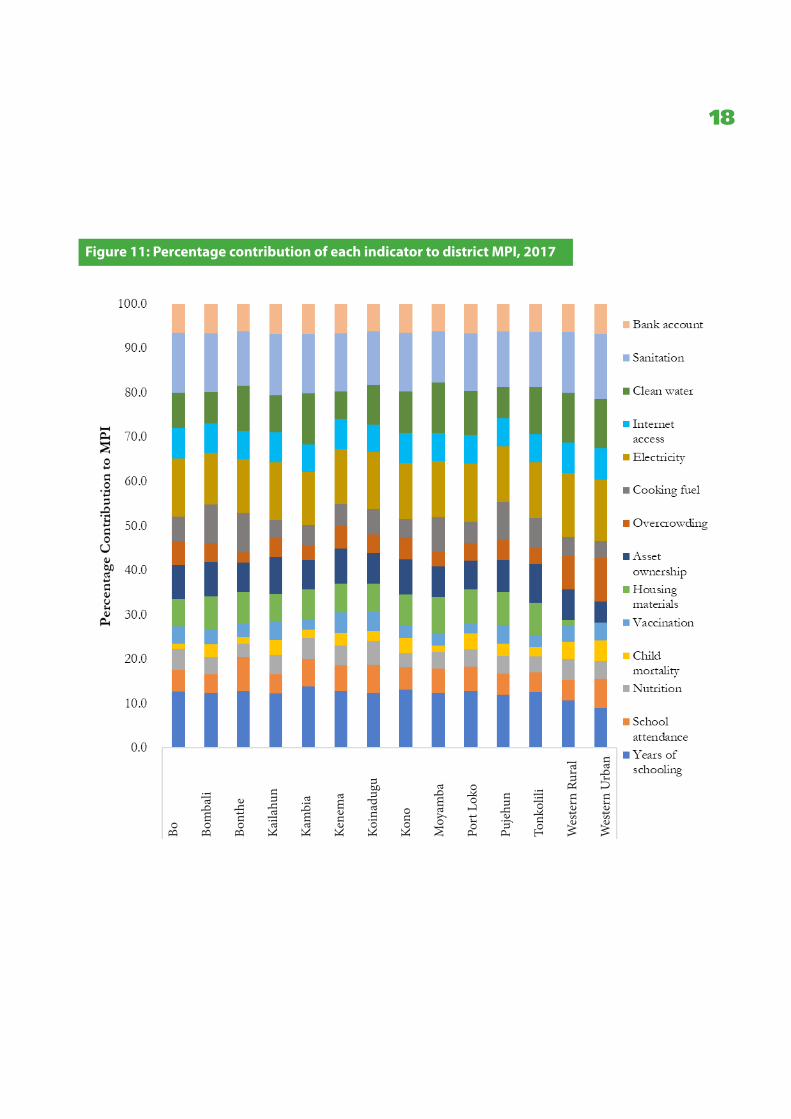
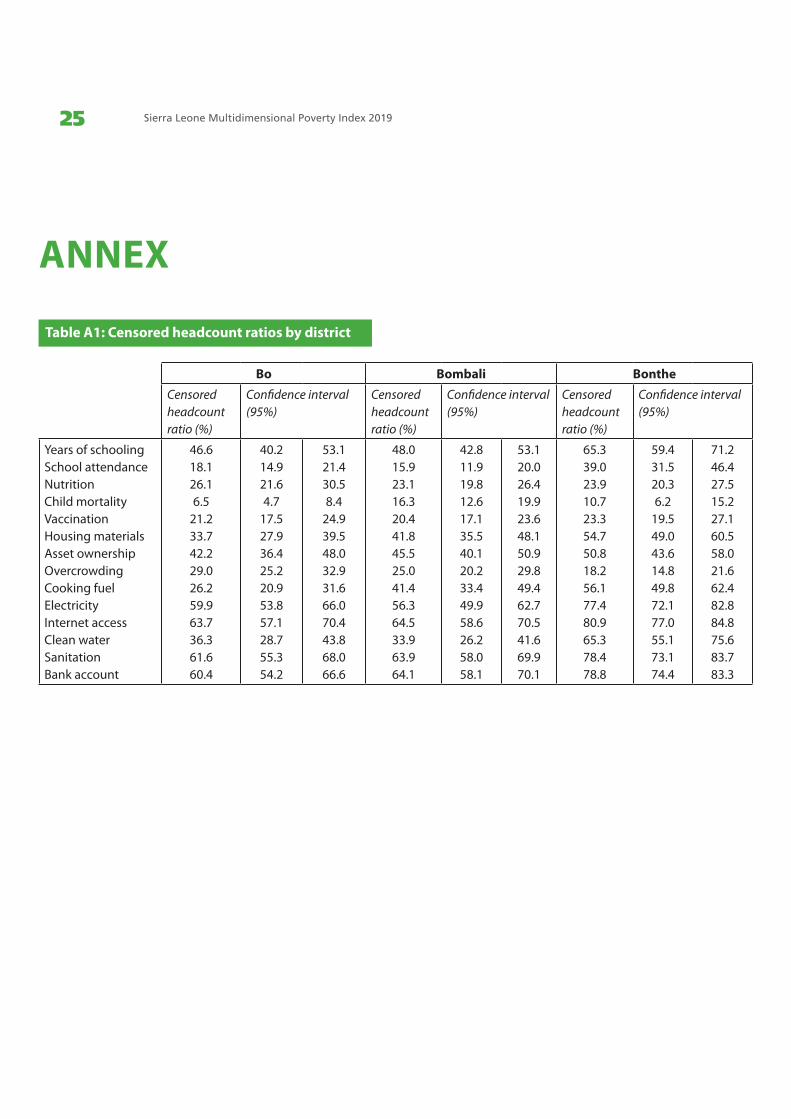
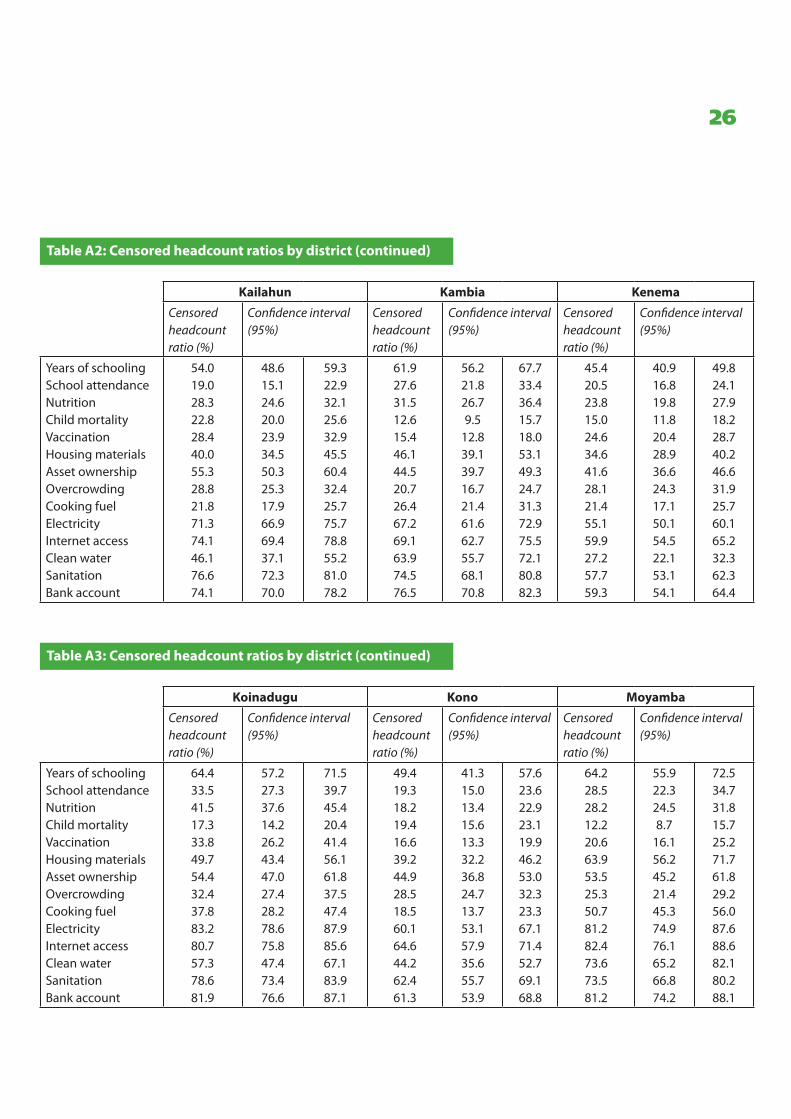
(0.140) in the country. The district with the highest MPI is Pujehun in the southern region (0.544), followed by Tonkolili and Koinadugu in the northern region (0.528 and 0.521, respectively). No significant differences are found between the levels of MPI of these three districts. However, significant differences are found between the MPI of these districts and those with the lowest MPI – Western Urban (0.140), Western Rural (0.275), and Bo (0.367). When the censored headcount ratios per indicator are analysed for each district (Table A1 in the annex), results reveal that in most regions the indica-tors related to electricity, sanitation, internet access, and bank account have the highest levels of deprivation. That is, multidimensionally poor individuals in most districts face deprivations in these indicators.
The percentage contribution of each indicator to district MPIs (Figure 11) shows similar patterns in most districts except for Western Rural and Western Urban. This is consistent with the previous findings, which show that indicators such as housing materials and overcrowding have a different contribution when comparing the western region with other regions and when comparing rural and urban areas.
Sanitation, electricity, and years of schooling are the indicators that contribute the most to the MPI in each of the regions
Sierra Leone Multidimensional Poverty Index 201915
Figure 7: Percentage contribution of each indicator to rural and urban MPI, 2017
16
Figure 8: Incidence of multidimensional poverty by district,* 2017
* The 2017 Multiple Indicator Cluster Survey data did not consider the new districts; as such, the MPI is presented in consistency with the 2017 Multiple Indicator Cluster Survey presentation.
Sierra Leone Multidimensional Poverty Index 201917
Figure 9: Intensity of multidimensional poverty by district, 2017
Figure 10: MPI by district, 2017
18
Figure 11: Percentage contribution of each indicator to district MPI, 2017
Bo Bom
bali
Bont
he
Kai
lahu
n
Kam
bia
Kene
ma
Koin
adug
u
Kono
Moy
amba
Port
Lok
o
Puje
hun
Tonk
olili
Wes
tern
Rur
al
Wes
tern
Urb
an
Sierra Leone Multidimensional Poverty Index 201919
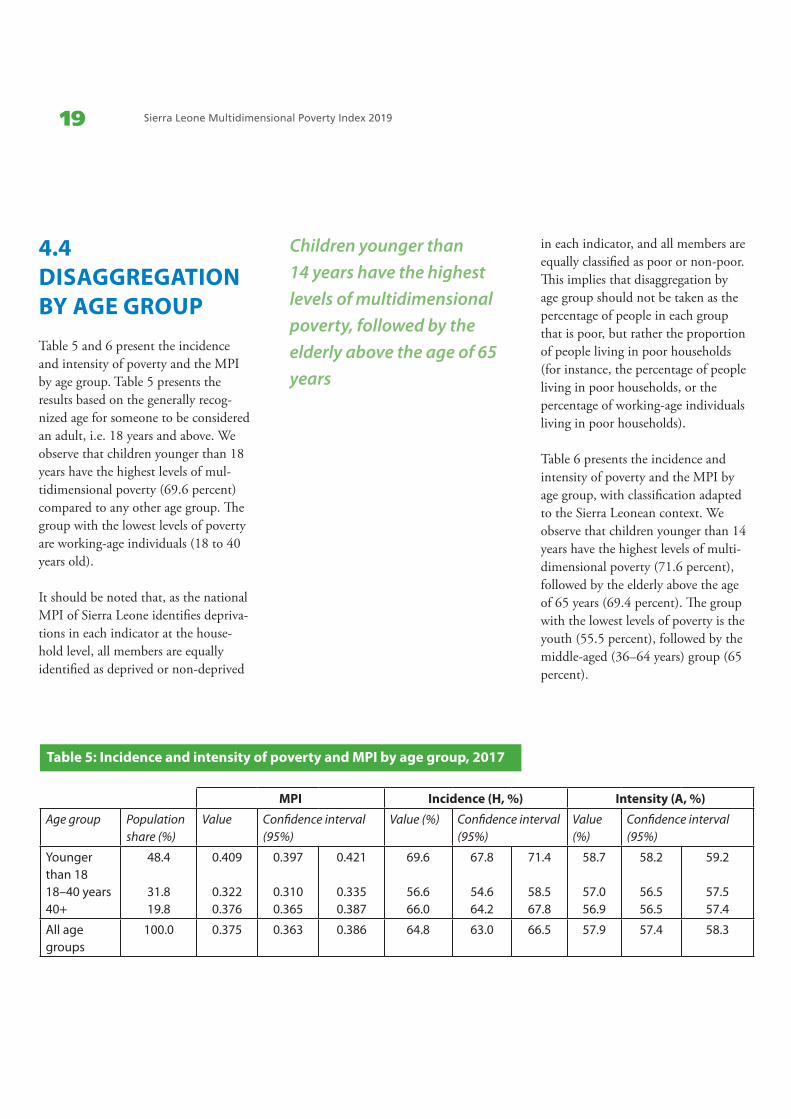
4.4 DISAGGREGATION BY AGE GROUPTable 5 and 6 present the incidence and intensity of poverty and the MPI by age group. Table 5 presents the results based on the generally recog-nized age for someone to be considered an adult, i.e. 18 years and above. We observe that children younger than 18 years have the highest levels of mul-tidimensional poverty (69.6 percent) compared to any other age group. The group with the lowest levels of poverty are working-age individuals (18 to 40 years old).
It should be noted that, as the national MPI of Sierra Leone identifies depriva-tions in each indicator at the house-hold level, all members are equally identified as deprived or non-deprived
in each indicator, and all members are equally classified as poor or non-poor. This implies that disaggregation by age group should not be taken as the percentage of people in each group that is poor, but rather the proportion of people living in poor households (for instance, the percentage of people living in poor households, or the percentage of working-age individuals living in poor households).
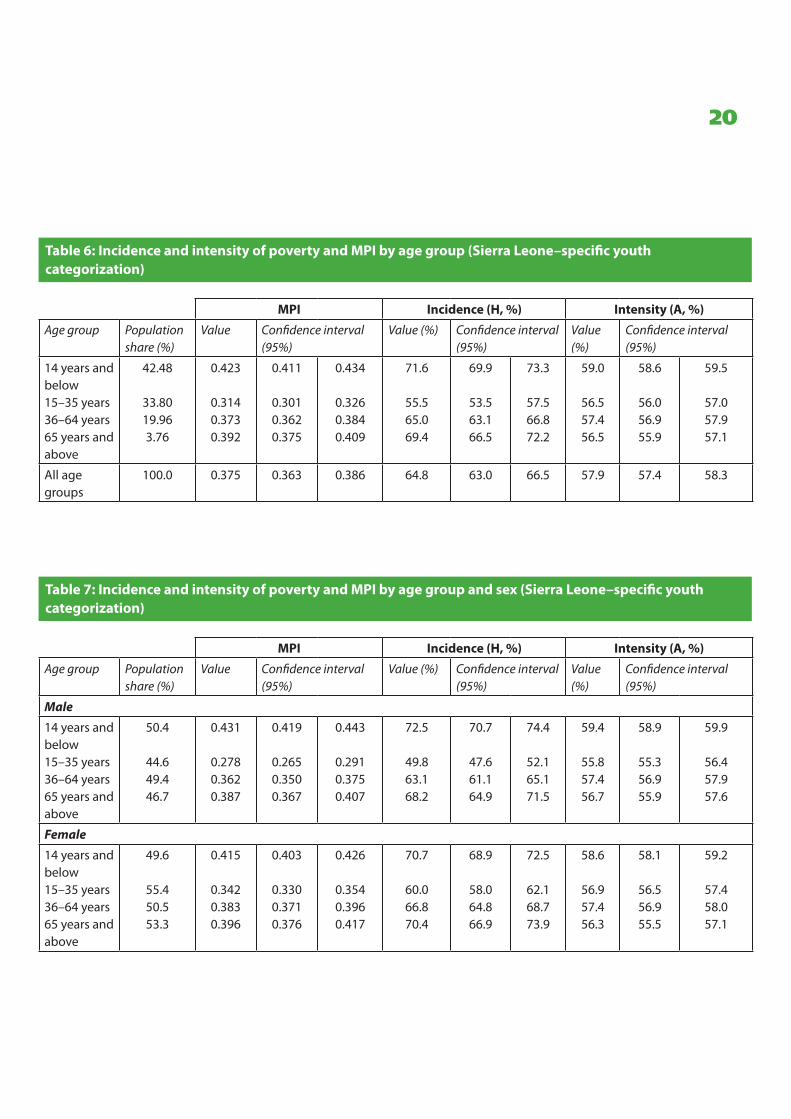
Table 6 presents the incidence and intensity of poverty and the MPI by age group, with classification adapted to the Sierra Leonean context. We observe that children younger than 14 years have the highest levels of multi-dimensional poverty (71.6 percent), followed by the elderly above the age of 65 years (69.4 percent). The group with the lowest levels of poverty is the youth (55.5 percent), followed by the middle-aged (36–64 years) group (65 percent).
Table 5: Incidence and intensity of poverty and MPI by age group, 2017
MPI Incidence (H, %) Intensity (A, %)
Age group Population share (%)
Value Confidence interval (95%)
Value (%) Confidence interval (95%)
Value (%)
Confidence interval (95%)
Younger than 1818–40 years40+
48.4
31.819.8
0.409
0.3220.376
0.397
0.3100.365
0.421
0.3350.387
69.6
56.666.0
67.8
54.664.2
71.4
58.567.8
58.7
57.056.9
58.2
56.556.5
59.2
57.557.4
All age groups
100.0 0.375 0.363 0.386 64.8 63.0 66.5 57.9 57.4 58.3
Children younger than 14 years have the highest levels of multidimensional poverty, followed by the elderly above the age of 65 years
20
Table 6: Incidence and intensity of poverty and MPI by age group (Sierra Leone–specific youth categorization)
MPI Incidence (H, %) Intensity (A, %)
Age group Population share (%)
Value Confidence interval (95%)
Value (%) Confidence interval (95%)
Value (%)
Confidence interval (95%)
14 years and below15–35 years36–64 years65 years and above
42.48
33.8019.963.76
0.423
0.3140.3730.392
0.411
0.3010.3620.375
0.434
0.3260.3840.409
71.6
55.565.069.4
69.9
53.563.166.5
73.3
57.566.872.2
59.0
56.557.456.5
58.6
56.056.955.9
59.5
57.057.957.1
All age groups
100.0 0.375 0.363 0.386 64.8 63.0 66.5 57.9 57.4 58.3
Table 7: Incidence and intensity of poverty and MPI by age group and sex (Sierra Leone–specific youth categorization)
MPI Incidence (H, %) Intensity (A, %)
Age group Population share (%)
Value Confidence interval (95%)
Value (%) Confidence interval (95%)
Value (%)
Confidence interval (95%)
Male
14 years and below15–35 years36–64 years65 years and above
50.4
44.649.446.7
0.431
0.2780.3620.387
0.419
0.2650.3500.367
0.443
0.2910.3750.407
72.5
49.863.168.2
70.7
47.661.164.9
74.4
52.165.171.5
59.4
55.857.456.7
58.9
55.356.955.9
59.9
56.457.957.6
Female
14 years and below15–35 years36–64 years65 years and above
49.6
55.450.553.3
0.415
0.3420.3830.396
0.403
0.3300.3710.376
0.426
0.3540.3960.417
70.7
60.066.870.4
68.9
58.064.866.9
72.5
62.168.773.9
58.6
56.957.456.3
58.1
56.556.955.5
59.2
57.458.057.1
Sierra Leone Multidimensional Poverty Index 201921
Table 7 presents the incidence and intensity of poverty and the MPI by both age group and gender. We observe that, apart from the children (14 years and below), females have relatively higher poverty rates than their male counterparts. For instance,
female youths (15–35 years) are poorer (60 percent) compared to their male counterparts (49.8 percent).
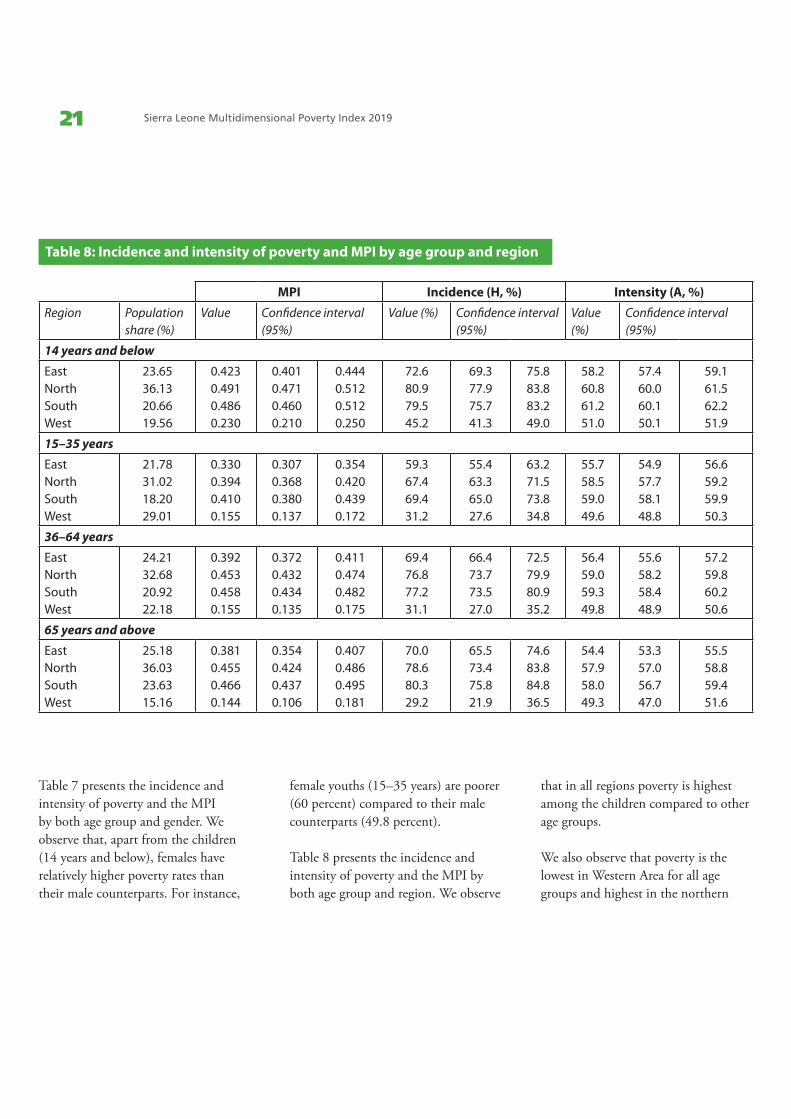
Table 8 presents the incidence and intensity of poverty and the MPI by both age group and region. We observe
that in all regions poverty is highest among the children compared to other age groups.
We also observe that poverty is the lowest in Western Area for all age groups and highest in the northern
Table 8: Incidence and intensity of poverty and MPI by age group and region
MPI Incidence (H, %) Intensity (A, %)
Region Population share (%)
Value Confidence interval (95%)
Value (%) Confidence interval (95%)
Value (%)
Confidence interval (95%)
14 years and below
EastNorthSouthWest
23.6536.1320.6619.56
0.4230.4910.4860.230
0.4010.4710.4600.210
0.4440.5120.5120.250
72.680.979.545.2
69.377.975.741.3
75.883.883.249.0
58.260.861.251.0
57.460.060.150.1
59.161.562.251.9
15–35 years
EastNorthSouthWest
21.7831.0218.2029.01
0.3300.3940.4100.155
0.3070.3680.3800.137
0.3540.4200.4390.172
59.367.469.431.2
55.463.365.027.6
63.271.573.834.8
55.758.559.049.6
54.957.758.148.8
56.659.259.950.3
36–64 years
EastNorthSouthWest
24.2132.6820.9222.18
0.3920.4530.4580.155
0.3720.4320.4340.135
0.4110.4740.4820.175
69.476.877.231.1
66.473.773.527.0
72.579.980.935.2
56.459.059.349.8
55.658.258.448.9
57.259.860.250.6
65 years and above
EastNorthSouthWest
25.1836.0323.6315.16
0.3810.4550.4660.144
0.3540.4240.4370.106
0.4070.4860.4950.181
70.078.680.329.2
65.573.475.821.9
74.683.884.836.5
54.457.958.049.3
53.357.056.747.0
55.558.859.451.6
22
and southern regions. Poverty rates by age group and district are presented in Tables A8 to A11 in the annex.
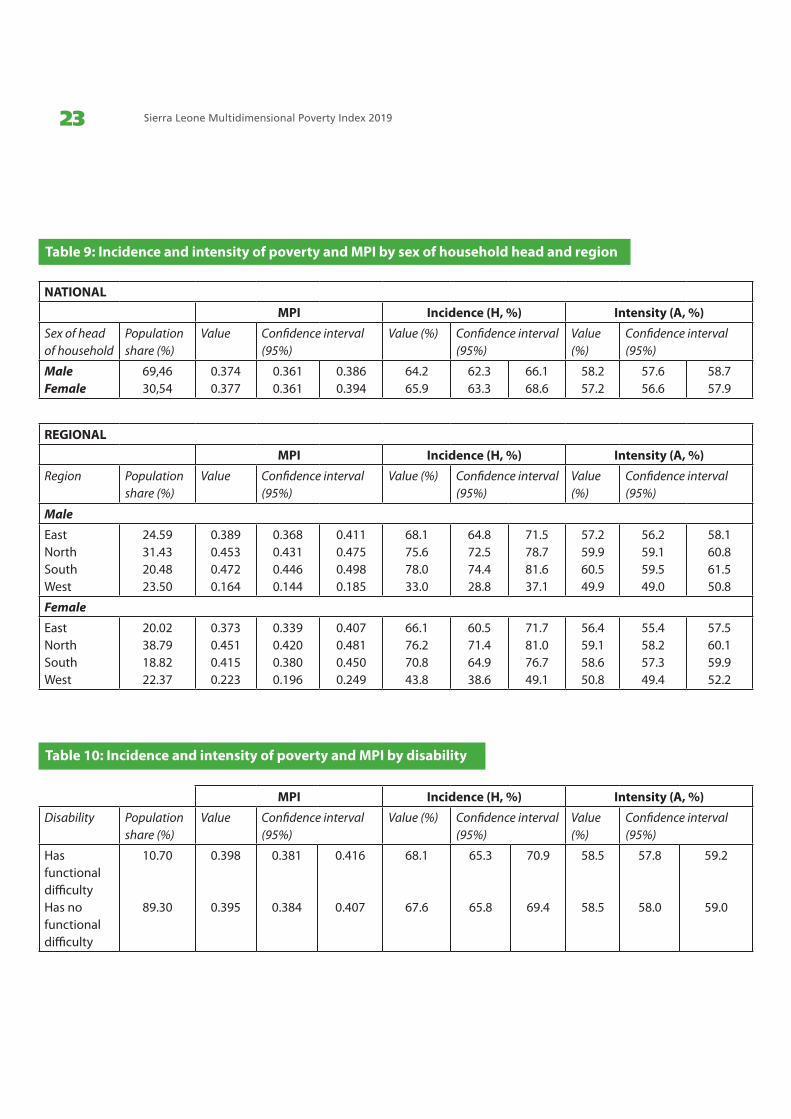
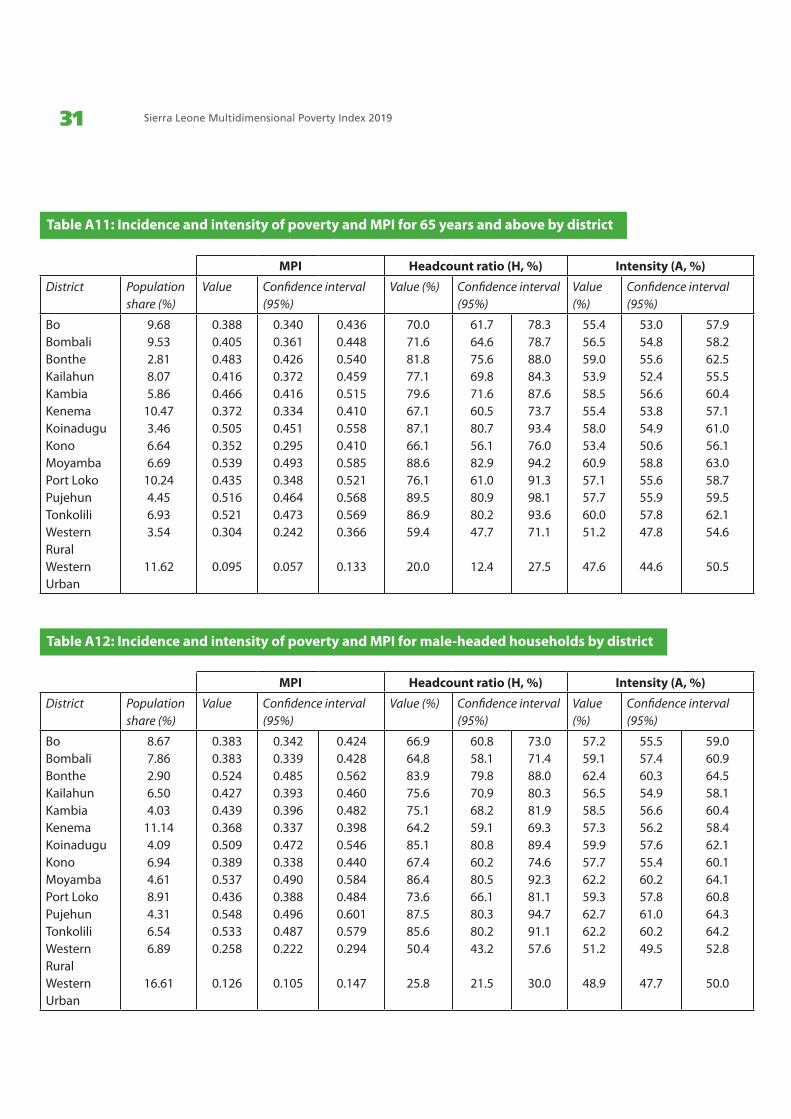
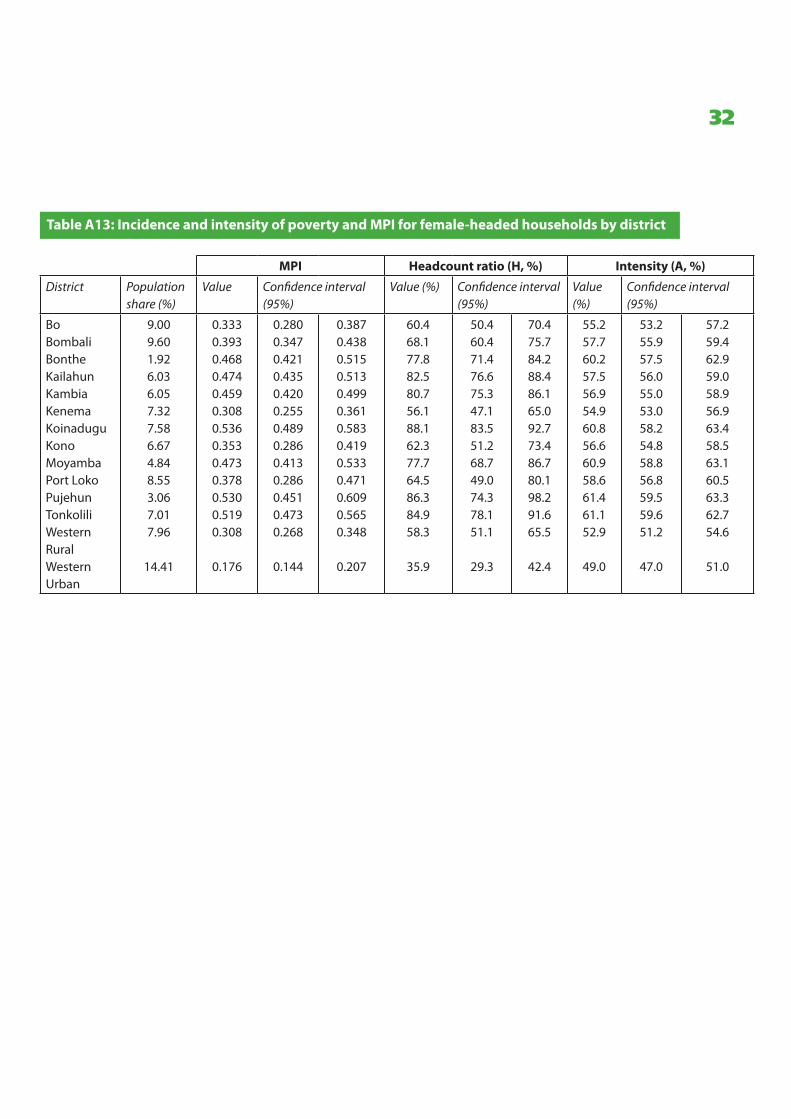
4.5 DISAGGREGATION BY SEX OF THE HOUSEHOLD HEADMultidimensional poverty is analysed on the basis of the sex of the household head. Table 9 shows that generally female-headed households have a higher level of multidimensional poverty (65.9 percent) compared to male-headed households (64.2
percent). We also observe that poverty is higher in female-headed households in the northern region and in Western Area, whereas the opposite is the case in the southern and eastern regions.
The fact that poverty is higher in male-headed households in the south and east may be attributed to cultural factors that encourage empathy and support to a widow and the family of a deceased husband by brothers and other family members. The situation is different in the northern region and Western Area, where such bonds and cultural values are not that strong. The details for poverty by sex of the household head by district are presented in Tables A12 and A13 in the annex.
4.6 DISAGGREGATION BY DISABILITY STATUS Table 10 presents multidimensional poverty based on disability defined as functional difficulties (18–49 years). We observe that people with functional difficulties are slightly poorer (68.1 percent) compared with those without functional difficulties (67.6 percent).
© UNDP Sierra Leone/Alpha Sesay
Sierra Leone Multidimensional Poverty Index 201923
Table 9: Incidence and intensity of poverty and MPI by sex of household head and region
NATIONAL
MPI Incidence (H, %) Intensity (A, %)
Sex of head of household
Population share (%)
Value Confidence interval (95%)
Value (%) Confidence interval (95%)
Value (%)
Confidence interval (95%)
MaleFemale
69,4630,54
0.3740.377
0.3610.361
0.3860.394
64.265.9
62.363.3
66.168.6
58.257.2
57.656.6
58.757.9
REGIONAL
MPI Incidence (H, %) Intensity (A, %)
Region Population share (%)
Value Confidence interval (95%)
Value (%) Confidence interval (95%)
Value (%)
Confidence interval (95%)
Male
EastNorthSouthWest
24.5931.4320.4823.50
0.3890.4530.4720.164
0.3680.4310.4460.144
0.4110.4750.4980.185
68.175.678.033.0
64.872.574.428.8
71.578.781.637.1
57.259.960.549.9
56.259.159.549.0
58.160.861.550.8
Female
EastNorthSouthWest
20.0238.7918.8222.37
0.3730.4510.4150.223
0.3390.4200.3800.196
0.4070.4810.4500.249
66.176.270.843.8
60.571.464.938.6
71.781.076.749.1
56.459.158.650.8
55.458.257.349.4
57.560.159.952.2
Table 10: Incidence and intensity of poverty and MPI by disability
MPI Incidence (H, %) Intensity (A, %)
Disability Population share (%)
Value Confidence interval (95%)
Value (%) Confidence interval (95%)
Value (%)
Confidence interval (95%)
Has functional difficultyHas no functional difficulty
10.70
89.30
0.398
0.395
0.381
0.384
0.416
0.407
68.1
67.6
65.3
65.8
70.9
69.4
58.5
58.5
57.8
58.0
59.2
59.0
24
5. POLICY RECOMMENDATIONS
The results of the National MPI for Sierra Leone reveal important differences between rural and urban areas, and between Western Area and the other regions. The national results reveal that multidimensional poor individuals face high levels of depriva-tion in access to electricity, sanitation, internet services, and bank accounts.
Therefore, it is important to prioritize resources in order to reduce these relevant deprivations in the whole country. Given that the percentage of multidimensional individuals deprived in each of these indicators is different between regions and districts, it is im-portant to prioritize actions depending on the percentage of individuals and households facing each deprivation.
It is important to recognize that the government should continue working on reducing child mortality, increasing the percentage of children with full vaccinations according to their age, and reducing child undernutrition and stunting.
Policies aiming to reduce multidimen-sional poverty in Sierra Leone should focus on reducing the multiple depriva-tions that the multidimensionally poor face. The results of the disaggregation of the MPI revealed that people living
in urban and rural areas face different deprivations; therefore, those should be prioritized in each area. In addition, three districts (Pujehun, Koinadugu, and Tonkolili) present the highest incidence of multidimensional poverty, while Pujehun also faces the highest intensity of poverty.
As a result, policies and programmes aiming to reduce multidimensional poverty in these districts should be a priority in the country.
Policies aiming to reduce multidimensional poverty in Sierra Leone should focus on reducing the multiple deprivations that the multidimensionally poor face
Sierra Leone Multidimensional Poverty Index 201925
ANNEX
Table A1: Censored headcount ratios by district
Bo Bombali Bonthe
Censored headcount ratio (%)
Confidence interval (95%)
Censored headcount ratio (%)
Confidence interval (95%)
Censored headcount ratio (%)
Confidence interval (95%)
Years of schoolingSchool attendanceNutritionChild mortalityVaccinationHousing materialsAsset ownershipOvercrowdingCooking fuelElectricityInternet accessClean waterSanitationBank account
46.618.126.16.5
21.233.742.229.026.259.963.736.361.660.4
40.214.921.6 4.7
17.5 27.9 36.4 25.2 20.9 53.8 57.1 28.7 55.3 54.2
53.1 21.4 30.5 8.4
24.9 39.5 48.0 32.9 31.6 66.0 70.4 43.8 68.0 66.6
48.0 15.9 23.1 16.3 20.4 41.8 45.5 25.0 41.4 56.3 64.5 33.9 63.9 64.1
42.8 11.9 19.8 12.6 17.1 35.5 40.1 20.2 33.4 49.9 58.6 26.2 58.0 58.1
53.1 20.0 26.4 19.9 23.6 48.1 50.9 29.8 49.4 62.7 70.5 41.6 69.9 70.1
65.3 39.0 23.9 10.7 23.3 54.7 50.8 18.2 56.1 77.4 80.9 65.3 78.4 78.8
59.4 31.5 20.3 6.2
19.5 49.0 43.6 14.8 49.8 72.1 77.0 55.1 73.1 74.4
71.2 46.4 27.5 15.2 27.1 60.5 58.0 21.6 62.4 82.8 84.8 75.6 83.7 83.3
26
Table A2: Censored headcount ratios by district (continued)
Kailahun Kambia Kenema
Censored headcount ratio (%)
Confidence interval (95%)
Censored headcount ratio (%)
Confidence interval (95%)
Censored headcount ratio (%)
Confidence interval (95%)
Years of schoolingSchool attendanceNutritionChild mortalityVaccinationHousing materialsAsset ownershipOvercrowdingCooking fuelElectricityInternet accessClean waterSanitationBank account
54.0 19.0 28.3 22.8 28.4 40.0 55.3 28.8 21.8 71.3 74.1 46.1 76.6 74.1
48.6 15.1 24.6 20.0 23.9 34.5 50.3 25.3 17.9 66.9 69.4 37.1 72.3 70.0
59.3 22.9 32.1 25.6 32.9 45.5 60.4 32.4 25.7 75.7 78.8 55.2 81.0 78.2
61.9 27.6 31.5 12.6 15.4 46.1 44.5 20.7 26.4 67.2 69.1 63.9 74.5 76.5
56.2 21.8 26.7 9.5
12.8 39.1 39.7 16.7 21.4 61.6 62.7 55.7 68.1 70.8
67.7 33.4 36.4 15.7 18.0 53.1 49.3 24.7 31.3 72.9 75.5 72.1 80.8 82.3
45.4 20.5 23.8 15.0 24.6 34.6 41.6 28.1 21.4 55.1 59.9 27.2 57.7 59.3
40.9 16.8 19.8 11.8 20.4 28.9 36.6 24.3 17.1 50.1 54.5 22.1 53.1 54.1
49.8 24.1 27.9 18.2 28.7 40.2 46.6 31.9 25.7 60.1 65.2 32.3 62.3 64.4
Table A3: Censored headcount ratios by district (continued)
Koinadugu Kono Moyamba
Censored headcount ratio (%)
Confidence interval (95%)
Censored headcount ratio (%)
Confidence interval (95%)
Censored headcount ratio (%)
Confidence interval (95%)
Years of schoolingSchool attendanceNutritionChild mortalityVaccinationHousing materialsAsset ownershipOvercrowdingCooking fuelElectricityInternet accessClean waterSanitationBank account
64.4 33.5 41.5 17.3 33.8 49.7 54.4 32.4 37.8 83.2 80.7 57.3 78.6 81.9
57.2 27.3 37.6 14.2 26.2 43.4 47.0 27.4 28.2 78.6 75.8 47.4 73.4 76.6
71.5 39.7 45.4 20.4 41.4 56.1 61.8 37.5 47.4 87.9 85.6 67.1 83.9 87.1
49.4 19.3 18.2 19.4 16.6 39.2 44.9 28.5 18.5 60.1 64.6 44.2 62.4 61.3
41.3 15.0 13.4 15.6 13.3 32.2 36.8 24.7 13.7 53.1 57.9 35.6 55.7 53.9
57.6 23.6 22.9 23.1 19.9 46.2 53.0 32.3 23.3 67.1 71.4 52.7 69.1 68.8
64.2 28.5 28.2 12.2 20.6 63.9 53.5 25.3 50.7 81.2 82.4 73.6 73.5 81.2
55.9 22.3 24.5 8.7
16.1 56.2 45.2 21.4 45.3 74.9 76.1 65.2 66.8 74.2
72.5 34.7 31.8 15.7 25.2 71.7 61.8 29.2 56.0 87.6 88.6 82.1 80.2 88.1
Sierra Leone Multidimensional Poverty Index 201927
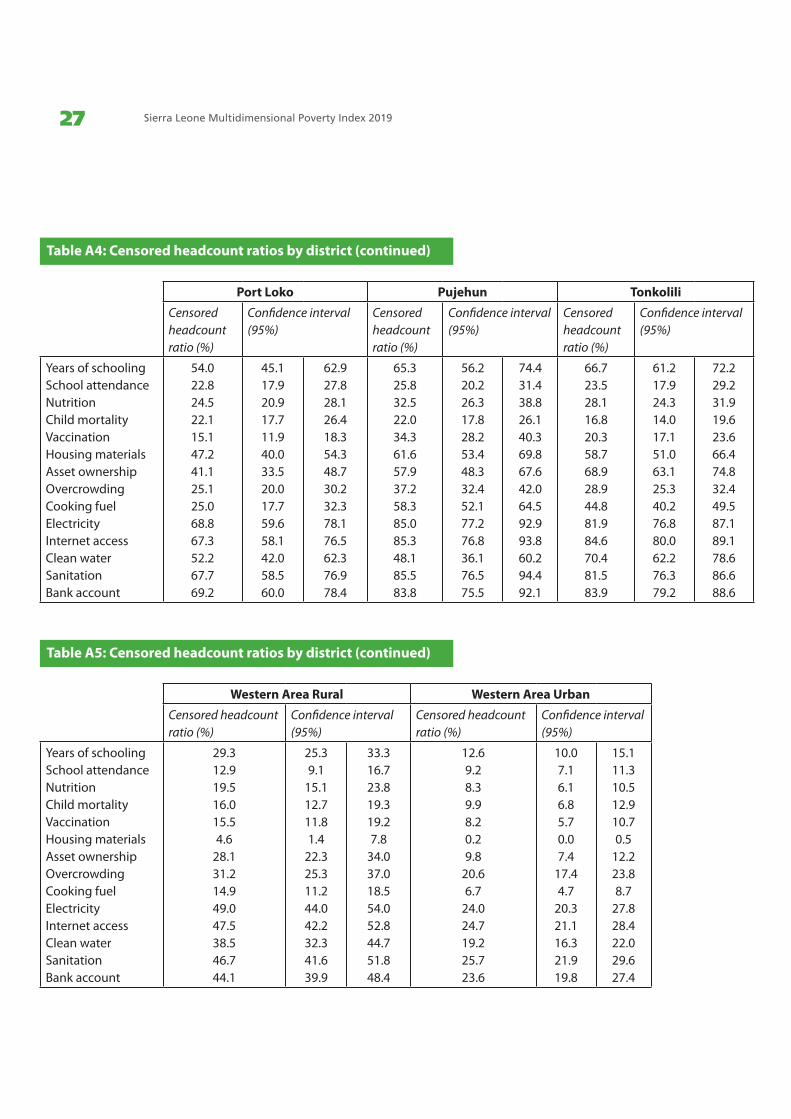
Table A4: Censored headcount ratios by district (continued)
Port Loko Pujehun Tonkolili
Censored headcount ratio (%)
Confidence interval (95%)
Censored headcount ratio (%)
Confidence interval (95%)
Censored headcount ratio (%)
Confidence interval (95%)
Years of schoolingSchool attendanceNutritionChild mortalityVaccinationHousing materialsAsset ownershipOvercrowdingCooking fuelElectricityInternet accessClean waterSanitationBank account
54.0 22.8 24.5 22.1 15.1 47.2 41.1 25.1 25.0 68.8 67.3 52.2 67.7 69.2
45.1 17.9 20.9 17.7 11.9 40.0 33.5 20.0 17.7 59.6 58.1 42.0 58.5 60.0
62.9 27.8 28.1 26.4 18.3 54.3 48.7 30.2 32.3 78.1 76.5 62.3 76.9 78.4
65.3 25.8 32.5 22.0 34.3 61.6 57.9 37.2 58.3 85.0 85.3 48.1 85.5 83.8
56.2 20.2 26.3 17.8 28.2 53.4 48.3 32.4 52.1 77.2 76.8 36.1 76.5 75.5
74.4 31.4 38.8 26.1 40.3 69.8 67.6 42.0 64.5 92.9 93.8 60.2 94.4 92.1
66.7 23.5 28.1 16.8 20.3 58.7 68.9 28.9 44.8 81.9 84.6 70.4 81.5 83.9
61.2 17.9 24.3 14.0 17.1 51.0 63.1 25.3 40.2 76.8 80.0 62.2 76.3 79.2
72.2 29.2 31.9 19.6 23.6 66.4 74.8 32.4 49.5 87.1 89.1 78.6 86.6 88.6
Table A5: Censored headcount ratios by district (continued)
Western Area Rural Western Area Urban
Censored headcount ratio (%)
Confidence interval (95%)
Censored headcount ratio (%)
Confidence interval (95%)
Years of schoolingSchool attendanceNutritionChild mortalityVaccinationHousing materialsAsset ownershipOvercrowdingCooking fuelElectricityInternet accessClean waterSanitationBank account
29.3 12.9 19.5 16.0 15.5 4.6
28.1 31.2 14.9 49.0 47.5 38.5 46.7 44.1
25.3 9.1
15.1 12.7 11.8 1.4
22.3 25.3 11.2 44.0 42.2 32.3 41.6 39.9
33.3 16.7 23.8 19.3 19.2 7.8
34.0 37.0 18.5 54.0 52.8 44.7 51.8 48.4
12.6 9.2 8.3 9.9 8.2 0.2 9.8
20.6 6.7
24.0 24.7 19.2 25.7 23.6
10.0 7.1 6.1 6.8 5.7 0.0 7.4
17.4 4.7
20.3 21.1 16.3 21.9 19.8
15.1 11.3 10.5 12.9 10.7 0.5
12.2 23.8 8.7
27.8 28.4 22.0 29.6 27.4
28
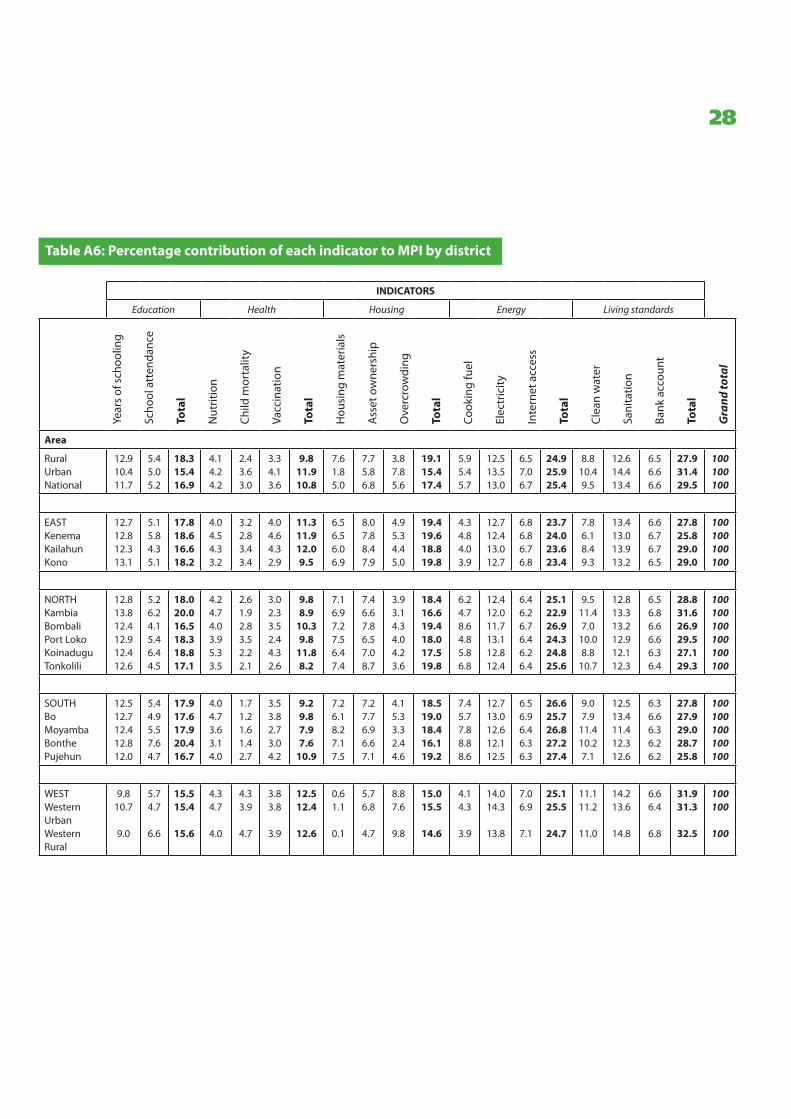
Table A6: Percentage contribution of each indicator to MPI by district
INDICATORS
Education Health Housing Energy Living standards
Area
RuralUrbanNational
12.9 10.4 11.7
5.4 5.0 5.2
18.3 15.4 16.9
4.1 4.2 4.2
2.4 3.6 3.0
3.3 4.1 3.6
9.8 11.9 10.8
7.6 1.8 5.0
7.7 5.8 6.8
3.8 7.8 5.6
19.1 15.4 17.4
5.9 5.4 5.7
12.5 13.5 13.0
6.5 7.0 6.7
24.9 25.9 25.4
8.8 10.4 9.5
12.6 14.4 13.4
6.5 6.6 6.6
27.9 31.4 29.5
100100100
EASTKenemaKailahunKono
12.7 12.8 12.3 13.1
5.1 5.8 4.3 5.1
17.8 18.6 16.6 18.2
4.0 4.5 4.3 3.2
3.2 2.8 3.4 3.4
4.0 4.6 4.3 2.9
11.3 11.9 12.0 9.5
6.5 6.5 6.0 6.9
8.0 7.8 8.4 7.9
4.9 5.3 4.4 5.0
19.4 19.6 18.8 19.8
4.3 4.8 4.0 3.9
12.7 12.4 13.0 12.7
6.8 6.8 6.7 6.8
23.7 24.023.623.4
7.8 6.1 8.4 9.3
13.4 13.0 13.9 13.2
6.6 6.7 6.7 6.5
27.8 25.829.029.0
100100 100 100
NORTHKambiaBombaliPort LokoKoinaduguTonkolili
12.8 13.8 12.4 12.9 12.4 12.6
5.2 6.2 4.1 5.4 6.4 4.5
18.0 20.0 16.5 18.3 18.8 17.1
4.2 4.7 4.0 3.9 5.3 3.5
2.6 1.9 2.8 3.5 2.2 2.1
3.0 2.3 3.5 2.4 4.3 2.6
9.8 8.9
10.3 9.8
11.8 8.2
7.1 6.9 7.2 7.5 6.4 7.4
7.4 6.6 7.8 6.5 7.0 8.7
3.9 3.1 4.3 4.0 4.2 3.6
18.4 16.6 19.4 18.0 17.5 19.8
6.2 4.7 8.6 4.8 5.8 6.8
12.4 12.0 11.7 13.1 12.8 12.4
6.4 6.2 6.7 6.4 6.2 6.4
25.1 22.926.924.324.825.6
9.5 11.4 7.0
10.0 8.8
10.7
12.8 13.3 13.2 12.9 12.1 12.3
6.5 6.8 6.6 6.6 6.3 6.4
28.8 31.626.929.527.129.3
100100 100 100 100 100
SOUTHBoMoyambaBonthePujehun
12.5 12.712.4 12.8 12.0
5.4 4.95.5 7.6 4.7
17.9 17.617.9 20.4 16.7
4.0 4.7 3.6 3.1 4.0
1.7 1.2 1.6 1.4 2.7
3.5 3.8 2.7 3.0 4.2
9.2 9.8 7.9 7.6
10.9
7.2 6.1 8.2 7.1 7.5
7.2 7.7 6.9 6.6 7.1
4.1 5.3 3.3 2.4 4.6
18.5 19.0 18.4 16.1 19.2
7.4 5.7 7.8 8.8 8.6
12.7 13.0 12.6 12.1 12.5
6.5 6.9 6.4 6.3 6.3
26.6 25.726.827.227.4
9.0 7.9
11.4 10.2 7.1
12.5 13.4 11.4 12.3 12.6
6.3 6.6 6.3 6.2 6.2
27.8 27.929.028.725.8
100100 100 100 100
WEST Western Urban Western Rural
9.8 10.7
9.0
5.7 4.7
6.6
15.5 15.4
15.6
4.3 4.7
4.0
4.3 3.9
4.7
3.8 3.8
3.9
12.5 12.4
12.6
0.6 1.1
0.1
5.7 6.8
4.7
8.8 7.6
9.8
15.0 15.5
14.6
4.1 4.3
3.9
14.0 14.3
13.8
7.0 6.9
7.1
25.1 25.5
24.7
11.1 11.2
11.0
14.2 13.6
14.8
6.6 6.4
6.8
31.9 31.3
32.5
100100
100
Year
s of
sch
oolin
g
Scho
ol a
tten
danc
e
Tota
l
Nut
ritio
n
Child
mor
talit
y
Vacc
inat
ion
Tota
l
Hou
sing
mat
eria
ls
Ass
et o
wne
rshi
p
Ove
rcro
wdi
ng
Tota
l
Cook
ing
fuel
Elec
tric
ity
Inte
rnet
acc
ess
Tota
l
Clea
n w
ater
Sani
tatio
n
Bank
acc
ount
Tota
l
Gra
nd to
tal
Sierra Leone Multidimensional Poverty Index 201929
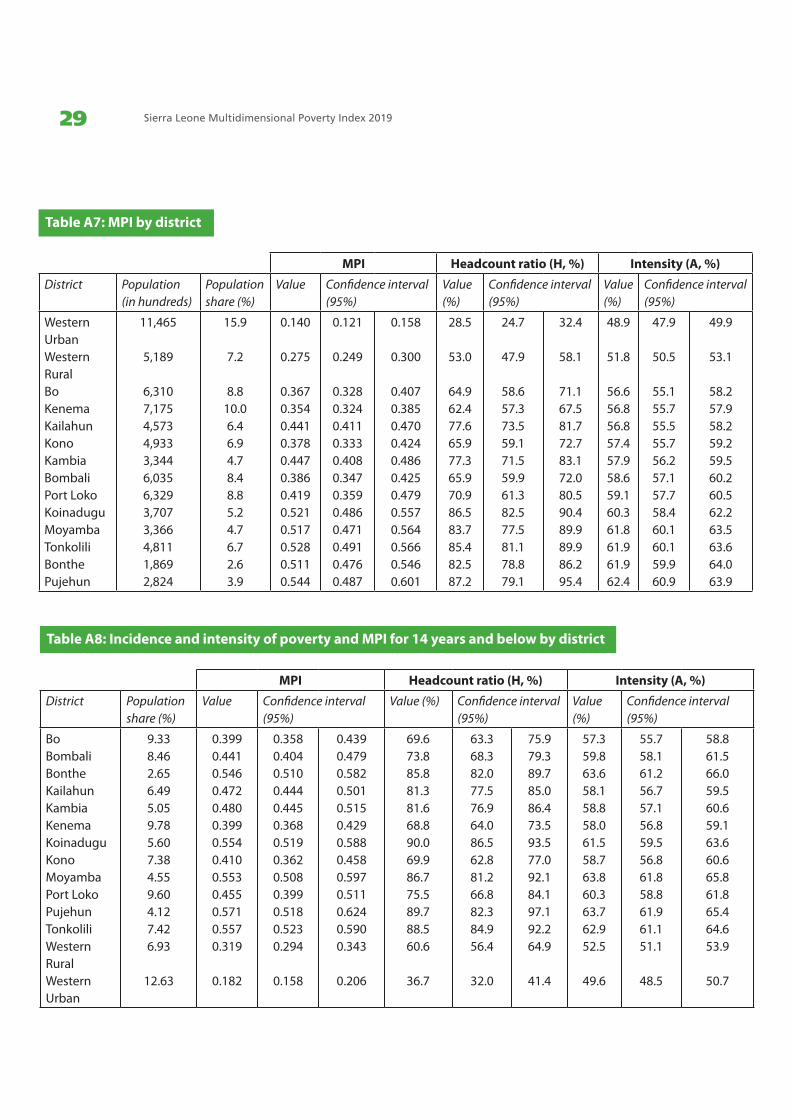
Table A7: MPI by district
MPI Headcount ratio (H, %) Intensity (A, %)
District Population (in hundreds)
Population share (%)
Value Confidence interval (95%)
Value (%)
Confidence interval (95%)
Value (%)
Confidence interval (95%)
Western Urban Western RuralBoKenemaKailahunKonoKambiaBombaliPort LokoKoinaduguMoyambaTonkoliliBonthePujehun
11,465
5,189
6,3107,1754,5734,9333,3446,0356,3293,7073,3664,8111,8692,824
15.9
7.2
8.810.06.46.94.78.48.85.24.76.72.63.9
0.140
0.275
0.3670.3540.4410.3780.4470.3860.4190.5210.5170.5280.5110.544
0.121
0.249
0.3280.3240.4110.3330.4080.3470.3590.4860.4710.4910.4760.487
0.158
0.300
0.4070.3850.4700.4240.4860.4250.4790.5570.5640.5660.5460.601
28.5
53.0
64.962.477.665.977.365.970.986.583.785.482.587.2
24.7
47.9
58.657.373.559.171.559.961.382.577.581.178.879.1
32.4
58.1
71.167.581.772.783.172.080.590.489.989.986.295.4
48.9
51.8
56.656.856.857.457.958.659.160.361.861.961.962.4
47.9
50.5
55.155.755.555.756.257.157.758.460.160.159.960.9
49.9
53.1
58.257.958.259.259.560.260.562.263.563.664.063.9
Table A8: Incidence and intensity of poverty and MPI for 14 years and below by district
MPI Headcount ratio (H, %) Intensity (A, %)
District Population share (%)
Value Confidence interval (95%)
Value (%) Confidence interval (95%)
Value (%)
Confidence interval (95%)
BoBombaliBontheKailahunKambiaKenemaKoinaduguKonoMoyambaPort LokoPujehunTonkoliliWestern RuralWestern Urban
9.338.462.656.495.059.785.607.384.559.604.127.426.93
12.63
0.3990.4410.5460.4720.4800.3990.5540.4100.5530.4550.5710.5570.319
0.182
0.3580.4040.5100.4440.4450.3680.5190.3620.5080.3990.5180.5230.294
0.158
0.4390.4790.5820.5010.5150.4290.5880.4580.5970.5110.6240.5900.343
0.206
69.673.885.881.381.668.890.069.986.775.589.788.560.6
36.7
63.368.382.077.576.964.086.562.881.266.882.384.956.4
32.0
75.979.389.785.086.473.593.577.092.184.197.192.264.9
41.4
57.359.863.658.158.858.061.558.763.860.363.762.952.5
49.6
55.758.161.256.757.156.859.556.861.858.861.961.151.1
48.5
58.861.566.059.560.659.163.660.665.861.865.464.653.9
50.7
30
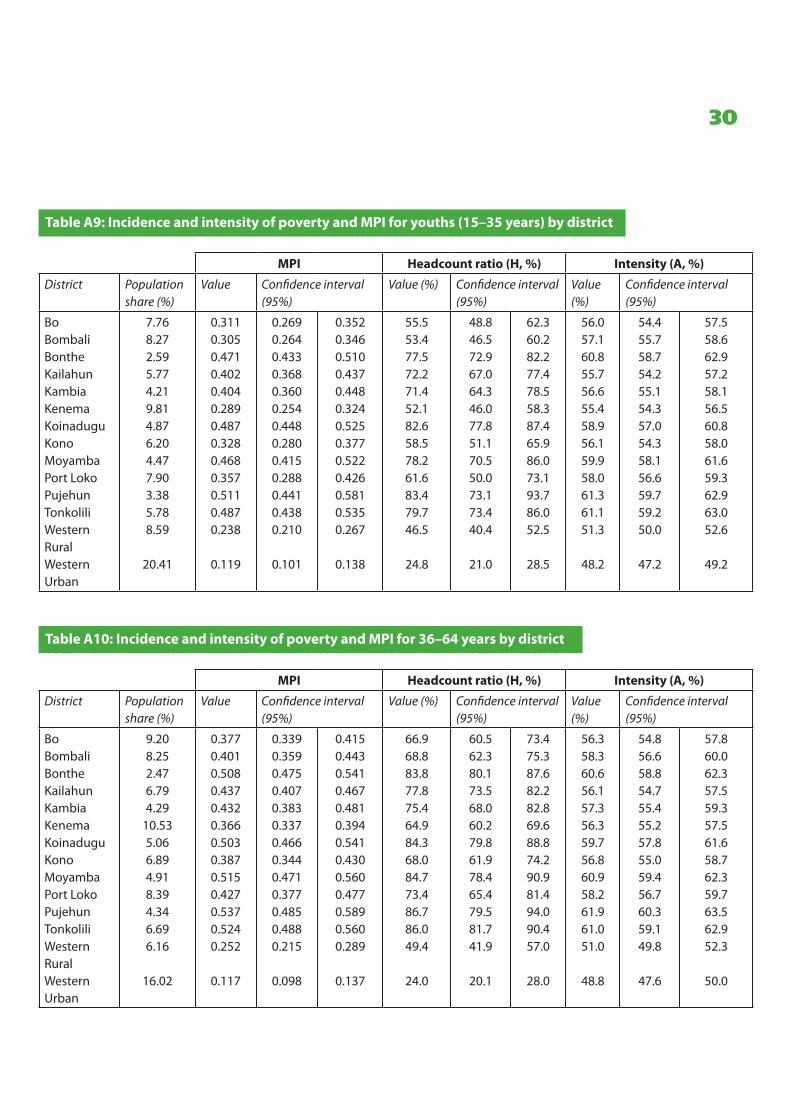
Table A9: Incidence and intensity of poverty and MPI for youths (15–35 years) by district
MPI Headcount ratio (H, %) Intensity (A, %)
District Population share (%)
Value Confidence interval (95%)
Value (%) Confidence interval (95%)
Value (%)
Confidence interval (95%)
BoBombaliBontheKailahunKambiaKenemaKoinaduguKonoMoyambaPort LokoPujehunTonkoliliWestern RuralWestern Urban
7.768.272.595.774.219.814.876.204.477.903.385.788.59
20.41
0.3110.3050.4710.4020.4040.2890.4870.3280.4680.3570.5110.4870.238
0.119
0.2690.2640.4330.3680.3600.2540.4480.2800.4150.2880.4410.4380.210
0.101
0.3520.3460.5100.4370.4480.3240.5250.3770.5220.4260.5810.5350.267
0.138
55.553.477.572.271.452.182.658.578.261.683.479.746.5
24.8
48.846.572.967.064.346.077.851.170.550.073.173.440.4
21.0
62.360.282.277.478.558.387.465.986.073.193.786.052.5
28.5
56.057.160.855.756.655.458.956.159.958.061.361.151.3
48.2
54.455.758.754.255.154.357.054.358.156.659.759.250.0
47.2
57.558.662.957.258.156.560.858.061.659.362.963.052.6
49.2
Table A10: Incidence and intensity of poverty and MPI for 36–64 years by district
MPI Headcount ratio (H, %) Intensity (A, %)
District Population share (%)
Value Confidence interval (95%)
Value (%) Confidence interval (95%)
Value (%)
Confidence interval (95%)
BoBombaliBontheKailahunKambiaKenemaKoinaduguKonoMoyambaPort LokoPujehunTonkoliliWestern RuralWestern Urban
9.208.252.476.794.29
10.535.066.894.918.394.346.696.16
16.02
0.3770.4010.5080.4370.4320.3660.5030.3870.5150.4270.5370.5240.252
0.117
0.3390.3590.4750.4070.3830.3370.4660.3440.4710.3770.4850.4880.215
0.098
0.4150.4430.5410.4670.4810.3940.5410.4300.5600.4770.5890.5600.289
0.137
66.968.883.877.875.464.984.368.084.773.486.786.049.4
24.0
60.562.380.173.568.060.279.861.978.465.479.581.741.9
20.1
73.475.387.682.282.869.688.874.290.981.494.090.457.0
28.0
56.358.360.656.157.356.359.756.860.958.261.961.051.0
48.8
54.856.658.854.755.455.257.855.059.456.760.359.149.8
47.6
57.860.062.357.559.357.561.658.762.359.763.562.952.3
50.0
Sierra Leone Multidimensional Poverty Index 201931
Table A11: Incidence and intensity of poverty and MPI for 65 years and above by district
MPI Headcount ratio (H, %) Intensity (A, %)
District Population share (%)
Value Confidence interval (95%)
Value (%) Confidence interval (95%)
Value (%)
Confidence interval (95%)
BoBombaliBontheKailahunKambiaKenemaKoinaduguKonoMoyambaPort LokoPujehunTonkoliliWestern RuralWestern Urban
9.689.532.818.075.86
10.473.466.646.69
10.244.456.933.54
11.62
0.3880.4050.4830.4160.4660.3720.5050.3520.5390.4350.5160.5210.304
0.095
0.3400.3610.4260.3720.4160.3340.4510.2950.4930.3480.4640.4730.242
0.057
0.4360.4480.5400.4590.5150.4100.5580.4100.5850.5210.5680.5690.366
0.133
70.071.681.877.179.667.187.166.188.676.189.586.959.4
20.0
61.764.675.669.871.660.580.756.182.961.080.980.247.7
12.4
78.378.788.084.387.673.793.476.094.291.398.193.671.1
27.5
55.456.559.053.958.555.458.053.460.957.157.760.051.2
47.6
53.054.855.652.456.653.854.950.658.855.655.957.847.8
44.6
57.958.262.555.560.457.161.056.163.058.759.562.154.6
50.5
Table A12: Incidence and intensity of poverty and MPI for male-headed households by district
MPI Headcount ratio (H, %) Intensity (A, %)
District Population share (%)
Value Confidence interval (95%)
Value (%) Confidence interval (95%)
Value (%)
Confidence interval (95%)
BoBombaliBontheKailahunKambiaKenemaKoinaduguKonoMoyambaPort LokoPujehunTonkoliliWestern RuralWestern Urban
8.677.862.906.504.03
11.144.096.944.618.914.316.546.89
16.61
0.3830.3830.5240.4270.4390.3680.5090.3890.5370.4360.5480.5330.258
0.126
0.3420.3390.4850.3930.3960.3370.4720.3380.4900.3880.4960.4870.222
0.105
0.4240.4280.5620.4600.4820.3980.5460.4400.5840.4840.6010.5790.294
0.147
66.964.883.975.675.164.285.167.486.473.687.585.650.4
25.8
60.858.179.870.968.259.180.860.280.566.180.380.243.2
21.5
73.071.488.080.381.969.389.474.692.381.194.791.157.6
30.0
57.259.162.456.558.557.359.957.762.259.362.762.251.2
48.9
55.557.460.354.956.656.257.655.460.257.861.060.249.5
47.7
59.060.964.558.160.458.462.160.164.160.864.364.252.8
50.0
32
Table A13: Incidence and intensity of poverty and MPI for female-headed households by district
MPI Headcount ratio (H, %) Intensity (A, %)
District Population share (%)
Value Confidence interval (95%)
Value (%) Confidence interval (95%)
Value (%)
Confidence interval (95%)
BoBombaliBontheKailahunKambiaKenemaKoinaduguKonoMoyambaPort LokoPujehunTonkoliliWestern RuralWestern Urban
9.009.601.926.036.057.327.586.674.848.553.067.017.96
14.41
0.3330.3930.4680.4740.4590.3080.5360.3530.4730.3780.5300.5190.308
0.176
0.2800.3470.4210.4350.4200.2550.4890.2860.4130.2860.4510.4730.268
0.144
0.3870.4380.5150.5130.4990.3610.5830.4190.5330.4710.6090.5650.348
0.207
60.468.177.882.580.756.188.162.377.764.586.384.958.3
35.9
50.460.471.476.675.347.183.551.268.749.074.378.151.1
29.3
70.475.784.288.486.165.092.773.486.780.198.291.665.5
42.4
55.257.760.257.556.954.960.856.660.958.661.461.152.9
49.0
53.255.957.556.055.053.058.254.858.856.859.559.651.2
47.0
57.259.462.959.058.956.963.458.563.160.563.362.754.6
51.0
Sierra Leone Multidimensional Poverty Index 201933
SIERRA LEONE MULTIDIMENSIONAL
POVERTY INDEX 2019
Sierra Leone is on a development trajectory towards achieving middle-income status by 2035. This report presents the results of the Sierra Leone National Multidimensional Poverty Index. The structure of the measure is the result of a long process of discussions led by the Ministry of Planning and Economic Development, Statistics Sierra Leone, and UNDP Sierra Leone. The design and computation of the National Multidimensional Poverty Index has included discussions and meetings with various stakeholders in the country. The purpose of the index is to monitor the reduction of poverty in all its dimensions and to provide relevant information to guide the implementation of social policies in the country. The figures in this report provide critical baselines for the implementation of the Medium-term National Development Plan.
Related Documents