On the Robustness of Multidimensional Poverty Orderings in the EU Tomas Zelinsky (Faculty of Economics, Technical University of Kosice) and Francisco Azpitarte (University of Melbourne and Brotherhood of St Laurence) Paper prepared for the 34 th IARIW General Conference Dresden, Germany, August 21-27, 2016 Session 4F: Meeting the Measurement Challenges of Official Statistics Offices II Time: Tuesday, August 23, 2016 [Afternoon]

Welcome message from author
This document is posted to help you gain knowledge. Please leave a comment to let me know what you think about it! Share it to your friends and learn new things together.
Transcript
On the Robustness of Multidimensional
Poverty Orderings in the EU
Tomas Zelinsky (Faculty of Economics, Technical University of Kosice) and Francisco Azpitarte
(University of Melbourne and Brotherhood of St Laurence)
Paper prepared for the 34
th IARIW General Conference
Dresden, Germany, August 21-27, 2016
Session 4F: Meeting the Measurement Challenges of Official Statistics Offices II
Time: Tuesday, August 23, 2016 [Afternoon]
Preliminaryworkingdraft.Pleasedonot quoteorcitewithout authors’ permission.
On the Robustness of Multidimensional Poverty Orderings
in the EU
Tomas ZelinskyFaculty of Economics, Technical University of Kosice
Francisco AzpitarteUniversity of Melbourne and Brotherhood of St Laurence
Paper prepared for the 34th General Conference of The International Associationfor Research in Income and Wealth [Dresden, Germany, August 21-27, 2016.]
Abstract
The goal of this paper is to assess the robustness of cross-country and cross-year comparisons in the EU using the official multidimensional poverty measurementframework. The previous research suggests that poverty comparisons are in generalsensitive to weights. Different weighting vectors can hence yield different results,and one is not able to claim robustly whether poverty in country A is higher thanin country B, or that poverty in a given country has unambiguously declined or in-creased. We find that approximately 50 per cent of all pair-wise country comparisonsare not robust to changes in weights, i.e. it is always possible to find a set of weightsfor which ranks of countries reverse. Similar results are obtained, when assessingthe robustness of poverty comparisons over time. The findings further indicate thatrankings of countries are extremely sensitive to change in weights around the officialdefinition of the composite indicator (i.e. weights of all dimensions and thresholdequal one third). Our results hence suggest that evaluations of the progress madein alleviating multidimensional poverty in the EU are highly sensitive to the set ofweights used to quantify poverty, and that more attention needs to be paid to thechecks for sensitivity of poverty comparisons to changes in weights.
Keywords: Multidimensional poverty; counting measures; dominance conditions;EU-SILCJEL Classification: I32.
This work was supported by the Slovak Scientific Grant Agency as part of the researchproject VEGA 2/0026/15 and 2015 Group of Eight (Go8) European Fellowship awardedto Tomas Zelinsky for visiting the Melbourne Institute of Applied Economic and SocialResearch, Faculty of Business and Economics, University of Melbourne. This study is basedon data from Eurostat, EU-SILC 2004-2013 (Eurostat, 2009a,b, 2010, 2011, 2015a,b,c,d,e,f).The responsibility for all conclusions drawn from the data lies entirely with the authors
1
1 Introduction
Among the researchers there is a consensus on the multidimensional nature of poverty.Poverty has been recognized as a multidimensional phenomenon by the transnationalinstitutions since the late 1990’s (UNDP, 1997; World Bank, 2001), and in a similarfashion Stiglitz et al. (2009) suggest that a multidimensional definition of well-beingshould be used. Multidimensionality of poverty was recognized even earlier as partof the basic (human) needs approach to development (UNCTAD, 1975) and furtherelaborated by Streeten et al. (1981). One of the first axiomatic conceptualizations ofmultidimensional poverty measurement was offered by Bourguignon and Chakravarty(2003), and despite the progress made in this field, there is no single generally acceptedmultidimensional measure of poverty. Moreover, there are opinions against constructingsuch measures (Ravallion, 2011).
In the sense of Sen’s (1976) tradition conceptualization of poverty measurement isbased on two main steps: identification of the poor, and aggregation of such information.In their recent paper Alkire and Foster (2011a) proposed an approach to multidimen-sional poverty measurement combining a ‘counting’ based method to identification ofthe poor (Atkinson, 2003) and FGT poverty measures family (Foster et al., 1984). Thisfamily of measures satisfies desirable axiomatic properties, and is easy to implement andinterpret.
Identification of the poor within the methodology proposed by Alkire and Foster(2011a) (A-F hereafter) is based on a ‘dual cutoff’ which depends on the dimensions’weights. Multidimensional poverty measures are often criticized due to arbitrariness insetting dimensions’ weights and poverty cutoffs. In this paper we focus on the role ofweights in identification and aggregation of the poor, and thus the deprivation cutoffsare considered as exogenous – determined by an authority.
In general the weights should reflect the variables’ importance in the index. The-oretical and empirical literature offers a number of approaches to setting weights ofdimensions. A detailed classification of approaches to weights setting can be found ina study by Decancq and Lugo (2013) who distinguish between data-driven approaches(frequency-based, statistical and most favorable weights), normative approaches (equalor arbitrary, expert opinion and price-based weights), and hybrid approaches (statedpreference and hedonic weights). As there is no universally accepted guideline for set-ting the weights, the selection should be open to criticism in order to gain reasonablepublic acceptance (Azevedo and Robles, 2013). The arbitrary equal weighting of alldimensions is the most commonly used approach in the empirical applications and isoften defended by its simplicity (Alkire and Santos, 2014), but at the same time equalweighting is universally considered to be wrong (Chowdhury and Squire, 2006). It isthus obvious that ranking the alternatives based on multidimensional poverty indicesdepends on the weights of dimensions, and the chosen weights can have a significanteffect on the ranking of various alternatives (Athanassoglou, 2015). Cox et al. (1992)defend the simple weighting schemes and methods of analysis, and they argue that manypreviously published weighting schemes were based on too complex multivariate methods
2
concluding that sensitivity analyses were highly desirable.The previous research suggests that poverty comparisons are in general sensitive to
weights (Alkire et al., 2015). Different weighting vectors can hence yield different results,and one is not able to claim robustly whether e.g. poverty in country A is higher than incountry B, or that poverty in a given country has unambiguously declined or increased.Thus, aggregation of the weighted dimensions should be followed by an examinationof the given ranking robustness to changes in the weights. Methodological literatureprovides a number of approaches to robustness checks such as stochastic dominanceconcepts (Duclos et al., 2006; Mehmet Pinar, 2013), Monte Carlo simulations (Saisanaet al., 2005), linear programming tools (Cherchye et al., 2008), models from decisiontheory suggested by Foster et al. (2013) and generalized by Permanyer (2011, 2012),approach based on Kemeny’s (1959) rule from social choice theory (Athanassoglou, 2015).
The goal of this paper is to assess the extent to which the cross-country and cross-year comparisons in Europe are robust to changes in weights. Our empirical applicationis based on European Union Statistics on Income and Living Conditions (EU-SILC)microdata adopting the counting approach to multidimensional poverty measurementproposed by Alkire and Foster (2011a). Two main analyses are performed in the study.First, we check the robustness of cross-country and cross-year comparisons in the EU forall pair-wise comparisons (cross-country as well as cross-year) by testing the necessaryand sufficient dominance conditions recently proposed in the literature by Gallegos et al.(2016). Secondly, we focus on the pair-wise comparisons for which dominance cannot beassumed. We analyse the maximum change in weights that preserves the initial ranksin pair-wise comparisons.
A number of empirical studies analysing multidimensional poverty/well-being indi-cators include robustness assessments, however they are usually based on a very lim-ited number of weighting vectors. Alkire and Santos (2014) present a multidimensionalpoverty index with equally weighted dimensions and perform robustness checks com-paring three alternative weighting structures, applying a 25%-25%-50% weight on eachdimension obtaining the rank correlation across all three alternative weighting systemsno lower than 0.83. As further pointed by Alkire and Santos (2013), the global MPIhas been released annually by UNDP since 2010 and has been subjected to numerousrobustness tests suggesting that 85 % of pair-wise comparisons were the same if theweights on each dimension varied between 25 % and 50 % of the total. The similar typesof analyses were done also by Alkire and Foster (2011a,b); Alkire et al. (2015), Weziak-Bialowolska (2016). Foster et al. (2012) assess robustness of 2004 HDI to weights usingthe robustness method proposed by Foster et al. (2013) and Permanyer (2011, 2012)and they conclude that for the entire dataset 70% of the pair-wise comparisons are fullyrobust while about 92% have robustness levels of 25% or higher. A similar analysiswas performed by Foster et al. (2013) who examined the empirical prevalence of robustcomparisons for three widely used indices: the Human Development Index (HDI), theIndex of Economic Freedom (IEF), and the Environmental Performance Index (EPI).The authors concluded that the rank robustness of the HDI was found to be the highest(73% of pair-wise 1998 country rankings were fully robust), while the EPI was the least
3
robust (no more than 6.5% of its pairwise rankings being fully robust).Robustness assessments based on a limited number of weighting structures is defen-
sible if the considered weighting vectors are generally agreed and/or accepted. If that isnot the case, and there is no such agreement, the limited robustness assessment analysismay be insufficient. We contribute to the robustness to weights empirical literature byassessing the robustness of the official multidimensional poverty index used in the Eu-ropean Union. The arbitrarily determined equal dimensional weights were not justified,and thus the question regarding the relative importance of the dimensions remains open.If in such a situation one’s aim is to claim unambiguously that poverty in a given countryhas declined or increased over time (or is higher/lower than in other country), the resultshave to be fully robust to weights. In our empirical study we find that approximately 50% of all pair-wise country comparisons are not robust to changes in weights, i.e. it is al-ways possible to find a set of weights for which ranks of countries reverse. Similar resultsare obtained, when assessing the robustness of poverty comparisons over time. Analysisof the relationship between maximum change in the weights (preserving the initial ranks)and threshold indicates that the highest probability or preserving ranks is attained inthe case of the union and intersection approaches. The findings further indicate thatrankings of countries are extremely sensitive to the change in weights around the offi-cial definition of the composite indicator (i.e. weights of all dimensions and thresholdequal to one third). Our results hence suggest that evaluations of the progress made inalleviating multidimensional poverty in the EU are highly sensitive to the set of weightsused to quantify poverty, and that more attention needs to be paid to the checks forsensitivity of poverty comparisons to changes in weights.
The rest of our paper is organized as follows: the second section presents the measure-ment framework summarizing the counting approach to poverty measurement followedby the description of necessary and sufficient condition of comparisons robust to theweights. In the third section the official EU at-risk-of-poverty or social exclusion indi-cator, as a special case of A-F multidimensional poverty measure, EU-SILC microdata(as the source of data for our analyses) and methods used are described. Finally, in thelast section the main results are presented.
2 The Measurement Framework
We consider a population with N individuals and D > 1 indicators of wellbeing. Letxnd denote the level of attainment by individual n on dimension d. If xnd < zd, wherezd is a deprivation line for dimension d from a D-dimensional vector of deprivation lines,Z, then we say that individual n is deprived in indicator d.
In order to account for the breadth of deprivations, counting measures rely on in-dividual deprivation scores defined as a weighted count of deprivations. Let W :=(w1, w2, ..., wD) denote the vector of dimensional weights such that wd ≥ 0 ∧
∑Dd=1wd =
4
1. The deprivation score for individual n is given by
cn ≡D∑d=1
wdI(xnd < zd),
where I is the indicator function that takes value 1 if the argument in parenthesis is true,and 0 otherwise. There is only one vector of possible values of cn for each particularchoice of deprivation lines and weights. Moreover it is easy to show that the maximumnumber of possible values is given by:
∑Di=0
(Di
)= 2D. The vector of possible values is
defined as: V := (v1, v2, ..., vl), where max l = 2D, vi < vi+j , v1 = 0 and vl = 1.Following Alkire and Foster (2011a) we characterise the set of multidimensionally
poor with an identification rule ρk(cn) that equals 1 when the individual is poor and 0otherwise. The indicator function ρk compares individuals’ cn with a multidimensionalcut-off k ∈ [0, 1] ⊂ R+ so that any person n is deemed to be poor if and only if: cn ≥ k.As shown in Lasso de la Vega (2010), the function ρk is the only identification rulethat satisfies the property of poverty consistency which requires ρk(cn′) = 1 wheneverρk(cn) = 1 and cn ≤ cn′ .
Let P (C) denote a social poverty counting measure depending on the vector ofpoverty scores, C. We consider a broad family of social poverty measures satisfyingstandard axioms in the literature on poverty measurement including:
Axiom 1 Focus (FOC): P should not be affected by changes in the deprivation score ofa non-poor person as long as for this person it is always the case that: cn < k.
Axiom 2 Monotonicity (MON): P should increase whenever cn increases and n is poor.
Axiom 3 Symmetry (SYM): P should not be affected by permutations in the vector ofpoverty scores C, i.e., P (C, ρk) = P (C ′, ρk) where C ′ is any permutation of C.
Axiom 4 Population-replication invariance (PRI): P (C, ρk) = P (CR, ρk) where CR =(C,C, ..., C) is any replication of the vector of scores C.
Axiom 5 Progressive deprivation transfer (PROG): A rank-preserving transfer of a de-privation from a poorer individual to a less poor individual, such that both are deemedpoor, should decrease P .
2.1 Necessary and sufficient conditions with variable weights
Analyses performed in this study are based on a new dominance conditions proposed byGallegos et al. (2016) to examine the robustness of poverty orderings to the choice ofweighting schemes.
The authors derive the new dominance conditions (necessary, sufficient and necessaryand sufficient) to assert the robustness of counting poverty orderings within the classes ofpoverty measures P1 and P2. These conditions build on the dominance results derived inLasso de la Vega (2010). Let PA and PB refer to the social poverty indices of populations
5
A and B, respectively, and let HA(k) and HB(k) refer to the multidimensional headcountof each of those populations. The following result sets out the conditions for unambiguouspoverty orderings within the class P1:
Condition 1 PA < PB for all P in P1 and any identification cut-off, k, if and only ifHA(k) ≤ HB(k) ∀k ∈ [0, v2, ..., 1] ∧ ∃k|HA(k) < HB(k).
For the proof see Lasso de la Vega (2010).Condition (1) states that poverty comparisons of A and B are robust to the choice
of the poverty function satisfying FOC,MON,SYM, and PRI only when the orderingof headcount measures is the same for every relevant value of k.
The following condition is both necessary and sufficient to guarantee unambiguouspoverty orderings within the class of measures P1 for any possible combination of iden-tification cut-off and dimensional weights.
Condition 2 Consider the class of poverty measures P1. The following three statementsare equivalent:
1. PA < PB for all P ∈ P1 for any weighting vector, W , and poverty threshold, k.
2. For any vector of weights, W , HA(k) ≤ HB(k) ∀k ∈ [0, v2, ..., 1] ∧ ∃k|HA(k) <HB(k).
3. For all γW,k ∈ Γ, Π(W,k) in A is no greater than in B, and at least once strictlylower.
The proof and the further details can be found in Gallegos et al. (2016).
3 Description of the Data and Methods
3.1 Definition of the Aggregated Indicator
The ‘people at risk of poverty or social exclusion’ multidimensional poverty measureis one of the Europe 2020 headline indicators created by Eurostat in order to monitorprogress towards the Europe 2020 strategy targets adopted by the European Council in2010 (Eurostat, 2015h). The indicator is defined as the sum of persons who are: at-risk-of-poverty and/or severely materially deprived and/or living in households with verylow work intensity as a share of the total population, expressed in numbers or shares ofthe population (European Commission, 2013). The composite indicator has thus threedimensions:
Monetary poverty (at-risk-of-poverty) defined as an equivalised disposable incomebelow 60 % of the national equivalised median income (after social transfers)1. The
1Prior to 2000, poverty estimates in the EU were based on 50 % of mean equivalised disposable income(Besharov and Couch, 2012), in 1998 the Statistical Programme Committee (CPS, 1998) recommendedto use 60 % of median income cut-off as the main reference point.
6
equivalised income is defined as the household’s total disposable income divided by itsequivalent size, while the equivalisation is made on the basis of the OECD modifiedscale (giving a weight of 1.0 to the first person aged 14 or more, a weight of 0.5 toother persons aged 14 or more and a weight of 0.3 to persons aged 0-13). The modifiedOECD scale adopted by the European Union was proposed in a study by Hagenaarset al. (1994), later published by de Vos and Zaidi (1997), and it is questionable whethera single equivalence scale should be applied to all countries2.
A person is considered to be severely materially deprived if she lives in a householdthat cannot afford to pay for at least four out of nine items (i. to face unexpectedexpenses; ii. one week annual holiday away from home; iii. to pay for arrears (mortgageor rent, utility bills or hire purchase installments); iv. a meal with meat, chicken or fishevery second day; v. to keep home adequately warm, or could not afford (even if wantedto): vi. a washing machine; vii. a colour TV; viii. a telephone; ix.) a personal car.)3
From the perspective of the last dimension, living in very low work intensity (quasi-jobless) households, a person is considered to be deprived if she lives in a household, whereworkinig-age adults (18-59) worked less than 20 % of their total work potential during thepast year. When adopting the indicator, in the Social Protection Committee discussion(SPC, 2010) several national delegations expressed a preference for composite indicatorbased only on two dimensions, excluding the quasi-jobless household indicator, most ofthem nevertheless accepted it. SPC (2010) admitted that defining jobless households onthe basis of the EU-SILC may require further methodological refinements. This can thusbe perceived as a political indication, that weight assigned to this sub-indicator shouldbe lower than of the previous two.
From the definitions of the indicators it is obvious that the thresholds have been cho-sen arbitrarily, and, moreover, application of the same equivalence scale to all countriesis questionable. However, both these aspects are beyond the scope of this paper. For amore detailed discussion and description of the evaluation of the set of EU poverty andsocial exclusion indicators see e.g. Daly (2010).
2 The authors warned that ‘...more research efforts should be devoted to the choice of equivalencescales which can be used for cross-country comparisons. One principal issue to be resolved is whetherin the cross-country comparisons we should use a single equivalence scale for all the Member States, orwhether a single methodology should be applied to estimate equivalence scales which can be differentacross different countries.’ (de Vos and Zaidi, 1997, p. 194)
3Before adopting the Europe 2020 strategy headline indicators, the previously agreed EU materialdeprivation indicator was defined as the share of people who were concerned with at least three out ofthe nine items. The change in the indicator definition was initiated by the Social Protection Committee(SPC, 2010) without any further justification.
7
3.2 Data Sources
The calculations in this paper are based on European Union Statistics on Income andLiving Conditions (EU-SILC)4 2004–2013 microdata (Eurostat, 2009a,b, 2010, 2011,2015a,b,c,d,e,f). In accordance with the EU methodology (European Commission, 2009),calculations are performed on individual (personal) level using personal cross-sectionalweights and the determination of poverty status in each dimension is based on thevariable RX070 5 (a three-digit value, where 1st digit depicts monetary poverty, 2nddigit captures severe material deprivation and 3rd digit low work intensity, i.e. threebinary variables).
The complete sample sizes range from 307,577 observations for 2004 microdata to588,608 observations for 2013 microdata (and from 8,545 observations for Iceland in2009 to 61,542 observations for Italy in 2009 at country level). German microdata werenot included in the dataset, as the German National Statistical Institute has not givenpermission to use the German microdata in this research project, and thus German dataare excluded from the analyses.
3.3 Statistical Inference
Our testing strategy is based on comparing subdimensional ratios. We set the followingnull hypothesis: Ho : z(r) = 0 ∀r = 1, 2, ..., R, against the alternative: Ha : z(r) <0 ∀r = 1, 2, ..., R. We reject the null hypothesis in favour of this particular alternative ifmax{z(1), z(2), ..., z(R)} < zα < 0, where zα is a left-tail critical value, and α is both thesize of a single-comparison test as well as the overall level of significance of the multiple-comparison test. It is not difficult to show that, generally, the overall size of the testwill be lower than α. Given the nature of the conditions, if we reject the null in favourof the alternative hypothesis then A dominates B in the sense of being deemed less poorfor a broad class of poverty measurement choices (which depends on the condition inquestion).
For each poverty set we need to perform comparisons with respective z-statistics. Inthe case of poverty set Π(W,k) we use z-statistics of the form:
Tw,k =ΠA(W,k)−ΠB(W,k)√
σ2ΠA(W,k)
NA +σ2
ΠB(W,k)
NB
, (1)
where:
σ2ΠA(W,k) = ΠA(W,k)[1−ΠA(W,k)] (2)
4EU-SILC is an instrument for the systematic production of EU statistics on income and livingconditions, encompassing comparable and timely cross-sectional and longitudinal data on income andon the level and composition of poverty and social exclusion at national and European levels (EuropeanUnion, 2003).
5Poverty status for data prior to 2008 had to be estimated in accordance with Eurostat methodologyand algorithms (Eurostat, 2015g).
8
3.4 Maximum deviation from equal weights
For pairs of countries for which dominance cannot be assumed (i.e. countries A and Bare identified as a pair of countries for which it is possible to find a set of weights forwhich country A dominates country B and another set of weights for which country Bdominates country A), we perform further analysis. Following the approach proposedby Permanyer (2012) the analysis is aimed at answering the question how far we candeviate from equal weights (i.e. by what value of δ ∈
(0, 2
3
]weight of each dimension
can be increased) while preserving the initial ranks of a pair of countries.The following algorithm is used:
1. For each pair an initial ranking is detected for equal weights (i.e. w1 = w2 = w3 =13) at each value of k, k ∈ { 1
240 ,2
240 , . . . , 1}.
2. For each value of k the weights are redistributed increasing weight of one of thedimensions by δ and decreasing weights of the two remaining dimensions by δ
2 , δ ∈{ 1
120 ,2
120 , . . . ,23}, i.e.:
2.1. w1i = 13 + δi, w2i = w3i = 1
3 −δi2 for i = 1, 2, . . . , 80,
2.2. w2i = 13 + δi, w1i = w3i = 1
3 −δi2 for i = 1, 2, . . . , 80,
2.3. w3i = 13 + δi, w1i = w2i = 1
3 −δi2 for i = 1, 2, . . . , 80.
3. For each of the dimensions a value of δj ∈ [ 1120 ,
23 ], (j = 1, 2, 3) is identified as
min{δi}, (i = 1, 2, . . . , 80) for which the ranks differ from the initial ranks for theparticular value of k.
4. Finally, the maximum value of δ which preserves the initial rankings for the par-ticular k is identified as δk = min{δj} − 1
120 . If ∀δi for all dimensions the changein rankings is not observed, then δk = 2
3 .
As a result of this analysis, for each pair of country we have the vector of maximumδ’s preserving the initial rankings for each value of k. If δ = 0 ∀k, even a small changein equal weights results in change in rankings, if δ = 2
3 ∀k, we can assume that one ofthe countries dominates the other regardless of weights and threshold.
4 Results
Before proceeding to the main results we will replicate the commonly used approach tosensitivity to weights analysis using a very limited number of weighting vectors. Follow-ing that approach, i.e. comparing the original rankings (based on the official approachassigning equal weights to each dimension) to alternative rankings (assigning a weight of0.5 to one dimension and 0.25 to the remaining two) we get changes in ranks as depictedin Fig 1. The red points in Fig. 1 indicate the initial rankings of the countries and thearrows indicate minimum and maximum ranks based on the three weighting schemesdescribed above. In case of around two thirds of observations the maximum differences
9
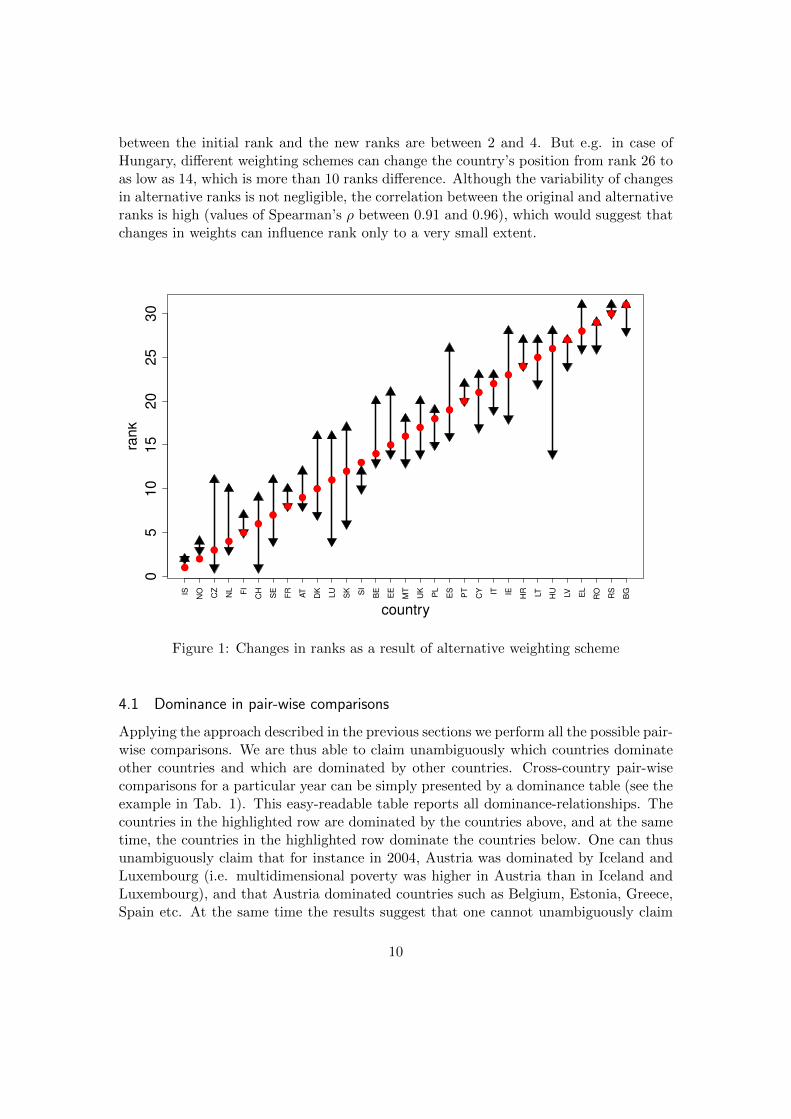
between the initial rank and the new ranks are between 2 and 4. But e.g. in case ofHungary, different weighting schemes can change the country’s position from rank 26 toas low as 14, which is more than 10 ranks difference. Although the variability of changesin alternative ranks is not negligible, the correlation between the original and alternativeranks is high (values of Spearman’s ρ between 0.91 and 0.96), which would suggest thatchanges in weights can influence rank only to a very small extent.
05
10
15
20
25
30
country
rank
IS
NO
CZ
NL FI
CH
SE
FR
AT
DK
LU
SK SI
BE
EE
MT
UK
PL
ES
PT
CY IT IE
HR LT HU
LV EL
RO
RS
BG
Figure 1: Changes in ranks as a result of alternative weighting scheme
4.1 Dominance in pair-wise comparisons
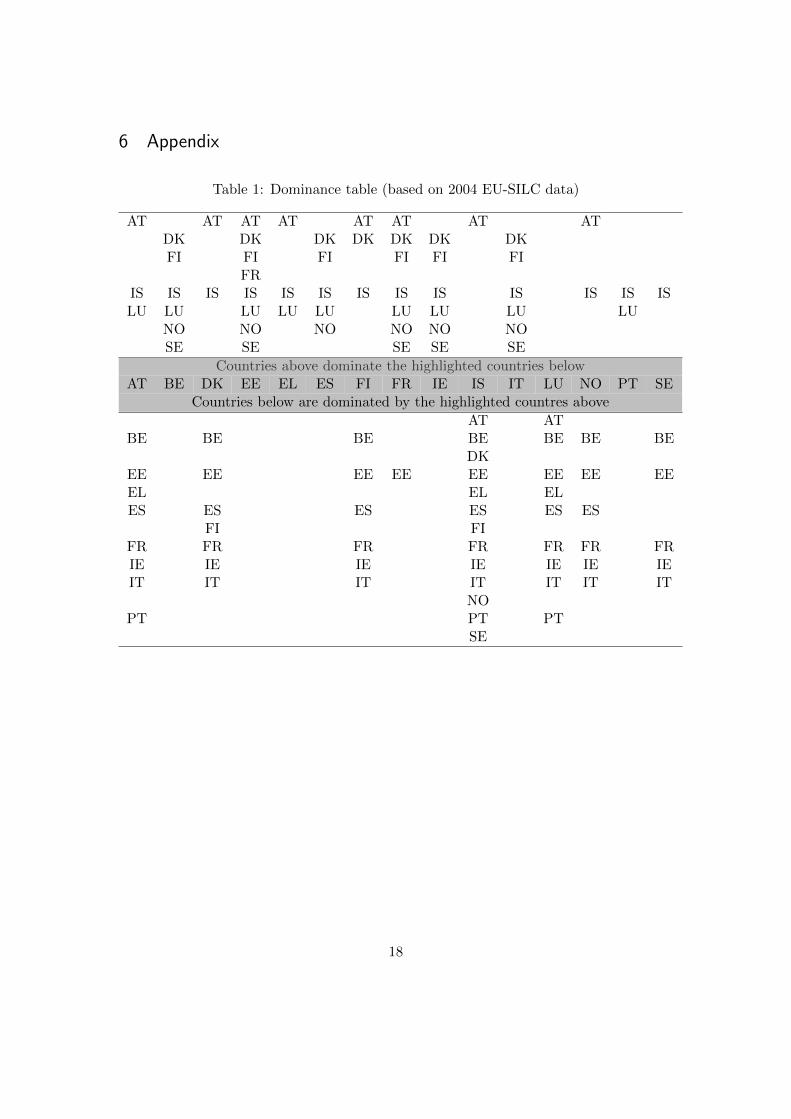
Applying the approach described in the previous sections we perform all the possible pair-wise comparisons. We are thus able to claim unambiguously which countries dominateother countries and which are dominated by other countries. Cross-country pair-wisecomparisons for a particular year can be simply presented by a dominance table (see theexample in Tab. 1). This easy-readable table reports all dominance-relationships. Thecountries in the highlighted row are dominated by the countries above, and at the sametime, the countries in the highlighted row dominate the countries below. One can thusunambiguously claim that for instance in 2004, Austria was dominated by Iceland andLuxembourg (i.e. multidimensional poverty was higher in Austria than in Iceland andLuxembourg), and that Austria dominated countries such as Belgium, Estonia, Greece,Spain etc. At the same time the results suggest that one cannot unambiguously claim
10
whether Iceland dominates Luxembourg or vice-versa, and hence for some sets of weightsone could conclude that Iceland dominates Luxembourg and for other sets of weightsthat Luxembourg dominates Iceland.
For each year included in the analysis a table similar to Tab. 1 can be produced, andthus instead of describing 10 such tables (for the period of 2004-2013) the aggregatedproportions of dominant pair-wise comparisons are summarized in Tab 2.
According to the results 42 – 58 % of the pair-wise cross-country comparisons canbe considered as unambiguous, and thus the dominance conditions are fulfilled. Similarresults are obtained if only complete data sets are taken into consideration (i.e. countrydata that are complete and available for the period of 2008-2013.
Summarizing the partial tables resulting from the complete data sets we are able toidentify countries which are mainly ‘dominatees’ or ‘dominators’ over the period of 2008– 2013 (Fig. 2). Taking into account the full data sets during the given period Bulgariaand Ireland were the only two countries that never dominated any other country, whileIceland was the only country which was never dominated by any other country. Tab.2 thus reports relative positions of countries in terms of dominance – countries in theupper part of the table are more likely to be dominated by other country and less likelyto dominate any other country, while the opposite is true for countries in the lower partof the table.
Results in Fig. 2 also provide information on the changes in the relative position ofcountries in terms of dominance, taking into account both directions (i.e. ‘dominator’and ‘dominatee’ positions). It is e.g. obvious how the relative position of Greece wors-ened between 2010-2011 in both directions (i.e. number of countries by which Greecewas dominated increased significantly, and at the same time the number of countriesdominated by Greece decreased to zero after 2010). On the other hand number of coun-tries by which Romania was dominated decreased considerably between 2009-2010, butthe number of countries dominated by Romania did not change.
However, the ranking of countries is only relative and one has to be very careful whenclaiming that poverty level in country A is higher/lower than in country B. Poverty inthe EU is measured in relative terms, and thus the poverty levels are not necessarilycomparable across the countries.
The proposed approach allows us to assess the poverty patterns across years, enablingus to answer the question whether one can unambiguously claim that poverty decreasedor increased over time (regardless of dimensional weights and cutoffs for the given set ofpoverty measures, and the fixed poverty thresholds for the given dimensions). Tab. 3gives an example of a country (Poland) dominance table, and it suggests that poverty inthe given country decreased over time (e.g. years 2005, 2006 and 2007 were dominatedby all the consecutive years). Such an evolution is rather monotonous with a clear trend,while 80.6% of pair-wise year comparisons are unambiguously ranked. However, a highpercentage of robust comparisons across years within a country does not necessarilyindicate a monotonous trend in poverty. The question of monotonous trend in poverty(in terms of robust cross-year comparisons) can be analysed using directed graphs. Weget the paths of poverty trends, and the examples of patterns for selected countries (the
11
longest robust trends available) are reported in Tab. 4. Those results e.g. allow us toclaim robustly that multidimensional poverty level in Poland declined between 2005 and2013, however the comparisons for 2010 and 2011 were unclear. Similarly, the resultssuggest that multidimensional poverty in Malta and Spain increased over time.
Such comparisons provide valuable information to the policy-makers, as they enablethem to claim robustly whether e.g. anti-poverty policies were effective and whetherpoverty levels (in multidiomensional terms) decreased (regardless of weights and multi-diomensional cutoffs).
4.2 Maximum Deviation from Equal Weights
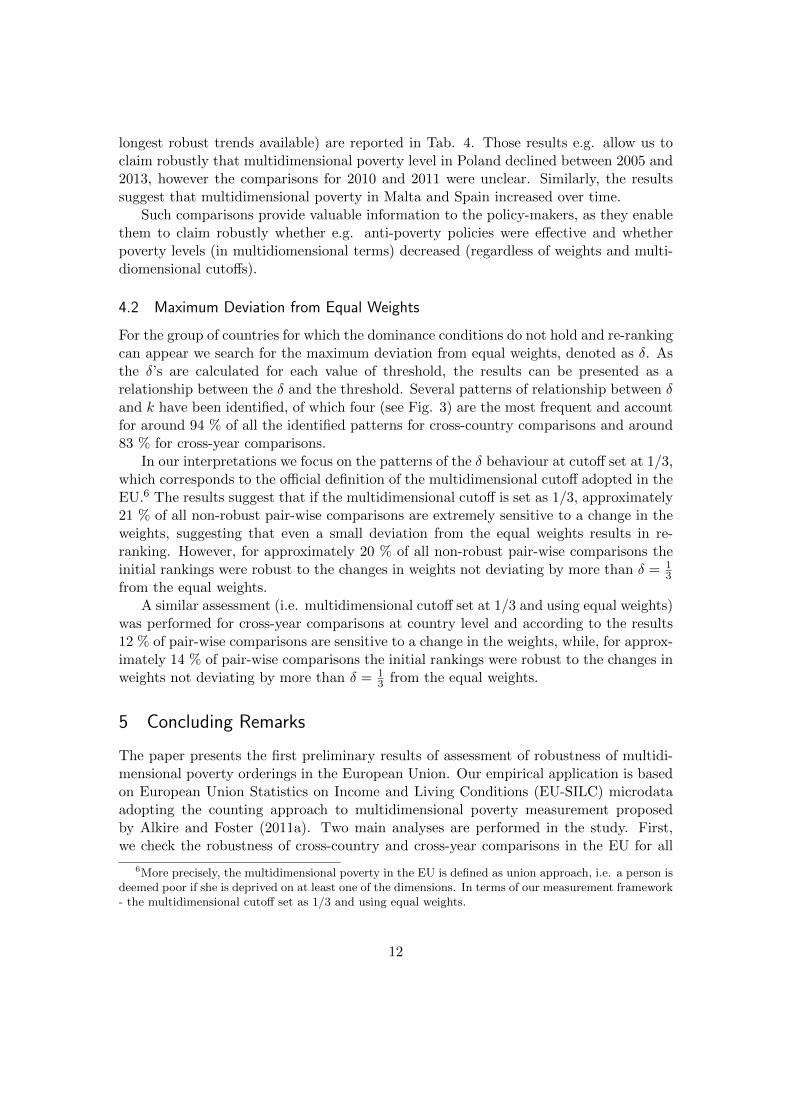
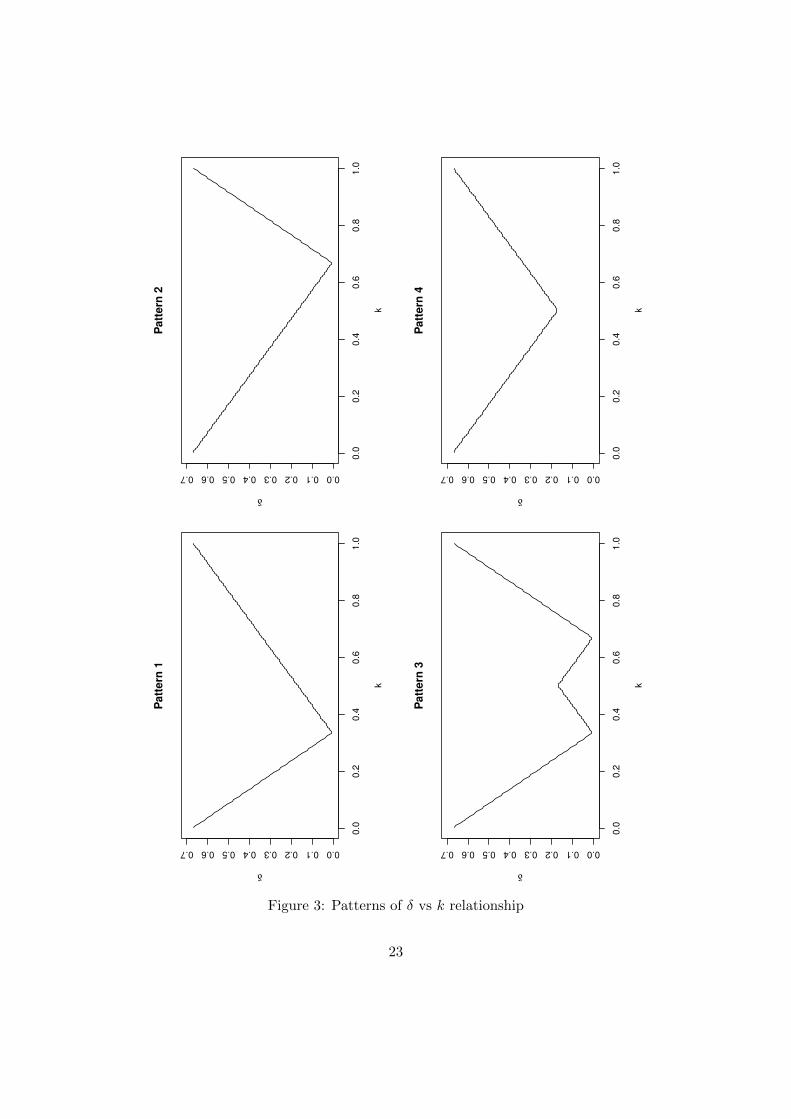
For the group of countries for which the dominance conditions do not hold and re-rankingcan appear we search for the maximum deviation from equal weights, denoted as δ. Asthe δ’s are calculated for each value of threshold, the results can be presented as arelationship between the δ and the threshold. Several patterns of relationship between δand k have been identified, of which four (see Fig. 3) are the most frequent and accountfor around 94 % of all the identified patterns for cross-country comparisons and around83 % for cross-year comparisons.
In our interpretations we focus on the patterns of the δ behaviour at cutoff set at 1/3,which corresponds to the official definition of the multidimensional cutoff adopted in theEU.6 The results suggest that if the multidimensional cutoff is set as 1/3, approximately21 % of all non-robust pair-wise comparisons are extremely sensitive to a change in theweights, suggesting that even a small deviation from the equal weights results in re-ranking. However, for approximately 20 % of all non-robust pair-wise comparisons theinitial rankings were robust to the changes in weights not deviating by more than δ = 1
3from the equal weights.
A similar assessment (i.e. multidimensional cutoff set at 1/3 and using equal weights)was performed for cross-year comparisons at country level and according to the results12 % of pair-wise comparisons are sensitive to a change in the weights, while, for approx-imately 14 % of pair-wise comparisons the initial rankings were robust to the changes inweights not deviating by more than δ = 1
3 from the equal weights.
5 Concluding Remarks
The paper presents the first preliminary results of assessment of robustness of multidi-mensional poverty orderings in the European Union. Our empirical application is basedon European Union Statistics on Income and Living Conditions (EU-SILC) microdataadopting the counting approach to multidimensional poverty measurement proposedby Alkire and Foster (2011a). Two main analyses are performed in the study. First,we check the robustness of cross-country and cross-year comparisons in the EU for all
6More precisely, the multidimensional poverty in the EU is defined as union approach, i.e. a person isdeemed poor if she is deprived on at least one of the dimensions. In terms of our measurement framework- the multidimensional cutoff set as 1/3 and using equal weights.
12
pair-wise comparisons (cross-country as well as cross-year) by testing the necessary andsufficient dominance condition and secondly, we focus on the pair-wise comparisons forwhich dominance cannot be assumed. We further investigate how far we can deviatefrom equal weights while preserving the initial ranks in pair-wise comparisons, i.e. wesearch for the maximum change in weights that preserves the initial ranks.
We find that approximately 50 % of all pair-wise country comparisons are not robustto changes in weights, i.e. it is always possible to find a set of weights for which ranksof countries reverse. Similar results are obtained, when assessing the robustness ofpoverty comparisons over time. Analysis of the relationship between maximum changein weights (preserving initial ranks) and threshold indicates that the highest probabilityor preserving ranks is in case of union and intersection approaches. The findings furtherindicate that rankings of countries are extremely sensitive to change in weights aroundthe official definition of the composite indicator (i.e. weights of all dimensions andthreshold equal one third).
Our results hence suggest that evaluations of the progress made in alleviating multi-dimensional poverty in the EU are highly sensitive to the set of weights used to quantifypoverty, and that more attention needs to be paid to the checks for sensitivity of povertycomparisons to changes in weights.
13
References
Alkire, S. and Foster, J. (2011a). Counting and Multidimensional Poverty Measurement.Journal of Public Economics, 95(7-8):476–487.
Alkire, S. and Foster, J. (2011b). Understandings and Misunderstandings of Multidi-mensional Poverty Measurement. Journal of Economic Inequality, 9(2):289–314.
Alkire, S., Foster, J. E., Seth, S., Santos, M. E., Roche, J. M., and Ballon, P. (2015). Ro-bustness analysis and statistical inference. In Multidimensional Poverty Measurementand Analysis, pages 233–255. Oxford University Press, Oxford.
Alkire, S. and Santos, M. E. (2013). A Multidimensional Approach: Poverty Measure-ment and Beyond. Social Indicators Research, 112(2):239–257.
Alkire, S. and Santos, M. E. (2014). Measuring Acute Poverty in the Developing World:Robustness and Scope of the Multidimensional Poverty Index. World Development,59:251–274.
Athanassoglou, S. (2015). Multidimensional Welfare Rankings under Weight Imprecision:A Social Choice Perspective. Social Choice and Welfare, 44(4):719–744.
Atkinson, A. B. (2003). Multidimensional deprivation: Contrasting social welfare andcounting approaches. Journal of Economic Inequality, 1(1):51–65.
Azevedo, V. and Robles, M. (2013). Multidimensional Targeting: Identifying Beneficia-ries of Conditional Cash Transfer Programs. Social Indicators Research, 112(2):447–475.
Besharov, D. J. and Couch, K. A. (2012). Introduction. In Besharov, D. J. and Couch,K. A., editors, Counting the Poor New Thinking About European Poverty Measuresand Lessons for the United States, pages 3–23. Oxford University Press, Oxford, UK.
Bourguignon, F. and Chakravarty, S. R. (2003). The measurement of multidimensionalpoverty. Journal of Economic Inequality, 1(1):25–49.
Cherchye, L., Moesen, W., Rogge, N., Puyenbroeck, T. V., Saisana, M., Liska, A. S. R.,and Tarantola, S. (2008). Creating Composite Indicators with DEA and RobustnessAnalysis: The Case of the Technology Achievement Index. Journal of the OperationalResearch Society, 59(2):239–251.
Chowdhury, S. and Squire, L. (2006). Setting Weights for Aggregate Indices: An Ap-plication to the Commitment to Development Index and Human Development Index.The Journal of Development Studies, 42(5):761–771.
Cox, D. R., Fitzpatrick, R., Fletcher, A. E., Gore, S. M., Spiegelhalter, D. J., and Jones,D. R. (1992). Quality-of-Life Assessment: Can We Keep It Simple? Journal of theRoyal Statistical Society. Series A (Statistics in Society), 155(3):353–393.
14
CPS (1998). Recommendations on social exclusion and poverty statistics cps 98/31/2.31st Meeting of the Statistical Programme Committee, Luxembourg, 26-27 November1998.
Daly, M. (2010). Assessing the EU Approach to Combating Poverty and Social Exclusionin the Last Decade. In Marlier, E. and Natali, D., editors, Europe 2020: Towardsa More Social EU? , pages 143–161. Peter Lang International Academic Publishers,Brussels.
de Vos, K. and Zaidi, M. A. (1997). Equivalence Scale Sensitivity of Poverty Statisticsfor the Member States of the European Community. Review of Income and Wealth,43(3):319–333.
Decancq, K. and Lugo, M. A. (2013). Weights in Multidimensional Indices of Wellbeing:An Overview. Econometric Reviews, 32(1):7–34.
Duclos, J.-Y., Sahn, D. E., and Younger, S. D. (2006). Robust Multidimensional PovertyComparisons. The Economic Journal, 116(514):943–968.
European Commission (2009). Portfolio of Indicators for the Monitoring of the EuropeanStrategy for Social Protection and Social Inclusion - 2009 update. European Commis-sion, Employment, Social Affairs and Equal Opportunities DG, Social protection andsocial integration, Social and demography analysis, Brussels.
European Commission (2013). EU social indicators - Europe 2020 poverty and socialexclusion target. European Commission, Social Protection Committee, IndicatorsSub-group, Brussels.
European Union (2003). Regulation (EC) No 1177/2003 of the European Parliamentand of the Council of 16 June 2003 concerning Community statistics on income andliving conditions (EU-SILC) . Official Journal of the European Union, L 165, Vol. 46,3 July 2003, P. 1-9.
Eurostat (2009a). EU-SILC 2004 UDB, cross-sectional data ver. 2004-4 from 01-08-09.European Commission, Eurostat, Luxembourg.
Eurostat (2009b). EU-SILC 2005 UDB, cross-sectional data ver. 2005-5 from 01-08-09.European Commission, Eurostat, Luxembourg.
Eurostat (2010). EU-SILC 2006 UDB, cross-sectional data ver. 2006-4 from 01-03-10.European Commission, Eurostat, Luxembourg.
Eurostat (2011). EU-SILC 2007 UDB, cross-sectional data ver. 2007-6 from 01-08-11.European Commission, Eurostat, Luxembourg.
Eurostat (2015a). EU-SILC 2008 UDB, cross-sectional data ver. 2008-7 from 01-03-15.European Commission, Eurostat, Luxembourg.
15
Eurostat (2015b). EU-SILC 2009 UDB, cross-sectional data ver. 2009-7 from 01-03-15.European Commission, Eurostat, Luxembourg.
Eurostat (2015c). EU-SILC 2010 UDB, cross-sectional data ver. 2010-6 from 01-03-15.European Commission, Eurostat, Luxembourg.
Eurostat (2015d). EU-SILC 2011 UDB, cross-sectional data ver. 2011-5 from 01-03-15.European Commission, Eurostat, Luxembourg.
Eurostat (2015e). EU-SILC 2012 UDB, cross-sectional data ver. 2012-3 from 01-03-15.European Commission, Eurostat, Luxembourg.
Eurostat (2015f). EU-SILC 2013 UDB, cross-sectional data ver. 2013-2 from 01-08-15.European Commission, Eurostat, Luxembourg.
Eurostat (2015g). EU statistics on income and living conditions (EU-SILC) method-ology. http://ec.europa.eu/eurostat/statistics-explained/index.php/EU_
statistics_on_income_and_living_conditions_%28EU-SILC%29_methodology.(Accessed: 2015-12-29). European Commission, Eurostat, Luxembourg.
Eurostat (2015h). Smartner, greener, more inclusive? Indicators to support the Europe2020 strategy. Publications Office of the European Union, Luxembourg.
Foster, J., Greer, J., and Thorbecke, E. (1984). A Class of Decomposable PovertyMeasures. Econometrica, 52(3):761–766.
Foster, J. E., McGillivray, M., and Seth, S. (2012). Rank Robustness of CompositeIndices: Dominance and Ambiguity. OPHI Working Paper No. 26b. Oxford Povertyand Human Development Initiative (OPHI).
Foster, J. E., McGillivray, M., and Seth, S. (2013). Composite Indices: Rank Robustness,Statistical Association, and Redundancy. Econometric Reviews, 32(1):35–56.
Gallegos, J. V., Yalonetzky, G., and Azpitarte, F. (2016). On the Robustness of Multi-dimensional Counting Poverty Orderings. Melbourne Institute Working Paper SeriesWorking Paper No. 22/15.
Hagenaars, A. J. M., de Vos, K., and Zaidi, M. A. (1994). Poverty Statistics in the Late1980s: Research Based on Micro-data. Office for Official Publications of the EuropeanCommunities, Luxembourg.
Kemeny, J. (1959). Mathematics without Numbers. Daedalus, 88(4):577–591.
Lasso de la Vega, C. (2010). Counting poverty orderings and deprivation curves. InBishop, J., editor, Research on Economic Inequality, pages 153–172. Emerald.
Mehmet Pinar, Thanasis Stengos, N. T. (2013). Measuring Human Development: AStochastic Dominance Approach. Journal of Economic Growth, 18(1):69–108.
16
Permanyer, I. (2011). Assessing the Robustness of Composite Indices Rankings. TheReview of Income and Wealth, 57(2):306–326.
Permanyer, I. (2012). Uncertainty and Robustness in Composite Indices Rankings. Ox-ford Economic Papers, 64(1):57–79.
Ravallion, M. (2011). On multidimensional indices of poverty. Journal of EconomicInequality, 9(2):235–248.
Saisana, M., Saltelli, A., and Tarantola, S. (2005). Uncertainty and Sensitivity AnalysisTechniques as Tools for the Quality Assessment of Composite Indicators. Journal ofthe Royal Statistical Society: Series A (Statistics in Society), 168(2):307–323.
Sen, A. (1976). Poverty: An Ordinal Approach to Measurement. Econometrica,44(2):219–231.
SPC (2010). Europe 2020 Strategy - SPC Contribution. Council of the European Union,The Social Protection Committee, Brussels.
Stiglitz, J. E., Sen, A., and Fitoussi, J.-P. (2009). Report by the Commission on theMeasurement of Economic Performance and Social Progress. Commission on the Mea-surement of Economic Performance and Social Progress, Paris.
Streeten, P., Burki, S. J., ul Haq, M., Hicks, N., and Stewart, F. (1981). First ThingsFirst: Meeting Basic Human Needs in the Developing Countries. Oxford UniversityPress.
UNCTAD (1975). The Cocoyoc Declaration. International Organization, 29(3):893–901.
UNDP (1997). Human Development Report 1997. Oxford University Press, New Yorkand Oxford.
Weziak-Bialowolska, D. (2016). Spatial Variation in EU Poverty with Respect to Health,Education and Living Standards. Social Indicators Research, 125(2):451–479.
World Bank (2001). World Development Report 2000/2001: Attacking Poverty. OxfordUniversity Press, Oxford.
17
6 Appendix
Table 1: Dominance table (based on 2004 EU-SILC data)
AT AT AT AT AT AT AT ATDK DK DK DK DK DK DKFI FI FI FI FI FI
FRIS IS IS IS IS IS IS IS IS IS IS IS ISLU LU LU LU LU LU LU LU LU
NO NO NO NO NO NOSE SE SE SE SE
Countries above dominate the highlighted countries belowAT BE DK EE EL ES FI FR IE IS IT LU NO PT SE
Countries below are dominated by the highlighted countres above
AT ATBE BE BE BE BE BE BE
DKEE EE EE EE EE EE EE EEEL EL ELES ES ES ES ES ES
FI FIFR FR FR FR FR FR FRIE IE IE IE IE IE IEIT IT IT IT IT IT IT
NOPT PT PT
SE
18
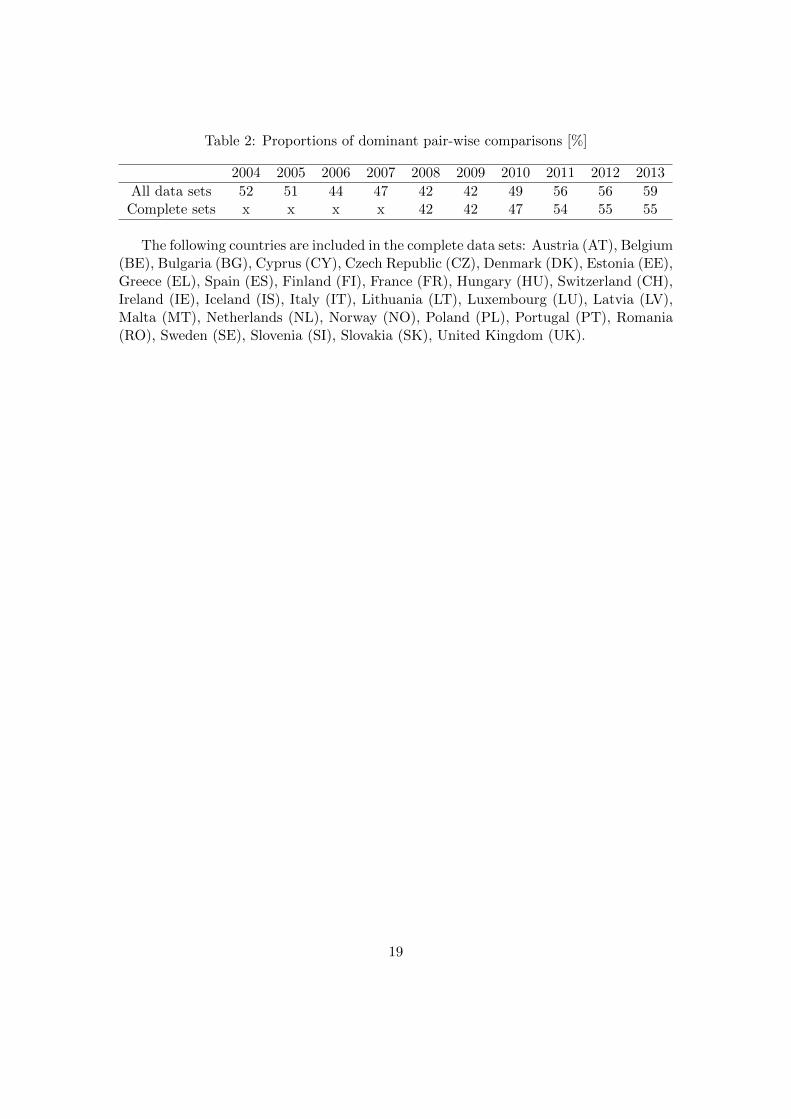
Table 2: Proportions of dominant pair-wise comparisons [%]
2004 2005 2006 2007 2008 2009 2010 2011 2012 2013
All data sets 52 51 44 47 42 42 49 56 56 59Complete sets x x x x 42 42 47 54 55 55
The following countries are included in the complete data sets: Austria (AT), Belgium(BE), Bulgaria (BG), Cyprus (CY), Czech Republic (CZ), Denmark (DK), Estonia (EE),Greece (EL), Spain (ES), Finland (FI), France (FR), Hungary (HU), Switzerland (CH),Ireland (IE), Iceland (IS), Italy (IT), Lithuania (LT), Luxembourg (LU), Latvia (LV),Malta (MT), Netherlands (NL), Norway (NO), Poland (PL), Portugal (PT), Romania(RO), Sweden (SE), Slovenia (SI), Slovakia (SK), United Kingdom (UK).
19
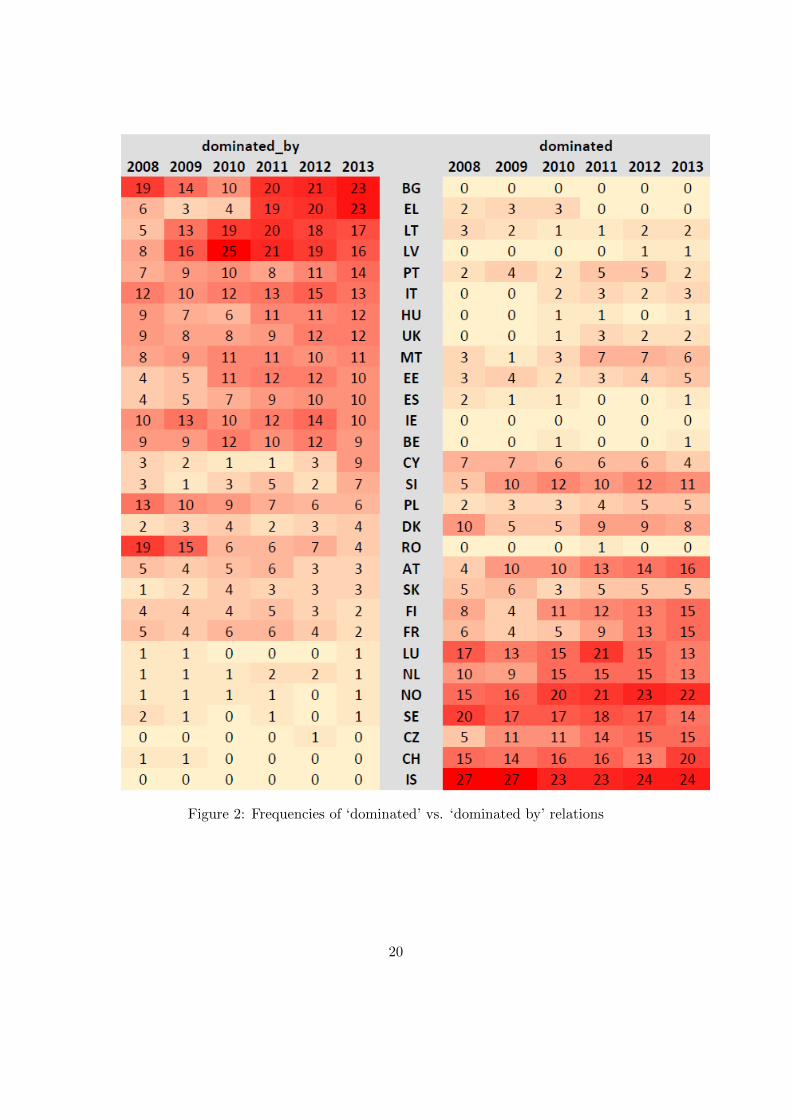
Figure 2: Frequencies of ‘dominated’ vs. ‘dominated by’ relations
20
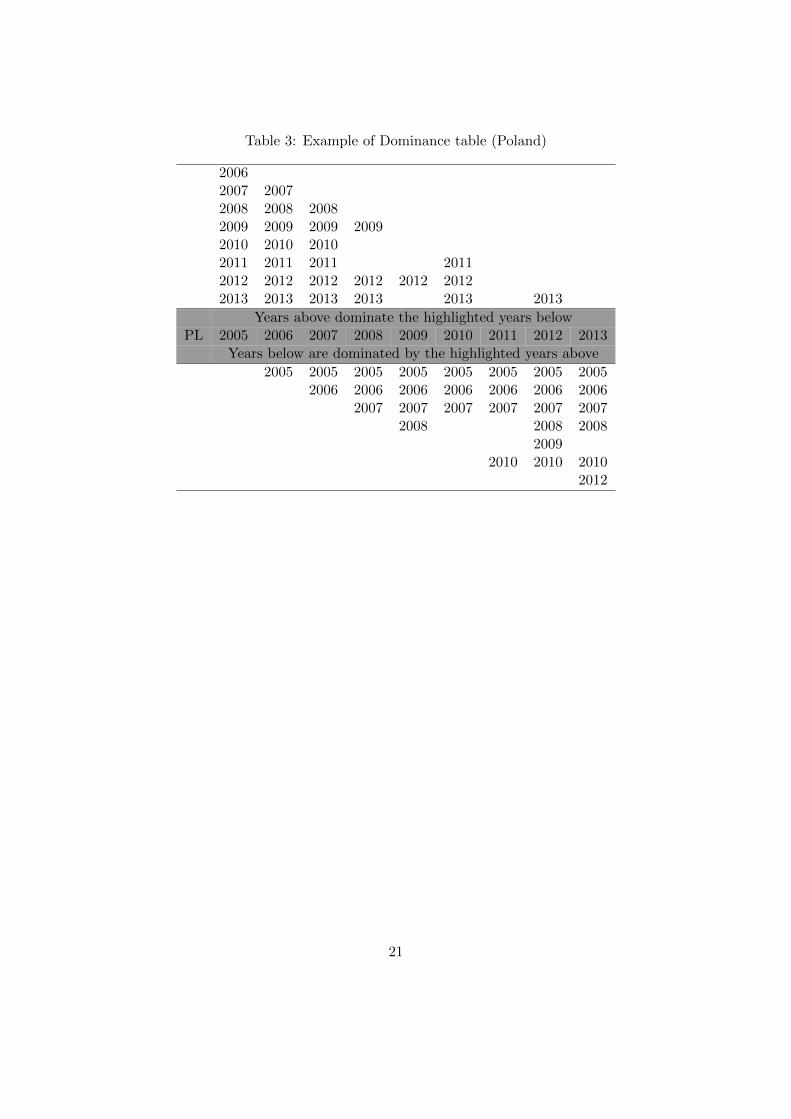
Table 3: Example of Dominance table (Poland)
20062007 20072008 2008 20082009 2009 2009 20092010 2010 20102011 2011 2011 20112012 2012 2012 2012 2012 20122013 2013 2013 2013 2013 2013
Years above dominate the highlighted years belowPL 2005 2006 2007 2008 2009 2010 2011 2012 2013
Years below are dominated by the highlighted years above
2005 2005 2005 2005 2005 2005 2005 20052006 2006 2006 2006 2006 2006 2006
2007 2007 2007 2007 2007 20072008 2008 2008
20092010 2010 2010
2012
21
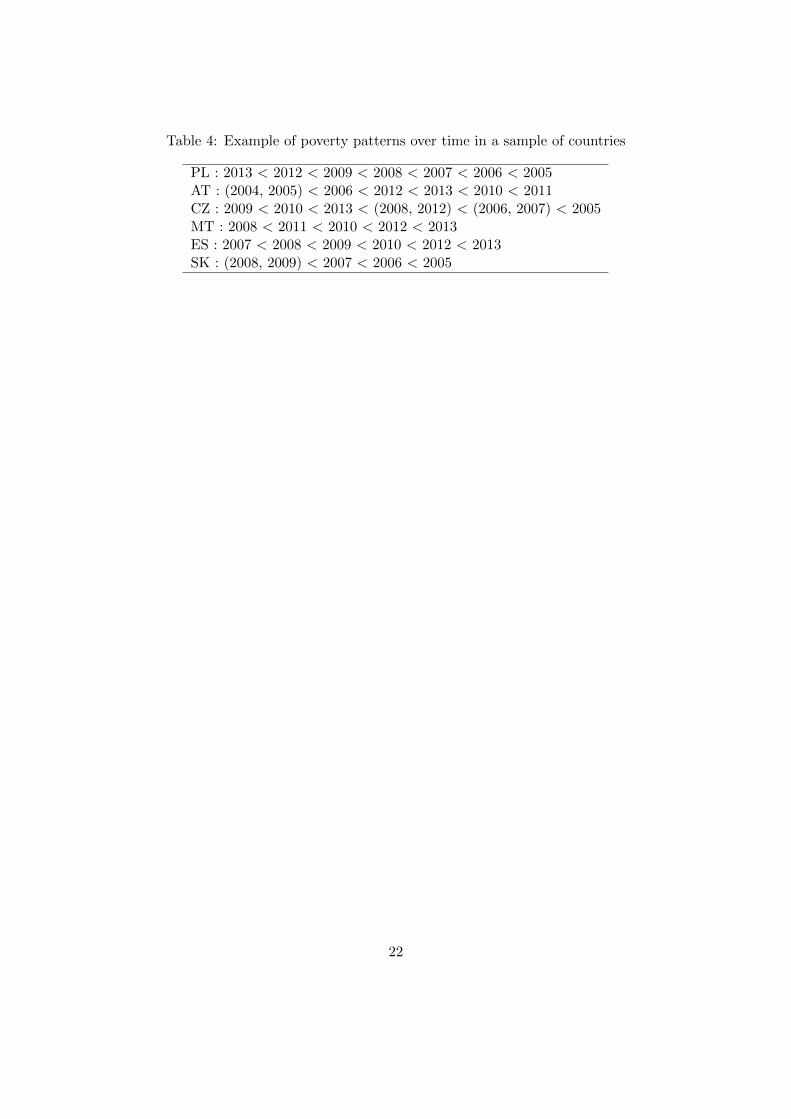
Table 4: Example of poverty patterns over time in a sample of countries
PL : 2013 < 2012 < 2009 < 2008 < 2007 < 2006 < 2005AT : (2004, 2005) < 2006 < 2012 < 2013 < 2010 < 2011CZ : 2009 < 2010 < 2013 < (2008, 2012) < (2006, 2007) < 2005MT : 2008 < 2011 < 2010 < 2012 < 2013ES : 2007 < 2008 < 2009 < 2010 < 2012 < 2013SK : (2008, 2009) < 2007 < 2006 < 2005
22
0.0
0.2
0.4
0.6
0.8
1.0
0.00.10.20.30.40.50.60.7
Pa
tte
rn
1
k
δ
0.0
0.2
0.4
0.6
0.8
1.0
0.00.10.20.30.40.50.60.7
Pa
tte
rn
2
k
δ0.0
0.2
0.4
0.6
0.8
1.0
0.00.10.20.30.40.50.60.7
Pa
tte
rn
3
k
δ
0.0
0.2
0.4
0.6
0.8
1.0
0.00.10.20.30.40.50.60.7
Pa
tte
rn
4
k
δ
Figure 3: Patterns of δ vs k relationship
23
Related Documents