NASA CR-132605-1 ' NASA CONTRACTOR REPORT (NASA-CR-132605-1) PREDICTION AND N75-21431 VERIFICATION OF CREEP BEHAVIOR IN METALLIC MATERIALS. AND COMPONENTS, FOR THE SPACE SHUTTLE THERMAL PROTECTION SYSTEM. VOLUME Unclas 1, PHASE 1: CYCLIC (McDonnell-Douglas G3/26 18570 Prediction and Verification of Creep Behavior in Metallic Materials and Components for the Space Shuttle Thermal Protection System VOLUME I Phase I - Cyclic Materials Creep Predictions November 1974 Prepared By J. W. Davis and B. A. Cramer k £ v MCDONNELL DOUGLAS ASTRONAUTICS COMPAN Y - EAST MCDONNELL DOUGL CORPOREATIO NATIONAL AERONAUTICS AND SPACE ADMINISTRATION * WASHINGTON, D.C. * NOVEMBER 1974 https://ntrs.nasa.gov/search.jsp?R=19750013359 2020-03-22T23:30:54+00:00Z

Welcome message from author
This document is posted to help you gain knowledge. Please leave a comment to let me know what you think about it! Share it to your friends and learn new things together.
Transcript
NASA CR-132605-1' NASA CONTRACTOR
REPORT
(NASA-CR-132605-1) PREDICTION AND N75-21431VERIFICATION OF CREEP BEHAVIOR IN METALLICMATERIALS. AND COMPONENTS, FOR THE SPACESHUTTLE THERMAL PROTECTION SYSTEM. VOLUME Unclas1, PHASE 1: CYCLIC (McDonnell-Douglas G3/26 18570
Prediction and Verification of Creep Behavior inMetallic Materials and Components for theSpace Shuttle Thermal Protection System
VOLUME I
Phase I - Cyclic Materials Creep Predictions
November 1974
Prepared By J. W. Davis and B. A. Cramer k £ v
MCDONNELL DOUGLAS ASTRONAUTICS COMPAN Y - EAST
MCDONNELL DOUGL
CORPOREATIO
NATIONAL AERONAUTICS AND SPACE ADMINISTRATION * WASHINGTON, D.C. * NOVEMBER 1974
https://ntrs.nasa.gov/search.jsp?R=19750013359 2020-03-22T23:30:54+00:00Z
NASA CR-132605-1
Prediction and Verification of Creep Behavior inMetallic Materials and Components for theSpace Shuttle Thermal Protection System
VOLUME IPhase I - Cyclic Materials Creep Predictions
November 1974
J. W. DavisB. A. Cramer
Prepared under contract NAS 1-11774
Prepared by McDonnell Douglas Astronautics Company-EastSaint Louis, Missouri
for National Aeronautics and Space AdministrationLangley Research Center
Hampton, VirginiaDistribution of this report is provided in the interest ofinformation exchange. Responsibility for the contentsresides in the author or organization that prepared it.
MCDONNELL DOUGLAS ASTRONAUTICS COMPANy , EA ST
Saint Louis, Missouri 63166 (314) 232-0232
MCDONNELL DOUGLQL.
CORPORATION
P"REDICTION OF CREEP IN PHASE I NAS-1-11774METALLIC TPS PANELS SUMMARY REPORT
FORWARD
This report was prepared by McDonnell Douglas Astronautics Company - Eastunder contract NAS-1-11774 for the National Aeronautics and Space Administration,Langley Research Center, Hampton. Virginia. It was administered under the directionof the Materials Division, Materials Research Branch, with Mr. D. R. Rummleracting as the technical representative of the contracting officer. The McDonnellDouglas program manager was Mr. J. W. Davis. Others who participated in thisprogram and in the preparation of this report are: Messrs. B. A. Cramer,W. J. Edens, and D. C. Ruhmann. The experimental portion were performed by Messrs.R. L. Hillman (steady state creep testing) and M. B. Munsell (cyclic creeptesting). Statistical analysis was performed by Dr. J. F. Brady, Mr. W. J. Edens,Mr. R. K. Linback, and Mr. D. C. Ruhmann.
This report covers the period from July 1972 to June 1974.
AMCDONNELL DOUGLAS ATWrONAUTC COM4wANyV. EAs
f',PREDICTION OF CREEP IN PHASE I NAS-1-11774
;" METALLIC TPS PANELS SUMMARY REPORT
SUMMARY
Phase I of this four-phase program was concerned with the steady-state and
cyclic creep behavior of four materials in sheet form, L605, Ti-6A1-4V, Rene' 41,
and TDNiCr, applicable to a metallic radiative thermal protection system (TPS).
A survey of the literature was conducted to gather available steady-state
creep data for each of the materials. Empirical equations were developed for these
data sets, using regression analysis techniques to express steady-state creep
strains as functions of stress, temperature and time. In addition, the material
gage and rolling direction were included as variables where applicable data were
provided.
A series of supplemental steady-state creep tests were conducted on tensile
specimens for each of the four materials. The majority of tests were conducted on
thin gage sheet specimens (u.025 cm) in the longitudinal rolling direction although
a limited number of tests were conducted to investigate effects of gage (%.060 cm)
and transverse direction on creep response.
Cyclic tests were conducted to evaluate creep response characteristics under
cyclic stress and temperature profiles typical of a Space Shuttle entry. These tests
were as follows:
Basic Cycle - Stress and peak temperature were maintained constant for twenty
minutes per cycle. Specimens of each material were cycled 100 times. Data from
these tests were used to develop cyclic empirical creep equations for each material.
Stepped stress profiles - Stress and peak temperature were maintained constant
for twenty minutes per cycle but stress level was varied as a function of cycle.
This series of tests was designed to simulate stress redistribution, due to creep,
occurring in a TPS panel.
ii
PACDONNELL DOUOGLAS ATRONAUTICS CO*MPANV EAST
" PREDICTION OF CREEP IN PHASE I NAS-1-11774IMETALLIC TPS PANELS SUMMARY REPORT
Complex trajectory - Peak temperature was maintained constant for twenty minutes
per cycle but stress was varied during the cycle. The stress was not varied between
cycles. Data from the stepped stress profile and complex trajectory tests were used
to investigate the applicability of the time and strain hardening theories of creep
accumulation during cyclic creep exposures.
Idealized trajectories - Stress and temperature flight profiles were idealized
into a series of constant steps. Specimens were repeatedly subjected to these pro-
files for up to 100 cycles.
Simulated mission profiles - Specimens were subjected to mission stress and
temperature that changed with time as would occur in flight. These changes were
conducted to 200 cycles.
Additional cyclic tests, conducted to assess the effect of time per cycle and
effect of atmospheric pressure on creep strain, completed the cyclic creep testing.
Test results demonstrated that there is no significant difference between
cyclic and steady-state creep strains (for the same total time at load) for the
alloys L605, Ti-6Al-4V, Rene' 41, and TDNiCr. A single linear equation describing
the combined steady-state and cyclic creep data, for each alloy, resulted in standard
errors of estimate higher than desirable for the individual data sets. Well fitting
creep strain equations were developed for either steady-state or cyclic creep data
using linear least squares analysis techniques. A non-linear least squares analysis
of the combined cyclic and steady-state data appeared to offer potential for lowering
the standard error of estimate but time prevented further exploration in this area.
Predictions of strains that were produced by complex trajectory and simulated
mission tests (using equations based on simple cycles) was successfully accomplished.
A computer program was specifically written for this analysis. This computer program
is based on time and strain hardening theories of creep accumulation. For Ti-6AI-4V,
iii
CDOmaINELL sOUGLAS AsTRONAJTICs Coor OMANy. N AsT
' 'OPREDICTION OF CREEP IN PHASE I NAS-1-11774
SMETALLIC TPS PANELS SUMMARY REPORT
and TDNiCr, the strain hardening theory of creep accumulation provided the best
predictions, while for Rene' 41 time hardening,and for L605 a combination of strain
and time hardening provided the best predictions.
A gage effect on creep response (thin gages crept faster) was noted in both the
literature survey and the supplemental steady-state creep data bases for L605,
Rene' 41, and TDNiCr. An effect of material rolling direction on creep strains was
observed in TDNiCr.
No effects on creep strain due to variation of time per cycle (for the same
total time) or atmospheric pressure were observed for any of the four materials.
Comparison of data obtained from idealized and simulated mission tests indicates
that adequate cyclic creep response analyses can be performed by expressing the
trajectory conditions in a simplified step-wise form.
The International System of units (SI) are used in this report. U.S. Customary
Units are also generally provided. Applicable conversion factors are presented in
Appendix A.
iv
MAlCDONNELL OUO.LAS ASYRONAUTICS COMP4ANY W AST
'tPREDICTION OF CREEP IN PHASE I NAS-1-11774'L'METALLIC TPS PANELS SUMMARY REPORT
TABLE OF CONTENTS
PAGE
SECTION
FORWARD . .. . . . . . .. . . . . . . . . . . . . . . . . . . . . . . . i
SUMMARY . . . . . . . .. . . . . . . . . . .. . . . . . ii
1.0 INTRODUCTION . . . . .. . . . . . . . . . . . . . . . . . . . . . 1-1
2.0 TECHNICAL APPROACH . ...... ...... . . . . . . . . . . . . . 2-1
2.1 TPS Design Criteria and Environment . ... . . . . . . . .. 2-1
2.2 Selection of Materials ........ .. . . . . . . . . . . 2-4
2.3 Survey of Literature ... . . . . . . . . . . . . . . . 2-9
2.4 Procurement of Materials * . .. . . . . . . . . 2-10
2.5 Selection of Creep Specimen Configuration . ......... 2-11
2.6 Creep Specimen Machining and Identification .. . . . . ... 2-17
2.7 Steady State Testing Procedures . ........... . . 2-18
2.8 Cyclic Testing Procedures . .. .. .. ... . . . . . . . . 2-21
2.9 Data Requirements and Test Selection . ........... 2-37
2.10 Computer Programs . . • . .... ...... ....... . 2-51
2.11 Statistical Considerations . ..... .. . ........... . . 2-54
3.0 TEST AND DATA ANALYSIS . . .. . . . . . . . . . . . . . . . . . 3-13.1 L605 - Results of Tests and Data Analysis . ......... 3-13.2 Ti-6Al-4V - Results of Tests and Data Analysis . ... . .. 3-593.3 Rene' 41 - Results of Tests and Data Analysis . . . ...... . 3-923.4 TD-Ni-Cr - Results of Tests and Data Analysis . ....... 3-131
4.0 CONCLUDING REMARKS ............................ 4-1
5.0 REFERENCES . . . . . . . . . . . . . . . . . . . . . . . . . . 5-1A Conversion of U.S. Customary Units to SI Units . ..... . A-1
B Bibiliography on Creep in Metals .... . .............. B-1
C-1 L605 Literature Survey Creep Data .. . . . .... ... . . C-1-1C-2 L605 Supplemental Steady-State Creep Tests (Raw Data) . . . . C-2-1
C-3 L605 Cyclic Creep Tests (Raw Data) ..... ... ..... . . C-3-1
V
MCcONMmELL DOUGLAS AS1WOMeAUWs, COMaPAA . RAsT
PBHASE I NAS-1-11774' ,PREDICTION OF CREEP IN PHASE IJL" METALLIC TPS PANELS SUMMARY REPORT'
TABLE OF CONTENTS (Continued)
PAGE
D-1 Ti-6Al-4V Literature Survey (Raw Creep Data) . ....... D-1-1
D-2 Ti-6Al-4V Supplemental Steady-State Creep Tests (Raw Data).. D-2-1
D-3 Ti-6Al-4V Cyclic Creep Tests (Raw Data) . ....... . . . D-3-1
E-1 Rene' 41 Literature Survey (Raw Creep Data) . ....... . E-1-1
E-2 Rene' 41 Supplemental Steady-State Creep Tests (Raw Data) . . E-2-1
E-3 Rene' 41 Cyclic Creep Tests (Raw Creep Data) . ..... . . E-3-1
F-I TDNiCr Literature Survey (Raw Creep Data) . ........ . F-1-1
F-2 TDNiCr Supplemental Steady-State Creep Tests (Raw Data) . . . F-2-1
F-3 TDNiCr Cyclic Creep Tests (Raw Creep Data) . ........ F-3-1
G-1 An Approach to Orthogonalizing the Independent
Variables in a repression Equation . ........ . . . . . G-3
G-2 An Approach Toward Developing a Finite Difference Equation
for Rene' 41 . ........ . ............... G-9
G-3 Nonlinear Least Square Fit to Ti-6A1-4V Data . .... . . . G-12
H-1 Error Analysis for Cyclic Creep Furnace Stress Measurements . H-i
LIST OF FIGURES
PAGE
2-1 Design Ascent Trajectory . ........ . . . . . . . . . . . . 2-2
2-2 Envelope of Ascent Pressures on Fuselage Lower Surface . ..... 2-2
2-3 Design Entry Trajectory . ...... . . . . . . . . . . . . . . 2-2
2-4 Lower Surface Entry Pressure ........ . . . . . . . . . . . . 2-2
2-5 Orbiter Bottom Centerline Entry Temperature . ....... . . . 2-3
2-6 Maximum Entry Temperature for a Space Shuttle with a Metallic
TPS . . . . ............ . . . . . . . . . . . . . . . . . . 2-3
2-7 Typical Shuttle Metallic Thermal Protection System . ..... . 2-6
2-8 Creep Specimen Geometry . ..... .... . . . . . . . . . . 2-14
2-9 Tensile Specimen Photoelastic Analysis . ..... . . . . . . . . 2-15
2-10 Creep Specimen Stress Distribution Determined from Finitd
Element Analysis . .......... ............. . 2-16
vi
MCDONNELL DOUoLAS ASrOIAUTICses COMP0ANy . EArT
OFPCREDICTIO REEP IF CREEP IN PHASE I NAS-1-11774METALLIC TPS PANELS SUMMARY REPORT
LIST OF FIGURES (Continued)
PAGE
2-11 Steady-State Creep Test Facility . . .. . . . . . . ... . . . . 2-192-12 Platinum Slide Rule for Steady-State Creep Measurement ...... 2-222-13 Optical Measuring System for Steady-State Creep Testing ..... 2-222-14 Astrofurnace-Cyclic Test Facility . ..... . . . . . . . . 2-242-15 Schematic of Furnace Test Chamber .. ..... .. .. . . 2-252-16 Whiffle Tree Mechanism for Cyclic Testing . . . . . . . . 2-272-17 Astrofurnace Control Equipment . . . . . . . . . . . . . . . . 2-292-18 Typical Load Profiles Obtained in Cyclic Tests ......... 2-302-19 Typical Temperature Profile Obtained in Cyclic Tests . ...... 2-342-20 Cyclic Creep Strain Measuring System . . . . .. ........ . . 2-362-21 Supplemental Steady-State Experimental Designs . . ...... ... . 2-392-22 Stress and Temperature Profiles for Basic Cyclic Creep Tests . . 2-452-23 Tests for Effects of Variation of Stress with Cycle , . . . .... 2-472-24 Tests to Evaluate Creep Recovery . .. . . . . . . . . . . . . . 2-492-25 Typical Approach for Trajectory Idealization . . ...... .. .. 2-492-26 Idealized Trajectory Profiles . . ..... .... . . . . . . . . 2-502-27 Simulated Mission Profile. . . .. . . . . . . . . . . . . . 2-522-28 Effect of Culling Low and High Strain Data on Predictive Equation
Development. . . . . . . . . . . . . . . . . . . . . . . . . . . . 2-58Developm........ ................................ ....... 2-58
3-1 L605 Data Range - Longitudinal Rolling Direction . . . . . . . . . 3-23-2 L605 Data Range - Transverse Rolling Direction . . . . . . . . . . 3-33-3 Residual Plats of L605 Literature Survey Equation (3-3). . . . . . 3-53-4 L605 Emperical Equation (3-3) ........... . . . , .... 3-63-5 L605 Supplementary Steady-State Creep Tests at 978 0K.. . .. .. 3-103-6 L605 Supplementary Steady-State Creep Tests at 10530K. . . . . 3-103-7 L605 Supplementary Steady-State Creep Tests at 1144*K. . . . ... . 3-113-8 L605 Supplementary Steady-State Creep Tests at 12550K. ...... . 3-113-9 Residual Plots of L605 Supplemental Steady-State Equation (3-4). 3-123-10 Comparison of L605 Creep Strain Predictions with Test Results at
978 0K and 110.3 MPa. . . . . . . .. ... . . . ............. . . 3-143-11 Comparison of L605 Creep Strain Predictions with Test Results at
1144 0K and 55.2 MPa. . . . ........... . . . . . . . . . . . . 3-14
vii
AC~CfoA&L.L &OUvLas AStIrAOONAUTCS COMAPAWyv. sarT
't PREDICTION OF CREEP IN PHASE I NAS-1-11774
Zo METALLIC TPS PANELS SUMMARY REPORT
LIST OF FIGURES (Continued)
PAGE
3-12 Effect of Gage on L605 Creep at 10530K and 55.2 MPa . ........ 3-16
3-13 Effect of Gage on L605 Creep at 11440K and 27.6 MPa . ... ..... . 3-16
3-14 Effect of Gage on L605 Creep at 11440K and 55.2 MPa . ........ 3-17
3-15 Effect of Rolling Direction on L605 Creep at 10530K and 55.2 Mpa . 3-18
3-16 Effect of Rolling Direction on L605 Creep at 11440K and 27.6 MPa . 3-18
3-17 Effect of Rolling Direction on L605 Creep at 11440K and 55.2 MPa . 3-19
3-18 Effect of Preoxidation on Creep of L605 and 10530K and 55.2 MPa . 3-20
3-19 Effect of Preoxidation of Creep of L605 at 11440K and 27.6 MPa . 3-20
3-20 Effect of Preoxidation on Creep of L605 at 11440 K and 55.2 MPa . 3-21
3-21 Comparison of Creep Data for Thickness <.063 and >.063 cm . ..... 3-23
3-22 L605 Basic Cyclic Experiment Design . ...... . . . . . . . . . . 3-25
3-23 L605 Basic Cyclic Creep Test at 9780K . ........... .... . 3-26
3-24 L605 Basic Cyclic Creep Test at 10530K . ........ . . . . . . 3-26
3-25 L605 Basic Cyclic Creep Test at 11440K ..... . .... . . . . . . . 3-27
3-26 L605 Basic Cyclic Creep Test at 12550K . ......... . . . . . 3-27
3-27 Residual Plots of L605 Cyclic Equation (3-6) . .. . . . . . . . . . 3-28
3-28 Change in Strain as a Function of Time Using Equation (3-6) ..... 3-31
3-29 Comparison of L605 Cyclic and Steady-State Data at 15 Hours ..... 3-32
3-30 Comparison of L605 Cyclic and Steady-State Data at 30 Hours . .... 3-32
3-31 Microstructure of L605 Before and After Creep Exposure at 9780K . . 3-34
3-32 Microstructure of L605 After Creep Exposure at 11440K . ....... 3-35
3-33 Microstructure of L605 After Creep Exposure at 12550K . ....... 3-36
3-34 L605 Cyclic Creep Strains are Function of Total Time at Load . . . . 3-38
3-35 Comparison of Cyclic Creep Strains for Simulated Mission and
Idealized Trajectories ........... . . . . . . . . . . . . . 3-38
3-36 L605 Cyclic Test No. 14 - Continuation of L605 Basic Cyclic Test
No. 3 . . . . . . . . . . . . . . . . . . . . . . . . . . . . . . . . 3-39
3-37 Effect of Time at Maximum Load for L605 Cyclic Tests at 11440K . . . 3-41
viii
MrCDONNELL DOUGLAS ASTIONAUTI^f CS COMPANV . ASTr
PREDICTION OF CREEP IN PHASE I NAS-1-11774IMETALLIC TPS PANELS SUMMARY REPORT
LIST OF FIGURES (Continued)
PAGE
3-38 L605 Cyclic Test No. 5 - Stepped Stress History and Resultant
Creep. . ......... ..... . . . . . . . . . . . . . . . 3-423-39 L605 Cyclic Test No. 10 - Stepped Stress History and Resultant
Creep. .... ... ....... . . . . . . . . . . . . . . . . ... 3-43
3-40 L605 Cyclic Test No. 6 - Increasing Stress History and Resultant
Creep. ........ .. . ..... . . . . . . . . . . . . . 3-45
3-41 L605 Cyclic Test No. 7 - Decreasing Stress History and Resultant
Creep. . . . ...... .. .. . . .. ... . . . . ... ....... . 3-463-42 Comparison of Hardening Theories ..... ........... . . . . . 3-47
3-43 Comparison of Hardening Theories - Stepped Stress Histories. . . . 3-48
3-44 Comparison of L605 Cyclic Test 9 and 3 - Stress for Equivalent
Creep Strain . .. . ......... . . . . . . . . . . . . . 3-50
3-45 Simulated Mission Trajectory Profile for L605 Cyclic Tests 12, 13,
and 15 . .......... .. .. . . . . . . . I. . . . . . . . . 3-52
3-46 Comparison of Hardening Theories - L605 Cyclic Test No. 9 .... 3-533-47 L605 Cyclic Test No. 13 - Idealized Trajectory Profiles and
Resultant Creep. ............ ... ............ . . . 3-54
3-48 L605 Cyclic Test No. 15 - Simulated Mission Trajectory Profiles
and Resultant Creep. ........... .. ....... . . . . . . . . . . 3-56
3-49 Comparison of Hardening Theories - L605 Cyclic Test No. 15 . . .. 3-57
3-50 Residual Plots of Ti-6Al-4V Literature Survey Equation (3-11). . . 3-623-51 Logarithmic Relationship of Actual Ti-6Al-4V Creep Strain Versus
Predicted Values Using Empirical Regression Equation (3-11). . . . 3-64
3-52 Ti-6Al-4V Supplemental Steady-State Experimental Design. . . . . . 3-663-53 Ti-6Al-4V Supplementary Steady-State Creep Data at 616 0K . .. . . 3-68
3-54 Ti-6Al-4V Supplementary Steady-State Creep Data at 6580K .. . . . 3-68
3-55 Ti-6Al-4V Supplementary Steady-State Creep Data at 6140K . .... 3-693-56 Ti-6Al-4V Supplementary Steady-State Creep Data at 783 0K . . . . . 3-693-57 Residual Plots of Ti-6Al-4V Supplemental Steady State Equation
(3-12) . . ... . . . . . . . . . . . . . 3-71
ix
AMCOONNM LL DOUOLAS ASRONAUTCr COMPANv. - ABTe
@'i5PREDICTION OF CREEP IN PHASE I NAS-1-11774
METALLIC TPS PANELS SUMMARY REPORT
LIST OF FIGURES (Continued)
PAGE
3-58 Effect of Rolling Direction on Ti-6A1-4V Creep at 6580K and
317.2 MPa . . . . .. . . . . . ........................... . 3-72
3-59 Comparison of Gage and Rolling Direction on Ti-6AI-4V Creep at
7140K and 165.5 MPa . . . . . . . . . . . . . . . . . . . . . . . 3-73
3-60 Comparison of Gage and Rolling Direction on Ti-6Al-4V Creep at
714 0K and 317.2 MPa . . . . . . . . . ....................... 3-73
3-61 Ti-6Al-4V Cyclic Test No. 1 - Basic Cyclic Test at 6580K ... . . 3-75
3-62 Ti-6A1-4V Cyclic Test No. 2 - Basic Cyclic Test at 6140K ... . . 3-76
3-63 Ti-6Al-4V Cyclic Test No. 3 - Basic Cyclic Test at 7830K . .... 3-76
3-64 Ti-6Al-4V Cyclic Test No. 4 - Basic Cyclic Test at 8390K . .... 3-78
3-65 Residual Plots of Ti-6Al-4V Cyclic Creep Equation (3-13) . .... 3-78
3-66 Comparison of Ti-6Al-4V Cyclic and Supplemental Steady-State Data
at 5 Hours . . . . . . . .. . . . .......................... . . 3-80
3-67 Comparison of Ti-6Al-4V Cyclic and Supplemental Steady-State Data
at 33 Hours. . . . . . . . . . .. .......................... . . 3-80
3-68 Microstructure of Ti-6Al-4V Before and After Creep Exposure. .. 3-81
3-69 Ti-6Al-4V Cyclic Creep Strains as a Function of Time per Cycle . 3-83
3-70 Comparison of Titanium Cyclic Test Data for Effects of
Atmospheric Pressure . ..................... . 3-84
3-71 Effect of Time Delay Between Cyclic Tests on the Creep Behavior
of Ti-6Al-4V . .. . . ... . . . . . . . ............ ... 3-84
3-72 Comparison of Hardening Theory Predictions with Increasing Stress
Test Results (Ti-6A1-4V Cyclic Test 6) . ...... ...... . 3-86
3-73 Comparison of Hardening Theory Predictions with Decreasing Stress
Test Results (Ti-6A1-4V CyclicTest 7) . ....... . . . . . . 3-87
3-74 Comparison of Strain Hardening Theory Predictions with Two Step
Trajectory Test Results (Ti-6A1-4V Cyclic Test 8). . ...... . 3-89
3-75 Comparison of Strain Hardening Theory Predictions with Simulated
Mission Test Results (Ti-6Al-4V Cyclic Test 9) . ...... . . . 3-90
3-76 Comparison of Strain Hardening Theory Predictions with Idealized
Trajectory Test Results (Ti-6AI-4V Cyclic Test 10) . ...... . 3-91
3-77 Residual Plots of Rene' 41 Literature Survey Equation (3-14) . .. 3-94
x
OWCDOMWELL DOUGLAS5 AJWONAA4TDCJF COAVOMAYV a EArV
' PREDICTION OF CREEP IN PHASE I NAS-1-11774- METALLIC TPS PANELS SUMMARY REPORT
LIST OF FIGURES (Continued)
PAGE3-78 Comparison of Literature Survey Creep Equation (3-14) with Test.
Results for Rene' 41 . . . . . ...... . . . . . . . . . . 3-953-79 Rene' 41 Supplemental Steady-State Tests . ...... ... . .. 3-973-80 Rene' 41 Supplementary Steady-State Creep Data at 964 and 9830K. 3-983-81 Rene' 41 Supplementary Steady-State Creep Data at 10610K.. ... . . 3-993-82 Rene' 41 Supplementary Steady-State Creep Data at 1llllK ..... 3-993-83 Rene' 41 Supplementary Steady-State Creep Data at 11550K . . . . 3-1003-84 Rene' 41 Supplementary Steady-State Creep Data at 11800K . . ... 3-1003-85 Residual Plots of Rene' 41 Supplemental Equation (3-15). . . . . 3-1023-86 Comparison of Gage and Rolling Direction on Creep of Rene' 41 at
1061 0K and 68.9 MPa .... .. ....... . . . . . . . . . . . 3-1033-87 Comparison of Gage and Rolling Direction on Creep of Rene'. 41 at
11110K and 69.9 MPa. . ........... ... . ... ... . 3-1033-88 Comparison of Gage and Rolling Direction on Creep of Rene' 41 at
11550K and 121.3 MPa . . . .. . ............ • . . . . . . . . . 3-1043-89 Comparison of Data Base and Supplemental Test Equations. . ... . 3-1043-90 Rene' 41 Basic Cyclic Creep Test at 1033 0K ... ... ... .. . 3-1073-91 Rene' 41 Basic Cyclic Creep Test at 10720K . ........ . . . 3-1073-92 Rene' 41 Basic Cyclic Creep Test at 11110K . ......... . . 3-1083-93 Rene' 41 Basic Cyclic Creep Test at 11550K .......... . . 3-1083-94 Residual Plots of Rene' 41 Cyclic Equation (3-17). . ....... 3-1103-95 Comparison of Cyclic and Supplemental Steady State Creep Data. .. 3-1123-96 Microstructure of Rene' 41 Prior to Creep Exposure . .. . . . . . 3-1143-97 Microstructure of Rene' 41 After Creep Exposure at 1061 and
10720K . . . . . . . . . . . . . . .. . 3-1153-98 Microstructure of Rene' 41 After Creep Exposure at 1155 0K. . . .. 3-1163-99 Rene' 41 Cyclic Creep Strains as a Function of Total Time at Load
at 11550K . . . . . . . . .. . . . ............................ 3-1173-100 Effect of Pressure on the Cyclic Creep of Rene' 41 ........ . 3-1193-101 Rene' 41 Cyclic Test No. 11 - Continuation of Rene' 41 Basic
Cyclic Test No. 1. . .......... . . . ... . .... . . . . . 3-1193-102 Effect of Increased Time at Load on Rene' 41 at 1111K . ..... , 3-120
xi
MCDONNEaLL DOUVLA ASTRONAUJTCS COMPANY. EArST
-- ,,, .PH," 1. NAS-1-11774-PREDICTION OF CREEP IN PHASE
I METALLIC TPS PANELS SUMMARY REPORT
LIST OF FIGURES (Continued)
PAGE
3-103 Effect of Variation of Stress Profile Between Cycles for Rene' 41
at 1111 0K... . . . . -.................... . ...... .. 3-122
3-104 Effect of Increasing Stress on Creep of Rene' 41 at 11119K . . 3-123
3-105 Effect of Decreasing Stress on Creep of Rene' 41 at lll1K . . . 3-124
3-106 Rene' 41 - Two Step Trajectory Data and Predictions ... . . . 3-126
3-107 Rene' 41 - Idealized Trajectory Profiles - Creep Data and
Predictions. . ......... . . . . . . .. . . 3-127
3-108 Rene' 41 Cyclic Test No. 13 - Idealized Trajectory Profiles -
Creep Data and Predictions ........ . . . . . . . . . . . . . 3-128
3-109 Rene' 41 - Simulated Mission Profile - Creep Data and Predictions. 3-129
3-110 Residual Plots of TDNiCr Literature Survey Equation (3-18) . . . . 3-132
3-111 Residual Plots of TDNiCr Literature Survey Equation (3-19) (Based
on NASA Data Only) . ............... .. . . . . . . 3-135
3-112 TDNiCr Supplemental Steady-State Experimental Design . ...... 3-136
3-113 TDNiCr Supplemental Steady-State Data at 50 Hours. ... .. ..... 3-138
3-114 Comparison of Data Base Predictions and Supplemental Test Results. 3-140
3-115 TDNiCr Basic Cyclic Creep Test at 1089 0K . ......... . . . 3-143
3-116 TDNiCr Basic Cyclic Creep Test at 12000K . ......... . . . 3-143
3-117 TDNiCr Basic Cyclic Creep Test at 13390 K . . . . . ..... . .. . . 3-144
3-118 TDNiCr Basic Cyclic Creep Test at 1478 0K . ......... . .. . 3-144
3-119 Residual Plots of TDNiCr Cyclic Equation (3-20). . ........ . 3-145
3-120 TDNiCr Cyclic Test Data. . .......... . . . . . . ... ... . 3-146
3-121 Data Range Comparison - TDNiCr . ........ . . . . . . . .. 3-148
3-122 Comparison of TDNiCr Cyclic and Supplemental Steady-State Data . 3-149
3-123 Comparison of Calculated Values of Cyclic Creep (Ecy' Equation
3-20) and Steady-State Data Base Creep (ess, Equation 3-18). . . . 3-150
3-124 Microstructure of TDNiCr Bef6re and After Creep Exposure at
13380 K . . . . . . . . . . . . ... .. . . . . . . . ... . . 3-151
3-125 TDNiCr Cyclic Creep Strains as a Function of Total Time at Load. 3-153
3-126 Comparison of TDNiCr Idealized Trajectory Tests for Atmospheric
Pressure Effects . ......... . . . . . . . . . . . . . . . 3-153
xii
MCDONAIELL DOUOLAS ASTW@OJAo rCs Co~CMoMPANY m AST
'PREDICTION OF CREEP IN PHASE I NAS-1-11774METALLIC TPS PANELS SUMMARY REPORT
LIST OF FIGURES (Continued)
PAGE3-127 Effect of Time Delay Between Cyclic Tests on the Creep Behavior
ofTDNiCr . . .. . . . .................... . . .... . 3-1543-128 Comparison of Test Data (TDNiCr Test 7 on) Predictions (Equation
3-21). . . . . .. ..... . . . . . . . . . . . I. . . . . . 3-157
LIST OF TABLES
PAGE2-1 Material Property Comparison ... . . . . ............... . . . 2-72-2 Supplier Certification . .. .... .. . ............. . . . 2-122-3 Determination of Temperature Gradient in Cyclic Test Furnace . . 2-322-4 Supplemental Steady-State Creep Tests. .. . .. . . ... . . . . . 2-412-5 Basic Cyclic Tests . . . . ...... .... ... . . . . . . . 2-453-1 L605 Supplemental Steady-State Tests . . . . .... . . . . ... ... 3-83-2 L605 Basic Cyclic Test Matrix..... .... .. ........... . . 3-253-3 Ti-6Al-4V Supplemental Steady-State Tests . .. .. ... . . . . . 3-673-4 Ti-6AI-4V Basic Cyclic tests. .. .. ............ 3-753-5 Rene' 41 Supplemental Steady-State Tests . . . ..... . . . . . 3-953-6 Rene' 41 Basic Cyclic Test Matrix. .... ..... . . . . ..... 3-1063-7 TDNiCr Supplemental Steady-State Tests . . . . . ............. .. 3-1363-8 Comparison of Gage and Rolling Direction Effects in Supplemental
Steady State Testing. .. .... . . . . ............. .. 3-1383-9 TDNiCr Basic Cyclic Tests.. .. ...... ... . . . . . . . 3-141
LIST OF SYMBOLS
S = strain, %
E = cyclic creep strain, %cy
E = supplemental steady-state creep strains, %ss
t = time, hrs.
xiii
AMCDONNELL Uo LAS AsJRWONAeU ss COAMPAyV *WANT
-00e PHASE I NAS-1-11774'PREDICTION OF CREEP IN PHASE NAS-
METALLIC TPS PANELS SUMMARY REPORT
LIST OF SYMBOLS (Continued)
Q = Apparent activation energy
R or R 2 = correlation coefficient
R = universal gas constant
RT = Room temperature
T = Absolute Temperature, OK
o = stress, MPa
o0 = uniform tensile specimen stress
01 = principal stress
02 = principal stress
aT = tangential stress
S = structure factor
0 = material thickness, cm.
9 = test direction
S = standard error of estimatey
S= dummy variable factor
< = less than
> = greater than
xiv
MCDoNuELL DOUOLAS ASTgrNAoaTrCS COMPA YVA aErS
'PREDICTION OF CREEP IN PHASE I NAS-1-11774METALLIC TPS PANELS SUMMARY REPORT
1.0 INTRODUCTION
One of the design requirements of reentry vehicle metallic thermal protection
systems (TPS) is that deflections, occurring during ascent and entry mission phases,
due to differential pressure and thermal loading, do not exceed design limits
established to minimize localized aerodynamic heating and to minimize the need for
panel refurbishment (Reference 1). Because these deflections include permanent
deformation due to creep, the influence of cyclic entry conditions on material creep
response and methods for predicting these deformations are needed.
Several experimental programs (References 2 to 6) have been conducted to
determine if cyclic entry environments produce a different creep strain response
than would be predicted based on data obtained from steady-state creep tests. These
programs have produced varying, and at times, conflicting results as to whether a
cyclic environment produces different results than those obtained in steady-state
environments.
This four-phase program was initiated, in an effort to further investigate
cyclic creep response and to develop design methods applicable to TPS structures
subjected to environments causing creep to occur. Four alloys, in sheet form,
Ti-6A1-4V, Rene' 41, L605 and TDNiCr, were studied. Although the work was initiated
for application to Space Shuttle TPS, results are considered applicable to a wide
variety of structures which are cyclicly exposed to creep producing thermal environ-
ments.
Phase I of this program was designed to investigate the steady-state (constant
temperature and load) and cyclic creep response characteristics of the four alloys.
Steady-state creep data was gathered through a literature survey to establish
a reference data base for each alloy. These data bases were used to develop
empirical equations describing creep as a function of time, temperature, and stress.
1-1
MICDONNELL OUGLAS ASTROPUVrCs COMep.Y * AS
' 'P'EDICTION OF CREEP IN PHASE I NAS-1-11774
METALLIC TPS PANELS SUMMARY REPORT
These equations were the basis for establishing test parameters for supplemental
steady-state creep tests conducted on tensile specimens. The purpose for these
tests was to compare the creep response of sheet used in this program with that of
the literature survey data base, and also to supplement the data base. Effects of
variables such as material thickness and rolling direction were studied.
Tensile cyclic creep tests were conducted to characterize material cyclic creep
response under varying loads and temperatures. These data were used to evaluate
analytical methods to predict cyclic creep behavior. Basic cyclic tests, using
simple constant stress and temperature cycles to represent flight conditions, pro-
vided data for comparison with steady-state response and development of empirical
equations for cyclic creep. Other tests were conducted using these same cycles but
with a varying stress as a function of cycle to simulate the changing stresses
present in a creeping beam as a result of stress redistribution. Additional tests
were conducted using complex stress and temperature profiles representative of Space
Shuttle Orbiter trajectories. Tests were generally conducted for 100 simulated
flight cycles.
A computer program was written, applying creep hardening theories in conjunction
with empirical equations for creep, to aid in analysis of these test data.
In Phase II a computer program will be written to predict TPS panel creep
deflections based on inputs of panel geometry, trajectory data, and empirical creep
equation coefficients. Corrugation stiffened and rib stiffened sub-size panels will
be tested to provide data for verification of prediction capability.
Phase III involves using methods of analysis developed in Phases I and II to
analyze full size heat shield panel creep deformation data developed on other R/D
programs (References 2 and 3).
In Phase IV recommended creep design procedures for the Space Shuttle TPS
1-2
MCDONNAELL DOUGLAS ASTIRO AUTCS CBOMPBN VT EAST
"-?REDICTION OF CREEP IN PHASE I NAS-1-117741;- METALLIC TPS PANELS SUMMARY REPORT
will be established. These procedures provide methods for analyzing material creep
data, procedures for design of TPS, and rules for inspection and measurement of
panel deflections.
This report contains results of Phase I of the study. Included are data for
steady-state and cyclic tests conducted and associated analysis for the four alloys
studied.
1-3
MCDONNELL DOUGLAS ASTRONAUTICS COMPANy . EAST
PREDICTION OF CREEP IN PHASE I NAS-1-11774> "METALLIC TPS PANELS SUMMARY REPORT
2.0 TECHNICAL APPROACH
2.1 TPS DESIGN CRITERIA AND ENVIRONMENT
This program was associated with the use of metallic materials for the Space
Shuttle TPS. Therefore, the test conditions were representative of the Reference
(1) Shuttle design criteria and environments.
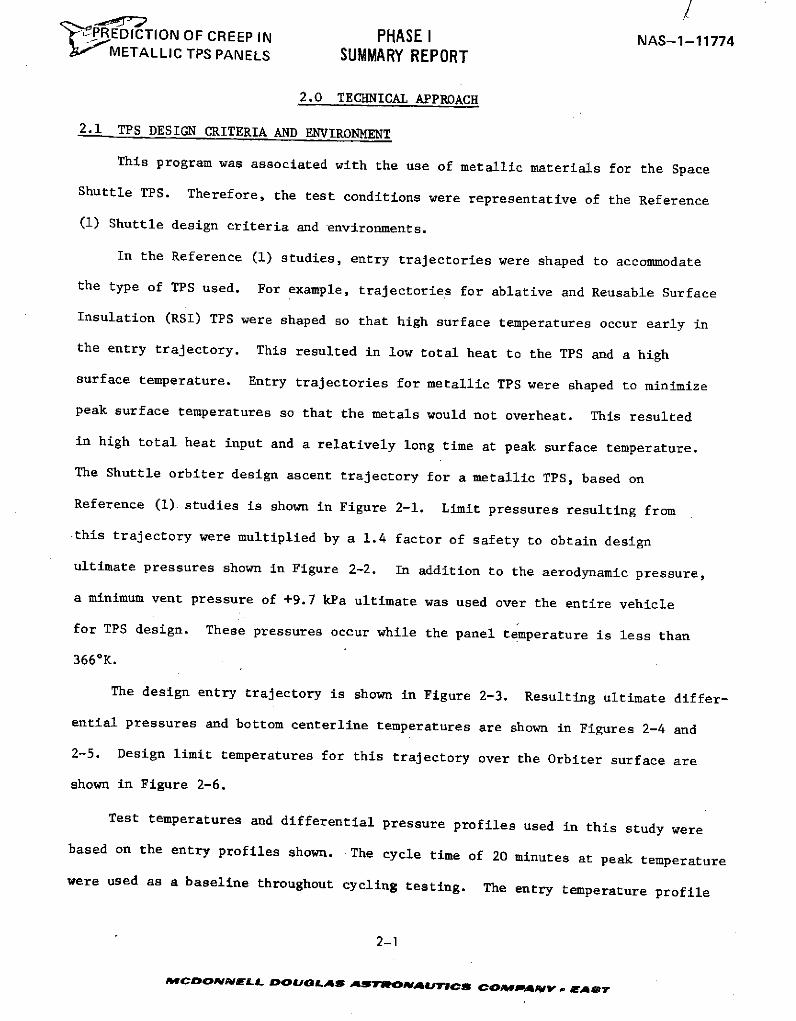
In the Reference (1) studies, entry trajectories were shaped to accommodate
the type of TPS used. For example, trajectories for ablative and Reusable Surface
Insulation (RSI) TPS were shaped so that high surface temperatures occur early in
the entry trajectory. This resulted in low total heat to the TPS and a high
surface temperature. Entry trajectories for metallic TPS were shaped to minimize
peak surface temperatures so that the metals would not overheat. This resulted
in high total heat input and a relatively long time at peak surface temperature.
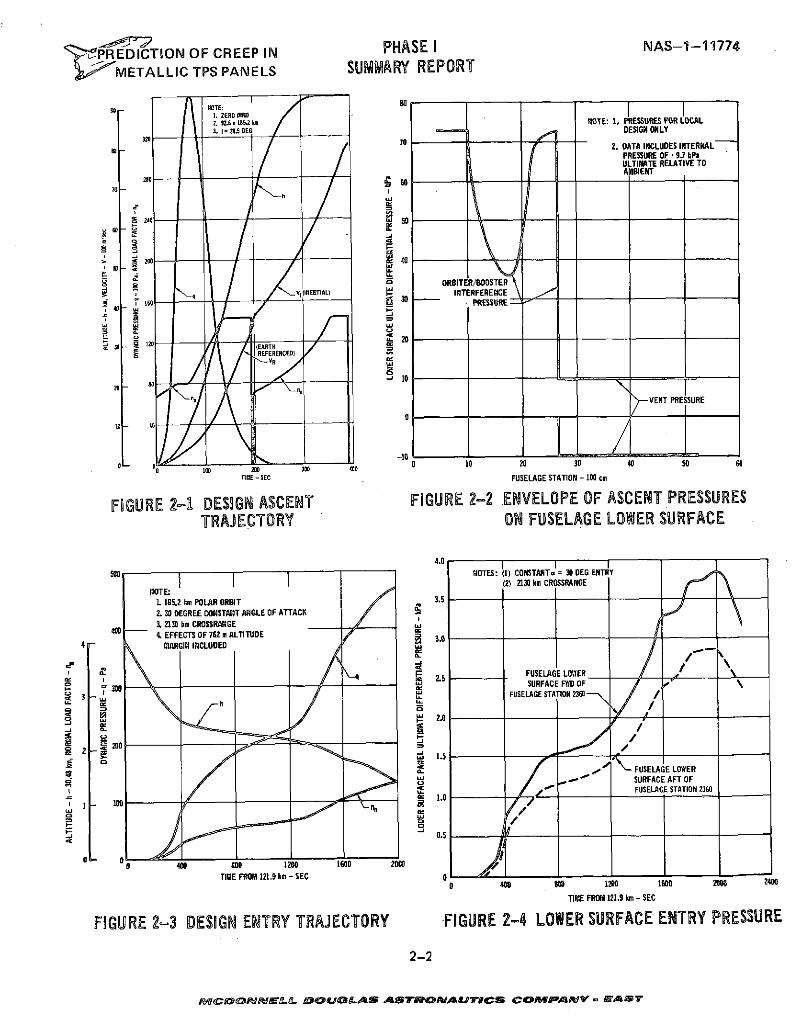
The Shuttle orbiter design ascent trajectory for a metallic TPS, based on
Reference (1) studies is shown in Figure 2-1. Limit pressures resulting from
this trajectory were multiplied by a 1.4 factor of safety to obtain design
ultimate pressures shown in Figure 2-2. In addition to the aerodynamic pressure,
a minimum vent pressure of +9.7 kPa ultimate was used over the entire vehicle
for TPS design. These pressures occur while the panel temperature is less than
366 0K.
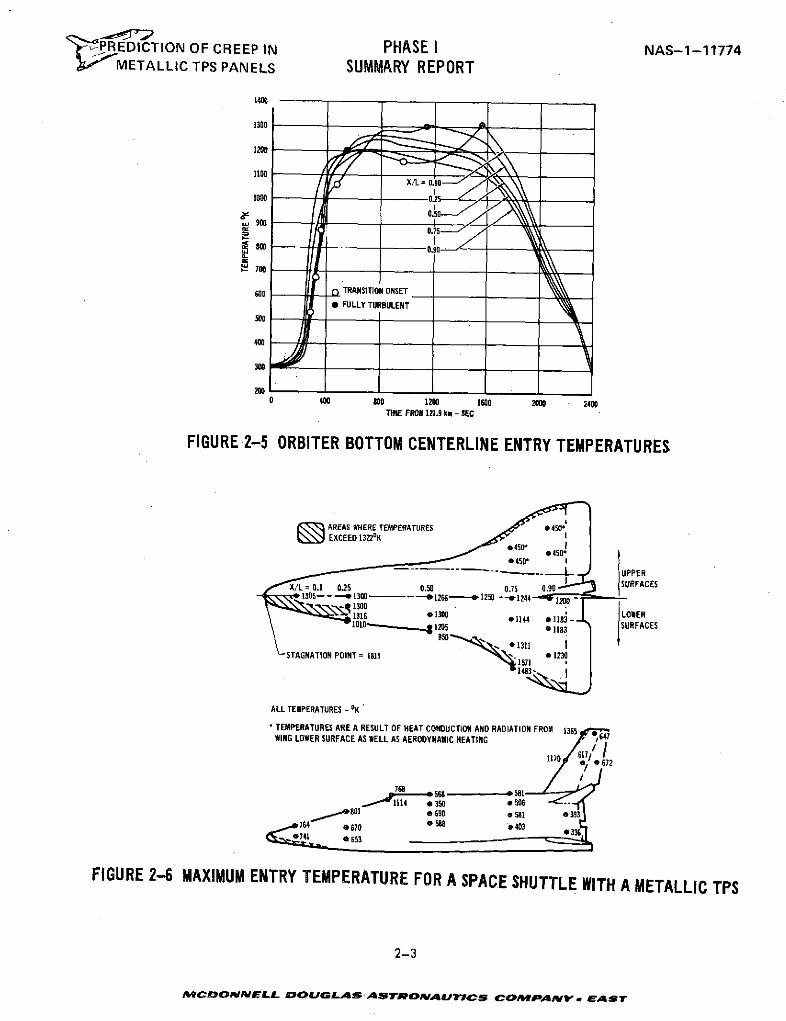
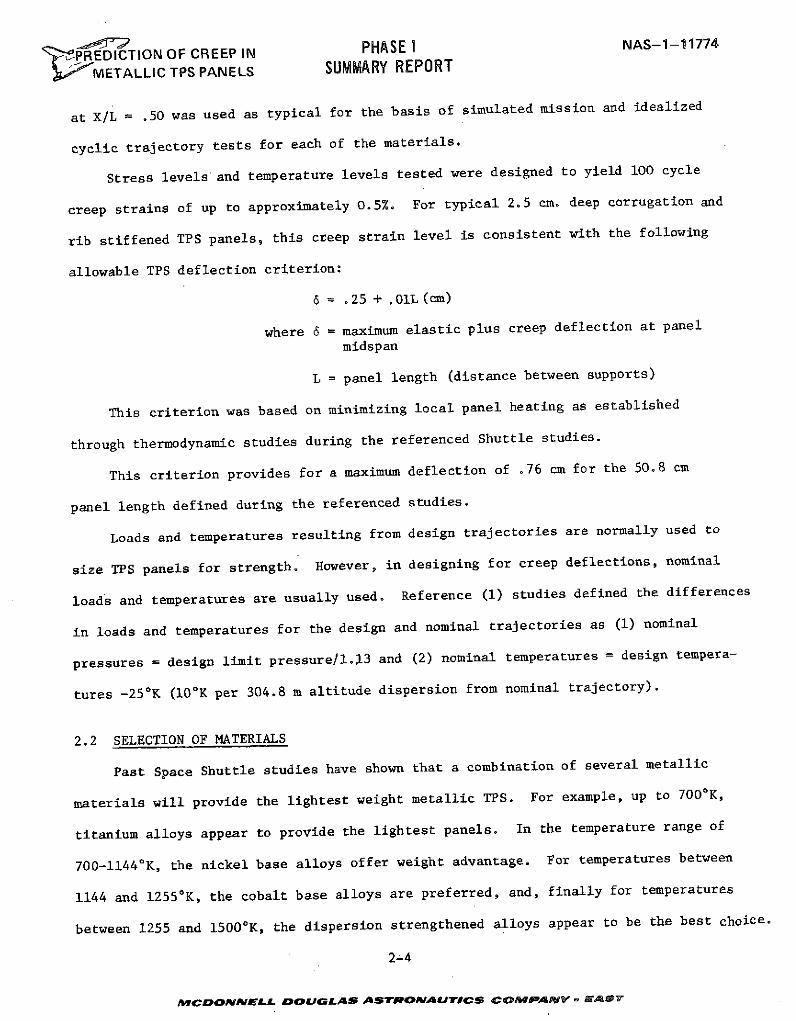
The design entry trajectory is shown in Figure 2-3. Resulting ultimate differ-
ential pressures and bottom centerline temperatures are shown in Figures 2-4 and
2-5. Design limit temperatures for this trajectory over the Orbiter surface are
shown in Figure 2-6.
Test temperatures and differential pressure profiles used in this study were
based on the entry profiles shown. The cycle time of 20 minutes at peak temperature
were used as a baseline throughout cycling testing. The entry temperature profile
2-1
AMCDONIELL DOUOLAS As ROWAUTC C COcamApNV - NAsT
'" PREDICTION OF CREEP IN PHASE I NAS-1-11774
MIETALLIC TPS PANELS SUMMARY REPORT
No NOTE: 801. ZERO RIND2. 12.6 13 .2 x ROTE: 1. PRESSURES FOR LOCAL3. i= 28.5 0EG 7 DESIGN ONLY
e70 2. DATA INCLUDES INTERNALPRESSURE OF ± 9.7 kPaULTIMATE RELATIVE TOAMBIENT
0 -0
S200
8
SO-
SORBITER/BOOSTERVj(INENTIAL) INTERFERENCE
REFERENCED)
VENT PRE PRESSURE SURE
201 8REFERENCED)
,_ so s 100- 0
TI E FUSELAGE STATION - 100 cm
VENT PRESSURE
-10 -
S 0 10 2W 300 toa0 10 20 30 40 50 60TiE - SEC FUSELAGE STATION - 100 cm
FGURE 2=1 DESIGN ASCENT FIGURE 2=2 ENVELOPE OF ASCENT PRESSURESTRAJECTORY ON FUSELAGE LOWER SURFACE
4.0 I I5 NOTES: (1) CONSTANTa = 30 DEG ENTRY
I I I 2) 2130 km CROSSRANGENOTE:
L 185.2 km POLAR ORBIT 3.52. 30 DEGREE CONSTANT ANGLE OF ATTACK3. 2130 km CROSSRAN4GE4. EFFECTS OF 762 m ALTITUDE 3._
4 R ARGIN INCLUDED 3.
FUSELAGE LOEROWERS SURFARFACECE AFT OFOF
FUSELAGE FUSELAGESTTATION 2360ATIO230
0 0 40 20 1200 1600 200
4 1.5 2400
FIGURE 23 DESG ENTRY TRAJECTORY FIGURE 2- LOWER SURFACE OWENTRY PRESSUR
U.' 10 ______ FUSELAGE STATION 2360a
0 400 00 1200 1600 2000TIME FROM 121.9 km - SEC _
TIME FROM 121.9 km - SEC
FIGURE 2-3 DESIGN ENTRY TRAJECTORY FIGURE 2-4 LOWER SURFACE ENTRY PRESSURE
2-2
,B~C~PO~Ai~&&. L~UgaOL ASTRONAUTICS~ CIW PAR4V9 - I*T
7REDICTION OF CREEP IN PHASE I NAS-1-11774METALLIC TPS PANELS SUMMARY REPORT
1400
1300
1100
0.5p 90
700
600 O TRANSITION ONSET
5 FULLY TURBULENT
500
400
2000 400 800 1200 1600 2000 2400
TIME FROM 121. km - SEC
FIGURE 2-5 ORBITER BOTTOM CENTERLINE ENTRY TEMPERATURES
AREAS WHERE TEMPERATURES e450*EXCEED1322oK
450* 1450S450* I---------- UPPER
GLOE SASURFACESX/L 0.1 0.25 0.50 0.75 0.90 SURFACES
1305 ---- 1300 - -- 12 - 1250 -- 244 120051300
1 316 e300 e1144 *1183- LOWER
850 , .1311
1STAGNATION POINT= 1811 *1 1230
1571
ALL TEMPERATURES -OK
TEMPERATURES ARE A RESULT OF HEAT CONDUCTION AND RADIATION FROM 1365 6WING LOWER SURFACE AS WELL AS AERODYNAMIC HEATING , ,647
1170 672
768 56_p--3-~ 568 _--" 581
801 e 690 e581 393
.. ,,e647 0670 e588 '403 *
FIGURE 2-6 MAXIMUM ENTRY TEMPERATURE FOR A SPACE SHUTTLE WITH A METALLIC TPS
2-3
MCDONNELL DOUGLAS ASTRONrAUTICS COMPANV . EAST
a PHASE I ~NAS-1-1 1774F'PREDICTION OF CREEP IN PHASE I
METALLIC TPS PANELS SUMMARY REPORT
at X/L = .50 was used as typical for the basis of simulated mission and idealized
cyclic trajectory tests for each of the materials.
Stress levels and temperature levels tested were designed to yield 100 cycle
creep strains of up to approximately 0.5%. For typical 2.5 cm. deep corrugation and
rib stiffened TPS panels, this creep strain level is consistent with the following
allowable TPS deflection criterion:
6 = .25 + .01L (cm)
where 6 = maximum elastic plus creep deflection at panel
midspan
L = panel length (distance between supports)
This criterion was based on minimizing local panel heating as established
through thermodynamic studies during the referenced Shuttle studies.
This criterion provides for a maximum deflection of .76 cm for the 50.8 cm
panel length defined during the referenced studies.
Loads and temperatures resulting from design trajectories are normally used to
size TPS panels for strength. However, in designing for creep deflections, nominal
loads and temperatures are usually used. Reference (1) studies defined the differences
in loads and temperatures for the design and nominal trajectories as (1) nominal
pressures = design limit pressure/1.13 and (2) nominal temperatures = design tempera-
tures -250K (100K per 304.8 m altitude dispersion from nominal trajectory).
2.2 SELECTION OF MATERIALS
Past Space Shuttle studies have shown that a combination of several metallic
materials will provide the lightest weight metallic TPS. For example, up to 7000 K,
titanium alloys appear to provide the lightest panels. In the temperature range of
700-11440 K, the nickel base alloys offer weight advantage. For temperatures between
1144 and 1255 0K, the cobalt base alloys are preferred, and, finally for temperatures
between 1255 and 15000 K, the dispersion strengthened alloys appear to be the best choice.
2-4
(MCDONNELL DOUGLAS ASTRONAUTICS CO iWPANV- AS~
" PREDICTION OF CREEP IN PHASE I NAS-1-117742i, METALLIC TPS PANELS SUMMARY REPORT
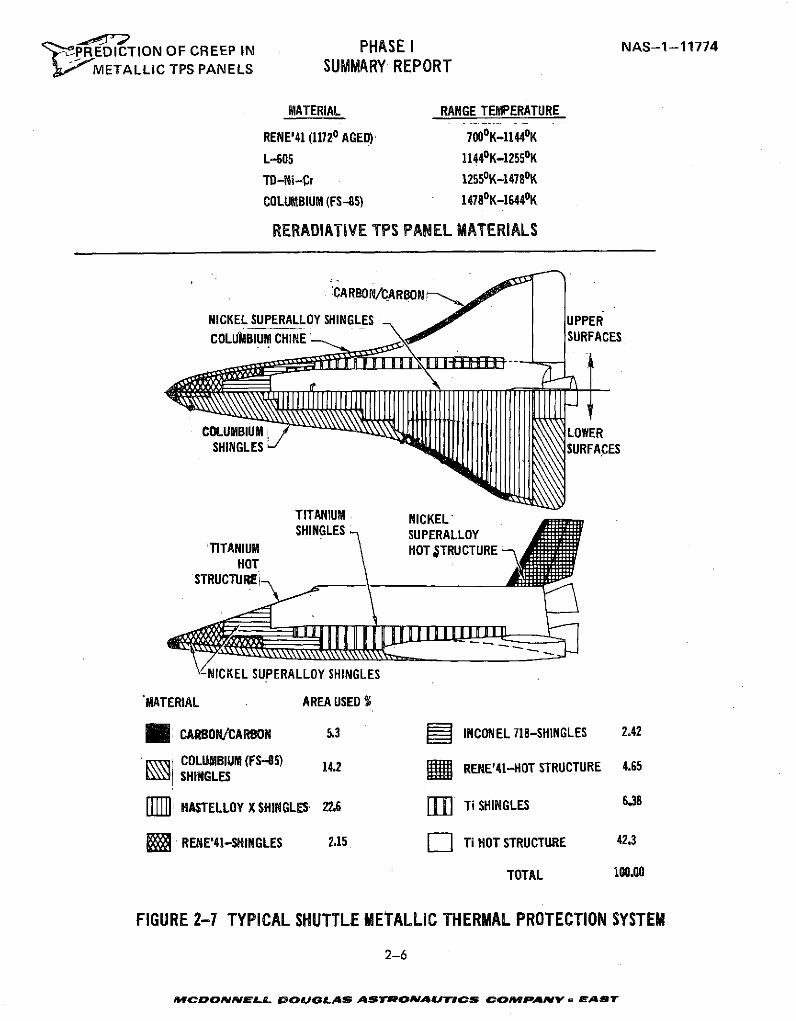
Above this temperature coated refractory metals would have to be used. A typical
distribution of metals on the Shuttle, based on temperature range of applicability,
is presented in Figure 2-7.
During the Space Shuttle studies (Reference 1) a review was made of the most
promising titanium, nickel, cobalt, and dispersion strengthened alloys to determine
which alloy should be used on shuttle. The following topics were considered:
o Availability in thin sheet
o Thermal stability
o Fabrication
o Weldability
o Oxidation resistance
o Strength
o Creep resistance
o Cost to manufacture
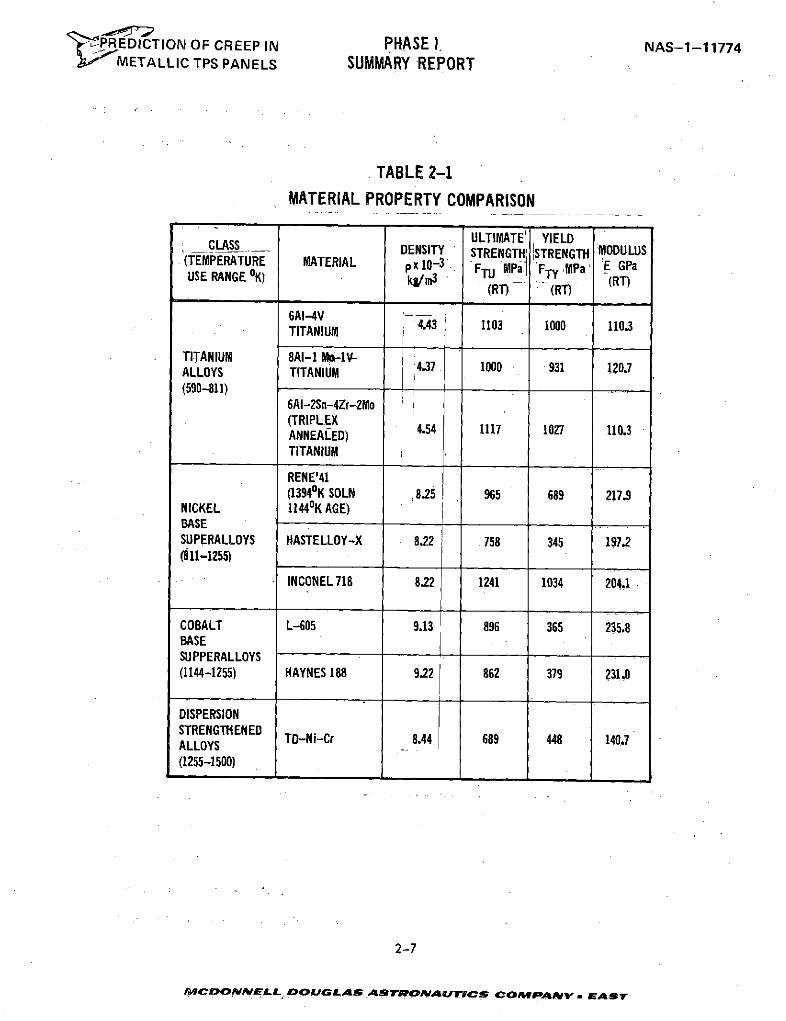
Material properties for the nine alloys reviewed are presented in Table 2-1.
Based on the results of these studies (References 1 and 7) and the goals of
this program, Ti-6Al-4V, in the annealed condition, was selected as the titanium
alloy for evaluation. Another titanium alloy, Ti-6Al-2Sn-4Zr-2Mo, was also con-
sidered. The fabricability and thermal stability of Ti-6AI-4V and Ti-6A1-2Sn-4Zr-2Mo
are the same. However, since Ti-6Al-4V has been in existence for over 10 years and
was evaluated extensively for the Supersonic Transport (SST) program and for the
Reference 1 studies, the data base for Ti-6Al-4V was greater than that for the
newer alloy Ti-6Al-2Sn-4Zr-2Mo.
The nickel base alloy selected was Rene' 41. The basis for this selection was
the fact that Rene' 41 was evaluated as full scale TPS panels in the Space Shuttle
Supplementary Structural Test Program .(SSTP), (Reference 2). In addition to panel
evaluation, support components for the panels were designed, fabricated, and tested,
to demonstrate their design feasibility and reuse capability.
2-5
MCDONNELL DOUOLAS ASOSTrOAUTICSr COAM A PY- RAS
PPR EDICTION OF CREEP IN PHASE I NAS-1-11774
METALLIC TPS PANELS SUMMARY REPORT
MATERIAL RANGE TEMPERATURE
RENE'41 (11720 AGED); 700oK-11440 K
L-605 1144oK-12550 K
TD-Ni-Cr 1255oK-14780K
COLUMBIUM (FS-85) 1478oK-16440 K
RERADIATIVE TPS PANEL MATERIALS
-CARBON/CARBON
NICKEL SUPERALLOY SHINGLES UPPERCOLUIBIUM CHINE 5 SURFACES
SCOLUMBIUM , ' LOWERSHINGLES SURFACES
TITANIUM NICKEL'SHINGLES SUPERALLOY
TITANIUM HOT STRUCTUREHOT.
STRUCTUIREi
NICKEL SUPERALLOY SHINGLES
MATERIAL AREA USED S
E ; CARBON/CARBON 5.3 INCONEL718-SHINGLES 2.42
-COLUABIUM (FS-85) 14.2 RENE'41-HOT STRUCTURE 4.65
II HASTELLOY X SHINGLES 22.6 Ti SHINGLES 638
SRENE'41-SHINGLES 2.15 [-- Ti HOT STRUCTURE 42.3
TOTAL 100.00
FIGURE 2-7 TYPICAL SHUTTLE METALLIC THERMAL PROTECTION SYSTEM
2-6
MCDONNELL DOUGLAS ASTRONAUTICS COMPANV - EAST
' PREDICTION OF CREEP IN PHASE I, NAS-1-11774METALLIC TPS PANELS SUMMARY REPORT
TABLE 2-1MATERIAL PROPERTY COMPARISON
ULTIMATE! YIELDCLASS DENSITY STRENGTH: STRENGTH MODULUS(TEMPERATURE MATERIAL px 10- 3 FTU MPa FTyMPa' E GPaUSE RANGE oK) kg/m 3 T (RT)
(RT) (RT)
6AI-4VTITANIUM 4.43 1103 1000 110.3TITANIUM
TITANIUM 8A1-1 -V-37 100020.7ALLOYS TITANIUM 4.37 1000
(590-811)6Ai-2Sn-4Zr-2Mo(TRIPLEXANNEALED) 4.54 1117 1027 110.3TITANIUM
RENE'41(1394 0K SOLN ,8.25 965 689 217.9
NICKEL 11440K AGE)BASESUPERALLOYS HASTELLOY-X 8.22 758 345 197.2(811-1255)
INCONEL 718 8.22 1241 1034 204.1
COBALT L-605 9.13 896 365 235.8BASESUPPERALLOYS(1144-1255) HAYNES 188 9.22 862 379 231.0
DISPERSIONSTRENGTH ENEDSTRENGTENED TD-Ni-Cr 8.44 689 448 140.7ALLOYS(1255-1500)
2-7
MCDONNELL DOUGLAS ASTRONAUTrICS COMPIaNYA . WAST
'-'PREDICTION OF CREEP IN PHASE I NAS-1-11774
' METALLIC TPS PANELS SUMMARY REPORT
There are a variety of heat treatments available for Rene' 41, each maximizing
given property. For example, the 13390 K solution treatment, followed by an age at
10330 K, gives Rene' 41 the highest tensile strength compared to other Rene' 41 heat
treatments but provides lower rupture strength than other heat treatments and limits
reuse to below 10330K (the aging temperature). For good stress-rupture strength, a
solution treatment of 1450*K followed by an age at 11720K is recommended. However,
this heat treatment tends to increase the materials sensitivity to strain-age crack-
ing during post weld heat treatments. A third heat treatment, which has reduced sus-
ceptibility to strain-age cracking, involves solution treating at 13940K and aging at
11720 K. Creep properties achieved with the 13940K solution closely approach the pro-
perties obtained with the 1450*K solution treatment and the material is not as crack
sensitive (References 8 and 9). Because of the better crack resistance and dimensional
stability, the 13940K solution and the 1172
0 K age heat treatment was the heat treatment
used on the Rene' 41 panels in the SSTP program and on in-house studies of cyclic
creep, (References 2 and 4), and is the heat treatment selected for use on this program.
The cobalt base alloy selected was L605. This material was also used in fab-
rication and evaluation of full scale TPS panels in the Reference 2 program.
At the time of selection another cobalt base alloy, Haynes 188, was considered,
which has properties similar to L605 but is more oxidation resistant above 12750K
than L605. It was not selected because there were no known large panel tests which
could be analyzed in the third phase of .this program.
A variety of dispersioned strengthened alloys exist ranging from the iron base
alloys DH242 and GE1541, to the nickel base alloys Inconel 853, TDNiCr, and TDNiCrA1.
However, above 13660 K only TDNiCr and TDNiCrAl possess the strength and oxidation
resistance necessary for consideration in Space Shuttle TPS. TDNICr was therefore
selected because it has been developed to the point where it can be considered
commercially available, and was also immediately available from an ongoing NASA
2-8
MCDONNELL DOU9 LA S AeSTRONAUAICS COMdWANVY - EAST
PREDICTION OF CREEP IN PHASE-I NAS-1-11774J"'"METALLIC TPS PANELS SUMMARY REPORT
program (Reference 10).
In addition, a program to manufacture and test full scale TDNiCr panels
(Reference 11) allowed data for prediction verification under Phase III of the program.
2.3 SURVEY OF LITERATURE
At the start of this program a search was performed to gather available creep
data for thin gage sheet material, in order to establish a reference data base for
the four alloys being studied. As part of this survey the following sources were
consulted:
o NASA Scientific and Technical Information Facility.
o Defense Metals Information Center, Battelle Memorial Institute.
o McDonnell Douglas Research and Engineering Library.
o Material vendors, research laboratories, airframe and jet turbine manufactur-
ers and others believed to be active in creep studies.
Fifty literature (Appendix B) sources out of approximately 600 dating from
January 1962 to July 1972 were reviewed in detail.
This search revealed that most of the creep data was inadequate for establish-
ing a data base. For example, much of the data was developed on rod and bar
specimens rather than sheet or strip specimens. These data were rejected because
the methods for manufacturing bar are different from those used to produce sheet.
There were, however, a few sources that presented enough detailed information,
such as lot number, test direction, gauge, and plots or tabulation of strains vs
time to establish a reasonable data base. These sources consisted of Reference (12)
for Ti-6Al-4V, References (13) and (14) for Rene' 41, Reference (15) for L605,
and References (16) to (21) for TDNiCr.
2-9
WMCCDONNELL DOUOLAS ASTRONAUTICS COAtPANV - EAST
'-P REDICTION OF CREEP IN PHASE I NAS-1-11774METALLIC TPS PANELS SUMMARY REPORT
The Ti-6Al-4V reference contained data generated on sheet produced by two
separate manufacturers and tested by two laboratories. One set of data was obtained
from sheets 0.160 cm in thickness, manufactured by Mallory Sharon Titanium Company
(now Reactive Metals Inc.) and tested by Joliet Metallurgical Laboratories.
The second set of data was obtained from sheets 0.102 and 0.160 cm, manu-
factured by Titanium Metals Corporation of America (TIMET), and tested by Metcut
Research Associates. These data were for approximately 120 creep tests at tempera-
tures ranging from 589 to 811*K.
The heat treatment selected for Rene' 41 is relatively new (solution treat at
13940K and age at 1172 0K) and as a result the literature survey only produced two
references. Reference (13) consisted of 10 creep tests performed on 0.127 cm thick
material while Reference (14) contained 24 tests performed on 0.020 cm thick material.
These two references had data for tests performed over the temperature range of 922
to 12550K.
The reference for L605 (15) contained data from approximately 52 creep tests
performed on sheet ranging in thickness from 0.013 to 0.203 cm in the temperature
range of 922 to 12550K.
TDNiCr had the largest number of sources available to establish a data base
for a dispersion strengthened alloy (Reference 16 to 21). These references con-
tained data performed on sheet ranging in thickness from .038 to .152 cm in the
temperature range of 1033 to 1477*K.
2.4 PROCUREMENT OF MATERIALS
Past studies have shown that the weight of the TPS is dictated by minimum gage
limits. Therefore, the baseline material gage selected for testing was thinnest sheet
available of approximately .025 cm thickness (.025 for L605, .031 for titanium, .025 for
TDNiCr, and .027 for Rene' 41). Thicker gage sheet (.064 for L605, .056 for titanium,
2-10
MCDOPNNLL DOUGLAS ASTROAITWA CS CO MPPAV P - AST
RnEDICTION OF CREEP IN PHASE I NAS-1--11774METALLIC TPS PANELS SUMMARY REPORT
.051 for TDNiCr, and .054 for Rene' 41) was also obtained for each of the four alloys
for use in comparison testing for gage effects and for application in TPS concept
fabrication during Phase II.
To ensure that the material was representative of current technology, Rene' 41,
L605, and Ti-6Al-4V sheet were procured to existing AMS or Military specifications.
TDNiCr, not available commercially, was obtained from NASA. This material was pro-
duced for NASA's Lewis Research Center by Fansteel Inc., under NASA Contract
NAS-3-13490. In addition, for each alloy, all material of the same gage was procured
from one heat of material. This eliminated the possibility of chemistry and/or
property variation in different heats of material from influencing the creep tests.
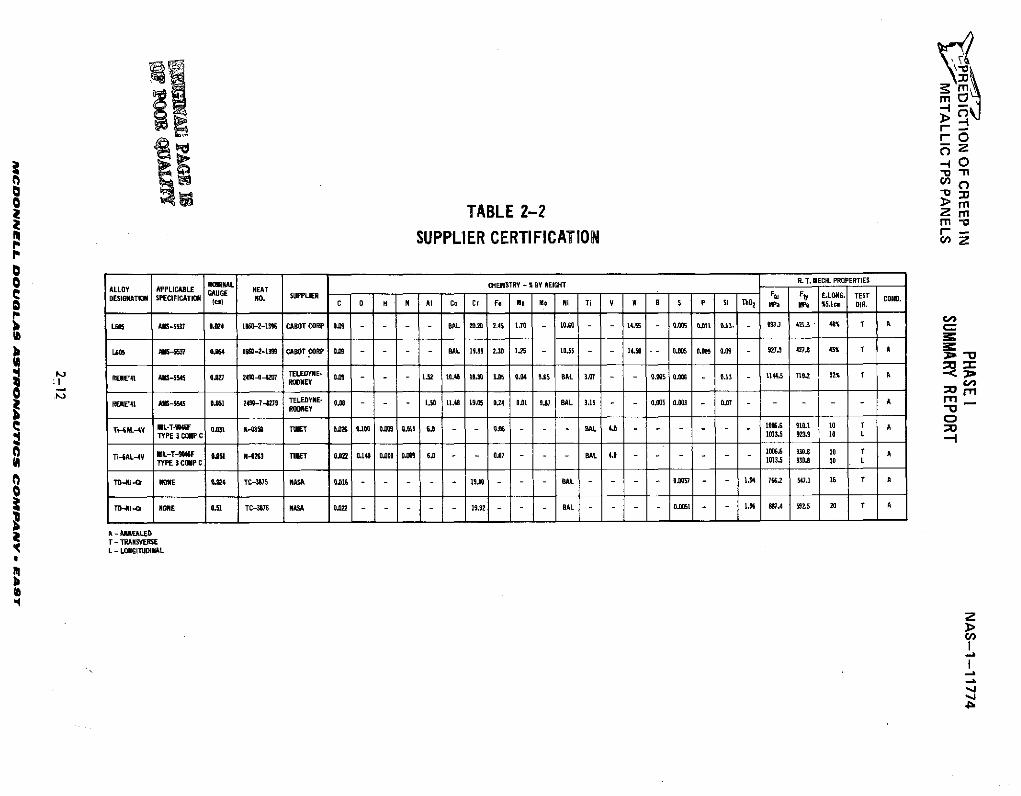
Summarized in Table 2-2 are the supplier certifications and purchase specifica-
tions of materials procured.
2.5 SELECTION OF CREEP SPECIMEN CONFIGURATION
Because both steady-state and cyclic testing were conducted on tensile specimens
in this phase of the program, selection of specimen geometry required consideration
of both types of test furnaces and measurement requirements. The same specimen
geometry was used for both steady-state and cyclic tests to eliminate any possible
variation in creep response due to specimen geometry.
The measurement of relative movement of scribe marks on a platinum slide rule
attached to the creep test specimen is an accurate method applicable in steady-
state testing where the furnace contains view-ports for continual readout of
creep strains without distrubing the specimen. This approach does not require
specimen tabs. However, in cyclic tests, where elastic loads are removed and
reapplied, slide rule buckling or slippage can result in inaccurate creep measure-
ments. For this type of testing the use of scribe marks on the specimen, read
with a measuring microscope, are considered to provide a more reliable approach.
S2-11
rAcoPo eLjL DoucGAs ASTroNAUIrs co mAy . EAsT
moA-O
-4O
rn 0
m -VSUPPLIER CERTIFICATION -
ALLOY APPLICABLE OMINAL HEAT CHEMISTRY - % BY WEIGHT R.T. MECH. PROPERTIES
DESIGNATION SPECIFICATION GAUGE NO. SUPPUER Flu Fy E.LONG. TEST COND.() C 0 H N Al Co Cr Fe Mn BO Ni Ti V W B S P Si ThO2 MPa MPa /5.1 m DIR.
L605 AMS-57 0.024 1860-2-1395 CABOT CORP 0.09 - - - - SAL 20.20 2.45 .70 - t0.0 - - 14.55 - 0.005 0.011 0.13. - 8973.7 421.3 49% T A
L05 ANS-557 0.064 1860-2-1399 CABOTCORP 0.09 - - - - BAL 19.95 2.30 1.25 10.55 - - 14.50 -- 0.05 0.005 0.09 - 927.3 427. 45% T A M
REETELEDY A-555 0.0NE 0.9 - - - 1.52 10.40 10.30 13.5 0.4 9.65 BAL 3.07 - - 0.0 6 . - 0.13 - 1144.5 710.2 32% T AoREE- -A--5545 am- -290-0 -2 RODNEY -
RENE'41 AS-5545 0.051 2490-7-8219 TELEDYNE- 0.08 1.50 11.48 19.05 0.24 0.01 9.87 BAL 3.15 - - 0.005 0.003 - 0.07 - - - - - A
TiE4AL-4V MLT4F Q0.01 #-4058 TIIET OAS 0.100 00 0.011 6, - - . - - - AL 4.0 - - -- 10.6 01.1 00 T ASTYPE 3 COPC 1013.5 923.9 10 L
Ti-6AL-4V IL-T-0F 051 N-0263 TIET 0.22 0.140 0.010 0.009 6.0 - - 0.07 - BAL 4.0 1006.6 30.8 10 T ATYPE 3CIOP C 1013.5 930.8 10 L
N TDN-CI NONE 0.024 TC-3775 NASA 0.016 - -- - 19.0 - - - BAL - - - - 0.0057 - - 1.94 7665.2 547.1 1 T A
TO-Nti-,- NONE 0.51 TC-3876 NASA 0.022 - - - - - 19.92 - - - BAL - - 0.0051 - - 1.96 887.4 592.5 20 T A
A - ANNEALEDT - TRANSVERSEL - LONGITUDINAL
Z
I
-a
WP--REDICTION OF CREEP IN PHASE I NAS-1-11774METALLIC TPS PANELS SUMMARY REPORT
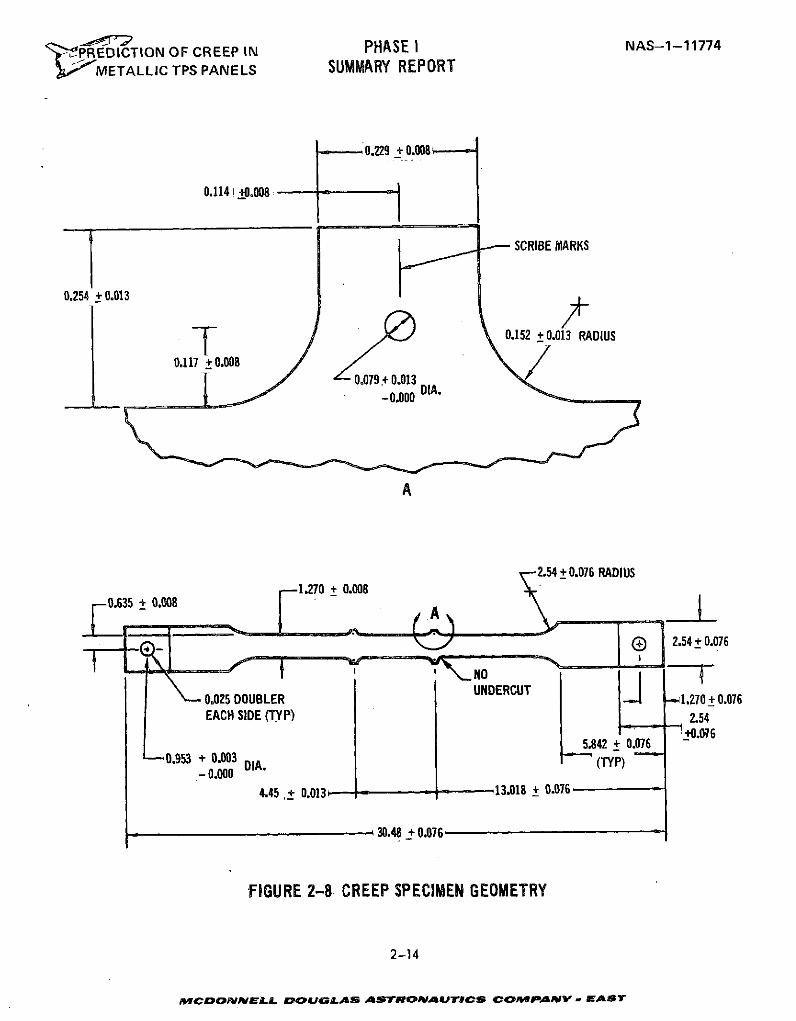
To provide a location for the scribe marks, outside the specimen test zone, tabs
were provided on the specimen as shown in Figure 2-8. Tabs were provided to
eliminate possible adverse effects of locating the scribe marks in the test zone
on the thin gage specimens. Holes were drilled in the tabs on Rene' 41, L605, and
Ti-6Al-4V specimens in an initial effort to utilize holes as a reference point for
creep strain measurements. Because scribe marks were subsequently used for this
purpose, holes were not provided in TDNICr specimens.
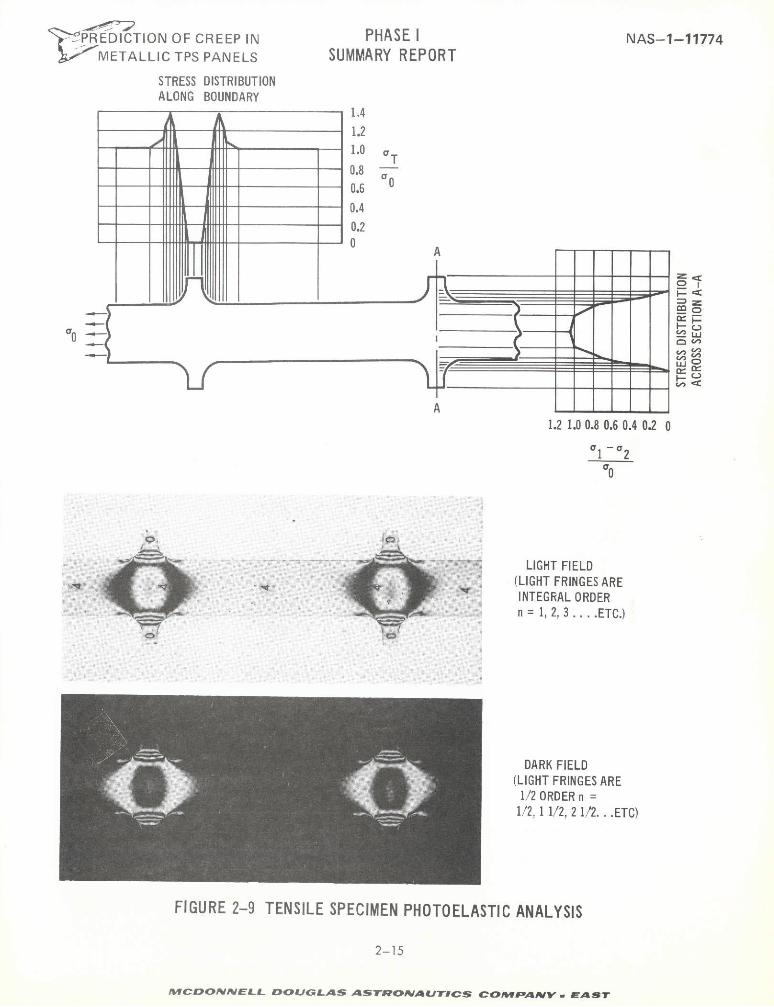
To investigate the effect that tabs and holes have on the stress distribution
in the specimen test zone, both photoelastic and finite element analyses were per-
formed. Results of the photoelastic analysis for a typical tab geometry are
presented in Figure 2-9. Stress distributions, based on analyses of the fringe
patterns,are shown along the free boundary where a uniaxial (tangent to the
boundary) stress exists and across the specimen at the tab centerline where a
biaxial stress state exists. Although the distribution across the specimen at the
tab centerline is the difference in principal stresses, it approximates the longi-
tudinal specimen stress distribution since stresses in the transverse direction
are relatively small. A stress concentration factor of approximately 1.4 is
shown to exist along the specimen boundary at the tab tangency point.
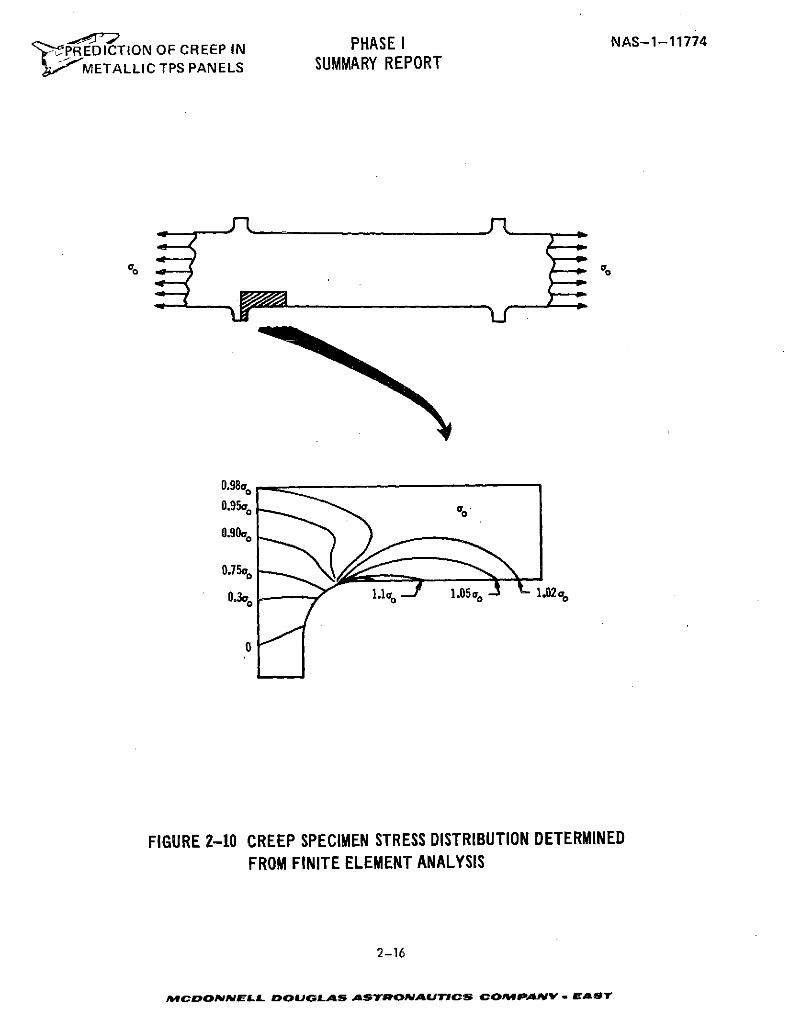
Finite element analysis was conducted using quadrilateral and triangular
membrane plates to model the specimen for the NASTRAN.Finite Element Computer
Program. The resulting stress distribution based on this analysis is shown in
Figure 2-10. Approximately seven percent of the specimen test zone area has greater
than two percent variation from the uniform stress and approximately four percent
of the specimen test zone area has greater than a five percent stress variation.
The stress concentration factor of 1.4 at the tangent point of the specimen tab
was substantiated in this analysis. Comparison of results for a specimen with a
2-13
-,PREDICTION OF CREEP IN PHASE I NAS-1-11774
METALLIC TPS PANELS SUMMARY REPORT
0.229 + 0.008
0.114 _-H.008
S-- SCRIBE MARKS
0.254 + 0.013
T 0.152 +0.013 RADIUS
0.117 + 0.008 /S0.079 + 0.013 DIA.
A
2.54 + 0.076 RADIUS1.270+ 0.008
0.635 + 0.008 (.
- 4 ( 2.54 + 0.076
0.025 DOUBLER UNDERCUT 1.270 + 0.076EACH SIDE (TYP) 2.54
+0.0765.842 ± 0.076 -. 6
-0.953 + 0.003 DIA. (TYP)- 0.000
4.45 ,_+ 0.013- .-- -_ - 13.018 + 0.076
30.48 + 0.076
FIGURE 2-8 CREEP SPECIMEN GEOMETRY
2-14
MCDONNELL DOUGLAS ASTROLAIUTICS COMPANY - EAST
P PREDICTION OF CREEP IN PHASE I NAS-1-11774METALLIC TPS PANELS SUMMARY REPORT
STRESS DISTRIBUTIONALONG BOUNDARY
1,4
1.2lll 1.0 a
- 0.8- 0.6 0
- 0.40.2-0 A
1 - a 2
CIO
LIGHT FIELD(LIGHT FRINGES ARE
SINTEGRAL ORDER:n = 1, 2, 3 .... ETC.)
DARK FIELDS(LIGHT FRINGES ARE
1/2 ORDER n =
1/2, 1 1/2, 2 1/2...ETC)
FIGURE 2-9 TENSILE SPECIMEN PHOTOELASTIC ANALYSIS
2-15
4ccp~m4Af a
' "PREDICTION OF CREEP IN PHASE I NAS-1-11774METALLIC TPS PANELS SUMMARY REPORT
0.98aa
0.95o o.
0.90,
0.750
0.3 1.10 1.05o 1.02%
0
FIGURE 2-10 CREEP SPECIMEN STRESS DISTRIBUTION DETERMINEDFROM FINITE ELEMENT ANALYSIS
2-16
MCDONNELL DOUGLAS ASTRONAUTICS COMPANY . EAST
--- PR'EDICTION OF CREEP IN PHASE I NAS-1-11774~ - METALLIC TPS PANELS SUMMARY REPORT
hole in the tab with those for a specimen without the hole indicated that the hole
(as defined in Figure 2-8) had a negligible effect on the resulting stress distri-
bution.
The presence of the hole was shown to relieve the stress concentration factor
due to the tab by impeding development of force gradients in the tab (Reference 22).
However, for the geometry used, this effect was minimal (approximately 1%). There-
fore, no further effort was made to optimize the hole location or size.
Minimizing tab width and tab fillet radius also reduces disturbances in the
uniform stress distribution. The 0.229 cm tab width and 0.152 cm fillet radius
used in the specimen design were considered minimums based on possibilities of
bending the tab during handling.
The selected length of the specimens was 4.45 cm, which allowed creep measure-
ments to be accomplished using a Unitron measuring microscope having a 5.08 cm
field of travel. Doublers at the loading holes, shown in Figure 2-8, were provided
to distribute bearing loads. Machining tolerances were based on McDonnell Douglas
Standard tensile specimen design designated 6M118.
2.6 CREEP SPECIMEN MACHINING AND IDENTIFICATION
Prior to machining the tensile specimens, blanks were sheared from their
respective sheets. These blanks which were 2.54 X 30.48 cm were then impression
stamped at the ends with an identification code to insure proper specimen control.
The code used is as follows. The first letter indicates the alloy, hence: L = L605,
R = Rene' 41, T = Ti-6Al-4V, and TD = TDNiCr. The numbers start from 1 and identify
an individual specimen. The last letter identifies the direction of rolling:
L = longitudinal (parallel to the direction of rolling); T = transverse (normal
to the direction of rolling). Therefore, specimen L50L is a L605 sheet specimen
2-17
MCDONNELL OOUGLAS ASTROvnAurCS COMPANY . EAST
'PREDICTION OF CREEP IN PHASE I NAS-1-11774
METALLIC TPS PANELS SUMMARY REPORT
number 50 that was taken from the longitudinal direction of the sheet. Specimens
machined from the thicker gage sheet received the first ten numbers (01 thru 10)
for each of the alloys.
After identification the strips were stacked and sandwiched between 2-2.54 cm
thick aluminum plates (one pack per alloy). The packs were then drilled, bolted
together, and machined to the dimensions shown in Figure 2-8. Specimen packs were
separated after machining, individually deburred and the tab holes (reference
Section 2.5) were drilled. An attempt was made to drill .040 cm tab holes. How-
ever, difficulty was encountered because the small drill could not be properly
sharpened to cut through the superalloys without breakage. As a result, the hole
diameter was increased to .079 cm. Doublers were spotwelded to specimens and
specimens were cleaned and inspected to complete preparation for testing.
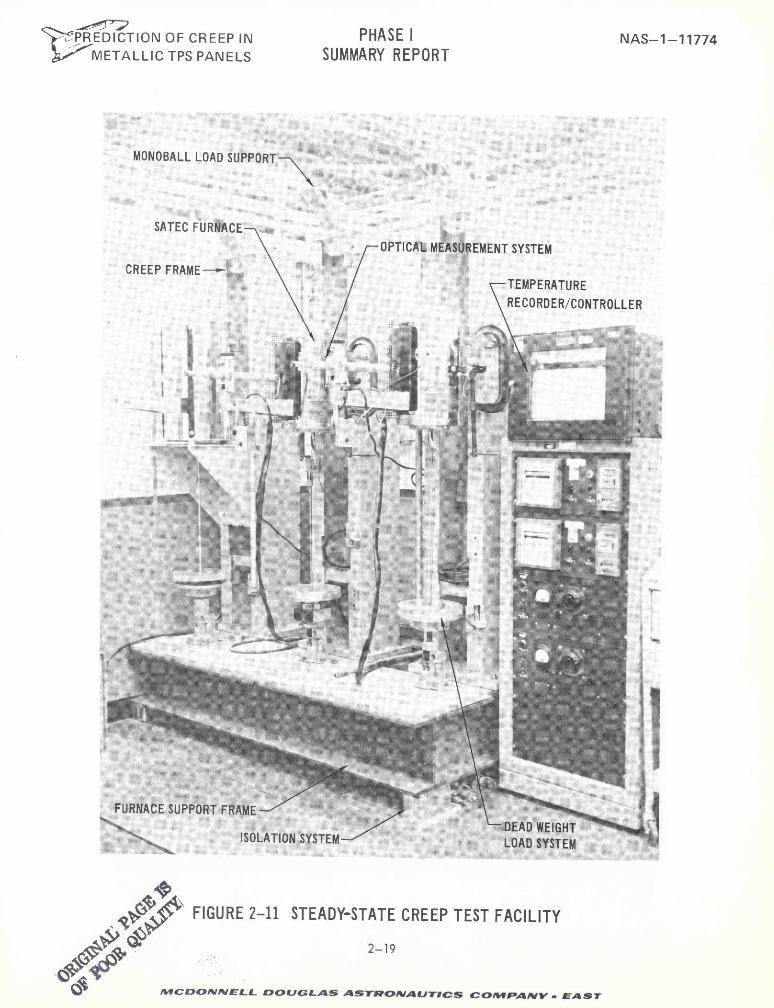
2.7 STEADY STATE TESTING PROCEDURES
2.7.1 TEST EQUIPMENT AND OPERATION
Steady-state tests were conducted using three Satec 7.62 cm (3 inch) diameter
tube furnaces mounted on specially built creep frames. This test facility is shown
in Figure 2-11.
2.7.1.1 Load Train. The creep frames were equipped with a self-aligning hemispherical
seated bearing (Monobail) at the load support point, to minimize misalignment of the
load train. The load train extended from the Monoball support through the furnace to a
dead weight loading platform below the furnace. Test loads were provided by weight
stacked on these platforms. The platform and weights were supported by a hydraulic
jack which was slowly retracted to apply the load to the specimen.
2-18
MCDONNELL DOUGLAS ASTRONAUTICS COIMPRANVY EAST
'PREDICTION OF CREEP IN PHASE I NAS-1-11774METALLIC TPS PANELS SUMMARY REPORT
MONOBALL LOAD SUPPORT
SATEC FURINACEOPTICAL MEASUREMENT SYSTEM
CREEP FRAME TEMPERATURE
RECORDER/CONTROLLER
-l ii 1
FURNACESUPPORTFRAME
ISOLATION SYSTEM LOAD SYSTEM
FIGURE 2-11 STEADY-STATE CREEP TEST FACILITY
, 2-19
IMCDONNELL DOUGLAS ASTRONAUTICS COMPANtV EASTr
,PREDICTION OF CREEP IN PHASE I NAS-1-11774
METALLIC TPS PANELS SUMMARY REPORT
2.7.1.2 Vibration Isolation. The creep frames were mounted on a support base as
shown in Figure 2-11. In order to minimize possible vibration effects on the load
train due to adjacent machinery, an isolation system was provided between this support
base and the laboratory floor. This system consisted of MB Isomode vibration pads,
piled to a compressed height of approximately 7 cm. Aluminum frames (boxes) were
utilized to provide lateral support for the pads. Pad height was established to
minimize response of the system. Seismometer readings taken showed that this system
reduced response to approximately 34% of that without the system. Based on force
transducer readings taken in the specimen load train, variations in applied load on
the specimen caused by these vibrations was shown to be (<0.5%).
2.7.1.3 Optical Measuring System. Optical systems,for measuring strains, were
mounted on brackets attached to the Satec Furnaces. Discussion of this system is
presented in Section 2.7.2.
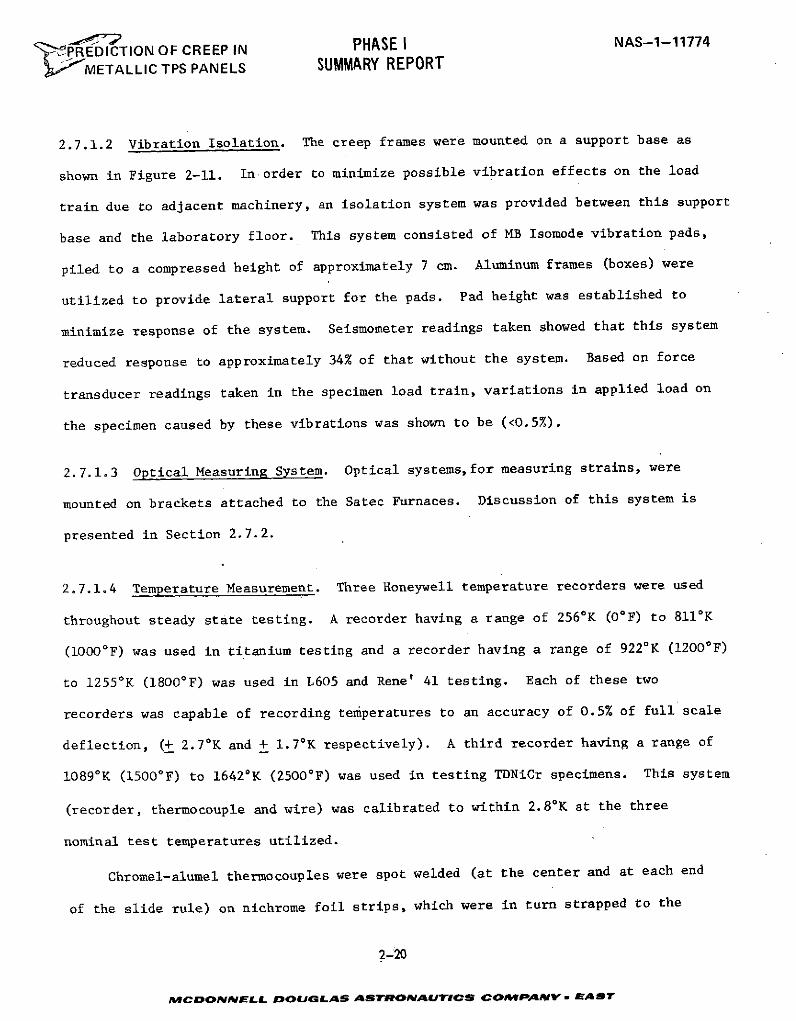
2.7.1.4 Temperature Measurement. Three Honeywell temperature recorders were used
throughout steady state testing. A recorder having a range of 2560K (00F) to 8110K
(1000°F) was used in titanium testing and a recorder having a range of 922*K (12000F)
to 1255 0K (18000 F) was used in L605 and Rene' 41 testing. Each of these two
recorders was capable of recording temperatures to an accuracy of 0.5% of full scale
deflection, (+ 2.70 K and + 1.70K respectively). A third recorder having a range of
10890K (15000F) to 16420K (25000F) was used in testing TDNiCr specimens. This system
(recorder, thermocouple and wire) was calibrated to within 2.80K at the three
nominal test temperatures utilized.
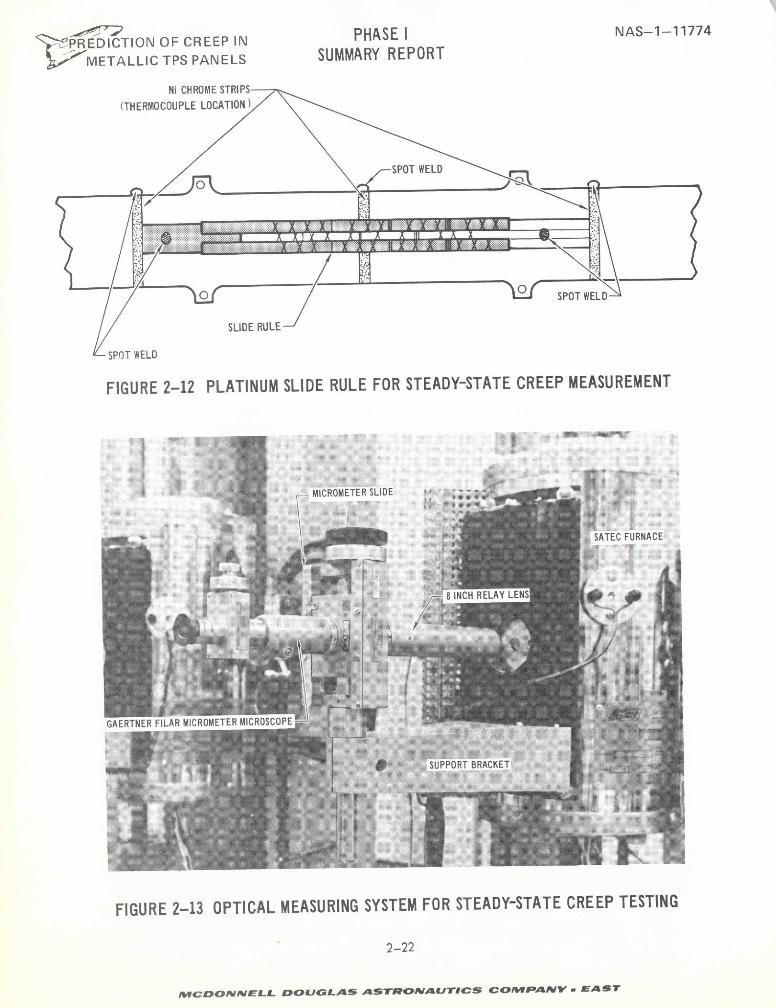
Chromel-alumel thermocouples were spot welded (at the center and at each end
of the slide rule) on nichrome foil strips, which were in turn strapped to the
2-20
fMCDONNELL DOUGLAS ASTRONAUTICS COMPANY- EAST
PrEDICTION OF CREEP IN PHASE I NAS-1-11774METALLIC TPS PANELS SUMMARY REPORT
specimen (see Figure 2-12) to monitor temperature during testing. For each test the
previous thermocouple bead was removed and a new bead and nichrome strip were made.
In addition to the chromel-alumel thermocouples, Pt-Pt-1O% Rh thermocouples were
used for the TDNiCr tests.
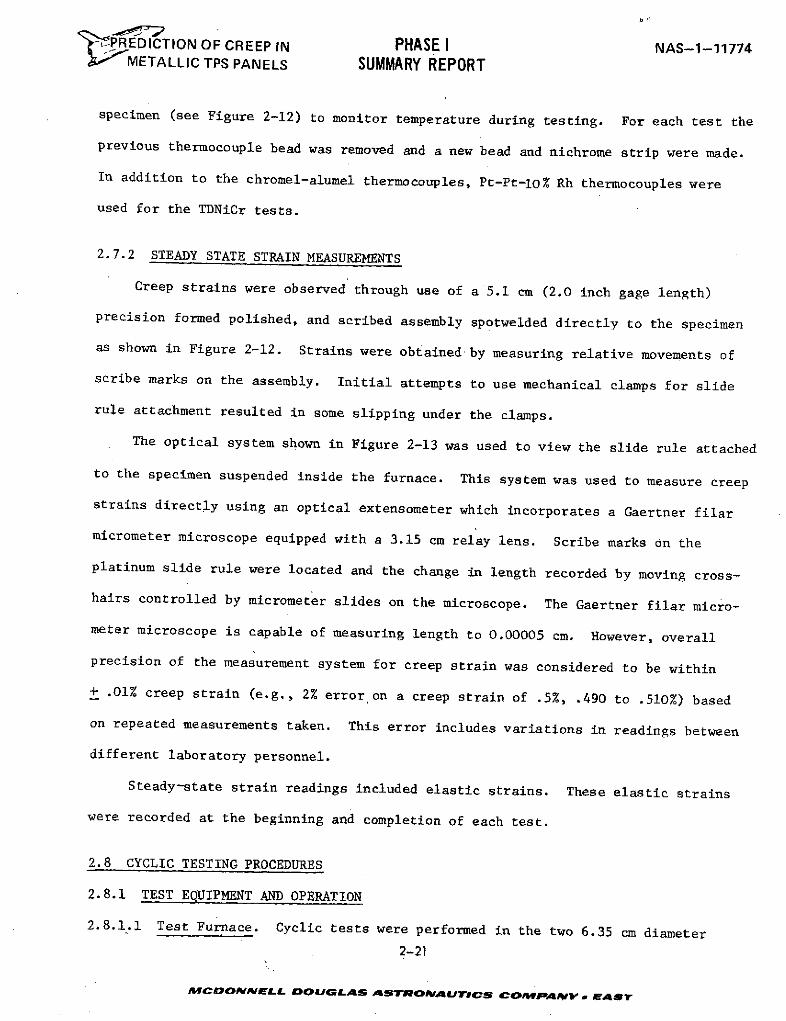
2.7.2 STEADY STATE STRAIN MEASUREMENTS
Creep strains were observed through use of a 5.1 cm (2.0 inch gage length)
precision formed polished, and scribed assembly spotwelded directly to the specimen
as shown in Figure 2-12. Strains were obtained by measuring relative movements of
scribe marks on the assembly. Initial attempts to use mechanical clamps for slide
rule attachment resulted in some slipping under the clamps.
The optical system shown in Figure 2-13 was used to view the slide rule attached
to the specimen suspended inside the furnace. This system was used to measure creep
strains directly using an optical extensometer which incorporates a Gaertner filar
micrometer microscope equipped with a 3.15 cm relay lens. Scribe marks on the
platinum slide rule were located and the change in length recorded by moving cross-
hairs controlled by micrometer slides on the microscope. The Gaertner filar micro-
meter microscope is capable of measuring length to 0.00005 cm. However, overall
precision of the measurement system for creep strain was considered to be within
+ .01% creep strain (e.g., 2% error on a creep strain of .5%, .490 to .510%) based
on repeated measurements taken. This error includes variations in readings between
different laboratory personnel.
Steady-state strain readings included elastic strains. These elastic strains
were recorded at the beginning and completion of each test.
2.8 CYCLIC TESTING PROCEDURES
2.8.1 TEST EQUIPMENT AND OPERATION
2.8.1.1 Test Furnace. Cyclic tests were performed in the two 6.35 cm diameter
2-21
MCDONNELL DOUGLAS ASTRONAUTICS COMPANY - EAST
~'PREDICTION OF CREEP IN PHASE I NAS-1-11774
METALLIC TPS PANELS SUMMARY REPORT
Ni CHROME STRIPS
(THERMOCOUPLE LOCATION)
SPOT WELD
( - SPOT WELD
SLIDE RULE
SPOT WELD
FIGURE 2-12 PLATINUM SLIDE RULE FOR STEADY-STATE CREEP MEASUREMENT
MICROMETER SLIDE :-
*SATEC FURNACE
8 INCH RELAY LENS
GAERTNER FILAR MICROMETER MICROSCOPE
.- SUPPORT BRACKET
FIGURE 2-13 OPTICAL MEASURING SYSTEM FOR STEADY-STATE CREEP TESTING
2-22
MCDONN.ELL OUGLAS ASTRONAUTICS COMPANV - EAST
"y PREDICTION OF CREEP IN PHASE I NAS-1-11774METALLIC TPS PANELS SUMMARY REPORT
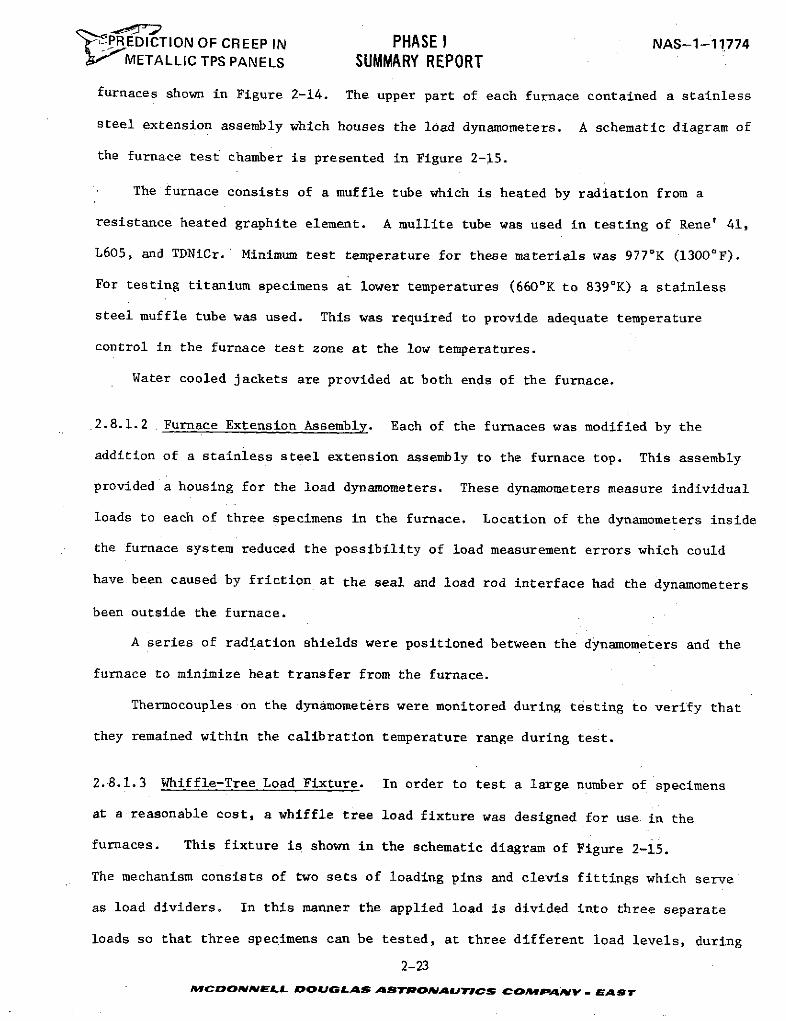
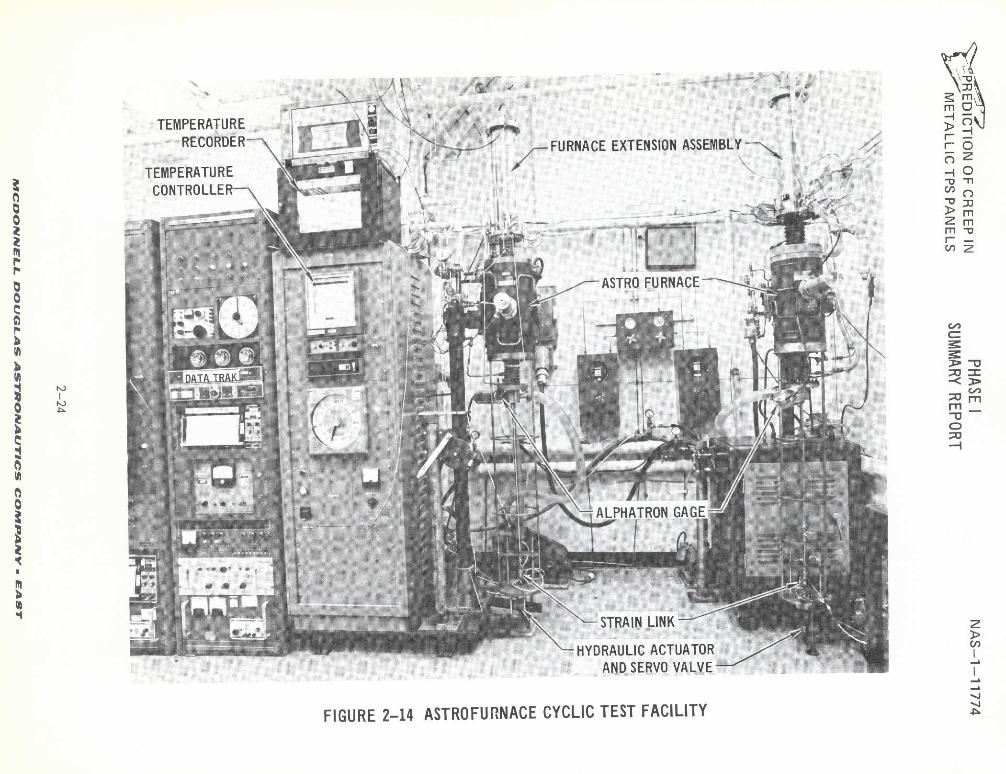
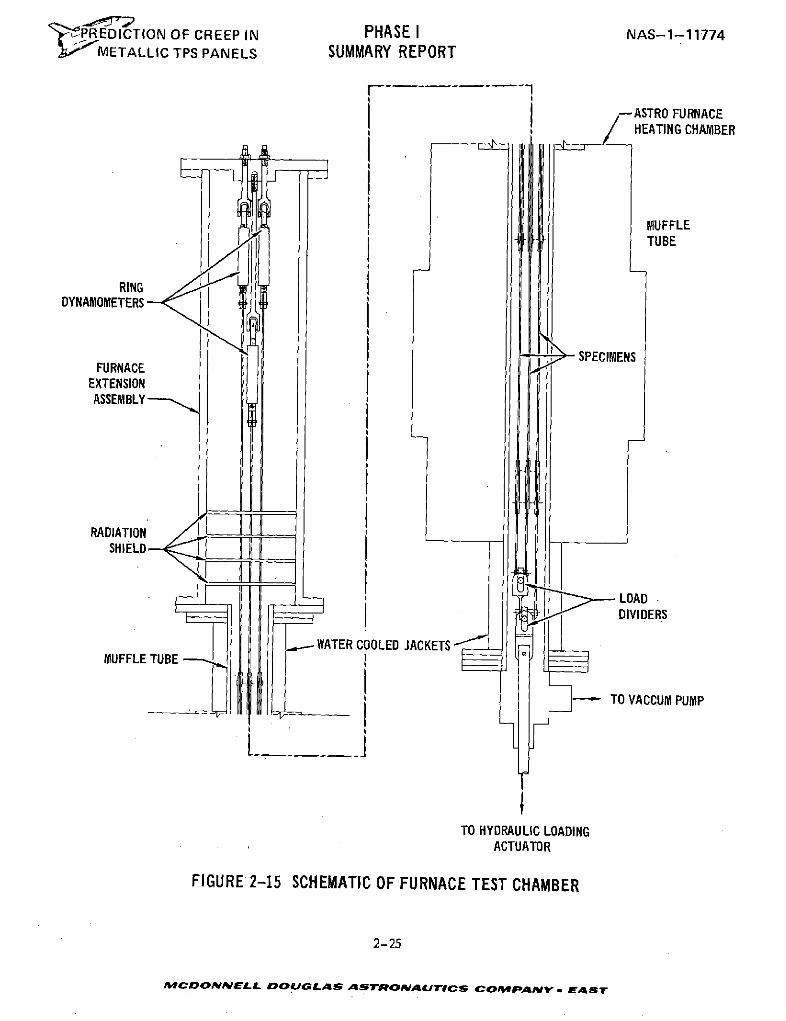
furnaces shown in Figure 2-14. The upper part of each furnace contained a stainless
steel extension assembly which houses the load dynamometers. A schematic diagram of
the furnace test chamber is presented in Figure 2-15.
The furnace consists of a muffle tube which is heated by radiation from a
resistance heated graphite element. A mullite tube was used in testing of Rene' 41,
L605, and TDNiCr.' Minimum test temperature for these materials was 977 0 K (13000F).
For testing titanium specimens at lower temperatures (6600K to 8390K) a stainless
steel muffle tube was used. This was required to provide adequate temperature
control in the furnace test zone at the low temperatures.
Water cooled jackets are provided at both ends of the furnace.
2.8.1.2 Furnace Extension Assembly. Each of the furnaces was modified by the
addition of a stainless steel extension assembly to the furnace top. This assembly
provided a housing for the load dynamometers. These dynamometers measure individual
loads to each of three specimens in the furnace. Location of the dynamometers inside
the furnace system reduced the possibility of load measurement errors which could
have been caused by friction at the seal and load rod interface had the dynamometers
been outside the furnace.
A series of radiation shields were positioned between the dynamometers and the
furnace to minimize heat transfer from the furnace.
Thermocouples on the dynamometers were monitored during testing to verify that
they remained within the calibration temperature range during test.
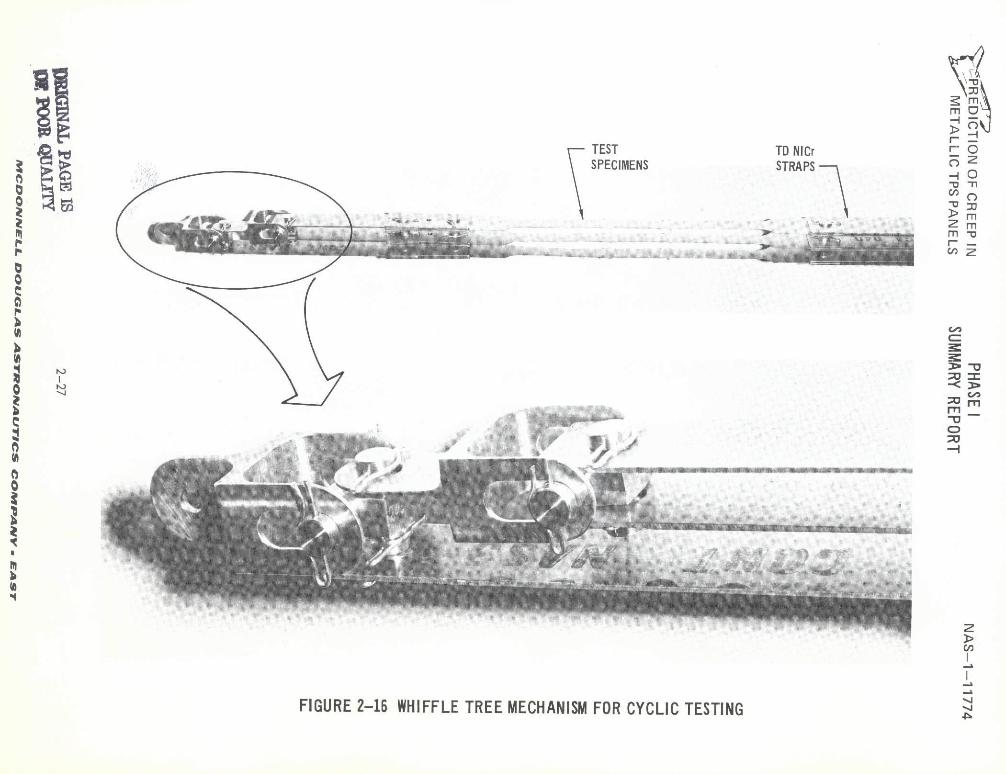
2.8.1.3 Whiffle-Tree Load Fixture. In order to test a large number of specimens
at a reasonable cost, a whiffle tree load fixture was designed for use in the
furnaces. This fixture is shown in the schematic diagram of Figure 2-15.
The mechanism consists of two sets of loading pins and clevis fittings which serve
as load dividers. In this manner the applied load is divided into three separate
loads so that three specimens can be tested, at three different load levels, during
2-23
MCDONNELL DOUGLAS ASTRONAUTICS COMPANY . EAST
TEMPERATURE .NRECORDER --_ FURNACE EXTENSION ASSEMBLY r-
CONTROLLE R-v,,
O Zmm mcn-
ASTRO FURNACE
--u
ALPHATRON GAGE
C
" AND SERVO VALVE "]"
S2-14 ATROFURNACE CYCLIC TET FACILITY
-S
FIGURE 2-14 ASTROFURNACE CYCLIC TEST FACILITY
' PREDICTION OF CREEP IN PHASE I NAS-1-11774METALLIC TPS PANELS SUMMARY REPORT
ASTRO FURNACEHEATING CHAMBER
MUFFLETUBE
RINGDYNAMOMETERS
SPECIMENSFURNACE
EXTENSIONASSEMBLY
RADIATIONSHIELD
LOADDIVIDERS
WATER COOLED JACKETSMUFFLE TUBE
S- TO VACCUM PUMP
TO HYDRAULIC LOADINGACTUATOR
FIGURE 2-15 SCHEMATIC OF FURNACE TEST CHAMBER
2-25
MCDONNELL DOUGLAS ASTRONAUTICS COMPANY - LAST
,:PREDICTION OF CREEP IN PHASE i NAS--"11774
;- METALLIC TPS PANELS SUMMARY REPORT
a single furnace run. Two specimens can be tested during a single furnace run, if
desired, by utilizing only one set of fittings.
Figure 2-16 shows a close-up of the pin and clevis fittings and their relation-
ship to the specimens. By providing several pin fittings with different strap
(specimen) attachment locations, several different load ratios were attained for
use as required in the various tests. The following ratios were used:
1/1.66/2.58
1/1.23/1.44
1/1.37/1.75
1/1.47/1.94
1/1.78/2.00
Variation in specimen loads due to differential specimen strains was found to
be negligible. Adjustment nuts were provided at the top of the furnace to allow
initial alignment of the loading pins. Loads on each specimen were measured
separately by the three load dynamometers provided at the top of the furnace
extension assembly (reference Section 2.8.1.2).
The pin and clevis fittings were made from PH13-8Mo stainless steel alloy.
Loading straps and specimen attachment pins were TDNiCr. A factor of safety of
2.10 with a limit load of 45.4 kg per specimen was used in designing the whiffle
tree and related load train components.
2.8.1.4 Load Measurements. A 1.27 cm diameter stainless steel rod was connected
to the load divider (whiffle tree) mechanism. This rod passed through an "0" ring
vacuum seal and out through the bottom of the furnace where it was connected to a
load cell through a clevis and Monoball. The load cell was connected to a hydraulic
actuator through a second set of clevis and monoballs. Coupled to the actuator was
a hydraulic servo valve. This provided a closed loop load control system with the
electronic load controller. Load-profiles were programmed into a time based analog
programmer (Data Trak) which 2-26
MCDONNELL DOUGLAS ASTRONAUTICS COMPANY" EAST
m 0
TEST TD NICr r- 0SPECIMENS STRAPS C)
-O> Z
Smr*
c
-eluS-In
F
FIGURE 2-16 WHIFFLE TREE MECHANISM FOR CYCLIC TESTING
REDICTION OF CREEP IN PHASE I NAS-1-11774PITEDITIN OF CREEP IN
I- METALLIC TPS PANELS SUMMARY REPORT
sent an electronic signal to the load controller which compared the signal to the
output of the load cell. Variations between the two signals caused the servo valve
to open or close, as required, to adjust the actual load to that of the programmed
load.
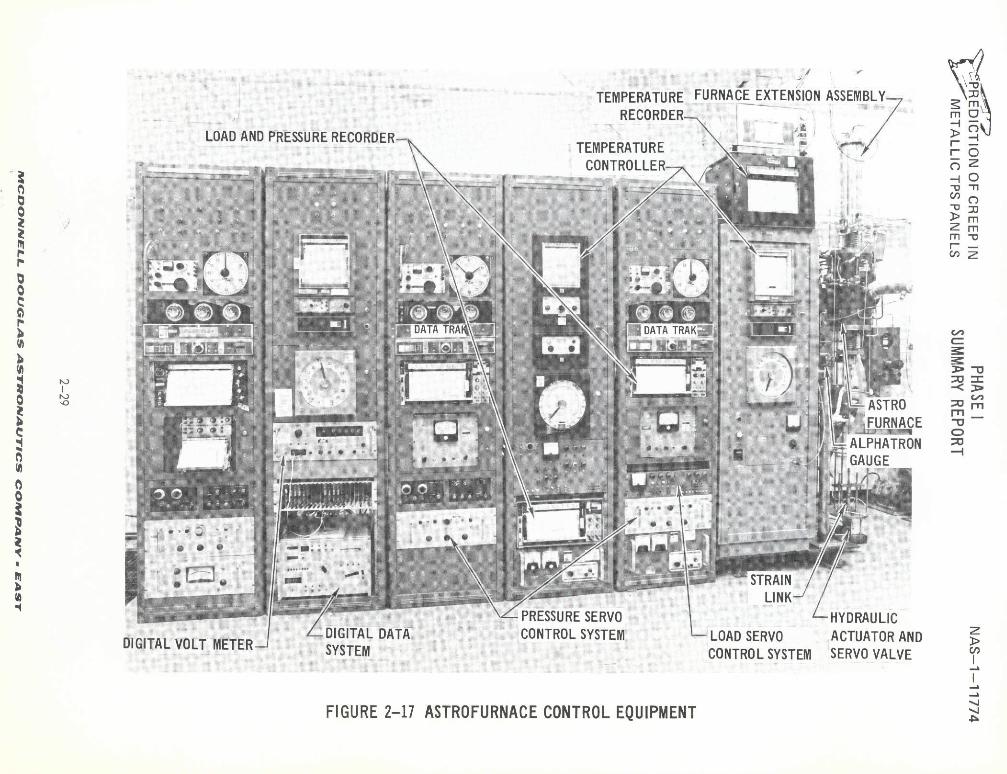
Data acquisition during the cyclic creep testing was obtained from a specially
designed digital data acquisition system. This system contained 50 channels which
were scanned every 50 seconds. The accuracy of this system is + 0.15%. The system
recorded the data on tape, and also contained an 8-character digital printer which
could be used to check the taped data. During testing the digital acquisition system
recorded the outputs from the ring dynamometers and thermocouple positioned on the
dynamometers. Control equipment is shown in Figure 2-17.
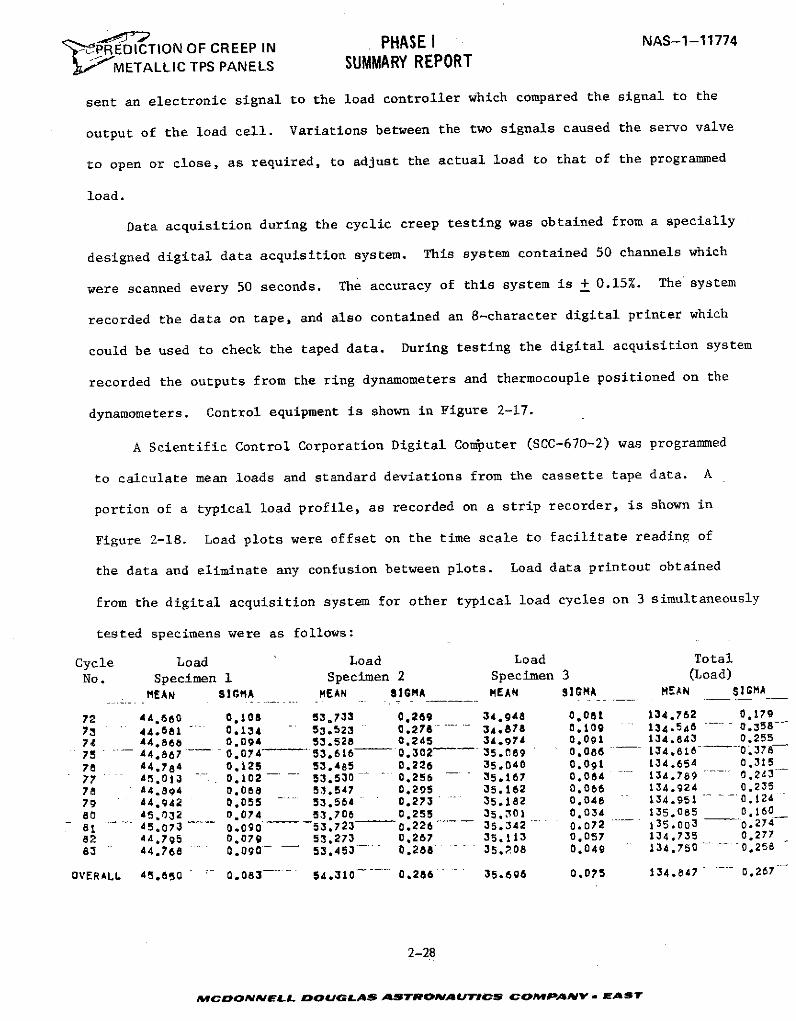
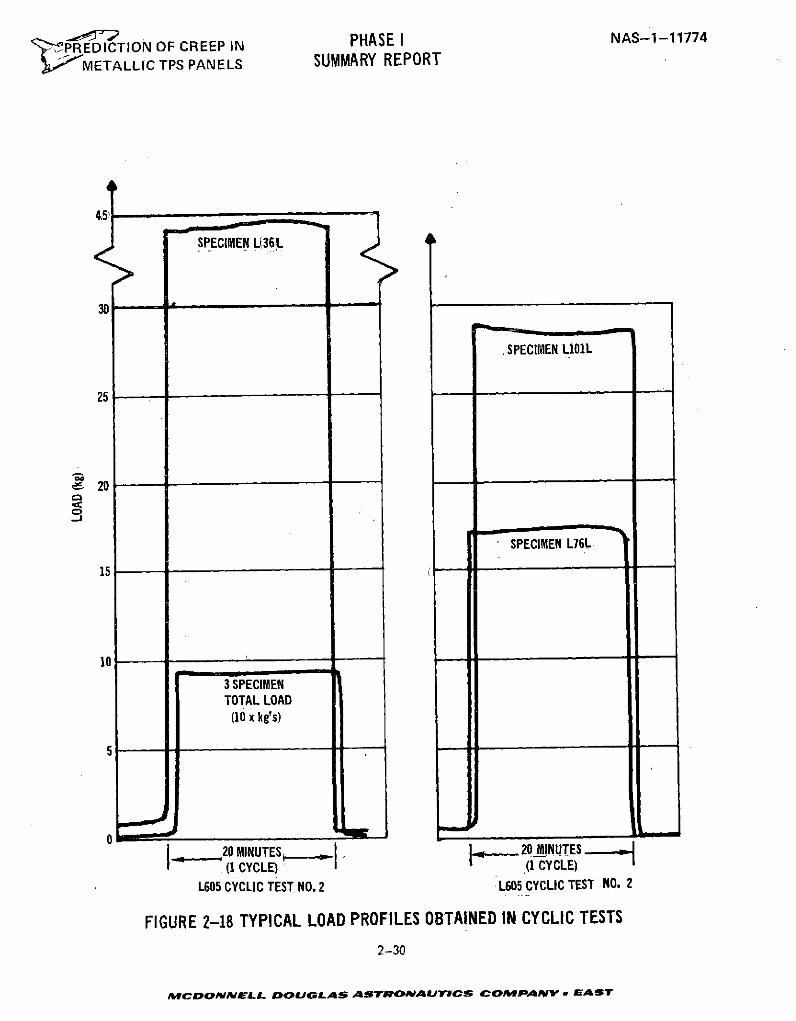
A Scientific Control Corporation Digital Computer (SCC-670-2) was programmed
to calculate mean loads and standard deviations from the cassette tape data. A
portion of a typical load profile, as recorded on a strip recorder, is shown in
Figure 2-18. Load plots were offset on the time scale to facilitate reading of
the data and eliminate any confusion between plots. Load data printout obtained
from the digital acquisition system for other typical load cycles on 3 simultaneously
tested specimens were as follows:
Cycle Load Load Load Total
No. Specimen 1 Specimen 2 Specimen 3 (Load)
MEAN SIGMA MEAN SIGMA MEAN SIGMA MEAN SIGMA
72 44.660 0,108 53,733 0,269 34,948 0.081 134,762 0.179
73 44.681 0,134 53.523 0.278 34,878 0.109 134.546 0.358-74 44.868 0.094 53.528 0.245 34,974 0.091 134.843 0.255
75 44.867 0.074" 53.616- 0.302 . .35.089 0.086 134.816 0.378
78 44.784 0.125 53.485 0.226 35.040 0.091 134.654 0.315
77 45,013 0.102 53.530 0.256 35.167 0.084 134.789 0.243
78 44.894 0.068 53.547 0.295 35.162 0.066 134.924 0.235
79 44.942 0,055 53.564 0.273 35.182 0.048 134.951 . 0.12480 45.032 0.074 53,706 0.255 35,01 0.034 135,085 0.160
81 .......5.073 0.090 53.723 0.226--- 35.342 0.072 135.00 3 -0.27482 44.795 0.079 53.273 0.267 35.113 0.057 134.735 0.277
83 44.768 0.090 - 53.453 . 0.288 35,208 0.049 134.750 . 0.258
OVERALL 45.650 0.083-.... 54.310 -. 0.286 - 35.696 0,075 134.847 0.267
2-28
MaCDONNELL DOUGLAS ASTRONAUTICS COMAPANY - EAST
TEMPERATURE FURNACE EXTENSION ASSEMBLYRECORDER m
LOAD AND PRESSURE RECORDER- TEMPERATURETEMPERATURE
CONTROLLER Ilz0
DATA TRA DATA TRAK t
o N ASTRO Mm
Sw ALPHATRON- GAUGE-
LINK
SYSTEM CONTROL SYSTEM SERVO VALVE
FIGURE 2-17 ASTROFURNACE CONTROL EQUIPMENT
illI " " " " """ r;~I F B :~/! -
',PREDICTION OF CREEP IN PHSE I NA--774
METALLIC TPS PANELS SUMMARY REPORT
SPECIMEN L(36,
.SPECIMEN U01L25
& 20
-J
SPECIMEN L76L
15
10
3 SPECIMENTOTAL LOAD
(10 x kg's)
5
01- 20 MINUTES 20 MINUTES
(I CYCLE) (1 CYCLE)L605 CYCLIC TEST NO. 2 L605 CYCLIC TEST NO. 2
FIGURE 2-18 TYPICAL LOAD PROFILES OBTAINED IN CYCLIC TESTS
2-30
MCDONNELL DOUGLAS ASTRONAUTICS COMPANY - EAST
' PREDICTION OF CREEP IN PHASE I NAS-1-11774METALLIC TPS PANELS SUMMARY REPORT
The mean value of load for each cycle was based on recorded loads at 50 second
intervals across the test profile. An overall mean load and standard were calculated
based on the mean values for each cycle. Average stress-time profiles for actual
trajectory stress history tests were obtained by data averaging loads at common times
in each cycle over the duration of the test. A load of approximately two percent of
maximum load was maintained throughout each cycle to prevent slack in the whiffle
tree mechanism.
2.8.1.5 Temperature Measurement. Within the hot zone of the furnace were two
platinum-platinum-l0% rhodium thermocouples. One of these thermocouples was used to
measure the temperature within the hot zone, while the other controlled the furnace.
Both of these thermocouples were connected to a thermocouple reference junction com-
pensator, which maintained a constant reference to within 0.14'K. From this
compensator the output of the measuring thermocouple was fed to a Honeywell strip
chart recorder (Model #15, 30.48 cm. scale). Prior to testing the temperature
recording system which included thermocouples, reference junction, and Honeywell
strip recorder was calibrated and found to be accurate to within 1.70 K.
The output from the control thermocouple was fed from the reference junction
to a Leeds and Northrup recorder/controller. This controller compared the electrical
signal from the controlling thermocouple to one that was previously programmed into
the Data Trak and adjusted the power input to the furnace to compensate for the
differences in signal. The temperature control was found to be capable of con-
trolling to within 1% of the desired temperature.
Prior to cyclic testing, calibrations were conducted to determine the magnitude
of temperature variations on the specimens. Calibrations were accomplished using
platinum/platinum-lo% rhodium thermocouples spotwelded at the upper tab (location #1
Table 2-3) and at the lower tabs (location #3, Table 2-3). Testing was performed under
a constant pressure of 1.33 Pa and temperature measurements were made immediately
2-31
MCDONNELL DOUGLAS ASTRONAUTICS COMPANV * AST
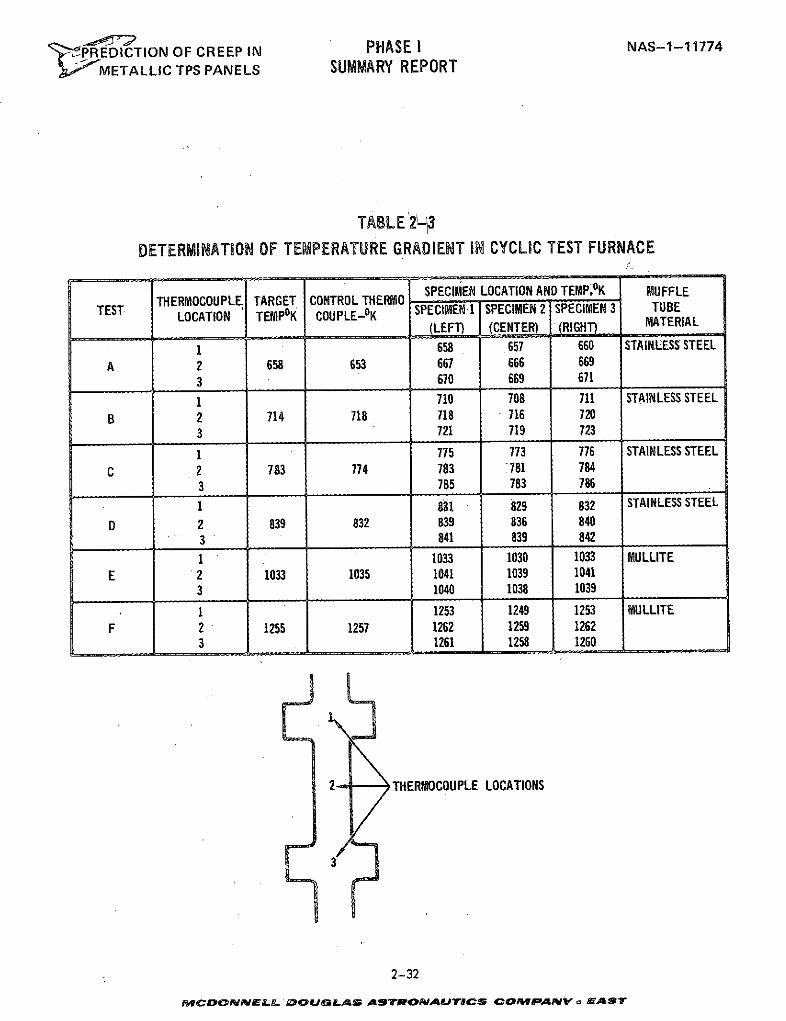
't PREDICTION OF CREEP IN PHASE I NAS-1-11774
METALLIC TPS PANELS SUMMARY REPORT
TABLE 2- 3
DETERMINATION OF TEMPERATURE GRADIENT IN CYCLIC TEST FURNACE
SPECIMEN LOCATION AND TEMP.oK MUFFLETHERMOCOUPLE TARGET CONTROL THERMO
LOCATION TEMPoK COUPLE-OK SPECIMEN 1 SPECIMEN 2 SPECIMEN 3 TUBES(LEFT) (CENTER) (RIGHT) MATERIAL
1 658 657 660 STAINLESS STEELA 2 658 653 667 666 669
3 670 669 671
1 710 708 711 STAINLESS STEELB 2 714 718 718 716 720
3 721 719 723
1 775 773 776 STAINLESS STEELC 2 783 774 783 781 784
3 785 783 786
1 831 829 832 STAINLESS STEEL
D 2 839 832 839 836 8403 841 839 842
1 1033 1030 1033 MULLITEE 2 1033 1035 1041 1039 1041
3 1040 1038 1039
1 1253 1249 1253 MULLITEF 2 1255 1257 1262 1259 1262
3 1261 1258 1260
2 THERMOCOUPLE LOCATIONS
3
2-32
~dfCtDOTFBELL DCOIGDLA.Ad ASirONLdAUT#IBCS CO BAAN , mA S T
PREDICTION OF CREEP IN PHASE I NAS-1-11774METALLIC TPS PANELS SUMMARY REPORT
after the furnace stabilized at the set temperature. In the test the control
thermocouple was located in the center part of the furnace in the same region as
the #2 thermocouple. This allowed a direct comparison between the control thermo-
couple and the #2 thermocouple on the specimen.
Results of these calibrations are presented in Table 2-3. It can be seen that
a 120K maximum (2%) gradient existed within the specimen gage length (Test A and B).
The maximum gradient from specimen to specimen was 40K (Test B, D, and F). Variation
between the control thermocouple reading and the center specimen temperature was
less than 70K for all tests except for test A where a 130K variation was found.
The general trend of these results is that temperature variations are reduced as
test temperature is increased.
In addition to variations between the control thermocouple and the specimen
temperature some variation from the planned temperature occurred as a function of
time in each cycle. A typical result of calibrations made to measure this is shown
in Figure 2-19. For a flat temperature profile at 1144°K (16000F), variations of
+ 60K were observed.
2.8.1.6 Pressure Measurement. Pressure within the test chamber was controlled by
a regulated leak rate operated by a servo-valve coupled to an Alphatron Vacuum gage
(Model 530). The Alphatron gage sent an electrical signal to a Gran-Phillips auto-
matic controller (series 213). The controller compared the signal from the Alphatron
with that programmed on the Data Trak. The controller actuated the servo valve as
required to control the air pressure. Control equipment is shown in Figure 2-17.
Some manual control of a bleed valve was necessary in the testing of specimens
to an actual pressure profile (pressure variation from 1.33 Pa to one atmosphere).
In these profiles the controller maintained a programmed change in pressure from
1.33 to 66.5 Pa.
2-33
MCDONNELL DOUGLAS ASTRONAUTICS COMPANY. EAST
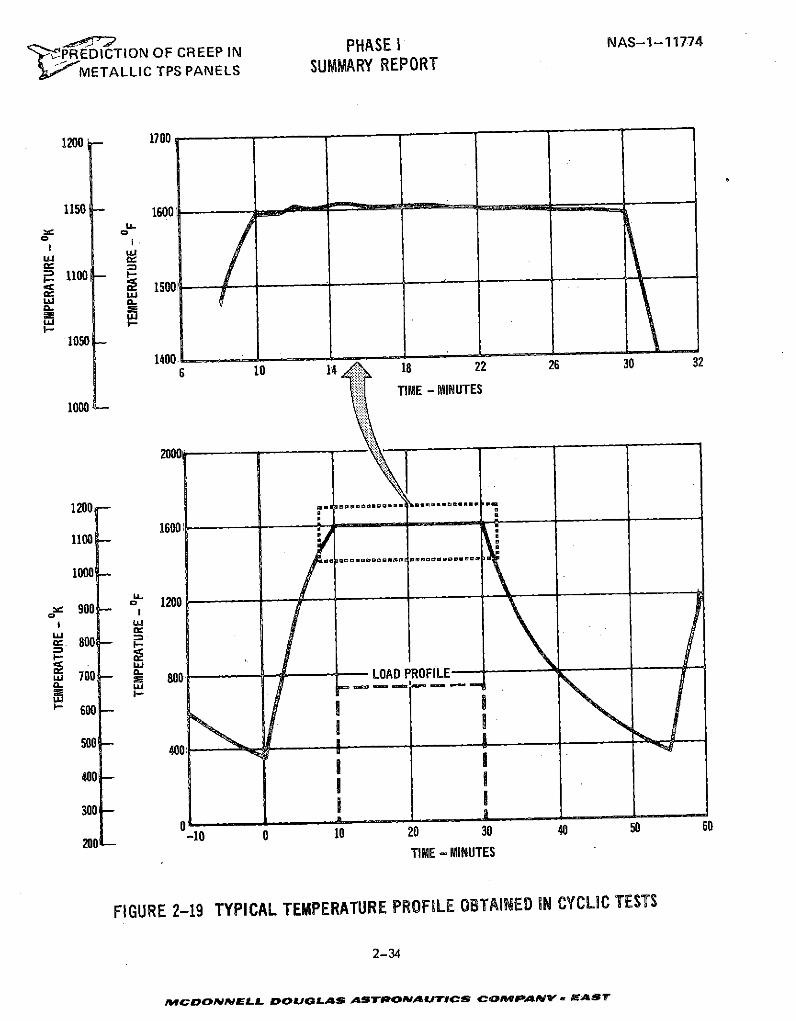
PHASE I NAS-1-11774PREDICTION OF CREEP IN
METALLIC TPS PANELS SUMMARY REPORT
1200 1700
1150 1600 - "
U.o
S1100- -1500 •
rL
I-.
1050140010 14 1 22 26 30 32
TIME - MINUTES
1000
200
1200 ..... 3.. .... "UUU3 ..........
1600001100 -
1000 -
S 1200
• ,," 900 -
00I300 -0
-10 0 10 20 30 40 50 60
TIME - MINUTES
FIGURE 2-19 TYPICAL TEMPERATURE PROFILE OBTAINED IN CYCLIC TESTS
2-34
MCDNNELL 0OUGLAS ASRONmMUTICS CoMPANVY EI aST
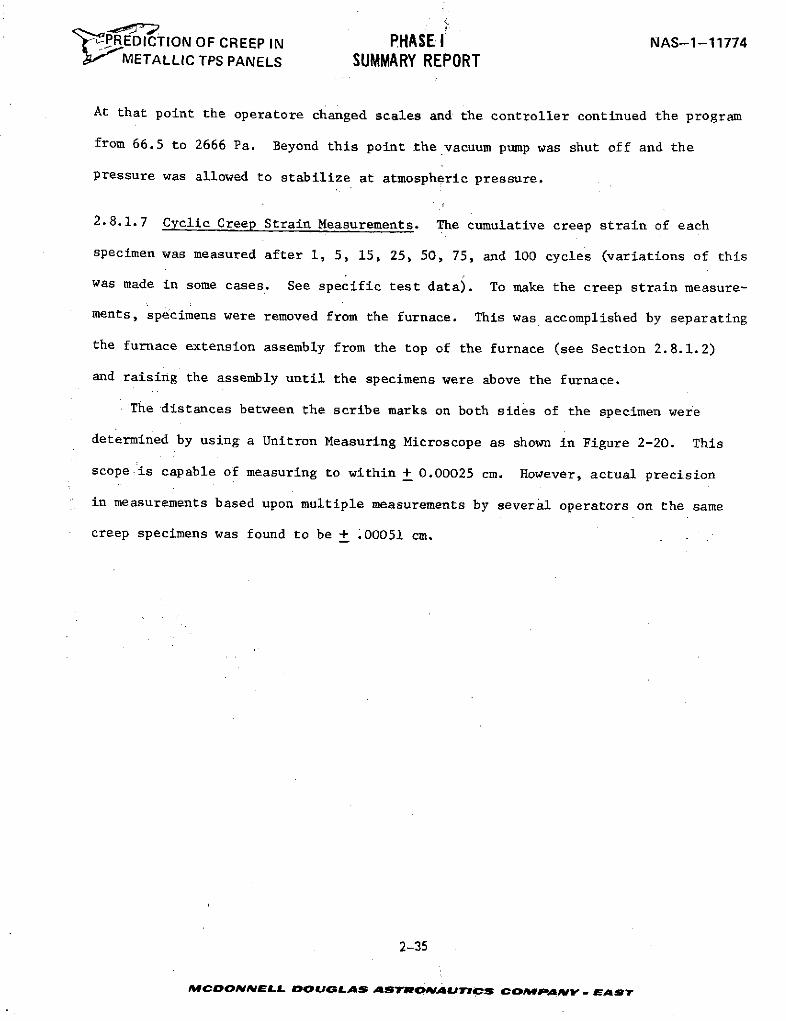
PREDICTION OF CREEP IN PHASE I NAS-1-11774METALLIC TPS PANELS SUMMARY REPORT
At that point the operatore changed scales and the controller continued the program
from 66.5 to 2666 Pa. Beyond this point the vacuum pump was shut off and the
pressure was allowed to stabilize at atmospheric pressure.
2.8.1.7 Cyclic Creep Strain Measurements. The cumulative creep strain of each
specimen was measured after 1, 5, 15, 25, 50, 75, and 100 cycles (variations of this
was made in some cases. See specific test data). To make the creep strain measure-
ments, specimens were removed from the furnace. This was accomplished by separating
the furnace extension assembly from the top of the furnace (see Section 2.8.1.2)
and raising the assembly until the specimens were above the furnace.
The distances between the scribe marks on both sides of the specimen were
determined by using a Unitron Measuring Microscope as shown in Figure 2-20. This
scope is capable of measuring to within + 0.00025 cm. However, actual precision
in measurements based upon multiple measurements by several operators on the same
creep specimens was found to be + .00051 cm.
2-35
MCDONNELL DOUGLAS ASTRONAUTICS COMPANY . EA ST
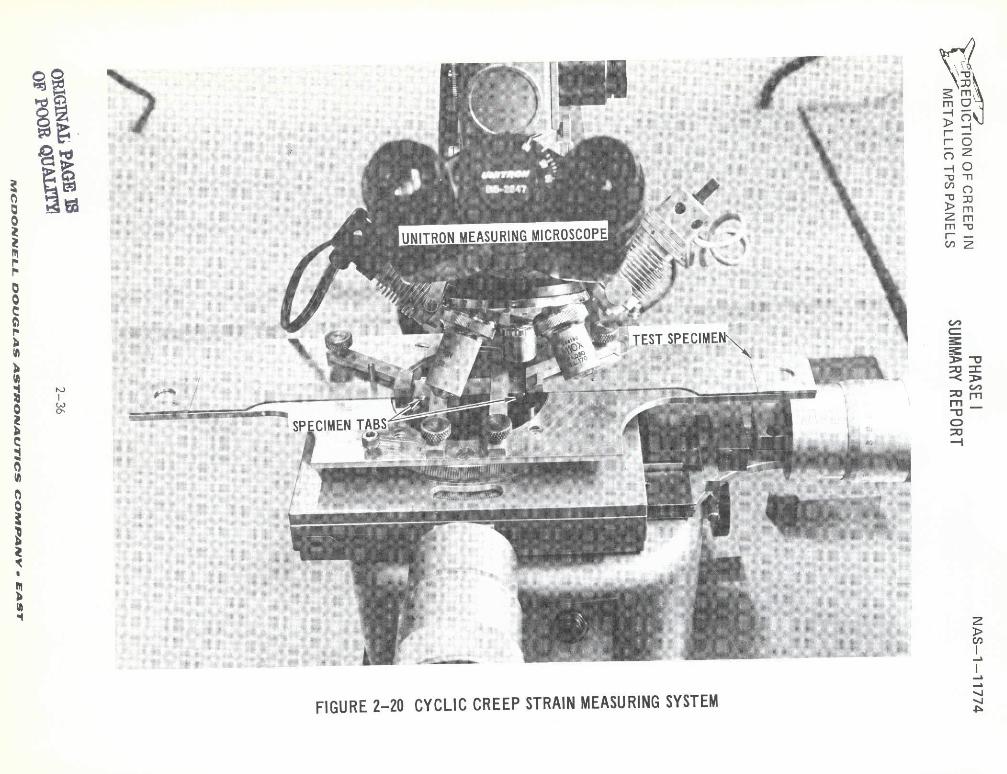
O
> ,m
0UNITRON MEASURING MICROSCOPE r -
SC:
o -u
SPECIMEN TABS
FI
FIGURE 2-20 CYCLIC CREEP STRAIN MEASURING SYSTEMd
PREDICTION OF CREEP IN PHASE I NAS-1-11774JV METALLIC TPS PANELS SUMMARY REPORT
2.9 DATA REQUIREMENTS AND TEST SELECTION
The approach toward selecting test conditions and types of tests for.supple-
mental steady-state testing and cyclic testing, is presented in this section.
2.9.1 SUPPLEMENTAL STEADY-STATE TESTING
2.9.1.1 Data Requirements. The original intent of the supplemental steady-state
creep tests was to use these tests to supplement the literature survey data base,
and demonstrate that the material being studied was representative of that data
base. The test matrix was established so that the resulting data could independently
serve as the basis of an empirical equation for comparison with cyclic test results.
In addition, a minimum number of tests for each alloy were planned for evaluation
of the effects of material thickness and material rolling direction on creep
response.
2.9.1.2 Selection of Conditions for Supplemental Steady-State Tests. Initially,
several experimental designs were examined in an effort to identify combinations
of test temperature and stress which would provide maximum useful data. The
studies were based on the L605 equation developed from the literature survey
(Reference Section 3.1.2).
lnc = 4.84599 + 2.12288 In a + .48945 Int - .29601 In -19.50143(1/T) (2-1)
where E = creep strain, %
t = time, hours
a = stress, MP a
= material thickness, cm
T = temperature, OK
In this effort to obtain an experimental design, the following requirements as
presented in Section 2.9.1.1 were considered.
2-37
MCDONNELL DOUGL AS STRONAUTICS COMP4PNV . EAST
',-PREDICTION OF CREEP IN PHASE I NAS-1-11774METALLIC TPS PANELS SUMMARY REPORT
(1) Test data should be amenable to development of an empirical creep strain
equation. Applicability of each design for satisfying this requirement was checked
by generating simulated creep strain data using equation 2-1, performing regression
analyses, and evaluating the resulting prediction equation.
(2) Test temperatures should cover the ranges of interest for the material
being tested.
(3) Test temperatures and stress levels should produce creep strains in the
range of interest for metallic TPS. Maximum and minimum levels of creep strain
considered reasonable for supplemental steady-state tests were .50% in 50 hours and
.06% in 200 hours, respectively.
Some of the designs considered are presented in Figure 2-21. These designs
include the simple 3 x 3 factorial design and an orthogonal composite design, des-
cribed in References 23 and 24, and shown in Figures 2-21(a) and 2-21(b), respectively.
While each of these designs satisfies the first requirement ((1) above), they do not
satisfy the second or third requirement. This is evident from the figure since even
for the narrow temperature range of 10890 to 12000 K and the stress range of 13.8
to 69 MPa, creep strains as low as .022% in 200 hours (13.8 MPa @ 10890 K) and as
high as .6% in 6 hours (69 MPa @ 12000 K) result. These values are outside of the
range of interest.
In addition to these two designs, the design shown in Figure 2-21(c) was con-
sidered because it provides a maximum coverage of the test temperature and stress
range of interest for L605. Analysis of the simulated data using regression tech-
niques, however, demonstrated that the resulting prediction equation based on this
design was a function of time only.
A fourth design considered is a compromise between the other three. This design,
shown in Figure 2-21(d) allowed testing over the temperature range of 9780 K to 12550 K
2-38
M4~DON~M ELL .DOJGdLA ASTROMNAUTICS COPApdY . EAST
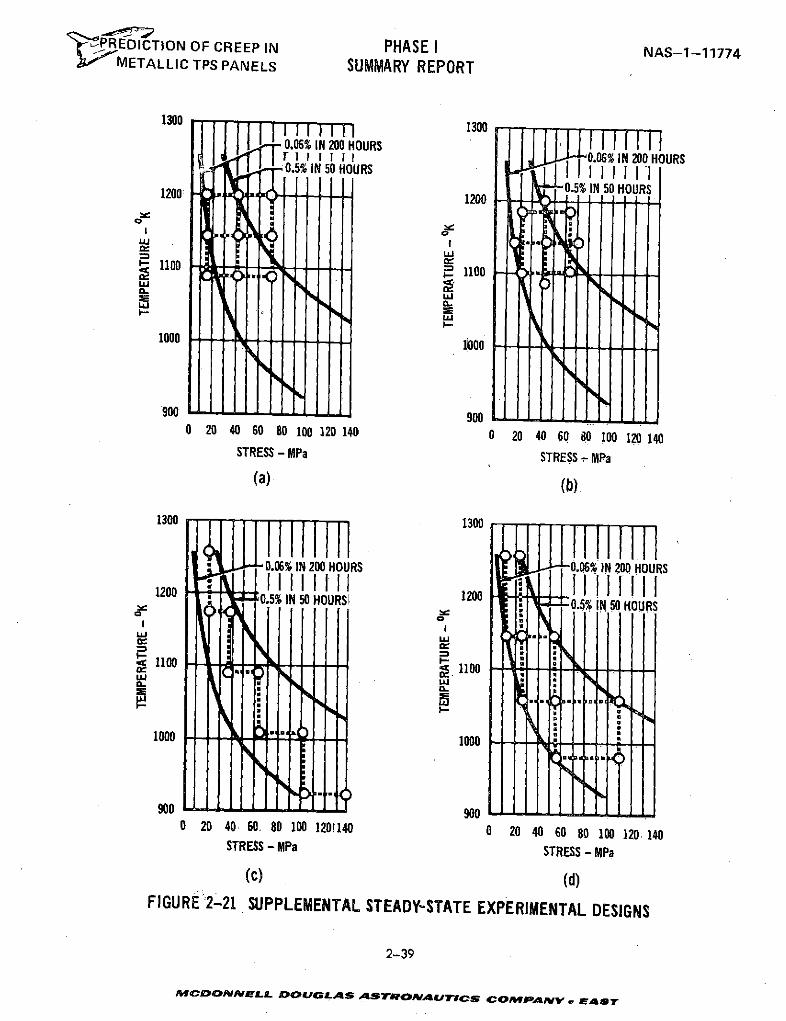
P RE DICTION OF CREEP IN PHASE I NAS-1-11774NIETALLIC TPS PANELS SUMMARY REPORT
1300 13001o 1 1 I 1 1 113000.06% IN 200 HOURST r0 I 0.06% IN 200 HOURS
1200; 0.5% IN 50 HOURS1200 --- " 1200 II
w I1100
1000 - - 1000
900 9000 20 40 60 80 100 120 140 0 20 40 60 80 100 120 140
STRESS - MPa STRESS M- MPa
(a) (b)
1300 1300
0.06% IN 200 HOURS 0.06% IN 200 HOURS120 10 IIIII1200 0.5 IN 50 HOURS 1200 .5% N 50 HOURSa
u I.5I 1 i
I-. --
1000 " -1000
909000
900 -- - - - - 9000 20 40. 60. 80 100 120!140 0 20 40 60 80 100 120 140
STRESS - MPa STRESS - MPa
(c) (d)FIGURE 2-21 SUPPLEMENTAL STEADY-STATE EXPERIMENTAL DESIGNS
2-39
MCDONNELL DOUGLAS ASTRO#JAUTICS COMPANy. P E ST
P-REDICTION OF CREEP IN PHASE I NAS-1-11774
SMETALLIC TPS PANELS SUMMARY REPORT
and stress range of 13.8 to 110.3 MPa. Values of temperature and stress were
selected to be equally spaced in the variables log stress and l/T (note form in
Equation 2-1). This allowed for spacing of tests throughout the strain range of
interest as well as the temperature and stress range. Study of this design using
simulated data and regression techniques indicated that an empirical equation could
be derived from the resulting test data. Therefore, due to the applicability of
this design to regression analysis and its utilization of a relatively wide range
of temperature and stress levels, this experimental design was used in the
selection of supplemental steady state creep tests for L605, Titanium, and TDNiCr
alloys. In the case of Rene' 41, the orthogonal composite design (Figure 2-21(b))
was used, based on a larger spread in the applicable creep range (see Section 3.3.2).
Resulting test conditions for the basic matrix of supplemental steady-state tests
are presented in Table 2-4. These tests were conducted using thin gage specimens
tested in the longitudinal direction. To be consistent with the data base, L605,
Titanium, and TDNiCr specimens were tested in the as-received condition and Rene' 41
specimens were tested with a heat oxidation coating obtained during the heat treat
process (solution treating in air at 13940 K followed by aging in air for 4 hours
at 1172 0 K). Some variations and additions were made to the test matrix in the case
of Rene' 41 and TDNiCr. Additional discussion on test conditions for each of the
alloys is presented in Section 3.
2.9.1.3 Selection of Tests for Evaluation of Other Variables. In addition to tests
on thin gage material specimens in the longitudinal rolling directions as specified
in Table 2-4, some tests were performed on each material to examine how material
thickness and rolling direction effect creep.
In addition, for L605, the effect of an emittance coating on creep was briefly
examined because panels will be coated to enhance emittance, which is essential for
the efficient radiation of aerodynamic heat.
2-40
MCDONN LL W DOUGi A ASTARONAUTICS ComIPAdV y EAST
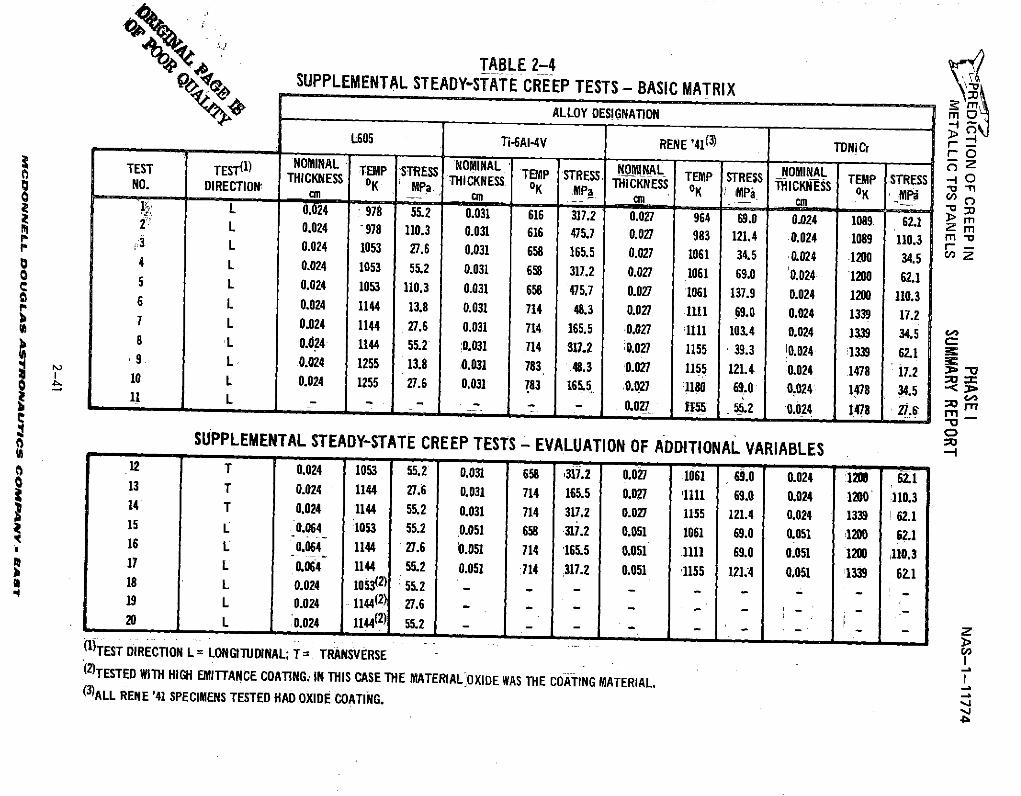
SPL T DTABLE 2-4SUPPLEMENTAL STEADY-STTE CREEP TESTS - BASIC MATRIX
ALLOY DESIGNATION m 0
L605 Ti-6AI-4V RENE '41(3 TDNiCr >TEST1 NOMINAL NOMINAL NOMINALTEST TEST( ) NTEMP STRESS NINA TEMP STRESS . TEMP STRESS TEMP STRESS -0NO. DIRECTIO THICKNESS OK MPa THICKNESS K MPa THICKNESS K M ICES OK MP c' nSan cm an _ cmL 0.024 978 55.2 0.031 616 317.2 0.027 964 69.0 0.024 1089 62.1 r23 L 0.024 978 110.3 0.031 616 475.7 0.027 983 121.4 0.024 1089 110.3 m3 L 0.024 1053 27.6 0.031 658 165.5 0.027 1061 34.5 0.024 1200 34.5 z
4 L 0.024 1053 55.2 0.031 658 317.2 0.027 1061 69.0 0.024 1200 62.15 L 0.024 1053 110.3 0.031 658 475.7 0.027 1061 137.9 0.024 1200 110.36 L 0.024 1144 13.8 0.031 714 48.3 0.027 1111 69.0 0.024 1339 17.27 L 0.024 1144 27.6 0.031 714 165.5 0.027 1111 1014 0.024 1339 34.58 L '0.24 1144 55.2 0.031 714 317.2 10.027 1155 39.3 10.024 1339 62.19 L 0.024 1255 13.8 0.031 783 48.3 0.027 1155 121.4 0.024 1478 17.2 -10 L 0.024 1255 27.6 0.031 783 165.5 0.027 1180 69.0 0.024 1478 34.5 -<11 L - - -- - - 0.027 15& 55.2 0.024 1478 27.6 rn
SUPPLEMENTAL STEADY-STATE CREEP TESTS - EVALUATION OF ADDITIONAL VARIABLES12 T 0.024 1053 55.2 0.031 658 317.2 0.027 1061 69.0 0.024 1200 62113 T 0.024 1144 27.6 0.031 714 165.5 0.027 1111 69.0 0.024 1200 110.314 T 0.024 1144 55.2 0.031 714 317.2 0.027 1155 121.4 0.024 1339 '62.115 L 0.064 1053 55.2 0.051 658 317.2 0.051 1061 69.0 0.051 I20 62.116 L 0.064 1144 27.6 10.051 714 '165.5 0.051 1111 69.0 0.051 1200 110.317 L 0.064 1144 55.2 0.051 714 317.2 0.051 1155 121;4 0.051 '1339 62.118 L 0.024 1053(2) 55.2 -
-19 L 0.024 1144( 27.6 - _20 L 0.024 1144(2) 55.2 - - -
(I)TEST DIRECTION L= LONGITUDINAL; T= TRANSVERSE
(2)TESTED WITH HIGH EMITTANCE COATING. IN THIS CASE THE MATERIAL OXIDE WAS THE COATING MATERIAL.(3)ALL RENE '41 SPECIMENS TESTED HAD OXIDE COATING.
P'.PREDICTION OF CREEP IN PHASE I NAS-1-11774
METALLIC TPS PANELS SUMMARY REPORT
For each material three specimens were tested in the transverse rolling
direction using the thin gage material (same as the basic matrix). Three tests were
also conducted on each alloy, in the longitudinal rolling direction, using the thicker
gage material procured (see Section 2.4). In these six tests, stresses and tempera-
tures were selected as replicates of conditions in the basic matrix.
Three tests were conducted on pre-oxidized L605 specimens. The surface coat-
ing used was the materials' own oxide obtained by heating the specimen in air to
1339 0K, holding for 10 minutes and rapid cooling to room temperature. These were
the thin gage, longitudinal rolling direction specimens as tested in the basic matrix.
Test stresses and temperatures were replicates of conditions in the basic matrix.
2.9.2 CYCLIC TESTING
2.9.2.1 Data Requirements. This program is designed to provide a capability for
the prediction of creep deflections for the Space Shuttle TPS panels. Toward develop-
ing the capability, the following requirements were established for cyclic testing:
(1) To provide data for determining material cyclic creep properties. To meet
this requirement it is desirable to provide tests from which an empirical
equation could be obtained, if required. Comparison of cyclic tests
results with steady-state results is necessary in order to evaluate
possible applicability of steady-state data bases to the prediction of
cyclic creep.
(2) To provide data for investigation of creep accumulation (hardening) rules.
These rules are required both in analyzing axially loaded components,
where load or temperature changes with time, and in analyzing TPS panels
subjected to bending loads. It is important to note that stresses in a
2-42
iWVACOJ~rPIAe L OU(LAS ASTROWAUTICS COMPAMNV AST
L' PREDICTION OF CREEP IN PHASE I NAS-1-117741, METALLIC TPS PANELS SUMMARY REPORT
TPS panel, creeping under bending loads, will continuously change
because of stress redistributions, even when applied bending loads are
held constant.
(3) To provide data for investigating the applicability of resulting cyclic
creep equations and hardening rules to trajectories having different time
durations.
(4) To provide data for investigating possible effects of creep recovery.
(5) To provide data for establishing procedures applicable to analysis of TPS
components subjected to general trajectories (varying temperatures and.
stresses within a cycle). In connection with this requirement the effect
of atmospheric pressure on creep response was investigated.
(6) To provide cyclic creep response data for a typical Shuttle Mission tra-
jectory. In connection with the requirement, stress and temperature pro-
files were applied with the goal of obtaining creep strains of approximately
.5% after exposure to 200 simulated missions.
Cyclic tests to achieve these goals, were conducted under the following cate-
gories: (1) Basic Cyclic tests; (2) Variation of stress with cycle; (3) Variation
of time per cycle; (4) Creep recovery tests; (5) Idealized trajectory tests and
atmospheric pressure variation; (6) Simulated mission tests
For consistency of data, all cyclic tests were conducted using minimum gage
specimens in the longitudinal rolling direction. Except for the variation of
atmospheric pressure and simulated mission tests, all cyclic tests were conducted
at a constant atmospheric pressure of less than 1.3 Pa.
2-43
MCDONNELL DOUGLAS ASTRONAUTICS COMPANY E.EAST
' PREDICTION OF CREEP IN PHASE I NAS-1-11774
I- METALLIC TPS PANELS SUMMARY REPORT
2.9.2.2 Basic Cyclic Tests. The Basic Cyclic tests form the cornerstone of all
cyclic testing in this program because the data generated from these tests was used
to develop the empirical equations relating stress, temperature, and time to creep
strains. The profile used, shown in Figure 2-22, is a simplified trajectory consist-
ing of a rapid heat-up, hold at temperature for twenty minutes, then rapidly cooling
to approximately 4220 K. The temperature profile was not taken to room temperature
(299 0K) because of cost and schedule consideration associated with an increased
testing time. After cool-down the same profile was repeated for a 100 cycle test
duration. Total time for each cycle was 55 minutes. The cycle time at maximum
temperature and load of 20 minutes was based on the Shuttle design trajectory
presented in Section 2.1 (See Figure 2-5).
Combinations of temperatures and stresses selected for each alloy were based
on the experimental design used in steady-state testing. This design was parti-
cularly attractive for cyclic testing due to the whiffle tree test mechanism used
(simultaneous testing of three specimens at one temperature and three different
stress levels as discussed in Section 2.8).
Stress and temperature levels were also selected with the goal of obtaining
100 cycle creep strains up to 0.5%. A summary of these Basic Tests is presented
in Table 2-5. More discussion of test selection for the Basic Cyclic Tests are
presented for each material in Section 3.
2.9.2.3 Variation of Stress with Cycle. Stress redistribution occurs and residual
stresses result within a beam due to creep. To include this effect in TPS creep
analysis, theories describing hardening behavior are employed. To provide data
2-44
MCDONNELL DOULABS ATROIAUtlCS CODMPANY - EABT
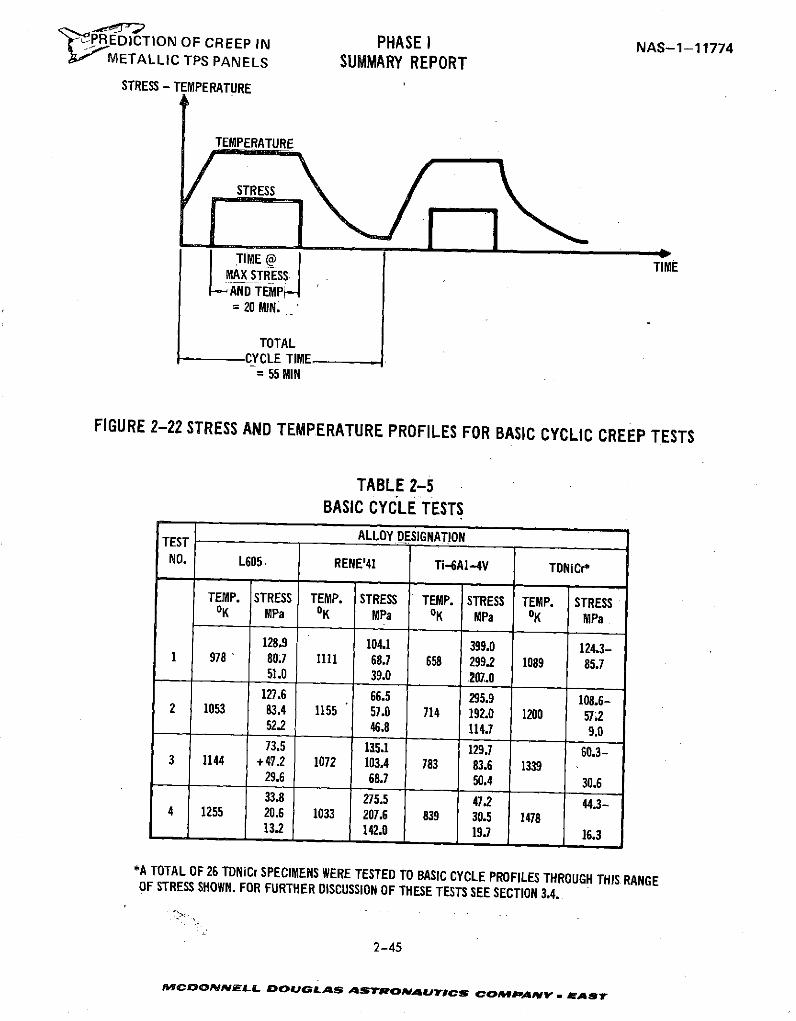
'"PREDICTION OF CREEP IN PHASE I NAS-1-11774IMETALLIC TPS PANELS SUMMARY REPORT
STRESS - TEMPERATURE
TEMPERATURE
STRESS
TIME @ TIME
= 20 MIN.
TOTALCYCLE TIME
= 55 MIN
FIGURE 2-22 STRESS AND TEMPERATURE PROFILES FOR BASIC CYCLIC CREEP TESTS
TABLE 2-5BASIC CYCLE TESTS
TEST ALLOY DESIGNATIONNO. L605 RENE'41 Ti-6A1-4V TDNiCr*
TEMP. STRESS TEMP. STRESS TEMP. STRESS TEMP. STRESSOK MPa OK MPa OK MPa OK MPa
128.9 104.1 399.0 124.3-1 978 80.7 1111 68.7 658 299.2 1089 85.7
51.0 39.0 207.0127.6 66.5 295.9 108.6-
2 1053 83.4 1155 57.0 714 192.0 1200 57.252.2 46.8 114.7 9.073.5 135.1 1297 60.3-
3 1144 +47.2 1072 103.4 783 83.6 133929.6 68.7 50.4 30.633.8 275.5 47.2 44.3-4 1255 20.6 1033 207.6 839 30.5 147813.2 142.0 19.7 16.3
*A TOTAL OF 26 TDNiCr SPECIMENS WERE TESTED TO BASIC CYCLE PROFILES THROUGH THIS RANGEOF STRESS SHOWN. FOR FURTHER DISCUSSION OF THESE TESTS SEE SECTION 3.4.
2-45
MPCDONNELL DOUGLAs ASTRONAUTICS COmAmNY - EAST
'PREDICTION OF CREEP IN PHASE I NAS-1-11774
METALLIC TPS PANELS SUMMARY REPORT
for investigating this behavior, tests were conducted in which load (stress) level
was varied as a function of cycle. Histories for these tests are shown in Figure
2-23. In these tests, the cycle profiles were the same as used in basic cyclic
testing. Data obtained was used in conjunction with the Basic Cyclic Tests to eval-
uate the applicability of time or strain hardening theories to the individual alloys.
Stress levels for the history shown in Figure 2-23(a) were selected to duplicate
stresses in the Basic Cyclic Tests where possible, to allow direct comparison of
data. The increasing and decreasing stress level tests, illustrated in Figures
2-23(b) and 2-23(c), respectively, were also used to assess and verify hardening
behavior for Shuttle TPS conditions. These are representative of internal stresses
at beam stresses which will gradually change due to creep during entry.
2.9.2.4 Variation of Time Per Cycle. In the previous discussions, analysis has
been based on tests using trajectory profiles which have a time of 20 minutes at
maximum temperature and load. Analysis, however, must be applicable to trajectories
that have different times at maximum temperature and load.
To determine the effect of time at temperature for each material, a test (3
specimens) was conducted using a time of 10 minutes at maximum temperature and load.
Total time per cycle was therefore 45 minutes, shortened by 10 minutes from the
Basic Cyclic Test profile. Temperature and stresses for this test were the same as
for one of the basic cyclic tests for each material to allow comparison with the
basic cyclic results.
2.9.2.5 Creep Recovery Tests. These tests were designed to evaluate the effect of
"recovery" time between loadings and the effect of overlapping stress and temperature
profiles in time space. Two types of tests were conducted, as depicted in Figure 2-24.
-2-46
, afCDOAPdELL. mdOUGAnfS ASTROAUTICS COrPeANly - EL ALST
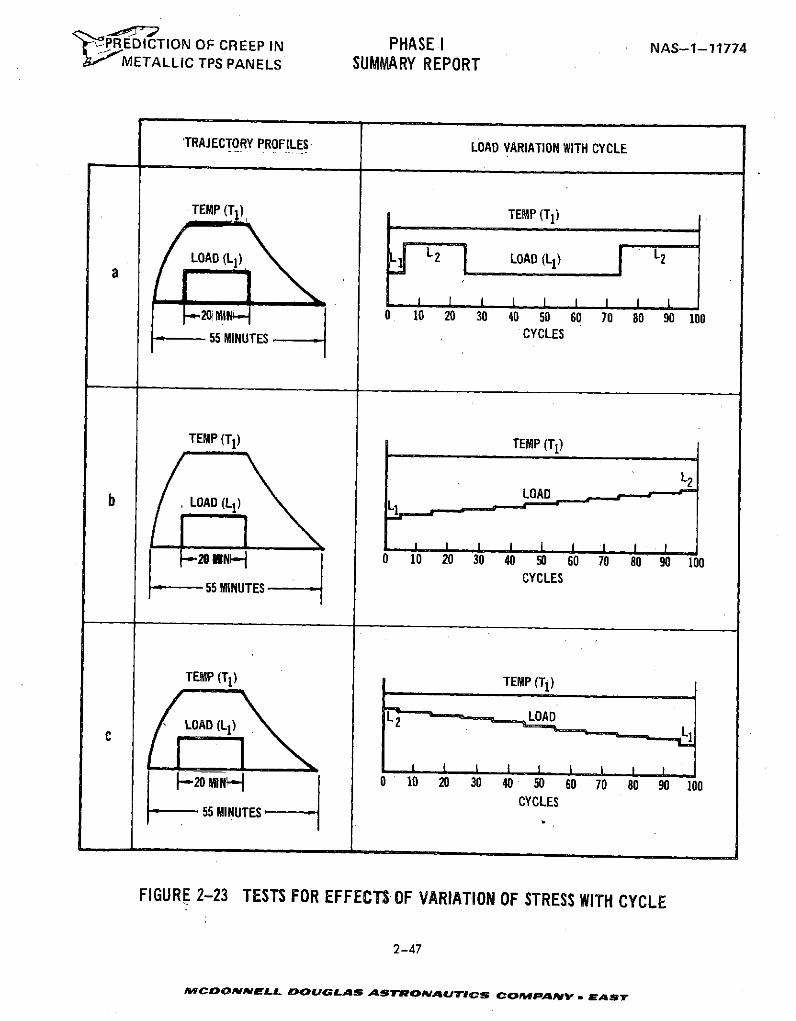
tPREDICTION OF CREEP IN PHASE I NAS-1-11774BJMETALLIC TPS PANELS SUMMARY REPORT
'TRAJECTORY PROFILES LOAD VARIATION WITH CYCLE
TEMP (T) TEMP (T1)
LOAD (L) L 2 LOAD (L1) L2
20IMINk..- 0 10 20 30 40 50 60 70 80 90 10055 MINUTES CYCLES
TEMP (TI) TEMP (T1)
b LOAD (L1) L
--20 IN 0 10 20 30 40 50 60 70 80 90 100CYCLES
55 MINUTES
CYCLES
TEMP (T1) TEMP (TI)
LOAD (L1) L LOAD
-'20 MIN i 0 10 20 30 40 50 60 70 80 90 100CYCLES
4---- 55 MINUTES
FIGURE 2-23 TESTS FOR EFFECTS OF VARIATION OF STRESS WITH CYCLE
2-47
MICDONNELL DOUGLAS ASTRONAUTICS CfOMPANY . EAST
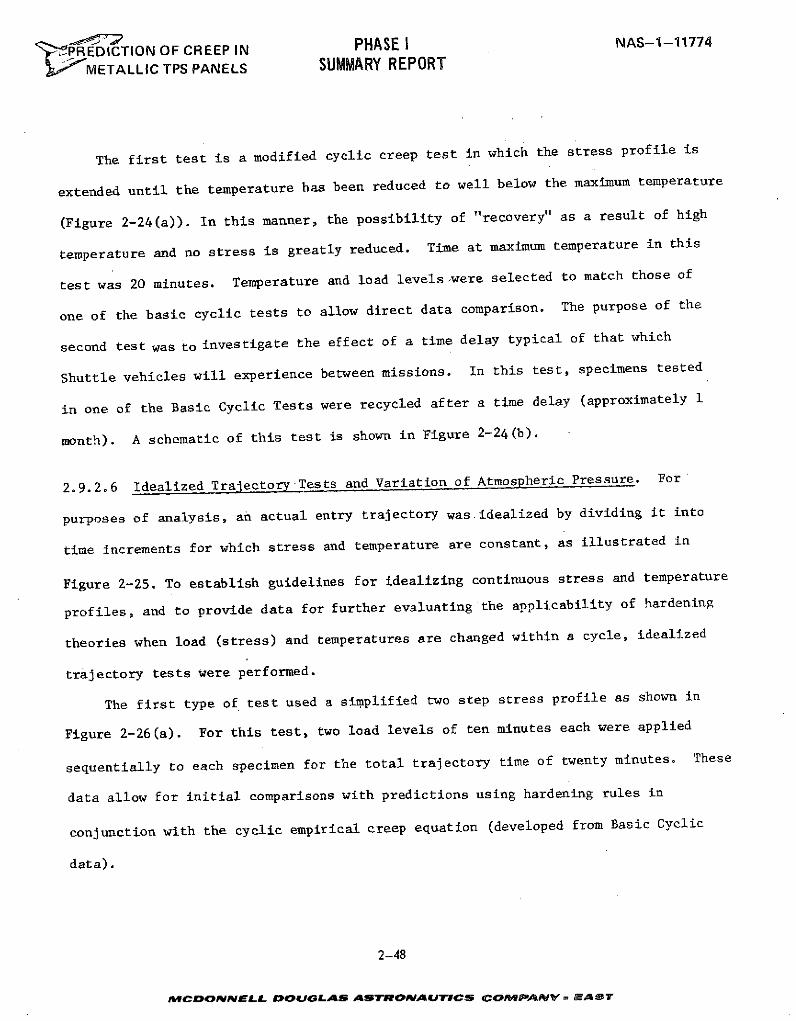
' PREDICTION OF CREEP IN PHASE I NAS-1-11774
METALLIC TPS PANELS SUMMARY REPORT
The first test is a modified cyclic creep test in which the stress profile is
extended until the temperature has been reduced to well below the maximum temperature
(Figure 2-24(a)). In this manner, the possibility of "recovery" as a result of high
temperature and no stress is greatly reduced. Time at maximum temperature in this
test was 20 minutes. Temperature and load levelswere selected to match those of
one of the basic cyclic tests to allow direct data comparison. The purpose of the
second test was to investigate the effect of a time delay typical of that which
Shuttle vehicles will experience between missions. In this test, specimens tested
in one of the Basic Cyclic Tests were recycled after a time delay (approximately 1
month). A schematic of this test is shown in Figure 2-24(b).
2.9.2.6 Idealized Trajectory Tests and Variation of Atmospheric Pressure. For
purposes of analysis, an actual entry trajectory was idealized by dividing it into
time increments for which stress and temperature are constant, as illustrated in
Figure 2-25. To establish guidelines for idealizing continuous stress and temperature
profiles, and to provide data for further evaluating the applicability of hardening
theories when load (stress) and temperatures are changed within a cycle, idealized
trajectory tests were performed.
The first type of test used a simplified two step stress profile as shown in
Figure 2-26(a). For this test, two load levels of ten minutes each were applied
sequentially to each specimen for the total trajectory time of twenty minutes. These
data allow for initial comparisons with predictions using hardening rules in
conjunction with the cyclic empirical creep equation (developed from Basic Cyclic
data).
2-48
MCDONNELL DOUGLAS ASTONAUTICS COAf#PANP*V AEAST
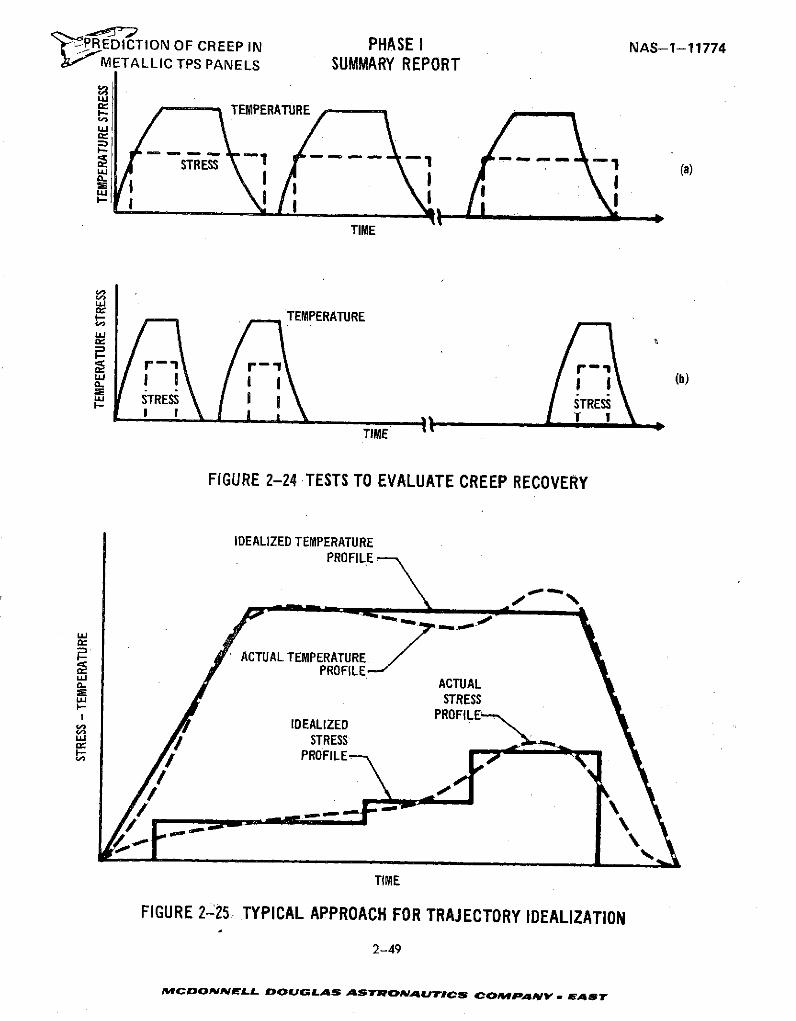
'rPREDICTION OF CREEP IN PHASE I NAS-1-11774IMETALLIC TPS PANELS SUMMARY REPORT
I.- TEMPERATUREul
STRESS 1 (a)
TIME
ITEMPERATURE
r rIE I (b)
" STRESS STRESSI I I
TIME
FIGURE 2-24 TESTS TO EVALUATE CREEP RECOVERY
IDEALIZED TEMPERATUREPROFILE
ACTUAL TEMPERATURE.PROFILE
,.- ACTUALw STRESSI.-
PROFILEIDEALIZED
STRESSt; PROFILE
,-
TIME
FIGURE 2-25. TYPICAL APPROACH FOR TRAJECTORY IDEALIZATION
2-49
MCDONNELL DOUGLAS ASTRONAUTICS COMPANY EA ST
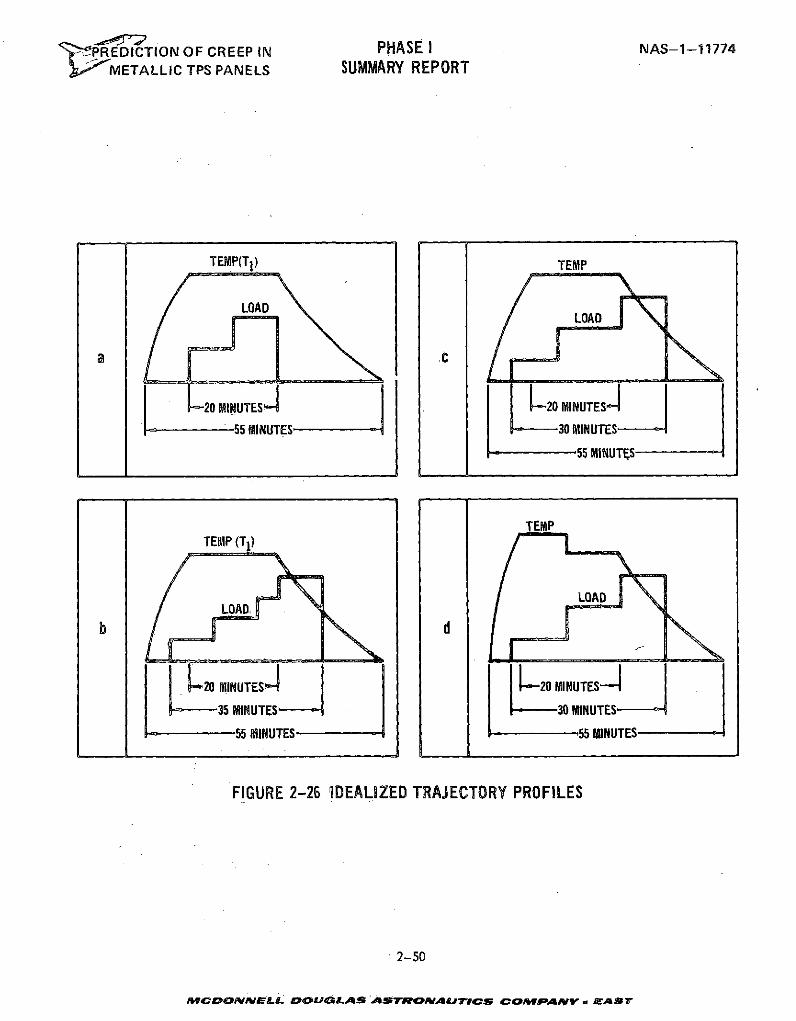
t'jPR EDICTION OF CREEP IN PHASE I NAS-1-11774SMETALLIC TPS PANELS SUMMARY REPORT
TEMP(TI) TEMP
LOAD LOA
55 MINUTES
TEMPTEMP (T1)
LOADLOAD,
20 MINUTES 20 MINUTES
35 MINUTES, - 30 MINUTES
55 MINUTES 55 MINUTES
FIGURE 2-26 'IDEALIZED TRAJECTORY PROFILES
2-50
MCDONNELL DOUOLAS ASTRONAUTICS CO PANY - EAsr
'PREDICTION OF CREEP IN PHASE I NAS-1-11774METALLIC TPS PANELS SUMMARY REPORT
The second type of test was conducted using idealizations of the projected.Shuttle
(load and temperature) missions. The number of steps in the idealized load trajectory
was varied between materials in some cases. A four-step load profile was used in
this test for L605 specimens, as depicted in Figure 2-26(b) and a three-step profile
was used for testing Rene' 41, titanium, and TDNiCr specimens as shown in Figure 2-26(c)
In addition, Rene' 41 specimens were tested using a two-level temperature distribu-
tion as shown in Figure 2-26(d). In general these tests.were conducted for 100 cycles.
All cyclic tests discussed to the point were conducted with a constant atmo-
spheric pressure of less than 1.3 Pa. To determine the effect of a changing
pressure, one idealized trajectory test for each material was repeated using the
simulated mission profile shown in Figure 2-27. This pressure profile is based on
altitude versus time for the Phase B Space Shuttle Orbiter trajectory presented in
Section 2.1.
2.9.2.7 Simulated Trajectory Tests. Testing of tensile specimens for each material
to a simulated Shuttle mission, load, temperature, and pressure profiles, shown in
Figure 2-27, completed the cyclic testing. Results of these tests provide data
for final verification of predictive capability for cyclic creep in tension.
2.10 COMPUTER PROGRAMS
2.10.1 SELECTION OF REGRESSION ANALYSIS COMPUTER PROGRAM FOR DATA ANALYSIS (BMDO2R)
In the development of an empirical equation using a large volume of data, the
use of regression analysis can be helpful. The computer program that was used in
this study is referred to as BMDO2R and is part of the Biomedical Computer Programs
developed by the Health Sciences Computing Facility, Department of Preventative
Medicine, University of California (Reference 25). The regression analysis programs
were designed to solve problems in medical research which involve data covering
several variables for each case or several observations on a few variables. Of the
2-51
AMCDONNELL DOUGLAS ASTRONArUTICS COAPAPNY EAST
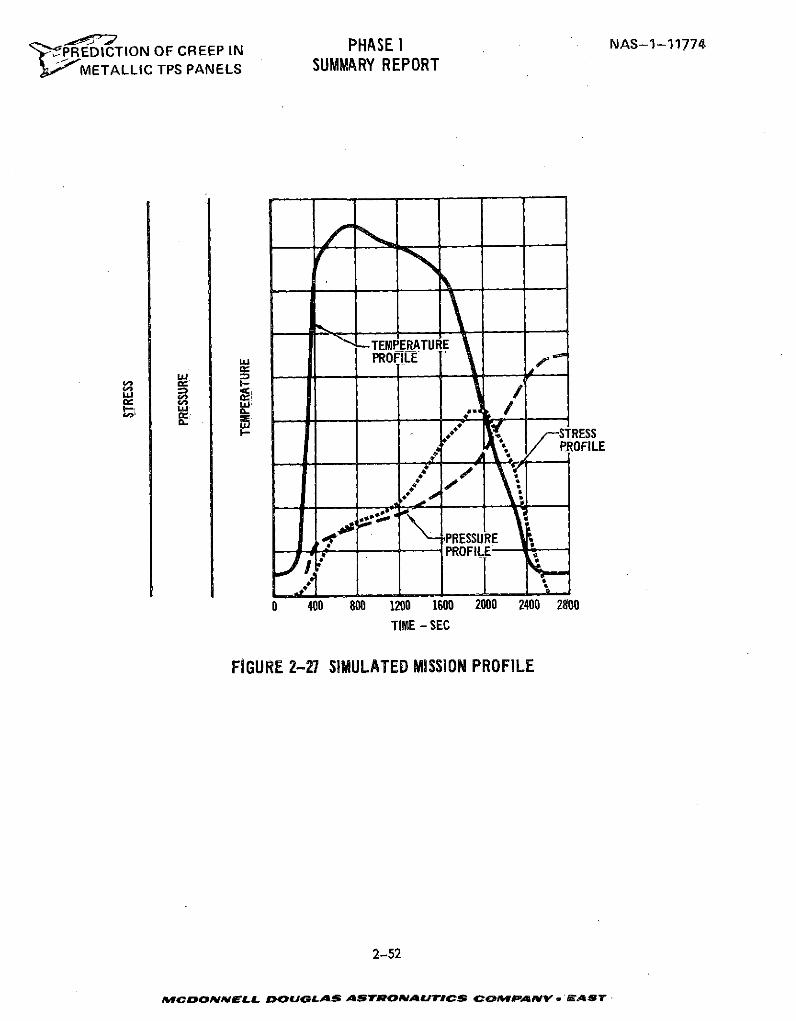
' P REDICTION OF CREEP IN PHASE NAS-1-11774
METALLIC TPS PANELS SUMMARY REPORT
TEMOERATUREPRFLTE- o
P OFILE/ /
PROFILE
0 400 800 1200 1600 2000 2400 2800
TIME - SEC
FIGURE 2-27 SIMULATED MISSION PROFILE
2-52
MrCDONNELL DOUGLAS ASTWPOMNAUICS CO.MPANY ' AST
:EDICTION OF CREEP IN PHASE I NAS-1-11774IMETALLIC TPS PANELS SUMMARY REPORT
regression analysis category of six programs, the stepwise regression program
(BMDO2R) was selected.
The program is capable of computing a sequence of multiple linear equations
in a stepwise manner. At each step, one variable is added to or deleted from the
equation. The variable that is added is the one that makes the greatest reduction
in the residual variance. In essence, the introduction of this variable produces
the greatest overall "F" ratio (F = MSR/MSV, where MSR is the mean square due to
regression and MSV is the mean square due to residual variation).
2.10.2 PROGRAM FOR TENSILE CREEP TRAJECTORY DATA ANALYSIS (CPCE)
The CPCE computer program-was written in order to allow rapid analysis of
cyclic tensile specimen trajectory test data. Creep strains are accumulated, based
on hardening theories in conjunction with empirical equations for the creep.
Program input is based on the type of trajectory profiles conducted. For tests
where stress is constant within each cycle but stepped as a function of cycle, input
includes time per cycle and number of cycles at each stress and temperature. For
tests where stress and temperature are varied within a cycle (idealized and simulated
trajectory tests), input includes time, temperature and stress of each step in the
trajectory and the number of cycles to be analyzed.
Analysis options are based on the time hardening and strain hardening theories
of creep accumulation (Reference 26). Five analysis predictions are calculated and
printed as functions of cycle and time within the cycle. The first two are time
hardening and strain hardening, respectively. The other three accumulate creep
strain increments for time or strain hardening, depending upon results of checks
made on the trajectory. These three approaches are: 1) use of time hardening when
stress increases and strain hardening when stress decreases; 2) use of time hard-
ening when effective time (in strain hardening) is less than actual time and strain
2-53
MCDONNELL DOUGLAS ASTRONAUTICS COMPAdNV- EAST
'PREDICTION OF CREEP IN PHASE I NAS-1-11 774
J0METALLIC TPS PANELS SUMMARY REPORT
hardening when effective time is greater than actual time; and 3) use of time
hardening when strain rate increases and strain hardening when strain rate decreases.
These three analysis approaches were formulated on the basis of initial analysis
of L605 cyclic test data.
This program not only allows for analysis of the cyclic data but will supple-
ment the TPS Beam prediction program for the analysis of TPS components subjected
to axial load only.
2.11 STATISTICAL CONSIDERATIONS
During this program, major areas of work included (1) the development of pre-
dictive equations for the description of creep behavior based on previously conducted
work as detailed in the literature, (2) the development of test matrices for the
defintion of test parameters for required creep tests (both steady-state and cyclic),
(3) the generation of new predictive equations for the description of steady-state
and cyclic creep behavior as experimentally observed during this program, and (4)
comparison of literature data with that obtained during this program. Each of these
above areas of interest required the use of statistical considerations. For example,
a very large number of equations are found in the literature which have been
developed over the years to describe the complex physical process of creep. In
addition, an infinite number of new relationships (or models) can be formulated
for the description of the dependent variable creep as a function of the independent
variables time, temperature, stress, structure, gage, etc. The use of regression
analyses permits a determination of which "classical" equation or new equation
best fits the previously existing and new creep data for each of the four
alloys studied during this program. Also, time and funding limited the number
of creep tests which could be performed during this program; therefore, statistical
methods were used to choose test parameter combinations and to identify the
2-54
' PREDICTION OF CREEP IN PHASE I NAS-1-11774METALLIC TPS PANELS SUMMARY REPORT
acceptable test data for establishing equations relating the test parameters and
the creep for each alloy investigated. The various test parameter combinations
are discussed separately under each of the four alloy discussions.
2.11.1 SELECTION OF EQUATIONS
The description of a creep equation involves the determination of the relation-
ship between the dependent variable, strain, and the independent variable such as
temperature, stress, time, thickness, and orientation. A convenient procedure for
determining this relationship is the use of multiple regression techniques. Two
parameters associated with this technique are (1) the multiple correlation coeffic-
ient, R, and (2) the standard error of estimate, S . The square of the multiple
correlation coefficient is defined as the ratio of the sum of squares due to
regression to the total sum of squares and is a measure of how well the fitted
equation explains the variation in the data [27]. The closer the value of R2 (or R)
is to 1, the better the equation will fit the data.
The standard error of estimate is defined as the square root of the residual
mean square and is an estimate of the variance about the regression. Therefore,
the precision of the estimate would be considered better the lower the value of Sy.
Accordingly, in the development of the various regression equations that were
examined during the program, emphasis was placed in obtaining equations which
resulted in large values of R and small values of Sy
The development and selection of each predictive equation generally followed
an iterative procedure as outlined below:
Step 1 - Select first order independent variables.
Step 2 - Using variables identified in Step 1, form new independent variables
for the regression analysis consisting of higher order terms and inter-
raction (first and higher order) terms. The computer program used to
2-55
AMCoONNELL DOUOeLAS ASTROjAuTDICs COMPAY. AEASy
't REDICTION OF CREEP IN PHASE I NAS-1-11774SMETALLIC TPS PANELS SUMMARY REPORT
perform the stepwise regression procedure (BMD-02R) is discussed in
Section 2.10.2. A feature of the program is the capability of con-
veniently introducing new independent variables which may be inter-
action terms by simply including transgeneration cards.
Step 3 - Using the stepwise regression procedure, and the literature and/or
program data, determine the significant variables from the total
identified and constructed in Steps 1 and 2.
Step 4 - Review and record R and S for equation. If sufficient replication
exists in data bank, compare the computed Sy with the internal
estimate of error which is computed from the replicate observations.
Step 5 - Examine the residual of plots of the dependent variable vs. regressed
variables. The residual is the difference between what is actually
observed and what is predicted by the regression equation. If the
proper variables were selected, the residual plots will have a uniform
distribution with a zero mean. If the proper variables were not in the
equation, then the residual plots tend to take a shape which indicates
if the analysis should be weighted or a linear or quadratic term should
have been used. An in-depth discussion of the examination of residuals
and their significance is presented in Reference (27).
Step 6 - Repeat Step 3 using new'variables and compare R and Sy with previously
established values. Repeat Step 5 (i.e., review of plots of residuals)
and form additional independent variables, if required.
Step 7 - Plot predicted creep responses and compare with experimentally
observed creep curves with particular emphasis placed in identifying
discrepancies in fit and general form of the predicted surfaces.
Step 8 - If major discrepancies are observed in Step 7, modify and/or add new
independent variables and repeat from Step 3.
2-56
MCOPNLL DOU1 LAS ArSTROWAUJTACS COMPANY - A
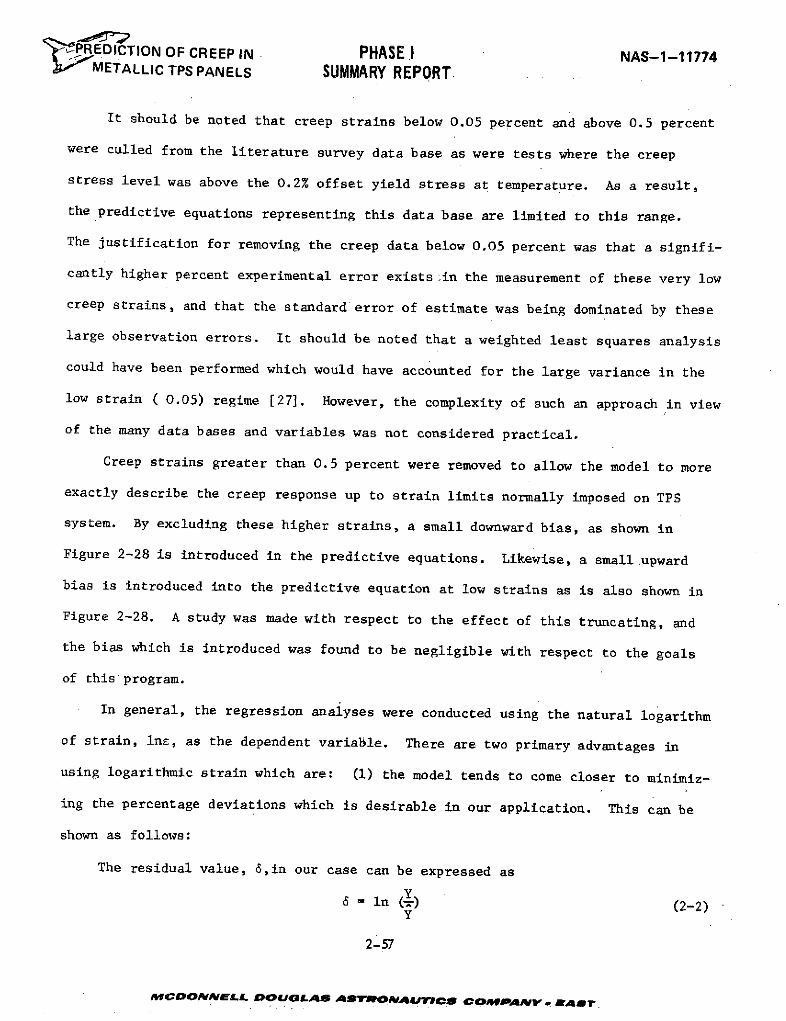
PREDICTION OF CREEP IN PHASE I NAS-1-11774METALLIC TPS PANELS SUMMARY REPORT.
It should be noted that creep strains below 0.05 percent and above 0.5 percent
were culled from the literature survey data base as were tests where the creep
stress level was above the 0.2% offset yield stress at temperature. As a result,
the predictive equations representing this data base are limited to this range.
The justification for removing the creep data below 0.05 percent was that a signifi-
cantly higher percent experimental error exists :in the measurement of these very low
creep strains, and that the standard error of estimate was being dominated by these
large observation errors. It should be noted that a weighted least squares analysis
could have been performed which would have accounted for the large variance in the
low strain ( 0.05) regime [27]. However, the complexity of such an approach in view
of the many data bases and variables was not considered practical.
Creep strains greater than 0.5 percent were removed to allow the model to more
exactly describe the creep response up to strain limits normally imposed on TPS
system. By excluding these higher strains, a small downward bias, as shown in
Figure 2-28 is introduced in the predictive equations. Likewise, a small upward
bias is introduced into the predictive equation at low strains as is also shown in
Figure 2-28. A study was made with respect to the effect of this truncating, and
the bias which is introduced was found to be negligible with respect to the goals
of this program.
In general, the regression analyses were conducted using the natural logarithm
of strain, lne, as the dependent variable. There are two primary advantages in
using logarithmic strain which are: (1) the model tends to come closer to minimiz-
ing the percentage deviations which is desirable in our application. This can be
shown as follows:
The residual value, 6,in our case can be expressed as
6 = n (r) (2-2)
2-57
MCDONNELL DOUGLAS AsTRONAU7ICS COMPANY w EAST
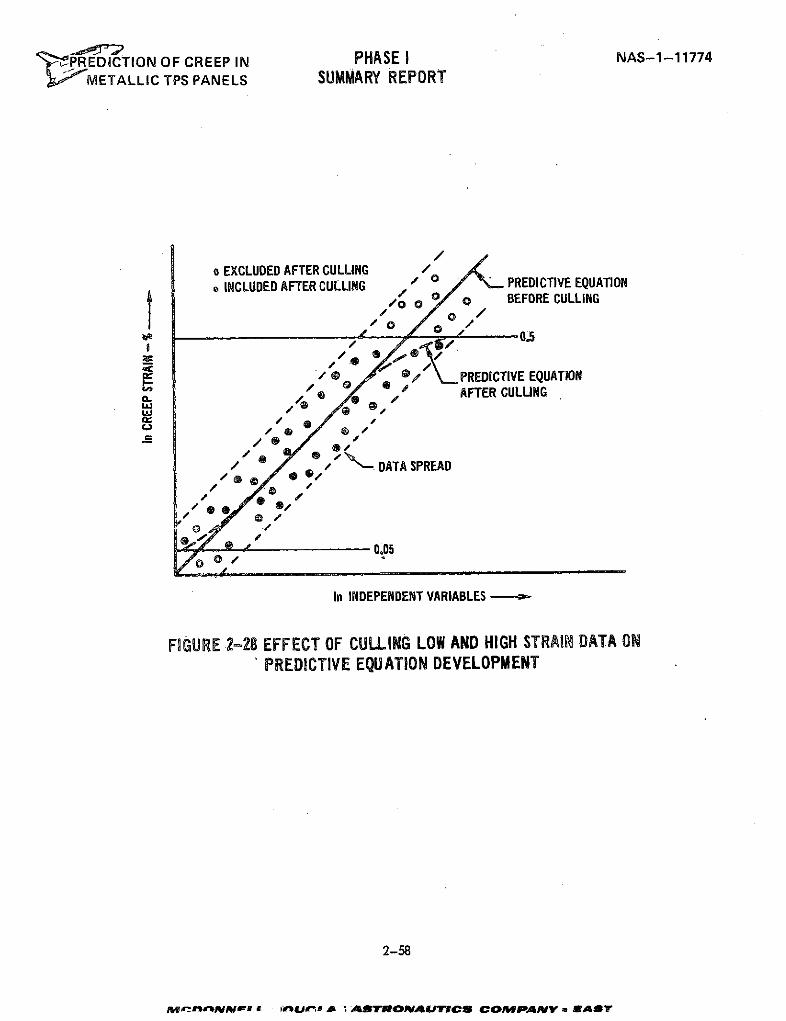
' PREDICTION OF CREEP IN PHASE I NAS-1-11774
METALLIC TPS PANELS SUMMARY REPORT
o EXCLUDED AFTER CULLING /9 INCLUDED AFTER CULLING - o PREDICTIVE EQUATIONS/o o / BEFORE CULLING
/ o
/ PREDICTIVE EQUATIONC a L AFTER CULLING
L &e/, , ,
In INDEPENDENT VARIABLES
FIGURE 2-28 EFFECT OF CULLING LOW AND HIGH STRAIN DATA ON
PREDICTIVE EQUATION DE AELOPMENT
/ EQUATIO DEVLPSPREM
In INMDEPEDENT VARIABLES
2-58
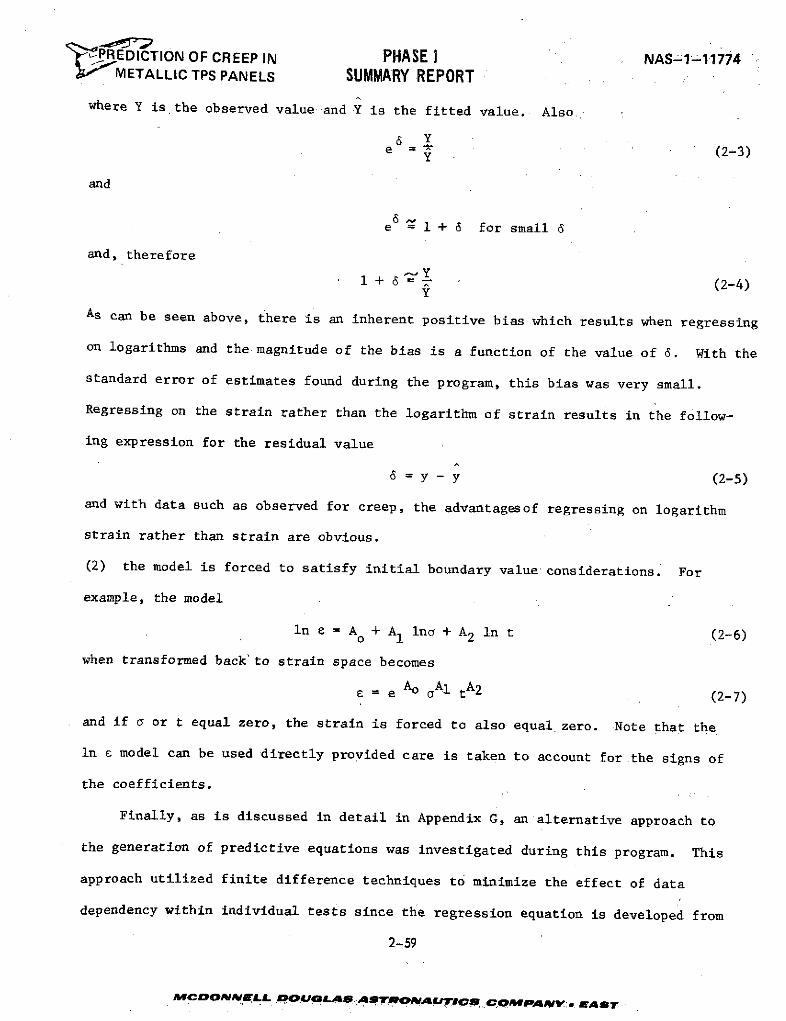
'CPREDICTION OF CREEP IN PHASE I NAS-1-11774METALLIC TPS PANELS SUMMARY REPORT
where Y is the observed value and Y is the fitted value. Also
6 Ye (2-3)
and
e6 1 + 6 for small 6
and, therefore. y
1+ 6 = (2-4)
As can be seen above, there is an inherent positive bias which results when regressing
on logarithms and the magnitude of the bias is a function of the value of 6. With the
standard error of estimates found during the program, this bias was very small.
Regressing on the strain rather than the logarithm of strain results in the follow-
ing expression for the residual value
6 y-y (2-5)
and with data such as observed for creep, the advantagesof regressing on logarithm
strain rather than strain are obvious.
(2) the model is forced to satisfy initial boundary value considerations. For
example, the model
in e = A + Al In + A2 In t (2-6)
when transformed back' to strain space becomes
e = e Ao uA1 tA2 (2-7)
and if a or t equal zero, the strain is forced to also equal zero. Note that the
in c model can be used directly provided care is taken to account for .the signs of
the coefficients.
Finally, as is discussed in detail in Appendix G, an alternative approach to
the generation of predictive equations was investigated during this program. This
approach utilized finite difference techniques to minimize the effect of data
dependency within individual tests since the regression equation is developed from
2-59
MConDoJNELL qDOOLAS ASTVLONAUTICS COMPANwY. e sr
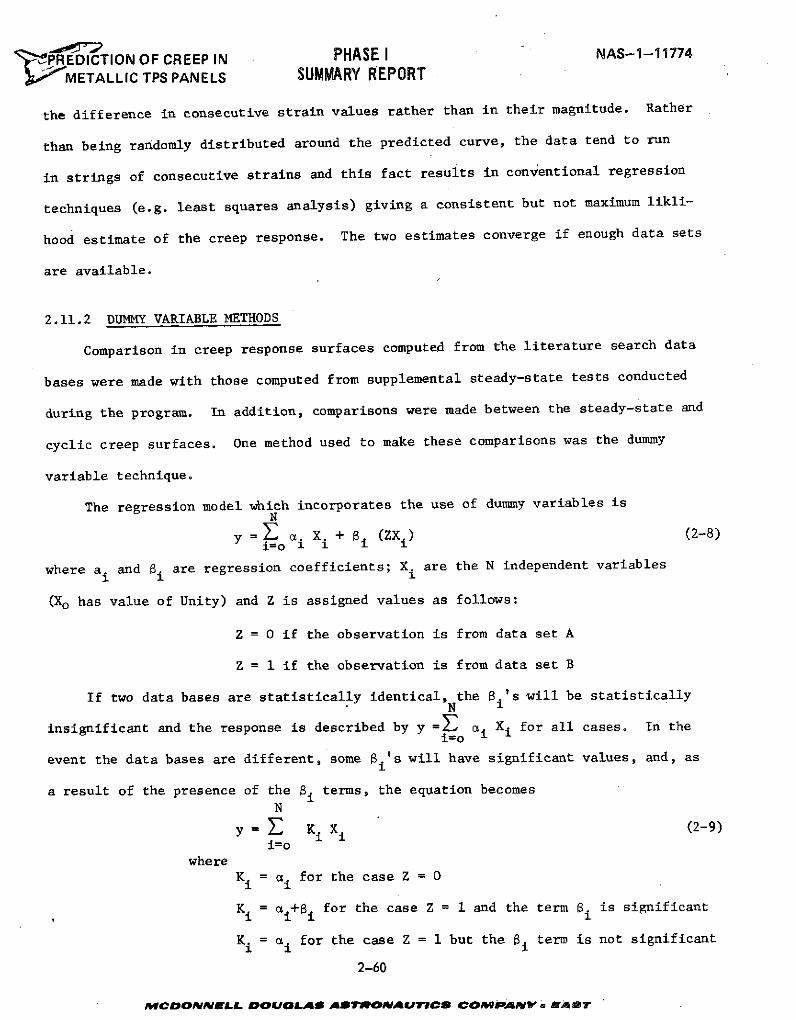
"'PREDICTION OF CREEP IN PHASE I NAS-1-11774
SMETALLIC TPS PANELS SUMMARY REPORT
the difference in consecutive strain values rather than in their magnitude. Rather
than being randomly distributed around the predicted curve, the data tend to run
in strings of consecutive strains and this fact results in conventional regression
techniques (e.g. least squares analysis) giving a consistent but not maximum likli-
hood estimate of the creep response. The two estimates converge if enough data sets
are available.
2.11.2 DUMMY VARIABLE METHODS
Comparison in creep response surfaces computed from the literature search data
bases were made with those computed from supplemental steady-state tests conducted
during the program. In addition, comparisons were made between the steady-state and
cyclic creep surfaces. One method used to make these comparisons was the dummy
variable technique.
The regression model which incorporates the use of dummy variables isN
y = E X + i (ZX) (2-8)i=o i i i
where ai and Bi are regression coefficients; X are the N independent variables
(Xo has value of Unity) and Z is assigned values as follows:
Z = 0 if the observation is from data set A
Z = 1 if the observation is from data set B
If two data bases are statistically identical, the Bi's will be statistically
insignificant and the response is described by y =F ai Xi for all cases. In thei=o
event the data bases are different, some 6.'s will have significant values, and, as
a result of the presence of the Bi terms, the equation becomesN
y = Ki Xi (2-9)i=o
whereKi = i for the case Z = 0
Ki = ai+8i for the case Z = 1 and the term 8i is significant
Ki = ai for the case Z = 1 but the ai term is not significant
2-60
MCDONNELL DO OLA S AT@OAUTICS COMFANAV a A Bi
PREDICTION OF CREEP IN PHASE I NAS-1-11774METALLIC TPS PANELS SUMMARY REPORT
In summary, the dummy variable method used in conjunction with the BMD-02R
regression analysis program provides an efficient and convenient technique for the
comparison of data and for the determination of significant differences, if any,between response surfaces from different data bases.
2-61
MCDONNELL DOUGLAS ASwROII4ATICS COMPANwV . EA r
' PREDICTION OF CREEP IN PHASE I NAS-1-11774METALLIC TPS PANELS SUMMARY REPORT
3.0 TEST AND DATA ANALYSIS
Presented in this section, by alloy, are the results of the literature survey
and experimental portion of Phase I alloy with the analysis of the results.
3.1 L605 - RESULTS OF TESTS AND DATA ANALYSIS
3.1.1 STEADY STATE L605 DATA BASE
3.1.1.1 Literature Survey. A review of the literature revealed that Reference 15
contained enough data to develop a data base. This reference contained the results
from 59 creep tests performed on various gages manufactured from the same heat of
material. This data base is presented in Appendix C-l.
3.1.1.2 L605 Data Base Analysis. Figures 3-1 and 3-2 are graphical representations of
stress, time, and temperature ranges for data base longitudinal and transverse tests
respectively. Shaded areas indicate the ranges of stress, time, and temperature for
which creep strain data less than 0.5% are available in the data set. At high
temperatures (1144 and 12550K) transverse specimens were generally tested for longer
times than the longitudinal specimens. In working with this data base it is important
to recognize that empirical equations based on this data base are applicable only for
the range of data shown.
Data for five tests were removed from the data base. Two were tests at 9220 K
(206.8 MPa on 0.013 cm and 248.2 MPa on 0.102 cm). These tests had very high initial
strain values (0.2% creep in 0.1 hour) which resulted in inconsistency between these
tests and others of the same temperature and similar stress levels. Data for three
additional tests were removed from the data base because the test points were erratic.
Creep strains less than 0.05% were removed from the data base in an effort to weight the
data in favor of the higher creep strains in the regression analysis (see Section 2.11.1).
Since the L605 data base tests were at temperatures greater than one half of the
the melting point, the following high temperature creep model was used as the basis
for obtaining an empirical equation.
3-1
MCDONNELL DOUGLAS ASTRONMAUTCS COMPAb V - EAS
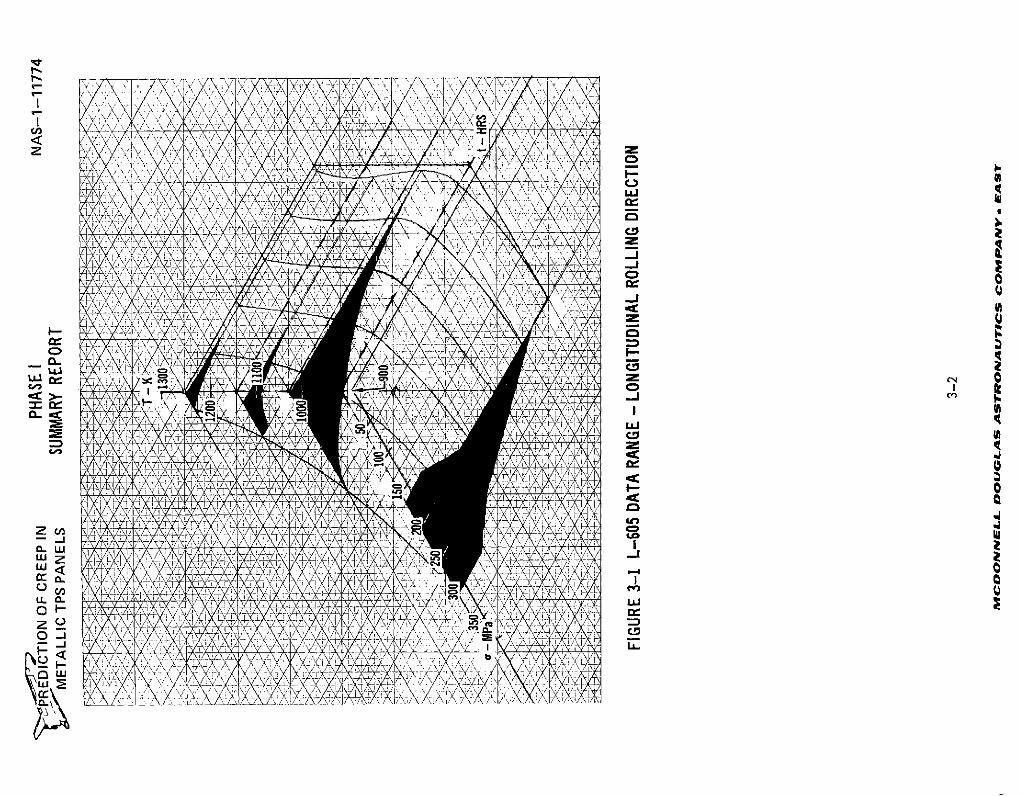
VXIv
.VV C)
I--
LiiJ
CD
WAI..
C)CC_ N-1
uj.
ouuj
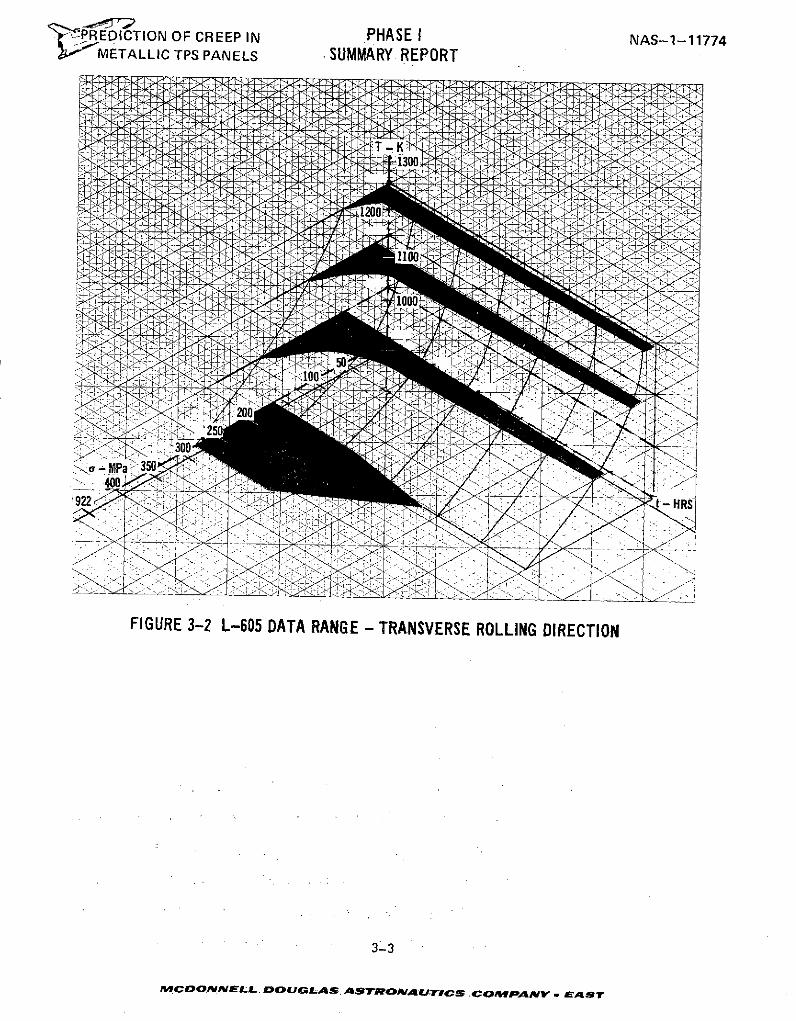
'"PREDICTION OF CREEP IN PHASE I NAS-1-1177421 METALLIC TPS PANELS SUMMARY REPORT
100pa,'350
FIGURE 3-2 L-605 DATA RANGE - TRANSVERSE ROLLING DIRECTION
3-3
MCDONNELL. DOUGLAS ASTROMAIJTICS COMANY . sE A
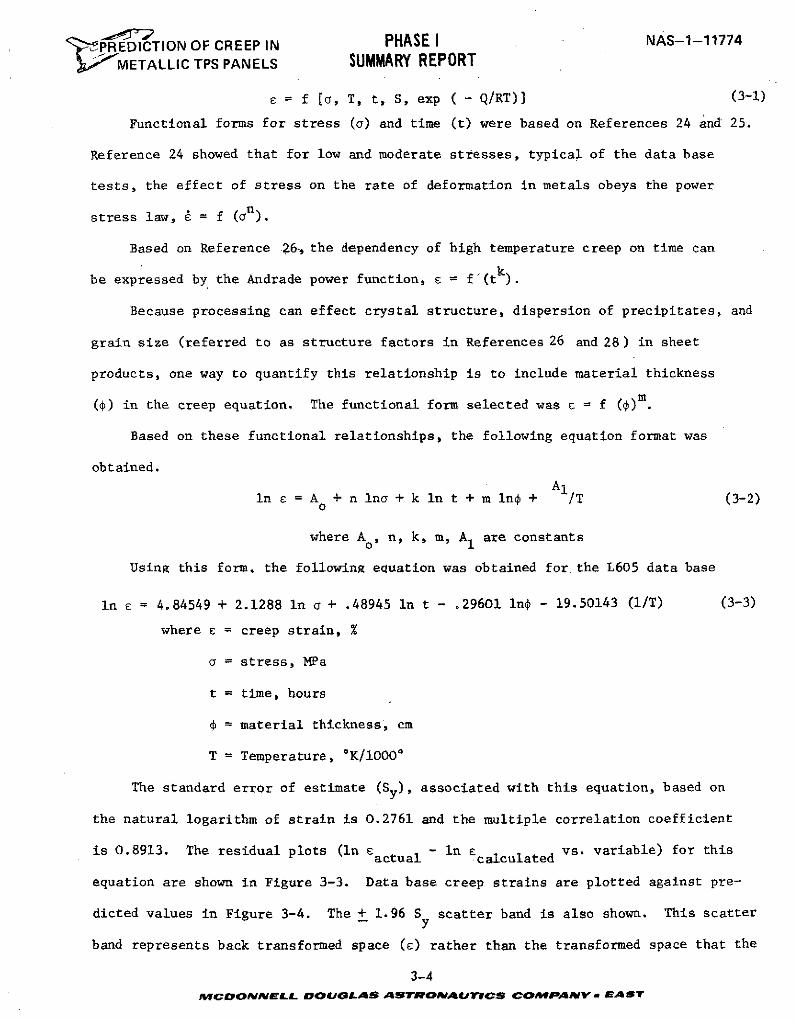
'" PREDICTION OF CREEP IN PHASE I NAS-1-11774
METALLIC TPS PANELS SUMMARY REPORT
=f [a, T, t, S, exp ( - Q/RT)] (3-1)
Functional forms for stress (a) and time (t) were based on References 24 and 25.
Reference 24 showed that for low and moderate stresses, typical of the data base
tests, the effect of stress on the rate of deformation in metals obeys the power
stress law, = f (an).
Based on Reference -26, the dependency of high temperature creep on time can
be expressed by the Andrade power function, c = f'(tk).
Because processing can effect crystal structure, dispersion of precipitates, and
grain size (referred to as structure factors in References 26 and 28) in sheet
products, one way to quantify this relationship is to include material thickness
(4) in the creep equation. The functional form selected was E = f (q)m
Based on these functional relationships, the following equation format was
obtained.
Alin e = A + n Ino + k In t + m in + /T (3-2)
where Ao, n, k, m, Al are constants
Using this form, the following equation was obtained for the L605 data base
In e = 4.84549 + 2.1288 In a + .48945 In t - .29601 In - 19.50143 (1/T) (3-3)
where E = creep strain, %
a = stress, MPa
t = time, hours
= material thickness, cm
T = Temperature, OK/10000
The standard error of estimate (Sy), associated with this equation, based on
the natural logarithm of strain is 0.2761 and the multiple correlation coefficient
is 0.8913. The residual plots (in Eactualc n calculated vs. variable) for this
equation are shown in Figure 3-3. Data base creep strains are plotted against pre-
dicted values in Figure 3-4. The + 1.96 S scatter band is also shown. This scatter-- y
band represents back transformed space (c) rather than the transformed space that the
3-4MCDONNELL DOUGLAS ASTRONAUTICS COMPANV EASTr
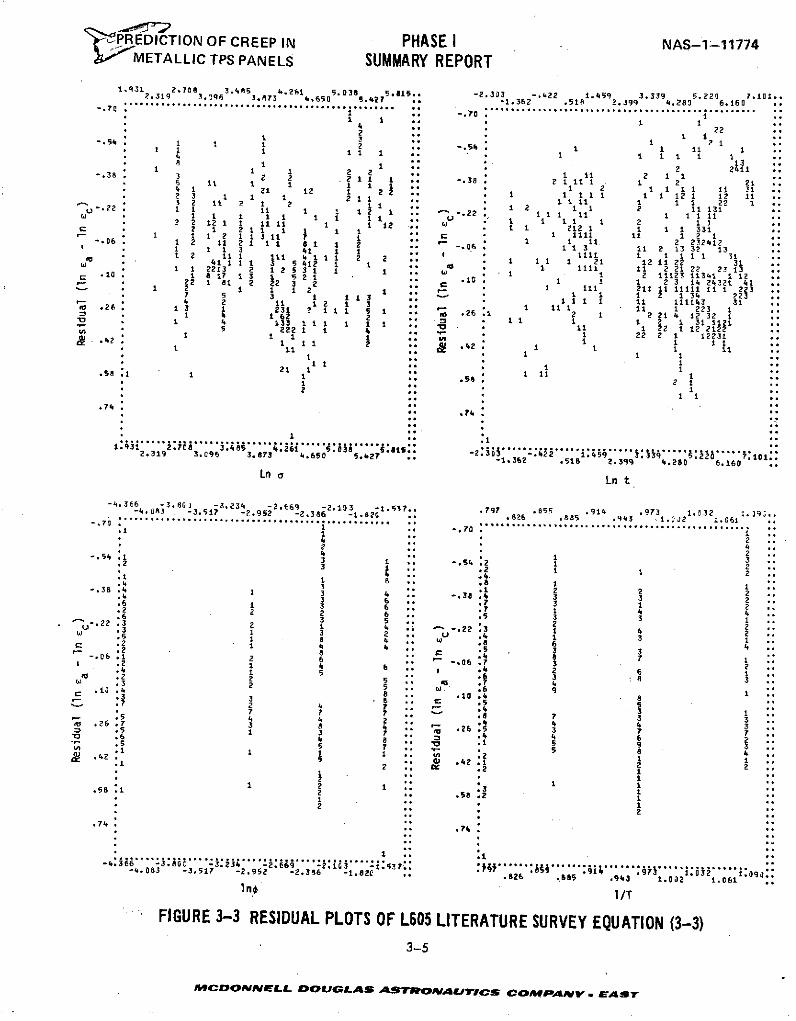
PREDICTION OF CREEP IN PHASE I NAS-1-11774METALLIC TPS PANELS SUMMARY REPORT
1.931 1 2.708 3.45 3 4.261 5.038 5.15 -2.303 -. 422 1.459 3.339 5.220 6 .101..2.319 • 3.9?! a.650 5.427 *. -1.362 .518 2.399 4.283 6.160
-.70 " ......................... -. . ........................................ ........
4 1 12222 . 1 2 1
.54 1 1 2 1 4 1 1 11 114 1 113
.1 2 2411 ...21 1 1 2 2 .. 1 11 2 1 1-. 39 3 2 2 . 1 1 1 -.38 2 1 1I1 1 2 216 11 1 1 1 1 1 11 1 11 314 1 21 12 1 2 1 1 11i 1 1 12 1 12 1123 1 1 1 2 1 1 11 1 1 1 22 1 ..3 2 11 2 1 2 .31 1. 1 2 1 1 2 11 1311-. 1 1 I 1 .. 1 -.22 I 11 1 1 311 11 .1 I 1 1 1 1 1 1 1 1 2 1 1 .2 2 12 1 1 1 11 1 1 12 . 1 212 1 1 1 1 3312 * 1 2 2 1 1 1 1 1- .1 1 112 11311 1" 1 111 11 1 2 1' 1 1 1 3 I ? I I it -- 2 23241206 1 2 11 1 1 1 1 .0 11 3 11 2 13 32 13S1 1 3 41 1 1 lil I 1 11 311 2 1 I 111 1 1 1 2 2 .. 1 11 1 21 121122 3141 1 1 3 541 1 1 1 1111 11 2212 2313
1 2 1 81 2 22 3, C
1 1 2213 2 1 2 5 3 1 1 1 1 1 Z 11123 11341, 1 12.10 1 6 1 81 2 22 3 2 11 1 1 1 2 3 14 24321 41 °22 1 1 2 .. 1 li 211 11 111 il 11 2237 5 3 1 3 1 1 1 2 1 3 2234 2 1 1 I 11 111143 310 .22. 13 1 2 3 3 1 - i 1 11 1 223 1.2 13 11 .26.1 2 1 2 214 12 ..11 4 1 62 2 1 1 1 2 1 3
1 21
.32 1 13 I I 1 1 1 11 1 22 1 12 21225 2221 42 22 2 i 12231S1*1 1 . 1 1 1
11 * ..2 I
1 ii i1 .. I2 .. 1
.74 . .? 4"° . 4
A--
1.931 2.7. o 2 .s -2.303 .422 . . 33.2.319 3.096 3.83 .650 -1.362 .518 2.399 4.280 6.160
Ln a Ln t
-4.366 -3.81 -3.234 -2.669 -2.103 -1.53.. .797 .855 .914 .973 1.032 :.9..-4.083 . -3.517 -2.952 -2.386 -1.825 .. .86 .85 .943 -1.1J2 1.
2 ... 24 1 3-. 54.
.. -. 54 .2 1 2.2 3 1 2 1 1 2S8 .. .8 1 14
.. .1 2 2 2-. 38.4 1 3 4 -. 38.4 3 3 2.4 3 b .. .7 3 1 2.6 1 3 6 .7 1 4 4
.2 2 6 .5 3 3 1. 3 5 .. 2 23 2-. 1 4 . -. 22. 1 4 2.3 1 3 2 .. U .4 1 3 1.5 1 8 4. .8 6 4- .2 1 4 4 .5. 8 78"
-6 .106 6.2 1 4 -6. 3 a.2 2 6 43 3 2 5 .. w .6 9 1S.10.
8 .. .10.4 8- .3 3 8 .5 5S .7 2 4 7 .. - .4 3 17. .. .8 7 3 3.5 4 4 2 . 4 4 3S.26.7 3 8 4 .26 .5 3 7 7.5 1 3 7 4 4 2" . 5 8 41 2 1 1 1 1.42:2
0) .42.1 2 22 12° .. . 1.58 1 2 ±12 .. .81 S 1
2 ..
.74 " .74
1 .. "1-4.366 -3.80C -3.234 - . : .:: :: :'............ .. 0 ..... .... :09::-4. 083 -3.511 -2.952 -2.386 -1.82C .626 .*85 .943 1.O2 1.061
no l/T
FIGURE 3-3 RESIDUAL PLOTS OF L605 LITERATURE SURVEY EQUATION (3-3)3-5
MCDONNELL DOUGLAS ASTRONAUTICS COMPANY. EAST
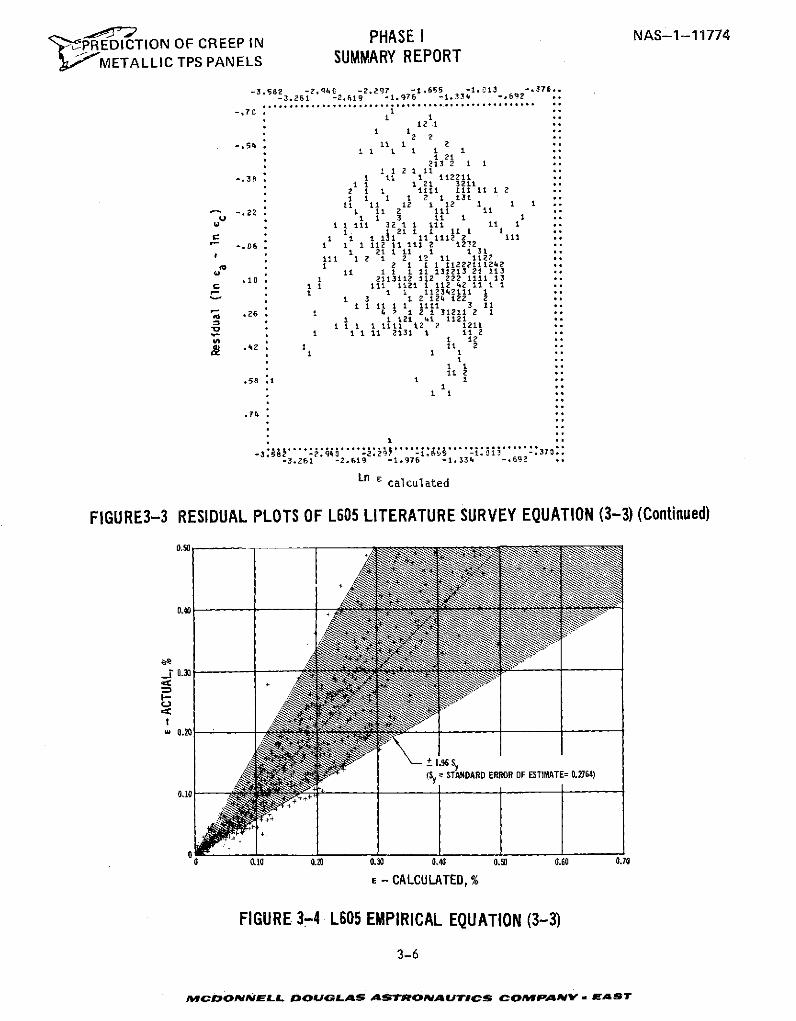
PHASE I NAS-1-11774" ,PREDICTION OF CREEP INI-- METALLIC TPS PANELS SUMMARY REPORT
-3.582 -2. 4C -2.297 -1.655 -1. 13 -.370..-3.261 -2.619 -1,976 -1.334 -.692
. ................ .. ............... .................
-. 70 1 ..1 1
-. 54. 11 1 2
1 21213 2 1 1
1 1 21 11-. 38 i i 1. 112211
i 1 1 21 32112 11 1111 ill it 1 2i 1 1 1 2 1 13111 11 12 1 12 1 1 1
.22 1 11 l2 111 iI I 1 3 1 1 ,
1 1 1 1 11 1 11 1 112 11 1112 2 12 ll
-1, 1 1 12 11 1 2 1211 21 1 it I i 31
111 1 2 1 2 1? 1 1122w 1 2 1 1 1 11222111242
11 1 1 1 11 131213 21 113.10 1 2113112 112 222 1111 13
c 1 1 11 11 111 42 11 1 I1 1 1 112342111 1*
1 3 1 2 124 122 2Sit 1 1 1 1111 3 11
U .26 1 4 2 1 2 1 31211 2 1 *I 11 121 41 1121
I I I 1 1111 12 2 1211 *1 1 1 1 2131 1 11 2
S 1 1 12.42 : 1 1 1 2
.58 1 11 1
.74
1 **
-3.261 -2.619 -1.976 -1.334 -. 692
Ln c calculated
FIGURE3-3 RESIDUAL PLOTS OF L605 LITERATURE SURVEY EQUATION (3-3) (Continued)
0.40 +
96 S(5_ = STANDARD ERROR OF ESTIMATE= 0.2764)
0.10 0.20 0.0 0.40 0.50 0.60 0.70
E - CALCULATED,%
FIGURE 3-4 L605 EMPIRICAL EQUATION (3-3)
3-6
MCDONNELL DOUGLAS ASTRONAUTICS COMrPANV- EAST
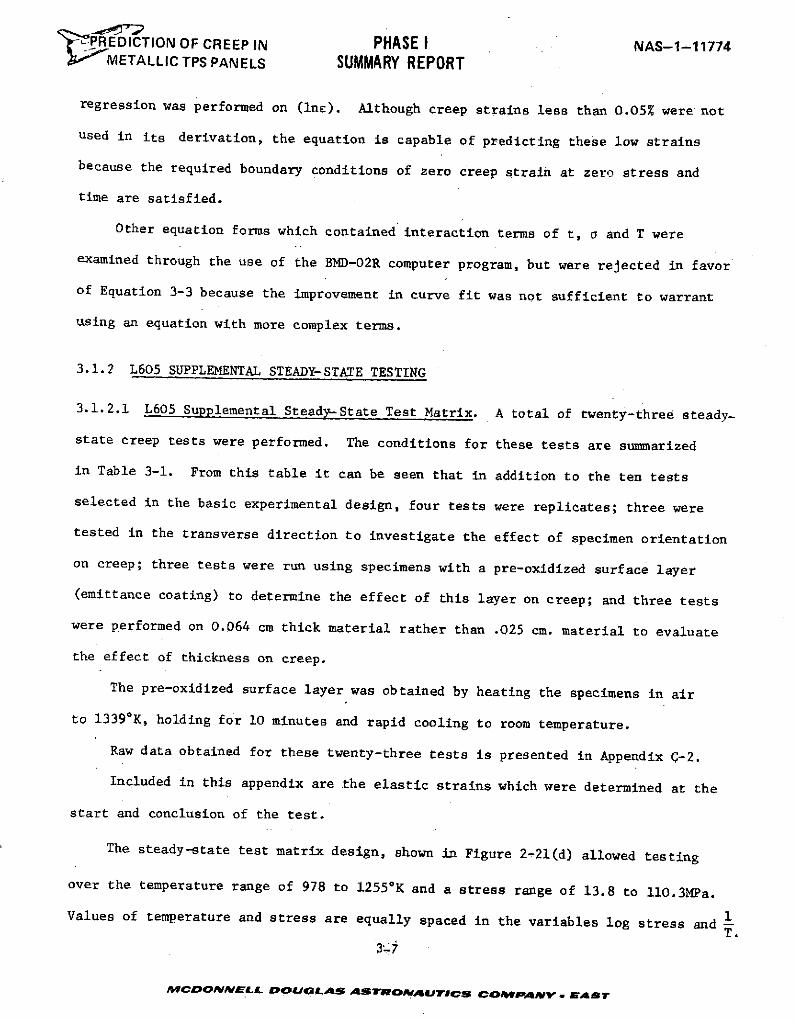
"tP.REDICTION OF CREEP IN PHASE I NAS-1-11774METALLIC TPS PANELS SUMMARY REPORT
regression was performed on (lne). Although creep strains less than 0.05% were not
used in its derivation, the equation is capable of predicting these low strains
because the required boundary conditions of zero creep strain at zero stress and
time are satisfied.
Other equation forms which contained interaction terms of t, a and T were
examined through the use of the BMD-02R computer program, but were rejected in favor
of Equation 3-3 because the improvement in curve fit was not sufficient to warrant
using an equation with more complex terms.
3.1.2 L605 SUPPLEMENTAL STEADY-STATE TESTING
3.1.2.1 L605 Supplemental Steady-State Test Matrix. A total of twenty-three steady-
state creep tests were performed. The conditions for these tests are summarized
in Table 3-1. From this table it can be seen that in addition to the ten tests
selected in the basic experimental design, four tests were replicates; three were
tested in the transverse direction to investigate the effect of specimen orientation
on creep; three tests were run using specimens with a pre-oxidized surface layer
(emittance coating) to determine the effect of this layer on creep; and three tests
were performed on 0.064 cm thick material rather than .025 cm. material to evaluate
the effect of thickness on creep.
The pre-oxidized surface layer was obtained by heating the specimens in air
to 13390K, holding for 10 minutes and rapid cooling to room temperature.
Raw data obtained for these twenty-three tests is presented in Appendix C-2.
Included in this appendix are the elastic strains which were determined at the
start and conclusion of the test.
The steady-state test matrix design, shown in Figure 2-21(d) allowed testing
over the temperature range of 978 to 12550 K and a stress range of 13.8 to 110.3MPa.
Values of temperature and stress are equally spaced in the variables log stress and 1T.
MCDOmELLa. OUGLAs ATIRONAUTCSe CscomPANY. Asy
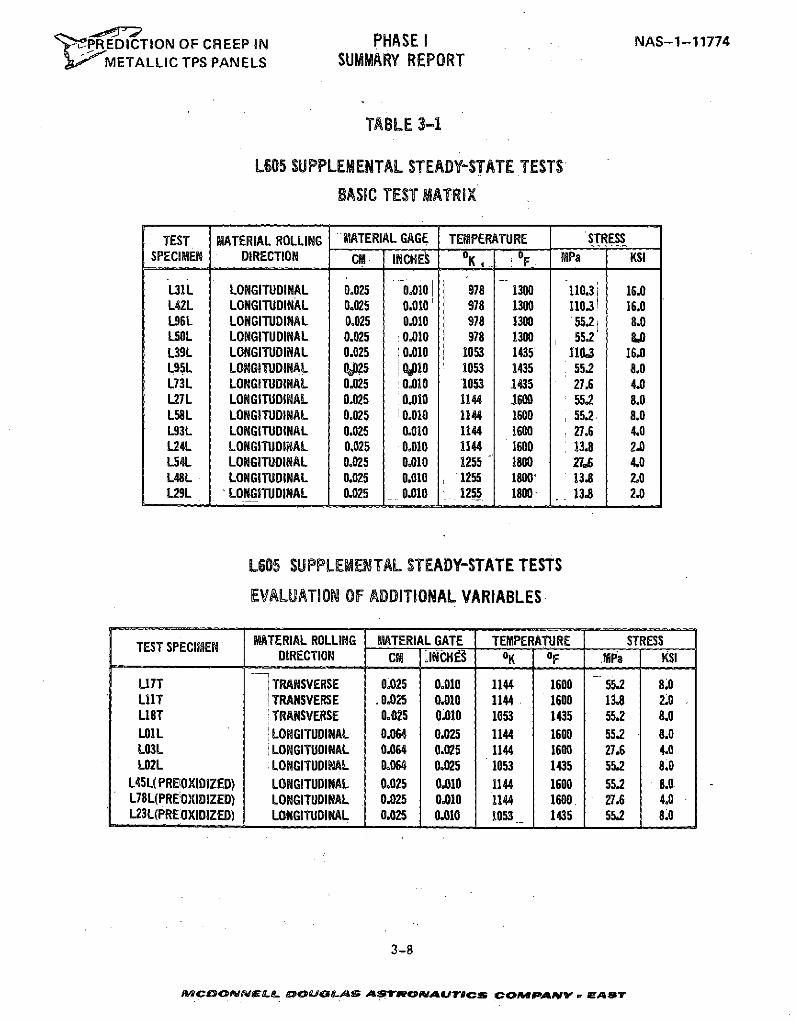
-PREDICTION OF CREEP IN PHASE I NAS-1-11774
METALLIC TPS PANELS SUMMARY REPORT
TABLE 3-1
L605 SUPPLEMENTAL STEADY-STATE TESTS
BASIC TEST MATRIX
TEST MATERIAL ROLLING MATERIAL GAGE TEMPERATURE STRESSSPECIMEN DIRECTION CM INCHES K, F MPa KSI
L31L LONGITUDINAL 0.025 0.010 978 1300 110.3 16.0L42L LONGITUDINAL 0.025 0.010 978 1300 110.3 16.0L96L LONGITUDINAL 0.025 0.010 978 1300 55.2 8.0L50L LONGITUDINAL 0.025 0.010 978 1300 55.2 u.L39L LONGITUDINAL 0.025 0.010 1053 1435 110J 16.0L95L LONGITUDINAL 05 I)10 1053 1435 55.2 8.0L73L LONGITUDINAL 0.025 0.010 1053 1435 27.6 4.0L27L LONGITUDINAL 0.025 0.010 1144 1600 55.2 8.0L58L LONGITUDINAL 0.025 0.010 1144 1600 55.2 8.0L93L LONGITUDINAL 0.025 0.010 1144 1600 27.6 4.0L24L LONGITUDINAL 0.025 0.010 1144 1600 13.8 2.0L54L LONGITUDINAL 0.025 0.010 1255 1800 27.6 4.0L48L LONGITUDINAL 0.025 0,010 1255 1800* 13.8 2.0L29L 'LONGITUDINAL 0.025 _ 0.010 1255 1800- 13.8 2.0
L605 SUPPLEMENTAL STEADY-STATE TESTS
EVALUATION OF ADDITIONAL VARIABLES
TEST SPECIMEN MATERIAL ROLLING MATERIAL GATE TEMPERATURE STRESSDIRECTION CM JINCHES oK oF MPa KSI
117T TRANSVERSE 0.025 0.010 1144 1600 55.2 8.0LlT TRANSVERSE .0.025 0.010 1144 1600 13.8 2.0LI8T TRANSVERSE 0.025 0.010 1053 1435 55.2 8.0L01L 'LONGITUDINAL 0.064 0.025 1144 1600 55.2 8.0L03L LONGITUDINAL 0.064 0.025 1144 1600 27.6 4.0L02L LONGITUDINAL 0.064 0.025 1053 1435 55.2 8.0
L45L(PREOXIDIZED) LONGITUDINAL 0.025 0.010 1144 1600 55.2 8.0L78L(PREOXIDIZED) LONGITUDINAL 0.025 0.010 1144 1600. 27.6 4.0L23L(PREOXIDIZED) LONGITUDINAL 0.025 0.010 1053 1435 55.2 8.0
3-8
IMC7OONNEL..- DOUGLAS ASTRONAUT ICS COAPAN . EAST
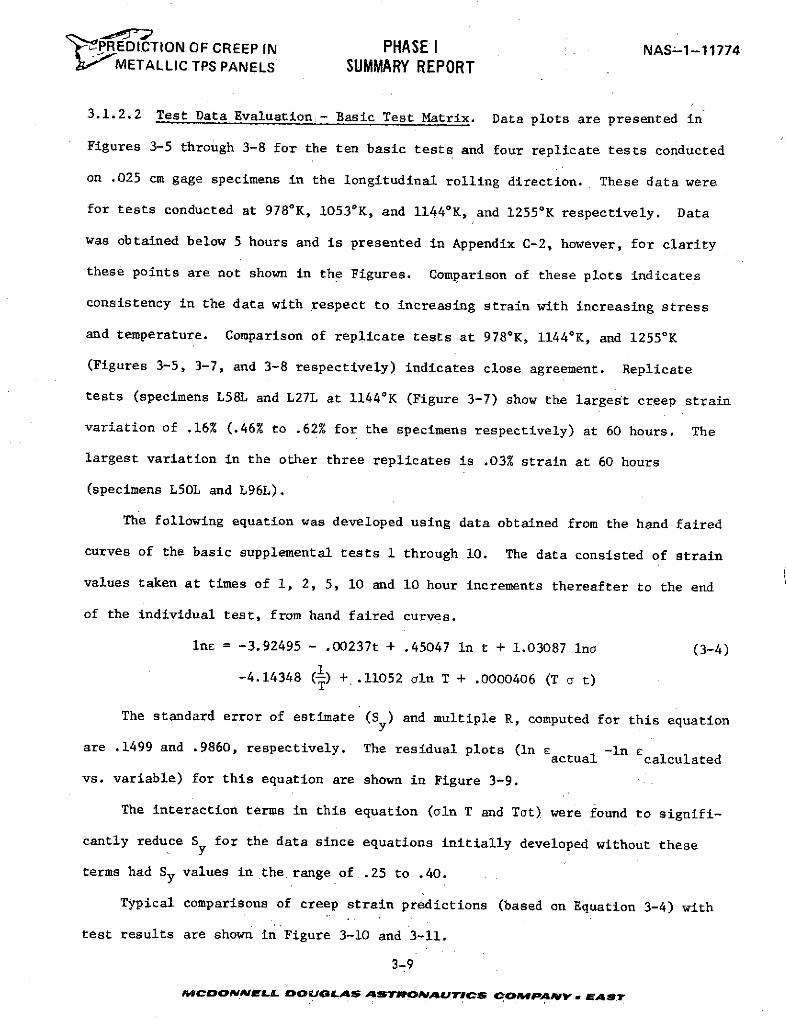
PREDI-CTIONF C CRP I IN PHASE I NAS-1-11774METALLIC TPS PANELS SUMMARY REPORT
3.1.2.2 Test Data Evaluation.- Basic Test Matrix. Data plots are presented in
Figures 3-5 through 3-8 for the ten basic tests and four replicate tests conducted
on .025 cm gage specimens in the longitudinal rolling direction. These data were
for tests conducted at 9780K, 10530K, and 11440 K, and 12550 K respectively. Data
was obtained below 5 hours and is presented in Appendix C-2, however, for clarity
these points are not shown in the Figures. Comparison of these plots indicates
consistency in the data with respect to increasing strain with increasing stress
and temperature. Comparison of replicate tests at 9780K, 11440 K, and 12550K
(Figures 3-5, 3-7, and 3-8 respectively) indicates close agreement. Replicate
tests (specimens L58L and L27L at 11440K (Figure 3-7) show the largest creep strain
variation of .16% (.46% to .62% for the specimens respectively) at 60 hours. The
largest variation in the other three replicates is .03% strain at 60 hours
(specimens L50L and L96L).
The following equation was developed using data obtained from the hand faired
curves of the basic supplemental tests 1 through 10. The data consisted of strain
values taken at times of 1, 2, 5, 10 and 10 hour increments thereafter to the end
of the individual test, from hand faired curves.
Ine = -3.92495 - .00237t + .45047 In t + 1.03087 Ina (3-4)
-4.14348 (1) + .11052 aln T + .0000406 (T a t)
The standard error of estimate (S ) and multiple R, computed for this equation
are .1499 and .9860, respectively. The residual plots (In Eactual -In scalculated
vs. variable) for this equation are shown in Figure 3-9.
The interaction terms in this equation (aln T and Tot) were found to signifi-
cantly reduce S for the data since equations initially developed without these
terms had Sy values in the range of .25 to .40.
Typical comparisons of creep strain predictions (based on Equation 3-4) with
test results are shown in Figure 3-10 and 3-11.
3-9
ACDoONNELL DOUGLAS ASTRONAUTICS COMPANy. EAST
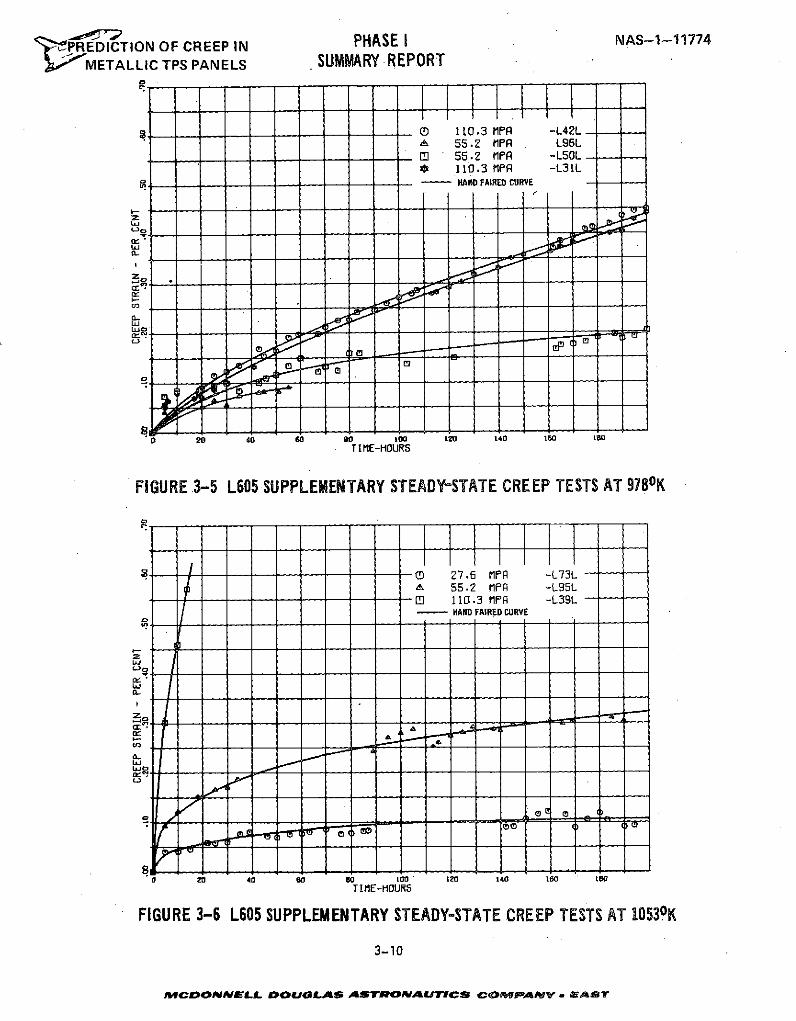
,PEDICTION OF CREEP IN PHASE I NAS-1-11774
Zo METALLIC TPS PANELS SUMMARY REPORT
S- 110.3 MPA -L42L& 55.2 MPA L96L0[ 55.2 MPR -L5OL* 110.3 MPA -L31L
- - - HAND FAIRED CURVE
TIME-MOURS
FIGURE 3-5 L5-SUPPLEMENTARY STEADY-STATE CREEP TESTS AT 978oK
t -- 27.6 MPA -L73L. 55.2 MPA -L95L[ 110.3 MPA -L39L
CL
0 20 40 60 8 10o 120 140 160 IS0
TIME-HOURS
FIGURE 3-6 L605 SUPPLEMENTARY STEADY-STATE CREEP TESTS AT 18530 K
3-10
-MCDONNELL DOULAS ASTLROAUTICS CP rAM~r -L73LAST
I-j
PaCDNNEL DOULASASTONVAATCSC0WAV*ES
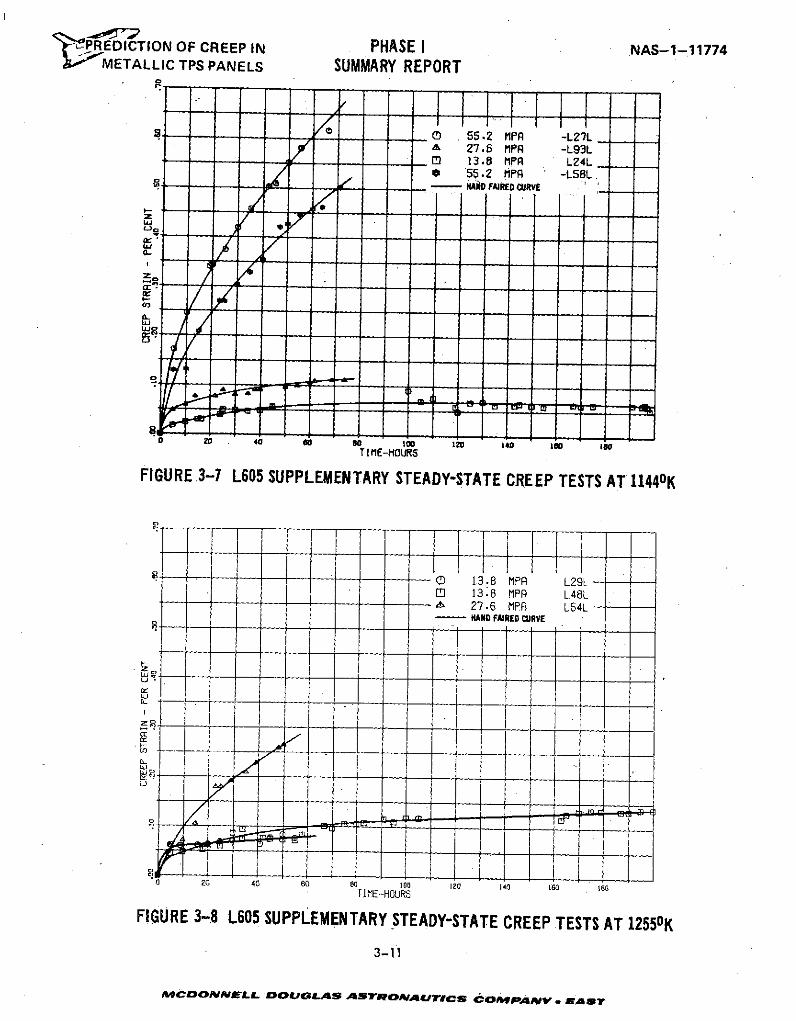
t"P REDICTION OF CREEP IN PHASE I NAS-1-11774METALLIC TPS PANELS SUMMARY REPORT
S_ 0 55.2 MPA -L27LA 27.6 MPA -L93L0 13.8 MPA LZ4L* 55.2 MPA -L58L
,9- - miiO FAIRED CURVE
TIME-HOURS
FIGURE 3-7 L605 SUPPLEMENTARY STEADY-STATE CREEP TESTS AT 1144oK
O( 13.8 MPA L29LD 13.8 MPFA L48L
-- 27-6 MPA L54L --SHAND FAIRED CURVE
1- II-
I r
0 20 40 60 80 100 120 140 160 16O
TI ME-HOURS
FIGURE 3-8 L605 SUPPLEMENTARY STEADY-STATE CREEP TESTS AT 12550K
3-11
MCDONNELL DOUGLAs AStROmAATICo- 27OMPANY . AST
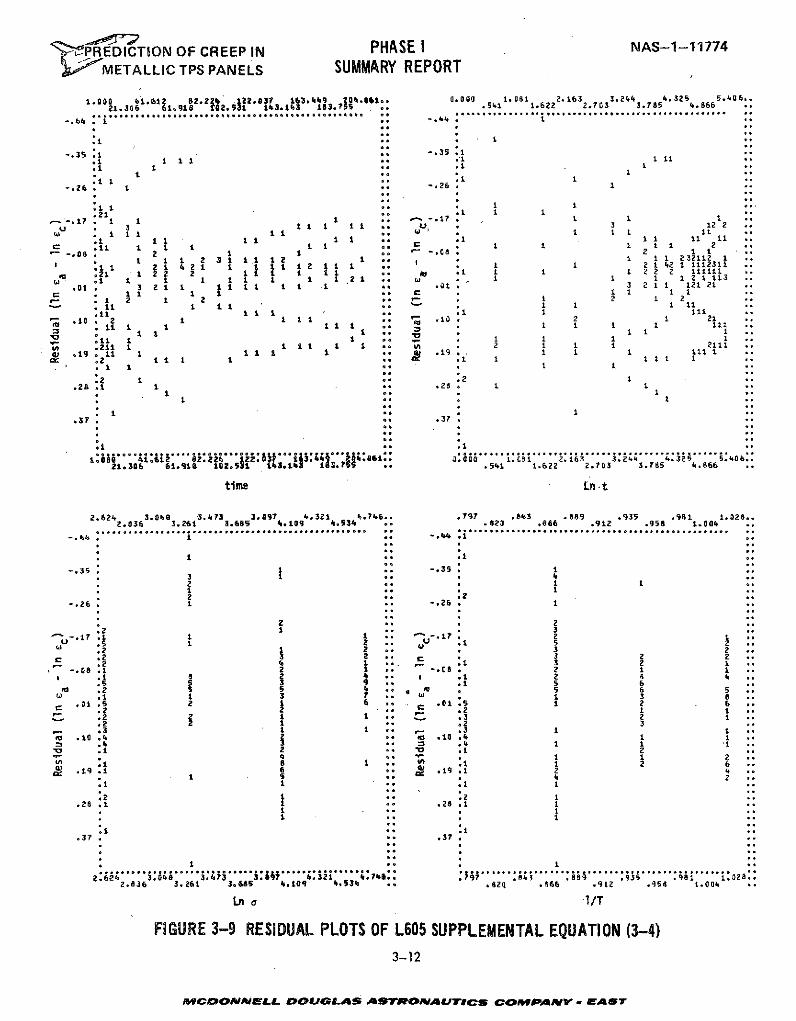
' PREDICTION OF CREEP IN PHASE I NAS-1-11774
METALLIC TPS PANELS SUMMARY REPORT
1.000 41.o612. 82221. 122.837. 163.49 204.01o 0.000 1.0 181 Z.163 3.2447 4.325 5.406.
21.306 1918 2 1 1313 .51 1.622 2.703 3.785 4.866
-. I 1 .... -*44 1
.1 ..
-. :-.3s .I ..1 .. .1 ,1
I I.1 .. .1 1
.6 1 -. 26 1
S21. 11 1-.17 1 1 1
U 3 3 12 2
2 1 ?3 1Z 1 1
1. 3 1 1 1 ** .. *1* 3 1 1121 ...21 1 1 1 .. . 11 1 1 22 1 1 .. -. 08 1 1
.11 1 1 2 1 11 12 * * 1 .1 1 1 .2 1 2 2 11111
o2 1 2 1 1 1 1 1 1 . 1 1 1 1 i 113
01. 3 2 1 1 1 1 1 1 1 Q. 01 3 2 1 1 121 21
. 1 2 .. - . 1 2 1 2
.1 2 1 11 . . 10 2 1 2 10 2 111 1 11 * . * . 1 I 11
11 1 1 2 1 111.1 1 1 1 1 1
.21lt1
2 .. ..281 1 .28 1 1o° 1 I,
.37 . -*3
.1 ** .1 **
13Ha O : i. 224 ) 13. 1 j4.861.. .000 1.181 2.163 3.244 4.325 5.406..21.306 61.918 102.531 143.043 183. **$ , .541 1.622 2.703 3.785 4.866
time Ln t
2.624 3.0480 3.473 3.897 4.321 4.746.. .797 .843 .889 .935 .981 1.028..2.836 3.261 3.685 4.109 4.534 .. .823 .866 .912 .958 1.004
.................. ................................. . ;..................................................-. 414 . -. 1 ,.
i .. .1
-. 35 1 . -. 33 1 .. 4 ..1 .* . 0o2 .. ..
-. 26. 1 1 -. 26. 1
2 . 2.2 1 .. 3
-. :1 --. 17 2 12 U :1 5
.2 1 .. 3 2
.2 3 2 C 3 2 2
.2 4 1 .- .1 3 2 1-. 08 1 2 1 , -. 8 2 1 1
.1 8 4 , 1 .1 2 8 4.5 s 3 9 1 5 6
t .2 5 5 4 o 5 6 51 1 3 1 .o • £ 3 a
.015 z 1 6 .15 1 2 6S. 2 2 5* : .2 1
S .2 * .3 2 1.2 . .2 3.3 1 -3
o .1:.1 .4 O .10.4 1 13 .4 •1 .4 1 1 1.
.1 , : .1 2" 4 . 2
.1 1 ,, . 1 2 6S.19 .1 2 4
I 5 2.1 1 .1 1
:z 1 .. :2 1.28 .1 .. .8 .1 1
° 1 °, 1
.37 . ,o .37 .
2.624 3.048 3.-7 .84 .935 .981 1.028::2.836 3.261 3.685 4.109 i4.534 , .828 .866 .912 .958 1.004 a
Lno l/T
FIGURE 3-9 RESIDUAL PLOTS OF L605 SUPPLEMENTAL EQUATION (3-4)3-12
MCDONNELL DmOUGLAS ASTRONAUTICS COMPApvNY EAST
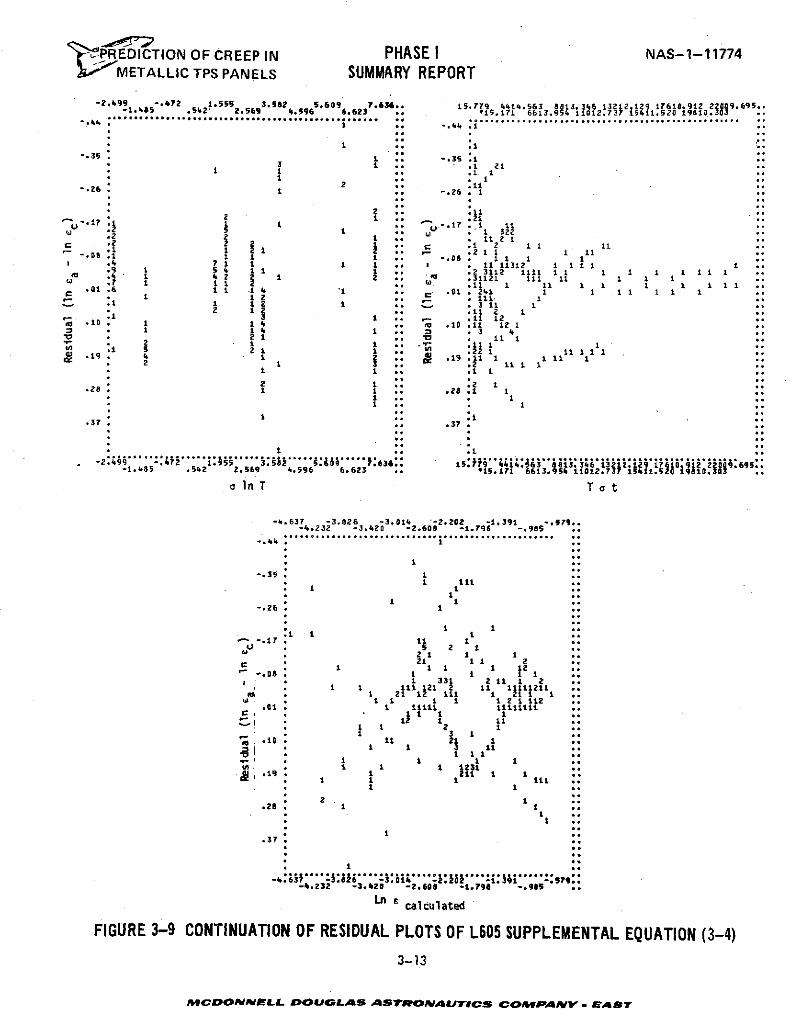
PREDICTION OF CREEP IN PHASE I NAS-1-11774METALLIC TPS PANELS SUMMARY REPORT
-2.499 -472 1.555 3.582 5.609 7.636. 15.5779 4.14.563 813.346 13212.1Z9 17610.91Z 22009.695..-1.415 .5142. 2.569 4.596 6.623 .. *15.171 6613.954 1 1012.737 15611.520 1961 .33
-, ........................................... ..................................................
I .. : .
1 1 .1 1
2 .. .1 11
I1 2 a :2 1 2 1 1 i211 2 .. .211 1 11-.2 1 1 1 1 . -. 026 1 1.4 71 1 1 1 . * 111312 1111 19 1 57 14 1 1 3112 t 1 1 1 1 1 1 1 11 1
a1t6 11 1 4- .01 241 1 1
.1-. 11.3 1 21 2 . 112 11 1 - .112
. 14 . ; .10 :11 21 1S1 . I 1 1
S2 * 1112 1 . 1 112 .1 : 11
.t * 21 1 2 a•
01 1 1 1 2o
T . 1 21 1 ,10 ,1 1 1 1 ..
" 2 1 , .2 1 1
1 I 1 1 1 1 1 1
. I : 1..
- 3 2 6. -3. 01. -2 .22 -11 -5 ..
I 111
1 I
-. 26. 1
U *5 2 1
W 1 1
S33 2 *211 1 2
t ""
11 .15 41~ 2 11 1
-.81 -,111 1. 1 -1
.21 1 11
3-1.
1 1 1o 1 3 11v 1op j;4 ,•m w v .s 4
-1~37 112 -1
1 1 1* 1 1 •
2.1 1-.28 . 1 1
-143 .o1:1 I- I ..
2 32 1 -. 9 1
3-13
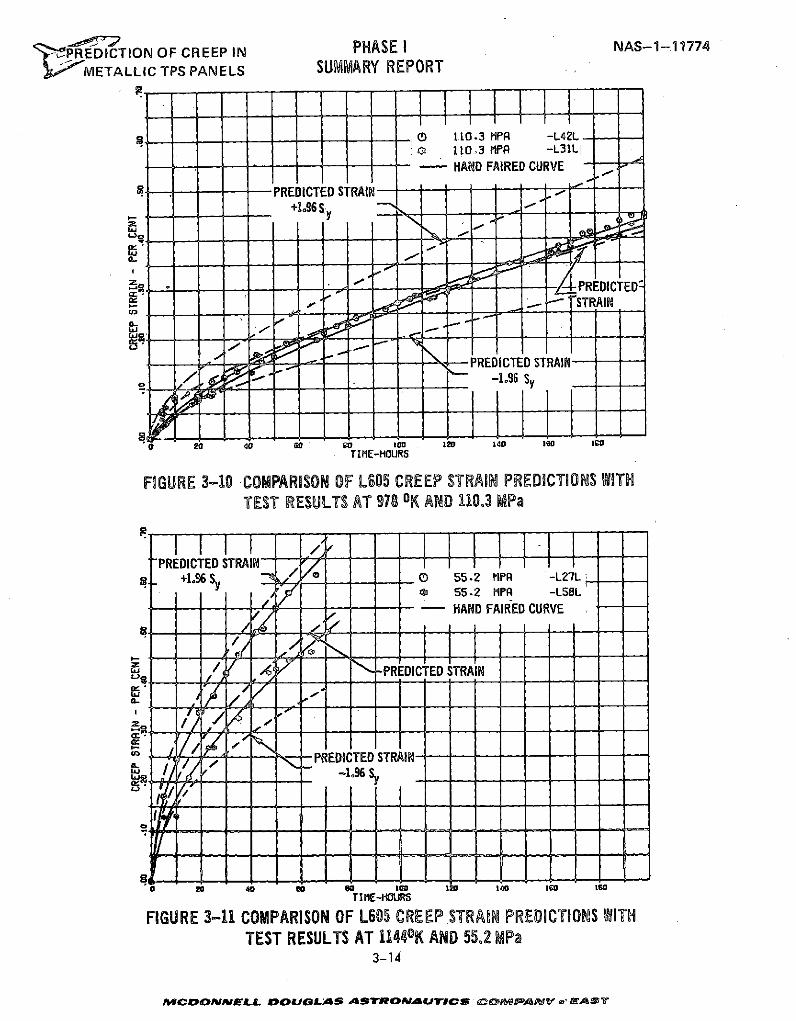
' ,PREDICTION OF CREEP IN PHASE OI NAS-1-11774
t- METALLIC TPS PANELS SUMMARY REPORT
0 110.3 MIPA -L42L-0 110 3 MPA -L31LI
S- - HAND FAIRED CURVE
PREDICTED STRAIN+1.96 S,
S-PREDICTED:, .I "STRAIN
-- ,PREDICTED STRAIN-1.96 Sy
20 40 60 "i 1 0 120 140 160 lea
TI ME-MOURS
FIGURE 3-10 COMPARISON OF L605 CREEP STRAIN PREDICTIONS WITHTEST RESULTS AT 978 oK AND 110.3 MPa
PREDICTED STRA-s +1.96 S 0 55.2 MPR -L27L
_ 55.2 HPR -L58L
o/
-- -- HAND FAIRED CURVE
PREDICTED STRAIN
TI ME--OU.SFIGURE 3-11 COMPARISON OF L605 CREEP STRAIN PREDICTONS WT
TEST RESULTS AT 114B4K AND 55.2 MPa3-14
MCDONNELL OUGLAS ASTRON-AUTICS N C- A PR O W-E
TES REUT AT ------------2 M
3-14--WCV - - - -I--
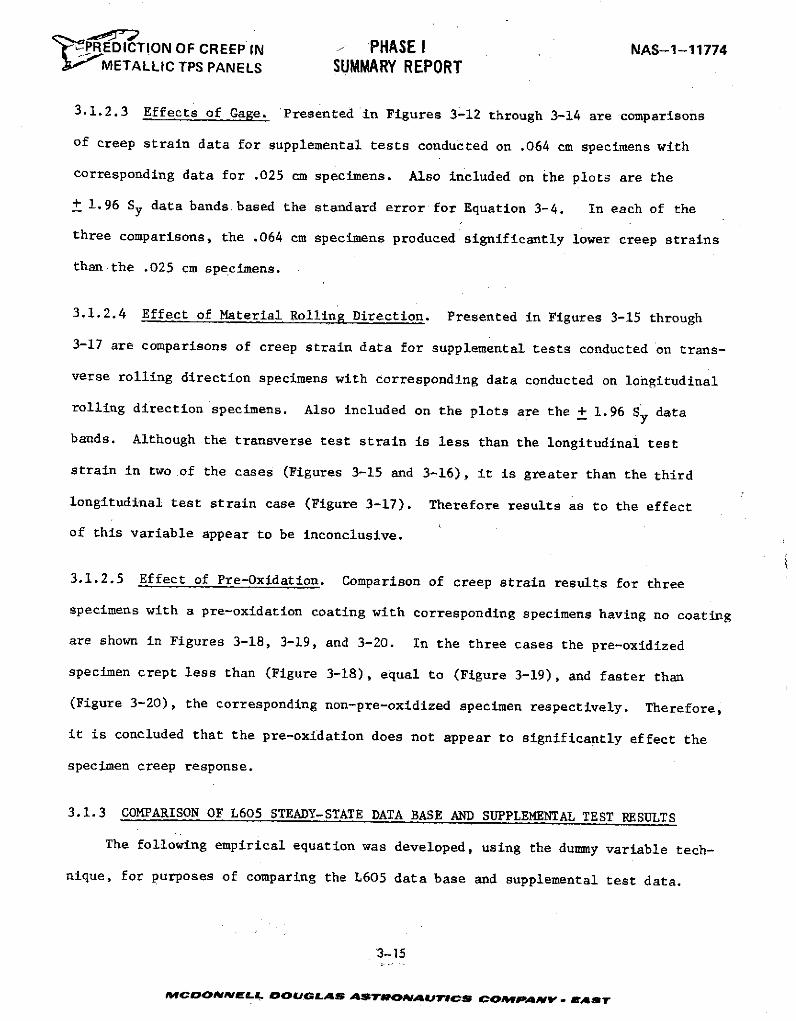
" PREDICTION OF CREEP IN PHASE I NAS-1-11774METALLIC TPS PANELS SUMMARY REPORT
3.1.2.3 Effects of Gage. Presented in Figures 3-12 through 3-14 are comparisons
of creep strain data for supplemental tests conducted on .064 cm specimens with
corresponding data for .025 cm specimens. Also included on the plots are the
+ 1.96 Sy data bands based the standard error for Equation 3-4. In each of the
three comparisons, the .064 cm specimens produced significantly lower creep strains
than the .025 cm specimens.
3.1.2.4 Effect of Material Rolling Direction. Presented in Figures 3-15 through
3-17 are comparisons of creep strain data for supplemental tests conducted on trans-
verse rolling direction specimens with corresponding data conducted on longitudinal
rolling direction specimens. Also included on the plots are the + 1.96 Sy data
bands. Although the transverse test strain is less than the longitudinal test
strain in two of the cases (Figures 3-15 and 3-16), it is greater than the third
longitudinal test strain case (Figure 3-17). Therefore results as to the effect
of this variable appear to be inconclusive.
3.1.2.5 Effect of Pre-Oxidation. Comparison of creep strain results for three
specimens with a pre-oxidation coating with corresponding specimens having no coating
are shown in Figures 3-18, 3-19, and 3-20. In the three cases the pre-oxidized
specimen crept less than (Figure 3-18), equal to (Figure 3-19), and faster than
(Figure 3-20), the corresponding non-pre-oxidized specimen respectively. Therefore,
it is concluded that the pre-oxidation does not appear to significantly effect the
specimen creep response.
3.1.3 COMPARISON OF L605 STEADY-STATE DATA BASE AND SUPPLEMENTAL TEST RESULTS
The following empirical equation was developed, using the dummy variable tech-
nique, for purposes of comparing the L605 data base and supplemental test data.
3-15
M&CDONNELL DOUGLAS ASTRONAIJTICS COMPAPYv. AEAST
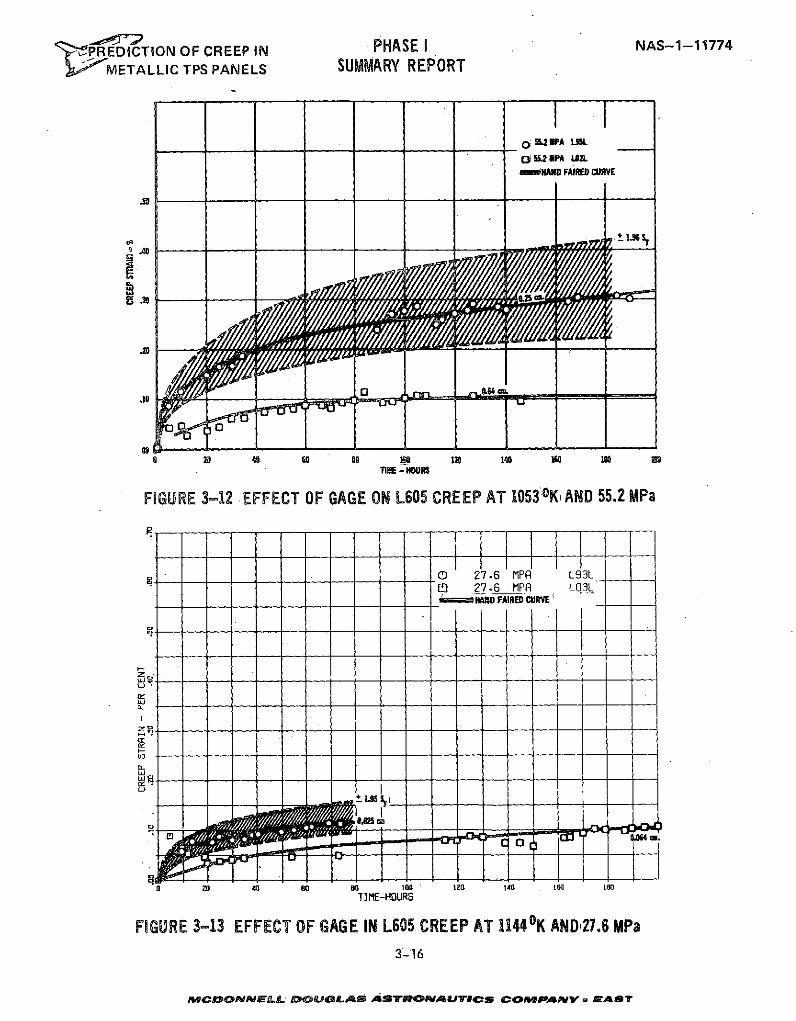
't-P REDICTION OF CREEP IN PHASE I NAS-1-11774
; "METALLIC TPS PANELS SUMMARY REPORT
_ 0L PA LSL
O 552PA 1.2L
e IAND FAIRED CURVE
.10 .
S60 80 s1 120 140 150 10 1TE -HOURS
FIGURE 3-12 EFFECT OF GAGE ON L605 CREEP AT 1053oK AND 55.2 MPa
O 27.6 MPR L93L[0 27.6 MPF LO3L7 AINsD FAIRED CURVE
c L
- ClS 20 4 6 80 100 120 140 160 10
TIME-HOURS
FIGURE 3-13 EFFECT OF GAGE IN L605 CREEP AT 1144 0 K AND'27.6 MPa
3-16
MACjdONINEmLL mouJBGiLAs AmORm&mAmUyTcS CoF PANm V EASTr
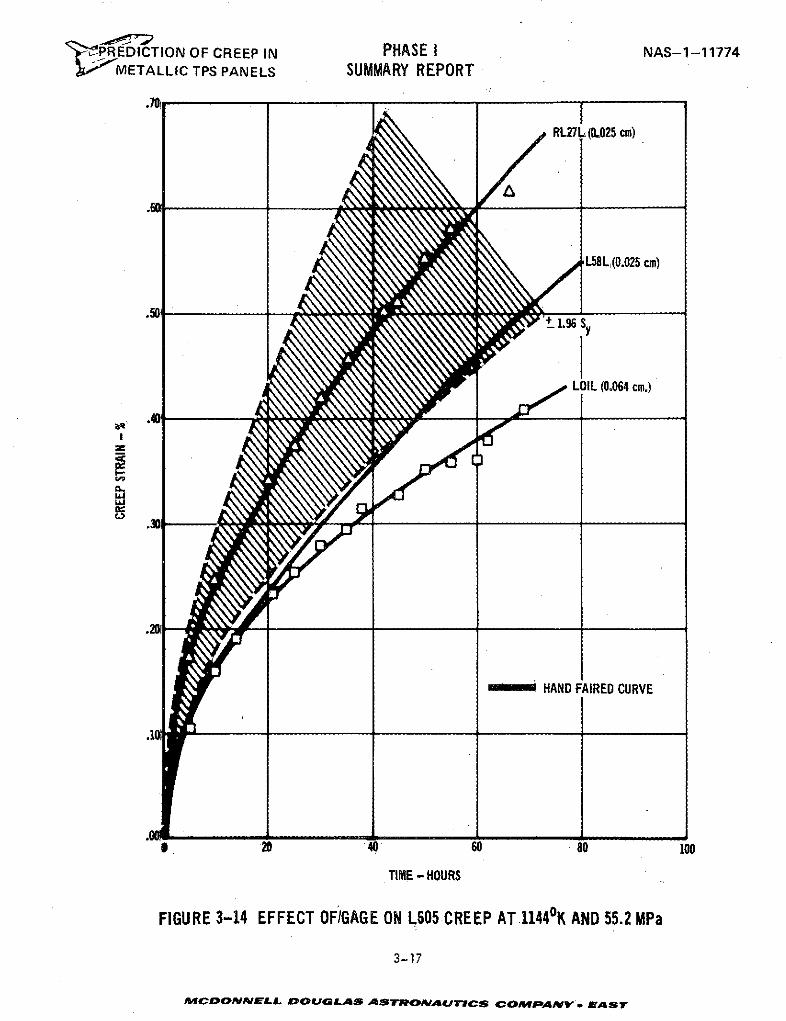
-"PREDICTION OF CREEP IN PHASE I NAS-1-11774E JMETALLIC TPS PANELS SUMMARY REPORT
.70
RL27L;(0.025 cm)
L58L,(0.025 cm)
.5_ 1.96 Sy
LO )L (0.064 cm.)
I-
U.11
.3:
mmoiHAND fAIRED CURVE
I ' 40 60 80 100
TIME - HOURS
FIGURE 3-14 EFFECT OF/GAGE ON L605 CREEP AT 11440K AND 55.2 MPa
3-17
MCDONELL DOUGoLAS ASTROmAcICSe COM *IAvv CAST
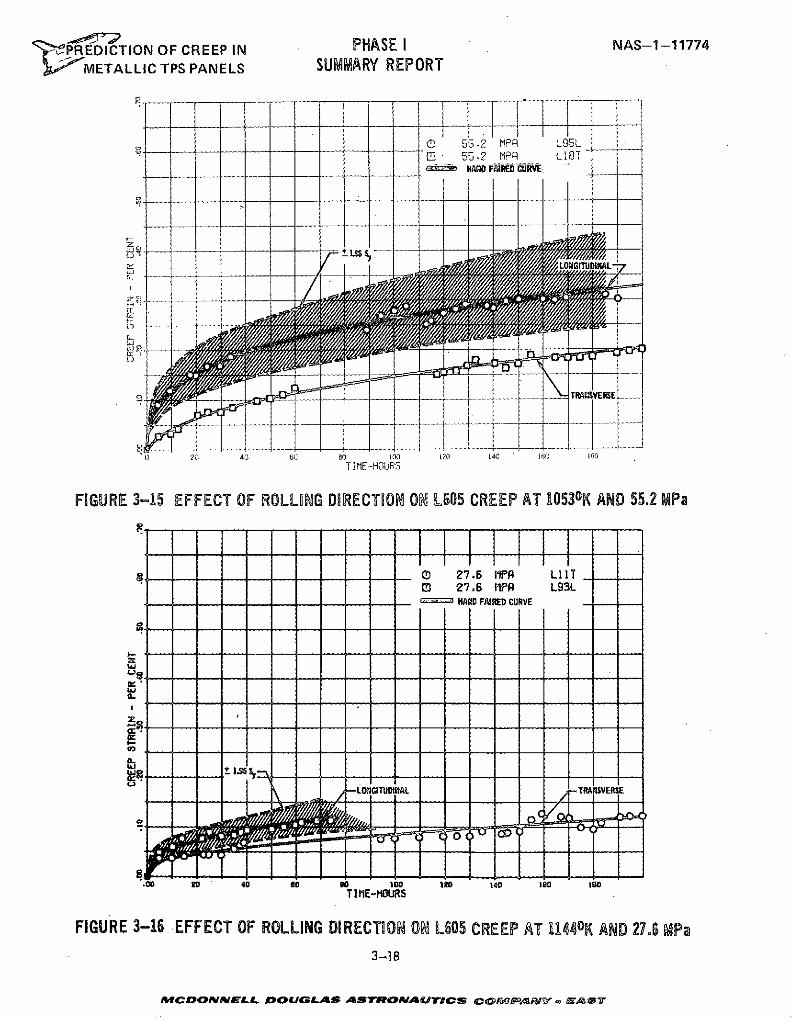
' PREDICTION OF CREEP IN PHASE I NAS-1-11774
SMETALLIC TPS PANELS SUMMARY REPORT
0 55.2 MPR L95LC] 55.2 MPR L18T
HAo FATIRED CURVE.
, LONIGITUDINAL
r ;
CL
LJ
TRAWSVERE
0 20 40 60 60 100 120 14C 160 to
TIME-HOURS
FIGURE 3-15 EFFECT OF ROLLING DIRECTION ON L605 CREEP AT 1053 0K AND 55.2 MPa
O 27.6 MPR LllT0 27.6 MPA L93L___ - HAND FAIRED CURVE
0
L.
• 40 60 s o 10 10 140 160 INOTIME-HOURS
FIGURE 3-16 EFFECT OF ROLLING DIRECTION ON L605 CREEP AT 1140oK AND 27.6 MPa3-18
LMCVVOiONELL DOURGLAS ANrSOVERAS'rEs C 0Wn R WaV. AT
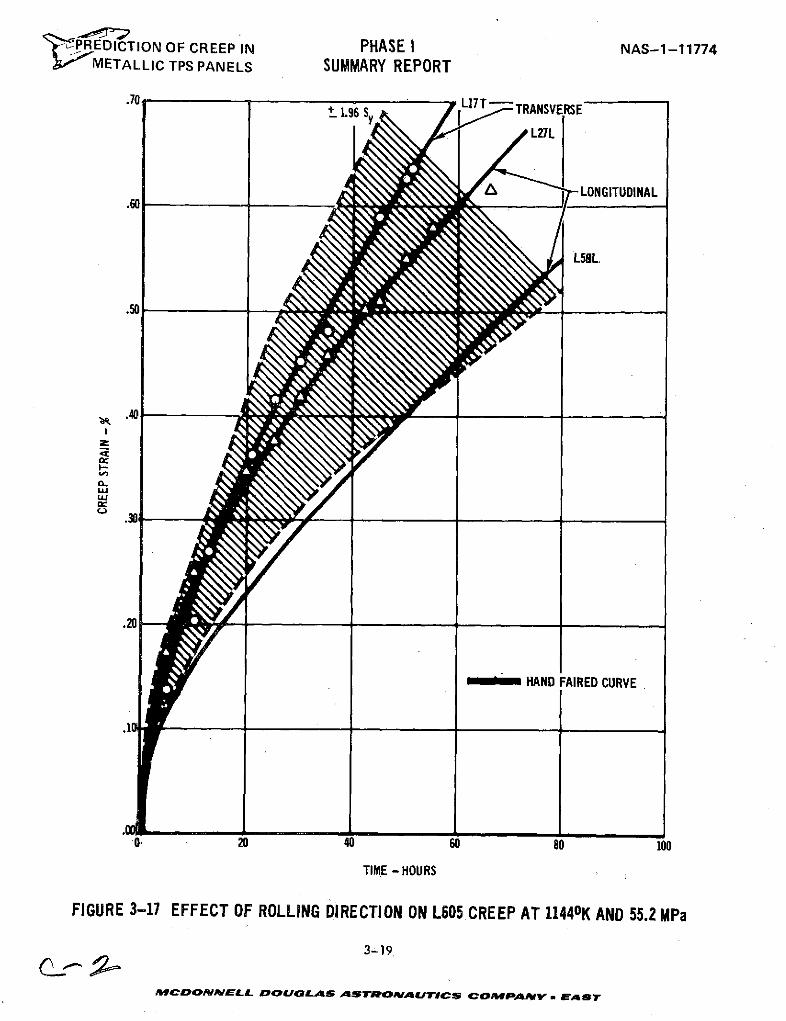
P kEDICTION OF CREEP IN PHASE I NAS-1-11774METALLIC TPS PANELS SUMMARY REPORT
.70 L17T-TR1.96 S TRANSVERSE
L27L
.60 LONGITUDINAL
L58L
.50
.40
I-
.20
HAND FAIRED CURVE
01 20 40 60 80 100
TIME - HOURS
FIGURE 3-17 EFFECT OF ROLLING DIRECTION ON L605 CREEP AT 11440 K AND 55.2 MPa
3- 19
MCDON ELL DOUGLAS ASTRONAUTICS COMPANY * EAST
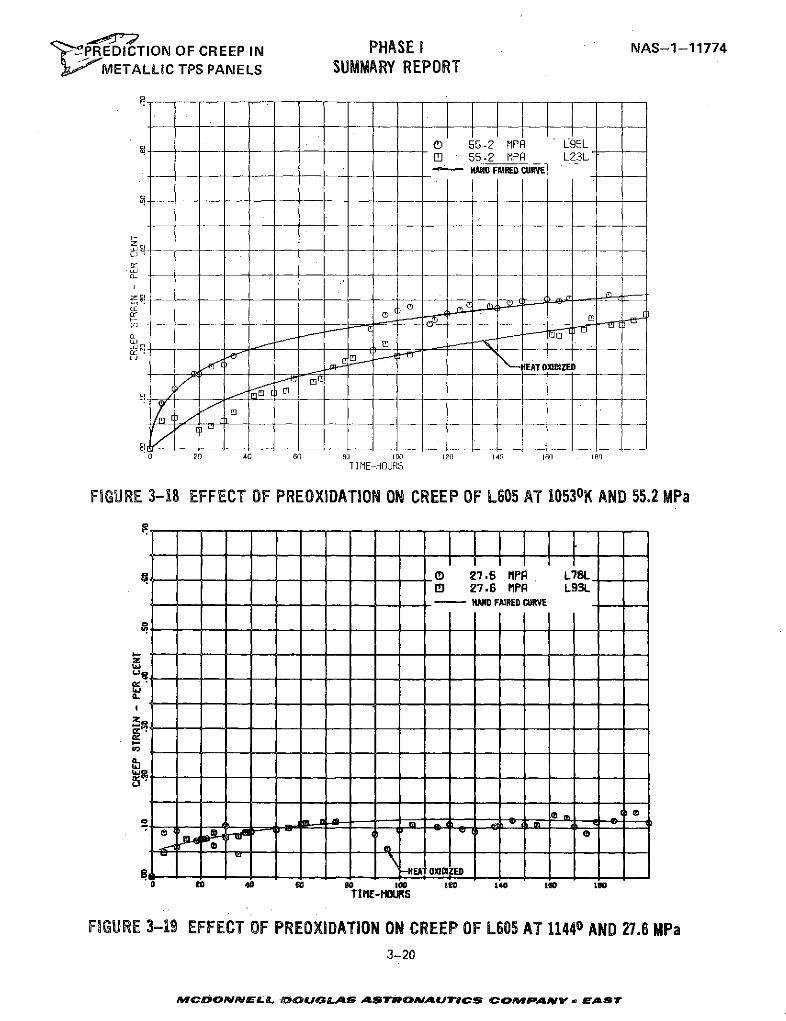
'PREDICTION OF CREEP IN PHASE I NAS-1-11774METALLIC TPS PANELS SUMMARY REPORT
-D 55-2 MPR L95L1] 55.2 MPR L23L
HAND FAIRED CURVE
_ i
TIME-HOURS
FIGURE 3-18 EFFECT OF PREOXIDATION ON CREEP OF L505 AT 1053°K AND 55.2 MPa
( 27.6 MPI L78Ln 27.6 PP L93L
- HAND FAIRED CURVE
I-
LO
I I
TIE--HOURS
FIGURE 3-19 EFFECT OF PREOXIDATION ON CREEP OF L605 AT 144053 0K AND 5527.8 MPa
MCONELL DUGAl! ASTR T27.6 COMPA L93L ST
- to- - - - - - --too-to-1 - -too-I -
3--
mc ov0~#i ___eL~ __rev urc ccm-jv.m m
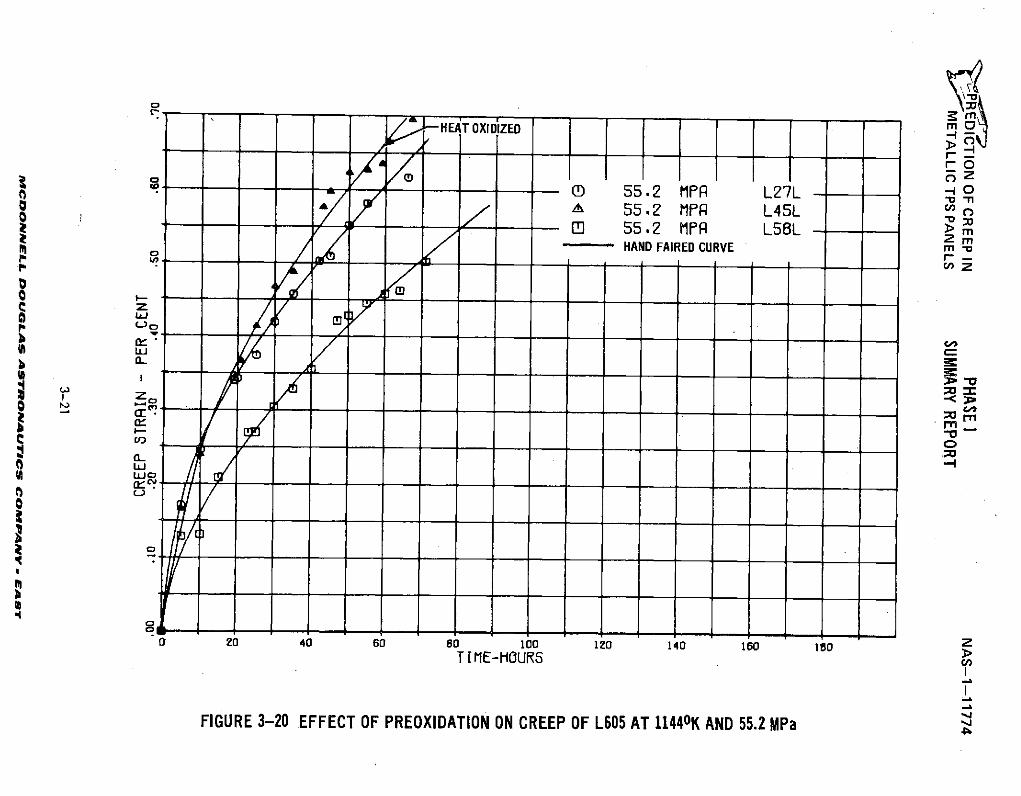
HEAT OXIDIZED mm
r-
o C ozSQ0 55.2 MP L27L o
A 55.2 MPR L45LDl 55.2 MPR L5L 2 MHAND FAIRED CURVE m
*co*
§ LU
2 -0 40 60 80 I1o 10 140 160 10 2
- I ME-OUS C
I 3I
FIGURE 3-20 EFFECT OF PREOXIDATION ON CREEP OF L605 AT 1144°K AND 55.2 MPa
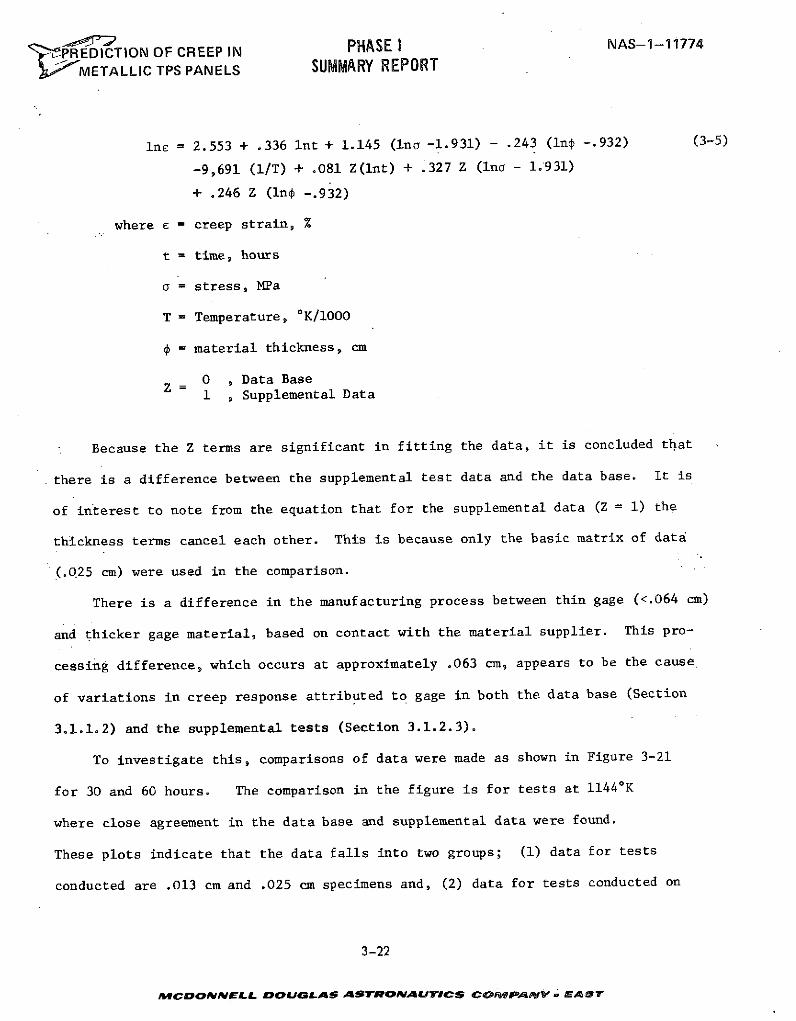
" PREDICTION OF CREEP IN PHASE I NAS-1-11774
METALLIC TPS PANELS SUMMARY REPORT
Ine = 2.553 + .336 Int + 1.145 (Ino -1.931) - .243 (In4 -.932) (3-5)
-9,691 (1/T) + .081 Z(lnt) + .327 Z (Ina - 1.931)
+ .246 Z (In -.932)
where E = creep strain, %
t = time, hours
a = stress, MPa
T = Temperature, OK/1000
= material thickness, cm
0 , Data BaseZ =1 , Supplemental Data
Because the Z terms are significant in fitting the data, it is concluded that
there is a difference between the supplemental test data and the data base. It is
of interest to note from the equation that for the supplemental data (Z = 1) the
thickness terms cancel each other. This is because only the basic matrix of data
(.025 cm) were used in the comparison.
There is a difference in the manufacturing process between thin gage (<.064 cm)
and thicker gage material, based on contact with the material supplier. This pro-
cessing difference, which occurs at approximately .063 cm, appears to be the cause
of variations in creep response attributed to gage in both the data base (Section
3.1.1.2) and the supplemental tests (Section 3.1.2.3).
To investigate this, comparisons of data were made as shown in Figure 3-21
for 30 and 60 hours. The comparison in the figure is for tests at 11440K
where close agreement in the data base and supplemental data were found.
These plots indicate that the data falls into two groups; (1) data for tests
conducted are .013 cm and .025 cm specimens and, (2) data for tests conducted on
3-22
MCONNELL DOUGLAS ASTRONAUTICS COe~PAny P EAST
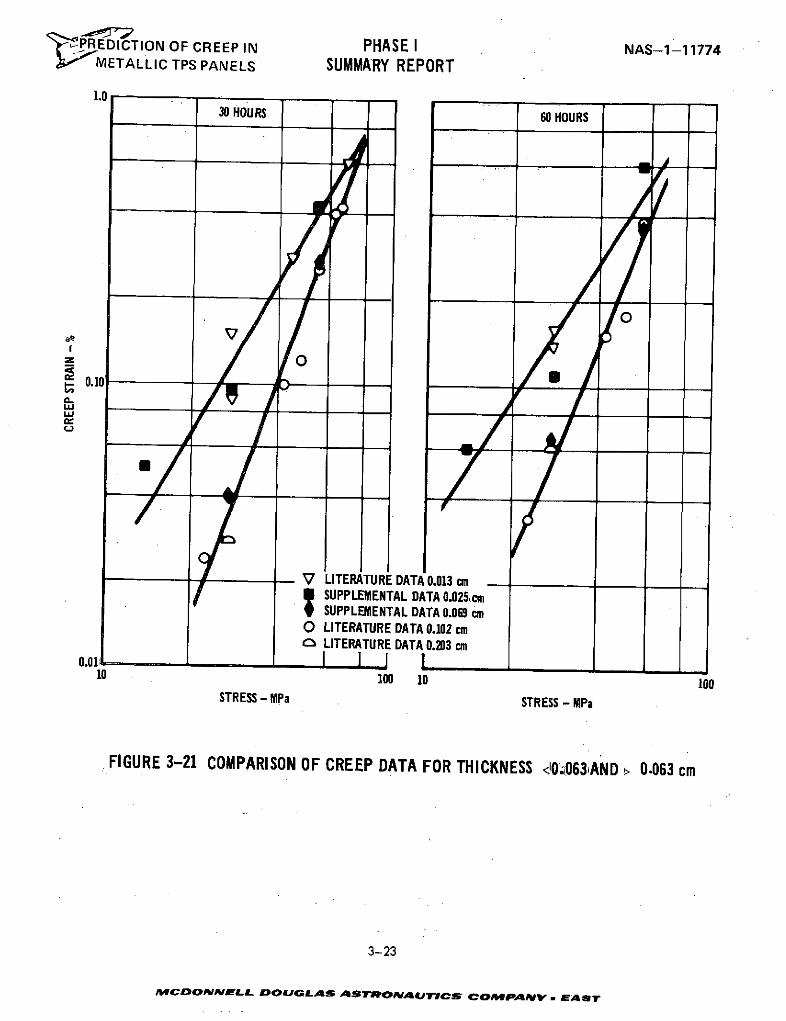
L'P EDICTION OF CREEP IN PHASE I NAS-1-11774METALLIC TPS PANELS SUMMARY REPORT
30 HOURS 60 HOURS
vO
0.10
w
V LITERATURE DATA 0.013 cmanSUPPLEMENTAL DATA 0.025,cmSUPPLEMENTAL DATA 0.069 cm
O LITERATURE DATA 0.102 cmn LITERATURE DATA 0.203 cm
0.01 I10 100 10 100
STRESS - MPa STRESS - MPa
FIGURE 3-21 COMPARISON OF CREEP DATA FOR THICKNESS 4'0:063,AND 0.063 cm
3-23
MCDONaNELL DOUGLAS ASTRONAUTICS COMPmANVY. ASTr
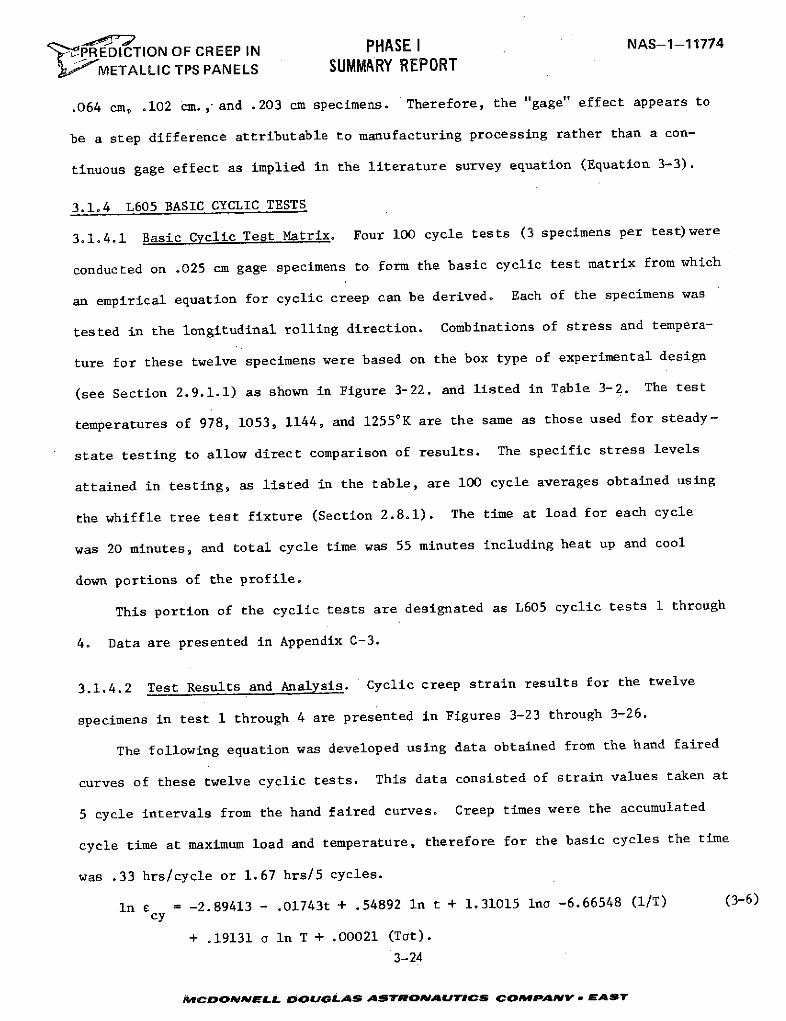
,PRREDICTION OF CREEP IN PHASE I NAS-1-11774
J METALLIC TPS PANELS SUMMARY REPORT
.064 cm, .102 cm., and .203 cm specimens. Therefore, the "gage" effect appears to
be a step difference attributable to manufacturing processing rather than a con-
tinuous gage effect as implied in the literature survey equation (Equation 3-3).
3.1.4 L605 BASIC CYCLIC TESTS
3.1.4.1 Basic Cyclic Test Matrix. Four 100 cycle tests (3 specimens per test)were
conducted on .025 cm gage specimens to form the basic cyclic test matrix from which
an empirical equation for cyclic creep can be derived. Each of the specimens was
tested in the longitudinal rolling direction. Combinations of stress and tempera-
ture for these twelve specimens were based on the box type of experimental design
(see Section 2.9.1.1) as shown in Figure 3-22. and listed in Table 3-2. The test
temperatures of 978, 1053, 1144, and 12550K are the same as those used for steady-
state testing to allow direct comparison of results. The specific stress levels
attained in testing, as listed in the table, are 100 cycle averages obtained using
the whiffle tree test fixture (Section 2.8.1). The time at load for each cycle
was 20 minutes, and total cycle time was 55 minutes including heat up and cool
down portions of the profile.
This portion of the cyclic tests are designated as L605 cyclic tests 1 through
4. Data are presented in Appendix C-3.
3.1.4.2 Test Results and Analysis. Cyclic creep strain results for the twelve
specimens in test 1 through 4 are presented in Figures 3-23 through 3-26.
The following equation was developed using data obtained from the hand faired
curves of these twelve cyclic tests. This data consisted of strain values taken at
5 cycle intervals from the hand faired curves. Creep times were the accumulated
cycle time at maximum load and temperature, therefore for the basic cycles the time
was .33 hrs/cycle or 1.67 hrs/5 cycles.
In c = -2.89413 - .01743t + .54892 In t + 1.31015 Ina -6.66548 (1/T) (3-6)cy
+ .19131 a In T + .00021 (Tat).
3-24
MICDONNELL ABOuLAS ASTRONAUTICS COMPANV - EA ST
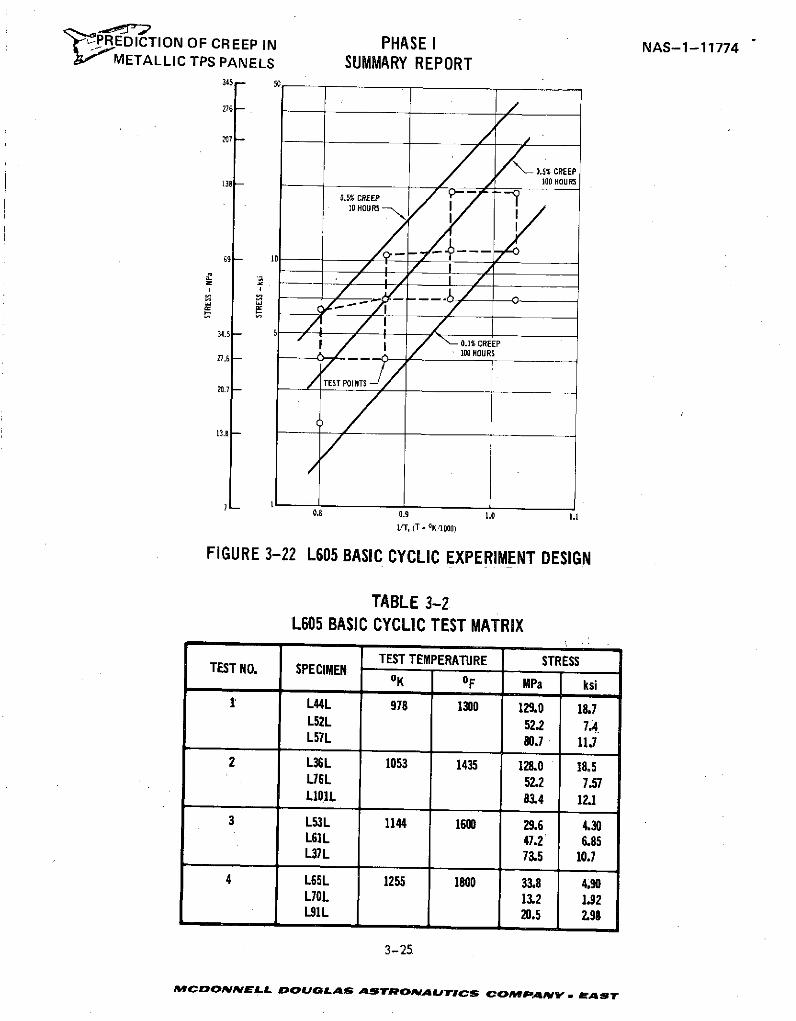
P 9REDICTION OF CREEP IN PHASE I NAS-1-11774I METALLIC TPS PANELS SUMMARY REPORT
345 50
207
0.5% CREEP138 -100 HOURS
180.5% CREEP
10 HOURS
,o .u/s - ,
34.5 - 50.1% CREEP
~27.6 100 HOURS
TEST POINTS20.7
13.8
0.8 0.9 1.0 1.1vT, (T= OK 1000)
FIGURE 3-22 L605 BASIC CYCLIC EXPERIMENT DESIGN
TABLE 3-2L605 BASIC CYCLIC TEST MATRIX
TEST TEMPERATURE STRESSTEST NO. SPECIMENOK OF MPa ksi
1 L44L 978 1300 129.0 18.7L52L 52.2 7.4L57L 80.7 11.
2 L36L 1053 1435 128.0 18.5L76L 52.2 7.57L01IL 83.4 12.1
3 L53L 1144 1600 29.6 4.30L61L 47.2 6.85L37L 73.5 10.7
4 L65L 1255 1800 33.8 4.90L70L 13.2 1.92L91L 20.5 2.98
3-25
MCDONNELL DOUGLAS ASTRONAUTICS COMPANY -. AST
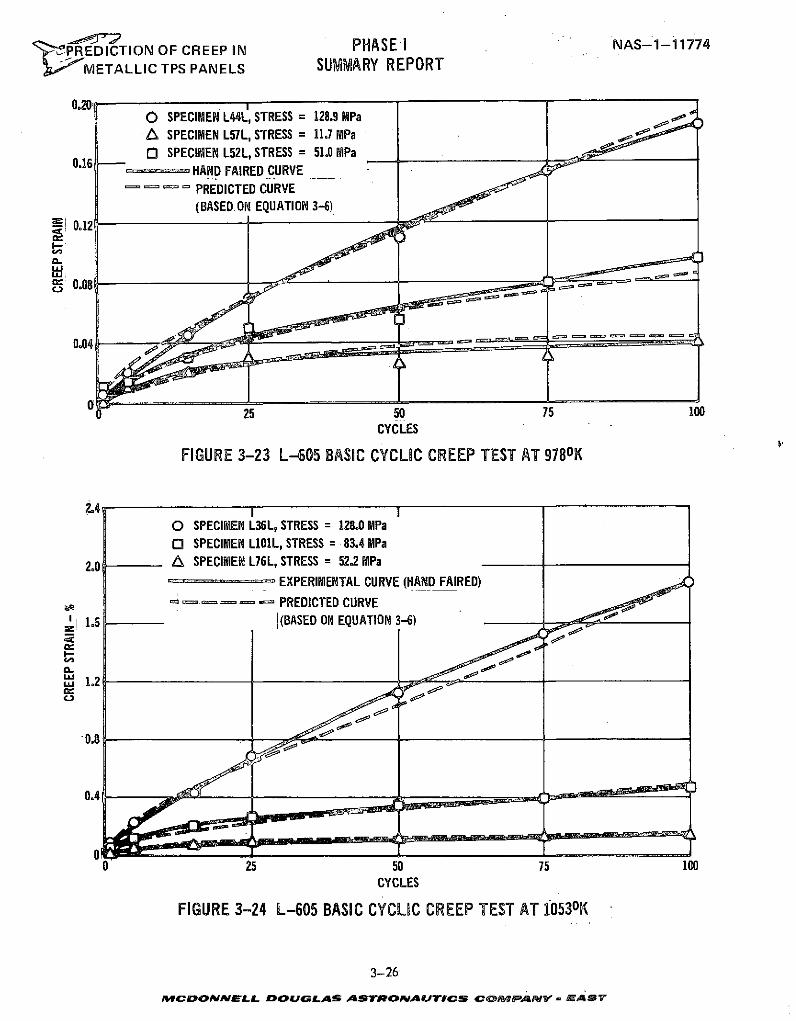
,PR EDICTION OF CREEP IN PHASE I NAS-1-11774I METALLIC TPS PANELS SUMMARY REPORT
0.201O SPECIMEN L44L, STRESS = 128.9 MPa
3 SPECIMEN L52L, STRESS = 51.0 MPa0.1 0.16 HAND FAIRED CURVE ,
FU PREDICTED CURVE(BASED.ON EQUATION 3-6)
S0.12
0.08
00 25 50 75 100CYCLES
FIGURE 3-23 L-605 BASIC CYCLIC CREEP TEST AT 978oK
2.4 1O SPECIMEN L36L, STRESS = 128.0 MPao SPECIMEN L01L, STRESS = 83.4 MPa
2.0 ,6 SPECIMEN L76L, STRESS = 52.2 MPa
EXPERIMENTAL CURVE (HAND FAIRED)
--. PREDICTED CURVE
1 1.6 - 1(BASED ON EQUATION 3-6)I-C-
n 1.2-
0.8
O 25 50 75 100CYCLES
FIGURE 3-24 L-605 BASIC CYCLIC CREEP TEST AT 1053 0K
3-26'
MCDONNELL DOUGLAS ASTRONAUTICS COMPAIV a, ,ST
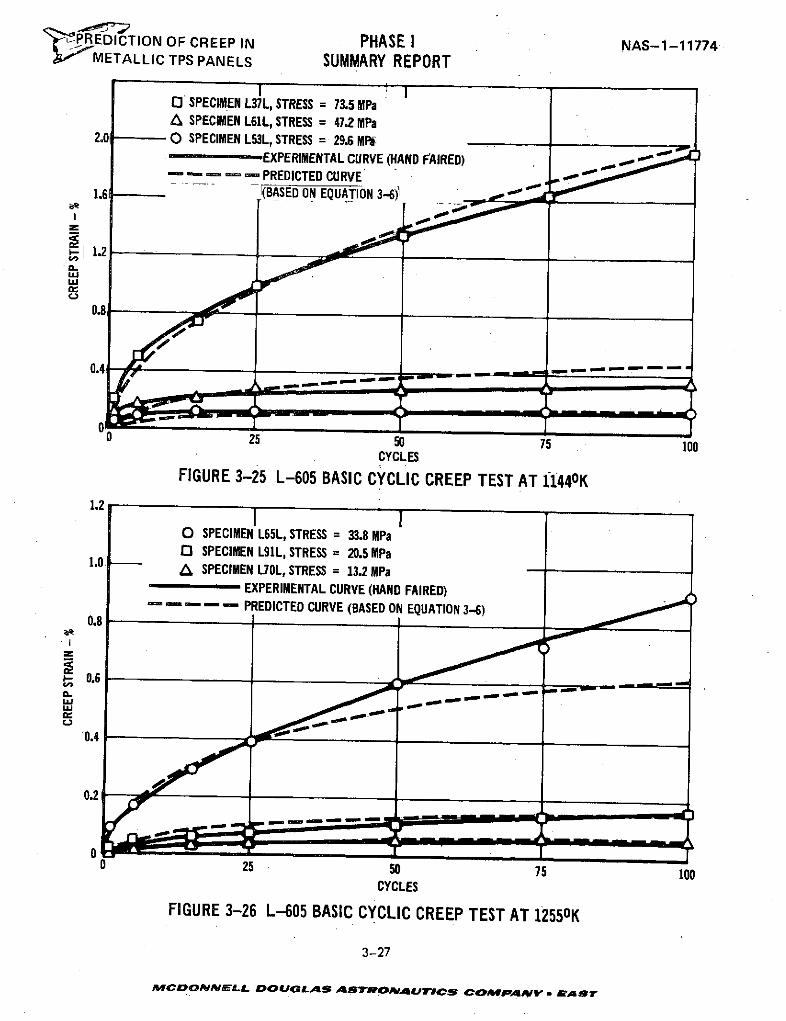
'PREDICTION OF CREEP IN PHASE I NAS-1-11774METALLIC TPS PANELS SUMMARY REPORT
o SPECIMEN L37L, STRESS = 73.5 MPaA SPECIMEN L61L, STRESS = 47.2 MPa
2.01: O SPECIMEN L53L, STRESS = 29.6 MRi-EXPERIMENTAL CURVE (HAND FAIRED) -
- - - - PREDICTED CURVE1.6 (BASED ON EQUATION 3-6)1
1.2
0.8 SPECIMEN L5L, STRESS = 33.8 MPa
00 25 50 75 100CYCLES
FIGURE 3-25 L-605 BASIC CYCLIC CREEP TEST AT 11440K
O SPECIMEN L65L, STRESS = 33.8 MPa0 SPECIMEN L91L, STRESS = 20.5 MPaA SPECIMEN L70L, STRESS = 13.2 MPa
EXPERIMENTAL CURVE (HAND FAIRED)- . - PREDICTED CURVE (BASED ON EQUATION 3-6)
0.8
0.2
0 25 50 75 100CYCLES
FIGURE 3-26 L-605 BASIC CYCLIC CREEP TEST AT 12550K
3-27
MCDONNELL DOUGLAS ASTROAAUTICS COMPANY m. EA S
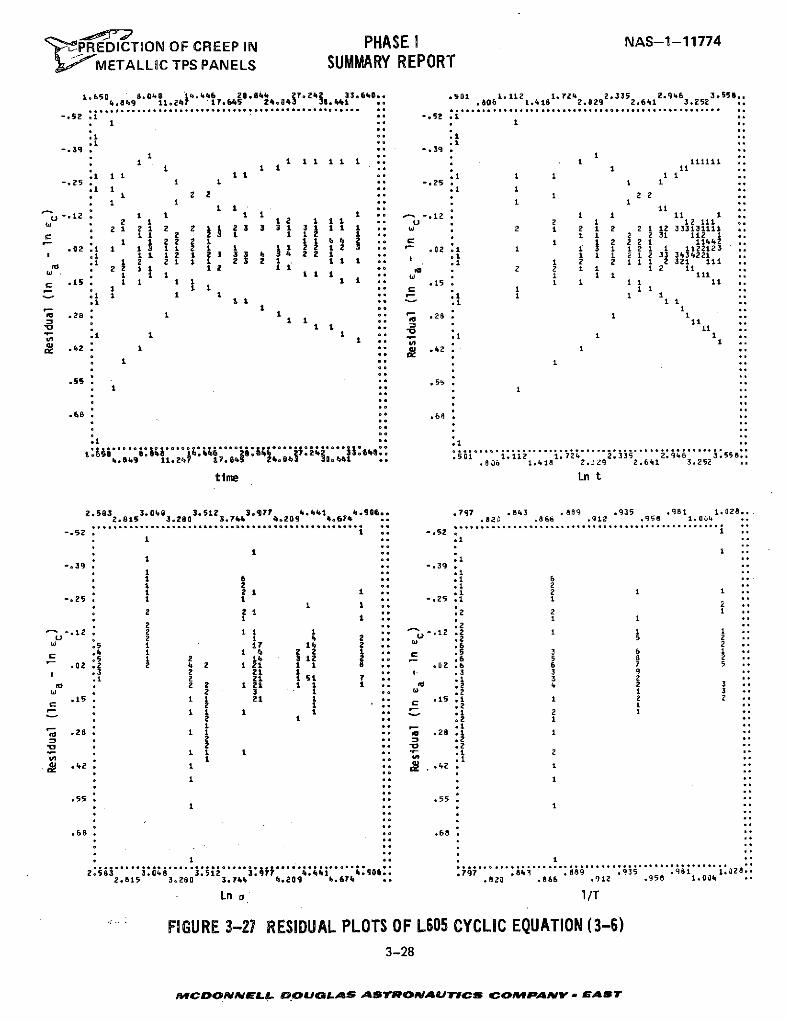
, 'P EDICTION OF CREEP IN PHASE I NAS-1-11774METALLIC TPS PANELS SUMMARY REPORT
1.650 8.0 t1.4 6 208..4 247.2 33.640. .501 1.112 1.724 2.335 2.946 3.558..849 11247 17.645 24.03 30.441 .. .806 1.418 2.029 2.6 1 3.252 ..
-.52 .1 *. -.52 .1 .
.1 *. .1
-. 39 . ** -. 39 .
1 1 1 1 1 1 . . 11111 ..± 11 ** . 11 ..
.1 1 i ** .1 1-.25 . -. 25 . 1
1 22 1 2 ..1 1 1 1
11 * ..
-. 212 . 1 1 1 1 1 ,0 -. 12 2 1 1 11 1
.2 1 2 1 2 2 2 3 3 31 31 1 w 2 1 2 1 2 2 1 12 333131111 ..c 1 1 2 Z 1 * 1 1 2 2 31 112 ..
- . 1 12 2 2 1 1 1 4 : 1 1 2 2 2 1 11442 ..02 1 1 1 11 1 2 - .2 .1 1 1 3 1 1 2 1 1 1122123
1 .1 1 12 1 2 3 3 31 4 2 1 .1 1 i 1 2 1 33 3434221S 2 2 1 1 1 2 2 1 1 1 1 .1 1 2 2 1 11 2 321 111 ..
S 2 i 1 12 11 * 2 2 1 1 1 2 11S 1 1 1 1 11 .. C 1 1 1 111 ..
.15 1 1 1 1 1 . 15 • 1 1 11 ..
1 1 1 .1 1 1 1
..28 1 1 281 1 ... 1 * it 1 1111 ..S.1 1 1 * - .1 1 1 .
.42 ..42 1
.55 . 55S 11
.68 .68
4.845 11,267 1.645 21.043 8. e , .86 1.418 2.j29 2.641 3.252
time Ln t
2.583 3.068 3.512 3.977 4.441 4.900.. .797 .843 . 889 .935 .981 1.028.2.815 3.280 3.744 4.209 4.674 *. .823 .866 .912 .988 1.00' .
-. 52 1-.52 .
-. 39 . ** -. 39
1 6 .* .1 61 2 * .1 21 2 1 1 ,, .1 2 1 1 .
-. 25. 1 1 * -. 25 .1 11 1 2 .
2 2 1 .2 2 11 .. . I 1
-.12 * 2 2 1 1 :1.2 5 1U 2 1 1. 2 1 4 2 .2 5 2
S .5 1 17 14 2 .6 2.4 1 1 4 22 1 * .5 3 6 1
C s 1 2 14 312 5 2a.0 2 2 42 121 1 1 8 : .2.6 6 7 5
S .3 2 2 .. .3 3 9.1 1 151 .1 3 2S2 1 21 1 .. .2 4 2 3
2 3 1 .2 1 3.15 1 21 1 .0 .15 1 2 2
1 1 1 .1 22 1 ,0 .2
.281 1 . .2 12 . .2
S..1 2
.42 . 1 .42 . 1
1 o. . 1
.68 ,0 .68.. . °° .°°
.81 31 1.
2.815 3.280 3.744 4.209 4.674 . .820 .866 .912 .958 1.004
Ln o 1/T
FIGURE 3-27 RESIDUAL PLOTS OF L605 CYCLIC EQUATION (3-6)3-28
coCDONNELL pDOUGLAS ASTRONAUTICS COMPANY , EAST
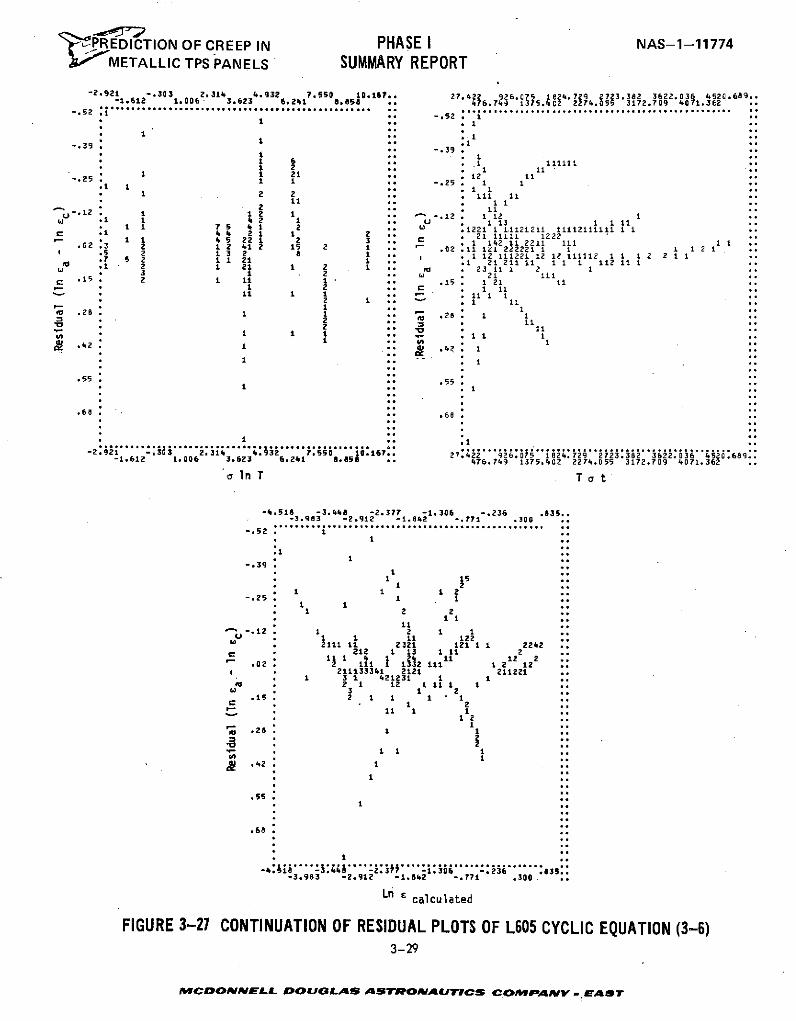
'REDICTION OF CREEP IN PHASE I NAS-1-11774METALLIC TPS PANELS SUMMARY REPORT
-2.921 -. 303 2.314 4.932 7.550 10.167.. 27.422 926.075 1824.729 2723.382 3622.036 4520.689..-1.612 1.006 3.623 6.241 8.5 .. 476.743 1375.402 2274.055 3172.709 4071.362
-. 52 . .................................. -.s :".
-.39 1
1 . 1 11-. 25 -. 25 39
1 2 1 -. 25 1 12
.1 4 21 1 2 .. . 1111 1 1222-. 2 45 221 2 3 1 142112211 111
.02 *3 2 1 2 41 15 2 1 ** .02 .11 121 222221 1 1 1 1 2 1
.5 2.1321 11
.7 2 1 3 2 1 1 .. * 1 12 111221 12 12 111112 1 1 1 2 2 1 1S 1 2 1 2 1 2 1 1 221211 11 11 1 112111S2* 3 1 2 12311 111121 1 111
1 2 1 1
S 5 1 1 m 1 . 1 1 1 1.
2 1 2 .. 1 11
•02 15 2 1 11E 11Z± ., 1 1 .
2 * .8 1 ...42 : .2 . 1
* * .I .3* ± I I .. 842 . 11 ..
168 ...
-. 3 .21 . .1 37 5. 4 2
c nT.1 - 5 3. 8 385
.55 .55
-. 25 1 1 ..
1 2 2
*12 1 1 .68 1
U 1 1 11 1222111 11 2321 121 1 1 2242
212 1 13 1 5t 2
4 1 4 1 2 2 2
-g 71 2T. .02Z 18./9 g338 362,036 51 1 0.689 1 2 12
-4518 -211133341 2121 21122136 .835..-3.983 -2.312 -1.84 -.771 .300 ..
225. 2 11 1 1
S..
-.12. 12 ± 12- .* 11 122
11 2 21
1 1111 1.4 Z•.15 2 1 1 1 1 ±
.55 ..
" * 2
.2. ...68
-3.983 -2.912 -1.842 -. 771 .300. ..
Ln E calculated
FIGURE 3-27 CONTINUATION OF RESIDUAL PLOTS OF L605 CYCLIC EQUATION (3-6)3-29
MCDONNELL DOUGVLAS ASTRONAUTICS COMfANV - EAST
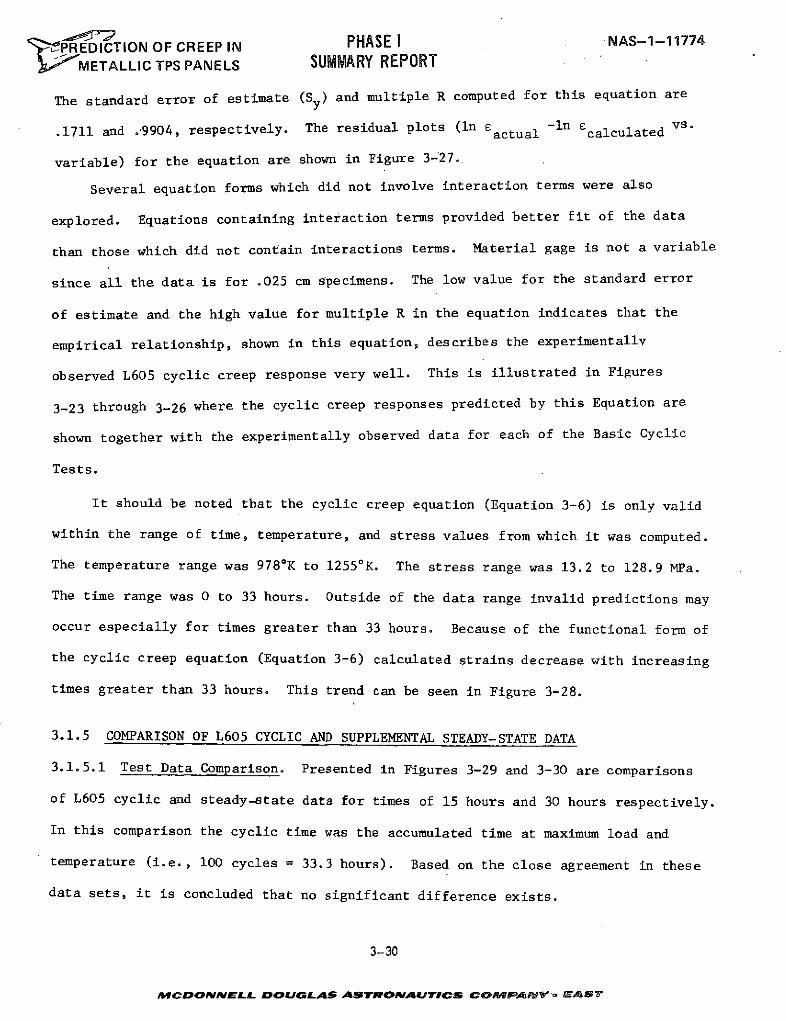
F'PREDICTION OF CREEP IN PHASE I NAS-1-774
METALLIC TPS PANELS SUMMARY REPORT
The standard error of estimate (S y) and multiple R computed for this equation are
.1711 and .9904, respectively. The residual plots (ln E actual -ln ccalculated vs.
variable) for the equation are shown in Figure 3-27.
Several equation forms which did not involve interaction terms were also
explored. Equations containing interaction terms provided better fit of the data
than those which did not contain interactions terms. Material gage is not a variable
since all the data is for .025 cm specimens. The low value for the standard error
of estimate and the high value for multiple R in the equation indicates that the
empirical relationship, shown in this equation, describes the experimentally
observed L605 cyclic creep response very well. This is illustrated in Figures
3-23 through 3-26 where the cyclic creep responses predicted by this Equation are
shown together with the experimentally observed data for each of the Basic Cyclic
Tests.
It should be noted that the cyclic creep equation (Equation 3-6) is only valid
within the range of time, temperature, and stress values from which it was computed.
The temperature range was 978 0K to 12550K. The stress range was 13.2 to 128.9 MPa.
The time range was 0 to 33 hours. Outside of the data range invalid predictions may
occur especially for times greater than 33 hours. Because of the functional form of
the cyclic creep equation (Equation 3-6) calculated strains decrease with increasing
times greater than 33 hours. This trend can be seen in Figure 3-28.
3.1.5 COMPARISON OF L605 CYCLIC AND SUPPLEMENTAL STEADY-STATE DATA
3.1.5.1 Test Data Comparison. Presented in Figures 3-29 and 3-30 are comparisons
of L605 cyclic and steady-state data for times of 15 hours and 30 hours respectively.
In this comparison the cyclic time was the accumulated time at maximum load and
temperature (i.e., 100 cycles = 33.3 hours). Based on the close agreement in these
data sets, it is concluded that no significant difference exists.
3-30
MrCDONNELL DOUGLAS ASTROAUTICS COesPMAPOV' A AST
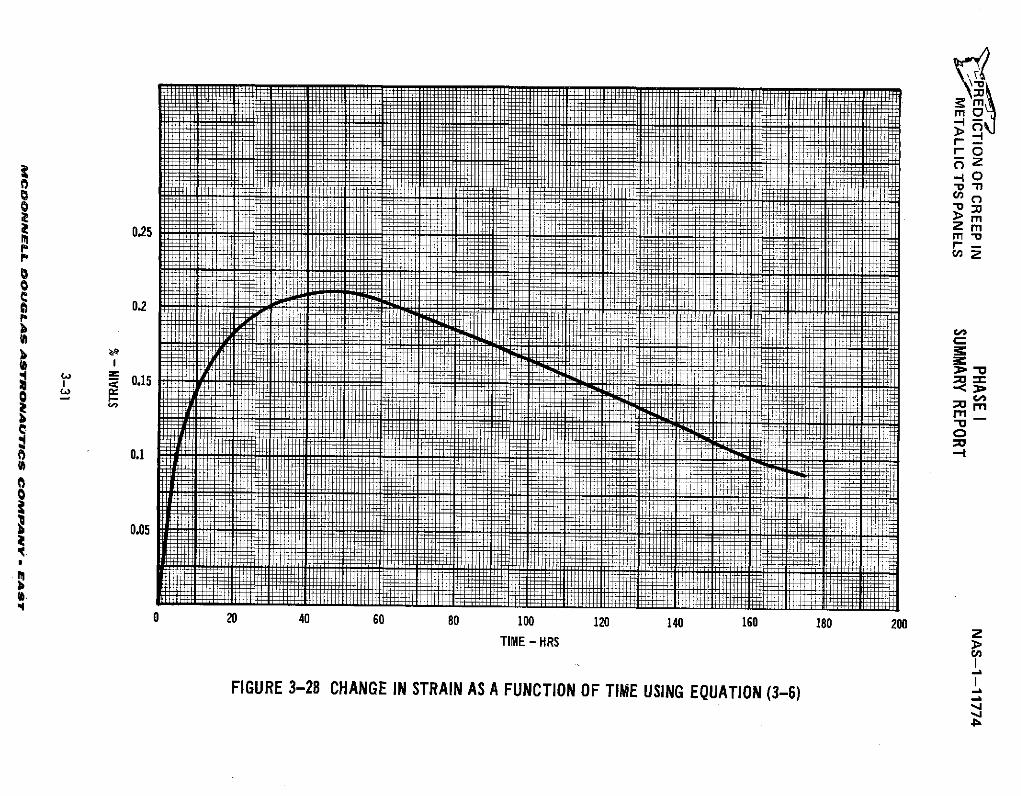
C
F--rro
02rO
0.25 rn m
mZ
0.2
= < 0.15
CO®R,
0 .1 -
0.05
++f++++_
0 20 40 60 80 100 120 140 160 180 200
c; cnZ
2TIME - HRS
FU 3
FIGURE 3-28 CHANGE IN STRAIN AS A FUNCTION OF TIME USING EQUATION (3-6)_,-
4:h
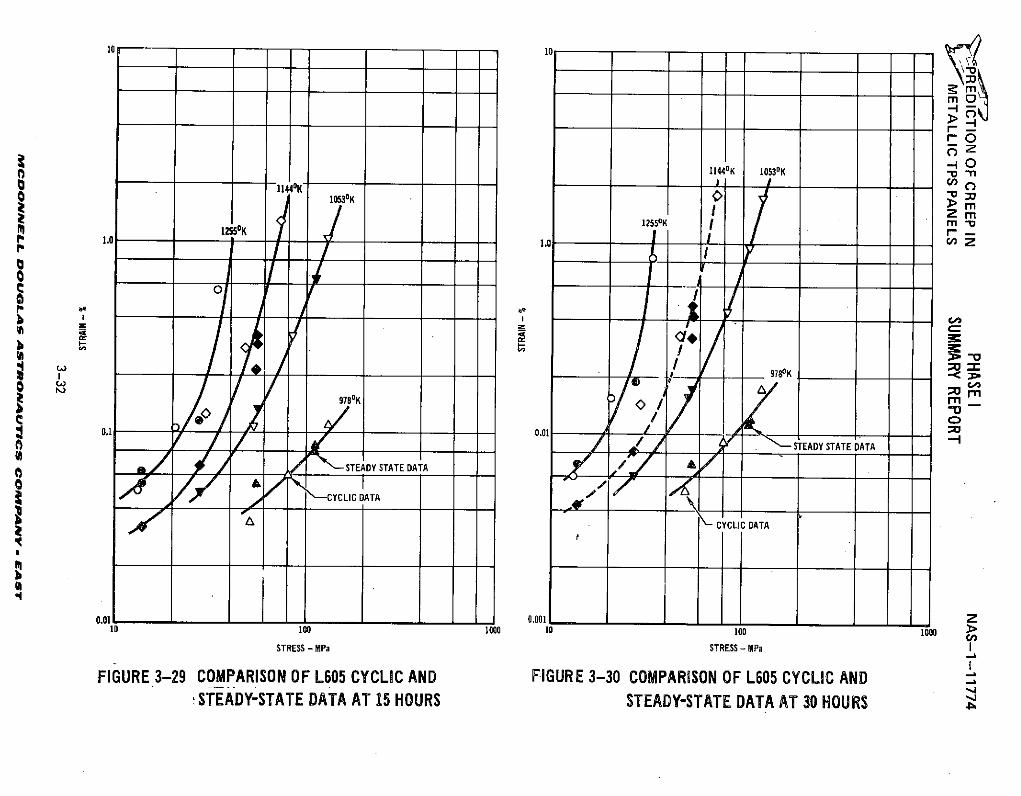
mmr-o
11440K 10530K - -n- 11440K -
1 10530K
Z m
Ib I
ASTATE DATA
/ STEADY STATE DATA
I-JV
9780K
0.01 0.0011103 1 0 1000 10 100 100 >
STRESS - MPa STRESS - MPa
FIGURE 3-29 COMPARISON OF L605 CYCLIC AND FIGURE 3-30 COMPARISON OF L605 CYCLIC ANDSTEADY-STATE DATA AT 15 HOURS STEAD-STAE DATA AT 30 HOURS
S"PPREDICTION OF CREEP IN PHASE I NAS-1-11774METALLIC TPS PANELS SUMMARY REPORT
3.1.5.2 Microstructure Comparison. Samples representing steady-state and cyclic
creep conditions were examined for microstructural features. The samples selected
for examination were those that exhibited strains less than 0.5% at the end of the
test. The results of this examination are presented in Figures 3-31, 3-32, and
3-33. From these figures it can be seen that there are no discernible differences,
at 500X magnification, between the steady state and cyclic microstructures at any
of the temperatures examined.
For comparison purposes the "as-received" microstructures are shown in Figure
3-31. Comparison of the as-received microstructure of L605 with that of the creep
tested specimens shows that significant precipitation has occurred at 978 0 K, these
precipitates are located only at the grain boundaries; according to Reference 29,
these precipitates consist primarily of Laves phases and a Co-W intermetallic com-
pound. At 11440K and 12550K, both grain boundary and matrix precipitation has
occurred; these precipitates consist primarily of Laves phases and metal carbides.
The carbides are primarily M2 3C6, at 11440 K, whereas at 12550 K, M6C predominates.
Examination of these photomicrographs also shows that testing at 11440K and 12550K
has resulted in a depletion of carbides below the specimen surface. This subsurface
layer is caused by preferential oxidation of less-noble alloying elements such as
chromium.
3.1.6 L605 CYCLIC TESTS FOR EVALUATION OF ADDITIONAL VARIABLES
Described in Section 2.9.2 were a series of tests designed to study the .effect
of time per cycle, atmospheric pressure, and time between cycles on the cyclic
creep of materials (creep recovery). This section discusses the results of those
tests on L605. Raw creep data generated in these tests are presented in Appendix C-3.
3.1.6.1 Effect of Time Per Cycle. In the analysis of creep in a metallic TPS beam,
the trajectory is idealized by dividing it into increments of time for which stress
3-33
MCDONNELL DOUGLAS ASTRONAUTICS COMPANy . EAST
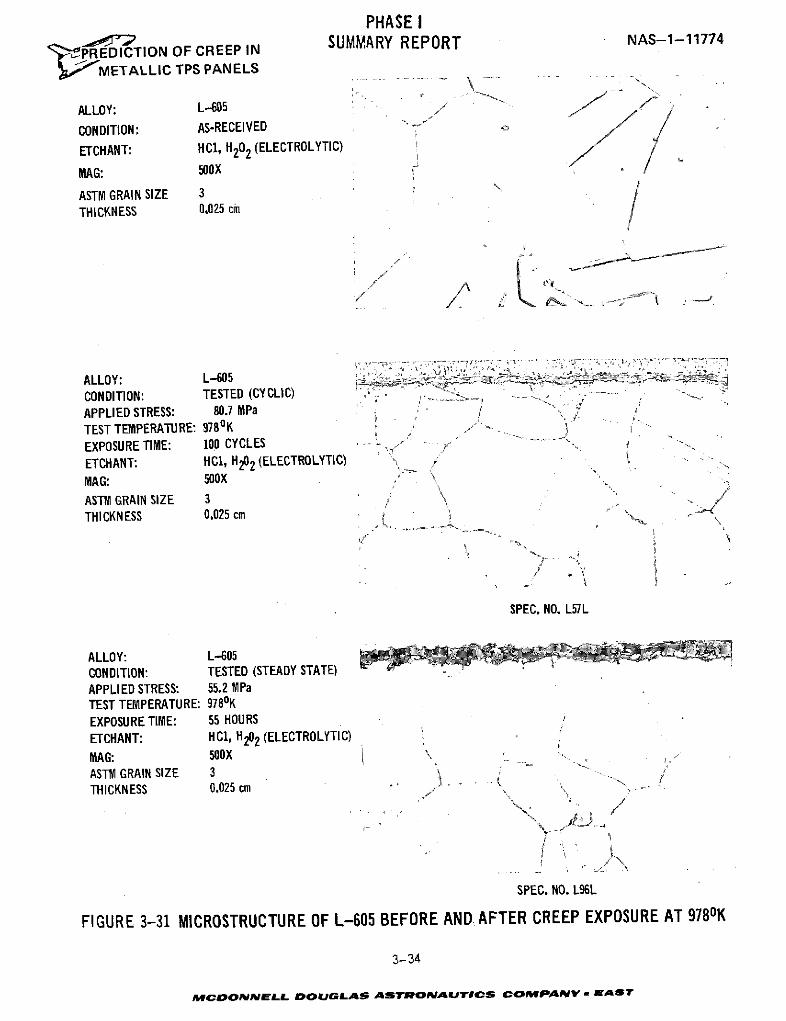
PHASE ION OF CREEP N SUMMARY REPORT NAS-1-11774
"PREDICTION OF CREEP INo METALLIC TPS PANELS
ALLOY: L-605
CONDITION: AS-RECEIVED
ETCHANT: HC1, H202 (ELECTROLYTIC)
MAG: 500X
ASTM GRAIN SIZE 3 /
THICKNESS 0.025 cm
ALLOY: L-605 ...
CONDITION: TESTED (CYCLIC) "APPLIED STRESS: 80.7 MPa ,
TEST TEMPERATURE: 978 0KEXPOSURE TIME: 100 CYCLESETCHANT: HCI, H202 (ELECTROLYTIC)MAG: 500XASTM GRAIN SIZE 3 /THICKNESS 0.025 cm
SPEC. NO. L57L
ALLOY: L-605CONDITION: TESTED (STEADY STATE)APPLIED STRESS: 55.2 MPaTEST TEMPERATURE: 978 0KEXPOSURE TIME: 55 HOURSETCHANT: HC1, H202 (ELECTROLYTIC)MAG: 500XASTM GRAIN SIZE 3THICKNESS 0.025 cm .
SPEC. NO. L96L
FIGURE 3-31 MICROSTRUCTURE OF L-605 BEFORE AND AFTER CREEP EXPOSURE AT 9780K
3-34
MCDONNELL DOUGLAS ASTRONAUTICS COMPANV- EAST
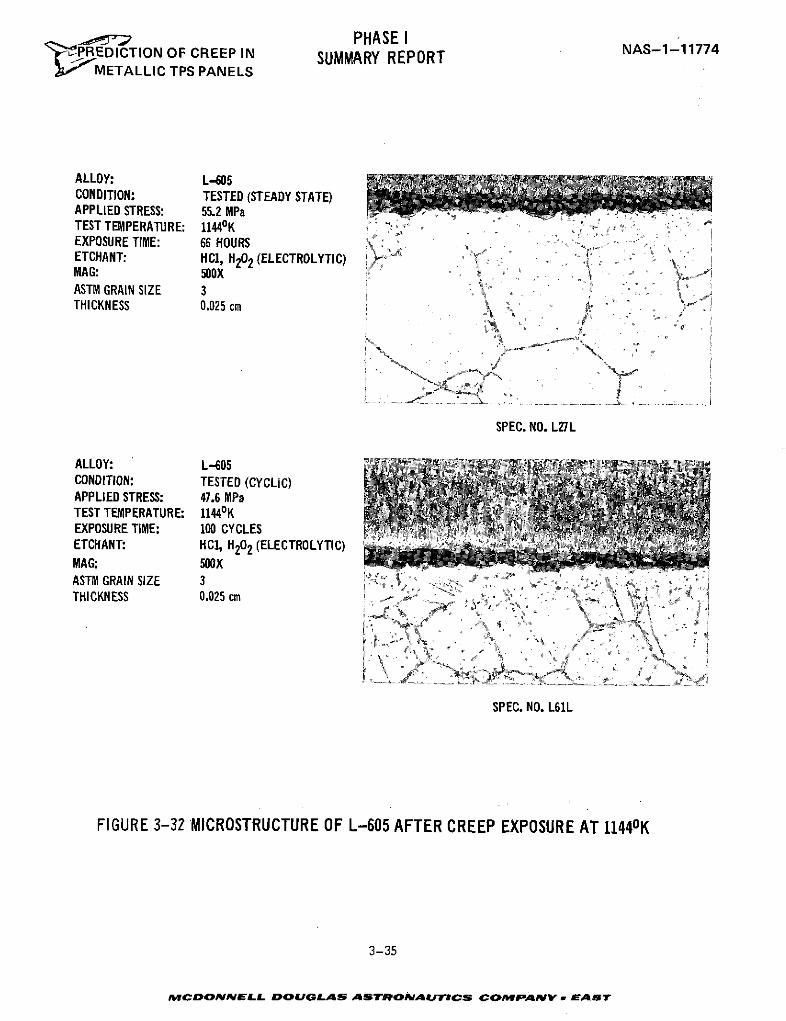
PHASE IPREDICTION OF CREEP IN SUMMARY REPORT NAS-1-11774
METALLIC TPS PANELS
ALLOY: L-605CONDITION: TESTED (STEADY STATE)APPLIED STRESS: 55.2 MPaTEST TEMPERATURE: 11440KEXPOSURE TIME: 66 HOURSETCHANT: HCI, H202 (ELECTROLYTIC)MAG: 500XASTM GRAIN SIZE 3THICKNESS 0.025 cm
SPEC. NO. L27L
ALLOY: L-605CONDITION: TESTED (CYCLIC)APPLIED STRESS: 47.6 MPaTEST TEMPERATURE: 11440KEXPOSURE TIME: 100 CYCLESETCHANT: HCI, H202 (ELECTROLYTIC)MAG: 500XASTM GRAIN SIZE 3 iTHICKNESS 0.025 cm
SPEC. NO. L61L
FIGURE 3-32 MICROSTRUCTURE OF L-605 AFTER CREEP EXPOSURE AT 11440K
3-35
MCDONNELL DOUGLAS ASTRONAUTICS COMPANY - EAST
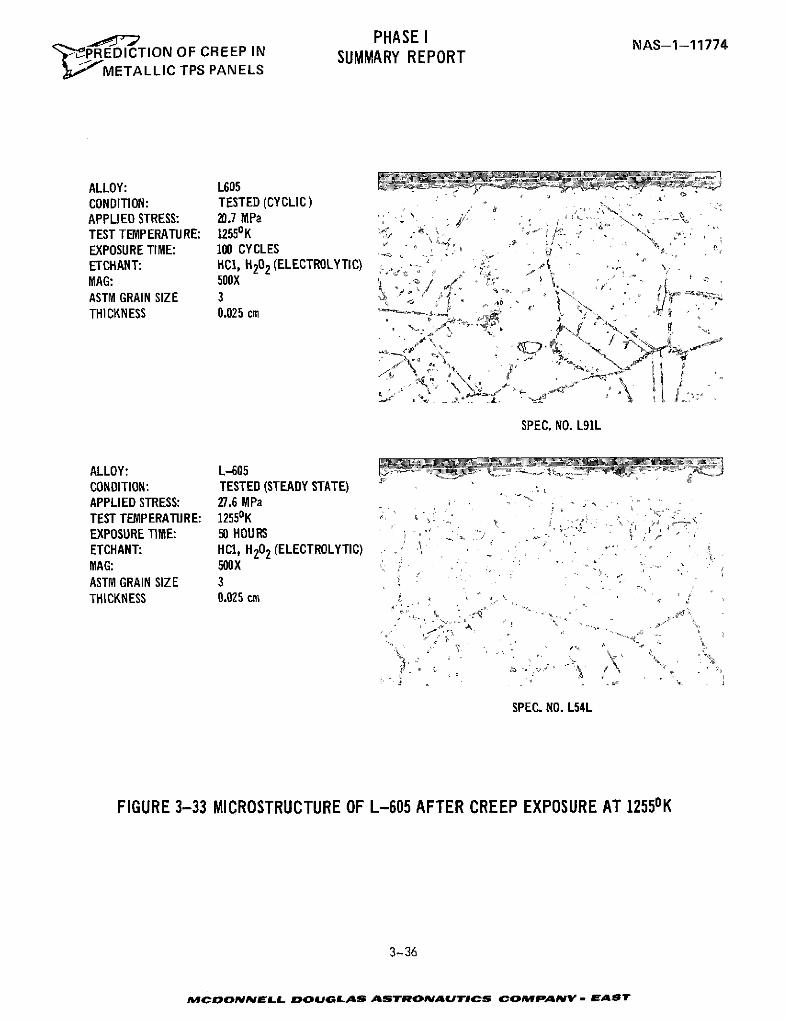
PHASE IPHASE I NAS-1-11774,.PREDICTION OF CREEP IN SUMMARY REPORT
' I METALLIC TPS PANELS
ALLOY: L605CONDITION: TESTED (CYCLIC)APPLIED STRESS: 20.7 MPaTEST TEMPERATURE: 12550KEXPOSURE TIME: 100 CYCLESETCHANT: HC1, H202 (ELECTROLYTIC)MAG: 500XASTM GRAIN SIZE 3 ''
THICKNESS 0.025 cm
SPEC. NO. L91L
ALLOY: L-605CONDITION: TESTED (STEADY STATE)APPLIED STRESS: 27.6 MPaTEST TEMPERATURE: 1255 0KEXPOSURE TIME: 50 HOURSETCHANT: HC1, H202 (ELECTROLYTIC)MAG: 500XASTM GRAIN SIZE 3THICKNESS 0.025 cm
SPEC. NO. L54L
FIGURE 3-33 MICROSTRUCTURE OF L-605 AFTER CREEP EXPOSURE AT 12550K
3-36
rMCDONNELL DOUGLAS ASTRONAUTICS COMPANYv EAST
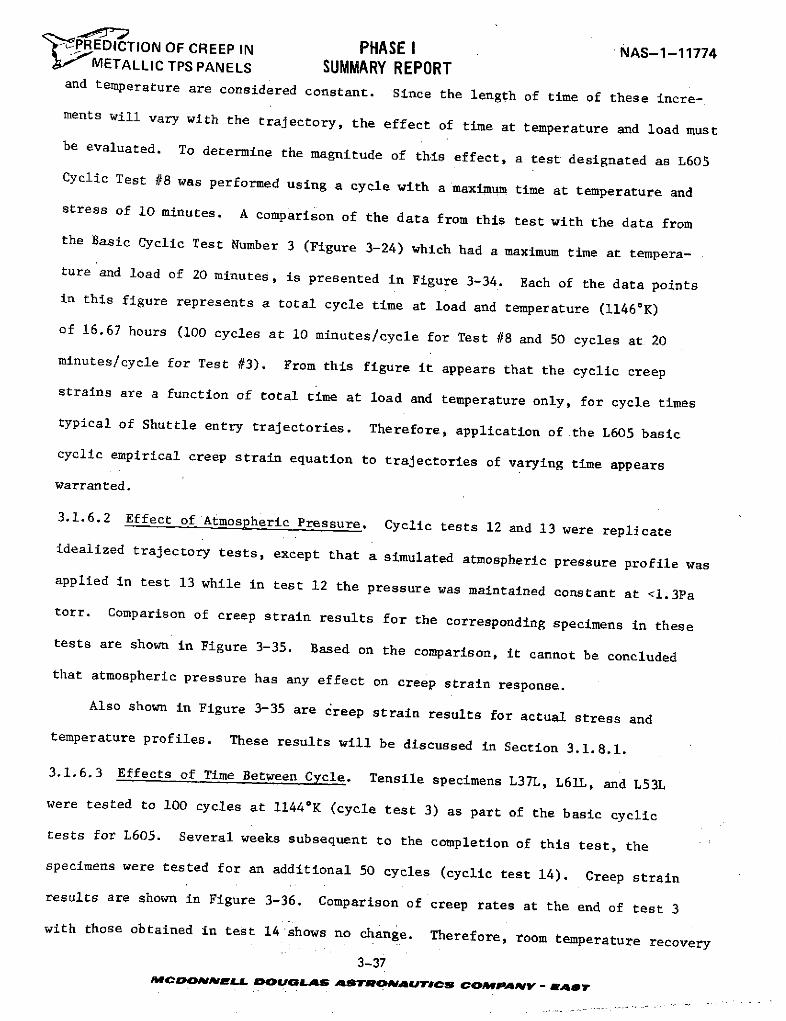
UPREDICTION OF CREEP IN PHASE I NAS-1-11774METALLIC TPS PANELS SUMMARY REPORT
and temperature are considered constant. Since the length of time of these incre-ments will vary with the trajectory, the effect of time at temperature and load mustbe evaluated. To determine the magnitude of this effect, a test designated as L605Cyclic Test #8 was performed using a cycle with a maximum time at temperature andstress of 10 minutes. A comparison of the data from this test with the data fromthe Basic Cyclic Test Number 3 (Figure 3-24) which had a maximum time at tempera-ture and load of 20 minutes, is presented in Figure 3-34. Each of the data pointsin this figure represents a total cycle time at load and temperature (11460 K)
of 16.67 hours (100 cycles at 10 minutes/cycle for Test #8 and 50 cycles at 20
minutes/cycle for Test #3). From this figure it appears that the cyclic creep
strains are a function of total time at load and temperature only, for cycle times
typical of Shuttle entry trajectories. Therefore, application of the L605 basic
cyclic empirical creep strain equation to trajectories of varying time appears
warranted.
3.1.6.2 Effect of Atmospheric Pressure. Cyclic tests 12 and 13 were replicateidealized trajectory tests, except that a simulated atmospheric pressure profile wasapplied in test 13 while in test 12 the pressure was maintained constant at <1.3Patorr. Comparison of creep strain results for the corresponding specimens in thesetests are shown in Figure 3-35. Based on the comparison, it cannot be concludedthat atmospheric pressure has any effect on creep strain response.
Also shown in Figure 3-35 are creep strain results for actual stress andtemperature profiles. These results will be discussed in Section 3.1.8.1.
3.1.6.3 Effects of Time Between Cycle. Tensile specimens L37L, L61L, and L53Lwere tested to 100 cycles at 11440K (cycle test 3) as part of the basic cyclic
tests for L605. Several weeks subsequent to the completion of this test, thespecimens were tested for an additional 50 cycles (cyclic test 14). Creep strain
results are shown in Figure 3-36. Comparison of creep rates at the end of test 3with those obtained in test 14 shows no change. Therefore, room temperature recovery
3-37M9CDONN ELL DOUGLAS ASTRONWAUTICS COMPAMNY - EAST
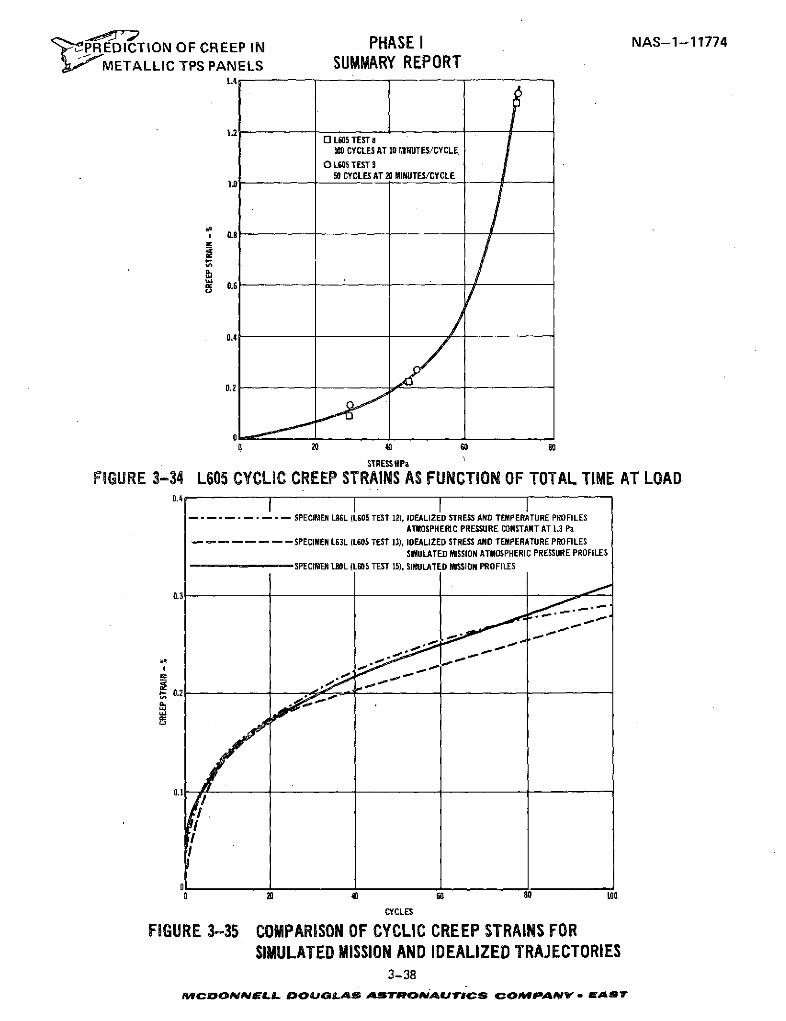
PREDICTION OF CREEP IN PHASE I NAS-1-11774
METALLIC TPS PANELS SUMMARY REPORT1.4
o L605 TEST100 CYCLES AT 10 5IOWUTES/CYCLE
O L605 TEST 350 CYCLES AT 20 MINUTES/CYCLE
I 0.8
0.6
0.4
0.2
a 20 40 60 go
STRESS MPa
FIGURE 3-34 L605 CYCLIC CREEP STRAINS AS FUNCTION OF TOTAL TIME AT LOAD0.4 1 1 1
- -- - - - - SPECIMEN 6L (L605 TEST 12), IDEALIZED STRESS AND TEMPERATURE PROFILESATMOSPHERIC PRESSURE CONSTANT AT 1.3 Pa
- - - - - - - -SPECIMEN L63L (L605 TEST 13), IDEALIZED STRESS AND TEMPERATURE PROFILESSIMULATED MISSION ATMOSPHERIC PRESSURE PROFILES
0.3
SIMULATED MISSION AND IDEALIZED TRAJECTORIES
C3-38
M LL ASTO OMPANY
CYCLES
FIGURE 3-35 COMPARISON OF CYCLIC CREEP STRAINS FORSIMULATED MISSION AND IDEALIZED TRAJECTORIES
3-38MPCDONNELL DOUGLAS ASTRONAUTiCS COPANYAivv- EAT
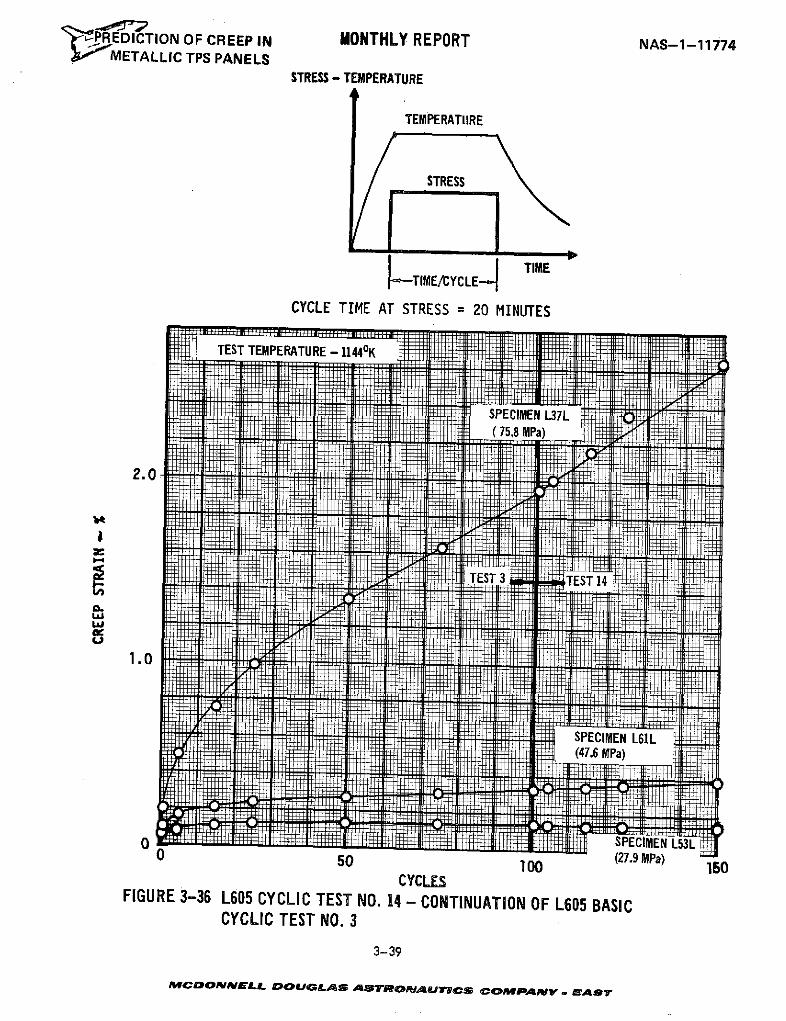
REDITION OF CREEP IN MONTHLY REPORT NAS-1-11774METALLIC TPS PANELS
STRESS - TEMPERATURE
TEMPERATURE
STRESS
--TIME/CYCLE-- TIME
CYCLE TIME AT STRESS = 20 MINUTES
TEST TEMPERATURE - 11440K
SPECIMEN L37L(75,8 MPa)
2.0
TEST3 TEST 14
Li
1.0
SPECIMEN L61L(47.6 MPa)
SSPECIMEN L53L0 50 100 (27.9 MPa)S100 150
CYCLESFIGURE 3-36 L605 CYCLIC TEST NO. 14 - CONTINUATION OF L605 BASIC
CYCLIC TEST NO. 3
3-39
MCDONANELL DOUGLAS ASrTRoIIAU'rECS COAMPANy . WAsT
'-PREDICTION OF CREEP IN PHASE I NAS-1-11774
METALLIC TPS PANELS SUMMARY REPORT
does not appear to be an important factor in the creep response behavior of L605.
Even though it did not appear that room temperature recovery was occurring,
.the possibility still existed that high temperature recovery was occurring in our
basic cycle profile. High temperature recovery is a specimen relaxation during
exposure to elevated temperature and no load conditions similar to what occurs in
the basic cycle profile). To determine if high temperature recovery was occurring,
an additional test was performed (test No. 11, specimens L43L and L38L) in which
the load was mainained for 50 minutes (see Figure 2-24(a)) instead of the usual 20
minutes. By maintaining the load until the temperature is lowered, high temperature
recovery should be prevented from occurring. Comparison of this test (No. 11), which
did not have high temperature recovery, with one that could have high temperature
recovery (test No. 3) revealed that there was no significant difference between the
resultant creep strains for the two tests (See Figure 3-37). As a result neither
room or high temperature recovery phenomena appear to be an important factor in
L605 creep response.
3.1.7 STEPPED STRESS CYCLIC TESTS
Tests were designed to provide data for evaluation of various hardening
rules applicable to TPS beam bending where stress varies as a function of time (see
section 2.9.2.3). L605 tests 5, 6, and 7 were conducted at 11440K and L605 test
10 was conducted at 1092 0K. All tests were conducted using the typical cycle
profile (20 minutes at load and peak temperature) shown in Figure 2-22. Load
was varied, periodically, after a fixed number of cycles in each of the tests as
indicated in Figures 3-38 to 3-41.
Stresses for Tests 5 and 10 were selected to duplicate portions of the creep
strain curves from Test 3 and 2 respectively (Figure 3-25 and 3-24) to allow
possible direct data comparisons.
3-40
MrCDONNELL DOUG LAS ASTRONjAUTCS COM.PAIYV , ELAST
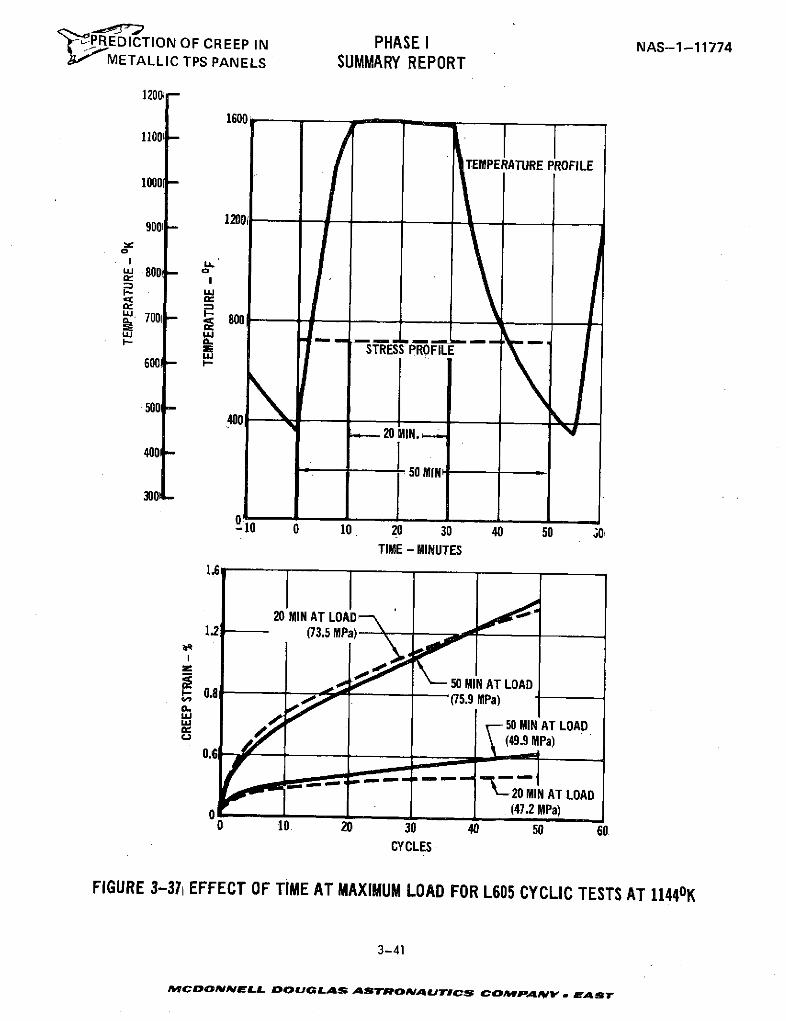
'"" PREDICTION OF CREEP IN PHASE I NAS-1-11774METALLIC TPS PANELS SUMMARY REPORT
1200
160011001
TEMPERATURE PROFILE1000
9001 1200, /
S- 800I-I
.. 700 800
STRESS PROFILE600
500 4
20 MIN.4001 -
50 MIN
300 -
10 0 10 20 30 40 50 0TIME - MINUTES
1.6
20 MIN AT LOAD1.2 (73.5 MPa)
50 MIN AT LOAD0.8 (75.9 MPa)
50 MIN AT LOAD
0.6
0 (47.2 MPa)0 10 20 30 40 50 60
CYCLES
FIGURE 3-371 EFFECT OF TIME AT MAXIMUM LOAD FOR L605 CYCLIC TESTS AT 11440K
3-41
mICDONNELL DOUGLAS ASTRONAUTICS COMPANY . EaST
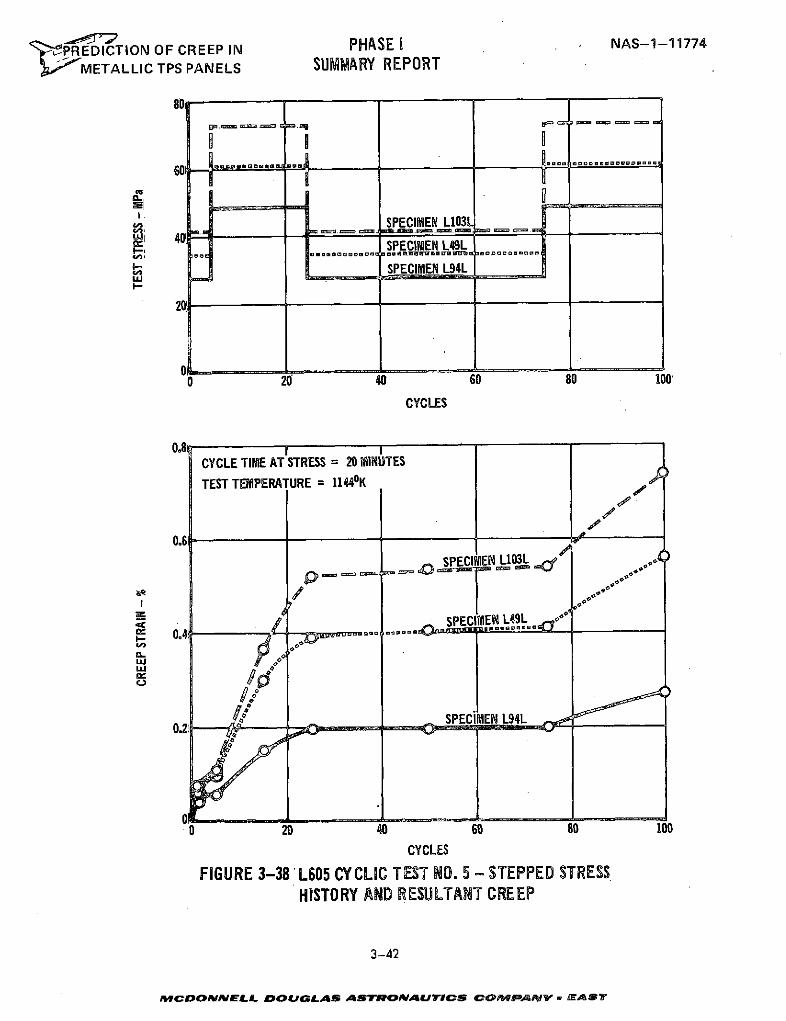
',OPREDICTION OF CREEP IN PHASE I NAS-1-11774
SMETALLIC TPS PANELS SUMMARY REPORT
801
. ....... ......
SPECIMEN L103LUJI -40 -t - oo =
SPECIMEN L49L
SPECIMEN L94LI-
20
0 26 40 60 80 100.
CYCLES
0.8ICYCLE TIME AT STRESS = 20 MINUTES
TEST TEMPERATURE = 11440K l
0.6SPECIME L103L ,o o
.4 /SPECIMEN L49L0.4 ......... .om ...
0.2 SPECIMEN L94L
20 40 60 80 100
CYCLES
FIGURE 3-38 L605 CYCLIC TEST NO. 5 - STEPPED STRESSHISTORY AND RESULTANT CREEP
3-42
MCrDONNItELL DOUGLAS ASTRONAIAUTICS COAErPaAR f / - MARY
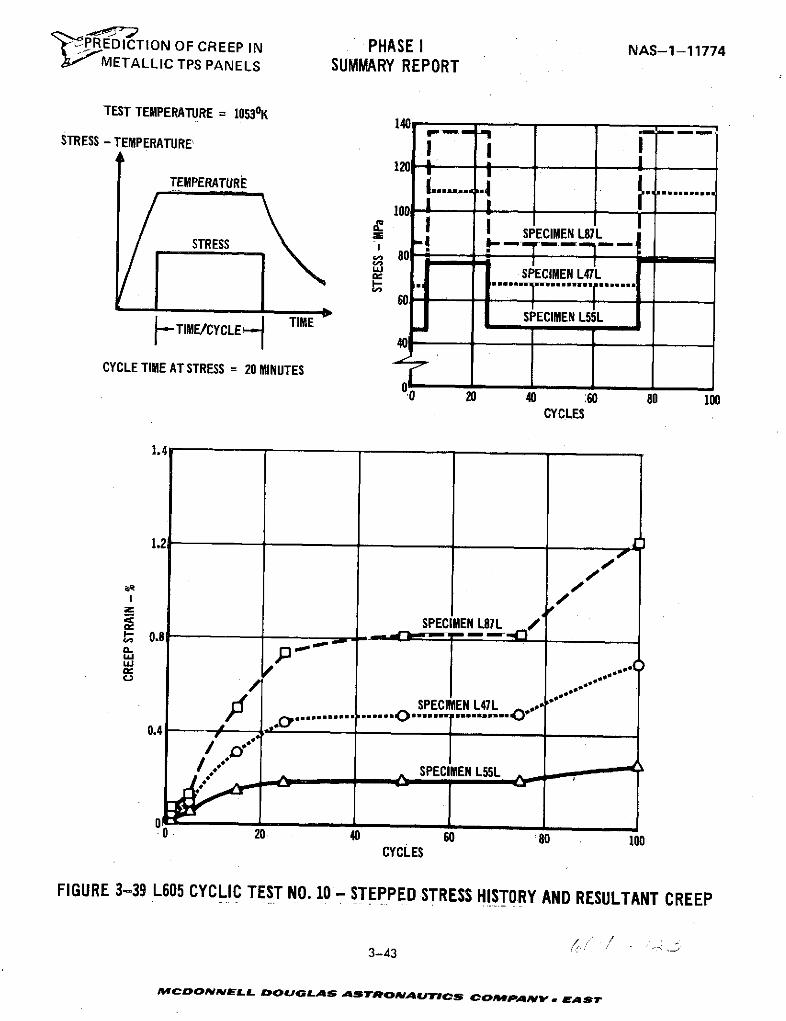
'PREDICTION OF CREEP IN PHASE I NAS-1-11774METALLIC TPS PANELS SUMMARY REPORT
TEST TEMPERATURE = 10530 K 140STRESS - TEMPERATURE
12C 'I -T -TEMPERATURE ... . .
ISPECIMEN L87LSTRESS II
80a,.- SPECIMEN L47L- .... **. ... ....
60 - -- ----
L.J SPECIMEN L55LTIMECYCLE H TIME
CYCLE TIME AT STRESS = 20 MINUTES
00 20 40 .60 80 100CYCLES
1.4
1.2
pe-,/I
SPECIMEN L87L
0.4
SPECIMEN L55L
0. 4 - ..... 60 0 * - ---- 4'
.20 40 60 80 100CYCLES
FIGURE 3-39 L605 CYCLIC TEST NO. 10 - STEPPED STRESS HISTORY AND RESULTANT CREEP
3-43
MCDONNELL DOUGLAS ASTRONAUTICS COMPANy -EA ST
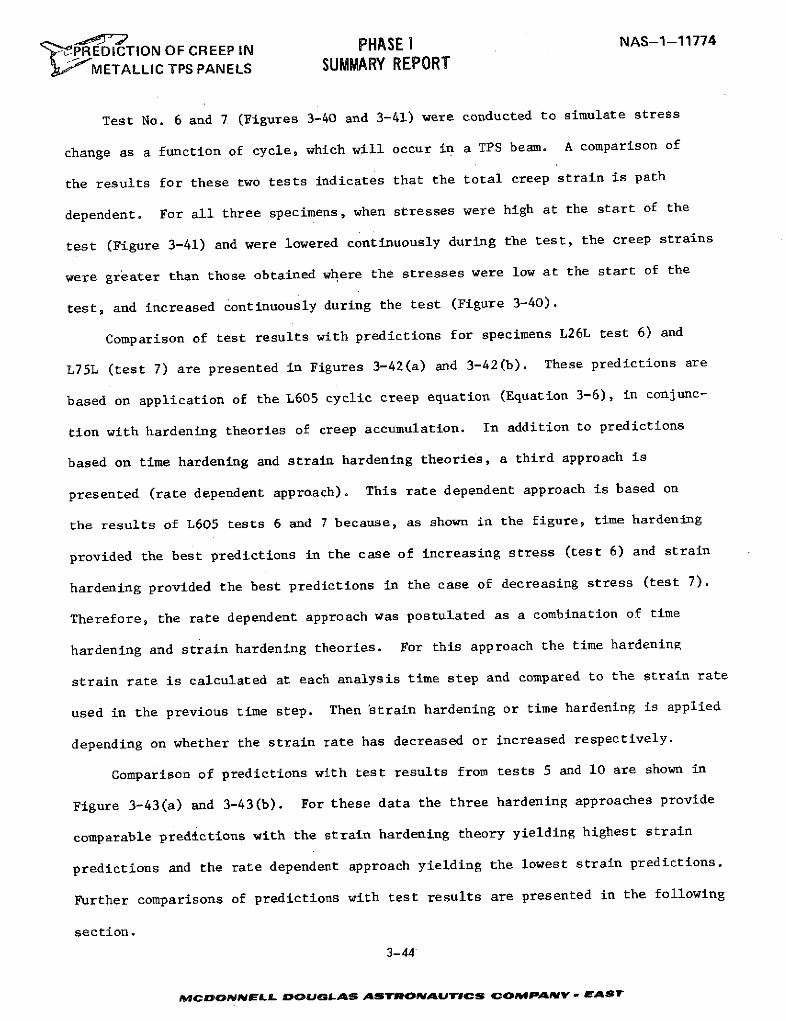
__e05_y PHASE INAS-1-11774'C PREDICTION OF CREEP IN PHASE I
METALLIC TPS PANELS SUMMARY REPORT
Test No. 6 and 7 (Figures 3-40 and 3-41) were conducted to simulate stress
change as a function of cycle, which will occur in a TPS beam. A comparison of
the results for these two tests indicates that the total creep strain is path
dependent. For all three specimens, when stresses were high at the start of the
test (Figure 3-41) and were lowered continuously during the test, the creep strains
were greater than those obtained where the stresses were low at the start of the
test, and increased continuously during the test (Figure 3-40).
Comparison of test results with predictions for specimens L26L test 6) and
L75L (test 7) are presented in Figures 3-42(a) and 3-42(b). These predictions are
based on application of the L605 cyclic creep equation (Equation 3-6), in conjunc-
tion with hardening theories of creep accumulation. In addition to predictions
based on time hardening and strain hardening theories, a third approach is
presented (rate dependent approach). This rate dependent approach is based on
the results of L605 tests 6 and 7 because, as shown in the figure, time hardening
provided the best predictions in the case of increasing stress (test 6) and strain
hardening provided the best predictions in the case of decreasing stress (test 7).
Therefore, the rate dependent approach was postulated as a combination of time
hardening and strain hardening theories. For this approach the time hardening
strain rate is calculated at each analysis time step and compared to the strain rate
used in the previous time step. Then strain hardening or time hardening is applied
depending on whether the strain rate has decreased or increased respectively.
Comparison of predictions with test results from tests 5 and 10 are shown in
Figure 3-43(a) and 3-43(b). For these data the three hardening approaches provide
comparable predictions with the strain hardening theory yielding highest strain
predictions and the rate dependent approach yielding the lowest strain predictions.
Further comparisons of predictions with test results are presented in the following
section.
3-44
I'CDMONNELL OULnSO AS ASTRONAUTICS COMPANV y EAST
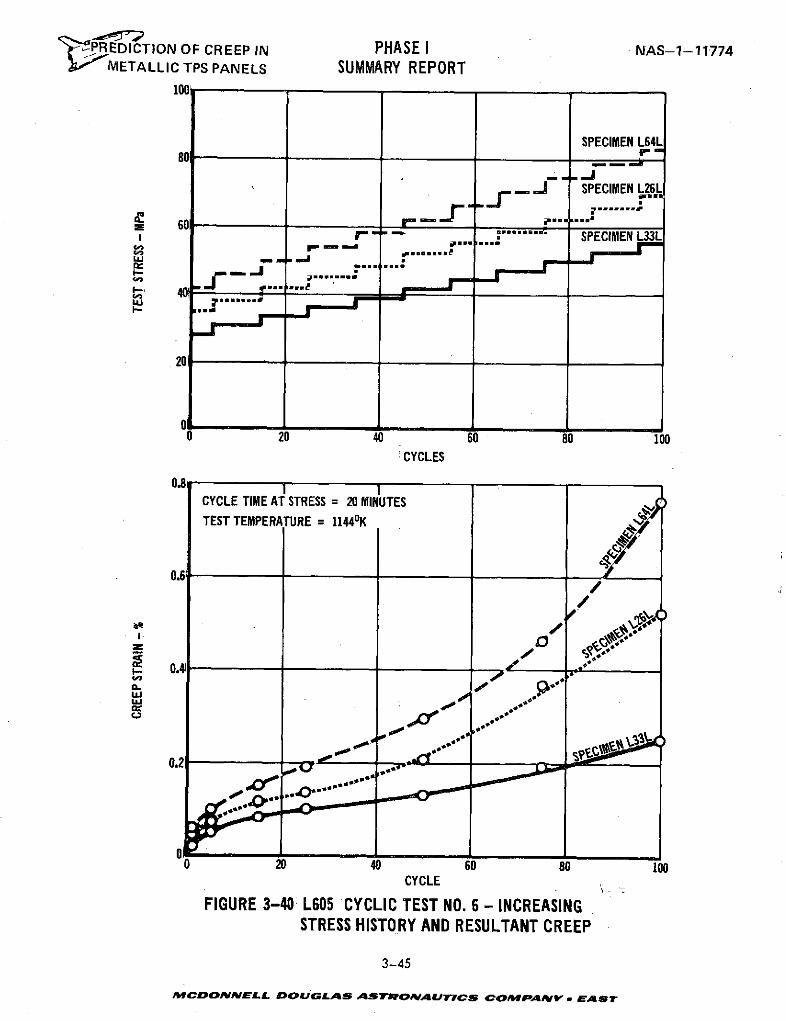
' PREDICTION OF CREEP IN PHASE I NAS-1-11774IIMETALLIC TPS PANELS SUMMARY REPORT
100
SPECIMEN L64L
-... SPECIMEN L26L
0 r m -" ..... . SPECIMEN L33L
upmow mo,, = .. _Jl -
20
00 20 40 60 80 100
.CYCLES
0.8 ICYCLE TIME AT STRESS = 20 MINUTESTEST TEMPERATURE = 11440K
0.6C
I 0 0
0.434
0 20 40 s0 80 100CYCLE
FIGURE 3-40 L605 CYCLIC TEST NO. 6 - INCREASINGSTRESS HISTORY AND RESULTANT CREEP
3-45
MCDONNELL DOUGLAS ASTRONAUTICS COMPANY EA ST
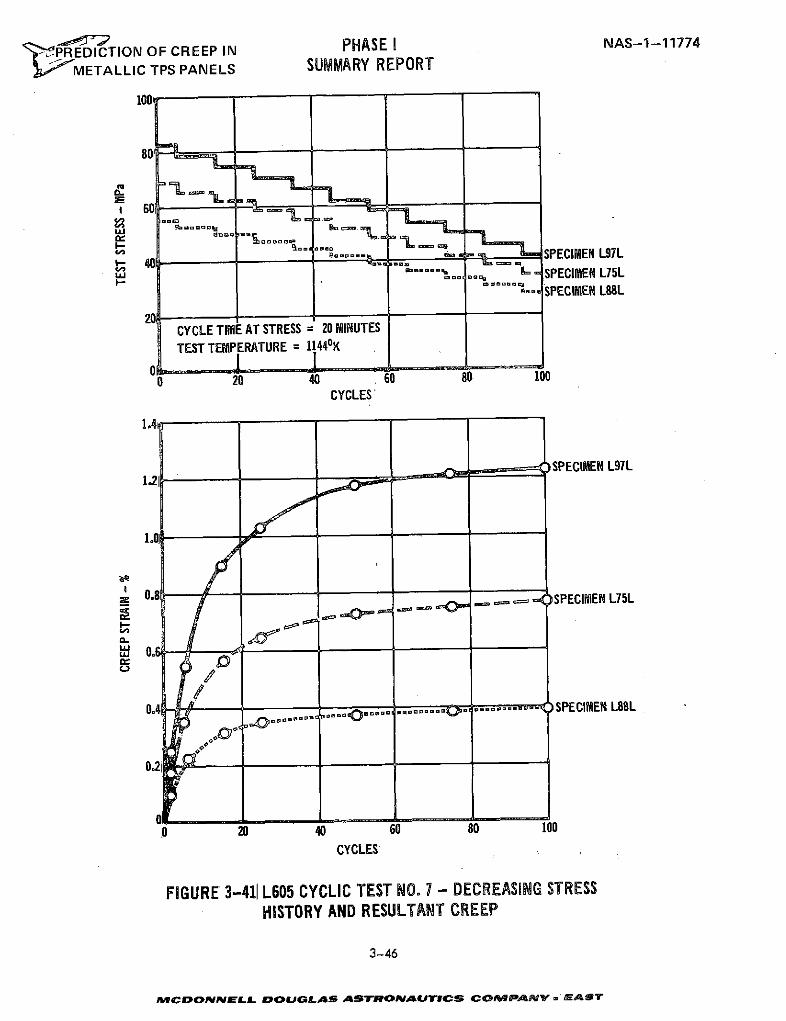
'"PREDICTION OF CREEP IN PHASE I NAS-1-11774
SMETALLIC TPS PANELS SUMMARY REPORT
01000
80
I= I"" Bam mar "l
CO ....... . . . SPECIMEN L97L1- 40.
W ... SPECIMEN L75L
. SPECIMEN L88L
20CYCLE TIME AT STRESS = 20 MINUTES
TEST TEMPERATURE = 1144 0K
0 20 40 60 80 100CYCLES
1.4
SPECIMEN L97L12
/0.8 - a ,SPECIMEN L75LI-
0.4. . O.... ........ SPECIMEN L88L
0 .20 40 60 80 100
CYCLES
FIGURE 3-411 L605 CYCLIC TEST NO. 7 - DECREASING STRESSHISTORY AND RESULTANT CREEP
3-46
MCDAONNELL DOUGLAS ASTRONwAUsICS COMPAN V EAST
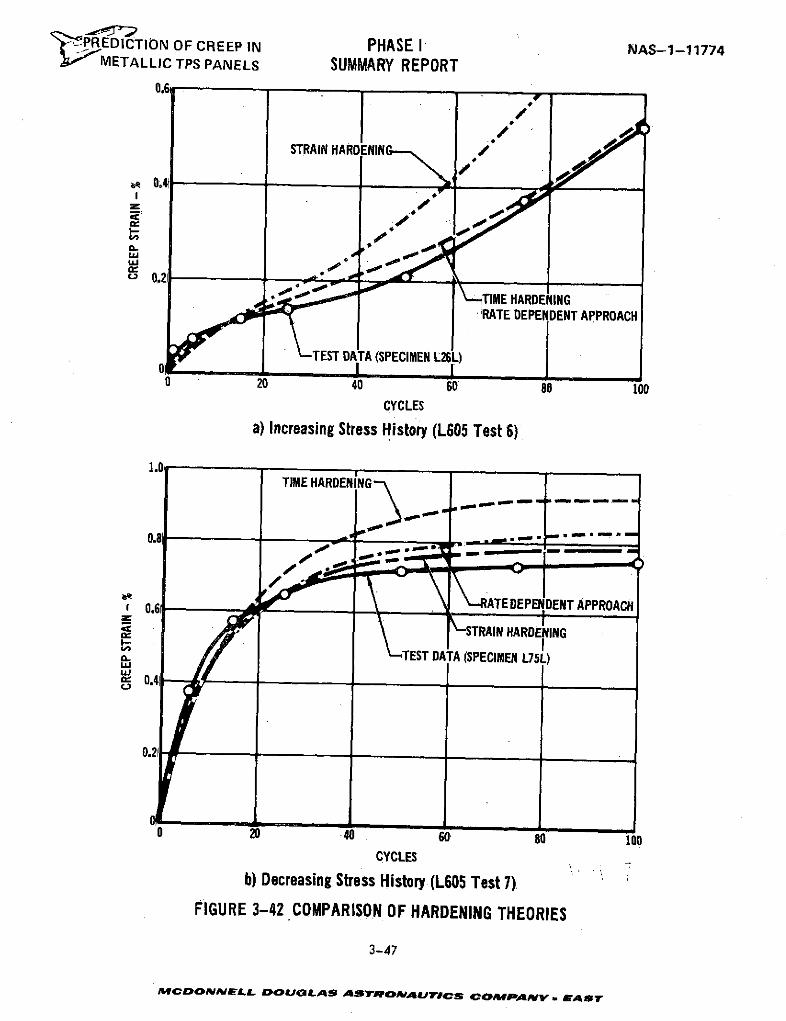
'PREDICTION OF CREEP IN PHASE I NAS-1-11774METALLIC TPS PANELS SUMMARY REPORT
STRAIN HARDENIN /
I-1
wO
TIME HARDENINGRATE DEPENDENT APPROACH
TEST DATA (SPECIMEN L26L)
0 20 40 60 80 100CYCLES
a) Increasing Stress History (L605 Test 6)
1.0TIME HARDENING
0. 8 m m m m
0.6 TEDEPENDENT APPROACH
STRAIN HARDENING
'. TEST DATA (SPECIMEN L75L)0.4
0 20 40 60. 80 100CYCLES
b) Decreasing Stress History (L605 Test 7),
FIGURE 3-42 COMPARISON OF HARDENING THEORIES
3-47
MCDONNELL DOUGLAS ASTRONAUJTICS COMPANpV. AST
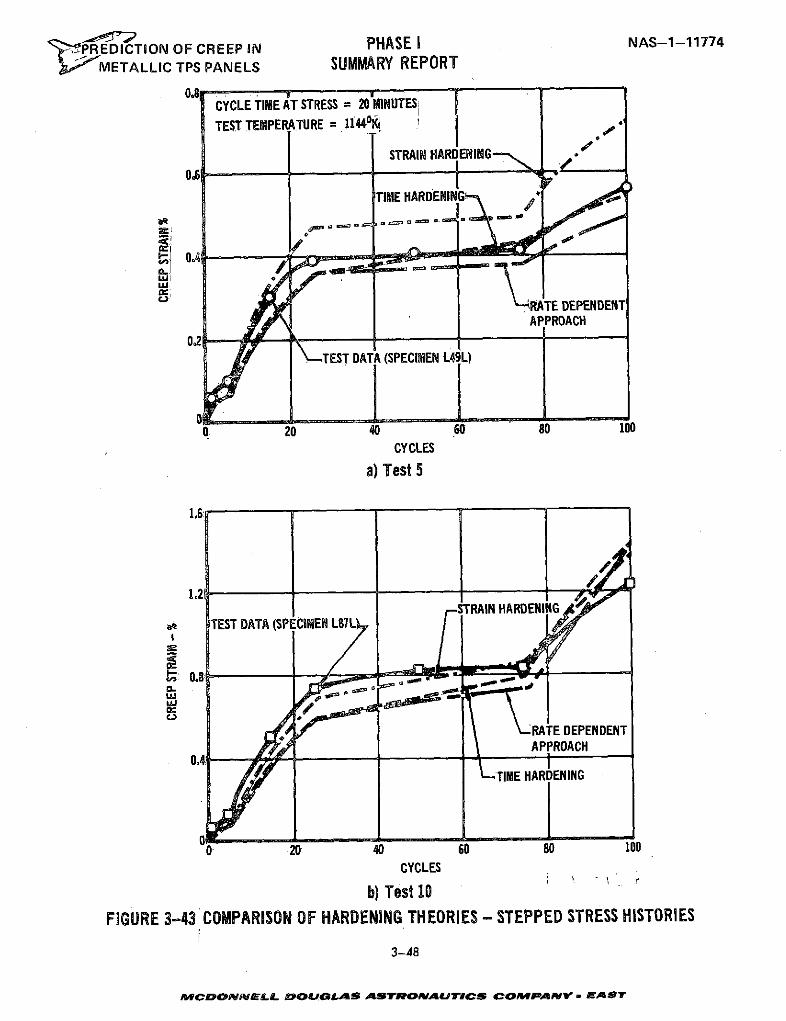
',PREDICTION OF CREEP IN PHASE I NAS-1-11774
METALLIC TPS PANELS SUMMARY REPORT
0.81 1CYCLE TIME AT STRESS = 20 MINUTESi
TEST TEMPERATURE = 11440K I
STRAIN HARDENING
TIME HARDENING
hi ILiu
RITE DEPENDENTAPPROACH
-.- TEST DATA (SPECIMEN L49L)
S20 40 60 80 100CYCLES
a) Test 5
1.6
STRAIN HARDENINGS TEST DATA (SPECIMEN L87
a- a
RATE DEPENDENTAPPROACH
TIME HARDENING
20 40 60 80 100
CYCLES
b) Test 10
FIGURE 3-43 COMPARISON OF HARDENING THEORIES - STEPPED STRESS HISTORIES
3-48
IeACDONNELhArL PBOUGLAS ASTROAIAUTCS COMPANY V EAST
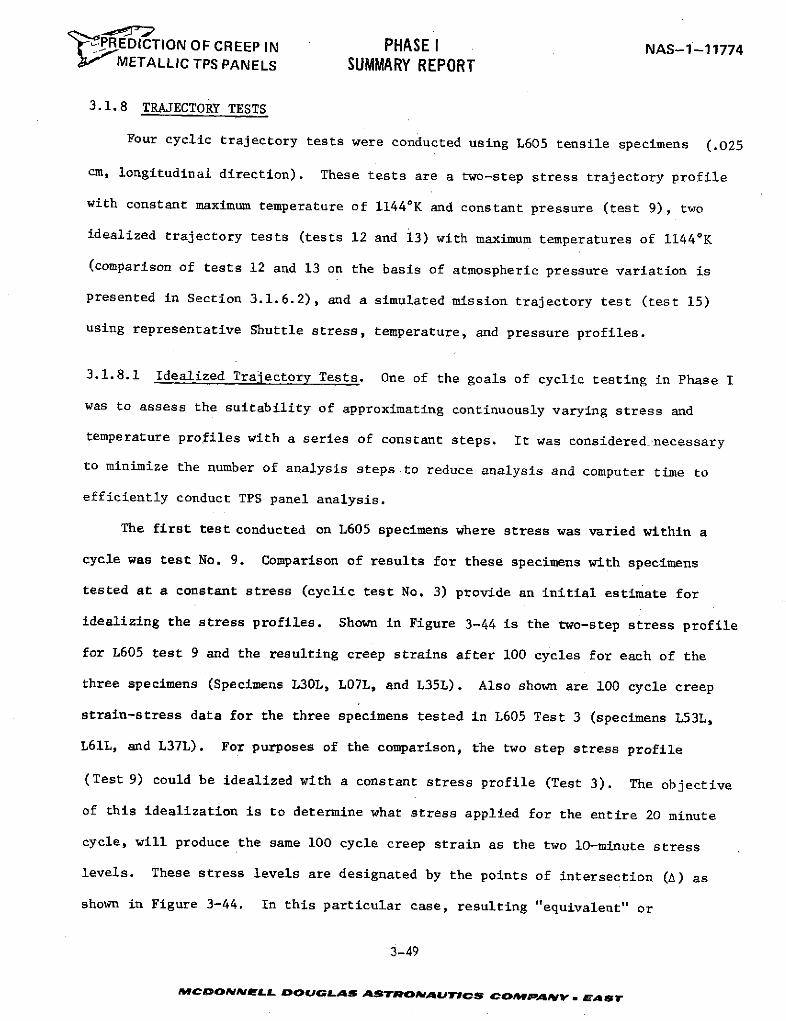
PAEDICTION OF CREEP IN PHASE I NAS-1-11774METALLIC TPS PANELS SUMMARY REPORT
3.1.8 TRAJECTORY TESTS
Four cyclic trajectory tests were conducted using L605 tensile specimens (.025
cm, longitudinal direction). These tests are a two-step stress trajectory profile
with constant maximum temperature of 11440 K and constant pressure (test 9), two
idealized trajectory tests (tests 12 and 13) with maximum temperatures of 11440K
(comparison of tests 12 and 13 on the basis of atmospheric pressure variation is
presented in Section 3.1.6.2), and a simulated mission trajectory test (test 15)
using representative Shuttle stress, temperature, and pressure profiles.
3.1.8.1 Idealized Trajectory Tests. One of the goals of cyclic testing in Phase I
was to assess the suitability of approximating continuously varying stress and
temperature profiles with a series of constant steps. It was considered necessary
to minimize the number of analysis steps to reduce analysis and computer time to
efficiently conduct TPS panel analysis.
The first test conducted on L605 specimens where stress was varied within a
cycle was test No. 9. Comparison of results for these specimens with specimens
tested at a constant stress (cyclic test No. 3) provide an initial estimate for
idealizing the stress profiles. Shown in Figure 3-44 is the two-step stress profile
for L605 test 9 and the resulting creep strains after 100 cycles for each of the
three specimens (Specimens L30L, L07L, and L35L). Also shown are 100 cycle creep
strain-stress data for the three specimens tested in L605 Test 3 (specimens L53L,
L61L, and L37L). For purposes of the comparison, the two step stress profile
(Test 9) could be idealized with a constant stress profile (Test 3). The objective
of this idealization is to determine what stress applied for the entire 20 minute
cycle, will produce the same 100 cycle creep strain as the two 10-minute stress
levels. These stress levels are designated by the points of intersection (A) as
shown in Figure 3-44. In this particular case, resulting "equivalent" or
3-49
MCOONNELL DOUGLAS ASTRONAUTICS COMPVa. A ST
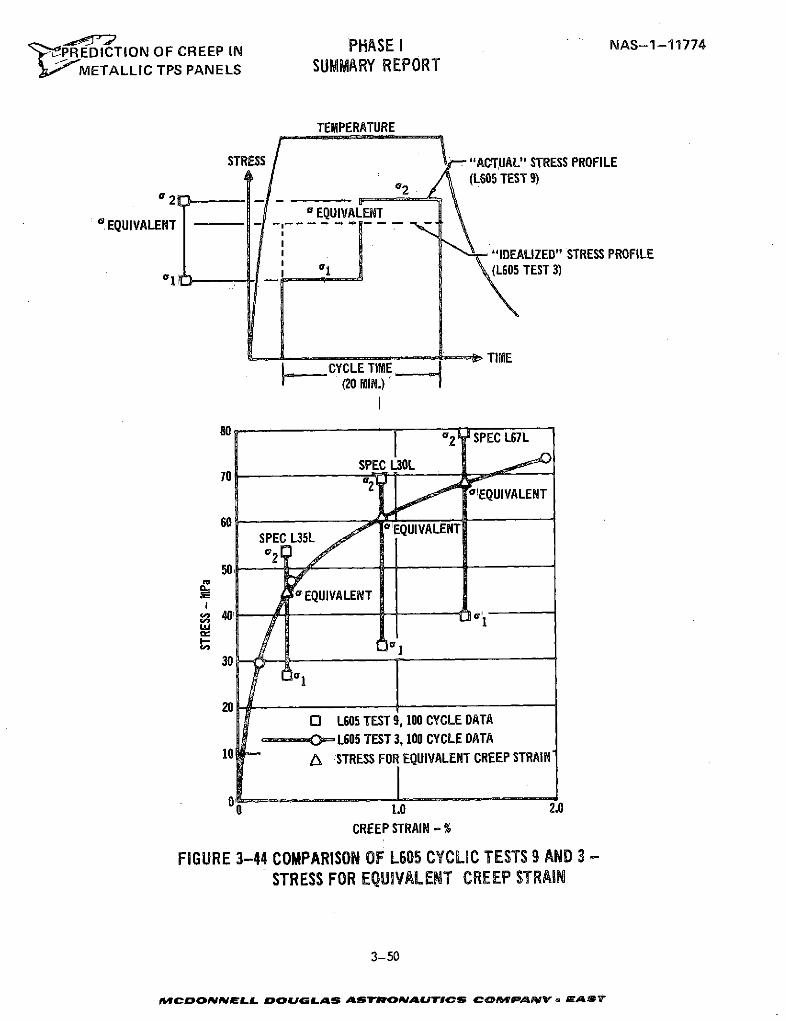
-' PREDICTION OF CREEP IN PHASE I NAS-1-11774
METALLIC TPS PANELS SUMMARY REPORT
TEMPERATURE
STRESS "ACTUAL" STRESS PROFILE(1605 TEST 9)
SEQUIVALENT" EQUIVALENT - --- --"IDEALIZED" STRESS PROFILE
__ (L605 TEST 3)
(20 MIN.)
82 SPEC L67L
SPEC L30L
2 o01EQUIVALENT
60 SPEC L35L EQUIVALENTSPEC L35L
50CL
S' EQUIVALENTI
30
200 1L605 TEST 9, 100 CYCLE DATA
------ 605 TEST 3, 100 CYCLE DATA
10 - A STRESS FOR EQUIVALENT CREEP STRAIN-
0 1.0 2.0
CREEP STRAIN - %
FIGURE 3-44 COMPARISON OF L605 CYCLIC TESTS 9 AND 3 -STRESS FOR EQUIVALENT CREEP STRAIN
3-50
MCDONNELL DOUGLAS ASTrONAUTrICS COIPA PAV - EAS7
<ZPR EDICTION OF CREEP IN PHASE I NAS-1-11774I METALLIC TPS PANELS SUMMARY REPORT
"idealized" stress levels turned out to be the lower stress plus approximately 73%
of the difference between the two stress levels (steps). This result indicates
that the nonlinear nature of the creep-stress relationship should be considered in
the process of idealizing a profile. The importance of making correct judgements
in this idealization process becomes more critical as fewer steps are used in
approximating the profiles.
For tests 12 and 13, the simulated mission stress profile was idealized into
four steps as shown in Figure 3-45. The atmospheric pressure profile was varied
between the tests in order to allow an assessment of the effects of this variable
on creep strains (see Section 3.1.11.3).
For the idealized profiles it was considered desirable to maintain a constant
peak temperature for twenty minutes to be consistent with basic cyclic and stepped
stress tests. Therefore, the temperature profile, shown in the figure, represents
an idealization for the entire twenty minute time period, based strictly on judge-
ment. Stress levels shown were also based on judgement. Specifically, stresses in
the first two time increments were established as somewhat lower than would be
indicated by the previous discussion on L605 test 9 in an effort to offset higher
temperatures and stress levels during the initial six minutes (200 seconds to 500
seconds).
A study using hardening theories in conjunction with cyclic equation 3-6 was
conducted for the idealized trajectory tests. Typical comparisons of predictions
with test data from tests 9 and 13 are presented in Figures 3-46 and 3-47. Results
show that the rate dependent approach generally provides closer predictions than
strain hardening or time hardening theories individually.
3.1.8.2 Simulated Mission Test. The final test of L605 tensile specimens (Test 15)
was conducted using representative shuttle stress, temperature, and pressure profiles.
The simulated mission profile and creep strain results are presented in Figure 3-48.
3-51MCDONNELL DOUGLAS ASTRONAUTICS COMPANY EAST
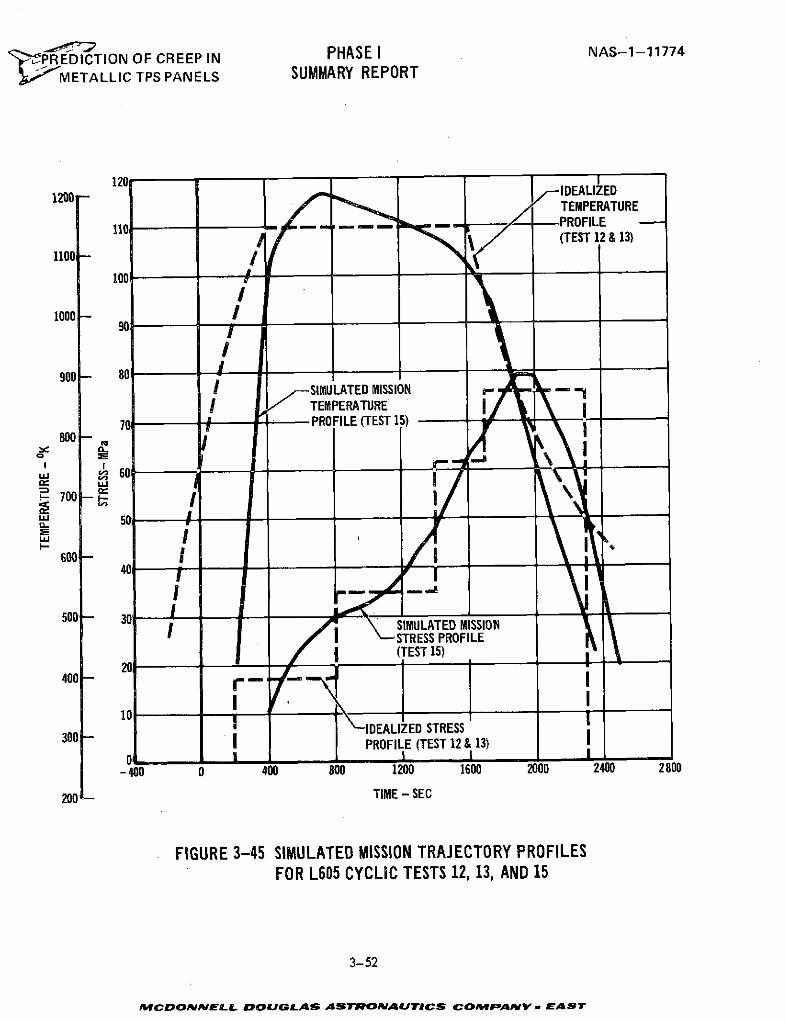
-REDICTION OF CREEP IN PHASE I NAS-1-11774
METALLIC TPS PANELS SUMMARY REPORT
1201200 - ,IDEALIzED
TEMPERATURE
110, . - -- PROFILE10 (TEST 12 & 13)
o 1100 /100
1000 -
90
900 - 80I -- SIMULATED MISSION -
I TEMPERATURE
-70 - PROFILE (TEST 15)800 -
C0
700 -
-4 1 4001 1600 2010 2430 2800
I'--
200 TIME - SEC
FIGURE 3-45 SIMULATED SISOSION TAJECTORY PROFILES
I -- STRESS PROFILE
4 0 0
I- ,
300 -DEALIZED STRESS30 I PROFILE (TEST 12 & 13) i
-400 400 800 1200 1600 2000 2400 2800
200 -TIME - SEC
FIGURE 3-45 SIMULATED MISSION TRAJECTORY PROFILESFOR L605 CYCLIC TESTS 12, 13, AND 15
3-52
MCDON'EL L DOUGLAS ASOTaE IAJDCS COPANV , E"ST
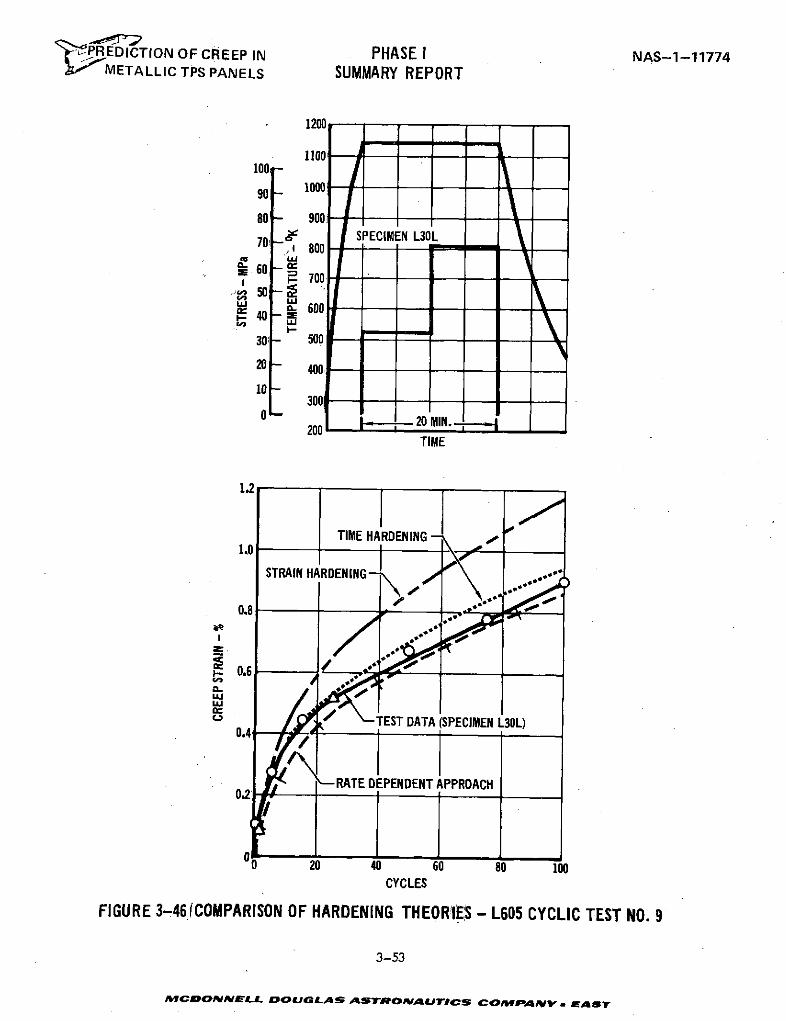
PREDICTION OF CREEP IN PHASE I NAS-1-11774METALLIC TPS PANELS SUMMARY REPORT
1200
1100100
100090 1000
80- 900ie0 SPECIMEN L30Li 800
S60-i 700
50 -600
20 - 300 -
200 -
TIME
1.2
TIME HARDENING -1.0
STRAIN HARDENING ..
0.8 .oe
TEST DATA (SPECIMEN L30L)0.4
RATE DEPENDENT APPROACH0.2
0 20 40 60 80 100CYCLES
FIGURE 3-46 ICOMPARISON OF HARDENING THEORIES - L605 CYCLIC TEST NO. 9
3-53
MCDONNELL DOUGLAS ASTRONAUTICS COMPAN. - EAST
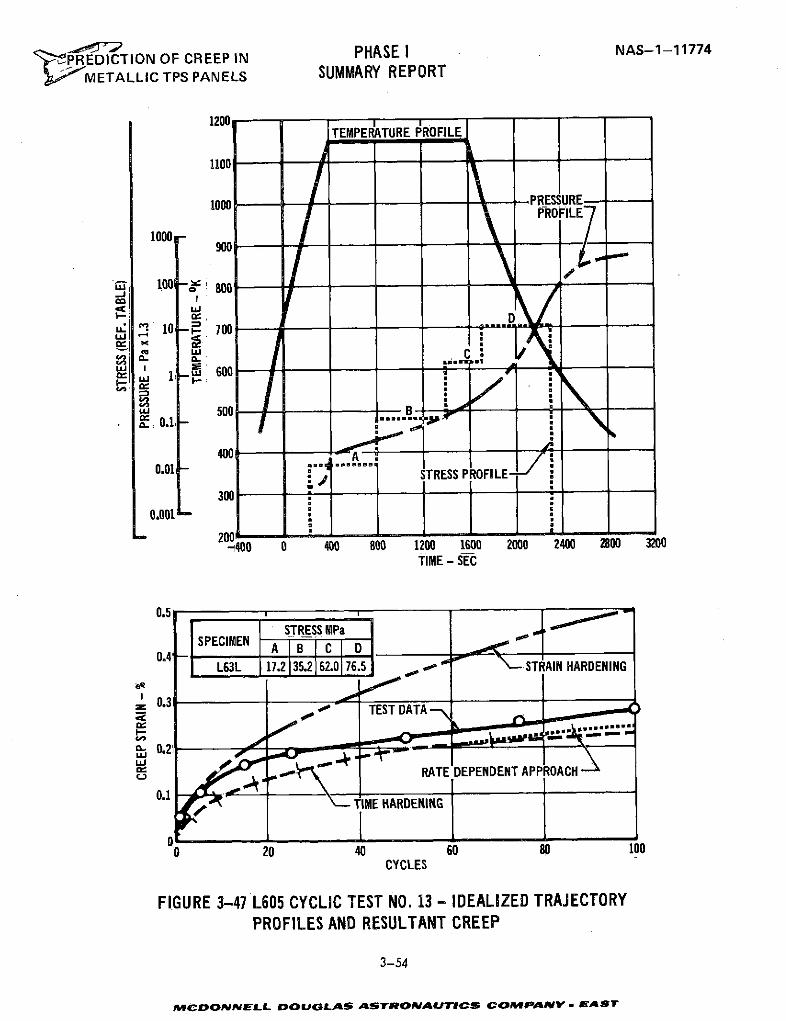
",PREDICTION OF CREEP IN PHASEI NAS-1-11774L METALLIC TPS PANELS SUMMARY REPORT
1200 - TEMPERATURE PROFILE
1100 -
1000 -PRESUREPROFILE
1000900
10o0 - 800
0: - B00--":
500o .1- i
400 Aj '
001 - : , ~ STRESS PROFILE
3000.001
. .000 0 400 800 1200 1600 2000 2400 200 3200
TIME - SEC
0.5 ,
STRESS MPaSPECIMEN ABC D.
0.4 A.I A B DC D.
L63L 17.2 135.2 62.0 76.5 STRAIN HARDENING
0.3
CYCLTEST DATA
FIGURE 3-47L605 CYCLIC TEST NO. 13 - IDEALIZED TRAJECTORY
PROFILES AND RESULTANT CREEP
3-54
0M n~00N:,~' .. ~T G A IME HARDENING
CYCLES
FIGURE 3-47 L605 CYCLIC TEST NO. 13 - IDEALIZED TRAJECTORYPROFILES AND RESULTANT CREEP
3-54
MCDONNELL DOUGLAS jaSyTONAUTcS COMPANY EAST
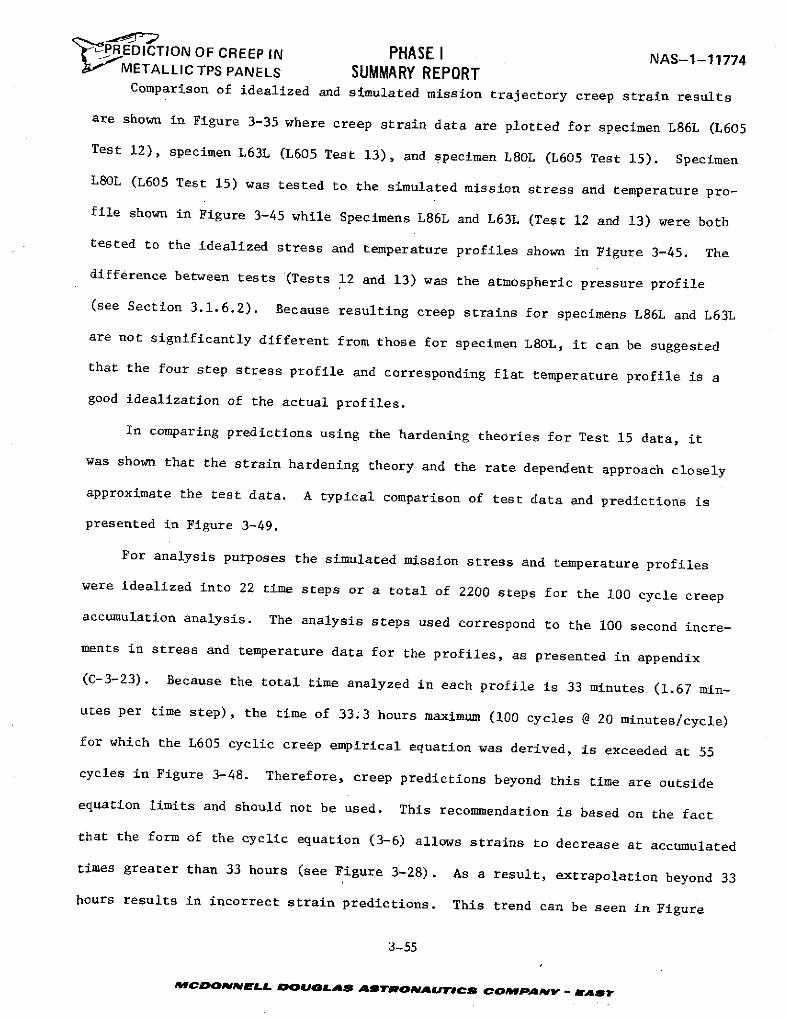
PREDICTION OF CREEP IN PHASE I NAS-1-11774E ; METALLIC TPS PANELS SUMMARY REPORT
Comparison of idealized and simulated mission trajectory creep strain results
are shown in Figure 3-35 where creep strain data are plotted for specimen L86L (L605
Test 12), specimen L63L (L605 Test 13), and specimen L80L (L605 Test 15). Specimen
L80L (L605 Test 15) was tested to the simulated mission stress and temperature pro-
file shown in Figure 3-45 while Specimens L86L and L63L (Test 12 and 13) were both
tested to the idealized stress and temperature profiles shown in Figure 3-45. The
difference between tests (Tests 12 and 13) was the atmospheric pressure profile
(see Section 3.1.6.2). Because resulting creep strains for specimens L86L and L63L
are not significantly different from those for specimen L80L, it can be suggested
that the four step stress profile and corresponding flat temperature profile is a
good idealization of the actual profiles.
In comparing predictions using the hardening theories for Test 15 data, it
was shown that the strain hardening theory and the rate dependent approach closely
approximate the test data. A typical comparison of test data and predictions is
presented in Figure 3-49.
For analysis purposes the simulated mission stress and temperature profiles
were idealized into 22 time steps or a total of 2200 steps for the 100 cycle creep
accumulation analysis. The analysis steps used correspond to the 100 second incre-
ments in stress and temperature data for the profiles, as presented in appendix
(C-3-23). Because the total time analyzed in each profile is 33 minutes (1.67 min-
utes per time step), the time of 33.3 hours maximum (100 cycles @ 20 minutes/cycle)
for which the L605 cyclic creep empirical equation was derived, is exceeded at 55
cycles in Figure 3-48. Therefore, creep predictions beyond this time are outside
equation limits and should not be used. This recommendation is based on the fact
that the form of the cyclic equation (3-6) allows strains to decrease at accumulated
times greater than 33 hours (see Figure 3-28). As a result, extrapolation beyond 33
hours results in incorrect strain predictions. This trend can be seen in Figure
3-55
MCONNWEL DOUNLAS AsRovnWAaurecs COMPANY - aSer
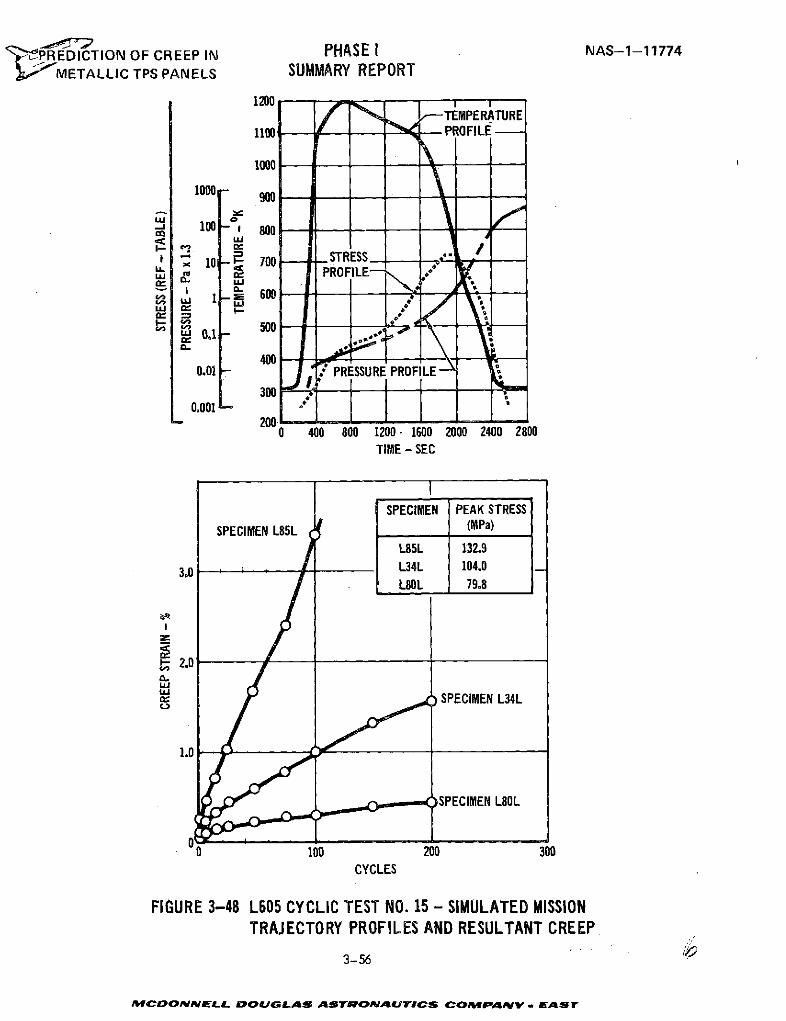
,-PREDICTION OF CREEP IN PHASE I NAS-1-11774
METALLIC TPS PANELS SUMMARY REPORT
1200 -TEMPERATURE
1100 - - -PROFILE-
1000
1000 - 900
100- 800
10 700 STRESS ."l , 10 , PROFILE--
0 000
00 400300 ,! PRESSURE PROFILE
It 1 "0.001 L
0 400 800 1200- 1600 2000 2400 2800TIME - SEC
SPECIMEN PEAK STRESS
SPECIMEN L85L (MPa)
L85L 132.9
3.0 L34L 104.0L80L 79.8
2.0
s )I SPECIMEN L34L
1.0
SPECIMEN L80L
0 100 200 300
CYCLES
FIGURE 3-48 L605 CYCLIC TEST NO. 15 - SIMULATED MISSIONTRAJECTORY PROFILES AND RESULTANT CREEP
3-56
MCONNELL DOUGLAS ASTRONAUlTICS CoMPAY I E AST
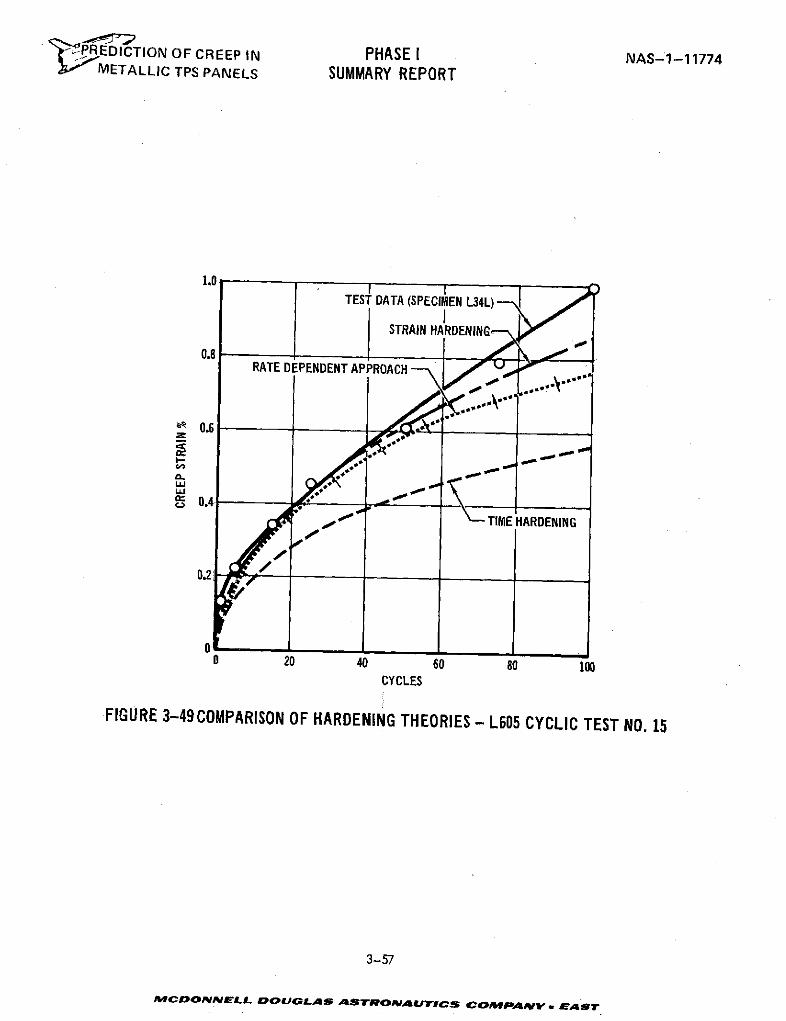
"PRCEDICTION OF CREEP IN PHASE I NAS-1-11774M-'IVIETALLIC TPS PANELS SUMMARY REPORT
1.0TEST DATA (SPECIMEN L34L)
ISTRAIN HARDENING
0.8RATE DEPENDENT APPROACH
,A 0.6
I--9-
a.
ha 0.4oe I TIME HARDENING
0.2
00 20 40 60 80 100
CYCLES
FIGURE 3-49 COMPARISON OF HARDENING THEORIES - L605 CYCLIC TEST NO. 15
3-57
MCONNELL DOUGLAS ASTVOA IC S COAMPNrv w AS rT
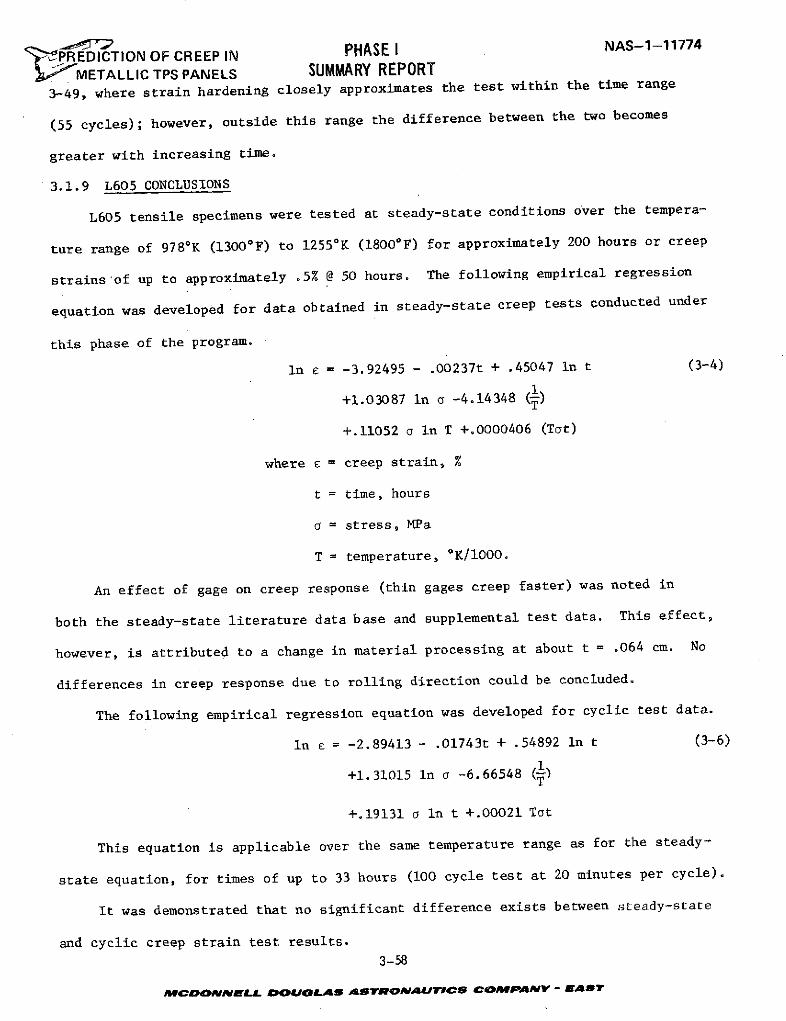
PREDICTION OF CREEP IN PHASE I NAS-1-11774
METALLIC TPS PANELS SUMMARY REPORT3-49, where strain hardening closely approximates the test
within the time range
(55 cycles); however, outside this range the difference between the two becomes
greater with increasing time.
3.1.9 L605 CONCLUSIONS
L605 tensile specimens were tested at steady-state conditions over the tempera-
ture range of 978 0K (13000F) to 1255 0K (18000 F) for approximately 200 hours or creep
strains of up to approximately .5% @ 50 hours. The following empirical regression
equation was developed for data obtained in steady-state creep tests conducted under
this phase of the program.
In E = -3.92495 - .00237t + .45047 In t (3-4)
+1.03087 In a -4.14348 (-)
+.11052 a in T +.0000406 (Tat)
where e = creep strain, %
t = time, hours
a = stress, MPa
T = temperature, 0K/1000.
An effect of gage on creep response (thin gages creep faster) was noted in
both the steady-state literature data base and supplemental test data. This effect,
however, is attributed to a change in material processing at about t = .064 cm. No
differences in creep response due to rolling direction could be concluded.
The following empirical regression equation was developed for cyclic test data.
In E = -2.89413 - .01743t + .54892 In t (3-6)
+1.31015 In a -6.66548 ( )
+.19131 a In t +.00021 Tot
This equation is applicable over the same temperature range as for the steady-
state equation, for times of up to 33 hours (100 cycle test at 20 minutes per cycle).
It was demonstrated that no significant difference exists between steady-state
and cyclic creep strain test results.
3-58
MCDONNNELL DOUGLAS ASTRONAUTICS COAMPANY - EA T
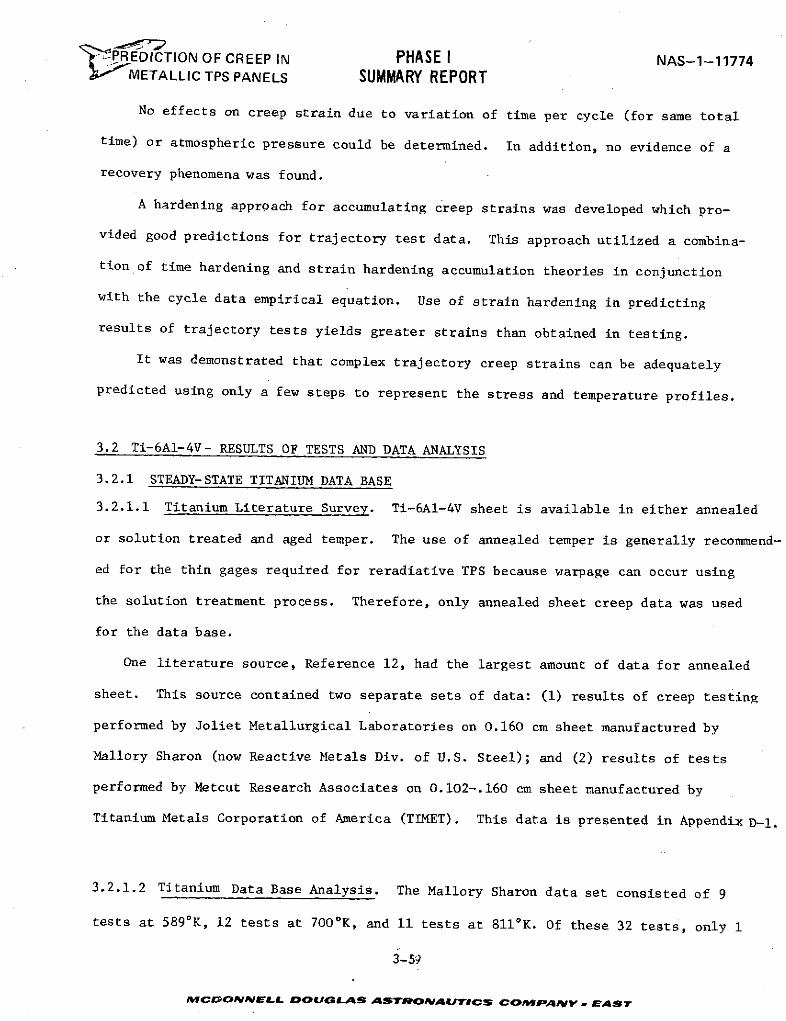
" PiREDICTION OF CREEP IN PHASE I NAS-1-11774; METALLIC TPS PANELS SUMMARY REPORT
No effects on creep strain due to variation of time per cycle (for same total
time) or atmospheric pressure could be determined. In addition, no evidence of a
recovery phenomena was found.
A hardening approach for accumulating creep strains was developed which pro-
vided good predictions for trajectory test data. This approach utilized a combina-
tion of time hardening and strain hardening accumulation theories in conjunction
with the cycle data empirical equation. Use of strain hardening in predicting
results of trajectory tests yields greater strains than obtained in testing.
It was demonstrated that complex trajectory creep strains can be adequately
predicted using only a few steps to represent the stress and temperature profiles.
3.2 Ti-6Al-4V- RESULTS OF TESTS AND DATA ANALYSIS
3.2.1 STEADY-STATE TITANIUM DATA BASE
3.2.1.1 Titanium Literature Survey. Ti-6Al-4V sheet is available in either annealed
or solution treated and aged temper. The use of annealed temper is generally recommend-
ed for the thin gages required for reradiative TPS because warpage can occur using
the solution treatment process. Therefore, only annealed sheet creep data was used
for the data base.
One literature source, Reference 12, had the largest amount of data for annealed
sheet. This source contained two separate sets of data: (1) results of creep testing
performed by Joliet Metallurgical Laboratories on 0.160 cm sheet manufactured by
Mallory Sharon (now Reactive Metals Div. of U.S. Steel); and (2) results of tests
performed by Metcut Research Associates on 0.102-.160 cm sheet manufactured by
Titanium Metals Corporation of America (TIMET). This data is presented in Appendix D-l.
3.2.1.2 Titanium Data Base Analysis. The Mallory Sharon data set consisted of 9
tests at 589 0K, 12 tests at 700 0K, and 11 tests at 8110 K. Of these 32 tests, only 1
3-59
&wCDONNELL DOUGLAS ASTRONAUTCS CO PANV - AeASr
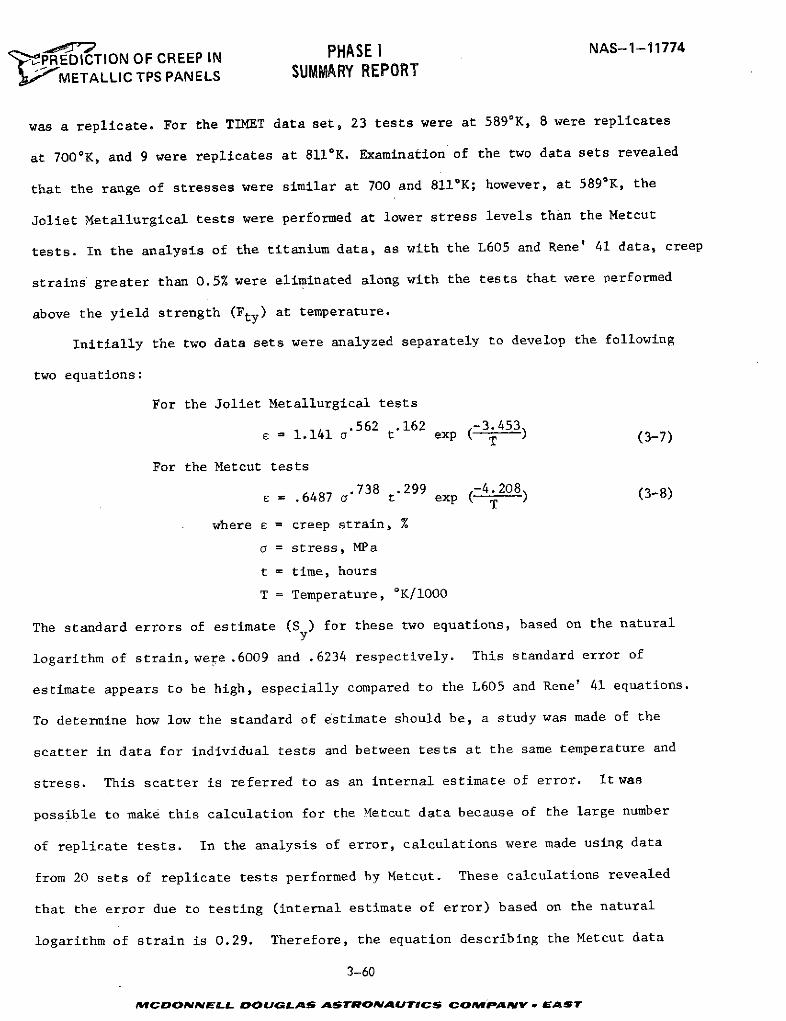
SIPHASE I NAS-1-11774PREDICTION OF CREEP IN
METALLIC TPS PANELS SUMMARY REPORT
was a replicate. For the TIMET data set, 23 tests were at 5890K, 8 were replicates
at 7000K, and 9 were replicates at 8110 K. Examination of the two data sets revealed
that the range of stresses were similar at 700 and 811*K; however, at 5890 K, the
Joliet Metallurgical tests were performed at lower stress levels than the Metcut
tests. In the analysis of the titanium data, as with the L605 and Rene' 41 data, creep
strains greater than 0.5% were eliminated along with the tests that were performed
above the yield strength (Fty) at temperature.
Initially the two data sets were analyzed separately to develop the following
two equations:
For the Joliet Metallurgical tests
.562 .162 -3.453= 1.141 t exp ( T ) (3-7)
For the Metcut tests
S.6487 a.738 .299 4.208 (3-8)
where c = creep strain, %
a = stress, MPa
t = time, hours
T = Temperature, OK/1000
The standard errors of estimate (S y) for these two equations, based on the natural
logarithm of strain, were .6009 and .6234 respectively. This standard error of
estimate appears to be high, especially compared to the L605 and Rene' 41 equations.
To determine how low the standard of estimate should be, a study was made of the
scatter in data for individual tests and between tests at the same temperature and
stress. This scatter is referred to as an internal estimate of error. It was
possible to make this calculation for the Metcut data because of the large number
of replicate tests. In the analysis of error, calculations were made using data
from 20 sets of replicate tests performed by Metcut. These calculations revealed
that the error due to testing (internal estimate of error) based on the natural
logarithm of strain is 0.29. Therefore, the equation describing the Metcut data
3-60
MCOONNELL DOULAS ASTROJAUTICS COMPANV - EAST
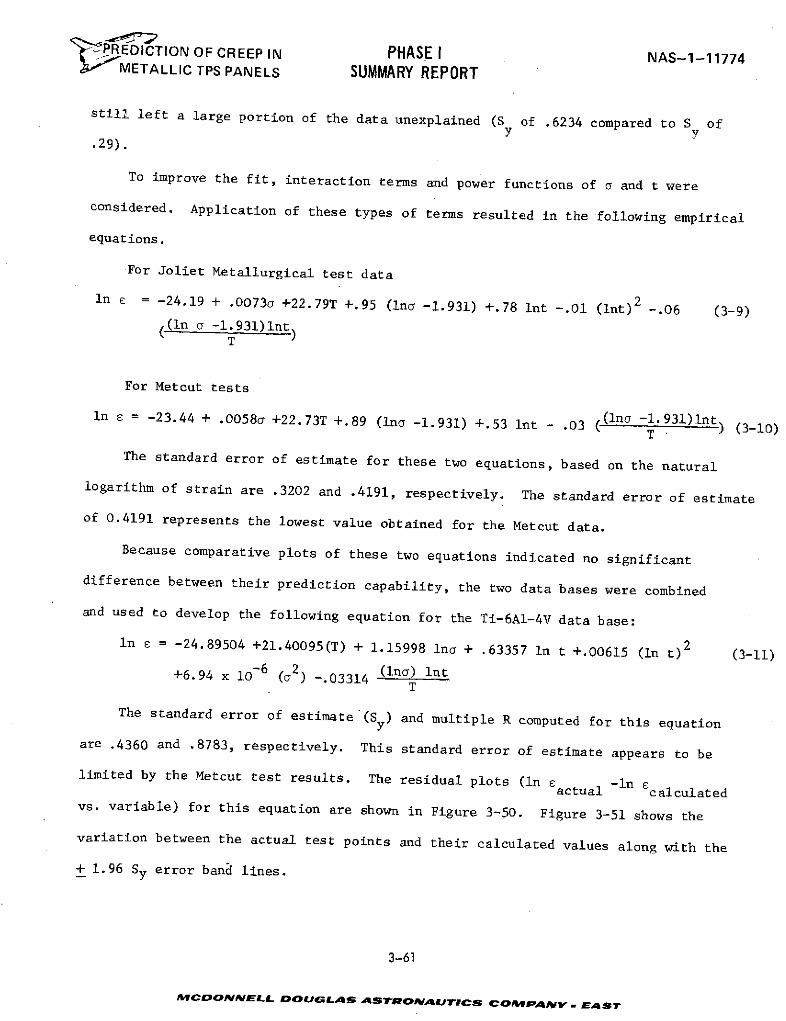
'PR'7EDICTION OF CREEP IN PHASE I NAS-1-11774; "METALLIC TPS PANELS SUMMARY REPORT
still left a large portion of the data unexplained (S of .6234 compared to S ofY y
.29).
To improve the fit, interaction terms and power functions of a and t were
considered. Application of these types of terms resulted in the following empirical
equations.
For Joliet Metallurgical test data
In E = -24.19 + .0 073a +22.79T +.95 (Ina -1.931) +.78 Int -.01 (lnt) 2 -.06 (3-9)((In a -1.931)lnt
T
For Metcut tests
In E = -23.44 + .0058a +22.73T +.89 (Ina -1.931) +.53 Int - .03 ((n -. 931nt) (3-10)
The standard error of estimate for these two equations, based on the natural
logarithm of strain are .3202 and .4191, respectively. The standard error of estimate
of 0.4191 represents the lowest value obtained for the Metcut data.
Because comparative plots of these two equations indicated no significant
difference between their prediction capability, the two data bases were combined
and used to develop the following equation for the Ti-6AI-4V data base:
In E = -24.89504 +21.40095(T) + 1.15998 Ina + .63357 In t +.00615 (in t)2 (3-11)
+6.94 x 10- 6 (2) -.03314 (ina) IntT
The standard error of estimate (S y) and multiple R computed for this equation
are .4360 and .8783, respectively. This standard error of estimate appears to belimited by the Metcut test results. The residual plots (in Eactual -in calculated
vs. variable) for this equation are shown in Figure 3-50. Figure 3-51 shows the
variation between the actual test points and their calculated values along with the
+ 1.96 Sy error band lines.
3-61
MCDONNELL DOUGLAS ASTROPAIUJTCS COPaN ,,v S-
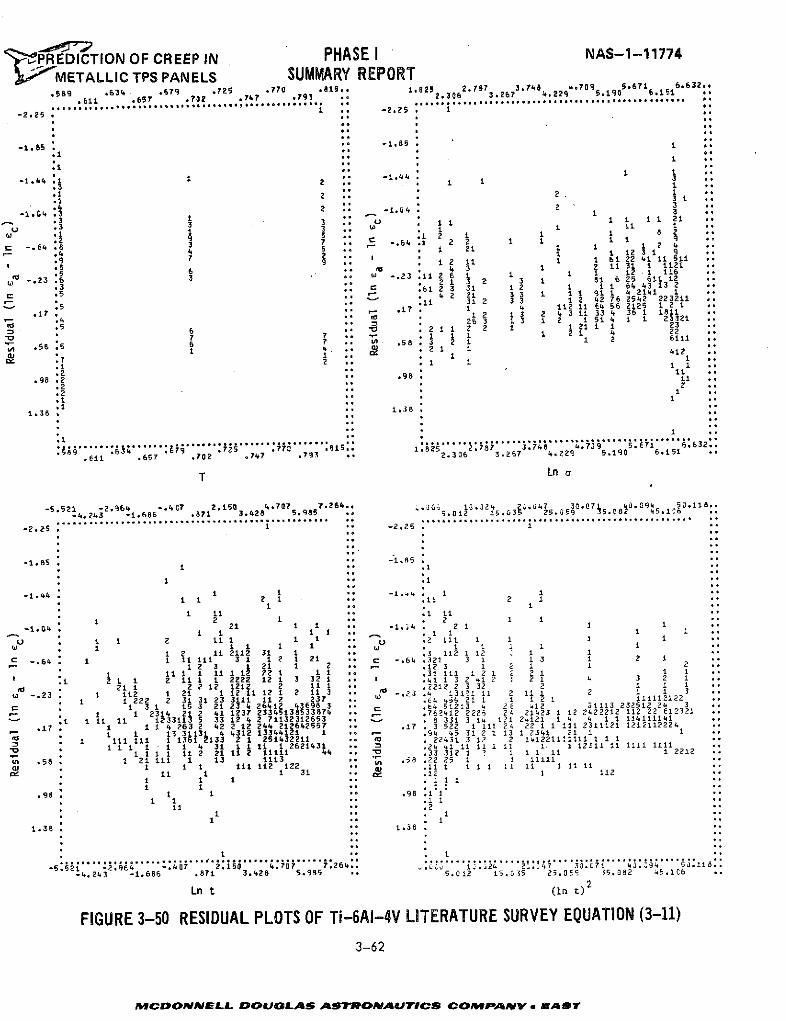
-- PREDICTION OF CREEP IN PHASE I NAS-1-11774k#rMETALLIC TPS PANELS SUMMARY REPORT
,589 .634 .679 .725 .770 815. 1.8252.36 2.787 3.263.748 .709 5.671 6.632.
.611 .657 .702 .7,7 .,793 . 2.306 3.267 .229 5.19. 6.151....
-2.25 - 1
-1.85 85
.1
" 3 2 '' . 1
.21 2 1 *.-1, 21 ,3
.1 3 3 11
.2 2 .12 1 1 8S-.64 .8 3 C -. 8*41 2 2 1 1 2*9
.9 79 . . . 12 11 1 1 61 22 11 511.8,. 4 3 12 11 31 1 1121
-. 23 6 3. -. 23 .11 2 6 1
.3 6 2 3 1 81 25 61 12C 3 . ;61 2 3 31 1 2 1 1 1 64 43 13 2
S .5 44 . 42 21 33 1 1 1 911 .42141 1S 31 2 3 1 2 42 76 252 223211
. 5 .17 1 4 1 12 5 1 2 1
. .4 •* % 1 2 1 3 2 4 3 11 33 4 3 1 1811:4 . 263 13 1 2 151 4 1 233216 2 1 1 2 2 1 1 21 1 1 23
S7 .. 1 1 1 21 4 22- 5 2 V 1 2 . 3 12 12 1 1 11
1 .32 31 3 2 1.58.5 2 12 2 6
•1 22 .. 1 1
. * . 1 41 .
98 .2 1 211.2 • 12
.1 . . 1.1 . .38
1.38 * ::
.1 " 1
.611 .657 .702 .747 .793 . 2.336 3.267 4.220 5.190 6.151 ,
T Ln a
-5.521 *264 .4C7 1 4.7075 7.Z64:: 1..324 094 5.11
-2.25 -2.25.
1. 2 2 ."
S1 1 . 1
1.38 121 1: 1.124: 1 2 11-6 1 1 1. 1 . 12 1 12
1 -. 111-4.243 -1.686 .871 213.128 5.985 1 .. 3 15.012 1 1 1 125.059 16
1 2 3 1 21 1 2 .. - .12 3 1 2 1 1 21 1I 1 11 1 12 22 1 1 1 .o .31 11 1 2 1 2 2 1 1 1
.1 2 1 1 2 11 1 1 2222 12 1 3 32 1 .4 .1 1 3 2 41 2 1 2 1 4 3 2 1
. 21 1 2 2 12 1212 2 * t 1 .2212 2 3 32 2 1 1 12 1 112 1 21 1 12 11 12 12 11 3 .. -23 .4 1311 11 2 ± 1 2 1 1 3
1 222 2 31 31 23 311 11 2 37 ..F 1 3 5 21 23 4 26412 43698 3 .•5 L 523 2 Y2 33N 232512 24 3
1 1 2314 21 2 41 1237 2334513853387,4 *4 76212 2224 2 241 2 2422212 112 22 512321
:i 1 11 11 1233113 5 33 12 4 2 71132312653 .74313 14 12 2142 1 4 4 1 1 114111141
.17 1 1 1 4 263 2 42 2 12 244 21264255 .. .17 3 5 1 1 2 22 1 1 I 2311121 12121122241 1 13 4 4312 13344121, 1 .94 5 31 2 1 13 1 2341 21 1 11 111 il 1 131 h33 2 1 251432211 . 0 *22431 3 12 2 141221111111 1 1 1
S * 11 1 1 1 4 31 i ± 1t 1 2621431 .. .24 41 11 11 1 11 1. 1 12311 11 1111 1111
58 1 I 1 11 2 21 2 11111 44 V .33 312 1 2 1 1 1 11 1 2212.58 1 21 I11 1 13 1113 4. " .58 .22 25 1 1 11111
W I ± 1 1 111 112 122 .. .111 1±1 1 1 11 11111i 1 1 1 31 •* .12 1 112
1 1 .. .11
.98 1 1 .98 .1 1I 1 *. .1 1 "11 .° .2 ""
1 1 4 Z3 1
-4.243 -1.686 .821 3.428 5 .9 . .12 1. 2. 1.02 .1
Ln t (In t)2
FIGURE 3-50 RESIDUAL PLOTS OF Ti-6AI-4V LITERATURE SURVEY EQUATION (3-11)
3-62
MCDPONNELIL D"OUGLAS ASTRONAUICS CcOMovA NV , EASr
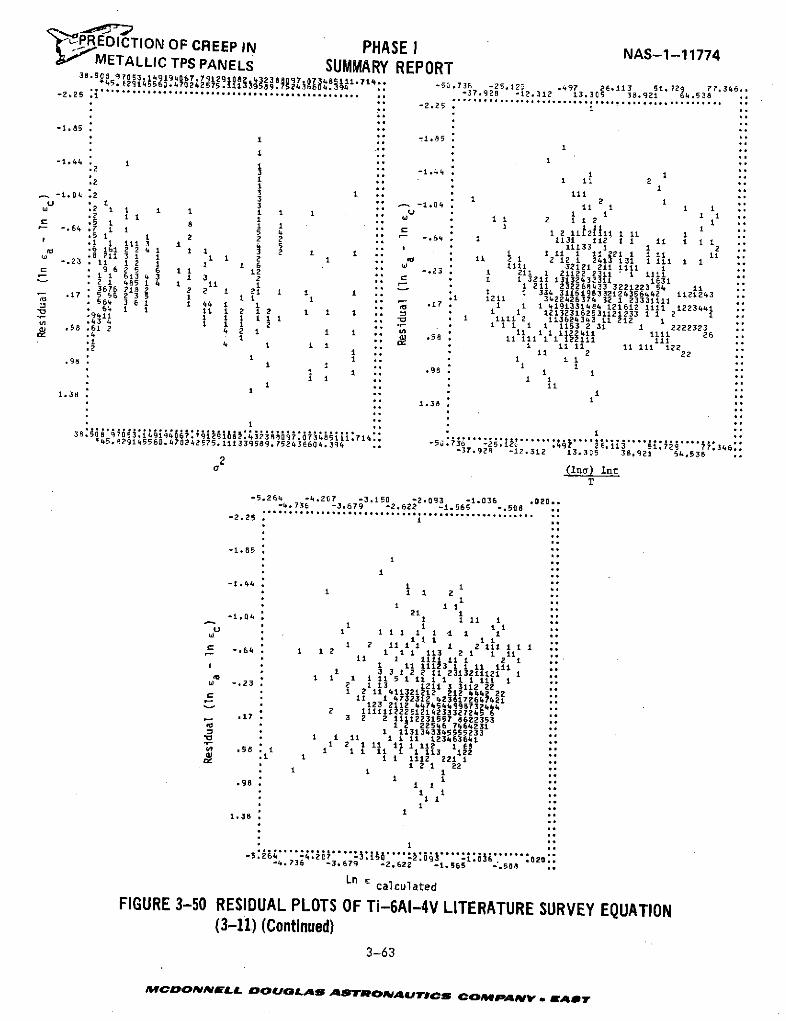
PREDICTION OF CREEP IN PHASE I NAS-1-11774METALLIC TPS PANELS SUMMARY REPORT
3 8.5 8
9155603 25475 1489 675266 ,194 .74 -50.736 -25.12- .497 26.113 51.729 77.346..-2.25:" .**....* *........ ..... .. -37.928 -12.312 13.3C5 38.921 64.538 ... 1 ..* -2.25 .
-1.851.5
°o -1.65
-1.44 * 1 1 . 12 3 -124 . 1 1.2 1 .. 1 11 2 .1 . 1-1.04 .2 3 111
S.2 1 2 1 1 2 1 1 1
. 1 11 1 .1 2 f112 f I- -. 64 1 5 4 -. 64 1 12 11 211 1 11 i I.5 1 1 2 1 1 113 1 11 1 1 1S 61 1 1 1 1 1 ± 3 1 221 1 1 11.8 211 3 1 1 1 1 2 1 11 2 12i 2413 131 1 11 1-. 1 2 ±± 1 1 6 11 i i 32 21 21 ±111 12 .
2 9 6 2 5 6 1 1 12 -23 1 211 1 21122 2311 1111S 61
1 1 3l 132433311 16316 1 3 4 3 1 2
1 21 232633 3221223 54 1132 1 485 1 411± 1 - - I 1 3 3116198332124356s42 1121243367.17 562 j 2 2 1 21 1 1 ± .1 1211 3422426374 32 23331111
± 1 1 1
1 564 3 8 ± 1 44 ± . .17 1 1 1 419i331484 121612 1111 122344 "5 64 1 ± 1 1 4 4 ±2 1 1 ± * 1 1213236253121233 1 1j9411 ± 1 ± 1 I 1 t 2ll 112 13624343 11 212 1.43 9 1 1 2 .1 1i I I1 1 1153 2 31 ± 2222323.58 .61 2 4 2 ± 1* ii 1 1111 27.4 2 1 w °35 121 111 1 ± 12211 11 ..3a 2 III 1 211 ill
.98 1 1 .. .1 1I± 1 .. I I ±
i 1 . .98 1 i1 .. 11 "
I *
1.3 1381
45.°291l45560.470242575,l1339589,?52660,94 ,-37926 -12.312 13.3C5 38.921 54.538
2 (inI) Int
-5.264 -4.2t7 -3.150 -2.093 -1.036 .020..-4.,736 -3.679 -2.622 -1.565 -. 508-2.25 * ±
-1.85 . **
**-1.44 1 1
1 1 1 2
1 11-1.04 2 1 I
1 1 1 1 1 1 i 1
-. 64 1 1 2 i 1 11 2 1 1 i1 2 1 11123 11 11 iI it 1±1123 I I I
1 3 3 1 2 1 1 Z313211121 1. .1 1 1 1 I 1 111 1 2I111 1. 1 1 121 3 1 12 22 2
1 2 11 411321212 212 4442 221*1 ± 4732312 4236172647421. 123 2112
44
7454499873144
2 111111Z22211233327245 6.17 3 2 2 11112231557 86223531 2 22546 7464231
S113433455S5233* ± 11 1 1 11 123463641"a 1 2 1 1 1 ± 11 H 3 1 68
.58 . 1 1 1 I 22. i 1 1 112 221 11 2 1 22
1 1.98 ± 1
11(3-11) (Continued)
1.38 *a r
-264 ..- 4.2 7 : o . -1036 .020..-4.736 -3.679 -2.622 -1.565 -. 506 ,,Ln E calculated
FIGURE 3-50 RESIDUAL PLOTS OF Ti-6AI-4V LITERATURE SURVEY EQUATION(3-11) (Continued)
3-63
MCOONNELL OOIOLAS ASTRONAUTICS COMPANV * lAST
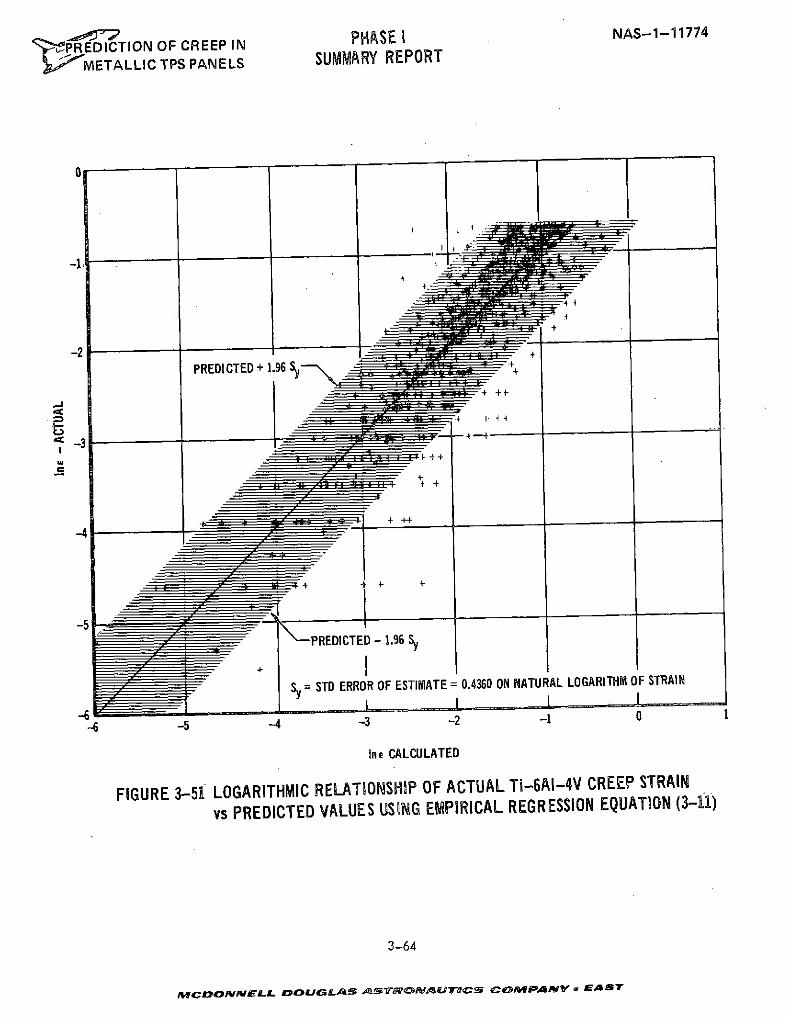
'PREDICTION OF CREEP IN NAS-
METALLIC TPS PANELS SUMMARY REPORT
0
-2
-1
PREDICTED + 1.96 'Y 4
PREDICTEDn CALCULATED1.96 S
-6
FIGURE 3-51 LOGARITHMIC RELATiONSHIP OF ACTUAL Ti-6AI-4V CREEP STRAIN
vs PREDICTED VALUES USING EMPIRICAL REGRESSION EQUATION (3-11)
3-64
-ACONNELL DOULS .SVW: dAUTCS COP AcM-PVTY . LAs T
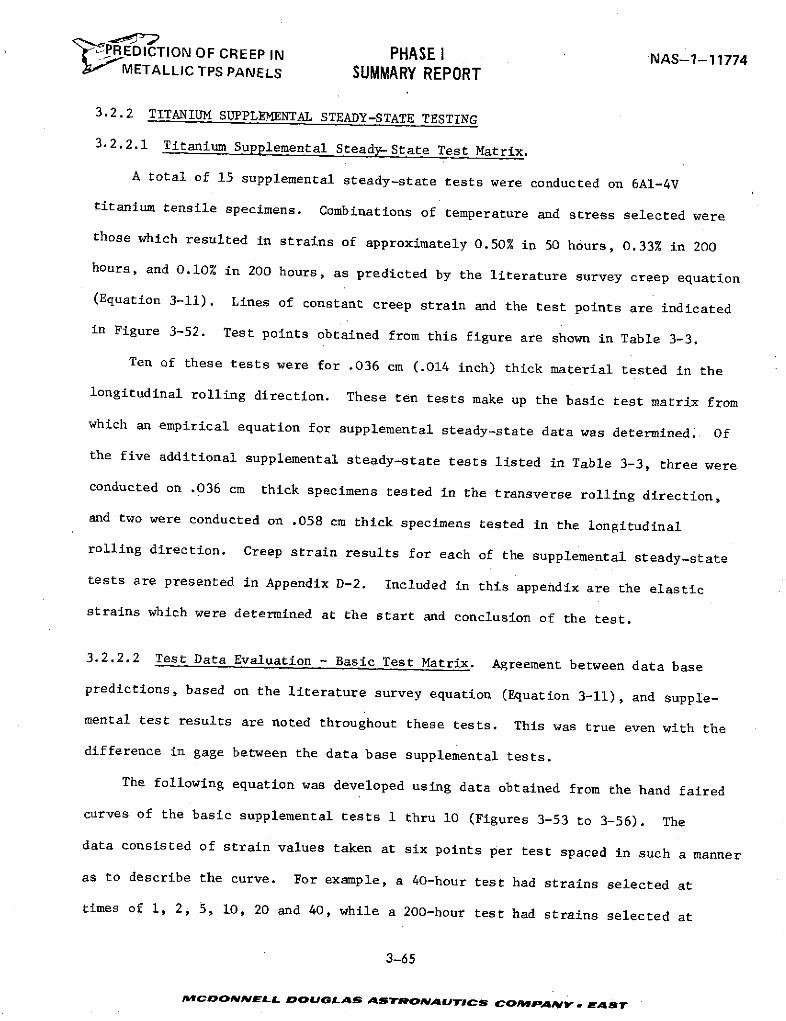
' P.REDICTION OF CREEP IN PHASE I NAS-1-117742;'METALLIC TPS PANELS SUMMARY REPORT
3.2.2 TITANIUM SUPPLEMENTAL STEADY-STATE TESTING
3.2.2.1 Titanium Supplemental Steady-State Test Matrix.
A total of 15 supplemental steady-state tests were conducted on 6Al-4V
titanium tensile specimens. Combinations of temperature and stress selected were
those which resulted in strains of approximately 0.50% in 50 hours, 0.33% in 200
hours, and 0.10% in 200 hours, as predicted by the literature survey creep equation
(Equation 3-11). Lines of constant creep strain and the test points are indicated
in Figure 3-52. Test points obtained from this figure are shown in Table 3-3.
Ten of these tests were for .036 cm (.014 inch) thick material tested in the
longitudinal rolling direction. These ten tests make up the basic test matrix from
which an empirical equation for supplemental steady-state data was determined. Of
the five additional supplemental steady-state tests listed in Table 3-3, three were
conducted on .036 cm thick specimens tested in the transverse rolling direction,
and two were conducted on .058 cm thick specimens tested in the longitudinal
rolling direction. Creep strain results for each of the supplemental steady-state
tests are presented in Appendix D-2. Included in this appendix are the elastic
strains which were determined at the start and conclusion of the test.
3.2.2.2 Test Data Evaluation - Basic Test Matrix. Agreement between data base
predictions, based on the literature survey equation (Equation 3-11), and supple-
mental test results are noted throughout these tests. This was true even with the
difference in gage between the data base supplemental tests.
The following equation was developed using data obtained from the hand faired
curves of the basic supplemental tests 1 thru 10 (Figures 3-53 to 3-56). The
data consisted of strain values taken at six points per test spaced in such a manner
as to describe the curve. For example, a 40-hour test had strains selected at
times of 1, 2, 5, 10, 20 and 40, while a 200-hour test had strains selected at
3-65
MACDONNELL DOUGLAS ASTRONAUTICS eCOR9IANV-w A AT
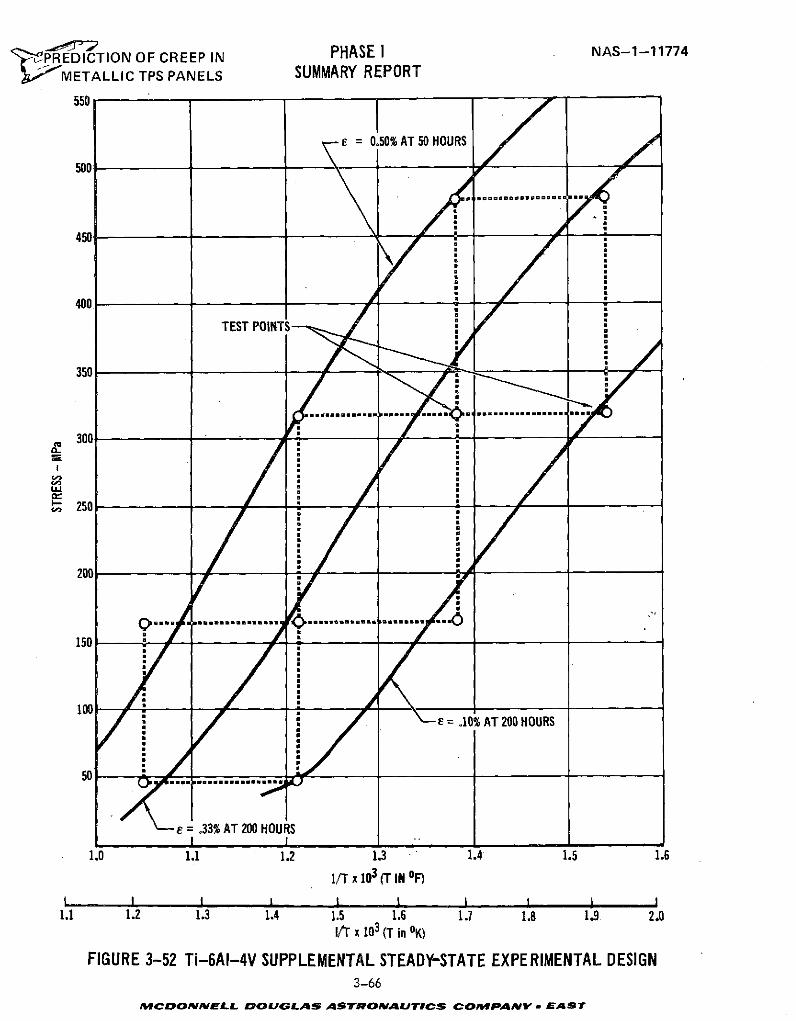
~"- PREDICTION OF CREEP IN PHASE I NAS-1-11774
METALLIC TPS PANELS SUMMARY REPORT
550
E = 0.50% AT 50 HOURS
500
450
400
TEST POINTS -7 A7
350
300
250
200
, / ............. ....................150
100 = .10% AT 200 HOURS
= .33% AT 200 HOURS
1.0 1.1 1.2 1.3 1.4 1.5 1.6
1/T x 103 (T IN OF)
I I J I I I I 1 I1.1 1.2 1.3 1.4 1.5 1.6 1.7 1.8 1.9 2.0
I/r x 103 (T in OK)
FIGURE 3-52 Ti-6AI-4V SUPPLEMENTAL STEADY-STATE EXPERIMENTAL DESIGN3-66
MAICDOIELL DOUGLAS ASTROAUTICS COMPaANYV . EAST
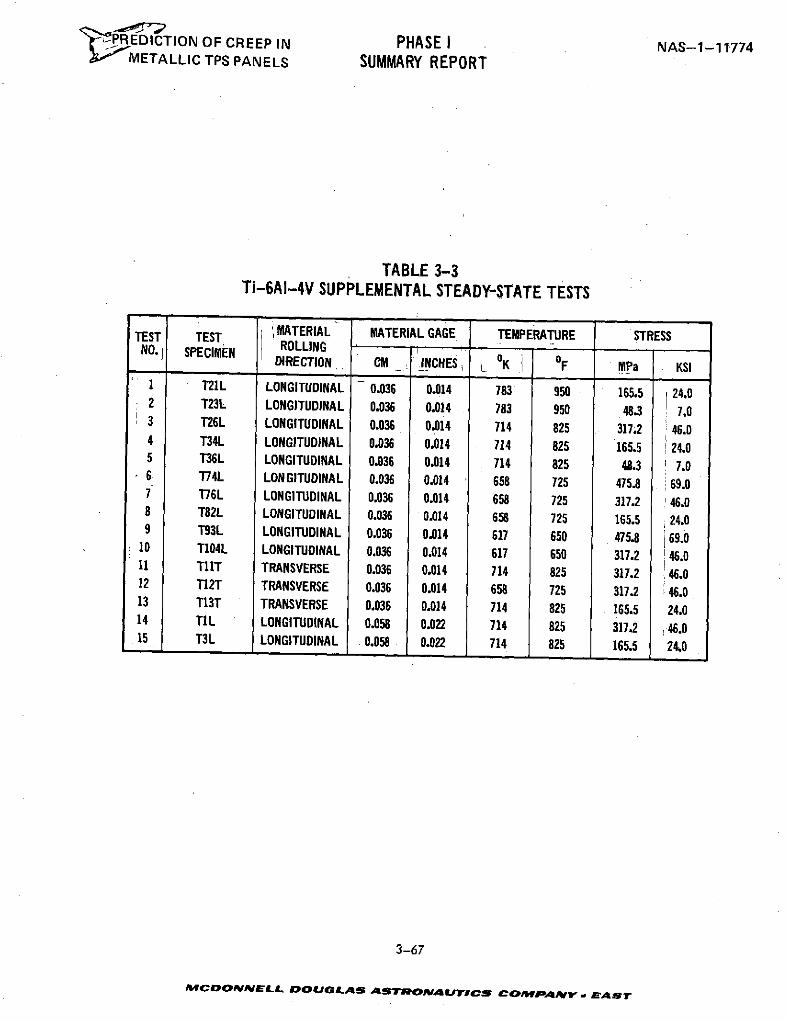
P EDICTION OF CREEP IN PHASE I NAS-1-11774l METALLIC TPS PANELS SUMMARY REPORT
TABLE 3-3Ti-6AI-4V SUPPLEMENTAL STEADY-STATE TESTS
TEST TEST MATERIAL MATERIAL GAGE TEMPERATURE STRESSNO. SPECIMEN ROLLINGDIRECTION CM _ INCHES oK oF MPa KSI
I T21L LONGITUDINAL 0.036 0.014 783 950 165.5 24.02 T23L LONGITUDINAL 0.036 0.014 783 950 48.3 7.03 T26L LONGITUDINAL 0.036 0.014 714 825 317.2 46.04 T34L LONGITUDINAL 0.036 0.014 714 825 165.5 24.05 T36L LONGITUDINAL 0.036 0.014 714 825 48.3 7.06 T74L LONGITUDINAL 0.036 0.014 658 725 475.8 :69.07 T76L LONGITUDINAL 0.036 0.014 658 725 317.2 46.08 T82L LONGITUDINAL 0.036 0.014 658 725 165.5 j24.09 T93L LONGITUDINAL 0.036 0.014 617 650 475.8 69.0
10 T104L LONGITUDINAL 0.036 0.014 617 650 317.2 46.011 T11T TRANSVERSE 0.036 0.014 714 825 317.2 :46.012 T12T TRANSVERSE 0.036 0.014 658 725 317.2 46.013 T13T TRANSVERSE 0.036 0.014 714 825 165.5 24.014 TIL LONGITUDINAL 0.058 0.022 714 825 317.2 46.015 T3L LONGITUDINAL 0.058 0.022 714 825 165.5 24.0
3-67
MCDONNELL OUGoLAS ASTRONAUTICS COMPIAYv. EAST
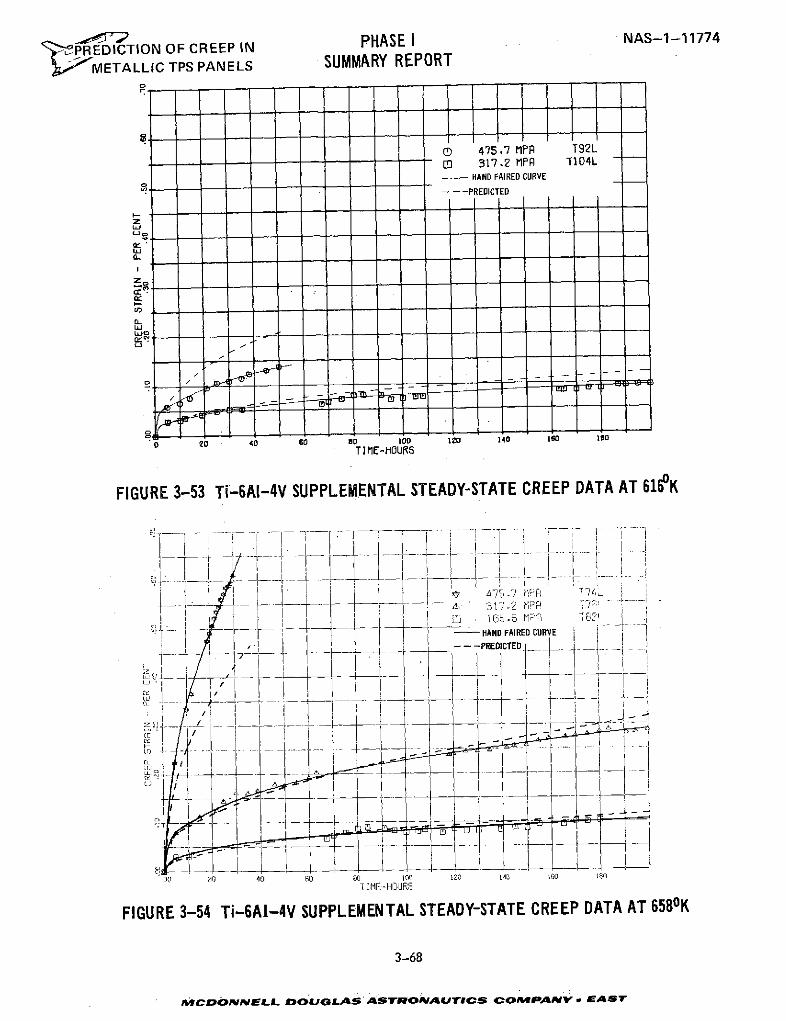
PHASE I NAS-1-11774,PREDICTION OF CREEP IN
METALLIC TPS PANELS SUMMARY REPORT
® 475.7 MPR T92LEl 317.2 MPR T104L
HAND FAIRED CURVE
- -- PREDICTED
€.1-
Z,
0-
0 20 40 60 80 100 120 140 160 l0o
TIME-HOURS
FIGURE 3-53 Ti-6AI-4V SUPPLEMENTAL STEADY-STATE CREEP DATA AT 5610 K
rT -T- r68Ti I- I p - -
I- - .-- -- v-. i SI-.
LJ A 2317.2 MPI I L - I } - .t 5s - .i . . .... .
I - HAND FAIRED CURVE
- --- -- - PREDICTED
/ I L - -LE. . .. . .
TIME-HOURS
FIGURE 3-54 Ti-6A1-4V SUPPLEMENTAL STEADY-STATE CREEP DATA AT 6580K
3-68
ICDONELL DOUGLAS ASTONAUTICS COPWPANV *AST
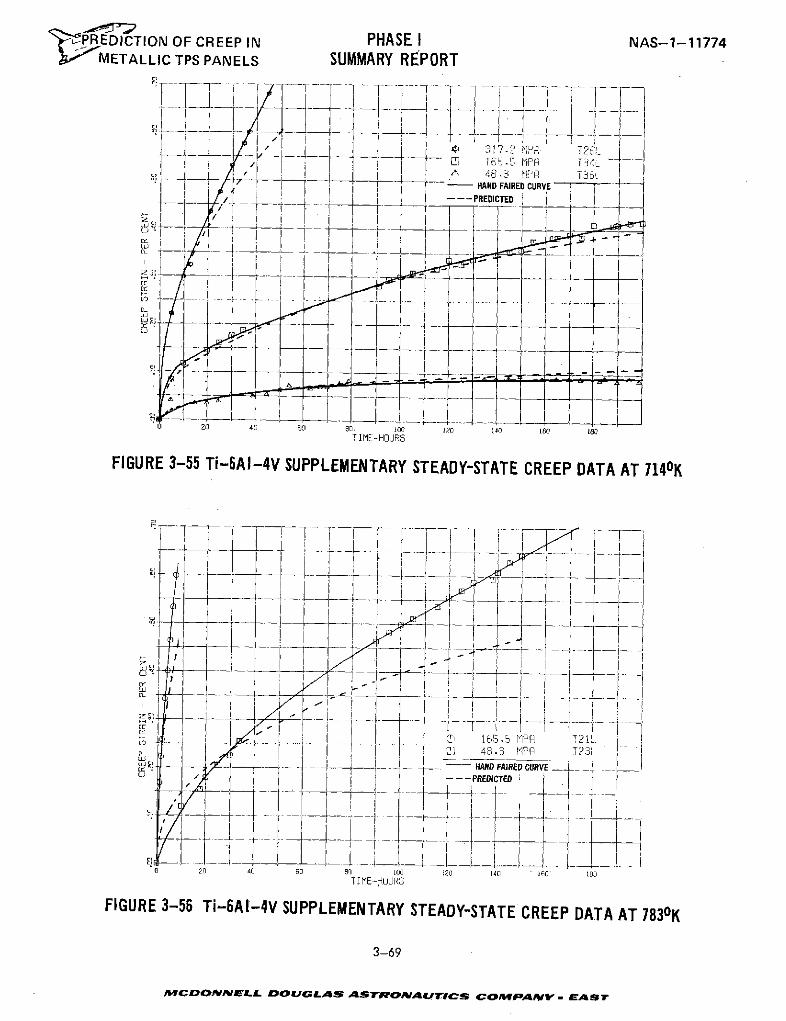
'P0REDICTION OF CREEP IN PHASE I NAS-1-11774M' IETALLIC TPS PANELS SUMMARY REPORT
S -31 -.PR T26 -
S-6 - MP:I T F
r--- L_,_ -
l 16' _. PP T 3446. T3tL
- i I - - ---- HAND FAIRED CURVE
Tii ME I IOUR
TIME--HOURS
FIGURE 3-55 Ti-BAI-4V SUPPLEMENTARY STEADY-STATE CREEP DATA AT 7140K
3-69
MC OI I L i i I i i / " a
o i I .1"- 1 ,-- i i _ ,E -'I , I FC- i
M --- - -- V T2 -
LI I i MP "
C, f 1-- I---) 20 40 60 80 0 [20 140 160 1
TIME--HOURS
FIGURE 3-56 Ti-6AI-4V SUPPLEMENTARY STEADY-STATE CREEP DATA AT 7830K
3-69
MCDONNELL DOUGLAS ASTRONAUTICS COMPANY - EAST
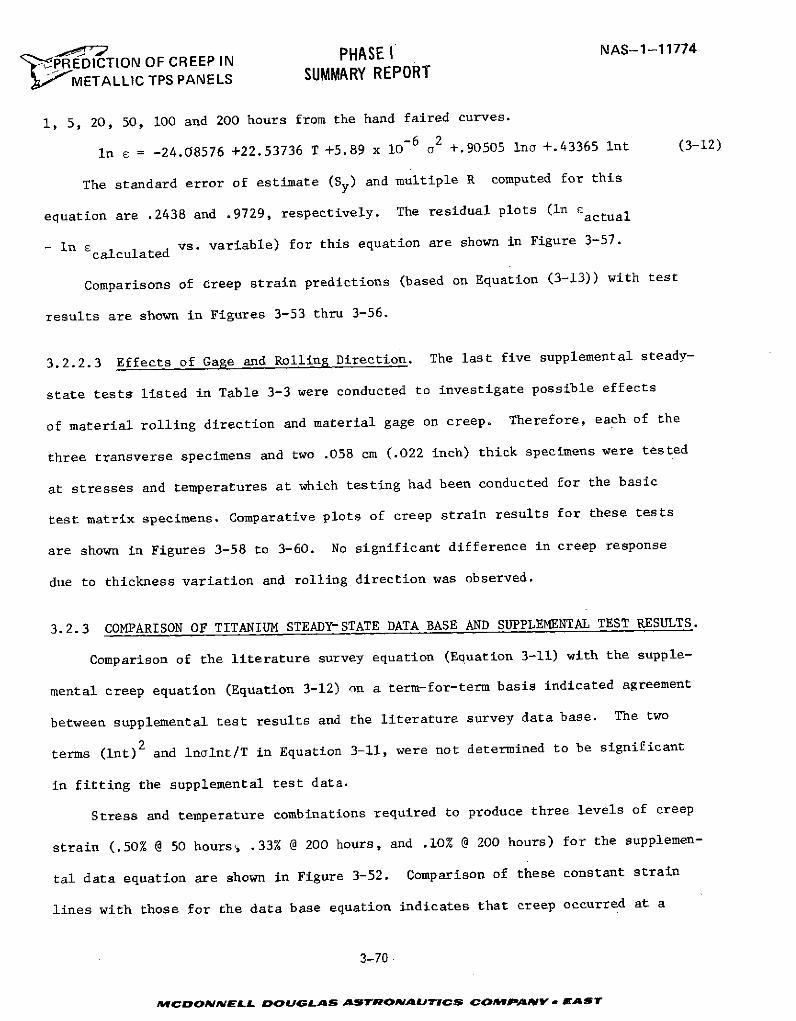
' , PREDICTION OF CREEP IN PHASE NAS-1-11774
; METALLIC TPS PANELS SUMMARY REPORT
1, 5, 20, 50, 100 and 200 hours from the hand faired curves.
In E = -24.08576 +22.53736 T +5.89 x 10⁶ 2 +.90505 Ina +.43365 Int (3-12)
The standard error of estimate (Sy) and multiple R computed for this
equation are .2438 and .9729, respectively. The residual plots (in Eactual
- In calculated vs. variable) for this equation are shown in Figure 3-57.
Comparisons of creep strain predictions (based on Equation (3-13)) with test
results are shown in Figures 3-53 thru 3-56.
3.2.2.3 Effects of Gage and Rolling Direction. The last five supplemental steady-
state tests listed in Table 3-3 were conducted to investigate possible effects
of material rolling direction and material gage on creep. Therefore, each of the
three transverse specimens and two .058 cm (.022 inch) thick specimens were tested
at stresses and temperatures at which testing had been conducted for the basic
test matrix specimens. Comparative plots of creep strain results for these tests
are shown in Figures 3-58 to 3-60. No significant difference in creep response
due to thickness variation and rolling direction was observed.
3.2.3 COMPARISON OF TITANIUM STEADY-STATE DATA BASE AND SUPPLEMENTAL TEST RESULTS.
Comparison of the literature survey equation (Equation 3-11) with the supple-
mental creep equation (Equation 3-12) on a term-for-term basis indicated agreement
between supplemental test results and the literature survey data base. The two
terms (Int)2 and Inalnt/T in Equation 3-11, were not determined to be significant
in fitting the supplemental test data.
Stress and temperature combinations required to produce three levels of creep
strain (.50% @ 50 hours, .33% @ 200 hours, and .10% @ 200 hours) for the supplemen-
tal data equation are shown in Figure 3-52. Comparison of these constant strain
lines with those for the data base equation indicates that creep occurred at a
3-70
MCC"IONNELL D OUGLAS ASTRONAUTICS COMPAMVY * EAST
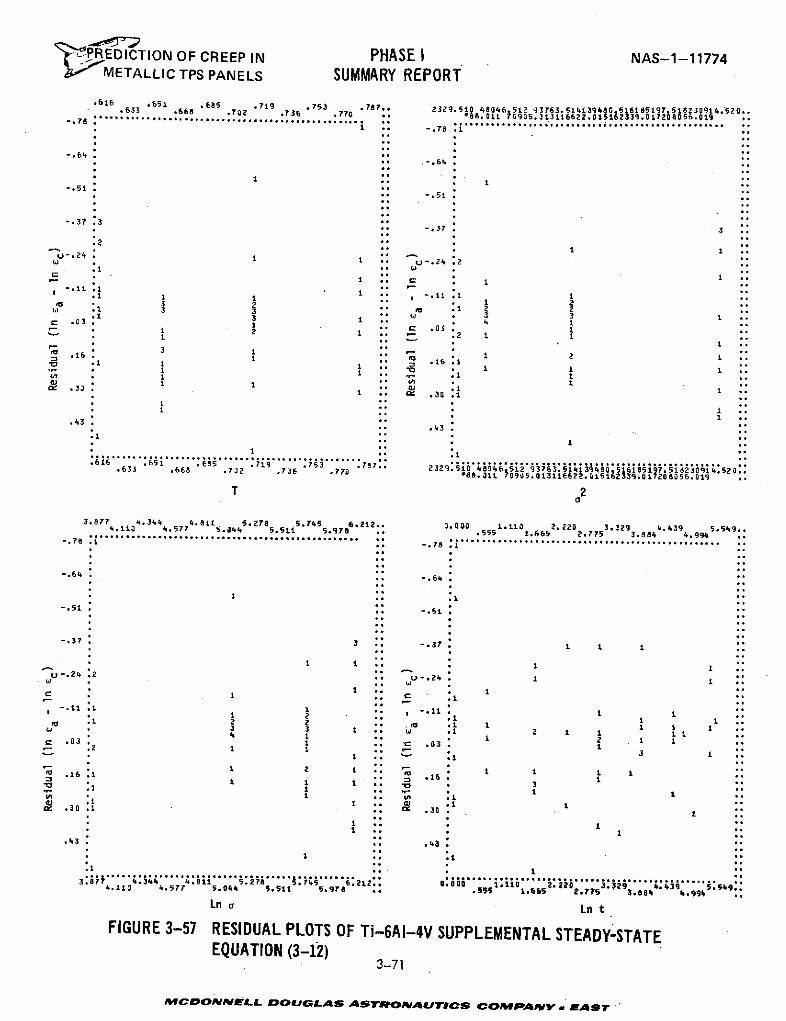
~tPREDICTION OF CREEP IN PHASE I NAS-1-117742; METALLIC TPS PANELS SUMMARY REPORT
.616 6 .651 66 5 .719 73 .753 787 2329.510 48046.51Z 93763.514139480.5618519S7.518 30914.520...63 .668 .702 .736 .770 .. '88. 011 70935.313116622015162339.01720805 .019 ..-. 78 . ............... ............... ..
-. 51
- ..
-51 . .-;51
3 1- 1 1 3
.37 .1
.1 3 -. 11 31U .1 3 3 . *1 3 3
•1 1 1 * * I
S . 1 1 .. .8 i2 .2 1 1
a 3 ± 3.16 1 . 1 , 1.1 . 16I I i I °
S1.. . ...... ...... ...... ..... 7. 1
.3 * .6 33. .668 .73? 71 .736 707 7.71311.2-" 4 1516339.0?2 056.019 2
T 2
3.877 114.344 4.577.811 5.278 5.7455 9786.212 0.000 1.1101.6652.220 3.029 4.439 5.5
'.
S.. . .. u
it1
-.51t o -.51 .
-. 37 ".. -. 37 . i 1 1
1 1 1.. 1 1
.16 .1 t .1 "
1 .. .C 1 oo1 .1
4 .. . 1 iS . 2 . . . 1u 2 1 ,- .1 2 1 2. 14 4 .6 . 1 54 .34 .. c .03 4
"" "" .1 11 o 1 1 .
5 .. 1 .6 " 1 6
. 43
3.877 . .3. 4 4.81 .278 .745 6.212.. 0.00 110o:."2"2 329 .... .. ... 5 4..:4.1±3 4.57? 5.044 5.511 5.978 .. .555 1.665 2.7T5 3.884 .99. ..
Ln a Ln t
FIGURE 3-57 RESIDUAL PLOTS OF Ti-6AI-4V SUPPLEMENTAL STEADY-STATEEQUATION (3-12)
3-71
MCIONNELL DOUGT.A. Af!;T, OA AU F ; CMP, INY ",
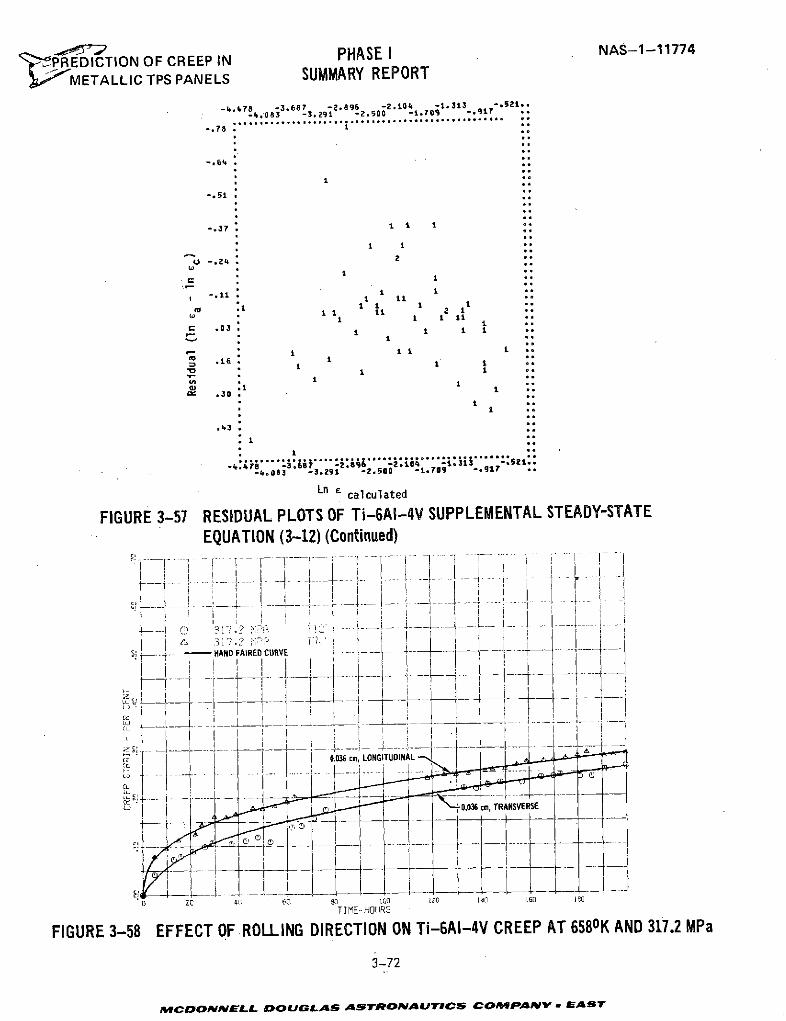
PI ION OF CREEP IN PHASE I NAS-1-11774MPRIEDiCTION OF CREEP IN
METALLIC TPS PANELS SUMMARY REPORT
-4.478 -3.687 -2.896 -2.104 -1.13 -. 521..-4.083 -3. 291 -2.500 -1.70;9 -. 917
-. 78 . ,
-. 64
-. 51**
-.37 11 +
1 i
U -. 24 2
1*
S .301
.1 1 9w -1 1 tt
.16 **n* I I i*
40 100 140 1601 * 1 °-
S .30.
3-.3 72
nms-4.478 m.Dua As A.m o-2.10. i.3IS - zr-4.083 -3.291 -2.500 -1.709 -. 917
-,i I 3I
rK _++++ .... i- --I----i-T i-E.OU
' ---- L I
FIUR 3-58 E T FON ONRiED-6Ri- CREEP A5 N 72
C,--
3-72
MCONNELL DOULS ASTRONAUTICS COPANI , EAST
REDICTION OF CREEP IN PHASE I NAS-1-11774L METALLIC TPS PANELS SUMMARY REPORT
CD) 165.5 MPR T13T- 165.5 MPFR T34L0! 165.5 MPR T3L- HAND FAIRED CURVE
0.058 cm, LONGITUDINALLu-
0.036 cm, TRANSVERSE
0.036 cm, LONGITUDINAL
L
S 20 40 60 o80 100 120 140 I50 ISOTIME-HOURS
FIGURE 3-59 COMPARISON OF GAGE AND ROLLING DIRECTION ON Ti-6AI-4VCREEP AT 714OK AND 165.5 MPa
0.058 cm,LONGITUDINAL - 0.036 c, LONGITUDINAL
0.036 cm, TRANSVERSEC! 317.2 PR TllT
317.2 PFR T26LID 317.2 MPFI TIL- HAND FAIRED CURVE
LU
a-
'3-73
cL o
20 40 60 80 100 120 140 I50 I80TIME-HOURS
FIGURE 3-60 COMPARISON OF GAGE AND ROLLING DIRECTION ON Ti-6AI-4VCREEP AT 7140K AND 317.2 MPa
3-73
MCOONIFELLL DOUGLAS ASTRONAUTICS CO Ml*'PANP,V - fASr
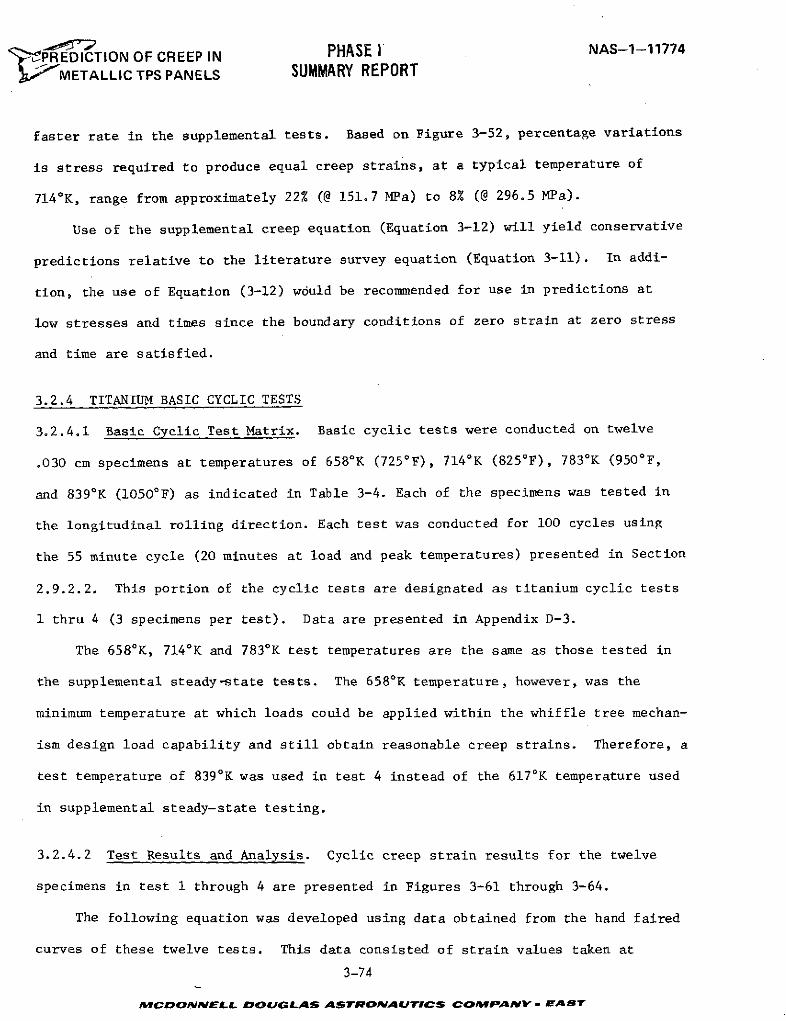
'PREDICTION OF CREEP IN PHASE I NAS-1-11774
I METALLIC TPS PANELS SUMMARY REPORT
faster rate in the supplemental tests. Based on Figure 3-52, percentage variations
is stress required to produce equal creep strains, at a typical temperature of
714 0 K, range from approximately 22% (@ 151.7 MPa) to 8% (@ 296.5 MPa).
Use of the supplemental creep equation (Equation 3-12) will yield conservative
predictions relative to the literature survey equation (Equation 3-11). In addi-
tion, the use of Equation (3-12) would be recommended for use in predictions at
low stresses and times since the boundary conditions of zero strain at zero stress
and time are satisfied.
3.2.4 TITANIUM BASIC CYCLIC TESTS
3.2.4.1 Basic Cyclic Test Matrix. Basic cyclic tests were conducted on twelve
.030 cm specimens at temperatures of 658 0K (725 0 F), 7140K (825 0F), 783 0K (9500F,
and 839 0K (1050 0 F) as indicated in Table 3-4. Each of the specimens was tested in
the longitudinal rolling direction. Each test was conducted for 100 cycles using
the 55 minute cycle (20 minutes at load and peak temperatures) presented in Section
2.9.2.2. This portion of the cyclic tests are designated as titanium cyclic tests
1 thru 4 (3 specimens per test). Data are presented in Appendix D-3.
The 658 0K, 714 0K and 783 0K test temperatures are the same as those tested in
the supplemental steady-state tests. The 6580K temperature, however, was the
minimum temperature at which loads could be applied within the whiffle tree mechan-
ism design load capability and still obtain reasonable creep strains. Therefore, a
test temperature of 839 0K was used in test 4 instead of the 617 0K temperature used
in supplemental steady-state testing.
3.2.4.2 Test Results and Analysis. Cyclic creep strain results for the twelve
specimens in test 1 through 4 are presented in Figures 3-61 through 3-64.
The following equation was developed using data obtained from the hand faired
curves of these twelve tests. This data consisted of strain values taken at
3-74
1CDONNEL DaOUGL.AS ASTRONfAITS CObMPANY . EAST
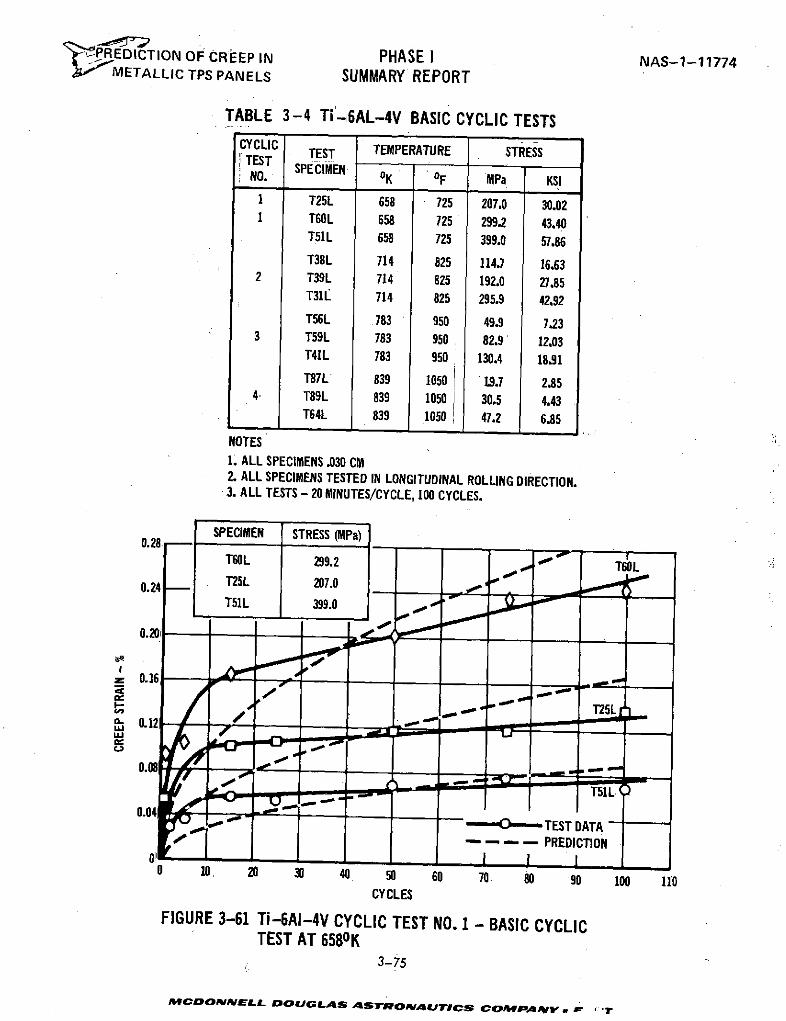
"JPREDICTION OF CREEP IN PHASE I NAS-1-11774METALLIC TPS PANELS SUMMARY REPORT
TABLE 3-4 Ti-,6AL-4V BASIC CYCLIC TESTSCYCLIC TEST TEMPERATURE STRESS
TESTNO. SPECIMEN K OF MPa KSI
1 T25L 658 725 207.0 30.021 T60L 658 725 299.2 43.40
T51L 658 725 399.0 57.86T38L 714 825 114.7 16.63
2 T39L 714 825 192.0 27.85T31L 714 825 295.9 42.92T56L 783 950 49.9 7.23
3 T59L 783 950 82.9' 12.03T41L 783 950 130.4 18391T87L 839 1050 197 2.85
4, T89L 839 1050 30.5 4.43T64L 839 1050 47.2 6.85
NOTES1. ALL SPECIMENS .030 CM2. ALL SPECIMENS TESTED IN LONGITUDINAL ROLLING DIRECTION.3. ALL TESTS - 20 MINUTES/CYCLE, 100 CYCLES.
SPECIMEN STRESS (MPa)0.28
T60L 299.2 0 TL
0.24 - T25L 207.0
T51L 399.0 0
I- S0.16 .
001 T25L
Lu
0.08
-TEST DATA- ---- -PREDICTION
0 10 20 30 40 50 60 70 80 90 100 110CYCLES
FIGURE 3-61 Ti-6AI-4V CYCLIC TEST NO. 1 - BASIC CYCLICTEST AT 6580K
3-75
MCDONNELL DOUGLAS ASTROIIUlP T ,rICS CO fAM'*mv. . 7
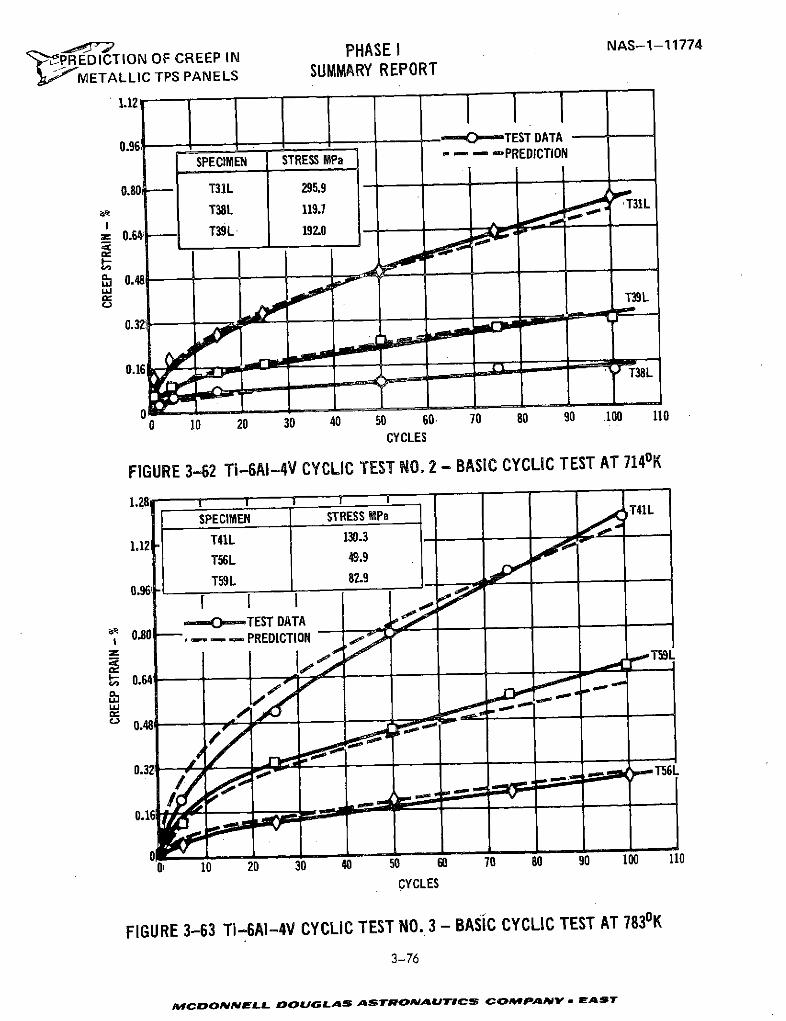
PHASE I NAS-1-11774' IPREDICTION OF CREEP IN
METALLIC TPS PANELS SUMMARY REPORT
1.12
0.96 ---- TEST DATA
SPECIMEN STRESS MPa -PREDICTION
0.80-- T31L 295.9T38L 119.7 .31L
0.64 T39L 192.0
S0.64i
0.16 T38L
0 10 20 30 40 50 60. 70 80 90 100 110
CYCLES
FIGURE 3-62 Ti-6AI-4V CYCLIC TEST NO. 2 - BASIC CYCLIC TEST AT 7140K
1.28I I ISPECIMEN STRESS MPa T41L
1.12 T41L 130.3
T56 L 49.9
T59L 82.9
--- TEST DATA0.80 -- PREDICTION
I0cII 10 "T59
0.64
0.321 0 . T56L
0 10 20 30 40 50 60 70 80 90 100 110
CYCLES
FIGURE 3-63 Ti-6AI-4V CYCLIC TEST NO. 3 - BASIC CYCLIC TEST AT 7830 K
3-76
MCDONN .fOELL DOUGLAS ASTRONAUTICS COMPANV - EAST
5 cycle intervals from the hand faired crrves. Creep times were the accumulated
cycle time at maximum load and temperature, therefore, for the basic cycles the
time was .33 hrs/cycle or 1.67 hrs/5 cycles.
In e = -28.94077 +26.24850 T +2.52 x 10⁻⁶ a2 +1.40406 Inc + .46894 Int (3-13)
The standard error of estimate (Sy) and multiple R computed for this equation are
.1951 and .9755, respectively. The residual plots (In Eactual -in ccalculated vs.
variable) for the equation are shown in Figure 3-65. It is of the same form as that
obtained for the supplemental steady state tests (Equation 3-12).
Comparison of predictions, using this equation, and the basic cyclic test data,
are shown in Figures 3-61 through 3-64.
3.2.5 COMPARISON OF TITANIUM CYCLIC AND SUPPLEMENTAL STEADY-STATE DATA
3.2.5.1 Test Data Comparison. As was noted in Section 3.2.4 both supplemental
steady-state and basic cyclic tests were conducted at three common temperatures
(658*K, 7140K and 7830 K). Direct comparisons of test data at these temperatures
from these two series of tests are shown in Figures 3-66 and 3-67 for times of 5
hours (15 cycles) and 33.3 hours (100 cycles), respectively. In this comparison
the cyclic time was the accumulated time at maximum load and temperature (i.e.,
100 cycles = 33.3 hours). Based on this comparison, there does not appear to be
any significant difference between cyclic and steady-state data for equal total
times at load.
3.2.5.2. Microstructure Comparison. The microstructure of the as-received
Ti-6AI-4V alloy (Figure 3-68) consists of slightly elongated grains of alpha phase
in a beta phase matrix. Exposure to both cyclic and steady-state creep at tempera-
tures as high as 7830 K and stresses of 48.3 MPa has produced no observable change
in the microstructure of this alloy relative to the as-received structure.
3-77,
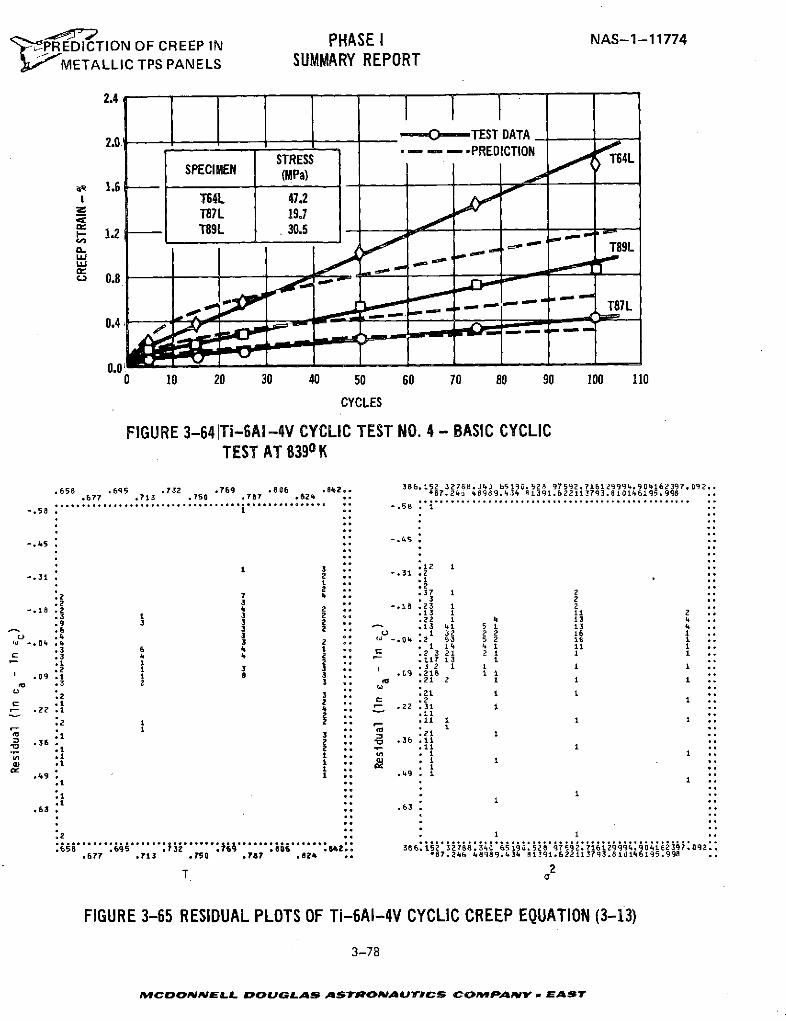
-- PREDICTION OF CREEP IN PHASE I NAS-1-11774
METALLIC TPS PANELS SUMMARY REPORT
2.4
2.0 ------ TEST DATA.0 I - - - -PREDICTION
STRESS T64LSPECIMEN (MPa)
4 1.6TS64L 47.2
_ T87L 19.71.2 T89L 30.5
CL
0 0.8
0 00 T87L0.4
0.0i0 10 20 30 40 50 60 70 80 90 100 110
CYCLES
FIGURE 3-64 Ti-6AI-4V CYCLIC TEST NO. 4 - BASIC CYCLICTEST AT 8390 K
.658 .695 .732 .769 .806 .842.. 386.152 32788.34) 65190.528 97592.716129994.904162397.092..677 713 750 787 82 87.4 48989434 1916221137938101469599
S-56* 1-.58 -. 58
-.45-.s5
S.12-.31 2 -.3
2 .. .2.2 7 6 .37 1 2.2 2 .32
-.18.2 -. 18 .23 1 2...3 3 2 .13 1 11 2
.9 3 3 2 .22 1 4 13 4S 6 3 2 . .13 41 5 1 13 4
S .4 3 .. 32 Z 2 16 121-. 04 .4 3 2 -. 04 .2 53 5 2 16
.3 6 4 1 . 1 14 41 11 1
.3 4 6 2 .2 3 21 21 1 1
.1 1 2 117 13 1.•2 1 3 .. 3 2 1 1 1 ,
.09 .1 1 8 3 .. .9 .218 i 10 .3 2 . .21 2 1 1
.2 3 :2t 1 1.
.22 12 . . .2 :31 1111
.2 . 1 1 1 .
S :1 .. .21S .36 2 .. 36 .
.1 2 . .11 1I. . 1 i. .1
.9 .. . 1
.63 " 63
. .. 3 1 1
T a 2
FIGURE 3-65 RESIDUAL PLOTS OF Ti-6AI-4V CYCLIC CREEP EQUATION (3-13)
3-78
MCDONNJELL DOUGLAS ASTRONAUTICS COMPANY - EAST
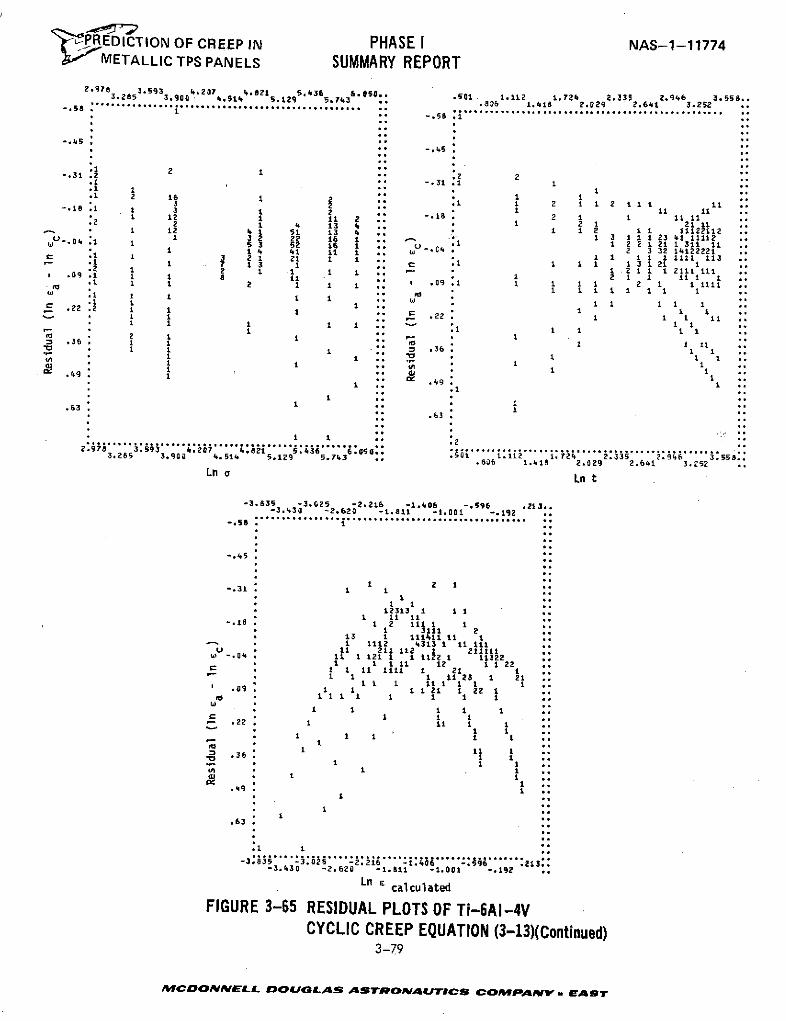
PREDICTION OF CREEP IN PHASE I NAS-1-11774IMETALLIC TPS PANELS SUMMARY REPORT
2.9 28 5 3.593 9004.207 4.821 5.436 6.50.. .501 1.112 1.724 2.335 2.946 3.558..S................................. 3 .80 1.418 2.029 2.641 3.252-. 58 . . . . . . . . . . . .." " " "" -. 58 . .. .............. ............... .
-. 45 -4 5-.s "
.1 2. 3 2-. 31 .2 . 2.1 ± -.31 .i 1.1 1 * ItS 2 16 21 2 1 21 1 11
*8 1 12 1 i ..2 2 1 13 4 111 11 i- 1 12 4 1 51 13 4 1 1 I 1 111112j 1 3 16 i .. i 23 4 1111 ..S * 11 14 41 .. 1 2 12 1 11 111 3 2 1 21 1 1 1 1 1 1 ll 1 ...* : 1 1 1 121 1. 2 2 1 2 1 1 1 1 2111 111S09 .1 1 8 1" 1 2 1 1 11 1 I
S 1 1 2 1 .. 09 1 1 1 1 2 1 1 1111. 1 1 1 1 1 1 1
21 1" .2 1 1 1 1 1 . 22 .1
... .63 1
1 .501 11 1, 1 ± 6. 1 1
S 1 1S ..1 1 ..
606 1.418 2.029 2.641 2
-3835 -3.2 -2.216 -1.406 -. 596 213
-3.430 -2.620 -1.811 -1.001 -. 192-.s .......................... ...... ................................
1.1 1 11
** * ** * ** * * ** * * ** It
1331 1 11111 11 1
1 12313 1 1 1 ..
11 211 112 1 211111S-04 * it 1 121 1 1 1122 1 113221 1 1 It 12 1 1 22 ..
S1 11 1111 1 21 1 ..- 1 1 1 1123 1 211 1 1 11 1 1 1 ...09 1 1 1 21 1 22 1S111 1 1 1 1 1 ""
.22 1 11 1 1
1 1 1 1 1 ,,. 31 1 1 1
* - * *1 1 .,
.4 9o1 11
1
.63 "
1 1 1 "1-3.83 -32.2 -1. . . .. . 21..
-3.430 -2.620 -1.811 -1.001 -.192
Ln e calculated
FIGURE 3-65 RESIDUAL PLOTS OF Ti-6AI-4VCYCLIC CREEP EQUATION (3-13)(Continued)
3-79
fMCDONNELL DOUGLAS ASTRONAUTICS COMWPANV , EAST
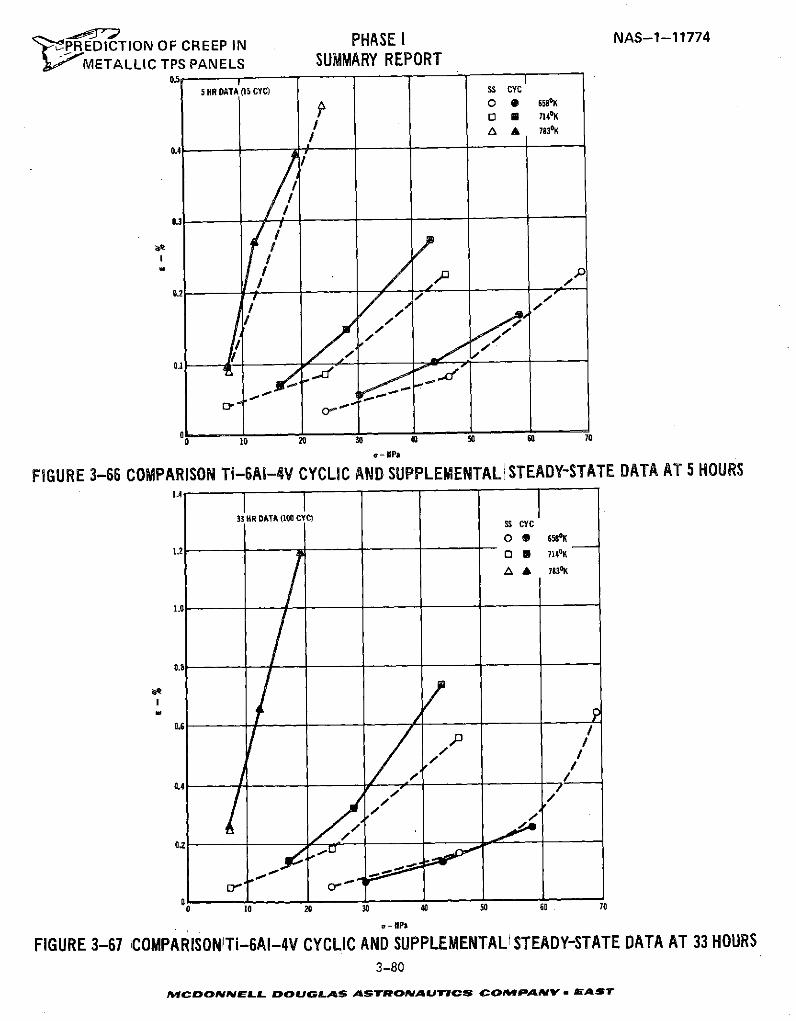
PREDICTION OF CREEP IN PHASE I NAS-1-11774
METALLIC TPS PANELS SUMMARY REPORT0.5 I
5 HR DATA (15 CYC) SS CYC
O 6580K0 U 714
0K
0.1
/ A 30K
/
0 10 20 30 40 50 0 70
a o-MPa
FIGURE 3-66 COMPARISON Ti-6AI-4V CYCLIC AND SUPPLEMENTAL STEADY-STATE DATA AT 5 HOURS
33 HR DATA (100 CYC) SS CYC
0 0 6580K1.2 0 8 714K
A 7830K
1.0
P0.2
I - MPa
00-
FIGURE 3-67 COMPARISON Ti-6AI-4V CYCLIC AND SUPPLEMENTAL I STEADY-STATE DATA AT 33 HOURS3-80
MCDNNELL DOUGLAS ASTRONtAUrICS COMPANY EAST
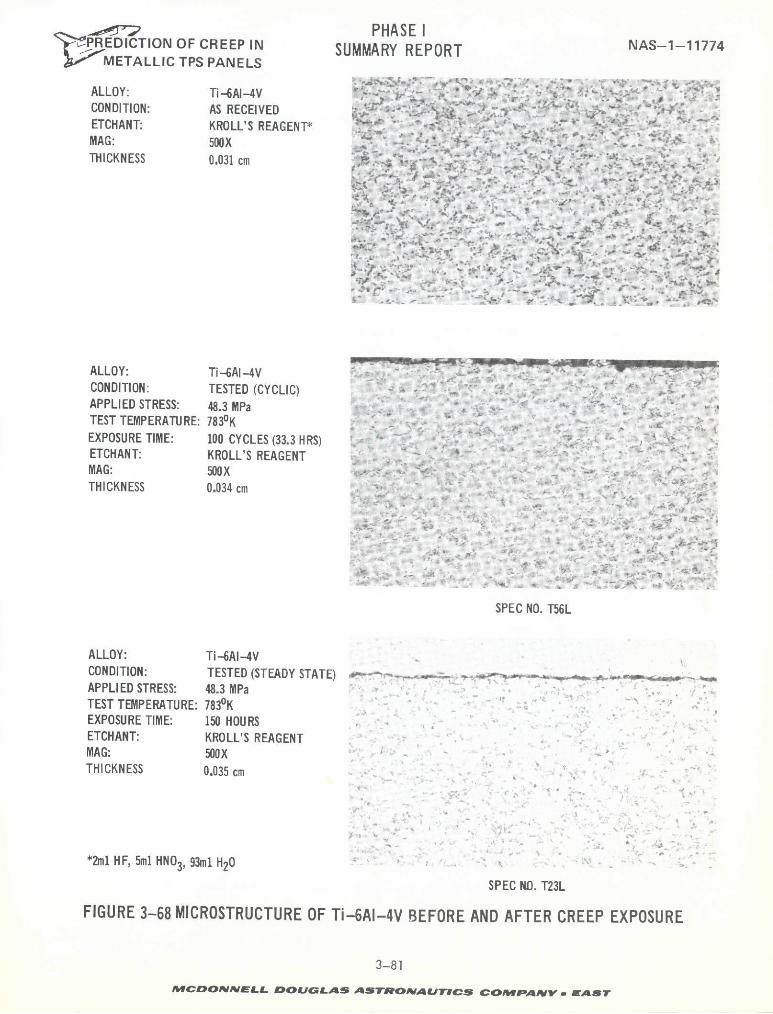
PHASE I-tPREDICTION OF CREEP IN SUMMARY REPORT NAS-1-11774S METALLIC TPS PANELS
ALLOY: Ti-6AI-4V , . -
CONDITION: AS RECEIVED :ETCHANT: KROLL'S REAGENT*MAG: 50OXTHICKNESS 0.031 cm
ALLOY: Ti-6AI -4V
CONDITION: TESTED (CYCLIC) , <APPLIED STRESS: 48.3 MPaTEST TEMPERATURE: 7830KEXPOSURE TIME: 100 CYCLES (33.3 HRS)ETCHANT: KROLL'S REAGENTMAG: 50OXTHICKNESS 0.034 cm "
SPEC NO. T56L
ALLOY: Ti-6AI-4VCONDITION: TESTED (STEADY STATE) , ....... .APPLIED STRESS: 48.3 MPaTEST TEMPERATURE: 7830KEXPOSURE TIME: 150 HOURSETCHANT: KROLL'S REAGENTMAG: 500X
THICKNESS 0.035 cm
*2ml HF, 5ml HNO3, 93ml H20SPEC NO. T23L
FIGURE 3-68 MICROSTRUCTURE OF Ti-6AI-4V BEFORE AND AFTER CREEP EXPOSURE
3-81
mcONELL ountAs AsTRomAuTIs coMPANy M &AsT
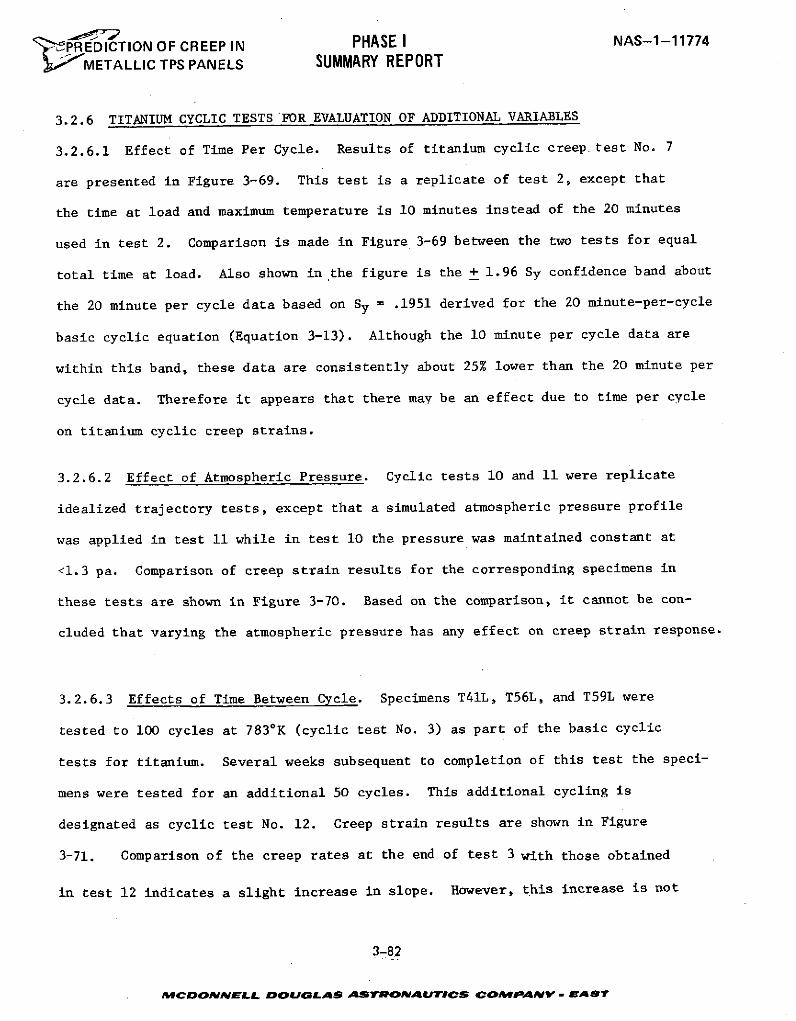
tPREDICTION OF CREEP IN PHASE I NAS-1-11774
# METALLIC TPS PANELS SUMMARY REPORT
3.2.6 TITANIUM CYCLIC TESTS FOR EVALUATION OF ADDITIONAL VARIABLES
3.2.6.1 Effect of Time Per Cycle. Results of titanium cyclic creep.test No. 7
are presented in Figure 3-69. This test is a replicate of test 2, except that
the time at load and maximum temperature is 10 minutes instead of the 20 minutes
used in test 2. Comparison is made in Figure 3-69 between the two tests for equal
total time at load. Also shown in the figure is the + 1.96 Sy confidence band about
the 20 minute per cycle data based on Sy = .1951 derived for the 20 minute-per-cycle
basic cyclic equation (Equation 3-13). Although the 10 minute per cycle data are
within this band, these data are consistently about 25% lower than the 20 minute per
cycle data. Therefore it appears that there may be an effect due to time per cycle
on titanium cyclic creep strains.
3.2.6.2 Effect of Atmospheric Pressure. Cyclic tests 10 and 11 were replicate
idealized trajectory tests, except that a simulated atmospheric pressure profile
was applied in test 11 while in test 10 the pressure was maintained constant at
<1.3 pa. Comparison of creep strain results for the corresponding specimens in
these tests are shown in Figure 3-70. Based on the comparison, it cannot be con-
cluded that varying the atmospheric pressure has any effect on creep strain response.
3.2.6.3 Effects of Time Between Cycle. Specimens T41L, T56L, and T59L were
tested to 100 cycles at 7830K (cyclic test No. 3) as part of the basic cyclic
tests for titanium. Several weeks subsequent to completion of this test the speci-
mens were tested for an additional 50 cycles. This additional cycling is
designated as cyclic test No. 12. Creep strain results are shown in Figure
3-71. Comparison of the creep rates at the end of test 3 with those obtained
in test 12 indicates a slight increase in slope. However, this increase is not
3-82
AMCDOMNELL bOUGLAS ASTRONAVUrICS COMPANYV - LAST
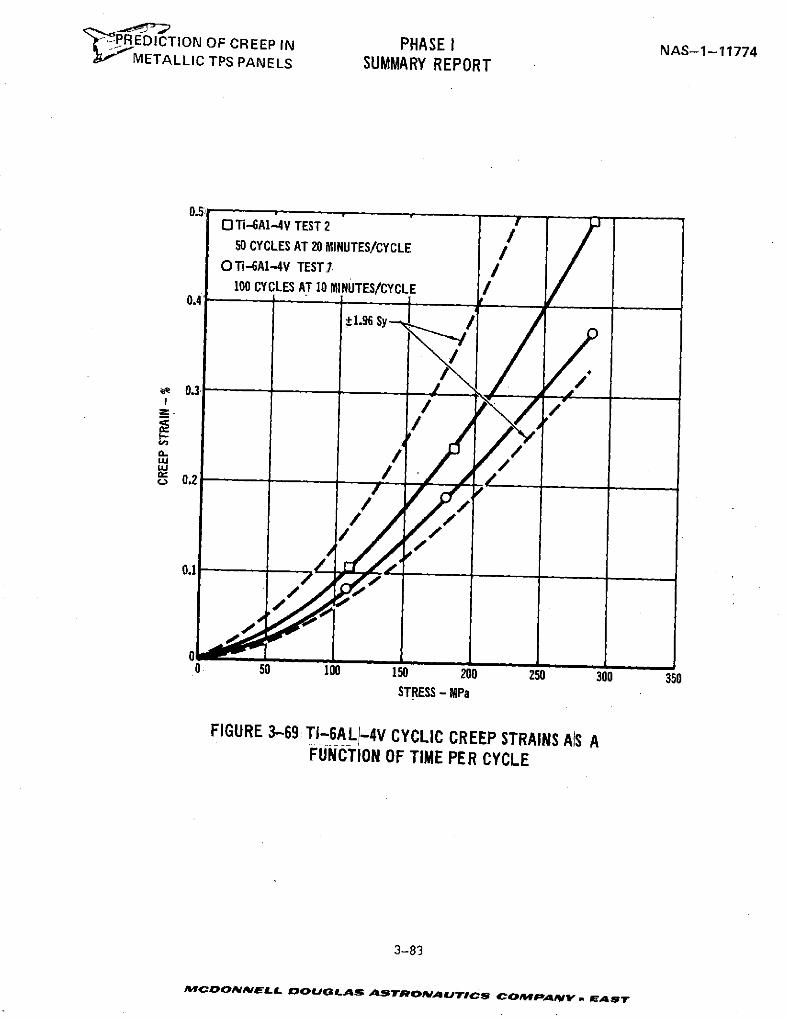
' EDICTION OF CREEP IN PHASE I NAS-1-11774METALLIC TPS PANELS SUMMARY REPORT
O Ti-6A1-4V TEST 250 CYCLES AT 20 MINUTES/CYCLE /
O Ti-AI-4V TEST 7 /100 CYCLES AT 10 MINUTES/CYCLE /
±1.96 Sy /
0.3
/I/ /
0.1
0 50 100 150 200 250 300 350STRESS - MPa
FIGURE 3-69 Ti-6AL/-4V CYCLIC CREEP STRAINS AS AFUNCTION OF TIME PER CYCLE
3-83
MCDONNaELL DOUGLAS ASTRONAUjTCS COMPAA .- WAST
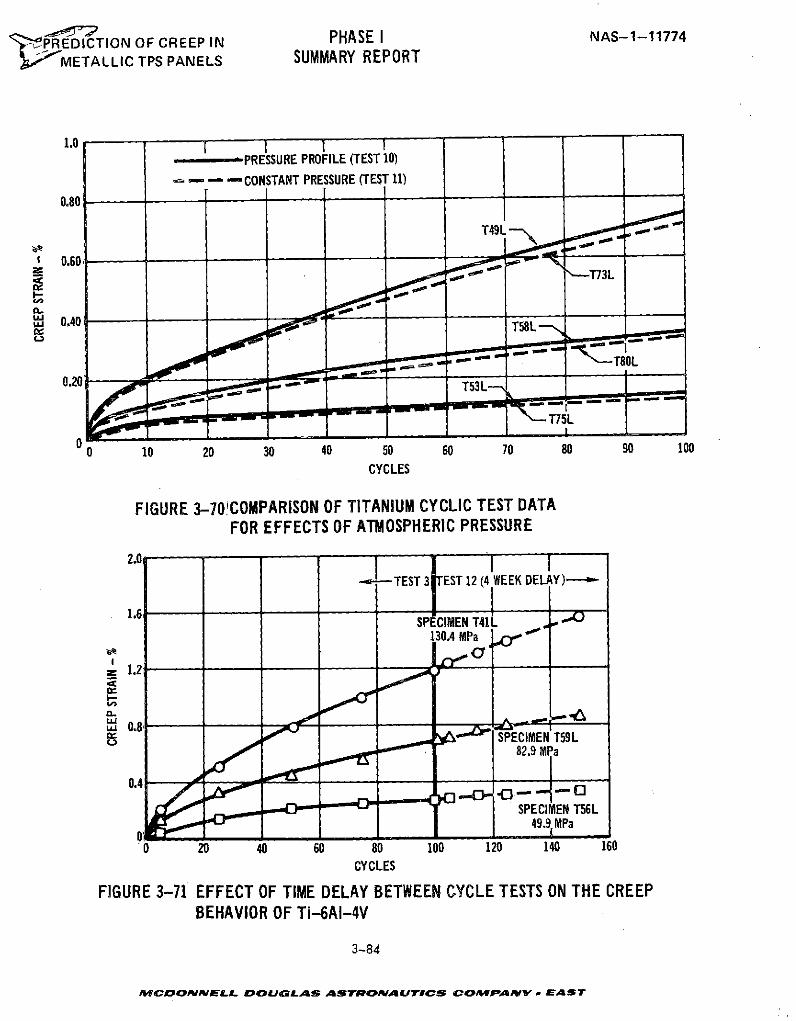
"-"PREDICTION OF CREEP IN PHASE I NAS-1-11774METALLIC TPS PANELS SUMMARY REPORT
1.o I I I- -- PRESSURE PROFILE (TEST 10)- - - CONSTANT PRESSURE (TEST 11)
0.80
T49L
0.60-- --T73L
I-
I 0.40
0 10 20 30 40 50 60 70 80 90 100CYCLES
FIGURE 3-70COMPARISON OF TITANIUM CYCLIC TEST DATAFOR EFFECTS OF ATMOSPHERIC PRESSURE
2.0
- -- TEST 3 TEST 12 (4 WEEK DELAY )
SPECIMEN T41L130.4 MPa
0.8
y: SPECIMEN T59L82.9 MPa
SPECIMEN T56L
0 20 40 60 80 100 120 140 160
CYCLES
FIGURE 3-71 EFFECT OF TIME DELAY BETWEEN CYCLE TESTS ON THE CREEPBEHAVIOR OF Ti-6AI-4V
3-84
MCDONNELL DOUGLAS ASTRONAUTICS COMPANY- EAST
.P EDICTION OF CREEP IN PHASE I NAS-1-11774METALLIC TPS PANELS SUMMARY REPORT
considered sufficient to conclude that the time delay has an effect on creep
strains.
3.2.7 STEPPED STRESS CYCLIC TESTS
Increasing and decreasing stress history tests were conducted on titanium
specimens. These were titanium cyclic test No. 5 (specimens T67L, T63L, T66L)
and titanium cyclic test No. 6 (specimens T78L, T68L, T69L), respectively. Both
tests were conducted at 7830 K. Comparisons of creep strain tests results with
predictions based on strain hardening and time hardening creep accumulation theories
in conjunction with the cyclic creep equation (Equation 3-13) are shown in Figures
3-72 and 3-73. Predictions based on the time hardening theory are closest to test
results in the case of the increasing stress history test (test 5) and predictions
based on the strain hardening theory are closest to test results for the decreasing
stress history test (test 6). Therefore, the analysis approach where strain isaccumulated by using time hardening when strain rate increases and strain hardening
when strain rate decreases (rate dependent approach) will be evaluated in the
analysis of trajectory test data in the following section.
3.2.8 TRAJECTORY TESTS
Four cyclic trajectory tests (8, 9, 10 and 11) were conducted using titanium
tensile specimens. These tests are a two-step stress trajectory profile with aconstant maximum temperature of 783 0K and constant pressure (test 8); an actual tra-jectory test (test 9) using actual Shuttle stress, temperature, and pressure profiles;
and two idealized trajectory tests (tests 10 and 11) with maximum temperatures of
8730 K. Comparison of test 10 and 11 results on the basic of atmospheric pressure
variations, is presented in Section 3.2.6.2.
Comparison of creep strain results for tests 8, 9 and 10 with predictions based
on the strain hardening theory of creem accumulation are shown in Figures 3-74 to
3-85
MCDOPSNJNLL DOUGLAS ASTRONMAUTICS COMWPAN - WEAT
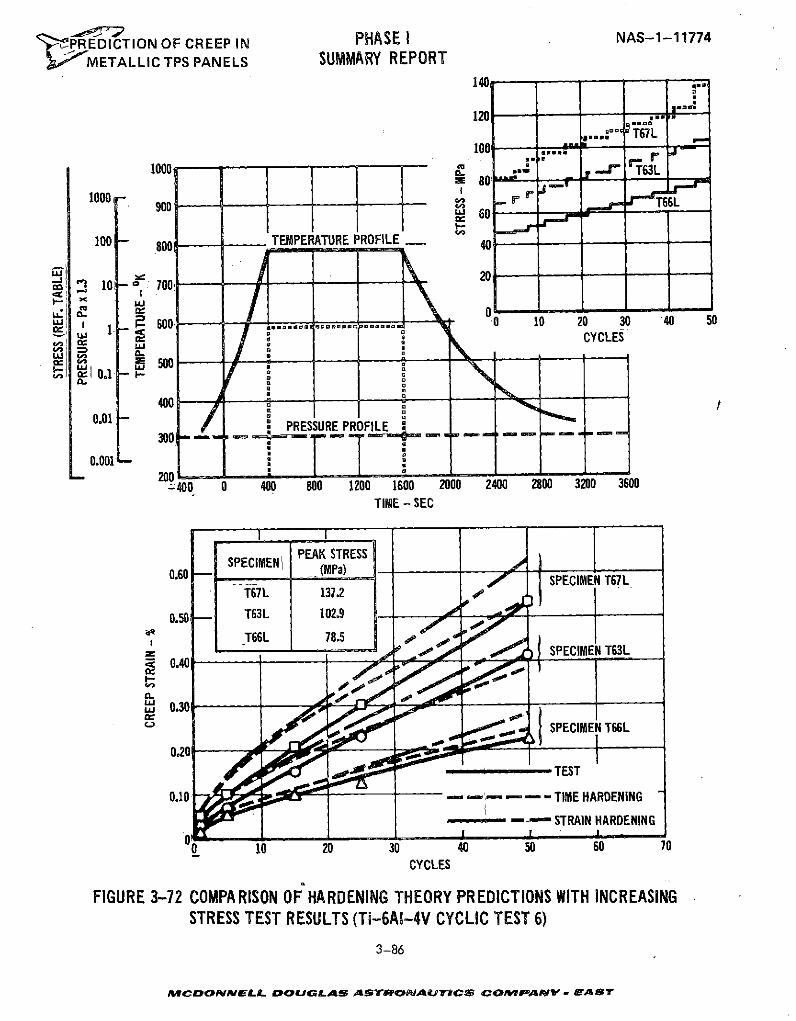
" ,PREDICTION OF CREEP IN PHASE I NAS-1-11774
METALLIC TPS PANELS SUMMARY REPORT140 -.-
120 ......... T67L
100 M
100 ... ..- 63L900 010 0 - 900 ------------- C O Tr66L
100 - 800 TEMPERATURE PROFILE - 40y--
c 101- 0 700 -
S -00 ...... ........ 10 20 30 '40 50j CYCLES
300 a400
PRESSURE PROFSSILE- - j
0.001 0.60 (MPa)200 " ei
400 0 400 800 1200 1600 2000 2400 2800 3200 3600TIME - SEC
SPECIMEN PEAK STRESSL 137.2 SPECIMEN T67L
T67 L 137.2 /
0.50 T63L 102.9
T66L 78.5 o L0
"do SPECIMEN T63L0.40
I 0.30cl.) tSPECIMEN T66L
, TEST
0.10 - -,- - - - TIME HARDENING
---- -- STRAIN HARDENING- I I
0 10 20 30 40 50 60 70CYCLES
FIGURE 3-72 COMPARISON OF HARDENING THEORY PREDICTIONS WITH INCREASINGSTRESS TEST RESULTS (Ti-6A1-4V CYCLIC TEST 6)
3-86
MCDONNELL DOUGLAS ASTROnAUTICS COMPAAN- EBAST
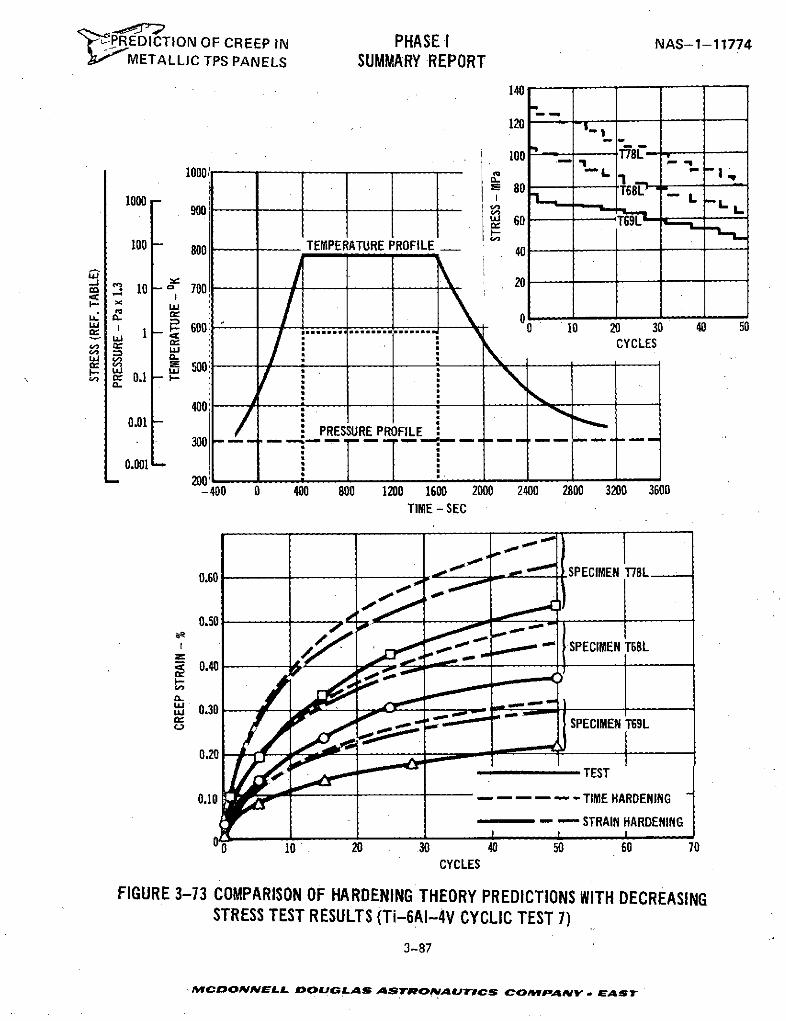
'DPREDICTION OF CREEP IN PHASE I NAS-1-11774METALLIC TPS PANELS SUMMARY REPORT
140
120 - .
100 78L8oo " _ Tlb-- •
1000 - -- .T691000 90 80L
60 T69L
100 800 TEMPERATURE PROFILE - 40
= 10- 700
, 0 10 20 30 40 501 600 ..... ................. 0) 20 31 40 0CYCLES
= 0.1 -
4000.01 -
PRESSURE PROFILE300 -
0.001- 200
-400 0 400 800 1200 1600 2000 2400 2800 3200 3600TIME - SEC
-3--01.0SPECIMEN T78L0.60 - -
0.50" " -oo- SPECIMEN T69L
TEST
3-87
Mo0. N
CYCLES
FIGURE 3-73 COMPARISON OF HARDENING THEORY PREDICTIONS WITH DECREASINGSTRESS TEST RESULTS (Ti-6AI-4V CYCLIC TEST 7)
3-87
flMCDONNELL DOUGLAS ASTROmAVTICS COMosANy., EAST
" PREDICTION OF CREEP IN PHASE I NAS-1-11774
- METALLIC TPS PANELS SUMMARY REPORT
3-76. The strain hardening theory was found to yield the best predictions for
this series of tests, although all predictions resulted in lower creep strain than
obtained in testing at the higher test times. The rate dependent approach, used
successfully in predicting L605 data, yielded strains comparable to the time
hardening predictions for these titanium data. These predictions were approximately
20% below the strain hardening predictions shown.
Steps used in idealizing the simulated mission stress and temperature profiles
(test 9) for analysis purposes are indicated in Figure 3-75. Higher creep strains
are predicted and obtained in the idealized trajectory tests (tests 10 and 11) than
in the simulated mission test, (test 9) because the 7830K peak temperature is main-
tained over a longer period of time in tests 10 and 11.
The creep accumulation analysis for specimens in test 9 shows that approximately
95% of the creep strain occurs between 500 and 1500 seconds into the trajectory.
Predictions for test 9 are shown to 200 cycles (total time of 73.3 hours) although
the cyclic creep equation (Equation 3-13) are used in analysis was developed based
on 100 cycle data (total time of 33.3 hours).
3.2.9 Ti-6Al-4V CONCLUSIONS
Ti-6AI-4V tensile specimens were tested at steady-state conditions over the
temperature range of 6160K (650 0F) to 783 0K (9500 F) for approximately 200 hours
or creep strains of up to approximately .5% in 50 hours. The following empirical
regression equation was developed for these data:
In E = -24.08576 +22.53736T + 5.89 x 10⁻⁶ a +.90505 In a + .43365 In t (3-11)
No effect could be seen in steady-state creep response due to material gage
or rolling direction. Creep response obtained in supplemental testing was shown
to be somewhat greater than that of the literature survey data base.
The following empirical regression equation was developed for cyclic test data.
3-88
MCDONNELL DOUGLAS ASTRONAUTICS COMPANY-AV EAST
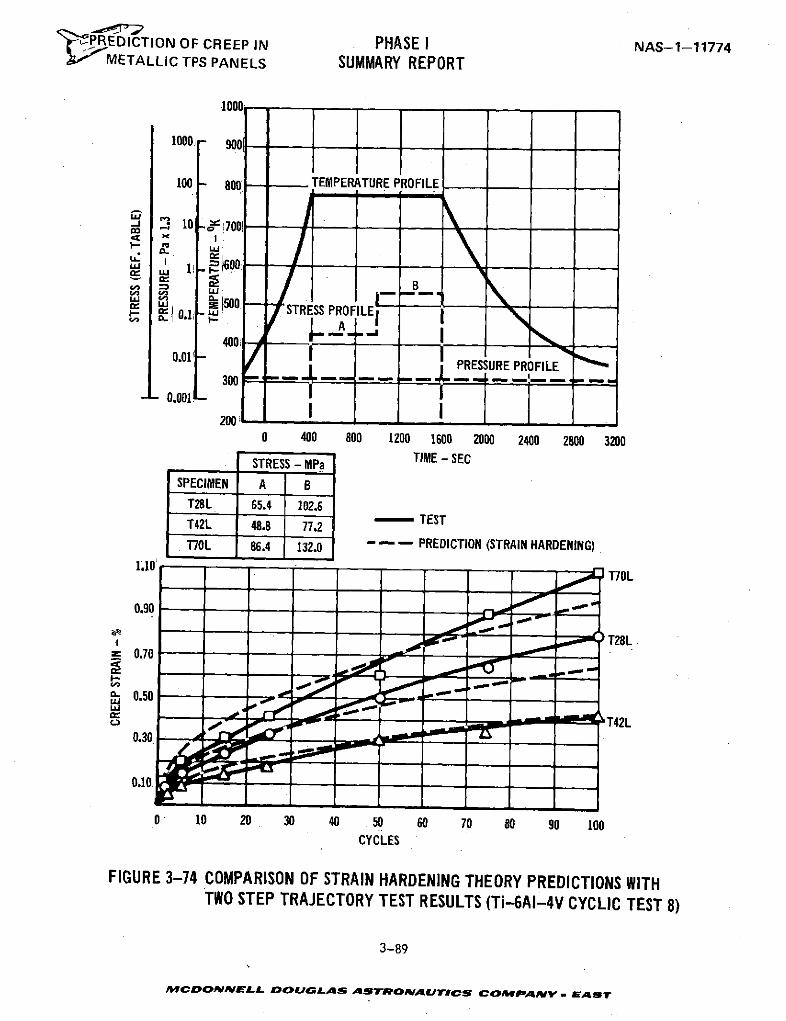
' J:PREDICTION OF CREEP IN PHASE I NAS-1-11774IVIETALLIC TPS PANELS SUMMARY REPORT
1 000
1000 - -0
100 - Boo! TEMPERATURE PROFILE
10 70- -00
0 P500 LSTRESS PROFILEE
T IEST
000- 0.001 -
STRESS - MPa TIME - SECLE
SPECIMEN A BT28L 65.4 102.6T42L 48.8 77.2 - TEST
T0L 86.4 132.0 - - - PREDICTION (STRAIN HARDENING)
1.10' I T TT70L
0.90 OC* . "
, "T28L
E 0.70
a 0.50
0.30 c'_: i , ..----,- T42L
0.10
0 10 20 30 40 50 60 70 80 90 100CYCLES
FIGURE 3-74 COMPARISON OF STRAIN HARDENING THEORY PREDICTIONS WITHTWO STEP TRAJECTORY TEST RESULTS (Ti-6AI-4V CYCLIC TEST 8)
3-89
MCDONNELL DOUGLAS ASTRONAUTICS COMPANY r EAST
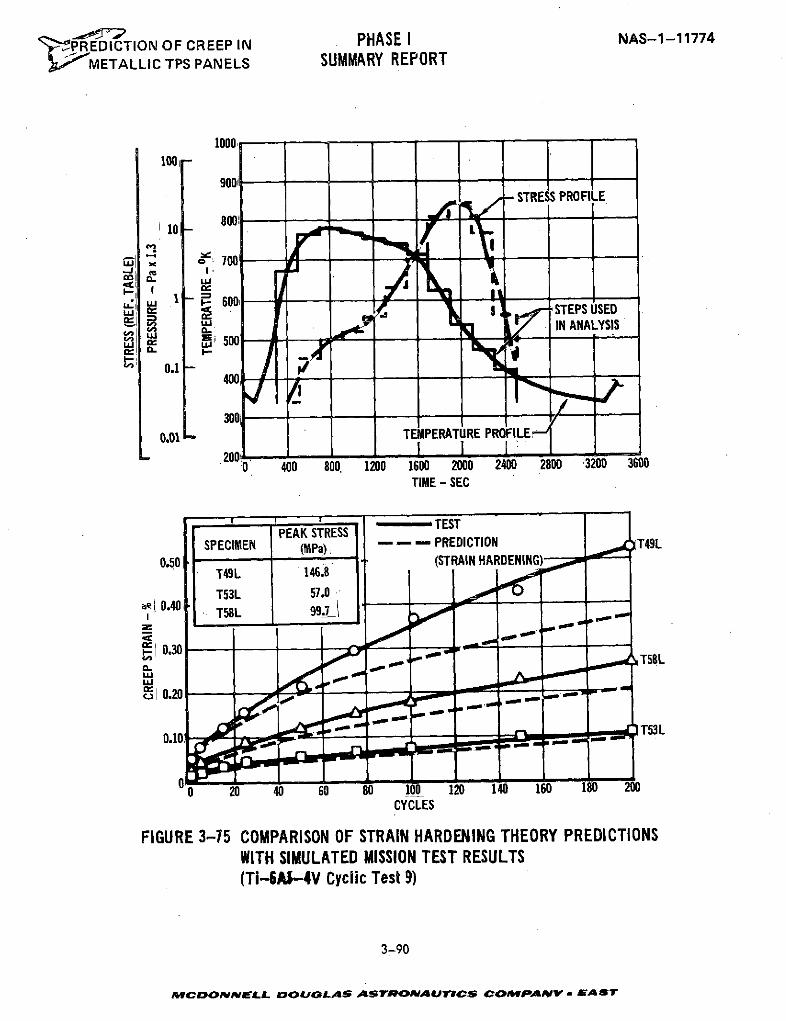
',PREDICTION OF CREEP IN PHASE I NAS-1-11774
METALLIC TPS PANELS SUMMARY REPORT
10001001-
900-STRESS PROFILE
10 800
I 00
1 605 i STEPS USED
C6 I-
0.140-
300-
0.01 TEMPERATURE PROFILE - - '
00 400 800. 1200 1600 2000 2400 2800 3200 3600TIME - SEC
TESTPEAK STRESS
SPECIMEN (MPa) - ,- - PREDICTION T49L
0.50 - (STRAIN HARDENING)T49L 146.8
T53L 57.0T580.40 TSL 99.7 GOP
S0.30W O W T58L
TNL0.10 POW ,o T53L
0 20 40 60 80 100 120 140 160 180 200CYCLES
FIGURE 3-75 COMPARISON OF STRAIN HARDENING THEORY PREDICTIONSWITH SIMULATED MISSION TEST RESULTS(Ti-6AI--4V Cyclic Test 9)
3-90
MCDONNELL DOUGLAS ASTRONAUTICS COMPANYV EAST
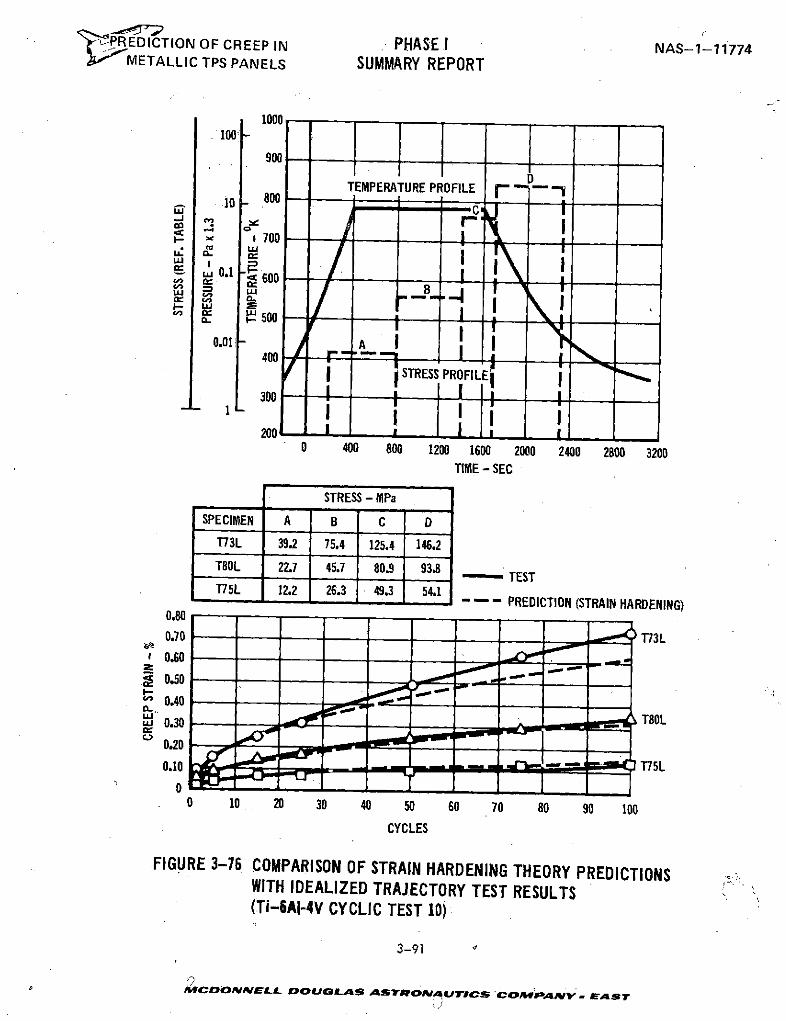
'PREDICTION OF CREEP IN PHASE I NAS-1-117742- METALLIC TPS PANELS SUMMARY REPORT
1000100
900
TEMPERATURE PROFILE n- -10 C• -.1 700,
U:700 - -
w I
0.01 - A400
ISTRESS PROFILE
1 I I I200 1 1 A -
0 400 800 1200 1600 2000 2400 2800 3200TIME - SEC
STRESS - MPa
SPECIMEN A B C DT13L 39.2 75.4 125.4 146.2T80L 22.7 45.7 80.9 93.8T75L 12.2 26.3 49.3 54.1
- - - PREDICTION (STRAIN HARDENING)0.800.70 _.,_ T73L
0.60
S0.50
n 0.40o3o T80L0.200.10~.--.:e - T75L
00 10 20 30 40 50 60 70 80 90 100
CYCLES
FIGURE 3-76 COMPARISON OF STRAIN HARDENING THEORY PREDICTIONSWITH IDEALIZED TRAJECTORY TEST RESULTS(Ti-6AI-4V CYCLIC TEST 10)
3-91
MCcDONNELL DOUGLAS ASTRONAaUTICS COMPAmNYw , AST
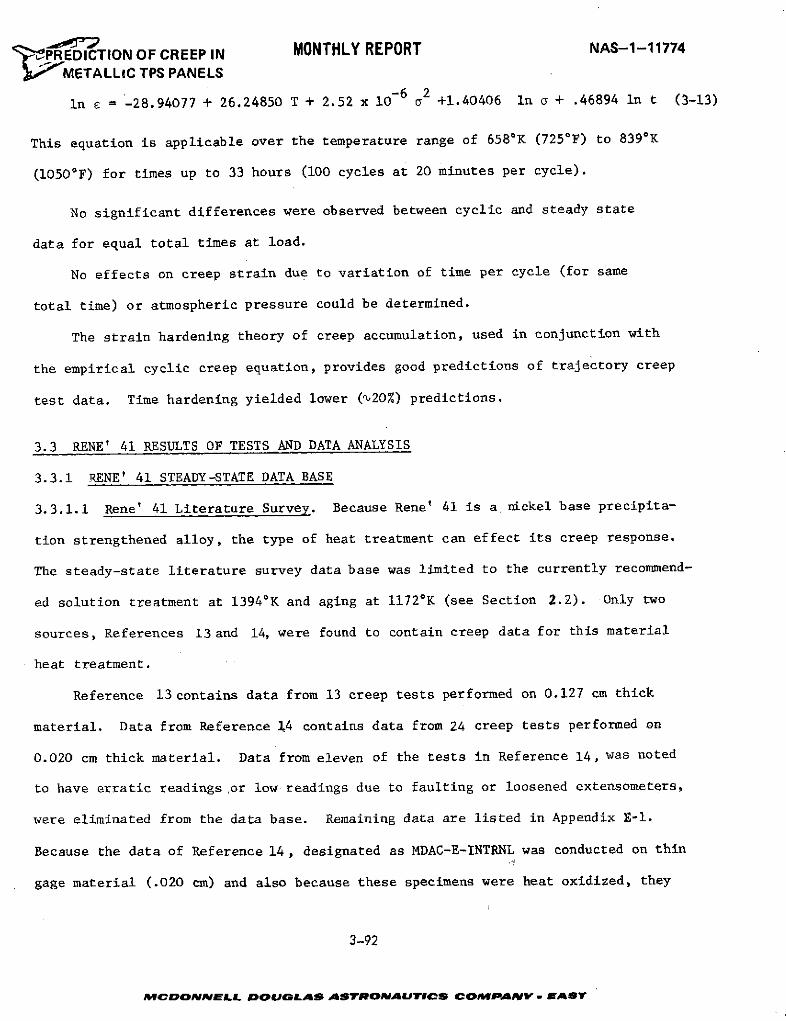
' ',PREDICTION OF CREEP IN MONTHLY REPORT NAS-1-11774
S METALLIC TPS PANELS-6 2
In e = -28.94077 + 26.24850 T + 2.52 x 10 a +1.40406 In a + .46894 in t (3-13)
This equation is applicable over the temperature range of 658 0K (725 0F) to 8390K
(1050*F) for times up to 33 hours (100 cycles at 20 minutes per cycle).
No significant differences were observed between cyclic and steady state
data for equal total times at load.
No effects on creep strain due to variation of time per cycle (for same
total time) or atmospheric pressure could be determined.
The strain hardening theory of creep accumulation, used in conjunction with
the empirical cyclic creep equation, provides good predictions of trajectory creep
test data. Time hardening yielded lower ('20%) predictions.
3.3 RENE' 41 RESULTS OF TESTS AND DATA ANALYSIS
3.3.1 RENE' 41 STEADY-STATE DATA BASE
3.3.1.1 Rene' 41 Literature Survey. Because Rene' 41 is a nickel base precipita-
tion strengthened alloy, the type of heat treatment can effect its creep response.
The steady-state literature survey data base was limited to the currently recommend-
ed solution treatment at 13940 K and aging at 11720K (see Section 2.2). Only two
sources, References 13 and 14, were found to contain creep data for this material
heat treatment.
Reference 13 contains data from 13 creep tests performed on 0.127 cm thick
material. Data from Reference 14 contains data from 24 creep tests performed on
0.020 cm thick material. Data from eleven of the tests in Reference 14, was noted
to have erratic readings ,or low readings due to faulting or loosened extensometers,
were eliminated from the data base. Remaining data are listed in Appendix E-l.
Because the data of Reference 14, designated as MDAC-E-INTRNL was conducted on thin
gage material (.020 cm) and also because these specimens were heat oxidized, they
3-92
MCDONPNELL DOUA LAS ASTRONAUTICS COMPANV- E AST
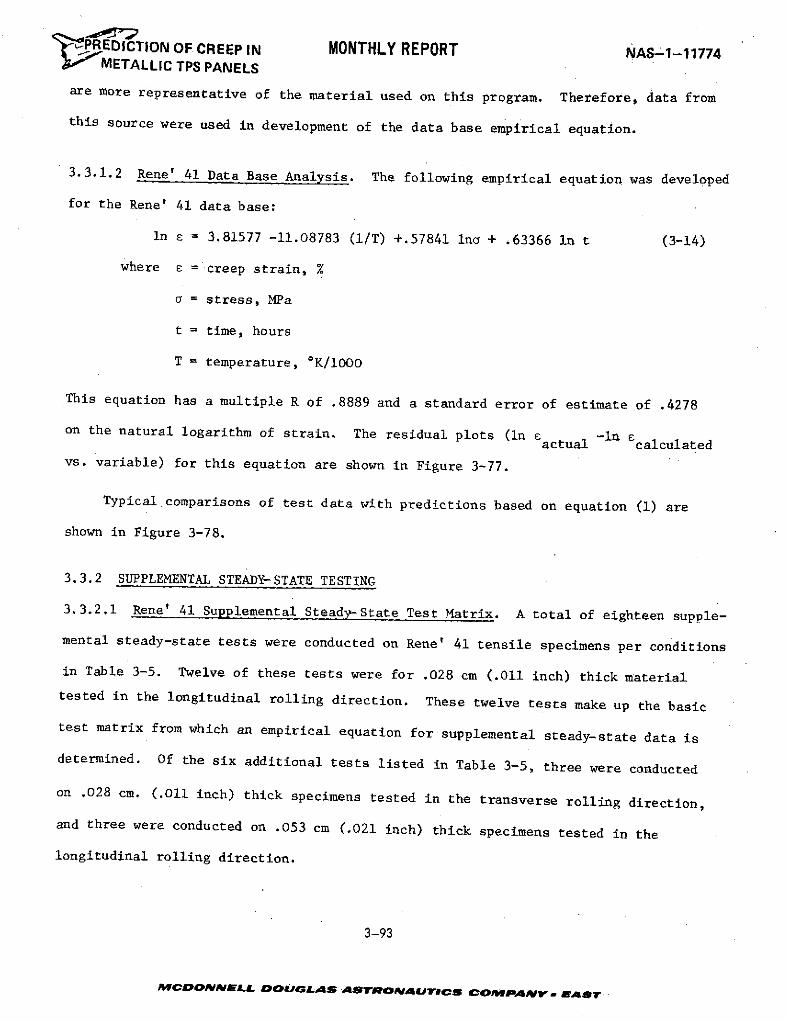
PREDICTION OF CREEP IN MONTHLY REPORT NAS-1-11774METALLIC TPS PANELS
are more representative of the material used on this program. Therefore, data from
this source were used in development of the data base empirical equation.
3.3.1.2 Rene' 41 Data Base Analysis. The following empirical equation was developed
for the Rene' 41 data base:
In E = 3.81577 -11.08783 (1/T) +.57841 Ina + .63366 In t (3-14)
where E = creep strain, %
a = stress, MPa
t = time, hours
T = temperature, OK/1000
This equation has a multiple R of .8889 and a standard error of estimate of .4278
on the natural logarithm of strain. The residual plots (in Eactual -In Ecalculatedvs. variable) for this equation are shown in Figure 3-77.
Typical comparisons of test data with predictions based on equation (1) are
shown in Figure 3-78.
3.3.2 SUPPLEMENTAL STEADY-STATE TESTING
3.3.2.1 Rene' 41 Supplemental Steady-State Test Matrix. A total of eighteen supple-
mental steady-state tests were conducted on Rene' 41 tensile specimens per conditions
in Table 3-5. Twelve of these tests were for .028 cm (.011 inch) thick material
tested in the longitudinal rolling direction. These twelve tests make up the basic
test matrix from which an empirical equation for supplemental steady-state data is
determined. Of the six additional tests listed in Table 3-5, three were conducted
on .028 cm. (.011 inch) thick specimens tested in the transverse rolling direction,
and three were conducted on .053 cm (.021 inch) thick specimens tested in the
longitudinal rolling direction.
3-93
MCDONNELL DOUGLAS ASTROPNAUTICS COPANY. P - AST
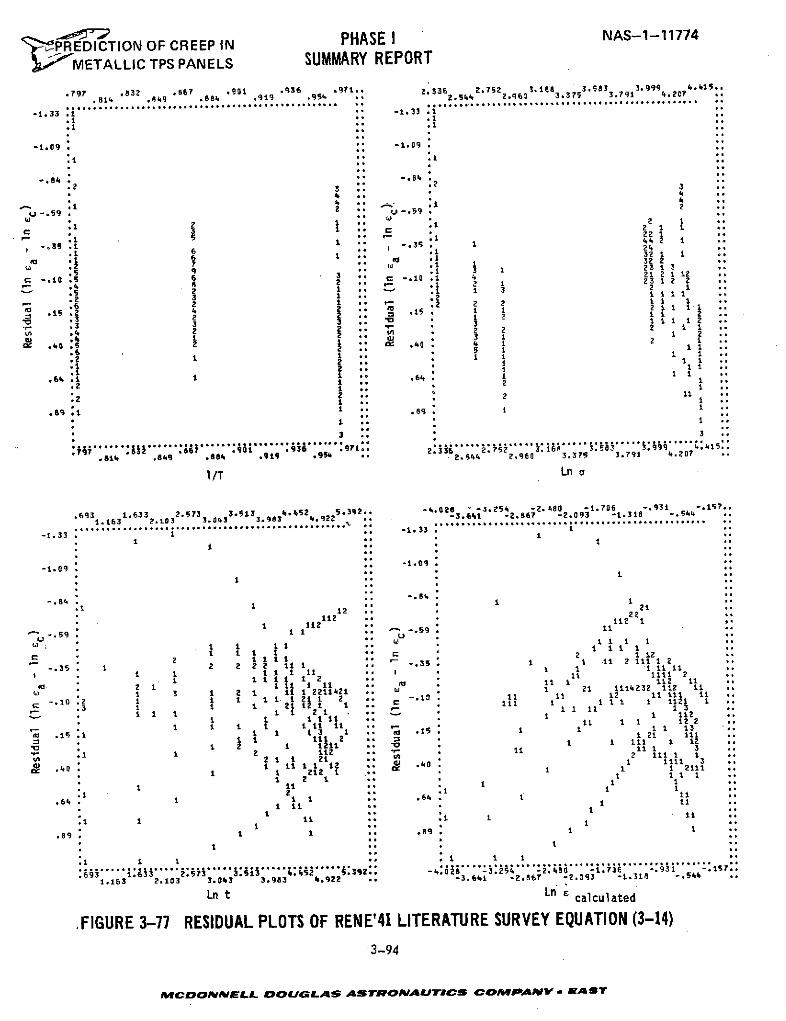
-. 0072PHASE I NAS-1-11774j-PREDICTION OF CREEP IN
SMETALLIC TPS PANELS SUMMARY REPORT
.797 .832 86? 901 .936 .971.. 2.336 2.752 3.168 3.583 3.999 4.415..
814 .849 .884 .919 .954 2.544 2.963 3.3?5 3.791 4.20 ?
.................................. ........ .....................................*... .** * *...-1.33 .1 . -1.33 .
-t.o9s . : -1.9.
i :2
.2 3 .2 3
4 . " 1 4
-. 9 .* -. 9 2
: 1 1 2 1 o
-.5 .. 2 1
S - 1 2 1
..1 23 13
.2* 3 , o: -. 1025 2 : - .1 11 21 22-- : 8 2 .. 1 1 23 1 1 .
.i 12 1. . 1 1 3. 1 .2 2 11 12
.E 1 2 .. i 3. 15. 1 1 2
. . 2 .. * 2 1i 1 ::
.64 1 .*64. 1S1 , 11 2 .2 I 1.1 1 "". 16""
6 1 . 1:2 1 •. 11 ..
S 1 . 1 ..
S. . .01a . . 1.. 2: . . . . ...... ...... : .. 41.814 .049 .884 .919 .95 .. 544 2 196 1 3.375 3.91 4.207
'I/T Ln a
.. . ....... ...... .... ......... ................
-1.33 .. . -1.33 *
-t,09 , -1.091 . . I
8.64 1. 12 21..
112 * 22*1 112 112 1
2 1 1
., .* -,19 111 1, ...
S I I I
1 .. I I I ..1
:2 1 1 1 1 1 1 2 .. - 1 111 21 ,
"-"1 3 1 2 1 112211421 5 1 21 1114232 11 11I
-. 0: 1t 1 1 1 1 1 21 1 ,1 -1.0 111 22 t l i
.4 £ 1 21 1 12 11 1 11 1 1 11 11 I
I 1 1 2 1 *1 1 1 1 11S 1 11 111
i 1-1 11 1 1 3.641 1 1 1 2 . . 2 11
S2 111 I I III 112.1 1 2 1 1 1 3
8 1 1 2 .. . 1 1
tI .. .
I 1 1 .. . 1 1.64 1 1 1 .84 1
.8 1 1 .8"
. .. 1 .63 .. . :3 . .... 4'. .. 4352: -4. .. . ' .. - . ... - ..... 931 ..... 1 .. "
1.163 2.103 3.043 3.983 4.922 *. -3.641 -2.867 -2.093 -1.318 -. 544
Ln t Ln calculated
.FIGURE 3-77 RESIDUAL PLOTS OF RENE'41 LITERATURE SURVEY EQUATION (3-14)3-94
MC.'fCDONJNELL DOUGLAS ASTRONAUTICS COMPAN ,, EAST
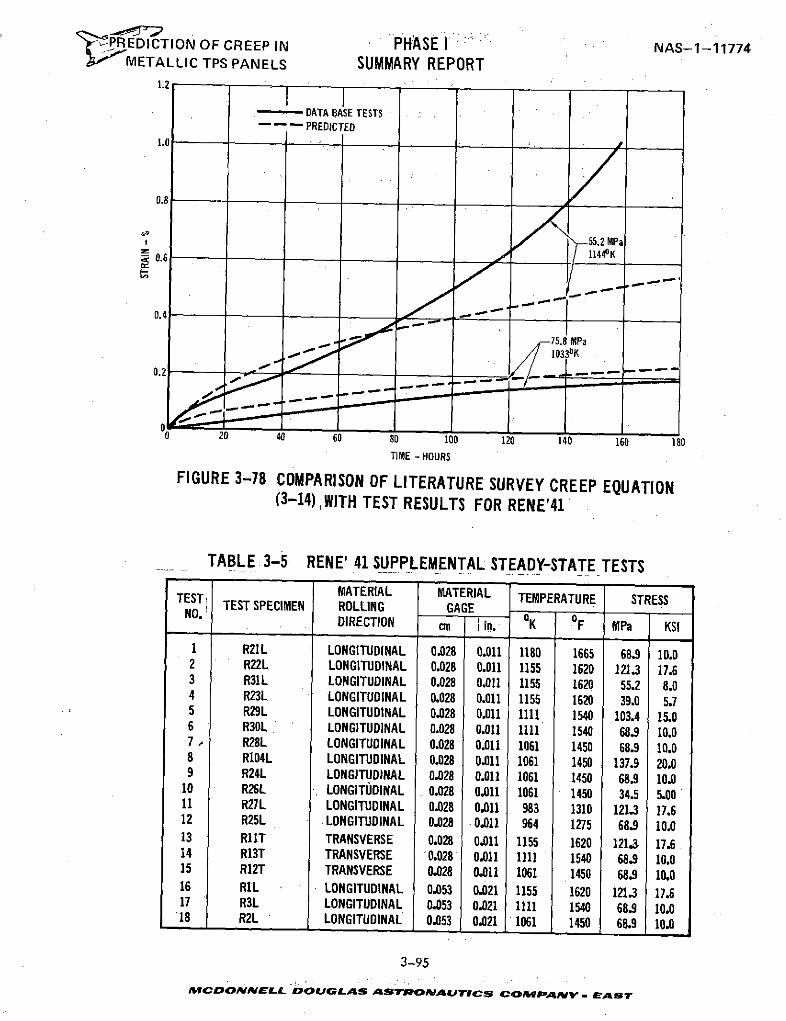
PREDICTION OF CREEP IN PHASE I NAS-1-117742;-' METALLIC TPS PANELS SUMMARY REPORT
1.2
DATA BASE TESTSPREDICTED
1.0 /_
55.2 MPa
__0.6__ 11440 K
0.4
75.8 MPa10330K
0 20 40 60 80 100 120 140 160 180
TIME -HOURS
FIGURE 3-78 COMPARISON OF LITERATURE SURVEY CREEP EQUATION(3-14) WITH TEST RESULTS FOR RENE'41
TABLE 3-5 RENE' 41 SUPPLEMENTAL STEADY-STATE TESTS
TESTMATERIAL MATERIAL TEMPERATURE STRESSNOTEST TEST SPECIMEN ROLLING GAGE
DIRECTION m I in. OK F MPa KSI
I R21L LONGITUDINAL 0.028 0.011 1180 1665 68.9 10.02 R22L LONGITUDINAL 0.028 0.011 1155 1620 121.3 17.63 R31L LONGITUDINAL 0.028 0.011 1155 1620 55.2 8.04 R23L LONGITUDINAL 0.028 0.011 1155 1620 39.0 5.75 R29L LONGITUDINAL 0.028 0.011 1111 1540 103.4 15.06 R30L LONGITUDINAL 0.028 0.011 1111 1540 68.9 10.07 R28L LONGITUDINAL 0.028 0.011 1061 1450 68.9 10.08 R104L LONGITUDINAL 0.028 0.011 1061 1450 137.9 20.09 R24L LONGITUDINAL 0.028 0.011 1061 1450 68.9 10.0
10 R26L LONGITUDINAL 0.028 0.011 1061 1450 34.5 5.0011 R27L LONGITUDINAL 0.028 0.011 983 1310 121.3 17.612 R25L LONGITUDINAL 0.028 0.011 964 1275 68.9 10.013 RIT TRANSVERSE 0.028 0.011 1155 1620 121.3 17.614 R13T TRANSVERSE '0.028 0.011 1111 1540 68.9 10.015 R12T TRANSVERSE 0.028 0.011 1061 1450 68.9 10.016 RIL LONGITUDINAL 0.053 0.021 1155 1620 121.3 17.617 R3L LONGITUDINAL 0.053 0.021 1111 1540 68.9 10.0'18 R2L LONGITUDINAL 0.053 0.021 1061 1450 68.9 10.0
3-95
MCDONNELL DOUGLAS ASTROMAUTICS COIfPApNY - EAST
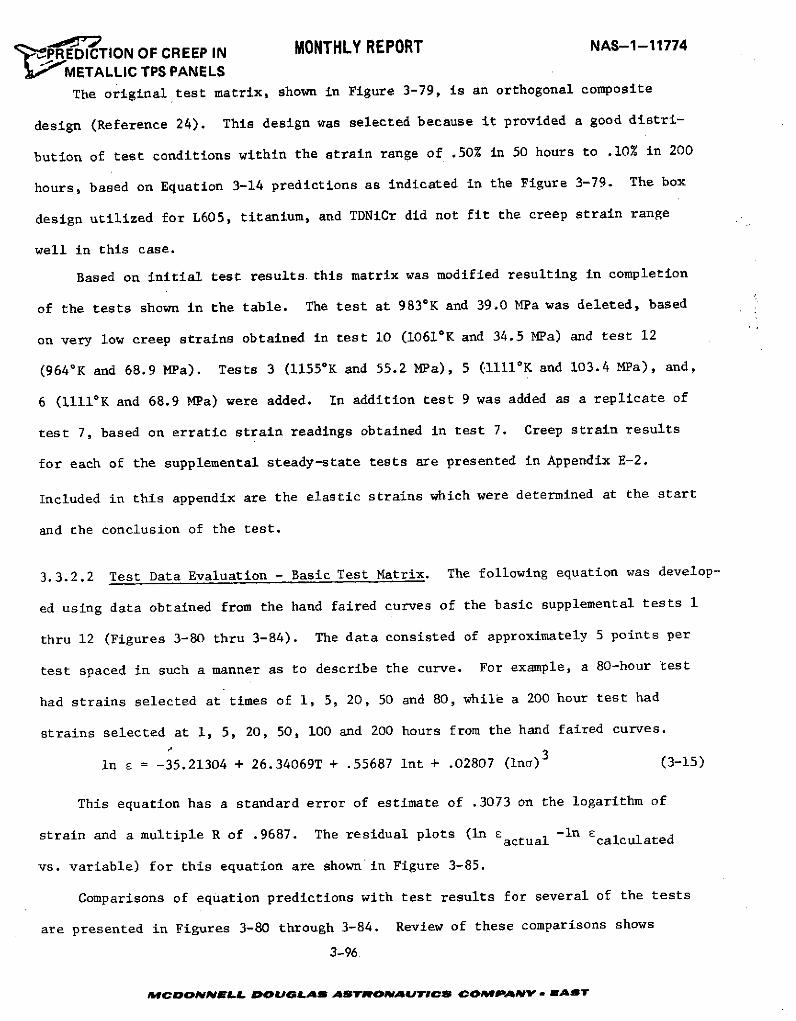
' RDICTION OF CREEP IN MONTHLY REPORT NAS-1-11774
k METALLIC TPS PANELS
The original test matrix, shown in Figure 3-79, is an orthogonal composite
design (Reference 24). This design was selected because it provided a good distri-
bution of test conditions within the strain range of .50% in 50 hours to .10% in 200
hours, based on Equation 3-14 predictions as indicated in the Figure 3-79. The box
design utilized for L605, titanium, and TDNiCr did not fit the creep strain range
well in this case.
Based on initial test results.this matrix was modified resulting in completion
of the tests shown in the table. The test at 9830K and 39.0 MPa was deleted, based
on very low creep strains obtained in test 10 (10610 K and 34.5 MPa) and test 12
(964"K and 68.9 MPa). Tests 3 (1155K and 55.2 MPa), 5 (1111*K and 103.4 MPa), and,
6 (11110K and 68.9 MPa) were added. In addition test 9 was added as a replicate of
test 7, based on erratic strain readings obtained in test 7. Creep strain results
for each of the supplemental steady-state tests are presented in Appendix E-2.
Included in this appendix are the elastic strains which were determined at the start
and the conclusion of the test.
3.3.2.2 Test Data Evaluation - Basic Test Matrix. The following equation was develop-
ed using data obtained from the hand faired curves of the basic supplemental tests 1
thru 12 (Figures 3-80 thru 3-84). The data consisted of approximately 5 points per
test spaced in such a manner as to describe the curve. For example, a 80-hour test
had strains selected at times of 1, 5, 20, 50 and 80, while a 200 hour test had
strains selected at 1, 5, 20, 50, 100 and 200 hours from the hand faired curves.
In E = -35.21304 + 26.34069T + .55687 Int + .02807 (lna)3 (3-15)
This equation has a standard error of estimate of .3073 on the logarithm of
strain and a multiple R of .9687. The residual plots (in Eactual -ln scalculated
vs. variable) for this equation are shown in Figure 3-85.
Comparisons of equation predictions with test results for several of the tests
are presented in Figures 3-80 through 3-84. Review of these comparisons shows
3-96.
MCDONNELL DOUGLAS ASTRONAUTICS COMPAANY- EA ST
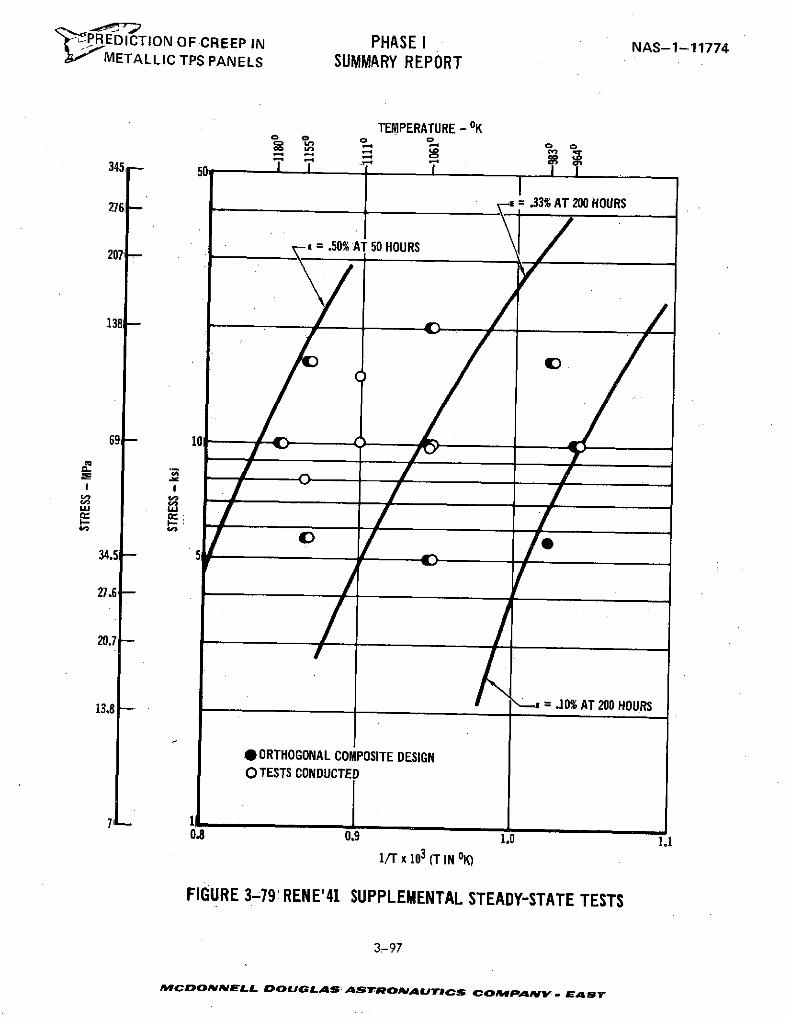
-PREDICTION OF CREEP IN PHASE I NAS-1-11774IMETALLIC TPS PANELS SUMMARY REPORT
TEMPERATURE - OK
345 50 I
276_ u= .33% AT 200 HOURS
a= .50% AT 50 HOURS207
138 -
69- 103
I g
I- I-
V3,7
34.5 - 5
27.6-
20.7 -
13.8__ '--s = .10% AT 200 HOURS13.8
*ORTHOGONAL COMPOSITE DESIGNO TESTS CONDUCTED
7- 1L08 0.9 1.0 1.1
1/T x 103 (T IN OK)
FIGURE 3-79': RENE'41 SUPPLEMENTAL STEADY-STATE TESTS
3-97
MCDONNELL DOUGLAS ASTRoPAUITICS COMePANYV. EAST
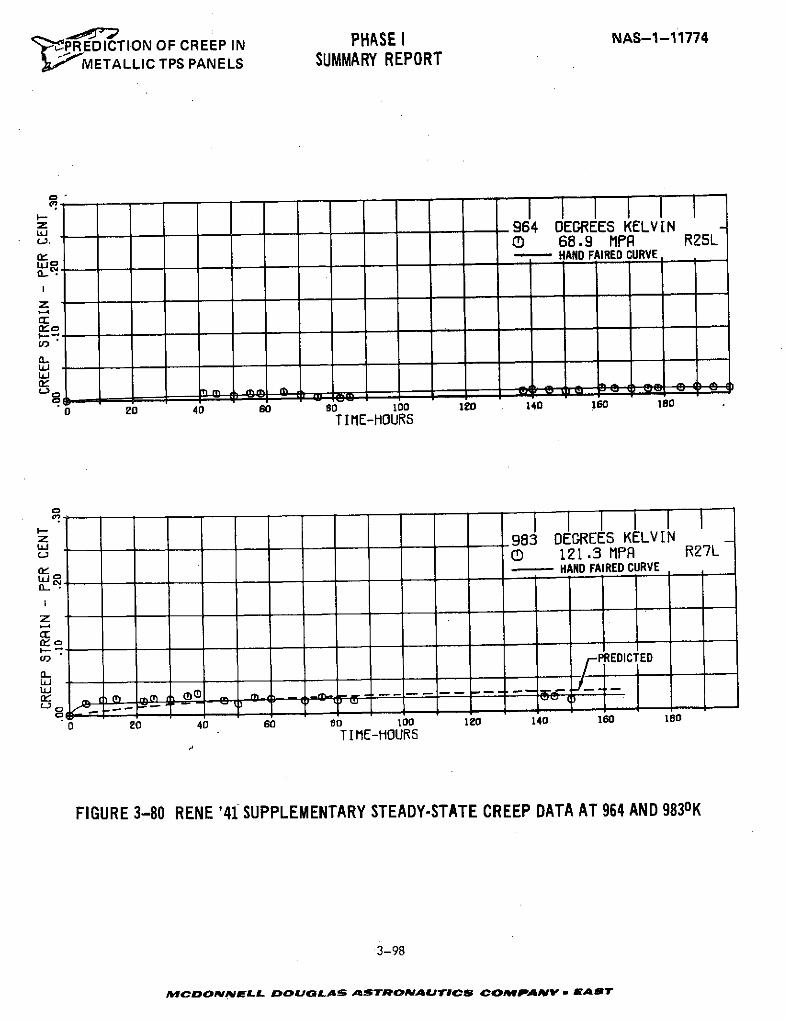
' 't4PREDICTION OF CREEP IN PHASE I NAS-1-11774
SMETALLIC TPS PANELS SUMMARY REPORT
I-
wz 964 DEGREES KELVIN0 68.9 MP R25L
S--- HAND FAIRED CURVE
z
a:ma~
0 20 40 60 80 100 120 140 260
TIME-HOURS
IT_-I
-z .983 DEGREES KELVIN0 121.3 MP R27Li_- HAND FAIRED CURVE
CZ
SPREDICTEDU)
Li
0 20 40 60 S0 10o 120 140 150 180
TIME-HOURS
FIGURE 3-80 RENE '41 SUPPLEMENTARY STEADY-STATE CREEP DATA AT 964 AND 9830K
3-98
MCDONNELL DOUGLAS ASTRONAUTICS COMPANV " EAST
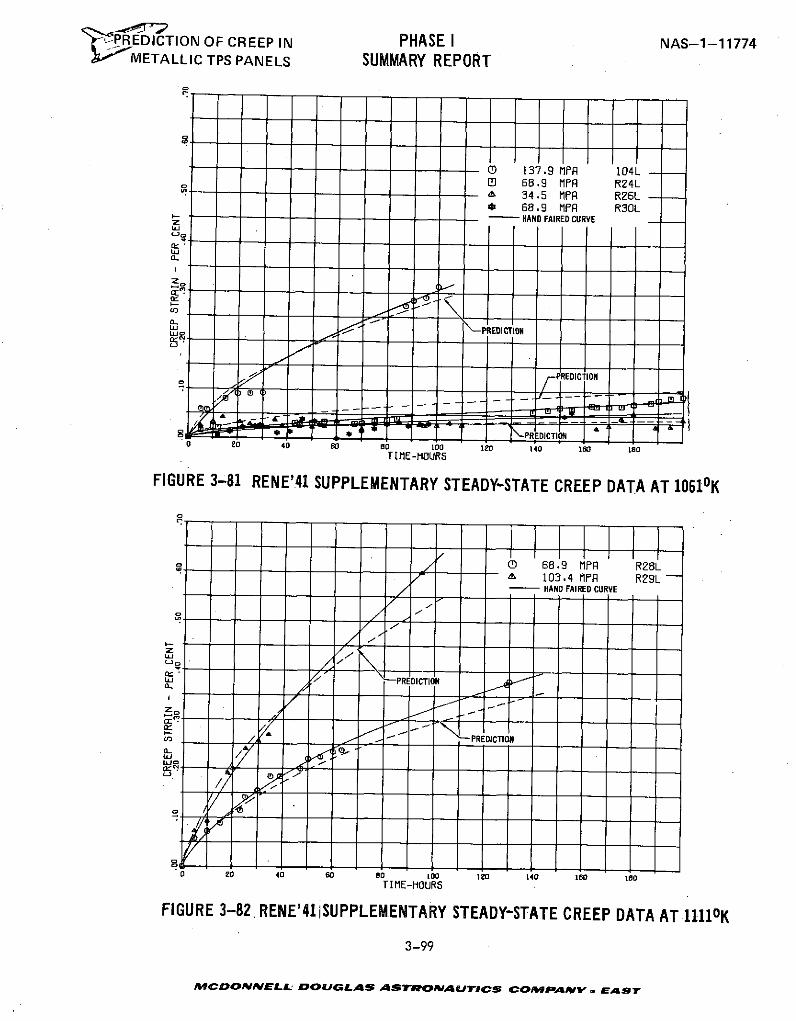
'PREDICTION OF CREEP IN PHASE I NAS-1-117742 METALLIC TPS PANELS SUMMARY REPORT
CD 137.9 MPA 104LEl 68.9 MPA R24L
--- A 34.5 MFR R26L* 68.9 MPR R30L
" HAND FAIRED CURVELAJ
{L_
a- -PREDICTION
0 20 40 60 80 100 120 140 160 180TI ME-HOURS
FIGURE 3-81 RENE'41 SUPPLEMENTARY STEADY-STATE CREEP DATA AT 10610K
S - 68.9 MPA R28L103.4 MPR R29LHAND FAIRED CURVE
I- -- - - - - - - P - - - - - - - - - - - --'C
PRDICTIO PREDICTION
3-99
S/OELL DOGLAS PREDICTION
MC O N LL O GL SA T ON UI S O P NYIE S
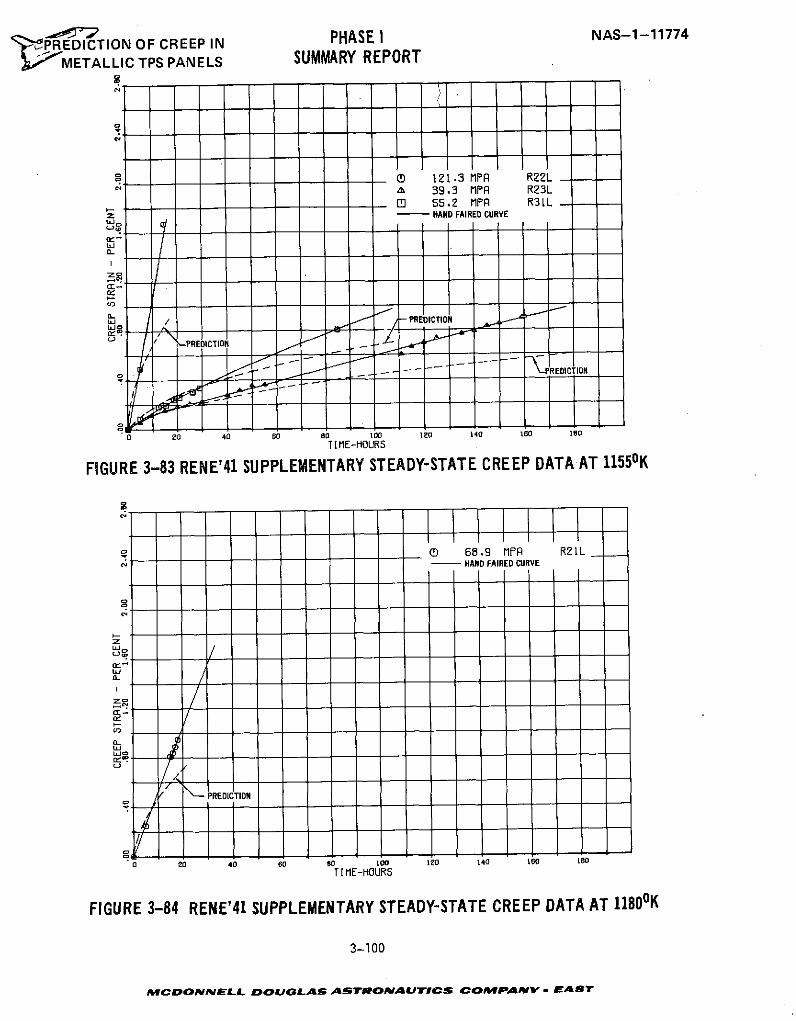
'jPREDICTION OF CREEP IN PHASE I NAS-1-11774
METALLIC TPS PANELS SUMMARY REPORT
(D 121.3 MPR R22L, 39.3 MPR R23LD 55.2 MPR R31L
z- HAND FAIRED CURVE
lX_
zo
)- PREDICTION
CP-- REDICTION
0 20 40 60 8o 100 120 140 160 180O
TIME-HOURS
FIGURE 3-83 RENE'41 SUPPLEMENTARY STEADY-STATE CREEP DATA AT 11550K
CD 68.9 MPR R21L-HAND FAIRED CURVEI I
'3
uJ
PREDI TION
0 20 46 60 8 100 1l2 140 160 180
TIME-HOURS
FIGURE 3-84 RENE'41 SUPPLEMENTARY STEADY-STATE CREEP DATA AT 11800K
3-100
MCDONNELL DOUGLAS ASRONUTICS COMPANY I EAST
'PREDICTION OF CREEP IN MONTHLY REPORT NAS-1-11774# METALLIC TPS PANELSthat the equation predicts lower strain rates than those accurring in the tests.
Predicted strains are higher than test values during the initial test timer, cross
the test values approximately midway through the test, and result in lower predic-
tions at the test completion. This result indicates that additional time terms
may be required to provide a better data fit. Terms such as n = f(t ), however,
were found to be insignificant in fitting data from the supplemental steady-state
basic test matrix (tests 1-12). The predictions for the 964 and 9830K tests are
not presented in Figure 3-80 because the amount of strain is so small that the
curve lies on the ordinate.
3.3.2.3 Effect of Gage and Rolling Direction on Rene' 41 Steady-State Creep.
Rene' 41 supplemental steady-state tests 13 through 18 (Table 3-5) were conducted
as replicates of basic matrix tests except for variations in rolling ditection
(tests 13, 14, 15 and in material thickness (tests 16, 17, 18). Comparison of creep
strains for thest two variables are presented in Figures 3-86, 3-87, and 3-88.
In each of the three comparisons, the thicker gage specimen (0.53 cm) exhibits
greater creep strain than either thin gage specimen. This difference is consis-
tently a factor of approximately 2 times the creep strain values for .028 cm thick
specimens tested in the longitudinal direction. One possibility for this effect is
the fact that the 0.053 cm material had a finer grain size (ASTM 7-8) than the
0.028 cm material (ASTM 6). Since the amount of creep obtained for thicker material
is greater than the factor of + 1.81 based on + 1.96 S scatter band for the supple-
mental steady-state creep equation (Equation 3-15), it can be concluded that the
gage was significant variable for this series of tests.
3-101
MCDONNELL DOUGLAS ASTRONAUrTICS COMPANYr - EA
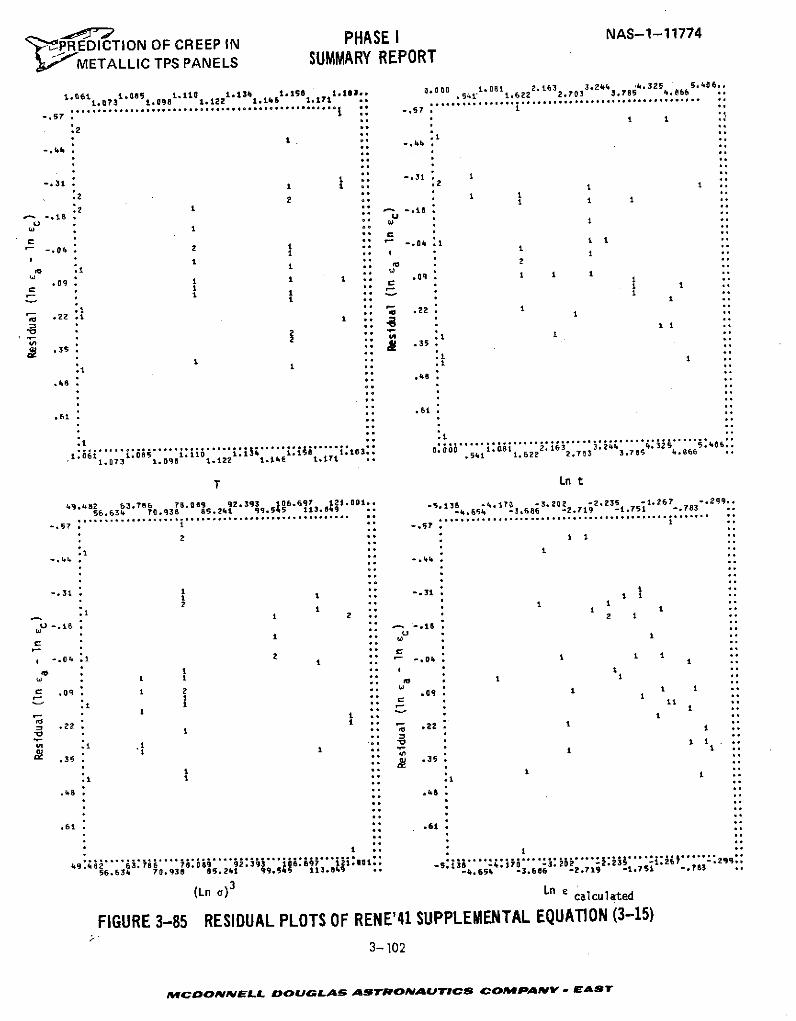
SPHASE I NAS-1-117744,PREDICTION OF CREEP IN
METALLIC TPS PANELS SUMMARY REPORT
1.061 1.085 1.110 1.134 1.158 1.183.. 0000 . 61.6222. 632.703 3.2 3.84.3254.8665,061.073 1.098 1.122 1.146 1.171 *,,, . ... ,, .. .. ,...,, , *,, ,
. ..................... - . 1
.2 ' ::
-.44 -. 44
- *1 -. 31. 11. 2
2 . -.
.22 * -. 18
-. 18 ..
1 -,*211 51 1 .
.31 .. 7 8
.05 ° 17 . . . . . . .
1 2
w U .- c * ..
q .1 2 . 11
.22 10 2
2 1
.61
.6
Z .- . ""
.0 2" ::"° .6 - 0". 1
-.................... :: ..*? ........I. .. *
- - I -.0.0 . o* 1
1.3a 3 5° 1
I ,- 1
-1 1 . ,2
1. . .. . . .
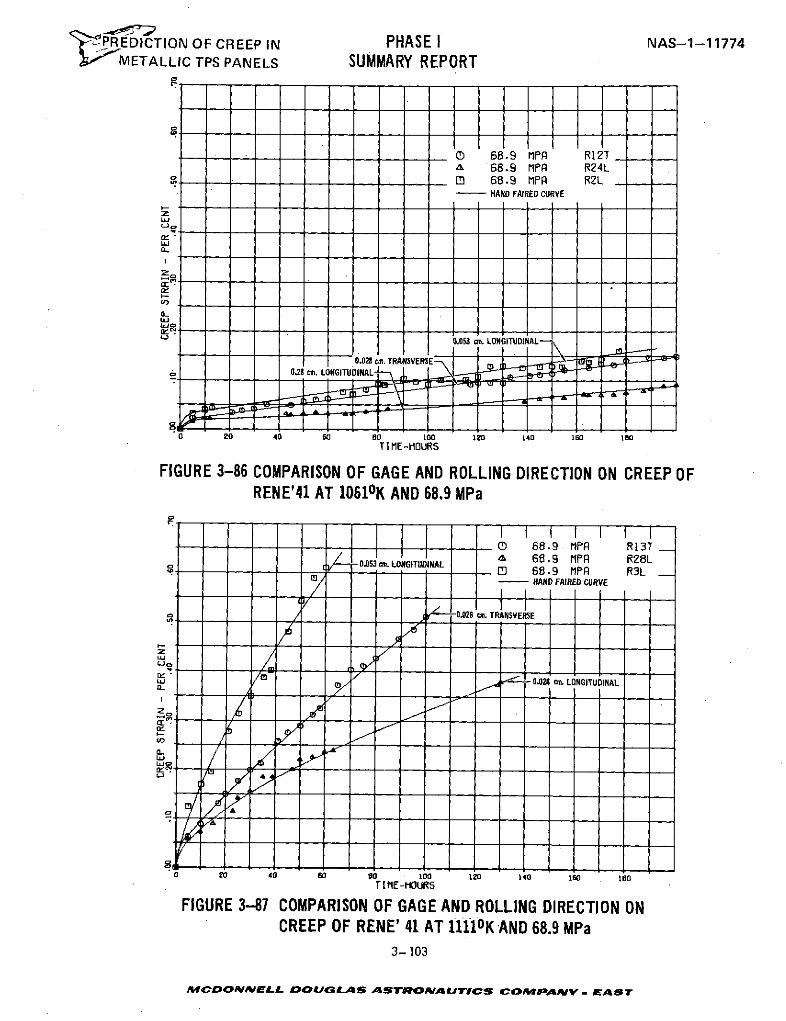
PREDICTION OF CREEP IN PHASE I NAS-1-11774METALLIC TPS PANELS SUMMARY REPORT
D 68.9 MPR R12TA 68.9 MPR R24LC 68.9 MPA R2L
- HAND FAIRED CURVE
Lu
0Z
c
0.053 cm. LONGITUDINAL
0.028 cm. TRANSVERSE - l,0.28. cm. L-NGITUDINAL-
0 20 40 60 0 100 120 140 160 10ooTIME-HOURS
FIGURE 3-86 COMPARISON OF GAGE AND ROLLING DIRECTION ON CREEP OFRENE'41 AT 1061 0K AND 68.9 MPa
0 68.9 MPA R13T& 68.9 MPA R28L0.053 an. LONGITUDINALI .o] 68.9 MPA R3L/- HAND FAIRED CURVE
S-0.028 cm. TRANSVERSE
.0.028 cm. LONGITUDINALLu" 1
TI ME-HOURS
FIGURE 3-87 COMPARISON OF GAGE AND ROLLING DIRECTION ONCREEP OF RENE' 41 AT 1iiiOK AND 68.9 MPa
3- 103
MCDONNELL DOUGLAS ASTRONAUTICS COMPANY . EAST"4cDOaNmelAL "cpUG LAs AsTWrcoNAuT,1csCiWAV LAS
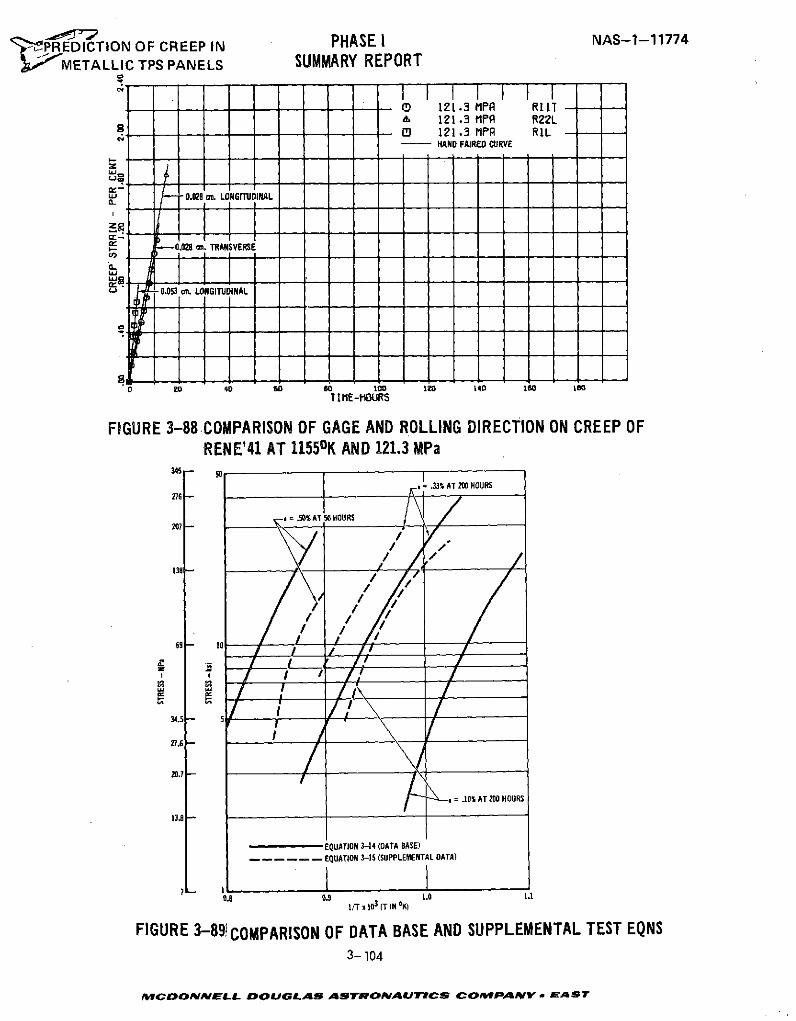
-- "PREDICTION OF CREEP IN PHASE I NAS-1-11774
SMETALLIC TPS PANELS SUMMARY REPORT
0 121.3 MPA RT -& 121.3 MPA R22LD[ 121.3 MPA RIL
- HAND FAIRED CURVE
I - - - - - - - - -- - - - - - -
J- 0.028 an. LONGITUDINAL
- .028 a. TRANSVERSE
S 0.053 a . LONGITUDINAL
a o 40 60 s8o to0 120 140 1i0 10
TIME-HOURS
FIGURE 3-88 COMPARISON OF GAGE AND ROLLING DIRECTION ON CREEP OFRENE'41 AT 11550K AND 121.3 MPa
= .33% AT 200 HOURS
.50% AT 50 HOURS 1
20.7 -
13.8 -
EQUATION 3-14 (DATA BASE)- - - - -- EQUATION 3-15 (SUPPLEMENTAL DATA)
0.8 0.9 1.0 1.11/T x 103 (T IN oK)
FIGURE 3-89 COMPARISON OF DATA BASE AND SUPPLEMENTAL TEST EQNS3- 104
MCDONNELL DOUGLAS ASTRONAUTICS COMPAnVNY - EAST
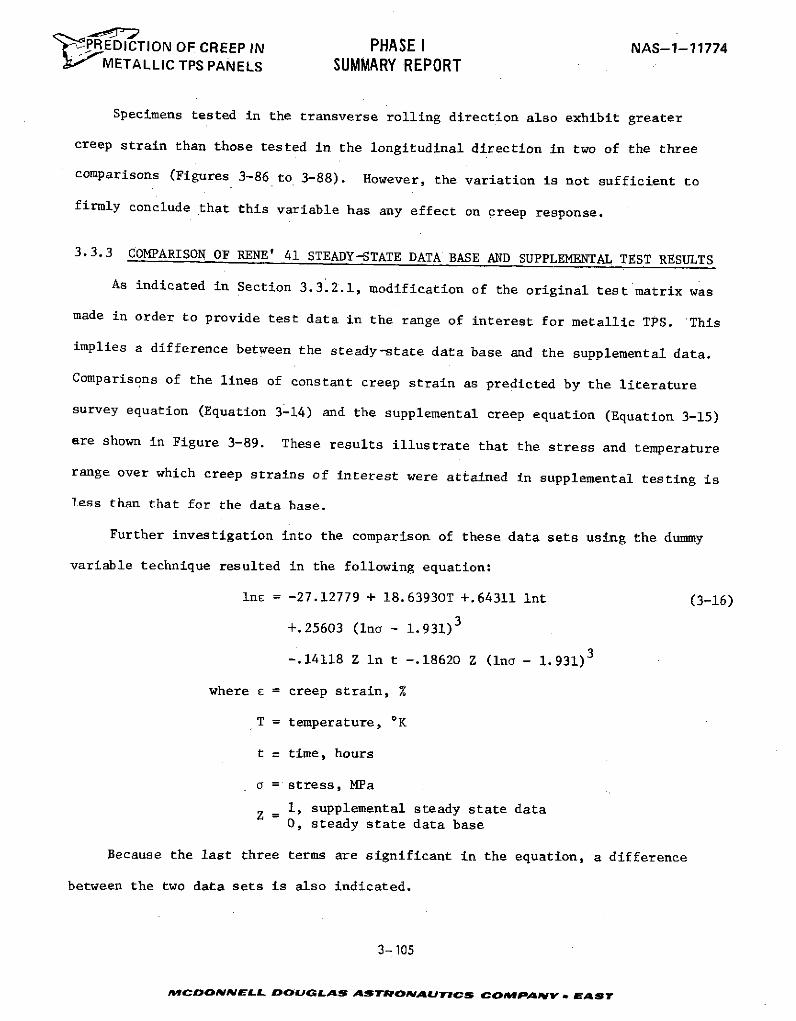
,PREDICTION OF CREEP IN PHASE I NAS-1-11774METALLIC TPS PANELS SUMMARY REPORT
Specimens tested in the transverse rolling direction also exhibit greater
creep strain than those tested in the longitudinal direction in two of the three
comparisons (Figures 3-86 to 3-88). However, the variation is not sufficient to
firmly conclude that this variable has any effect on creep response.
3.3.3 COMPARISON OF RENE' 41 STEADY-STATE DATA BASE AND SUPPLEMENTAL TEST RESULTS
As indicated in Section 3.3.2.1, modification of the original test matrix was
made in order to provide test data in the range of interest for metallic TPS. This
implies a difference between the steady-state data base and the supplemental data.
Comparisons of the lines of constant creep strain as predicted by the literature
survey equation (Equation 3-14) and the supplemental creep equation (Equation 3-15)
are shown in Figure 3-89. These results illustrate that the stress and temperature
range over which creep strains of interest were attained in supplemental testing is
less than that for the data base.
Further investigation into the comparison of these data sets using the dummy
variable technique resulted in the following equation:
Inc = -27.12779 + 18.63930T +.64311 Int (3-16)
+.25603 (Ina - 1.931)3
-.14118 Z In t -.18620 Z (In - 1.931)3
where e = creep strain, %
T = temperature, OK
t = time, hours
S= stress, MPa
Si1, supplemental steady state data0, steady state data base
Because the last three terms are significant in the equation, a difference
between the two data sets is also indicated.
3-105
MCDONNELL DOUGLAS ASTRONAUTICS COMPANY . EAST
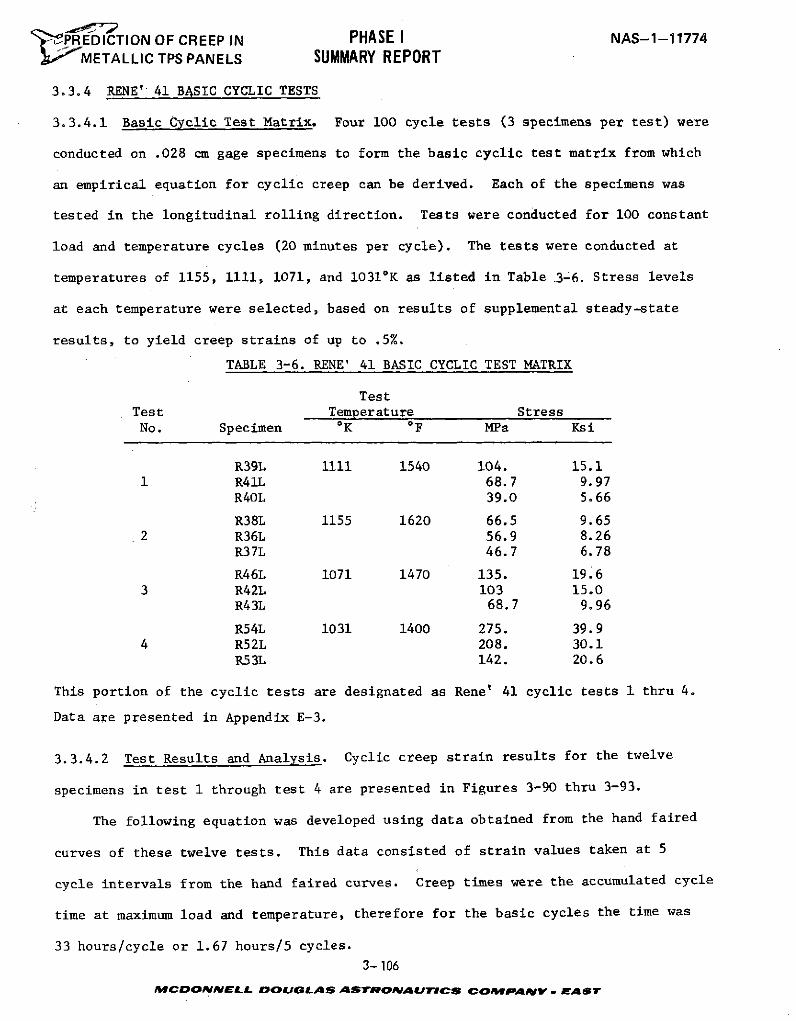
' PREDICTION OF CREEP IN PHASE I NAS-1-11774METALLIC TPS PANELS SUMMARY REPORT
3.3.4 RENE' 41 BASIC CYCLIC TESTS
3.3.4.1 Basic Cyclic Test Matrix. Four 100 cycle tests (3 specimens per test) were
conducted on .028 cm gage specimens to form the basic cyclic test matrix from which
an empirical equation for cyclic creep can be derived. Each of the specimens was
tested in the longitudinal rolling direction. Tests were conducted for 100 constant
load and temperature cycles (20 minutes per cycle). The tests were conducted at
temperatures of 1155, 1111, 1071, and 10310 K as listed in Table .3-6. Stress levels
at each temperature were selected, based on results of supplemental steady-state
results, to yield creep strains of up to .5%.
TABLE 3-6. RENE' 41 BASIC CYCLIC TEST MATRIX
TestTest Temperature StressNo. Specimen oK oF MPa Ksi
R39L 1111 1540 104. 15.11 R41L 68.7 9.97
R40L 39.0 5.66
R38L 1155 1620 66.5 9.652 R36L 56.9 8.26
R37L 46.7 6.78
R46L 1071 1470 135. 19.63 R42L 103 15.0
R43L 68.7 9.96
R54L 1031 1400 275. 39.94 R52L 208. 30.1
R53L 142. 20.6
This portion of the cyclic tests are designated as Rene' 41 cyclic tests 1 thru 4.
Data are presented in Appendix E-3.
3.3.4.2 Test Results and Analysis. Cyclic creep strain results for the twelve
specimens in test 1 through test 4 are presented in Figures 3-90 thru 3-93.
The following equation was developed using data obtained from the hand faired
curves of these twelve tests. This data consisted of strain values taken at 5
cycle intervals from the hand faired curves. Creep times were the accumulated cycle
time at maximum load and temperature, therefore for the basic cycles the time was
33 hours/cycle or 1.67 hours/5 cycles.
3- 106
MCOONNELL D OULAS ASTROI4MUTICS COM4PANYv. AST
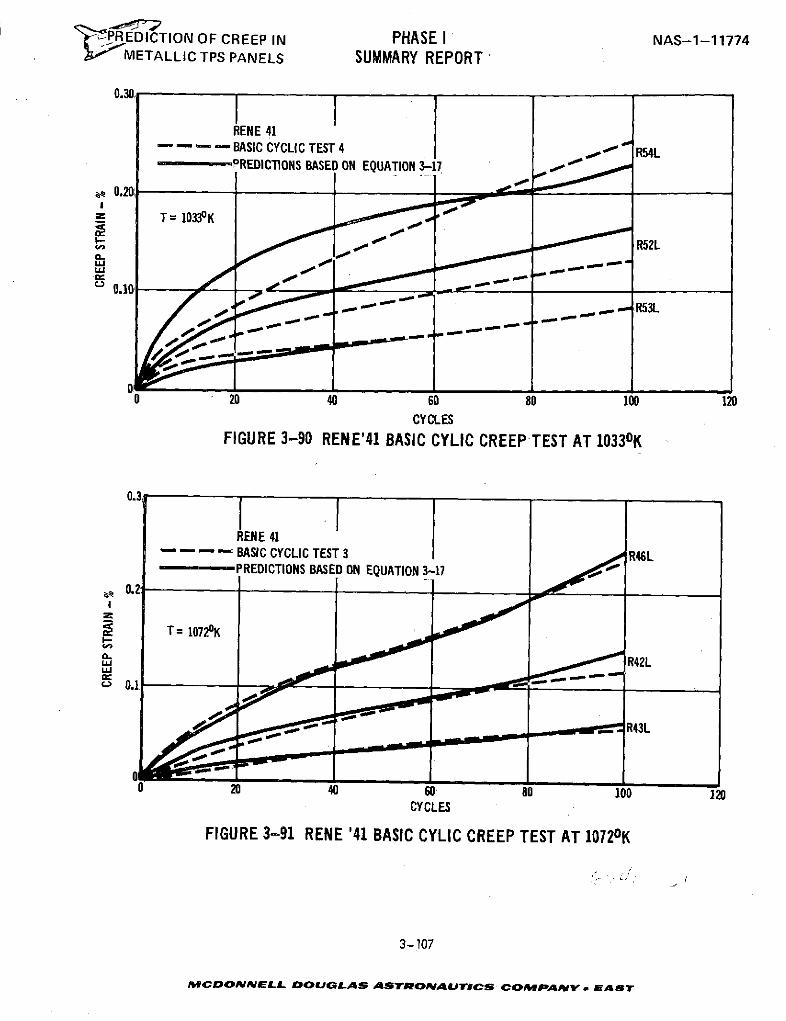
PREDICTION OF CREEP IN PHASE I NAS-1-11774METALLIC TPS PANELS SUMMARY REPORT
0.30,
RENE 41- - - - BASIC CYCLIC TEST 4 R54L
PREDICTIONS BASED ON EQUATION 3-17
T= 10330K0.0.,
2 40 60 8 10 120
CYCLES
FIGURE 3-90 RENE'41 BASIC CYLIC CREEP TEST AT 10330 K
0.3
RENE 41
PREDICTIONS BASED ON EQUATION 3-170.2
T= 1072oKR42L
0.1 -
w, R43L
0 20 40 60 80 100 120CYCLES
FIGURE 3-91 RENE '41 BASIC CYLIC CREEP TEST AT 10720K
3- 107
M9CDONNELL DOUGLAS ASTRONAUTICS COM&PANP V. EA S
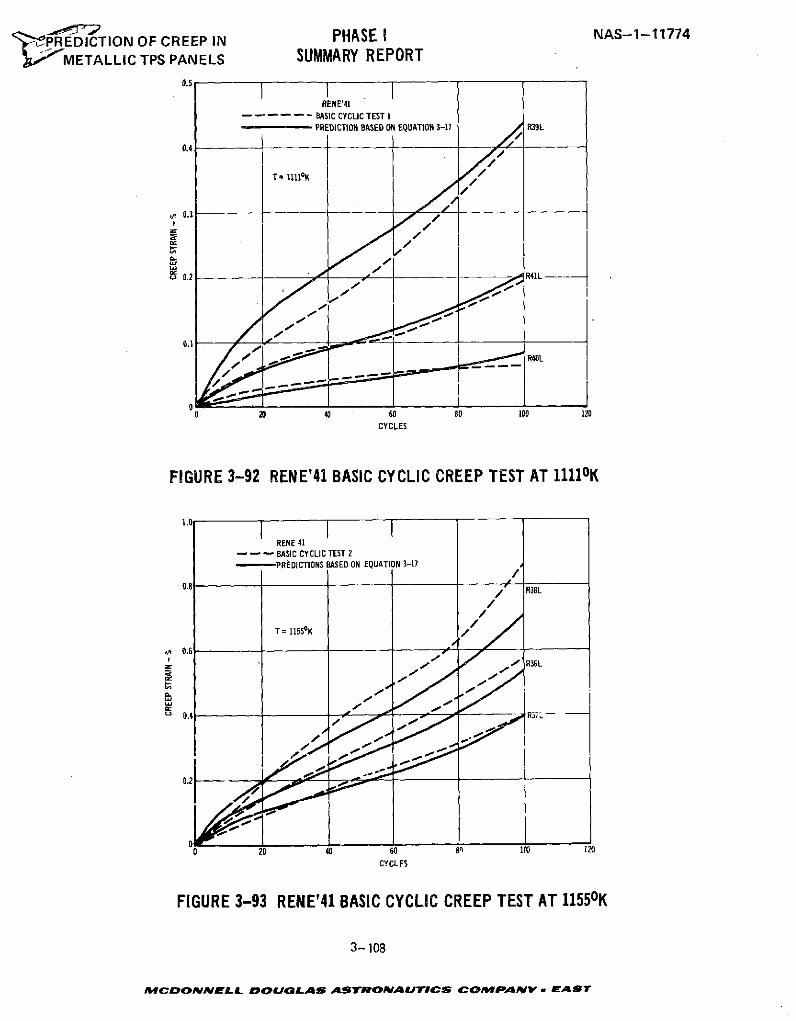
-6PRREDICTION OF CREEP IN PHASE I NAS-1-11774
; 'METALLIC TPS PANELS SUMMARY REPORT0.5
RENE'41- - - -- - BASIC CYCLIC TEST I
PREDICTION BASED ON EQUATION 3-17 R39L
0.4
T= 11loK
S0.2R4L -- --
00.2
R40L
0 40 6010 120CYCLES
FIGURE 3-92 RENE'41 BASIC CYCLIC CREEP TEST AT 11110K
1.0
RENE 41- - - BASIC CYCLIC TEST 2- PREDICTIONS BASED ON EQUATION 3-17
/ R36L
FIGURE 3-93 RENE'41 BASIC CYCLIC CREEP TEST AT 1155K
3-108
MCDONNELL DOUGLAS ASTRONAUTICS COMPANYV - EAST
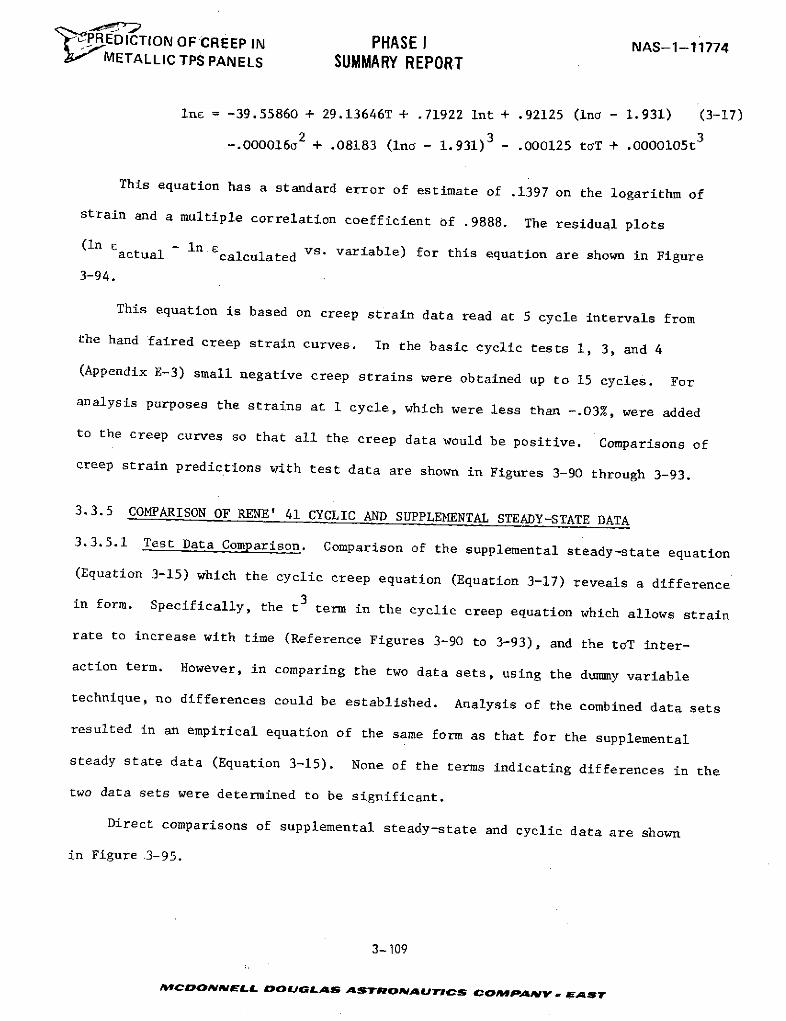
PREDI CTION OF CREEP IN PHASE I NAS-1-1i7742 IMETALLIC TPS PANELS SUMMARY REPORT
Inc = -39.55860 + 29.13646T + .71922 Int + .92125 (ina - 1.931) (3-17)
-.000016a2 + .08183 (Ina - 1.931) 3 - .000125 toT + .0000105t3
This equation has a standard error of estimate of .1397 on the logarithm of
strain and a multiple correlation coefficient of .9888. The residual plots
(In Eactual - in .calculated vs. variable) for this equation are shown in Figure
3-94.
This equation is based on creep strain data read at 5 cycle intervals from
the hand faired creep strain curves. In the basic cyclic tests 1, 3, and 4
(Appendix E-3) small negative creep strains were obtained up to 15 cycles. For
analysis purposes the strains at 1 cycle, which were less than -.03%, were added
to the creep curves so that all the creep data would be positive. Comparisons of
creep strain predictions with test data are shown in Figures 3-90 through 3-93.
3.3.5 COMPARISON OF RENE' 41 CYCLIC AND SUPPLEMENTAL STEADY-STATE DATA
3.3.5.1 Test Data Comparison. Comparison of the supplemental steady-state equation
(Equation 3-15) which the cyclic creep equation (Equation 3-17) reveals a difference
in form. Specifically, the t3 term in the cyclic creep equation which allows strain
rate to increase with time (Reference Figures 3-90 to 3-93), and the toT inter-
action term. However, in comparing the two data sets, using the dummy variable
technique, no differences could be established. Analysis of the combined data sets
resulted in an empirical equation of the same form as that for the supplemental
steady state data (Equation 3-15). None of the terms indicating differences in the
two data sets were determined to be significant.
Direct comparisons of supplemental steady-state and cyclic data are shown
in Figure 3-95.
3-109
MCOoNNELL DOUGLAS ASTRONAUTICS COMPAVNY EAST
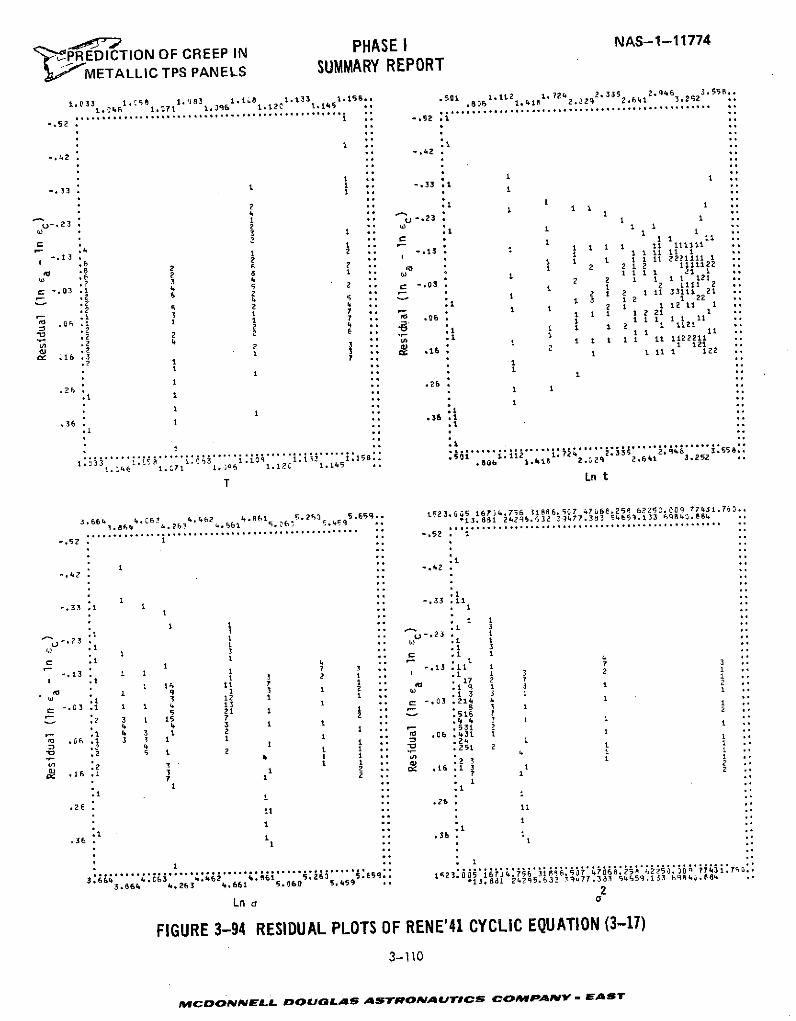
'"PREDICTION OF CREEP IN PHASE NAS-1-11774
METALLIC TPS PANELS SUMMARY REPORT
1.033 1.. a 1.183 .j 1.133 1. 156. .5s1 .112 1.724 2.335 2.446 3.558..
2 ............................ .. . .s . ............... ..- 31 . -.533 .1
t 1 1 1 1 i
13- 3 2 1 1 1 -. 33 .
I .. 1 t1
-. 03 4 2 ** 2 1 1 1 1 1 21
2 .. . 1 2
.* " 2 1 1 1 1 1
2 3 ; 2 4 1 2 1 22
- 1 7 .. - .3 1 12 i
C 1 . 1 2 1 1 I
2 4. 1 2
1 11 i
.2 2 - *1 1 2 1 1 1211l1 .
- 31 " " i 1 1 2 2 1 1 1 1 -
. 2 1 1 1 11 221111
16 .3 3 .16
i 1 12
'1 * 2- 2 2 1 i 21
-. 03,. 4. 5 . . - .0 ± 2 11112 2 ,
26 8 . - I 2 12 1 11 33111 21
.2 1 . 6 1 12 12
S .. I 1 7 .' 06 .1 1 .1 .
S2 * 1 111131 11.z. . C .. 6 11.25Z
S. 4. 4i 1 1 1 6 1122211
-. 2 .16. . .. 2 i i 22
.2 i -.1
. 1 -. 33 122
.1 1 .. .
.26 :1 3 1
1 .. - . .11 1
1. . ,
.6 ..
.1 1 1
1.233 i.tCs 1.I'3 1.10 1158.. 01 ±152 7
i :513 z7s'6 2.
1146 : i 11 1 .1 5 .806 1 .29 2.61 3.2520
T Ln t
366 4.63 4462 1 5.6849. LZ3.05 16734.756 11886.507 4768.258 6 52.005 77431.763..3. 864 4.263 661 8262
r 5.459 .. *13.881 2425.,32 35477.383 54653.133 984.88
........................................ ............ .
I-.52 1 45 O ±-.
..0
-4 .2 It .26
15.. 3 .1 71
-. 33 .1 1 - i.,
1 3 1
0Z ;1 .1 3, -1 1 '. 3
.1 ., .1 1
,C 15 11 1 , 17 3 1 i ''
S.1 3 12 1 ,
. 1 1 4 1 1 "" O .2l4 4 1
.2 3 1 7
°• .1- 1.I . . .. .2. 1 i .
. 5 1 2 1 1 .. .251 2 1
.2 1 1 . I *1 1 -
.1 1 .
.6 . 1 .. ..
Ln a a
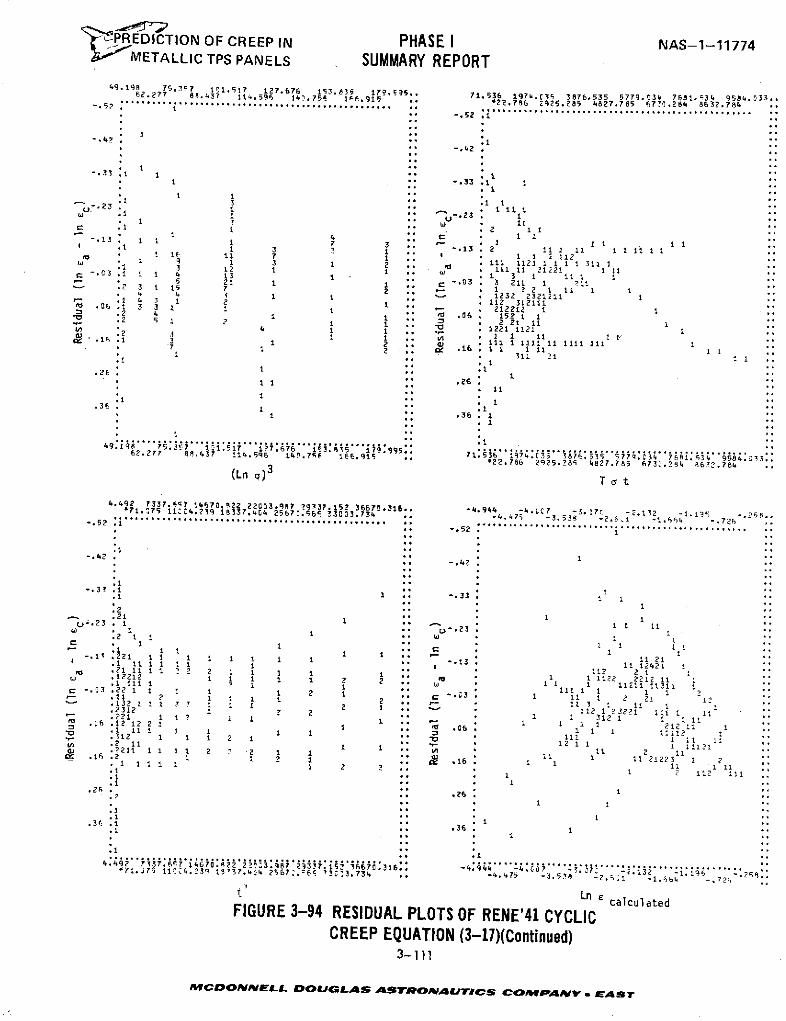
'- REDICTION OF CREEP IN PHASE I NAS-1-11774I-' METALLIC TPS PANELS SUMMARY REPORT
49.198 75.3r7 11. 5174 127.676 153.835 179.95. 71.536 197 .C35 3876.535 5779.034 7681.534 9584. 33.6 .2771 ' 8. *437 1 .59, 1.75* 1 .915 .. *22.786 2925.285 4827.785 6731.284 8632.784
*-.52 .
-.42 : 1-.42
1.1
1 1 . -. 33 .11 3 U 1 *
S .1 1 .2 1 11"4 .. C 1 11.13. I1 1 7 3 C . 1 111.1 1 3 -. 13 2 11 1 11 1 1 11 113 11 1 1 2 1123 1 2 111 1121 1 1 1 1 311 1.1 3 12 1 11 . - 1 1 1 1 1 II-.
0 3 1 1 1 4 13 1 3 1 11 1 15 21 1 -. 3 3 211 1 71i.2 3 1 15 1 2 1 1 1 141 1 * 1232 2321211r ,6.1 34 3 1 2 1 112 Z 31111.0 1 3
13 1 :: .06 1
1 1
.2 s 1 21S .1
. 1 311 1 117 1 2 .16 I 111 1(Ln q)11 3T21
i * .I1
1 7: .26. 1
. 1 1 .3
I2* 1.6
S .36 . 1
.2
i I'
4 9. 122 1 7 1 7 1 1*1*1 1 ? 7 . 7 '1 1 22 1 i
62 .21 1 8 .437 114.596 14 1.7 1.91 .36 . 28 82.5 67 2 s4 t 5 1.84
(Ln g)3 Tat
. 21 S 4 13 1 137. 53 1331, -. 4 1 2 1 21 -1.1 -.11..
11 2 1 1 1 1 2 it **3 11* 1 1 1 21
1. 1 1 1 23 1337.4 . -4 - 3 -2 1 -1 4 -72
-. 2 2 1 . 2 1 .5 .312 1 1 1 I
.12 1 1 1 1 1 1 212 11 1
L.2.. - .42,
.1
.3 12 I .. -. * 1 1
A .1 . - 3 I I 2
.2 11 1 1 1 1 2 2 2 1 11 2122 1
.2 1 1* 1 1.2 * 1 I.1
1 ***. 13 1 1 1 -1. 1 ** 1 " .13 *1 2171 . 11 I 2 1 1 1 1 11 I * 1 11211 1131 1.21 i 7 1 1
I alculated.2 1 1 21 1 32 1 111 i
FIGURE 3-94 RESIDUAL PLOTS OF RENE'41 CYCL 3121 1 C.221 12 1 1 1 .. 1 1 12
.13- 111 Wc.come4312 o1 C 1A S 2 - om v1 11 m
*" - . 1 1 1 2ii1.2. 11 1 1 *1 2 I 11", . 211 11 11 2 2 1 I ° 1 1 11 1 1 21223 1 2 ,,
1 11 2. . 1 - 112 1111 .. 1.. . 1 1,
.1
7 1.''7' 114 . 23' 11 '3,.'4 256?:. ' 6 '3 1 3.734 .. " : -4. , -_-.4 : 1 ' -1 .4 _ - 72
Ln £ calculatedFIGURE 3-94 RESIDUAL PLOTS OF RENE'41 CYCLIC
CREEP EQUATION (3-11)(Continued)3-111
MCDONNELL DOUGLAS ASTRONAUTICS COMPANY. EA sT
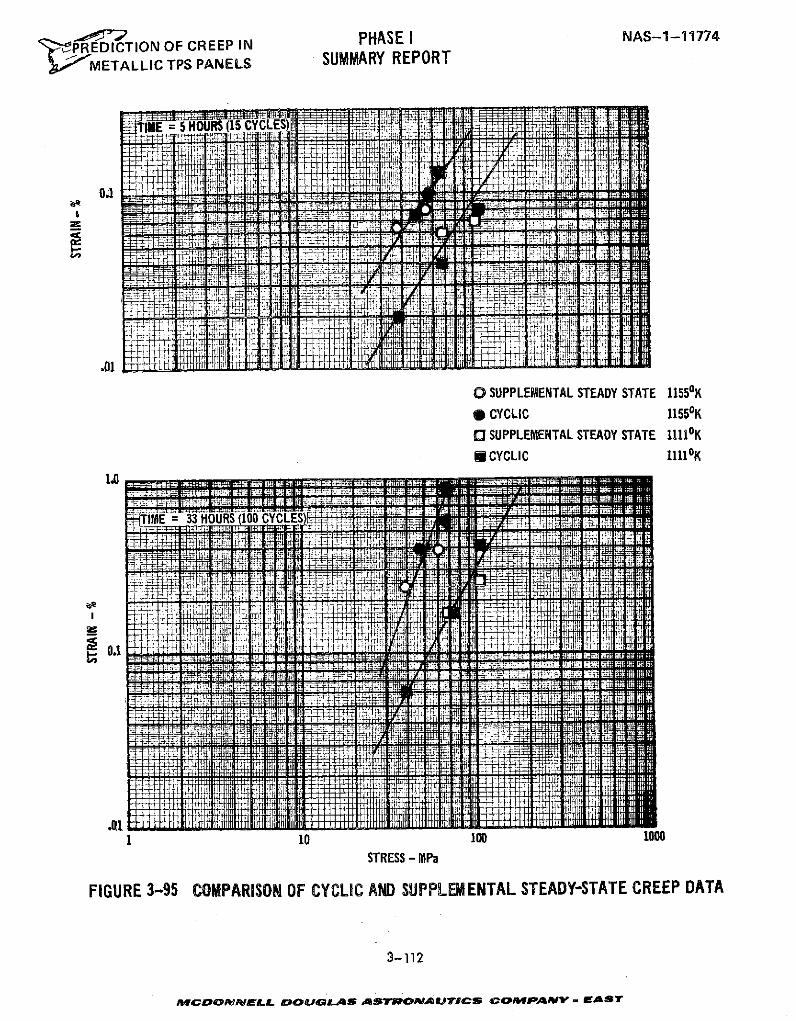
PHASE I NAS-1-11774!"ZtPREDICTION OF CREEP IN
METALLIC TPS PANELS SUMMARY REPORT
0 T.E = 5 KOURS -15 C L
0.01
o SUPPLEMENTAL STEADY STATE 11550K
* CYCLIC 11550K
0 SUPPLEMENTAL STEADY STATE 11ll0K
*CYCLIC 1111 0K
3HOURS CYCYC1.0
1 10 100 100STRESS -MPa
FIGURE 3-95 COMPARISON OF CYCLIC AND SUPPLEMENTAL STEADY-STATE CREEP DATA
3-112
MCDONNELL DOUGLAS AsrRONAUTDICS COMePANY - EAST
'PREDICTION OF CREEP IN PHASE I NAS-1-1,1774;- 'METALLIC TPS PANELS SUMMARY REPORT
3.3.5.2 Microstructure Comparison. The microstructure of the nickel-base Rene' 41
alloy before test is shown in Figure 3-96. Figures 3-97 and 3-98 show the structure
after creep exposure. The as-received material has a typical solution annealed
structure, consisting of stringers of carbides in a gamma solid solution matrix.
After solution treatment and aging, carbide precipitation is evident at the grain
boundaries and a subsurface zone depleted of precipitates has formed. Such zones
are formed because diffusion and oxidation processes deplete the material adjacent
to the surface of the less mobile alloying elements (such as chromium and aluminum).
Figures 3-97 and 3-98 show that pronounced changes have occurred in the micro-
structure of this alloy after creep exposure. Exposure at 1072 0K and 137.9 MPa has
caused coarsening of the grain boundary carbides and an increase in the extent of the
subsurface depletion zone. Exposure at 11550K and 41.4 MPa has a more pronounced
effect, resulting in additional coarsening of precipitates both at the grain bound-
aries and within the grains, in addition to a more extensive subsurface depletion zone.
However, no differences can be observed at this magnification between the cyclic and
steady state microstructures of specimens creep tested at similar temperatures and
stress levels.
3.3.6 RENE' 41 CYCLIC TESTS FOR EVALUATION OF ADDITIONAL VARIABLES
3.3.6.1 Effect of Time Per Cycle. Comparison of Rene' 41 cyclic test No. 8 (speci-
mens R66L, R64L, and R65L) with Rene' 41 cyclic test No. 2 (specimens R37L, R36L, and
R38L) are presented in Figure 3-99 for equal total times at load. Test 8 is a
replicate of test 2 except that the time at load and maximum temperature is 10
minutes instead of the 20 minutes used in test 2. Based on the comparison, it
cannot be concluded that time per cycle has any effect on Rene' 41 creep strains.
3.3.6.2 Effect of Atmospheric Pressure. Cyclic tests 13 and 14 were replicate
idealized trajectory tests except that a simulated atmospheric pressure profile was
3-113
MrfCDONMELL DOUGLAS ASTRONAUTICS COMPANY P . EAST
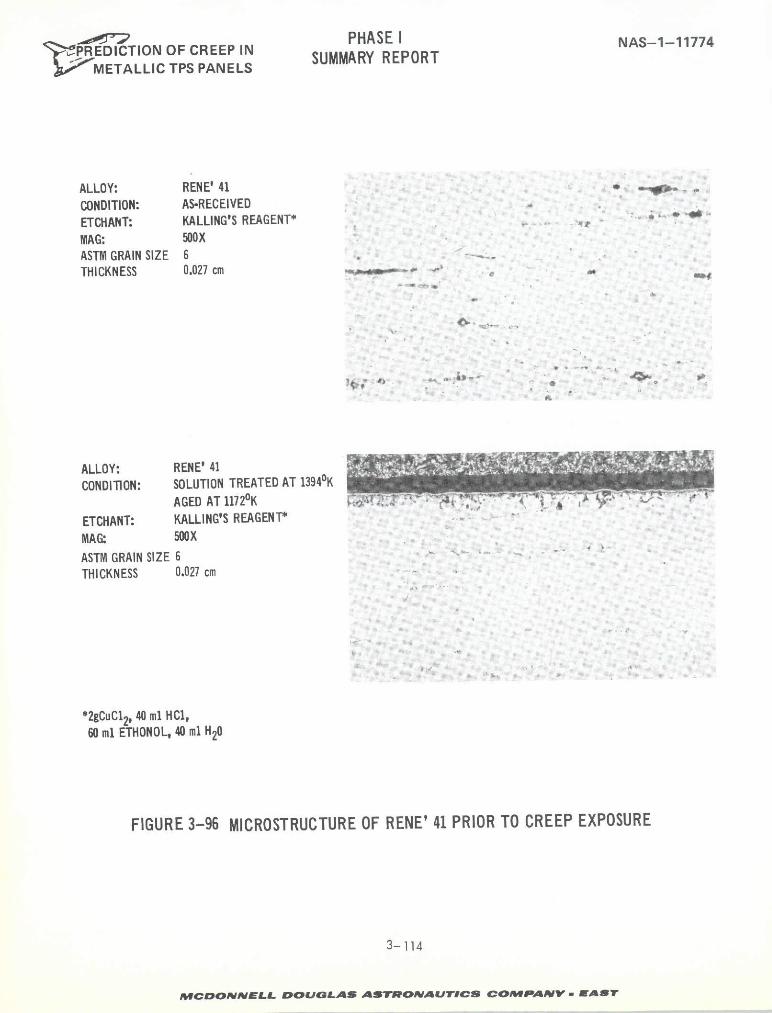
__ PHASE I NAS-1-11774'",PREIDICTION OF CREEP IN SUMMARY REPORT
~a' METALLIC TPS PANELS
ALLOY: RENE' 41 * :.CONDITION: AS-RECEIVEDETCHANT: KALLING'S REAGENT*MAG: 500XASTM GRAIN SIZE 6THICKNESS 0.027 cm
ALLOY: RENE' 41
CONDITION: SOLUTION TREATED AT 1394 0KAGED AT 11720K e4
ETCHANT: KALLING'S REAGENT*
MAG: 500X
ASTM GRAIN SIZE 6 -
THICKNESS 0.027 cm
*2gCuC1 2, 40 ml HC1,60 ml ETHONOL, 40 ml H20
FIGURE 3-96 MICROSTRUCTURE OF RENE' 41 PRIOR TO CREEP EXPOSURE
3-114
MCDaONNELL DOUGLAS ASTRONAUTICS COMPwANIYV- EAST
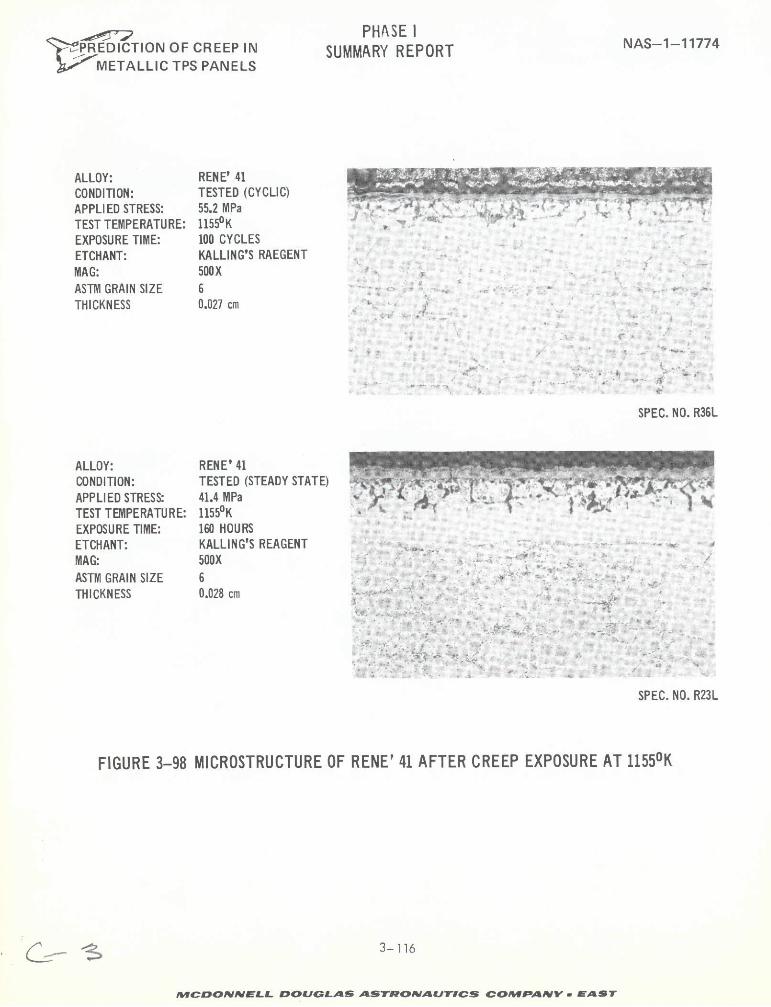
PHASE I-- PREDICTION OF CREEP IN SUMMARY REPORT NAS-1-11774
METALLIC TPS PANELS
ALLOY: RENE' 41CONDITION: TESTED (CYCLIC)APPLIED STRESS: 55.2 MPaTEST TEMPERATURE: 11550K ,EXPOSURE TIME: 100 CYCLESETCHANT: KALLING'S RAEGENTMAG: 500XASTM GRAIN SIZE 6THICKNESS 0.027 cm
SPEC. NO. R36L
ALLOY: RENE'41CONDITION: TESTED (STEADY STATE) jAPPLIED STRESS: 41.4 MPa ,4 kTEST TEMPERATURE: 11550KEXPOSURE TIME: 160 HOURSETCHANT: KALLING'S REAGENTMAG: 500XASTM GRAIN SIZE 6THICKNESS 0.028 cm
SPEC. NO. R23L
FIGURE 3-98 MICROSTRUCTURE OF RENE' 41 AFTER CREEP EXPOSURE AT 11550K
3-116
M&CDONNELL DOUGLAS ASTRONAUTICS COMPIANY- ,A ST
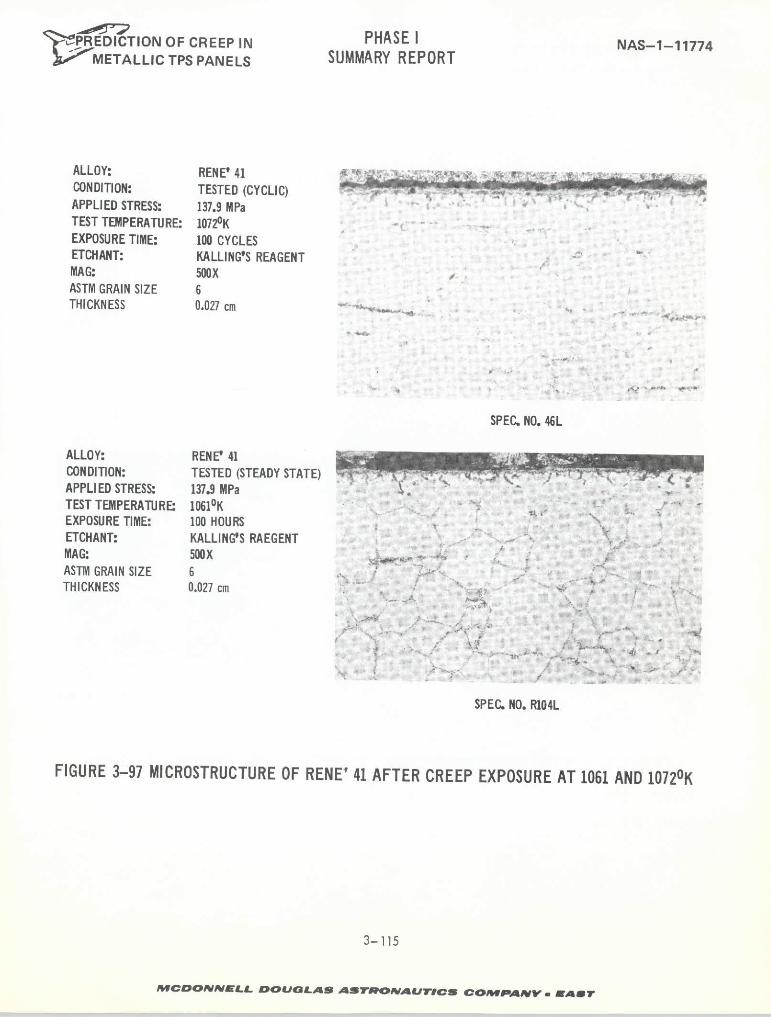
S'PREDICTION OF CREEP IN PHASE I NAS-1-11774~ METALLIC TPS PANELS SUMMARY REPORT
ALLOY: RENE' 41CONDITION: TESTED (CYCLIC)APPLIED STRESS: 137.9 MPaTEST TEMPERATURE: 1072 0KEXPOSURE TIME: 100 CYCLESETCHANT: KALLING'S REAGENTMAG: 500XASTM GRAIN SIZE 6THICKNESS 0.027 cm
SPEC. NO. 46L
ALLOY: RENE' 41CONDITION: TESTED (STEADY STATE)APPLIED STRESS: 137.9 MPaTESTTEMPERATURE- 1061 0KEXPOSURE TIME: 100 HOURSETCHANT: KALLINGS RAEGENTMAG: 500XASTM GRAIN SIZE 6THICKNESS 0.027 cm
SPEC. NO. RIO4L
FIGURE 3-97 MICROSTRUCTURE OF RENE' 41 AFTER CREEP EXPOSURE AT 1061 AND 10720K
3-115
MCDONNELL DOUGLAS ASTROMAUTICS COMPAINV . SAST
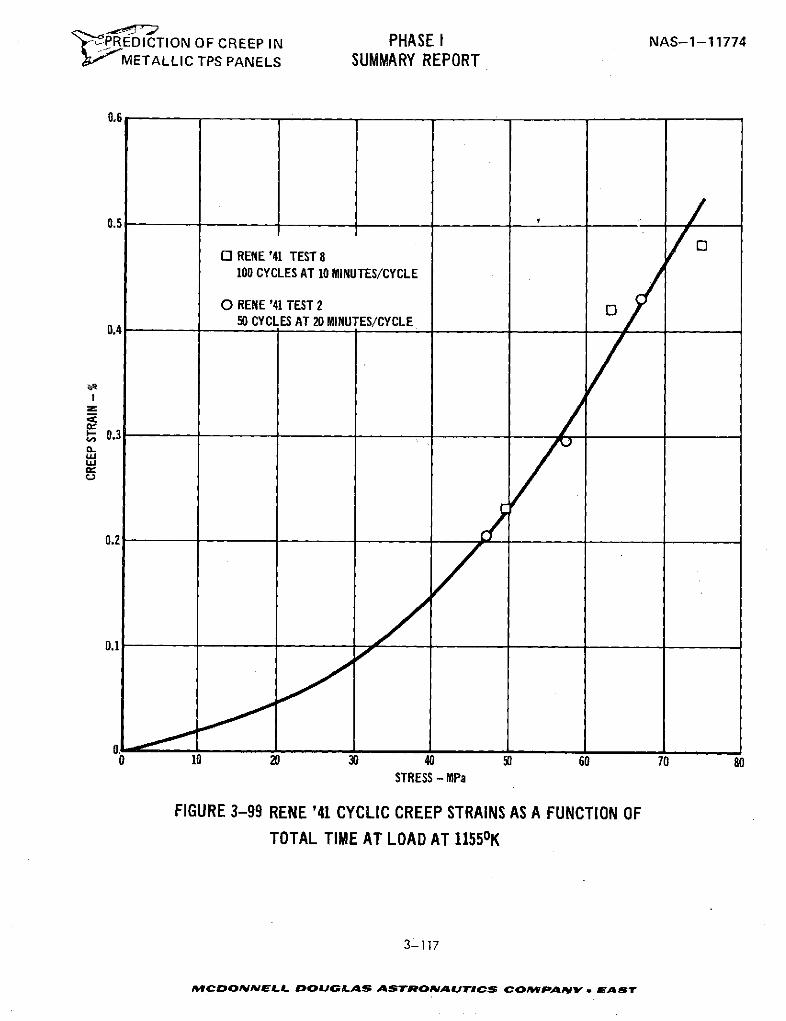
'jPR.EDICTION OF CREEP IN PHASE I NAS-1-117742;, METALLIC TPS PANELS SUMMARY REPORT
0.5
O RENE '41 TEST 8100 CYCLES AT 10 MINUTES/CYCLE
O RENE '41 TEST 2 "0.4 50 CYCLES AT 20 MINUTES/CYCLE
0.3
0.2
0.1
0 Ia 2D 30 40 50 60 70 80STRESS - MPa
FIGURE 3-99 RENE '41 CYCLIC CREEP STRAINS AS A FUNCTION OFTOTAL TIME AT LOAD AT 1155 0K
3-117
MCDONNELL DOUGLAS ASTRONAUTICS COMWPANV . EAST
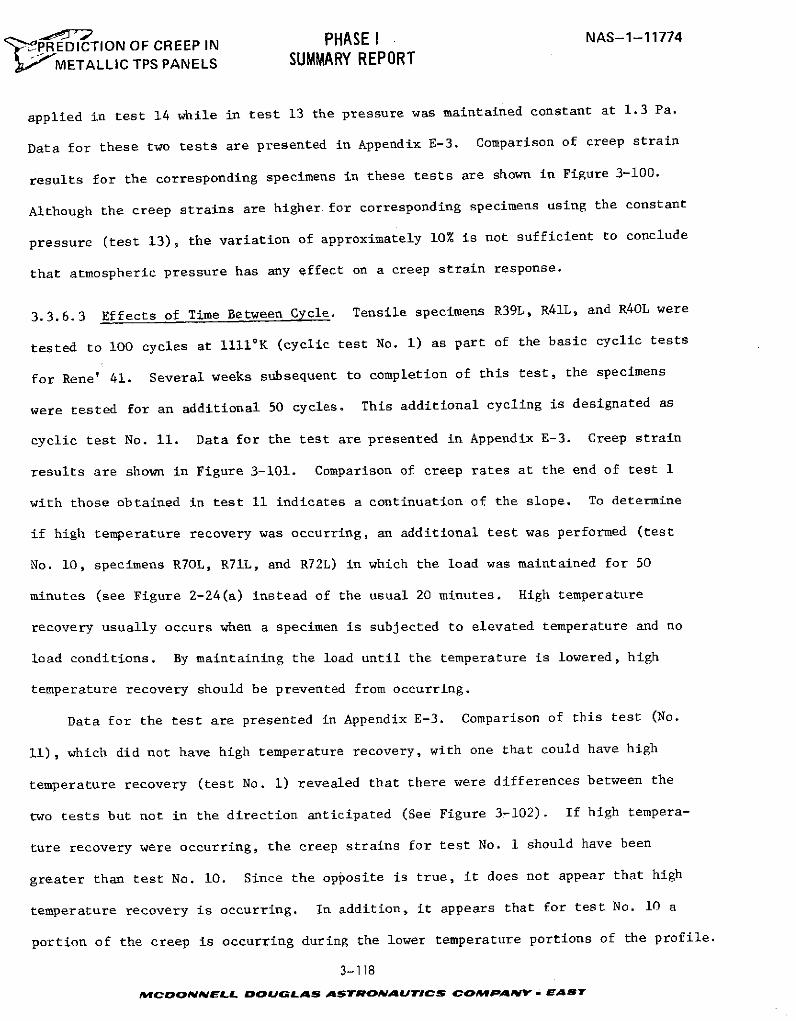
' PREDICTION OF CREEP IN PHASE I NAS-1-11774
- METALLIC TPS PANELS SUMMARY REPORT
applied in test 14 while in test 13 the pressure was maintained constant at 1.3 Pa.
Data for these two tests are presented in Appendix E-3. Comparison of creep strain
results for the corresponding specimens in these tests are shown in Figure 3-100.
Although the creep strains are higher for corresponding specimens using the constant
pressure (test 13), the variation of approximately 10% is not sufficient to conclude
that atmospheric pressure has any effect on a creep strain response.
3.3.6.3 Effects of Time Between Cycle. Tensile specimens R39L, R41L, and R4OL were
tested to 100 cycles at 1111K (cyclic test No. 1) as part of the basic cyclic tests
for Rene' 41. Several weeks subsequent to completion of this test, the specimens
were tested for an additional 50 cycles. This additional cycling is designated as
cyclic test No. 11. Data for the test are presented in Appendix E-3. Creep strain
results are shown in Figure 3-101. Comparison of creep rates at the end of test I
with those obtained in test 11 indicates a continuation of the slope. To determine
if high temperature recovery was occurring, an additional test was performed (test
No. 10, specimens R70L, R71L, and R72L) in which the load was maintained for 50
minutes (see Figure 2-24(a) instead of the usual 20 minutes. High temperature
recovery usually occurs when a specimen is subjected to elevated temperature and no
load conditions. By maintaining the load until the temperature is lowered, high
temperature recovery should be prevented from occurring.
Data for the test are presented in Appendix E-3. Comparison of this test (No.
11), which did not have high temperature recovery, with one that could have high
temperature recovery (test No. 1) revealed that there were differences between the
two tests but not in the direction anticipated (See Figure 3-102). If high tempera-
ture recovery were occurring, the creep strains for test No. 1 should have been
greater than test No. 10. Since the opposite is true, it does not appear that high
temperature recovery is occurring. In addition, it appears that for test No. 10 a
portion of the creep is occurring during the lower temperature portions of the profile.
3-118
MCOONNELL DOUGLAS ASTRONAUTICS COMPANY EAST
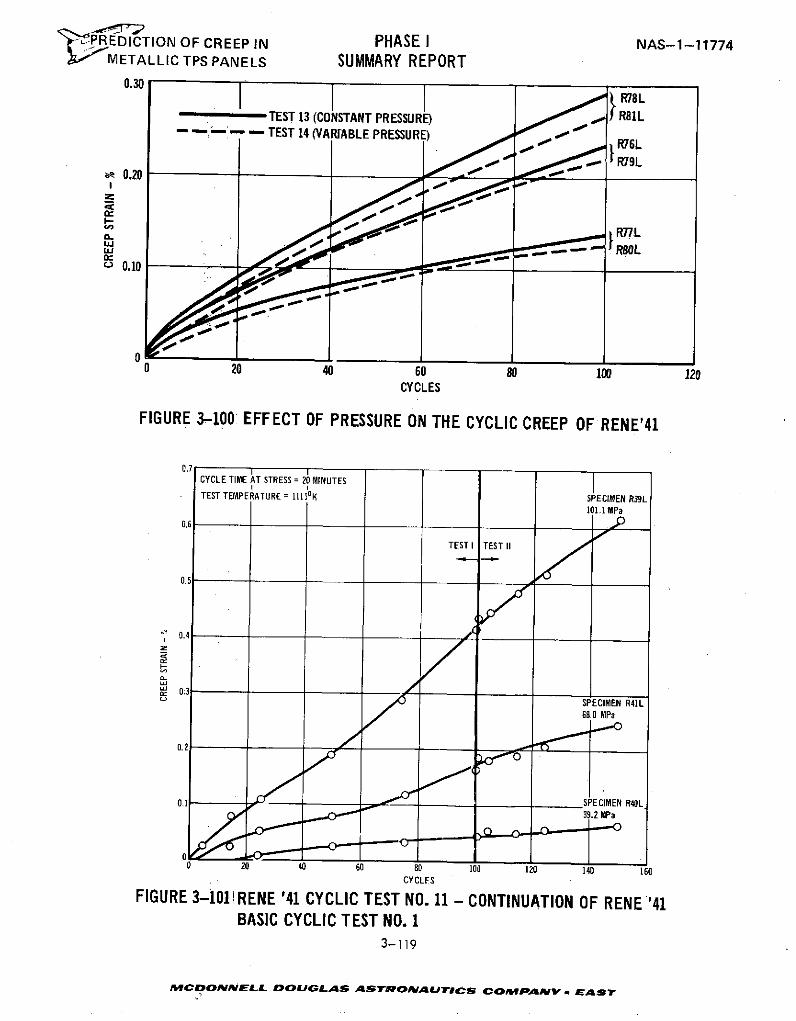
'-PREDICTION OF CREEP IN PHASE I NAS-1-11774LN IMETALLIC TPS PANELS SUMMARY REPORT
0.30
- - -' - TEST 14 (VARIABLE PRESSUR E)R76L
0 I
R79L0.20
0 20 4 60 0 0 ; 000 10 1
CYCLE TIME AT STRESS = 20 MINUTES
TEST TEMPERATURE = 11110K SPECIMEN R39L
lo1l MPa0.6 oo Jo
TEST I TEST II
0.4
o SPECIMEN R41L68 0 MPa
0.21
. SP ECIMEN R40L..---- 39.2 MPa
20 40 60 80 100 120 140 160CYCLES
FIGURE 3-1011RENE '41 CYCLIC TEST NO. 11 - CONTINUATION OF RENE '41BASIC CYCLIC TEST NO. 1
3-119
MCONNELL DOUGLAS ASTRONAUTICS COMPANY . EAS
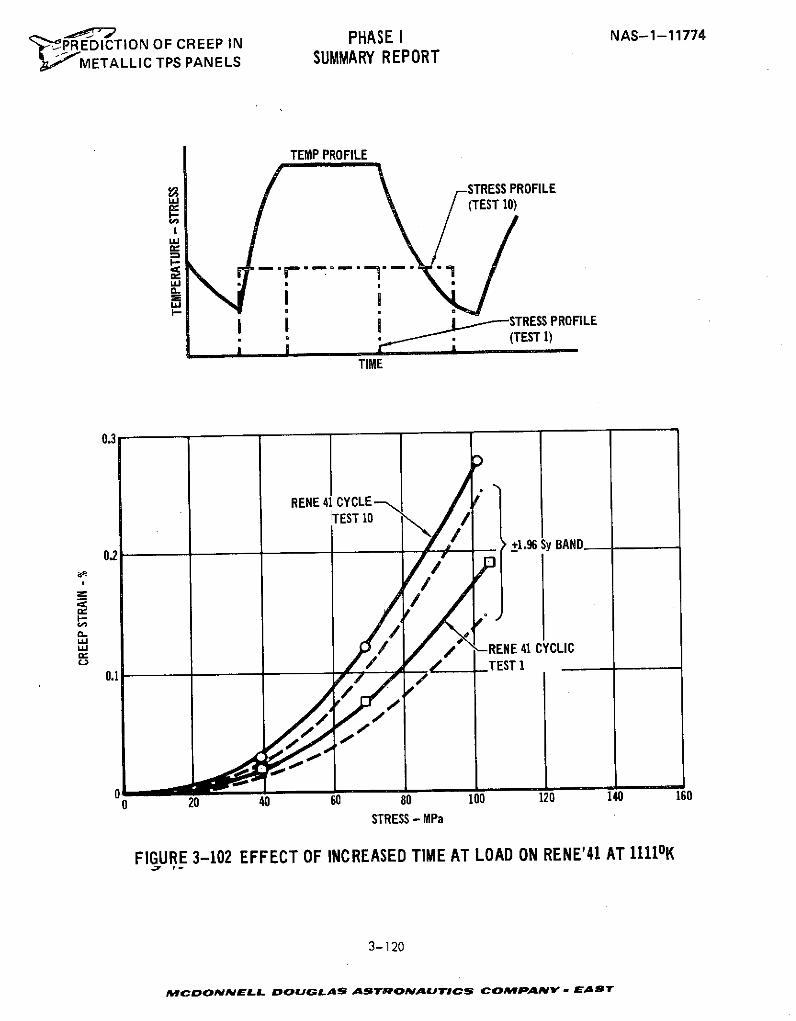
'-,PREDICTION OF CREEP IN PHASE I NAS-1-11774
METALLIC TPS PANELS SUMMARY REPORT
TEMP PROFILE
STRESS PROFILE(TEST 10)
"-
I. STRESS PROFILE
(TEST 1)
TIME
0.3
RENE 41 CYCLETEST 10 /
0.2> +1.96 Sy BAND
"/ -RENE 41 CYCLIC
0. / TEST 10.1 '
0 20 40 60 80 100 120 140 160
STRESS - MPa
FIGURE 3-102 EFFECT OF INCREASED TIME AT LOAD ON RENE'41 AT 1111oK
3-120
MCDONNELL DOUGLAS ASTRONAUTICS COMPANV EAST
-PREDICTION OF CREEP IN PHASE I NAS-1-11774METALLIC TPS PANELS SUMMARY REPORT
3.3.7 STEPPED STRESS CYCLIC TESTS
Three cyclic tests were conducted where stress was maintained constant within
each cycle but was varied as a function of cycle in order to allow an assessment of
the materials hardening behavior. ,Data for these tests (Rene'':41 tests 5, 6, and 7 are
presented in Appendix E-3.
In the first of these tests, Rene' 41 cyclic test 5 (specimens R51L, R47L, and
R48L) stress was increased at cycle 16 through 50 and then decreased to the original
level for the remaining 50 cycles as shown in Figure 3-103. Also shown in the figure
are comparison of test results with predictions based on the time hardening theory
of strain accumulation in conjunction with the cyclic creep equation (Equation 3-17).
Predictions based on strain hardening (not shown) were up to 77% higher than those
based on time hardening.
Increasing and decreasing stress history tests were also conducted on Rene' 41
tensile specimens. These were Rene' 41 cyclic test No. 6 (specimen R60L, R58L, and
R59L) and Rene' 41 cyclic test No. 7 (specimens R63L, R61L, and R62L) respectively.
Both tests were conducted at 1111K (15400 F). Data for these tests are presented
in Appendix E-3.
Comparisons of test creep strain results with predictions based on time hardening
creep accumulation theories in conjunction with Equation (3-17) are shown in Figures
3-104 and 3-105. Predictions based on the strain hardening theory of creep accumula-
tion were found to be approximately the same as for time hardening in predicting
strains for test 6 (increasing stress). For test No. 7 however, strain hardening
predictions were found to be up to 77% higher than the time hardening predictions
which were already up to 30% higher than test values. Data comparisons show little
creep strain difference between the increasing vs decreasing step stress tests at
100 missions.
3-121
MCDONNELL DOUGLAS ASTRONAUTICS COMPANY . EAST
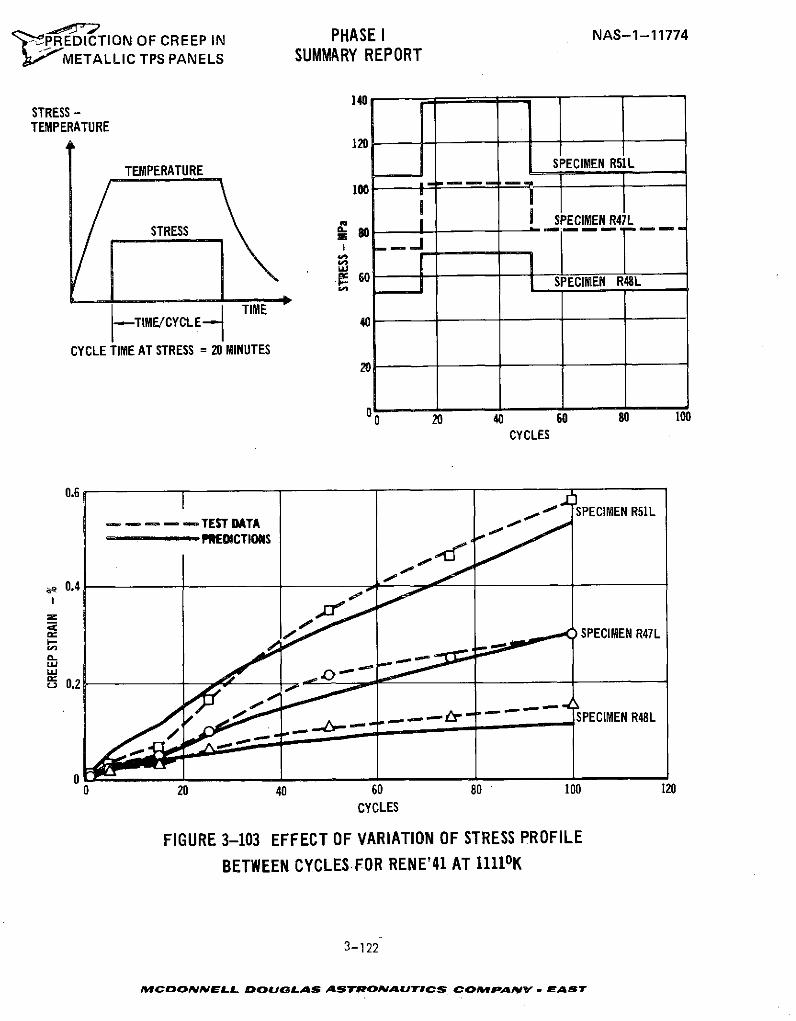
-'PREDICTION OF CREEP IN PHASE I NAS-1-11774
;' METALLIC TPS PANELS SUMMARY REPORT
140STRESS -TEMPERATURE
120
TEMPERATURE SPECIMEN R51L
100
SPECIMEN R47LSTRESS 80 . . .
[ S - -
a 60 SPECIMEN R48L
-TIME/CYCLE 40
CYCLE TIME AT STRESS = 20 MINUTES20
0 20 40 60 80 100CYCLES
0.6
. - - - - TEST DATA SPECIMEN R51L-- - PREDICTIONS
0.4
cSPECIMEN R47L
In
0 .2
/ ,- -... --0 SPECIMEN R48L
00 20 40 60 80 ' 100 120
CYCLES
FIGURE 3-103 EFFECT OF VARIATION OF STRESS PROFILE
BETWEEN CYCLES FOR RENE'41 AT 11110K
3-122
MCDONNELL DOUGLAS ASTRONAUTICS COMPANY - EAST
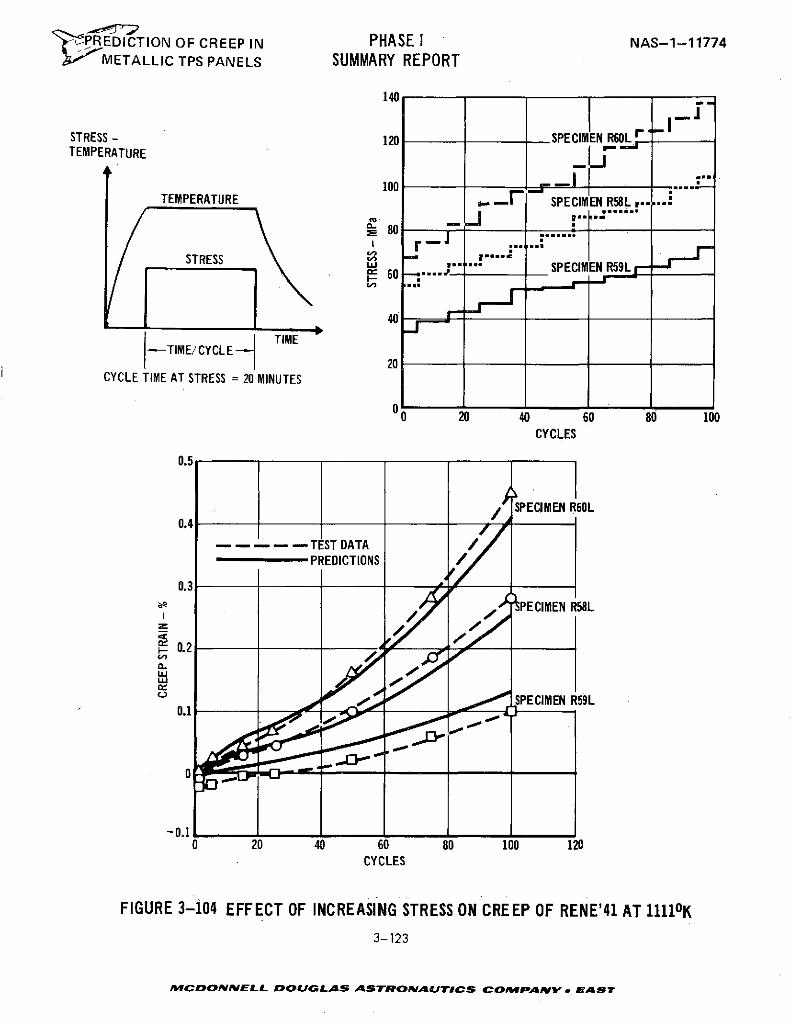
'PPREDICTION OF CREEP IN PHASE I NAS-1-11774METALLIC TPS PANELS SUMMARY REPORT
140
STRESS - 120 -SPECIMEN R60Lr
TEMPERATURE
100TEMPERATURE - SPECIMEN R58L ,.....
80 ..... .
Ew SPECIMEN R59L -F 60 .....-
TI _I TIME
-TIME/CYCLE TIME
CYCLE TIME AT STRESS = 20 MINUTES
0 20 40 60 80 100CYCLES
0.5
0./ SPECIMEN R60L0.4 -
- ---- -TEST DATAPREDICTIONS
0.3
PECIMEN R58L
0.2
w
SPECIMEN R59L
0.1 .0
-0.10 20 40 60 80 100 120
CYCLES
FIGURE 3-104 EFFECT OF INCREASING STRESS ON CREEP OF RENE'41 AT 11110K3-123
MCDONNELL DOUGLAS ASTRONAUTICS COMPANY EAST
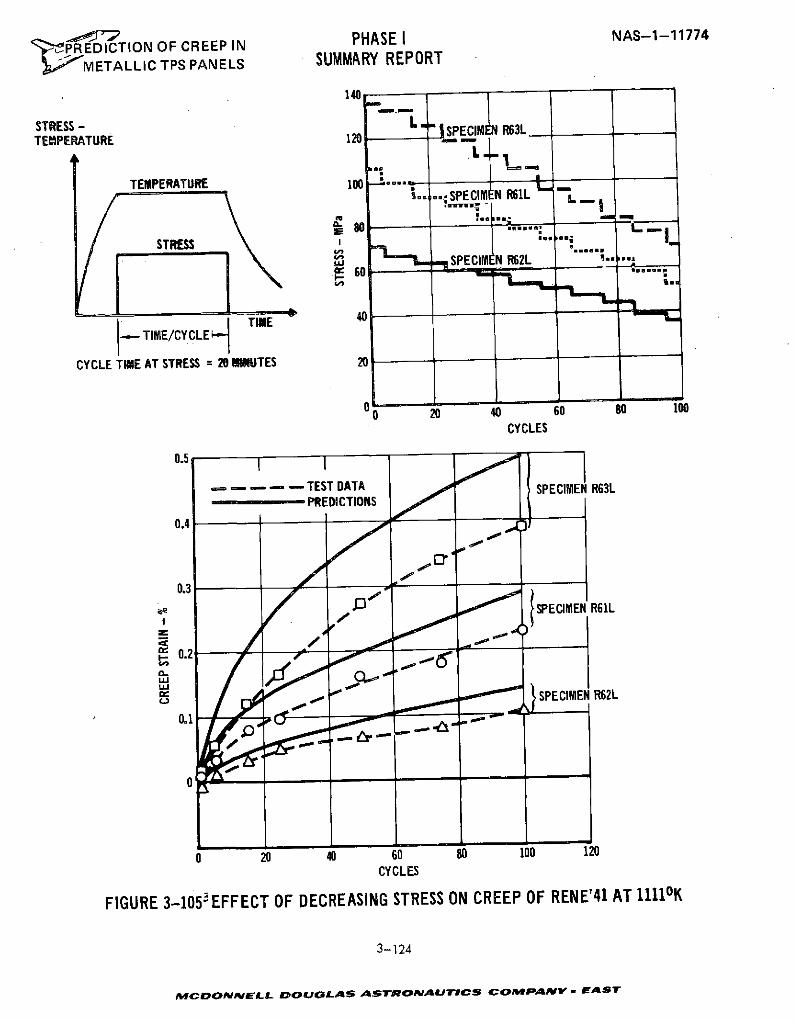
' PREDICTION OF CREEP IN PHASE NAS-1-11774
METALLIC TPS PANELS SUMMARY REPORT
140
STRESS- ENTEMPERATURE 120SPECIMEN R63L
TEMPERATURE 100.... SPECIM N R61L L
T0U So .... D, -
STRESS I
SI ..SPECIM N R62L " .60 *.
TMETIME/CYCLE
CYCLE TIME AT STRESS = 20 INUTES 20
0 20 40 60 80 100
CYCLES
0.5
- - - - TEST DATA SPECIMEN R63L0.4 - PREDICTIONS
0.4 -
0.3 -a
OF , SPECIMEN R61L
0.2
00 SPECIMEN R62L
0.1 "D'
0 20 40 60 80 100 120CYCLES
FIGURE 3-105 " EFFECT OF DECREASING STRESS ON CREEP OF RENE'41 AT 1111 0K
3-124
MCDONNELL DOUaGLAS ASTRONAUTICS COMPANY - EAST
>'jPREDICTION OF CREEP IN PHASE I NAS-1-11774METALLIC TPS PANELS SUMMARY REPORT
3.3.8 TRAJECTORY TESTS
Five cyclic trajectory tests were conducted using Rene'41 tensile specimens.
Data for these tests, Rene' 41 cyclic tests 9, 12, 13, 14, and 15 are presented in
Appendix E-3. These tests are a two-step stress trajectory profile with constant
maximum temperature of 1111 0 K (1540*F) and constant pressure (test 9), an idealized
trajectory test with a two-step temperature profile at 1155 0K and 1111K (test 12),
two idealized trajectory tests (test 13 and 14) with a maximum temperature of 1111*K
(comparison of test 13 and 14 on the basis of atmospheric pressure variation is
presented in Section 3.3.6.2), and a simulated mission test (test 15) using represen-
tative Shuttle stress, temperature, and pressure profiles.
Comparison of creep strain results for tests 9, 12, 13, and 15, based on the
time hardening theory of creep accumulation, are shown in Figures 3-106 through 3-109
respectively. Although the time hardening theory yielded the best predictions for
this series of tests,.all strain predictions are significantly lower than test
results in the idealized and simulated mission tests where high stresses are main-
tained beyond the peak temperature portion of the profile. This behavior is the
same as noted in comparing results of test 1 and 10 in Section 3.3.6.3.
The temperature and stress steps that were used to perform the trajectory
analysis are presented in Appendix (E-3-25). In this analyses 10 steps of 200
seconds each were used starting with the data measured at 400 seconds into the
trajectory.
3.3.9 Rene' 41 CONCLUSIONS
Rene' 41 tensile specimens were tested at stead-state conditions over thetemperature range of 964 0K (12750F) to 11800K (16650F) over approximately 200
hours or creep strains of up to approximately .5% @ 50 hours. The following
empirical regression equation was developed for these data:
In e = -35.21304 +26.34069 T +.55687 In t +.02807 (ln a)3 (3-15)
3-125
MCDONNELL DOUGLAS ASTRONAUTICS COMPANy . EAST
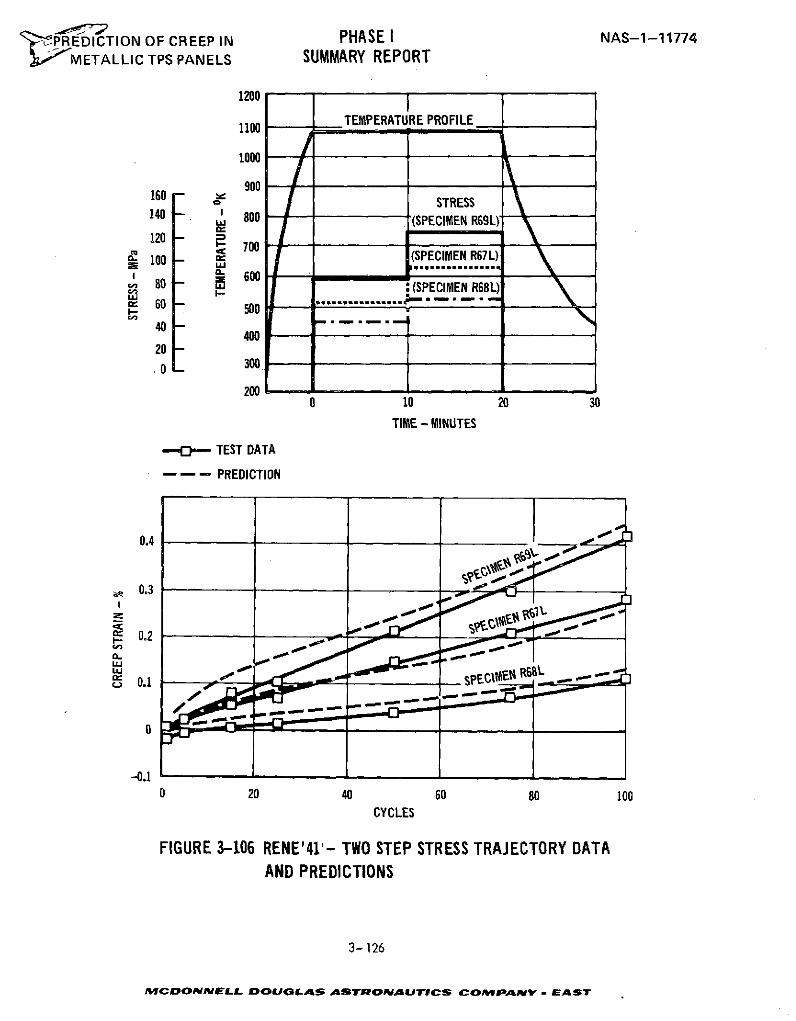
'--PREDICTION OF CREEP IN PHASE I NAS-1-11774METALLIC TPS PANELS SUMMARY REPORT
1200
1100 . TEMPERATURE PROFILE
1000
900160 9160 - STRESS140 800 (SPECIMEN R69L)
120 -700
S1007 (SPECIMEN R67L)C 600 t
6 80 (SPECIMEN R68L)i 0 ................ -* -
6 0 i500
40020
S300
2000 10 20 30
TIME - MINUTES
-O- TEST DATA
-- - PREDICTION
0.4
0.3
0.1 - - -ECjtNrc%
-0.10 20 40 60 80 100
CYCLES
FIGURE 3-106 RENE'41'- TWO STEP STRESS TRAJECTORY DATAAND PREDICTIONS
3-126
MCDONNELL DOUGLAS ASTRONAUTIrCS COMPANmY EAST
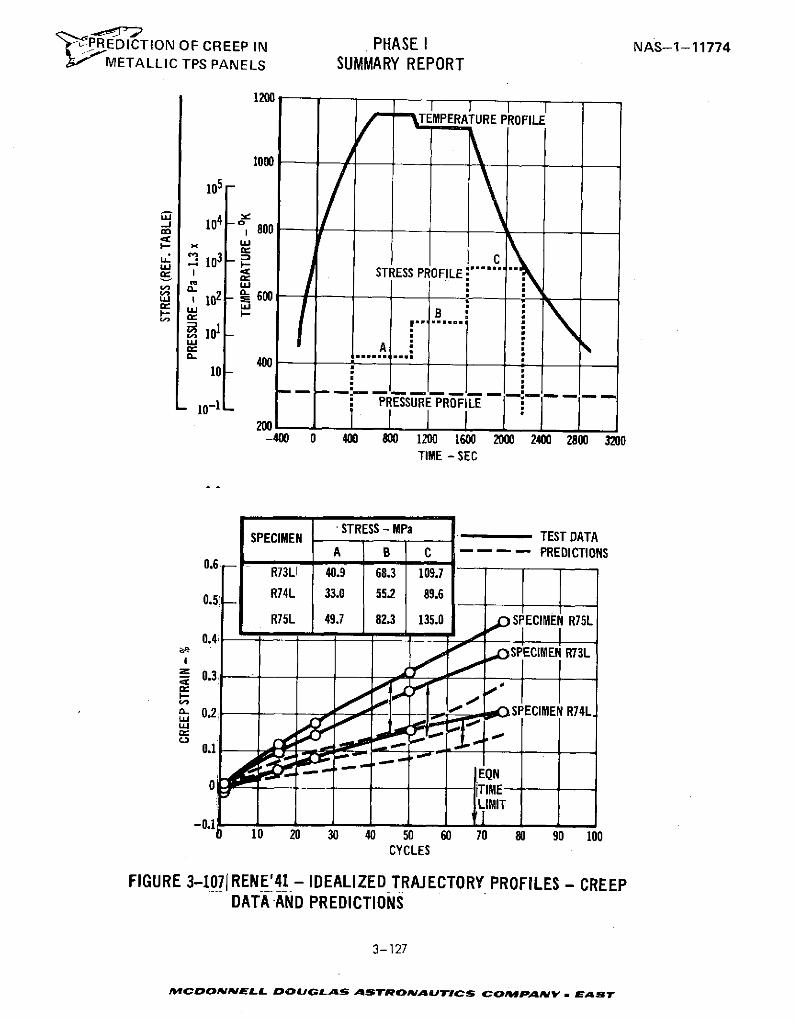
"' PREDICTION OF CREEP IN PHASE I NAS-1-11774V METALLIC TPS PANELS SUMMARY REPORT
1200
TEMPERATURE PROFILE
1000 --
105 -
104 800
S 103 I- Cr1 STRESS PROFILE
0 -102 - 600 WVol B
10 40 -
o A
06
10 200
-400 0 400 800 1200 1600 200 2400 2800 3200TIME -SEC
SPECIMEN STRESS - MPa TEST DATAA B C -- PREDICTIONS
R73LI 40.9 68.3 109.7
0.5 iR75L 49.7 82.3 135.0 SPECIMEN R75L
" 0 ISPECIMEN R73L
I-l
; 0.3
0 0.2 SPECIMEN R74L
C.,
EQN01 TIME--
LIMIT
-0.110 20 30 40 50 60 70 80 90 100
CYCLES
FIGURE 3-!071RENE'41 - IDEALIZED TRAJECTORY PROFILES - CREEPDATA AND PREDICTIONS
3-127
MICDONNELL DOUGLAS ASTROMALUTICS COMPA*NY. EAST
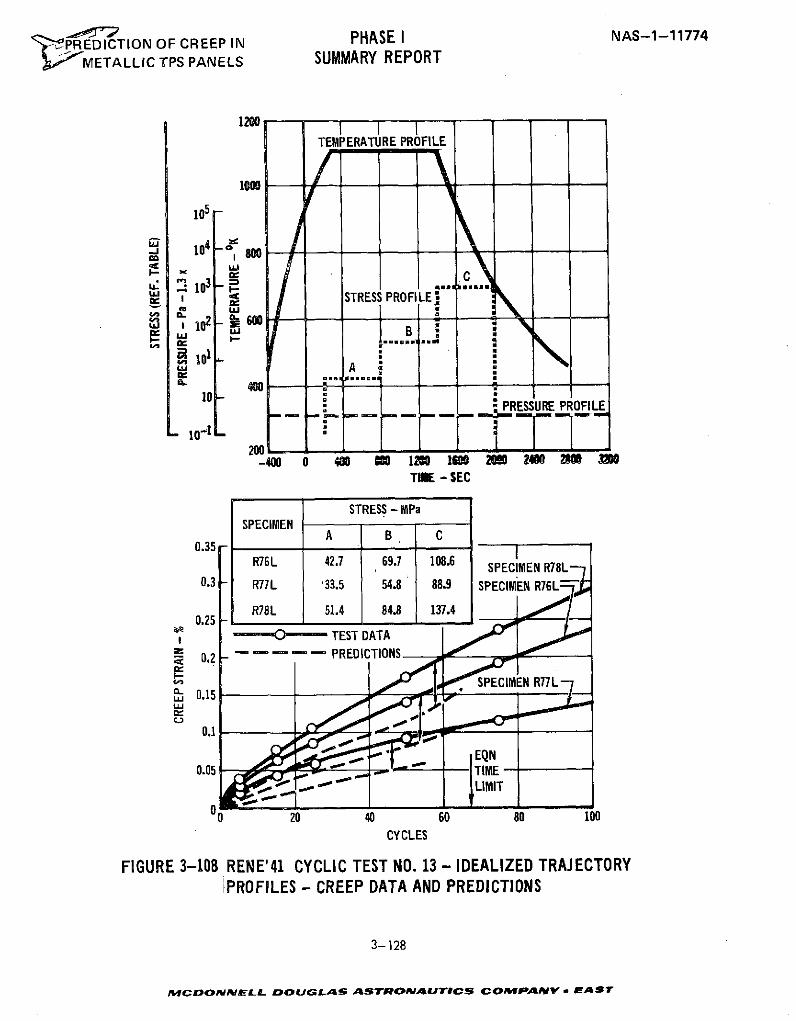
OF CREEP IN PHASE I NAS-1-11774$PREDICTION OF CREEP
IN
METALLIC TPS PANELS SUMMARY REPORT
1200 -TEMPERATURE PROFILE/ - -
1000
105 -
104 -80-
STRESS PROFILE
n102 n B n
w I a
Saa " _... ...i B:
lo _f 1 i i PRESSU PROFLE
101 A200
-400 0 0 O 80 120 l00 200 200280 200TIME - SEC
STRESS - MPaSPECIMEN
A B C0.35 - - - I
R76L 42.7 69.7 108.6 SSPECIMEN R78L0.3 - R77L '33.5 54.8 88.9 SPECIMEN R76L
0.25 R78L 51.4 84.8 137.4
----*O**- TEST DATA
= 0.2 - PREDICTIONS
" 0.15
0.1
", EQN0.05 ' ,.--+ - TIME
O0 20 40 60 80 100
CYCLES
FIGURE 3-108 RENE'41 CYCLIC TEST NO. 13 - IDEALIZED TRAJECTORYiPROFILES - CREEP DATA AND PREDICTIONS
3-128
MCDONNELL DOULISA ASTRONUTICS COMPIPANY . EAST
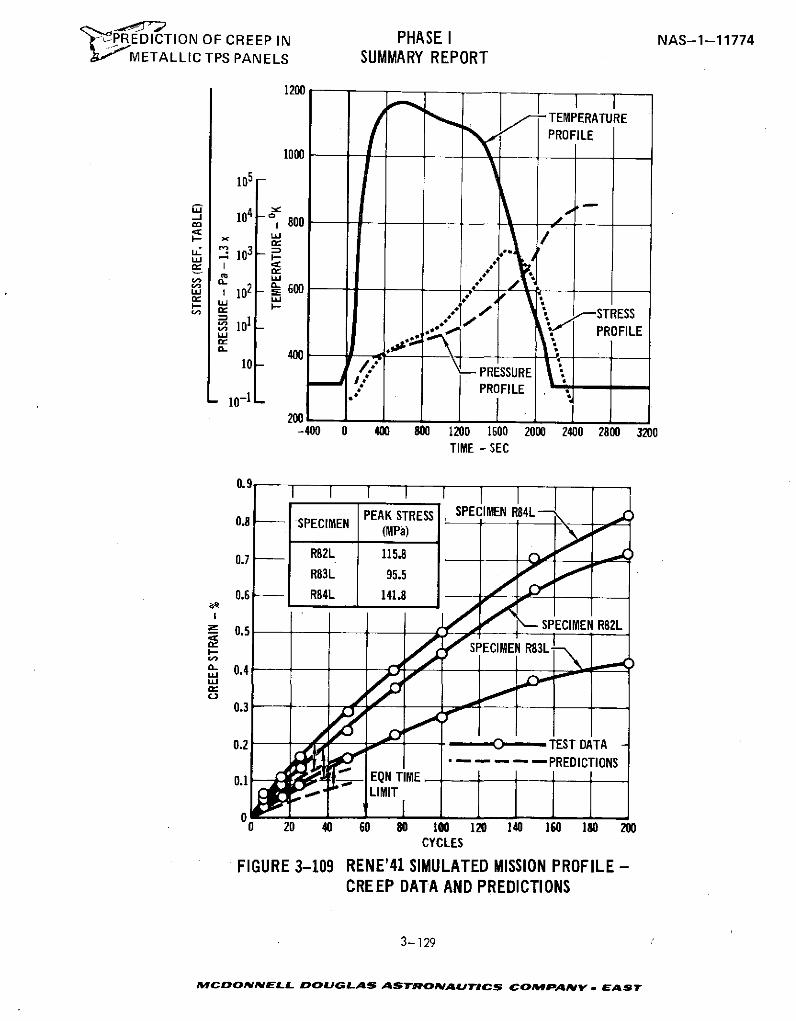
r-P REDICTION OF CREEP IN PHASE I NAS-1-11774g.#"METALLIC TPS PANELS SUMMARY REPORT
1200
TEMPERATURE
PROFILE1000
105
S 104 o
c r 102 - 600I-STRESS
c 101." IPROFILE0 40010 4 PRESSURE
j PROFILE . *10-1
-400 0 400 800 1200 1600 2000 2400 2800 3200TIME - SEC
0.9
PEAK STRESS SPECIMEN R84L0.8- SPECIMEN (MPa)
0.7 R82L 115.8
R83L 95.5
0.6 - R84L 141.8
SSPECIMEN R82L
SPECIMEN R83L
0 0.4
0.3
0.2 00" -0 lTEST DATA
-- - - - -PREDICTIONS0.1 6 EQN TIME- LIMIT
0 20 40 60 80 100 120 140 160 180 200CYCLES
FIGURE 3-109 RENE'41 SIMULATED MISSION PROFILE -CREEP DATA AND PREDICTIONS
3-129
MCDONNELL DOIGLAS ASTRONAIUTICS CO M PANY , EAST
"-'PIREDICTION OF CREEP IN PHASE I NAS-1-11774
r METALLIC TPS PANELS SUMMARY REPORT
An effect of material gage on creep response was noted in both the literature
survey data base and supplemental test results. Thicker gage specimens (.051 cm)
were observed to creep faster than the thin gage (.027 cm) specimens in the supple-
mental tests. No differences in creep response due to material rolling direction
were observed.
The following empirical regression equation was developed for cyclic test
data:
In E = -39.55860 +29.13646 T +.71922 In t -.92125 (ln a -1.931) (3-17)
-.000016 a2 +.08183 (ln a - 1.931) 3 -.000125 taT +.0000105t3
This equation is applicable over the temperature range of 10310K (14000F) to 11550K
(16200F) for times up to 33 hours (100 cycles at 20 mintues per cycle).
Comparison of supplemental steady-state data and cyclic data showed that
no difference existed in these data sets.
No effects on creep strain due to variation of time per cycle (for the same
total time) or atmospheric pressure could be determined. Significant increases
in creep strains were noted in tests where stress was maintained on the specimen
while temperature was being decreased rapidly. This would indicate that creep
can occur at a low temperature for Rene' 41.
Use of strain and time hardening creep accumulation theories in predicting
the complex trajectory test data resulted in low predictions (approximately 40%
below test value). The time hardening theory provided the best predictions.
In predicting results for a simple two step trajectory however, the time hardening
theory yielded good agreement with test data. The variation in prediction
capability between simple and complex trajectories is attributed to the same
phenomena demonstrated in the case where using a simple single stress profile,
stress was maintained into the decreasing temperature portion of the cycle.
3-130
MCDONNELL DOUGLAS STRONAUTICS COMPA NY EAST
" PREDICTION OF CREEP IN PHASE I NAS-1-11774,r METALLIC TPS PANELS SUMMARY REPORT
3.4 TDNiCr - RESULTS OF TESTS AND DATA ANALYSIS
3.4.1 TDNiCr DATA BASE
3.4.1.1 Literature Survey. The TDNiCr steady-state data base is comprised of
1897 data points obtained from the following sources: NASA Marshall (Reference 16),
NASA Lewis (Reference 17), General Electric Company (References 18 and 19), and
McDonnell Douglas Corporation (References 20 and 21).. Data from the above sources
were reviewed and tests with creep strains greater than approximately 0.5% at 100
hours were eliminated. Killpatrick (Reference 30) has found that TDNiCr creep
tests which have creep strains greater than 0.5% at 100 hours are suspect of
improper material condition. The literature data base is presented in Appendix F-1.
3.4.1.2 Data Base Analysis. Several equations of different forms were developed
for the data base. The following equation was selected for use in development of a
test matrix for TDNiCr.
In e = -12.43906 +.01930a +2.80992T -.00022t -.389450 +22.45187p +.35175 Int (3-18)-1.12398 In
where c = creep strain, %
T = temperature, oK/100
o = stress, MPa
= i, longitudinal material directionO, transverse material direction
= gage, cm
t = time, hours
This equation has a standard error of estimate of .6933, based on the logarithm
of strain, and a multiple correlation coefficient of .7750, indicating a larger
degree of scatter in this data than had been present for the other material data
bases obtained for this program. Both material gage and rolling direction are
indicated to be significant, independent variables. The residual plots (in Eactual
-In Ecalculated vs. variable) for this equation are shown in Figure 3-110.
An empirical equation was also derived for a portion of the data base consider-
ed to be most representative of current TDNiCr manufacturing technology.
3-131
MCDONNELL DOUGLAS ASTRONAUTICS COMPANY . EAST
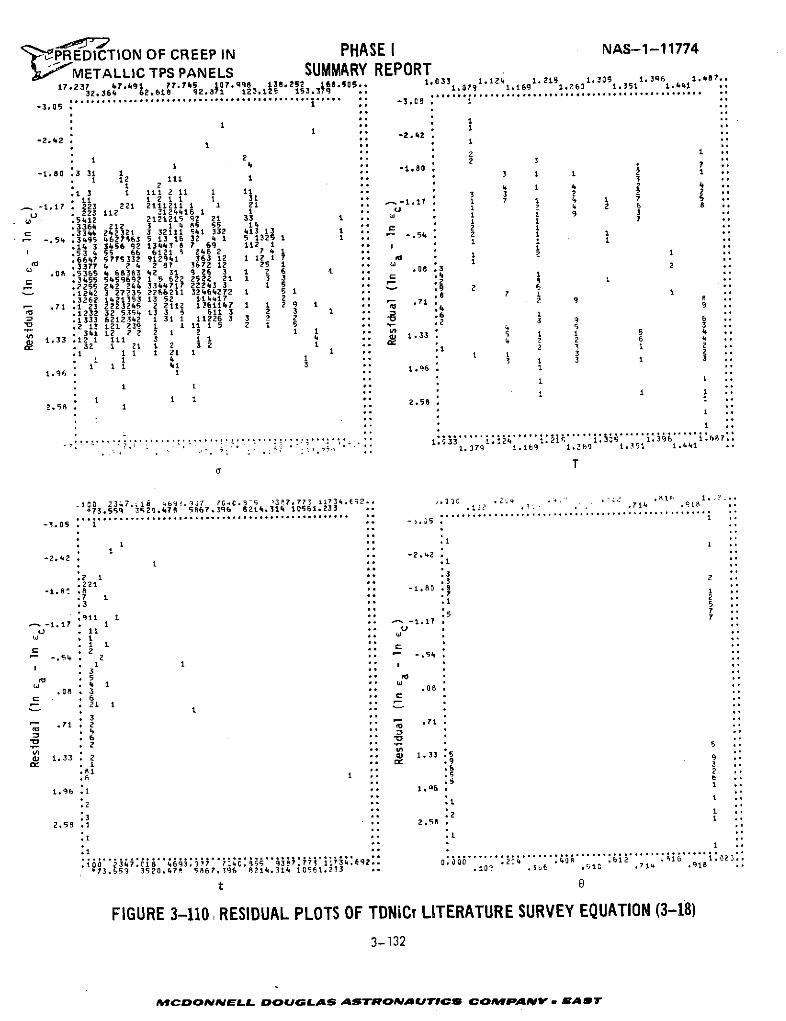
'PREDICTION OF CREEP IN PHASE I NAS-1-11774
METALLIC TPS PANELS SUMMARY REPORT17.237 47.91 77.745 17.qqS 38.252 t68.55o 1.033 1.124 1.215 13 1.21 1.396 1.487.
-3.05 . I
-2.42 1 -2.42
1 2 . 24 2 3
-1.80 .3 31 1 -1.80.1 1 2 111 1 3
1 2 .. .1 11 2 1 4 1 4 2 4
.I1 2 i211 1 31 t : 3 3 2 2 2"111 L 2 1 1 1 31 * .
-1.17 * 223 221 2111211 1 1 21 -117 1 7 4 12 6
U . 223 112 3124416 1 1 u 4 2 6 8 *
Q .5412 2121215 92 21 33 1 . 1 1 9 37.3364 212 1 1 4 R5 55 14 C 1 7
S 3344 242321 3 32111 E541 332 413 13 1 .
-. 54 .3495 462763 5 13 16 32 4 1 5 1325 1 -. 4 1 1
.14 3 3456 92 13443 8 7 69 112 1 * 1 1.53 4 55 66 6121 9 246 2 7 4 1 1.6647 5775332 912941 363 12 1 12 1 7 .1 2
'w .3377 4 2 4 2 87 3672 12 25 1 W. 1 2
S.08 .5365 4 66383 42 31 9 26 3 1 2 6 .. .08 3 2S .345 5459692 1 5 622 2522 21 1 3 3 4 C 1
.2255 242 244 3344717 22243 3 1 5 * :1 2 6.1242 3 27235 2266211 32464272 1 5 1 7 1 ...3262 1421153 13 52 114417 2 * . 8 7
- .71 .1 23 2223245 2 2112 1361147 1 1 2 9 1 * m 71 , 9 *.1232 32 5354 13 3 5 611 3 2 3 1 * .4 1.1333 6212342 1 31 1 11226 33 ? 2 .6 1 6.2 13 121 239 1 1 it 1 5 2 1 5 .2 4 3 3 .
" . 341 12 2 2 1 2 1 1 1.33 532 1 1 12 3 2 1 1 2
S1 21 1 1 3 21 1 1 3 1 3
1 1 1 41 3 1.961.96 1 1.96
1 1 .1.
1 11 ,1 ,
2.58 . 1 2.51 °,
7. 7 7 ...
.. ,. , , 1.379 1.169 1.260 1.351 1. 1 *
a T
.10C 2347.i6 461.q37 7G+C.- 5 37773 11734.692. ,1 .3 jc .
3. . 12 . 1.
.73.55q 3520.47 5967.396 8214.314 10561.233 .. . .71 .91................. ... - .5 ........... .
-3.05 . i
.1
-2.42 -2.42
.2 1 .. .3 2
.221 . .3-1.8T .8 -1.80
.7 1 2 .
.3 .1 515 7
9-1.17 1 1 : 5. 7
u 11 ... 2
-. -. 5
. 1C . 2 *.
4 1
.08 3 •" .06
81 2 e-.-
.6 1 *21
3- .71 2 . 71
).. *
771.33 2 .1 1.33 .5 9
.1 1 " 9 3 ..
2 5.6
.2 .
2.56 .1 2.
.1 .. .1:1 .:
' :.1" k "" ........ ...... .......................... . ...... .............. '...
.100 2347.C18 4693.177 7:41C.55 9387.771 11734.692.. 0.a00 .24 .40R .61? .911 1.27..S73.551 3520.470 5867. 196 8214.31 106S1.233 .. .101 .3u6 .1 .714 .918
t 0
FIGURE 3-110 RESIDUAL PLOTS OF TDNiCr LITERATURE SURVEY EQUATION (3-18)
3-132
MCDONNELL DOUGLAS ASTRONAUTICS COMPANY * EAST
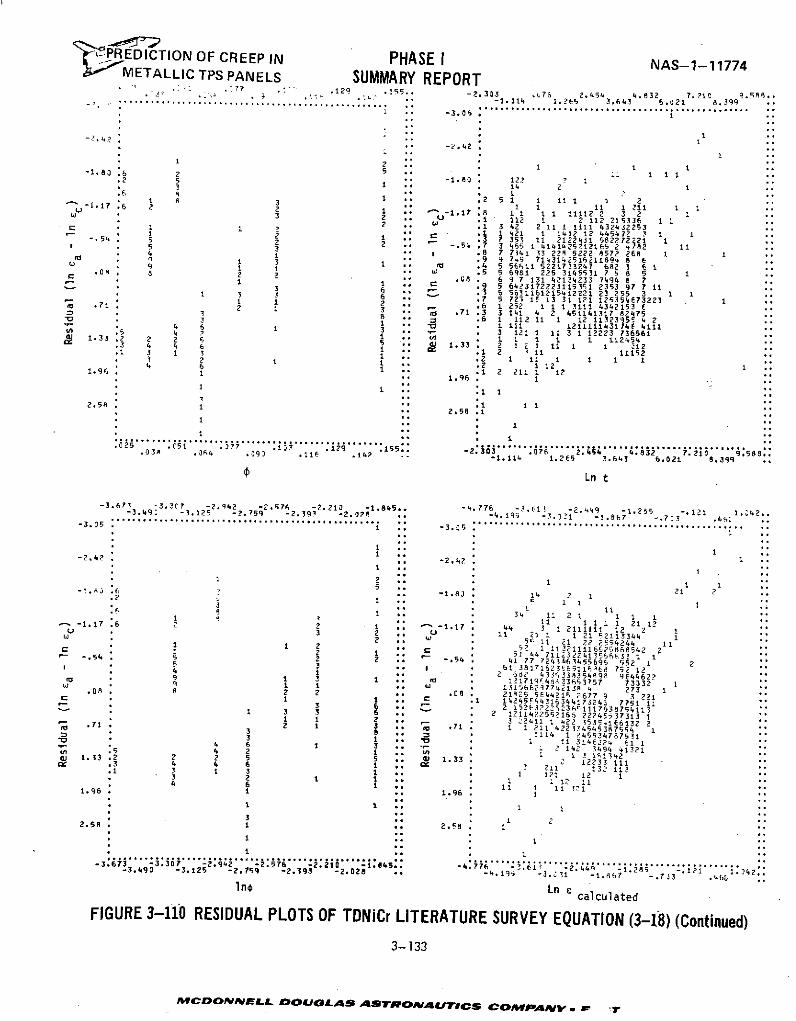
PREDICTION OF CREEP IN PHASE I NAS-1-11774-" METALLIC TPS PANELS SUMMARY REPORT77 : .129 .155, -2.33 .75 2.454 4.832 7.1 85..
. 120 . "-1 114 1.?65 3.643 6.021 8.399................................. ............
11
-,'.42 * -2.42
2 1 1-1.80 6 2 -1.801 1
• 5 -1*80 122 ? 1
.6 5. 3 1 2 1 22
S.2 5 1 1 1 1 1 2.1 6 2 2 1 -1.17 8 1 1 1 1 1112 2 3 2 1S2 .. . 2 112 215336 1 11 2 2 ,, .1 3 42 2 11 1 1111 4324322531 2 1 ±421 1 1412 12 445472 3 1- .54 2 1 .53 11 -. 1 .7 346615
21 5 -,54 3 465 1 414142512 65 2 4 82 11S .8 7 741 33 229 5222 8572 268 1 14 1 .9 9 7.5 71.3142516211894 8 6* 9 1 1 .4 5 56611 5221723247 682 3 6 1w * 1 1 * .5 5 6981 225 3145531 7 5 8 5 1.0R 3 2 2 .G8 . 6 9 7 131 42134233 7494 8 7S1 .. .9 5 6423172223115351 2353 97 7 113 6 .3 6 56311612l5412221 23 255 3 1 11 3 3 6 2 7 5 723 15 13 31 121 125354673223 17 1 3 .6 1 252 1 1 1 3111 4342153 fS 71 1 3 .71 .3 3 141 4 2 451141317 82475S.6 1 112 11 1 12 11323955 4 26 1 S 1 111 121111143174E 41111. 4 6 3 3 12:1 11 3 1 12223 736561
1 4 2 11 1 1 1 1115413.3 2 2 2 s 5 1.33 2 11 11 1 1 2123 4 4 6 1 . .1 11 11152.1 3 1 3 1 .. .2 11.9 1 1 . .12 1 124 6
1
2.8 . 1 .1 1 12.58 62.58 .1
1 .1 1 1"
............. .. . ........... .......025 .C51 .77 .1 i . .19 . 155.. -Z:.38 . . 0 2.54 .83 . i 9.588..03R .6 4 .116 .142 -1.114 1.265 3.643 6.021 8.399
Ln t
-3.673 -3.37C1 -2.942 -2.576 -2.210 -1.845.. -4.776 -3.61 -2.449 -1.215 -. 1 I 1.,42.-3.49 -3.125 -2.759 -2. 37, -2. -4.19 -7.121 -1.867 -. 7:3 ;- .. . . . . ............................................... .s . ." .""".-3.05 .. -3.5
1 .. 1-2.42 1-2.42 *
25 .. . 21 ?
- .3 -1.83 4 2 113 . . 1 1 2 1 1
3 1121 111 -1 . -. : 11 21 1 1 1 1 1-1.17 6 .. -117 44 1 211 12 212 1
3 2 .11 21 1 1 21 52113344 12 5 11 21 22 2554244 111 1 2 * 1 1 113211116525868542 251 44 711.32Z41
556E32 I Ir -4 * ..1 -. 54 41 77 7241463455695 552 1 2S** I 61 3817162356511 5 8 752 121 2 662 434C53354R98 9f44622'U
± 3 . 1?17195(41,33653757 73332 1S1 1 . 1315662977413 4 273 1.08 * 2 2 *. .08 21925 5044215 2677 9 3 2211 3 . C .1 4245F54316344173243 7751 11.6 _ 2 1 15232221 236117s118754111.. . 2 121142?55216 22245,37313 I
1 2 3 211 1 422 3535.16132 2S .71 3 1 71 I 211 42234545387554 13 1114 1 245534787531- * 3 I 314E2 6114 6 ± 3 .. 1 1 142 3494 41321
c 1.33.2 2 2 5 5 ' 133 2 33 111.3 4 4 6 1 .. 3 211 132 113S3 3 1 : 1 121 12 14 6 1 11 1 1
3- 133•ODOMMELA ,assessas man an 2.. 8 t-3.30? -. 942 576 -2.-210 -1.5.. -476 -. -2.443 " 1.285 .121 1342..-3.490 -3.125 -2.759 -2.393 -2.028 .. -4.193 -3.i31 -1.9A7 -. 733 .461
1n¢ Ln £ calculated
FIGURE 3-110 RESIDUAL PLOTS OF TDNiCr LITERATURE SURVEY EQUATION (3-18) (Continued)
3- 133
MCDONNELL DOUGLAS ASTRONAUTICS, COMPLrgy. ,r ' 1"
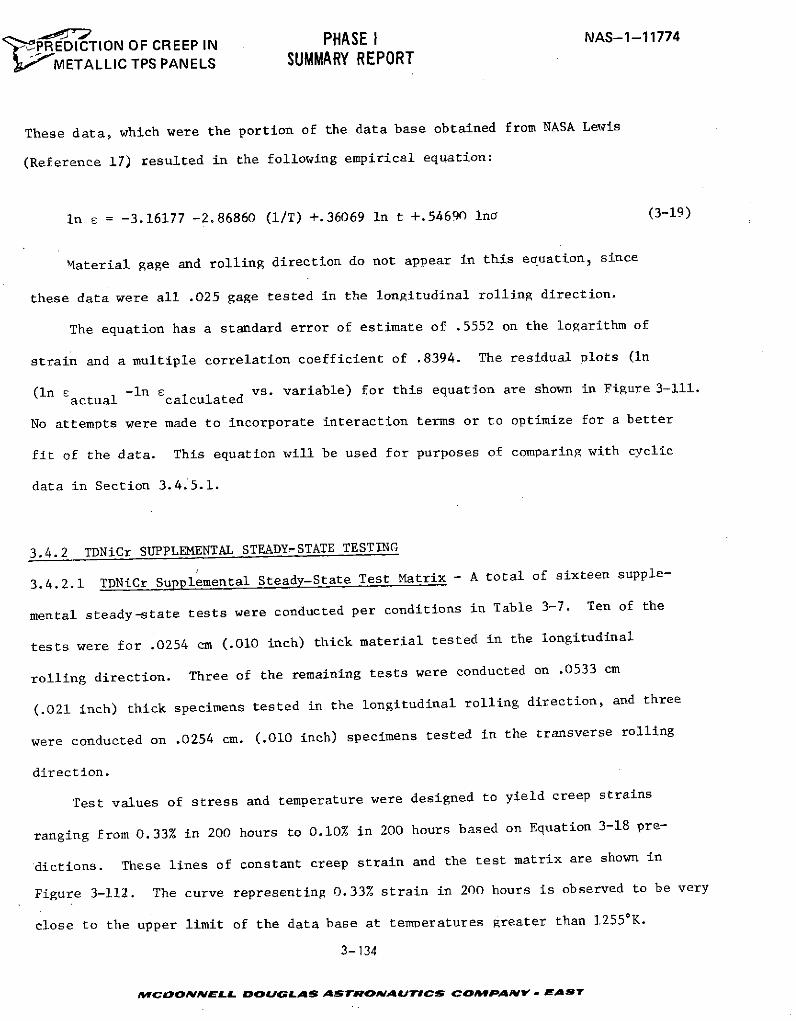
' PREDICTION OF CREEP IN PHASE I NAS-1-11774
METALLIC TPS PANELS SUMMARY REPORT
These data, which were the portion of the data base obtained from NASA Lewis
(Reference 17) resulted in the following empirical equation:
In E = -3.16177 -2.86860 (1/T) +.36069 In t +.54690 Ina (3-19)
Material gage and rolling direction do not appear in this equation, since
these data were all .025 gage tested in the longitudinal rolling direction.
The equation has a standard error of estimate of .5552 on the logarithm of
strain and a multiple correlation coefficient of .8394. The residual plots (In
(In Eactual -in ccalculated vs. variable) for this equation are shown in Figure 3-111.
No attempts were made to incorporate interaction terms or to optimize for a better
fit of the data. This equation will be used for purposes of comparing with cyclic
data in Section 3.4.5.1.
3.4.2 TDNiCr SUPPLEMENTAL STEADY-STATE TESTING
3.4.2.1 TDNiCr Supplemental Steady-State Test Matrix - A total of sixteen supple-
mental steady-state tests were conducted per conditions in Table 3-7. Ten of the
tests were for .0254 cm (.010 inch) thick material tested in the longitudinal
rolling direction. Three of the remaining tests were conducted on .0533 cm
(.021 inch) thick specimens tested in the longitudinal rolling direction, and three
were conducted on .0254 cm. (.010 inch) specimens tested in the transverse rolling
direction.
Test values of stress and temperature were designed to yield creep strains
ranging from 0.33% in 200 hours to 0.10% in 200 hours based on Equation 3-18 pre-
dictions. These lines of constant creep strain and the test matrix are shown in
Figure 3-112. The curve representing 0.33% strain in 200 hours is observed to be very
close to the upper limit of the data base at temperatures greater than 12550K.
3-134
MCDONNELL DOUGLAS ASTRONAUTICS COMPANY- EAST
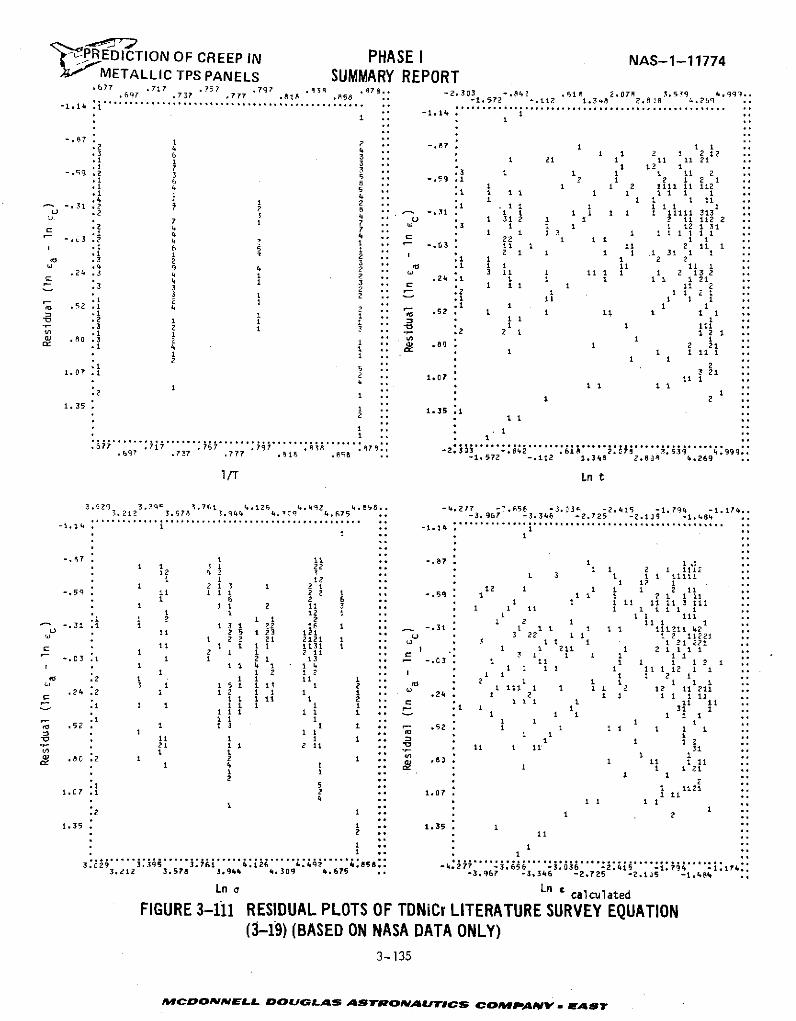
'tPREDICTION OF CREEP IN PHASE I NAS-1-11774IMETALLIC TPS PANELS SUMMARY REPORT
.677 .717 757 797 5 3 . 878.. -2 303 -84 61 2.078 3. 39 4. q l,,.697 .737 .777 .818 .8 -1.72 -. 112 1.38 2.888 4.264-1.14 . . .""""".... ... .." ..... .. . .. ..... II -1, 572 -o112 1,3 8 Z,8}8 #,26q ,,.1. . . -1.1............ ........................................
-1.1
S1 21 1 11
-. 87. 1 I 1.2 1 2 2 1.3 3 1 1 11 11 21.1 1 3 1 1 1.•1 3 1 12 i
-. 129 .2 3 5 1-.591 1 1 11 26 8 .. - 121.1 4 5 . . 1 I 1 1 11111 12
.1 .3 1 11 1 1S1 . 1 1 1 1 1
i . 2
2 .. 1 1 1 31
7 1 12312 7 13 1 11 111. 1*4 4 22 1 1 1 ..-. 3.2 4 1 -. 03 11 1 11 2 11 1.1 1 2 .. * 1 1 1 1 1 31 1
W 3 2 3 1 1 1 1 1S . 1 3 11 2 2.24 3 4 1 2 .24 1 1 1. 121* 4 3 .. 2 1I .3 3 2 . 7.2 1 1 2 1
.5 1 2 .52*1 2 1 it..5 . 1 1 1 1 1
. 1 1 1 1 1% .3 1 1 J .3 1 .1 1 1 1 ..S.2 214 1 1 ..24 1R "° 2 2 1 1 1 221
1 1 . "u . 2.80 .
1 21 ..
* * 80 1 21
1 1 1 1 1 12 1 .
126
1 121
1.35 * 1 .. 1.353 13.69" .737 .777 .818 .85a -1.572 -. 112 1.348 2.838 4.269
1/T Ln t
3.19 1.39 3.7± 4,1 24 4.492 4.85. -4.277 -'.656 -3.33 -2.415 -1.794 -1.174..3.21? 3.578 3.944 4 4.675 -3.967 -3.346 -2.725 -2.135 -1.484-1.14 .1 1 -4
I ..
-. 7 1 1 t 1 11 1 3 1 22 1 2 1 111
12 .. . 1 3 1 II 111111 1 2 1 1 11 13 I 1.. 2 1 1 1 1 2 11i-S II I 1 6 259 I I i 2 i1 6 2 6 1 . 1 11 11 1111 11 2 11 3 1 ii 1 1 1 1 1
1 1 1 1 2 .. 1 2 1 1 1-. 31.1 1 131 22 16 1 .. _ -. 3 1 1 I 1 II 11121142
t 11 2 5 1 23 121 3 22 1 1 1 2 11221S1 22 21 2121 1 .. . 1 1 1 11 221t11 1I 1 1 1131 11* 1 211 2 1 1C - 3 1 1 1 21 13 .. - -.C3. 1 11 1 1 1 1 2 14 i I i 1 i. . 1 I 1 I 11 12 11:2 1 1 2 1 1 1 1It I 1 1 11 1 t 2 1 1 1 1 1 1S1 2 2 1 1 2 12 11211.24 2 1 1 2 11 1 1 . .24. 1 2 11 1 11I I I 1 1 2 - . 1 3 1 1.5 1 1 1 I I I I 1 1
=3 1 I I I 1 .o
21 1 1 . It I In I ... t I 1 1It .812 1 2 . 1 1 1
1 . * 1,,I I . 1 1.
1i 11211 7 . 1.0 1 114 .1 1 1 1
1 1. 35.2 1 ,. 1 2 1
1.35 1 .. 1.35 12 ,, 1± "
3-135
MCDONNELL DOUGLAS ASTRONIATICS COSAV -, EA ST
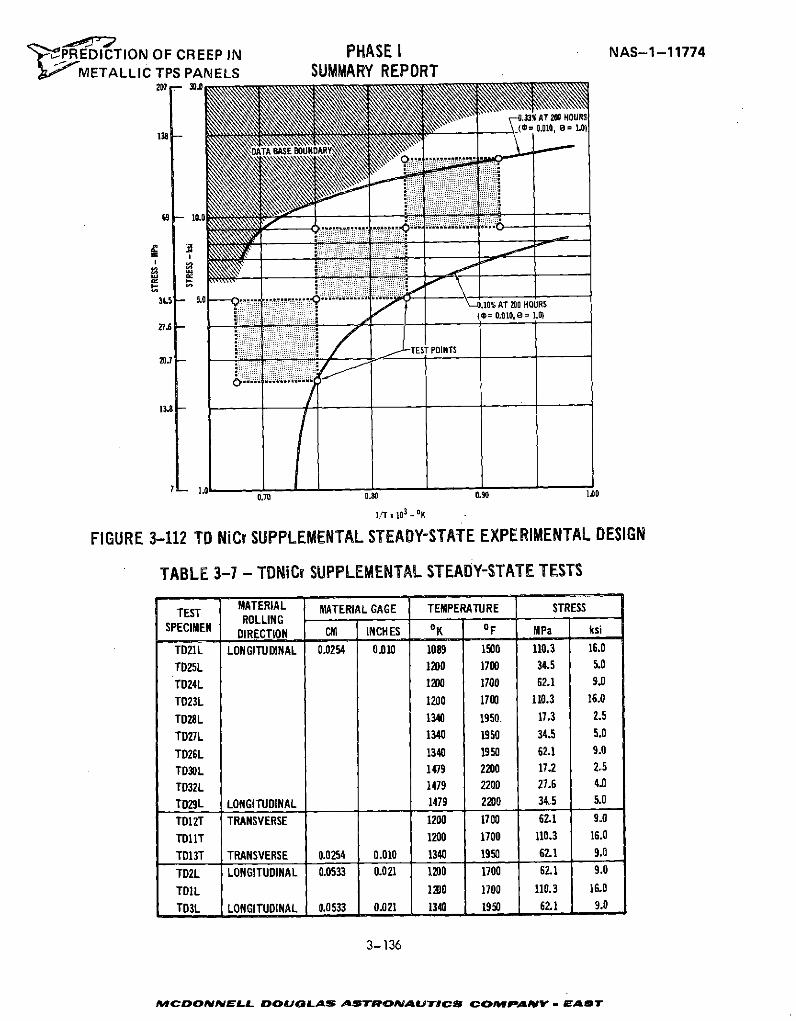
' PREDICTION OF CREEP IN PHASE I NAS-1-11774METALLIC TPS PANELS SUMMARY REPORT
207 - 30.0
0.33% AT 200 HOURS
:. iiiiiii. (€ ( 0.010, = 0.010 9= 1.0
138
69 - 10.0
34.5 - 0 .............. **.10% AT 200 HO IRS( 0.0 10, = 1.0)
27.6 -
20.7 -
13.8 -
0.70 0.80 0.90 100
1/T x 103 - OK
FIGURE 3-112 TD NiCr SUPPLEMENTAL STEADY-STATE EXPERIMENTAL DESIGN
TABLE 3-7 - TDNiCr SUPPLEMENTAL STEADY-STATE TESTS
TEST MATERIAL MATERIAL GAGE TEMPERATURE STRESSROLLING
SPECIMEN DIRECTION CM INCHES OK OF MPa ksi
TD21L LONGITUDINAL 0.0254 0.010 1089 1500 110.3 16.0
TD25L 1200 1700 34.5 5.0
TD24L 1200 1700 62.1 9.0
TD23L 1200 1700 110.3 16.0
TD28L 1340 1950. 17.3 2.5
TD27L 1340 1950 34.5 5.0
TD26L 1340 1950 62.1 9.0
TD30L 1479 2200 17.2 2.5
TD32L 1479 2200 27.6 4.0
TD29L LONGITUDINAL 1479 2200 34.5 5.0
TD12T TRANSVERSE 1200 1700 62.1 9.0
TD11T 1200 1700 110.3 16.0
TD13T TRANSVERSE 0.0254 0.010 1340 1950 62.1 9.0
TD2L LONGITUDINAL 0.0533 0.021 1200 1700 62.1 9.0
TD1L 1200 1700 110.3 16.0
TD3L LONGITUDINAL 0.0533 0021 1340 1950 62.1 9.0
3-136
MCDOM ELL DOUGLAS ASTNYPROM SA T o .. r4MOAY EAST
'?PREDICTION OF CREEP IN PHASE I NAS-1-11774,' METALLIC TPS PANELS SUMMARY REPORT
It should be noted that a curve for 0.50% strain at 50 hours is not shown, as has
been done previously for the other materials under investigation, since this curve
is outside the data base. This is indicative of the low creep strains obtained with
TDNiCr material. The shaded area in Figure 3-112 represents the upper limits of
the data for this material and is also where several specimen stress rupture failures
occurred in the data base.
Creep strain results for each of the supplemental steady-state tests are pre-
sented in Appendix F-2. Included in this appendix are the elastic strains which
were determined at the start and the conclusion of the test.
3.4.2.2 Test Data Evaluation - Basic Test Matrix. A review of the supplemental
steady-state data indicates some inconsistency, in that some tests at 1340 0K
exhibit higher creep strains than those at 14790K. This is demonstrated in the
50-hour creep strains shown in Figure 3-113. The usefulness of developing an
equation for this data is, therefore, questionable.
Subsequent comparisons of cyclic and supplemental steady-state data are made
(Section 3.4.5) which indicate no difference between these sets of data. Therefore,
empirical equations developed for the basic cyclic tests (cyclic tests 1-6) will be
considered applicable to the supplemental steady-state data also.
3.4.2.3 Effects of Gage and Rolling Direction. Comparisons of supplemental steady-
state creep data for tests conducted on specimens of .0254 and .0533 cm and
on specimens in longitudinal and transverse directions are shown in Table 3-8 for
three different times. Review of the data indicates that the .0533 cm specimens
experienced greater creep strains than the .0254 cm specimens, and that specimens
tested in the transverse rolling direction experienced greater creep strain than
those tested in the longitudinal rolling direction. The only exceptions to this
trend were in the case of specimen TD12T (.0254 gage, transverse direction) where
very low creep strains were attained, which may indicate an invalid test. These
3-137
MCDONNELL DOUGLAS ASTRONAUTICS COMPANV- ELAST
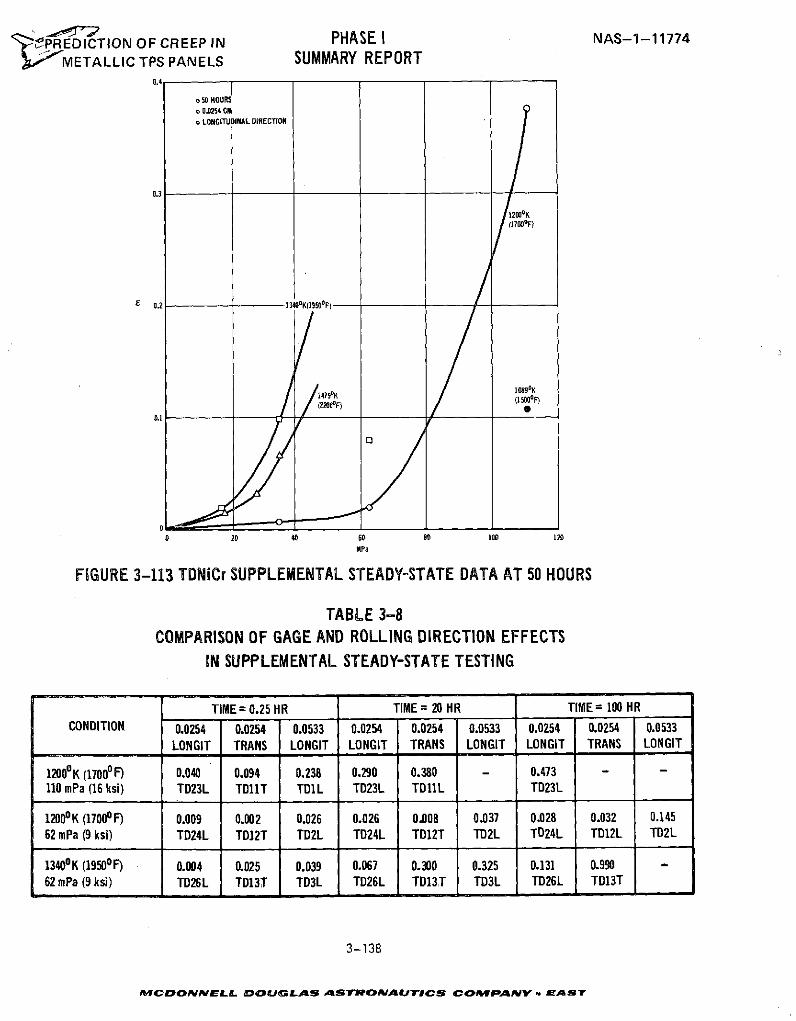
- PREDICTION OF CREEP IN PHASE I NAS-1-11774
SMETALLIC TPS PANELS SUMMARY REPORT0.4 1
o 50 HOURSo 0.0254 CMo LONGITUDINAL DIRECTION
0.3
1200OK(1700
0F)
0.2 1340oK(1950°F)
10890
K(1 ( F)00F)
0 20 40 0 80 100 120
MPa
FIGURE 3-113 TDNiCr SUPPLEMENTAL STEADY-STATE DATA AT 50 HOURS
TABLE 3-8COMPARISON OF GAGE AND ROLLING DIRECTION EFFECTS
IN SUPPLEMENTAL STEADY-STATE TESTING
TIME= 0.25 HR TIME = 20 HR TIME= 100 HRCONDITION 0.0254 0.0254 0.0533 0.0254 0.0254 0.0533 0.0254 0.0254 0.0533
LONGIT TRANS LONGIT LONGIT TRANS LONGIT LONGIT TRANS LONGIT
1200oK (1700 0F) 0.040 0.094 0.238 0.290 0.380 - 0.473 - -110 mPa (16 ksi) TD23L TD11T TD1L TD23L TD11L TD23L
12000K (1700 0F) 0.009 0.002 0.026 0.026 0.008 0.037 0.028 0.032 0.14562 mPa (9 ksi) TD24L TD12T TD2L TD24L TD12T TD2L TD24L TD12L TD2L
13400K (1950 0F) 0.004 0.025 0.039 0.067 0.300 0.325 0.131 0.990 -62 mPa (9 ksi) TD26L TDI3T TD3L TD26L TDI3T TD3L TD26L TD13T
3-138
JIWCDONNELL bOUG LAS ASTONAUTICS COMPANY - EAST
V'PEDICTION OF CREEP IN PHASE I NAS-1-11774]-I METALLIC TPS PANELS SUMMARY REPORT
results agree with the prediction for the steady-state data base in Equation 3-18
where creep strain increases with increasing gage, and is greater for the trans-
verse direction (e=0) than the longitudinal direction (0=1).
3.4.3 COMPARISON OF STEADY-STATE DATA BASE AND SUPPLEMENTAL TEST RESULTS
Comparison of supplemental data at 5 hours and 50 hours, with predictions
based on the data base equation (Equation 3-18) are shown in Figure 3-114. This
comparison demonstrates that creep strains attained in supplemental testing are
generally about one-half of strains predicted from the data base.
3.4.4 TDNiCr BASIC CYCLIC TESTS
3.4.4.1 Basic Cyclic Test Matrix. Evaluation of TDNiCr, from the standpoint of
creep deflections in TPS panels, represents a completely different case than the
other three materials studied under this program. This is primarily because
relatively little creep is evident in this material before failures occur. There-
fore, the requirement for definition of creep deflection is minimized in the design
criteria for TDNiCr TPS. Because of this, less emphasis has been placed on evalua-
tion of the steady-state data base and comparison of this data base with supple-
mental steady-state tests. More emphasis has been placed on definition of limits
of temperature and stress at which failure occurs. In this effort, additional
cyclic tests were conducted when necessary to obtain failures at each of four test
temperatures. A summary of the basic cyclic tests performed is presented in Table 3-9.
Basic cyclic tests were conducted on .0254 cm specimens in the longitudinal
direction at temperatures of 10890 K (15000 F), 1200 0K (17000F), 13400K (19500F),
and 1479 0K (22000F). These tests consisted of cycling specimens at constant
loads and temperatures for up to 100 cycles using a constant load and temperature
over a 20-minute cycle time period. Test stress levels were based on the data
base boundary as presented in Figure 3-112. Data for this portion of the cyclic
3-139
MCDONNELL DOUGLAS ASTRONAUTICS COMPANY .-AST
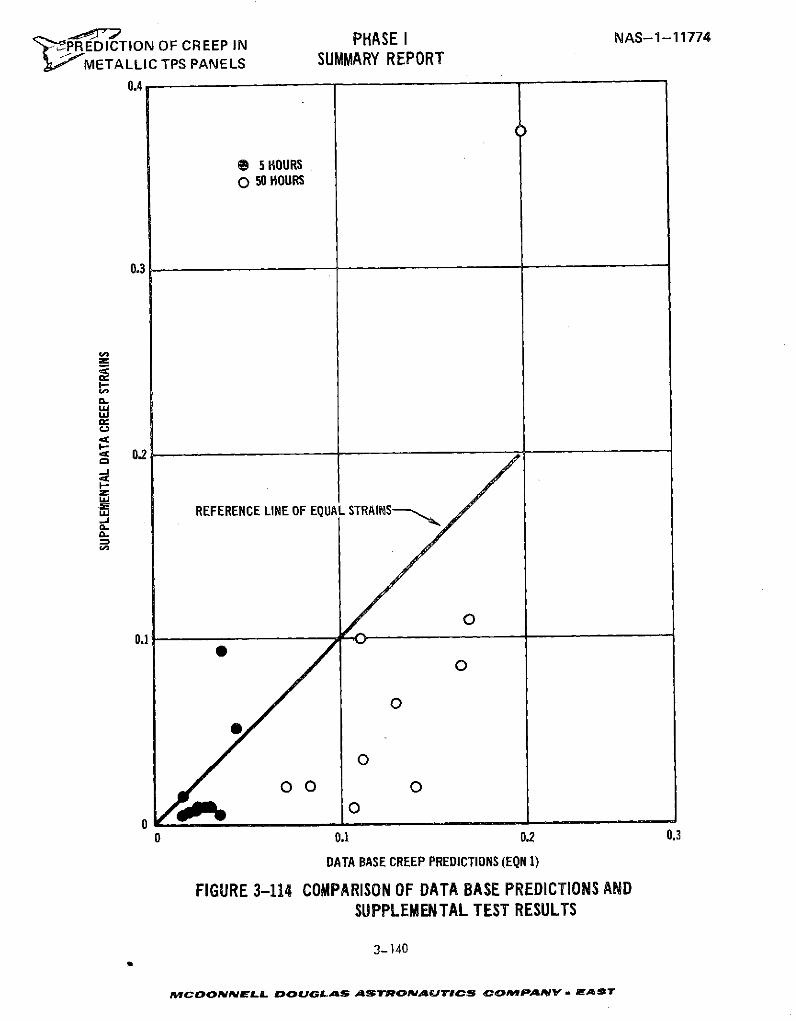
OF CREEP IN PHASE I NAS-1-11774$PREDICTION OF CREEP INn
METALLIC TPS PANELS SUMMARY REPORT0.4
9 5 HOURSO 50 HOURS
0.3
I-< 02
-J
REFERENCE LINE OF EQUAL STRAINS
00
0.1
00 0
0 0.1 0.2 0.3
DATA BASE CREEP PREDICTIONS (EQN 1)
FIGURE 3-114 COMPARISON OF DATA BASE PREDICTIONS ANDSUPPLEMENTAL TEST RESULTS
3-140
MCDOaNNELL DOUG LATS ASTRONAUTICS COMPpANY - EAST
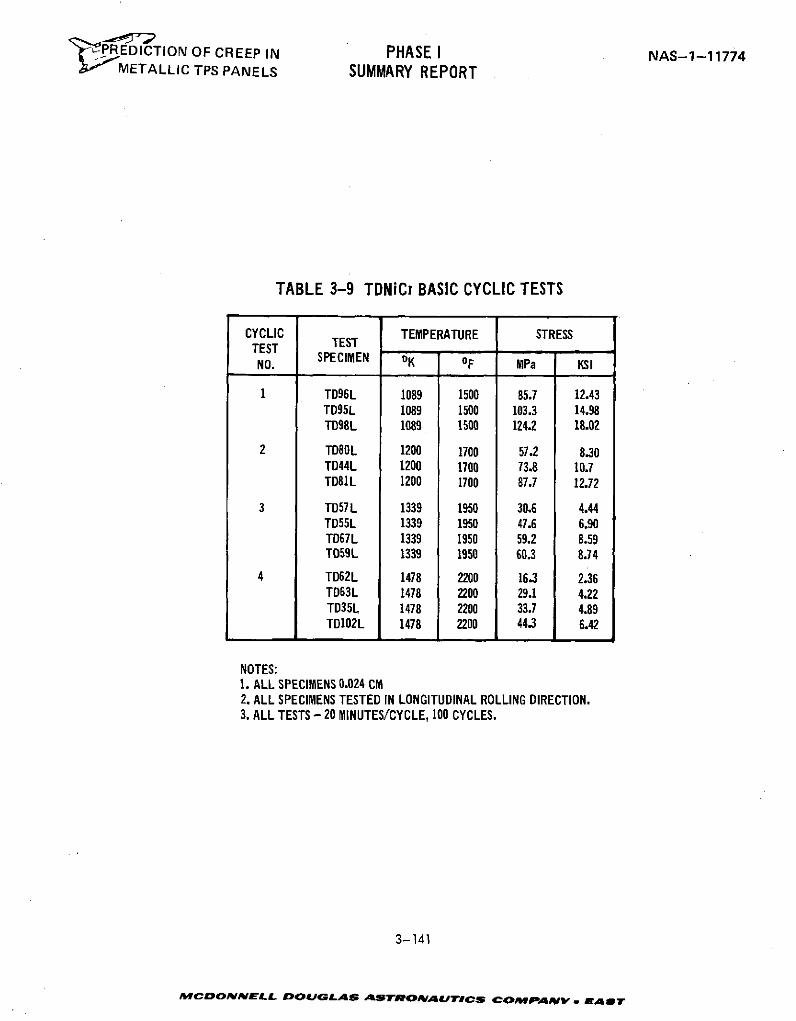
" REDICTION OF CREEP IN PHASE I NAS-1-11774' METALLIC TPS PANELS SUMMARY REPORT
TABLE 3-9 TDNiCr BASIC CYCLIC TESTS
CYCLIC TEMPERATURE STRESSTEST TEST
NO. SPECIMEN oK OF MPa KSI
1 TD96L 1089 1500 85.7 12.43TD95L 1089 1500 103.3 14.98TD98L 1089 1500 124.2 18.02
2 TD80L 1200 1700 57.2 8.30TD44L 1200 1700 73.8 10.7TD81L 1200 1700 87.7 12.72
3 TD57L 1339 1950 30.6 4.44TD55L 1339 1950 47.6 6.90TD67L 1339 1950 59.2 8.59TD59L 1339 1950 60.3 8.74
4 TD62L 1478 2200 16.3 2.36TD63L 1478 2200 29.1 4.22TD35L 1478 2200 33.7 4.89TD102L 1478 2200 44.3 6.42
NOTES:1. ALL SPECIMENS 0.024 CM2. ALL SPECIMENS TESTED IN LONGITUDINAL ROLLING DIRECTION.3. ALL TESTS - 20 MINUTES/CYCLE, 100 CYCLES.
3-141
MCDONNELL DOUGLAS ASTRONAUTICS COMPANY. w-Asr
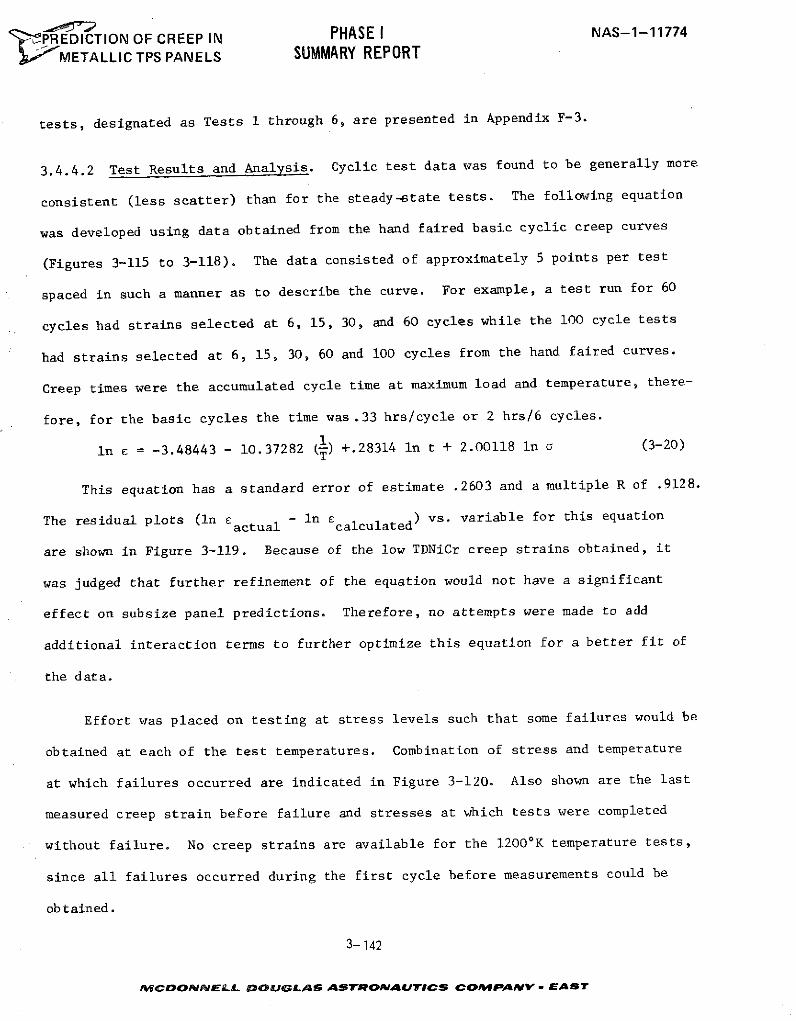
-- PREDICTION OF CREEP IN PHASE I NAS-1-11774
J- METALLIC TPS PANELS SUMMARY REPORT
tests, designated as Tests 1 through 6, are presented in Appendix F-3.
3.4.4.2 Test Results and Analysis. Cyclic test data was found to be generally more
consistent (less scatter) than for the steady-state tests. The following equation
was developed using data obtained from the hand faired basic cyclic creep curves
(Figures 3-115 to 3-118). The data consisted of approximately 5 points per test
spaced in such a manner as to describe the curve. For example, a test run for 60
cycles had strains selected at 6, 15, 30, and 60 cycles while the 100 cycle tests
had strains selected at 6, 15, 30, 60 and 100 cycles from the hand faired curves.
Creep times were the accumulated cycle time at maximum load and temperature, there-
fore, for the basic cycles the time was .33 hrs/cycle or 2 hrs/6 cycles.
In E = -3.48443 - 10.37282 (-) +.28314 in t + 2.00118 In a (3-20)
This equation has a standard error of estimate .2603 and a multiple R of .9128.
The residual plots (in cactual - In Ecalculated ) vs. variable for this equation
are shown in Figure 3-119. Because of the low TDNiCr creep strains obtained, it
was judged that further refinement of the equation would not have a significant
effect on subsize panel predictions. Therefore, no attempts were made to add
additional interaction terms to further optimize this equation for a better fit of
the data.
Effort was placed on testing at stress levels such that some failures would be
obtained at each of the test temperatures. Combination of stress and temperature
at which failures occurred are indicated in Figure 3-120. Also shown are the last
measured creep strain before failure and stresses at which tests were completed
without failure. No creep strains are available for the 1200 0K temperature tests,
since all failures occurred during the first cycle before measurements could be
obtained.
3- 142
PWCOONsIELAL DOUlGLAS AST ROAUTICS COMPANY - EAST
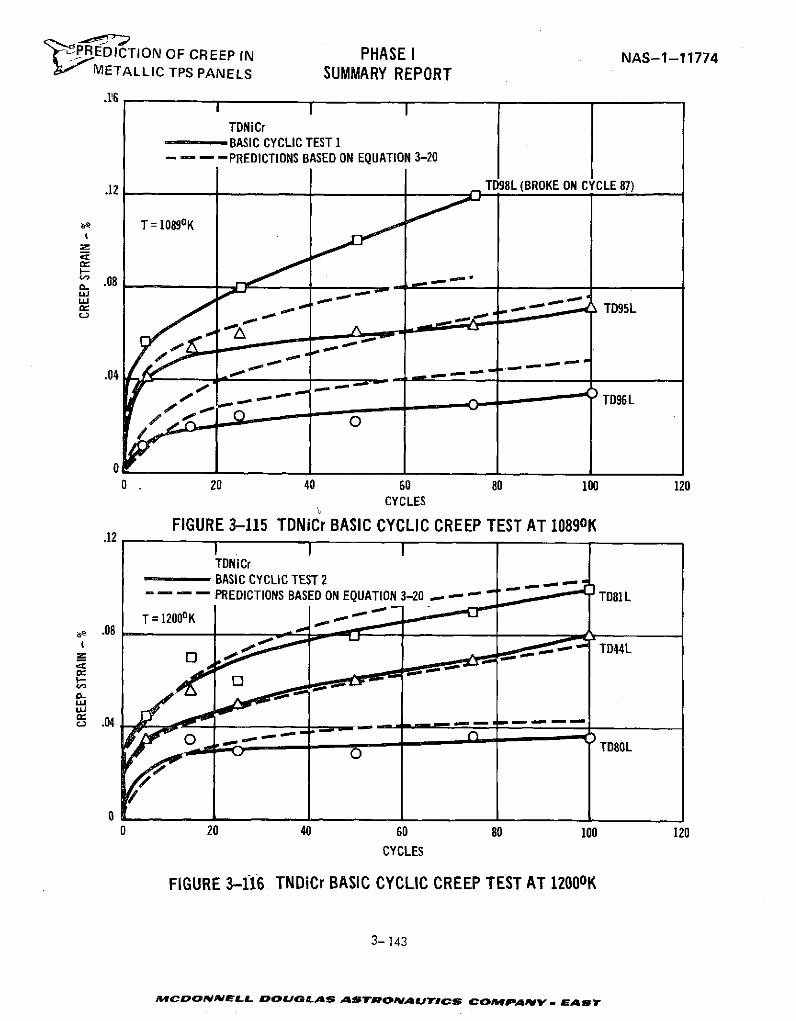
-PREDICTION OF CREEP IN PHASE I NAS-1-11774METALLIC TPS PANELS SUMMARY REPORT
.1!6 I I ITDNiCr
--- -BASIC CYCLIC TEST 1- - - -PREDICTIONS BASED ON EQUATION 3-20
.12 TD98L (BROKE ON CYCLE 87)
T=10890 K
S.08 .
TD95L
.04
TD96L
0 20 40 60 80 100 120CYCLES
FIGURE 3-115 TDNiCr BASIC CYCLIC CREEP TEST AT 10890 K.12
TDNiCr--- -BASIC CYCLIC TEST 2
S PREDICTIONS BASED ON EQUATION 3-20 - " TD81L
T=12000K.08
STD44L
O , -" . . -TD80L
0 20 40 60 80 100 120CYCLES
FIGURE 3-116 TNDiCr BASIC CYCLIC CREEP TEST AT 1200 0K
3- 143
MCDONNELL DOUGLAS ASTRONAUTICS COMPAINV EAT

"'7PREDICTION OF CREEP IN PHASE I NAS-1-11774
METALLIC TPS PANELS SUMMARY REPORT
.12 rTDNiCr
TD59L (BROKE ON CYCLE 46 BASIC CYCLIC TEST 3S- .. . -PREDICTIONS BASED ON EQUATION 3-20
0TD67L T = 1339oK
S.08 _ -
== TD55L.
.04
T057L
0 20 40 60 80 100 120
CYCLES
FIGURE 3-117 TDNiCr BASIC CYCLIC CREEP TEST AT 13390K
.24
TDNiCr... BASIC CYCLIC TEST 4.- -- . PREDICTIONS BASED ON EQUATION 3-20
.18TD102L (BROKE ON CYCLE 57) T = 14780K
I -
0 . 0 o TD63L
_7=
00 20 40 60 80 100 120
CYCLES
FIGURE 3-118 TDNiCr BASIC CYCLIC CREEP TEST AT 1478'o
3-144
MCONNELL DOUGLS AOl A TRONAUTICS C4RAPA N P 6$9
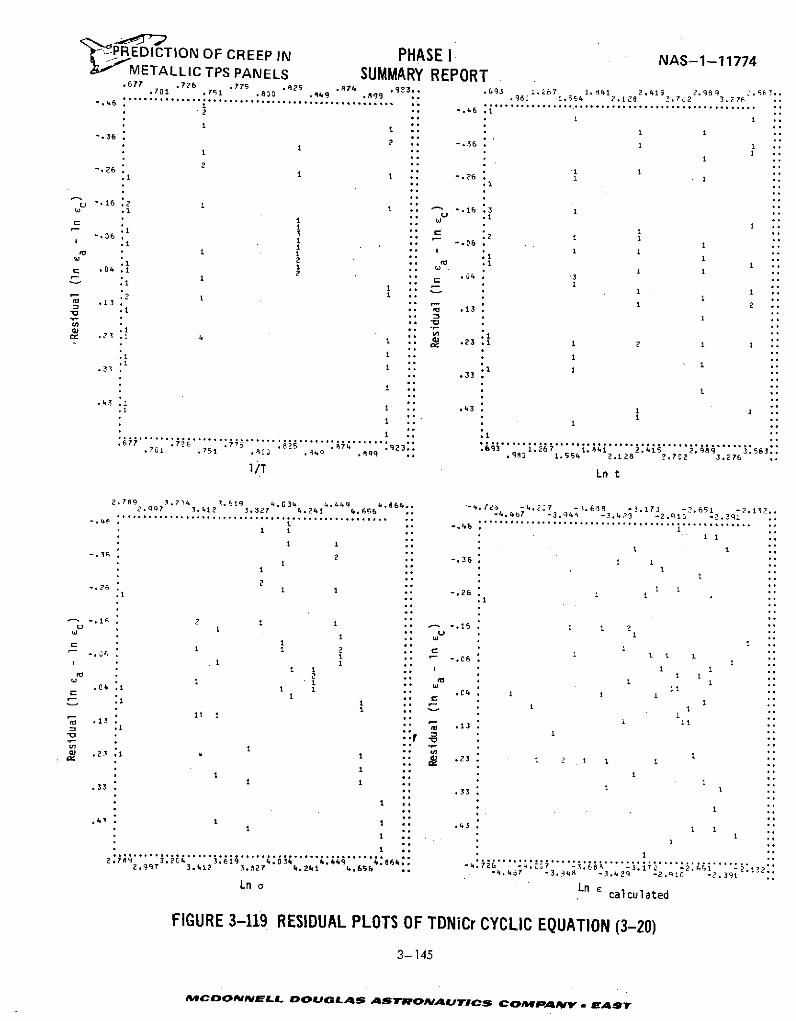
VPREDICTION OF CREEP IN PHASE I NAS-1-11774METALLIC TPS PANELS SUMMARY REPORT
.677 .726 .775 .825 .874 .923.. .693 1.267 1. 41 2.415 2.989 2.563..701 .751 .830 .49 .899 .98J 1.554 2.128 -. 72 3.277-. 46
-.* 1i""""""""
****"** ************
............. .......................... ................................... .............................* 1 116
.. .
.362 -. 36 1 1I * . . .
-. 26 1 i- t :21 1 .26 : 3 .0.1
* :2
-. 16 .2 ..
*D 6 I 1 11
.1 2 .104 1 ** . 11 1
1 1 2 1
. . ... .-- 3
2 9 3 . 1 3 .2 3 . 1 1 2 1 16 1 1 - . 11
323: 1 .. .1 1
, .33°1 .. . °
2I
4 1 4. 1
1 .. .
3-145
.701 .75i .812 .D O .9 .. .961 1.554 2.128 .702 3.26
) 1"1
-. 3 2"-
16 11" 1
.1" -. 26. I
1) 1 ..
I • I .. 1
C.. .. C
- .1 1 . .1311
1 1i 11 ""
I 1° 1 33 1• -.33 : i
3- 145
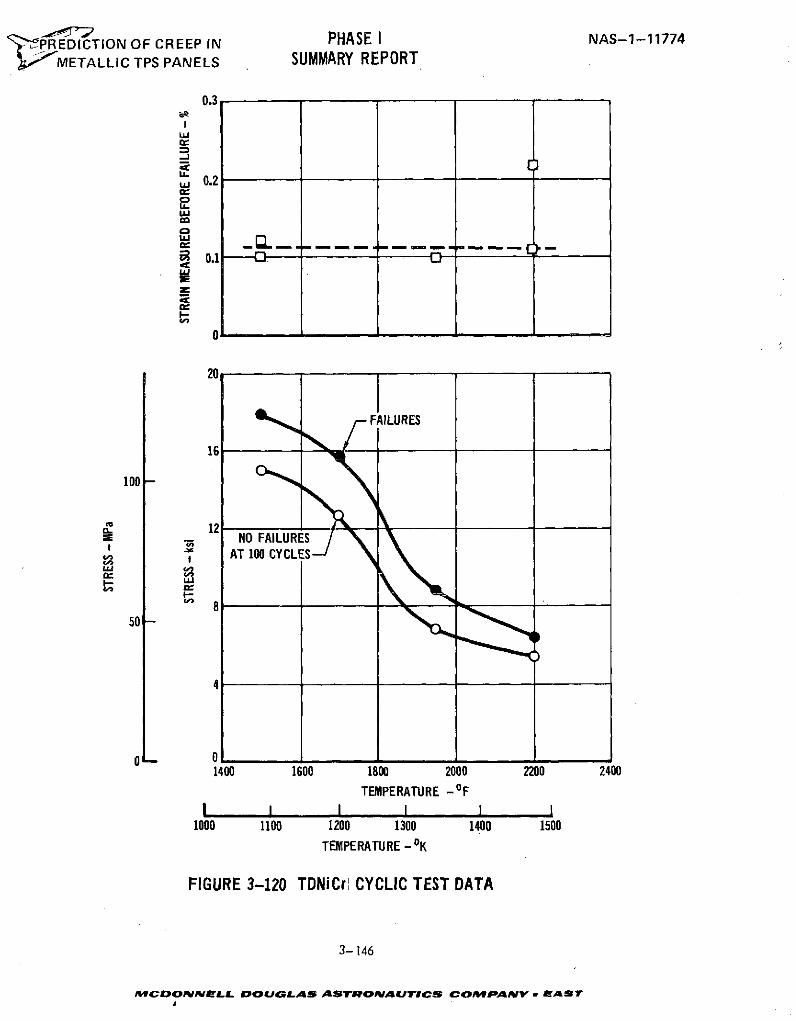
P REDICTION OF CREEP IN PHASE I NAS-1-11774
-METALLIC TPS PANELS SUMMARY REPORT
0.3
IU
S0.2
3E
16 FLURES
100 -
0- 12= .- NO FAILURES
I- 80AT 100 CYCLES
1400 1600 1800 2000 2200 2400
TEMPERATURE -OF
I I I I 1 11000 1100 1200 1300 1400 1500
TEMPERATURE - OK
FIGURE 3-120 TDNiCr CYCLIC TEST DATA
3-146
MCDONNELL DOUGLAS ASTRONAUTICS COMPANY . EAST
cjd
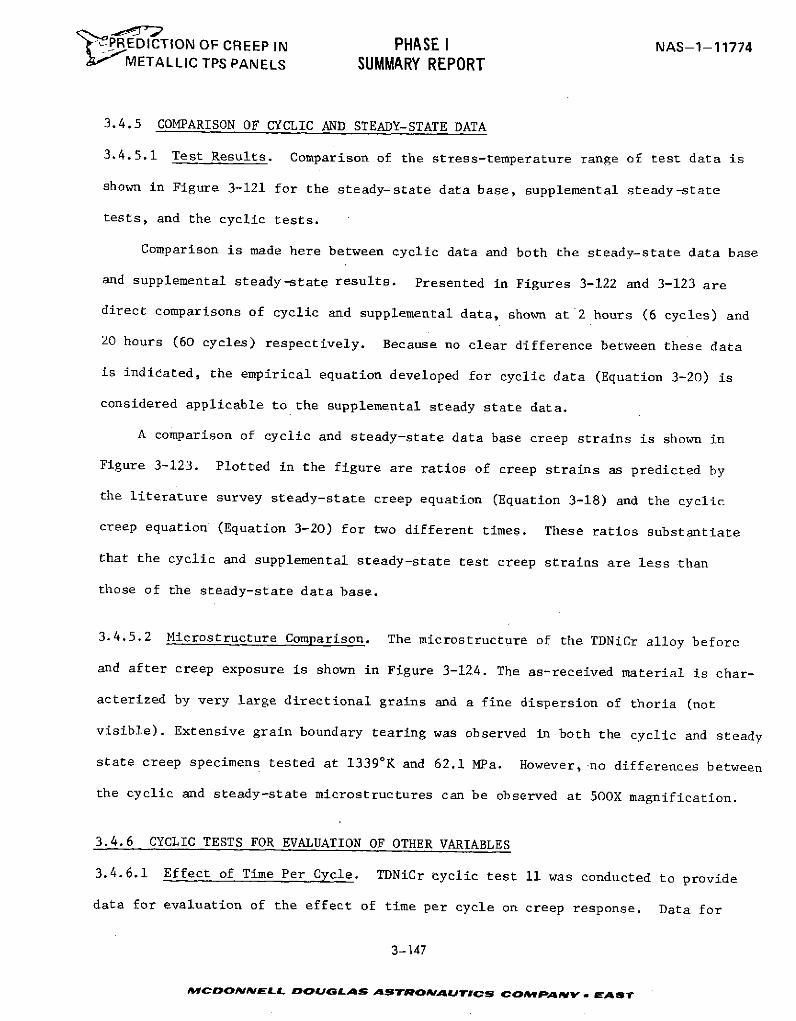
PR EDICTION OF CREEP IN PHASE I NAS-1-11774METALLIC TPS PANELS SUMMARY REPORT
3.4.5 COMPARISON OF CYCLIC AND STEADY-STATE DATA
3.4.5.1 Test Results. Comparison of the stress-temperature range of test data is
shown in Figure 3-121 for the steady-state data base, supplemental steady-state
tests, and the cyclic tests.
Comparison is made here between cyclic data and both the steady-state data base
and supplemental steady-state results. Presented in Figures 3-122 and 3-123 are
direct comparisons of cyclic and supplemental data, shown at 2 hours (6 cycles) and
20 hours (60 cycles) respectively. Because no clear difference between these data
is indidated, the empirical equation developed for cyclic data (Equation 3-20) is
considered applicable to the supplemental steady state data.
A comparison of cyclic and steady-state data base creep strains is shown in
Figure 3-123. Plotted in the figure are ratios of creep strains as predicted by
the literature survey steady-state creep equation (Equation 3-18) and the cyclic
creep equation (Equation 3-20) for two different times. These ratios substantiate
that the cyclic and supplemental steady-state test creep strains are less than
those of the steady-state data base.
3.4.5.2 Microstructure Comparison. The microstructure of the TDNiCr alloy before
and after creep exposure is shown in Figure 3-124. The as-received material is char-
acterized by very large directional grains and a fine dispersion of thoria (not
visible). Extensive grain boundary tearing was observed in both the cyclic and steady
state creep specimens tested at 13390K and 62.1 MPa. However, no differences between
the cyclic and steady-state microstructures can be observed at 50OX magnification.
3.4.6 CYCLIC TESTS FOR EVALUATION OF OTHER VARIABLES
3.4.6.1 Effect of Time Per Cycle. TDNiCr cyclic test 11 was conducted to provide
data for evaluation of the effect of time per cycle on creep response. Data for
3-147
MCDONNELL DOUGLAS ASTRONAUTICS COMP PAY EAST
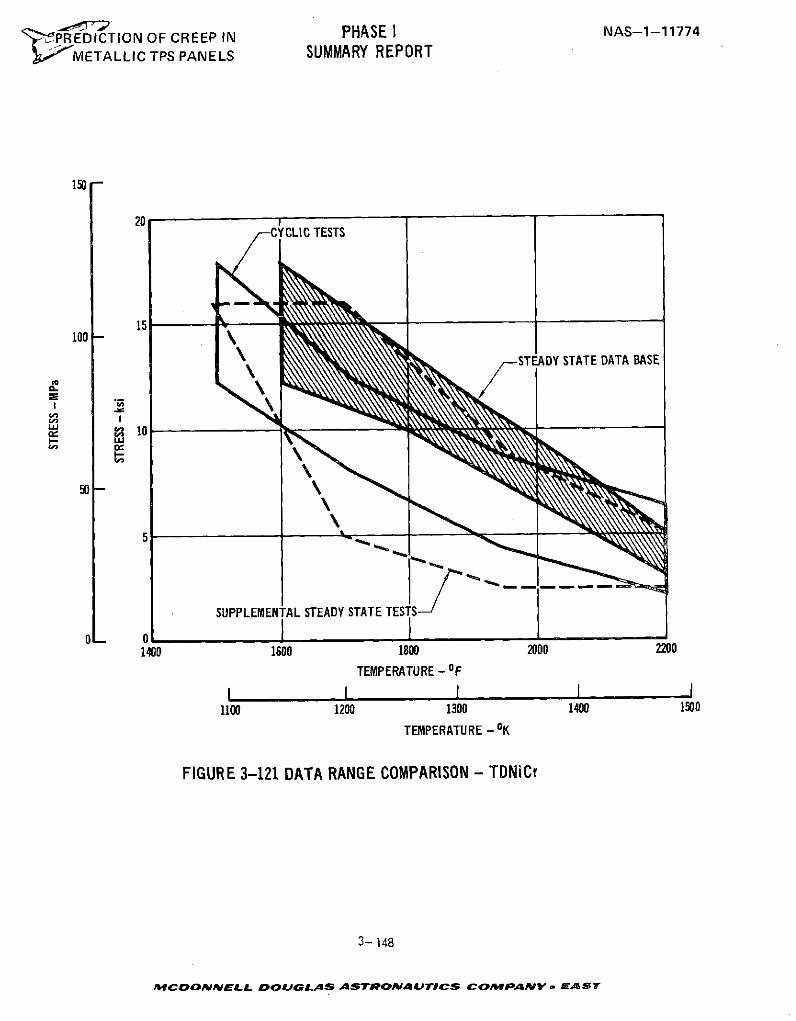
REDICTION OF CREEP IN PHASE I NAS-1-11774
METALLIC TPS PANELS SUMMARY REPORT
150
20CYCLIC TESTS
,. /---STEADY STATE DATA BASE
Ino 0\
SUPPLEMENTAL STEADY STATE TES S /
0 01400 1600 1800 2000 2200
TEMPERATURE - OFI I I I I
1100 1200 1300 1400 1500
TEMPERATURE - OK
FIGURE 3-121 DATA RANGE COMPARISON - TDNiCr
3- 148
MCDONIIELL DOULMSA ASYROIAUICS COSTMPAAY TE EATST
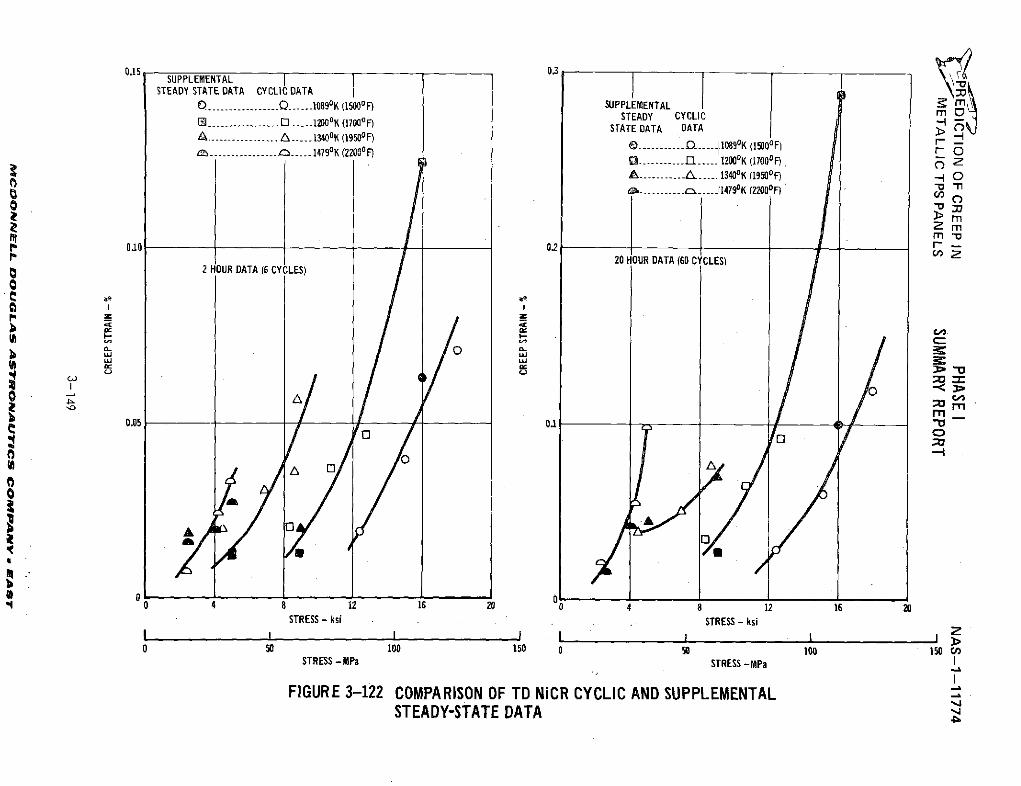
0.15 03SUPPLEMENTAL I
STEADY STATE DATA CYCLIC DATA
................ ......10890K (1500OF) SUPPLEMENTAL
-................. ..... 1200oK (17000oF) STEADY CYCLICSTATE DATA DATAA ---------..... A ..... 13400K (19500F)
S-----------.... ----- 10890K (15000F) ----------------- ---- 14790K (22000F) -..0 ----------- ----- 12000K (1700 0F) 2A .......... ..... 13400K (19500F) --
o "- 0------- c. -----..Il4790K (22001F) - n
>rmzn-vm
010 02 n20H OUR DATA (60 CYCLES)
2 HOUR DATA (6 CYCLES)
Q :0
0.05 50 10 1Te o0
STRESS - ksi STRESS - ksi
I
I I I I I I
0 50 100 150 0 so 100 150 CnSTRESS - MPa STRESS -MPa
FIGURE 3-122 COMPARISON OF TD NiCR CYCLIC AND SUPPLEMENTALSTEADY-STATE DATA 4b
'jPREDICTION OF CREEP IN PHASE I NAS-1-11774
METALLIC TPS PANELS SUMMARY REPORT
1.2 1 I 12550K (1800 0F)1368oK (2000°F)
1.0 1143oK (16000F)
14970K (22000F)
LI-
i O.OF
. 0.4
0.2 5 HOUR DATA
LO1368 0 (20000 F) 12550K (18000F)1143oK (1600o
0.8 14970K (22000F)
0.6
-, 0.4
0.2 - 50 HOUR DATA
00 4 8 12 16 20
STRESS - ksi
0 50 100 150STRESS -M Pa
FIGURE 3-123 COMPARISON OF CALCULATED VALUES OF CYCLIC CREEP (eCy, EQN 3-20)AND STEADY-STATE DATA BASE CREEP (eSS, EQN 3-18)
3-150
MCDONNELL DOUGLAS ASTRONAUTICS COMPANV . AST
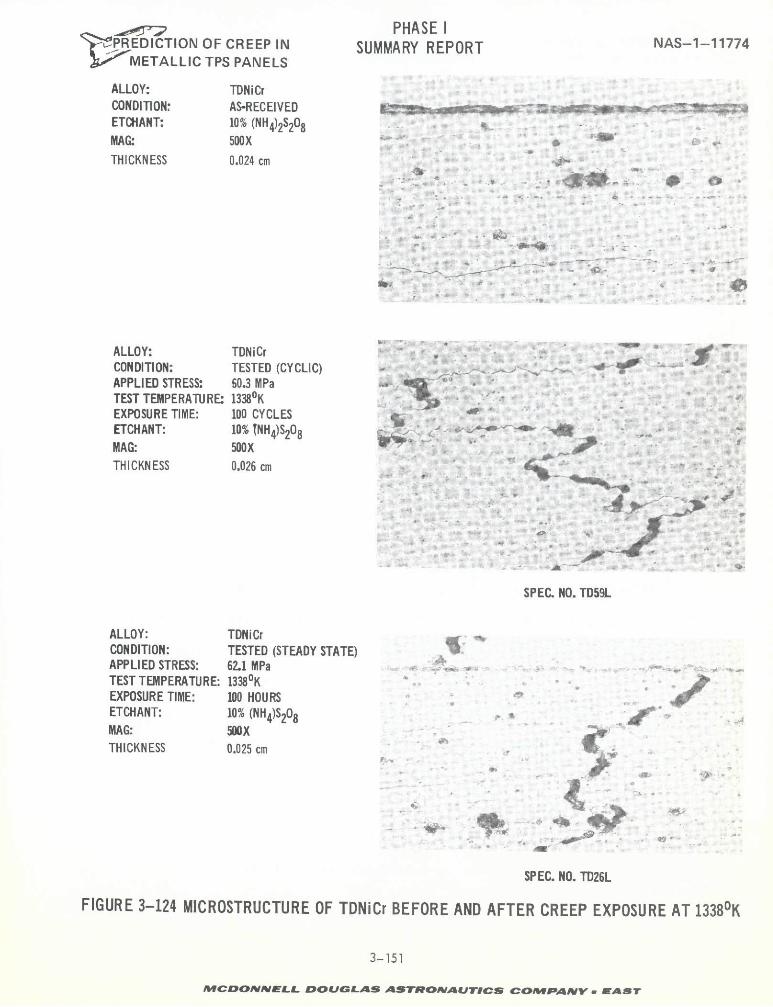
PHASE IPREDICTION OF CREEP IN SUMMARY REPORT NAS-1-11774
METALLIC TPS PANELS
ALLOY: TDNiCrCONDITION: AS-RECEIVEDETCHANT: 10% (NH4)2S208MAG, 500XTHICKNESS 0.024 cm
-~l -- ;:Bgf.
ALLOY: TDNiCrCONDITION: TESTED (CYCLIC)APPLIED STRESS: 60.3 MPaTEST TEMPERATURE: 13380KEXPOSURE TIME: 100 CYCLESETCHANT: 10% !NH4)S20 8 IMAG: 500XTHICKNESS 0.026 cm
SPEC. NO. TD59L
ALLOY: TDNiCrCONDITION: TESTED (STEADY STATE)APPLIED STRESS: 62.1 MPaTEST TEMPERATURE: 13381KEXPOSURE TIME: 100 HOURSETCHANT: 10% (NH4)S208MAG: 500XTHICKNESS 0.025 cm
SPEC. NO. TD26L
FIGURE 3-124 MICROSTRUCTURE OF TDNiCr BEFORE AND AFTER CREEP EXPOSURE AT 13380K
3-151
MCDONNELL DOUGLAS ASTRONAUTICS COMPANV - EAST
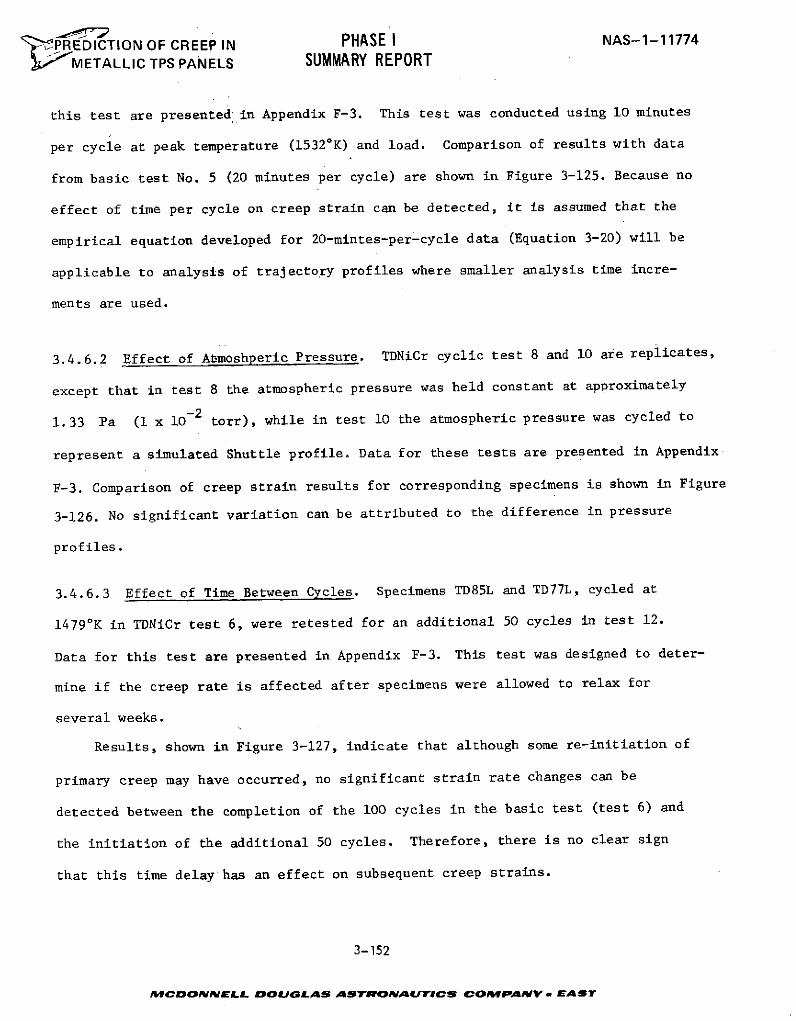
'PREDICTION OF CREEP IN PHASE I NAS-1-11774
METALLIC TPS PANELS SUMMARY REPORT
this test are presented in Appendix F-3. This test was conducted using 10 minutes
per cycle at peak temperature (15320 K) and load. Comparison of results with data
from basic test No. 5 (20 minutes per cycle) are shown in Figure 3-125. Because no
effect of time per cycle on creep strain can be detected, it is assumed that the
empirical equation developed for 20-mintes-per-cycle data (Equation 3-20) will be
applicable to analysis of trajectory profiles where smaller analysis time incre-
ments are used.
3.4.6.2 Effect of Atmoshperic Pressure. TDNiCr cyclic test 8 and 10 are replicates,
except that in test 8 the atmospheric pressure was held constant at approximately
1.33 Pa (1 x 10- 2 torr), while in test 10 the atmospheric pressure was cycled to
represent a simulated Shuttle profile. Data for these tests are presented in Appendix
F-3. Comparison of creep strain results for corresponding specimens is shown in Figure
3-126. No significant variation can be attributed to the difference in pressure
profiles.
3.4.6.3 Effect of Time Between Cycles. Specimens TD85L and TD77L, cycled at
14790 K in TDNiCr test 6, were retested for an additional 50 cycles in test 12.
Data for this test are presented in Appendix F-3. This test was designed to deter-
mine if the creep rate is affected after specimens were allowed to relax for
several weeks.
Results, shown in Figure 3-127, indicate that although some re-initiation of
primary creep may have occurred, no significant strain rate changes can be
detected between the completion of the 100 cycles in the basic test (test 6) and
the initiation of the additional 50 cycles. Therefore, there is no clear sign
that this time delay has an effect on subsequent creep strains.
3-152
MCDONPNELL DOUGLAS ASTRONAUTICS COMPANV y EAST
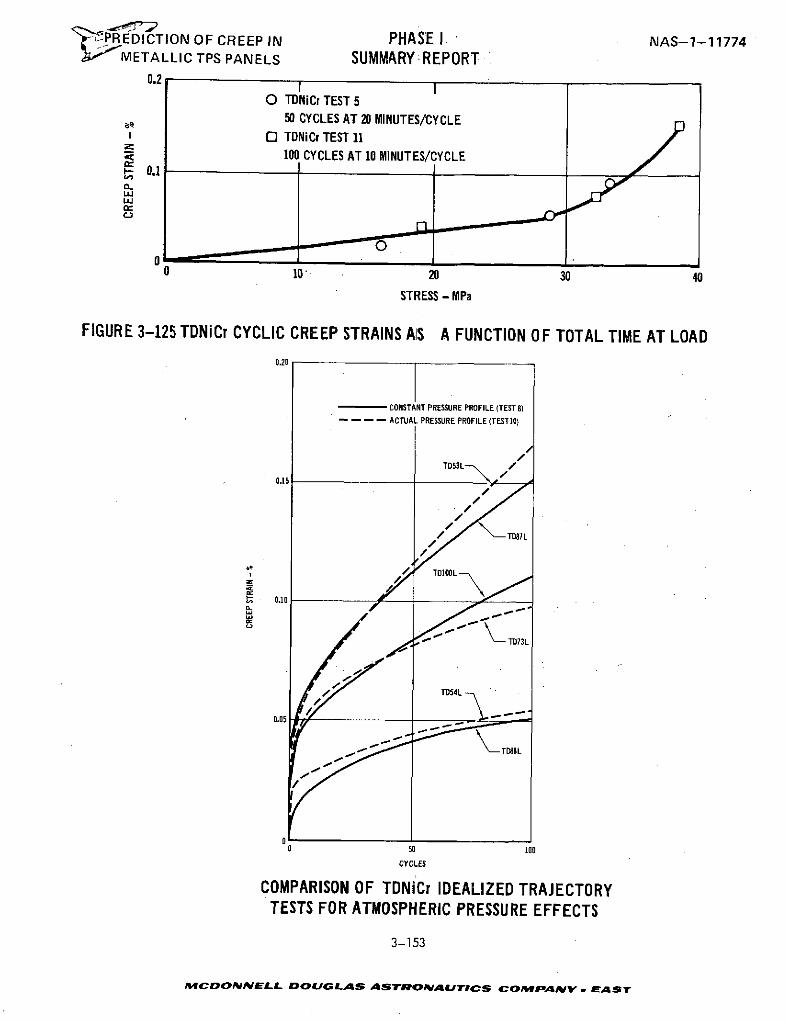
ZjPREDICTION OF CREEP IN PHASE I NAS-1-11774r ;METALLIC TPS PANELS SUMMARY REPORT
0.2
0 TDNiCr TEST 550 CYCLES AT 20 MINUTES/CYCLE
0 TDNiCr TEST 11100 CYCLES AT 10 MINUTES/CYCLE
00 10 20 30 40
STRESS - MPa
FIGURE 3-125 TDNiCr CYCLIC CREEP STRAINS AS A FUNCTION OF TOTAL TIME AT LOAD0.20
CONSTANT PRESSURE PROFILE (TEST 8)- - - - ACTUAL PRESSURE PROFILE (TESTI0)
TDS3L-- /
0.15
f TD87L
TD100L
0.05
0 50 100
CYCLES
COMPARISON OF TDNiCr IDEALIZED TRAJECTORYTESTS FOR ATMOSPHERIC PRESSURE EFFECTS
3-153
MCDONNELL DOUGLAS ASTROINAUTICS COMPANYV. EAST
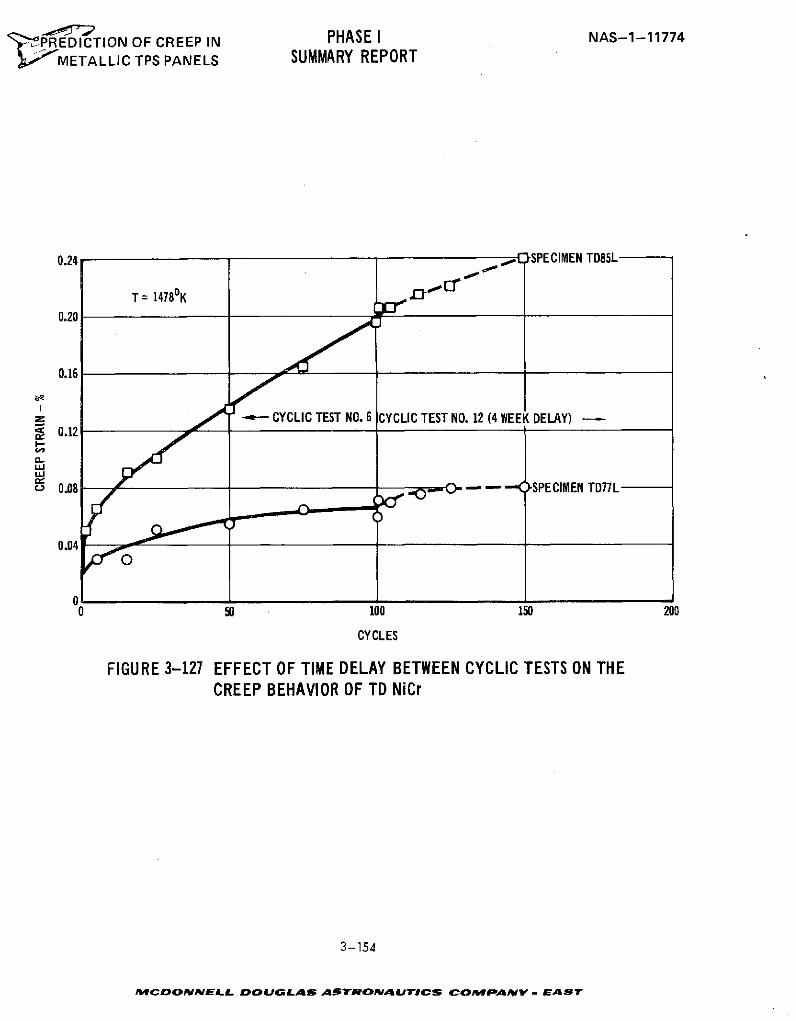
'-~PREDICTION OF CREEP IN PHASE I NAS-1-11774
METALLIC TPS PANELS SUMMARY REPORT
0.24 1SPECIMEN TD85L
T= 1478°K J-I
0.16
S- CYCLIC TEST NO. 6 CYCLIC TEST NO. 12 (4 WEEK DELAY) -0.12
o 008 O= ~ - = * SPECIMEN TD77L
0.04
0
0 50 100 150 200
CYCLES
FIGURE 3-127 EFFECT OF TIME DELAY BETWEEN CYCLIC TESTS ON THECREEP BEHAVIOR OF TD NiCr
3-154
MCDONNELL DOUGLAS ASTRONAUTICS COMPANY - EAST
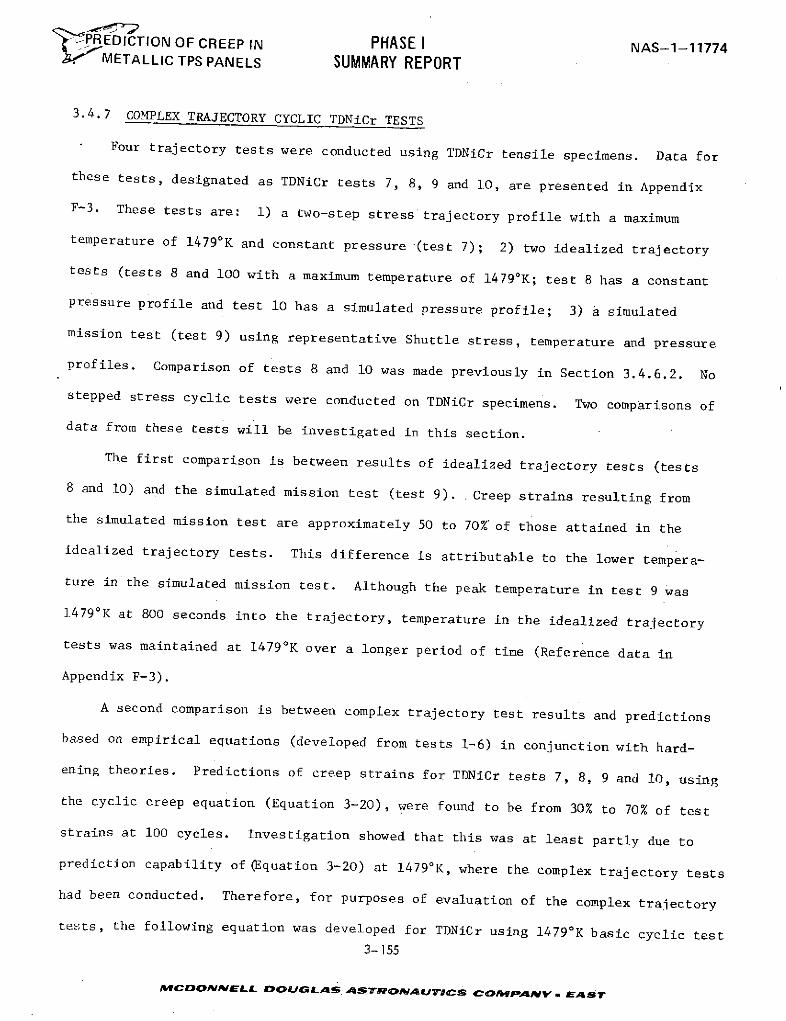
PREDICTION OF CREEP IN PHASE I NAS-1-11774METALLIC TPS PANELS SUMMARY REPORT
3.4.7 COMPLEX TRAJECTORY CYCLIC TDNiCr TESTS
Four trajectory tests were conducted using TDNiCr tensile specimens. Data for
these tests, designated as TDNiCr tests 7, 8, 9 and 10, are presented in Appendix
F-3. These tests are: 1) a two-step stress trajectory profile with a maximum
temperature of 14790K and constant pressure -(test 7); 2) two idealized trajectory
tests (tests 8 and 100 with a maximum temperature of 1479 0K; test 8 has a constant
pressure profile and test 10 has a simulated pressure profile; 3) a simulated
mission test (test 9) using representative Shuttle stress, temperature and pressure
profiles. Comparison of tests 8 and 10 was made previously in Section 3.4.6.2. No
stepped stress cyclic tests were conducted on TDNiCr specimens. Two comparisons of
data from these tests will be investigated in this section.
The first comparison is between results of idealized trajectory tests (tests
8 and 10) and the simulated mission test (test 9). Creep strains resulting from
the simulated mission test are approximately 50 to 70%' of those attained in the
idealized trajectory tests. This difference is attributable to the lower tempera-
ture in the simulated mission test. Although the peak temperature in test 9 was
1479 0K at 800 seconds into the trajectory, temperature in the idealized trajectory
tests was maintained at 14790K over a longer period of time (Reference data in
Appendix F-3).
A second comparison is between complex trajectory test results and predictions
based on empirical equations (developed from tests 1-6) in conjunction with hard-
ening theories. Predictions of creep strains for TDNiCr tests 7, 8, 9 and 10, using
the cyclic creep equation (Equation 3-20), were found to be from 30% to 70% of test
strains at 100 cycles. Investigation showed that this was at least partly due to
prediction capability of (Equation 3-20) at 14790 K, where the complex trajectory tests
had been conducted. Therefore, for purposes of evaluation of the complex trajectory
tests, the following equation was developed for TDNiCr using 14790 K basic cyclic test3-155
PMCDONNELL DOUGLAS ASTRONAUTICS COMIPANYv . EAST
't'PREDICTION OF CREEP IN PHASE I NAS-1-11774
METALLIC TPS PANELS SUMMARY REPORT
data (tests 5 and 6).
In E = -11.4831 +2.2404 In a +.4127 In t (3-21)
Comparisons of predictions using this equation in conjunction with the strain harden-
ing theory of creep accumulation for the two-step stress profile (test 7) are shown
in Figure 3-128. Predictions using the time hardening theory were approximately 90%
of those using strain hardening.
Predictions using Equation 3-21 in conjunction with strain hardening are approxi-
mately 50% of values obtained in the idealized and simulated mission tests (tests
8, 9, and 10). This variation may be attributable to an effect of increasing creep
response in the case where load is maintained into the portions of the trajectory
profile where temperature is reduced. This effect was noted previously for Rene' 41.
3.4.8 TDNiCr CONCLUSIONS
Evaluation of TDNiCr, from the standpoint of creep deflections in TPS panels,
represents a completely different case than the other three materials studied
under this program. This is primarily because relatively little creep is evident
in this material before failures occur. Therefore, the requirement for definition
of creep deflection is minimized in the design criteria for TDNiCr TPS.
TDNiCr tensile specimens were tested at steady-state conditions over the
temperature range of 10890 K (1500F) to 1479
0K (22000 F) to approximately
200 hours. Significant scatter was observed in both the literature survey data
base and supplemental tests. The following empirical regression equation was
developed for the data base, showing both material thickness and rolling direction
to be significant variables.
in 6 = -12.43906 +.01930a +2.80992T -. 00022t -. 38945 +22.451874 (3-18)
+.35175 Int -1.12398 In4
3-156
MCDONNELL DOUGLAS ASTRONAUTICS COMPANY- EAST
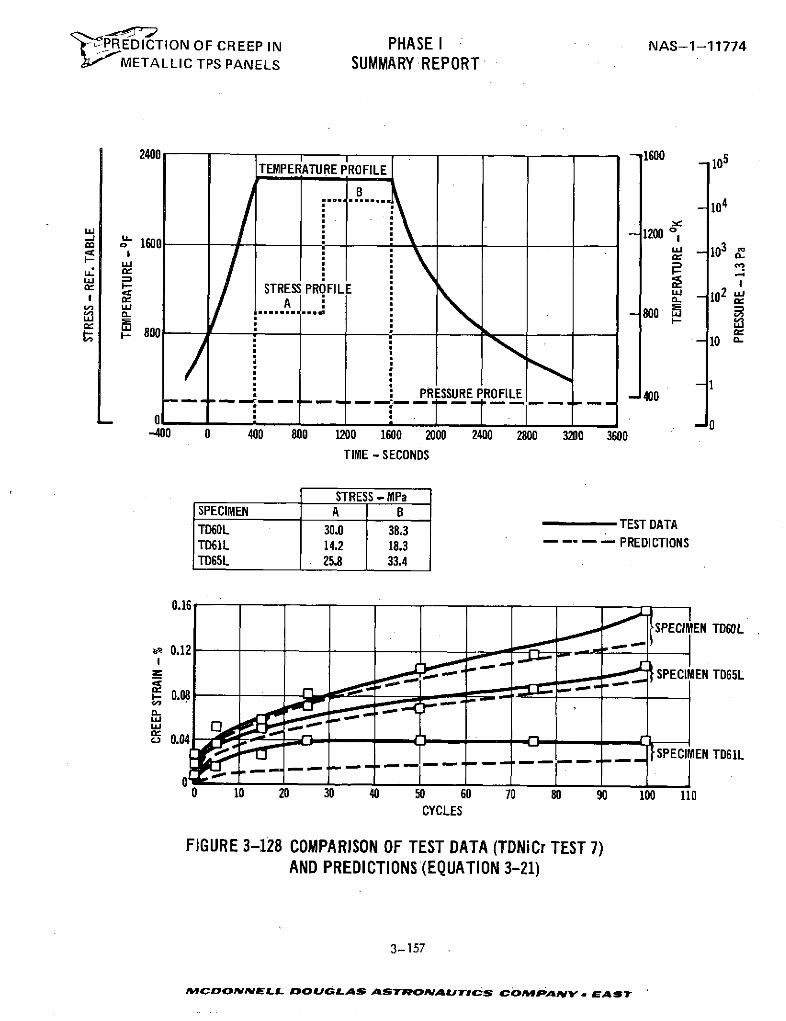
FP0REDICTION OF CREEP IN PHASE I NAS-1-11774I '# METALLIC TPS PANELS SUMMARY REPORT
2400 1600 5T EMPERATURE PROFILE 100 10
B- 104
w .. -1200 oe1600 -.- 13
STRESS PROFILE 2S............ 800
800-
-400 0 400 800 1200 1600 2000 2400 2800 3200 3600TIME -SECONDS
STRESS - MPaSPECIMEN A BTD60L 30.0 38.3 TEST DATATD61L 14.2 18.3 PREDICTIONSTD65L 25.8 33.4
0.16
SPECIMEN TD60L
e-0.12
SPECIMEN TD65L
0.08
0 I
0 0.04SPECIMEN TD61L
0I I I
-----------------------------
0 10 20 30 40 50 60 70 80 90 100 110CYCLES
FIGURE 3-128 COMPARISON OF TEST DATA (TDNiCr TEST 7)AND PREDICTIONS (EQUATION 3-21)
3-157
MCOONNELL DOUGLAS ASTRONAUTICS COMPANY . EAST
' PREDICTION OF CREEP IN PHASE I NAS-1-11774
J;;--METALLIC TPS PANELS SUMMARY REPORT
Supplemental test results also showed that specimens tested in the transverse
direction crept faster than those tested in the longitudinal direction and that,
as is the case of Rene' 41, thinner gage crept less than the thicker material.
This phenomenon for TD NiCr was observed in References 17 and 30. An extensive dis-
cussion of the possible causes of this are presented in Reference 30 but in general
it appears to be a result of the variation in proc essing required to produce a
"cubic texture" in the sheet.
The following empirical regression equation was developed for cyclic test data:
In E = -3.48443 -10.37282 ( ) + .28314 In t +2.00118 Ino (3-20)
This equation is applicable over the temperature range of 10890K to 1479 0K
for times up to 33 hours (100 cycles at 20 minutes per cycle). No significant
difference could be determined between supplemental steady-state test data and
cyclic data sets.
Stress rupture failures were obtained at creep strains of approximately .11%
throughout the cyclic test temperature range. No effect of time per cycle (for
the same total time) or atmospheric pressure could be determined in cyclic testing.
Predictions were approximately 50% of trajectory cyclic creep test data.
The strain hardening theory of creep accumulation provided the best predictions
with time hardening theory yielding even lower values. This relationship between
predictions and test strains is the same as obtained for Rene' 41.
Atmospheric pressure and time between cycling do not appear to have a
significant effect on cyclic creep,
3-158
M sCDONNELL DOUGiLAB ASTRONAUJTICS COMPANYV EAST
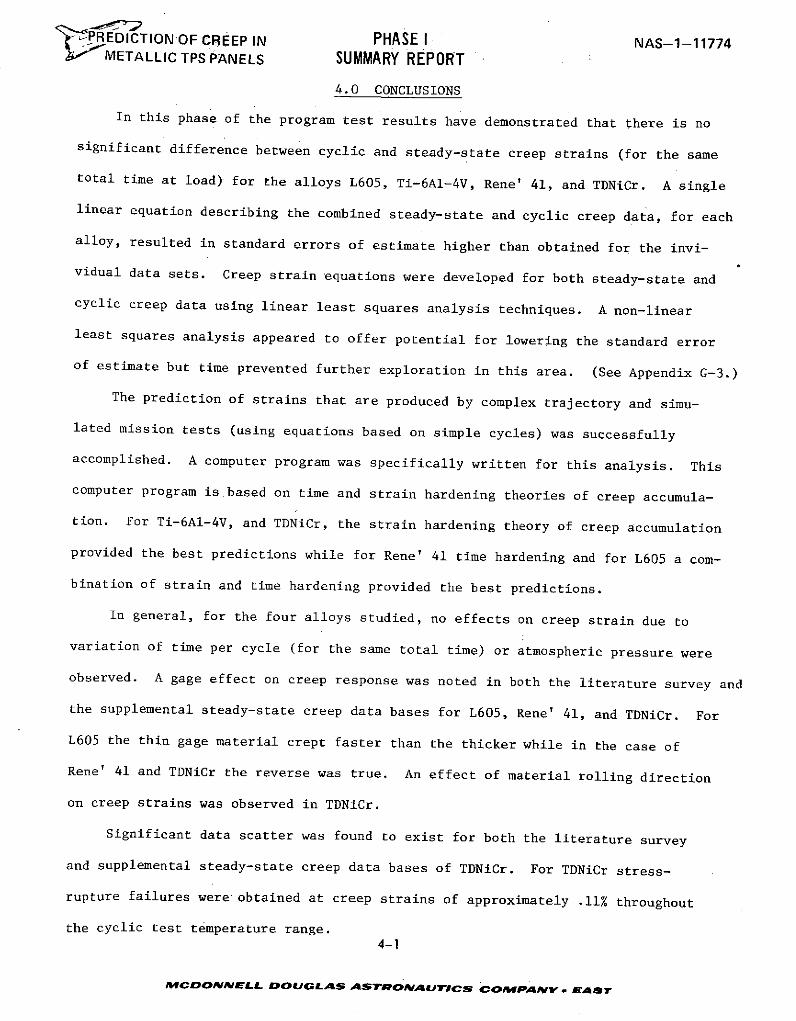
P1?REDICTION OF CREEP IN PHASE I NAS-1-11774METALLIC TPS PANELS SUMMARY REPORT
4.0 CONCLUSIONS
In this phase of the program test results have demonstrated that there is no
significant difference between cyclic and steady-state creep strains (for the same
total time at load) for the alloys L605, Ti-6Al-4V, Rene' 41, and TDNiCr. A single
linear equation describing the combined steady-state and cyclic creep data, for each
alloy, resulted in standard errors of estimate higher than obtained for the invi-
vidual data sets. Creep strain equations were developed for both steady-state and
cyclic creep data using linear least squares analysis techniques. A non-linear
least squares analysis appeared to offer potential for lowering the standard error
of estimate but time prevented further exploration in this area. (See Appendix G-3.)
The prediction of strains that are produced by complex trajectory and simu-
lated mission tests (using equations based on simple cycles) was successfully
accomplished. A computer program was specifically written for this analysis. This
computer program is.based on time and strain hardening theories of creep accumula-
tion. For Ti-6Al-4V, and TDNiCr, the strain hardening theory of creep accumulation
provided the best predictions while for Rene' 41 time hardening and for L605 a com-
bination of strain and time hardening provided the best predictions.
In general, for the four alloys studied, no effects on creep strain due to
variation of time per cycle (for the same total time) or atmospheric pressure were
observed. A gage effect on creep response was noted in both the literature survey and
the supplemental steady-state creep data bases for L605, Rene' 41, and TDNiCr. For
L605 the thin gage material crept faster than the thicker while in the case of
Rene' 41 and TDNiCr the reverse was true. An effect of material rolling direction
on creep strains was observed in TDNiCr.
Significant data scatter was found to exist for both the literature survey
and supplemental steady-state creep data bases of TDNiCr. For TDNiCr stress-
rupture failures were obtained at creep strains of approximately .11% throughout
the cyclic test temperature range.4-1
MCDONNELL OOUGLAS ASTRONAUTICS COMPANY . AST
,1 PHASE I NAS-1-11774,P-REDICTION OF CREEP IN,;o' METALLIC TPS PANELS SUMMARY REPORT
Comparison of data obtained from idealized and simulated mission tests indicates
that cyclic creep response analyses can be performed through the use of the simpler
idealized approach.
Specific conclusions as they relate to the individual alloys are presented in
the specific alloy sections of this report.
4-2
MCDaONaNELL DOUaGLAS ASTRONAUTICS COSMPANV m EAST
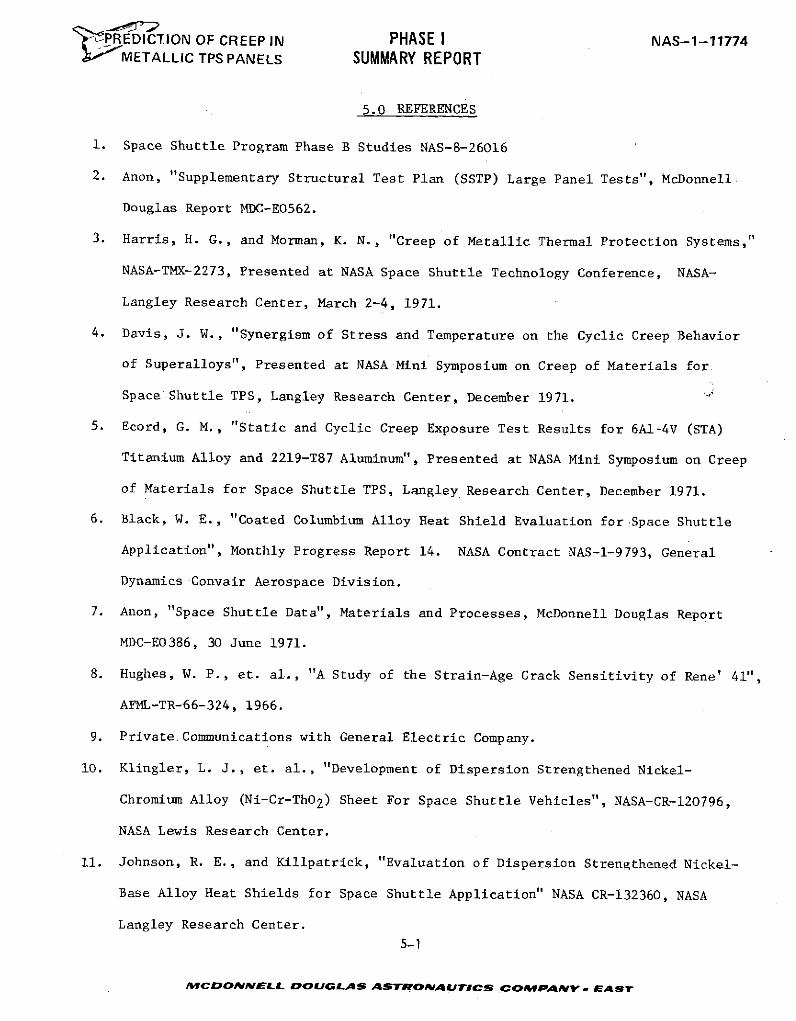
1PREDICTION OF CREEP IN PHASE I NAS-1-11774g- METALLIC TPS PANELS SUMMARY REPORT
5.0 REFERENCES
i. Space Shuttle Program Phase B Studies NAS-8-26016
2. Anon, "Supplementary Structural Test Plan (SSTP) Large Panel Tests", McDonnell
Douglas Report MDC-E0562.
3. Harris, H. G., and Morman, K. N., "Creep of Metallic Thermal Protection Systems,"
NASA-TMX-2273, Presented at NASA Space Shuttle Technology Conference, NASA-
Langley Research Center, March 2-4, 1971.
4. Davis, J. W., "Synergism of Stress and Temperature on the Cyclic Creep Behavior
of Superalloys", Presented at NASA Mini Symposium on Creep of Materials for
Space Shuttle TPS, Langley Research Center, December 1971.
5. Ecord, G. M., "Static and Cyclic Creep Exposure Test Results for 6Al-4V (STA)
Titanium Alloy and 2219-T87 Aluminum", Presented at NASA Mini Symposium on Creep
of Materials for Space Shuttle TPS, Langley Research Center, December 1971.
6. Black, W. E., "Coated Columbium Alloy Heat Shield Evaluation for Space Shuttle
Application", Monthly Progress Report 14. NASA Contract NAS-1-9793, General
Dynamics Convair Aerospace Division.
7. Anon, "Space Shuttle Data", Materials and Processes, McDonnell Douglas Report
MDC-E0386, 30 June 1971.
8. Hughes, W. P., et. al., "A Study of the Strain-Age Crack Sensitivity of Rene' 41",
AFML-TR-66-324, 1966.
9. Private Communications with General Electric Company.
10. Klingler, L. J., et. al., "Development of Dispersion Strengthened Nickel-
Chromium Alloy (Ni-Cr-Th02 ) Sheet For Space Shuttle Vehicles", NASA-CR-120796,
NASA Lewis Research Center.
11. Johnson, R. E., and Killpatrick, "Evaluation of Dispersion Strengthened Nickel-
Base Alloy Heat Shields for Space Shuttle Application" NASA CR-132360, NASA
Langley Research Center.
5-1
MCDONNELL DOUGLAS ASTRONAUTICS COMPANY. EAST
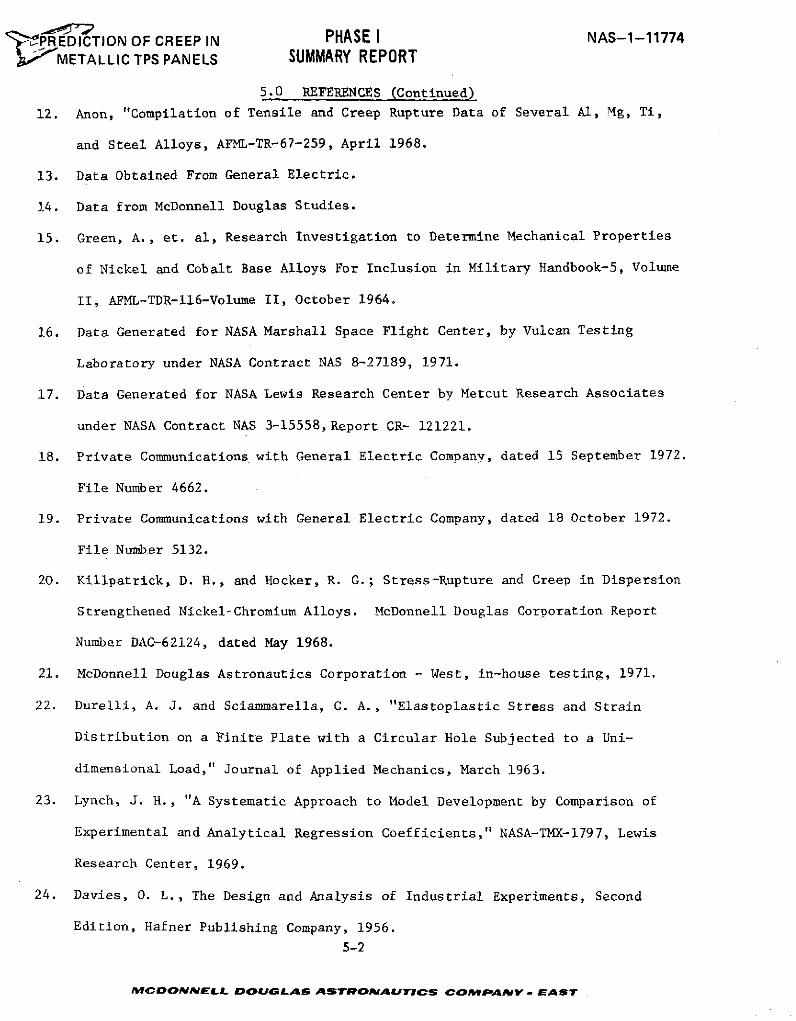
REDICTION OF CREEP IN PHASE I NAS-1-11774METALLIC TPS PANELS SUMMARY REPORT
5.0 REFERENCES (Continued)
12. Anon, "Compilation of Tensile and Creep Rupture Data of Several Al, Mg, Ti,
and Steel Alloys, AFML-TR-67-259, April 1968.
13. Data Obtained From General Electric.
14. Data from McDonnell Douglas Studies.
15. Green, A., et. al, Research Investigation to Determine Mechanical Properties
of Nickel and Cobalt Base Alloys For Inclusion in Military Handbook-5, Volume
II, AFML-TDR-116-Volume II, October 1964.
16. Data Generated for NASA Marshall Space Flight Center, by Vulcan Testing
Laboratory under NASA Contract NAS 8-27189, 1971.
17. Data Generated for NASA Lewis Research Center by Metcut Research Associates
under NASA Contract NAS 3-15558,Report CR- 121221.
18. Private Communications with General Electric Company, dated 15 September 1972.
File Number 4662.
19. Private Communications with General Electric Company, dated 18 October 1972.
File Number 5132.
20. Killpatrick, D. H., and Hocker, R. G.; Stress-Rupture and Creep in Dispersion
Strengthened Nickel-Chromium Alloys. McDonnell Douglas Corporation Report
Number DAC-62124, dated May 1968.
21. McDonnell Douglas Astronautics Corporation - West, in-house testing, 1971.
22. Durelli, A. J. and Sciammarella, C. A., "Elastoplastic Stress and Strain
Distribution on a Finite Plate with a Circular Hole Subjected to a Uni-
dimensional Load," Journal of Applied Mechanics, March 1963.
23. Lynch, J. H., "A Systematic Approach to Model Development by Comparison of
Experimental and Analytical Regression Coefficients," NASA-TMX-1797, Lewis
Research Center, 1969.
24. Davies, O. L., The Design and Analysis of Industrial Experiments, Second
Edition, Hafner Publishing Company, 1956.
5-2
MICOONNELL DOUGLAS ASTRONAUTICS COMPANY - EA ST
'PREDICTION OF CREEP IN PHASE I NAS-1-11774METALLIC TPS PANELS SUMMARY REPORT
5.0 REFERENCES (Continued)
25. Dixon, W. J., "Biomedical Computer Programs (BMD)," Automatic Computation
No. 2, University of California.
26. Dorn, J.E., Mechanical Behavior of Materials at Elevated Temperature,
McGraw Hill Book Company, 1961, pages 79 - 93 and 455 - 457.
27. Draper, N. R., and Smith, H., Applied Regression Analysis, John Wiley
pages 27, 77 - 105, and 134 - 142.
28. Garafalo, F., Fundamentals of Creep and Creep-Rupture in Metals, MacMillan
Company, 1965, page 16.
29. Private Communications with R. B. Herchenroeder, Cabot Corporation.
30. Discussions with D. H. Killpatrick, MDAC-W, based on his work on "The Effect
of Texture on the Elevated Temperature Mechanical Properties of Dispersion
Strengthened Nickel-20 Chromium Alloys," McDonnell Douglas Corporation Report
Number DAC-62153, dated February 1970.
5-3
MCDONNELL DOUGLAS ASTRONAMUTIC COMPAWNY -. As
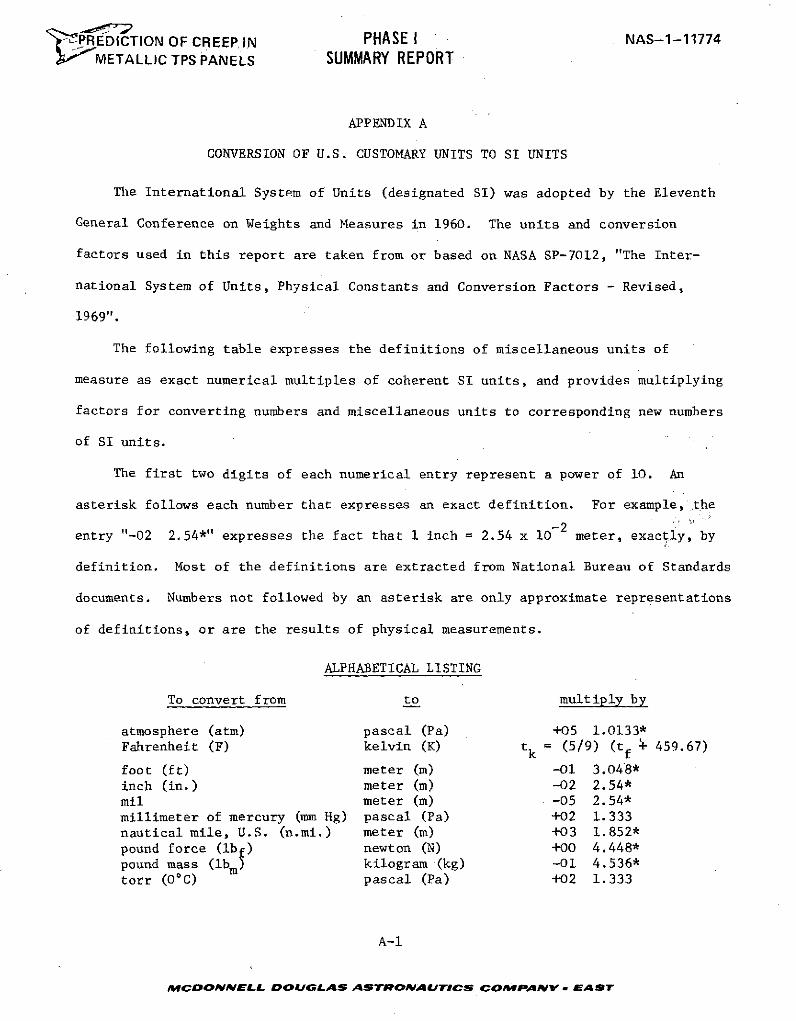
rP-REDICTION OF CREEP IN PHASE I NAS-1-11774
METALLIC TPS PANELS SUMMARY REPORT
APPENDIX A
CONVERSION OF U.S. CUSTOMARY UNITS TO SI UNITS
The International System of Units (designated SI) was adopted by the Eleventh
General Conference on Weights and Measures in 1960. The units and conversion
factors used in this report are taken from or based on NASA SP-7012, "The Inter-
national System of Units, Physical Constants and Conversion Factors - Revised,
1969".
The following table expresses the definitions of miscellaneous units of
measure as exact numerical multiples of coherent SI units, and provides multiplying
factors for converting numbers and miscellaneous units to corresponding new numbers
of SI units.
The first two digits of each numerical entry represent a power of 10. An
asterisk follows each number that expresses an exact definition. For example, the
entry "-02 2.54*" expresses the fact that 1 inch = 2.54 x 10- 2 meter, exactly, by
definition. Most of the definitions are extracted from National Bureau of Standards
documents. Numbers not followed by an asterisk are only approximate representations
of definitions, or are the results of physical measurements.
ALPHABETICAL LISTING
To convert from to multiply by
atmosphere (atm) pascal (Pa) +05 1.0133*Fahrenheit (F) kelvin (K) tk = (5/9) (tf 4 459.67)
foot (ft) meter (m) -01 3.048*
inch (in.) meter (m) -02 2.54*
mil meter (m) -05 2.54*
millimeter of mercury (mm Hg) pascal (Pa) +02 1.333nautical mile, U.S. (n.mi.) meter (m) +03 1.852*
pound force (lbf) newton (N) +00 4.448*
pound mass (ibm ) kilogram (kg) -01 4.536*
torr (00 C) pascal (Pa) +02 1.333
A-i
MCDONNELL DOUGLAS ASTRONAUTICS COMPANV - EAST
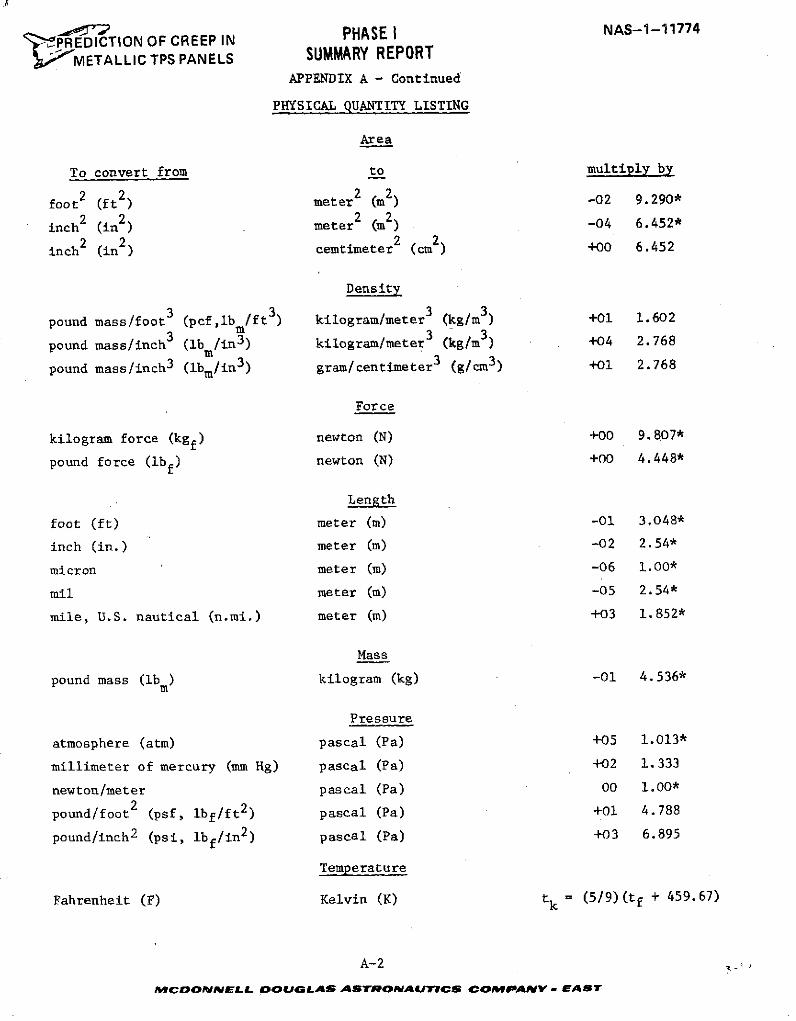
PHASE I NAS-1-11774, PREDICTION OF CREEP IN
METALLIC TPS PANELS SUMMARY REPORTAPPENDIX A - Continued
PHYSICAL QUANTITY LISTING
Area
To convert from to multiply by
foot 2 (ft2 ) meter2 (m2) -02 9.290*
inch 2 (in2) meter2 (m2) -04 6.452*
inch 2 (in2) cemtimeter2 (cm2) +00 6.452
Density
pound mass/foot 3 (pcf,lb /ft3) kilogram/meter3 (kg/m3) +01 1.602
pound mass/inch 3 (lb /inm) kilogram/meter3 (kg/m3 ) +04 2.768
pound mass/inch3 (ibm/in 3) gram/centimeter3 (g/cm3) +01 2.768
Force
kilogram force (kgf) newton (N) +00 9.807*
pound force (lbf) newton (N) +00 4.448*
Length
foot (ft) meter (m) -01 3.048*
inch (in.) meter (m) -02 2.54*
micron meter (m) -06 1.00*
mil meter (m) -05 2.54*
mile, U.S. nautical (n.mi.) meter (m) +03 1.852*
Mass
pound mass (Ibm) kilogram (kg) -01 4.536*
Pressure
atmosphere (atm) pascal (Pa) +05 1.013*
millimeter of mercury (mm Hg) pascal (Pa) +02 1.333
newton/meter pascal (Pa) 00 1.00*
pound/foot2 (psf, lbf/ft2 ) pascal (Pa) +01 4.788
pound/inch 2 (psi, lbf/in2 ) pascal (Pa) +03 6.895
Temperature
Fahrenheit (F) Kelvin (K) tk = (5/9)(tf + 459.67)
A-2
MCDONNELL DOUGLAS ASTRSONAUICS C OMPANYV- CAST
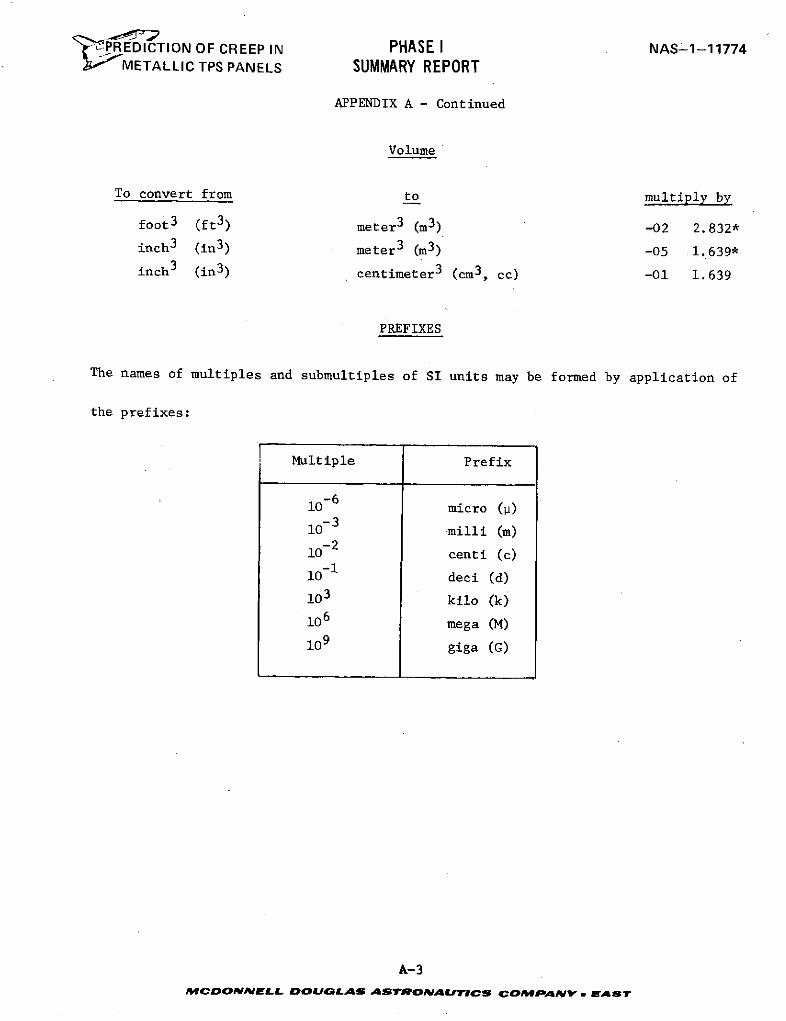
-"tPREDICTION OF CREEP IN PHASE I NAS-L1-117742# METALLIC TPS PANELS SUMMARY REPORT
APPENDIX A - Continued
Volume
To convert from to multiply by
foot 3 (ft3) meter3 (m3) -02 2.832*
inch 3 (in3) meter 3 (m3) -05 1.639*
inch 3 (in3) centimeter3 (cm3 , cc) -01 1.639
PREFIXES
The names of multiples and submultiples of SI units may be formed by application of
the prefixes:
Multiple Prefix
10- 6 micro (W)
0- 3
10-3 milli (m)
10- 2 centi (c)
10-1 deci (d)
103 kilo (k)
106 mega (M)
109 giga (G)
A-3
MCOONNELL DOUGLAS ASTRONAUTICS COMPANYV - AST
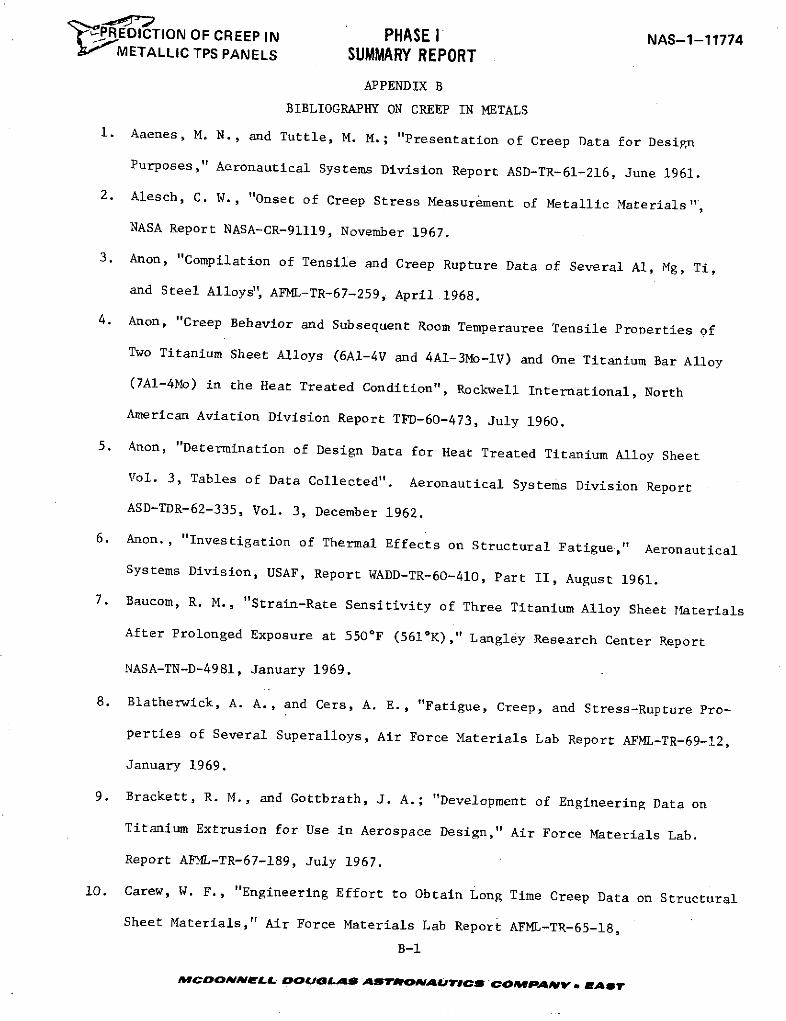
" P EDICTION OF CREEP IN PHASE I NAS-1-11774METALLIC TPS PANELS SUMMARY REPORT
APPENDIX B
BIBLIOGRAPHY ON CREEP IN METALS
1. Aaenes, M. N., and Tuttle, M. M.; "Presentation of Creep Data for Design
Purposes," Aeronautical Systems Division Report ASD-TR-61-216, June 1961.
2. Alesch, C. W., "Onset of Creep Stress Measurement of Metallic Materials",
NASA Report NASA-CR-91119, November 1967.
3. Anon, "Compilation of Tensile and Creep Rupture Data of Several Al, Mg, Ti,
and Steel Alloys", AFML-TR-67-259, April 1968.
4. Anon, "Creep Behavior and Subsequent Room Temperauree Tensile Properties of
Two Titanium Sheet Alloys (6AI-4V and 4A1-3Mo-lV) and One Titanium Bar Alloy
(7Al-4Mo) in the Heat Treated Condition", Rockwell International, North
American Aviation Division Report TFD-60-473, July 1960.
5. Anon, "Determination of Design Data for Heat Treated Titanium Alloy Sheet
Vol. 3, Tables of Data Collected". Aeronautical Systems Division Report
ASD-TDR-62-335, Vol. 3, December 1962.
6. Anon., "Investigation of Thermal Effects on Structural Fatigue," Aeronautical
Systems Division, USAF, Report WADD-TR-60-410, Part II, August 1961.
7. Baucom, R. M., "Strain-Rate Sensitivity of Three Titanium Alloy Sheet Materials
After Prolonged Exposure at 5500 F (561*K)," Langley Research Center Report
NASA-TN-D-4981, January 1969.
8. Blatherwick, A. A., and Cers, A. E., "Fatigue, Creep, and Stress-Rupture Pro-
perties of Several Superalloys, Air Force Materials Lab Report AFML-TR-69--2,
January 1969.
9. Brackett, R. M., and Gottbrath, J. A.; "Development of Engineering Data on
Titanium Extrusion for Use in Aerospace Design," Air Force Materials Lab.
Report AFML-TR-67-189, July 1967.
10. Carew, W. F., "Engineering Effort to Obtain Long Time Creep Data on Structural
Sheet Materials," Air Force Materials Lab Report AFML-TR-65-18,
B-1
&CDOOINELL DOUGLAS ASTROAAVUTIC COMPANV * EAST
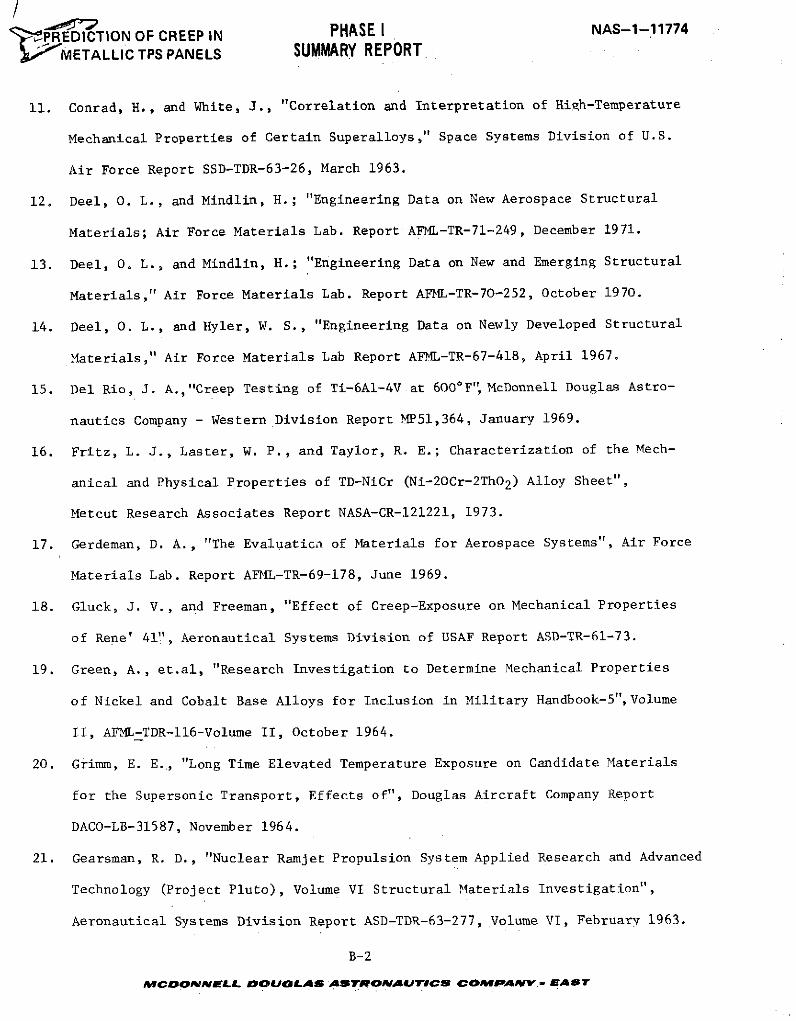
-,'PREDICTION OF CREEP IN PHASE I NAS-1-11774
METALLIC TPS PANELS SUMMARY REPORT
11. Conrad, H., and White, J., "Correlation and Interpretation of High-Temperature
Mechanical Properties of Certain Superalloys," Space Systems Division of U.S.
Air Force Report SSD-TDR-63-26, March 1963.
12. Deel, 0. L., and Mindlin, H.; "Engineering Data on New Aerospace Structural
Materials; Air Force Materials Lab. Report AFML-TR-71-249, December 1971.
13. Deel, 0. L., and Mindlin, H.; "Engineering Data on New and Emerging Structural
Materials," Air Force Materials Lab. Report AFML-TR-70-252, October 1970.
14. Deel, 0. L., and Hyler, W. S., "Engineering Data on Newly Developed Structural
Materials," Air Force Materials Lab Report AFML-TR-67-418, April 1967.
15. Del Rio, J. A.,"Creep Testing of Ti-6A1-4V at 6000F', McDonnell Douglas Astro-
nautics Company - Western Division Report MP51,364, January 1969.
16. Fritz, L. J., Laster, W. P., and Taylor, R. E.; Characterization of the Mech-
anical and Physical Properties of TD-NiCr (Ni-2OCr-2ThO2) Alloy Sheet",
Metcut Research Associates Report NASA-CR-121221, 1973.
17. Gerdeman, D. A., "The Evaluaticn of Materials for Aerospace Systems", Air Force
Materials Lab. Report AFML-TR-69-178, June 1969.
18. Gluck, J. V., and Freeman, "Effect of Creep-Exposure on Mechanical Properties
of Rene' 41", Aeronautical Systems Division of USAF Report ASD-TR-61-73.
19. Green, A., et.al, "Research Investigation to Determine Mechanical Properties
of Nickel and Cobalt Base Alloys for Inclusion in Military Handbook-5", Volume
II, AFML-TDR-116-Volume II, October 1964.
20. Grimm, E. E., "Long Time Elevated Temperature Exposure on Candidate Materials
for the Supersonic Transport, Effects of", Douglas Aircraft Company Report
DACO-LB-31587, November 1964.
21. Gearsman, R. D., "Nuclear Ramjet Propulsion System Applied Research and Advanced
Technology (Project Pluto), Volume VI Structural Materials Investigation",
Aeronautical Systems Division Report ASD-TDR-63-277, Volume VI, February 1963.
B-2
MCDONNELL DOUGLAS ASTRONArUTICS COMPWANV.- EAST
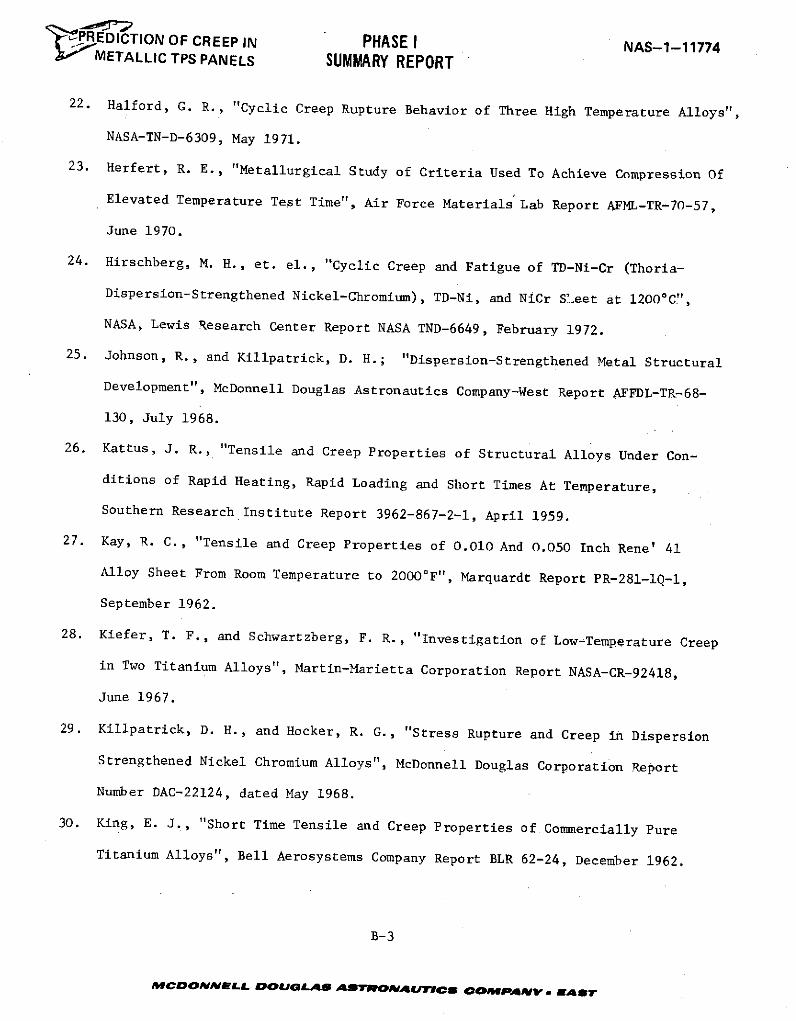
' .PREDICTION OF CREEP IN PHASE I NAS-1-11774METALLIC TPS PANELS SUMMARY REPORT
22. Halford, G. R., "Cyclic Creep Rupture Behavior of Three High Temperature Alloys",
NASA-TN-D-6309, May 1971.
23. Herfert, R. E., "Metallurgical Study of Criteria Used To Achieve Compression Of
Elevated Temperature Test Time", Air Force Materials Lab Report AFML-TR-70-57,
June 1970.
24. Hirschberg, M. H., et. el., "Cyclic Creep and Fatigue of TD-Ni-Cr (Thoria-
Dispersion-Strengthened Nickel-Chromium), TD-Ni, and NiCr SL-eet at 1200 0C",
NASA, Lewis Research Center Report NASA TND-6649, February 1972.
25. Johnson, R., and Killpatrick, D. H.; "Dispersion-Strengthened Metal Structural
Development", McDonnell Douglas Astronautics Company-West Report AFFDL-TR-68-
130, July 1968.
26. Kattus, J. R., "Tensile and Creep Properties of Structural Alloys Under Con-
ditions of Rapid Heating, Rapid Loading and Short Times At Temperature,
Southern Research Institute Report 3962-867-2-1, April 1959.
27. Kay, R. C., "Tensile and Creep Properties of 0.010 And 0.050 Inch Rene' 41
Alloy Sheet From Room Temperature to 2000 0F", Marquardt Report PR-281-lQ-1,
September 1962.
28. Kiefer, T. F., and Schwartzberg, F. R., "Investigation of Low-Temperature Creep
in Two Titanium Alloys", Martin-Marietta Corporation Report NASA-CR-92418,
June 1967.
29. Killpatrick, D. H., and Hocker, R. G., "Stress Rupture and Creep in Dispersion
Strengthened Nickel Chromium Alloys", McDonnell Douglas Corporation Report
Number DAC-22124, dated May 1968.
30. King, E. J., "Short Time Tensile and Creep Properties of Commercially Pure
Titanium Alloys", Bell Aerosystems Company Report BLR 62-24, December 1962.
B-3
MCDONNELL DOULAS ANTONPAUVICs COMwAPNVr EaeT
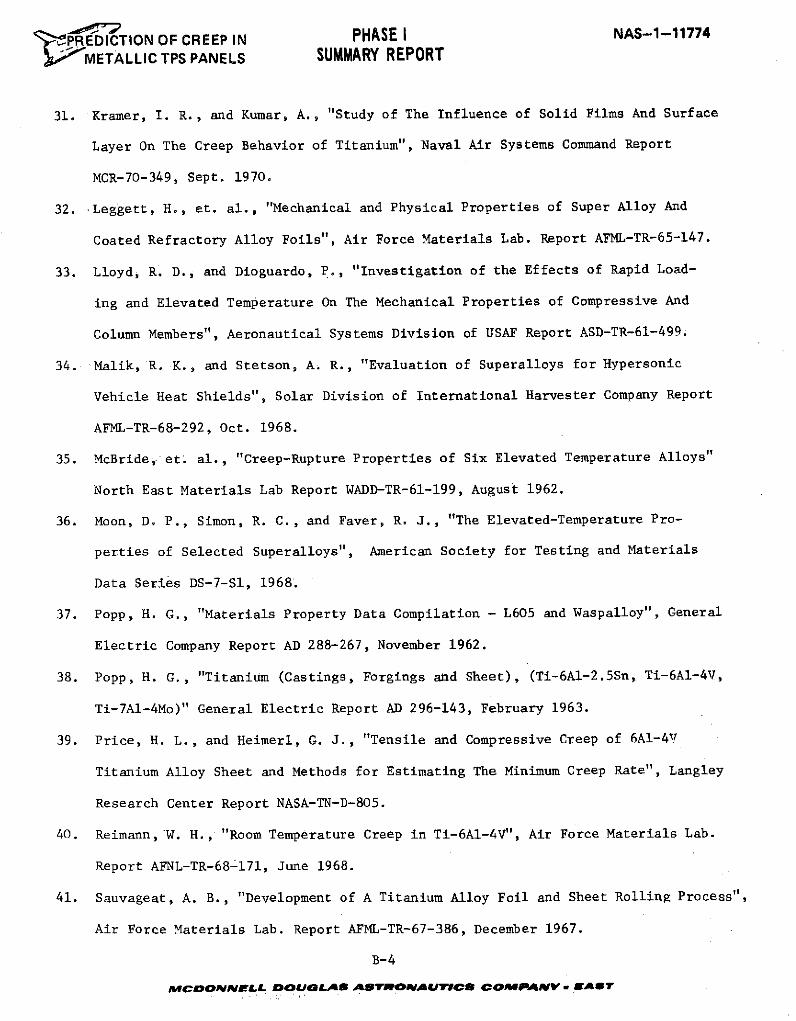
' PREDITION OF CREEP IN PHASE I NAS-1-11774
j;-METALLIC TPS PANELS SUMMARY REPORT
31. Kramer, I. R., and Kumar, A., "Study of The Influence of Solid Films And Surface
Layer On The Creep Behavior of Titanium", Naval Air Systems Command Report
MCR-70-349, Sept. 1970.
32. *Leggett, H., et. al., "Mechanical and Physical Properties of Super Alloy And
Coated Refractory Alloy Foils", Air Force Materials Lab. Report AFML-TR-65-147.
33. Lloyd, R. D., and Dioguardo, P., "Investigation of the Effects of Rapid Load-
ing and Elevated Temperature On The Mechanical Properties of Compressive And
Column Members", Aeronautical Systems Division of USAF Report ASD-TR-61-499.
34. Malik, R. K., and Stetson, A. R., "Evaluation of Superalloys for Hypersonic
Vehicle Heat Shields", Solar Division of International Harvester Company Report
AFML-TR-68-292, Oct. 1968.
35. McBride, et. al., "Creep-Rupture Properties of Six Elevated Temperature Alloys"
North East Materials Lab Report WADD-TR-61-199, August 1962.
36. Moon, D. P., Simon, R. C., and Faver, R. J., "The Elevated-Temperature Pro-
perties of Selected Superalloys", American Society for Testing and Materials
Data Series DS-7-S1, 1968.
37. Popp, H. G., "Materials Property Data Compilation - L605 and Waspalloy", General
Electric Company Report AD 288-267, November 1962.
38. Popp, H. G., "Titanium (Castings, Forgings and Sheet), (Ti-6Al-2.5Sn, Ti-6Al-4V,
Ti-7Al-4Mo)" General Electric Report AD 296-143, February 1963.
39. Price, H. L., and Heimerl, G. J., "Tensile and Compressive Creep of 6Al-4V
Titanium Alloy Sheet and Methods for Estimating The Minimum Creep Rate", Langley
Research Center Report NASA-TN-D-805.
40. Reimann, W. H., "Room Temperature Creep in Ti-6Al-4V", Air Force Materials Lab.
Report AFNL-TR-68-171, June 1968.
41. Sauvageat, A. B., "Development of A Titanium Alloy Foil and Sheet Rolling Process",
Air Force Materials Lab. Report AFML-TR-67-386, December 1967.
B-4
fMCDONNELL DOUGLAjS ASTrOWAUTDs8 COMjPAV . EASY
' -PREDICTION OF CREEP IN PHASE I NAS-1-117741 I METALLIC TPS PANELS SUMMARY REPORT
42. Schwartz, D. B., "Hypersonic Aerospace-Vehicle Structures Program, Vol. I.,
General Structural Analyses Formulations", Martin-Marietta Report AFFDL-TR-68-
129, Vol. I, August 1968.
43. Schwartzberg, F. R., et. al., "The Properties of Titanium Alloys at Elevated
Temperature", Battelle Memorial Institute Report TML-82, Sept. 1957.
44. Swindeman, R. W., "Some Creep-Rupture Data for Newer Heats of Haynes Alloy No.
25 (L605)", Oak Ridge National Laboratory Report ORNL-TM-3028, Aug. 1970.
45. Thompson, O. N., and Jones, R. L., "Intermittent Creep and Stability of
Materials for SST Applications", Air Force Materials Lab Report AFML-TR-66-407,
January 1967.
46. White, D. L., and Watson, H. T., "Determination of Design Data for Heat Treated
Titanium Alloy Sheet. Volume 2B, Test Techniques and Results for Creep and
Fatigue". Aeronautical Systems Division Report ASD-TDR-62-335, Vol. 2B,
December 1962.
47. Widmer, R., et el, "Mechanisms Associated with Long Time Creep Phenomena",
New England Materials Laboratory Report AFML-TR-65-181, June 1965.
48. Wilcox, B. A., and Clauer, A. H., "High Temperature Deformation of Dispersion
Strengthened Nickel Alloys", Part I -"The Influence of Initial Structure on
Tensile and Creep Deformation of T.D. Nickel", Part II-"The Effect of Matrix
Stacking Fault Energy on Creep of Ni-Cr-ThO2 Alloys", Lewis Research Center
Report NASA-CR-72367, February 1968.
49. Wood, R. A., "Aircraft Designers Handbook for Titanium and Titanium Alloys,
Air Force Materials Lab. Report AFML-TR-67-142, March 1967.
50. Wurst, J. C., et. al., "The Evaluation of Materials for Aerospace Applications",
Air Force Materials Lab. Report AFML-TR-67-165, June 1967.
B-5
MCDONNELL DOUGLAS ASTRONAMTICS COMPANV * EAST
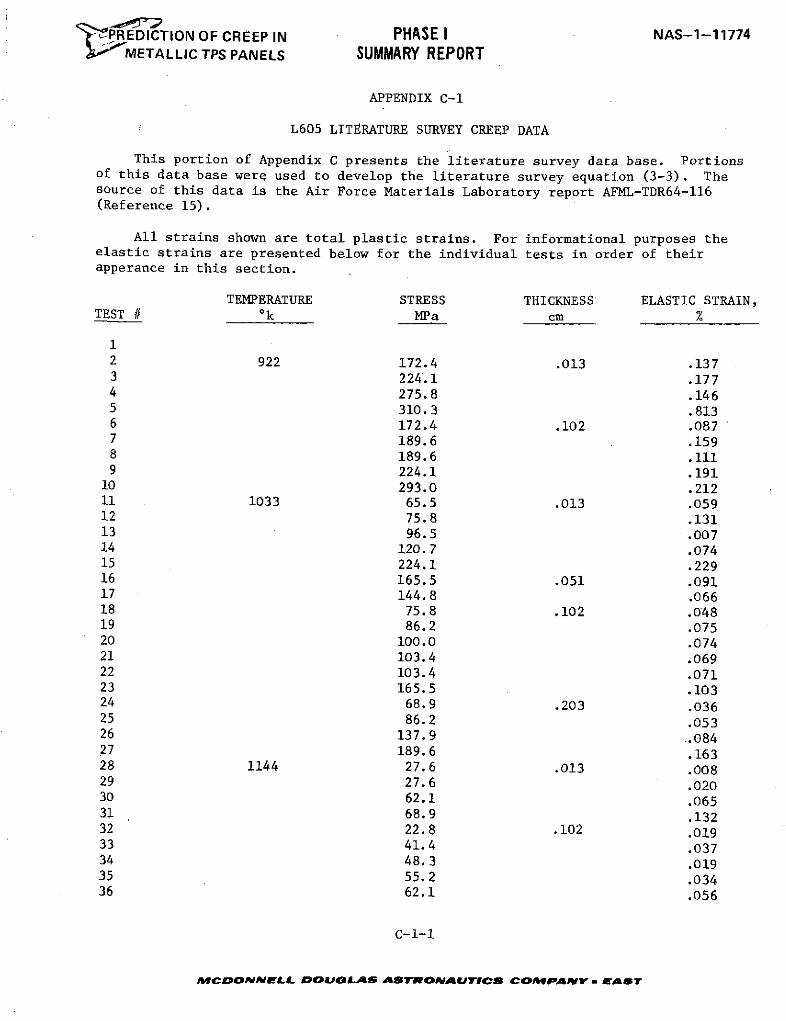
"jPREDICTION OF CREEP IN PHASE I NAS-1-11774METALLIC TPS PANELS SUMMARY REPORT
APPENDIX C-I
L605 LITERATURE SURVEY CREEP DATA
This portion of Appendix C presents the literature survey data base. Portionsof this data base were used to develop the literature survey equation (3-3). Thesource of this data is the Air Force Materials Laboratory report AFML-TDR64-116(Reference 15).
All strains shown are total plastic strains. For informational purposes theelastic strains are presented below for the individual tests in order of theirapperance in this section.
TEMPERATURE STRESS THICKNESS ELASTIC STRAIN,TEST # ok MPa cm %
12 922 172.4 .013 .1373 224.1 .1774 275.8 .1465 310.3 .8136 172.4 .102 .0877 189.6 .1598 189.6 .1119 224.1 .191
10 293.0 .21211 1033 65.5 .013 .05912 75.8 .13113 96.5 .00714 120.7 .07415 224.1 .22916 165.5 .051 .09117 144.8 .06618 75.8 .102 .04819 86.2 .07520 100.0 .07421 103.4 .06922 103.4 .07123 165.5 .10324 68.9 .203 .03625 86.2 .05326 137.9 .08427 189.6 .16328 1144 27.6 .013 .00829 27.6 .02030 62.1 .06531 68.9 .13232 22.8 .102 .01933 41.4 .03734 48.3 .01935 55.2 .03436 62.1 .056
C-1-1
MCDONNELL DOUGLAS ASTRONAUTrICS COMPAMV a EAST
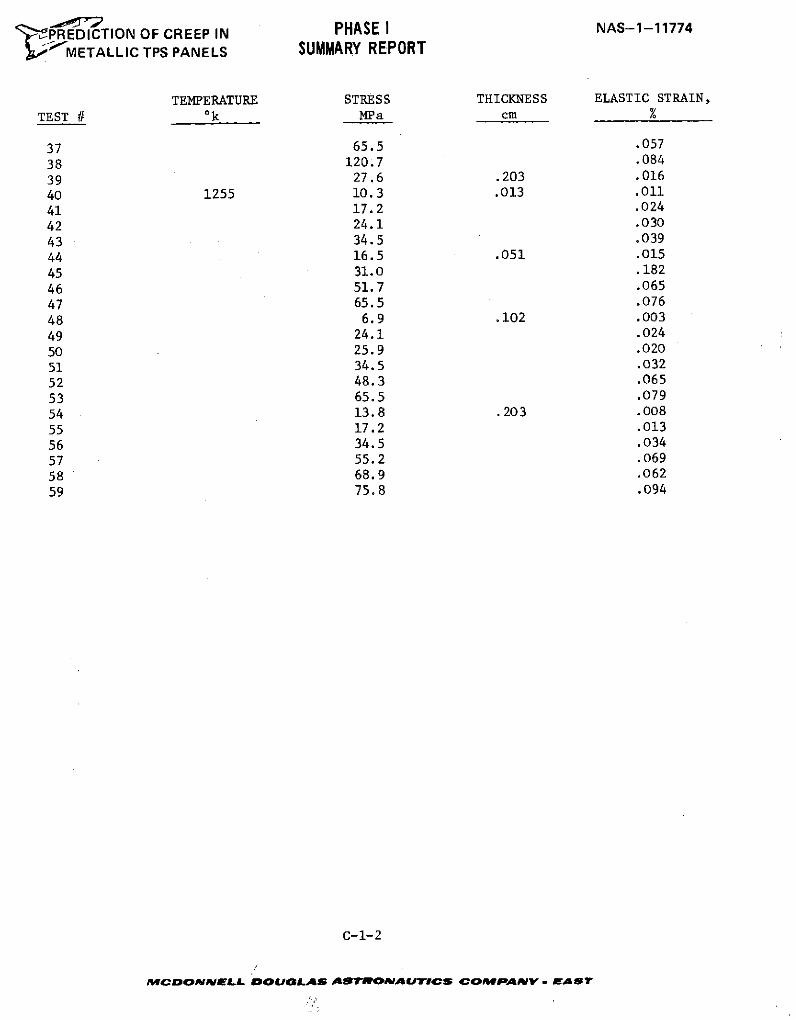
.'Z PREDICTION OF CREEP IN PHASE I NAS-1-11774
,/'METALLIC TPS PANELS SUMMARY REPORT
TEMPERATURE STRESS THICKNESS ELASTIC STRAIN,
TEST # Ok MPa cm %
37 65.5 .057
38 120.7 .084
39 27.6 .203 .016
40 1255 10.3 .013 .011
41 17.2 .024
42 24.1 .030
43 34.5 .039
44 16.5 .051 .015
45 31.0 .182
46 51.7 .065
47 65.5 .076
48 6.9 .102 .003
49 24.1 .024
50 25.9 .020
51 34.5 .032
52 48.3 .065
53 65.5 .079
54 13.8 .203 .008
55 17.2 .013
56 34.5 .034
57 55.2 .069
58 68.9 .062
59 75.8 .094
C-1-2
MCDONNMELL DOUGLAS ASTRONAUTICS COMP*ANy - MA81T
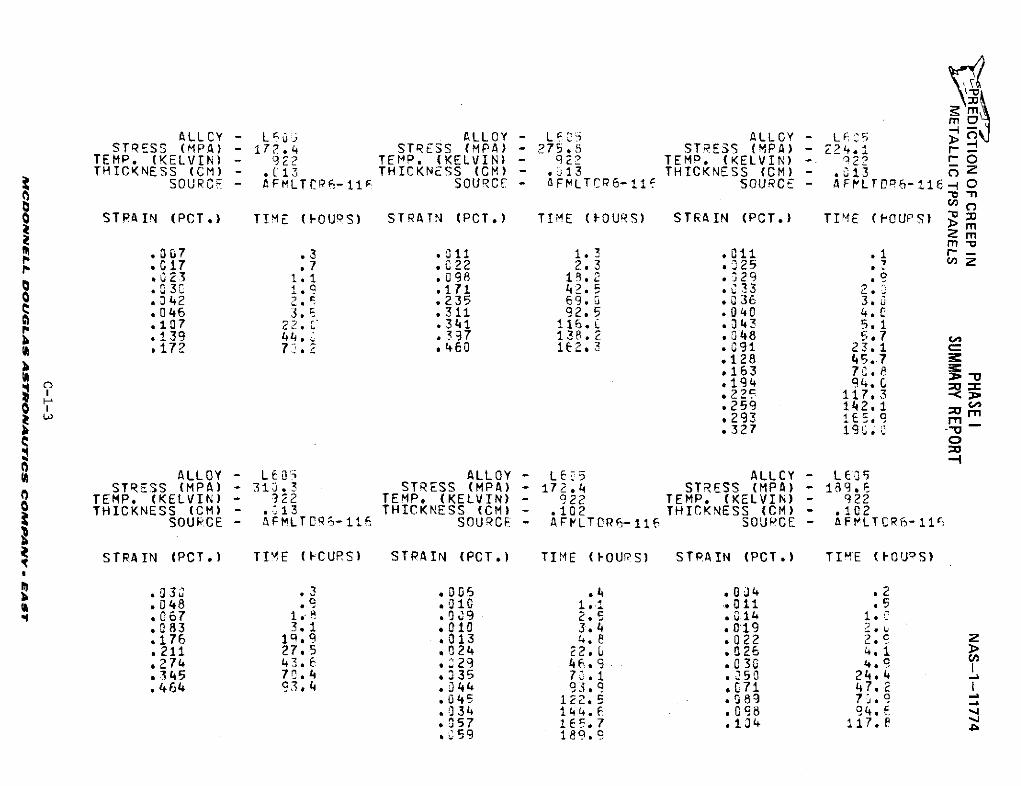
rnm)
ALLCY - LI G ALLOY - L "i ALLCY - LF,7STRESS (MPA) - 172.4 STRESS (MPA) 275.8 STRESS (MPA) - 224.1
TEMP. (KELVIN) - 922 TEMP. (KELVIN) - 922 TEMP. (KELVIN) -. 22 r-THICKNESS (CM) - .[13 THICKNESS (CM) - .13 THICKNESS (CM) - .013 Z
SOURCE - AFMLTC96-11F SOURCE - aFMLTCP6-11 SOURCE - AF LTCP6-116- 0
STRAIN (PCT.) TIME (FOUPS) STRATN (PCT.) TIME (FOURS) STRAIN (PCT.) TIME (OCUPS) : mZm
.0G7 .3 .011 1.3 .11 .1 r-
.017 .7 .022 2.3 .025 .? z
.223 1.1 .098 18.2 .329 .9
.,35 1.9 .171 42.5 .C33 2.
.042 2.- .235 69. .036 3.0
.046 3.5 .311 92.5 .040 4.0
.107 22. .341 116.0 .043 5. 1
.139 44. .397 138.2 .048 5.7 -oE.172 7*46-0 13e .091 23.1 c.172 722 .128 45.7
.163 7C.E
.194 94.
.225 117.3
.259 142.1
.293 165.9 mS.327 19 0. 2 -
31.0
-IALLOY - L60 ALLOY - LS:5 ALLCY - LE09
STRESS (MPA) - 312.3 STRESS (MPA) - 172.4 STRESS (MPA) - 189.6TEMP. (KELVIN) - 322 TEMP. (KELVIN) - 922 TEMP. (KELVIN) - 922THICKNESS (CM) - .013 THICKNESS (CM) - .102 THICKNESS (CM) - .102
SOUFRCE - AFMLTCR%-16 SOURCE - AFVLTORS-116 SOURCE - AFVLTR6-116
STRAIN (PCT.) TIME (I-CURS) STRAIN (PCT.) TIME (FOURS) STRAIN (PCT.) TIME (FOURS)
.030 .3 .006 .4 .004 .2048 . .010 1.1 .011 .5
.067 1.8 .00359 2.5 .014 1
.083 3.1 .010 3.4 .219 2.u
.176 19.9 .013 4.8 P .022 2.q z
.211 27.5 .024 22.L .026 4.1 >
.274 43.6 .29 46.9.. .030 4.9
.345 7 .4 .335 70.1 .050 24.4
.464 93,4 .04 93.9 .071 47.2 I.045 122.5 .089 7.9.034 144.F .09B 94..057 165.7 .134 117.8.059 189.9
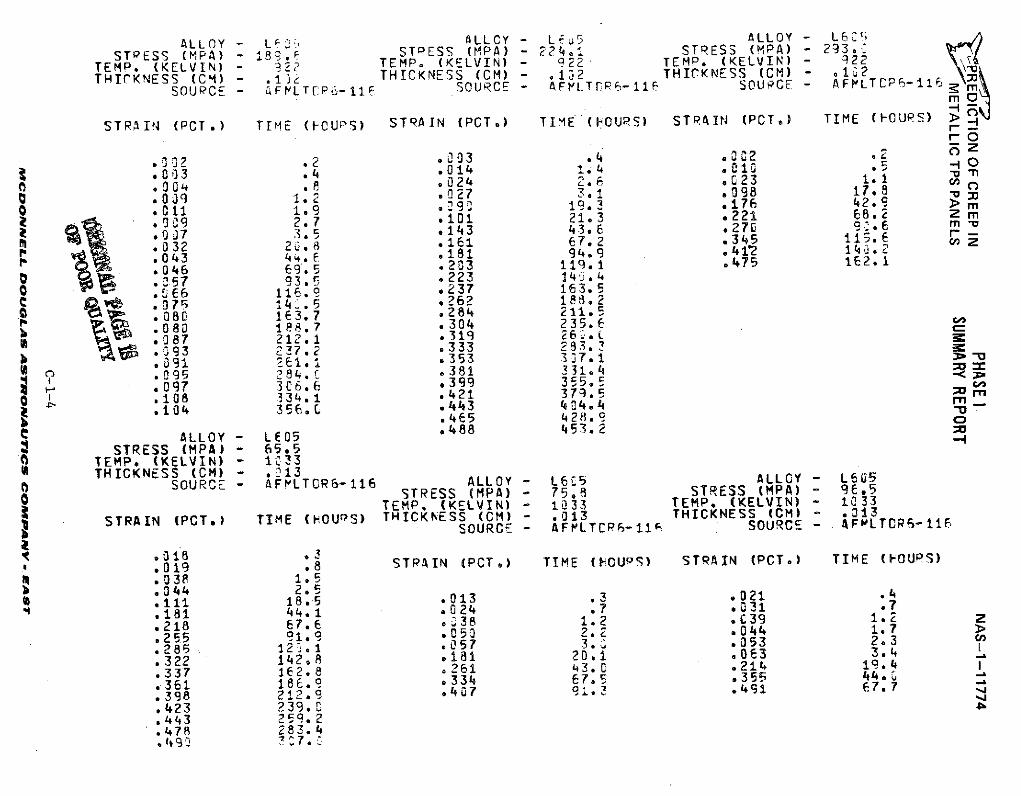
ALLOY - L , ALLCY - L% 5 ALLOY - L6.STRESS (MPA) - STRESS (MPA) - 224.1 STRESS (MPA) - 293.
TEMP (KELVIN) - TEMP. (KELVIN) - 922 TEMP. (KELVIN) - 922
THICKNESS (CM) - 12 THICKNESS (CM) - .132 THICKNESS (CM) - •132SOURCE - 4AFLT[:P6-11F SOURCE - AFrLTEP6-116 SOURCE - AFFLTCP-110
STRAIN (PCT.) TIME (PCUPS) STRAIN (PCT.) TIME ('OURS) STRAIN (PCT.) TIME (-OUPS) >rO
• 3 .2 ..03 .4 22 .2 0zS03 .4 .014 1.4 .n1O ,50. .024 2.6 .023 1.1 n
004 . n27 3.1 .098 17.80 o0 1.92 2 19.3 176 42.9 > m
S9 2.7 •101 21.3 .21 8, m. 07 3.5 .143 43.6 .27 0.6 mr-
S032 2 161 67.2 .345 11E.6 z.043 4,. .181 94.9 .412 14
.046 6.5 .203 119. .475 12. 1
S:-57 93 5 .223 14 .40 E66 116. .237 163.5
75 14.. *262 188.2.080 163.7 *284 211.6.080 188.7 .304 235.fL.087 212.1 .333 2 3.193 237.2 .333
b V 91 121.i .353 3.7.1.9 284. .381 331.4
.097 3C6.6 .399 355.5
- .. 108 334.1 .421 379 6 ;.104 356. .443 404.4 m-
.465 428.9 o
.488 453.2ALLOY - LE05 -4
STRESS (MPA) - 65.5TEMP. (KELVIN) - 1Z33THICKNESS (CM) - .213 ALLOY - L6C5 ALLOY - L605
SOURC - AFLT - STRESS (MPA) - 75.8 STRESS (MPA) - 9E.5TEMP. (KELVIN) 33 TEMP ( VIN) - 1033
STRAIN (POT.) TIME (HOUrS) THICKNESS (CM) - .013 THICKNESS (CM) - .313I PT (SOURCE - AF FLTCP6-11 SOURCE - AF LTCR6-11F
.018 .3
.019 .8 STPAIN (PCT.) TIME (hOUoS) STRAIN (PCT.) TIME (FOUPS)
mi .038 1.5b.34 2.5
111 18.5 .013 .3 .021 .4.181 414.1 .024 .7 .031 .7• 1 . 39 2.218 67.6 .238 1.2 .039 1.2 >.255 91.9 .050 2.2 .054 1.7 3.285 12. .057 3. .053 2.3.322 112,8 .181 20.1 .063 3.4.337 162.8 .261 43.C .214 19.1
.361 180.9 .334 67.5 .355 64.
.398 212.9 .407 91.3 .491 67.
.423 239.1 '
.443 259.2
.478 283.4.0 92 327..
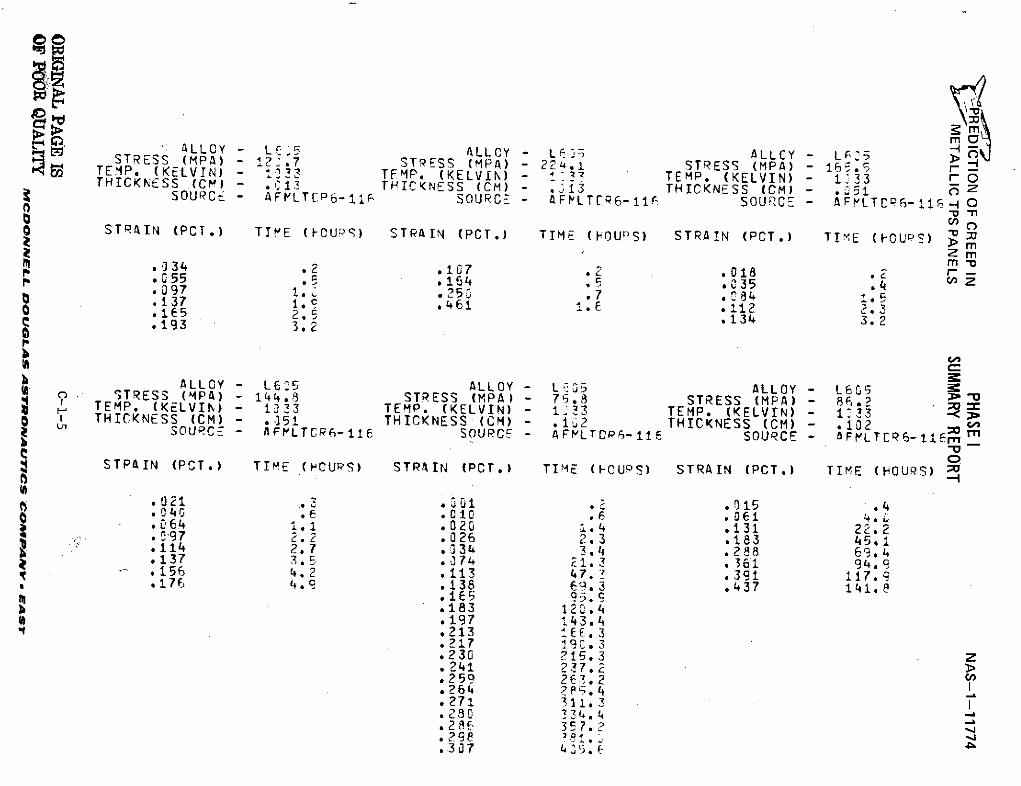
mOSALLCY - L:5 ALLCY - LE> ALLCY - LF:5 n 0STRESS (MPA) - 12.7 STESS (MPA) - 224.1 STRESS (MPA) - r6
S TEMP. (KELVIN) TMP. (KE LVIN) - i 37 TEMP. (KELVIN) - 1 .33 r 0THICKNSS (CM) .1 THICKNESS (CM) - 3 THICKNESS (CM) - 1SOURCE - AFVLTCP6-1i SOURCE - AFFLTER6-11, SOURCE - AFrLTCP6-11 0
SSTRAIN (PCT.) TIE (OCUPS) STRAIN (PCT.) TIME (HOUS) STRAIN (PCT.) TIME (FOUPS) -> m
.034 .2 .107 .Z .0o180 55 .5 .164 .E .035 .4.097 1. .25n .7 . ,...137 iq .461. .112 3..E5 2.5 .134 3.2S.193 3.2
3cALLOY -L65 ALLOY - LA5 ALLOY - L605
STRESS (MPA) - 144. STRESS (MPA) - 7. STRESS (MPA) - 86.2TEMP. (KELVIN) - 1033 TEMP. (KELVIN) - 133 TEMP. (KELVIN) - 123 ,THICKNESS (CM) - .351 THICKNESS (CM) - .12 THICKNESS (CM) - .102SOURCE - AFMLTCP6-116 SOURCE - AF LTTCP 6-11 SOURCE - .FrLTCR6- i r
STPAIN (PCT.) TI ME (PCUPS) STRAIN (PCT.) TIME (FCUPS) STRAIN (PCT.) TIME (HOURS)0
.021 .3 .001 . .015 .40 4.ct .6 .061 4.,.064 1.1 .020 1.4 .131 22.2&1•97 2.2 .026 2.3 .183 45.1.114 2.7 .534 3.4 .288 69.4.137 3.5 .074 21.3 .361 94.9.156 4.2 .113 47.- .391 117.9.176 4.9 .138 9.3 .437 141.8
*165 92.9.183 12 .4.197 143.4.213 1 F6.3.217 190.3.230 215.3 Z.241 237.2 >.259 263.2.264 2P5.4*271 311.3.280 334.4
. 357.?2.298 1..307 45.
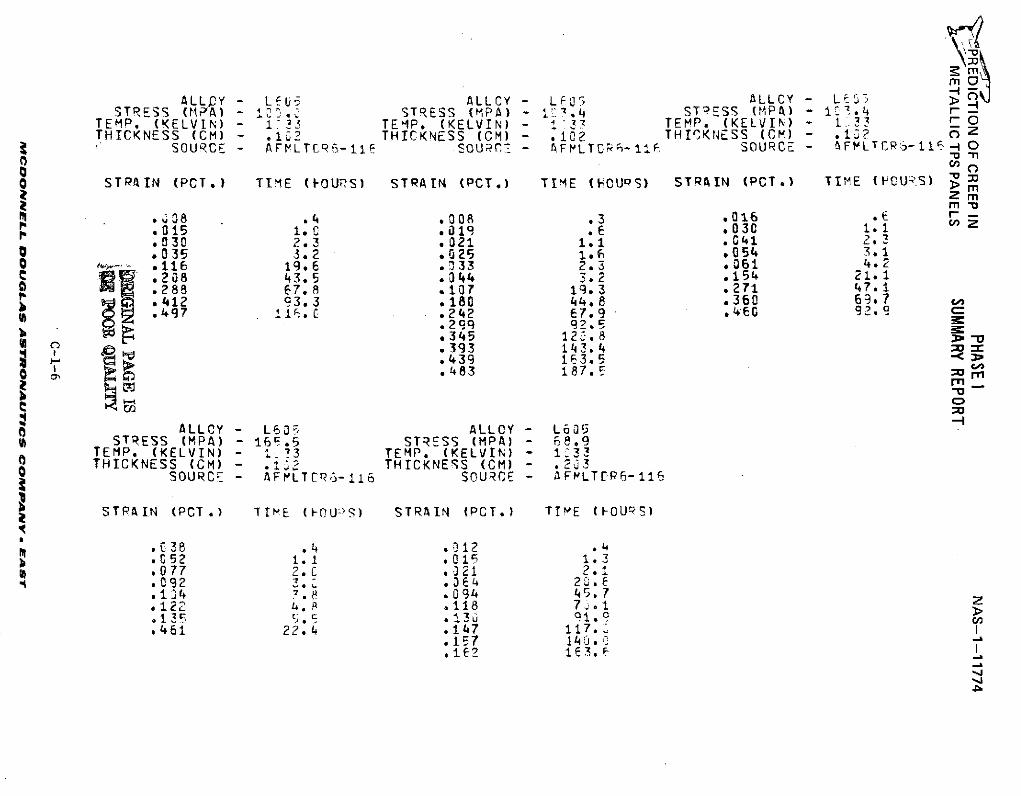
mO
ALLY - LE U ALLCY - LF 0 ALLCY - L>STRESS (MPA) - i.' STRSESS (MPA) P- STESS (PA) - 1L.
TEMP. (KELVIN) - 1 33 TEMP. (KELVIN) - 3 TEMP. (KELVIN) - .33 0THICKNESS (CM) - .12 THICKNESS (CM) - 102 THICKNESS (CM) - ?.12 ( Z
SOURCE - AFMLTCR~-11S SCOU;R - F LTCi0-11 E SOURCE - FVLTCR--11 ' 0
SSTRAIN (PCT.) TIME (FOUPS) STRAIN (PCT.) TIME (HOUQS) STRAIN (PCT.) TIME (FCU-S) ym2 mm
. 80 .4 .008 .3 .016 . -P.015 ..c .019 . 030 1.1
.030 2.3 .021 1.1 .041 2.3S.035 3.2 .025 1.6 .054 3.1
O .116 19.6 .033 2.3 .061 4.2.208 43.5 .044 3.2 *154 21.1.288 67.8 .107 19.3 .271 47.1,412 93.3 .180 44,,.8 .360 69.7 C,.497 11i.C .242 67.9 ,E6 92.9 c
.299 92.5
.345 12-.8
.439 163.5
.483 187.E rn-u-I
ALLOY - L605 ALLOY - L605STRESS (MPA) - 16F.5 STRESS (MPA) - 68.9
TEMP. (KELVIN) - . ?3 TEMP. (KELVIN) - 1233THICKNESS (CM) - .132 THICKNESS (CM) - .203
SOURCE - AFVLTCR6-116 SOURCE - AFPLTEP6-116
STRAIN (PCT .) TIME (FOUYS) STRAIN (PCT.) TIME (FOURS)
S.C38 . .012 .4.052 1.1 .015 1.3
4 .077 2.C .321 2.1.092 3.Z .064 20.6.134 3 .8 .094 4r.7 z.122 4.P .118 7;.1>.135 E. .136 91.9.461 22.4 .147 117.I
.157 140. -
.162 163.
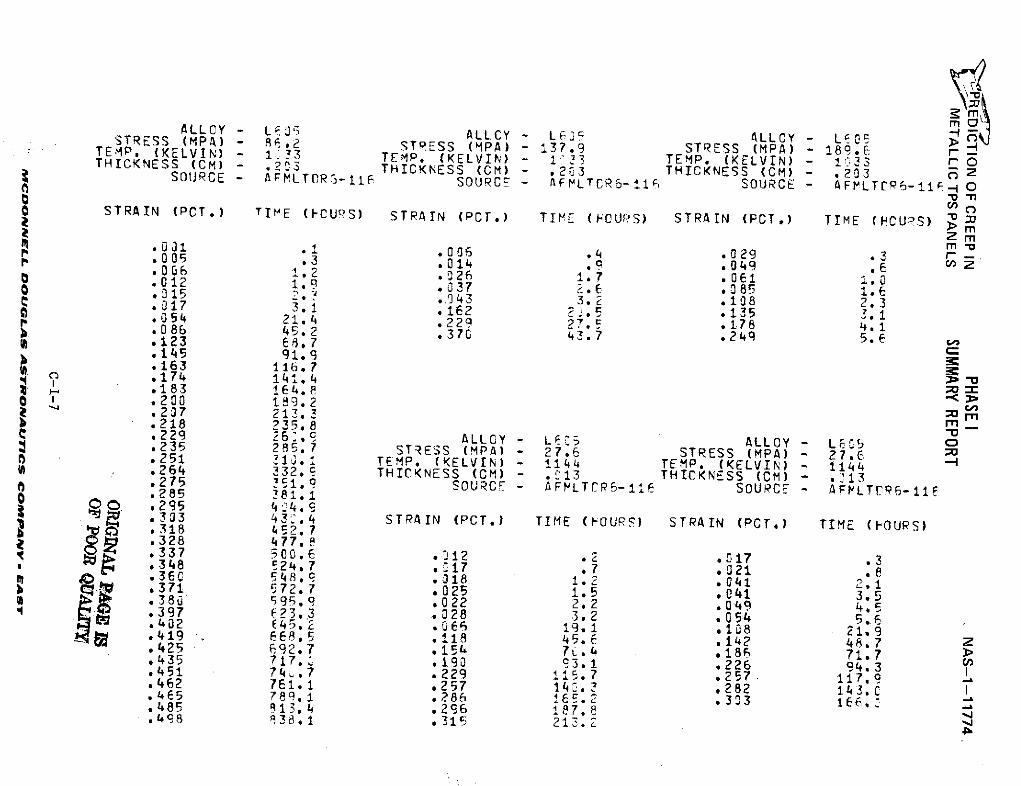
ALLY - LJ, ALLY - L 3C ALLOY - L05 mSTRESS (MPA) - 8.2 STRESS (MPA) - 137. STRESS (MPA) - 189d.; -TEMP. (KELVIN) - 1, 3 TEMP. (KELVIN) - 1733 TEMP. (KELVIN) - 1:33 r 0THICKNESS (CM) - .23 THICKNESS (CM) - .203 THICKNESS (CM) - 203 C ZSOURCE - AFMLTORG-11E SOURCE - AFFLTCOR-116 SOURCE AFMLTCP6-e r-- 0
O STRAIN (PCT.) TIME (FCUDS) STRAIN (PCT.) TIME (FOUPS) STRAIN (PCT.) TIME (HCU.S) " m> m
• * 1 .1 .006 .4 .029 .r.•005 .3 .014 .0 .049 .E.006 1.2 .026 1.7 .061 1.0S.012 1.9 .037 .085 1.6S.315 .' . 43 3.2 .108 2.3E .017 3.1 .162 2. .135 3. 1O .054 21.4 .229 27. .178 4.1S.086 45.2 .370 43. .249 5.6 .123 H .7
.145 91.9 c
.163 116.7
.174 141.4I- * .183 164.8 o
o .200 189.2 C ".237 213.3 rn.218 235.8.229 26.9 ALLOY - L6%5 ALLOY - LE65 0.235 285.7 STRESS (MPA) - 27.6 STRESS (MPA) - 27.6 .251 210.1 TEMP. (KELVIN) - 1144 TEMP. (KELVIN) - 1144.264 332.9 THICKNESS (CM) - .013 THICKNESS (CM) - .013.275 51.9 SOURCE - AFLTCR6-1 SOURCE - AFFLTr96-11F.2985 481.1
333 4.4 STRAIN (PCT.) TIME (-OURS) STRAIN (PCT.) TIME (FOURS)" .318 452.7.328 477.8.337 F00.6 12 017 3.348 E24.7 .A17 .7 .021 .8.360 548.9 .318 1.2 .041 2.1.371 572.7 .025 1.5 .041 3.5.380 595.9 .022 2.2 .049 4.5S*397 23.3 .028 3.2 .054 5.,.402 E45.2 .066 19.1 .108 21.9*419 668.5 .118 45.6 .142 48.7 Z.425 692.7 .154 7L.4 .186 71.7 >.435 717. .190 93.1 .226 94.3.451 74..7 .229 115. 7 .257 117.9*462 761.1 .257 140.3 .282 143.0 I.465 789.1 .286 !65.2 .303 166..485 813.4 .296 187.8.498 838.1 .315 213.4
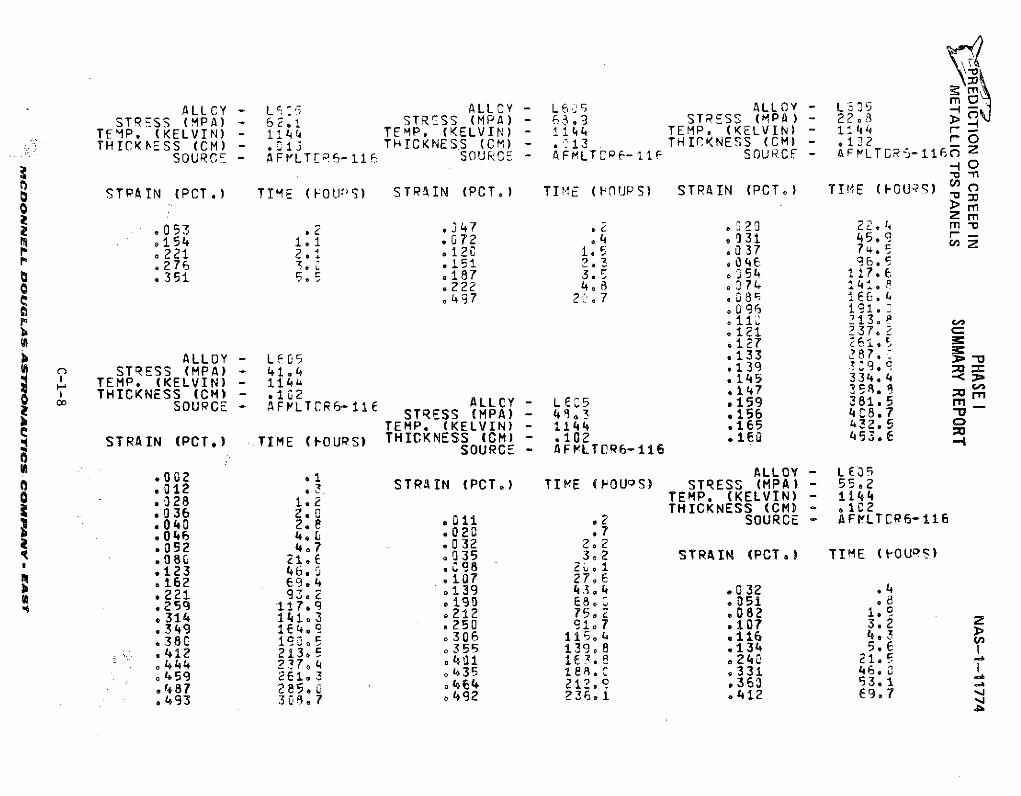
me
ALLCY - LE :T ALLCY - L6 5 ALLOY - LSTPRSS (MPA) - 62.1 STRESS (MPA) - 63.9 STRESS (MPA) - 22.8 >
TEMP. (KELVIN) - 1144 TEMP. (KELVIN) - 1144 TEMP, (KELVIN) - 1144 r -THICK ESS (CM) - .113 THICKNESS (CM) - . 13 THICKNESS (CM) -12 r
SOURCE - AFLTE96-11E SOURCE - AFMLTP6-11F SOURCF - AFPLTCR5-1160 ZHO
STRAIN (PCT) TIME (FOUP~) STRAIN (PCT,) TIME (F-UPS) STRAIN (PCT.) TIME (OUPS) 60S I O(T TM U ) (
: zm.. 2 2;.4 m "D.053 2 347 .2 .2 224 m
. .154 1.1 *072 .4 .031 45. -S221 2. ,120 1.5 .037 74.5
.276 151 .3 .046 96.S .351 5,5 .187 3.5 .354 117.6
O °222 4,8 .074 4:..497 2 .7 .08 1E,.
) .096 i 1.rI110 213.P C1
.121 237. c
.127 261. -
ALLOY - LC5 .133 287. >.STRESS (MPA) - 41.4 .139 329 4
TEMP. (KELVIN) - 1144 .145 3
0 o SOURCE - AFVLTCR6-11E ALLCY - L65 .159 381.7 mSTRESS (MPA) - 41,3 .156 408.7
TEMP. (KELVIN) - 1144 .165 432.5STRAIN (PCT.) TIME (FOURS) THICKNESS (CM) - .102 .160 53.6
SOURCE - AFLTR6-116
.002 .1 ALLOY - LE.T
.012 3 STRAIN (PCT.) TIME (IOUoS) STRESS (MPA) - 55.201328 1.2 TEMP. (KELVIN) - 1144
.036 2. THICKNESS (CM) - .102
.040 2.8e ,11 .2 SOURCE - AFLTCR6-116
.046 4.0 .020 .7.052 407 .032 202080 21.E .035 3.2 STRAIN (PCT.) TIME (FOURS).123 46.0 .098 2 o..162 69.4 .107 27.6.221 93,E .139 43.4 .032 .4.259 117.9 *190 68. .051 .8.314 1413 .212 75.2 .082 1.9.349 1 4.9 .250 91.7 .107 3.2 2,38C 190 5 .306 115. .116 4.3.412 213 5 .355 139,8 ,134 5.6,444 271 163.8 . 240 21,5.459 261.4 .435 188°C .331 46.0 -45987 2851 0464 212. .363 53.1 -0493 30 ,7 .492 236.1 .412 69,7 -.
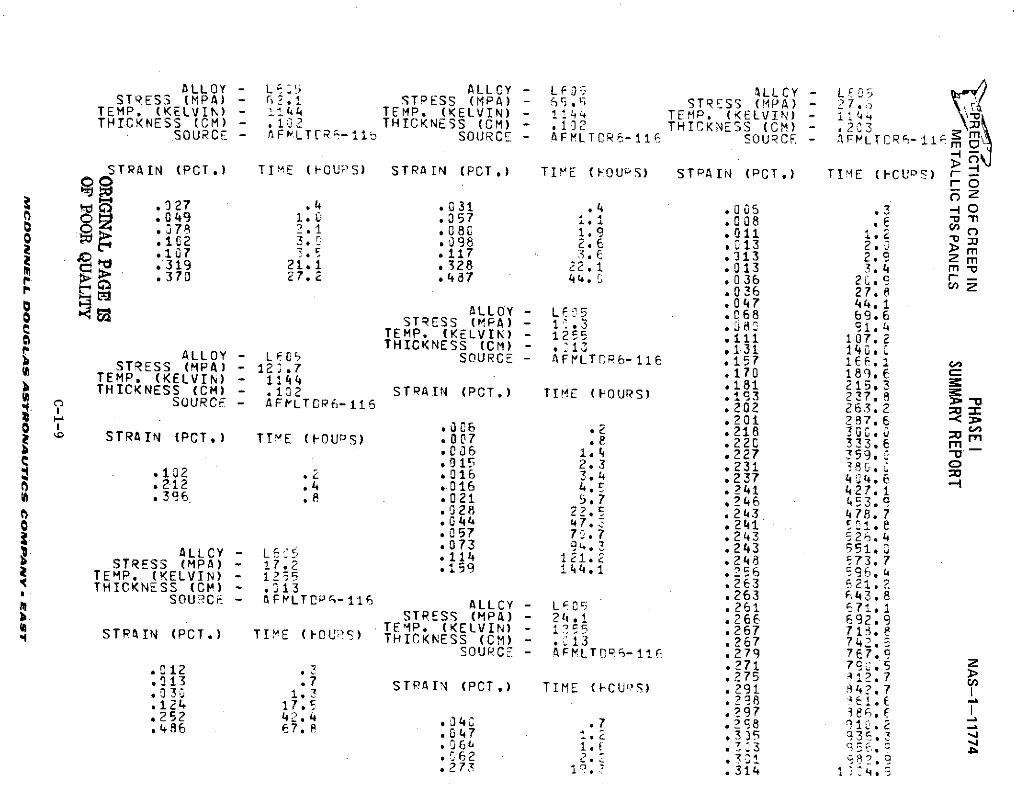
ALLOY - L5 ALLCY - LEJ0 ALLCY - L 5STRESS (MPA) -STESS (MPA) - S. STRESS (MPA) - 7.
TEMP. (KELVIN) - -44 4 TEMP. (KELVIN) - 4 TE (ELVIN) -THICKNESS (CM) - .102 THICKNESS (CM) .1THICKNESS (CM) - 203
SOURCE - AF!LT[RR-11;b SOURCE - AFMLTCR6-116 SOURCE - AFVLTCR-ll- m
STRAIN (PCT.) TIME (COUPS) STRAIN (PCT.) TIME (FIOUiS) STPAIN (PCT.) TIME ( CUS) )
oz.027 .4 .031 .4 .005 .3 -1 0.049 1.0 .057 .1 .08 .E* 78 2.1 1080 1.9 .011 i.2*1G2 3. .098 2.6 .013 2. 0*107 *.5,.117 3.6 .313 2.9 2 m.319 21.1 .328 22.1 .013 3.4 M -v.370 •.7. .487 44. .036 20.-9 r-
.036 27.8 " z2L .047 44.1
STRESS (MPA) - 1,.3 n 91.4TEMP. (KELVIN) - 1255 .11i 107.2THICKNESS (CM) - .513 .131 140.C
ALLOY - L 05 SOURCE - AFtLT'6-116 .157 1EF .1STRESS (MPA) - 123.7 170 189. c-TEMP. (KELVIN) - 1144181 215.3THICKNESS (CM) - .1L2 STRAIN (PCT.) TIME (FOURS) .193 237.•
SOURCE - AFrLTCP-116 .202 263.23 P .201 287.60 .006 .2 .218 3 O.0STRAIN (PCT.) TI M E (FOUDS) .007 8 .22CG 33.6 m
.036 1.4 .227 359. "1 .015 2.3 .231 3 8,.102 •. .016 3.4 .237 4 4.6,212 .4 .016 4. .241 427. 1.396 .8 .021 5.7 .246 453.9
.028 2. .243 478.7*044 47. .241 178.8* 057 7?.7 .243 526.4
ALLY L.073 94. .243 551.STRESS (MPA) - 17.2 .114 11. .24 573.
TEMP. (KELVIN) - 1255 .1 144.1 .256 9THICKNESS (CM) - .•13 .263 521.2
S.263 43.8SOURCE - AFtLTCPr--116 ALLCY - L 05 .261 71 1STRESS (MPA) - 24.1 .266 692.9
TEMP, (KELVIN) - I 5 .267 71, eSTPAIN (PCT.) TIME (FOURS) THICKNESS (CM) - 13 267 742.
SOURCE - AFMLTCR-11 .279 7679S12 .271 7L. 5 Z
. 13 1.7 STRAIN (PCT.) TIME (FCU0S) 291 7
.124 17.5 .2 8 .
.252 42.4 04 .7.?9.486 C-7. P, J'40 .7 Ze8 qi 8.4 7. .047 1.E .335 Q3 4
*06' 1. .33 R C6..062 2 .301 9! 8..273 19. .314 11 .
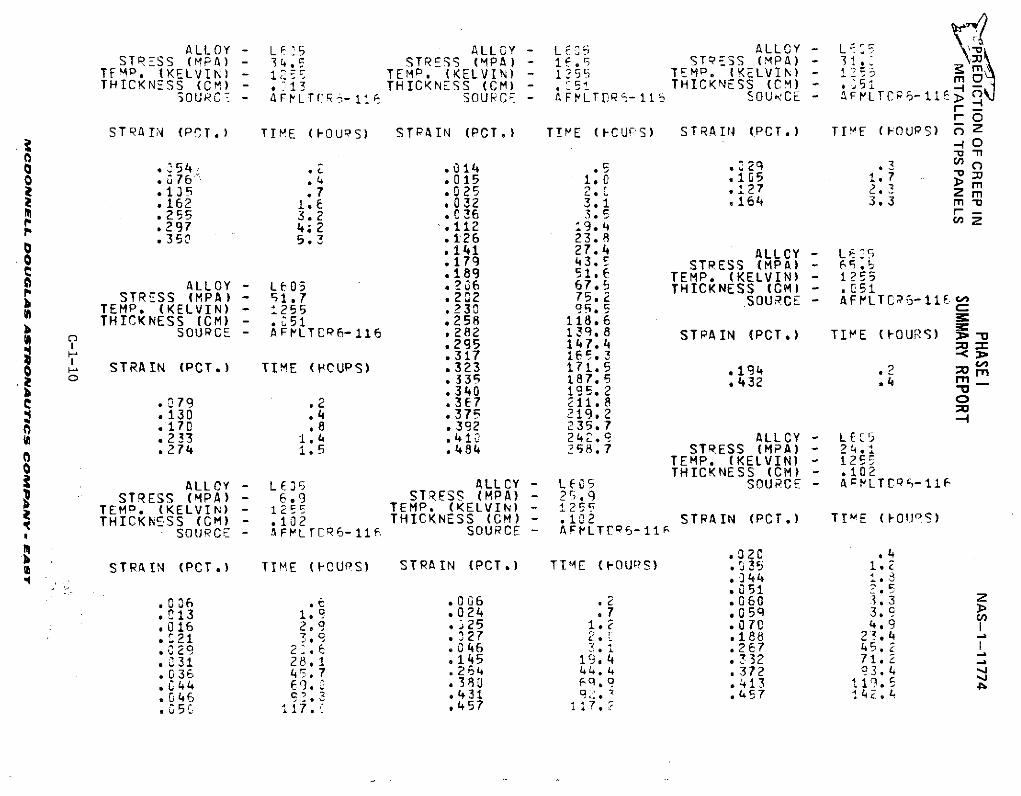
ALLOY - L r5 ALLOY - L EP ALLOY - LE7STRESS (MPA) - 34.5 STRESS (MPA) - 1E STPESS (MPA) - 31. _
TFM~. (KELVIN) -TEMP. (KELVIN) 55T (KELVIN) - m a;THICKNESS (CM) - 13 THICKNESS (CM) - . THICKNESS (CM) - .m
SOURCI - AFLTt 6-11 SOU CE - AF LTDR~-115 OUNCE - aFtLTC 6-11r
rO
STRAIN (PCT.) TIME (FOUPS) STRAIN (PCT.) TIE (CU%'S) STRAIN (PCT.) TIME (FOURS) . z
. 54, .2 .014 . 29 .30 .076 .4 .015 1.0 .105 1.7
.135 .7 .025 2.0 .127 2.3 z m
.162 1.6 .032 3.1 .164 3.3 m-255 3.2 *C36 3.5 -
.297 4;2 -. 112 19. 4
.350 5.3 .126 23..141 27.4 ALLOY - Lf5.179 43,E STRESS (MPA) -65.5.189 51.6 TEMP. (KELVIN) - 1255
ALLOY - L605 2?06 67.5 THICKNESS (CM) - .51STRESS (MPA) - 91.7 .232 75.2 SOUC 1
TEMP. (KELVIN) - 1255 .230 95.5THICKNESS (CM) - .051 .258 118.6
SOURCE - AFrLTCR6-116 .282 139.8 STPAIN (PCT.) TIME (OURS).295 147.47 .317 165.3
STRAIN (PCT.) TIME (HOURS) .323 171.5 21940 .335 187.5 .432 .4 _
.340 195.2 3.079 .2 .367 211.8 0.130 .4 .375 219.2.170 .8 .392 235.7.233 1.4 .410 242., ALLCY- LEC5.274 i.5 .484 298.7 STRESS (MPA) - 24.1
TEMP. (KELVIN) - 1250o THICKNESS (CM) - .102
ALLOY - LEi5 ALLCY - LE05 SOURCE - AMLTC9-11FU STRESS (MPA) - 6.9 STRESS (MPA) - 25.9
TEMP. (KELVIN) - 1255 TEMP. (KELVIN) - 1255THICKNESS (CM) .102 THICKNESS (CM) - .102 STRAIN (PCT.) TIME (FOIorS)
, SOURCE - AFMLTCR6-11F. SOURCE - AFFLTC6-11 r-
.020 ,4A STRAIN (PCT.) TIME (OCURS) STRAIN (PCT.) TIME (FOURS) •35 1.
.006 .6 .006 2 .060 33
.013 1.9 .024 .7 .05q 3.9
.016 2.9 . 25 1.2 .070 4.9 I
.021 3.9 *327 2. .188 2 4 -
.029 2.6 .046 3.1 .267 45.2
.L31 28.1 .145 19.4 .332 71.
.036 45.7 .264 44 4 .372 93.4
.044 .380 9.9 .413 119.5
.046 431. .457 142.4
.c0 117. C .457 117. 2
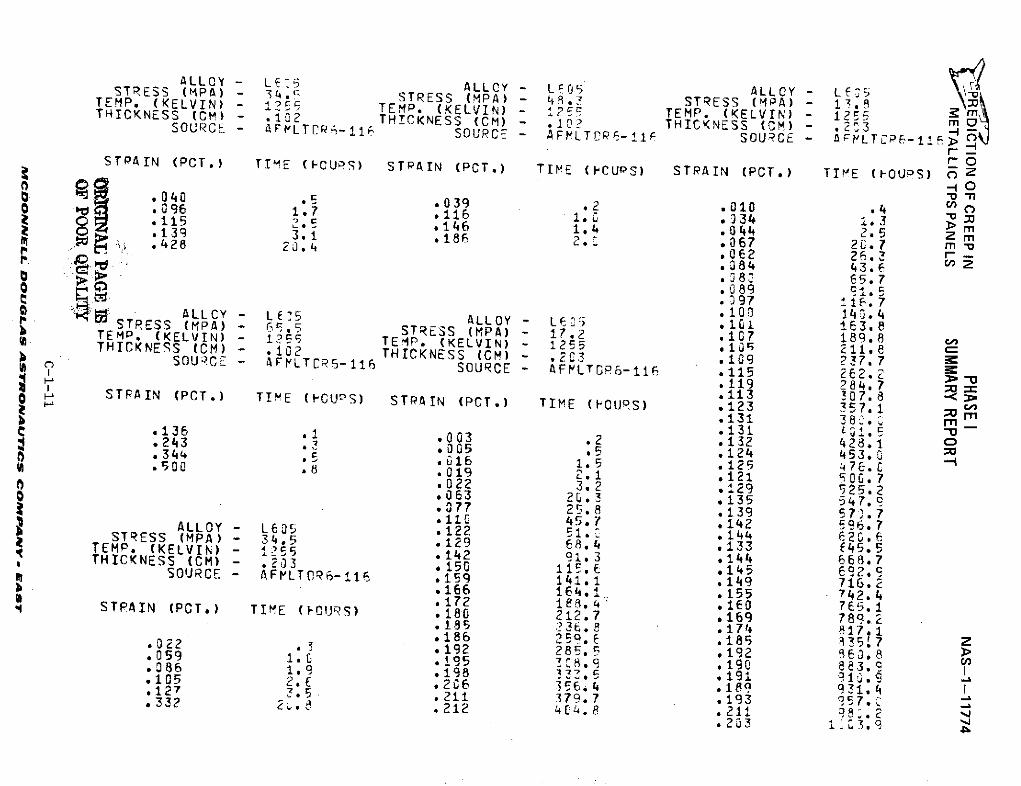
ALLSTESS OY (P - 5 ALLOY - Lf05 ALLCY - L 5STESS (PKELVIN) - STRESS (MPA) - 4 3 STRESS (MPA) - 17.8TEMP, (KELVIN) - TEMP. (KELVIN) - 125 TEMP. (KELVIN) - 125THICKNESS (CM) - .102 THICKNESS (CM) - 1 THICKNESS (CM) - 23SOURCE - AFFLTCRE-11 - SOURCE FMLTCP-11i SOURCE - AFILTP-11s
STRAIN (PCT.) TI ME (ICUPS) STRAIN (PCT.) TIME (FCUPS) STRAIN (PCT.) TE' (IOUDS) 0 z0 POU
-n0S.09 1.7 .039 .2 .010 .4 096 1.7 116 .C .334 1.3139 .1 .146 1.4 .044 2.5 Z m.139 3.1 .186 2.C .067 26.7 m rn11.428 20.4 E2 26, r-_.084 43.6
< .08i 65.7:.089 91.5.397 116.7
AT .100 140,4ALSTESS LC - L5 ALLOY - LE5 .10 163.8STRESS (PLV) - 6 STRESS (PA) - 17.2 .167 189.8 GTEMP. (KELVIN) - 1255 TEMP. (KELVIN) - 1255 .Ia5 E11.8S THICKNESS (CM) - 102 THICKNESS (CM) - .203 .109 237.7a SOU;.CE- AFVLTCRS-116 SOURCE - AFVLTGP6-116 .115 2E2.2.119 284.?.113 307.8STPAIN (PCT.) TIME (PCUCS) STRAIN (PCT.) TIME (HOURS) .123 357.1 m*131 38', r.131 l 1.5 "0C .136 .1 .131 1-u -.2143 .003 .2 .132 428.1 C.344 . .005 .5 .124 453.0.34 16 1.5 .125 4 76. --.500 .8 .019 .1 .121 500.7.022 3.2 .129 525.2.063 20.3 .135 547.9.077 25.8 .139 57).7ALL.11 45.7 .142 596.7ALLOY -LE .122 51. .144 2.STRESS (MPA) - 34.5 .129 68.4 .133 645.5TEMP. (KELVIN) - ?5 .142 91,3 .144 668,7THICKNESS (CM) - .03 ,152 115.E .145 692.
SOURCE - AFMLTP6-116 •159 141.1 .149 716.2.166 164.1 .155 742.4- .172 ie'. 4 .lE0 7E5.1STRAIN (PCT,) TIME (FOURS) .180 212.7 .169 789,2.195 736. .174 817.1.186 259.E .185 83517 z022 3 .192 285.5 .192 60.8.059 1.0 95 H,. .190 883.906 1. .19 .191 1.9
.105 2.E .206 356.4 ,189 931.,4.127 3.5 .211 379.7 .193 957.-332 . .212 404.8 . 211 98.2.203 11:3.9
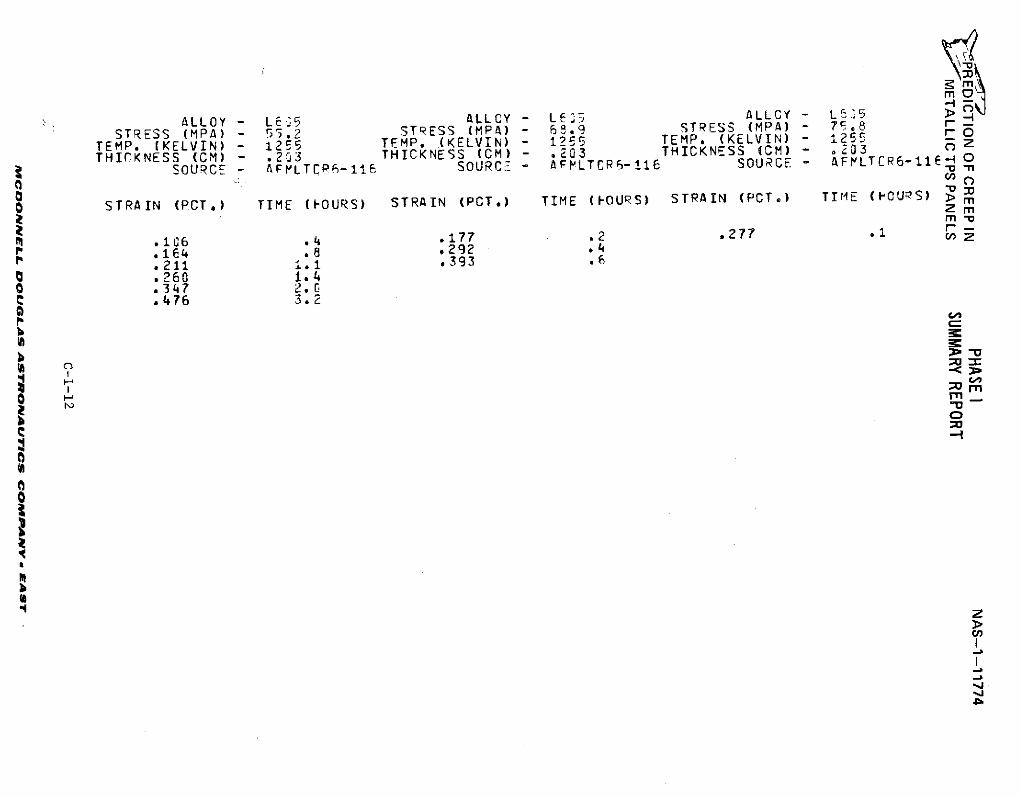
ALLOY - LE5 ALLCY - LE3 ALLGV - L5 >STRESS (MPA) - 55.2 STRESS (MPA) - 6.9 STRESS (MPA) - 7ci8
TEMP. (KELVIN) - 12 5 TEMP. (KELVIN) - lZrTEMP. (KELVIN) - 12E 5THICKNESS (CM) - .23 THICKNESS (CM)- 03 THICKNESS (CM) - .33 Z
SOURCE - AFLTCP6- 116 SOURC - AFLTCR6-16T SOURCE - AFrLTCR6-11E 0
O STRAIN (PCT.) TIME (FOURS) STRAIN (PCT.) TIME (FOURS) STRAIN (PCT.) TIME (FIOUS) z m
.lb6 .4 .177 .2 .277 1
S.164 .8 .292 *4.211 1.1 .393 .
S.260 1. 4o .347 2.GC .476 3.2Q co
aa
0z
bh
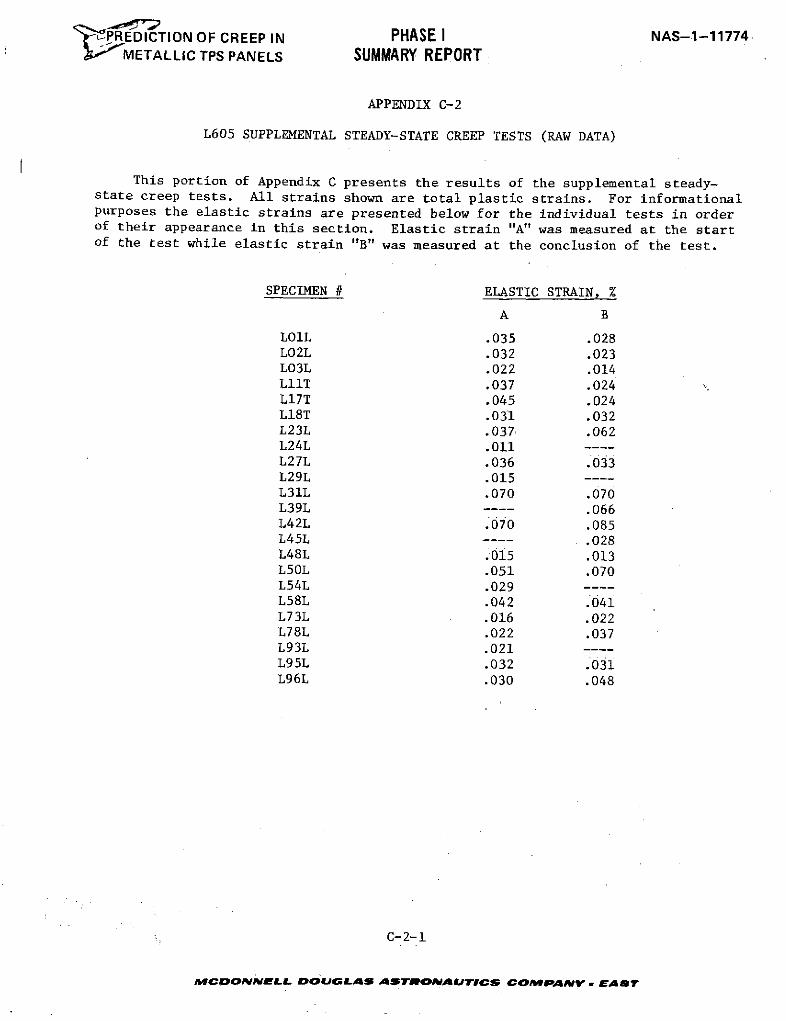
PREDICTION OF CREEP IN PHASE I NAS-1-11774'METALLIC TPS PANELS SUMMARY REPORT
APPENDIX C-2
L605 SUPPLEMENTAL STEADY-STATE CREEP TESTS (RAW DATA)
This portion of Appendix C presents the results of the supplemental steady-state creep tests. All strains shown are total plastic strains. For informationalpurposes the elastic strains are presented below for the individual tests in orderof their appearance in this section. Elastic strain "A" was measured at the startof the test while elastic strain "B" was measured at the conclusion of the test.
SPECIMEN # ELASTIC STRAIN, %
A B
LOlL .035 .028LO2L .032 .023LO3L .022 .014LllT .037 .024L17T .045 .024L18T .031 .032L23L .037 .062L24L .011L27L .036 .033L29L .015L31L .070 .070L39L ---- .066L42L .070 .085L45L ---- .028L48L .015 .013L50L .051 .070L54L .029L58L .042 .04iL73L .016 .022L78L .022 .037L93L .021L95L .032 .031L96L .030 .048
C-2-1
MCDONNELL DOUGLAS ASTONAUCS COMPANY . EAST
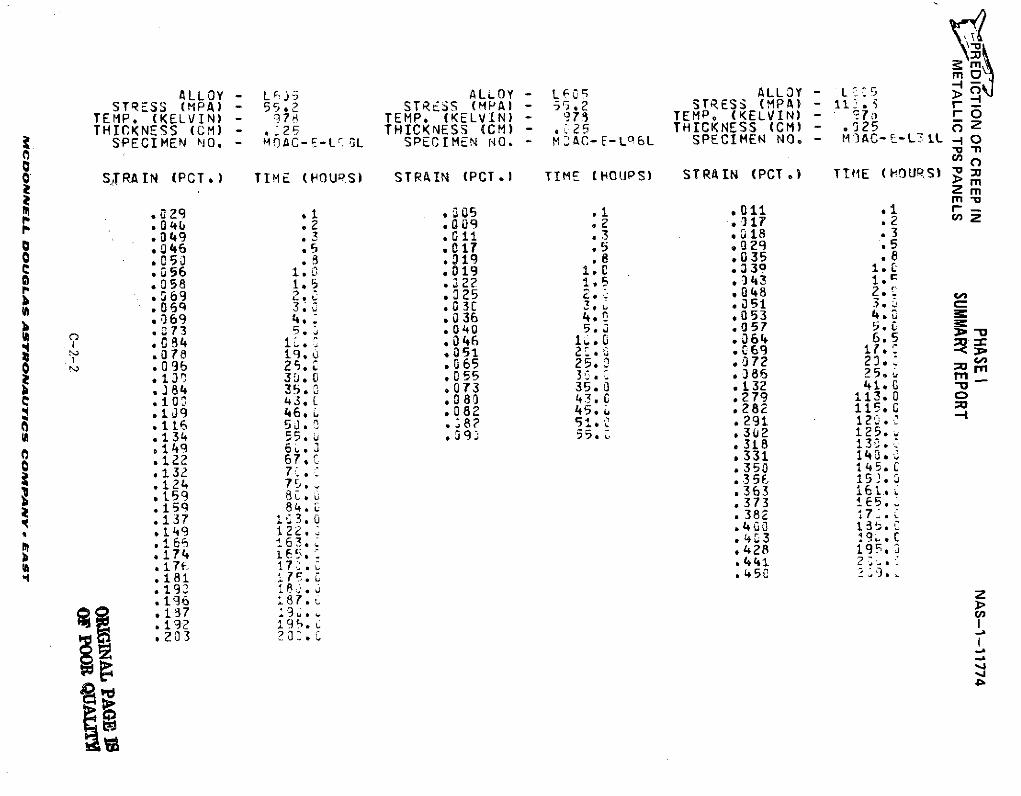
ALLOY - Lj ALLOY - L ALLOY - L oSTRESS (MPA) - 55.2 STRESS (MPA) - 55.2 STRESS (MPA) - 11 i r
TEMP. (KELVIN) - q7 TEMP. (KELVIN) - 979 TEMPo (KELVIN) - r- 0THICKNESS (CM) - 25 THICKNESS (CM) - 25 THICKNESS (CM) - .25
SPECIMEN NO. - M9AC-E-L',OL SPECIMEN NO. - MDAC-E-LP6L SPECIMEN NO. - M3AC-E-L1 L 4 0a -n
SS.TRAIN (PCT.) TIME (HOURS) STRAIN (PCT.) TIME (HOUPS) STRAIN (PCT.) TIME (HOURS) .o mZm
.029 .1 ,5 .1 .011 *1 rP04b .2 .009 .2 17 .2 Z.049 3 .011 .3 u18 .3.046 .5 .C17 .5 .029 .5S.050 .8 .019 .8 .035 .8.0S 6 1.0 .019 1.[ *30 3.058 1.5 .322 1.5 .343 1..69 2. 025 2 048 2..069 3.0 .031 3.u *a51 3.7.069 4. .036 4, ,053 4.6.273 5 .040 5.0 .057 5..084 iC .046 1i.0 .364 6.5.078 19. .051 2•. .069 17.*
0 .06 25. .065 25.0 .072 23..130 3.0 .055 30.86 25 m.384 35. .073 35.0 .132 41. G
C .10, 43,C .080 43.0 *279 113.0.19g 46.L .082 45. .282 115. G
S .116 50, .,82 Si. .291 120.UW.134 55. U .93 o5[ .302 125.
.149 6u. 3 *318 130.S.122 67.3 .331 142..132 7: .350 145.
.124 7.. .35 15.5
.159 84. .363 6 .1 5 84. . 373 .
.137 :L3.0 . 382 17.
.149 122. .400166 163 43
.174 .65. 428 195. 3
.17f, 17 .* .441 2 .
.181 17 . .9..
.193 18 .
.196 187. ZS .187 >3
.192 195.
.203 3'3 .
b,4"4
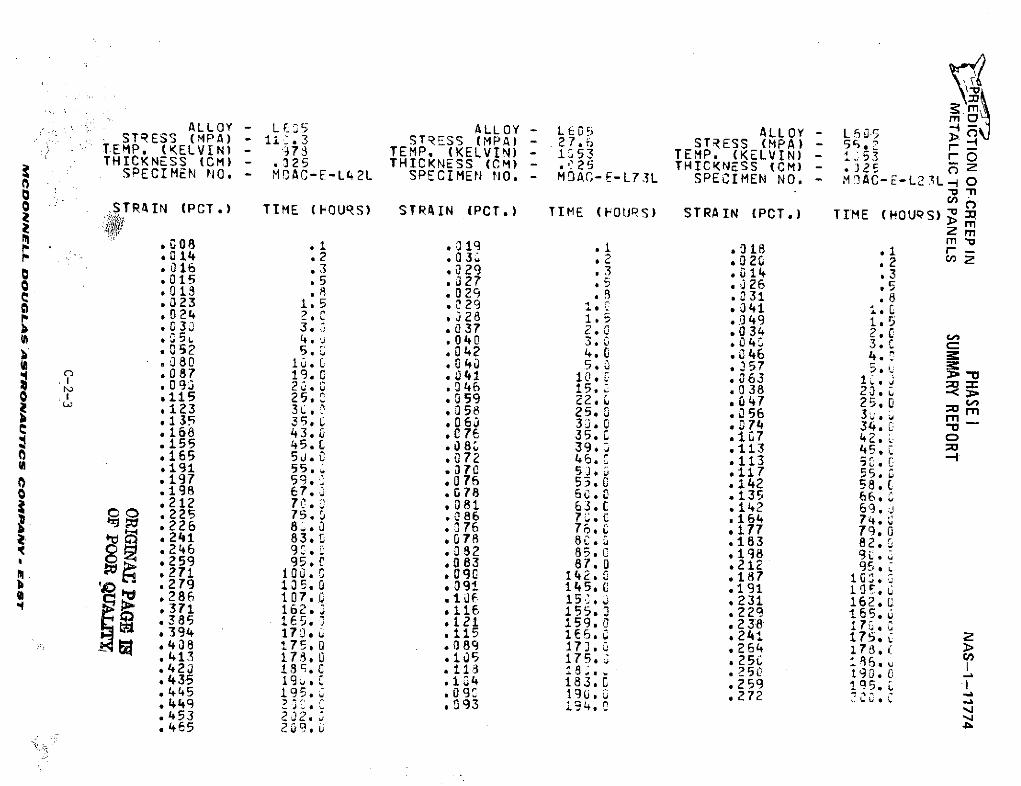
ALLOY - L 5 ALLOY - LG05 ALLOY - LSG5STRESS (MPA) - 11.3 STRESS (MPA) - 27.6 STRESS (MPA) - 55 .•TEMP. (KELVIN) - 7 TEMP. (KELVIN) - 1553 TEMP. (KELVIN) - 1 r-THICKNESS (CM) - .325 THICKNESS (CM) - .025 THICKNESS (CM) - j 2 o ZSPECIMEN NO. - MOAC-E-L42L SPECIMEN rNO. - MDAC-E-L73L SPECIMEN NO. - M)AC-E-L23L 0
STRAIN (PCT.) TIME (FOURS) STRAIN (PCT,) TIME (FOURS) STRAIN (PCT.) TIME (HOURS)'
.008 .1 .019 .1 .018 .1 m014 .2 .030 .2 .020 2 2
.016 .3 .029 .3 .014 .3S.015 .5 .27 .5 .026 .013 . .029 .8 .031 .8.023 1.5 .029 1. .041 1
.P 024 . C .328 1.5 .049 1,5S030 3. .037 2.0 .034 2.0.040 3.0 .040 3.C.,52 5. .042 4.0 .046 4..080 1u.L .04 5.0 .057 . LS .087 19. 0 .041 IOC. 063 1.09 20. .46 15 .038 2 3..115 25. .059 22. .047 25.0 o
.123 3. .058 25. .056 3 L*135 35. .063 3.j0 .074 34.0 - -168 43.0 .076 35.0 .107 42,. C.155 45. .080 39.; .113 45. 0.165 5J.0 .072 46.0 .113 50. l
( .191 55.2 .070 5J.0 .117 55.0.197 59. .076 53.0 .142 58.c.198 67.- .078 65.0 .135 66..212 70. .081 63. .142 69.00 .225 75.0 .086 7,.C .164 74.S226 80.3 .076 76.0 .177 79.0.241 83.0 .078 80.2 .183 82..2 46 9.O .082 85. .198 910S*259 95.0 .083 87.0 .212 95.*271 100.0 *09 142.0 .187 10b .279 135.0 .091 145. 0 .191 10 ,c .286 107.0 .1if 150. .231 162.0.371 162. .116 155.3 .229 165..385 165.* .121 159.0 .238 17.;*394 170.1 .115 16 .241 175,
.408 175.0 .089 17 .0 .264 17, ..413 178.0 .105 175. .250 I161n
.423 18 .G .13 8 . 250 190.0.435 19, .Z104 183.0 .259 195.*445 195.9 .090 190. .272 ?0t.C
.449 27. C .093 194.0
.453 232.
.465 20 9 .
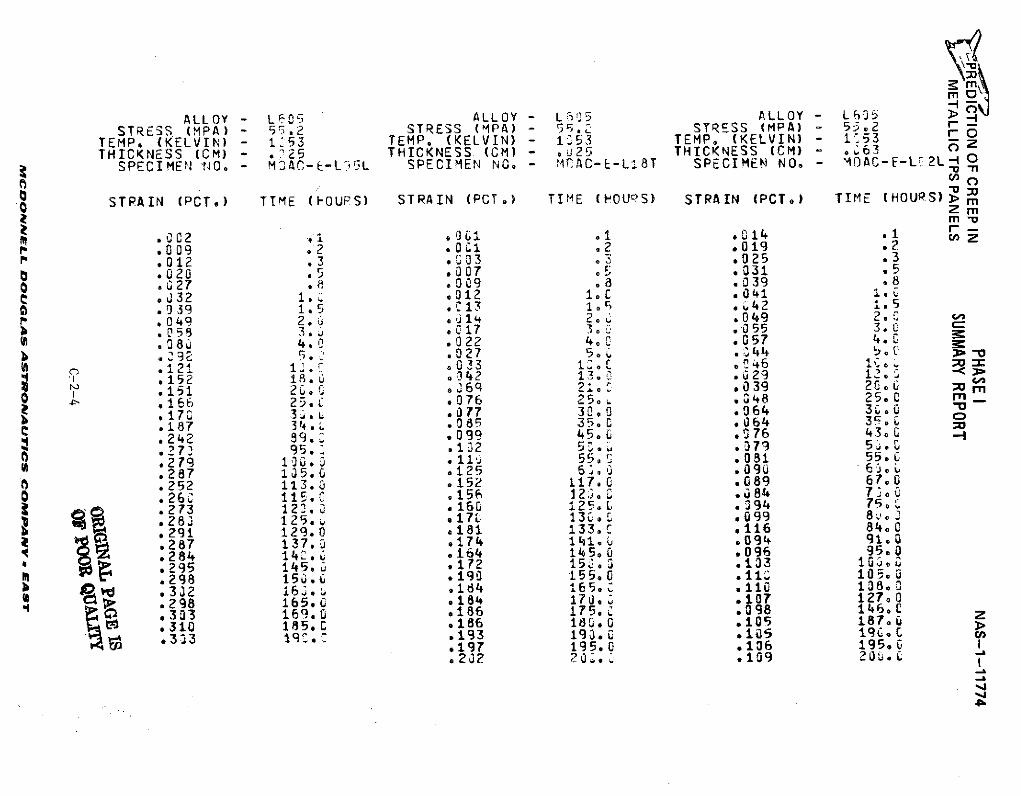
2 mm 0
ALLOY - Lr0S ALLOY - L ALLOY - Lb60STRE.S (MPA) 55.2 STRESS (MPA) STRESS (MP) 2 019 .2
TEMP. (KELVIN) - 13 TEMP. (KELVIN) - 153 TEMP. (KELVIN) - 3 .3THIC .020NESS (CM) .5 HICKNESS (CM) - 25 THICNESS (CM) 3
T K .039 1.5 *013 1o6 • 42 1•5.049 2.1 .01 2. .049 2..012 3 .017 3 0 .055 3.
.0820 .0 .022 4.0 057 4.
.151 2. C .6009 21.8 .039 20.8:939 1.15 031- .C .'42 1.5
S.16649 2. .076 2. .049 25..170 3 .1 077 3 0 .6 3.0.187 4. .085 35. .064 4. G
.242 89. .33099 5. .0 76 3.
1527 95 . .02 5, .079 5J 2..9 1055. .081 55.
5287 105. * ....S.252 113.0 .152 17.0 .089 67.0
2166 211. .0156 2:5..~ .425. 7rnS273 3 .160 125. . 94 35,
S.28 12534. .85 13. .0499 8.S29 129. 99 45 17. .116 84
279 13. 11 55 11.0 .081 55.0
.284 1435.0 164 145. 0 .096 95.0
.252 1135.0 .12 1517. .039 67,o.6 ' 115. .156 121.1 .0 84 7 "1
2 98 122. .1690 125. L1 .94 75.0
b .382 1625.9 184 165. C .110 18.o0* 298 12965.0 .184 1330 .16 4,02833 169.0 .186 145. .0968 16.95
410 185. 18672 150. .105 187.0
3293 195. .193 1955.0 . 114 19.0
.1 1..197 195.0 .106 195.0 I.9 P . .12 2009-0
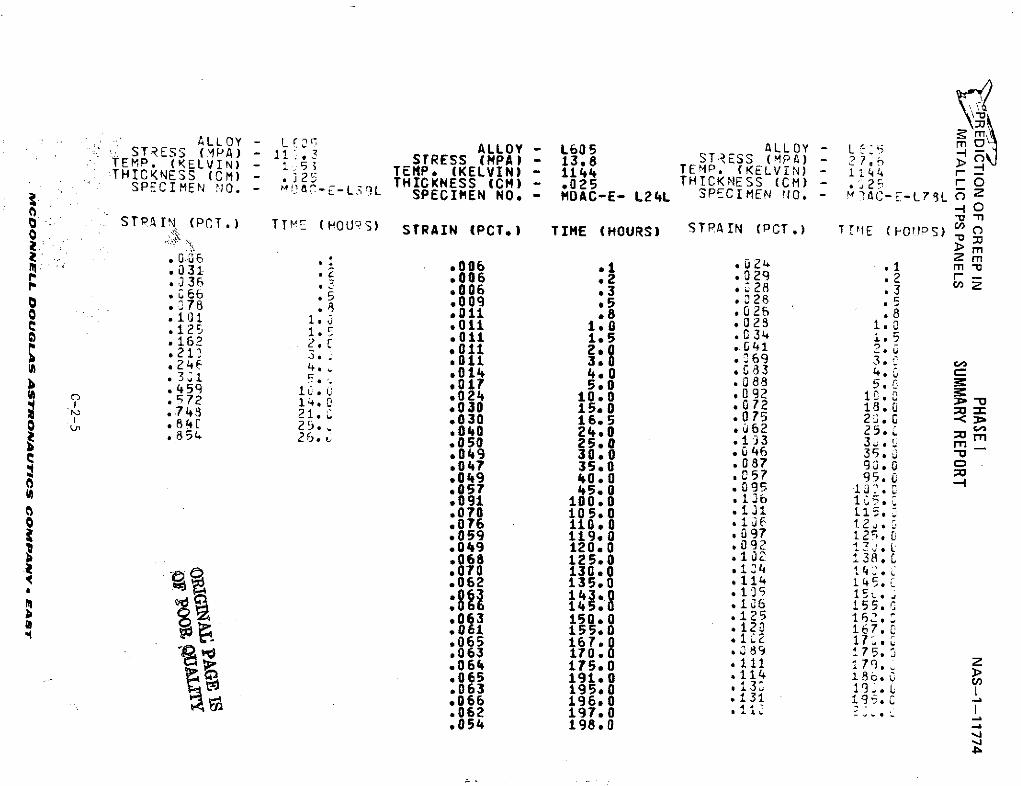
ALLOY - Lr 0STRESS (IPA) - 11 3 ALLOY - L605 ALLOY - L
TEMP.) - STRESS (MPA) - 13.8 STRESS (MPA) - 27TEHP. (KELVIN) - 5 TEMP. (KELVIN) -1144 TEMP. (KELVIN) - 14SPEHICNE () 25 THICKNESS (CM) - .025 THICKNESS (CM) -. 32 r
SPEMEN - -- LL SPECIMEN NO. - MDAC-E- L24L SPECIMEN 1O. - M-AC-E-L79L0O
STPAIN (PCT.) TTIM (HOUS) STRAIN (PCT,) TIME (HOURS) STPAIN (PCT.) TPIE (FOUPS) C
M.s006 0 2 mS031r 006 . *02 .* mS36 .006 .2 .029 .2
.66 .006 3 ,8 .3S.78 .009 5 02
S.01 11 1 .026 .c 125 *Olt 1.0 *028 1.0
.125 i.E ..011 1.5a .162 2. C .011 .41 2.
lb . 011 3. .69 3. ,.2 ., 014 4.0 834. C
..459 017 5.0 .088 5.72 024 10.0 .02.74. 21.2 .030 15.0 .072 18.
S84 25030 16.5 .075 2..54 25. .040 24.0 .062 25. o26. .050 25.0 .133 3L. m
S.049 30.0 *046 35.0 -.047 35.0 .087 9.0 C.049 40.0 .057 95.0.057 45.0 .095.091 100.0 .136 .:.070 105.0 131 115..076 110.0 1.21 .12E.059 119.0 .097 125..049 120.0 .092 1J.L.068 125.0 .102 138..070 130.0 .124 1t4'..062 135.0 *114 14 5.
: , .1i6 '55.:'.063 150.0 .125 162.061 155.0 .120 167.L.065 167.0 .1L2 17'..063 170.0 .89 1 75.:.064 175.0 .111 179..065 191.0 .114 186..063 195.0 .13 C..066 196.0 .131 194..062 197.0 1il1 . l.054 198.0
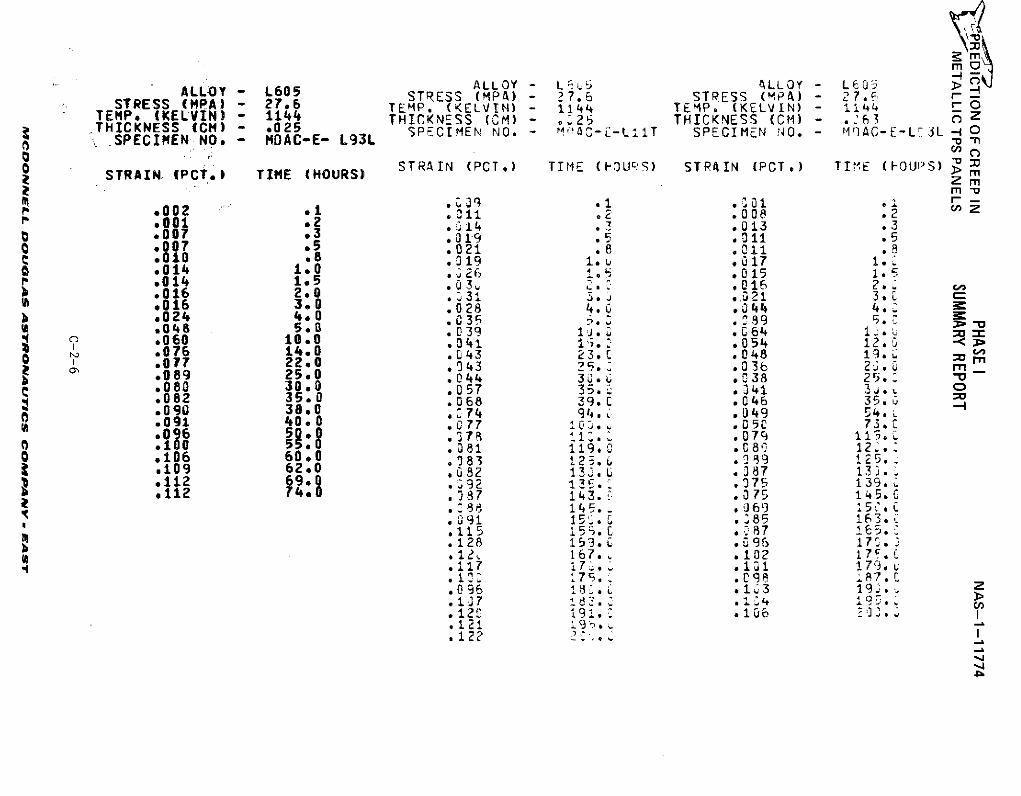
m
ALLY - L ALLOY L, ALLO L0 >ALLOY - L605 STRESS (MPA) - 27.6 STRESS (MPA) - 27. r
STRESS (MPA) - 27.6 TEMP. (KELVIN) 1144 TE4P. (KELVIN) - 1144 -OTEMP. (KELVIN) - 1144 THICKNESS (CM) - .25 THICKNESS (CM) - .,63 (
,THICKNESS (CM) - .025 SPECIMEN NO. - lMAC-E-LI1T SPECIMEN NO. - M1 AC-E-L 3L -SPECIMEN NO. - MDACE- L93L -n
S STRAIN (PCT.) TIME (I)OUrS) STRAIN (PCT.) TIME (FOUPS) 'STRAIN (PCT.) TIME (HOURS) >n
.002 11 .o Z
.007 .2 .14. .013 .30 007 3 019 .5 .011 .5
0007 5 .021 .8 .011 .8.010 .8 .019 .l .017 1•S.014 1.0 .2 .015 1..014 1.5 ? 2.S.01U 3 .: .016 2.^.016 2.0 .031 3.,.021 3.* 016 3.0 .028 4.6 .044 4..024 4.0 .035 .. 89060 10.0 .039 .64.060 10.0 .041 15. .054 12..
S.076 14.0 .C43 23.1 .048 19.,o .1 22.0 .043 •3.C .048 1•.rrS.089 22.0 .043 25. .036 2. m
*089 25.0 .044 30.0 .038 25. 1.080 30.0 .057 35.0 .04 1 3. C.082 35.0 .068 39. .046 35.
S090 .0 .74 94. .049 54.i091 0.0 .077 . .05 73.0:096 S .379 1 . ,7ys 115..
.10 5*0 .081 119.0 .C8C 120..O .106 60.0 .083 12-. .089 125.
.109 62.0 .G82 13. . 87 130.k .112 69. .92 1 .375 139.*112 74A .087 143. .375 145.C
.188 145 . .69 150.
.091 15. G .385 163.-
.115 155. .87 165.
.128 153 9. .095 170.12, 167., .102 17F..117 i7 . .101 179..I : '79 .C98 187. C.096 18.I .103 193.. 2.137 1. .104 195.
.120 191. .106 2 . I.121 19,..122 2 ,
',,,
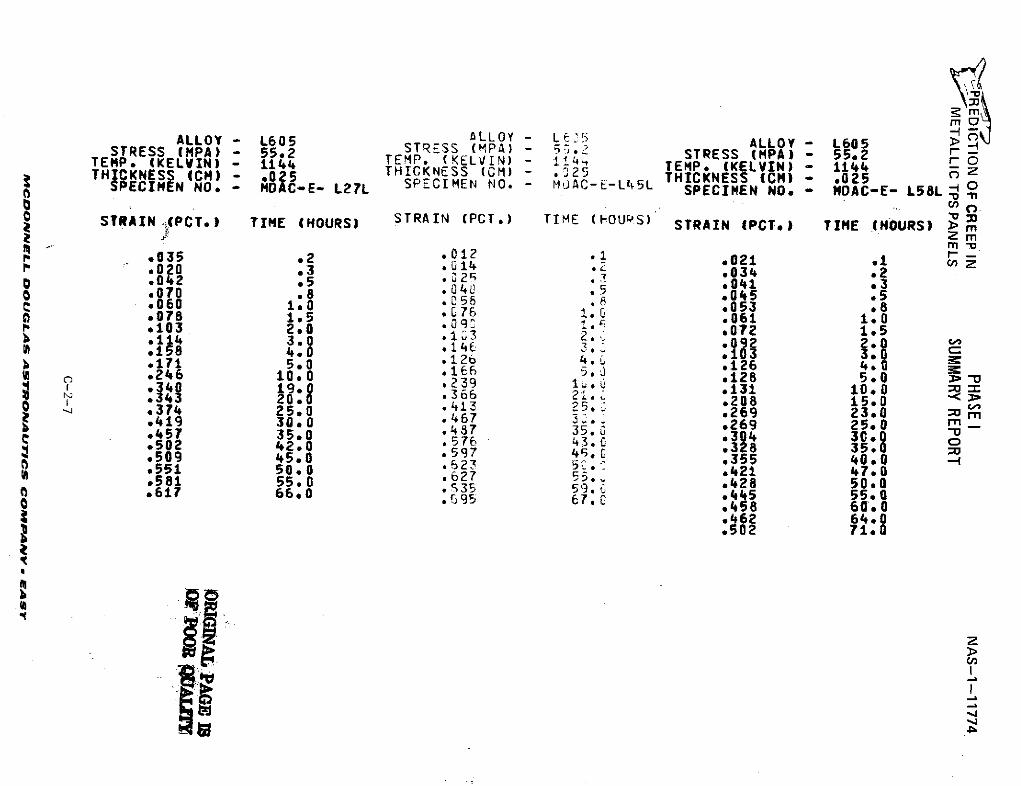
mm 0ALLOY - L605 ALLOY - ALLOY - L605 ->
STRESS (MPA) - 55.2 STRESS (MPA) - 5-.2 STRESS (MPA) - 55.2 rTEMP. (KELVIN) - 114 TEMP. (KELVIN) - 1144 TEMP. (KELVIN) - 1144THICKNESS (CM) - .05 THICKNESS (CM) - .,25 THICKNESS (CM) - .025
ECIMEN NO. - MDAC-E- L27L SPECIMEN NO - MDAC-E- L58L
0 STRAIN (PCT.) TIME (HOURS) STRAIN (PCT.) TIME (-OUPS) STRAIN (PCT.) TIME (HOURS) > mZ m
S*.035 .2 . .1 .021 .1 z.020 .3 G14 .034 .20 .042 .5 02 .041 .3o0 070 .8 04 .5 045 .5
S *060 1.0 .056 .053 .878 1.5 .061 1.0
.103 2.0 .0 72 1.514 3 .092 2.0.158 4 .1, o103 3.
.171 5.0 .126 4.S.246 10.0 *e .126 .0e26 3 .239 u 128 5.0:141 1908 .131 10.0
2 4 .208 15.0- .374 25.0 .413 .269 23.0.419 30.0 .467 .269 25.0 m
S457 35. .487 35. 0 .304 30.0 0• .502 42. .577 43.[ •328. 35.0.509 45.0 .597 .5 9355 40.0.551 50.0 .27 5 421 470.581 55.0 .2 428 50*617 660 .428 50.0.'95 6 .445 55.0.458 60.0
.462 64.0b .502 71.0
~-A
,I+•l -. ++ ,p..A
• -I
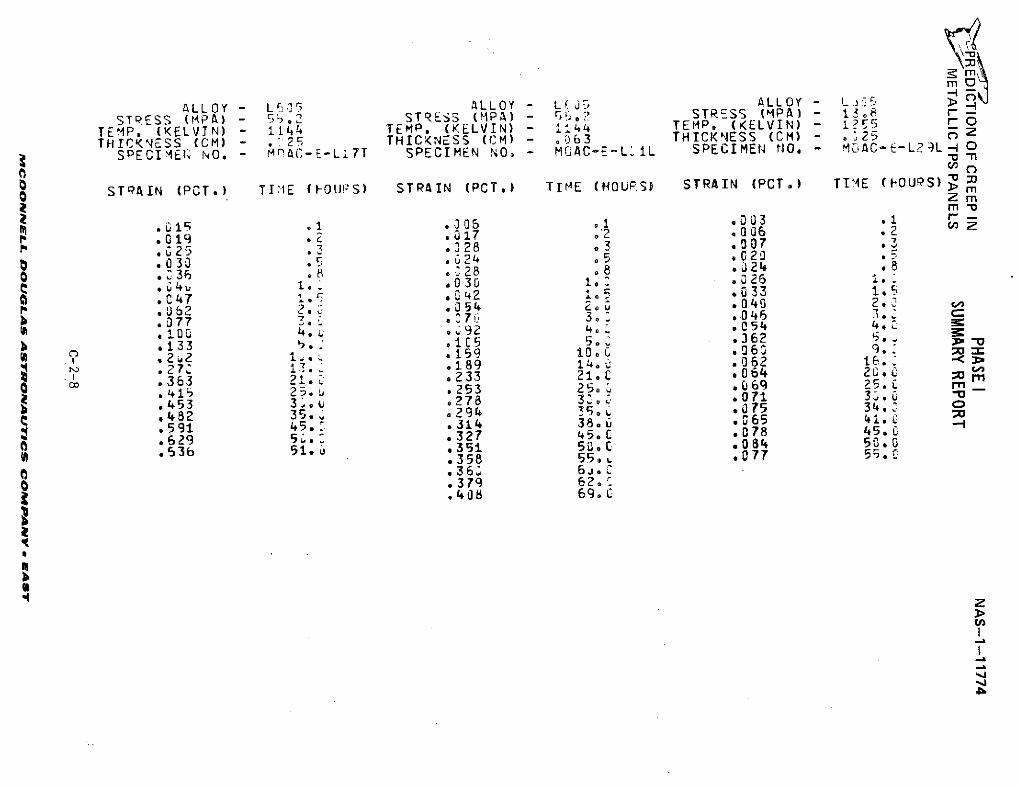
mO
ALLOY - L ALLOY - L"E ALLOY - L
STRESS (MPA) - 2 STRESS (MPA) - .? STRESS (MPA) - 13-
TEP. (KELVIN) i44 TEMP. (KELVIN) 144 TEMP. ((ELVIN) - 15THICKNESS (CM) . THICKNESS (CM) - .063 THICKNESS (CM) -. 25 Z
SPECIMEI NO. - MC-E-Li7T SPECIMEN NO. - MAC-E-L IL SPECIMEN .NO - MiAC-E-L?2L - 0
0SP1PSTPAIN (PCT.) TIIE (F-OU'S) STRAIN (PCT.) TIME (HOURS) STRAIN (PCT.) TIME (fOUS)> m
Z m-
M1 .35 .1 .03 .1 w.019 a 017 .2 .006 .2
.025 3 .28 .3 .7 .3
b .33 . *,04 * .0 2Z 36 . ,.28 .8 .324 .8
S 1. .030 1. .326.062 .0330 .047 *.' .042 i°5 .03
b.2 .354 .(.040 2.0.077 .7 . . .046 .10; 40 L+. .a054 4 ..133 .i5 o362 " 3-
.22 U .159 Oo .060 9..27C 13. .189 140 .0362 16. n.363 21.0 .233 21.c .064 20. C'.41i 25 . .253 2 .069 25. L _
.453 3 .6 .278 3;0. .071 3.
e .482 35. .294 5 0.591 45. .314 38.0 .U65 41.629 5. .327 45.0 .078 45.c-53b 51. .351 5 . .084 50.0
.358 55., .077 55.c
0 .360 6j.2.379 62..408 69.0
zCA
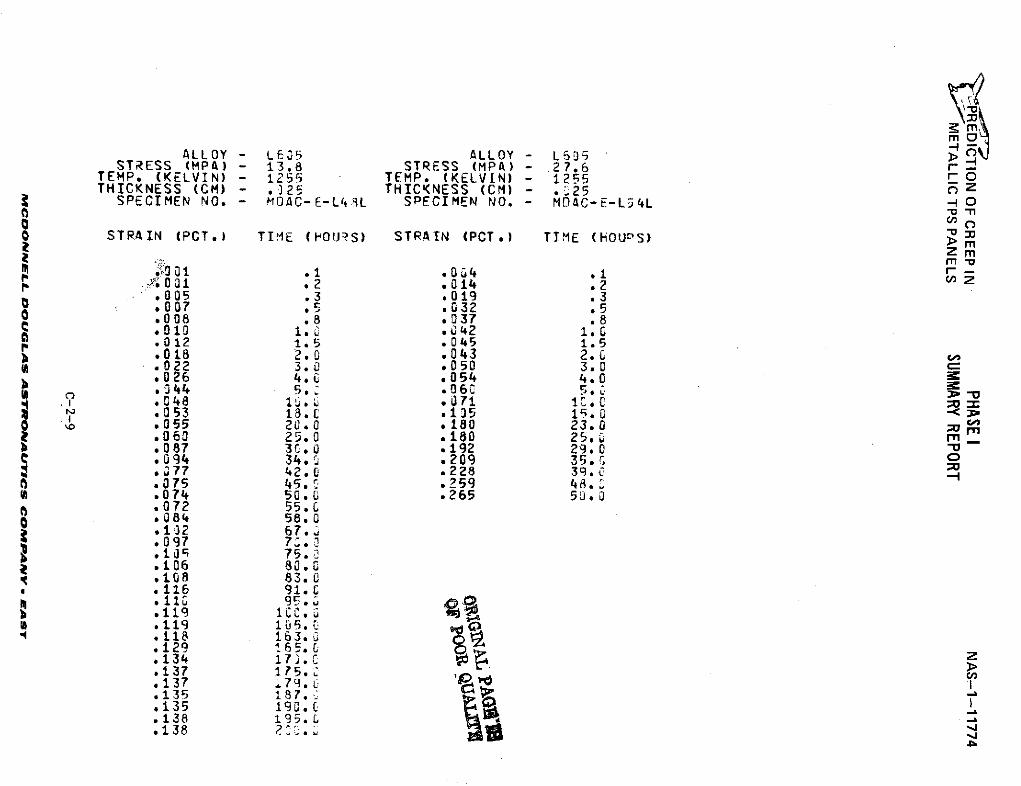
m
ALLOY - L605 ALLOY - L5 -5OSTRESS (MPA) - 13.8 STRESS (MPA) - 27.6 r
TEMP. (KELVIN) - 1255 TEMP. (KELVIN) - 1255THICKNESS (CM) - .325 THICKNESS (CM) - 25
SPECIMEN NO. - MOAC-E-L41L SPECIMEN NO. - MD5C-E-L34L OW 0
o STRAIN (PCT.) TIME (POU S) STRAIN (PCT.) TIME (HOUPS) M> Zm2 m
0 01 .1 .04 01 r -a1oi .2 .014 .2.005 .3 .019 .3.007 .5 .032 .5S.008 .8 .037 .8*010 . .042 1.0.012 1.5 .045 1.5.018 2.0 .043 2.0
S.022 3.0 .050 3.0 c.026 4.0 .054 4.0.344 5.$ 060.048 .071 C.053 18.0 .135 15.0
0 .055 20.0 .180 23.0 m.060 25.0 .180 250G.087 30.0 .192 29.0.094 34. .209 35. C.077 42.0 .228 39.
.075 45. .259 48.
.074 50.0 .265 5J00
.072 55.0S084 58.0* 132 67,*.097 7L..ida; 75.0.106 80.0S.108 83.0
, .116 91.0
.119 105,
.118 163. 0
.129 165.0.134 17.C Z.137 175. 4.137 179. L.135 187.'.135 190.0.138 195.L.138 2 ".
PREDICTION OF CREEP IN PHASE I - NAS-1-111774METALLIC TPS PANELS SUMMARY REPORT
APPENDIX C-3
L605 CYCLIC CREEP TESTS
(RAW DATA)
This section presents the results of the 15 cyclic creep tests that were
performed on L605 tensile specimens.
C-3-1
MCDONmNLL DOUGLAS ASTRONAo UrCS COMPAN4V . AeST
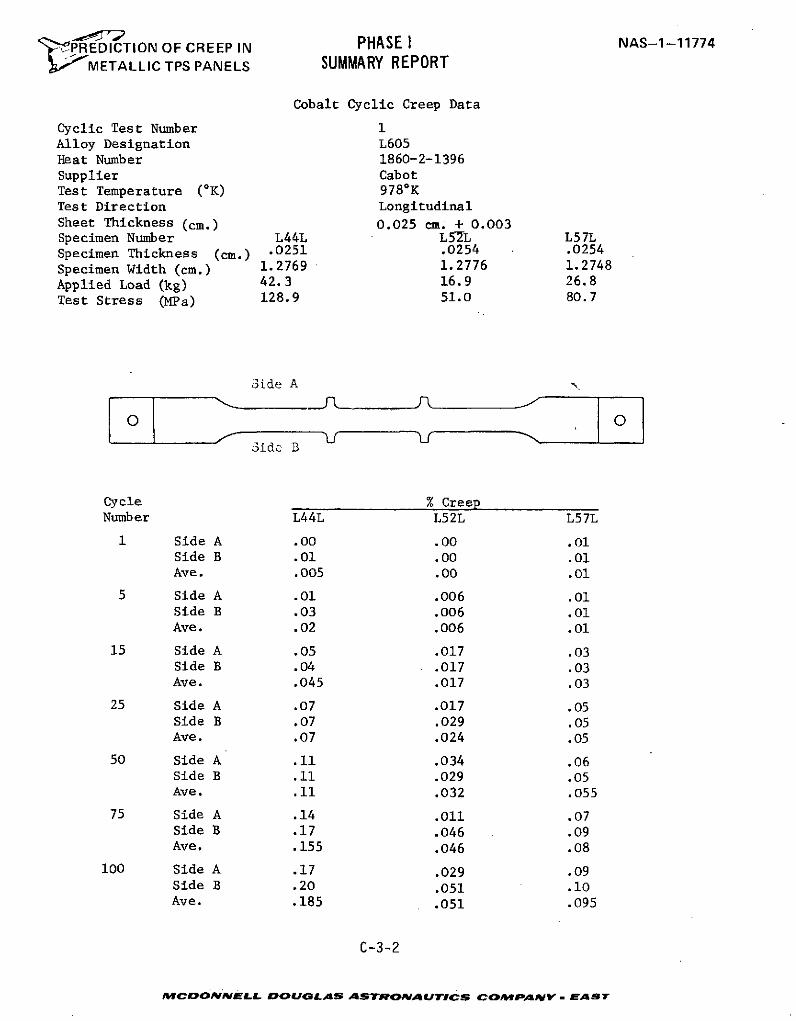
PREDICTION OF CREEP IN PHASE I NAS-1-11774
SMETALLIC TPS PANELS SUMMARY REPORT
Cobalt Cyclic Creep Data
Cyclic Test Number 1Alloy Designation L605Heat Number 1860-2-1396Supplier CabotTest Temperature (OK) 978*KTest Direction LongitudinalSheet Thickness (cm.) 0.025 cm. + 0.003Specimen Number L44L L57L L57LSpecimen Thickness (cm.) .0251 .0254 .0254
Specimen Width (cm.) 1.2769 1.2776 1.2748
Applied Load (kg) 42.3 16.9 26.8
Test Stress (MPa) 128.9 51.0 80.7
Side A
Side B
Cycle % CreepNumber L44L L52L L57L
1 Side A .00 .00 .01Side B .01 .00 .01Ave. .005 .00 .01
5 Side A .01 .006 .01Side B .03 .006 .01Ave. .02 .006 .01
15 Side A .05 .017 .03Side B .04 .017 .03Ave. .045 .017 .03
25 Side A .07 .017 .05Side B .07 .029 .05Ave. .07 .024 .05
50 Side A .11 .034 .06Side B .11 .029 .05Ave. .11 .032 .055
75 Side A .14 .011 .07Side B .17 .046 .09Ave. .155 .046 .08
100 Side A .17 .029 .09Side B .20 .051 .10Ave. .185 .051 .095
C-3-2
MCDONNELL DOUGLAS ASTRONAUTICS COMPANY - EAST
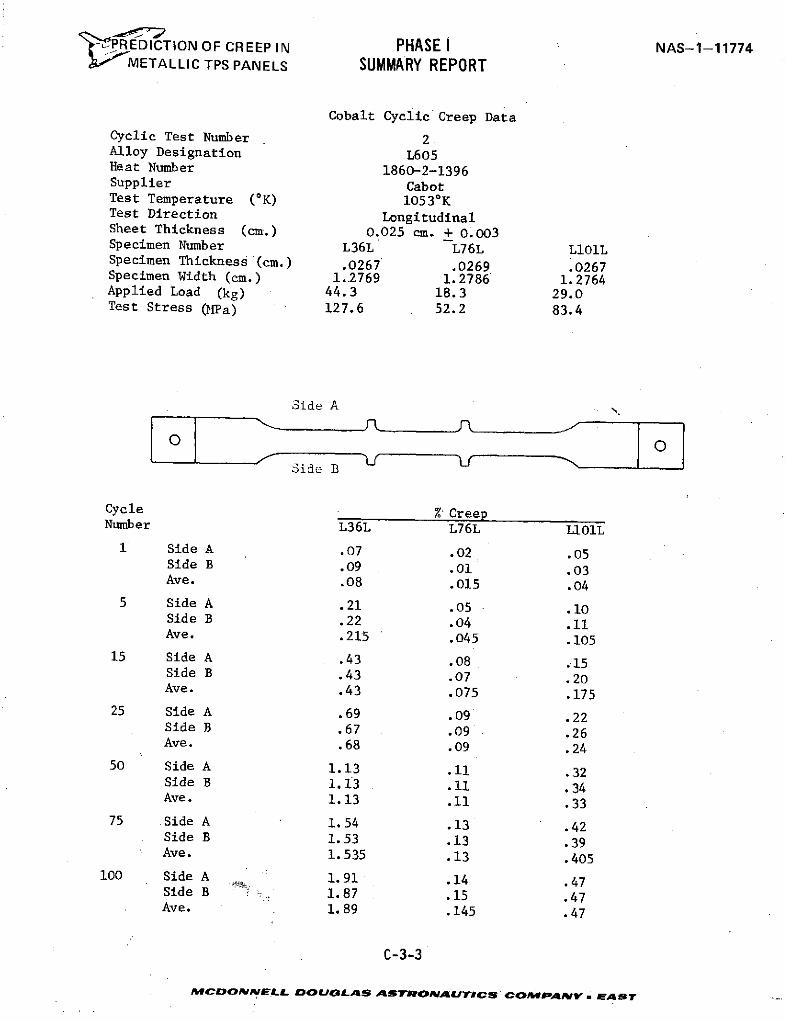
'tZPIEDICTION OF CREEP IN PHASE I NAS-1-11774METALLIC TPS PANELS SUMMARY REPORT
Cobalt Cyclic Creep Data
Cyclic Test Number 2Alloy Designation L605Heat Number 1860-2-1396Supplier CabotTest Temperature (OK) 10530KTest Direction LongitudinalSheet Thickness (cm.) 0.025 cm. + 0.003Specimen Number L36L L76L L101LSpecimen Thickness (cm.) .0267 .0269 .0267Specimen Width (cm.) 1..2769 1.2786 1.2764Applied Load (kg) 44.3 18.3 29.0Test Stress (MPa) 127.6 52.2 83.4
Side A
O OSide B --
Cycle % CreepNumber L36L L76L L101L1 Side A .07 .02 .05
Side B .09 .01 .03Ave. .08 .015 .04
5 Side A .21 .05 .10Side B .22 .04 .11Ave. .215 .045 .105
15 Side A .43 .08 .15Side B .43 .07 .20Ave. .43 .075 .175
25 Side A .69 .09 .22Side B .67 .09 .26Ave. .68 .09 .24
50 Side A 1.13 .11 .32Side B 1.13 .11 .34Ave. 1. 13 .11 .33
75 Side A 1.54 .13 .42Side B 1.53 .13 .39Ave. 1. 535 .13 .405
100 Side A 1.91 .14 .47Side B 1.87 .15 .47Ave. 1. 89 .145 .47
C-3-3
"MCDONNELL DOUGLAS ASTRONAUTICS cOdMPANY - EAST
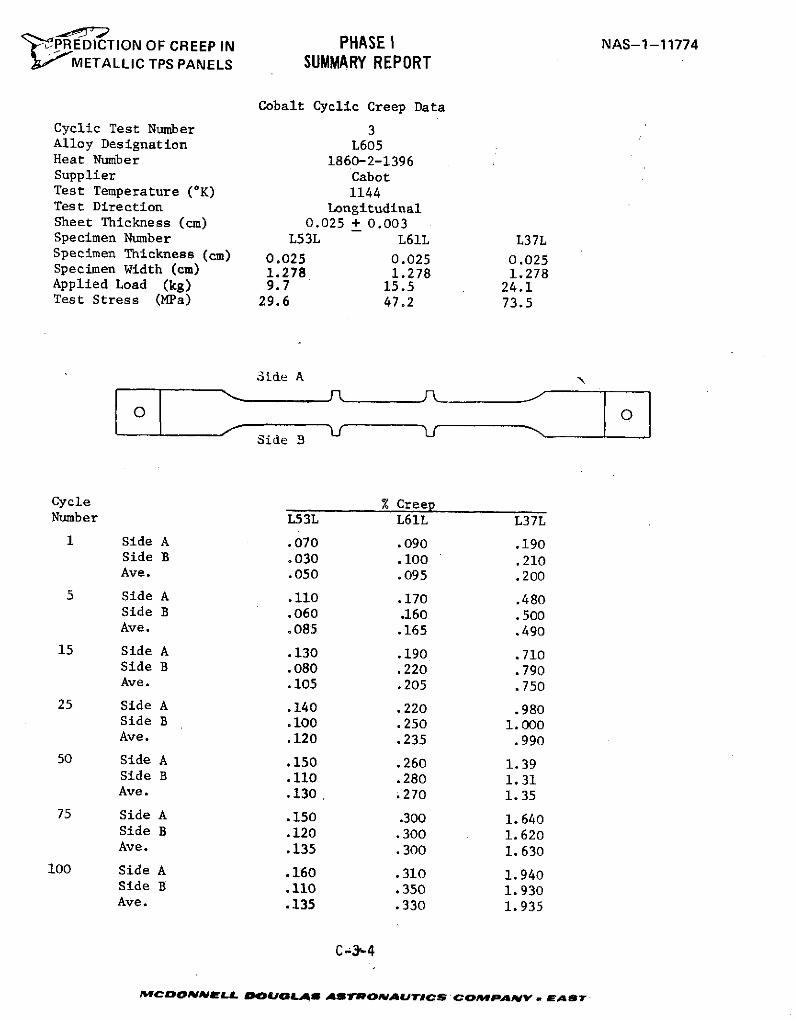
' PREDICTION OF CREEP IN PHASE I NAS-1-11774METALLIC TPS PANELS SUMMARY REPORT
Cobalt Cyclic Creep Data
Cyclic Test Number 3Alloy Designation L605Heat Number 1860-2-1396Supplier CabotTest Temperature (OK) 1144Test Direction LongitudinalSheet Thickness (cm) 0.025 + 0.003Specimen Number L53L L61L L37LSpecimen Thickness (cm) 0.025 0.025 0.025Specimen Width (cm) 1.278 1.278 1.278Applied Load (kg) 9.7 15.5 24.1Test Stress (MPa) 29.6 47.2 73.5
Side A
SSide B L
Cycle % CreepNumber L53L L61L L37L
1 Side A .070 .090 .190Side B .030 .100 .210Ave. .050 .095 .200
5 Side A .110 .170 .480Side B .060 .160 .500Ave. .085 .165 .490
15 Side A .130 .190 .710Side B .080 .220 .790Ave. .105 .205 .750
25 Side A .140 .220 .980Side B .100 .250 1.000Ave. .120 .235 .990
50 Side A .150 .260 1.39Side B .110 .280 1.31Ave. .130 .270 1.35
75 Side A .150 .300 1.640Side B .120 .300 1.620Ave. .135 .300 1.630
100 Side A .160 .310 1.940Side B .110 .350 1.930Ave. .135 .330 1.935
C -3-4
CDIONmELL oU8JOLAS ATArONAITVICS COMMPAdV -W AST
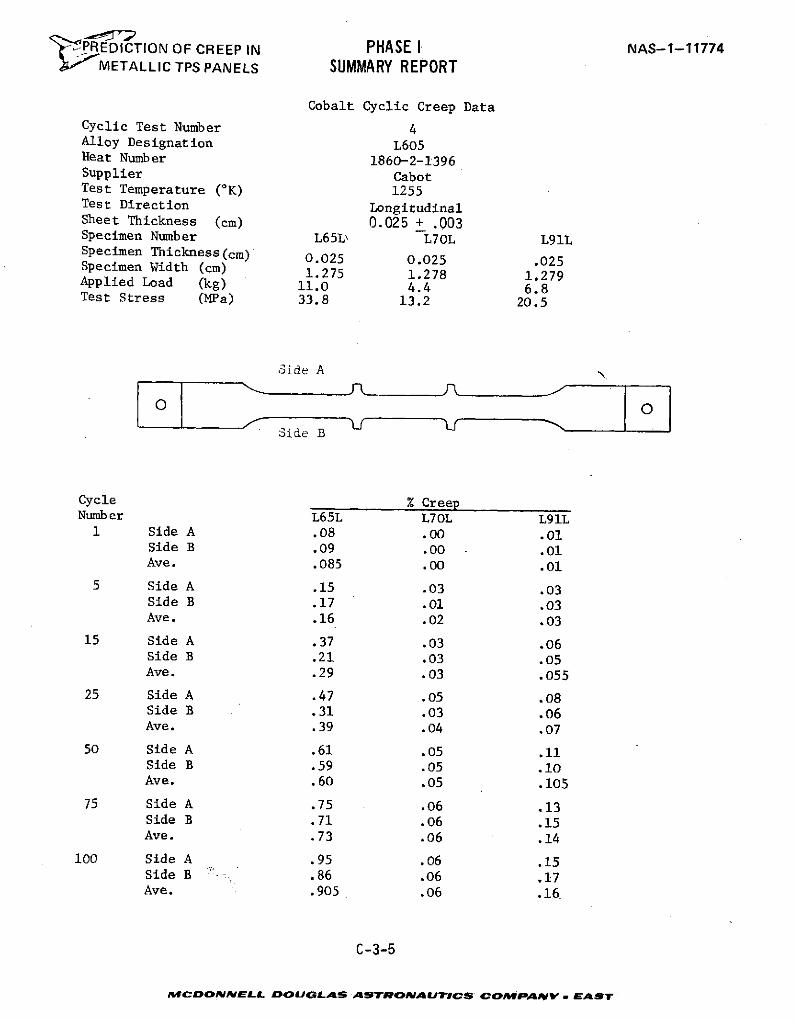
L'PREDICTION OF CREEP IN PHASE I NAS-1-11774METALLIC TPS PANELS SUMMARY REPORT
Cobalt Cyclic Creep Data
Cyclic Test Number 4Alloy Designation L605Heat Number 1860-2-1396Supplier CabotTest Temperature (OK) 1255Test Direction LongitudinalSheet Thickness (cm) 0.025 + .003Specimen Number L65L, -L70L L91LSpecimen Thickness(cm) 0.025 0.025 .025Specimen Width (cm) 1.275 1.278 1.279Applied Load (kg) 11.0 4.4 6.8Test Stress (MPa) 33.8 13.2 20.5
Side A
O O
Cycle % CreepNumber L65L L70L L91L1 Side A .08 .00 .01
Side B .09 .00 .01Ave. .085 .00 .01
5 Side A .15 .03 .03Side B .17 .01 .03Ave. .16 .02 .03
15 Side A .37 .03 .06Side B .21 .03 .05Ave. .29 .03 .055
25 Side A .47 .05 .08Side B .31 .03 .06Ave. .39 .04 .07
50 Side A .61 .05 .11Side B .59 .05 .10Ave. .60 .05 .105
75 Side A .75 .06 .13Side B .71 .06 .15Ave. .73 .06 .14
100 Side A .95 .06 .15Side B .86 .06 .17Ave. .905 .06 .16
C-3-5
MCDONNELL DOUGLAS ASTRONAUTICS COMPANPV EAST
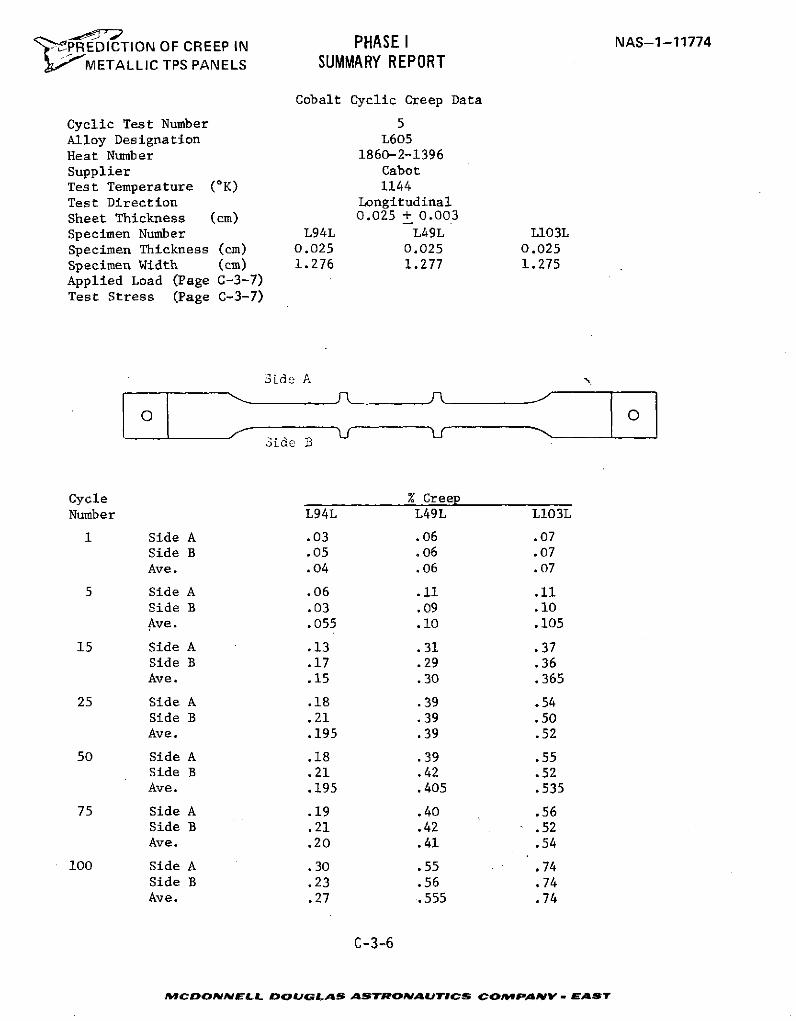
'-P-REDICTION OF CREEP IN PHASE I NAS-1-11774
METALLIC TPS PANELS SUMMARY REPORT
Cobalt Cyclic Creep Data
Cyclic Test Number 5Alloy Designation L605Heat Number 1860-2-1396Supplier CabotTest Temperature (OK) 1144Test Direction LongitudinalSheet Thickness (cm) 0.025 + 0.003
Specimen Number L94L L49L L103LSpecimen Thickness (cm) 0.025 0.025 0.025Specimen Width (cm) 1.276 1.277 1.275Applied Load (Page C-3-7)Test Stress (Page C-3-7)
Side A
Side B
Cycle % CreepNumber L94L L49L L103L
1 Side A .03 .06 .07Side B .05 .06 .07Ave. .04 .06 .07
5 Side A .06 .11 .11Side B .03 .09 .10Ave. .055 .10 .105
15 Side A .13 .31 .37Side B .17 .29 .36Ave. .15 .30 .365
25 Side A .18 .39 .54Side B .21 .39 .50Ave. .195 .39 .52
50 Side A .18 .39 .55Side B .21 .42 .52Ave. .195 .405 .535
75 Side A .19 .40 .56Side B .21 .42 .52Ave. .20 .41 .54
100 Side A .30 .55 .74Side B .23 .56 .74Ave. .27 .555 .74
C-3-6
MCDONNELL DOUGLAS ASTRONAUTICS COMPANYV EAST
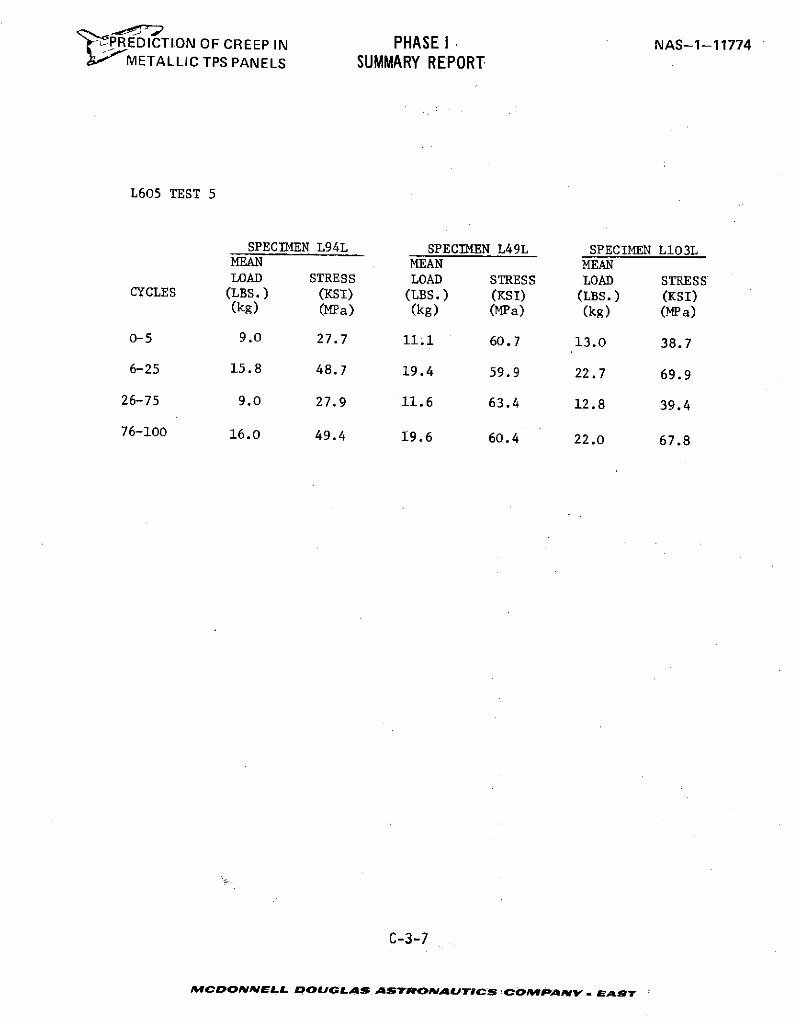
t-ZPREDICTION OF CREEP IN PHASE I NAS-1-11774"'RMETALLIC TPS PANELS SUMMARY REPORT
L605 TEST 5
SPECIMEN L94L SPECIMEN L49L SPECIMEN L1O3LMEAN MEAN MEANLOAD STRESS LOAD STRESS LOAD STRESS
CYCLES (LBS.) (KSI) (LBS.) (KSI) (LBS.) (KSI)(kg) (MPa) (kg) (MPa) (kg) (MPa)
0-5 9.0 27.7 11.1 60.7 13.0 38.7
6-25 15.8 48.7 19.4 59.9 22.7 69.9
26-75 9.0 27.9 11.6 63.4 12.8 39.4
76-100 16.0 49.4 19.6 60.4 22.0 67.8
C-3-7.
MCDONNELL DOUGLAS ASTRONAUTICS 4COMPANV . EAST
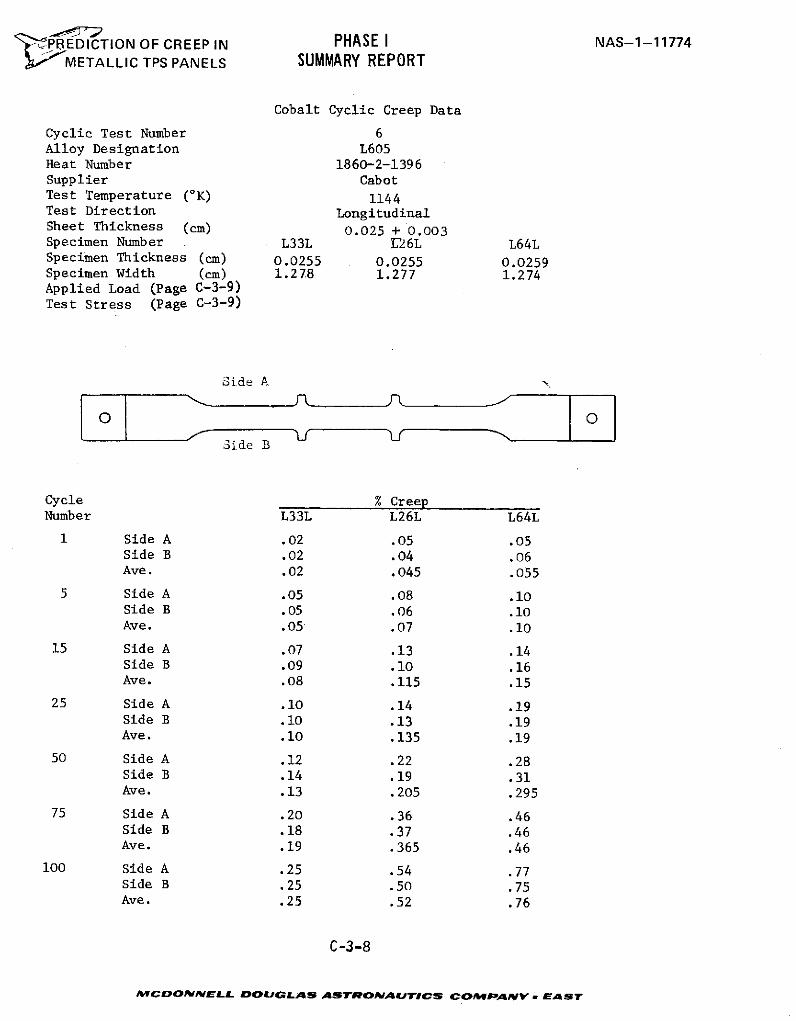
' PREDICTION OF CREEP IN PHASE I NAS-1-11774L METALLIC TPS PANELS SUMMARY REPORT
Cobalt Cyclic Creep Data
Cyclic Test Number 6Alloy Designation L605Heat Number 1860-2-1396Supplier CabotTest Temperature (°K) 1144Test Direction LongitudinalSheet Thickness (cm) 0.025 + 0.003Specimen Number L33L E26L L64LSpecimen Thickness (cm) 0.0255 0.0255 0.0259Specimen Width (cm) 1.278 1.277 1.274Applied Load (Page C-3-9)Test Stress (Page C-3-9)
Side A
Side B
Cycle % CreepNumber L33L L26L L64L
1 Side A .02 .05 .05Side B .02 .04 .06Ave. .02 .045 .055
5 Side A .05 .08 .10Side B .05 .06 .10Ave. .05 .07 .10
15 Side A .07 .13 .14Side B .09 .10 .16Ave. .08 .115 .15
25 Side A .10 .14 .19Side B .10 .13 .19Ave. .10 .135 .19
50 Side A .12 .22 .28Side B .14 .19 .31Ave. .13 .205 .295
75 Side A .20 .36 .46Side B .18 .37 .46Ave. .19 .365 .46
100 Side A .25 .54 .77Side B .25 .50 .75Ave. .25 .52 .76
C-3-8
MCDONNELL DOUGLAS ASTRONAUTICS COMPANVY EAST
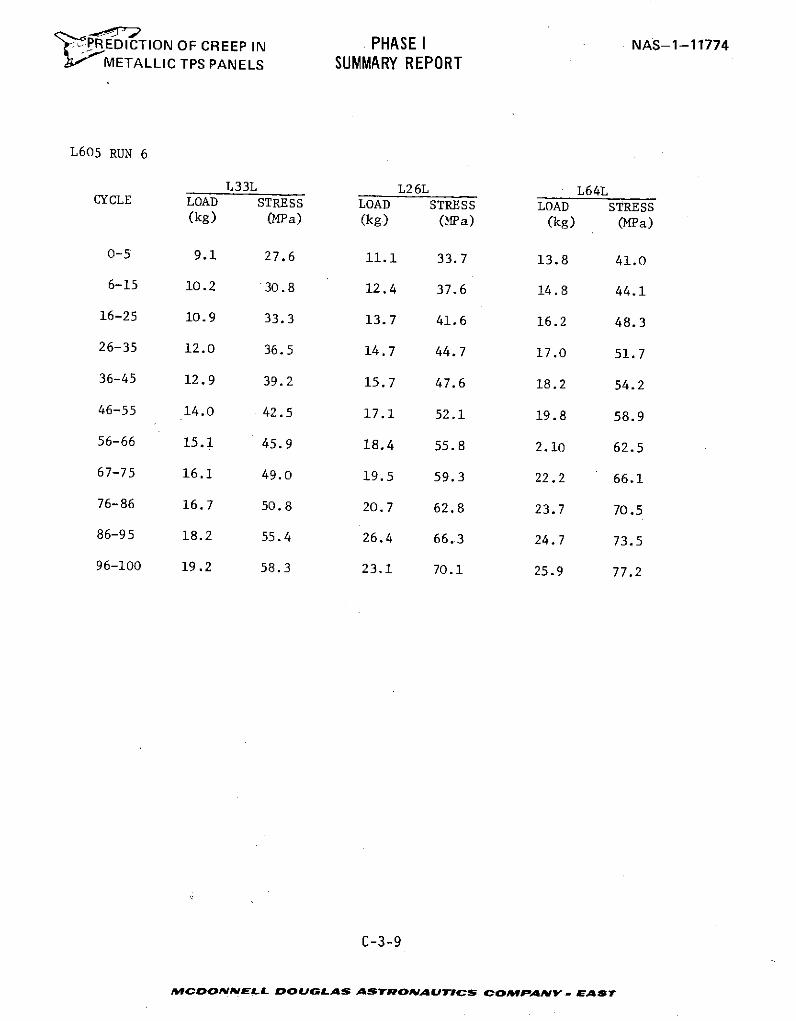
>fiPREDICTION OF CREEP IN PHASE I NAS-1-11774METALLIC TPS PANELS SUMMARY REPORT
L605 RUN 6
L33L L26L L64LCYCLE LOAD STRESS LOAD STRESS LOAD STRESS
(kg) (MPa) (kg) (MPa) (kg) (MPa)
0-5 9.1 27.6 11.1 33.7 13.8 41.0
6-15 10.2 30.8 12.4 37.6 14.8 44.1
16-25 10.9 33.3 13.7 41.6 16.2 48.3
26-35 12.0 36.5 14.7 44.7 17.0 51.7
36-45 12.9 39.2 15.7 47.6 18.2 54.2
46-55 14.0 42.5 17.1 52.1 19.8 58.9
56-66 15.1 45.9 18.4 55.8 2.10 62.5
67-75 16.1 49.0 19.5 59.3 22.2 66.1
76-86 16.7 50.8 20.7 62.8 23.7 70.5
86-95 18.2 55.4 26.4 66.3 24.7 73.5
96-100 19.2 58.3 23.1 70.1 25.9 77.2
C-3-9
MCDONNELL DOUGLAS ASTRONAUTICS COMPANYV - EAST
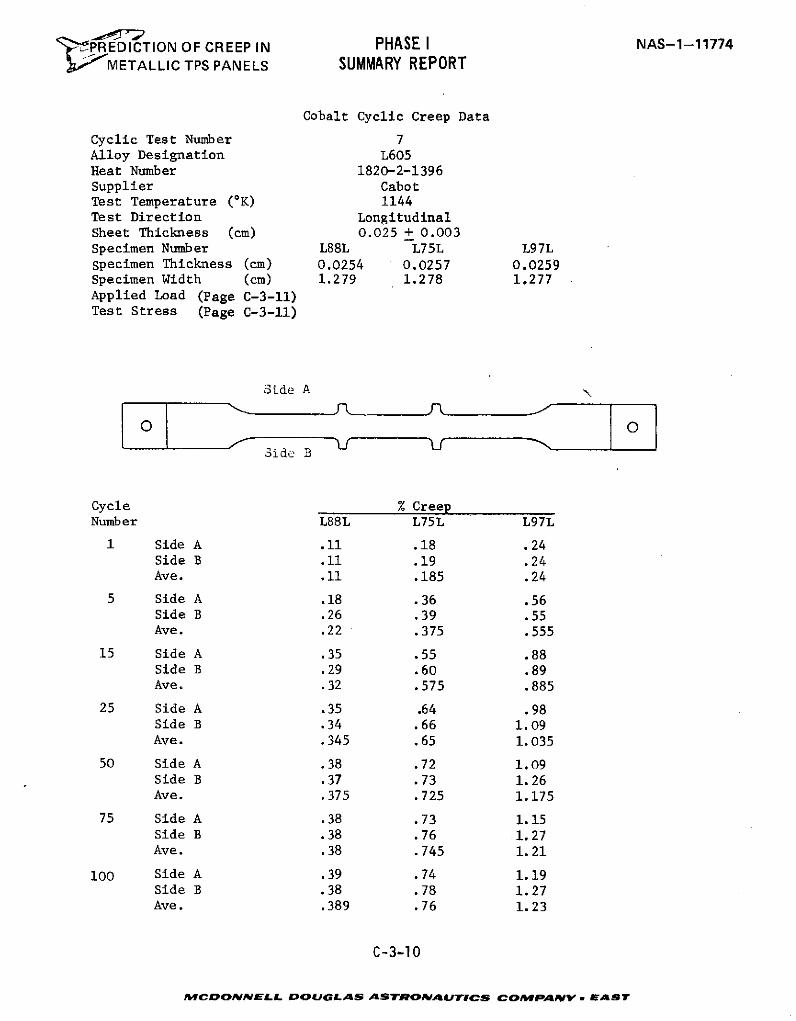
t- PREDICTION OF CREEP IN PHASE I NAS-1-11774METALLIC TPS PANELS SUMMARY REPORT
Cobalt Cyclic Creep Data
Cyclic Test Number 7Alloy Designation L605Heat Number 1820-2-1396Supplier CabotTest Temperature (OK) 1144Test Direction LongitudinalSheet Thickness (cm) 0.025 + 0.003Specimen Number L88L L75L L97Lspecimen Thickness (cm) 0.0254 0.0257 0.0259Specimen Width (cm) 1.279 1.278 1.277Applied Load (Page C-3-11)Test Stress (Page C-3-11)
Side A
Side B
Cycle % CreepNumber L88L L75L L97L
1 Side A .11 .18 .24Side B .11 .19 .24Ave. .11 .185 .24
5 Side A .18 .36 .56Side B .26 .39 .55Ave. .22 .375 .555
15 Side A .35 .55 .88Side B .29 .60 .89Ave. .32 .575 .885
25 Side A .35 .64 .98Side B .34 .66 1.09Ave. .345 .65 1.035
50 Side A .38 .72 1.09Side B .37 .73 1.26Ave. .375 .725 1.175
75 Side A .38 .73 1.15Side B .38 .76 1.27Ave. .38 .745 1.21
100 Side A .39 .74 1.19Side B .38 .78 1.27Ave. .389 .76 1.23
C-3-10
MCDONNELL DOUGLAS ASTRONAUTICS COMPAiY . EAST
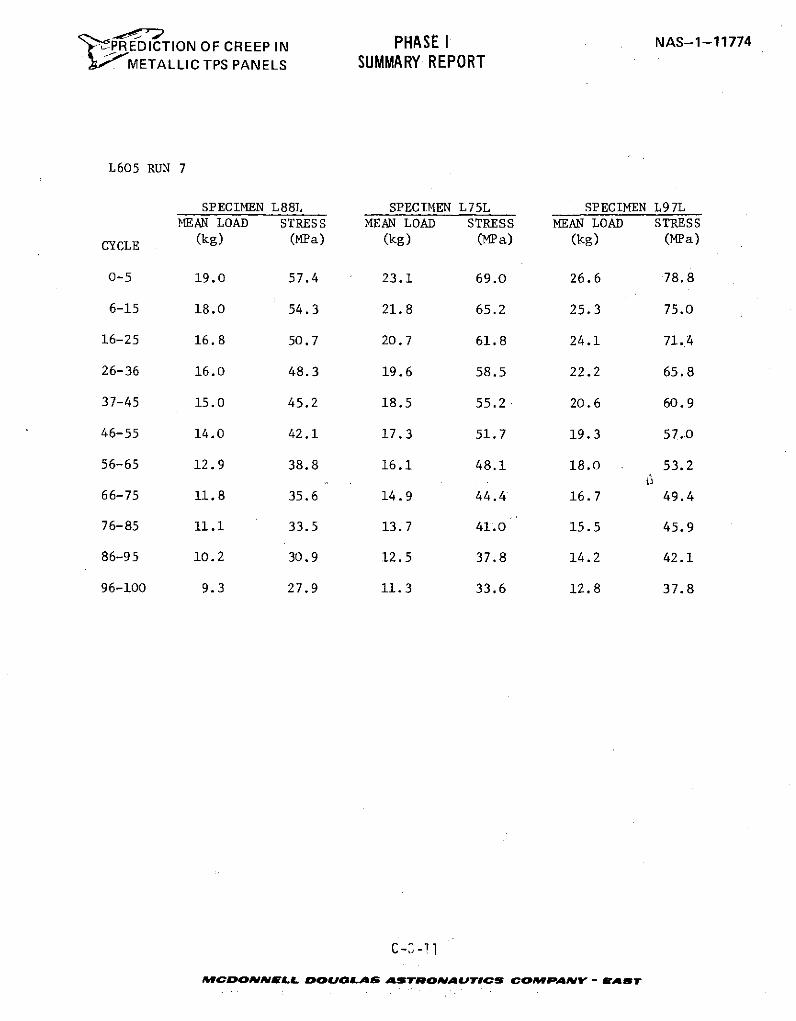
'PREDICTION OF CREEP IN PHASE I NAS-1-11774M ETALLIC TPS PANELS SUMMARY REPORT
L605 RUN 7
SPECIMEN L88L SPECIMEN L75L SPECIMEN L97LMEAN LOAD STRESS MEAN LOAD STRESS MEAN LOAD STRESS
CYCLE (kg) (MPa) (kg) (MPa) (kg) (MPa)
0-5 19.0 57.4 23.1 69.0 26.6 78.8
6-15 18.0 54.3 21.8 65.2 25.3 75.0
16-25 16.8 50.7 20.7 61.8 24.1 71.4
26-36 16.0 48.3 19.6 58.5 22.2 65.8
37-45 15.0 45.2 18.5 55.2. 20.6 60.9
46-55 14.0 42.1 17.3 51.7 19.3 57.0
56-65 12.9 38.8 16.1 48.1 18.0 53.2
66-75 11.8 35.6 14.9 44.4 16.7 49.4
76-85 11.1 33.5 13.7 41.0 15.5 45.9
86-95 10.2 30.9 12.5 37.8 14.2 42.1
96-100 9.3 27.9 11.3 33.6 12.8 37.8
C-3-!11
MCDONIMELL DOUGLAS ASTROIAUTICS COMPANY - EAer
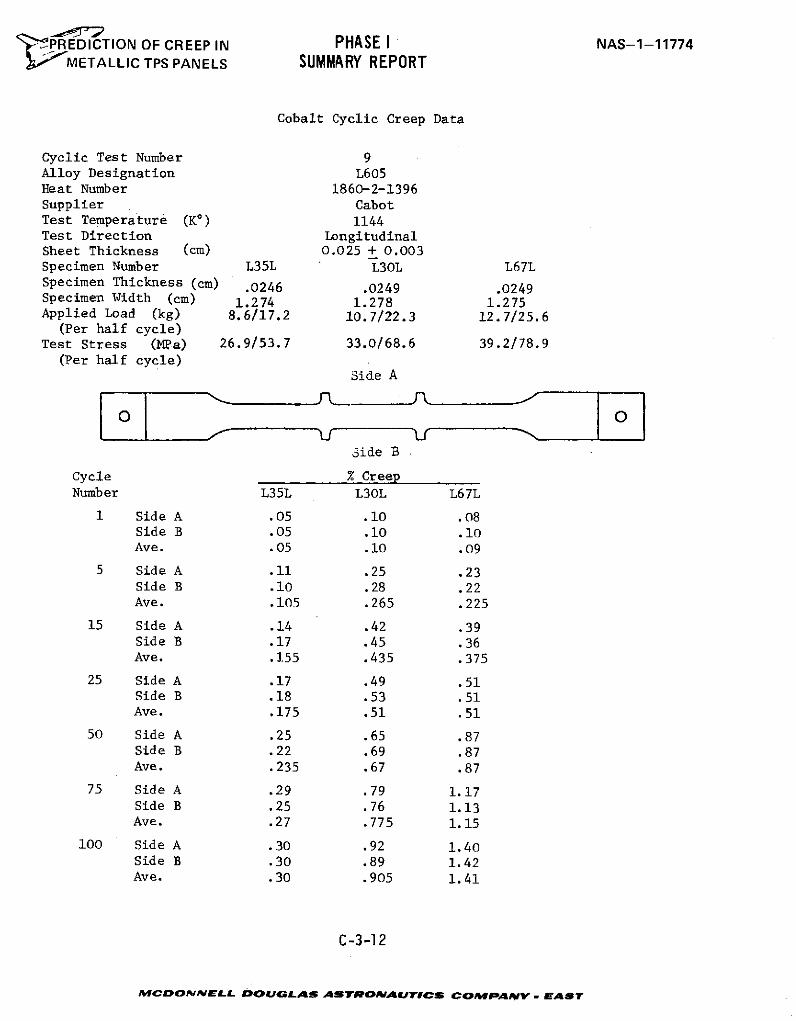
'"PREDICTION OF CREEP IN PHASE I NAS-1-11774METALLIC TPS PANELS SUMMARY REPORT
Cobalt Cyclic Creep Data
Cyclic Test Number 9Alloy Designation L605Heat Number 1860-2-1396Supplier CabotTest Temperature (Ko) 1144Test Direction LongitudinalSheet Thickness (cm) 0.025 + 0.003Specimen Number L35L L30L L67LSpecimen Thickness (cm) .0246 .0249 .0249Specimen Width (cm) 1.274 1.278 1.275Applied Load (kg) 8.6/17.2 10.7/22.3 12.7/25.6
(Per half cycle)Test Stress (MPa) 26.9/53.7 33.0/68.6 39.2/78.9
(Per half cycle)Side A
Side B
Cycle % CreepNumber L35L L30L L67L
1 Side A .05 .10 .08Side B .05 .10 .10Ave. .05 .10 .09
5 Side A .11 .25 .23Side B .10 .28 .22Ave. .105 .265 .225
15 Side A .14 .42 .39Side B .17 .45 .36Ave. .155 .435 .375
25 Side A .17 .49 .51Side B .18 .53 .51Ave. .175 .51 .51
50 Side A .25 .65 .87Side B .22 .69 .87Ave. .235 .67 .87
75 Side A .29 .79 1.17Side B .25 .76 1.13Ave. .27 .775 1.15
100 Side A .30 .92 1.40Side B .30 .89 1.42Ave. .30 .905 1.41
C-3-12
MCDONfNELL DOUGLAS ASTRONAUTICS COMPANV . EAST
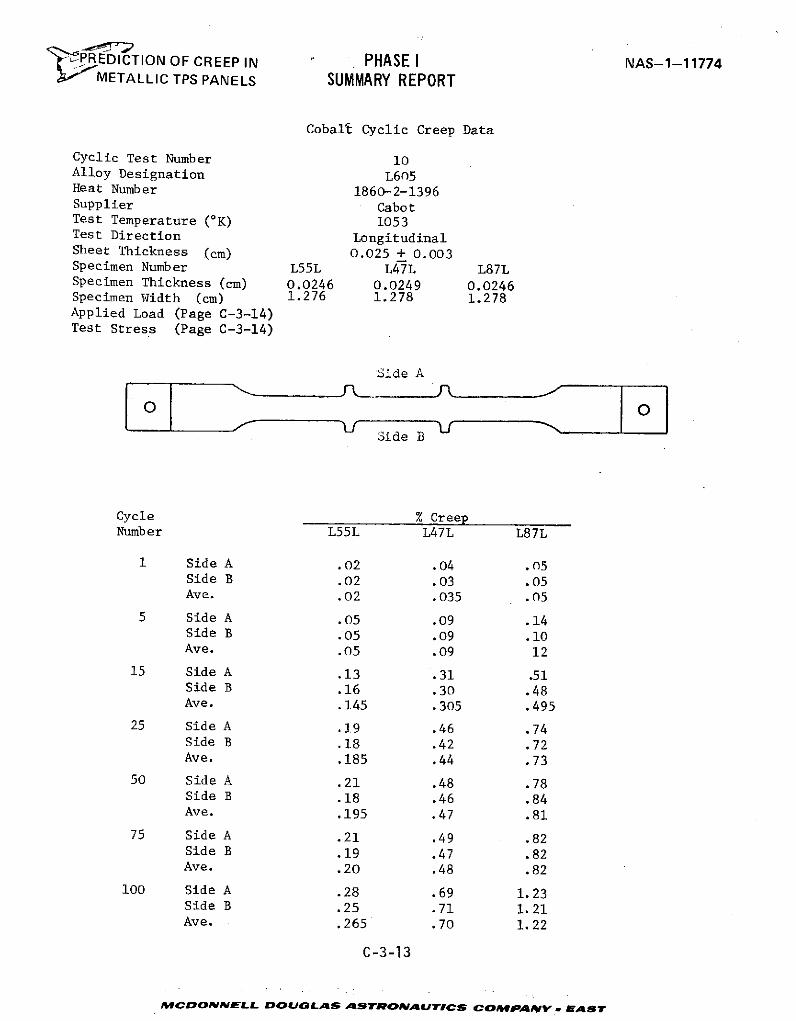
LPREDICTION OF CREEP IN PHASE I NAS-1-11774NIETALLIC TPS PANELS SUMMARY REPORT
Cobalt Cyclic Creep Data
Cyclic Test Number 10Alloy Designation L605Heat Number 1860-2-1396Supplier CabotTest Temperature (oK) 1053Test Direction LongitudinalSheet Thickness (cm) 0.025 + 0.003Specimen Number L55L L47L L87LSpecimen Thickness (cm) 0.0246 0.0249 0.0246Specimen Width (cm) 1.276 1.278 1.278Applied Load (Page C-3-14)Test Stress (Page C-3-14)
Side A
OO
3ide B
Cycle % CreepNumber L55L L47L L87L
1 Side A .02 .04 .05Side B .02 .03 .05Ave. .02 .035 .05
5 Side A .05 .09 .14Side B .05 .09 .10Ave. .05 .09 12
15 Side A .13 .31 .51Side B .16 .30 .48Ave. .145 .305 .495
25 Side A .19 .46 .74Side B .18 .42 .72Ave. .185 .44 .73
50 Side A .21 .48 .78Side B .18 .46 .84Ave. .195 .47 .81
75 Side A .21 .49 .82Side B .19 .47 .82Ave. .20 .48 .82
100 Side A .28 .69 1.23Side B .25 .71 1.21Ave. .265 .70 1. 22
C-3-13
FCDONNELL DOUGLAS ASTRONAUTICS COMsPA"PV EAST
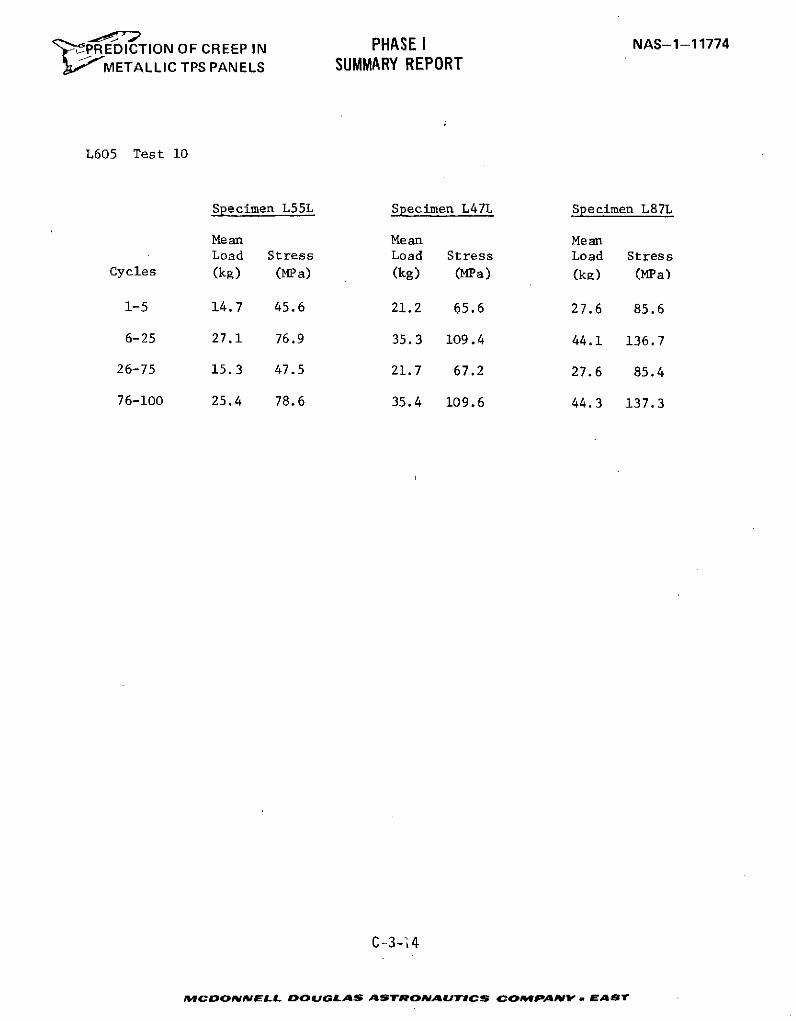
PREDICTION OF CREEP IN PHASE I NAS-1-11774
j METALLIC TPS PANELS SUMMARY REPORT
L605 Test 10
Specimen L55L Specimen L47L Specimen L87L
Mean Mean MeanLoad Stress Load Stress Load Stress
Cycles (kg) (MPa) (kg) (MPa) (ka) (MPa)
1-5 14.7 45.6 21.2 65.6 27.6 85.6
6-25 27.1 76.9 35.3 109.4 44.1 136.7
26-75 15.3 47.5 21.7 67.2 27.6 85.4
76-100 25.4 78.6 35.4 109.6 44.3 137.3
C-3--4
MCDONNELL DOUGLAS ASTRONAUTICS COMPANV - EAST
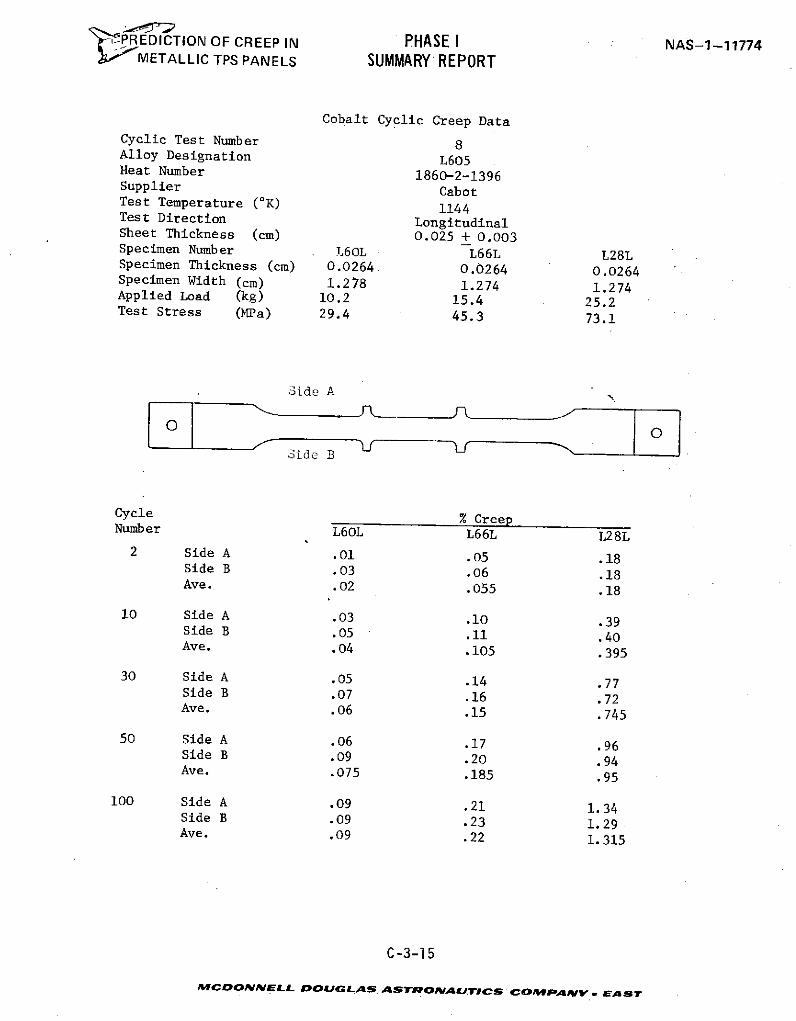
PREDICTION OF CREEP IN PHASE I NAS-1-11774METALLIC TPS PANELS SUMMARY REPORT
Cobalt Cyclic Creep DataCyclic Test Number 8Alloy Designation L605Heat Number 1860-2-1396Supplier CabotTest Temperature (OK) 1144Test Direction LongitudinalSheet Thickness (cm) 0.025 + 0.003Specimen Number L60L L66L L28LSpecimen Thickness (cm) 0.0264 0.0264 0.0264Specimen Width (cm) 1.278 1.274 1.274Applied Load (kg) 10.2 15.4 25.2Test Stress (MPa) 29.4 45.3 73.1
Side A
Side B
Cycle % CreepNumber L6OL L66L L28L2 Side A .01 .05 .18
Side B .03 .06 .18Ave. .02 .055 .18
10 Side A .03 .10 .39Side B .05 .11 .40Ave. .04 .105 .395
30 Side A .05 .14 .77Side B .07 .16 .72Ave. .06 .15 .745
50 Side A .06 .17 .96Side B .09 .20 .94Ave. .075 .185 .95
100 Side A .09 .21 1.34Side B .09 .23 1.29Ave. .09 .22 1.315
C-3-15
MCDONNELL DOUGLAS ASTRONAUTICS COMPANY EA S
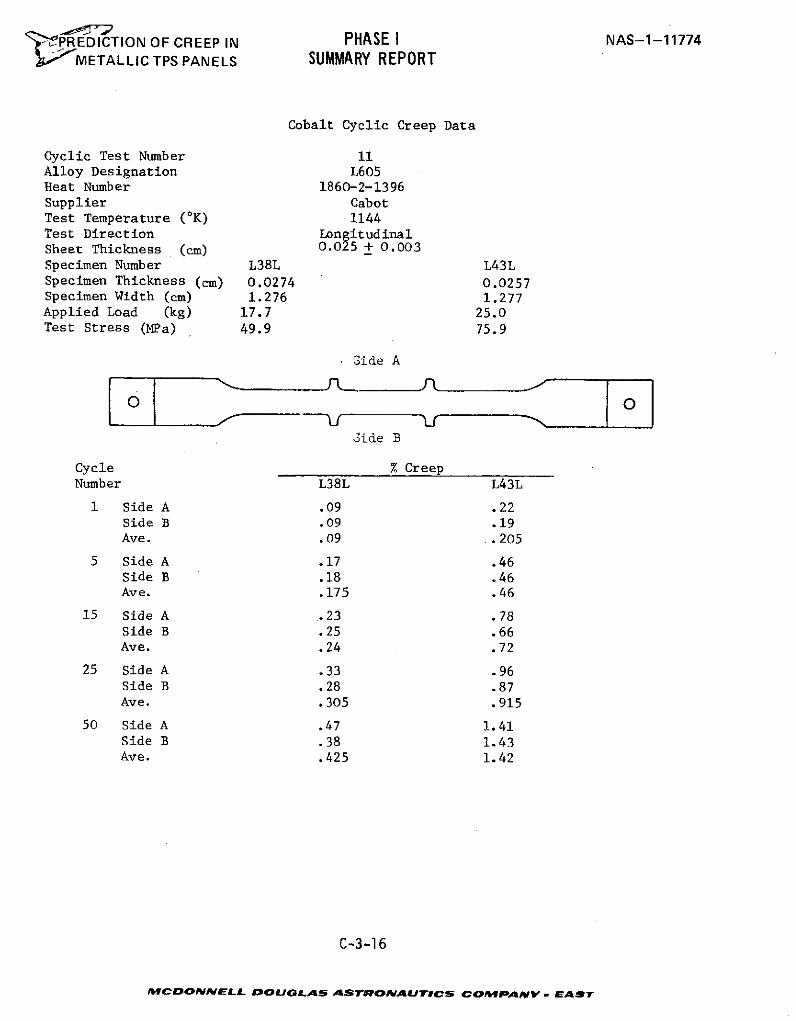
' PREDICTION OF CREEP IN PHASE I NAS-1-11774METALLIC TPS PANELS SUMMARY REPORT
Cobalt Cyclic Creep Data
Cyclic Test Number 11Alloy Designation L605Heat Number 1860-2-1396Supplier CabotTest Temperature (OK) 1144Test Direction LongitudinalSheet Thickness (cm) 0.025 + 0.003Specimen Number L38L L43LSpecimen Thickness (cm) 0.0274 0.0257Specimen Width (cm) 1.276 1.277Applied Load (kg) 17.7 25.0Test Stress (MPa) 49.9 75.9
Side A
Side B
Cycle % CreepNumber L38L L43L
1 Side A .09 .22Side B .09 .19Ave. .09 ..205
5 Side A .17 .46Side B .18 .46Ave. .175 .46
15 Side A ..23 .78Side B .25 .66Ave. .24 .72
25 Side A .33 .96Side B .28 .87Ave. .305 .915
50 Side A .47 1.41Side B .38 1.43Ave. .425 1. 42
C-3-16
AMCDONNELL DOUGLAS ASTRONAUTICS COMPANY . EST
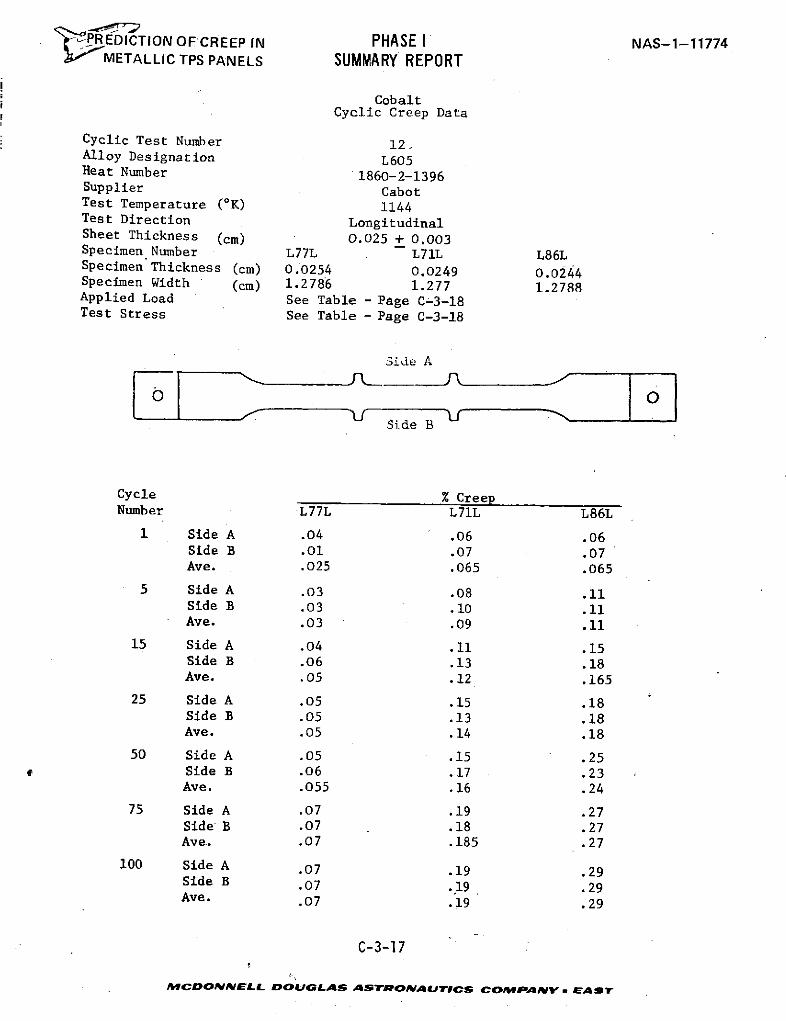
N-e05717?PREDICTION OFCREEP IN PHASE I NAS-1-11774i METALLIC TPS PANELS SUMMARY REPORT
CobaltCyclic Creep Data
Cyclic Test Number 12.Alloy Designation L605Heat Number 1860-2-1396Supplier CabotTest Temperature (OK) 1144Test Direction LongitudinalSheet Thickness (cm) 0.025 + 0.003Specimen Number L77L L71L L86LSpecimen Thickness (cm) 0.0254 0.0249 0.0244Specimen Width (cm) 1.2786 1.277 1.2788Applied Load See Table - Page C-3-18Test Stress See Table - Page C-3-18
Side A
Side B
Cycle % CreepNumber L77L L71L L86L
1 Side A .04 .06 .06Side B .01 .07 .07Ave. .025 .065 .065
5 Side A .03 .08 .11Side B .03 .10 .11Ave. .03 .09 .11
15 Side A .04 .11 .15Side B .06 .13 .18Ave. .05 .12 .165
25 Side A .05 .15 .18Side B .05 .13 .18Ave. .05 .14 .18
50 Side A .05 .15 .25Side B .06 .17 .23Ave. .055 .16 .24
75 Side A .07 .19 .27Side B .07 .18 .27Ave. .07 .185 .27
100 Side A .07 .19 .29Side B .07 .19 .29Ave. .07 .19 .29
C-3-17
MCDONNELL DOUGLAS ASTRONAIUTICS COMPANY EAST
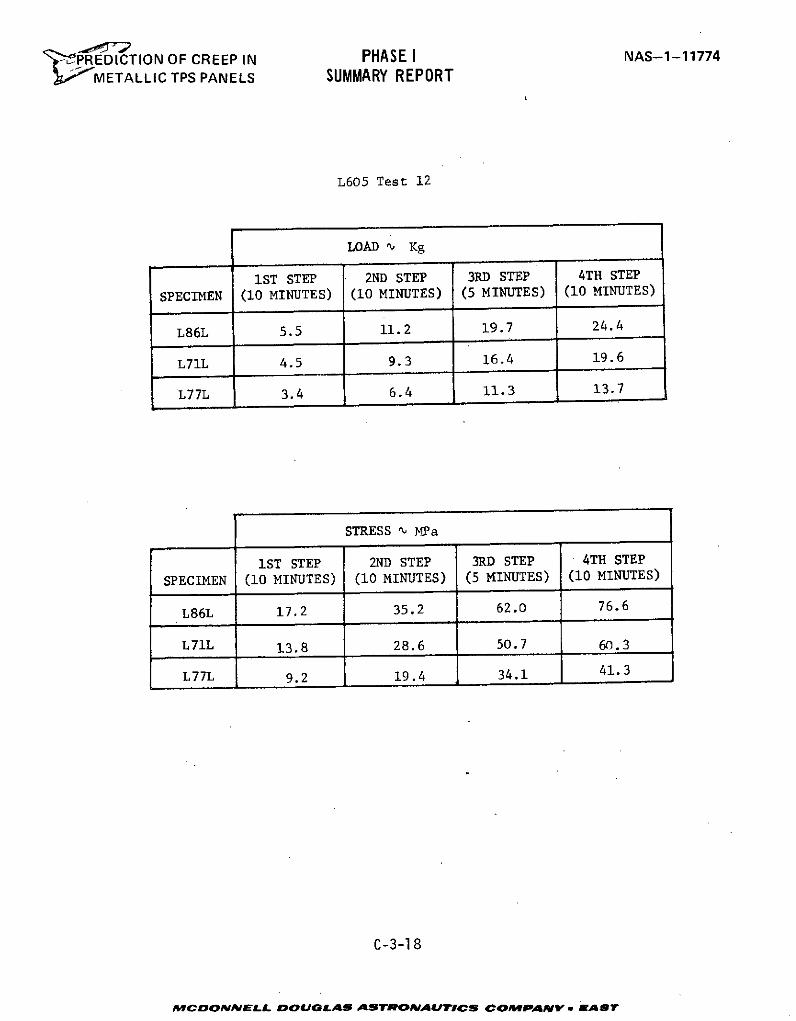
' PREDICTION OF CREEP IN PHASE I NAS-1-11774METALLIC TPS PANELS SUMMARY REPORT
L605 Test 12
LOAD , Kg
1ST STEP 2ND STEP 3RD STEP 4TH STEP
SPECIMEN (10 MINUTES) (10 MINUTES) (5 MINUTES) (10 MINUTES)
L86L 5.5 11.2 19.7 24.4
L71L 4.5 9.3 16.4 19.6
L77L 3.4 6.4 11.3 13.7
STRESS n MPa
1ST STEP 2ND STEP 3RD STEP 4TH STEP
SPECIMEN (10 MINUTES) (10 MINUTES) (5 MINUTES) (10 MINUTES)
L86L 17.2 35.2 62.0 76.6
L71L 13.8 28.6 50.7 60.3
L77L 9.2 19.4 34.1 41.3
C-3-18
MCDONNELL DOUGLAS ASTROMAUTwCS COMPANY . EAST
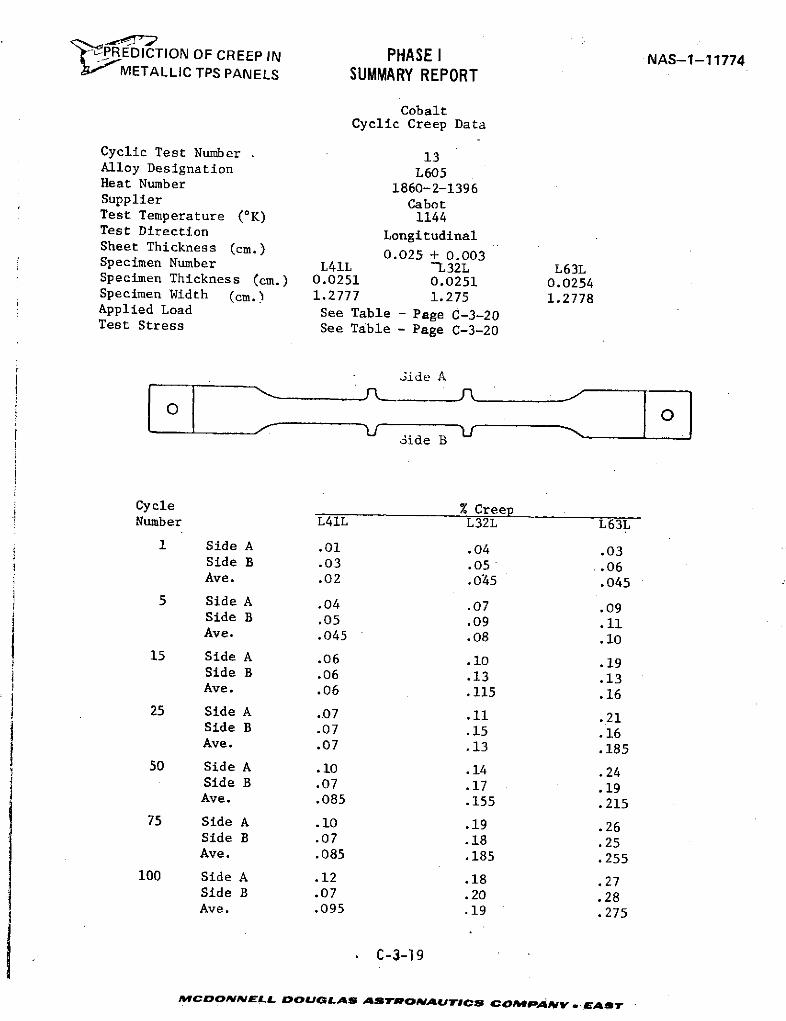
PRE DICTION OF CREEP IN PHASE I NAS-1-117742', METALLIC TPS PANELS SUMMARY REPORT
CobaltCyclic Creep Data
Cyclic Test Number 13Alloy Designation L605Heat Number 1860-2-1396Supplier CabotTest Temperature (OK) 1144Test Direction LongitudinalSheet Thickness (cm.) 0.025 + 0.003Specimen Number L41L -L32L L63LSpecimen Thickness (cm.) 0.0251 0.0251 0.0254Specimen Width (cm.) 1.2777 1.275 1.2778Applied Load See Table - Page C-3-20Test Stress See Table - Page C-3-20
Jide A
/ ide B
Cycle % CreepNumber L41L L32L L63L
1 Side A .01 .04 .03Side B .03 .05 .06Ave. .02 .0'45 .045
5 Side A .04 .07 .09Side B .05 .09 .11Ave. .045 .08 .10
15 Side A .06 .10 .19Side B .06 .13 .13Ave. .06 .115 .16
25 Side A .07 .11 .21Side B .07 .15 .16Ave. .07 .13 .185
50 Side A .10 .14 .24Side B .07 .17 .19Ave. .085 .155 .215
75 Side A .10 .19 .26Side B .07 .18 .25Ave. .085 .185 .255
100 Side A .12 .18 .27Side B .07 .20 .28Ave. .095 .19 .275
. C-3-19
MCoONNELLs nOOULAS ASTRONAUTICS COMPAty . wASTr
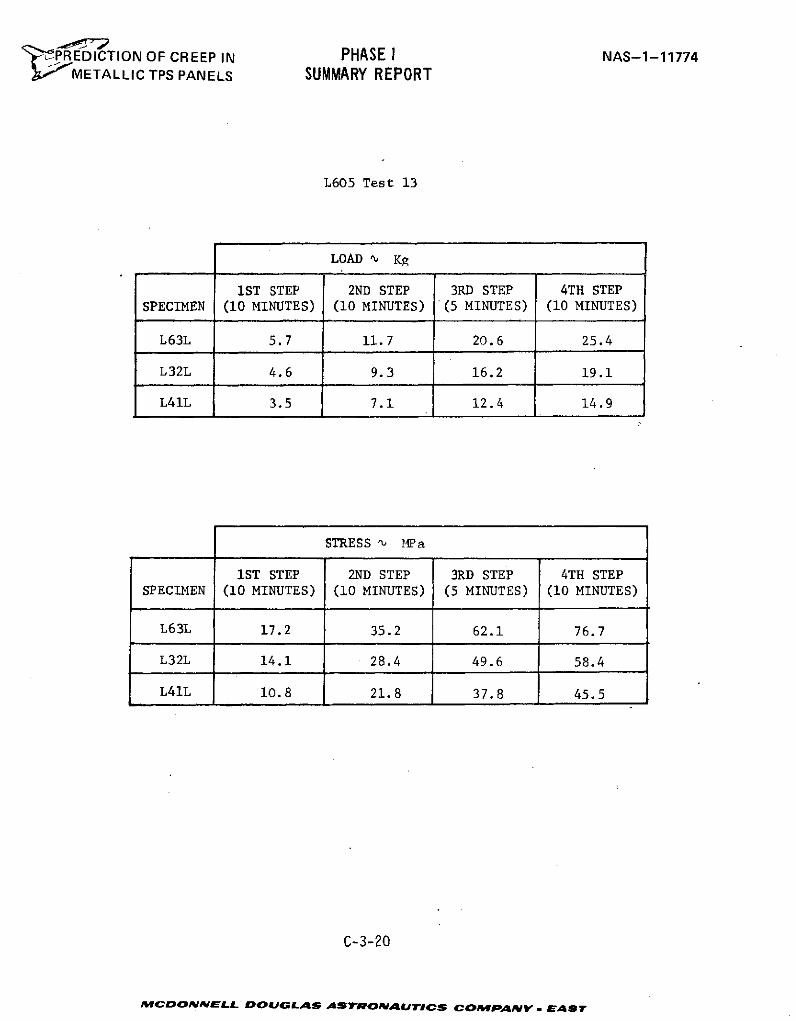
'PREDICTION OF CREEP IN PHASE I NAS-1-11774METALLIC TPS PANELS SUMMARY REPORT
L605 Test 13
LOAD N Kg
1ST STEP 2ND STEP 3RD STEP 4TH STEPSPECIMEN (10 MINUTES) (10 MINUTES) (5 MINUTES) (10 MINUTES)
L63L 5.7 11.7 20.6 25.4
L32L 4.6 9.3 16.2 19.1
L41L 3.5 7.1 12.4 14.9
STRESS ^- MPa
1ST STEP 2ND STEP 3RD STEP 4TH STEPSPECIMEN (10 MINUTES) (10 MINUTES) (5 MINUTES) (10 MINUTES)
L63L 17.2 35.2 62.1 76.7
L32L 14.1 28.4 49.6 58.4
L41L 10.8 21.8 37.8 45.5
C-3-20
MCEDONNELL DOUGLAS ASTRONALUTICS COMPANY EAST
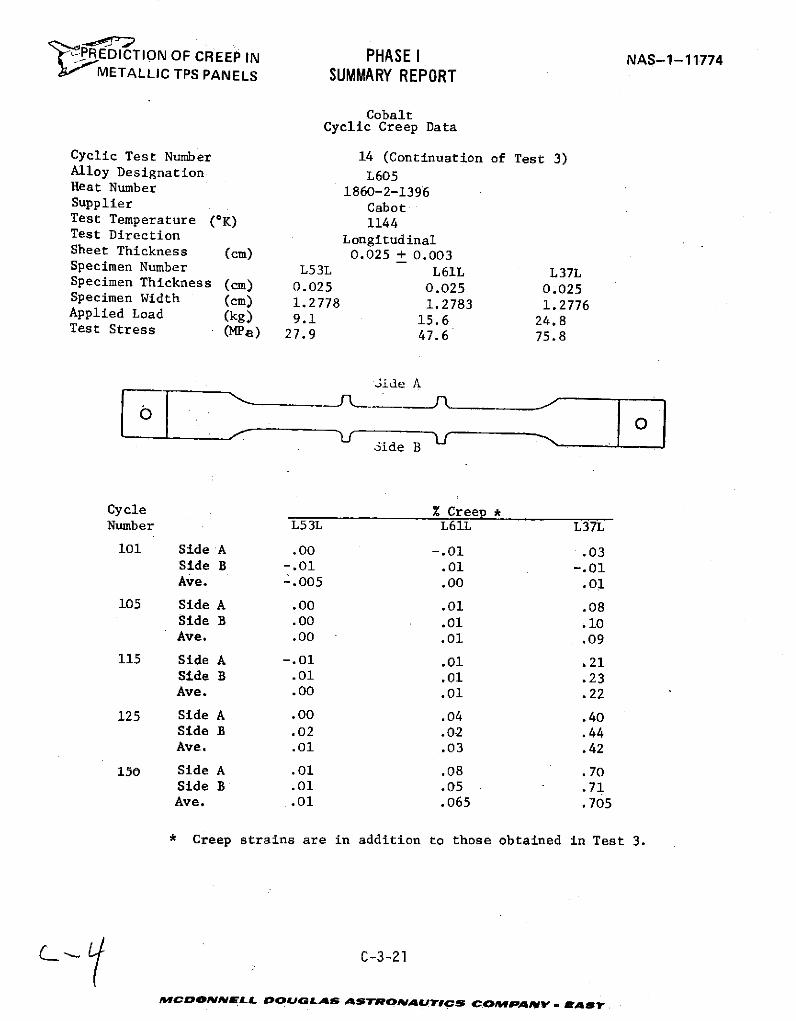
LP?5REDICTION OF CREEP IN PHASE I NAS-1-11774METALLIC TPS PANELS SUMMARY REPORT
CobaltCyclic Creep Data
Cyclic Test Number 14 (Continuation of Test 3)Alloy Designation L605Heat Number 1860-2-1396Supplier CabotTest Temperature (OK) 1144Test Direction LongitudinalSheet Thickness (cm) 0.025 + 0.003Specimen Number L53L L61L L37LSpecimen Thickness (cm) 0.025 0.025 0.025Specimen Width (cm) 1.2778 1.2783 1.2776Applied Load (kg) 9.1 15.6 24.8Test Stress (MPa) 27.9 47.6 75.8
Jide A
3ide B
Cycle % Creep *Number L53L L61L L37L
101 Side A .00 -.01 .03Side B -.01 .01 -.01Ave. -.005 .00 .01
105 Side A .00 .01 .08Side B .00 .01 i10Ave. .00 .01 .09
115 Side A -.01 .01 .21Side B .01 .01 .23Ave. .00 .01 .22
125 Side A .00 .04 .40Side B .02 .02 .44Ave. .01 .03 .42
150 Side A .01 .08 .70Side B .01 .05 .71Ave. .01 .065 .705
* Creep strains are in addition to those obtained in Test 3.
C-3-21
MCDONNELL DOUGLAS ASTRONAUTICS COMPANAY . RAST-
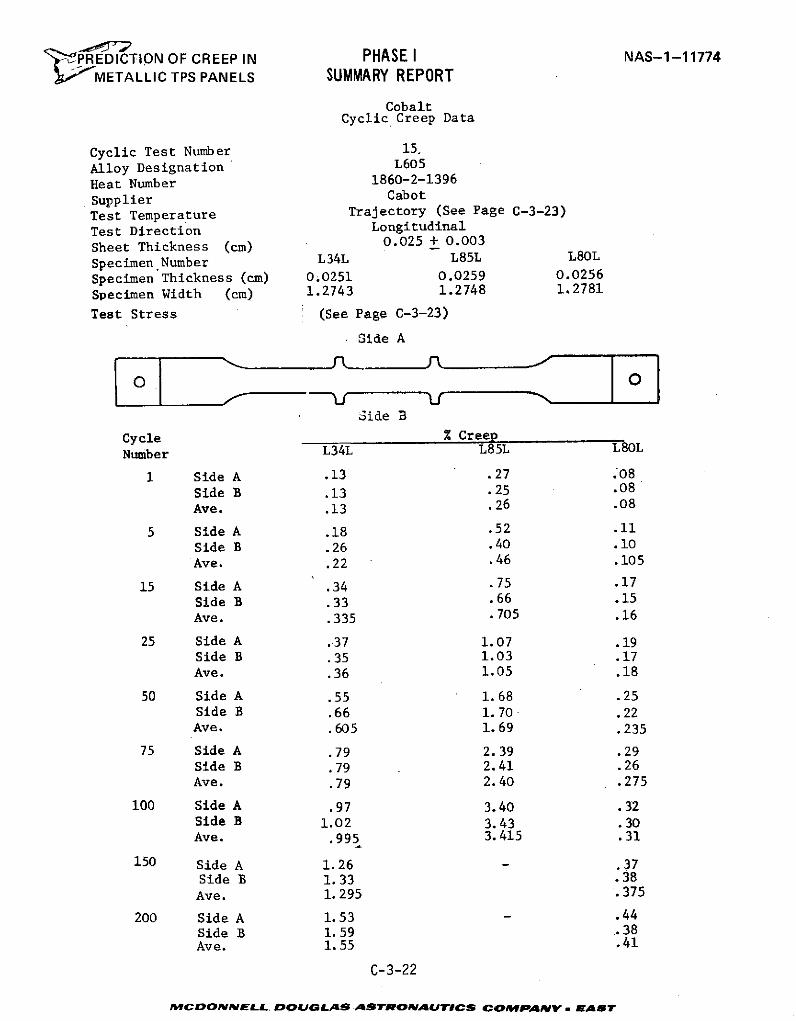
" PEDICTION OF CREEP IN PHASE I NAS-1-11774METALLIC TPS PANELS SUMMARY REPORT
CobaltCyclic Creep Data
Cyclic Test Number 15.
Alloy Designation L605
Heat Number 1860-2-1396
Supplier Cabot
Test Temperature Trajectory (See Page C-3-23)
Test Direction Longitudinal
Sheet Thickness (cm) 0.025 + 0.003
Specimen Number L34L L85L L80L
Specimen Thickness (cm) 0.0251 0.0259 0.0256
Specimen Width (cm) 1.2743 1.2748 1.2781
Test Stress (See Page C-3-23)
Side A
Side B
Cycle % CreepNumber L34L L85L L80L
1 Side A .13 .27 .08Side B .13 .25 .08Ave. .13 .26 .08
5 Side A .18 .52 .11
Side B .26 .40 .10Ave. .22 .46 .105
15 Side A .34 .75 .17
Side B .33 .66 .15
Ave. .335 .705 .16
25 Side A .37 1.07 .19Side B .35 1.03 .17Ave. .36 1.05 .18
50 Side A .55 1.68 .25Side B .66 1.70 .22Ave. .605 1.69 .235
75 Side A .79 2.39 .29Side B .79 2.41 .26Ave. .79 2.40 .275
100 Side A .97 3.40 .32Side B 1.02 3.43 .30Ave. .995 3.415 .31
150 Side A 1.26 - .37Side B 1.33 .38
Ave. 1.295 .375
200 Side A 1.53 .44
Side B 1.59 .38Ave. 1.55 .41
C-3-22
A1CONNELL DOUGL.AS ^ASTRONPAUICS COMdMANY ASTr
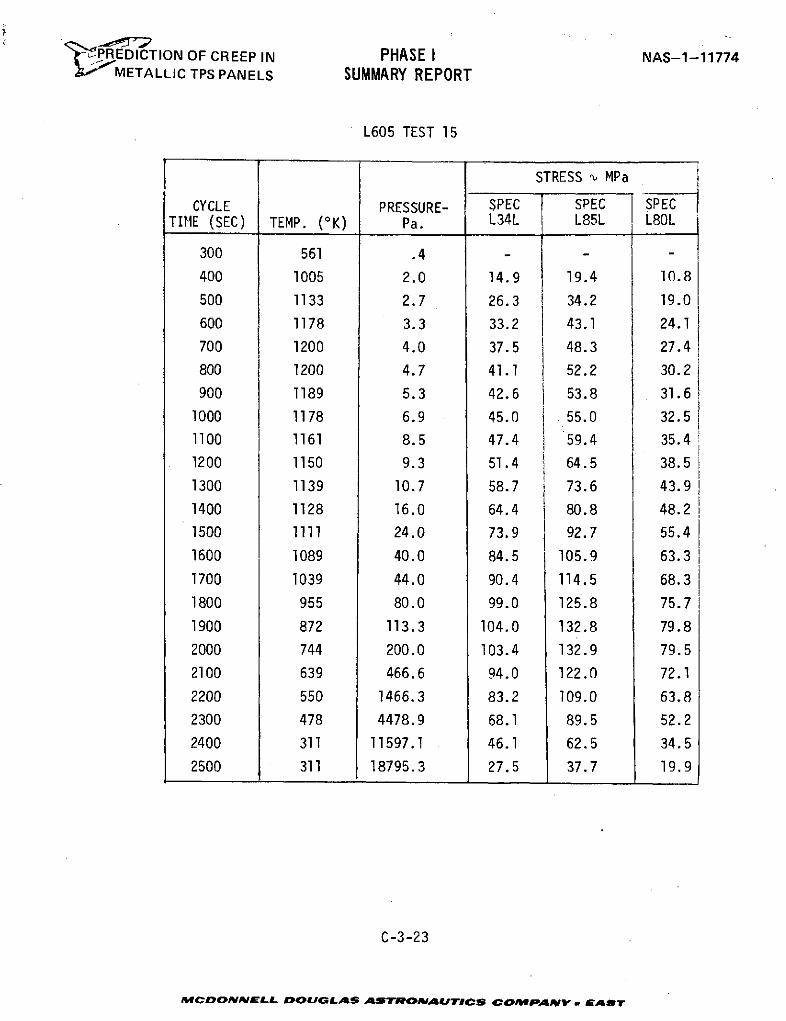
PREDICTION OF CREEP IN PHASE I NAS-1-11774METALLIC TPS PANELS SUMMARY REPORT
L605 TEST 15
STRESS ', MPa
CYCLE PRESSURE- SPEC SPEC SPECTIME (SEC) TEMP. (OK) Pa. L34L L85L L80L
300 561 .4 - - -
400 1005 2.0 14.9 19.4 10.8
500 1133 2.7 26.3 34.2 19.0
600 1178 3.3 33.2 43.1 24.1
700 1200 4.0 37.5 48.3 27.4
800 1200 4.7 41.1 52.2 30.2
900 1189 5.3 42.6 53.8 31.6
1000 1178 6.9 45.0 55.0 32.5
1100 1161 8.5 47.4 i 59.4 35.4
1200 1150 9.3 51.4 64.5 38.5
1300 1139 10.7 58.7 73.6 43.9
1400 1128 16.0 64.4 80.8 48.2
1500 1111 24.0 73.9 92.7 55.4
1600 1089 40.0 84.5 105.9 63.3
1700 1039 44.0 90.4 114.5 68.3
1800 955 80.0 99.0 125.8 75.7
1900 872 113.3 104.0 132.8 79.8
2000 744 200.0 103.4 132.9 79.5
2100 639 466.6 94.0 122.0 72.1
2200 550 1466.3 83.2 109.0 63.8
2300 478 4478.9 68.1 89.5 52.2
2400 311 11597.1 46.1 62.5 34.5
2500 311 18795.3 27.5 37.7 19.9
C-3-23
MCDONNELL DOUGLAS ASTRONAUTICS COMPANY. EAST

PRED ICTION OF CREEP IN PHASE I NAS-1-11774METALLIC TPS PANELS SUMMARY REPORT
APPENDIX D-1
Ti-6Al-4V LITERATURE SURVEY RAW CREEP DATA
This section contains the raw creep data developed on sheet produced by twosuppliers TIMET (data on pages D-1-2 to D-i-7) and Reactive Metals (data on pagesD-1-8 to D-1-12).
D-1-1C
McDONNELLt OUGL.As ATROAUIse compan . Ewar
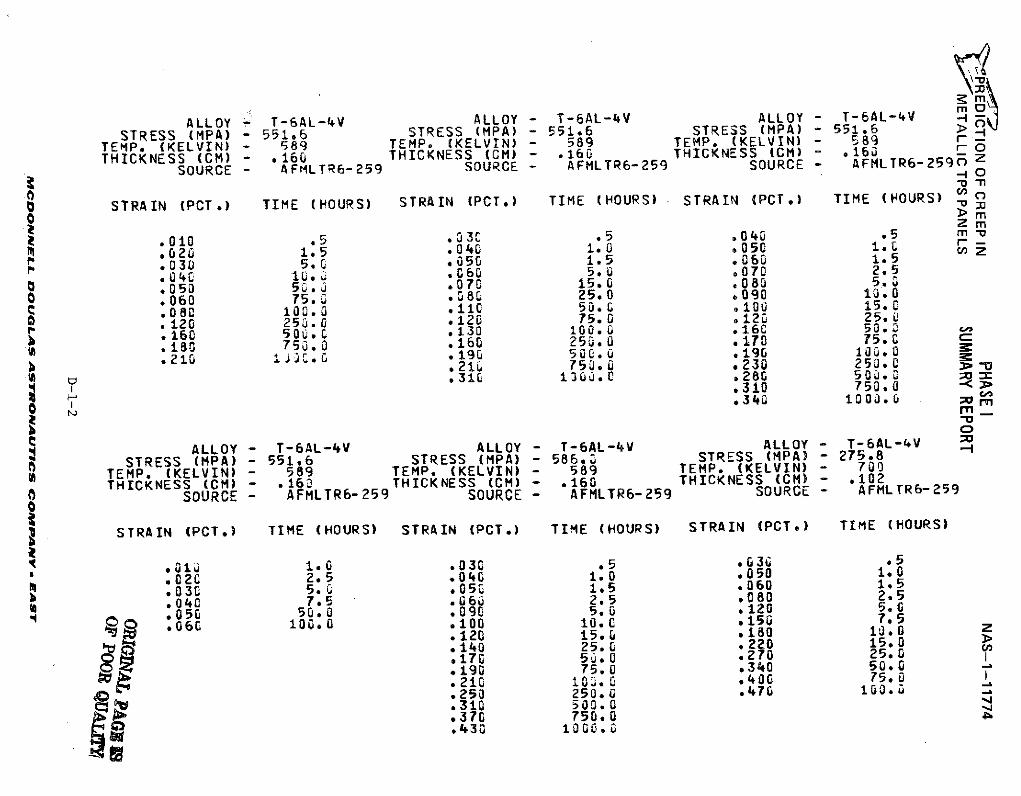
ALLOY T-6AL-4V ALLOY - T-6AL-4V ALLOY T-6AL-4VSTRESS (MPA) - 551.6 STRESS (MPA) - 551.6 STRESS (MPA) - 551.6 >
TEMP. (KELVIN) - 589 TEMP. (KELVIN) - 589 TEMP. (KELVIN) - 589 r-THICKNESS (CM) - 160 THICKNESS (CM) - .160 THICKNESS (CM) - .160 r-O
SOURCE - AFMLTR6-259 SOURCE - AFMLTR6-259 SOURCE - AFMLTR6-259 -0
STRAIN (PCT.) TIME (HOURS) STRAIN (PCT) TIME (HOURS) STRAIN (PCT.) TIME (HOURS) v 0> mZm
*010 .5 030 .5 .040 5 m -
l .020 1.5 .040 1.0 .050 1.0 -.030 5.0 .050 1.5 .060 1.5.:44 1.S .060 5.0 .070 2.5.050 5. 0 .070 15.0 .080 5.0S.060 75. *080 25.0 .090 10.0.080 100.0 .110 50.0 .100 15.0• 120 250.0 .120 75.0 .120 25.o160 50. 0 .130 100.0 .160 50.Z.16 75 .0 .160 250.0 .170 75..210 30 . .190 500.0 .190 100.0b .21G 750. .230 250.0
.310 1303.0 .280 50o. i.310 750.0.340 1003.0 m
-o
ALLOY - T-6AL-4V ALLOY - T-6AL-4V ALLOY - T-6AL-4V
STRESS (MPA) - 551.6 STRESS (MPA) - 586. STRESS (MPA) - 275.8
TEMP. (KELVIN) - 589 TEMP. (KELVIN) - 589 TEMP. (KELVIN) - 700THICKNESS (CM) - .160 THICKNESS (CM) - .160 THICKNESS (CM) - .102
SOURCE - AFMLTR6-259 SOURCE - AFMLTR6-259 SOURCE - AFMLTR6-259
STRAIN (PCTI) TIME (HOURS) STRAIN (PCT.) TIME (HOURS) STRAIN (PCT.) TIME (HOURS)
.Olu 1.0 .030 .5 .03C .5
.02G 2.5 .040 1.0 .050 1.0
.03C 5.0 .05 1.5 .060 1.50.40 7.5 .060 2.5 .080 2.5
.050 50.0 .090 5.0 .120 5.G06G 1o 100 10.0 . 50 7.5
.2 15.0 .180 10.0 z.140 25.0 .220 15.0.170 50.0 .270 25.0.190 75.0 .340 50.0 -.210 1.. 0 .400 75.0.250 250. 470 100.0.310 500.0.370 750.0.430 1000.0
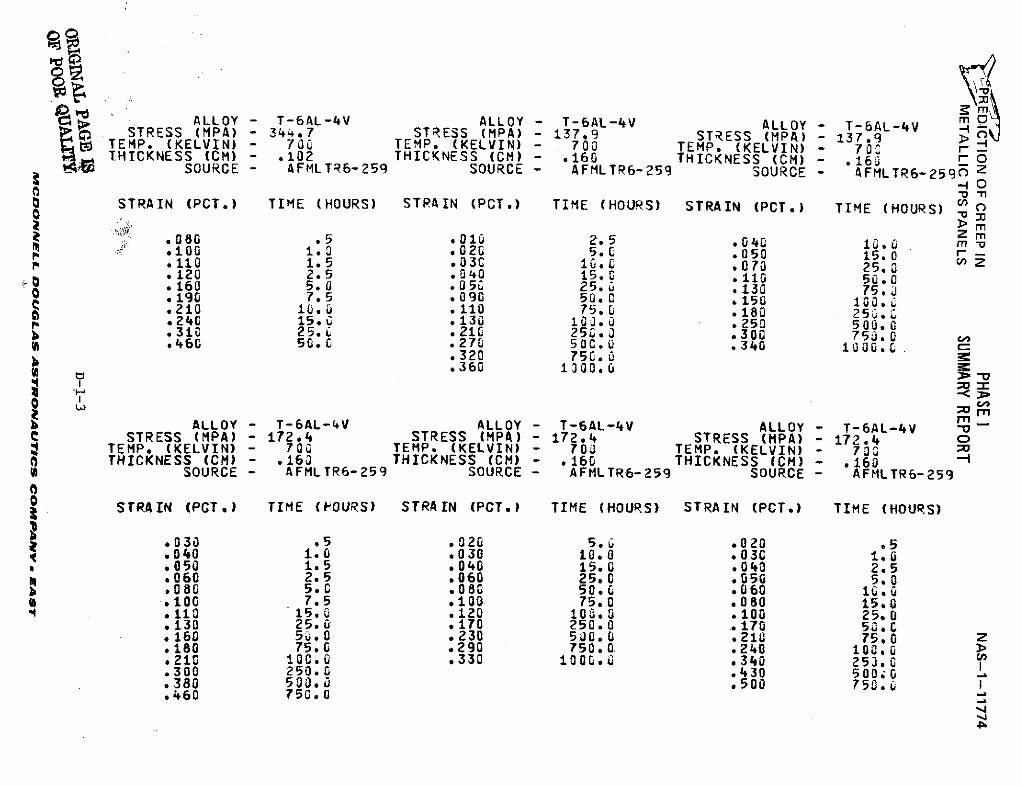
ALLOY - T-6AL-4V ALLOY - T-6AL-4V ALLOY - T-6AL-4V mSTRESS (MPA) - 344.7 STRESS (MPA) - 137.9 STRESS (MPA) - 137.9TEMP. (KELVIN) - 700 TEMP. (KELVIN) - 700 TEMP. (KELVIN) - 70 rTHICKNESS (CM) - .102 THICKNESS (CM) - .160 THICKNESS (CM) - .160 r 0
SOURCE - AFMLTR6-259 SOURCE - AFMLTR6-259 SOURCE - AFMLTR6-2590 Z-10
C -o-nSTRAIN (PCT.) TIME (HOURS) STRAIN (PCT.) TIME (HOURS) STRAIN (PCT*) TIME (HOURS) 0
0> m.080 .5 .010 2.5 .040 zI. m.100 1.0 .020 5.0 .050 15.0 r-.110 1.5 .03C 10.0 .070 25.0 Z.120 2.5 .040 15. G .110 50.0* 160 5. 0 .05C 25. 0 .130 75 ,O .190 7.5 .090 50.0 .150 100..210 .. 110 75 .180 25..24C 15. .130 103.0 .250 500.0.310 25.C .210 250.0 .300 750.0c.460 50. 0 .270 500. .340 10 00.
.320 750.3
.360 1300.0mm
ALLOY - T-6AL-4V ALLOY - T-6AL-4V ALLOY - T-6AL-4VSTRESS (MPA) - 172.4 STRESS (MPA) - 172.4 STRESS (MPA) - 172.4 C
TEMP. (KELVIN) - 700 TEMP. (KELVIN) - 700 TEMP. (KELVIN) - 703THICKNESS (CM) - .160 THICKNESS (CM) - .160 THICKNESS (CM) - .160
SOURCE - AFMLTR6-259 SOURCE - AFMLTR6-259 SOURCE - AFMLTR6-259
STRAIN (PCT.I TIME (HOURS) STRAIN (PCT.) TIME (HOURS) STRAIN (PCT.) TIME (HOURS)
.030 .5 .020 5.6 .020 .5
.040 1.0 .030 10.0 .03c 1.0, .050 1.5 .040 15.0 .040 2.5
.060 2.5 .060 25.0 .050 5.0S.080 5.0 .080 50. .060 10,
S .100 7.5 .100 75.0 .080 15,0.110 15.0 .120 103.0 .100 25.0.130 25.0 .170 250.0 .170 50.0.160 50.0 .230 500.0 .210 75.0 z.180 75.0 .290 750.0 .240 100.0 >.210 100.0 .330 10G0.0 .340 253.0.300 250.0 .430 500 0 I.380 500.0 .500 750 ..460 750.0
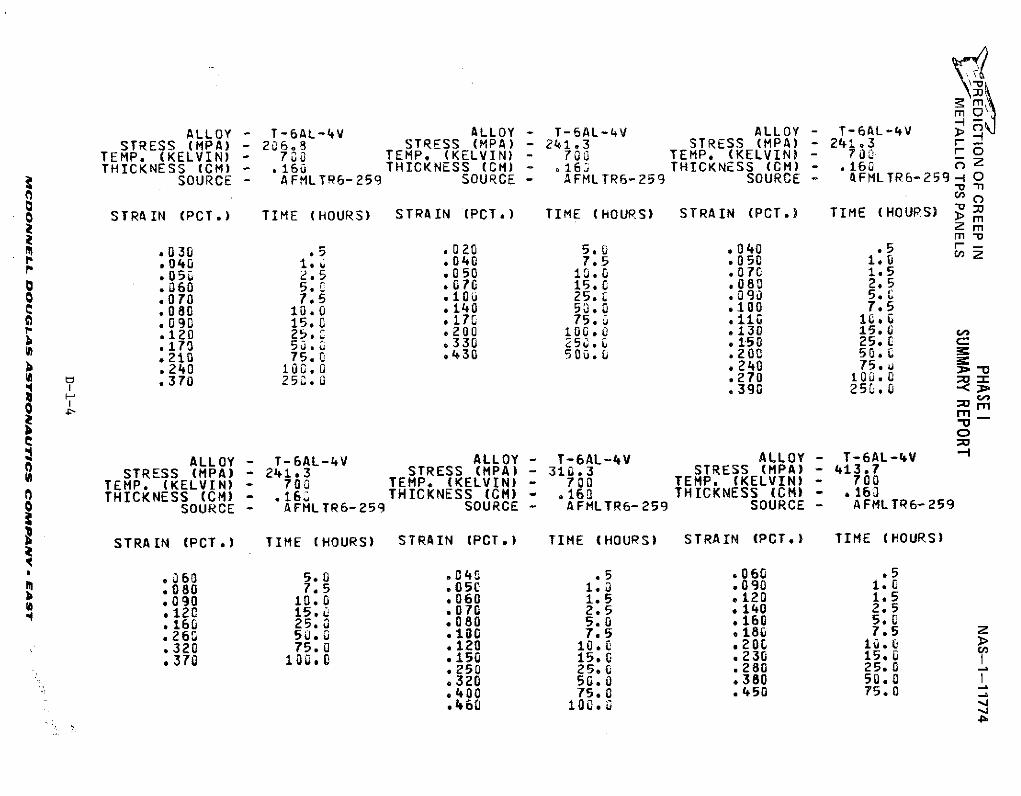
ALLOY - T-6AL-4V ALLOY - T-6AL-4V ALLOY - T-6AL-4V .STRESS (MPA) -2068 STRESS (MPA) - 241.3 STRESS (MPA) - 241.3 r
TEMP. (KELVIN) - 720 TEMP, (KELVIN) - 70 TEMP. (KELVIN) - 700 0
THICKNESS (CM) - .160 THICKNESS (CM) - .16j THICKNESS (CM) - .160 2SOURCE - AFMLTR6-259 SOURCE - AFMLTR6-259 SOURCE - AFMLTR6-259- 0
STRAIN (PCT.) TIME (HOURS) STRAIN (PCT.) TIME (HOURS) STRAIN (PCT.) TIME (HOURS) > m2 m
.030 .5 .020 5.0 .040 .5 r-
.040 1.C .040 7.5 .050 1.0
.05. 2.5 .050 1.o .070 1.5
.060 5. .070 15.0 .080 2.5
.070 7.5 100 25. .090 5.0
.080 10.0 .140 50.0 .100 7.50 .090 15.0 .170 75.0 .110 10.0
.120 25.0 .200 I00.0 .130 15.0
.170 50.l .330 250.0 .150 25.0 c
.210 75.0 .430 500.0 .200 50.0
.240 100.0 .240 75. uS.370 250.0 .270 100.0
.390 250.0
- u
ALLOY - T-6AL-4V ALLOY - T-6AL-4V ALLOY - T-6AL-4VSTRESS (MPA) - 241.3 STRESS (MPA) - 310.3 STRESS (MPA) - 413.7
TEMP. (KELVIN) - 700 TEMP. (KELVIN) - 700 TEMP. (KELVIN) - 700O THICKNESS (CM) - .16i THICKNESS (CM) - .160 THICKNESS (CM) - .16.O SOURCE - AFMLTR6-259 SOURCE - AFMLTR6-259 SOURCE - AFMLTR6-259
STRAIN (PCT.) TIME (HOURS) STRAIN (PCT.) TIME (HOURS) STRAIN (PCT.) TIME (HOURS)
.060 5.0 .04 i 5 .060 .5
.080 7.5 .05C 1.0 .090 1.0I .090 10.0 .060 1.5 .120 1.5
.120 15.Z . 07 2.5 *140 2.5
.160 25.0 .080 5.0 .160 5.0
.260 50.0 .100 7.5 .180 7.5 z
.320 75.0 .120 10.0 .200 10.0
.370 100.0 9150 15.0 .230 159. 1.250 25.0 .280 25.0.320 50.0 .380 50.0 _
.400 75.0 .450 75.0
.460 10.
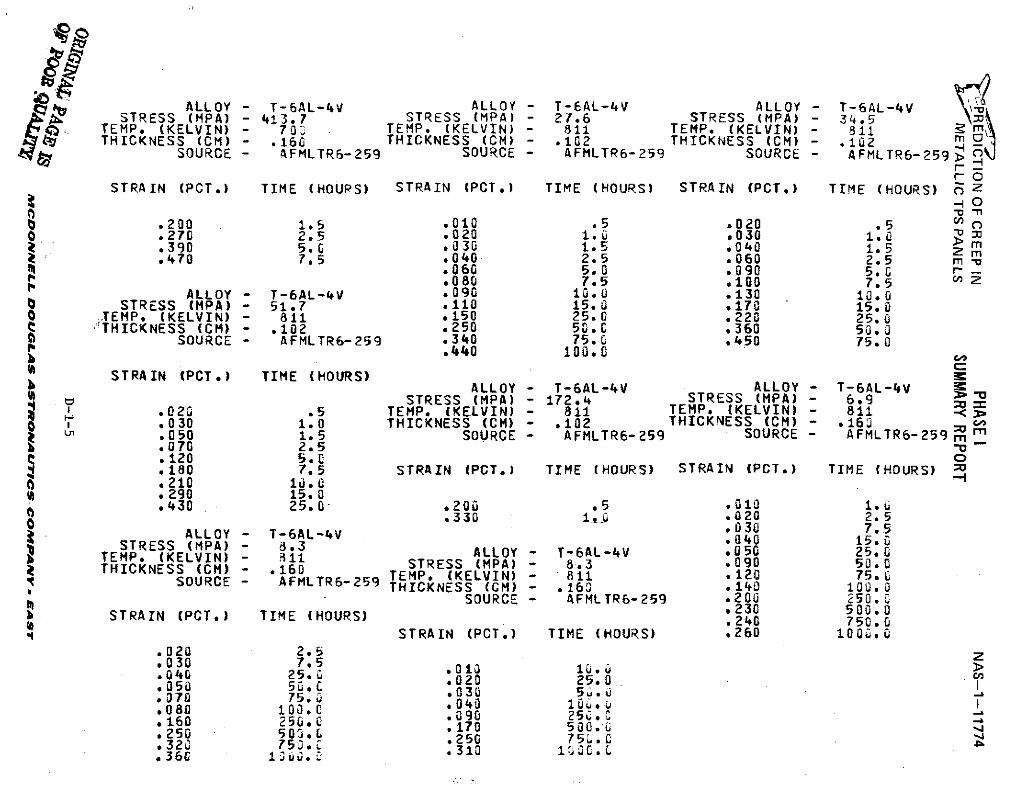
ALLOY - T-6AL-V ALLOY - T-6AL-4V ALLOY - T-6AL-4VSTRESS (MPA) - 413.7 STRESS (MPA) - 27.6 STRESS (MPA) - 34.5
TEMP (KELVIN) TEMP. (KELVIN) - 811 TEMP. (KELVIN) - 311THICKNESS (CM) - .160 THICKNESS (CM) - .102 THICKNESS (CM) - .102 m
SOURCE - AFMLTR6-259 SOURCE - AFMLTR6-259 SOURCE - AFMLTR6-259 >c
STRAIN (PCT.) TIME (HOUPS) STRAIN (PCT.) TIME (HOURS) STRAIN (PCT.) TIME (HOURS) z zt -- n
.200 1.5 .010 .5 .020 .5m
.270 2.5 .020 1.0 .030 1.0
.390 5. 0 030 1.5 .040 1.5 2 m
.470 7,5 .040 2.5 .060 2.5 m -.060 5.0 .090 5.G r-.080 7.5 .100 7.5 cn Z
ALLOY - T-bAL-4V .090 1050 .130 10.0STRESS (MPA) - 51.7 .110 15.0 .170 15.0
TEMP. (KELVIN) - 811 .150 25.0 .220 25.03 THICKNESS (CM) - .102 .250 50.0 .360 50,0
SOURCE - AFMLTR6-259 *340 75.0 .450 75.0.440 100.0
STRAIN (PCT.) TIME (HOURS)ALLOY - T-6AL-4V ALLOY - T-6AL-4V
STRESS (MPA) - 172.4 STRESS (MPA) - 6.9.020 .5 TEMP. (KELVIN) - 811 TEMP. (KELVIN) - 811.030 1.0 THICKNESS (CM) .102 THICKNESS (CM) .163n .050 1.5 SOURCE - AFMLTR6-259 SOURCE - AFMLTR6-259 m.070 2.5.120 5.0 C.180 7.5 STRAIN (PCT.) TIME (HOURS) STRAIN (PCT.) TIME (HOURS).210 10.0.290 15.0.430 25.0 .200 .5 .010 1.5
.330 1., .020 2.5ALLOY - T-6AL-4V .030 7.5
STRESS (MPA) 8.3 ALLOY - T-6AL-4V .050 25.0TEMP. (KELVIN) - 1160 STRESS (MPA) - 8.3 .090 50.0THICKNESS (CM) - .160 TEMP. (KELVIN) - 811 .120 75.0
SOURCE - AFMLTR6-259 THICKNESS (CM) - .60 .140 100.0SOURCE - AFMLTR6-259 .200 250.
.230 500.0SSTRAIN (PCT.) TIME (HOURS) .240 750.0STRAIN (PCT.) TIME (HOURS) .260 iOO0.
.020 2.5 z
.030 7.5.040 25.5 02 25.050 50.c .03 5.0.070 75. 03 , .0040 luwo u
080 100, .090 25i..160 250.C .170 500o.L. 50 503,L .250 75 .0.320 75 ...360 1060 .310
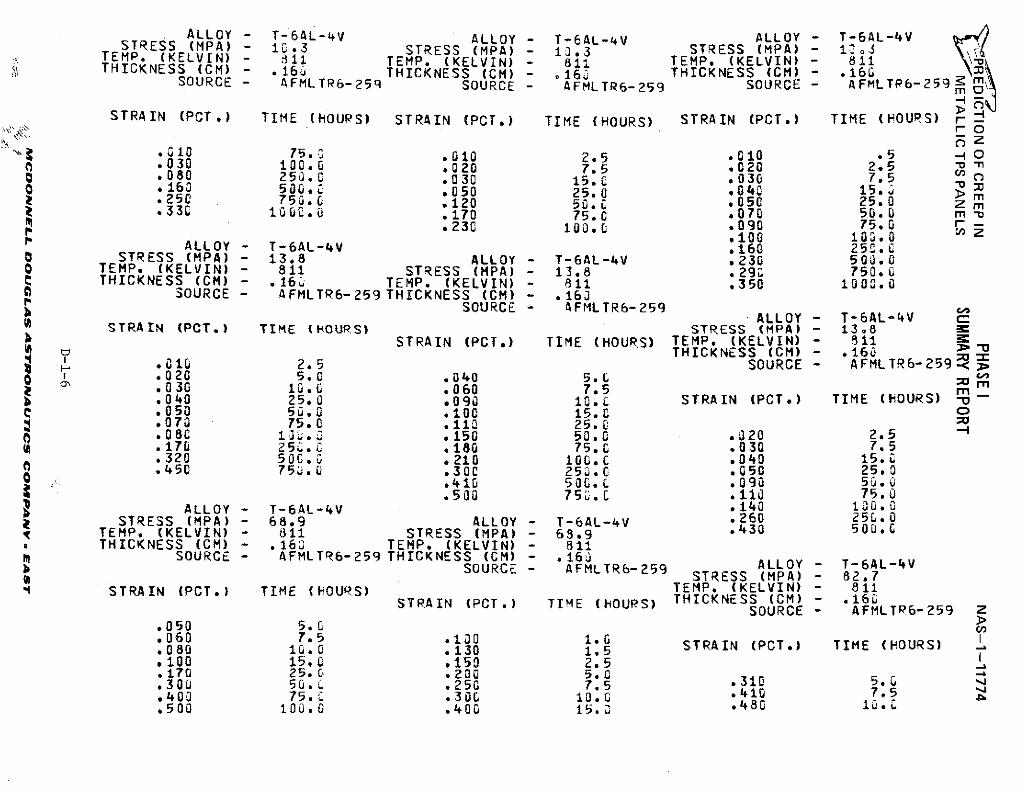
ALLOY - T-6AL-4V ALLOY - T-6AL-4VSTRESS (MPA) - 10.3 STRESS (MPA) - 13.3 STRESS (MPA) - 1:2J
TEMP. (KELVIN)- 11 TEMP (KELVIN) - 811 TEMP. (KELVIN) - 811mTHICKNETHICKNESS (CM THICKNESS (C - .16 THICKNESS (CM) - .160
SOURCE - AFMLTR6-259 SOURCE - AFMLTR6-259 SOURCE - AFMLTP6-259 m
STRAIN (PCT.) TIME (HOURS) STRAIN (PCT.) TIME (HOURS) STRAIN (PCT.) TIME (HOURS) r-
. . 010 75. 010 2.5 .010 .5 00 030 100.0 .020 7.5 .020 2.5 "
S080 250.0 .030 15.L .030 7.5 m0 .163 500.0 .050 25.0 .040 15.0 m250 75G.0 .120 50. .050 25.0 m.330 1o00.o .170 75.0 .070 50.0 m-
.230 100.0 .090 75.0 r-,S100 10.O
ALLOY - T-6AL-4V .160 250.00 STRESS (MPA) - 13.8 ALLOY - T-6AL-4V .230 500.0o TEMP. (KELVIN) - 811 STRESS (MPA) - 13.8 .290 750.6
THICKNESS (CM) - .16' TEMP. (KELVIN) - 811 .350 1000.0)0 SOURCE - AFMLTR6-259 THICKNESS (CM) - .160
SOURCE - AFMLTR6-259 -TS ALLOY - T-6AL-4V c
STRAIN (PCT.) TIME (HOURS) STRESS (MPA) - 138b STRAIN (PCT.) TIME (HOURS) TEMP. (KELVIN) - 811I THICKNESS (CM) - .160
.0*10 2.5 SOURCE - AFMLTR6-259 -
. 020 5.0 .040 5.0 nS .030 10.0 .060 7.5 r
.040 25.0 .090 10.L STRAIN (PCT.) TIME (HOURS) -0uC .050 53.0 .100 15.0
.070 75.0 .110 25.0'
.080 1c..0 .150 50.0 .020 2.5
.170 25C0. .180 75.0 .030 7.5
.320 50C. .210 100.0 .040 15.0.45C 75.0 .300 250.0 .050 25.0
.410 50G0. .090 50.u
.500 750.C .110 75.0ALLOY - T-6AL-4V .140 100.0
STRESS (MPA) - 68.9 ALLOY - T-6AL-4V .260 250.0t TEMP. (KELVIN) - 811 STRESS (MPA) - 63.9 .430 500., THICKNESS (CM) - .163 TEMP. (KELVIN) - 811
SOURCE - AFMLTR6-259 THICKNESS (CM) - .16 ALLOY - T-AL-Vb SOURCE - AFMLTR6-259 ALLOY - T-6AL-4V
SOURCE - A R STRESS (MPA) - 82.7SSTRAIN (PCT.) TIME (HOURS) TEMP. (KELVIN) - 811
STRAIN (PCT.) TIME (HOURS) THICKNESS (CM) - .160SOURCE - AFMLTR6-259 z
.050 5.0 n
.060 7.5 .100 1.0.080 1G.0 .130 1,5 STRAIN (PCT.) TIME (HOURS).100 15.0 .150 2.5.170 25. .200 5.0.300 50.L .250 7.5 .310 5,-.400 75. c .300 10.0 .410 7,5.500 100.0 .400 15. .480 10.
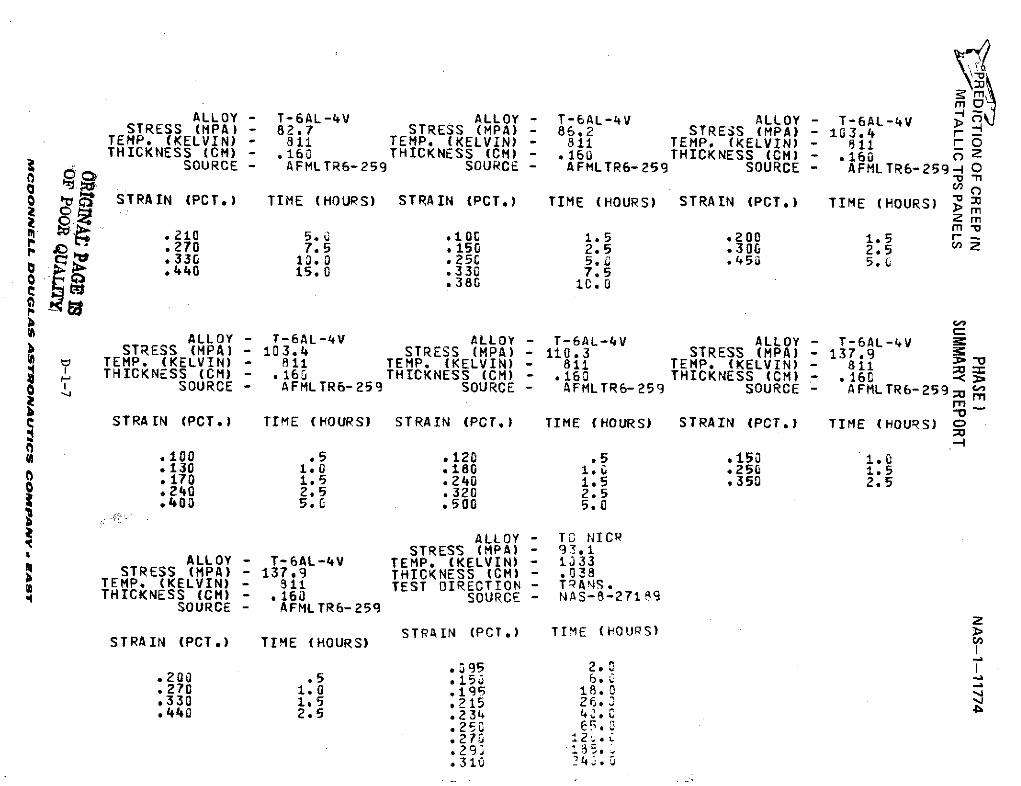
ALLOY - T-6AL-4V ALLOY - T-6AL-4V ALLOY - T-6AL-4V 1STRESS (MPA) - 82.7 STRESS (MPA) - 86,2 STRESS (MPA) - 103.4 r-
TEMP. (KELVIN) - 811 TEMP. (KELVIN) - 811 TEMP. (KELVIN) - 811 roTHICKNESS (CM) - .160 THICKNESS (CM) - .160 THICKNESS (CM) - .160 0 Z
SOURCE - AFMLTR6-259 SOURCE - AFMLTR6-259 SOURCE - AFMLTR6-259-i O
qj STRAIN (PCT.) TIME (HOURS) STRAIN (PCT.) TIME (HOURS) STRAIN (PCT.) TIME (HOURS) > mZm
.210 5.0 .100 1.5 .200 1.5 r-
.270 7.5 .150 2.5 .300 2.5 a
.330 10.0 .25C 5.0; .450 5.0
.440 15.0 .330 7.5.380 10.0
ALLOY - T-6AL-4V ALLOY - T-6AL-4V ALLOY - T-6AL-4V RSTRESS (MPA) - 103.4 STRESS (MPA) - i10.3 STRESS (MPA) - 137.9
(A TEMP. (KELVIN) - 811 TEMP. (KELVIN) - 811 TEMP. (KELVIN) - 11THICKNESS (CM) - .160 THICKNESS (CM) - .160 THICKNESS (CM) - .160
SOURCE - AFMLTR6-259 SOURCE - AFMLTR6-259 SOURCE - AFMLTR6-259 c-m _
STRAIN (PCT.) TIME (HOURS) STRAIN (PCT.) TIME (HOURS) STRAIN (PCT,) TIME (HOURS) c
0 -I.100 .5 .120 .5 .150 1.0.130 1.0 .180 1.0 .250 1.5.170 1.5 .240 1.5 .350 2.5
O .240 2.5 .320 2.5.400 5.0 .500 5.0
ALLOY - TO NICRSTRESS (MPA) - 9.1
STRESS ALLOY - T-6AL-4V TEMP. (KELVIN) - 1333STRESS (MPA) - 137.9 THICKNESS (CM) - .038
TEMP. (KELVIN) - 311 TEST DIRECTION - TPANS.THICKNESS (CM) - .160 SOURCE - NAS-8-27189
SOURCE - AFMLTR6-259z
STRAIN (PCT.) TIME (POURS) >STRAIN (PCT.) TIME (HOURS) STRIN (PCT) TIE ( S
, 95 2.04200 .5 .150 6.-.270 1.0 .195 18. 4.330 1.5 .15 26.440 2.5 .234 40*
.25 e5. 0
.270 12 .
.293 4" , o
.31u 14;
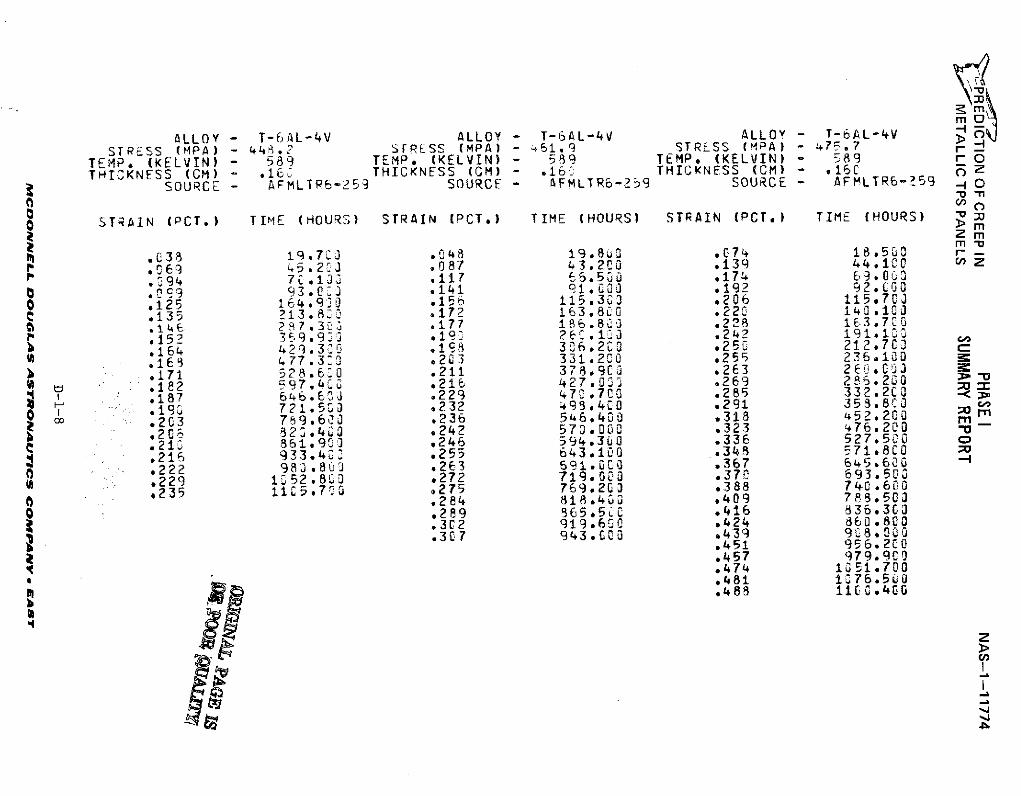
ALLOY - T-6AL-4V ALLOY - T-6AL-4V ALLOY - T-6AL-4V > .
STRESS (MPA) - 44 .2 STRESS (MPA) - '51.9 STRESS (MPA) - 475.7 -
TEMP. (KELVIN) - 589 TEMP. (KELVIN) - 589 TEMP. (KELVIN) - 589 rOTHICKNESS (CM) - .16" THICKNESS (CM) - .16* THICKNESS (CM) - .160 z
SOURCE AFMLT-2 SUC - AFMLTR6-59 SOURCE - AFMLTR6-259 0
o STRAIN (PCT.) TIME (HOURS) STRAIN (PCT.) TIME (HOURS) STRAIN (PCT.) TIME (HOURS)
m
.038 19.7C3 .048 19.800 .C74 18.5300 -
.069 45.203 .087 43.200 .139 44.100 c Z
.94 7C.13 .117 66.530 .174 69.003• 09 93.0.3 .141 91.000 .192 92.(GO
O .125 164.9 0 .156 115.303 .206 115.7%JS .135 ?13.820 .172 163.800 .220 140.100
14 27.3ci .177 186.803 .228 163.70GP .15' 3E59.93 . 190 26 E.1 .242 191.10
b 164 429.30 18 306.200 .250 212.703A.165 77.3 ,.203 331.200 .255 236.100
b .171 528.600 .211 378.9C .263 2E.C03t .182 597.400 .216 427.0%3 .269 286.200
.187 646.630 .229 470.700 .285 332.200 -3o *19~ 721.5% .232 493.400 .291 35.80
.203 79.6 0 .236 546.400 .318 452.200 __
.20 225.40 .242 570.000 .323 476.200 -0
.21: 861.90 .246 594.350 .336 527.500 O
.21i 933.402 .255 643.100 .343 571.800
.222 983.800 .263 691.0,0 .367 645.6002 .29 1252.8C0 .272 719,080 .370 693.503,235 11C5.70 .275 769.20) .388 740.600
.284 818. 4 0 0 ,409 788.500
.289 E65.5c0 .416 836.3G3
.3C2 919.64 .424 860.800
.307 943. C0 .439 908.000.451 956.200.457 979.900.474 1051.700.481 1076.5L0*488 1100.400
iC,2
U >
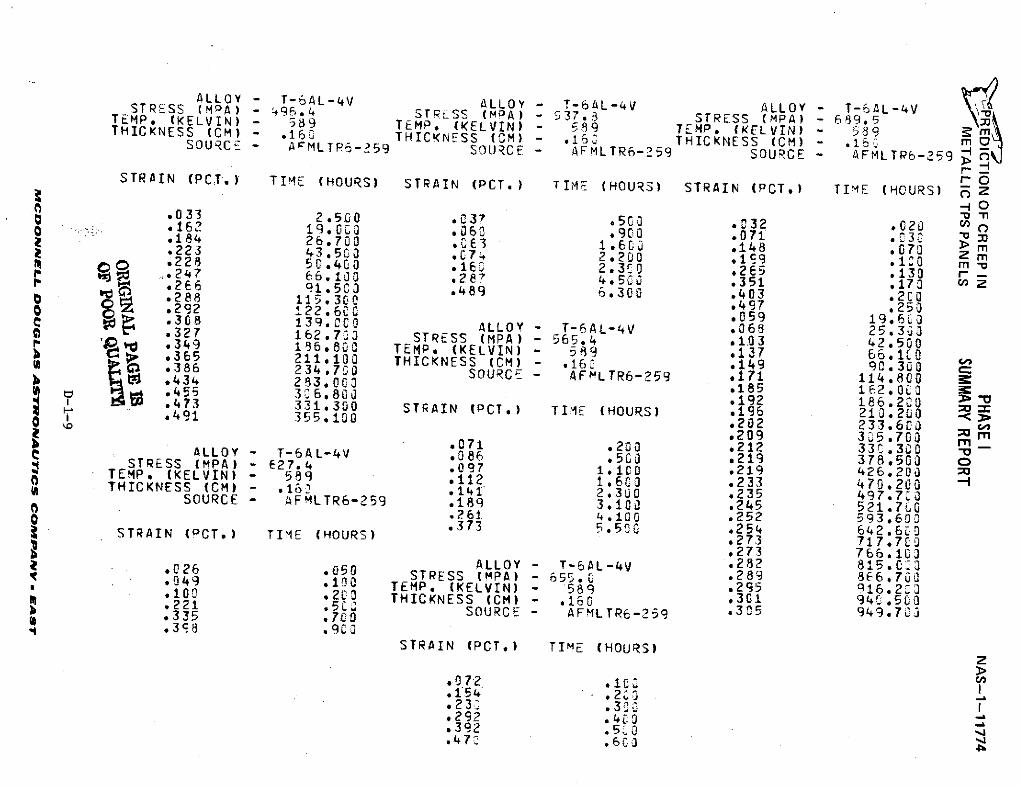
ALLOY - T-6AL-4V ALLOY - T-6AL-4V ALLOY - T-6AL-4VSTRSS (MA) - 96.4 STRESS (MA) - 537. 8 STRESS (MPA) - 689,5TEMP. (KELVIN) - 59 TEMP. (KELVIN) - 589 TEMP. (KELVIN) -THICKNESS (CM) - .16HICKNESS 16 THICKNESS (CM) - .16 0SOURCE AFMLTP6-59 SOURCE - AFMLTR6--59 SOURCE - AFMLTRP6-259
STRAIN (PCTi) TIME (HOURS) STRAIN (PCT.) TIM7 (HOURS) STRAIN (PCT.) TIME (HOURS) 0 ZrO
8.033 2.5O ..033 .4CO .32 .020S 16?292 122 .009co .071 .250.1836 26.700 THICKNESS 1(C . .148 G.703S 223 43. 0 SOURC- AFLTR6-O .171 1148mS.228 5C.40 .16 2.3 .265 .130 r-S v .247 66.100 .287 4PCT) TI 5. .351 .170 n Z.2E6 91.503 .489 6.300 .03 5.200.288 115 9360 .497 *250
7 292 122.600 .059 19"6L-139.0C0 ALLOY - T-6AL-4V o063 25.300S327 12.7ST3 STESS (MPA) - 565427. 037 42.500S.349 TEMP16*80 TEMP. (KELVIN) - 589 .137 426.200THICKN.35 211.10 THICKNESS (CM) - .116 149 90.30SOURCE386 234,7-FMLTR0 SOU-259 18 3100 171 114.800.4=5 32'6w800 .192 186.200
3261 4,100 .252 593600
STRAI 33300 STRAIN (PCCT) TITI (HOURS) .196 21.2.00.491 355.10 .202 233766,03.209 35,700 _b .071 .200 .212 332.300 -0ALLOY - -AL-4V 0T-6L6 .5V 219 37815.00 oSTRESS 00 STRESS (MPA) - 557 .10 289 426000 TEMP (KELVIN) -58 .2 .6C .233 470.200STHICKNESS THICKNESS (CM) - 2.316 0 235 497.700SOURCE - AFMLTR6-259 .189 3.1 .24305 521.7,
38 .261 4100 .252 593.63
STRAIN (PCTCT TIME (HOURS) 273 717,7[69.0273 766.ALLOY - T-6AL-4V 282 815.c220026 .050 STRESS (MPA) - 655. .289 3E5,70.049 .100 TEMP. (KELVIN) - 59 .295 916.27J
.102 .23 15HICKNESS (CM) 160 301 94050221 .292 SORCE - AFMTR-9 .35 949 .7.4335 .32 .5
.398 .903STRAIN (POT.) TIME (HOURS)
.154 .2L"
.23: .30
.29? .4o_
.47" .23-
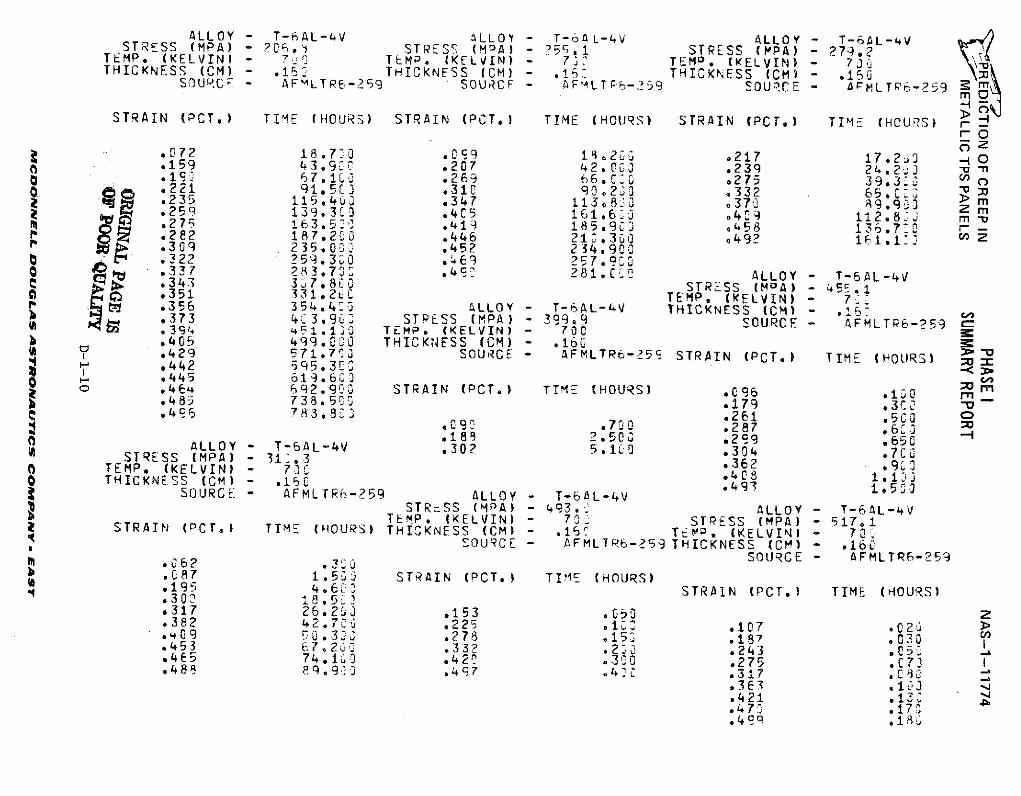
ALLOY - T-6AL-4V ALLOY - T-6AL-4V ALLOY - T-6AL-4VSTRESS (MPA) 20 .3 STRESS (MoA) - ?5.1 STRESS (MPA) - 279.2TEMP. (KELVIN) - 7 TEMP. (KELVIN) - 7 TEMP. (KELVIN) 7 -THICKNESS (CM) - .15 THICKNESS (CM) - .1 THICKNESS (CM) - .150SOUPRC - AFMLTRE-259 SOURCF - AFILT P - 5 9 SOURCE - APMLTP6-259 m
STRAIN (PCT.) TIME (HOURS) STRAIN (PCT.) TIME (HOURS) STRAIN (PCT.) TIME (HOURS)
*72 18.7 0 .0•9 13.23 .217 17.2, -0" .159 43.920 .207 42.000 .239 24.23 m190 67.1i0 .269 66,°C~ .275 39.3",, .221 91.503 .310 90 ,20 332 65.0C:: rS.235 115.4U2 .347 1138 0 .370 899 mf .259 139.300 .405 161,6 j o4C. 112.865 m
M .2*275 163.5.1 .41 185.9c3 0458 13.7^n r -.282 187.2200 .446 21 30 o492 161.1 ZP .309 235.0 3 .452 234.9 '
S .322 259.3.0 .e69 257.900 337 283.770 .490 281.Ci0 ALLOY - T-6AL-4Vv *34- 37. 8f0 STRESS (MoA) - 45.1* 351 331.2 C TEMP, (KELVIN) - 7 -P .356 354.4'5 ALLOY - T-6AL-4V THICKNESS (CM) - ,5.373 4C3.9cL STRESS (MPA) - 399.9 S.OURCE AFMLTP6-259 Cm .394 +51.13. TEMP. (KELVIN) - 700S.405 499.00 THICKNESS (CM)- .160
.429 571 75 SOURCE - AFMLTR6-259 STRAIN (PCT,) TIME (HOURS) ".442 595,31^o .445 619.6 3o .464 69q2.90 STRAIN (PCT.) TIME (HOURS) .096 .1i0. rm
.485 738.50% .179 .30S.496 723.81 .261 5C0 0.090 .7 0 .287 .6.188 2.503 o299 ,650 "
ALLOY - T-6AL-4V .302 5. .304 76 uSTRESS (MPA) - 31".3 .362 .2TEMP. (KELVIN) - 700 .48 1.1.o THICKNESS (CM) - .160 49 15.1
SOURCE - AFMLTR6-259 ALLOY - T-6L-4V 50
STRESS (MPA) - 493.1 ALLOY - T-6AL-4VTEMP. (KELVIN) - 70 STRESS (MPA) - 517.1STRAIN (PCT,) TIME (HOURS) THICKNESS (CM) - .160 T-E;, (KELVIN) - 70
SOURCE - AFMLTR6-?59 THICKNESS (CM) - .16c62 . SOURCE - AFMLTR6-259062 5
b.087 1.5 STRAIN (PCT.) TIME (HOURS).195 4,6; STRAIN (PCT.) TIME (HOURS).303 I8.5c.317 26.20J .153 .050 2.382 42. 70 .225 ,12 .107 .02 >.409 '0 330 .278 .15 .187 .030 m.453 t7,20 .33? .22, .243 .05.465 74.1i0 .420 .300 .275 .C7 I.488 89,922 .447 .42 .317 ,
.363 .103
.421 .1
.47 ,.17, 4 9q,
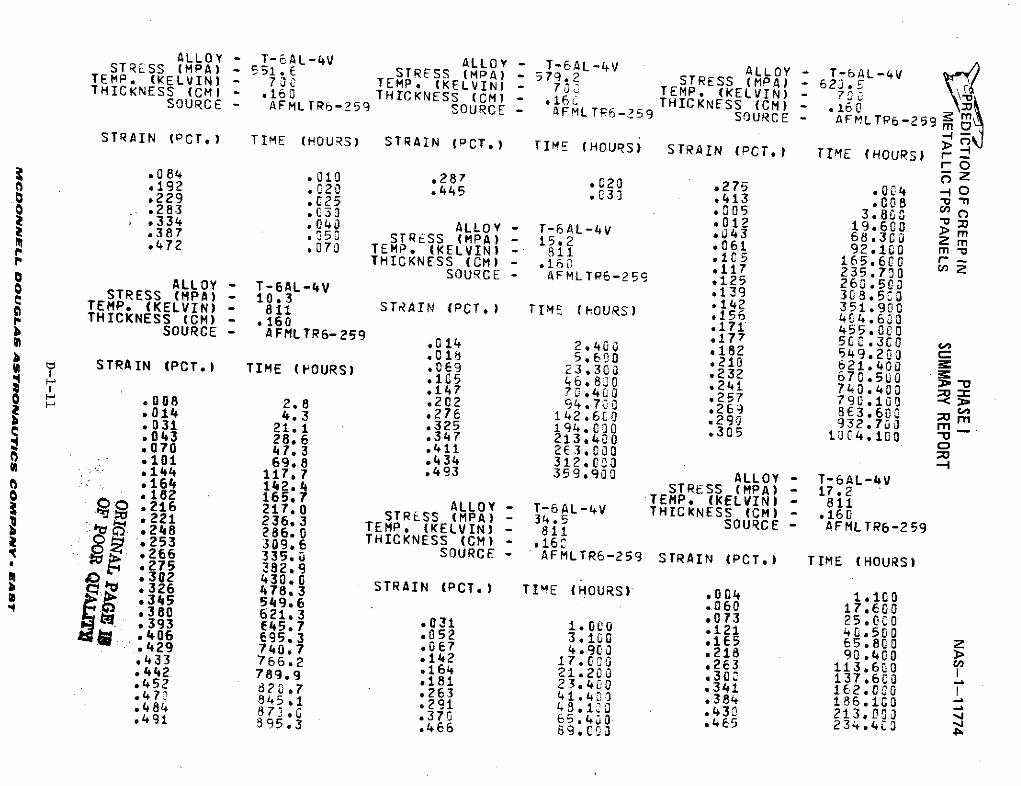
ALLOY - T-EAL-4V ALLOY - T-6AL-4V ALLOY - T-6AL-4VSTRESS (MPA) - 551.E STRESS (MPA) - 579.2 STRESS (MPA) - 62j S.LTEMP. (KELVIN) - 70 TEMP. (KELVIN) - 7,3 TEMP. (KELVIN) - v "vTHICKNESS (CM) - .160 THICKNESS (M(CM) - 160SOURCE - AFMLTR6-259 SOURCE - AFMLTP6-59 SOURCE - AFMLTP6-259
LSQURCE - AFMLTP6-259STRAIN (PCT.) TIME (HOURS) STRAIN (PCT.) TIME (HOURS) STRAIN (PCT*) TIME (HOURS) -r- o0
o084 .010 .745 .C20 .275 .004 -1 0•192 .C20 .445 C 33 o413 .008 -o "mS .229 .025 . 3413 0O .283 .033 .005 3.830. 012 19.600
> m.334 .040 ALLOY - T-6AL-4V *~43 68.3C0 Z mS387 .5 STRESS (MPA) - 15.2 .061 92.100 m o-S.472 .070 TEMP. (KELVIN) - 811 .15 165.6C0 r-
THICKNESS (CM) - .160 .117 165.7C0 nSOURCE - AFMLTP6-259 .125 260.500ALLOY - T-6AL-4V .139 308.500STRESS (MPA) - 10.3 142 351.900TEMP. (KELVIN) - 811 STRAIN (PCT.) TIME (HOURS) 156 4351.900
THICKNESS (CM) - .160 .171 455.060SOURCE - AFMLTR6-259 014 .177 5CC.3C0 c.014 2400 *182 549.200 ".01 5.600 210 621.400 cSTRAIN (PCT.) TIME (HOURS) .09 2330 .232 670.50O
41C5 46.8j0 .241 740.400 --.147 7 .01 40 .257 790.100 0S008 2.8 .202 94.700 .269 793.600.014 4.3 *276 142o6C0 .293 932.60 m.031 21.1 .325 194. C00 .305 iOC4. 00 m-.043 28.6 *347 213.400*070 47.3 .411 2 3.000 o*101 69,8 o434 312C3 -4*.14 117.7 ,493 359.900 ALLOY - T-6AL-4V.164 142.4 STRESS (MPA) - 17.2.1682 165.7 TEMP. (KELVIN)- 811.216 217.0 ALLOY - T-6AL-4V THICKNESS (CM) - .160"6 -217.0 STRESS (MPA) - 34.5 SOURCE - AFMLTR6-259.22148 26.03 TEMP. (KELVIN) - 811.253 309.6 THICKNESS (CM) - .163.266 3 3 5.0 SOURCE - AFMLTR6-259 STRAIN (PCT.) TIME (HOURS)S.275 382.9
S326 478,3 STRAIN (PCT.) TIME (HOURS) *004 1.160.345 549.6 .060 17.600.380 621.3 .073 25.000.393 E45,7 .031 1.0*0 .121 40,500.406 E95.3 .052 3.1Go .1iE5 65.80 z.429 740.7 .067 4.9C0 .218 90.400>
.433 766.2 .142 17.C0O .263 113.600 W.462 789.9 .164 21.200 .300 1376 0.452 .181 23.40 e341 162.00452 8d20.7 .263 21.400 .341 16.00475 845.1 .291 8.1 .384 18.100.484 87 .0 .370 65.4 0 .453 213. 00.491 395.3 .466 9. .65 234433
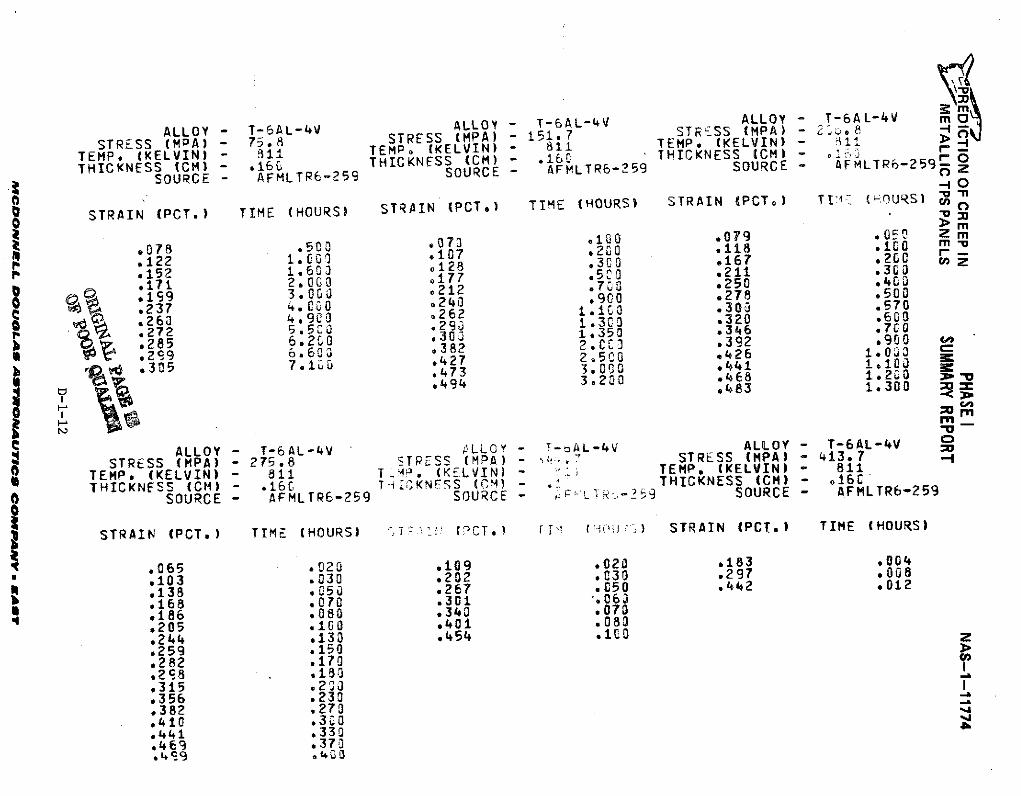
ALLOY T-6L-4V ALLOy - T-AL-4V ALLOY - T-6AL-4V m
STRESS (MPA) 75.8 STRESS (MPA) - 11. TEMP A (KELVIN) - -aATEMP. (KELVIN) - TEMP KELVINCM) - 1THICKNESS CMLVIN) -THICKNESS (CM) - iG THICKNESS N) - 1 THICKNESS CM) - -F r 0SOURCE - AFMLTR6-259 SOURCE - AFMLTR6-259 SOURCE - AFMLTR6-259z-0
STRAIN (PCT.) TIME HOURS) STRAIN (PCT.) TIME (HOURS) STRAIN (PCT.) TI. (-)URS) m)- 0
.07 .507 .079 0 m16.071 *500 0 200 *18 *00 r -.122 1.2 107 *3.0 167 .2GO emn.152 1.600 .128 .0 *211 .*3 ZS.171 2.00 12 .700 .250 .400.237 4.177O .50017.261 2.900 212 .900 .278 .570
3 . c .240 1.100 .300 .70.2 5.5O0 .29 1,3 .320 .600.285 6.237 ,300 1.350 .346.262 6.500 .382 2.00] .392- .900
.2S9 6.600 .427 2.5C 4 .0 a7. .305 7.1 .427 23.0050 .426 1.00
*494 .483 1.300 ? D'I0
r m-
ALLOY - T-6AL-4V ALLOY - T-oAL-4V ALLOY - T-6AL-4VSTRESS (MPA) - 275.8 STR2SS (MPA) - . STRESS (MPA) 43117 -TEMP. (KELVIN) - 811 TIP. (KELVIN) - TEMP. (KELVIN) - 811
THICKNESS (CM) - .160 Ti~KNFS (CM) - . THICKNESS (CM) - 16CSOURCE - AFMLTP6-259 SOURCE - ;', T-5 THCN SOURCE - AFMLTR6-259
STRAIN (PCT.) TIME (HOURS) LT r (PCT.1 rI FT I) STRAIN (PCT.) TIME (HOURS)
.065 .020 .109 .020 .183 .004
.103 .030 .202 .030 .297 ,008,138 .050 *267 .050 .442 .012S168 .070 .301 *063*186 .080 .340 .070.205 .100 .401 .080.244 .130 .454 .100 z.259 .150.282 .170.298 .180 I.315 .210 I.356 .230.382 .270.410 .300.441 .330.469 .370.4S9 .400
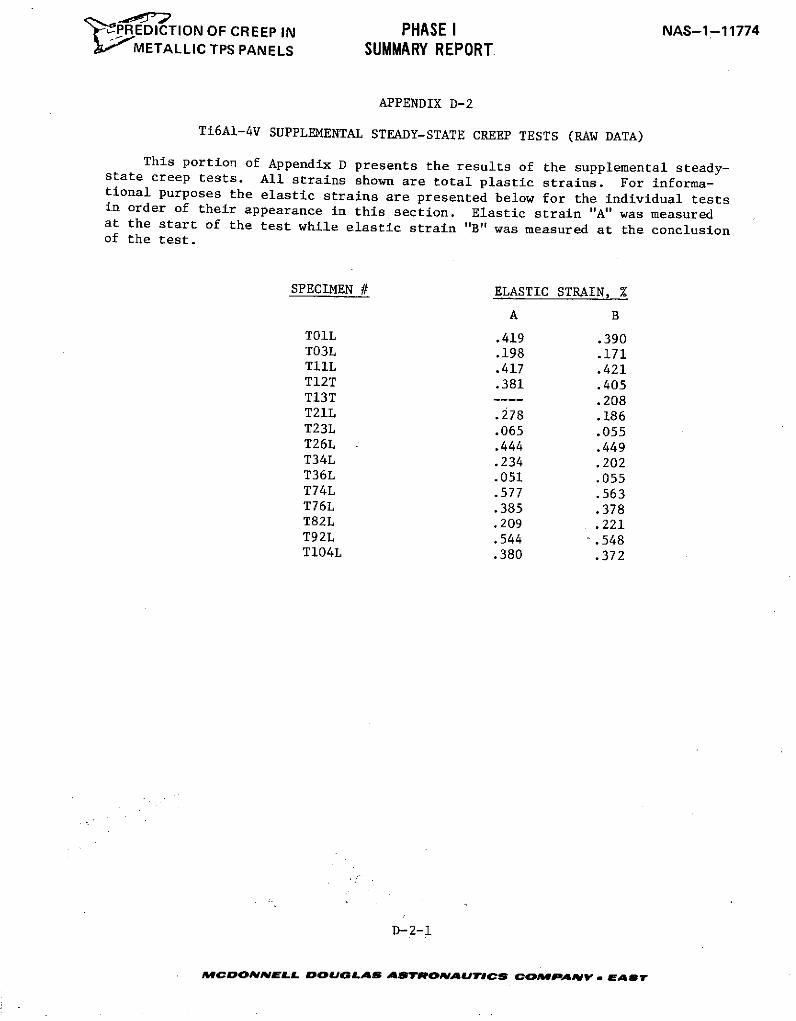
PREDICTION OF CREEP IN PHASE I NAS-1-11774jV;' METALLIC TPS PANELS SUMMARY REPORT
APPENDIX D-2
Ti6Al-4V SUPPLEMENTAL STEADY-STATE CREEP TESTS (RAW DATA)
This portion of Appendix D presents the results of the supplemental steady-state creep tests. All strains shown are total plastic strains. For informa-tional purposes the elastic strains are presented below for the individual testsin order of their appearance in this section. Elastic strain "A" was measuredat the start of the test while elastic strain "B" was measured at the conclusionof the test.
SPECIMEN # ELASTIC STRAIN, %
A B
TO1L .419 .390T03L .198 .171T11L .417 .421TI2T .381 .405T13T ---- .208T21L .278 .186T23L .065 .055T26L .444 .449T34L .234 .202T36L .051 .055T74L .577 .563T76L .385 .378T82L .209 .221T92L .544 -.548T104L .380 .372
D-2-1
MCDONNELL DOUOLAS ASTRONAUTICS COMPANYv. EAST
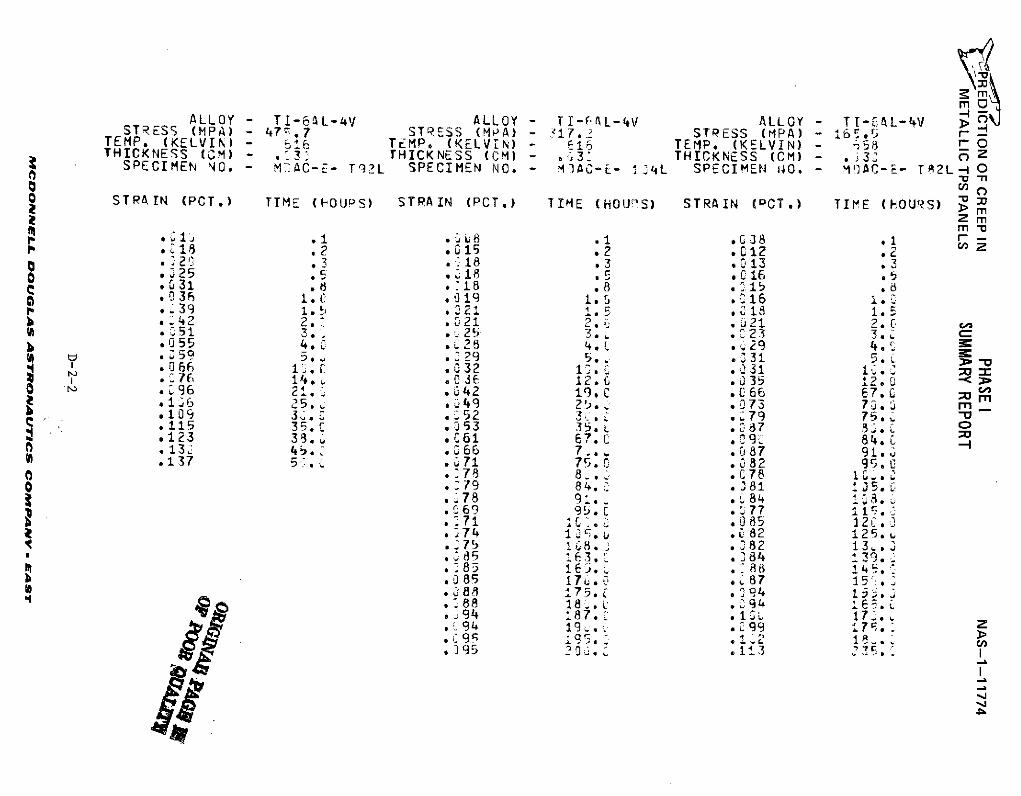
m
ALLOY - TI-64L-4V ALLOY - TI-, AL-4V ALLOY - TI-EAL-4A V >STRESS (MPA) - 47-,7 STRESS (MOA) - 17. ) STRESS (MPA) -165o. rTEMP. (KELVIN - 16 TEMP. (KELVIN) - 16 TEMP. (KELVIN) - r-THICKNESS (CM) - .:3 THICKNESS (CM) - .23, THICKNESS (CM) - .3 O
SPECIMEN NO. - M-AC-E- T92L SPECIMEN NO. - M.1A-E- 134L SPECIMEN 140. - M AC-E- T12L - O
STRAIN (PCT.) TTME (-OUPS) STRAIN (PCT.) TIME (HOUS) STRAIN (PCT.) TIME (HOURS) >r m
m"b *1 j .1 oa8 .1 08 1 r -P *.18 .2 .o15 .2 .C12 .2
S* 2; .3 .:18 .3 .013 .3o .25 . .. 1 .5 .160 .031 .8 2:18 .8 .15 .8
•I .Z3i .019 . .316 •.P *}39 • . 21 1•5 i.
S. 42 2. .021 122.- 321 2.2 C*055 4.0 .028 4s , 4.
S66 .32 1031*,76 14., oC ; 12 . 6 .035 12. -O .*96 21.0 .U42 19.C .066 7.G
*16 25. .49 2'5. .. 73 70.2 m* ON 3. .52 3 . .79 75.
S.115 35. .53 35.T .87 3. o.123 38. .C61 E7.C .. 84.*13 4.C .66 .87 91.
S.137 .071 75. C .082 95.c.278 8 •. .78
o .279 84. .J81 15.. 78 91. 84 18.
n*69 95.E 377 11 .. 71 r' .085 12C.,
. 74 10 .'o .Z82 !25.u
.275 1 8. .82 13 ..:85 163. 384 139.. 85 E~~ . 88 145,085 17 . 0 . 87 15 .
• . 88 175. .'94 53S.1288 18.1 .9 15.CS394 187. 1 17-..94 19,. .;99 17. >•C9R 195. 1,L2 lo!
9395 q20 . .1.3 2 "L I
l"5.
rc4i
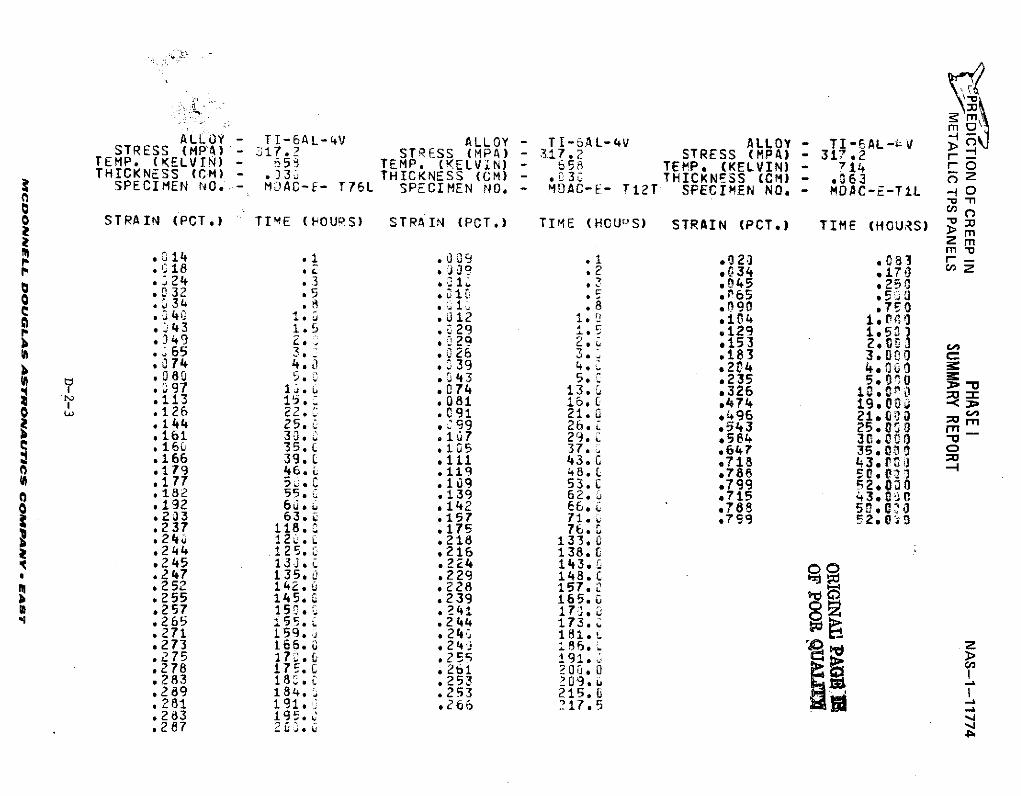
ALLOY - TI-6A4L-4V ALLOY -- TI -AL- V >STRESS (MPA) - 317•2 STRESS (MPA) - 317.2 STRESS (MPA) - 317.2 r- -TEMP. (KELVIN) - e5 TEMP. (KELVIN) - 658 TEMP. (KELVIN) - 714 r 0
THICKNESS (CM) - .33. THICKNESS (CM) - . 30 THICKNESS (CM) - . 63 o ZSPECIMEN NO. - MDAC-E- T76L SPECIMEN NO. - MDAC-E- TI2T SPECIMEN NO. - MDAC-E-TiL - 0
0
0 STRAIN (PCT.) TIME (I-OUPS) STRAIN (PCT.) TIME (HOUrS) STRAIN (PCT.) TIME (HOURS)I Zm
F 14 .1 .009 .1 .02, r- 83* ]18 .2 .. 9 .2 ,034 .170 z.L24 .3 .31. .Z .045 9250.032 .5 .065 .50
4.34 . . .8 .090 .750*04* .012 .104 i,*ngp .43 1.5 .29 i• .129 i l5
b *949 2. .029 2. .153 2.0oS*65 . .26 3. .183 3.000 c
.074 4.0 .Z39 4 .2t4 4.0
.080 5.. .43 5. .235 5.0 I.97 10. .074 13. .326 1 a.0O
.*113 1. o081 1 .6 .474 19.o3 .0 126 22.; .091 21.u .496 21.0 O1 m
..144 25. .99 26. .543 25.000 m
.161 30. 177 29 .C *584 3C. "
.16, 35.( .105 37.. .647 35.00? o
.166 39.0 .111 43.0 .718 43. r7,JS179 46.L .119 .48.L 788 5c,. 02
.177 %.C .109 53.0 .799 52.000
.182 55. .139 62*. .715 43.0 0o .192 60.1 .142 66. 788 50
.233 63.. .157 71.' .759 52.0 3
.237 118. .175 76.0
.244 1*20. .218 133.0
.244 125.L .216 138.0
.245 13CJ.O .224 143.0 L, .247 135. 0 229 148.0
S.252 142.0 .228 157..255 145.0 .239 165.0
S.257 15r.0 .241 171,0.265 155. .244 173..271 159. . .24'; 181.C.273 166.0 .24J 18 6. Z.275 17 . .255 191..278 175.L .261 200. 0.283 18. 0 .253 209.6.289 184. .253 215.0.281 191.0 .266 217.5.283 195..287 20 .2
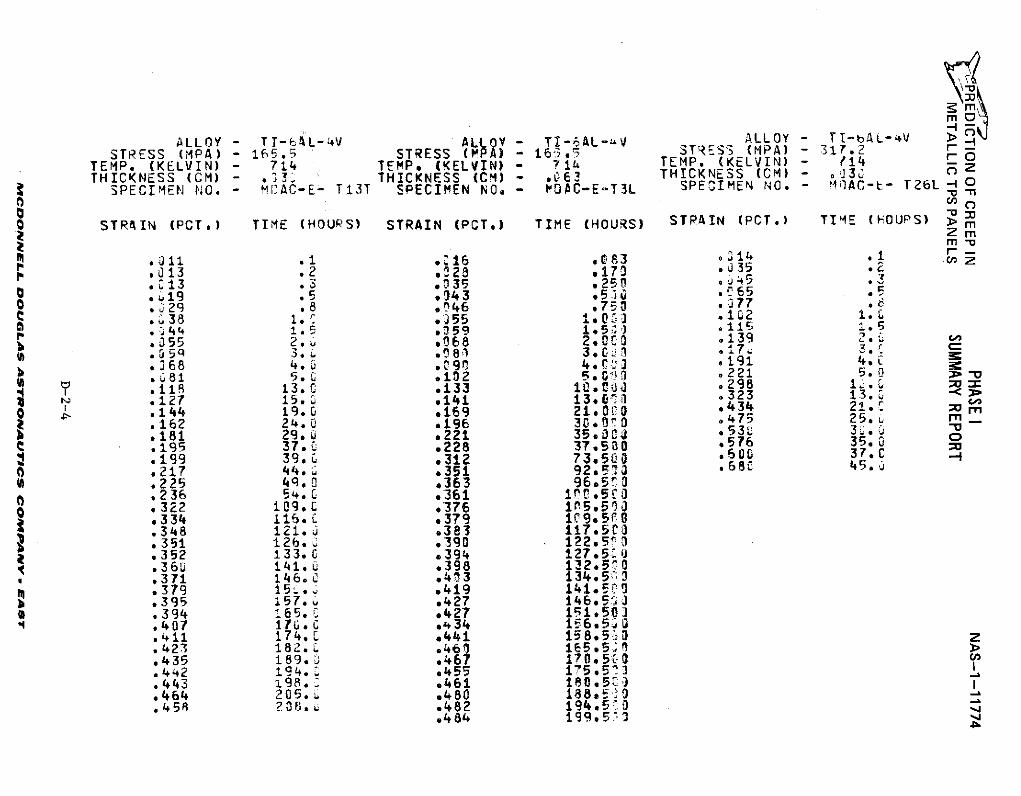
moIALLOY -T TI-AL-4V ALLOY - TI-6AL-uV ALLOY - TI-bAL-V > _
STRESS (MPA) - 165.5 STRESS (MPA) - 165.7 ST'ESS (MPA) - 317.2TEMP. (KELVIN) - 714 TEMP. (KELVIN) - 716 TEMP. (KELVIN) - 14 rTHICKNESS (CM) - .3 THICKNESS (CM) - 63 THICKNESS (CM) - 31 o
SPECIMEN NO. - MCAC-E- T13T SPECIMEN NO. - tDAC-E-T3L SPECIMEN NO. - MrAC-,- T26L -- 0
O STRAIN (PCT.) TIME (HOURS) STRAIN (PCT.) TIME (HOURS) STPAIN (PCT.) TIME (HOUPS) > M2 mnm -
M11 .1 .6 .C83 o014 .1 r-.0 13 .2 .28 .17 . 35 ..013 .3 035 .250 ,J45 ..19 .5 .543 .53 C65 .. 29 .8 .046 .75 77.1 38 1. C .955 IO0U, .1j2 1.. 44 1. 5 059 15; 115 1.5.055 2. .068 2.00C .139 CO.0 59 3 .081 3.C0 *17u 3..368 4. .090 4 o *191 4o i
81 5. o.102 5. .221 5. -.118 13. C .133 10.c;J .298 1 .w
S *127 15. .141 13.03 .323 13.2
C .195 37.. .228 37.500 .576 35.oS.199 39. .31 73.500 .600 37..C .217 44. .351 92.5?3 .68 45.
.225 49.0 .363 96.50
.236 54.0 .361 i .5 0o 322 109. .376 1r5L.5 0.334 116.c .379 j9*5f0.348 121. .383 117.5C3.351 12b6, .390 122.5 5 3.352 133. 0 .394 127.5A.36% 141.,0 .398 i32.50 0.371 146.o .43 134,.52 3
I .379 150. J .419 141.50.395 157. 0 .427 146.5
S.394 165. ; .427 11.50, 407 17 C .434 16.5j 0.411 174, C .441 158.5ra z
.423 182.* .46 165.5i0.435 189. .467 170.5 0.442 194. . .455 175.573.443 198. .461 180.5i -1.464 205.~ .480 188 ".458 ?08., .482 194.S50
.484 199,5 0
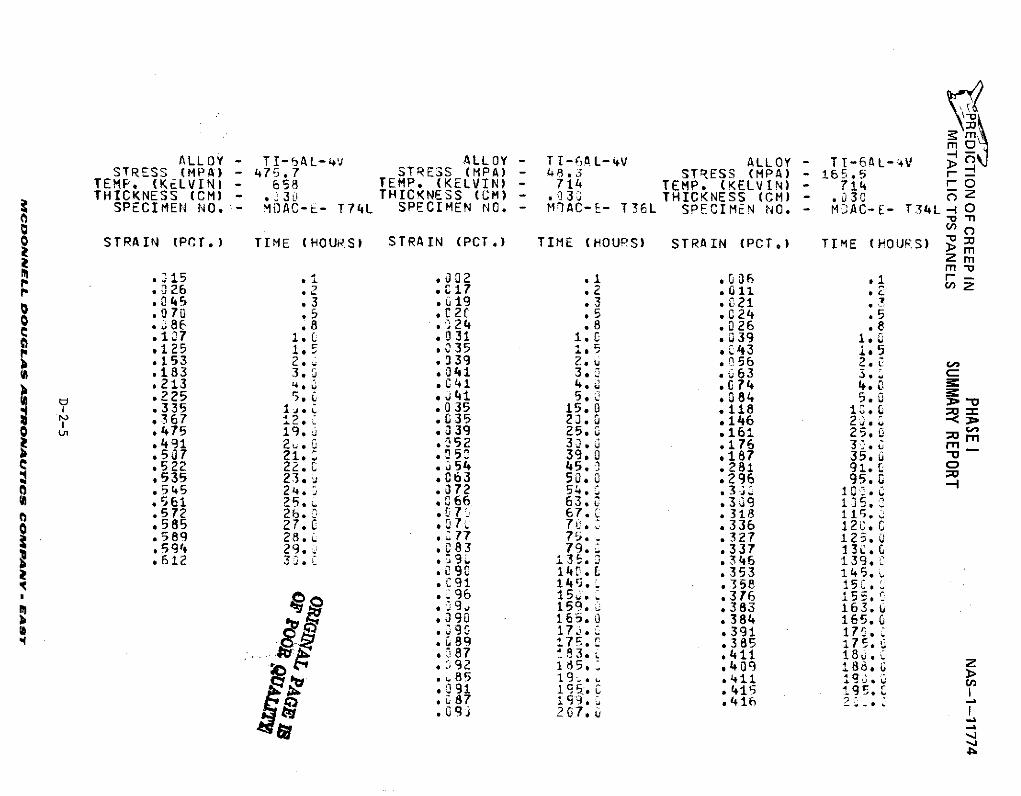
m-
ALLOY - TI-6AL-4v ALLOY - TI-6AL-4V ALLOY - TI-64L-4V >STRESS (MPA) - 475.7 STRESS (MPA) - 48.3 STRESS (MPA) - 165.5 r
TEMP. (KELVIN) - 658 TEMP. (KELVIN) - 714 TEMP. (KELVIN) - 714 rTHICKNESS (CM) - .33 THICKNESS (CM) - .03' THICKNESS (CM) - .330 2Z
SPECIMEN NO. - MOAC-E- T74L SPECIMEN NO. - MlAC-E- T36L SPECIMEN NO. - MDAC-E- T34L 0
O STRAIN (PCT.) TIME (HOURS) STRAIN (PCT.) TIME (HOURS) STRAIN (PCT.) TIME (HOUP, S) > mZm
.002 .1 *0036 1 c -.026 .2 .17 .2 .011 .2.045 .3 .U19 .3 .021 3.07 .C2 .5 .024 .5.86 .8 .--24 .8 .026 .8.1 1. .031 1.0 .039 1..125 35 5 .143 165.153 2. .039 2. .056 2.C co.183 3.0 .041 3.0 .463 3.. c.213 4.- .041 4. .074 4.0.225 5,L .w41 5. .084 5. 3.335 1 .035 15.0 .118 1,.0tj .367 42 .035 23.0 .146 2. -o . .475 19 .339 253 .161 25..491 2 .252 3).Q .176 3 .0 _.507 21.3 *051 39o0 .187 35. -
C .522 22.C .354 45.' .281 91.0 0.535 23., .063 500. .296 95.0
0 .545 24.- .072 54.1 .33 10 .35.561 25... .066 63.1 .3u9 135.2
.572 2b. .07 667. . .318 115.o .585 27. .07, 70. .336 12C.0
.589 28. * .77 75, .327 125.0
.594 29.. .083 79. .337 13C.C
.612 3 .0 * 35. .346 139..090 14 .C .353 i45..SC91 145. .358 !5C,S.96 15'. .376 155,
. 9, 159. .383 163.L
.090 165.0 .384 165.G
.090 17. .391 17f.' .89 175.~ .385 175.
.87 193.L .411 18u.. 92 185. .409 186. 6 Z
.85 19 411 193.* 93 1 -195.. .15 1 IC.,87 199. .416 2..VJ 3 207.
h~b,4
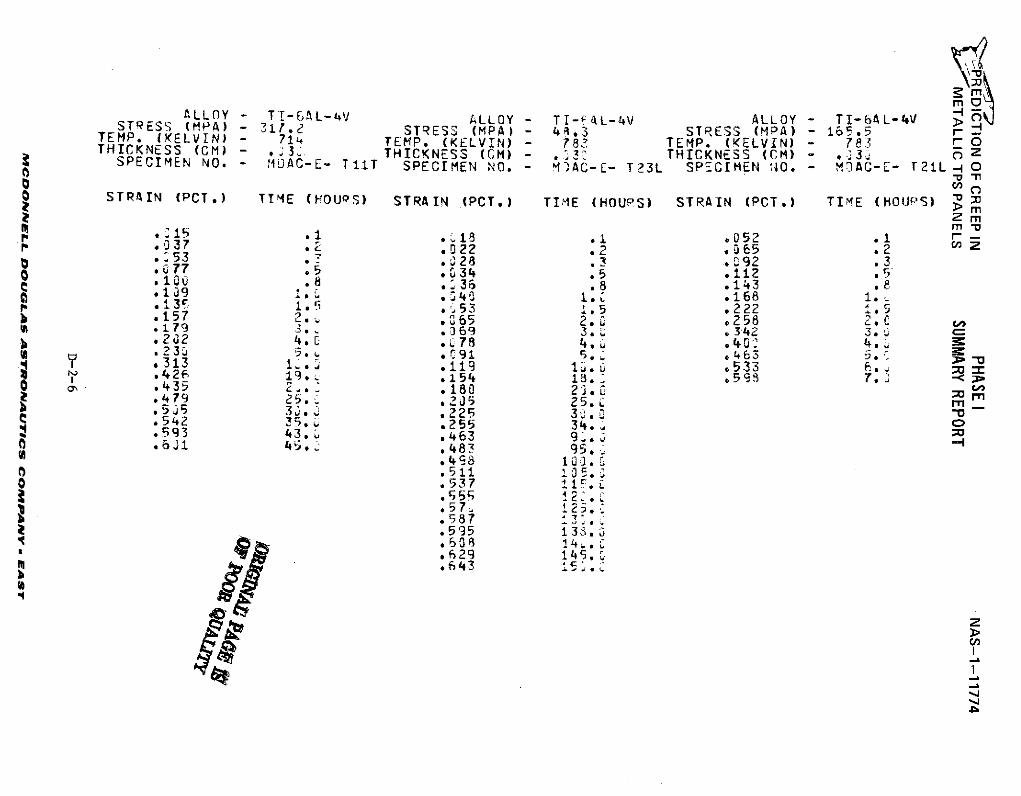
ALLOY - TI-6AL-4V ALLOY - TI-A L-4V ALLOY - TI-6AL-4V - 0STRESS (MPA)- 31.2 STRESS (MPA) - 43.3 STRESS (MPA) - 165.
TEMP. (KELVIN) - 714 TEMP. (KELVIN) - 78? TEMP. (KELVIN) - 783 0THICKNESS (CM) - •.3 THICKNESS (CM) - .. 3: THICKNESS (CM) - . 3 Z
SPECIMEN NO. - 1i0AC-E- T11T SPECIMEN NO. - MjAC-E- T23L SPECIMEN AO. - M5AC-E- T21L 0-u-n
O STRAIN (PCT.) TIME (HOUPS) STRAIN (PCT.) TIIE (HOUPS) STRAIN (PCT.) TIME (HOUPS) x> m
M m, .215 .1 .118 .1 .052 .1 r-p .,37 .2 .022 .2 .065 .2 c Z
.53 7 .028 .3 .C92 .3S.u77 ,5 .y34 .5 .112 .5
S100o .8 .,36 .8 .143 .8§.1 9 i, ,J40 .168 1.-.5 .53 1.5 222 .5
.157 * .065 2, .Z 258 2.v ,S.179 *.. .369 3.0 342 3.
. 202 4*. .0 7 8 4,% .40i 4.-.S23 C91 . .463
4 .313 1 . .119 1. .533r .426 19.. 154 18. 598 7. iall .4135 2,. .180 2 3.L ~r
.479 25, .2 5 25.2 rn*5j 5 3 j. .225 3,0. "S.542 35. ,255 34. o.593 43. .463 9.
14.* .483 95..498 103.0.511 10. 537 11 0.5 7 125.
.587 -S.595 138.0
b .629 145.I o543
c,,
"UPREDICTION OF CREEP IN PHASE I NAS-1-11774
M" METALLIC TPS PANELS SUMMARY REPORT
APPENDIX D-3
Ti-6Al-4V CYCLIC CREEP TESTS
(RAW DATA)
Presented in this section are the results of the twelve cyclic tests performed
on tensile specimens.
D-3-1
MCDONNELL DOUGLAS ASTRONAUTICS COPANV y EASTr
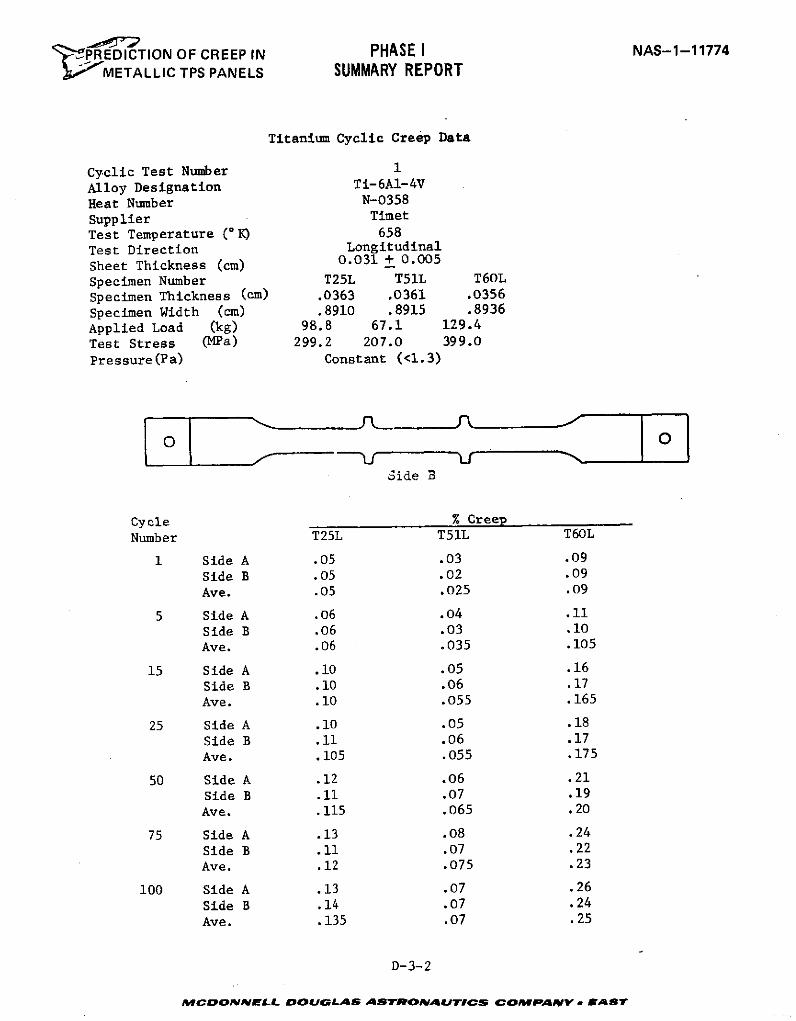
RPREDICTION OF CREEP IN PHASE I NAS-1-11774
METALLIC TPS PANELS SUMMARY REPORT
Titanium Cyclic Creep Data
Cyclic Test Number 1Alloy Designation Ti-6Al-4VHeat Number N-0358
Supplier Timet
Test Temperature ( K) 658
Test Direction Longitudinal
Sheet Thickness (cm) 0.031 + 0.005
Specimen Number T25L T51L T60L
Specimen Thickness (cm) .0363 .0361 .0356Specimen Width (cm) .8910 .8915 .8936Applied Load (kg) 98.8 67.1 129.4
Test Stress (MPa) 299.2 207.0 399.0
Pressure(Pa) Constant (<1.3)
0O
3ide B
Cycle % Creep
Number T25L T51L T60L
1 Side A .05 .03 .09
Side B .05 .02 .09Ave. .05 .025 .09
5 Side A .06 .04 .11
Side B .06 .03 .10Ave. .06 .035 .105
15 Side A .10 .05 .16
Side B .10 .06 .17
Ave. .10 .055 .165
25 Side A .10 .05 .18
Side B .11 .06 .17
Ave. .105 .055 .175
50 Side A .12 .06 .21
Side B .11 .07 .19
Ave. .115 .065 .20
75 Side A .13 .08 .24
Side B .11 .07 .22
Ave. .12 .075 .23
100 Side A .13 .07 .26
Side B .14 .07 .24
Ave. .135 .07 .25
D-3-2
MCDONNELL DOUGLAS ASTRONAUTICS COMPAANY- LA ST
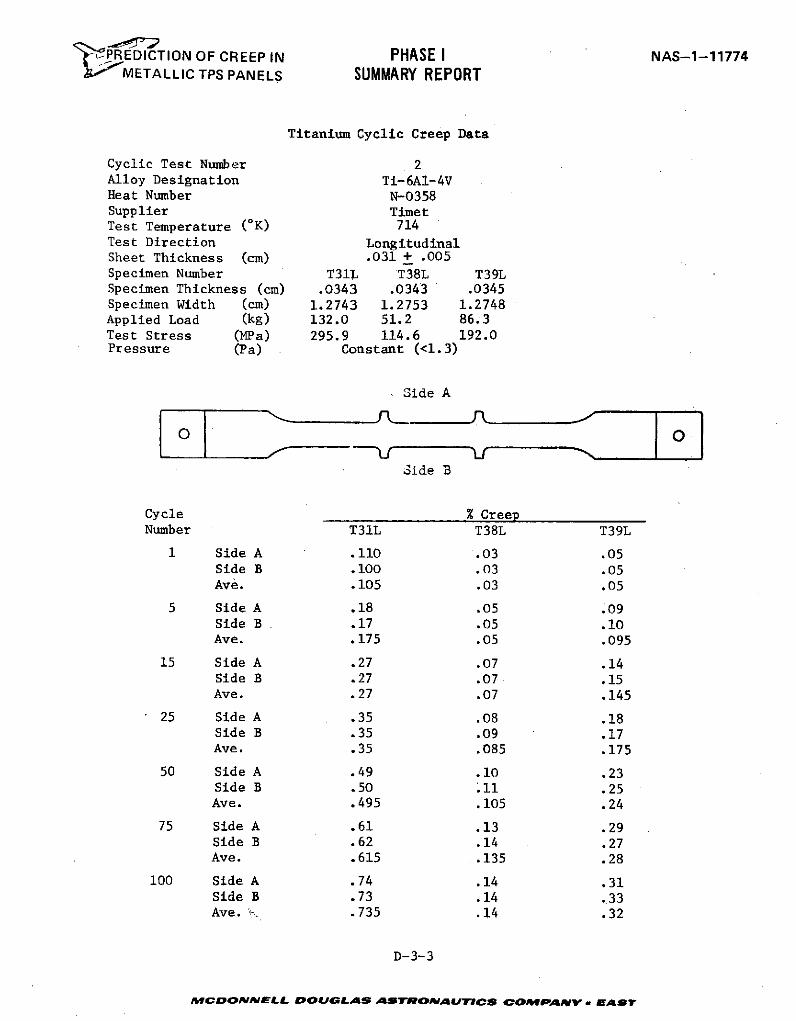
PPREDICTION OF CREEP IN PHASE I NAS-1-11774METALLIC TPS PANELS SUMMARY REPORT
Titanium Cyclic Creep Data
Cyclic Test Number 2Alloy Designation Ti-6Al-4VHeat Number N-0358Supplier TimetTest Temperature (OK) 714Test Direction LongitudinalSheet Thickness (cm) .031 + .005Specimen Number T31L T38L T39LSpecimen Thickness (cm) .0343 .0343 .0345Specimen Width (cm) 1.2743 1.2753 1.2748Applied Load (kg) 132.0 51.2 86.3Test Stress (MPa) 295.9 114.6 192.0Pressure (Pa) Constant (<1.3)
Side A
Side B
Cycle % CreepNumber T31L T38L T39L
1 Side A .110 .03 .05Side B .100 .03 .05Ave. .105 .03 .05
5 Side A .18 .05 .09Side B .17 .05 .10Ave. .175 .05 .095
15 Side A .27 .07 .14Side B .27 .07 .15Ave. .27 .07 .145
25 Side A .35 .08 .18Side B .35 .09 .17Ave. .35 .085 .175
50 Side A .49 .10 .23Side B .50 .11 .25Ave. .495 .105 .24
75 Side A .61 .13 .29Side B .62 .14 .27Ave. .615 .135 .28
100 Side A .74 .14 .31Side B .73 .14 .33Ave. .735 .14 .32
D-3-3
MCDONNELL DOUGLAS STRONMAUTICS COMPANY EAST
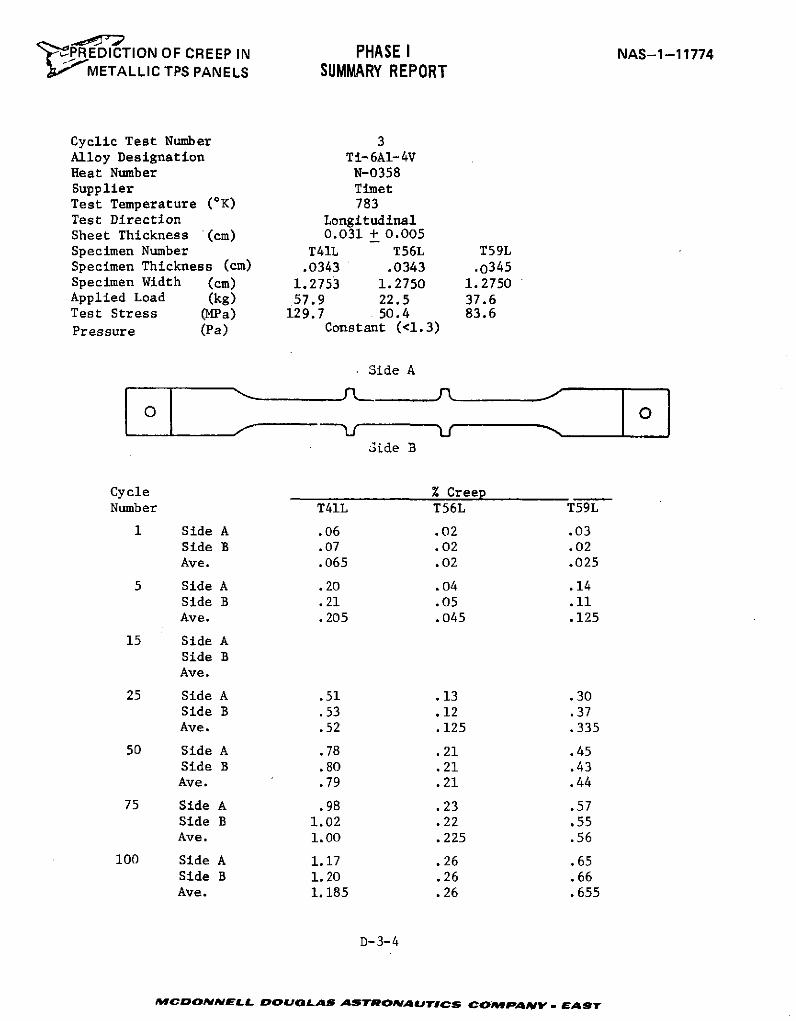
" PREDICTION OF CREEP IN PHASE I NAS-1-11774S ,METALLIC TPS PANELS SUMMARY REPORT
Cyclic Test Number 3Alloy Designation Ti-6Al-4VHeat Number N-0358Supplier TimetTest Temperature (OK) 783Test Direction LongitudinalSheet Thickness (cm) 0.031 + 0.005Specimen Number T41L T56L T59LSpecimen Thickness (cm) .0343 .0343 .0345Specimen Width (cm) 1.2753 1.2750 1.2750Applied Load (kg) 57.9 22.5 37.6Test Stress (MPa) 129.7 50.4 83.6
Pressure (Pa) Constant (<1.3)
Side A
Side B
Cycle % CreepNumber T41L T56L T59L
1 Side A .06 .02 .03Side B .07 .02 .02Ave. .065 .02 .025
5 Side A .20 .04 .14Side B .21 .05 .11Ave. .205 .045 .125
15 Side ASide BAve.
25 Side A .51 .13 .30Side B .53 .12 .37Ave. .52 .125 .335
50 Side A .78 .21 .45Side B .80 .21 .43Ave. .79 .21 .44
75 Side A .98 .23 .57Side B 1.02 .22 .55Ave. 1.00 .225 .56
100 Side A 1.17 .26 .65Side B 1.20 .26 .66Ave. 1.185 .26 .655
D-3-4
MCMDONNELL DOUGLAS ASTRONAgITICrS CO PA vPNY v. wST
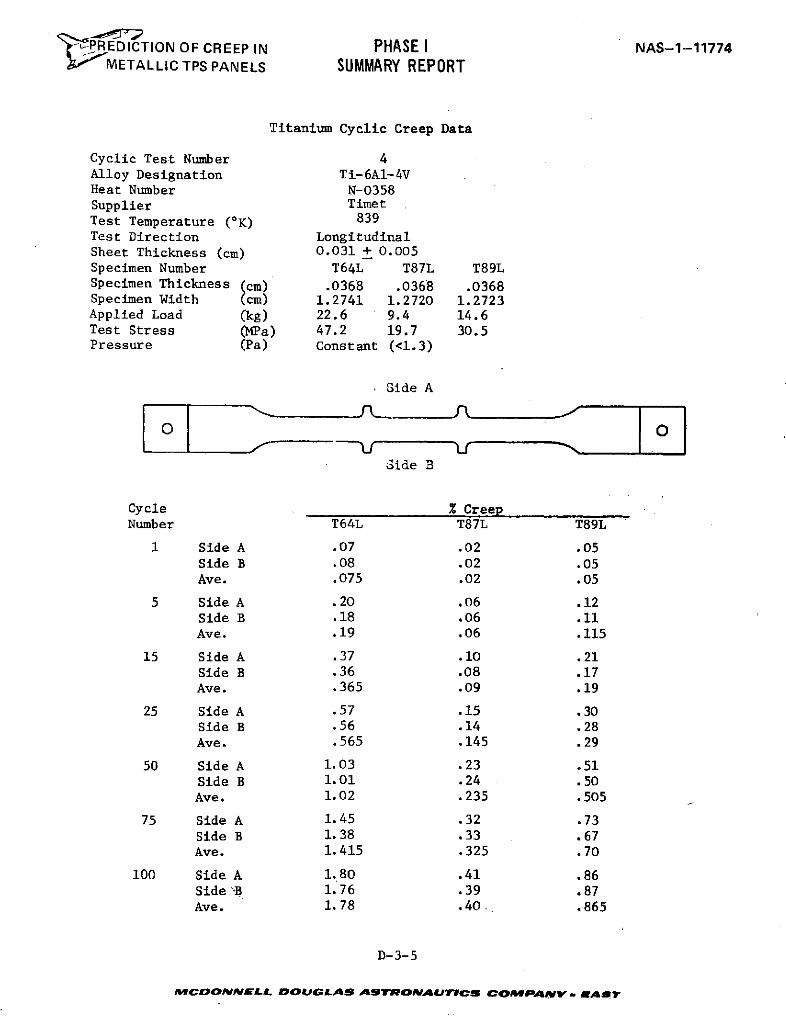
PREDICTION OF CREEP IN PHASE I NAS-1-11774METALLIC TPS PANELS SUMMARY REPORT
Titanium Cyclic Creep Data
Cyclic Test Number 4Alloy Designation Ti-6Al-4VHeat Number N-0358Supplier TimetTest Temperature (OK) 839Test Direction LongitudinalSheet Thickness (cm) 0.031 + 0.005Specimen Number T64L T87L T89LSpecimen Thickness (cm) .0368 .0368 .0368Specimen Width (cm) 1.2741 1.2720 1.2723Applied Load (kg) 22.6 9.4 14.6Test Stress 0Pa) 47.2 19.7 30.5Pressure (Pa) Constant (<1.3)
Side A
Side B
Cycle % CreepNumber T64L T87L T89L
1 Side A .07 .02 .05Side B .08 .02 .05Ave. .075 .02 .05
5 Side A .20 .06 .12Side B .18 .06 .11Ave. .19 .06 .115
15 Side A .37 .10 .21Side B .36 .08 .17Ave. .365 .09 .19
25 Side A .57 .15 .30Side B .56 .14 .28Ave. .565 .145 .29
50 Side A 1.03 .23 .51Side B 1.01 .24 .50Ave. 1.02 .235 .505
75 Side A 1.45 .32 .73Side B 1.38 .33 .67Ave. 1.415 .325 .70
100 Side A 1.80 .41 .86Side 'B 1.76 .39 .87Ave. 1.78 .40 .865
D-3-5
MCDONNELL DOUGLAS ASTRONAUTICS COMPANV . EAor
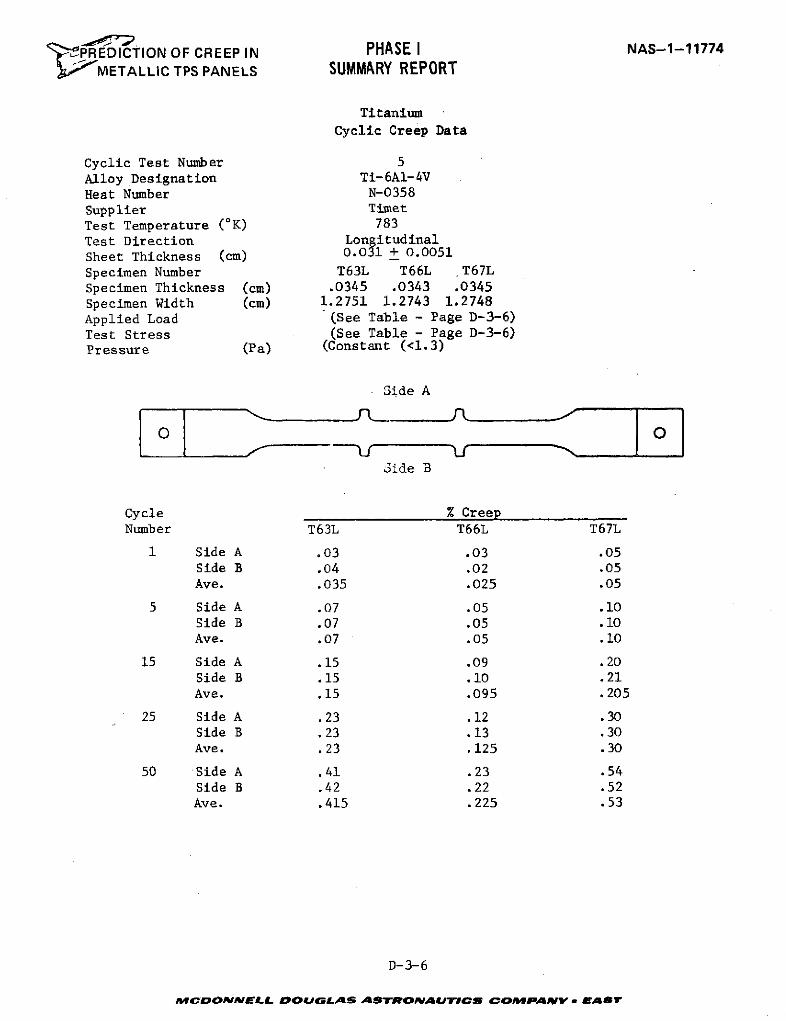
'tPREDICTION OF CREEP IN PHASE I NAS-1-11774METALLIC TPS PANELS SUMMARY REPORT
Titanium
Cyclic Creep Data
Cyclic Test Number 5Alloy Designation Ti-6A1-4VHeat Number N-0358
Supplier TimetTest Temperature (oK) 783Test Direction LongitudinalSheet Thickness (cm) 0.031 + 0.0051
Specimen Number T63L T66L T67L
Specimen Thickness (cm) .0345 .0343 .0345Specimen Width (cm) 1.2751 1.2743 1.2748Applied Load (See Table - Page D-3-6)Test Stress (See Table - Page D-3-6)Pressure (Pa) (Constant (<1.3)
Side A
Side B
Cycle % CreepNumber T63L T66L T67L
1 Side A .03 .03 .05Side B .04 .02 .05Ave. .035 .025 .05
5 Side A .07 .05 .10Side B .07 .05 .10Ave. .07 .05 .10
15 Side A .15 .09 .20Side B .15 .10 .21Ave. .15 .095 .205
25 Side A .23 .12 .30Side B .23 .13 .30Ave. .23 .125 .30
50 Side A .41 .23 .54Side B .42 .22 .52Ave. .415 .225 .53
D-3-6
MCDONNELL DOUGLAS ASTRONAUTICS COMPANV EABST
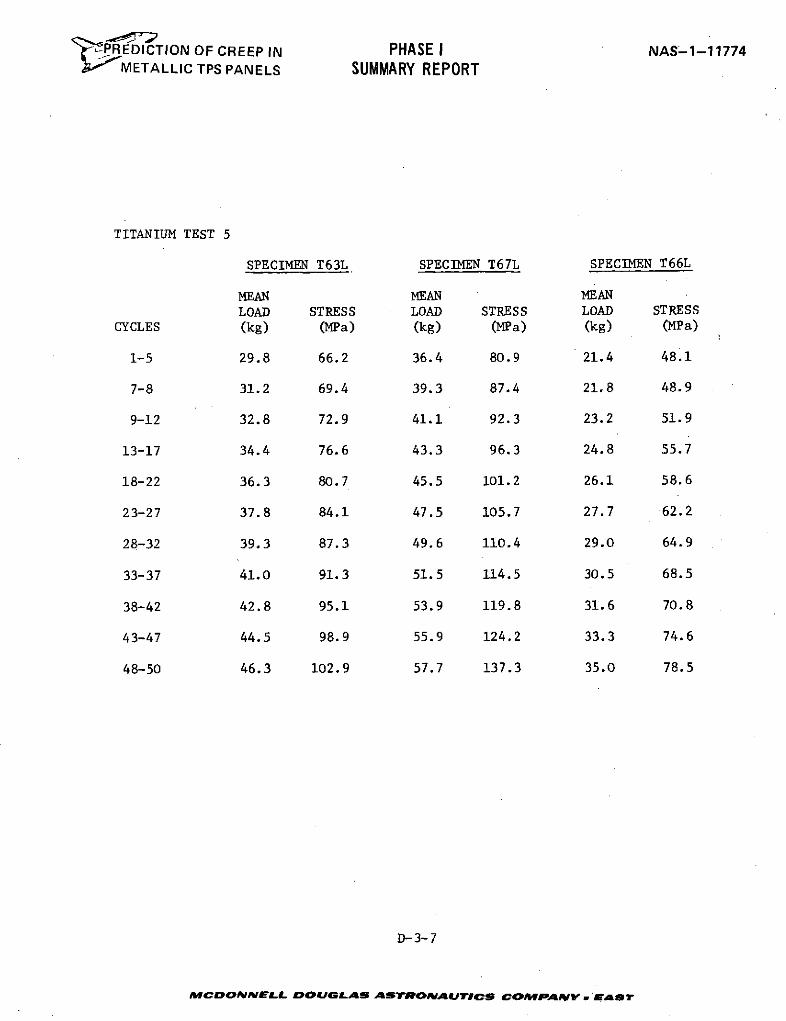
P;R'REDICTION OF CREEP IN PHASE I NAS-1-11774I"- METALLIC TPS PANELS SUMMARY REPORT
TITANIUM TEST 5
SPECIMEN T63L SPECIMEN T67L SPECIMEN T66L
MEAN MEAN MEANLOAD STRESS LOAD STRESS LOAD STRESS
CYCLES (kg) (MPa) (kg) (MPa) (kg) (MPa)
1-5 29.8 66.2 36.4 80.9 21.4 48.1
7-8 31.2 69.4 39.3 87.4 21.8 48.9
9-12 32.8 72.9 41.1 92.3 23.2 51.9
13-17 34.4 76.6 43.3 96.3 24.8 55.7
18-22 36.3 80.7 45.5 101.2 26.1 58.6
23-27 37.8 84.1 47.5 105.7 27.7 62.2
28-32 39.3 87.3 49.6 110.4 29.0 64.9
33-37 41.0 91.3 51.5 114.5 30.5 68.5
38-42 42.8 95.1 53.9 119.8 31.6 70.8
43-47 44.5 98.9 55.9 124.2 33.3 74.6
48-50 46.3 102.9 57.7 137.3 35.0 78.5
D-3-7
ACDONNELL DOUGLVAS ASTRONAUTICS COMPANY. 'EAST
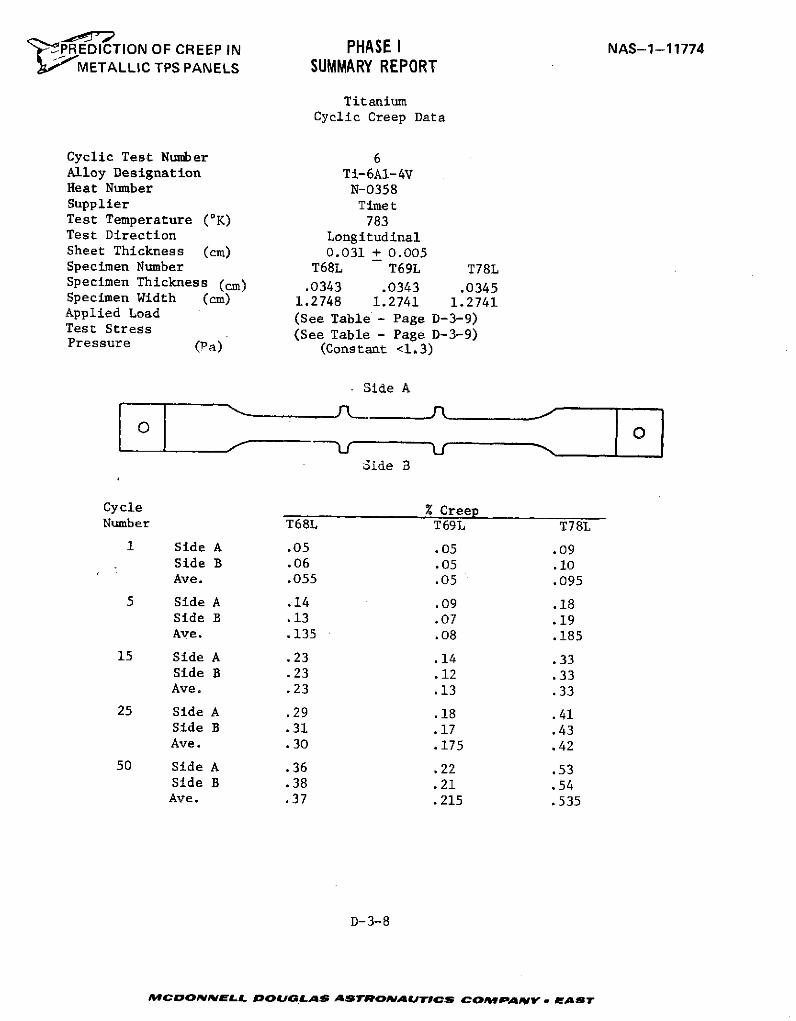
'PREDICTION OF CREEP IN PHASE I NAS-1-11774' , METALLIC TPS PANELS SUMMARY REPORT
TitaniumCyclic Creep Data
Cyclic Test Number 6Alloy Designation Ti-6A-4VHeat Number N-0358Supplier TimetTest Temperature (OK) 783Test Direction LongitudinalSheet Thickness (cm) 0.031 + 0.005Specimen Number T68L T69L T78LSpecimen Thickness (cm) .0343 .0343 .0345Specimen Width (cm) 1.2748 1.2741 1.2741Applied Load (See Table - Page D-3-9)Test Stress (See Table - Page D-3-9)Pressure (Pa) (Constant <1.3)
Side A
Side B
Cycle % CreepNumber T68L T69L T78L
1 Side A .05 .05 .09Side B .06 .05 .10Ave. .055 .05 .095
5 Side A .14 .09 .18Side B .13 .07 .19Ave. .135 .08 .185
15 Side A .23 .14 .33Side B .23 .12 .33Ave. .23 .13 .33
25 Side A .29 .18 .41Side B .31 .17 .43Ave. .30 .175 .42
50 Side A .36 .22 .53Side B .38 .21 .54Ave. .37 .215 .535
D-3-8
MCDONNELL DOUGLAS ASTRONAUTICS COMPANY. fEATS
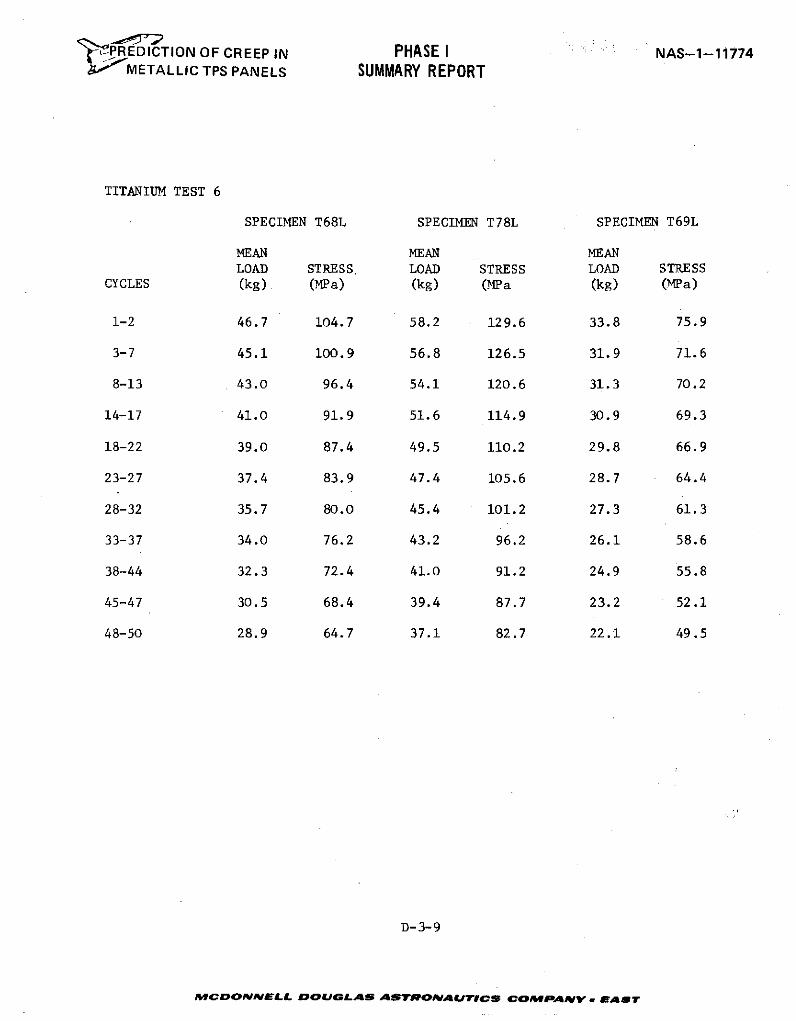
PREDICTION OF CREEP IN PHASE I NAS-1-11774METALLIC TPS PANELS SUMMARY REPORT
TITANIUM TEST 6
SPECIMEN T68L SPECIMEN T78L SPECIMEN T69L
MEAN MEAN MEANLOAD STRESS. LOAD STRESS LOAD STRESS
CYCLES (kg). (MPa) (kg) (MPa (kg) (MPa)
1-2 46.7 104.7 58.2 129.6 33.8 75.9
3-7 45.1 100.9 56.8 126.5 31.9 71.6
8-13 43.0 96.4 54.1 120.6 31.3 70.2
14-17 41.0 91.9 51.6 114.9 30.9 69.3
18-22 39.0 87.4 49.5 110.2 29.8 66.9
23-27 37.4 83.9 47.4 105.6 28.7 64.4
28-32 35.7 80.0 45.4 101.2 27.3 61.3
33-37 34.0 76.2 43.2 96.2 26.1 58.6
38-44 32.3 72.4 41.0 91.2 24.9 55.8
45-47 30.5 68.4 39.4 87.7 23.2 52.1
48-50 28.9 64.7 37.1 82.7 22.1 49.5
D-3-9
MCDONNELL DOUGLAS ASTRONAUTICS COMPANY BLAeST

'PREDICTION OF CREEP IN PHASE I NAS-1-11774-METALLIC TPS PANELS SUMMARY REPORT
Titanium
Cyclic Creep Data
Cyclic Test Number 7Alloy Designation Ti-6A1-4VHeat Number N-0358Supplier TimetTest Temperature (OK) 714Test Direction LongitudinalSheet Thickness (cm) 0.031 + 0.005Specimen Number T32L T40L T61LSpecimen Thickness (cm) .0338 .0338 .0340Specimen Width (cm) 1.2746 1.2748 1.2743Applied Load (kg) 130.1 49.5 84.3Test Stress (MPa) 296.0 112.6 190.4Pressure (Pa) (Constant (<1.3)
Side A
Side B
Cycle % CreepNumber T32L T40L T61L
1 Side A .07 .02 .03Side B .07 .02 .03Ave. .07 .02 .03
5 Side A .11 .03 .05Side B .13 .03 .05Ave. .12 .03 .05
10 Side A .15 .03 .08Side B .16 .03 .08Ave. .155 .03 .08
30 Side A .23 .04 .09Side B .22 .03 .10Ave. .225 .035 .095
50 Side A .29 .06 .14Side B .29 .07 .15Ave. .29 .065 .145
100 Side A .37 .07 .18Side B .37 .09 .19Ave. .37 .08 .185
D-3-10
MCDONNELL DOUGLAS ASTRONAUTICS COMFPANY . EAST
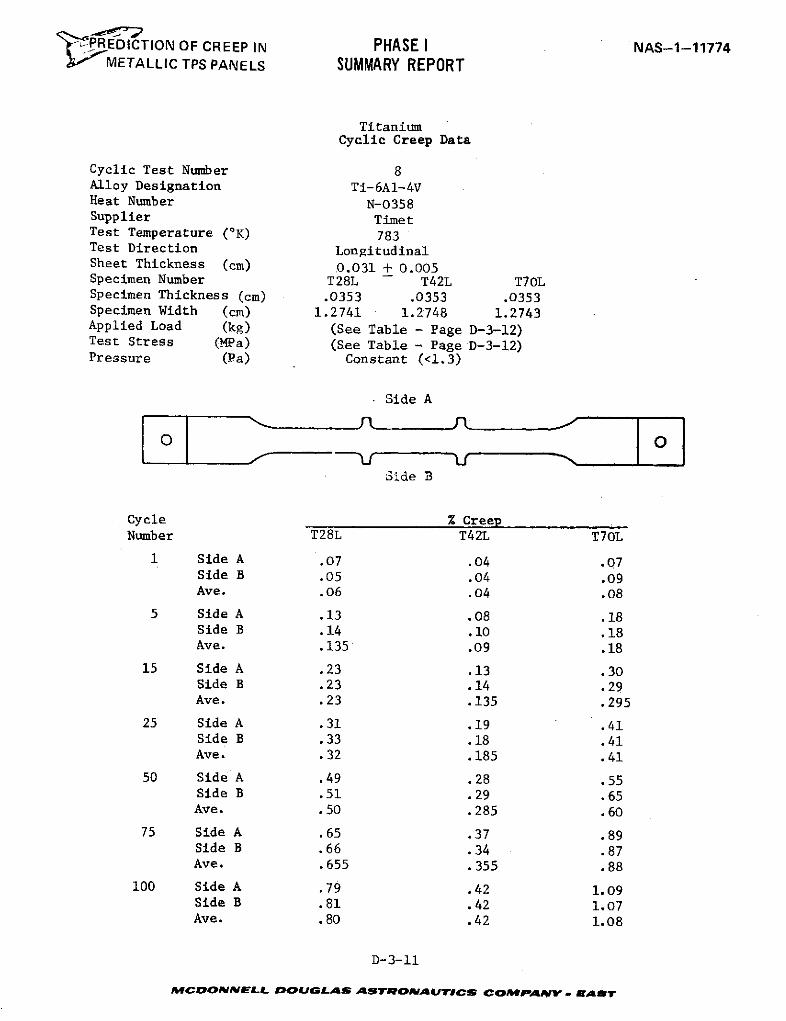
PREDICTION OF CREEP IN PHASE I NAS-1-11774METALLIC TPS PANELS SUMMARY REPORT
TitaniumCyclic Creep Data
Cyclic Test Number 8Alloy Designation Ti-6A1-4VHeat Number N-0358Supplier TimetTest Temperature (OK) 783Test Direction LongitudinalSheet Thickness (cm) 0.031 + 0.005Specimen Number T28L T42L T70LSpecimen Thickness (cm) .0353 .0353 .0353Specimen Width (cm) 1.2741 1.2748 1.2743Applied Load (kg) (See Table - Page D-3-12)Test Stress (MPa) (See Table - Page D-3-12)Pressure (Pa) Constant (<1.3)
Side A
Side B
Cycle % CreepNumber T28L T42L T70L
1 Side A .07 .04 .07Side B .05 .04 .09Ave. .06 .04 .08
5 Side A .13 .08 .18Side B .14 .10 .18Ave. .135 .09 .18
15 Side A .23 .13 .30Side B .23 .14 .29Ave. .23 .135 .295
25 Side A .31 .19 .41Side B .33 .18 .41Ave. .32 .185 .41
50 Side A .49 .28 .55Side B .51 .29 .65
Ave. .50 .285 .60
75 Side A .65 .37 .89Side B .66 .34 .87Ave. .655 .355 .88
100 Side A .79 .42 1.09Side B .81 .42 1.07Ave. .80 .42 1.08
D-3-11
MCDONNELL DOUGLAS ASTRONAUTCS COMPANY.V EAST
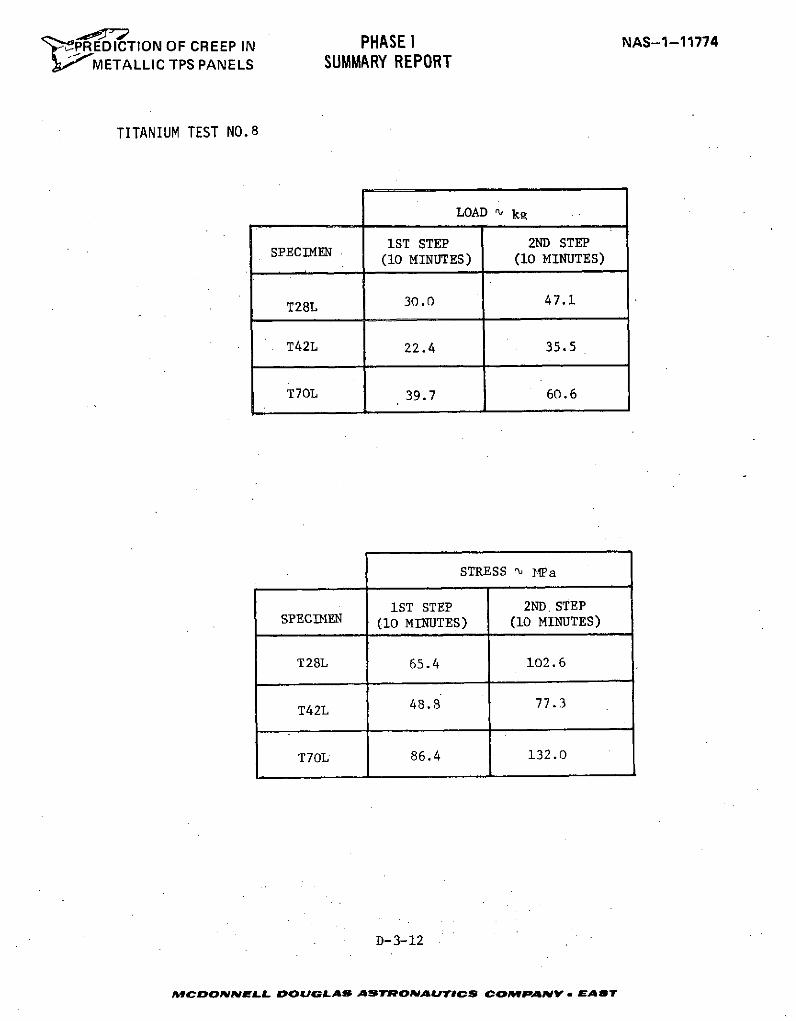
PREDICTION OF CREEP IN PHASE I NAS-1-11774
METALLIC TPS PANELS SUMMARY REPORT
TITANIUM TEST NO.8
LOAD "- kg
1ST STEP 2ND STEP(10 MINUTES) (10 MINUTES)
T28L 30.0 47.1
T42L 22.4 35.5
T7OL 39.7 60.6
STRESS ul MPa
1ST STEP 2ND STEPSPECIMEN (10 MINUTES) (10 MINUTES)
T28L 65.4 102.6
T42L 48.8 77.3
T70L 86.4 132.0
D-3-12
MrCDONNELL DOUGLAS ASTROMAJUTICS COMPANY V EAST
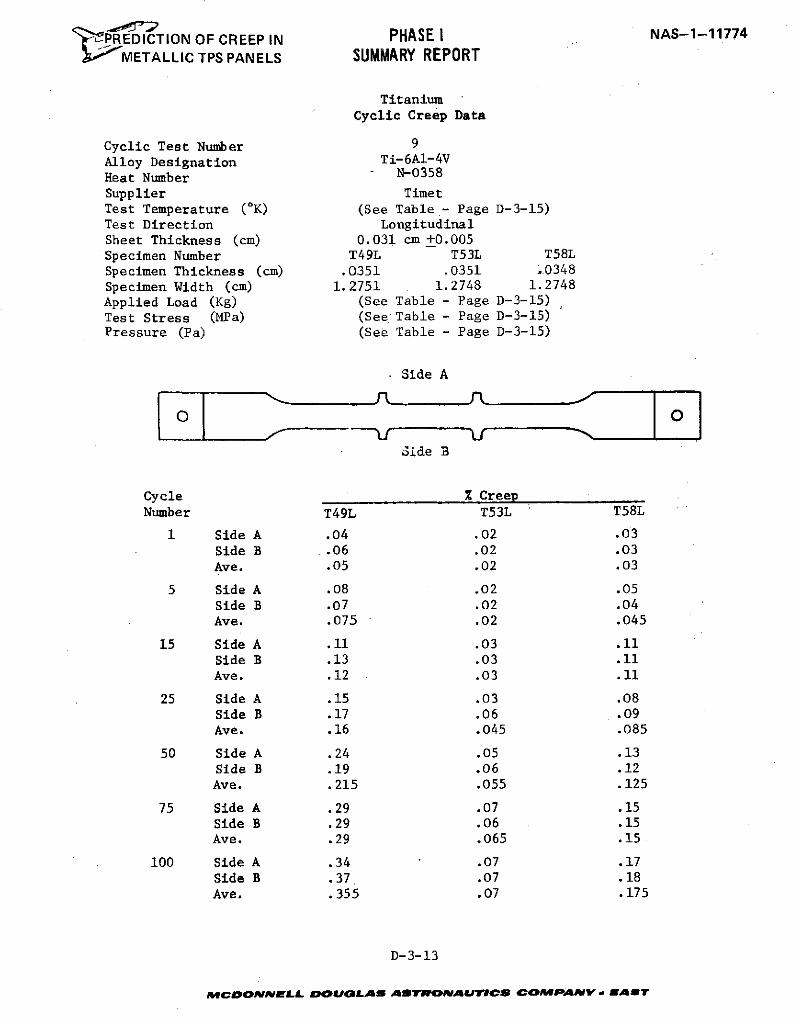
' PREDICTION OF CREEP IN PHASE I NAS-1-11774
2,,METALLIC TPS PANELS SUMMARY REPORT
Titanium
Cyclic Creep Data
Cyclic Test Number 9
Alloy Designation Ti-6AI-4V
Heat Number N-0358
Supplier TimetTest Temperature (OK) (See Table - Page D-3-15)Test Direction LongitudinalSheet Thickness (cm) 0.031 cm +0.005Specimen Number T49L T53L T58L
Specimen Thickness (cm) .0351 .0351 1.0348
Specimen Width (cm) 1.2751 1.2748 1.2748
Applied Load (Kg) (See Table - Page D-3-15)
Test Stress (MPa) (See Table - Page D-3-15)Pressure (Pa) (See Table - Page D-3-15)
Side A
Side B
Cycle % CreepNumber T49L T53L T58L
1 Side A .04 .02 .03
Side B .06 .02 .03
Ave. .05 .02 .03
5 Side A .08 .02 .05
Side B .07 .02 .04
Ave. .075 .02 .045
15 Side A .11 .03 .11
Side B .13 .03 .11
Ave. .12 .03 .11
25 Side A .15 .03 .08
Side B .17 .06 .09
Ave. .16 .045 .085
50 Side A .24 .05 .13
Side B .19 .06 .12Ave. .215 .055 .125
75 Side A .29 .07 .15Side B .29 .06 .15Ave. .29 .065 .15
100 Side A .34 .07 .17Side B .37 .07 .18Ave. .355 .07 .175
D-3-13
AMCDONELL DOUOGLA ASwRONAUTICr COMPANV EAsTr
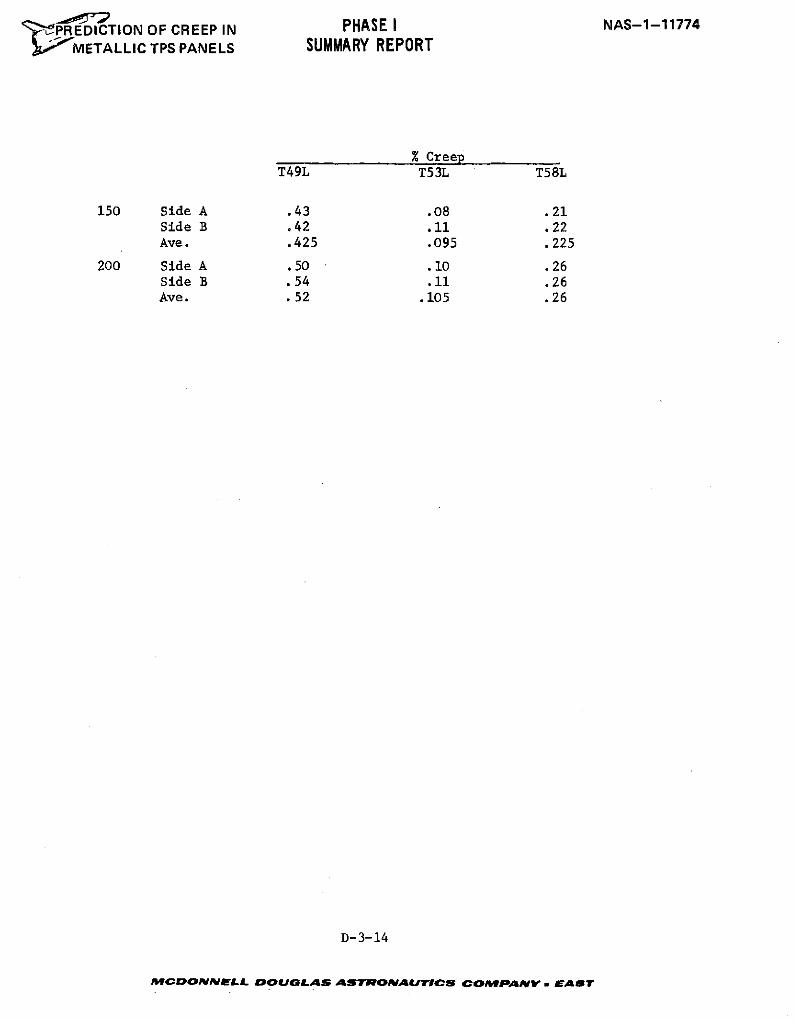
' OP REDICTION OF CREEP IN PHASE I NAS-1-11774
SMETALLIC TPS PANELS SUMMARY REPORT
% CreepT49L T53L T58L
150 Side A .43 .08 .21Side B .42 .11 .22Ave. .425 .095 .225
200 Side A .50 .10 .26Side B .54 .11 .26Ave. .52 .105 .26
D-3-14
fMCDONNELL DOUGLAS ASTRONAUTICS COAomPAINV . EAST
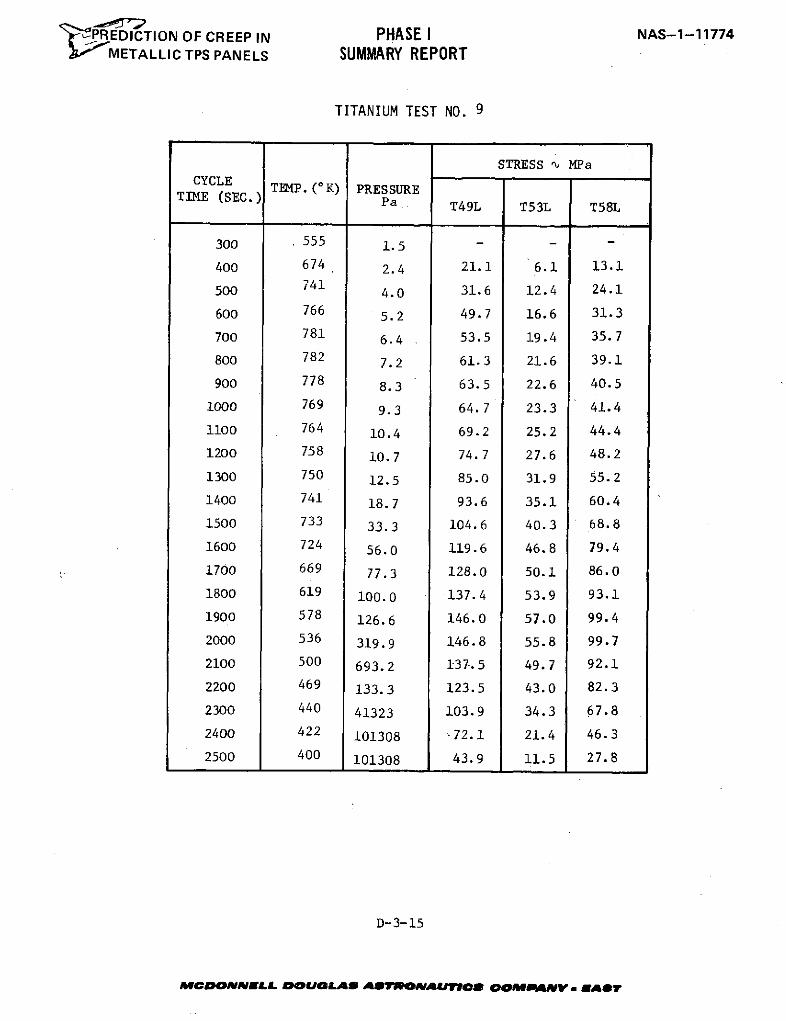
"~rPREDICTION OF CREEP IN PHASE I NAS-1-117742' METALLIC TPS PANELS SUMMARY REPORT
TITANIUM TEST NO. 9
STRESS r MPaCYCLECYCLE TEMP.(oK) PRESSURE
TIME (SEC.) Pa T49L T53L T58L
300 555 1.5 - -
400 674 2.4 21.1 6.1 13.1
500 741 4.0 31.6 12.4 24.1
600 766 5.2 49.7 16.6 31.3
700 781 6.4 53.5 19.4 35.7
800 782 7.2 61.3 21.6 39.1
900 778 8.3 63.5 22.6 40.5
1000 769 9.3 64.7 23.3 41.4
1100 764 10.4 69.2 25.2 44.4
1200 758 10.7 74.7 27.6 48.2
1300 750 12.5 85.0 31.9 55.2
1400 741 18.7 93.6 35.1 60.4
1500 733 33.3 104.6 40.3 68.8
1600 724 56.0 119.6 46.8 79.4
1700 669 77.3 128.0 50.1 86.0
1800 619 100.0 137.4 53.9 93.1
1900 578 126.6 146.0 57.0 99.4
2000 536 319.9 146.8 55.8 99.7
2100 500 693.2 137.5 49.7 92.1
2200 469 133.3 123.5 43.0 82.3
2300 440 41323 103.9 34.3 67.8
2400 422 101308 -72.1 21.4 46.3
2500 400 101308 43.9 11.5 27.8
D-3-15
MCgo NNELL DOUQLAS ASTrONAVJyey OML AVY. mAr
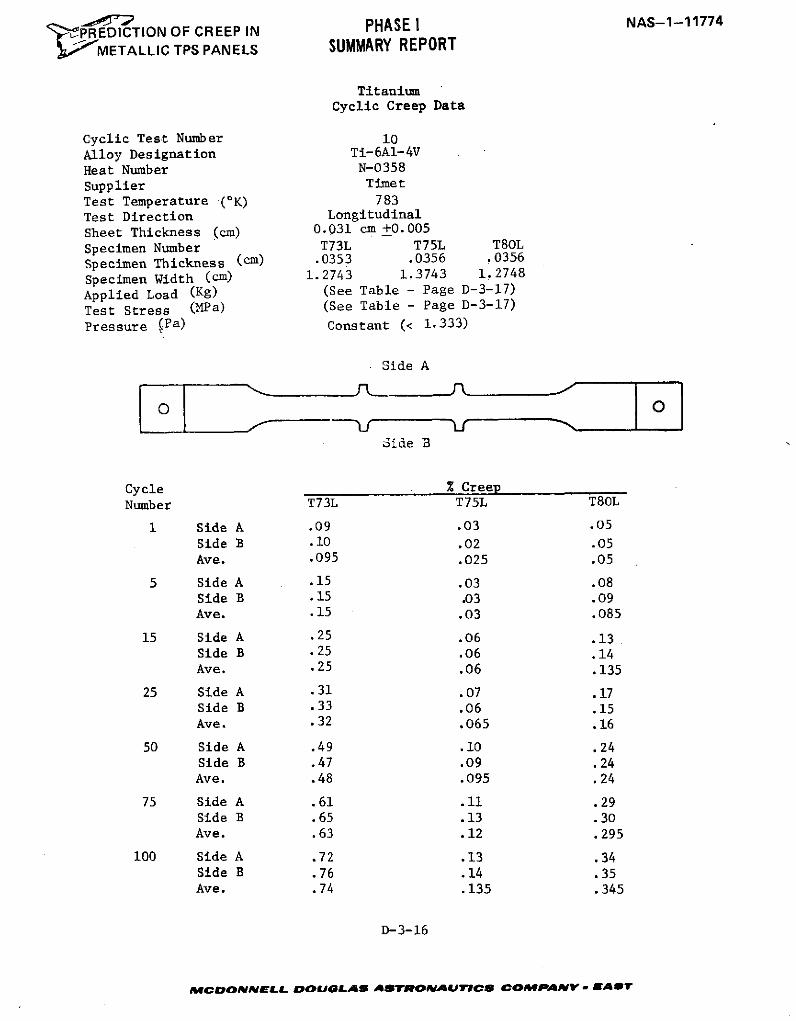
/-1. PHASE I NAS-1-11774',4PREDICTION OF CREEP IN
METALLIC TPS PANELS SUMMARY REPORT
TitaniumCyclic Creep Data
Cyclic Test Number 10Alloy Designation Ti-6A1-4VHeat Number N-0358Supplier TimetTest Temperature (OK) 783Test Direction Longitudinal
Sheet Thickness (cm) 0.031 cm +0.005
Specimen Number T73L T75L T80LSpecimen Thickness (cm) .0353 .0356 .0356
Specimen Width (cm) 1.2743 1.3743 1.2748
Applied Load (Kg) (See Table - Page D-3-17)
Test Stress (MPa) (See Table - Page D-3-17)
Pressure .Pa) Constant (< 1.333)
Side A
Side B
Cycle % Creep
Number T73L T75L T80L
1 Side A .09 .03 .05Side B .10 .02 .05Ave. .095 .025 .05
5 Side A .15 .03 .08Side B .15 .03 .09Ave. .15 .03 .085
15 Side A .25 .06 .13Side B .25 .06 .14Ave. .25 .06 .135
25 Side A .31 .07 .17Side B .33 .06 .15Ave. .32 .065 .16
50 Side A .49 .10 .24Side B .47 .09 .24Ave. .48 .095 .24
75 Side A .61 .11 .29Side B .65 .13 .30Ave. .63 .12 .295
100 Side A .72 .13 .34Side B .76 .14 .35Ave. .74 .135 .345
D-3-16
MCMDONNAELL DOUOLAZS ASTRONAULTICS COMPANV EAST
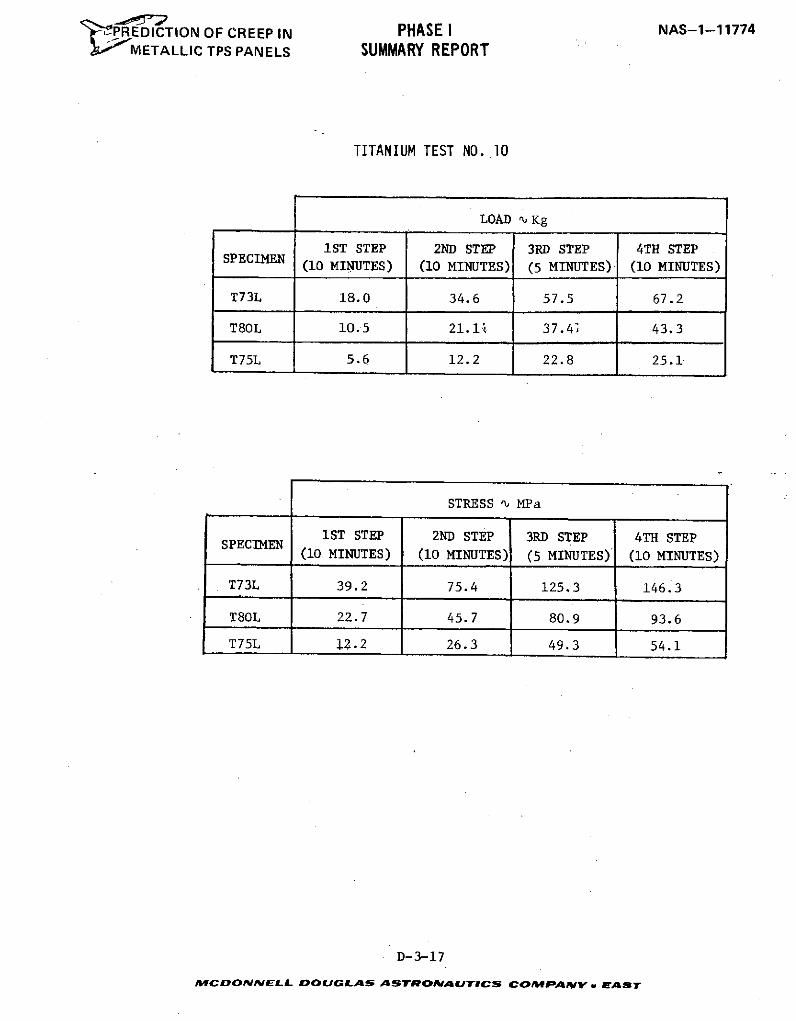
'-PREDICTION OF CREEP IN PHASE I NAS-1-11774l ,METALLIC TPS PANELS SUMMARY REPORT
TITANIUM TEST NO. .10
LOAD ,- Kg
1ST STEP 2ND STEP 3RD STEP 4TH STEP(10 MINUTES) (10 MINUTES) (5 MINUTES) (10 MINUTES)
T73L 18.0 34.6 57.5 67.2
T80L 10.5 21.11t 37.41 43.3
T75L 5.6 12.2 22.8 25.1
STRESS % MPa
1ST STEP 2ND STEP 3RD STEP 4TH STEPSPECIMEN(10 MINUTES) (10 MINUTES) (5 MINUTES) (10 MINUTES)
T73L 39.2 75.4 125.3 146.3
T80L 22.7 45.7 80.9 93.6
T75L 12.2 26.3 49.3 54.1
D-3-17
MCDONNELL DOUGLAS ASTRONAUTICS COMPANYV EAST
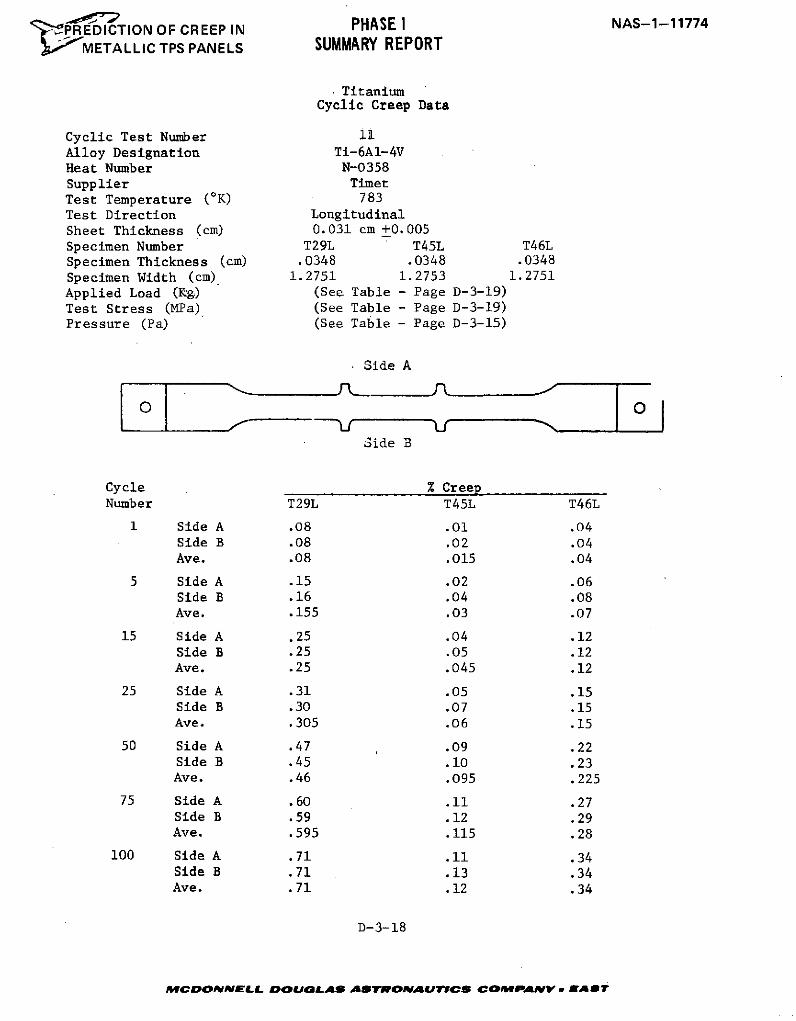
RPREDICTION OF CREEP IN PHASE I NAS-1-11774
METALLIC TPS PANELS SUMMARY REPORT
TitaniumCyclic Creep Data
Cyclic Test Number 11Alloy Designation Ti-6Al-4VHeat Number N-0358Supplier TimetTest Temperature (oK) 783Test Direction LongitudinalSheet Thickness (cm) 0.031 cm +0.005Specimen Number T29L T45L T46LSpecimen Thickness (cm) .0348 .0348 .0348Specimen Width (cm) 1.2751 1.2753 1.2751Applied Load (Kg) (See Table - Page D-3-19)Test Stress (MPa) (See Table - Page D-3-19)Pressure (Pa) (See Table - Page D-3-15)
Side A
0 O
Side B
Cycle % CreepNumber T29L T45L T46L
1 Side A .08 .01 .04Side B .08 .02 .04Ave. .08 .015 .04
5 Side A .15 .02 .06Side B .16 .04 .08Ave. .155 .03 .07
15 Side A .25 .04 .12Side B .25 .05 .12Ave. .25 .045 .12
25 Side A .31 .05 .15Side B .30 .07 .15Ave. .305 .06 .15
50 Side A .47 .09 .22Side B .45 .10 .23Ave. .46 .095 .225
75 Side A .60 .11 .27Side B .59 .12 .29Ave. .595 .115 .28
100 Side A .71 .11 .34Side B .71 .13 .34Ave. .71 .12 .34
D-3-18
MCDONNELL DOIUOLAS ASTRONAUTICS COMPWANVV- WATr
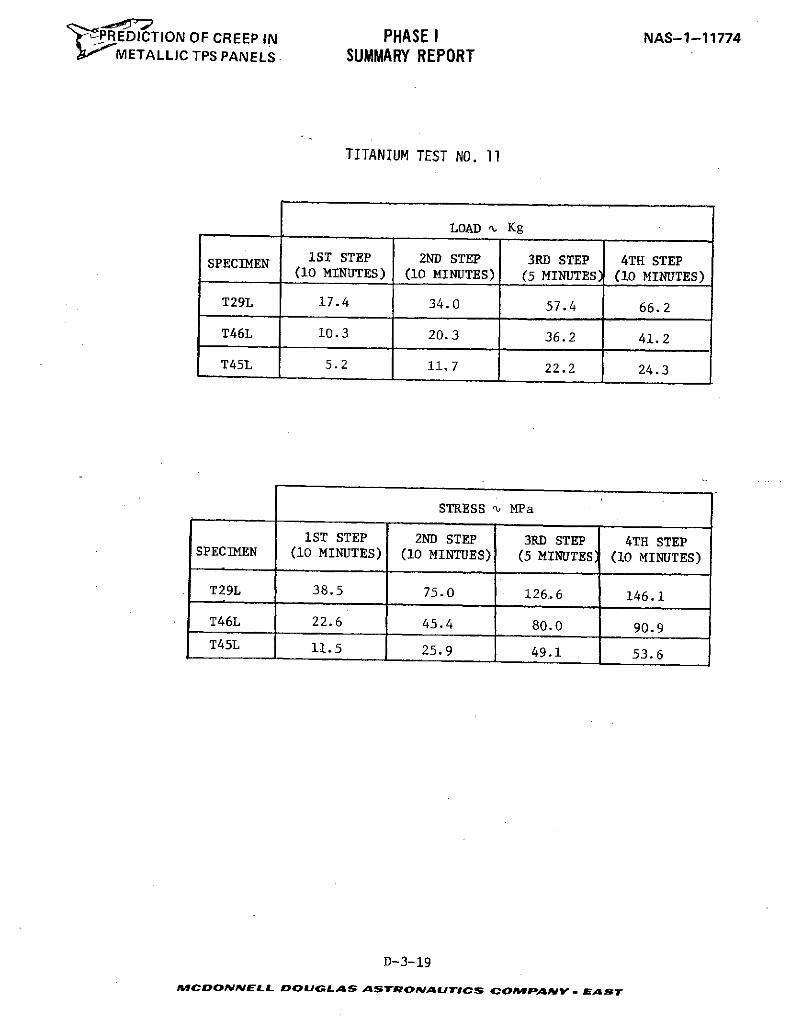
'rPREDICTION OF CREEP IN PHASE I NAS-1-11774METALLIC TPS PANELS. SUMMARY REPORT
TITANIUM TEST NO. 11
LOAD , Kg
SPECIMEN IST STEP 2ND STEP 3RD STEP 4TH STEP(10 MINUTES) (10 MINUTES) (5 MINUTES) (10 MINUTES)
T29L 17.4 34.0 57.4 66.2
T46L 10.3 20.3 36.2 41.2
T45L 5.2 11.7 22.2 24.3
STRESS u MPa
1ST STEP 2ND STEP 3RD STEP 4TH STEPSPECIMEN (10 MINUTES) (10 MINTUES) (5 MINUTES (10 MINUTES)
T29L 38.5 75.0 126. 6 146.1
T46L 22.6 45.4 80.0 90.9T45L 11.5 25.9 49.1 53.6
D-3-19
tMCDONNELL DOUGLAS ASTRONAUTICS COIMPANYv EAST

7PREDICTION OF CREEP IN PHASE I NAS-1-11774METALLIC TPS PANELS SUMMARY REPORT
APPENDIX E-1
RENE' 41 LITERATURE SURVEY CREEP DATA
E-1-1
AMCDONNELL DOIUGLAS ASTRONAUTICS COmPAavy - EASr
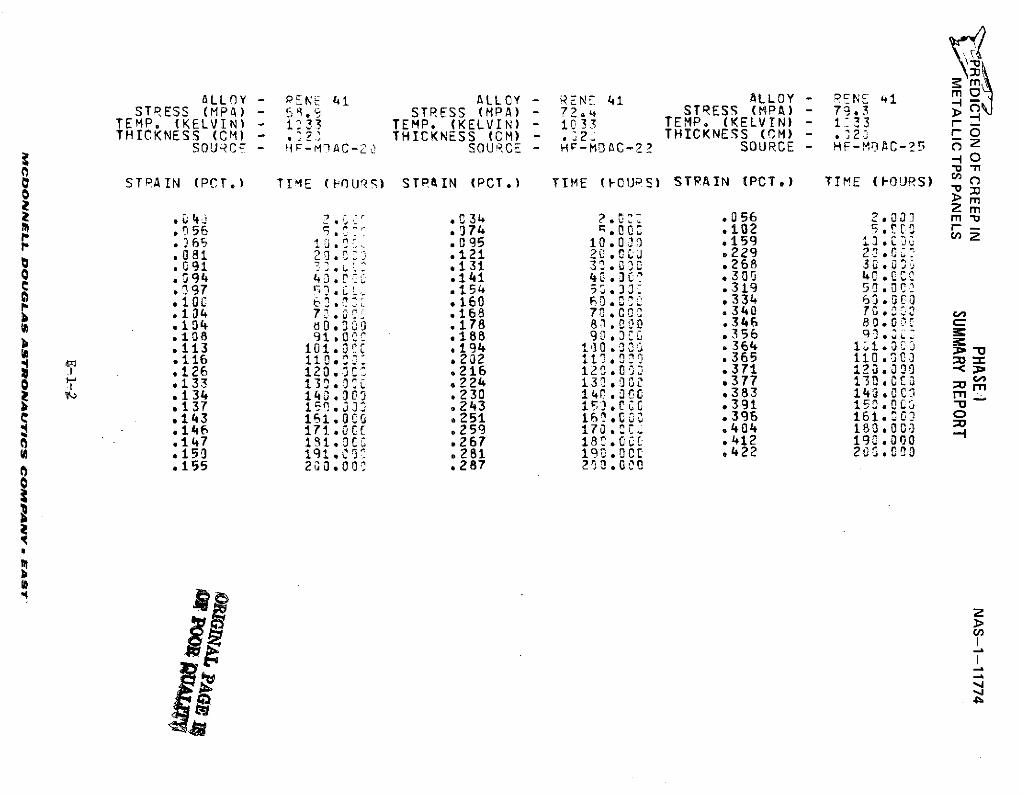
OLLOY -- ENE 41 ALLOY - RCNE 41STRESS (MPg) - STRESS (MPA) - 72.4 STRESS (MPA) - 79.3 >
TEMP. (KELVIN) - 1:33 TEMP. (KELVIN) - 1033 TEMP. (KELVIN) - 1,33THICKNESS (CM) - .32 THICKNESS (CM) - .2 THICKNESS (CM) - . O
SOURCE - HF-M AC-2 SOURCE - HF-MDAC-2 SOURCE - HF-MDAC-?5 0 z0 O
P STPAIN (PCT.) TIME (fOURS) STP8IN (PCT.) TIME (PCURPS) STRAIN (PCT.) TIME (POURS) o> m
z 0? 43 .0:: .056 .03. mmM 56 ... 37 <.00 *102 5.•74 0 -• 65 10i .095 10.000 .159 .0,C.081 . .121 20. CJ .229 2.C6-.091 I. .131 33.00 .268 30.0',
S.094 45C .141 40.0C' .300 4C.CC• 797 5?. L. .154 5,.30 .319 50.OC.10 6l .160 0 ,.,- .334 60.303.104 7 .168 74.CO 340 70..104 60. 00 .178 8. 0 .346 80.0-.108 91.0 .188 90.30 .356.113 101 o.J .194 110.30 .364 101. I
ol.116 110.: .202 113.0 0 .365 110 .31.126 120.3, .216 120.00 *,371 120.' a0 _
O .133 13 .0:- .224 1330,2 .377 130. Or m.134 140.303 .230 14r0.30 .383 1403. CI m
b .137 1 a .01. .243 1F3.)*C .391 150.00 -C-e .143 161.000 .251 16i.0% .396 161.30 c
.146 171.00% .259 170.3% .404 180.00 a
.14,7 181.C .267 18S.00 .*412 190.000
.150 191. C .281 190. 00 *422 20. .0
.155 200.00 .287 20 .0O0
now z
s-a
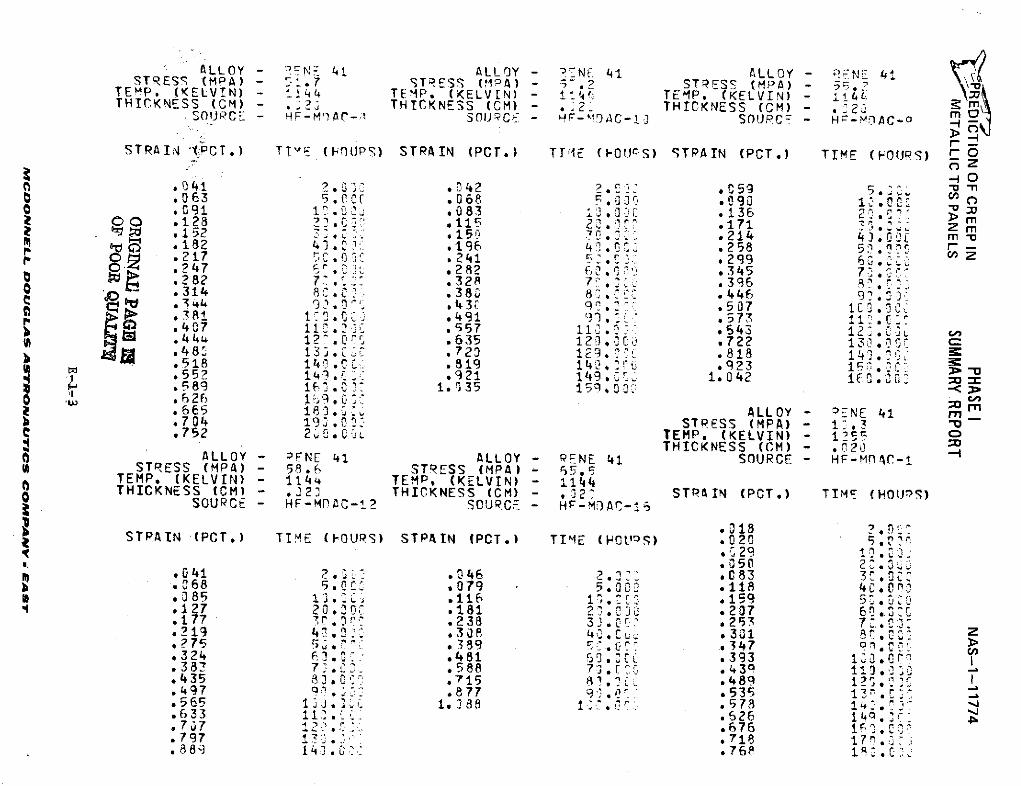
ALLOY - N 41 ALLOY - NE 41 ALLOY - N_ ISTRESS (MPA) .7 STAE ( ) - STRESS (MPA) - 5
TEMP. (KELVIN) - 1144 TEMP, (KELVIN) - 1Yt TEMP. (KELVIN) - I 14,THICKNESS (CM) - ,2 THICKNESS (CM) - . 2 THICKNESS (CM) - 2SOURCE - HF-MrAC- SOURC - HE-ADAC-1 SORC - H.- MDAC-9
STRAIN TPCT.) TT-E (OU'P) STRAIN (PCT.) TIT'E (1FOiOS) STRAIN (PCT.) TIME (FOUfS) O0" -- O
o .)41 6 .42 C.9 5 -a -n.063 5. VC .068 , J90 i ~
..091 1 . .083 0.0 .136 2 •.00o .128 0r .115 r; .171 m* 152 'IV 1. 150 0. .214 4 rn -.182 41,1 , .196 4. .258 -
,217 241 5 .• .299 63•* 47 .. 282 C. .345 7.* 282 7. 328 71 .396
0 .314 8.• .38U 8L. .446 9*34 30. 44 .43C 9 .2 .507 lco.c".. 381 1 - .. *491 99, .573 1 ..407 11 .557 511 .643 12.c0.444 12..0o .635 120, .722 130 .483 i•. C .729 129. .818l ".It 518 14,j e< .819 140. .923 1 -.
1 .55? 1.. 921 149 .0 1.042 16.02a C .589 1 . 1. 31 35 19-00 1'<1 .626 1lA rnC
.665 183. " ALLOY - ENE 41 m
.704 193.02 STRESS (MPA) - 1 .3 -S.752 2*5. C- TEMP. (KELVIN) 125
THICKNESS (CM) - .020ALLOY - PENE 41 ALLOY - RENE 41 SOURCE - HF-MlIC-1
STRESS (MPA) - 58. STRESS (MPA) *- 65.TEMP. (KELVIN) - 1144 TEMP, (KELVIN) - 1144THICKNESS (CM) - .23 THICKNESS (CM) - . 2; STRAIN (PCT.) TIME (HOU'S)
SOURCE - HF-MPAC-12 SOUPRC = - HF-MDAC-15
STRAIN (PCT.) TIME (-OURS) STRAIN (PCT.) TIME ()0Ot'S) .020 ..*29 1.150 2 .3,
.041 2 .046 2. .083 3 .0b .68 5. .079 5 000 .118 4. n'S.385 .1. 116 1.0 .159 5 •O0
*127 20 .00? .181 2.. 207 6 r.177 r . 00 .238 3 • a .253 7 .c0.219 4 2 . 308P, 4 . , 301 8 •. n, z.?75 5 389 F'" .347 . G,324 F.. .481 ;0:.' .393 1 0., r '.387 71.,3 .588 73. .43.435 83. .15 8.7. .489.497 o0. - .877 9 .0' .535 13. .r.565 130,l 1.,88 .578 14 . '
.633 1 . i•526 14 . r
.707 12 .676 1
.797 .718 17,.
.889 143. .", .76f8 1 .
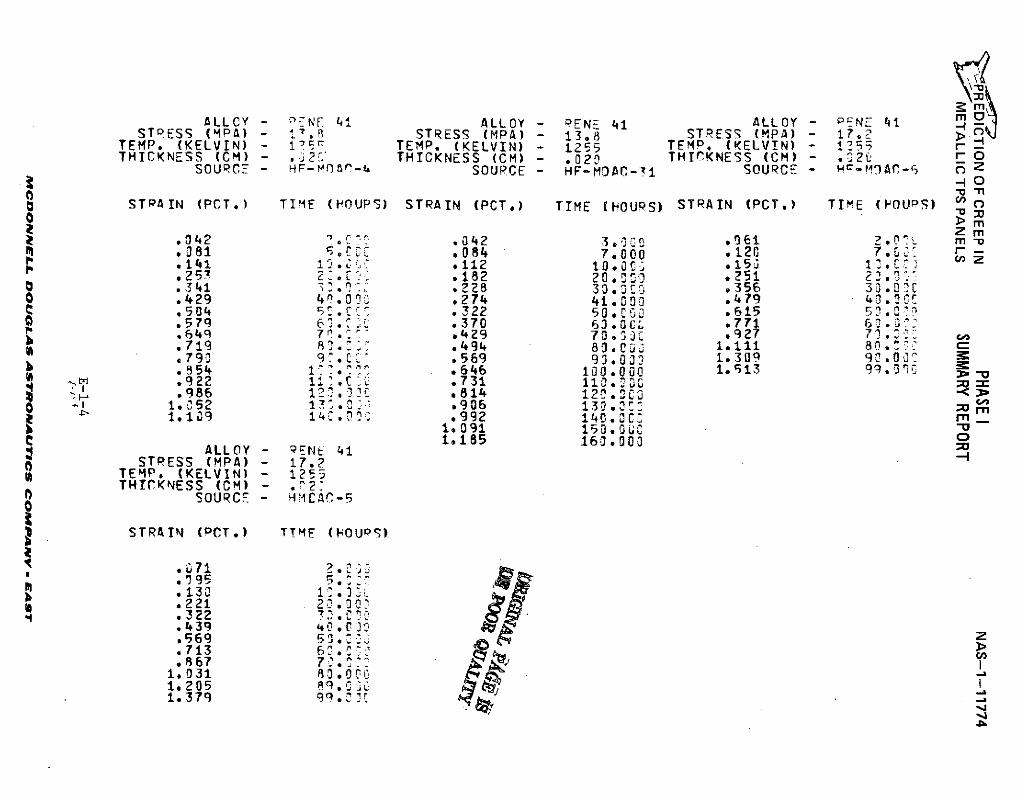
ALLOY - 0NF (1 ALLOY - PENE 41 ALLOY - P1NE 41 m 0STRESS (MPA) - . STRESS (MPA) - 13.8 STRESS (MPA) - 17.2 > 0
TEMP. (KELVIN) - 1?E TEMP. (KELVIN) - 255 TEMP. (KELVIN) - 125 rTHICKNESS (CM) - .&2 THICKNESS (CM) - .020 THICKNESS (CM) - 20 O
SOURCE - HF-MOAI,-4 SOURCE - HF-MDACr-:~ SOURCE - H-MAr-5 C z- O
STRAIN (PCT.) TIME (HOUPS) STRAIN (PCT.) TIME (HOURS) STRAIN (PCT.) TIME (FOULS)
Z m.342 ,•t .042 3.0 .061 .• , m -l.81 5.•r; .084 7.000 .120 7.".141 .112 1o.00 .15 i.. Z.257 2 .- • .182 20.OZ *251 :..341 228 30 356 30.0.429 40.01 .274 41. 00 .479 430~..504 5 .322 50.0 615.579q • .370 63.o0C .771 6.549 7•" .429 70. O .927 7 :.719 .494 800 1.111.790 9.~ .569 93.002 1.309 92.o0.854 1i'.*' .646 100.000 1.513 990A.922 1 C .731 1 0.0.986 123 ' .814 120.0 18
1.052 1 .906 130.: m1.109 14 : .992 140.OC m
1.091 150.0601.185 160.0030
ALLOY - 9ENE 41 -STRESS (MPA) - 17.2
TEMP. (KELVIN) - 1255THICKNESS (CM) - .
SOURCE - WHCAC-5
STRAIN (DCT.) TTME (OUPS)
.- 71 72.,9g5 5. :.130 .0.221 20.0 "
.322 37,
.439 4.0 z
.569 5Jc
.713 6
.867 7 11.031 80.0 -a1.205 t9.1.379 go.000
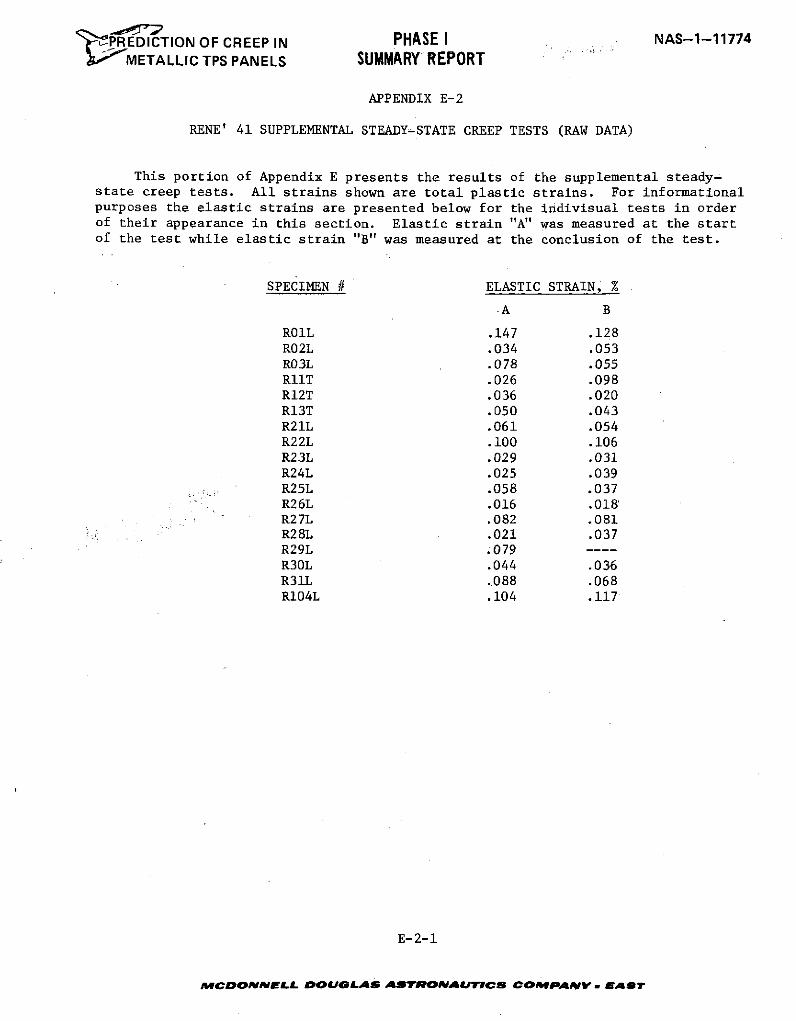
REDICTION OF CREEP IN PHASE I NAS-1-11774V 50METALLIC TPS PANELS SUMMARY REPORT
APPENDIX E-2
RENE' 41 SUPPLEMENTAL STEADY-STATE CREEP TESTS (RAW DATA)
This portion of Appendix E presents the results of the supplemental steady-state creep tests. All strains shown are total plastic strains. For informationalpurposes the elastic strains are presented below for the indivisual tests in orderof their appearance in this section. Elastic strain "A" was measured at the startof the test while elastic strain "B" was measured at the conclusion of the test.
SPECIMEN # ELASTIC STRAIN, %
-A B
R01L .147 .128R02L .034 .053R03L .078 .055R11T .026 .098R12T .036 .020R13T .050 .043R21L .061 .054R22L .100 .106R23L .029 .031R24L .025 .039R25L .058 .037R26L .016 .018'R27L .082 .081R28L .021 .037R29L .079R30L .044 .036R31L .088 .068R104L .104 .117
E-2-1
MCDONNELL DOUGLAS ASr~RO AUJTIC COMPAP4V N EAST
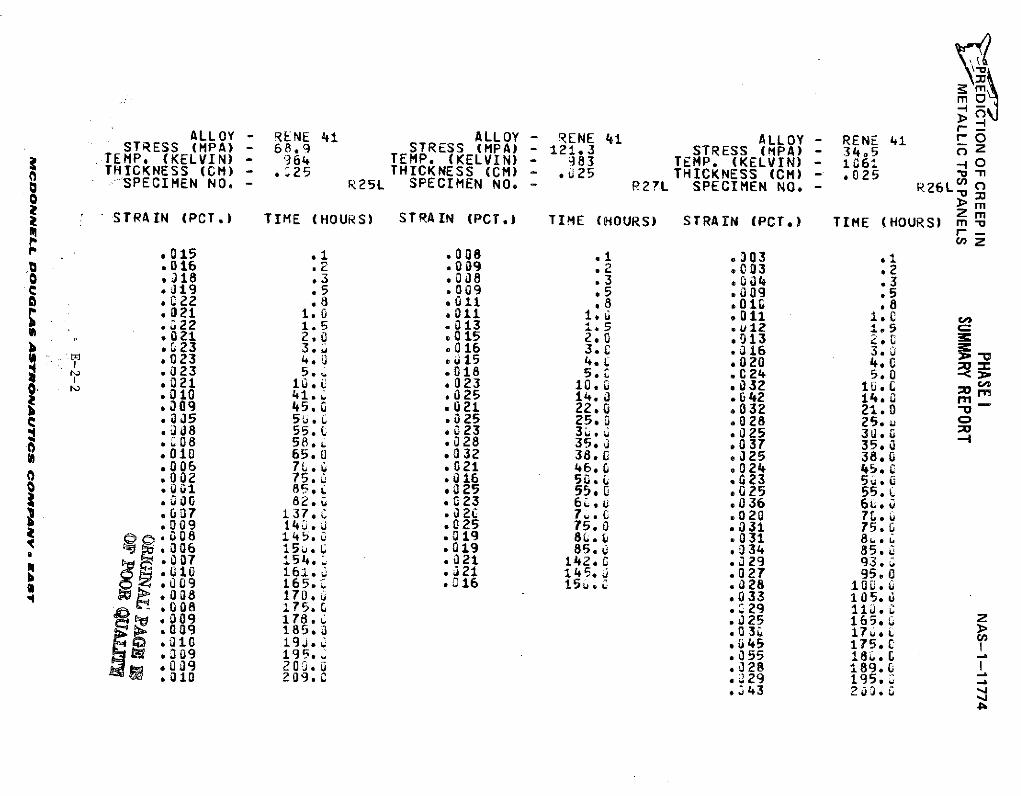
r--
ALLOY - RENE 41 ALLOY - RENE 41 ALLOY - RENE 41 rOSTRESS (MPA) - 68,9 STRESS (MPA) - 121.3 STRESS (MPA) - 3405 8 Z
TEMP. (KELVIN) - 964 TEMP. (KELVIN) - 983 TEMP. (KELVIN) - 1061 - 0THICKNESS (CM) - .'25 THICKNESS (CM) - .u25 THICKNESS (CM) - .025 -nSSPECIMEN NO. - R25L SPECIMEN NO. - P27L SPECIMEN NO. - 6Leo M
> ZmSTRAIN (PCT.) TIME (HOURS) STRAIN (PCT.) TIME (HOURS) STRAIN (PCT.) TIME (HOURS) m
* .015 .1 .008 .1 .303 .1.016 .2 .009 .2 .003 .2
0 .318 .3 .0J8 .3 .004 .3C .019 .5 .009 .5 .009 .5O .022 .8 .011 .8 .010 .8
.021 1.0 .011 1.0 .011 1..322 1.5 .013 i.5 .u12 1.5
.021 2.0 .015 2.0 .013 2.V.023 3. .016 3.0 .016 3.0(A.023 4.0 .015 4. .020 4.0*023 5.1 .018 5.c .024 5.0S021 10. C .023 10,0 .032 10.0.010 41.1 .025 14.J .642 14.0.009 45e. .021 22.0 .032 21.0 --.05 5,.. .025 25.0 .028 25.1.08 55.L .023 3..o .025 30.0.08 5 8 .* .028 35 . .037 35.0.010 65.0 .032 38.0 .025 38.0.006 7L. .021 46.0 .024 45..002 75.. .016 50,0 .0G23 5 .*l001 8 59i .225 55.3 .025 55.C. 00 82.C .023 6Z. .036 6u.0.037 137., .020 7.*L .020 7L..009 14.; .025 75.0 .031 75.G*008 145.0 .019 8L.0 .031 8..1i .006 15.GL .019 85. .034 85. L
F .007 154. . .021 142. 0 .29 93. ,161.1; .321 145. ' .027 95.0
.009 165. i5u*15 .028 100,.
.008 170. .033 105.00 .08 175.0 .29 11i.c.*009 178.0 .J25 165. ;*009 185.3 .03L 17u#.>*oi0 19j. .145 175.0.309 195. .055 181;.6 --
009 20j.0 .028 189.02010 209. C .029 195.,
.343 2-3.W -i,.
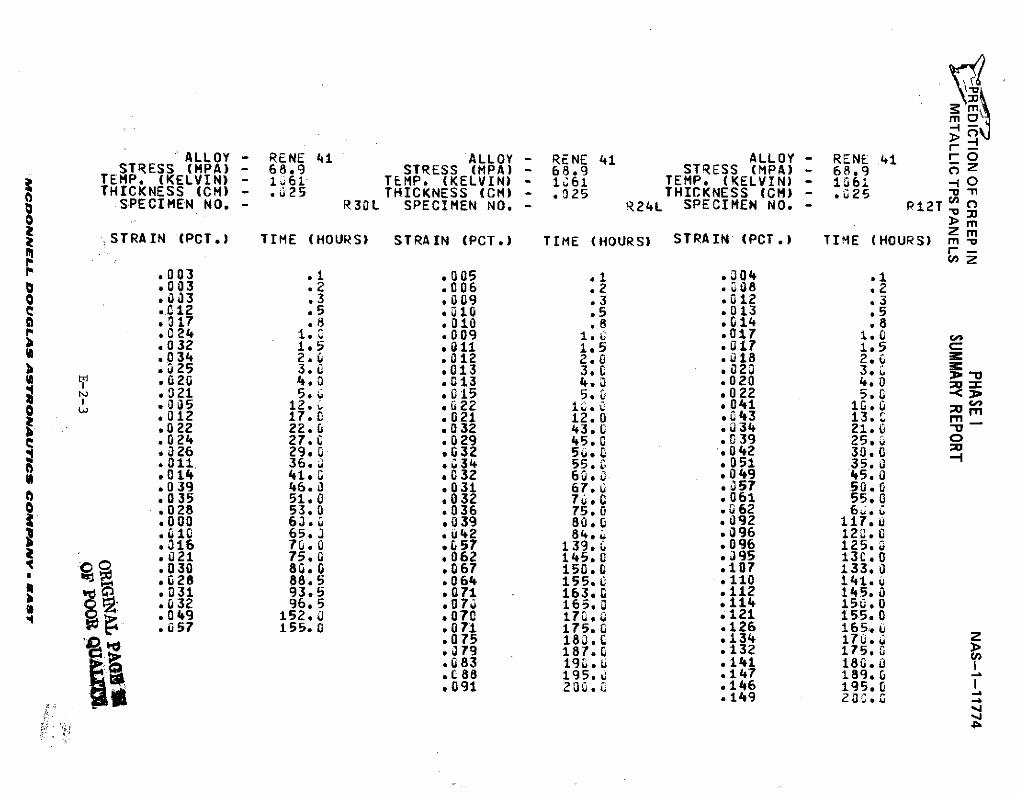
ALLOY - RENE 41 ALLOY - RENE 41 ALLOY- RENE 41 A - 689STRESS (HPA) 68.9 STRESS (MPA) - 689 STRESS (MPA) - 68.9 K z
TEMP. (KELVIN) - 1661 TEMP. (KELVIN) - 61ELVIN) 1061 - 0THICKNESS (CM) - .25 THICKNESS (CM) - .025 THICKNESS (CM) - .025 Q
SPECIMEN NO. - R30L SPECIMEN NO. R24L SPECIMEN NO. Ri2mT
Z m,STRAIN (PCT.) TIME (HOUS) STRAIN (PCT.) TIME (HOURS) STRAIN (PCT.) TIME (HOURS) m m
.003 .1 .005 .1 .304 .1
.003 .2 .006 .2 .08 .2o .3 3 .3 .009 .3 .012 .3
S.Ci12 .5 .010 .5 .013 .53 .17 .8 .010 .8 .014 .8
*024 1.3 .009 .017 1.0.032 1.5 .0 1.5 .017 1.5 c.034 2,C .012 2.0 .G18 2. m.025 3.6 .013 3.0 .023 3.L.020 4.0 .013 4.J .020 4.0.021 5.1 .015 5.0 022 5.0
005 12*1; .022 . *041 13.0 m ,,S.012 17.0 .021 12.0 .043 13. m,.022 22.0 .032 43.0 .034 21.0.024 27.0 .029 45.0 .039 25. 0.326 29.0 .032 5U.0 .042 30.0 4.011 36.; .u34 55.i .051 35..014 41.0 .032 60.0 .049 45.0.039 46.0 .031 67.0 .057 50.0.035 51.0 .032 7.0 .061 55.0.028 53.0 .036 75.0 .062 60..000 60.3 .039 80.0 .092 117..010 65.3 .042 84. .096 123.0.816 70.0 .057 139, .096 125.0.021 75.0 .062 145.0 .95 130.0
0 .030 80.0 .067 150.0 .107 133.0.028 88.5 .064 155. .110 141.u
b .031 93.5 .071 - 163.0 .112 145.* - .032 96.5 .O07 165, .3i 150.0
0 .049 152.0 .070 170.0 .121 155.0.057 155.0 .071 175.0 .126 165. z
.075 183.0 .134 170.3 >
.0379 187.0 .132 175.0
.083 19.u .141 180.0
.088 195. .147 189.0
.091 200,0 .146 195.0.149 200.G
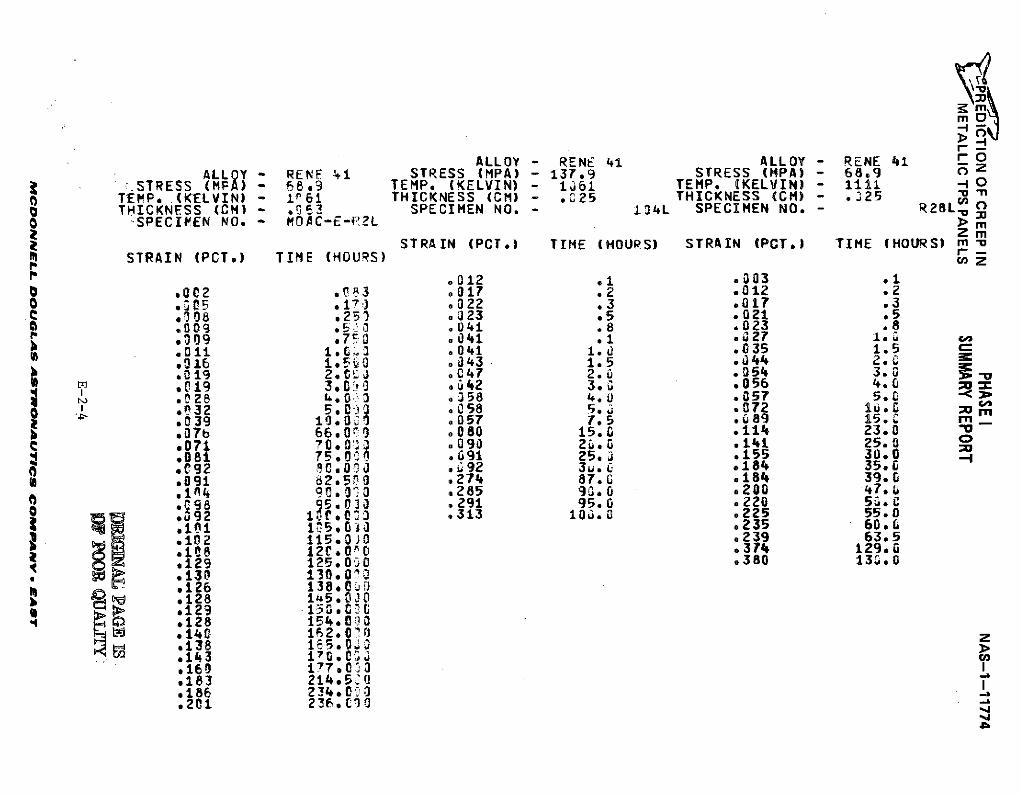
ALLOY - RENE 41 ALLOY - RENE 41 rOALLOY - RENE 41 STRESS (MPA) - 137.9 STRESS (MPA) - 68.9 z
- STRESS (MFA)- 68.9 TEMP. (KELVIN) - 161 TEMP. (KELVIN) - 1111 -TEMP .(KELVIN) - 161 THICKNESS (CM) - .025 THICKNESS (CM) - .325 -THICKNESS (CM) -,S3 SPECIMEN NO. - 134L SPECIMEN NO. - R28L, -
O -SPECIPEN NO. - MOAC-E-(2L mZm
STRAIN (PCT.) TIME (HOURS) STRAIN (PCT.) TIME (HOURS) m -M STRAIN (PCT.) TIME (HOURS) Clz
.012 .1 .003 .1.002 .3 .017 .2 .012 .2
O .005 J7 .022 .3 .017 .3.008 .25) .J23 .5 *021 .5.009 .5" .041 .8 .023 .8.009 *750 .041 .1 0 27 10 oo.11 .041 1. .035 1.5.016 1.5L0 a343 - 1.5 w4 2.,
b .019 2.0C .047 2.0 054 3.0 rm .019 3.00 .~ 42 3.0 056 4.0
o028 4.0 3 .358 4,U .057 5.0o . .032 5.0 058 5, .072 liuC _o
. 39 19.0A .057 7.5 .089 15. n
.076 66.00 .080 15.0 .114 23.0C .071 70*05 .090 2 0. .141 25.0
.081 75.O) .691 25. .155 30.0o .092 09010J ."92 3u. *184 35.0
.091 62.5P0 .274 87.0 .184 39.0
.104 9D.030 *285 90.0 .200 47.98 95.00 .291 95.0 .220 SG.C
.92 1 0 a 03 0313 100.0 o225 55.0V.101 S *235 60.0
w .102 115.00 .239 63.5.108 120.00 .374 129.u.129 125.0,0 .380 13..0.131 130.0>).126 138. 0'J.128 145.030
U .129 150.0C0c.128 154.010*14 162.0 0.138 155.0 >.143 1c0.0C.160 177.00I.183 214.520.186 234.0)3.201 2?6.104
Ph
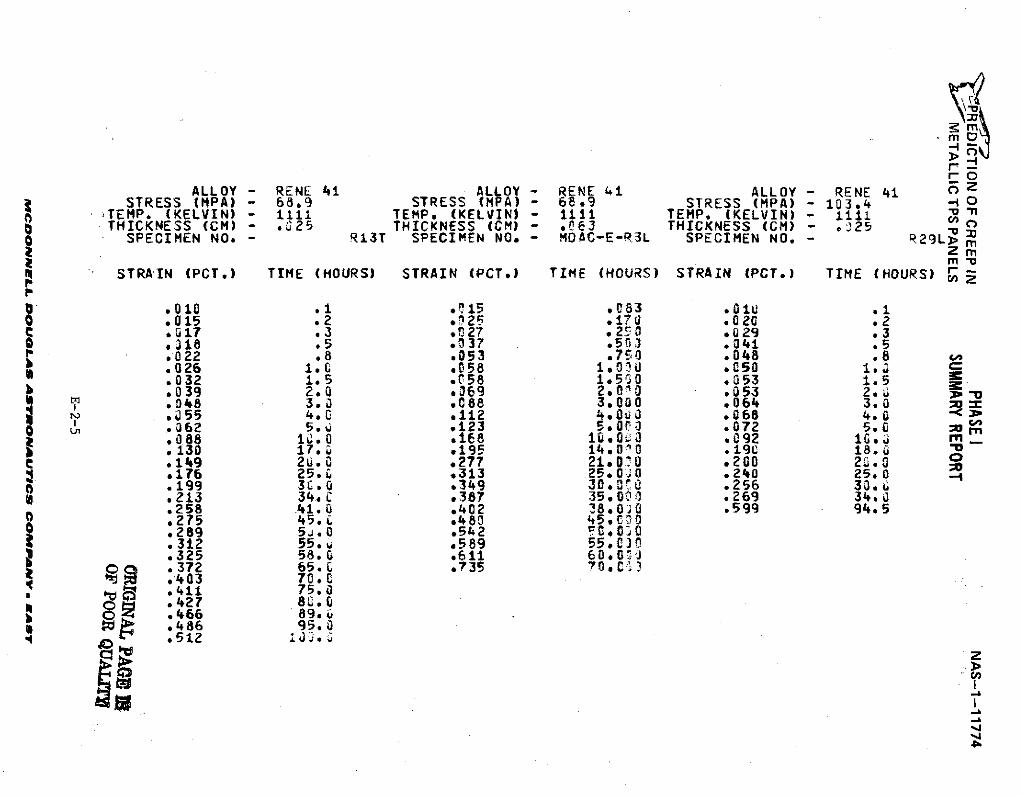
m
r-O
ALLOY - RENE 41 ALLOY - RENE 41 ALLOY - RENE 41 F 2STRESS (MPA) - 68.9 STRESS (MPA) 68.9 STRESS (MPA) - 103.4 -1 0
TEMP. (KELVIN) 1111 TEMP. (KELVIN) - iii TEMP. (KELVIN) - 1111 -nTHICKNESS (CM) - .25 THICKNESS (CM) - .63 THICKNESS (CM) - .25
SSPECIMEN NO. - R13T SPECIMEN NO. - MDAC-E-R3L SPECIMEN NO. - R29L> m
i mySTRAIN (PCT.) TIME (HOURS) STRAIN (PCT.) TIME (HOURS) STRAIN (PCT.) TIME (HOURS)
0 .010 .1 .* 1 5 .083 .010 .1O .015 .2 0925 .170 .020 .2C .017 .3 .027 .250 .029 .3
..018 .5 .037 .5 3 .041 .5:e .022 .8 .053 .750 .048 .8
b .026 1.0 .058 1.010 .050 1..032 1.5 .r58 1.50 .053 1.50 39 2.0 .369 2. 01 .053 2.
1 .048 3.0 .C88 3.000 .064 3.0.055 4.G .112 4.0 3 .068 4.0
§ .062 5. .123 5.0 01 .072 5.0.088 10.0 *168 10.000 .092 10.. 130 17. 195 14D10 .19c 18.
e .149 26.0 .277 21.0'0 .200 20.8S176 25., .313 25. 0 0 .240 25. 0
.199 3C.0 .349 30.00 .256 30.,
.213 34. C .387 35.0 .269 34.0
.258 41. 0 .402 38.0.0 .599 94.5
.275 45. .489 45.C0
.289 5j.0 .542 .0
.312 55.u .589 55.0cJ0
.325 58.0 .611 60.0 00 .372 65.C .735 7..
.403 70.
.411 75.0
.466 8 9 . ;W .486 950
.512 i.
z
",
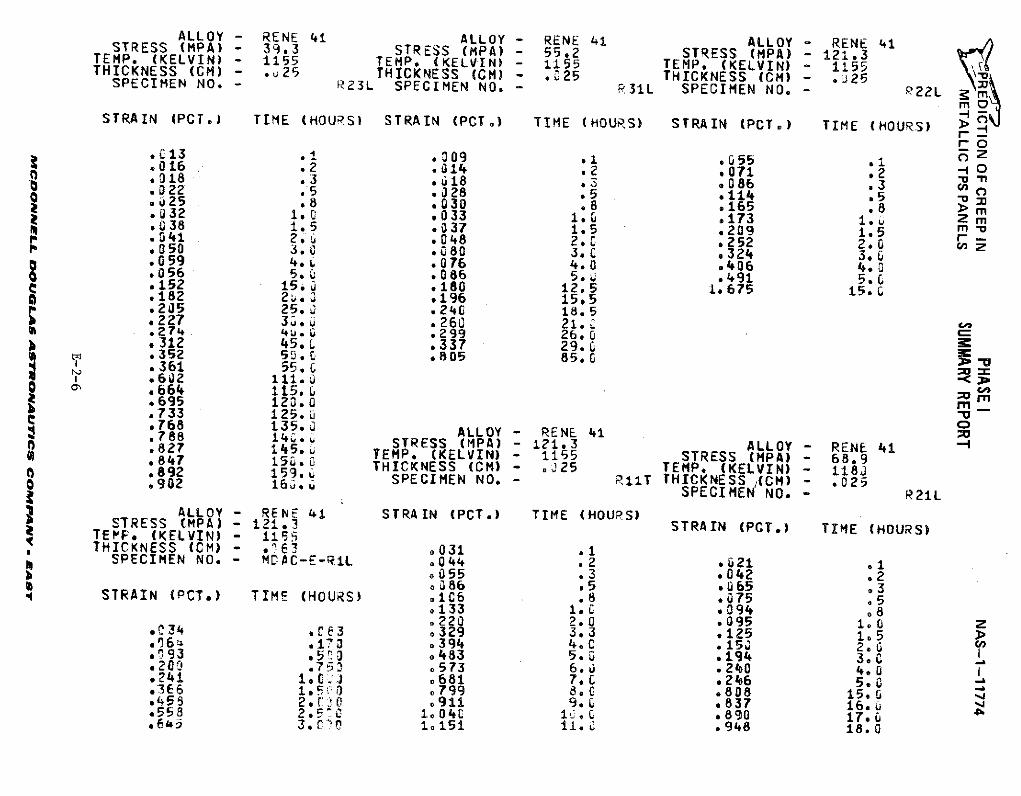
ALLOY - RENE 41 ALLOY - RENE 41 ALLOY - RENE 41STRESS (MPA) - 39.3 STRESS (MPA) - 55.2 STRESS (MPA) - 121.3TEMP. (KELVIN) - 1155 TEMP. (KELVIN) - 1155 TEMP. (KELVIN) - 1155THICKNESS (CM) - .25 THICKNESS (CM) - .025 THICKNESS (CM) - .25-SPECIMEN NO. - R23L SPECIMEN NO. - R31L SPECIMEN NO. - P22L
STRAIN (PCT.) TIME (HOURS) STRAIN (PCT.) TIME (HOURS) STRAIN (PCT.) TIME (HOURS)
r-.C13 31 .309 .1 .055 .1 0.016 .2 .014 .2 .071 .2 -nS018 .3 .018 .3 086 .3.022 .5 . 28 .5 .114 .5.25 .8 .030 .8 .165 .8 >..32 1.0 .033 1.0 .173 Z m.038 1.5 .037 1.5 .209 1.5 m-
S.041 2* .048 2.C .252 2.06P .050 3.0 . 80 3.0 .324 3.0.059 4.L .076 4.0 .406 4.S 056 5.0 .086 5. .491 5.0e .152 15.u .180 12.5 1.675 15.0.182 2.j .196 15.5p .205 25.0 .24 18.5
.227 3 ,.uj .260 21.Z
.274 4 .0 .299 26.0
.312 45.0 .337 29.'
.352 5o. E .805 85. 0.361 55. =
.6J2 111.^
.664 115.0
.695 1203.0
.733 1 25 . Ce768 13 5.0 ALLOY - RENE 41.788 14,. STRESS (MPA) - 121.3 ALLOY - RENE 41.827 145. TEMP. (KELVIN) - 1155 STRESS (MPA) - 68.9.847 15L.0 THICKNESS (CM) - .025 TEMP. (KELVIN) - 1183.892 15 9 .u SPECIMEN NO. - R11T THICKNESS (CM) - 025
SPECIMEN NO. - R21LALLOY - RENE 41 STRAIN (PCT.) TIME (HOURS)
STRESS (MPA) - 121.3 STRAIN (PCT.) TIME (HOURS)TEPFP (KELVIN) - 1151THICKNESS (CM) - . 031 .1
SPECIMEN NO. - DAC-E- RiL .044 .2 .U21 .10055 .3 .042 .2o o086 .5 .065 93STRAIN (PCT.) TIME (HOURS) 10C6 .8 .075 .5o133 1. .094 .8.220 2.0 .095 e 0 Z9034 .'3 o329 3.3 .125 1.5 >
. .. 394 4.0 .15k 2.0*093 .5 3 .483 5.0 .194 3.0.200 .753 .573 6 .u .240 4.0*241 1. J 0681 7.0 .246 5,3.366 1. 0 .799 8.0 .808 15. 0*459 2. 0 .911 9.0 837 16.*558 2.5" 1.040 1. .890 17 .6 3.0 151 11. .948 18.0
'tPREDICTION OF CREEP IN PHASE I NAS-1-11774M NETALLIC TPS PANELS SUMMARY REPORT
APPENDIX E-3
RENE' 41 CYCLIC CREEP TESTS
(RAW DATA)
This section presents the results of the 15 cyclic creep tests that were
performed on Rene' 41 tensile specimens.
E-3-1
MCDONNELL DOUGLAS ASTRONAUTICS COMPAMVIY AerT
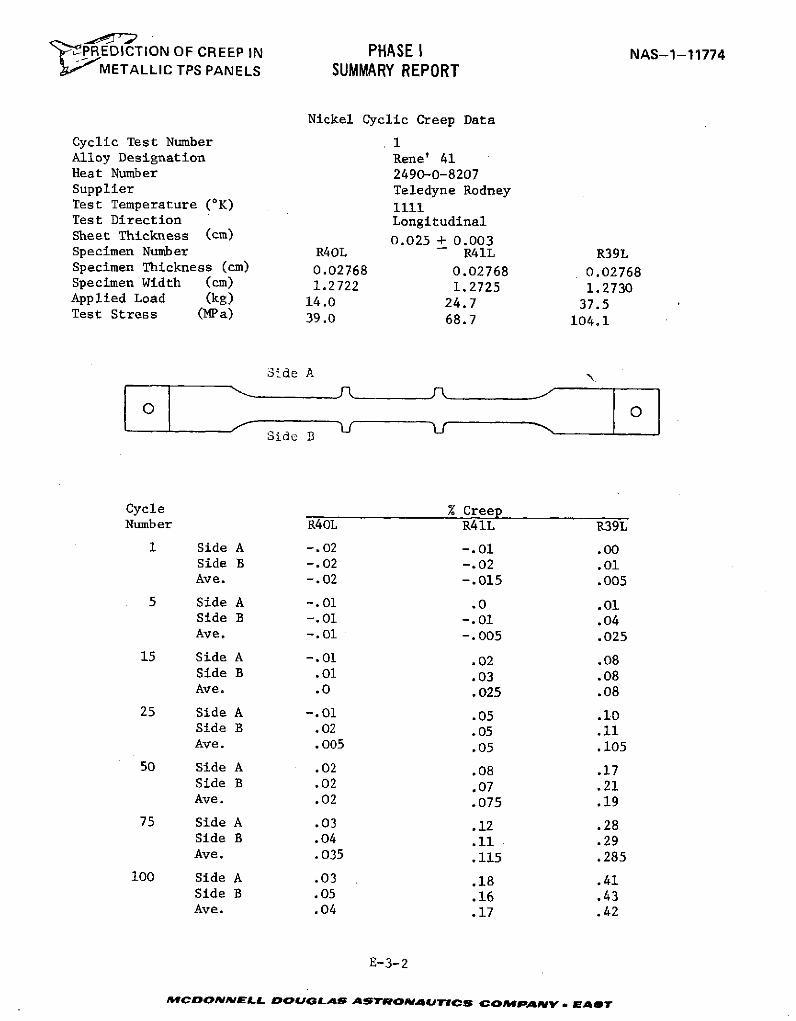
P"REDICTION OF CREEP IN PHASE I NAS-1-117742; METALLIC TPS PANELS SUMMARY REPORT
Nickel Cyclic Creep Data
Cyclic Test Number 1Alloy Designation Rene' 41Heat Number 2490-0-8207Supplier Teledyne RodneyTest Temperature (OK) 1111Test Direction LongitudinalSheet Thickness (cm) 0.025 + 0.003Specimen Number R40L R41L R39LSpecimen Thickness (cm) 0.02768 0.02768 0.02768Specimen Width (cm) 1.2722 1.2725 1.2730Applied Load (kg) 14.0 24.7 37.5Test Stress (MPa) 39.0 68.7 104.1
Side A
Side B 11
Cycle % CreepNumber R40L R41L R39L
1 Side A -.02 -.01 .00Side B -.02 -.02 .01Ave. -.02 -.015 .005
5 Side A -.01 .0 .01Side B -.01 -.01 .04Ave. -.01 -.005 .025
15 Side A -.01 .02 .08Side B .01 .03 .08Ave. .0 .025 .08
25 Side A -.01 .05 .10Side B .02 .05 .11Ave. .005 .05 .105
50 Side A .02 .08 .17Side B .02 ,07 .21Ave. .02 .075 .19
75 Side A .03 .12 .28Side B .04 .11 .29Ave. .035 .115 .285
100 Side A .03 .18 .41Side B .05 .16 .43Ave. .04 .17 .42
E-3-2
AMCDONNELL DOUGLAS ASTRONAUTICS eCOMPAVN - AST
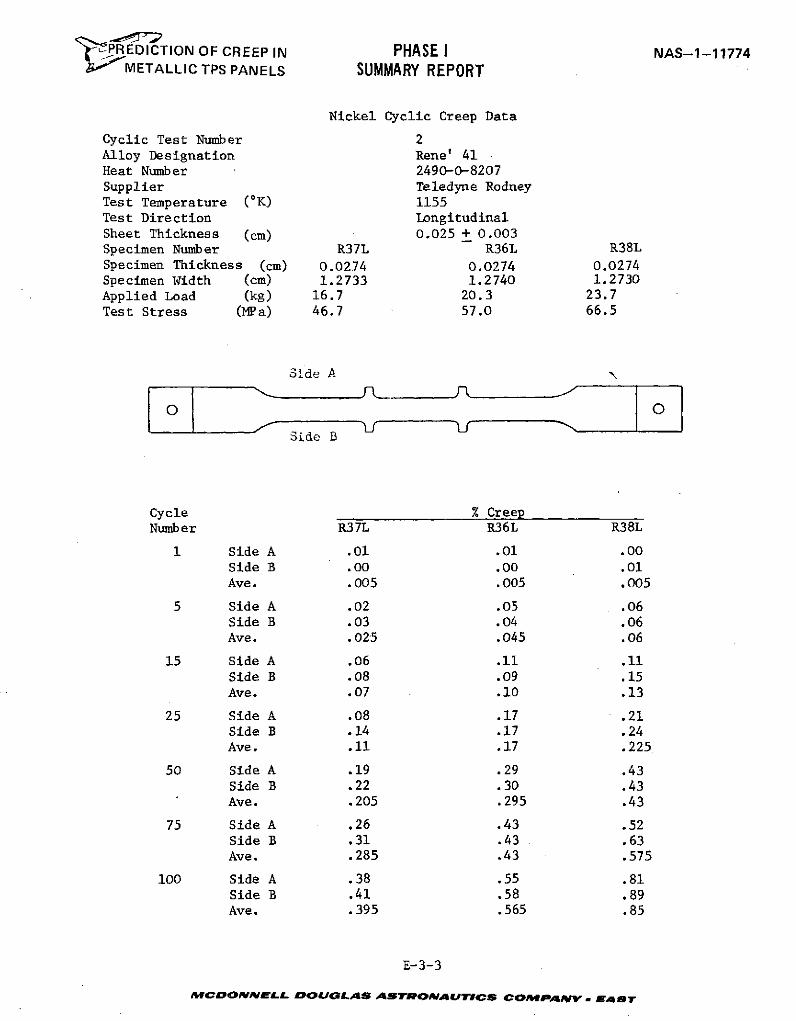
PREDICTION OF CREEP IN PHASE I NAS-1-117741 , METALLIC TPS PANELS SUMMARY REPORT
Nickel Cyclic Creep Data
Cyclic Test Number 2Alloy Designation Rene' 41Heat Number 2490-0-8207Supplier Teledyne RodneyTest Temperature (oK) 1155Test Direction LongitudinalSheet Thickness (cm) 0.025 + 0.003Specimen Number R37L R36L R38LSpecimen Thickness (cm) 0.0274 0.0274 0.0274Specimen Width (cm) 1.2733 1.2740 1.2730Applied Load (kg) 16.7 20.3 23.7Test Stress (MPa) 46.7 57.0 66.5
Side A
Side B
Cycle % CreepNumber R37L R36L R38L
1 Side A .01 .01 .00Side B .00 .00 .01Ave. .005 .005 .005
5 Side A .02 .05 .06Side B .03 .04 .06Ave. .025 .045 .06
15 Side A .06 .11 .11Side B .08 .09 .15Ave. .07 .10 .13
25 Side A .08 .17 .21Side B .14 .17 .24Ave. .11 .17 .225
50 Side A .19 .29 .43Side B .22 .30 .43Ave. .205 .295 .43
75 Side A .26 .43 .52Side B .31 .43 .63Ave. .285 .43 .575
100 Side A .38 .55 .81Side B .41 .58 .89Ave. .395 .565 .85
E-3-3
MCDONNELL DOUJGLAS ASTRONAUTICS COMPANYv. erBT
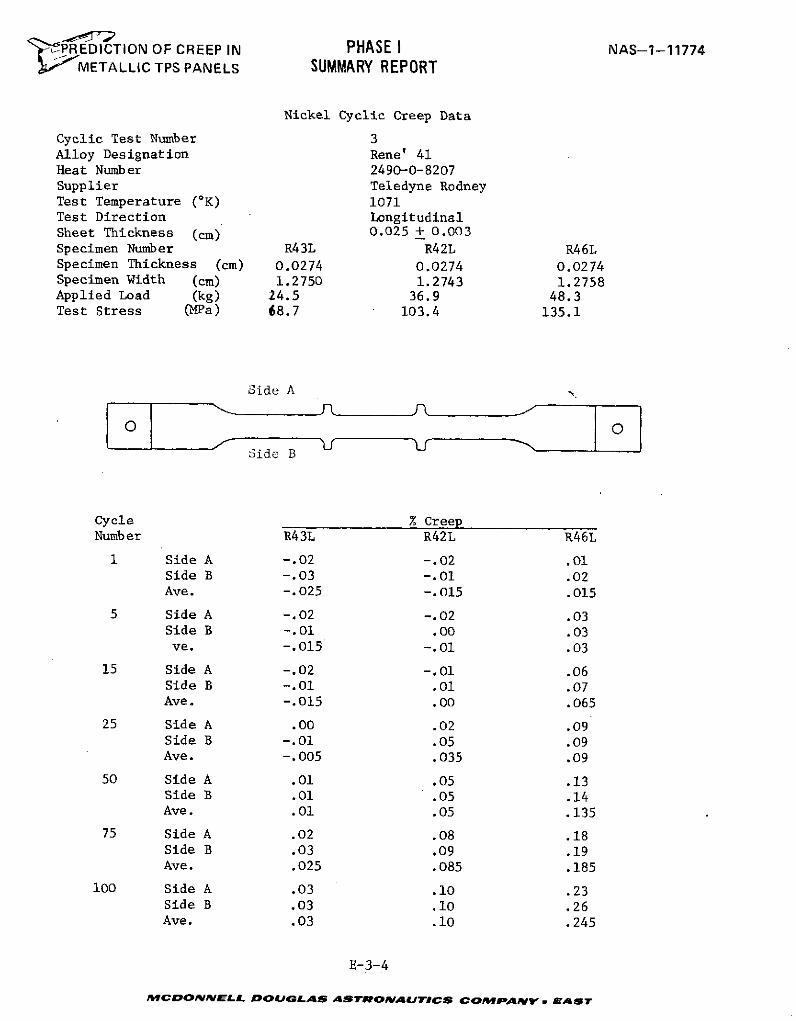
PREDICTION OF CREEP IN PHASE I NAS-1-11774METALLIC TPS PANELS SUMMARY REPORT
Nickel Cyclic Creep Data
Cyclic Test Number 3Alloy Designation Rene' 41Heat Number 2490-0-8207Supplier Teledyne RodneyTest Temperature (OK) 1071Test Direction LongitudinalSheet Thickness (cm) 0.025 + 0.003Specimen Number R43L R42L R46LSpecimen Thickness (cm) 0.0274 0.0274 0.0274Specimen Width (cm) 1.2750 1.2743 1.2758Applied Load (kg) 24.5 36.9 48.3Test Stress (MPa) 68.7 103.4 135.1
Side A
O O
/ Side B
Cycle % CreepNumber R43L R42L R46L
1 Side A -.02 -.02 .01Side B -.03 -.01 .02Ave. -.025 -.015 .015
5 Side A -.02 -.02 .03Side B -.01 .00 .03ve. -.015 -.01 .03
15 Side A -.02 -.01 .06Side B -.01 .01 .07Ave. -.015 .00 .065
25 Side A .00 .02 .09Side B -.01 .05 .09Ave. -.005 .035 .09
50 Side A .01 .05 .13Side B .01 .05 .14Ave. .01 .05 .135
75 Side A .02 .08 .18Side B .03 .09 .19Ave. .025 .085 .185
100 Side A .03 .10 .23Side B .03 .10 .26Ave. .03 .10 .245
E-3-4
MCDONNELL DOUGLAS ASTRONAUTICS COMPANY - EAST
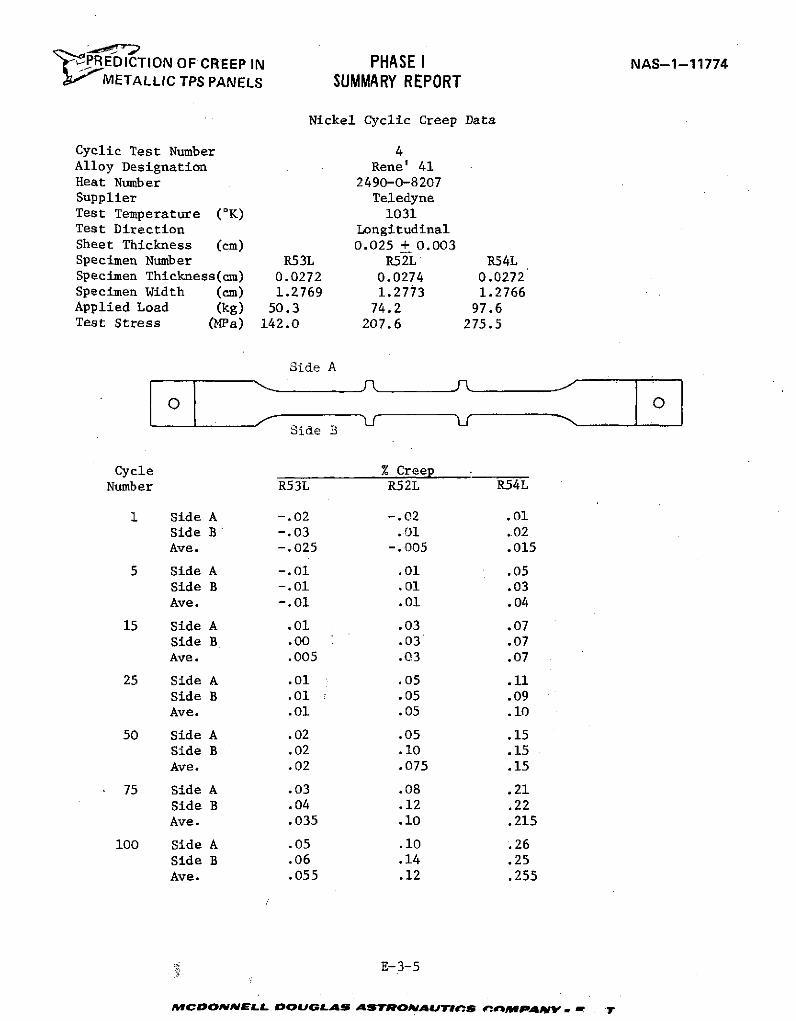
!EDICTION OF CREEP IN PHASE I NAS-1-11774" METALLIC TPS PANELS SUMMARY REPORT
Nickel Cyclic Creep Data
Cyclic Test Number 4Alloy Designation Rene' 41Heat Number 2490-0-8207Supplier TeledyneTest Temperature (OK) 1031Test Direction LongitudinalSheet Thickness (cm) 0.025 + 0.003Specimen Number R53L R52L R54LSpecimen Thickness(cm) 0.0272 0.0274 0.0272Specimen Width (cm) 1.2769 1.2773 1.2766Applied Load (kg) 50.3 74.2 97.6Test Stress (MPa) 142.0 207.6 275.5
Side A
Side B
Cycle % CreepNumber R53L R52L R54L
1 Side A -. 02 -.02 .01
Side B -.03 .01 .02Ave. -. 025 -.005 .015
5 Side A -.01 .01 .05Side B -.01 .01 .03
Ave. -.01 .01 .04
15 Side A .01 .03 .07Side B .00 .03 .07Ave. .005 .03 .07
25 Side A .01 .05 .11
Side B .01 .05 .09Ave. .01 .05 .10
50 Side A .02 .05 .15Side B .02 .10 .15Ave. .02 .075 .15
75 Side A .03 .08 .21
Side B .04 .12 .22Ave. .035 .10 .215
100 Side A .05 .10 .26Side B .06 .14 .25
Ave. .055 .12 .255
E-3-5
MCDONNa L'L DOU LAS ASTRONAUTCDS .1PA&MVN r r
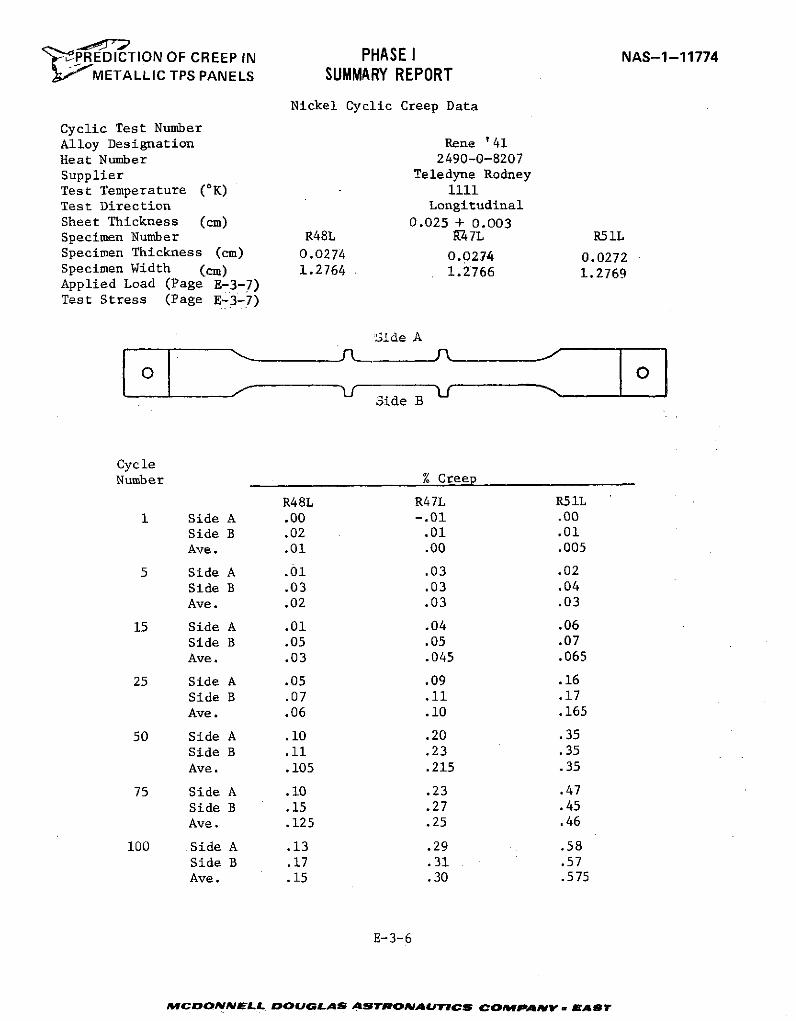
'PREDICTION OF CREEP IN PHASE I NAS-1-11774METALLIC TPS PANELS SUMMARY REPORT
Nickel Cyclic Creep Data
Cyclic Test NumberAlloy Designation Rene '41Heat Number 2490-0-8207Supplier Teledyne RodneyTest Temperature (OK) 1111Test Direction LongitudinalSheet Thickness (cm) 0.025 + 0.003Specimen Number R48L R47L R51LSpecimen Thickness (cm) 0.0274 0.0274 0.0272Specimen Width (cm) 1.2764 1.2766 1.2769Applied Load (Page E-3-7)Test Stress (Page E-3-7)
Side A
Side B
CycleNumber % Creep
R48L R47L R51L1 Side A .00 -.01 .00
Side B .02 .01 .01Ave. .01 .00 .005
5 Side A .01 .03 .02Side B .03 .03 .04Ave. .02 .03 .03
15 Side A .01 .04 .06Side B .05 .05 .07Ave. .03 .045 .065
25 Side A .05 .09 .16Side B .07 .11 .17Ave. .06 .10 .165
50 Side A .10 .20 .35Side B .11 .23 .35Ave. .105 .215 .35
75 Side A .10 .23 .47Side B .15 .27 .45Ave. .125 .25 .46
100 Side A .13 .29 .58Side B .17 .31 .57Ave. .15 .30 .575
E-3-6
MCDONNELL DOUoLvaS ASTRONAUTICSr COPNAV. eAST
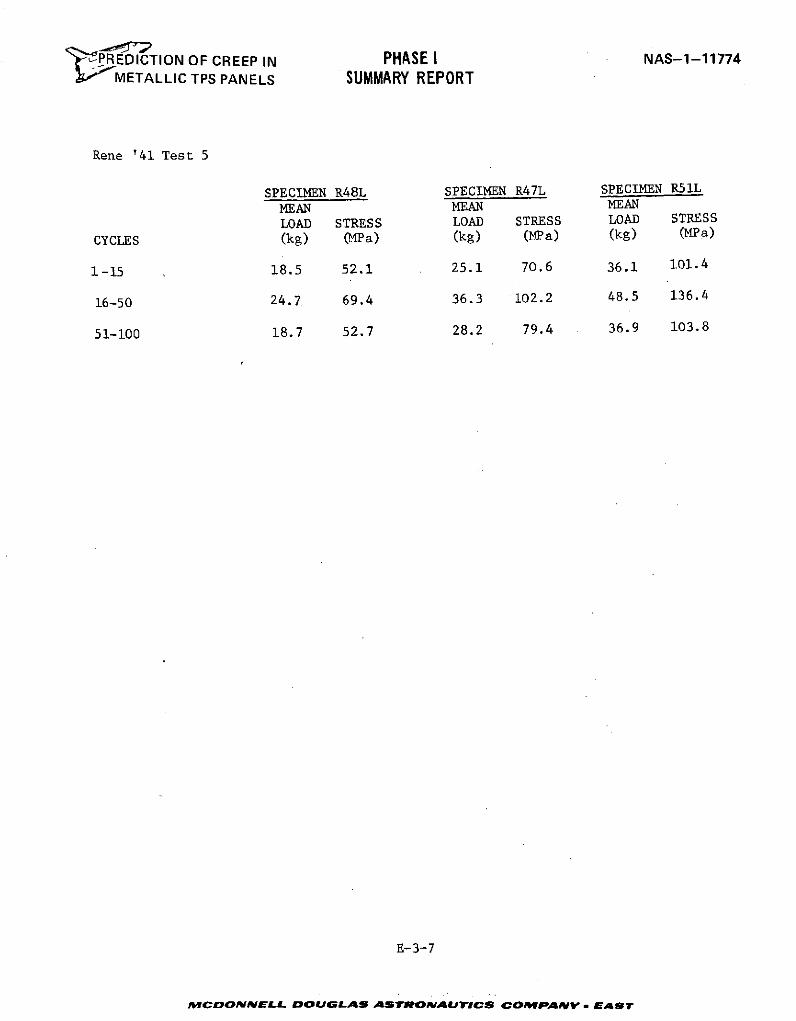
"PREDICTION OF CREEP IN PHASE I NAS-1-11774J" METALLIC TPS PANELS SUMMARY REPORT
Rene '41 Test 5
SPECIMEN R48L SPECIMEN R47L SPECIMEN R51L
MEAN MEAN MEANLOAD STRESS LOAD STRESS LOAD STRESS
CYCLES (kg) (MPa) (kg) (MPa) (kg) (MPa)
1-15 18.5 52.1 25.1 70.6 36.1 101.4
16-50 24.7 69.4 36.3 102.2 48.5 136.4
51-100 18.7 52.7 28.2 79.4 36.9 103.8
E-3-7
MCDONNELL DOUGLAS ASTRONMAUTICS COAMPA0NV , &AT
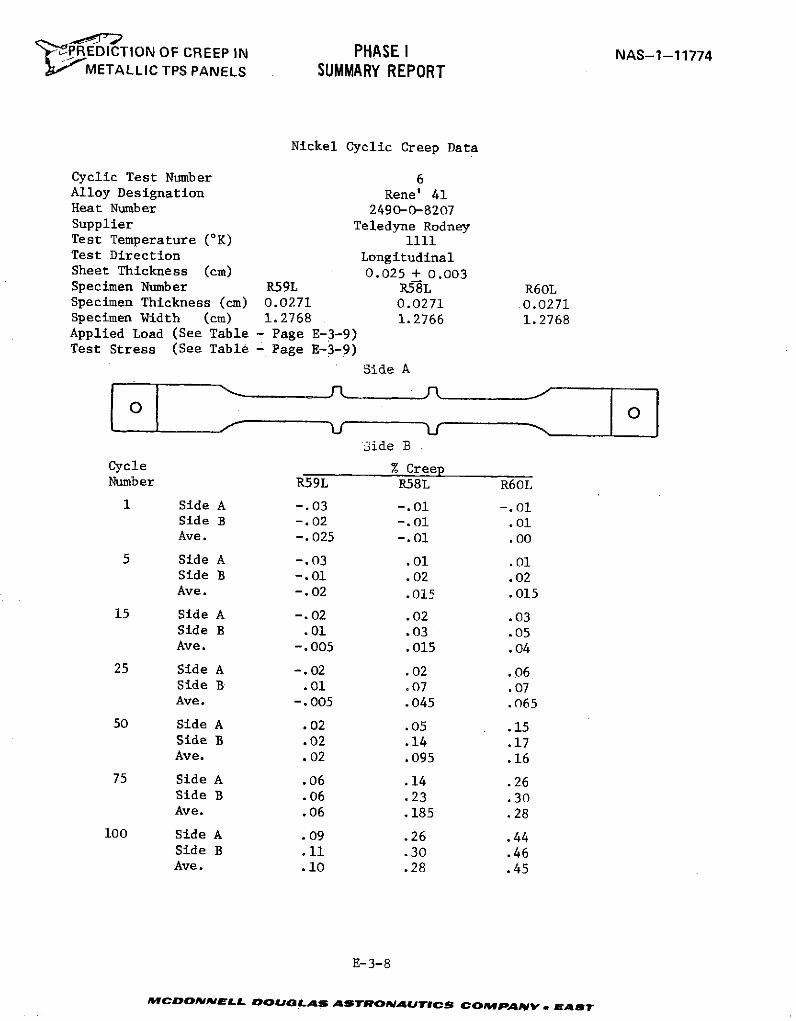
' PREDICTION OF CREEP IN PHASE I NAS-1-11774SMETALLIC TPS PANELS SUMMARY REPORT
Nickel Cyclic Creep Data
Cyclic Test Number 6Alloy Designation Rene' 41Heat Number 2490-0-8207Supplier Teledyne RodneyTest Temperature (OK) 1111Test Direction LongitudinalSheet Thickness (cm) 0.025 + 0.003Specimen Number R59L R58L R60LSpecimen Thickness (cm) 0.0271 0.0271 0.0271Specimen Width (cm) 1.2768 1.2766 1.2768Applied Load (See Table - Page E-3-9)Test Stress (See Table - Page E-3-9)
Side A
Side B
Cycle % CreepNumber R59L R58L R60L
1 Side A -. 03 -.01 -.01Side B -. 02 -.01 .01Ave. -.025 -. 01 .00
5 Side A -. 03 .01 .01Side B -.01 .02 .02Ave. -.02 .015 .015
15 Side A -.02 .02 .03Side B .01 .03 .05Ave. -.005 .015 .04
25 Side A -.02 .02 .06Side B .01 .07 .07Ave. -. 005 .045 .065
50 Side A .02 .05 .15Side B .02 .14 .17Ave. .02 .095 .16
75 Side A .06 .14 .26Side B .06 .23 .30Ave. .06 .185 .28
100 Side A .09 .26 .44Side B .11 .30 .46Ave. .10 .28 .45
E-3-8
MCDONNELL DOUGLAS AISTRONaUTICS COMpT'ANy . As'
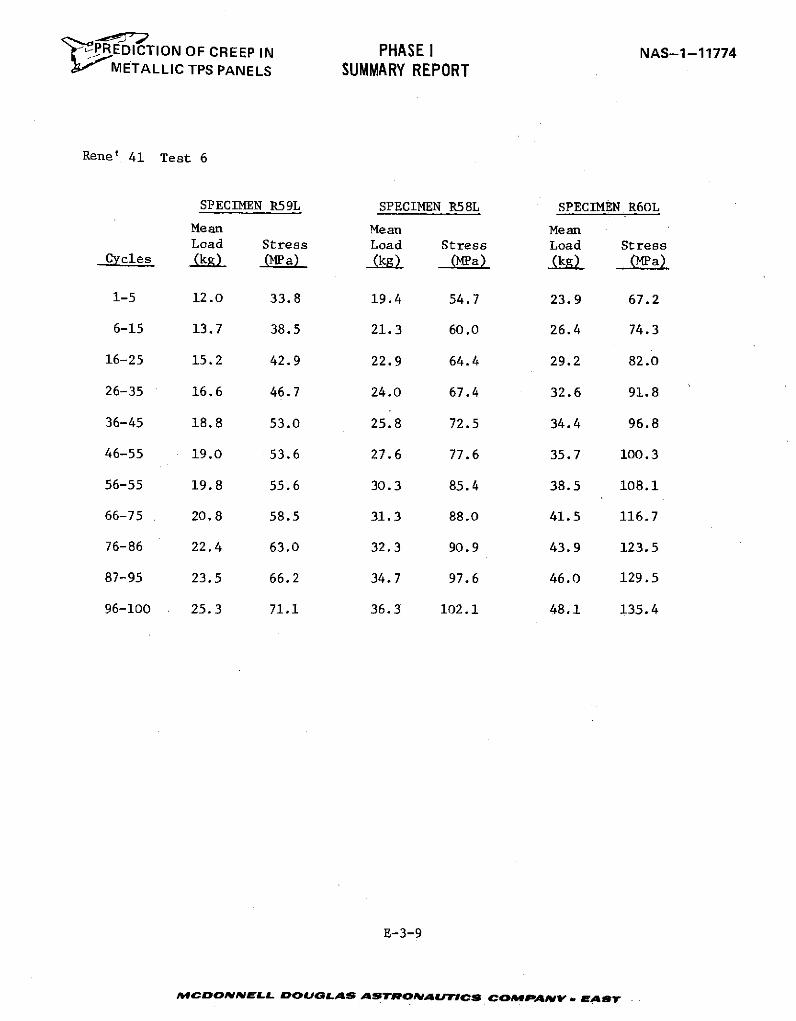
'TPREDICTION OF CREEP IN PHASE I NAS-1-11774METALLIC TPS PANELS SUMMARY REPORT
Rene' 41 Test 6
SPECIMEN R59L SPECIMEN R58L SPECIMEN R60L
Mean Mean MeanLoad Stress Load Stress Load Stress
Cyles (kp; Ma) (kg) (a)(kg) (a)
1-5 12.0 33.8 19.4 54.7 23.9 67.2
6-15 13.7 38.5 21.3 60.0 26.4 74.3
16-25 15.2 42.9 22.9 64.4 29.2 82.0
26-35 16.6 46.7 24.0 67.4 32.6 91.8
36-45 18.8 53.0 25.8 72.5 34.4 96.8
46-55 19.0 53.6 27.6 77.6 35.7 100.3
56-55 19.8 55.6 30.3 85.4 38.5 108.1
66-75 20.8 58.5 31.3 88.0 41.5 116.7
76-86 22.4 63.0 32.3 90.9 43.9 123.5
87-95 23.5 66.2 34.7 97.6 46.0 129.5
96-100 25.3 71.1 36.3 102.1 48.1 135.4
E-3-9
MCDONNELL DOUGLAS ASTROAUTICS COMPANY a EAS".
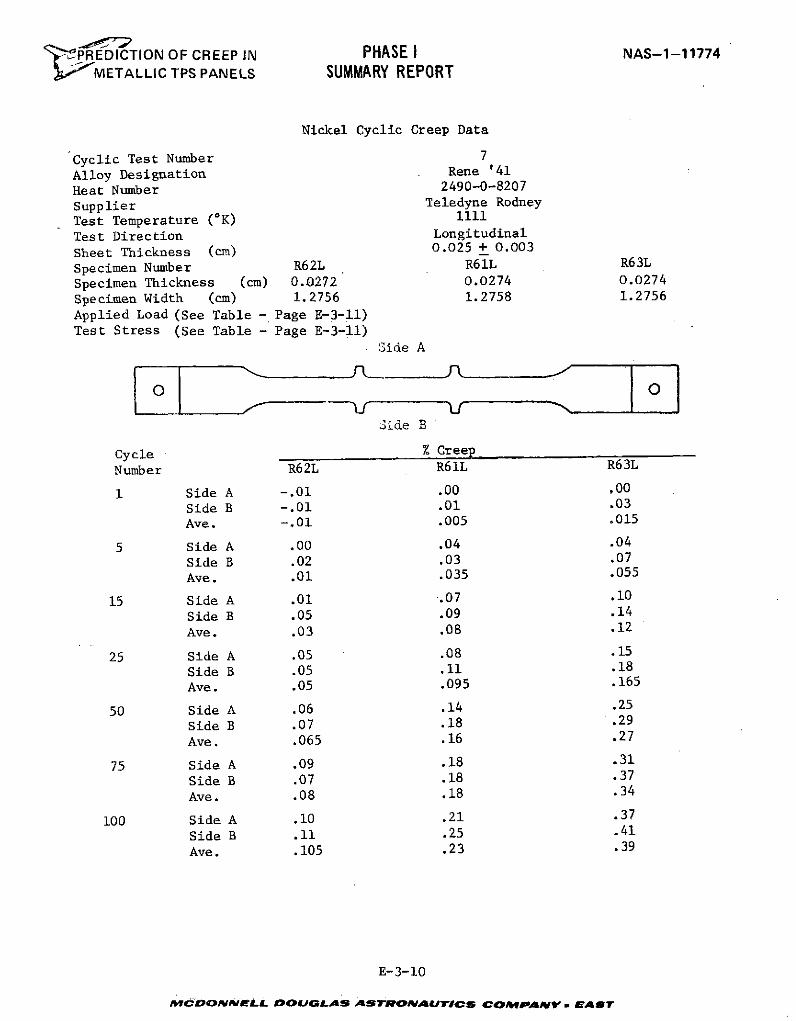
' PRTEDICTION OF CREEP IN PHASE I NAS-1-11774METALLIC TPS PANELS SUMMARY REPORT
Nickel Cyclic Creep Data
Cyclic Test Number 7
Alloy Designation Rene '41
Heat Number 2490-0-8207
Supplier Teledyne Rodney
Test Temperature (OK) 1111
Test Direction Longitudinal
Sheet Thickness (cm) 0.025 + 0.003
Specimen Number R62L R61L R63L
Specimen Thickness (cm) 0.0272 0.0274 0.0274
Specimen Width (cm) 1.2756 1.2758 1.2756
Applied Load (See Table - Page E-3-11 )
Test Stress (See Table - Page E-3-11)Side A
Side B
Cycle % Creep
Number R62L R61L R63L
1 Side A -.01 .00 ,00
Side B -.01 .01 .03
Ave. -.01 .005 .015
5 Side A .00 .04 .04Side B .02 .03 .07
Ave. .01 .035 .055
15 Side A .01 .07 .10
Side B .05 .09 .14
Ave. .03 .08 .12
25 Side A .05 .08 .15
Side B .05 .11 .18
Ave. .05 .095 .165
50 Side A .06 .14 .25
Side B .07 .18 .29
Ave. .065 .16 .27
75 Side A .09 .18 .31
Side B .07 .18 .37
Ave. .08 .18 .34
100 Side A .10 .21 .37
Side B .11 .25 .41
Ave. .105 .23 .39
E-3-10
MCDONNELL DOUGLAS ASTRONAUTICS COMPANV V EAT
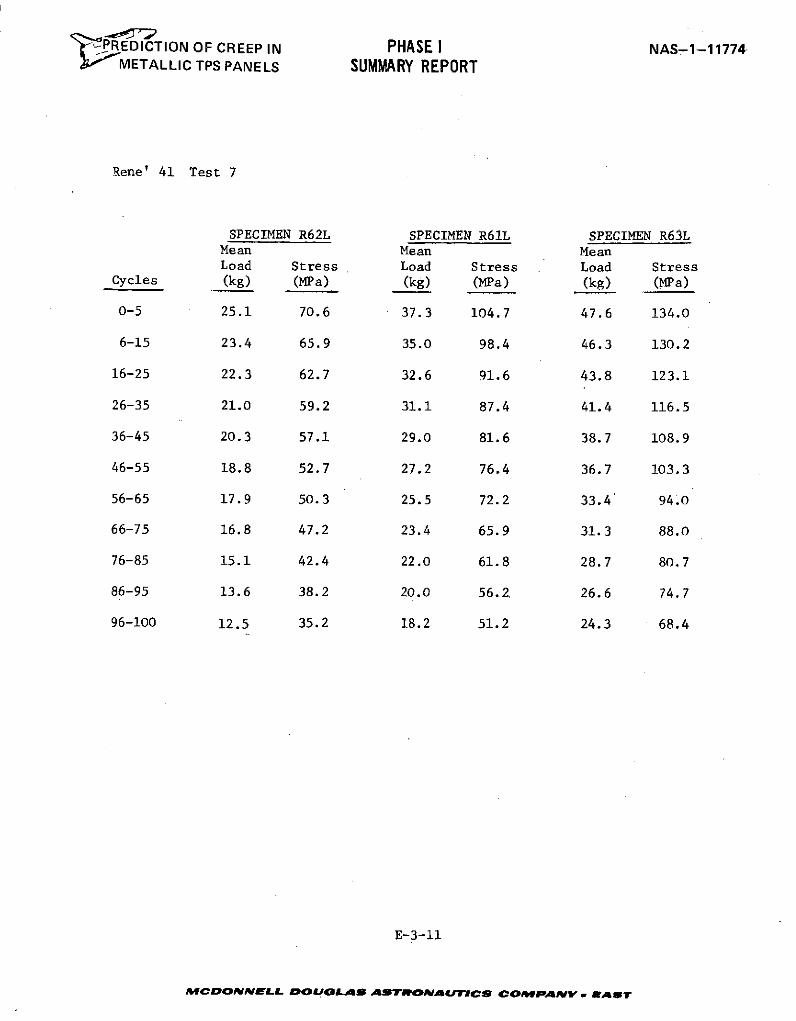
PREDICTION OF CREEP IN PHASE I NAS-1-117744 'METALLIC TPS PANELS SUMMARY REPORT
Rene' 41 Test 7
SPECIMEN R62L SPECIMEN R61L SPECIMEN R63LMean Mean MeanLoad Stress Load Stress Load Stress
Cycles (kg) (MPa) (kg) (MPa) (kg) (MPa)
0-5 25.1 70.6 37.3 104.7 47.6 134.0
6-15 23.4 65.9 35.0 98.4 46.3 130.2
16-25 22.3 62.7 32.6 91.6 43.8 123.1
26-35 21.0 59.2 31.1 87.4 41.4 116.5
36-45 20.3 57.1 29.0 81.6 38.7 108.9
46-55 18.8 52.7 27.2 76.4 36.7 103.3
56-65 17.9 50.3 25.5 72.2 33.4 94.0
66-75 16.8 47.2 23.4 65.9 31.3 88.0
76-85 15.1 42.4 22.0 61.8 28.7 80.7
86-95 13.6 38.2 20.0 56.2, 26.6 74.7
96-100 12.5 35.2 18.2 51.2 24.3 68.4
E-3-11
MCDONNELL DOUGLAS ASTROIVAUTICS COMANY . EAMT
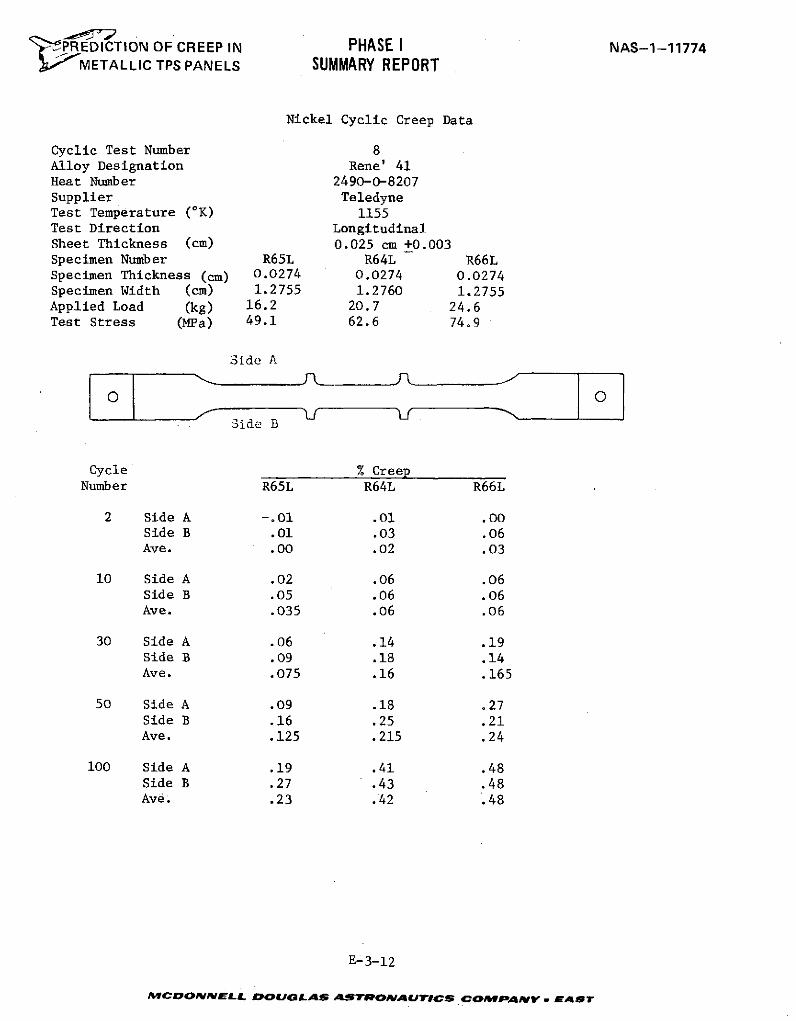
"PREDICTION OF CREEP IN PHASE I NAS-1-11774METALLIC TPS PANELS SUMMARY REPORT
Nickel Cyclic Creep Data
Cyclic Test Number 8Alloy Designation Rene' 41Heat Number 2490-0-8207Supplier TeledyneTest Temperature (OK) 1155Test Direction LongitudinalSheet Thickness (cm) 0.025 cm +0.003Specimen Number R65L R64L R66LSpecimen Thickness (cm) 0.0274 0.0274 0.0274Specimen Width (cm) 1.2755 1.2760 1.2755Applied Load (kg) 16.2 20.7 24.6Test Stress (MPa) 49.1 62.6 74.9
Side A
Side B
Cycle % CreepNumber R65L R64L R66L
2 Side A -.01 .01 .00Side B .01 .03 .06Ave. .00 .02 .03
10 Side A .02 .06 .06Side B .05 .06 .06Ave. .035 .06 .06
30 Side A .06 .14 .19Side B .09 .18 .14Ave. .075 .16 .165
50 Side A .09 .18 .27Side B .16 .25 .21Ave. .125 .215 .24
100 Side A .19 .41 .48Side B .27 .43 .48Ave. .23 .42 .48
E-3-12
MCcONNELL DOUGLAS ASTRONAUTICS COMPANY -. AST

" P REDICTION OF CREEP IN PHASE I NAS-1-11774r~- METALLIC TPS PANELS SUMMARY REPORT
NickelCyclic Creep Data
Cyclic Test Number 9Alloy Designation Rene' 41Heat Number 2490-0-8207Supplier TeledyneTest Temperature (OK) 1111Test Direction LongitudinalSheet Thickness (cm) 0.025 + 0.003Specimen Number R68L. R67L R69LSpecimen Thickness (cm) 0.0274 - 0.0274 0.0274
Specimen Width (cm) 1.2758 1.2756 1.2753Applied Load (kg) 14.6/22.0 21.7/32.5 29.3/43.7Test Stress (MPa) 40.7/61.4 60.8/91.0 82.1/122.3
Jide A
3ide B
Cycle % CreepNumber R68L R67L R69L
1 Side A -.03 .01 -.01
Side B -.01 .00 .01
Ave. -.02 .005 .00
5 Side A -.01 .02 .02
Side B -.01 .02 .02
Ave. -.01 .02 .02
15 Side A .00 .06 .07
Side B .01 .05 .09
Ave. .005 .055 .08
25 Side A .00 .06 .10
Side B .03 .07 .11
Ave. .015 .065 .105
50 Side A .03 .13 .19
Side B .05 .17 .24
Ave. .04 .15 .215
75 Side A .05 .17 .27Side B .09 .24 .33Ave. .07 .205 .30
100 Side A .09 .25 .39Side B .13 .31 .44Ave. .11 .28 .415
E-3-13
MCDONdELL DOUGLAS ASTVRONAUA IC COMPAvNY. AArT
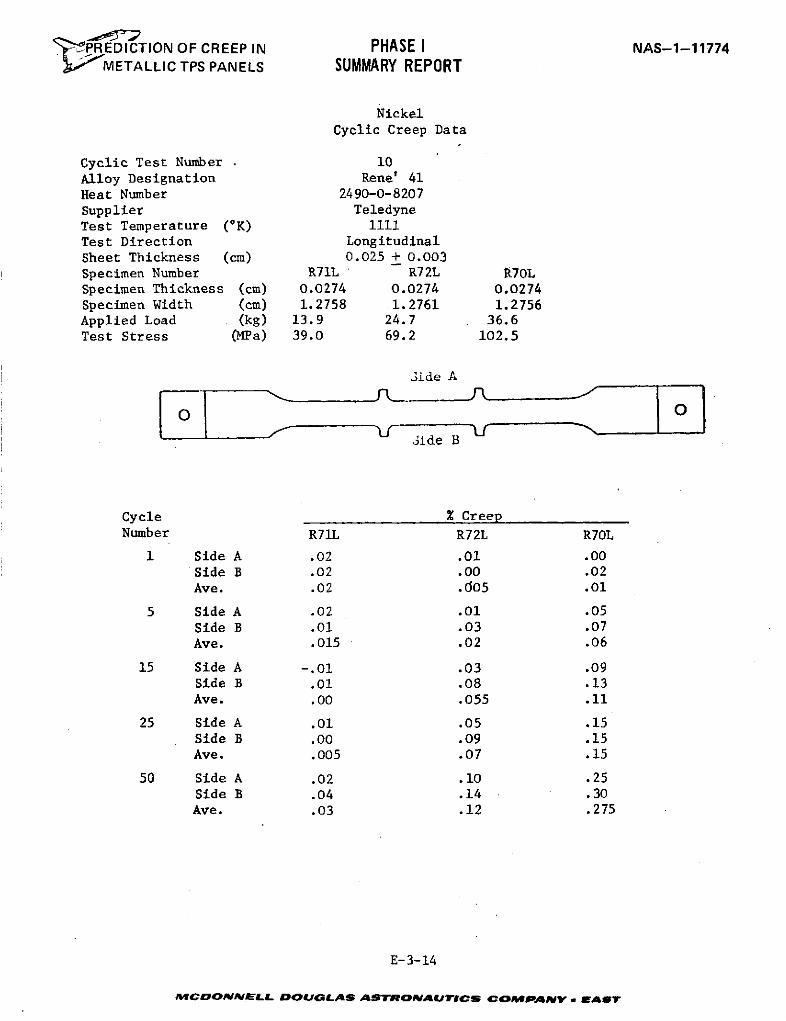
' P REDICTION OF CREEP IN PHASE I NAS-1-11774METALLIC TPS PANELS SUMMARY REPORT
NickelCyclic Creep Data
Cyclic Test Number 10Alloy Designation Rene' 41Heat Number 2490-0-8207Supplier TeledyneTest Temperature (*K) 1111Test Direction LongitudinalSheet Thickness (cm) 0.025 + 0.003Specimen Number R71L R72L R70LSpecimen Thickness (cm) 0.0274 0.0274 0.0274Specimen Width (cm) 1.2758 .1.2761 1.2756Applied Load (kg) 13.9 24.7 36.6Test Stress (MPa) 39.0 69.2 102.5
Side A
Jide B
Cycle % CreepNumber R71L R72L R70L
1 Side A .02 .01 .00Side B .02 .00 .02Ave. .02 .005 .01
5 Side A .02 .01 .05Side B .01 .03 .07Ave. .015 .02 .06
15 Side A -.01 .03 .09Side B .01 .08 .13Ave. .00 .055 .11
25 Side A .01 .05 .15Side B .00 .09 .15Ave. .005 .07 .15
50 Side A .02 .10 .25Side B .04 .14 .30Ave. .03 .12 .275
E-3-14
MrCDONNELL DOUGLAS ASTRONAUTICSe COPANY m EAST
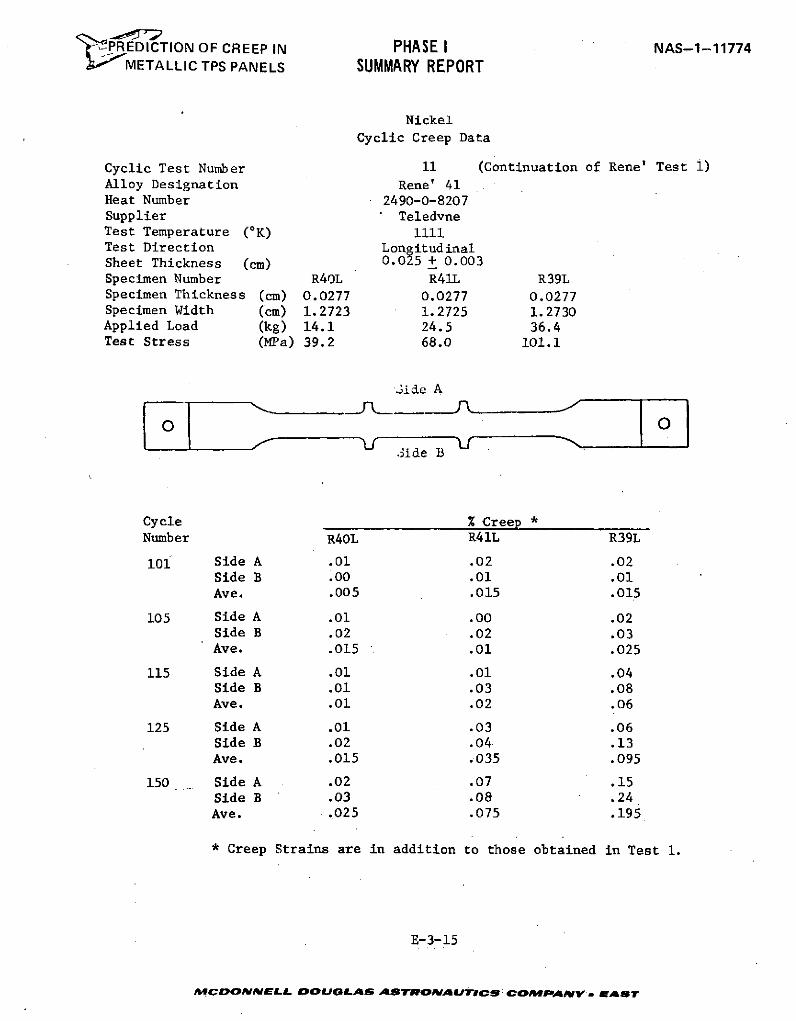
JPREDICTION OF CREEP IN PHASE I NAS-1-11774d 'METALLIC TPS PANELS SUMMARY REPORT
Nickel
Cyclic Creep Data
Cyclic Test Number 11 (Continuation of Rene' Test i)Alloy Designation Rene' 41Heat Number 2490-0-8207Supplier TeledyvneTest Temperature (*K) 1111Test Direction LongitudinalSheet Thickness (cm) 0.025 + 0.003Specimen Number R40L R41L R39LSpecimen Thickness (cm) 0.0277 0.0277 0.0277Specimen Width (cm) 1.2723 1.2725 1.2730Applied Load (kg) 14.1 24.5 36.4Test Stress (MPa) 39.2 68.0 101.1
Jide A
3ide B
Cycle % Creep *Number R40L R41L R39L
10i Side A .01 .02 .02Side B .00 .01 .01Ave. .005 .015 .015
105 Side A .01 .00 .02Side B .02 .02 .03Ave. .015 .01 .025
115 Side A .01 .01 .04Side B .01 .03 .08Ave. .01 .02 .06
125 Side A .01 .03 .06Side B .02 .04- .13Ave. .015 .035 .095
150 Side A .02 .07 .15Side B .03 .08 .24Ave. .025 .075 .195
* Creep Strains are in addition to those obtained in Test 1.
E-3-15
MCOONNELL DOUGLAS ASTRONAUTICS: COMPANY. EAST
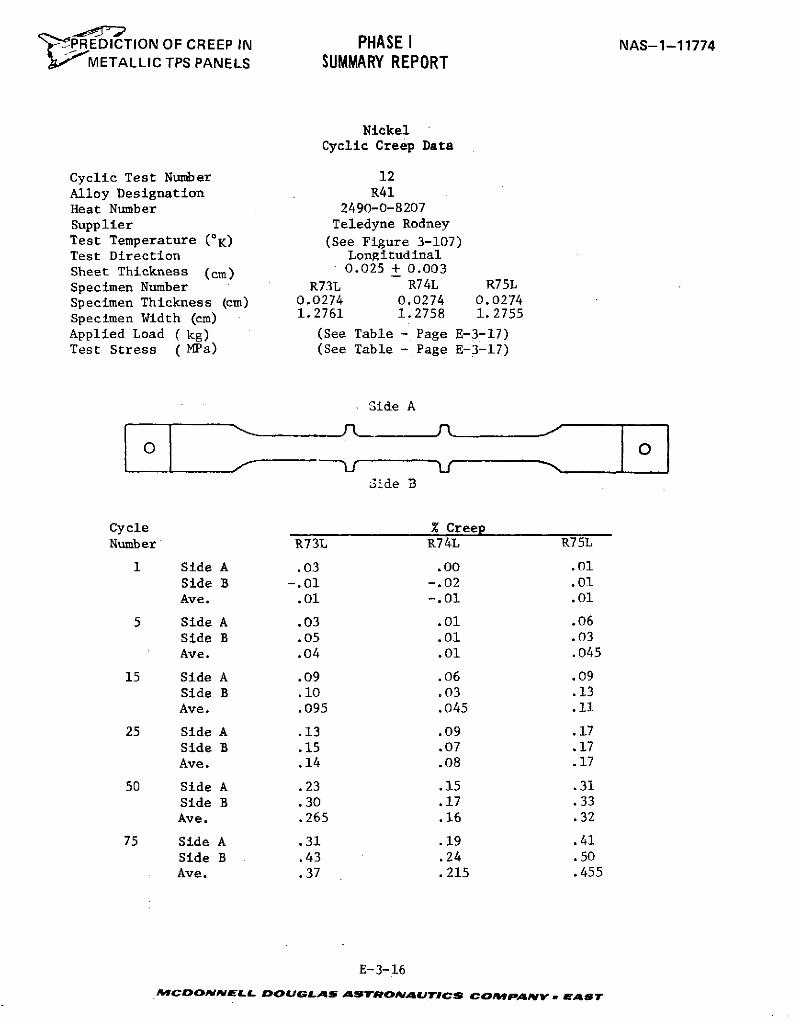
"PREDICTION OF CREEP IN PHASE I NAS-1-11774METALLIC TPS PANELS SUMMARY REPORT
NickelCyclic Creep Data
Cyclic Test Number 12Alloy Designation R41Heat Number 2490-0-8207Supplier Teledyne RodneyTest Temperature (*K) (See Figure 3-107)Test Direction LongitudinalSheet Thickness (cm) 0.025 + 0.003Specimen Number R73L R74L R75L
Specimen Thickness (cm) 0.0274 0.0274 0.0274Specimen Width (cm) 1.2761 1.2758 1.2755
Applied Load ( kg) (See Table - Page E-3-17)Test Stress ( MPa) (See Table - Page E-3-17)
Side A
Side B
Cycle % CreepNumber R73L R74L R75L
1 Side A .03 .00 .01Side B -.01 -.02 .01Ave. .01 -.01 .01
5 Side A .03 .01 .06Side B .05 .01 .03Ave. .04 .01 .045
15 Side A .09 .06 .09Side B .10 .03 .13Ave. .095 .045 .11
25 Side A .13 .09 .17Side B .15 .07 .17Ave. .14 .08 .17
50 Side A .23 .15 .31Side B .30 .17 .33Ave. .265 .16 .32
75 Side A .31 .19 .41Side B .43 .24 .50Ave. .37 .215 .455
E-3-16
MCDONNELL DOUGLAS ASTRONAUTICS COMPANY EAST
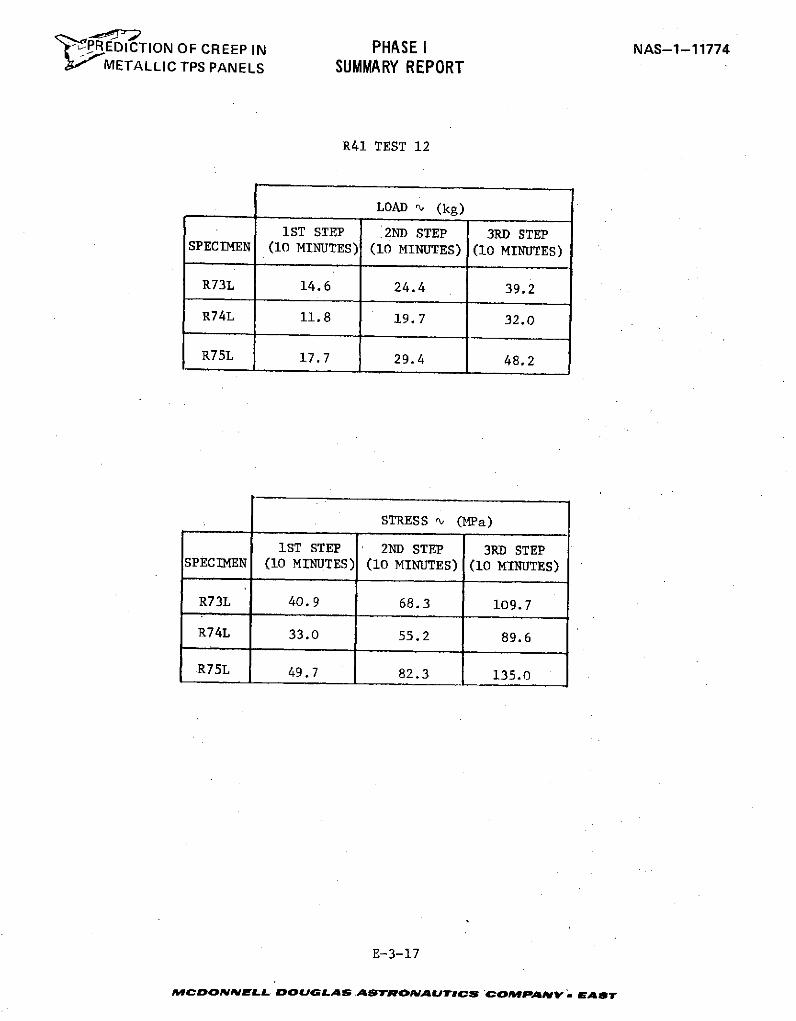
-PREDICTION OF CREEP IN PHASE I NAS-1-11774IL,"METALLIC TPS PANELS SUMMARY REPORT
R41 TEST 12
LOAD nu (kg)
1ST STEP 2ND STEP 3RD STEPSPECIMEN (10 MINUTES) (10 MINUTES) (10 MINUTES)
R73L 14.6 24.4 39.2
R74L 11.8 19.7 32.0
R75L 17.7 29.4 48.2
STRESS n (MPa)
1ST STEP 2ND STEP 3RD STEPSPECIMEN (10 MINUTES) (10 MINUTES) (10 MINUTES)
R73L 40.9 68.3 109.7
R74L 33.0 55.2 89.6
R75L 49.7 82.3 135.0
E-3-17
MCDONNELLA DOUGLAS ASTRONAUTICS COMPANV - ANrT
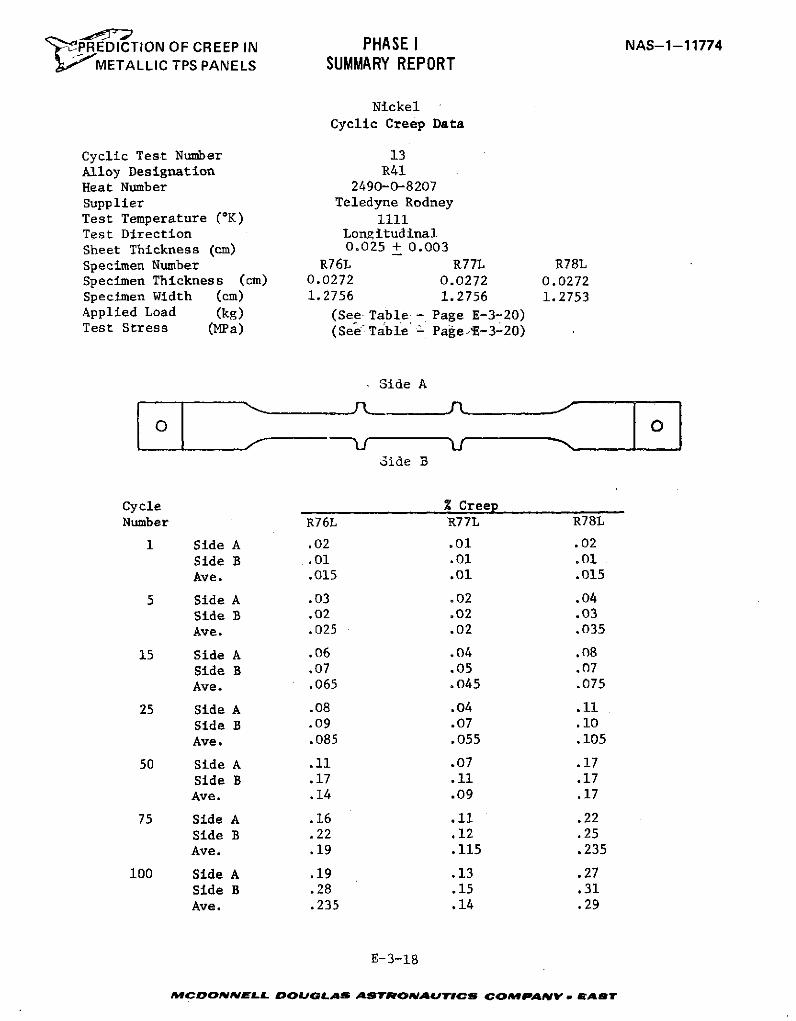
PREDICTION OF CREEP IN PHASE I NAS-1-11774METALLIC TPS PANELS SUMMARY REPORT
Nickel
Cyclic Creep Data
Cyclic Test Number 13Alloy Designation R41Heat Number 2490-0-8207Supplier Teledyne RodneyTest Temperature (OK) 1111Test Direction LongitudinalSheet Thickness (cm) 0.025 + 0.003
Specimen Number R76L R77L R78LSpecimen Thickness (cm) 0.0272 0.0272 0.0272Specimen Width (cm) 1.2756 1.2756 1.2753Applied Load (kg) (See Table - Page E-3-20)Test Stress (MPa) (See Table Page 'E-3-20)
Side A
Side B
Cycle % CreepNumber R76L R77L R78L
i Side A .02 .01 .02
Side B .01 .01 .01Ave. .015 .01 .015
5 Side A .03 .02 .04
Side B .02 .02 .03
Ave. .025 .02 .035
15 Side A .06 .04 .08
Side B .07 .05 .07Ave. .065 .045 .075
25 Side A .08 .04 .11
Side B .09 .07 .10Ave. .085 .055 .105
50 Side A .11 .07 .17Side B .17 .11 .17Ave. .14 .09 .17
75 Side A .16 .11 .22Side B .22 .12 .25Ave. .19 .115 .235
100 Side A .19 .13 .27Side B .28 .15 .31Ave. .235 .14 .29
E-3-18
MCDONNELL DOUGLAS ASTRONAUTICS COMPANVr. fAST
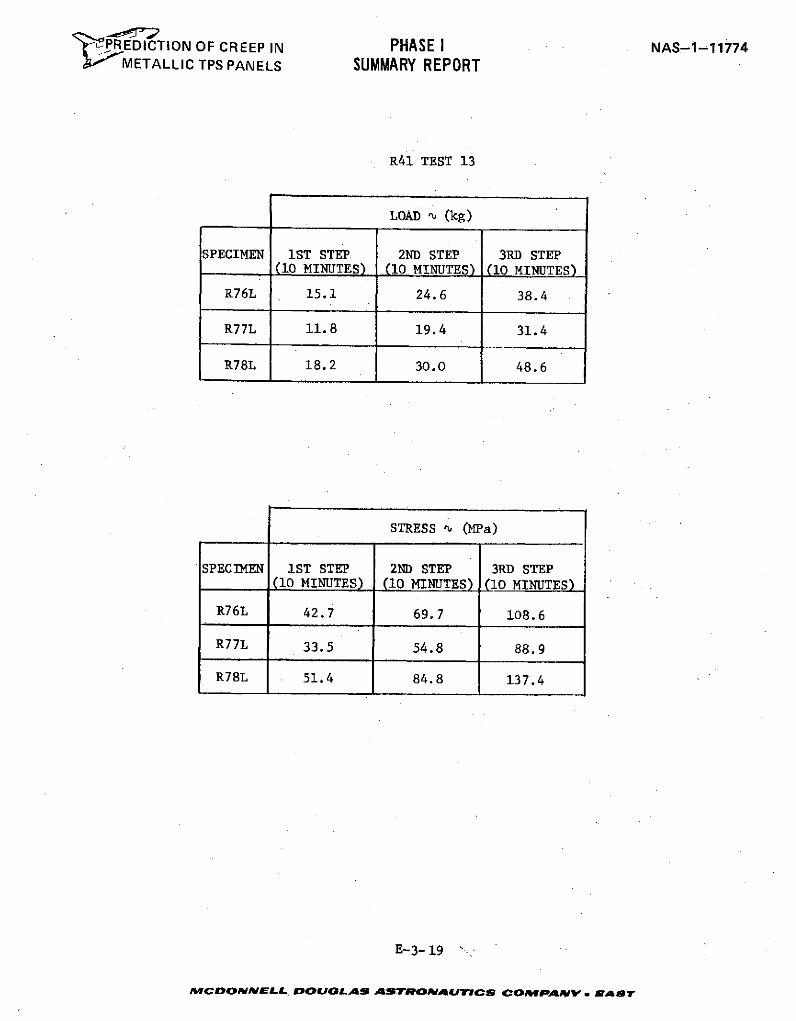
PREDICTION OF CREEP IN PHASE I NAS-1-11774METALLIC TPS PANELS SUMMARY REPORT
R41 TEST 13
LOAD ' (kg)
SPECIMEN 1ST STEP 2ND STEP 3RD STEP(10 MINUTES) (10 MINUTES) (10 MINUTES)
R76L 15.1 24.6 38.4
R77L 11.8 19.4 31.4
R78L 18.2 30.0 48.6
STRESS ' (MPa)
SPECIMEN IST STEP 2ND STEP 3RD STEP(10 MINUTES) (10 MINUTES) (10 MINUTES)
R76L 42.7 69.7 108.6
R77L 33.5 54.8 88.9
R78L 51.4 84.8 137.4
E-3- 19
WMCDONNEL DOUGLAS ASTRONAUTICS COMPANV. EAsr
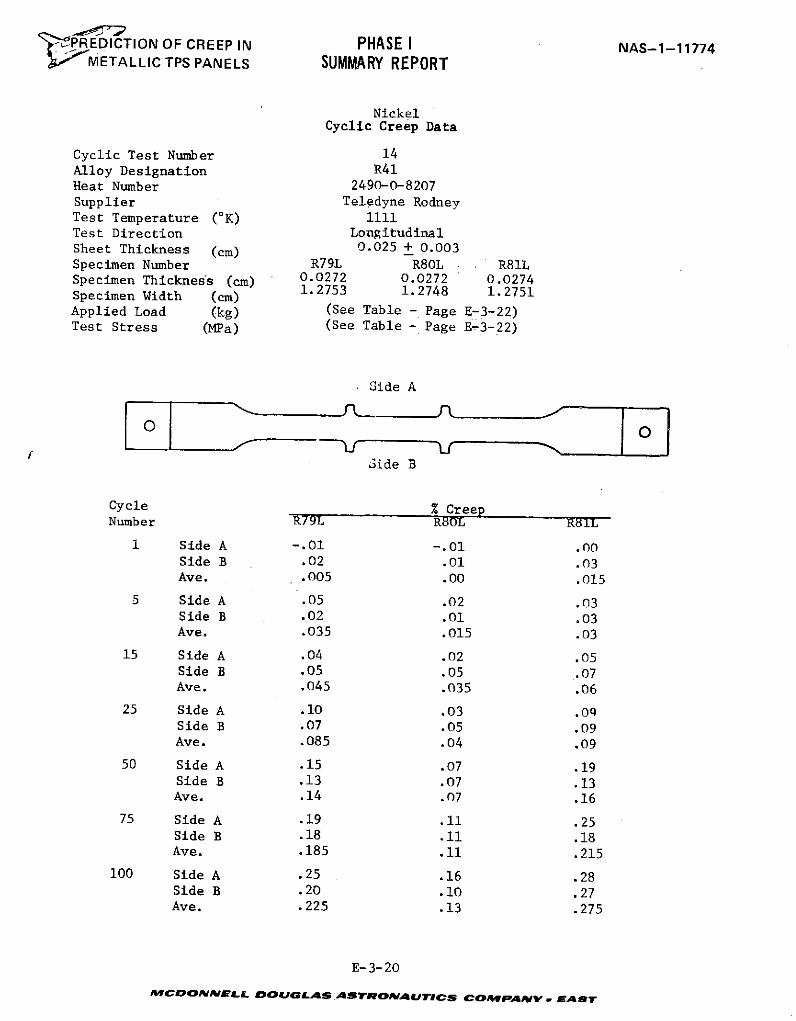
-- PREDICTION OF CREEP IN PHASE I NAS-1-11774METALLIC TPS PANELS SUMMARY REPORT
NickelCyclic Creep Data
Cyclic Test Number 14Alloy Designation R41Heat Number 2490-0-8207Supplier Teledyne RodneyTest Temperature (oK) 1111Test Direction LongitudinalSheet Thickness (cm) 0.025 + 0.003Specimen Number R79L R80L R81LSpecimen Thickness (cm) 0.0272 0.0272 0.0274Specimen Width (cm) 1.2753 1.2748 1.2751
Applied Load (kg) (See Table - Page E-3-22)Test Stress (MPa) (See Table - Page E-3-22)
Side A
Side B
Cycle % CreepNumber R79L R8OL R81L
1 Side A -.01 -.01 .00Side B .02 .01 .03Ave. .005 .00 .015
5 Side A .05 .02 .03Side B .02 .01 .03Ave. .035 .015 .03
15 Side A .04 .02 .05Side B .05 .05 .07Ave. .045 .035 .06
25 Side A .10 .03 .09Side B .07 .05 .09Ave. .085 .04 .09
50 Side A .15 .07 .19Side B .13 .07 .13Ave. .14 .07 .16
75 Side A .19 .11 .25Side B .18 .11 .18Ave. .185 .11 .215
100 Side A .25 .16 .28Side B .20 .10 .27Ave. .225 .13 .275
E-3-20
MCDONNELL DOUGLAS ASTRONAUTICS COMPANY. E AST
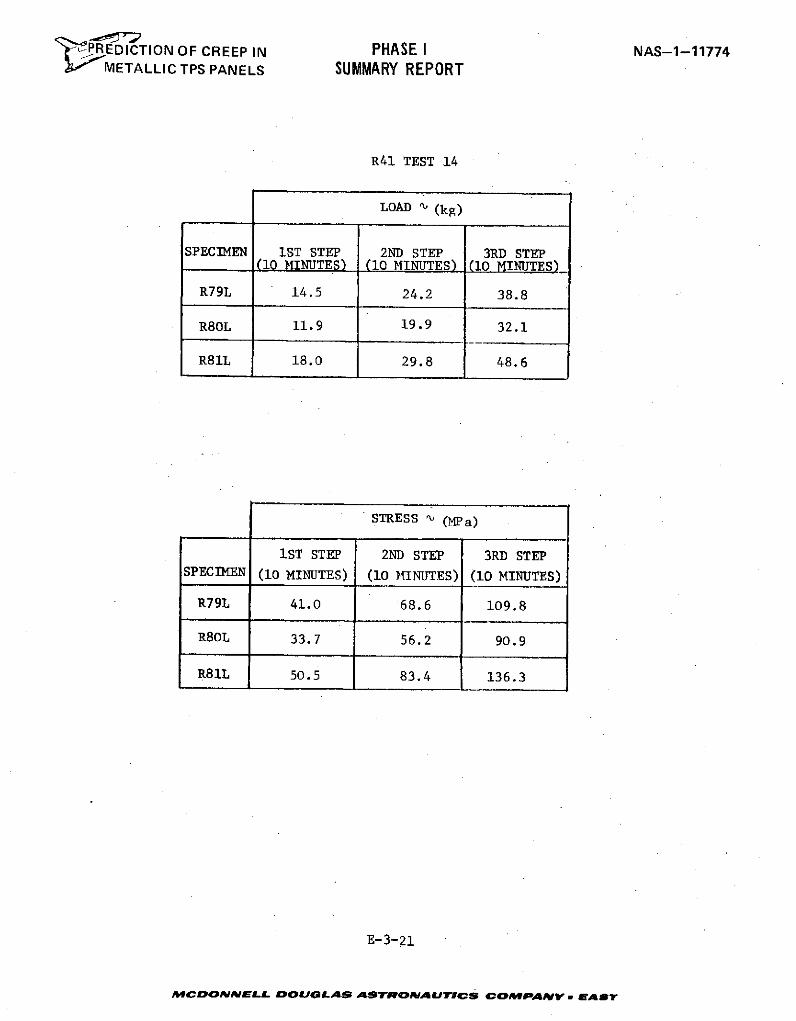
PREDICTION OF CREEP IN PHASE I NAS-1-11774~ ~IMETALLIC TPS PANELS SUMMARY REPORT
R41 TEST 14
LOAD ' (kg)
SPECIMEN IST STEP 2ND STEP 3RD STEP(10 MINUTES) (10 MINUTES) (10 MINUTES)
R79L 14.5 24.2 38.8
R80L 11.9 19.9 32.1
R81L 18.0 29.8 48.6
STRESS nu (MPa)
IST STEP 2ND STEP 3RD STEP
SPECIMEN (10 MINUTES) (10 MINUTES) (10 MINUTES)
R79L 41.0 68.6 109.8
R80L 33.7 56.2 90.9
R81L 50.5 83.4 136.3
E-3-21
MCDONNELL DOUGLAS ASTRONAUTICS COMPANY . EABe
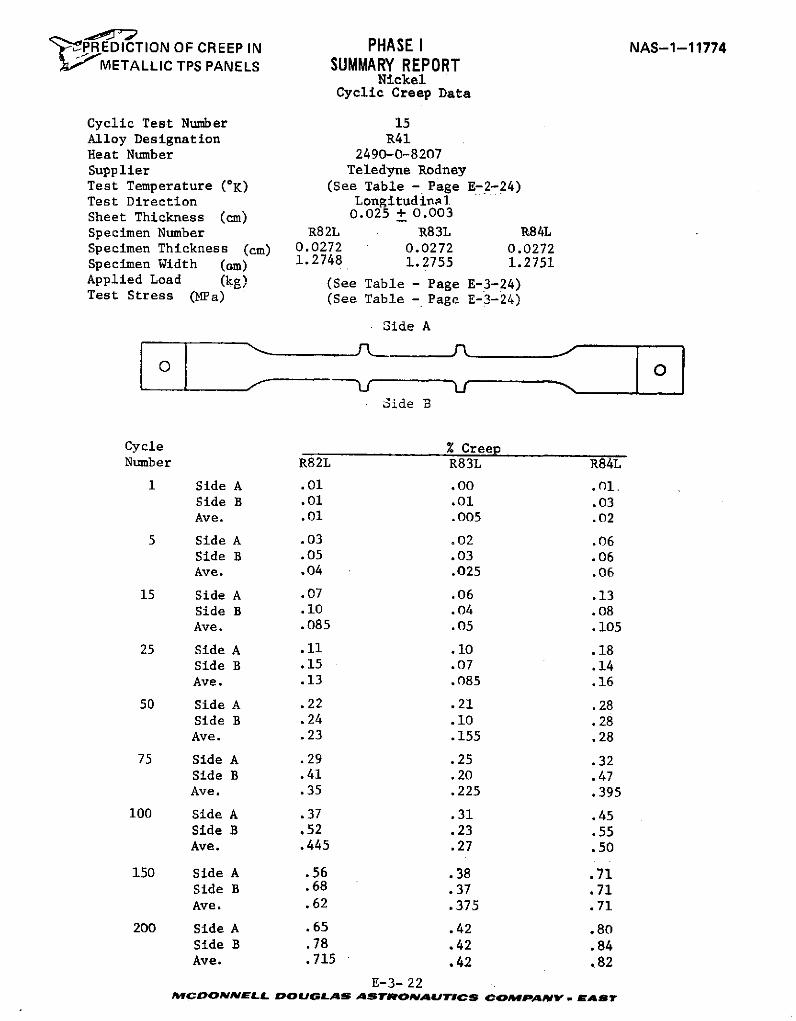
C'PREDICTION OF CREEP IN PHASE I NAS-1-11774METALLIC TPS PANELS SUMMARY REPORT
NickelCyclic Creep Data
Cyclic Test Number 15Alloy Designation R41Heat Number 2490-0-8207Supplier Teledyne RodneyTest Temperature (OK) (See Table - Page E-2-24)Test Direction Longitudinal.Sheet Thickness (cm) 0.025 + 0.003
Specimen Number R82L R83L R84LSpecimen Thickness (cm) 0.0272 0.0272 0.0272Specimen Width (Qm) 1.2748 1.2755 1.2751Applied Load (kg) (See Table - Page E-3-24)Test Stress (MPa) (See Table - Page E-3-24)
Side A
Side B
Cycle % CreepNumber R82L R83L R84L
1 Side A .01 .00 .01.Side B .01 .01 .03Ave. .01 .005 .02
5 Side A .03 .02 .06Side B .05 .03 .06Ave. .04 .025 .06
15 Side A .07 .06 .13Side B .10 .04 .08Ave. .085 .05 .105
25 Side A .11 .10 .18Side B .15 .07 .14Ave. .13 .085 .16
50 Side A .22 .21 .28Side B .24 .10 .28Ave. .23 .155 .28
75 Side A .29 .25 .32Side B .41 .20 .47Ave. .35 .225 .395
100 Side A .37 .31 .45Side B .52 .23 .55Ave. .445 .27 .50
150 Side A .56 .38 .71Side B .68 .37 .71Ave. .62 .375 .71
200 Side A .65 .42 .80Side B .78 .42 .84Ave. .715 .42 .82
E-3- 22ACDONNELL DOUGLAS ASTRONAUTICS COMPAVV- EAST
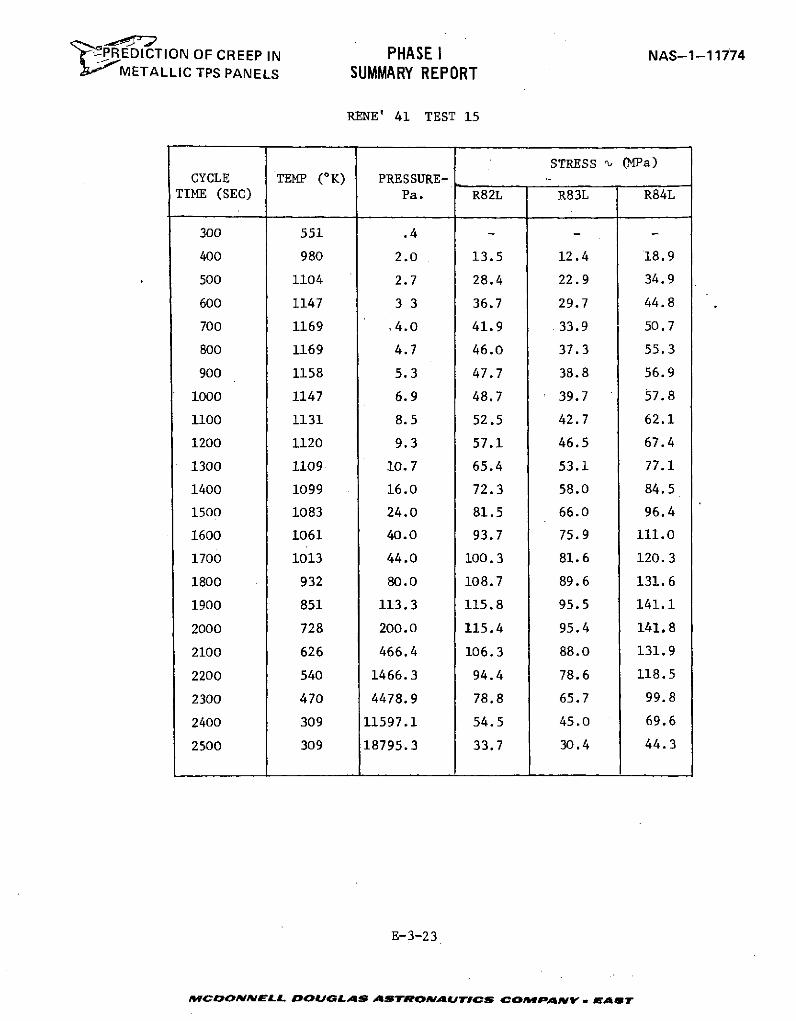
',,, PREDICTION OF CREEP IN PHASE I NAS-1-11774g-"METALLIC TPS PANELS SUMMARY REPORT
RENE' 41 TEST 15
STRESS a (MPa)CYCLE TEMP (OK) PRESSURE-
TIME (SEC) Pa. R82L R83L R84L
300 551 .4 - - -
400 980 2.0 13.5 12.4 18.9
500 1104 2.7 28.4 22.9 34.9
600 1147 3 3 36.7 29.7 44.8
700 1169 4.0 41.9 .33.9 50.7
800 1169 4.7 46.0 37.3 55.3
900 1158 5.3 47.7 38.8 56.9
1000 1147 6.9 48.7 39.7 57.8
1100 1131 8.5 52.5 42.7 62.1
1200 1120 9.3 57.1 46.5 67.4
1300 1109 10.7 65.4 53.1 77.1
1400 1099 16.0 72.3 58.0 84.5
1500 1083 24.0 81.5 66.0 96.4
1600 1061 40.0 93.7 75.9 111.0
1700 1013 44.0 100.3 81.6 120.3
1800 932 80.0 108.7 89.6 131.6
1900 851 113.3 115.8 95.5 141.1
2000 728 200.0 115.4 95.4 141.8
2100 626 466.4 106.3 88.0 131.9
2200 540 1466.3 94.4 78.6 118.5
2300 470 4478.9 78.8 65.7 99.8
2400 309 11597.1 54.5 45.0 69.6
2500 309 18795.3 33.7 30.4 44.3
E-3-23
MCDONNELL DOUGLAS ASTRONAUJTICS COMPANYV EAST
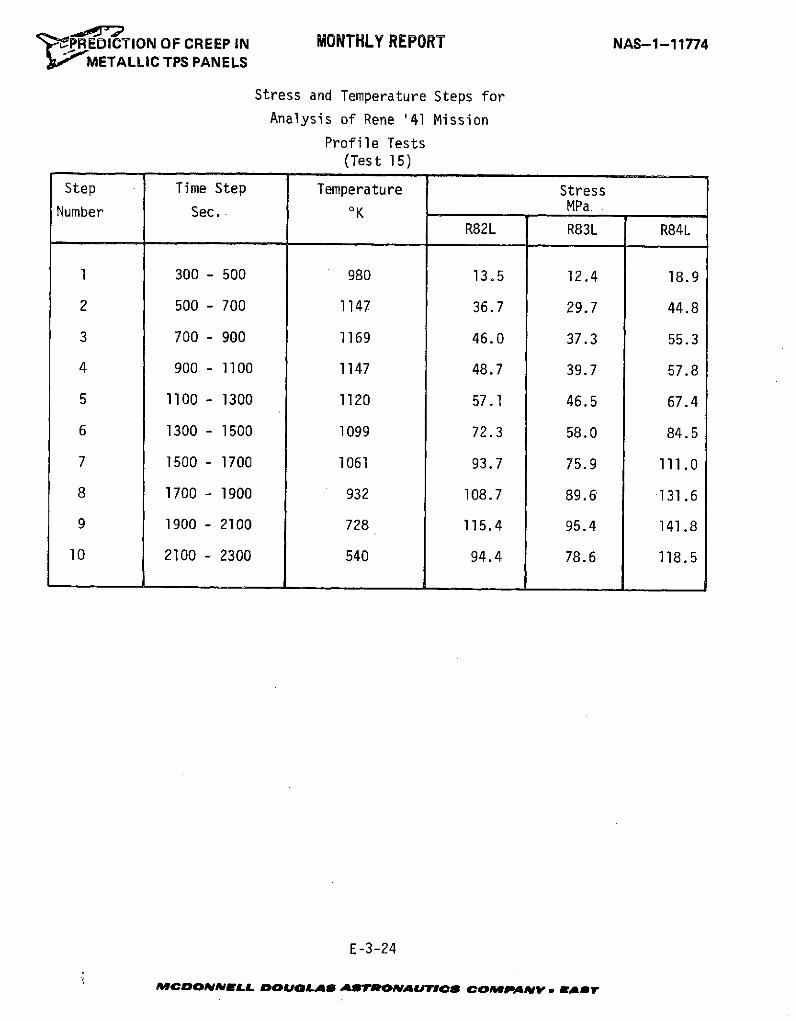
' PREDICTION OF CREEP IN MONTHLY REPORT NAS-1-11774SMETALLIC TPS PANELS
Stress and Temperature Steps for
Analysis of Rene '41 Mission
Profile Tests(Test 15)
Step Time Step Temperature StressNumber Sec. OK MPa.
R82L R83L R84L
1 300 - 500 980 13.5 12.4 18.9
2 500 - 700 1147 36.7 29.7 44.8
3 700 - 900 1169 46.0 37.3 55.3
4 900 - 1100 1147 48.7 39.7 57.8
5 1100 - 1300 1120 57.1 46.5 67.4
6 1300 - 1500 1099 72.3 58.0 84.5
7 1500 - 1700 1061 93.7 75.9 111.0
8 1700 - 1900 932 108.7 89.6 131.6
9 1900 - 2100 728 115.4 95.4 141.8
10 2100 - 2300 540 94.4 78.6 118.5
E-3-24
AMCDONNELL DOULA ASTIrONAUTIC COIAImANV u EAST
' 0PREDICTION OF CREEP IN PHASE I NAS-1-11774
METALLIC TPS PANELS SUMMARY REPORT
APPENDIX F-I
TDNiCr LITERATURE SURVEY CREEP DATA
Sources of this data are:
DAC-62124 - Killpatrick, D. H., and Hocker, R. G., "Stress-Rupture
and Creep in Dispersion Strengthened Nickel-Chromium
Alloys," McDonnell Douglas Corporation Report DAC-62124,
May 1968
G.E.-PVT-4662 and 5132 - Private Communications with General Electric Company
File number 4662 and 5132, September and October 1972
MDAC-W-INTL - McDonnell Douglas Astronautics Corporation - West,
in-house testing, 1971
NAS-3-15558 - Data Generated for NASA Lewis Research Center by
Metcut Research Associates under NASA contract
NAS-3-15558 and reported in NASA CR-121221, 1973
NAS-8-27189 - Data Generated for Marshall Space Flight Center, by
Vulcan Testing Laboratory under NASA contract
NAS-8-27189, 1971
F-1-1
mACDONNELL DOUGLAS ASTROMAUTICS COMPAWAMvY EASTer
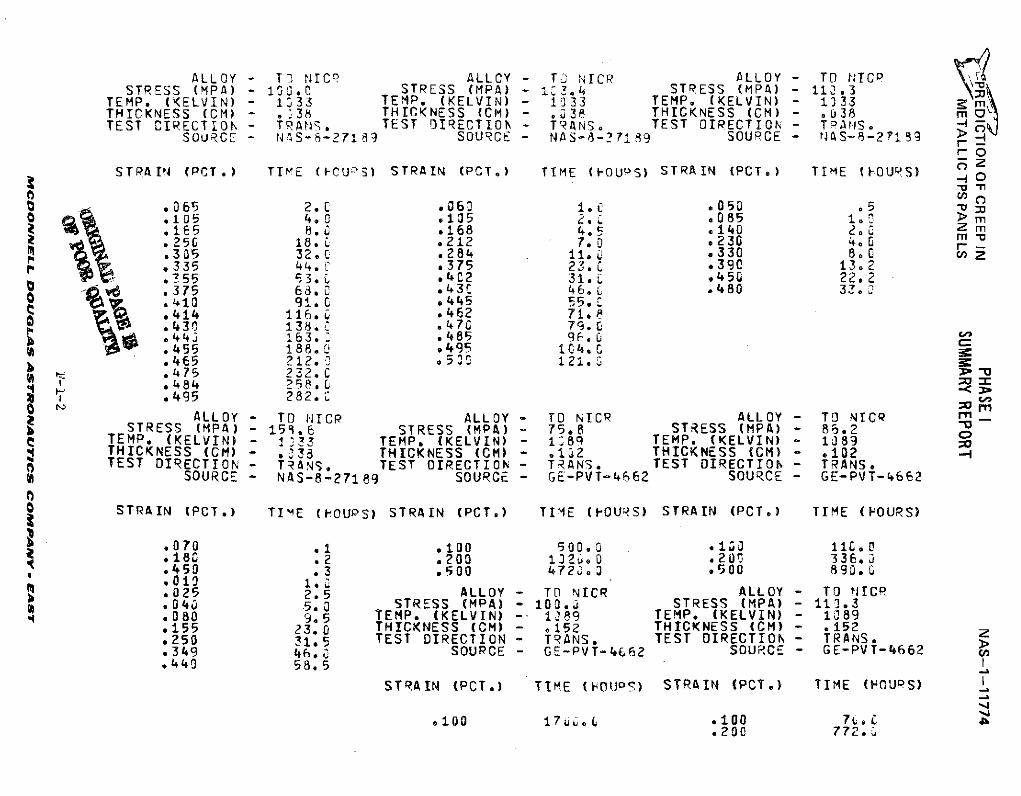
ALLOY - TO NICR ALLOY - TJ NICR ALLOY - TO NICPSTRESS (MPA) - 10,.0 STRESS (MPA) - i 3.4 STRESS (MPA) - 11.3 --
TEMP. (KELVIN) - 1333 TEMP. (KELVIN) - 133 TEMP. (KELVIN) - 1)33THICKNESS (CM) - .38 THICKNESS (CM) - .03P THICKNESS (CM) - .038 mTEST CIRECTION - TRANS. TEST OIRECTION - TRANS. TEST DIRECTION - Ta)A1S. -
SOURCE - NA1S- -271 8 9 SOURCE - NAS-8-2?7i-9 SOURCE - IAS-8-27139 > -
rO
STRAIN (PCT.) TIME (F-CUS) STRAIN (PCT,) TIME ( -OUPS) STRAIN (PCT.) TIME (-OUPS) O-o"o -n
.065 2.0 .060 1.C .050 .5 M-o .105 4.0 .135 2.85 m
S.1 5 8.3 .168 4.5 .140 2e m.250 18. C .212 7.0 O 230 40 m -
305 32.0 C .284 11ii.L .330 8.0 , Z.335 44. .375 23. C .390 13.2.355 53.. 9402 3 1. .450 22.2
S .375 66.0 *43C 46.L .480 33..410 91. 445 55.
.414 116. *462 71. P
.430 138,. .47G 79.0,443 163. .485 96. 0 cp.455 18 8.6 *495 IC4,. C=.465 212.0 5l0 12i. :.475 232.C
*495 282.Z IOALLOY - TO NICP ALLOY - TO NICR ALLOY - TO NICR rn
STRESS (MPA) - 159.6 STRESS (MPA) - 75.8 STRESS (MPA) - 86.2 -TEMP. (KELVIN) - 1 33 TEMP. (KELVIN) - 1:89 TEMP. (KELVIN) - 1089THICKNESS (CM) - .'3 THICKNESS (CM) - .12 THICKNESS (CM) - .102 --TEST DIRECTION - TRANS, TEST DIRECTION - TRANS. TEST DIRECTION - TRANS.
SOURCE - NAS-8-27189 SOURCE - GE-PVT-4662 SOURCE - GE-PVT-4662
STRAIN (PCT,) TIME (POUPS) STRAIN (PCT.) TIME (fOURS) STRAIN (PCT.) TIME (POURS)
.070 e1 .100 500.0 .1zi 110.0.070 .1 .i OO 532.0 •
.180 .2 .200 132t.0 .200 336.0
.450 .3 .500 472u.3 .500 890.0
.010 1.Z
.025 2.5 ALLOY - TO NICR ALLOY - TO NICR
.040 5.0 STRESS (MPA) - 100.j STRESS (MPA) - 113.3
.080 9.5 TEMP. (KELVIN) -- 189 TEMP. (KELVIN) - 1 89
.155 23.0 THICKNESS (CM) - .152 THICKNESS (CM) - .152
.250 31.5 TEST DIRECTION - TRANS. TEST DIRECTION - TRANS. z
.349 46,* SOURCE - GE-PVT-4662 SOURCE - GE-PVT-4662.440 58.5 1
STRAIN (PCT,) TIME (HOUoS) STRAIN (PCT.) TIME (HOURS)
.100 1 7 L. .100 7 ..200 772.2
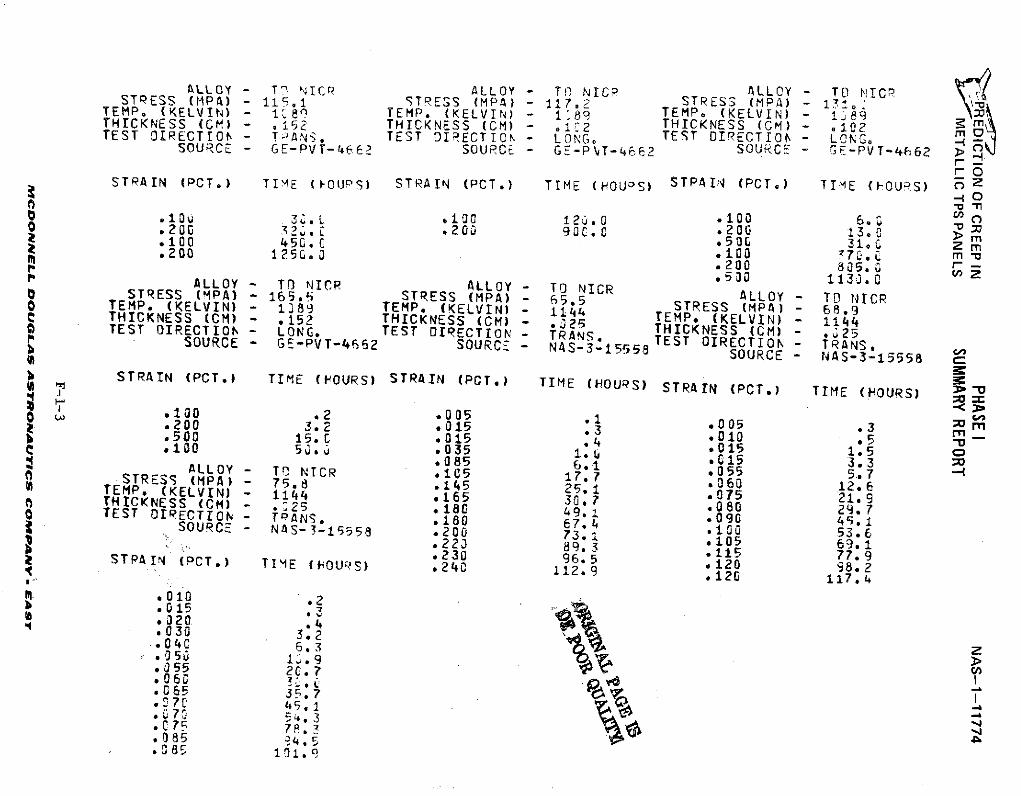
ALLOY - T NICR ALLOY - TO NICR ALLOY - TO NIC?STRESS (MPA) - 119.1 STRESS (MPA) - 117.2 STRESS (MPA) -
TEMP. (KELVIN) -in) TEMP. (KELVIN) - 1:89 TEMP. (KELVIN) - V4THITHICKNESS ) - THICKNESS (CM) - ~2 THICKNESS (CM) - .102 mTEST OIRECTION - T ANS. TEST DIRECTION - LONG. TEST DIRECTION - LONG. mSOURCE - GE-PVT-4(662 SOURCE - GE-P T-46F2 SOURCE - EF-PVT-4662
STRAIN (PCT.) TIME (tOUPS) STRAIN (PCT.) TIME (HOUOS) STRPAIN (PCT.) TIME (FOUZ'S) ZO
7 130 3.L .100 120.0 .100 6.3 o.200 12 .L .200 90C. .200 13.0 m100 450. .500 31.L z mS.200 1250. .I 00770. m
.200 8 05.0 r.530 113i.0ALLOY - TO NICR ALLOY - TO NICR 50 1130.00 STRESS (MPA) - 165.5 STRESS (MPA) - 65.5 ALLOY - TMP NCR0 TEMP. (KELVIN) - 1389 TEMP. (KELVIN) - 1144 TEMP (ELVIN) - 1144c THICKNESS (CM) - .152 THICKNESS (CM) - 25 THICKNESS (CM) - 250 TEST OIRECT - LOG. TEST DIRECTION - TRANS. TEST IRECTI - TRANS.SOURCE GE-PVT-4662 SOURCE - NAS-3-15558 E@ SOURCE - NAS-3-15558
l STRAIN (PCT.) TIME (HOURS) STRAIN (PCT.) TIME (HOUPS) STRAIN (POT.) TIME (HOURS).10 .2- 05S.20 .1 .005 .3 rn.200 3.2 .015 .3 .010 m.500 15.c .015 .4 .*015 1.5, -S 100 5 .035 1.0 .15 1.5 o
.085 6.1 *015 3.3ALLOY TO NICR .15 .17.55 5.7STRESS (HPA) 75.8 .145 25.1 0751.TEMP. (KELVIN) 1144 .165 30,7 *075 29THICKNESS (CM) .:2 .18c 49.1 .0092.TEST DIRECTION T- ANS. .180 674 .090 3.
SOURCE - NAS-3-15558 .200 73.1 .100 53.6.22 89.3 .105 69.1S230 96.5120 98.2STRAIN (PCT.) TIME (HiOURS) .240 9 .120 98.2112.9 120 117.4
NI .010 .2S.015.3
S.320, ..030 3.2.040 6.3.955 1.9
*060 .065 35F.7
70 45.1
.085 5.5
.085 i. 9
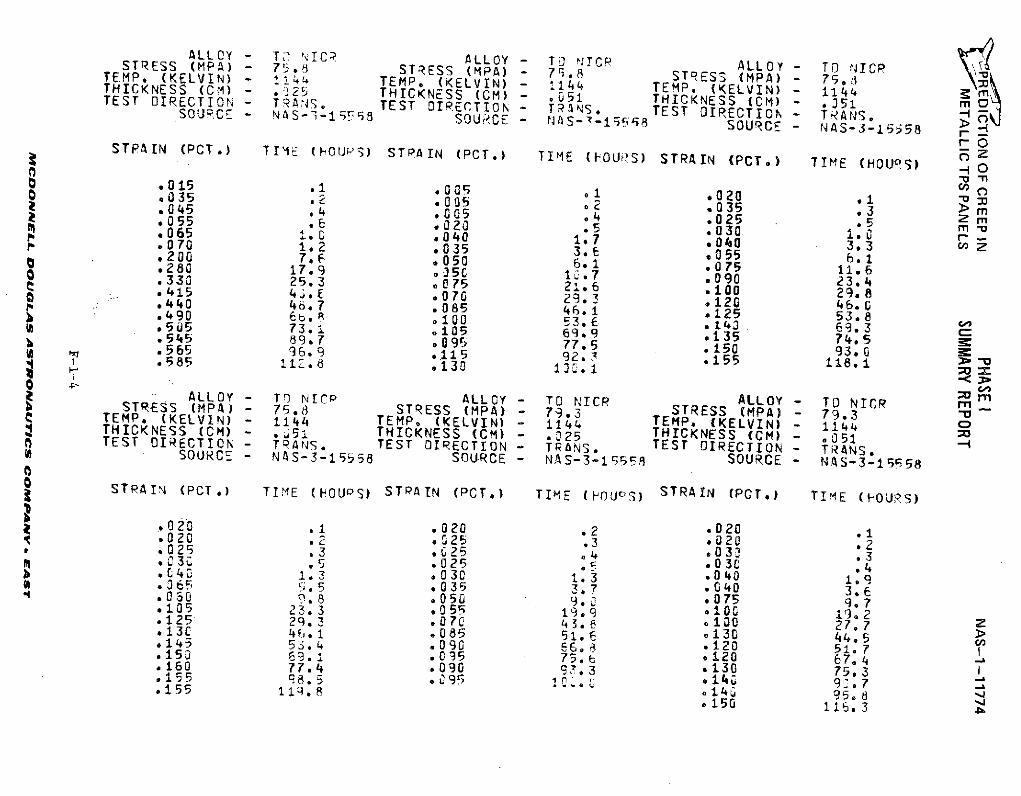
ALLOY - T2 NICR ALLOY - PT NICr ALLOY - TD NrICPSTRESS (MPA) - 75 STRESS (MPA) - 75,98 STRESS (MPA) 75.TEMP. (KELVIN) - 1144 TEMP. (KELVIN) 1144 TEMP. (ELVIN) 1144THICKNESS (CM) - .25 THICKNESS (CM) - 1 MP. (KELVIN) - 1144TEST DIRECTION - TRANS. TEST DIRETION - .RS1 THICKNESS (CM) - .51 mOU CE - NA S-I- TS c;ET-I ANS TEST DIRECTION - TRANS. 1
SOURCE- NAS--159CE8 S--5 SOURCE - NAS-3-15-58
STPAIN (PCT.) TIME (hOUvS) STRAIN (PCT.) TIME (hOURS) STRAIN (PCT.) TIME (HOURS) -0 0
.015 .1 .o005 -0 .20
.045 2 .005 .035 .3 m. 055 .020 .5 .030 1.0 -oM : •o,040 1•7 .040 3.3 z.070 1.2 .035 3.6 .055 6.1.200 7.6 .050 5.1 .075 11.6.280 17.9 .35C 1.7 .090 23.,.330 25.3 .075 2. 6 .100 23
S.440 4.7.07 29.3 .120 46.0S.49406b7 .085 45.1 .125 53.87490 0b. .100 53. E 143 69.3 C^ 7 .105 69.9 .135 74.5S545 89.7 o091 77.5 .150 93. 0S.565 96.9 .115 92. .155 93.0S.585 112.8 .130 13 .1 .
ALLOY - TD NICP ALLOY - TO NICP ALLOY - TO NICR PmSTRESS (MPA) - 75.8 STRESS (MPA) - 79.3 STRESS (MPA) - 79.3S(KELVIN) - 11 TEMP. (KELVIN) -1144 TEMP. (KELVIN) 1144 THP. (KELVIN) - 114 o1 THICKNESS (CM) 51 THICKNESS (CM) - .- 25 THICKNESS (CM) - 051TEST DIRECTION - T ANS. TEST DIRECTION - TRANS. TEST DIRECTION - TRANS.SOURCE - NAS-3-15558 SOURCE - NAS-3-15551 SOURCE - NAS-3-15558
STRAIN (PCT.) TIME (HOUDS) STPAIN (PCT.) TIME (HOUO1) STRAIN (PCT.) TIME (POURS)
.020 .1 .020 .2 .020 e1S020 .2 .025 .3 .020 .2.025 3 .625 a4 .03 .30 3. .5 025 .030 .4
.C4'0 1.3 .030 1.3 *040 1.9.065 5. 5 .035 3.7 * 40 3.605O0 I. .050 9, 1 .075 9. 7.105 23.3 .055 19.9 1I00 1,9.2.125 29. 3 .070 43.8 .100 27, 713~~45.1 .085 51. 130 44.5.145 53.4 .090 66.8 ,120 51.7* 150 69. .035 75,6 .120 67. 4.160 77.4 .090 93.3 .130 75. 3 Io155 q8.5 .095 o 4, .140 9,7
.155 11- 8 144 95. 8150 11. 3
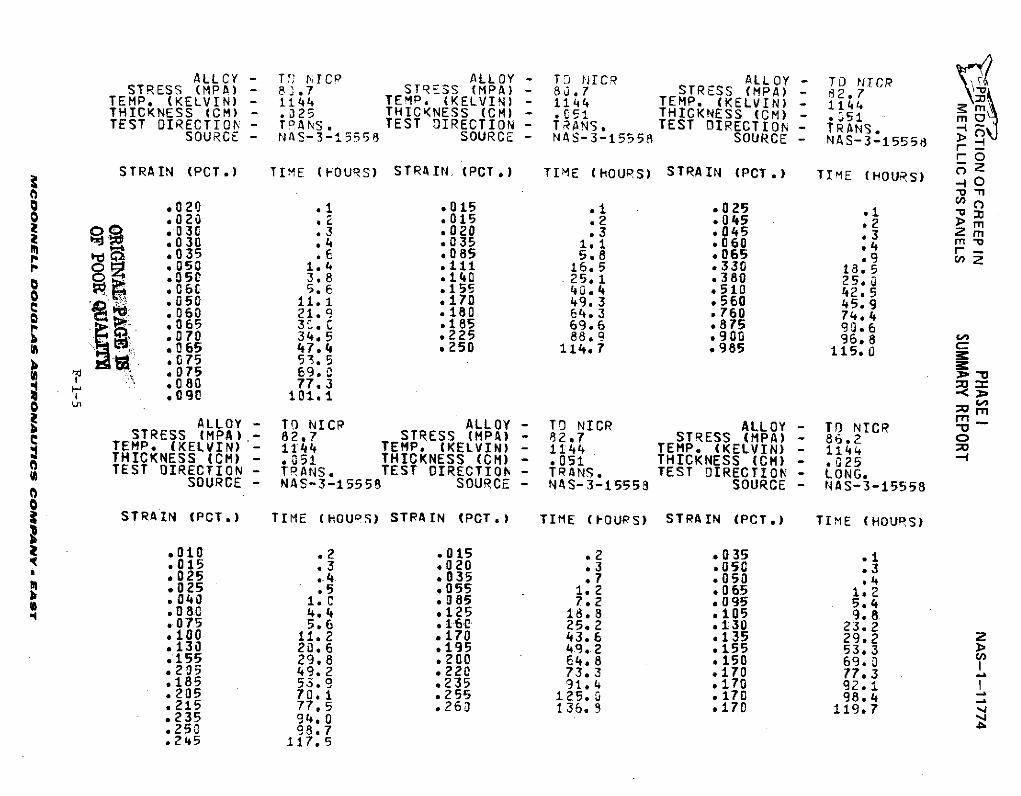
ALLCY - TT' NICP ALLOY - TD NICR ALLOY - TD NTCRSTRESS (MPA) - 8J.7 STRESS (MPA) -8.7 STRESS (MPA) - 2.7
TEMP. (KELVIN) - 1144 TEMP. (KELVIN) - 1144 TEMP. (KELVIN) -1144THICKNESS (CM) - .25 THICKNESS (CM) - .C51 THICKNESS (CM) - .51TEST DIRECTION - TRANS, TEST DIRECTION - TRANS, TEST DIRECTION - TRANS.
SOURCE - NAS-3-15558 SOURCE - NAS-3-155 5 SOURCE - NAS-3-15558
POSTRAIN (PCT.) TIME (FOURS) STRAIN (POCT) TIME (HOURS) STRAIN (PCT.) TIME (HOURS) O
0
.020 .1 *015 .1 .025 1S.020 . .015 .2 .045 .200 .03C .3 .020 .3 .045 .3 2 mSw .030 .4 .035 11 060 .4 m
.035 . .085 5.8 .065 .O .050 1.4 .111 16.5 *330 18.5
.050 3.8 .140 25.1 .380 25.u
.06 5.6 .155 404 .510 42.5
.050 11.1 .170 49.3 .560 45.9060 21.9 .180 64.3 .760 74.4* .065 3.C *185 69.6 .875 90.6.070 34.5 *225 88.9 0900 96.8 c_.065 47.4 .250 114.7 .985 115.0
N .075 53.5S- .075 69.0
.080 77.3
.090 101.1O CIO
ALLOY - TO NICP ALLOY - TO NICR ALLOY - TO NICR V-STRESS (MPA) 82.7 STRESS (MPA) - 82.7 STRESS MPA) - 86.2TEMP. (KELVIN) - 1144 TEMP. (KELVIN) - 1144 TEMP. (KELVIN) - 1144THICKNESS (CM) - 051 THICKNESS (CM) - .051 THICKNESS (CM) - .025TEST DIRECTION - TRANS. TEST OIRECTION - TRANS. TEST DIRECTION - LONG.
SOURCE - NAS-3-15558 SOURCE - NAS-3-15553 SOURCE - NAS-3-15558
STRAIN (PCT.) TIME (HOURS) STRAIN (PCT.) TIME (IOURS) STRAIN (PCT.) TIME (HOURS)
.010 .2 .015 .2 .035 .1*015 .3 *020 .3 .050 .3S025 .4. .035 .7 .050 .4* .025 .5 .055 1.2 .065 1.2*040 1.0 .085 7.2 .095 5.4.080 4.4 .125 18.8 .105 9.8.075 5.6 .16 25.2 .130 23.2.100 11.2 .170 43.6 .135 29.2 Z.130 20.6 .195 49.2 *155 53.3.155 29.8 .200 64.8 .150 69.0 C,.235 49.2 .220 73.3 .170 77.3.185 53.9 .235 31.4 .170 92.1*205 70.1 .255 125.0 .170 98.4.215 77.5 .260 136.3 9170 119.7.235 94.0.250 98.7.245 117.5
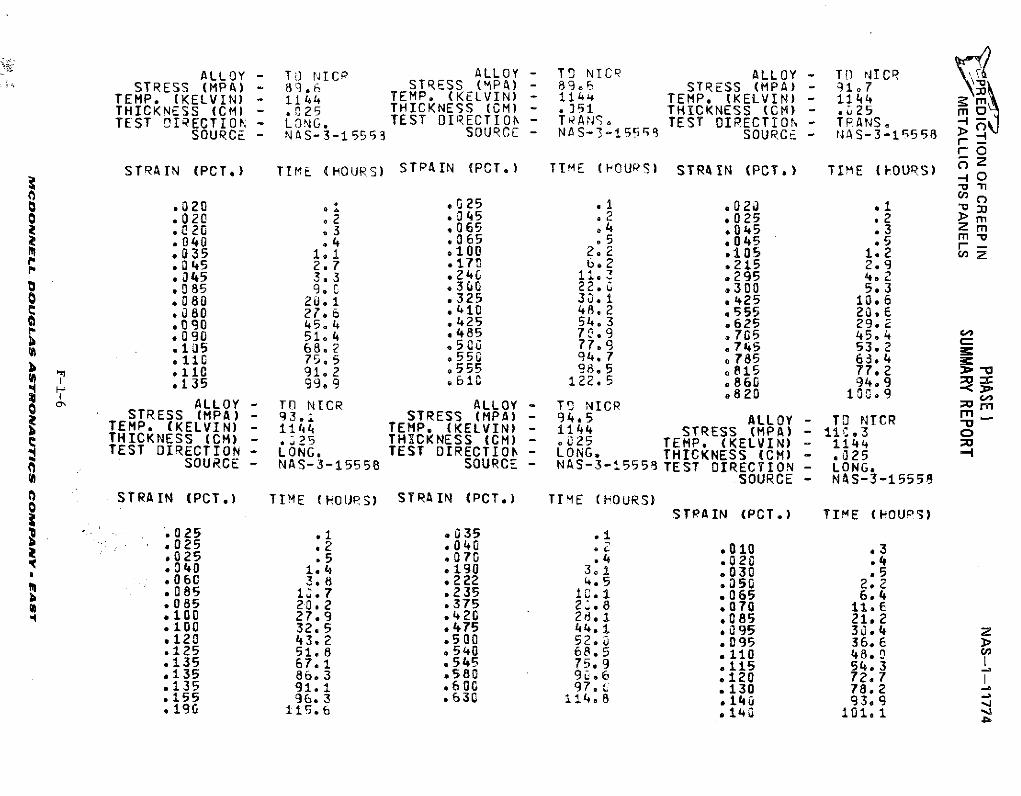
ALLOY - TO rNICP ALLOY - TO NICR ALLOY - TO NICR .STRESS (MPA) - 8 .5 STRESS (MPA) - 89 STRESS (MPA) - 91.7
TEMP. (KELVIN) - 1144 TEMP. (KELVIN) - 1144 TEMP. (KELVIN) - 1144THICKNESS (CM) - .025 THICKNESS (CM) - .351 THICKNESS (CM) - 25 mTEST DIRECTION - LONG. TEST DIRECTION - T ANS TEST DIRECTION - TRANS.
SOURCE - NAS-3-15553 SOURCE - NAS-3-155r9 SOURCE - NAS-3-1558rO
STRAIN (PCT.) TIME (HOURS) STRPAIN (PCT.) TIME (HOUPS) STRAIN (PCT.) TIME (hOURS)-nl
.020 *.025 .1 .020 10 .020 .2 .045 .2 .025 .2 m
S.020 .3 .065 .4 .045 .3 Z m1 .040 .4 .065 .5 .045 .5 rm
.035 101 .100 2.2 .105 1.2 C/p .045 2.7 .170 6.2 .215 2.9
. 45 3.3 *240 11.3 .295 4.2
.085 9. c .300 22.0 .300 5.30 .080 20.1 9325 30.1 .425 10.6
C .080 27.6 .410 48.2 .555 20.6.090 45.4 .425 54.3 .625 29.2.090 51.4 *485 70.9 .705 45.4 l.105 68.2 *500 77.9 .745 53.2.110 75.5 *550 94.7 .785 63.4.110 91.2 .555 98.5 .815 77.2.135 99,.9 .o10 122.5 .860 94.9
.820 100.9ALLOY - TO NICR ALLOY - TO NICR :m _
STRESS (MPA) - 93.1 STRESS (MPA) - 94,5 ALLOY - TO NICR --TEMP. (KELVIN) - 1144 TEMP. (KELVIN) - 1144 STRESS (MPA) - 11C.3 oSTHICKNESS (CM) - .25 THICKNESS (CM) - .025 TEMP. (KELVIN) - 1144 :TEST DIRECTION - LONG, TEST DIRECTIOn - LONG. THICKNESS (CM) - .025SOURCE - NAS-3-15558 SOURCE - NAS-3-15558 TEST DIRECTION - LONG.
SOURCE - NAS-3-15558
STRAIN (PCT.) TIME (HOUPS) STRAIN (PCT.) TIME (FOURS)SSTPAIN (PCT,.) TIME (POURS)
.025 .1 .035 .1.025 .2 .00 .010 .3*025 .5 .070 .4 .020 .4.340 1.4 .190 3,1 .030 .5.060 3.8 .222 4.5 .350 2.2.085 13.7 .235 10.1 .065 6.4
0 .085 20.2 9375 2L.8 .070 11.6.100 27.9 .420 28.1 .085 21.2.100 32.5 .475 44.1 .095 30.4 Z.120 43.2 .500 52.0 .095 36.6 >.125 51.8 .540 68.5 .110 48 .0.135 67.1 .545 75.9 .115 54.3.135 86.3 .580 90.6 .120 727 I.135 91.1 .600 9 7 . L .130 78.2.155 96.3 .630 114.8 .140 93.9 b.190 115.6 .14 101 .1
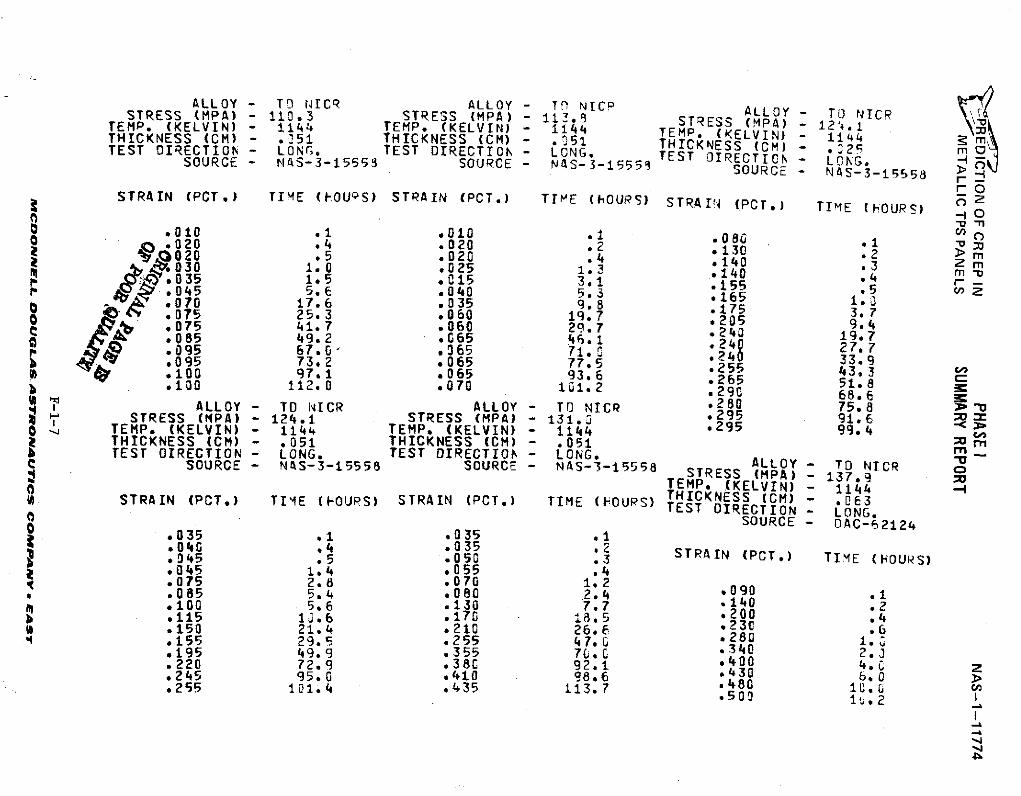
ALLOY - TO NtICR ALLOY - Tn NICP ALLOY- TO NTCRSTRESS (MPA) - 110.3 STRESS (MPA) - 113.8 STRESS (MPA) - 12.
TEMP. (KELVIN) - 1144 TEMP. (KELVIN) - 1144 TEMP. (KELVIN) - 1144THICKNESS (CM) - .151 THICKNESS (CM) - .51 THICKNESS (CM) - .325TEST OIRECTION - LONG. TEST DIRECTION - LONG. TEST DIRECTION - LONG.
SOURCE - NAS-3-15553 SOURCE - NAS-3-15558 SOURCE - NAS-3-155 5
rSTRAIN (PCT.) TIME (FOUQS) STRAIN (PCT.) TIME (hOURS) STRAIN (PCT.) TIME (hOURS) .0o
.010 .1 .010 .1 084 .020 .4 .020 .2 *130 2 >0020 .5 .020 .4 *140 .3 Z m
~ -030 1.0 .025 1.3 .140 .4 m ".045 5.6 .040 5.3 .165 . a.070 17.6 .035 9.8 .175 3.7
D .075 25.3 .060 19.7 205 9.40 .075 41.7 .060 29.7 .240 19.
*085 49.2 .G65 46.1 .240 27.7S .095 67.0 .065 71.0 .240 33.9.095 73.2 .065 77.5 .255 43.3* .100 97.1 .065 93.6 .265 51.8.100 112.0 .070 101.2 .290 68.6
T ALLOY - TO NICR ALLOY - TO NICR .280 75.8mm' STRESS (MPA) - 124.1 STRESS (MPA) - 131.0 .295 91.6o TEMP. (KELVIN) - 1144 TEMP. (KELVIN) - 1144 .295 99 4THICKNESS (CM) - .051 THICKNESS (CM) - .051o r
TEST OIRECTION - LONG. TEST DIRECTION - LONG. ALLOY - TO TCc SOURCE - NAS-3-15558 SOURCE - NAS-3-15558 ALLOY - TD NICR oSTRESS (HPA) - 137.9 oTEMP. (KELVIN) - 1144-THICKNESS (CM) - .0E3
STRAIN (PCT.) TIME (FOURS) STRAIN (PCT.) TIME (OURS) TEST DIRE(CM) - .063) SOURCE - OAC-62124.035 .1 0351
*04 . .035 .2 STRAIN (PCT.) TIME (HOURS).5 5 .050 .3.045 1.4 .055 .4.075 2.8 .070 1.2.085 5.4 .080 2.4 .090 .1.100 5.6 .130 7.7 .140 .2S.115 10.6 .170 18.5 .200 .4
S.150 21.4 .210 26.6 .230 .64 •155 29.5 .255 47. L .280 1.
.195 49.9 .355 7G.C .340 2.3
.220 72.9 .380 92.1 .400 4 .C
.245 95.0 .410 98.6 .430 6, 0
.255 11.4 .435 113.7 .480 10 O u..50i 1 .2
-,4
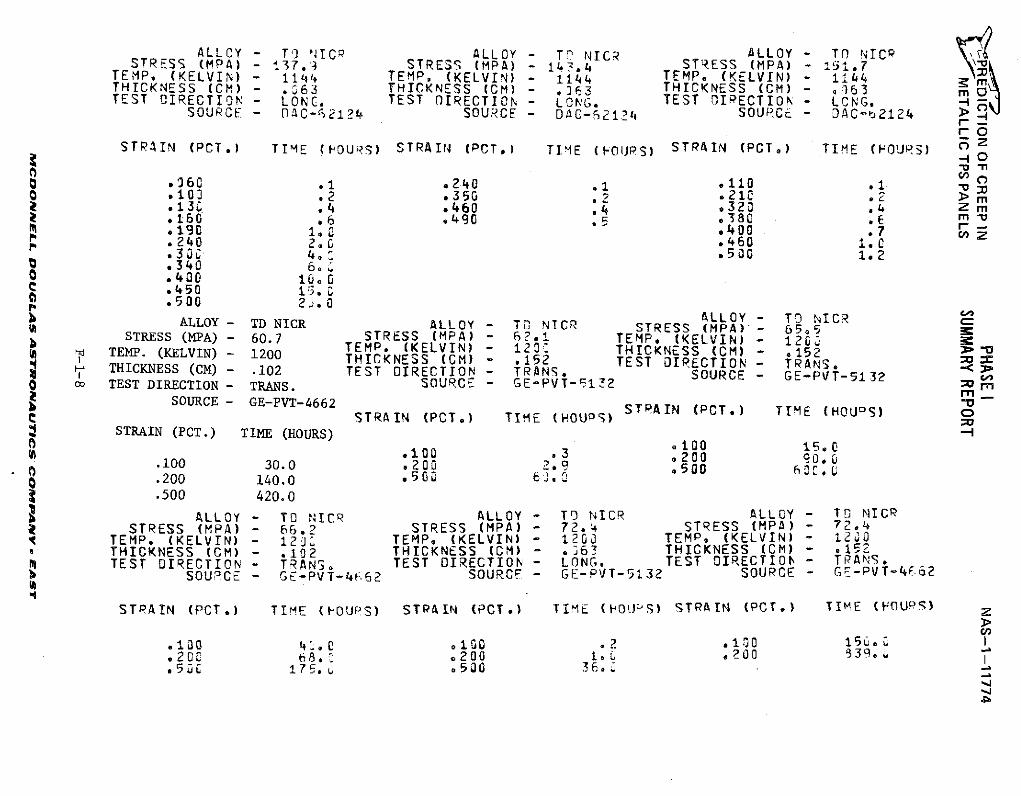
ALLOY - TO 'NIC ALLOY - TA NCR ALLOY - TO NIC\STRESS (MPA) - 137.3 STRESS (MPA) - 1.4 STRESS (MPA) - 151.7
TEMP. (KELVIN) - 114 TEMP. (KELVIN) - 1144 TEMP. (KELVIN) - I44THICKNESS (CM) - .)63 THICKNESS (CM) - .363 THICKNESS (CM) - 163 mTEST OIRECTION - LONG. TEST DIRECTION - LONG. TEST DIRECTION - LCNG. I oSOURCE - DaC-r2124 SOURCE - DAC-121Z4 SOURCE - DAC-b2124 >
0
STRAIN (PCT.) TIME (POURS) STRAIN (PCT.) TIME (FOUJPS) STRAIN (PCT.) TIME (HOURS) 0 z.- 0
.060 .1 .20 .1101 mO .103 .2 .350 .2 .210 2 > m
13 .4 .460 :4 .320 .4 m.160 .6 .490 .5 .380 -m.190 1,0 400 .7 cz.240 2. *460 i.0.30 4., .500 1.2.340 ..400 10.0.450 15.0.500 2j.0
ALLOY - TD NICR ALLOY - TD NTCR STRESS (MLLPA - 65.5IC..... S (AY- 65, 5CSTRESS (MPA) - 60.7 STRESS (MPA) - 6?.1 TEMP. (KELVIN) - 1260TEMP. (KELVIN) - 1200 TEMP. (KELVIN) - 120 THICKNESS (CM) - .152STEMP. (KELVIN) - 120THICKNESS (CM) .15 TEST DIRECTION - TRANSH THICKNESS (CM) - .102 TEST DIRECTION -TRANS. SOURCE- GE-PVT-5132co TEST DIRECTION - TRANS. SOURCE - GE-PVT-512 SR G-_
SOURCE - GE-PVT-4662STRAIN (PCT. TIME (HOUS) STRAIN (PCT.) TIME (HOUOS) o
STRAIN (PCT.) TIME (HOURS)STRAIN (PCT.) TIME (HOURS) .100 15.0.100 .3 .200 90.0.100 30.0 .200 2.9 .500 60 ,U
.200 140.0 .5 0 6
.500 420.0
ALLOY - TO NICR ALLOY - TO NICR ALLOY - TD NICRSTRESS (MPA) - 66,2 STRESS (MPA) - 72.4 STRESS (MPA) - 72.4
TEMP. (KELVIN) - 12J TEMP. (KELVIN) - 1200 TEMP. (KELVIN) - 12J0THICKNESS (CM) - .102 THICKNESS (CM) - .363 THICKNESS (CM) - .152TEST DIRECTION - TRANS3 TEST DIRECTION - LONG. TEST DIRECTION - TRANS.
SOURCE - GE-PVT-4:62 SOURCE - GE-PVT-I532 SOURCE - GP-PVT-F-2
STRAIN (PCT.) TIME (FOURS) STRAIN (PCT.) TIME (tO!U'S) STRAIN (PCT.) TIME (FOURS)
.100 4,0 o10 .2 .100 150.0
.200 68,0 .200 1.0 *200 539.~
.5Su 175. .500 36.
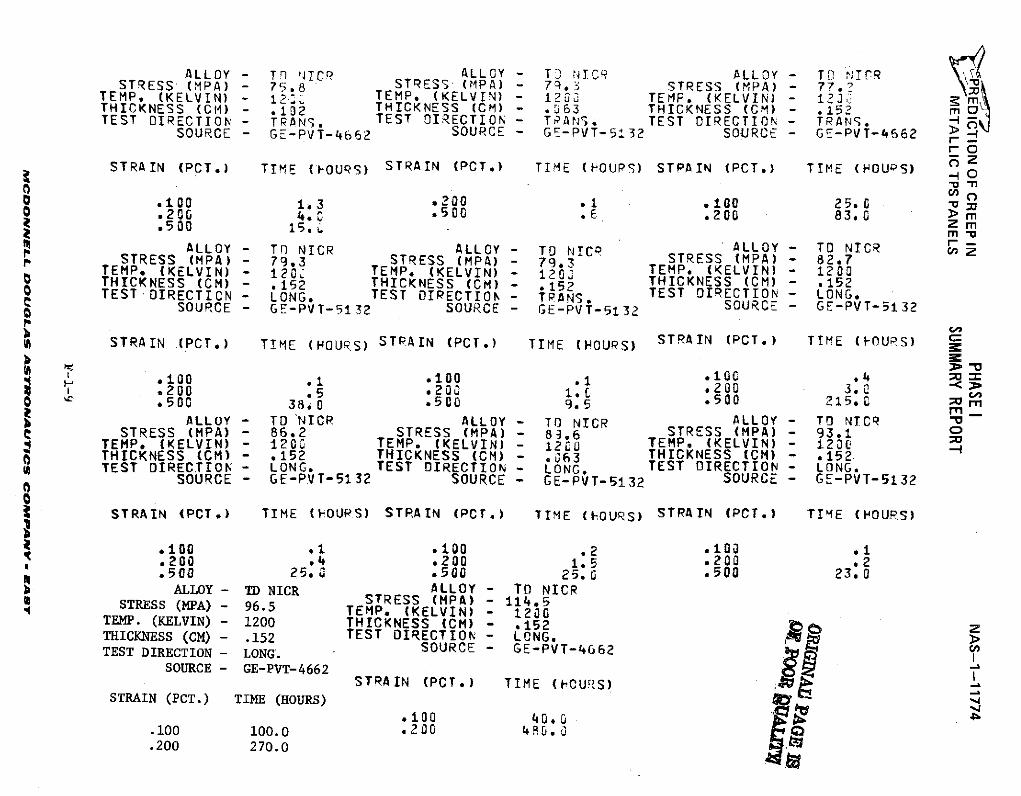
ALLOY - T9 NICR ALLOY - T3 NTIC ALLOY - TD ICRSTRESS (MPA) - 75.8 STRESS (MPA) - 79.3 STRESS (MPA) - 77.?
TEMP. (KELVIN) - 12- TEMP. (KELVIN) - 120 TEMP. (KELVIN) - 12 yiTHICKNESS (CM) - .102 THICKNESS (CM) - .063 THICKNESS (CM) - .152TEST DIRECTION - TAN. TEST DIRECTION - TRANS. TEST DIRECTION - TRANS.
SOURCE - GE-PVT-4662 SOURCE - GE-PVT-5132 SOURCE - GE-PVT-4662 >rO
STRAIN (PCT.) TIME (FOURS) STRAIN (PCT.) TIME (fOUPS) STPAIN (PCT.) TIME (HOURS)
.100 1.3 *200 .1 .100 25.0
.200 4.0 .500 .6 .200 83.0 >m
.500 15. i Z m
ALLOY - TF NICR ALLOY - TO NICo ALLOY - TO NICR 'STRESS (MPA) - 79.3 STRESS (MPA) - 79q3 STRESS (MPA) - 82.7
TEMP. (KELVIN) - 120, TEMP. (KELVIN) - 1202 TEMP. (KELVIN) - 1200THICKNESS (CM) - .152 THICKNESS (CM) - .152 THICKNESS (CM) - .152TEST DIRECTICN - LONG. TEST DIRECTION - TRANS. TEST DIRECTION - LONG.
SOURCE - GE-PVT-5132 SOURCE - GE-PVT-5132 SOURCE - GE-PVT-5132
CO,i STRAIN (PCT.) TIME (HOURS) STPAIN (PCT.) TIME (HOURS) STRAIN (PCT.) TIME (FOURS)
' H .100 .1 *100 .1 .200.200 .5 *200 1.0 .200 3.00 ~ .500 38.0 .500 9.5 .500 215.0m
ALLOY TO - TOALLOY TO NICR ALLOY - TO NTCRSTRESS (MPA) - 86.2 STRESS (MPA) - 89.6 STRESS (MPA) - 93.1 0
TEMP. (KELVIN) - 1200 TEMP. (KELVIN) - 1200 TEMP. (KELVIN) - 1200THICKNESS (CM) - .152 THICKNESS (CM) - .063 THICKNESS (CM) - .152TEST DIRECTIO- LONG. TEST DIRECTION - LONG. TEST DIRECTION - LONG.
SOURCE -GE-PVT-5132 SOURCE - GE-PVT-5132 SOURC P 32
t STRAIN (PCT.) TIME (IOUPS) STRAIN (PCT.) TIME (-OURS) STRAIN (PCT.) TIME (HOURS)
.100 .1 .100 .2 *100 .1
.200 .4 .200 1.5 *200 .2
.500 25.0 .500 25.0 .500 23.0ALLOY - TD NICR ALLOY - TD NICR
STRESS (MPA) - 96.5 STRESS (MPA) - 114.5TEMP. (KELVIN) - 1200TEMP. (KELVIN) - 1200 THICKNESS (CM) - .152THICKNESS (CM) - .152 TEST DIRECTION - LONG.TEST DIRECTION - LONG. SOURCE - GE-PVT-4662 I
SOURCE - GE-PVT-4662STRAIN (PCT.) TIME (I-OURS)
STRAIN (PCT.) TIME (HOURS).100 40o 0
.100 100.0 .200 49O. '
.200 270.0
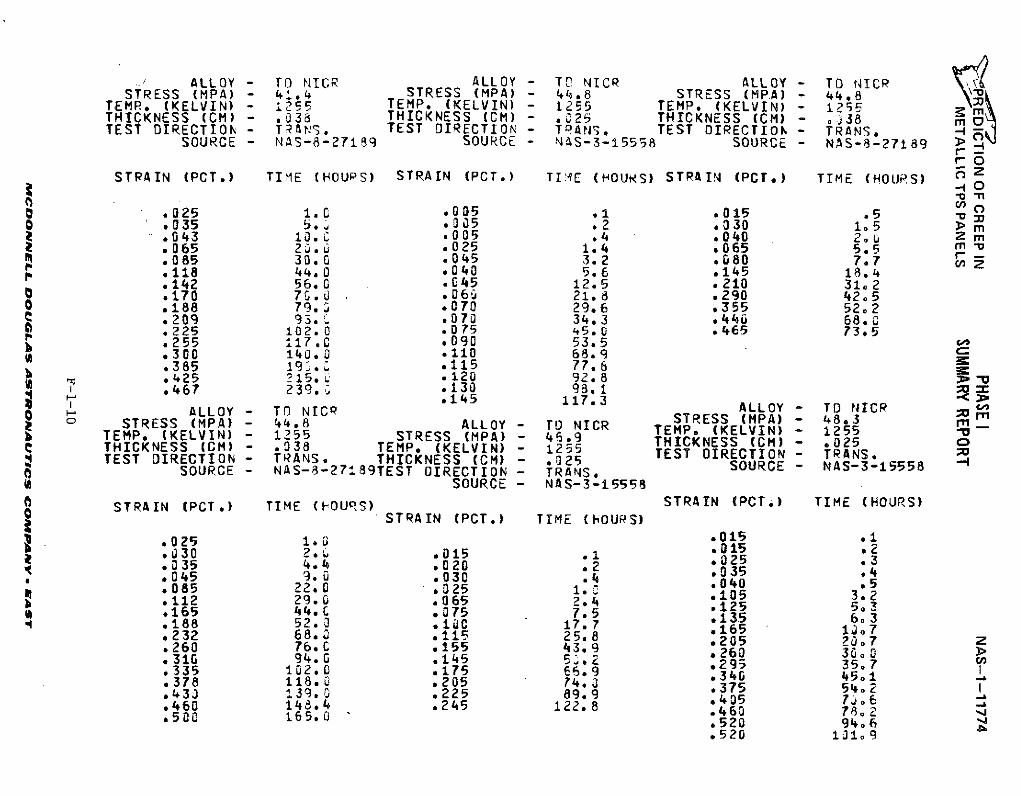
ALLOY - TO NICR ALLOY - Tn NICR ALLOY - TO NICRSTRESS (MPA) - 41.4 STRESS (MPA) - 44.8 STRESS (MP.A) - 44.8
TEMR. (KELVIN) - 1255 TEMP. (KELVIN) - 1255 TEMP. (KELVIN) - 1255THICKNESS (CM) - .038 THICKNESS (CM) - .025 THICKNESS (CM) - ,338 mTEST DIRECTION - TRANS. TEST DIRECTION - TRANS TEST OIRECTION - TRANS,
SOURCE - NAS-8-27189 SOURCE - NAS-3-15558 SOURCE - NAS-8-27189rO
STRAIN (PCT.) TITE (HOUPS) STRAIN (PCT.) TIAE (HOURS) STRAIN (PCT.) TIME (HOURS) 1 Z
-O.025 1.C .005 .1 .015 .5
0 .035 5. .305 .2 .0330 1.5 m.043 10.C .005 .4 .040 2.6 Z m.065 2".1 .025 1.4 .065 5.5 r.085 30.0 .045 3.2 .080 7.7 cn.118 44.0 .040 5.6 .145 18.4.142 56.0 .045 12.5 .210 31.2.170 7(. .D060 21.8 .290 42,5
O .188 79, .070 29.6 .355 52.2.209 93. . .070 34.3 *440 68.0.225 102.0 .075 45.0 .465 73.5.255 117.0 .090 53.5.300 140.0 .110 68.9.385 19. 115 77.6.425 215.. .120 92.8.467 239.. .130 93.1
e145 117.3ALLOY - T NIC 3 ALLOY - TD NICR no ALLOY - TO NI STRESS (MPA) - 483 mSTRESS (MPA) - 44.8 ALLOY - TO NICR TEMP (KELVIN) - 1255 -
TEMP. (KELVIN) - 1255 STRESS (MPA) - 46.9 THICKNESS (CM) - 025 0C THICKNESS (CM) - .038 TEMP. (KELVIN) - 1255 TEST DIRECTION - TRANS
TEST DIRECTION - TRANS. THICKNESS (CM) - .025 SOURCE - NAS-3-.5558SOURCE - NAS-8-27189TEST DIRECTION - TRANS.
SOURCE - NAS-3-15558
STRAIN (PCT.) TIME (POURS) STRAIN (PCT.) TIME (HOURS)S STRAIN (PCT.) TIME (OUPS)
.025 1.0 .015 .1
.030 2 L .0151 015-1 "025 •3.035 4.4 .020 .2 *035
.045 3. 0 .030 .4 . .4
.085 22.0 .025 1.Z .040 .5
.112 29.0 .065 2.4 .1025 3.2.165 44.C .075 7.5 .125 6.3.188 52.3 .100 17.7 "165 1,37.232 68. 0 .115 25.8 .205 20.7 z
.260 76.C .155 43.9 .260 3 20
.310 94.0 .145 5. 2 .295 3. 7
.335 102.0 .175 66.9 .340 451
.378 118.0 .205 74.J .375 54.2.433 i 9.0 .225 89.9 .35 5j6
.460 148.4 .245 122.8 .460 78.2500 165.0 520 94..520 1-31.9
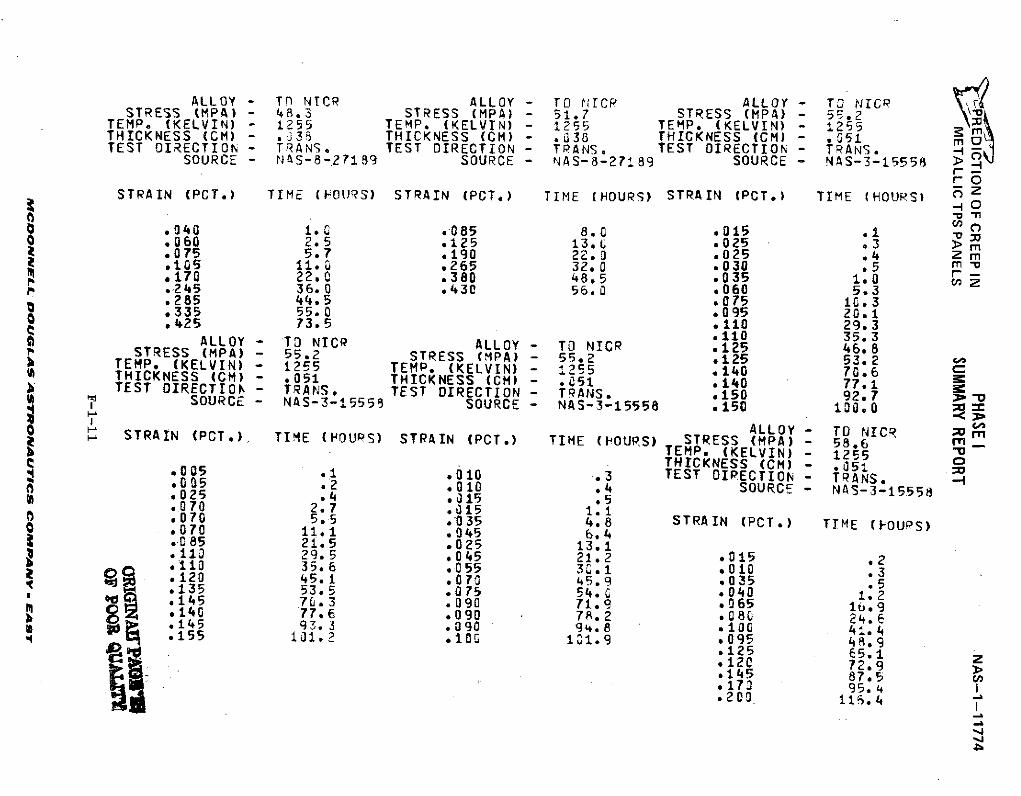
ALLOY - Tn NICR ALLOY - TO NICR ALLOY - TO rNICpSTRESS (MPA) - 48.3 STRESS (MPA) - 51.7 STRESS (MPA) - 5E.2
TEMP. (KELVIN) -1255 TEMP. (KELVIN) - 255 TEMP. (KELVIN) - 1255 gTHICKNESS (CM) - .35 THICKNESS (CM) - .038 THICKNESS (CM) - .051mTEST DIRECTION - TRANS. TEST DIRECTION TRANS. TEST DIRECTION - TRANS. -SOURCE - N AS 8.-27189 SOURCE - NAS-8-27189 SOURCE - NA S-3-15558 >
rOSTRAIN (PCT.) TIME (hOURS) STRAIN (PCT.) TIME (HOURS) STRAIN (PCT.) TIME (HOURS) z
-n.040 1.0 .085 8.0 .015 .1 M.060 2.5 .125 13.1 .025 .3 m.075 5.7 .190 22.0 .025 .4 Z m.105 11.0 .265 32.0 .030 .5 m ".170 22.0 .380 48.5 .035 1.0 c.245 36.0 .430 56.0 .060 5.3.285 44.5 .075 10.3.335 55.0 .095 20.1.425 73.5 .110 29.3S110 35.3
ALLOY - TO NICP ALLOY - TO NICR .125 46. 8STRESS (MPA) - 55.2 STRESS (MPA) - 55,2 .125 53.2 cTEMP. (KELVIN) - 1255 TEMP. (KELVIN) - 1255 .140 70.6THICKNESS (CM) - .051 THICKNESS (CM) -. 051 .140 77.1 BTEST OIRECTION - TRANS. TEST DIRECTION - T RANS. .150 92.7 oSOURCE - NAS-3-15555 SOURCE - NAS-3-15558 .150 100.0SALLOY - TO NICR
STRAIN (PCT.). TIME (HOUPS) STRAIN (PCT.) TIME (HOURS) STRESS (MPA) - 58.6TEMP. (KELVIN) - 1255THICKNESS (CM) - .051
*005 .1 .010 .3 TEST DIRECTION - TRANS..005 .2 .018 .4 SOURCE - NAS-3-1555 8.025 .4 .015 .5.070 2.7 .015 1.10 .070 5.5 .035 4.8 STRAIN (PCT.) TIME (-OUPS)S.070 11.1 .045 6,4.085 21.5 .025 13.111ii 29.5 .045 21.2 .015 .2.110 35.6 .055 3.1 .010 .3.120 45.1 .070 45.9 .035 .5
*135 53.5 .075 54.C .040 1.2S 145 70.3 .090 71.9 .065 16.9.140 77.6 .090 78.2 *08L 24.6S; .145 93.3 .090 94,.8 .100 4.4.155 101.2 105 101.9 .095 48 9.125 5.1 z.120 72.9*145 87.5.173 95. 4*200 11.i 4
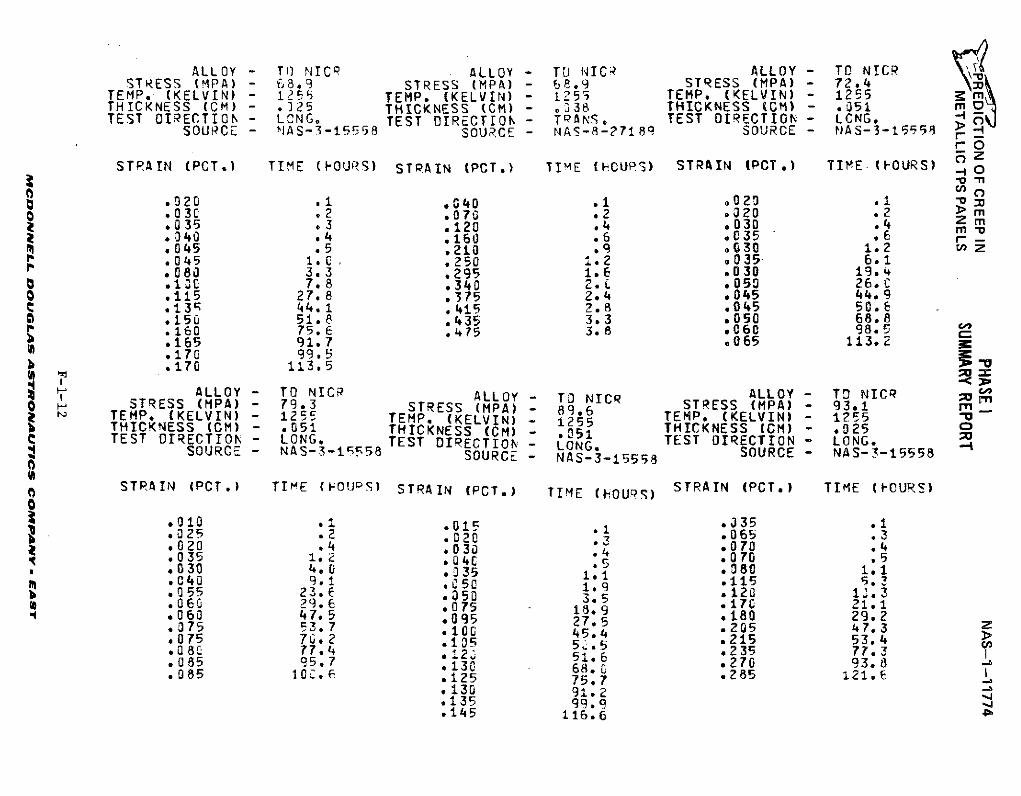
ALLOY - TO NICR ALLOY - TU NICR ALLOY - TO NICR ,STRESS (MPA) - 68.9 STRESS (MPA) - 68.9 STRESS (MPA) - 72.4
TEMP. (KELVIN) - 1255 TEMP. (KELVIN) - 1253 TEMP. (KELVIN) - 1255THICKNESS (CM) - .•25 THICKNESS (CM) - .338 THICKNESS (CM) - .051TEST IRECTION - LCNG. TEST DIRECTION - TPANS. TEST DIRECTION - LCNG.
SOURCE - NAS-3-15558 SOURCE - NAS-8-27189 SOURCE - FNAS-3-15558rO
STRAIN (PCT.) TIME (FOURS) STRAIN (PCT.) TIME (OCURS) STRAIN (PCT.) TIME. (I-OURS) o
.920 .1 .040 *1 020 .1 .mS.03C .2 .070 .2 .020 .2 m
; .035 3 .120 *.4 .030 .4 rz .040 .4 .160 .6 .035 .6 r -~ .045 .5 .210 .9 .030 1.2 zp .045 1.0 . .250 1.2 .035 6.1
.080 3.3 .295 1.6 .030 19.40 .1 3 7.8 .340 2.c .050 26.CO .115 27.8 .375 2.4 .045 44.9C 13r 44.1 .415 2.8 .045 50.6
• .150 51.8 .435 3.3 .050 68.8p%.160 75.6 .475 3.8 .060 98.5
.165 91.7 .065 113.2 g
.170 99.5
.170 113.5
ALLOY - TO NICR ALLOY - TD NICR ALLOY - TO NICRo STRESS (MPA) - 79.3 STRESS (MPA) - 89.6 STRESS (MPA) - 93.1 rnTEMP. (KELVIN) - 1255 STRESS (MPA) - 89,5 TEMP. (KELVIN) - 1255 C-b THICKNESS (CM) - .051 THICKNESS (CM) - 051 THICKNESS (CM) - 025
S- TEST DIRECTION -LONG. TES T OIRECTION - LONG.SOURCE - NAS-3-158 SOURCE - NAS-3-15558 SOURCE -NAS--15558
STRAIN (PCT.) TIME (FOUDS) STRAIN (PCT.) TIME (HiOU) STRAIN (PCT.) TIME (FOURS)
.010 .1 .015 1 035 .1*025 .2 .020 3 065 ..020 .4 .030 •4 *070 .4.035 12 .04 .5 .070 .5
S.030 4.0 .35 1.1 .080 1.1• .040 9.1 050 *,9 13.04055 23.6 .050 1.9 .115 5.3.055 23, . .050 35 .120 13.3.060 29.6 ro .075 1 9 *17C 21.1.060 47.5 .095 27.5 .180 29.2.075 53.7 10055 205 47.3
.20545.4 215..075 7i.2 .105 55.5.0877. 2 51.6 .235 77.313.085 657. .270 93.8
.085 10m. .125 75.7 .285 121.6.130 91.2.135 g9.9*145 116.6
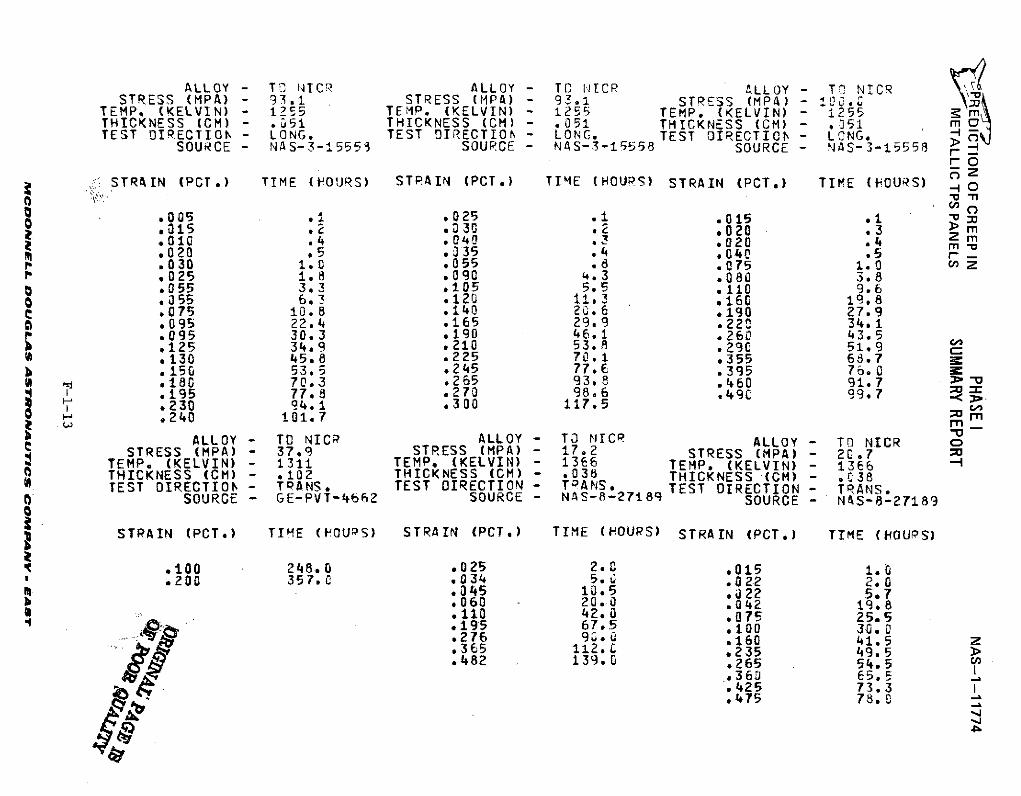
ALLOY - TO NICR ALLOY - TOC ItCR ALLOY - TO NICRSTRESS (MPA) - 93.1 STRESS (MPA) - 93.1 STRESS (MPA) -1
TEMP. (KELVIN) - 1255 TEMP. (KELVIN) - 1255 TEMP. (KELVIN) - 1255THICKNESS (CM) - .051 THICKNESS (CM) - .051 THICKNESS (CM) - .51 mTEST DIRECTION - LONG. TEST DIRECTION - LONG. TEST OIRECTIOC - LONG. y
SOURCE NAS-3-1 5553 SOURCE - NAS-3-15558 SOURCE - NAS-3-15558 -rO
STRAIN (PCT.) TIME (POURS) STRAIN (PCT.) TIME (HOURS) STRAIN (PCT.) TIME (HOURS) O
0 o.005 .1 .025 .1 ,015 .1 -OM.015 .2 .030 2 .020 .3 >.010 .4 .040 .3 .020 .* m2 m.020 .5 .335 .4 .040 .5 r-.030 1.0 .055 .8 .075 1.0 z.025 1.8 .090 4.3 .080 3.8.055 3.3 .105 5.5 .110 9.6
o .055 6.3 .120 11.3 .16C 19.8e .075 10.8 .140 20.6 .190 27.9§ .095 22.4 .165 29.9 .220 34.1
S .095 30.3 .190 46.1 .260 43.5.125 34.9 .210 53.8 .290 51.9.130 45.8 .225 70.1 .355 68.7r.150 53.5 .245 77.6 .395 76.0.180 70.3 .265 93.8 .460 91.7.195 77.8 .270 98.6 .490 99.7.230 94.1 .300 117.5 c,9.240 101. 7 r-,
ALLOY - TO NICR ALLOY - TO NICR ALLOY - TO NICR oSTRESS (MPA) - 37.9 STRESS (MPA) - 17.2 STRESS (MPA) - 20.7
TEMP. (KELVIN) - 1311 TEMP. (KELVIN) - 1366 TEMP. (KELVIN) - 13660 THICKNESS (CM) - .102 THICKNESS (CM) - 038 THICKNESS '(CM) - .038
TEST OIRECTION - TRANS* TEST DIRECTION - TANS* TEST OIRECTION - TRANS.SOURCE - GE-PVT-462 SOURCE - NAS-8-27189 SOURCE - NAS-8-27189
STRAIN (PCT.) TIME (HOUPS) STRAIN (PCT.) TIME (HOURS) STRAIN (PCT.) TIME (HOUPS)
.100 248.0 .025 2.0 .015 1.0' .200 357.0 .034 5.u .022 2,0
.345 10.5 .022 5.7
.060 - 20.0 .042 19.8
.110 42.0 .075 25.5.195 67.5 .100 30.0*276 9.U .160 41.5 z.365 112.L .235 49.5 >.482 139.0 .265 54.5
.425 73.3
.475 78.0~3~ L~i
a 4'b
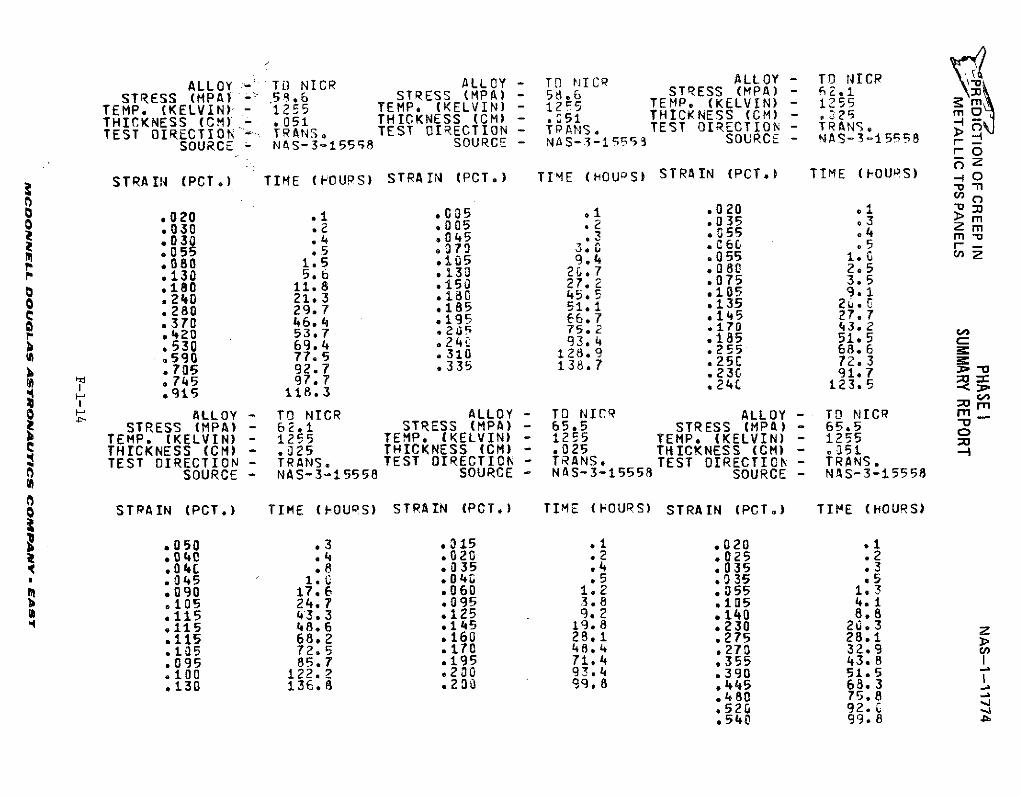
ALLOY - TO NICR ALLOY - TO NICR ALLOY - O NICRSTRESS (MPA) - 5R.6 STRESS (MPA) - 58.6 STRESS (MPA) - 62.1
TEMP. (KELVIN) - 1255 TEMP, (KELVIN) - 12r5 TEMPO (KELVIN) - 1255 mTHICKNESS (CM) .051 THICKNESS (CM) -. 51 THICKNESS (CM) ,25
TEST DIRECTION-- TRANS, TEST CIRECTION- TPANS. TEST OIRECTION - TRANS. -SOURCE - NAS-3-15558 SOURCE NAS-3-1555 SOURCE - NAS-3-15558 rr -
c-Z
STRAIN (PCT.) TIME (FOURS) STRAIN (PCT.) TIME (HOUPS) STRAIN (PCT.) TIME (FOUPS) --
0 .020 .1 .005 .1 .020 .1 "M
z 030 .2 .005 .2 .035 .3> m
S.030 .4 045 .3 55 .4.055 .5 .073 3.0 .G 060 .5 r-
.080 1.5 .105 9.4 .055 .7 zP .130 5.b .130 2G. 7 .080 2 5
.180 11.8 .150 27 2 .075 3.5* .240 21.3 .180 45.5 .105 9.1S280 29.7 .185 51.1 .135 27.7
.370 46.4 .195 E6.7 .145 277S420Z 53.7 .205 75.2 170 3.
.530 69.4 .24; 93.4 .185 51.5• .590 77.5 .310 128.9 .255 68.6.705 92.7 .335 138.7 .25C 72.3745 977 .230 91.7
.915 118.3 .24L 123.5
0 ALLOY -TONCO- TO NICR ALLOY TD NIC ALLOY - TD NICR 1 rSTRESS (MPA) - 62.1 STRESS (MPA) - 65.5 STRESS (MPA) - 65.5 "v
TEMP. (KELVIN) - 1255 TEMP. (KELVIN) - 1255 TEMP. (KELVIN) - 1255 o
THICKNESS (CM) - .025 THICKNESS (CM) - .025 THICKNESS (CM) - '351 -TEST DIRECTION - TRANS. TEST DIRECTION - TRANS. TEST DIRECTION - TRANS.
SOURCE - NAS-3-15558 SOURCE - NAS-3-15558 SOURCE - NAS-3-15558
0 STRAIN (PCT.) TIME (FOURS) STRAIN (PCT.) TIME (FOURS) STRAIN (PCT.) TIME (HOURS)
.050 .3 .315 .1 .020 .1
.040 .4 .020 .2 .025 .2
.040 .8 .035 .4 .035 .3.045 1.0 .040 .5 .035 .5
i .090 17.6 .060 1.2 .055 1.3.105 24.7 .095 3.8 .105 4.1.115 43,3 .125 9, 2 .140 8.8.115 48.6 .145 19.8 .230 20.3 7.115 68.2 .160 28.1 .275 28.1.105 72.5 .170 48.4 .270 32.9 cn.095 85.7 .195 71.4 .355 43.8 I.100 122.2 .200 93.4 .390 51.5.130 136.8 .200 99.8 .445 68.3
.480 75.8
.520 92.C,540 99.8 .
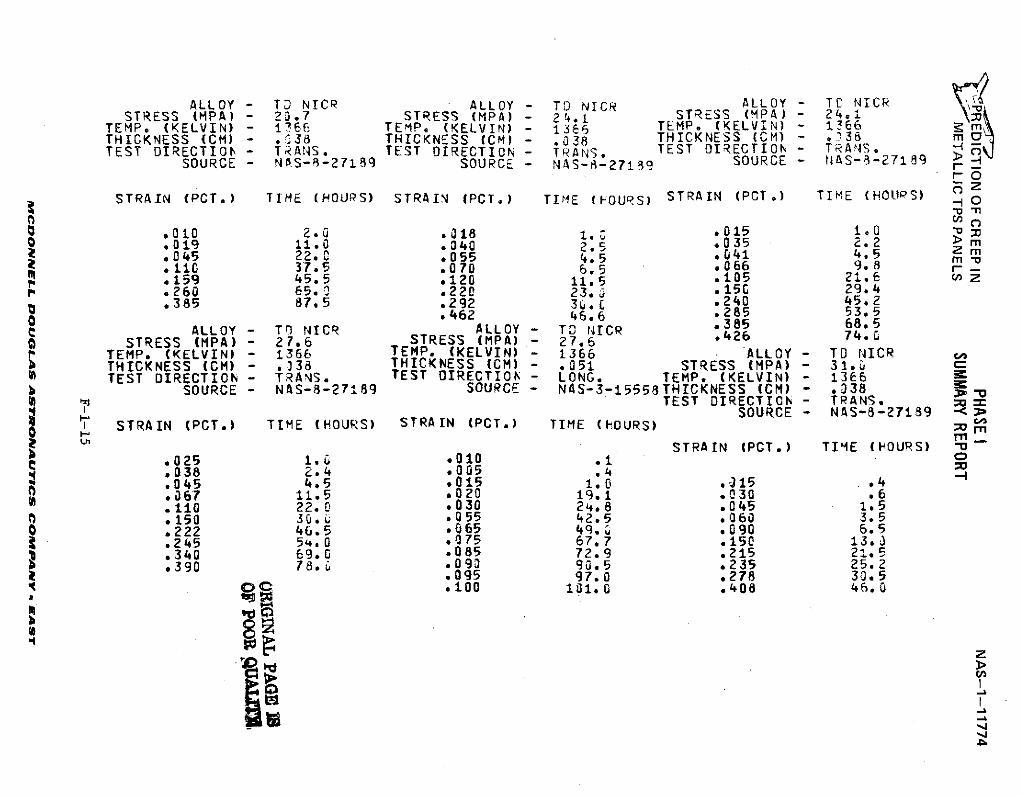
ALLOY - T NIC ALLOY T N ALLOY - TC NICNICSTRESS (MPA) - 20.7 STRESS (MPA) - 241 STRESS (MPKELVIN) - 24
TEMP. (KELVIN) - 1366 TEMP. (KELVIN) - 1366 TEMP (KELVIN) - 1366 mTHICKNESS (CM) - .38 THICKNESS (CM) - .038 THICKNESS (CM) - .3 meTEST DIRECTIO - TRANS. TEST DIRECTION - TRANS. TEST DIRECTION - TRANS.
SOURCE - NAS-8-27189 SOURCE - NAS-8-27199 SOURCE - AS-8-27189 -.rO
STRAIN (PCT.) TIME (HOUPS) STRAIN (PCT.) TIME (FOURS) STRAIN (PCT.) TIME (HOUPS)
i .010 2.0 .018 1.. *015 1.0 - sa .019 11.0 .040 2.5 .035 2.2 mZ .045 22.0 .055 4.5 .041 4.5
. 110 37.5 .070 6.5 .066 9.8 r-
.159 45.5 .120 11.5 .105 21.6 , z
.260 65.0 .220 23.- .150 29.4
.385 87.5 .292 3 .L .240 45.2S.462 46.6 .285 53.5SALLOY - TO NICR ALLOY - T NICR .385 68.5
STRESS (MPA) - 27.6 STRESS (MPA) - 27. .426 74.
TEMP. (KELVIN) 1366 TEMP. (KELVIN) - 1366 ALLOY - TD NICR o*THICKNESS (CM) - .338 THICKNESS (CM) - .051 STRESS (MPA) - 31.0 cTEST DIRECTION - TRANS. TEST DIRECTION - LONG. TEMP. (KELVIN) - 1366
SOURCE - NAS-8-27189 SOURCE - NAS-3-15558THICKNESS (CM) - .038( TEST DIRECTION - TRANS.
SOURCE - NAS-8-27139 -< 0I STRAIN (PCT.) TIME (HOURS) STRAIN (PCT.) TIME (HOURS) m
STRAIN (PCT.) TIME (FOURS) --.025 1. .*010 .1 o.038 2.4 .005 .4.045 4*5 6015 1.0 .315 .4.067 11.5 .020 19.1 .030 .6.110 22.0 .030 24.8 .045 1.5.150 30. * 0 55 42.5 .060 3.5
0 .222 46.5 .065 49.7 .090 6.5.245 54.0 .075 67.7 .150 13.3.340 69.0 .085 72.9 .215 21.5.390 78. .090 90.5 .235 25.2
.095 97.0 .278 30.50. .100 101. .408 46. 0
z
,,
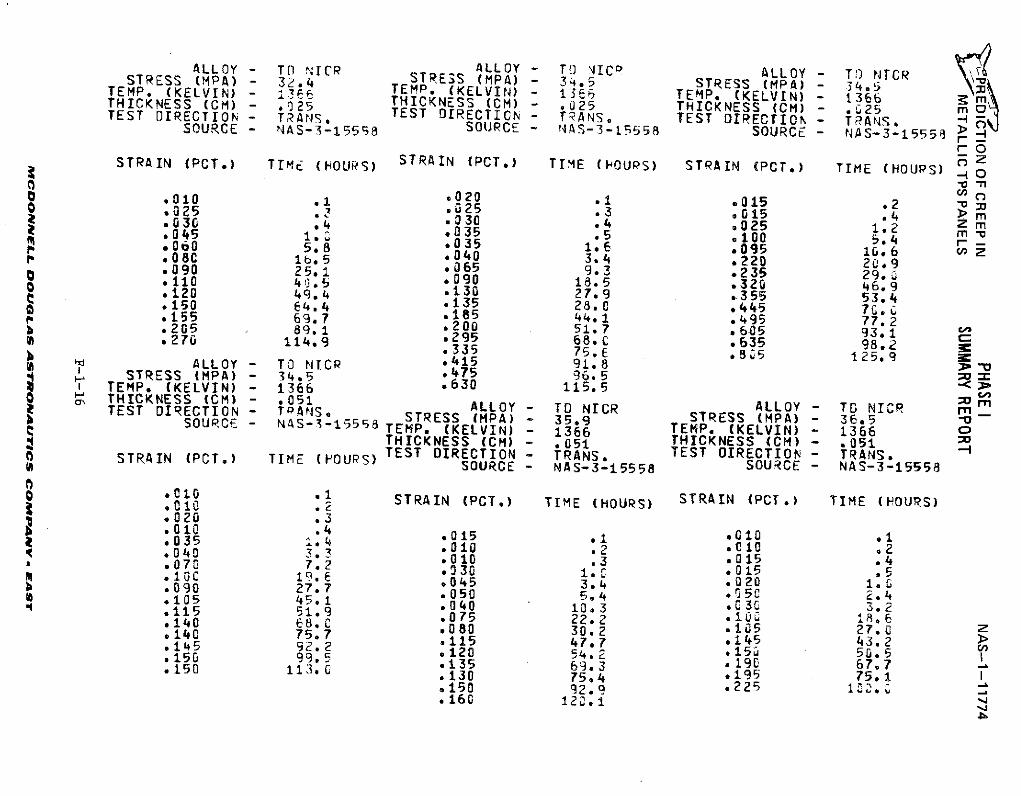
ALLOY - rn NICP ALLOY - TO NIC ALLOY - TO NTCRSTRESS MPA) - 32.4 STRES (MPA) 34.5 STRESS (MPA) - 34.TEMP. (KELVI) - TEMP. (KELVIN)LVIN) 16 TEMP. (KELVIN) 1366THICKNESS (CM) - .025 THICKNESS (CM) .025 THICKNESS (CM) - 25 mTEST DIRECTION - TANS. TEST DIRECTICN - TRANS. TEST DIRECTION - TPANSSOURCE - AS- AS--1558 SOURCE - 4AS-3-15558 SOURCE - NAS-3-15558 -I
STRAIN (PCT.) TIME (HOUfS) STRAIN (PCT.) TIME (POURS) STRAIN (PCT.) TIME (HOURS) -
o .020 .1 .o015 .2O .025 .3 .015 .4.03C .4 .030 .4 .025 1.2 Z m.045 1. .035 .5 .100 5.4 rn.060 5.8 .035 1.6 .095 10.6 c 2.O0C lb.5 .040 3.4 .220 20.9*090 25.1 .065 9.3 .235 29. *110 4.5 .090 18.5 .320 46.9.120 49.4 .130 27.9 .355 53.4S.150 64.4 135 28.0 .445 7G.155 69.7 .5 44.1 .495 77.2.205 89.1 .200 51.7 .605 93.1.270 114,9 .295 68.0 .635 98.2.335 75.E .8 5 125.9ALLOY - TO NICR .415 91.8STRESS (MPA) - 34.5 *475 96.5TEMP. (KELVIN) - 1366 .630 115.5 'C .O THICKNESS (CM) - T051 ALLOY - TD NICR ALLOY - TO NICR mTEST DIRECTION - TPAS• STRESS (MPA) -35.9 STRESS (MPA) 36.5SOURCE - NAS-3-1555a TEMP. (KELVIN) - 1366 TEMP. (KELVIN) - 1366THICKNESS (CM) - .051 THICKNESS (CM) - .051
TEST DIRECTION - TRANS. TEST DIRECTION - TRANS.STRAIN (PCT.) TIME (FOUPS) SOURCE- NAS-3-15558 SOURCE- NAS-3-15558
S.010 1 STRAIN (PCT.) TIME (HOURS) STRAIN (PCT.) TIME (HOURS)5 010 .2
*.020 .3.035 .4.015 .010 .2.040 3.3 .010 .2 015 .4. 707010 •3 .015 .4b.070 7.2 .30C 1.C .015 .4.090 7.7 .045 3.4 .u2 1.5.105 45.1 .050 510 . C2.411540 5. 1.00 0.3.20115 68 I .075 22.2 *10j 1.6*140 875.7 .080 30.2 .105 27.0S145 2 .115 47.7 .145 43.2*145 92.9 *120 54.2 .15% 50.5.150 11399. .135 69.3 .190 67.7S113130 75.4 .195 75.1 I
.150 92.9 0225 1 ..
.160 120.1 j4,14
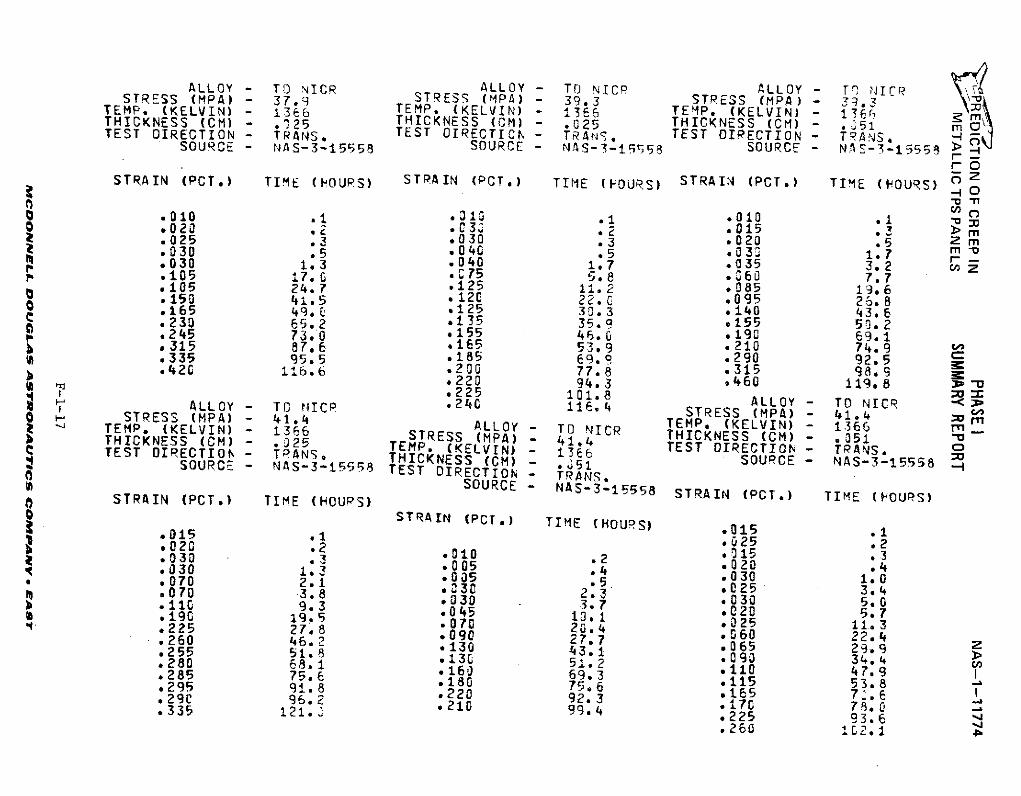
ALLOY - TO NICR ALLOY - TO NICP ALLOY - TrS NI'ICRSTRESS (MPA) - 37.9 STRESS (MPA) - 39.3 STRESS (MPA) - 39.TEMP. (KELVIN) -136 TEMP. (KELVIN) - 1366 TEMP. (KELVIN) - 1 6rTHICKNESS (CM) - .325 THICKNESS (CM) - .025 THICKNESS (CM) - .351 m
TEST DIRECTION- TRANS, TEST OIRECTICN - TRANS. TEST DIRECTION - TRANS.SOURCE - NAS-3-15558 SOURCE - NAS-3-15558 SOURCE - N.AS-3-1558 >rO
STRAIN (PCT,) TIME (HOURS) STRAIN (PCT.) TItlE (FOURS) STRAIN (PCT.) TIME (HOURS) O" -4 0( .. -n
.010 .1 .31 .1 .010 .1S02003 .2 .015 .3 > m.025 .3 *030 .3 .020 .5 z m.030 .5 .040 .5 .030 1.7 m -.030 1.3 .040 1.7 .035 3.2
S.105 17. CC75 5.8 .360 7.7.105 24.?7 125 11. 2 .085 19.6S150 41.5 .120 22.C .095 26.80165 49, 125 30.3 .140 43.6.230 65.2 *135 35.9 .155 50.2*245 73.0 *155 46.0 190 69.1S315 87.6 .165 53,9 .210 74.9 C.335 95.5 .185 69.9 .290 92.5S420 1.1.6 .200 77.8 .315 98.9*220 94.3 .460 119.8
*225 101.8225ALLOY 101.8 ALLOY - TO NICR <ALLOY - TO NICP STRESS (MPA) - 41.4 mH STRESS (MPA) - 41.4 TEMP. (KELVIN) - 1366 MTEMP. (ELVIN) - 136 ALLOY - TO NICR THICKNESS (CM) - 1351 "THICKNESS (CM) - 132 STRESS (MPA) - 41.4 TEST DIRECTION - TANS.ETHICKNESS (CM) - 25 TEP (KELVIN) - i1366STEST DIRECTION - TRANS, THICKNESS (CM) - J51 SOURCE- NAS-3-15558 -SOURCE - NAS-3-15558 TEST DIRECTION - TRANS.
STRAIN (PCTSOURCE - NAS-3-1555 8 STRAIN (PCT.) TIME (HOURS)STRAIN (PCT.) TIME (HOUPS)0 STRAIN (PCT,) TIME (HOURS) .015 .1
.015 . .25 .2•20 .2 ..
4.030 .3 .010 .2 .015 .3.. 30 005 .4 .030 1.0.030 13 .005 .5 020 .4.070 2.1 *3 a4 .030 5.0.070 3.8 *43C 2.3 .025 3.4b .110 9.3030 3.7 030 5.0
S.190 19.5 .045 13o1 .020 5,7S9c 19. 070 025 11.3.225 27.8 .070 2.4 .060 22.4.260 46.2 090 27 06 29.9.25580 6851. 13 5.2 09 34.4.285 75.1 .160 69.3 .110 47.9 I.295 91.8 .180 75.6 .115 53.8.295 91.8 .220 92.3 .165 7...335 121. 2104 225 93.
.260 4 C2.1 .
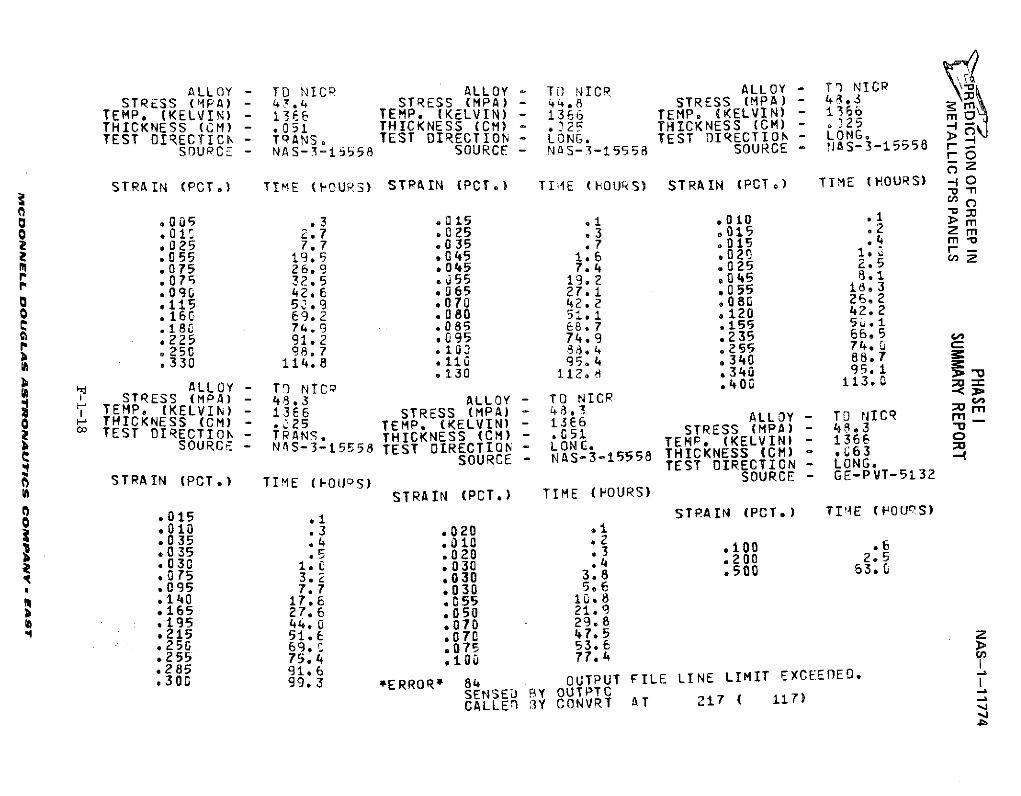
ALLOY - TD NICR TALLOY ALLOY - 1') NICRSTRESS (MPA) - 4+.' STRESS (MPA) - 44.8 STRESS (MPA) - 4.3
TEMP. (KELVIN) - 1366 TEMP. (KELVIN) - 1366 TEMP. (KELVIN) - 1366 5THICKNESS (CM) - .051 THICKNESS (CM) - .22F THICKNESS (CM) - .25TEST DIRECTICh - TRANS. TEST DIRECTION - LONG. TEST DIRECTION - LONG
SOURCE - NAS-3-15558 SOURCE - NAS-3-15558 SOURCE - NAS-3-15558 r -oz
STRAIN (PCT.) TIME (FOURS) STRAIN (PCT.) TIiE (HOURS) STRAIN (PCT*) TIME (HOURS) - 0
0 .005 .3 .015 .1 .010 .1 > Mo .lr 2.7 .025 .3 .015 .2 2 m
.025 7.7 .035 ,7 .015 1. m
.055 19.5 .045 1.6 *020 9** rI .075 26.9 .045 7.4 .025 2.5 c'Zr .07 32.5 .55 19.2 .045 8.1
.090 42.6 .065 27.1 .055 18.30 .115 50.9 .070 42.2 .080 26.20 .160 69.2 .080 51.1 .120 42.2C 18 74.9 .085 68.7 .155 51.1t .225 91.2 .095 74.9 .235 66.5 C,
.250 98.7 .100 8.4 .255 74.
.330 114.8 .110 95.4 .340 88.7.130 112.~ .340 95.1
SALLOY - TD NTC .400 113.0 =STRESS (MPA) - 48.3 ALLOY - TO NICR ol
~ TEMP. (KELVIN) - 1366 STRESS (MPA) - 48.3 NICo THICKNESS (CM) - .- 25 TEMP. (KELVIN) - 1366 ALLOY - T NCR mC TEST DIRECTION - TRANS. THICKNESS (CM) - .G5i STRESS (MPA) - 66 .3c
SOURCE - NAS-3-15559 TEST DIRECTION - LONG. TEMP. (KELVIN) - 1366 oSSOURCE - NAS-3-15558 THICKNESS (CM) - .63 m
TEST DIRECTION - LONG.STRAIN (PCT.) TIME (FOURS) SOURCE - GE-PVT-5132
STRAIN (PCT.) TIME (POURS)
S.015 .1 STRAIN (PCT.) TIME (HOUPS)
.010 .3 .020 .1
.035 .4 .010 100
.035 .5 .020 .3 2100 2.5030 I.C .030 .4 .200 .5
.075 3.2 .030 500 63
.095 7. 7 .030 5.6
.140 17.6 .055 10.8
.165 27.6 .050 21.9r .195 44.0 .070 29.8
.215 51.6 .070 47.5 2
.250 69. .075 53.6
.255 75.4 .100 77.4
.285 91.6
.300 99.3 *ERROR' 84 OUTPUT FILE LINE LIMIT EXCEEDED.
SENSED BY OUTPTCCALLED 3Y CONVRT AT 217 ( 117)
,
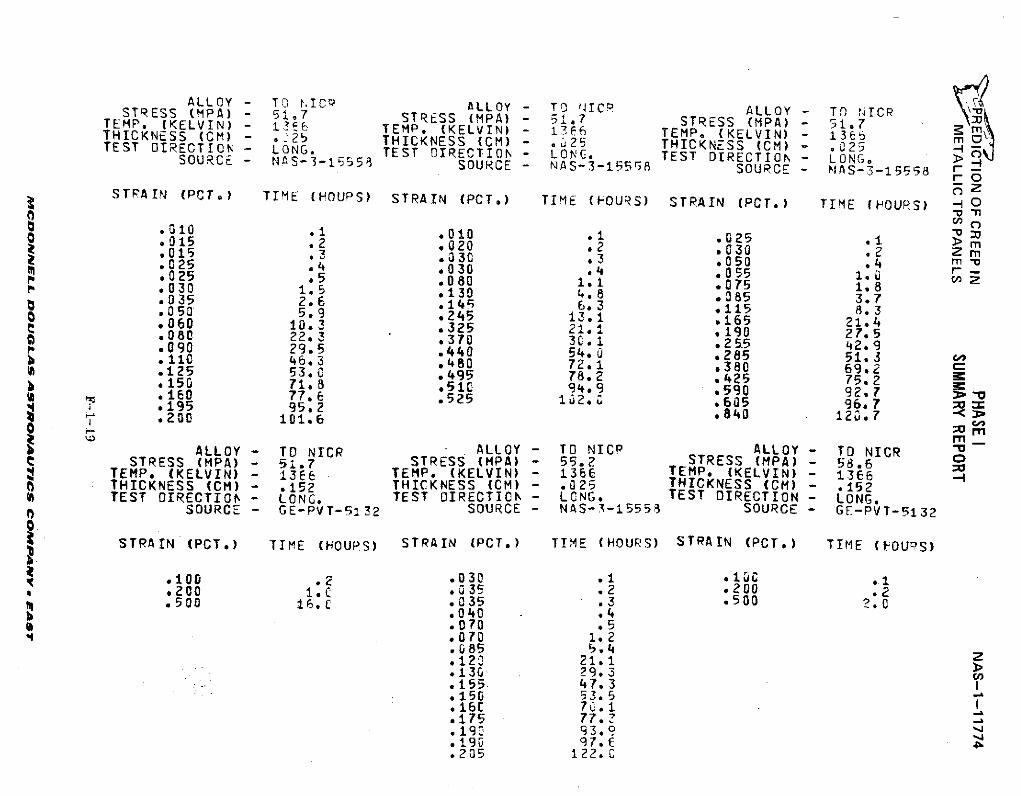
ALLOY - TDO rIC ALLOY - TO 11ICP ALLOY - TFD NICRSTRESS (MPA) - 51 7 STRESS (MPA) - 51.7 STRESS (MPA) - 51.7TEMP. (KELVIN) - 13 TEMP. (KELVIN) - 1366 TEMP. (KELVIN) - 13EiTHICKNESS (CM) -25 THICKNESS (CM) - .25 THICKNESS (CM) - .025TEST DIRECTION - LONG. TEST OIRECTION- LONG. TEST DIRECTION- LONG.SOURCE - NAS-3-155 SOURCE - NAS-3-15558 SOURCE - NAS-3-15558 r-
rOSTPAIN (PCT.) TIME (HOUPS) STRAIN (PCT.) TIME (POURS) STRAIN (PCT.) TIME (HOURS) O"u -n
.010 . .010 .1 .025 .1> r.015 .2 .020 .2 .030 .2 m
.025 .4 .030 .4 .055 1.0 cn
.0 25 5 .080 1.1 .075 1,8.030 1.5 130 4.8 .085 3.7.035 2.6 .145 6.3 .115 8. 3S.050 5.9 .245 13.1 .165 218.S.060 10.3 .325 21. .190 27.5. 080 22. 3 .370 3c .1 5.5 42.9.ao 29.5 .440 54.0 .285 51.3 co
.150 71.8 .51 94.9 .590 92.7.160 77.6 .525 132.u .605 96.78 .195 9552
2 2101.6.1,210 101.6 .840 12.7 rnmALLOY - TO NIOR ALLOY - TO NIC SORSSTRESS MPA) 51.7 STRESS (MPA) 55.2 STRESS (MPA) - 58.6TEMP. (KELVIN) - 136E TEMP. (KELVIN) - 36 TEMP. (KELVIN) -1366 -1THICKNESS (CM) - .152 THICKNESS (CM) - .025 THICKNESS (CM) .152TEST OIRECTIOI - LONG. TEST DIRECTION - LCNG. - LONG.
SOURCE - GE-PVT-5132 SOURCE - NAS-3-15553 SOURCE - GF-PVT-5132
STRAIN (PCT.) TIME (HOUPS) STRAIN (POT.) TIME (HOURS) STRAIN (POT.) TIME (I-OUDS)
.100 .2 .030 .1 .10 .1I, .2O i•. .035 .2 .200 .2.500 16.c .035 .3 .500 2.0.040 .4.070 .5
. .070 1. 2.085 5.4.12 0 21.1 Z13& 29.3 W
.155 47. 3
.150 53. 5.16C 70.1.175 77..190 93.9.190 97.(.205 122.C
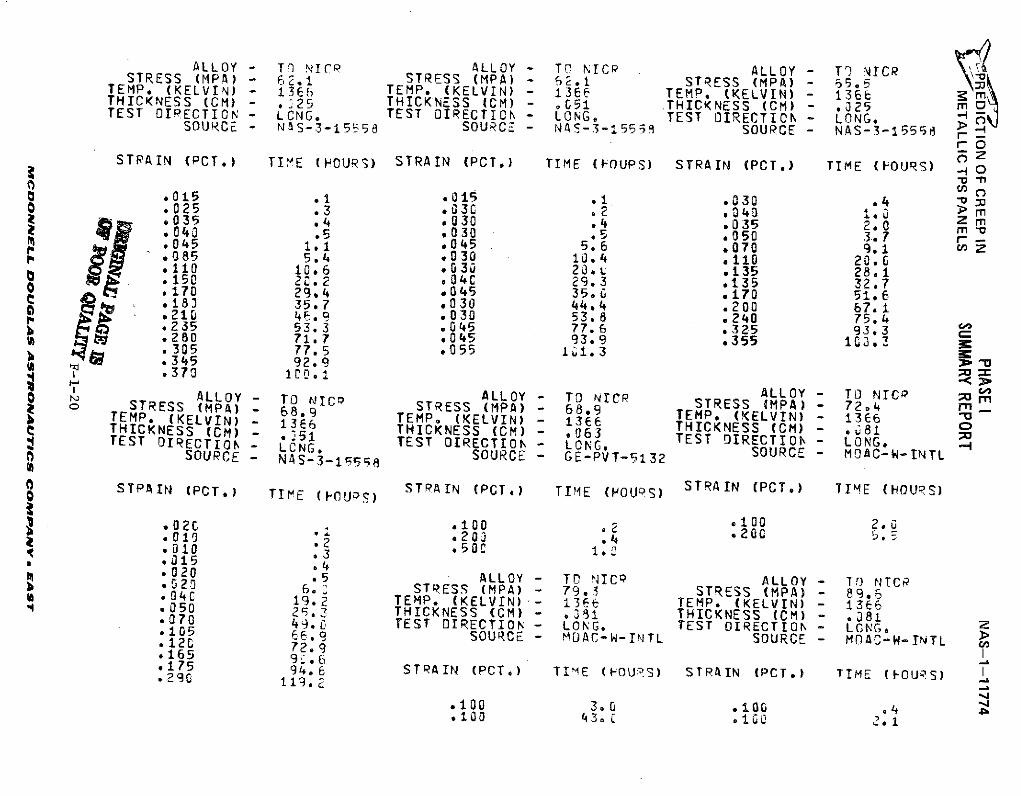
ALLOY - T; NICR ALLOY - Tr NICR ALLOY - T NICRSTRESS (MPA) - 62.1 STRESS (MPA) - 62.1 STRESS (MPA) - 65.5TEMP. (KELVIN) - 1366 TEMP. (KELVIN) - 1366 TEMP. (KELVIN) - 1366THICKNESS (CM) - .25 THICKNESS (CM) - .051 THICKNESS (CM) - .25 mTEST DIRECTION - LCNG. TEST OIRECTICN - LONG. TEST DIRECTION - LONG.SOURCE - NAS-3-1555 SOURCE - NAS-3-15559 SOURCE - NAS-3-15558 r
rOSTRAIN (PCT.) TIME (HOURS) STRAIN (PCT.) TIME (FOUPS) STRAIN (PCT.) TIME (FOURS)
.015 .1 .015 .1 .030 .4 oS.025 .3 .030 .2 .043 1,a > m.035 .4 .030 *4 .035 2.0 2 m040 .5 .030 .5 .050 3.7 r*045 1.1 ,045 5.6 .070 9.1 m Z.085 5.4 .030 10.,4 .110 20.0.110 10.6 .030 20.L .135 28.1.150 20.2 .04C 29.3 .135 32.7*170 29.4 .045 35.0 .170 51.6e .183 35.7 .030 44.4 .200 67.1S.210 4F6.9 .030 53.8 .240 75.4b .235 53.3 .045 77.6 .325 93.3.280 71.7 .045 93.9 .355 103.3.305 77.5 .055 1'1.3 9
4A:.345 92.9S370 100.1
ALLOY - TD NrCP m mLLOY - TNICALLOY - TO NICP STRESS (MPA) - 724a STRESS (MPM) - ) 68.9 TEMP. (KELVIN) - 136 ITEMP. (KELVIN) - 1368.9 TEMP. (KELVIN) -1366 THICKNESS (CM) - 81THICKNESS (C) - 166 THICKNESS (CM) - .063 TEST DIRECTION - LONG.TEST DIRECTION - NG51 TEST DIRECTION - LONG. SOURCE- MO--INTL
SOURCE - NAS-3-155 SOURCE - GE-PVT-5132 SOURCE MAC ITL
STRAIN (PCT,) TIME (FOUP) STRAIN (PGT*) TIME (HOURS) STRAIN (PCT.) TIME (HOUS)
S.02C .100 .2 .100 2.0.010 . .203 .4 20
0010 .3 .50C -.S015 .4
02 0 .5T ALLOY - TD NICP ALLOY - TO NICR0206. STRESS (MPA) - 79.3 STRESS (MPA) - 89.5.04C 19.2 TEMP. (KELVIN)-- 1366 TEMP. (KELVIN) - 1366.050 25.3 THICKNESS (CM) - .381 THICKNESS (CM) - .081.070 49.0 TEST OIRECTION - LONG. TEST DIRECTION - LONG. z.105 66.9 SOURCE - MDAC-W-INTL SOURCE - MDAC-W-TINTL.120 72.9•165 95.6.175 94.6 STRAIN (PCT.) TI'E (FOURS) STRAIN (PCT.) TIME (CFOUS).290 119,2
.100 3.0 .100 .4.100 43. olGC0 .1
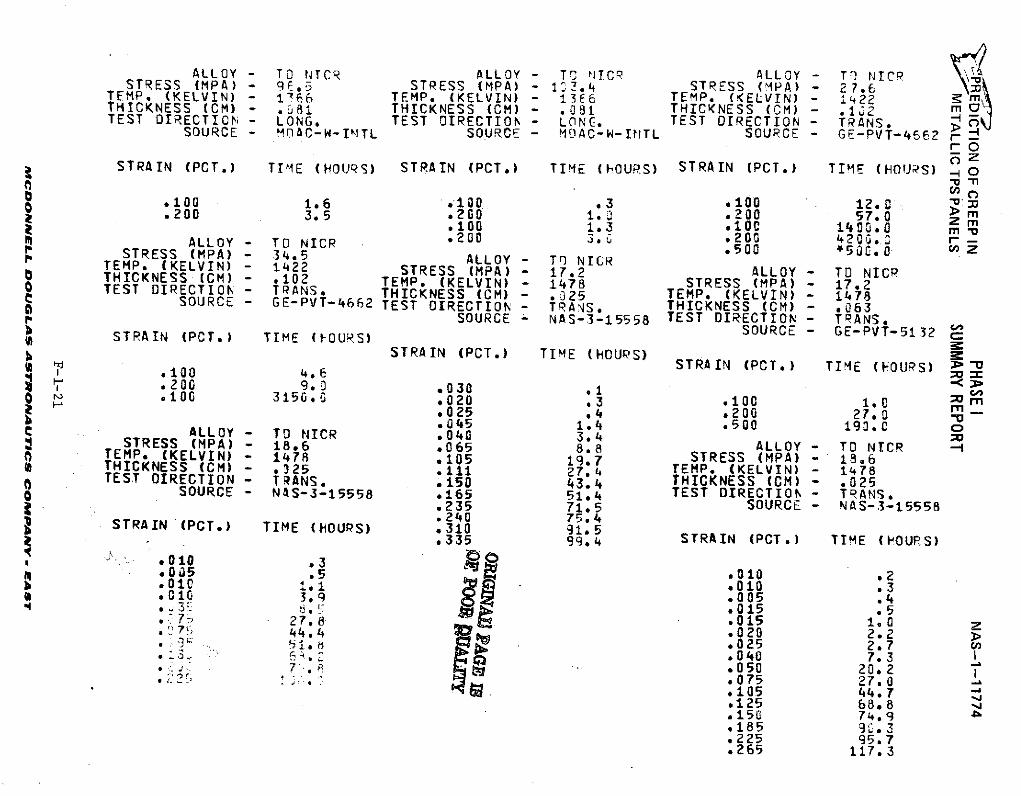
ALLOY - TD NTCR ALLOY - TO NITCR ALLOY - TO NICR STRESS (MPA) - 9E.5 STRESS (MPA) - 1^3.4 STRESS (MPA) - 27.6TEMP. (KELVIN) - 1"66 TEMP. (KELVIN) - 136 TEMP. (ELVIN) - 12
THICKNESS (CM) - .81i THICKNESS (CM) - .091 THICKNESS (CM) - .1'2 mTEST DIRECTICN - LONG, TEST DIRECTION - LONC. TEST DIRECTION - TRANS.
SOURCE - MDAC-W-INTL SOURCE - MDAC-W-INTL SOURCE - GE-PVT-462 r-rO
STRAIN (PCT.) TIME (HOURS) STRAIN (PCT.) TIME (hOURS) STRAIN (PCT.) TIME (HOURS) o
S.100 1.6 .100 .3 .100 12.0 V:.200 3.5 .200 1.0 .200 57.0 Z m* 100 143 10 0 m "m
ALLOY - TO NICR .200 3. .200 4200.0 r-STRESS (MPA) .500 #500.0 c ZSTRESS (MPA) - 34.5 ALLOY - TO NICR
TEMP. (KELVIN) - 1422 STRESS (MPA) - 17,2 ALLOY - TD NICRTHICKNESS (CM) - .102 TEMP. (KELVIN) - 1478 STRESS (MPA) - 17.2TEST DIRECTION - TRANS* THICKNESS (CM) - .025 TEMP. (KELVIN) - 1478SSOURCE - GE-PVT-4662 TEST DIRECTION - TRANS. THICKNESS (CM) - .063§ SOURCE - NAS-3-15558 TEST DIRECTION - TRANS.
SOURCE - GE-PVT-51 32STRAIN (PCT.) TIME (IOURS)STRAIN (PCT.) TIME (HOUPS)
100 STRAIN (POT.) TIME (OUSTRAIN (PCT.) TIME (FOURS)S200 9. .030 .10 *100 3150,. .020 .3 .100 1.0 m.025 .4 .200 2710 -
.045 1.4 .500 190. oC ALLOY - TO NICR .040 3.4STRESS (MPA) - 18.6 .065 8.8 ALLOY - T NICR --4
TEMP. (KELVIN) - 1478 *105 19.7 STRESS (MPA) - 18.6THICKNESS (CM) - .325 .111 27.4 TEMP. (KELVIN) - 1478TEST DIRECTION - TRANS. .150 43.4 THICKNESS (CM) - .0250 SOURCE - NAS-3-15558 .165 51.4 TEST DIRECTION - TRANS.
.235 71.5 SOURCE - NAS-3-15558
.240 75.4STRAIN (PCT.) TIME (HOURS) .310 91.5S.335 99.4 STRAIN (PCT.) TIME (HOURS)
,0..- 0 .10 .3 .2S.0045 .5.010 .2
s 01* 1.1 .010 .3.010 3.9 .005 .43 ,9. .015 .57- 278 .015 1.0 z
27 44.4 .020 2.2 >Si..8 025 2.7 c>
*, .040 7.37..~ .050 20.2
* - . . 075 27.0.105 44.7.125 68.8.150 74.9.185 90.3.225 95.7.265 117.3
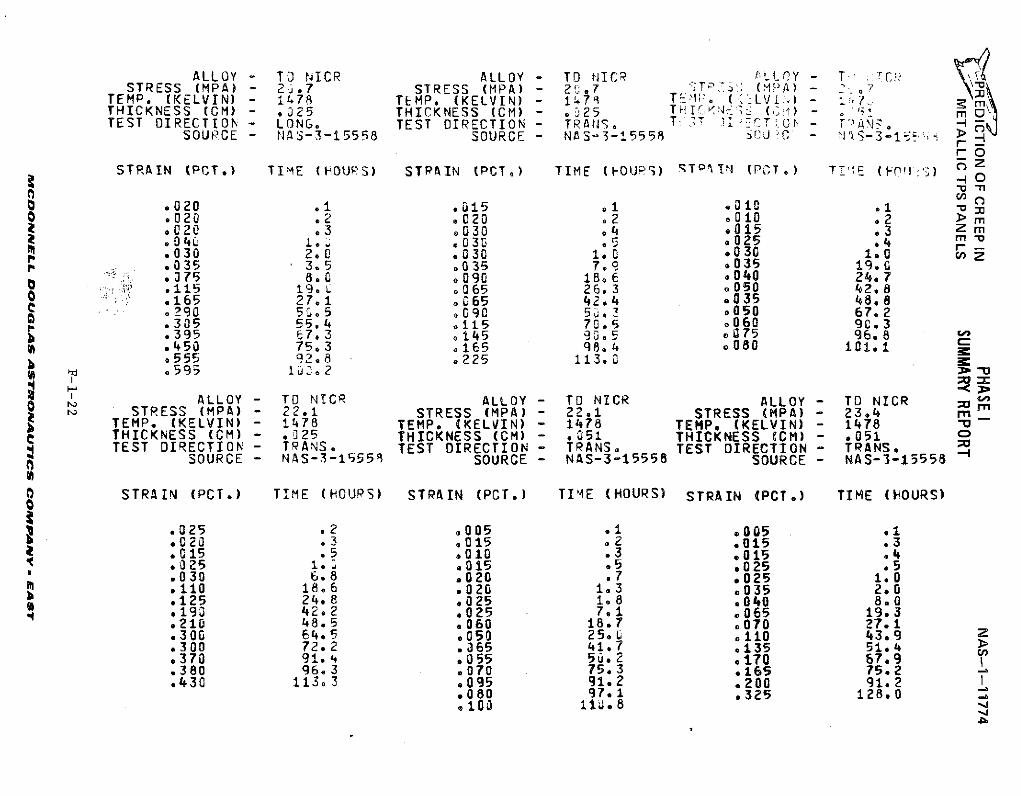
ALLOY - T3 NICR ALLOY - TO NICR LLOY - TSTRESS (MPA) - 2 .7 STRESS (MPA) - 2 .7 T (PA) 7- .
TEMP. (KELVIN) - 1478 TEMP. (KELVIN) - 1478 T . ( LV -THICKNESS (CM) - .025 THICKNESS (CM) - .025 THIC ' ( ) - omTEST DIRECTION - LONG. TEST DIRECTION - TRANS. T: T CT( - .
SOURCE - NAS-3-15558 SOURCE - NAS-3-15558 SJ C - S-o3-15 4rO
STRAIN (PCT.) TIME (HOUP S) STPAIN (PCT,) TIME (OURS) ST'IN (PCT.) T",E (fo, ')n10
.020 .1 .015 .1 .010 .10 .020 .2 .020 .2 .010 .2 > m
.020 .3 .030 .4 .015 .3 Z m
.04C 1.0 .030 ,5 ,025 •4 ".030 2.0 C .030 1.0 .*030 1.0 , z
.035 3.5 .035 7.C .035 19.0
.375 8.0 .090 18.6 *040 24.7S .115 19. .065 26.3 .050 42.8
.165 27.1 .065 42.4 .035 48,8• .290 50.5 .090 5,.3 .050 67.2.305 55.4 .115 70.5 .060 90.3.395 67.3 .145 90.5 075 96.8 _.450 75,3 .165 98,4 .080 1iC..555 92.8 .225 113.0
ALLOY - TO NICR ALLOY - TO NICR ALLOY - TO NICR CoSTRESS (MPA) - 22.1 STRESS (MPA) - 22.1 STRESS (MPA) - 23.4 m"
TEMP. (KELVIN) - 1478 TEMP. (KELVIN) - 1478 TEMP. (KELVIN) - 1478 -"THICKNESS (CM) - .025 THICKNESS (CM) - .051 THICKNESS (CM) - .051 oTEST DIRECTION - TRANS. TEST DIRECTION - TRANS. TEST DIRECTION- TRANS.
SOURCE - NAS-3-15558 SOURCE - NAS-3-15558 SOURCE - NAS-3-15558
0 STRAIN (PCT.) TIME (HOUPS) STRAIN (PCT.) TIME (HOURS) STRAIN (PCT.) TIME (HOURS)
.025 .2 .005 .1 .005 .1
.020 .3 .015 .2 .015 .3
.015 .5 .010 .3 .015 .4
.025 1.0 .015 .5 .025 .5
.030 6.8 .020 .7 .025 1.0
.110 18.6 .020 1.3 .035 2.0
.125 24.8 .025 1.8 .040 8.0
.190 42.2 .025 7.1 .065 19.3
.210 48.5 .060 18.7 .070 27.1.300 64.5 .050 25.u ,110 43.9 Z.300 72.2 .365 41.7 .135 51.4.370 91.4 .055 50.2 .170 67.9.380 96.3 .070 75.3 .165 75.2.430 113.3 .095 91.2 .200 91.2
.080 97.1 .325 128.0
.100 11i.8 -11J08
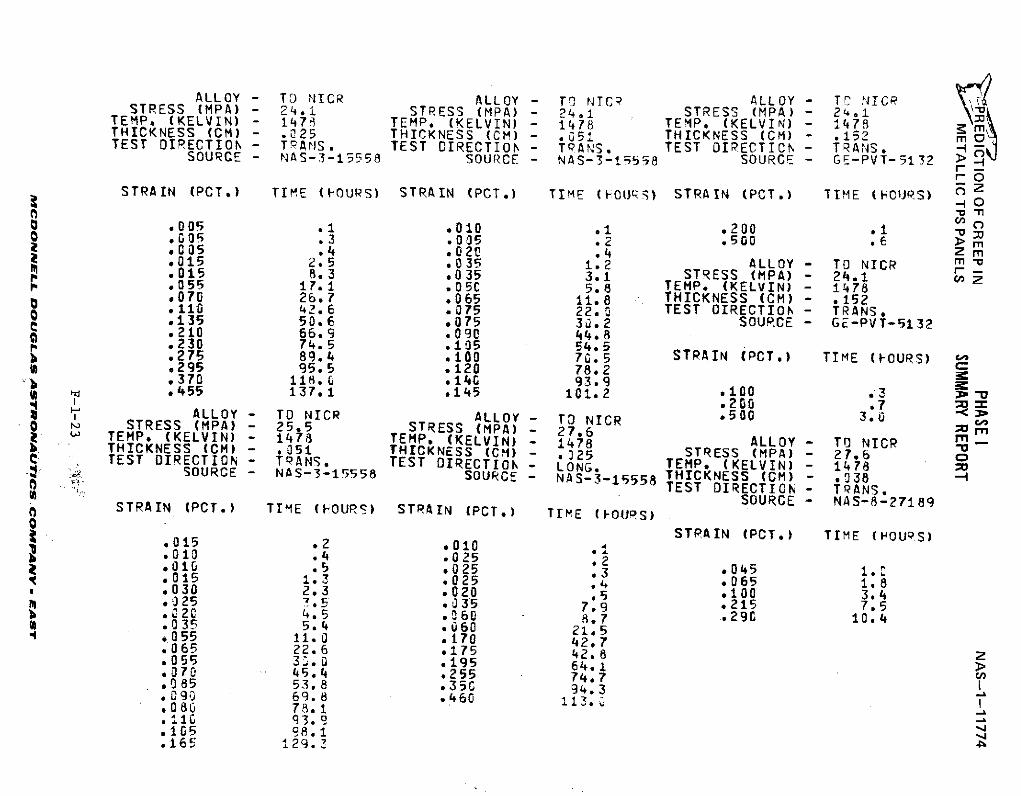
ALLOY - TD NICR ALLOY - TO NTC? ALLOY - TC NICR STRESS (MPA) - 24.1 STRESS (MPA) - 24.1 STRESS (MPA) - 24,1
TEMP, (KELVIN) - 1478 TEMP. (KELVIN) - 1478 TEMP. (KELVIN) - 1478THICKNESS (CM) - .025 THICKNESS (CM) - .051 THICKNESS (CM) - .152 mTEST DIRECTION - TRANS. TEST DIRECTION - TRANS. TEST DIRECTION - TRANS.SOURCE - NAS-3-15558 SOURCE - NAS-3-15558 SOURCE - GE-PVT-5132 _rO
STRAIN (PCT.) TIME (FOURS) STRAIN (PCT.) TIME (COUtS) STRAIN (PCT.) TIME (COURS) 0Z0 -I,I C/.005 .1 .010 .1 .200 .1 -
S.035 .3 .035 .2 .500 .6 mZ005 .4 .020 .4 Z m*015 2.5 .035 1.2 ALLOY - TO NICR m -.015 8.3 .035 3.1 STRESS (MPA) - 24.1.055 17.1 .05C 5.8 TEMP. (KELVIN) - 1478.070 26.7 .065 11.8 THICKNESS (CM) - .152.110 42.6 .075 22. 0 TEST DIRECTION - TRANS..135 50.6 .075 30.2 SOURCE - GE-PVT-5132.210 66.9 .090 44.8.230 74.5 .105 54.5.275 89.4 .0b0 7G.5 STRAIN (PCT.) TIME (FOURS).295 95.5 .120 78.2.370 118.0 .14G 93.9
r .455 137.1 .145 101.2 .100 .3A Y T C.200 .7 ozALLOY - TO NICR ALLOY - TO NICR .500 3.00 STRESS (MPA) - 25.5 STRESS (MPA) - 27.6 mTEMP. (KELVIN) - 1478 TEMP. (KELVIN) - 1478 ALLOY - TO NICR
THICKNESS (CM) - .051 THICKNESS (CM) - .325 STRESS (MPA) - 27.6 oC TEST DIRECTION - TPANS. TEST DIRECTION - LONG. TEMP. (KELVIN) - 1478 mSOURCE - NS-3-15558 SOURCE - NAS--15558 THICKNESS (CM) - .038 -TEST DIRECTION - TRANS.
SOURCE - NAS-8-271890 STRAIN (PCT.) TIME (FOURS) STRAIN (PCT.) TIME (IOURS)
0 STRAIN (PCT.) TIME (hOURS).015 .2 ,010 .1.010 .4 .025 .2*010 .5 .025 .3 *045 1..015 1.3 *025 .4 .065 1.8.030 2.3 .020 .5 .100 3.4.025 7.5 *035 7.9 .215 7.5.02C 4.5 .060 8.7 .290 10.4U .035 5.4 .060 21.5.055 11.0 .170 42.7.065 22.6 .175 42.8 Z.055 33.0 .195 64.1.070 45.4 .255 74.7.085 53.8 .350 94.3.090 69.8 .460 13.080 78.1.110 93.9.105 98.1.165 129.3
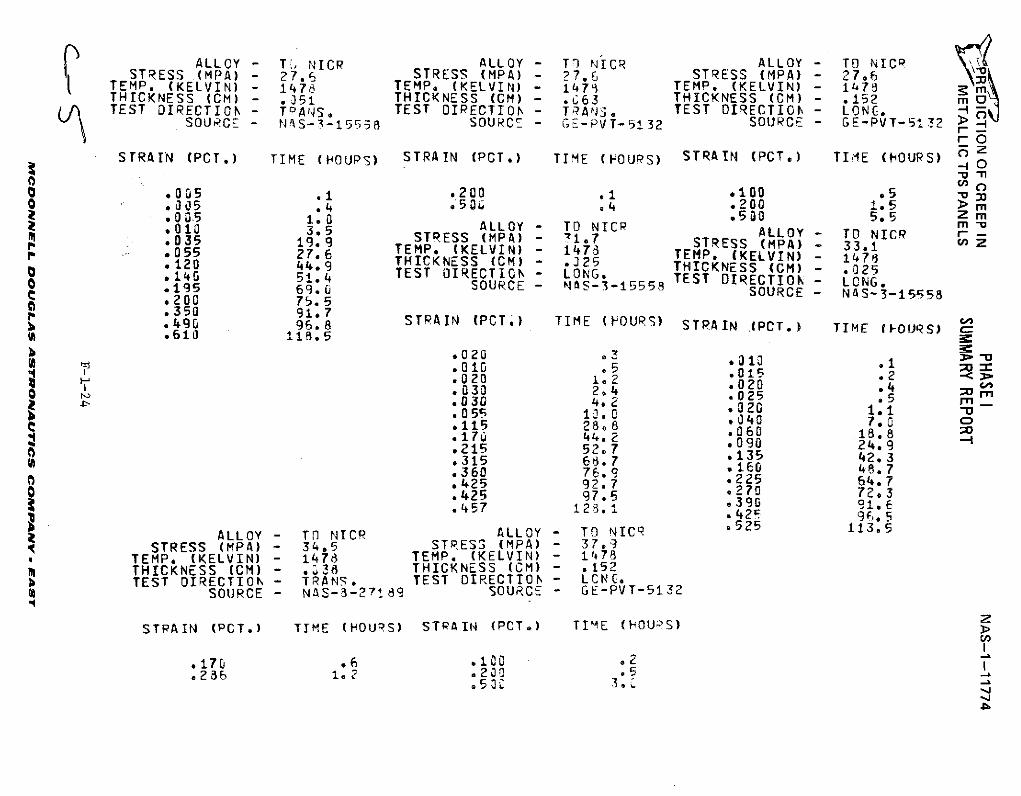
ALLOCY - T, NICR ALLOY - T) NICR ALLOY - TO NICRSTRESS (MPA) - 27. STRESS (MPA) - ?7.6 STRESS (MPA) - 27,6STEMP (KELVIN) 1478 TEMP. (KELVIN) 1- 473 TEMP. (KELVIN) - 1478
THICKNESS (CM) - .351 THICKNESS (CM) -. 63 THICKNESS (CM) - .152 mTEST DIRECTION - ToAS TEST DIRECTION- TRANS, TEST DIRECTION - LONG .
SOURCE - NAS--1555 SOURCE - GE-PVT-5132 SOURCE - GE-PVT-54 32 >
STRAIN (PCT.) TIME (POUPS) STRAIN (PCT.) TIME (FOURS) STRAIN (PCT.) TIME (HOURS) --nTi
S .005 .1 .200 .1 .100 .5 M0 .0.5 1:4 50i .4 .200 1.5 > m
10 05 .0 .500 5.5 m.010 3.5S ALLOY - TO NICP m.035 19.9 STRESS (MPA) M 717 STRESS (MPA) 33.1 cz055 27.6 TTEP. (KELVIN) . (KELVIN) 1471120 44.9 THICKNESS (CM) .325 THICKNESS (CM) - .025140 51.4 TEST DIRECTION - LONG. TEST DIRECTION - LNG.S195 69.0 SOURCE - NS-3-15558 SOURCE NS-3-15s58
S200 75.5
.49G 96.8 STPAIN (PCT) TIME (FOURS) STRAIN (PCT.) TIME CIOURS)
.610 118.5 _7
.020 3.5 .10 .-
.01o . .01 .
.020 1.2 .015 .2030 2,4 025 . m030 025 ..055 11.0.115 28.8 040 1.8 o.170 44.2 060 18.8.215 52.7 24.9.315 68, 7 135 42.3.360 76.09 10 8.7.425 92.7 .225 64.725 92.7 270 7203.425 97.°5 .390 91.6.457 128. 1 .42 9.5
ALLOY - TO NICR ALLOY - TO NICR 113.5STRESS (MPA) - 34.5 STRESS (MPA) - 37,9
, TEMP. (KELVIN) - 1478 TEMP. (KELVIN) - 1478THICKNESS (CM) - .38 THICKNESS (CM) - .152TEST DIRECTION - TRANS. TEST DIRECTION - LCNG.
A SOURCE - NAS-3-271-89 SOURCE - GE-PVT-5132
STRAIN (PCT.) TIME (HOURS) STRAIN (PCT.) TIME (HOU3S)
.170 .6 .100 .2
.286 12 .230 .5.50% 3.
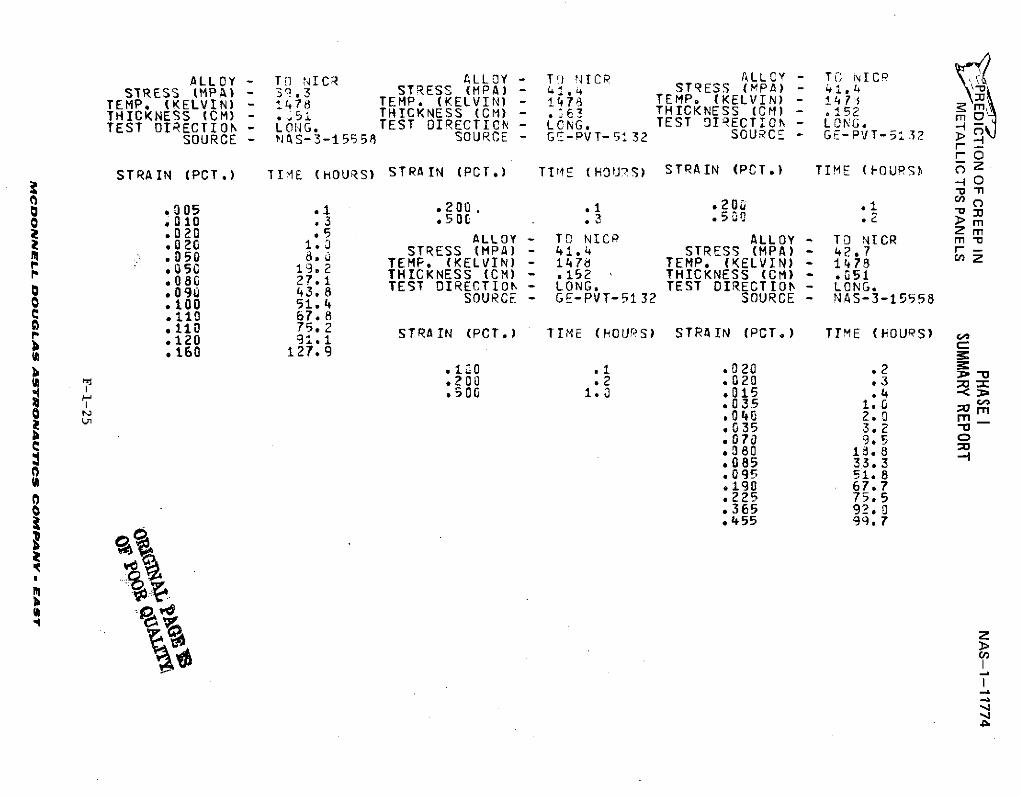
ALLOY - TD ICR ALLOY - TI NICR ALLOY T[- TIu NICPSTRESS (MPA) - 39.3 STRESS (MPA) - 1.4 STRESS (7PA) - .
TEMP, KELVIN) t478 TEMP. (KELVIN) -1478 TEMP. (KELVIN) - 1471THICKNESS (S (C- THICKNESS (CM) - L.C THICKNESS (CM) - .152TEST DIRECTION - LONG. TEST IRECTIN LONG. TEST OIECTIO - LONG.
SOURCE - NS-3-15558 SOURCE - Gr'-PVT-512 SGURCE - GE-PVT-5132
STRAIN (PCT.) TIME (HOURS) STRAIN (PCT.) TIME (HOURS) STRAIN (PCT.) TIME (IOUPS O3 -n
S.005 .1 .200. .1 . 2 0u .1 oS.010 .3 500 .3 > m
.020 .5 L 0 T Zm020 ALLOY - T NICP ALLOY - TO NICR m m2050 STRESS (MPA) - 41.4 STRESS (MPA) - 427
•.050 9,2 TEMP. (KELVIN)- 1478 TEMP. (KELVIN) - 1478 cnP0 27.1 THICKNESS (CM) - .152 THICKNESS (CM) - .051
091 43.8 TEST DIRECTION - LONG. TEST DIRECTION - LONG.S.100 51.4 SOURCE - GE-PVT-5132 SOURCE - NAS-3-15558
C .110 67.8.110 75.2 STRAIN (PCT.) TIME (HOURS) STRAIN (PCT.) TIME (IOURS).120 91.1S.160 127.9
.1O .1 .020 .2A .200 .2 .020 .3
.500 1.0 .015 .4-.035 1.0.040 2. r mr.035 3.2.070 9.5 o.080 1 . 8.085 33.3.095 51.8S.190 67,7.225 75.5
.455 99,7
Az,,
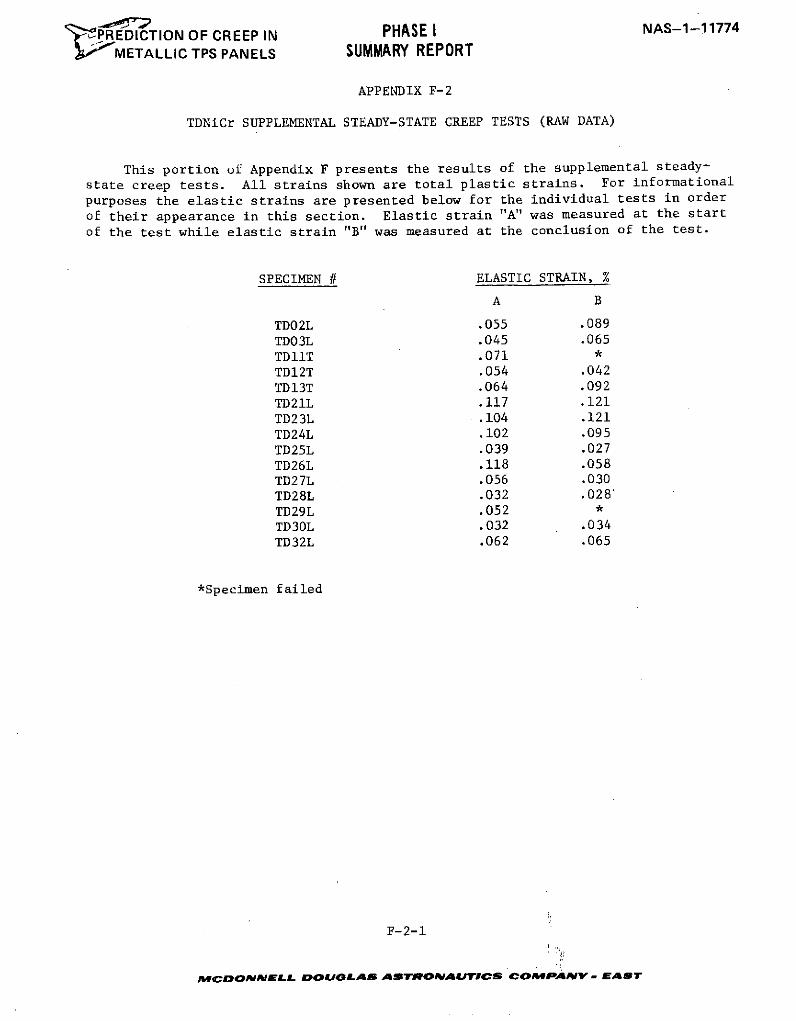
PAE NAS-1-11774PrREDICTION OF CREEP IN PHASE I
METALLIC TPS PANELS SUMMARY REPORT
APPENDIX F-2
TDNiCr SUPPLEMENTAL STEADY-STATE CREEP TESTS (RAW DATA)
This portion of Appendix F presents the results of the supplemental steady-
state creep tests. All strains shown are total plastic strains. For informational
purposes the elastic strains are presented below for the individual tests in order
of their appearance in this section. Elastic strain "A" was measured at the start
of the test while elastic strain "B" was measured at the conclusion of the test.
SPECIMEN # ELASTIC STRAIN, %
A B
TD02L .055 .089
TD03L .045 .065
TD11T .071 *TD12T .054 .042
TD13T .064 .092
TD21L .117 .121
TD23L .104 .121
TD24L .102 .095
TD25L .039 .027
TD26L .118 .058
TD27L .056 .030
TD28L .032 .028'
TD29L .052 *
TD30L .032 .034
TD32L .062 .065
*Specimen failed
F-2-1
MPdCDONNELL DOUGLAS ASTRONAUTICS COMPANY - EAST
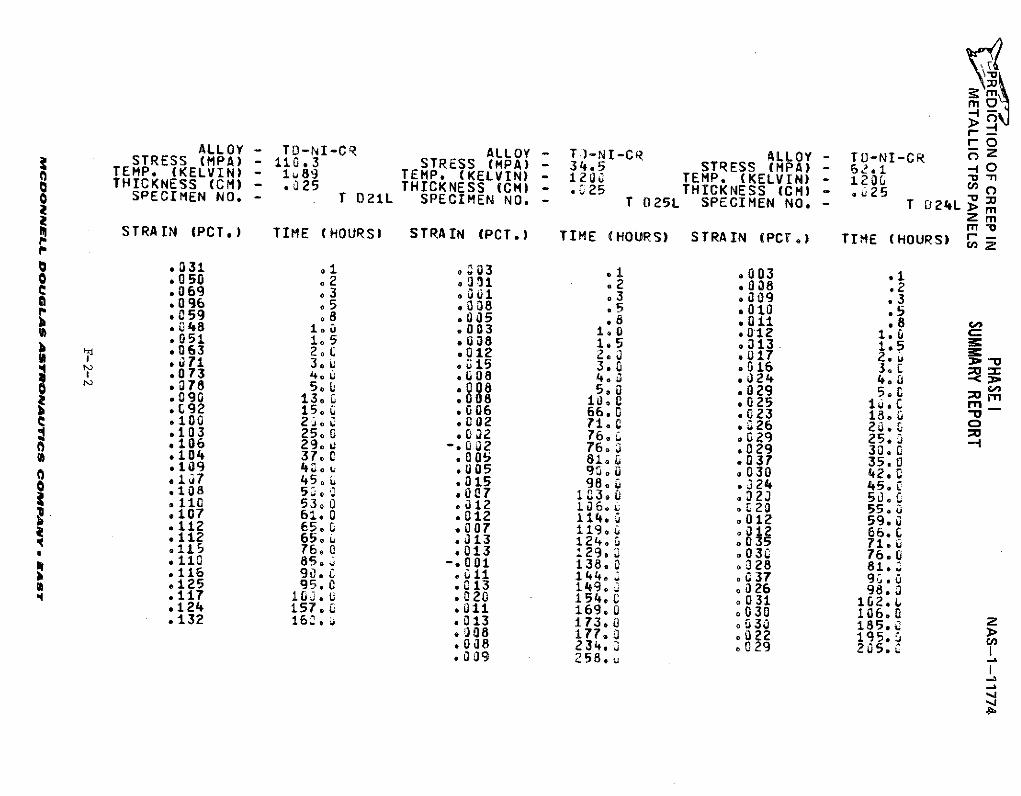
a--
rOALLOY - TD-NI-CR ALLOY - TJ-NI-CR ALLOY - TD-NI-CR o ZSTRESS (MPA) - 110.3 STRESS (MPA) - 34.5 STRESS (MPA) - 62I 0TEMP. (KELVIN) - 1u89 TEMP. (KELVIN) - 1200 TEMP. (KELVIN) - 1200 -n
THICKNESS (CM) - .025 THICKNESS (CM) - . 25 THICKNESS (CM) - u25 nSPECIMEN NO. - T D21L SPECIMEN NO. - T 025L SPECIMEN NO, - T 024L > m
2 mSTRAIN (PCT.) TIME (HOURS) STRAIN (PCT.) TIME (HOURS) STRAIN (PCT.) TIME (HOURS)
.031 ol .03 . .003 .1S.050 .2 09 1 .2 .008 .2.069 03 .01l .3 a009 .3*096 .5 00338 .5 .01 .5.059 .8 .005 .8 o.01 .8 C.L48 10 .003 10 .012 1.6.051 1, 5 .008 1.5 .313. 1.5.063 20C .012 2.3 o017 2, .a ea71 l .0 15 3.0 .516 3oC.073 .o 0 608 4.j .024 4.0 078 5. .008 5.0 .029 5.0. 090 13. .008 10.0 .025 10.0 m.092 15.0 .006 66.0 .023 1.100 2.0 .002 71.0 . 026 20. o.103 25.0 .032 76. .029 25.0.106 2 9 .u -. 032 76.3 .029 30.0S104 37.0 .005 81.0 .037 35.0.109 48 . .005 90.0 .030 42.0S.17 45.0 .015 98.0 .324 45.0S.108 50.0 .007 1z3.0 .020 50.C.110 53.0 .012 10 6 .L .020 55.0S107 61.0 .012 114.0 .012 59.0.112 65.0 .007 119.0 .012 66.Ct 112 65.6 .313 124.0 .035 71., .115 76.0 .013 129.3 .030 76.0S110 85.0 -.001 138.0 o028 81.b116 90,0 .011 144.0 .037 90.3* .125 95.0 .013 149.0 o026 98.3.117 100.0 .020 154.0 .031 12. L.124 157.0 .011 169.0 .030 106.0.132 16,~ .013 173.0 .030 185., Z*308 177.0 .022 195.0.008 234.0 .029 205.0
.009 258.-
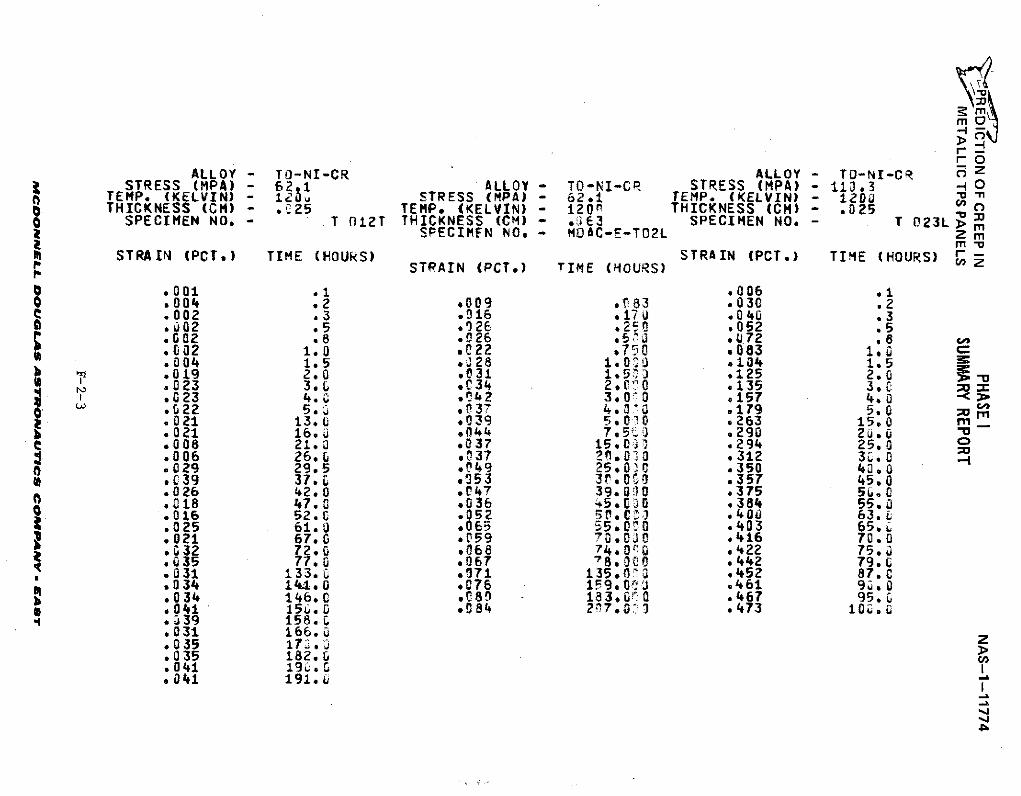
I-
ro
ALLOY - TO-NI-CR ALLOY - TO-NI-CR 0 ZSTRESS (MPA) - 62.1 ALLOY - TO-NI-CR STRESS (MPA) - 110.3 -
TEMP. (KELVIN)- 120, STRESS (MPA)- 62,1 TEMP. (KELVIN) - 1200THICKNESS (CM) - .r25 TEMP. (KELVIN) - 120 THICKNESS (CM) - .025
a SPECIMEN NO, - T 012T THICKNESS (CM) - ,i63 SPECIMEN NO. - T 023L > mi SPECIMEN NO. - MOAC-E-TD2L z m
H STRAIN (PCT.) TIME (HOURS) STRAIN (PCT.) TIME (HOURS) r-STRAIN (PCT.) TIME (HOURS)
S.001 .1 .006 .1O .004 .2 *009 .83 .030 .2C .002 .3 .916 .170 .040 .3
.a02 .5 .026 .250 .052 .5
.002 .8 .026 .5, .72 .8
.002 1.0 *C22 .750 .083 1.0c
.004 1.5 .*28 1.00 .104 1.5
.019 2.0 .031 1.5"1 .125 2.0S.023 3.0 o34 2. r' 0 135 3.C 0
.023 4.0 .942 3.00 .157 4.0S.022 5.0 .37 4.0 .179 5.0.021 13.u .039 5.000 .263 15.0 m _
S .021 16. *.44 7.5'J .290 20.0 -.008 21.0 .037 15.0 .294 25, 0 C.006 26.0 .037 3 .02o .312 3.0.029 29.5 *F49 25°.00 .350 40,0
S .C39 37. *0953 3r.00 .357 45.0.026 42.0 .047 39.00 .375 5,0.018 47.0 *036 45.0C0 .384 55.0.016 52.0 .052 5, CJ3 4O 63.L.025 61.0 .065 55.00O .403 6 5 ...021 67.0 .059 70.030 .416 70.0.032 72.0 .68 74.4 .422 75.0.035 77.0 .067 78.00 .442 79.0.031 133.C .971 135.010 .452 87.C.034 141.0 .076 1F9.0GJ .461 90,0
b .034 146.C .089 183.0 0 .467 95.* .041 15u 0 .084 217,071 .473 10L.G
S.39 158.0.031 166.0.035 17..035 182.0.041 190.0.041 191. -
-I,,.1
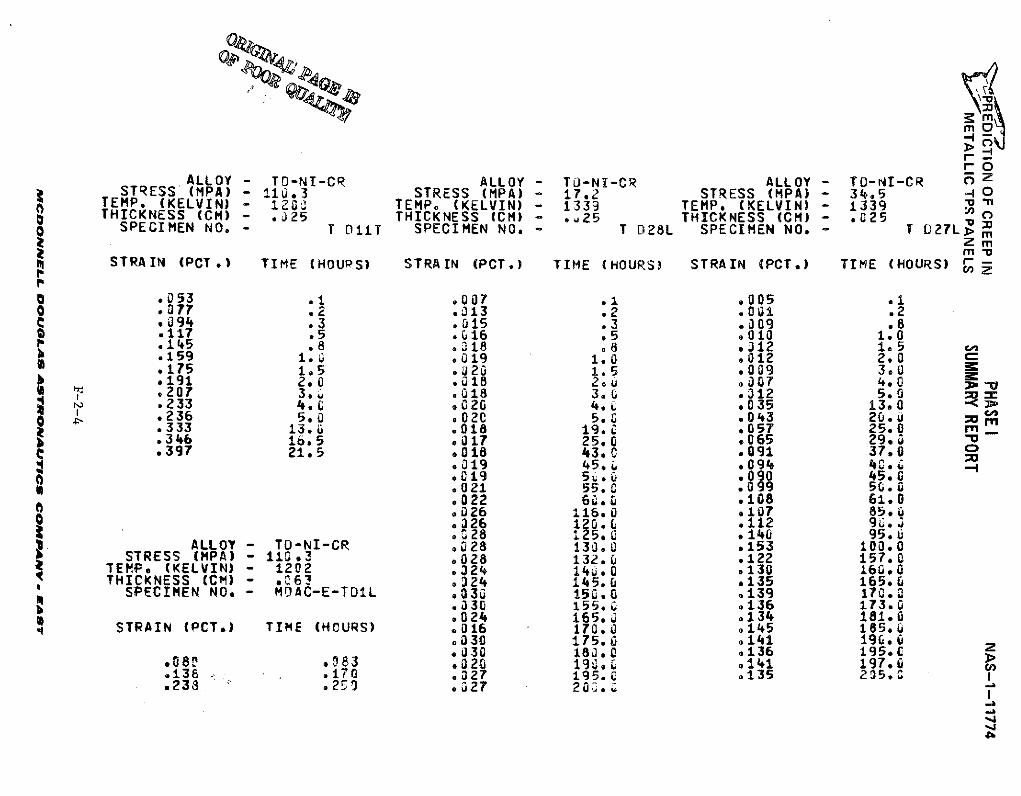
rO
ALLOY - TO-NT-CR ALLOY - TO-NI-CR ALLOY - TD-NI-CR 0 ZSTRESS (MPA) - 110.3 STRESS (MPA) - 17.2 STRESS (MPA) - 34.5 4 0
TEMP. (KELVIN) - 120t TEMP. (KELVIN) - 1339 TEMP. (KELVIN) - 1339 0 THICKNESS (CM) - .u25 THICKNESS (CM) - .*25 THICKNESS (CM) - .025 0
o SPECIMEN NO. -T DiT SPECIMEN NO. - T 028L SPECIMEN NO. - T 027L> mZ m
SSTRAIN (PCT.) TIME (HOURS) STRAIN (PCT.) TIME (HOURS) STRAIN (PCT.) TIME (HOURS) u
0 .053 .1 .007 .1 .005 .10 .077 .2 .013 .2 .001 .2C .094 .3 .015 .3 .009 .8
*117 .5 .16 .5 .010 1.0.145 .8 .018 .8 .312 1.5.159 1.6 .019 1.0 .012 2.0.175 1.5 .U20 1.5 .009 3.0*191 2.0 .018 2.0 .007 4.0.207 3.u .018 3.0 .312 5.0.233 4.0 .020 4.L .035 13.0* .236 5.0 .020 5.0 .043 20. MC.333 13.0 .018 19.0 .057 25.0 m.346 b16.5 .017 25.0 .065 29.0 Co.397 21.5 .018 43.0 *091 37.0
.019 45. .094 40.4 -4
.019 5. $ .090 45.0
.021 55.0 .099 5G0.
.022 60.0 .108 61.0
.026 116.0 .107 85.0
.326 120.0 .112 90.3o .Z 28 125.0 .140 95.0
ALLOY - TO-NI-CR o028 130.0 .153 100.0STRESS (MPA) - 1103 .028 132.0 .122 157.0
TEMP. (KELVIN) - 1202 .324 14;.0 .130 160.0THICKNESS (CM) - .~063 324 145.0 .135 165.0
SPECIMEN NO. - MOAC-E-TDIL .030 150.0 .139 170.0.330 155.0 .136 173.0S024 165.0 .134 181.0
STRAIN (PCT.) TIME (HOURS) o016 170.0 .145 185.0o030 175.0 .141 190.0.030 180.0 .136 195.0 z
*08 *83 .020 190.L .141 197.0 0.136 .170 o027 195.0 .135 235.C I.233 .250 .327 20 .
4
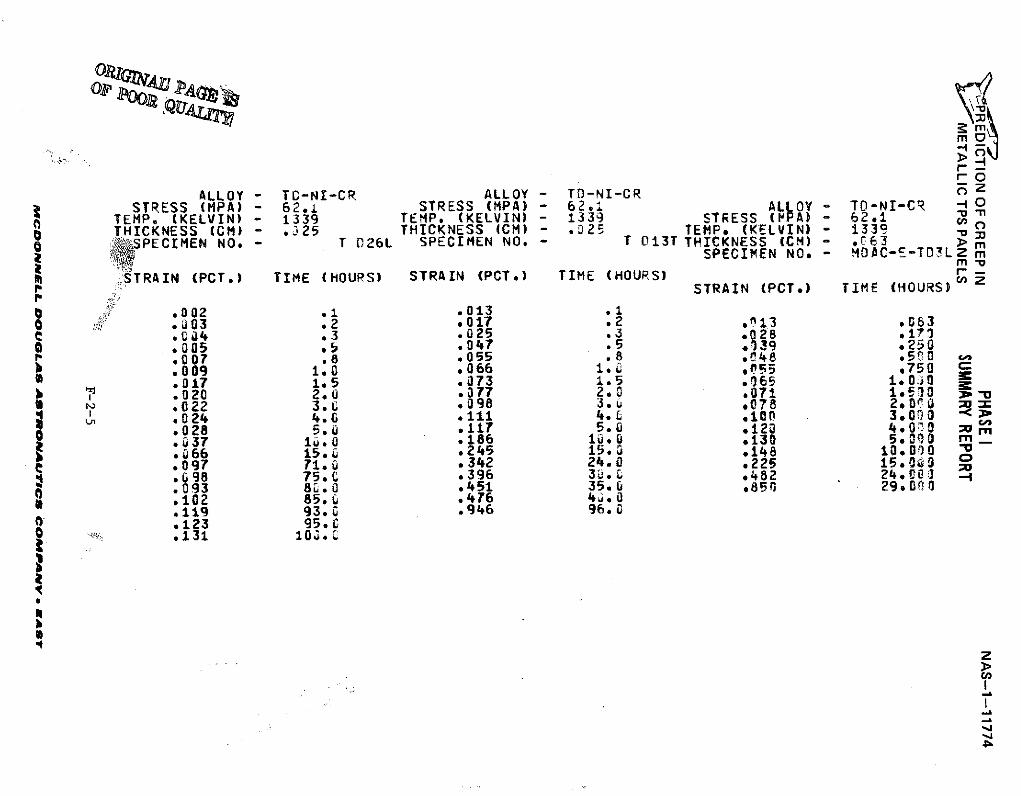
rO
ALLOY - TC-NI-CR ALLOY - TD-NI-CR C ZSTRESS (MPA) - 62.1 STRESS (MPA) - 62,. AL OY - TO-NI-CR - 0
TEMP. (KELVIN) - 1339 TEMP. (KELVIN) - 1339 STRESS (MA) - 62.1THICKNESS (CM) - .325 THICKNESS (CM) - .325 TEMP. (KELVIN) - 1339 -
o PECIMEN NO. - T D26L SPECIMEN NO. T 013T THICKNESS (CM) - .63 mSPECIMEN NO. - LDC-E-TO3L2 m
'-STRAIN (PCT.) TIME (HOURS) STRAIN (PCT.) TIME (HOURS)STRAIN (PCT.) TIME (HOURS)
S.002 .1 .013 .1O .03 .2 .017 .2 0f13 *083C .#04 .3 .025 .3 .028 .173
.005 .5 .047 .5 *.39 *250
.007 .8 .055 .8 .048 .500 C
.009 1.0 *066 1 55 .750
.017 1.5 073 1.5 .J65 1.0130
.020 2 .77 2.0 .071 1.50 .1"
.022 3.C .098 3,U .078 2.0r
.024 4.0 *111 4.L *i0 3.00 0
.028 5 0 *47 5 12 .00 r037 1u. 0 *186 10.0 e130 5.00 m.066 15. .245 15.0 .148 10.0)0 1S .097 71.0 .342 24.0 .225 15.0 C.098 75.0 .396 3J*. .482 24.003.093 8.O .451 35.0 *85 29, 0I
a .102 85.u .476 4j.0.119 93.c .946 96.0.123 95.C
o .131 10.
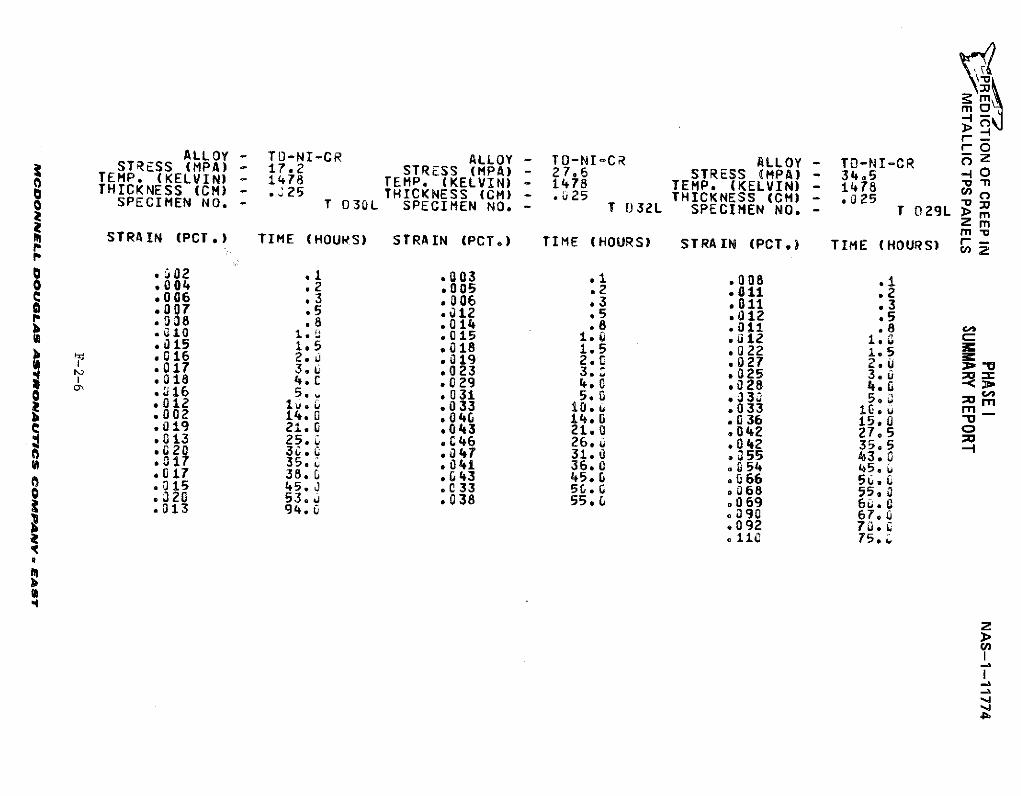
--
rOALLOY - TO-NI-CR ALLOY - TO-NI-CR ALLOY - TO-NI-CR 0 ZSTRESS (MPA) - 17.2 STRESS (MPA) - 27.6 STRESS (MPA)- 34.5 ~0TEMP. KELVIN) - 1478 rEMP. (KELVIN) - 1478 TEMP. (KELVIN) - 1478 CASTHICKNESS (CM) - 1425 THICKNESS (CM) - .025 THICKNESS (CM) - .25o SPECIMEN NO. - T 030L SPECIMEN NO. - T 032L SPECIMEN NO. - T 029L > m
Z mM STRAIN (PCT.) TIME (HOURS) STRAIN (PCT,) TIME (HOURS) STRAIN (PCT.) TIME (HOURS) Z
.02 .1 .003 .1 .008 .1.004 .2 .005 .2 .011 .2S.006 .3 .006 .3 .011 .3.007 .5 .,12 .5 .012 .5.008 .8 .014 .8 .011 .8.C10 1* .015 1.0 .1i2 1.0 .015 1.5 .018 1.5 .022 1.5l .G16 2. .019 2.C .027 2.6 J-.017 3.u . 23 3.' .025 3.0.318 4.0 .029 4.0 .028 4.0N0 016 5. .031 5.0 .34 5.0 r.012 1 * .033 10, .033 1. mr
S002 14.0 .040 14.0 .036 15.0S.019 21.0 .043 21.0 .042 27.5.013 25.0 .C46 26.U .042 35.5S *020 30.0 .047 31.0 .55 43.0.017 35. .041 36*0 .054 45.,.017 38.0 .043 45*. .066 5,GL.015 45. .033 5c. .o068 5500S.20 53.? .038 55*0 .069 6.0.013 94.0 090 67.0.092 70.0. 114 75.0
z
I
46,
tPREDICTION OF CREEP IN PHASEI NAS-1-11774METALLIC TPS PANELS SUMMARY REPORT
APPENDIX F-3
TD-Ni-Cr CYCLIC CREEP TESTS
(RAW DATA)
This section presents the results of the 12 cyclic creep tests that were
performed on TD-Ni-Cr tensile specimens.
F-3-1
MCDONNELL DOUOLAS ASTROMAUTICS COMPANV EASer
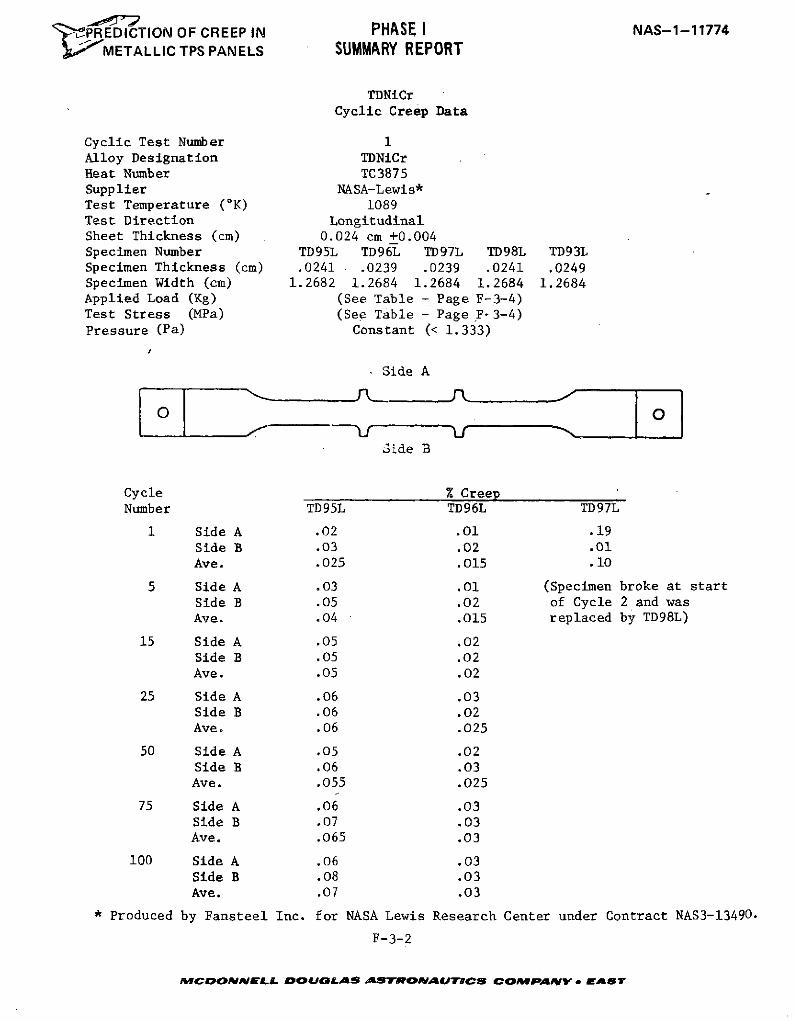
'P REDICTION OF CREEP IN PHASE I NAS-1-11774SMETALLIC TPS PANELS SUMMARY REPORT
TDNiCrCyclic Creep Data
Cyclic Test Number 1Alloy Designation TDNiCrHeat Number TC3875Supplier NASA-Lewis*Test Temperature (OK) 1089Test Direction LongitudinalSheet Thickness (cm) 0.024 cm +0.004Specimen Number TD95L TD96L TD97L TD98L TD93LSpecimen Thickness (cm) .0241 - .0239 .0239 .0241 .0249Specimen Width (cm) 1.2682 1.2684 1.2684 1.2684 1.2684Applied Load (Kg) (See Table - Page F-3-4)Test Stress (MPa) (See Table - Page F-3-4)Pressure (Pa) Constant (< 1.333)
Side A
Side B
Cycle % CreepNumber TD95L TD96L TD97L
1 Side A .02 .01 .19Side B .03 .02 .01Ave. .025 .015 .10
5 Side A .03 .01 (Specimen broke at startSide B .05 .02 of Cycle 2 and wasAve. .04 .015 replaced by TD98L)
15 Side A .05 .02Side B .05 .02Ave. .05 .02
25 Side A .06 .03Side B .06 .02Ave. .06 .025
50 Side A .05 .02Side B .06 .03Ave. .055 .025
75 Side A .06 .03Side B .07 .03Ave. .065 .03
100 Side A .06 .03Side B .08 .03Ave. .07 .03
* Produced by Fansteel Inc. for NASA Lewis Research Center under Contract NAS3-13490.
F-3-2
MCDONNELL DOUOLAS ASTRONAUTICS COWPANY E AST
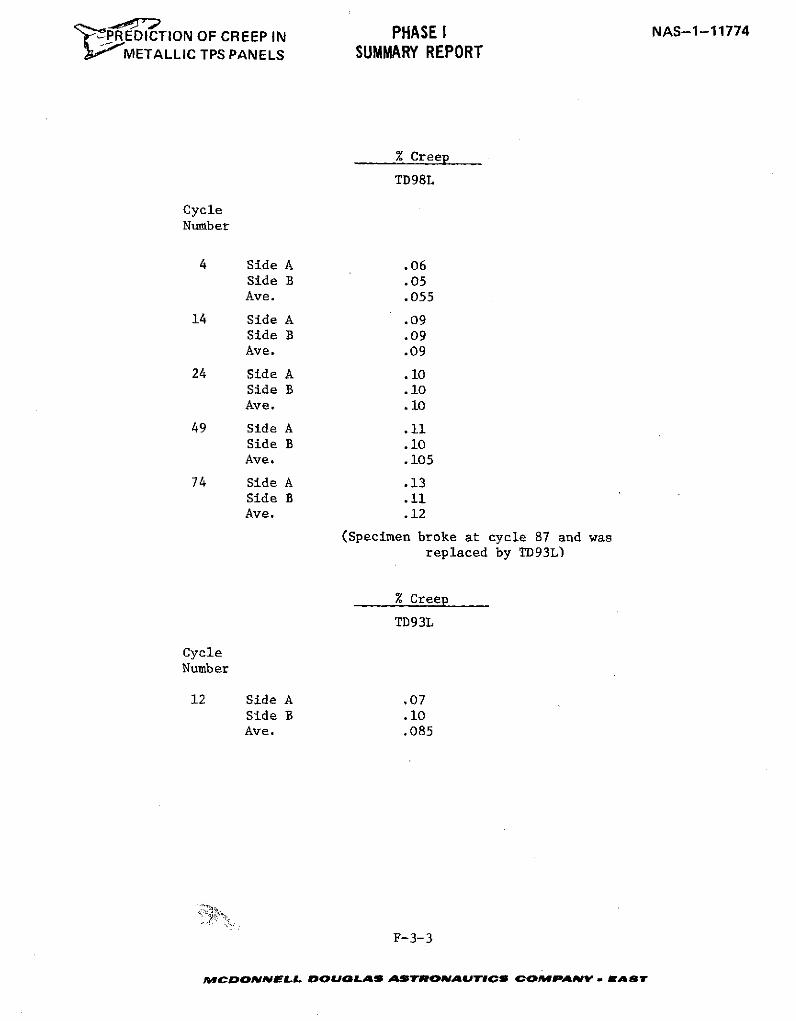
",PREDICTION OF CREEP IN PHASE I NAS-1-11774
METALLIC TPS PANELS SUMMARY REPORT
% Creep
TD98L
Cycle
Number
4 Side A .06Side B .05Ave. .055
14 Side A .09Side B .09Ave. .09
24 Side A .10Side B .10Ave. .10
49 Side A .11Side B .10Ave. .105
74 Side A .13Side B .11Ave. .12
(Specimen broke at cycle 87 and wasreplaced by TD93L)
% Creep
TD93L
CycleNumber
12 Side A .07Side B .10Ave. .085
F-3-3
MCDONNELL DOUGLAS ASTRONAUTICS COMPANY EAST
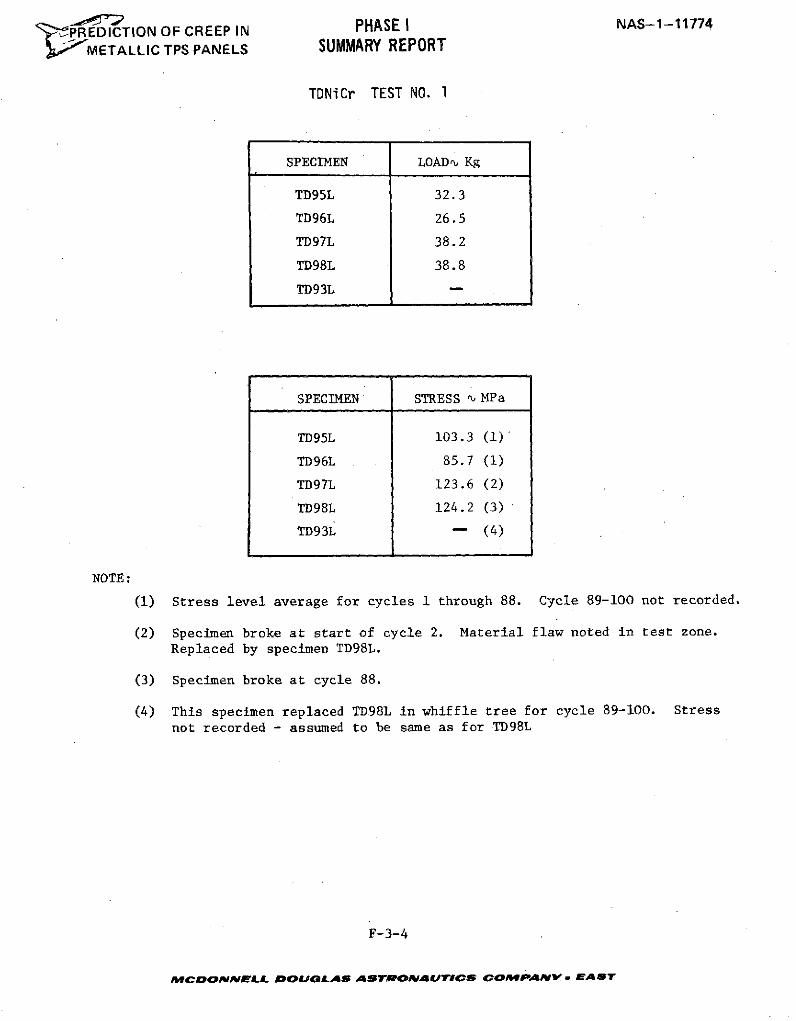
'tP REDICTION OF CREEP IN PHASE I NAS-1-11774
METALLIC TPS PANELS SUMMARY REPORT
TDNiCr TEST NO. 1
SPECIMEN LOAD-u Kg
TD95L 32.3
TD96L 26.5
TD97L 38.2
TD98L 38.8
TD93L
SPECIMEN STRESS r MPa
TD95L 103.3 (1)
TD96L 85.7 (1)
TD97L 123.6 (2)
TD98L 124.2 (3)
TD93L - (4)
NOTE:
(1) Stress level average for cycles 1 through 88. Cycle 89-100 not recorded.
(2) Specimen broke at start of cycle 2. Material flaw noted in test zone.
Replaced by specimen TD98L.
(3) Specimen broke at cycle 88.
(4) This specimen replaced TD98L in whiffle tree for cycle 89-100. Stress
not recorded - assumed to be same as for TD98L
F-3-4
4CDONRNELL DOUGLAS ASTRPONIAUTICS COMPANY , EAST
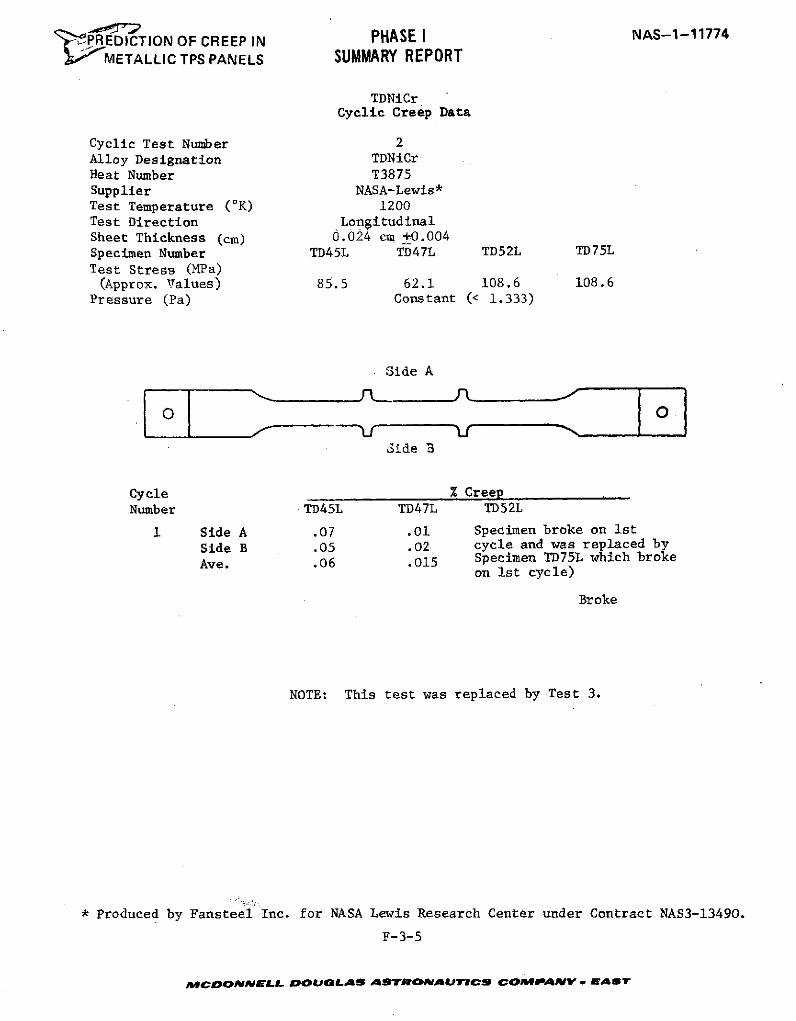
"PREDICTION OF CREEP IN PHASE I NAS-1-11774
SMETALLIC TPS PANELS SUMMARY REPORT
TDNiCrCyclic Creep Data
Cyclic Test Number 2Alloy Designation TDNiCrHeat Number T3875Supplier NASA-Lewis*Test Temperature (oK) 1200Test Direction LongitudinalSheet Thickness (cm) 0.024 cm +0.004Specimen Number TD45L TD47L TD52L TD75L
Test Stress (MPa)(Approx. Values) 85.5 62.1 108.6 108.6
Pressure (Pa) Constant (< 1.333)
Side A
0
3ide B
Cycle % CreepNumber TD45L TD47L TD52L
1 Side A .07 .01 Specimen broke on ist
Side B .05 .02 cycle and was replaced by
Ave. .06 .015 Specimen TD75L which brokeon Ist cycle)
Broke
NOTE: This test was replaced by Test 3.
* Produced by Fansteel Inc. for NASA Lewis Research Center under Contract NAS3-13490.
F-3-5
MCDONmNELL DOUGsLAS ASTCROAUTICS COMPANVY. EArTw
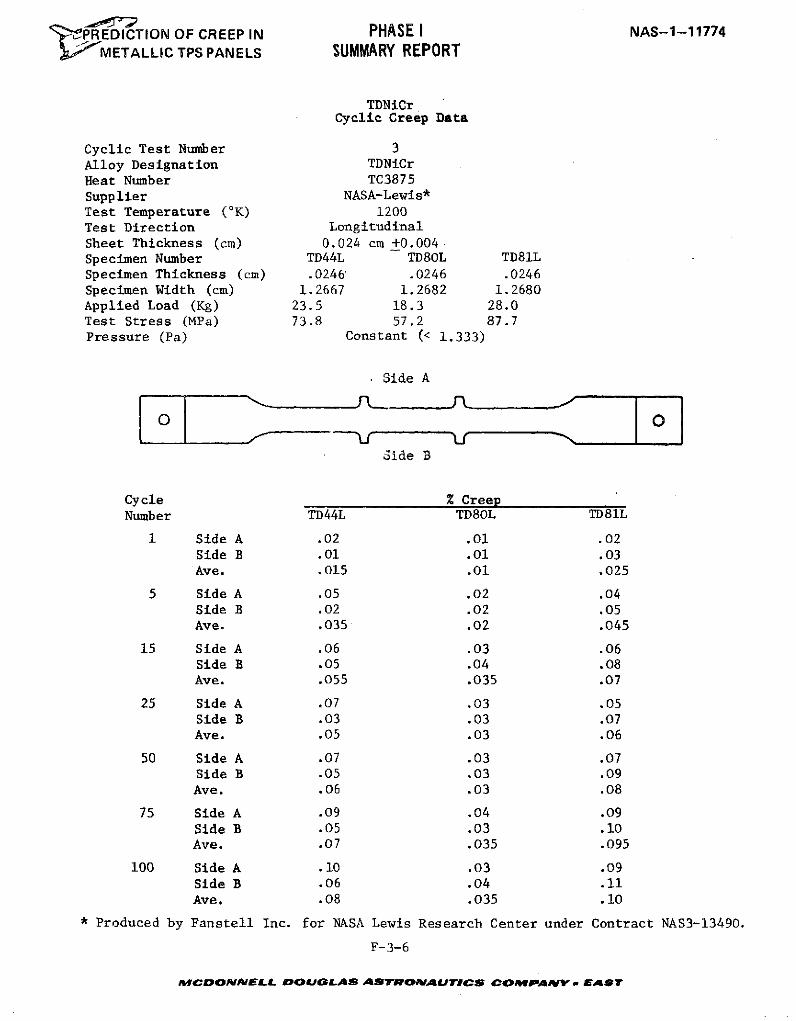
' PREDICTION OF CREEP IN PHASE I NAS-1-11774METALLIC TPS PANELS SUMMARY REPORT
TDNiCrCyclic Creep Data
Cyclic Test Number 3Alloy Designation TDNiCrHeat Number TC3875Supplier NASA-Lewis*Test Temperature (OK) 1200Test Direction LongitudinalSheet Thickness (cm) 0.024 cm +0.004Specimen Number TD44L TD80L TD81LSpecimen Thickness (cm) .0246 .0246 .0246Specimen Width (cm) 1.2667 1.2682 1.2680Applied Load (Kg) 23.5 18.3 28.0Test Stress (MPa) 73.8 57.2 87.7Pressure (Pa) Constant (< 1.333)
Side A
Side B
Cycle % CreepNumber TD44L TD80L TD81L
1 Side A .02 .01 .02Side B .01 .01 .03Ave. .015 .01 .025
5 Side A .05 .02 .04Side B .02 .02 .05Ave. .035 .02 .045
15 Side A .06 .03 .06Side B .05 .04 .08Ave. .055 .035 .07
25 Side A .07 .03 .05Side B .03 .03 .07Ave. .05 .03 .06
50 Side A .07 .03 .07Side B .05 .03 .09Ave. .06 .03 .08
75 Side A .09 .04 .09Side B .05 .03 .10Ave. .07 .035 .095
100 Side A .10 .03 .09Side B .06 .04 .11Ave. .08 .035 .10
* Produced by Fanstell Inc. for NASA Lewis Research Center under Contract NAS3-13490.
F-3-6
MCOONNELL DOUOLAS ASTROAAUTICS COMPANV EAST
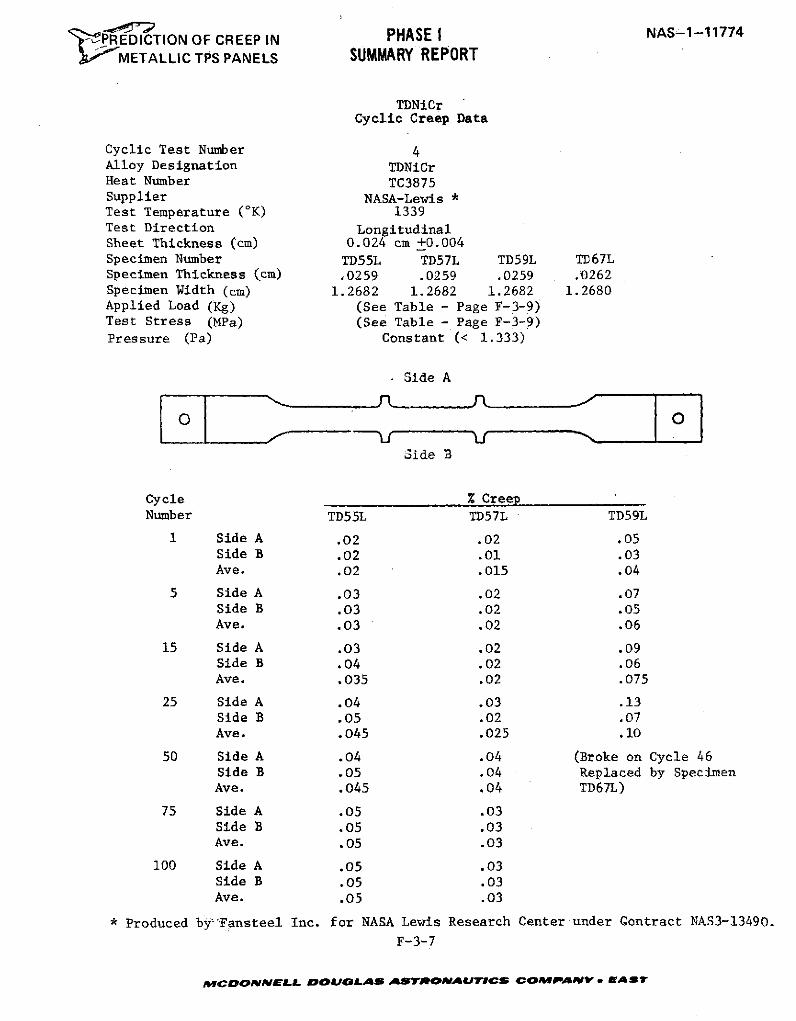
P REDICTION OF CREEP IN PHASE I NAS-1-11774
METALLIC TPS PANELS SUMMARY REPORT
TDNiCrCyclic Creep Data
Cyclic Test Number 4Alloy Designation TDNiCrHeat Number TC3875Supplier NASA-Lewis *Test Temperature (*K) 1339Test Direction LongitudinalSheet Thickness (cm) 0.024 cm +0.004Specimen Number TD55L TD57L TD59L TD67LSpecimen Thickness (cm) ,0259 .0259 .0259 .0262Specimen Width (cm) 1.2682 1.2682 1.2682 1.2680Applied Load (Kg) (See Table - Page F-3-9)Test Stress (MPa) (See Table - Page F-3-9)
Pressure (Pa) Constant (< 1.333)
Side A
3ide B
Cycle % CreepNumber TD55L TD57L TD59L
1 Side A .02 .02 .05Side B .02 .01 .03Ave. .02 .015 .04
5 Side A .03 .02 .07Side B .03 .02 .05Ave. .03 .02 .06
15 Side A .03 .02 .09Side B .04 .02 .06Ave. .035 .02 .075
25 Side A .04 .03 .13Side B .05 .02 .07Ave. .045 .025 .10
50 Side A .04 .04 (Broke on Cycle 46Side B .05 .04 Replaced by SpecimenAve. .045 .04 TD67L)
75 Side A .05 .03Side B .05 .03Ave. .05 .03
100 Side A .05 .03Side B .05 .03Ave. .05 .03
* Produced by-Fansteel Inc. for NASA Lewis Research Center under Contract NAS3-13490.
F-3-7
MCDONNELL OUvoLAS ASTROPAUTICS COMPANY V E AST
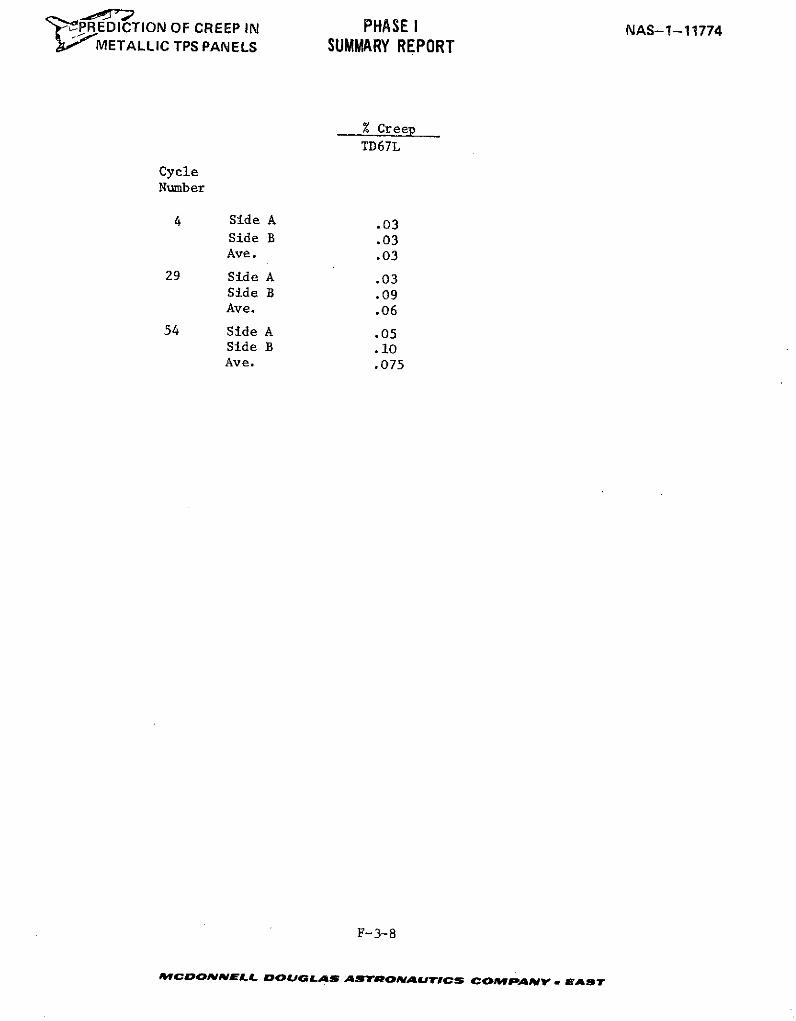
PREDICTION OF CREEP IN PHASE I NAS-1-11774METALLIC TPS PANELS SUMMARY REPORT
% Creep
TD67L
CycleNumber
4 Side A .03Side B .03Ave. .03
29 Side A .03Side B .09Ave. .06
54 Side A .05Side B .10Ave. .075
F-3-8
MCoONNELL DOUGLAS ASTRONAUTICS COMPANY . EAST
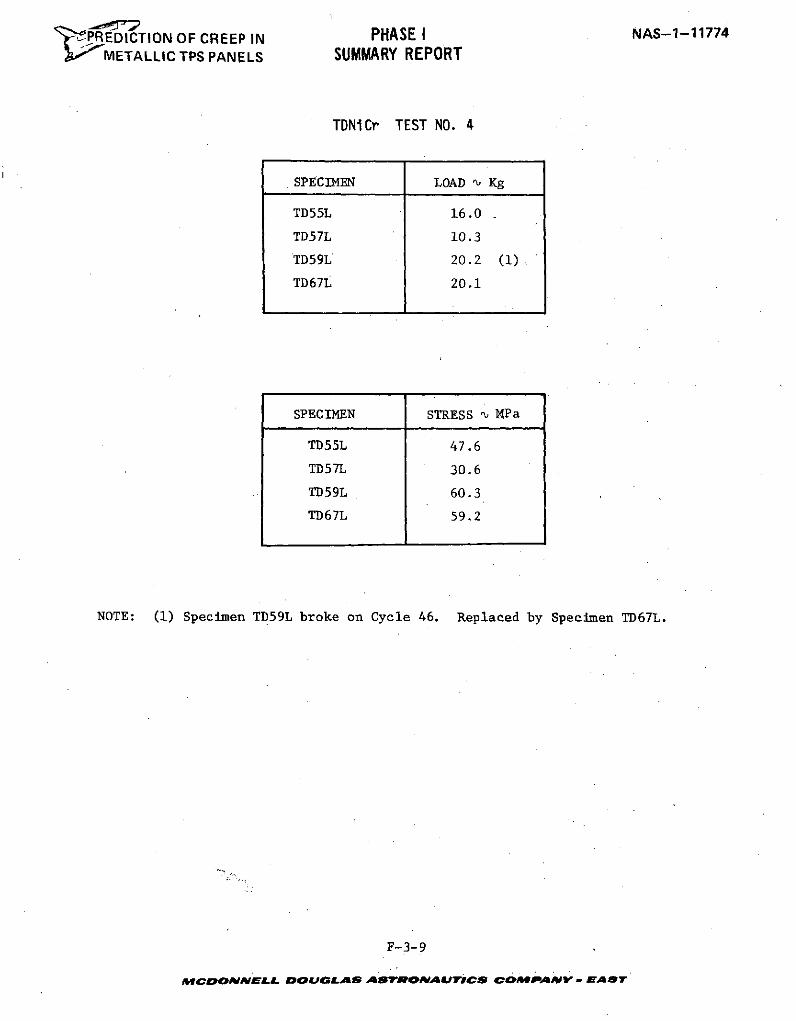
PREDICTION OF CREEP IN PHASE I NAS-1-11774
METALLIC TPS PANELS SUMMARY REPORT
TDNiCr TEST NO. 4
SPECIMEN LOAD ' Kg
TD55L 16.0
TD57L 10.3
TD59L 20.2 (1)
TD67L 20.1
SPECIMEN STRESS nu XPa
TD55L 47.6
TD57L 30.6
TD59L 60.3
TD67L 59.2
NOTE: (1) Specimen TD59L broke on Cycle 46. Replaced by Specimen TD67L.
F-3-9
MCDONNELL DOUGLAS ASTRONAUTICS COMPANY Ba S
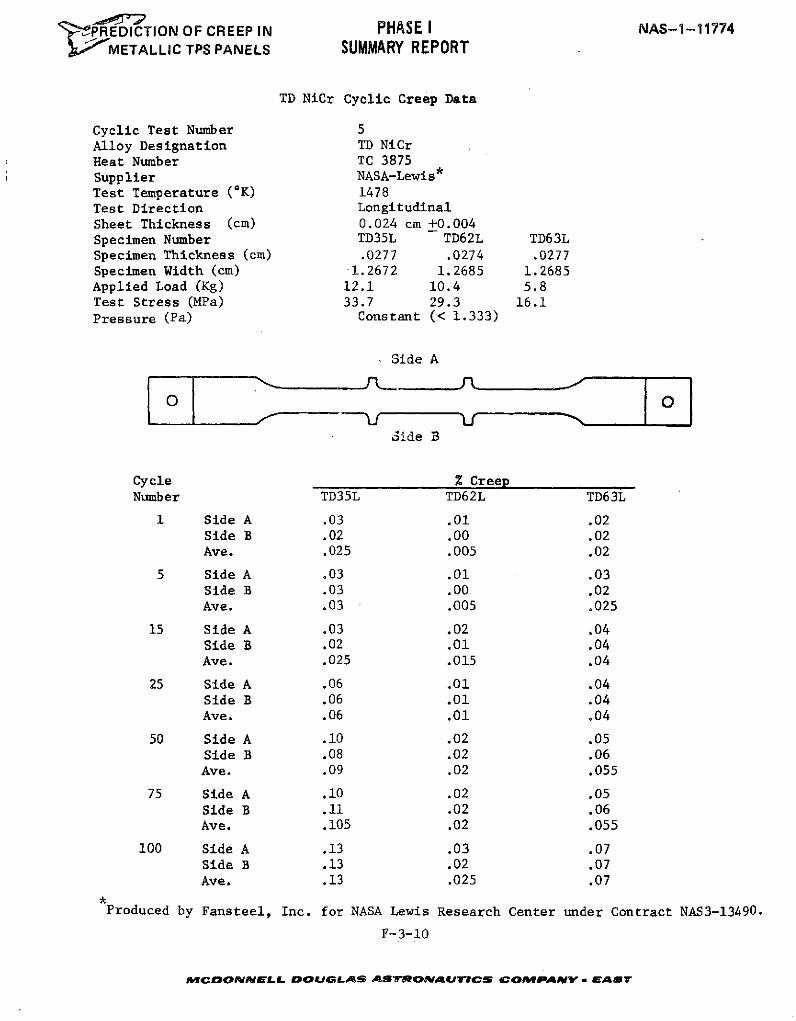
' PREDICTION OF CREEP IN PHASE I NAS-1-11774SMETALLIC TPS PANELS SUMMARY REPORT
TD NiCr Cyclic Creep Data
Cyclic Test Number 5Alloy Designation TD NiCrHeat Number TC 3875Supplier NASA-Lewis*Test Temperature (0K) 1478Test Direction LongitudinalSheet Thickness (cm) 0.024 cm +0.004Specimen Number TD35L TD62L TD63LSpecimen Thickness (cm) .0277 .0274 .0277Specimen Width (cm) 1.2672 1.2685 1.2685Applied Load (Kg) 12.1 10.4 5.8Test Stress (MPa) 33.7 29.3 16.1Pressure (Pa) Constant (< 1.333)
Side A
Side B
Cycle % CreepNumber TD35L TD62L TD63L
1 Side A .03 .01 .02Side B .02 .00 .02
Ave. .025 .005 .02
5 Side A .03 .01 .03Side B .03 .00 .02
Ave. .03 .005 .025
15 Side A .03 .02 .04Side B .02 .01 .04
Ave. .025 .015 .04
25 Side A .06 .01 .04Side B .06 .01 .04
Ave. .06 .01 .04
50 Side A .10 .02 .05Side B .08 .02 .06
Ave. .09 .02 .055
75 Side A .10 .02 .05Side B .11 .02 .06Ave. .105 .02 .055
100 Side A .13 .03 .07Side B .13 .02 .07Ave. .13 .025 .07
Produced by Fansteel, Inc. for NASA Lewis Research Center under Contract NAS3-13490.
F-3-10
AWCDONAIELL DOUGLAS ASTRONAUTICS COMWPAV a EAST
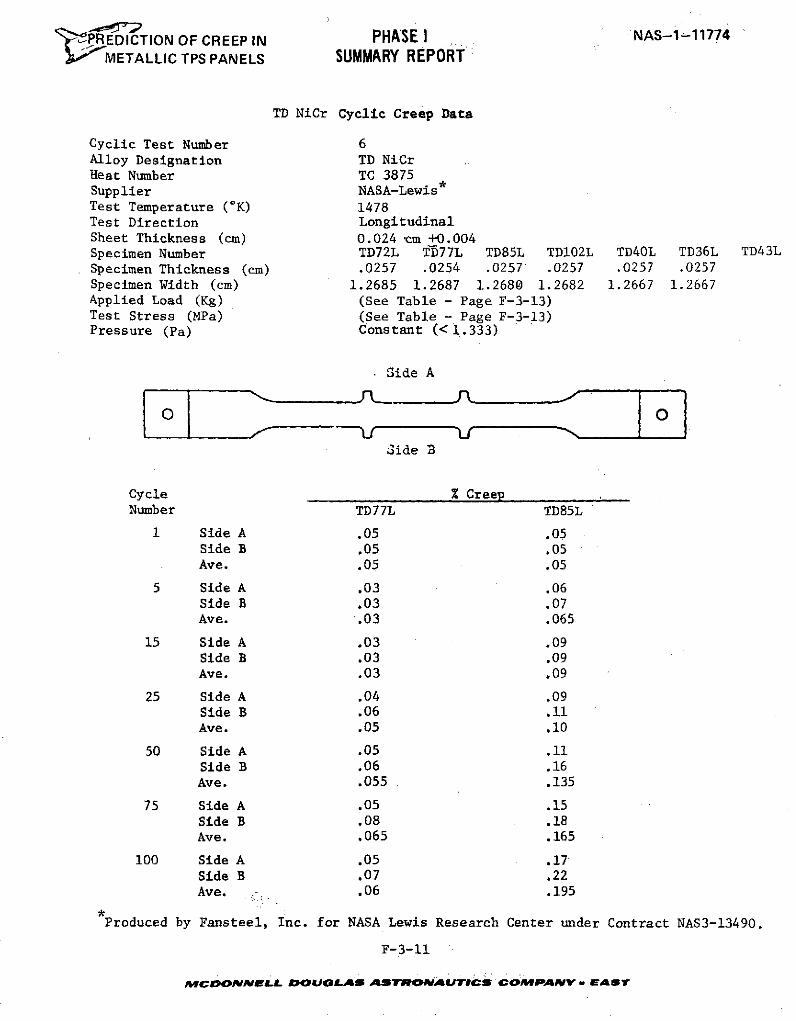
' REDICTION OF CREEP IN PHASE I NAS-1-11774METALLIC TPS PANELS SUMMARY REPORT
TD NiCr Cyclic Creep Data
Cyclic Test Number 6Alloy Designation TD NiCrHeat Number TC 3875Supplier NASA-Lewis*Test Temperature ('K) 1478Test Direction LongitudinalSheet Thickness (cm) 0.024 cm +0.004Specimen Number TD72L Tf77L TD85L TD102L TD40L TD36L TD43LSpecimen Thickness (cm) .0257 .0254 .0257 .0257 .0257 .0257
Specimen Width (cm) 1.2685 1.2687 1.2680 1.2682 1.2667 1.2667Applied Load (Kg) (See Table - Page F-3-13)Test Stress (MPa) (See Table - Page F-3-13)Pressure (Pa) Constant (<1.333)
Side A
0_O
Side B
Cycle % CreepNumber TD77L TD85L
1 Side A .05 .05Side B .05 .05Ave. .05 .05
5 Side A .03 .06Side B .03 .07Ave. .03 .065
15 Side A .03 .09Side B .03 .09Ave. .03 .09
25 Side A .04 .09Side B .06 .11Ave. .05 .10
50 Side A .05 .11Side B .06 .16Ave. .055 .135
75 Side A .05 .15Side B .08 .18Ave. .065 .165
100 Side A .05 .17Side B .07 .22Ave. .06 .195
Produced by Fansteel, Inc. for NASA Lewis Research Center under Contract NAS3-13490.
F-3-11
MCDONNELL DOUOLAS ASTRONAUTICS COMPANY V ASV
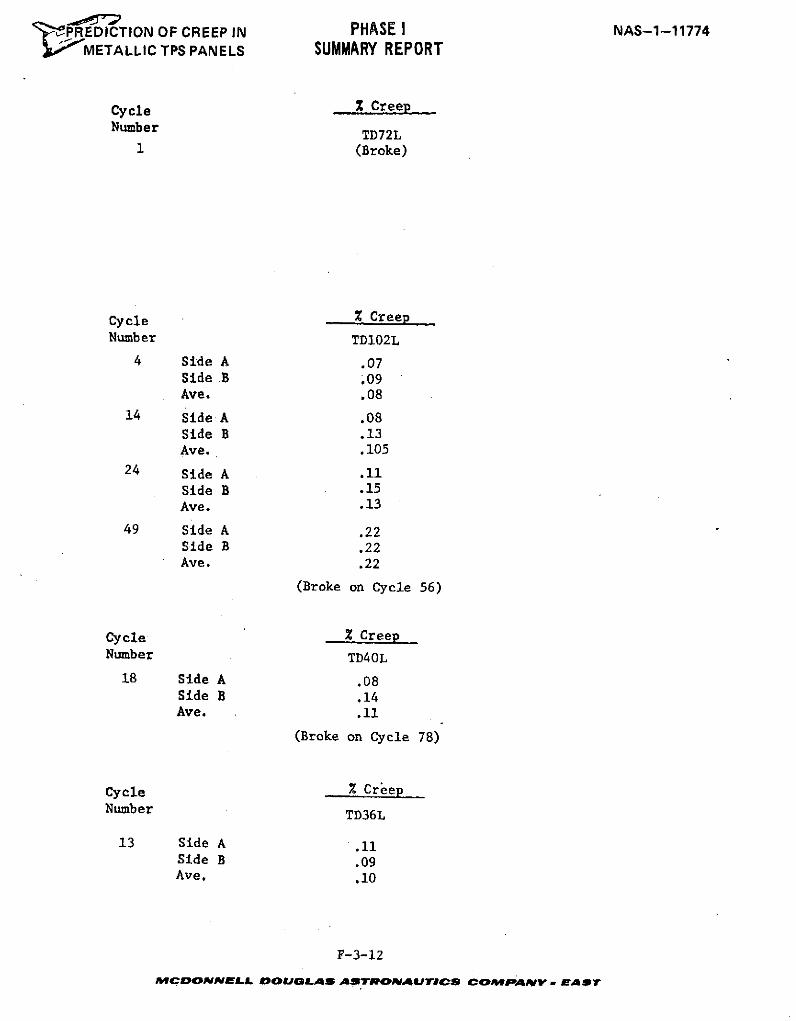
" PREDICTION OF CREEP IN PHASE I NAS-1-11774Jb METALLIC TPS PANELS SUMMARY REPORT
Cycle 2 CreepNumber TD72L
1 (Broke)
Cycle % CreepNumber TD102L
4 Side A .07Side B .09Ave. .08
14 Side A .08Side B .13Ave. .105
24 Side A .11Side B .15Ave. .13
49 Side A .22Side B .22Ave. .22
(Broke on Cycle 56)
Cycle % CreepNumber TD40L
18 Side A .08Side B .14Ave. .11
(Broke on Cycle 78)
Cycle % CreepNumber TD36L
13 Side A .11Side B .09Ave. .10
F-3-12
AMCDOaNELL DOUGLAS ASTRONAUTICS COMPANV . EAST
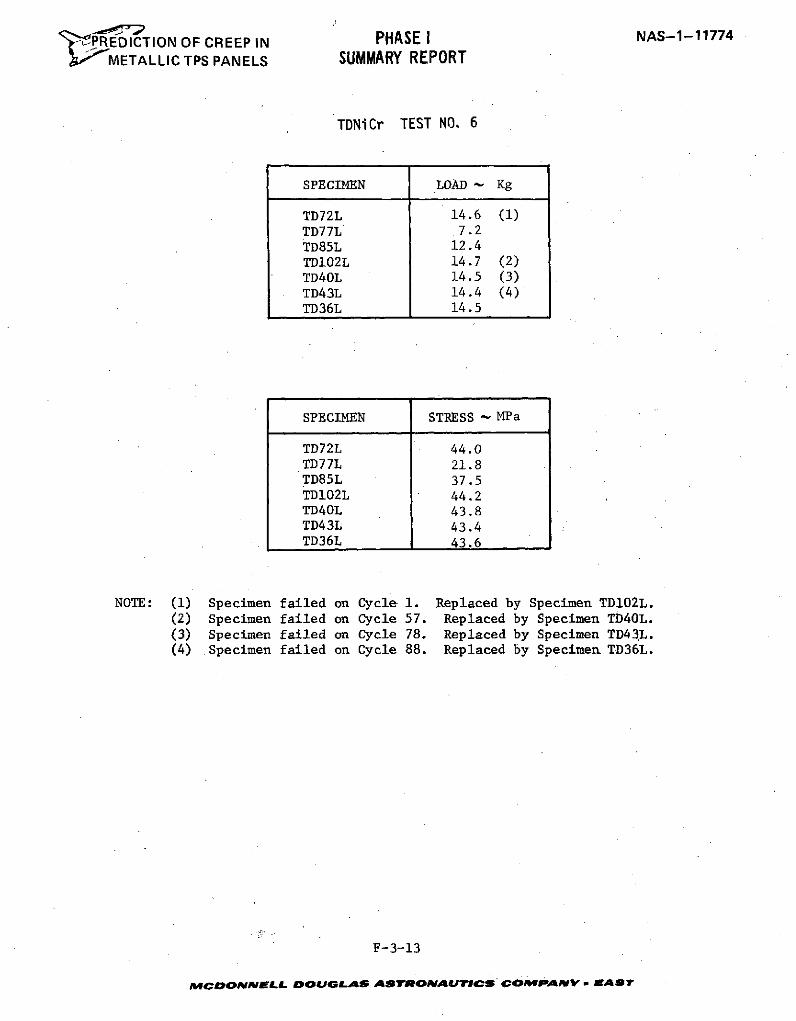
PHASE I NAS-1-11774PREDICTION OF CREEP IN PHASE I0 METALLIC TPS PANELS SUMMARY REPORT
TDNiCr TEST NO. 6
SPECIMEN LOAD - Kg
TD72L 14.6 (1)TD77L 7.2TD85L 12.4TD102L 14.7 (2)TD40L 14.5 (3)TD43L 14.4 (4)TD36L 14.5
SPECIMEN STRESS - MPa
TD72L 44.0TD77L 21.8TD85L 37.5TD102L 44.2TD40L 43.8TD43L 43.4TD36L 43.6
NOTE: (1) Specimen failed on Cycle 1. Replaced by Specimen TD102L.
(2) Specimen failed on Cycle 57. Replaced by Specimen TD40L.(3) Specimen failed on Cycle 78. Replaced by Specimen TD43L.(4) Specimen failed on Cycle 88. Replaced by Specimen TD36L.
F-3-13
M*VCDONNELL DOUGLAS ASTrROAUTICS COMPANyV - aSr
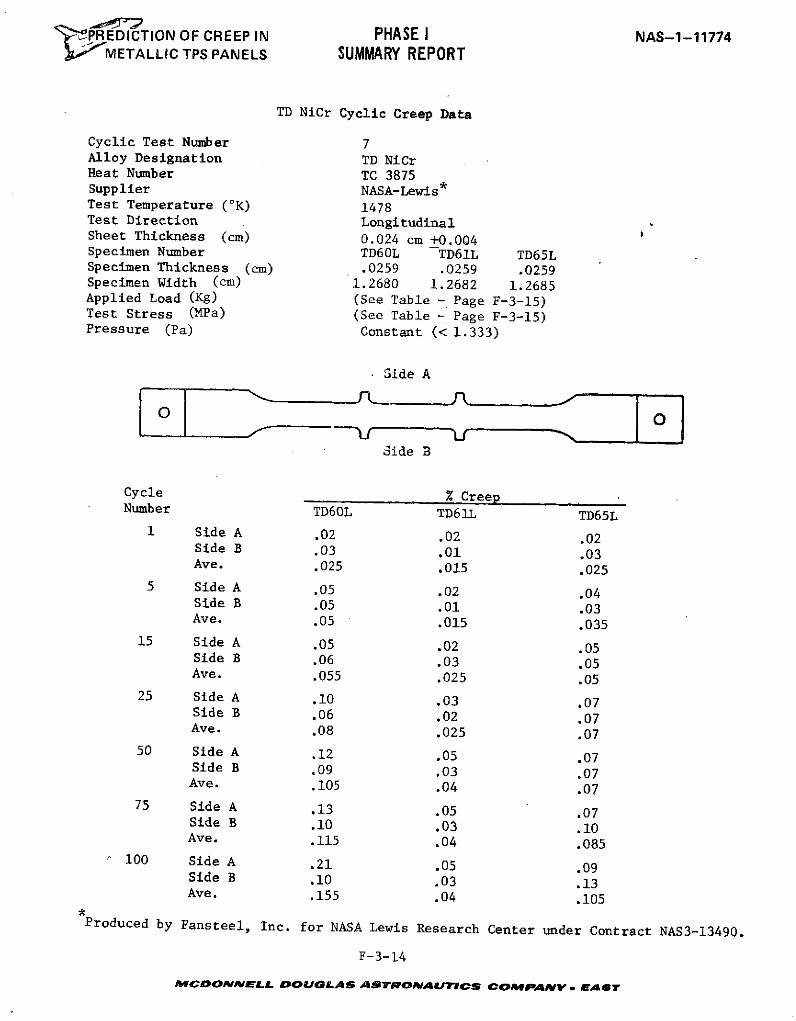
'PREDICTION OF CREEP IN PHASE I NAS-1-11774SMETALLIC TPS PANELS SUMMARY REPORT
TD NiCr Cyclic Creep Data
Cyclic Test Number 7Alloy Designation TD NiCrHeat Number TC 3875Supplier NASA-Lewis*Test Temperature (oK) 1478Test Direction LongitudinalSheet Thickness (cm) 0.024 cm +0.004Specimen Number TD60L -TD61L TD65LSpecimen Thickness (cm) .0259 .0259 .0259Specimen Width (cm) 1.2680 1.2682 1.2685Applied Load (Kg) (See Table - Page F-3-15)Test Stress (MPa) (See Table - Page F-3-15)Pressure (Pa) Constant (< 1.333)
Side A
Side B
Cycle % CreepNumber TD60L TD61L TD65L
1 Side A .02 .02 .02Side B .03 .01 .03Ave. .025 .015 .025
5 Side A .05 .02 .04Side B .05 .01 .03Ave. .05 .015 .035
15 Side A .05 .02 .05Side B .06 .03 .05Ave. .055 .025 .05
25 Side A .10 .03 .07Side B .06 .02 .07Ave. .08 .025 .07
50 Side A .12 .05 .07Side B .09 .03 .07Ave. .105 .04 .07
75 Side A .13 .05 .07Side B .10 .03 .10Ave. .115 .04 .085
100 Side A .21 .05 .09Side B .10 .03 .13Ave. .155 .04 .105
Produced by Fansteel, Inc. for NASA Lewis Research Center under Contract NAS3-13490.
F-3-14
,CDONNeLL DOUGLAS ASTrONAUTICS COMPANY . mAsT
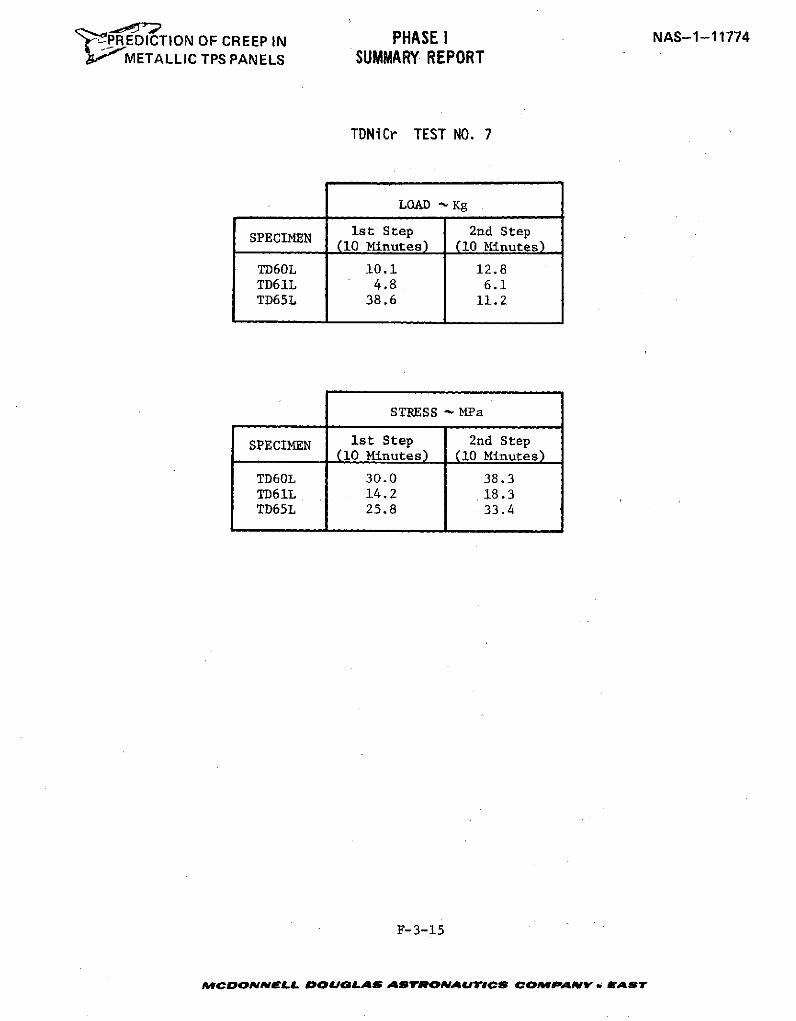
PREDICTION OF CREEP IN PHASE I NAS-1-11774METALLIC TPS PANELS SUMMARY REPORT
TDNiCr TEST NO. 7
LOAD - Kg
SPECIMEN 1st Step 2nd Step(10 Minutes) (10 Minutes)
TD60L 10.1 12.8TD61L 4.8 6.1TD65L 38.6 11.2
STRESS -MPa
SPECIMEN 1st Step 2nd Step(10 Minutes) (10 Minutes)
TD60L 30.0 38.3TD61L 14.2 18.3TD65L 25.8 33.4
F-3-15
MCDONNELL DOUGLAS ASTRONAUTICS COMPANV . LAST
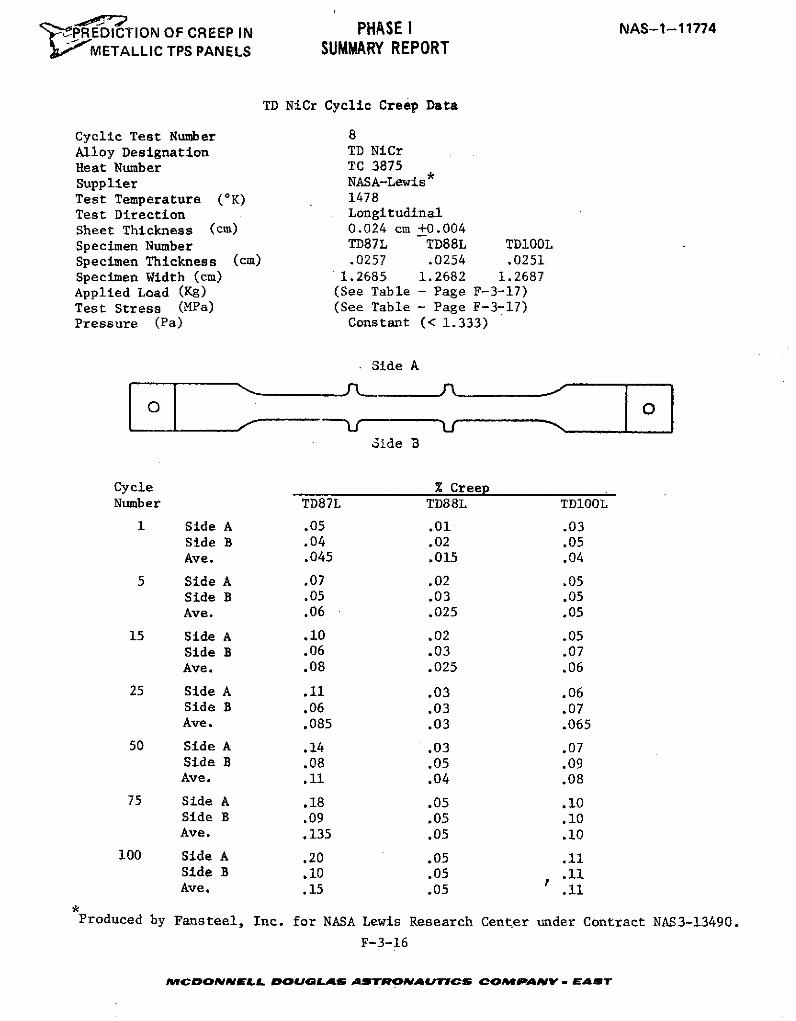
0PREDICTION OF CREEP IN PHASE I NAS-1-11774METALLIC TPS PANELS SUMMARY REPORT
TD NiCr Cyclic Creep Data
Cyclic Test Number 8Alloy Designation TD NiCrHeat Number TC 3875Supplier NASA-Lewis*Test Temperature (OK) 1478Test Direction LongitudinalSheet Thickness (cm) 0.024 cm +0.004Specimen Number TD87L TD88L TD100LSpecimen Thickness (cm) .0257 .0254 .0251Specimen Width (cm) 1.2685 1.2682 1.2687Applied Load (Kg) (See Table - Page F-3-17)Test Stress (MPa) (See Table - Page F-3-17)Pressure (Pa) Constant (< 1.333)
Side A
Side B
Cycle % CreepNumber TD87L TD88L TD100L
1 Side A .05 .01 .03Side B .04 .02 .05Ave. .045 .015 .04
5 Side A .07 .02 .05Side B .05 .03 .05Ave. .06 .025 .05
15 Side A .10 .02 .05Side B .06 .03 .07Ave. .08 .025 .06
25 Side A .11 .03 .06Side B .06 .03 .07Ave. .085 .03 .065
50 Side A .14 .03 .07Side B .08 .05 .09Ave. .11 .04 .08
75 Side A .18 .05 .10Side B .09 .05 .10Ave. .135 .05 .10
100 Side A .20 .05 .11Side B .10 .05 .11Ave. .15 .05 .11
Produced by Fansteel, Inc. for NASA Lewis Research Center under Contract NAS3-13490.
F-3-16
MCDONNoL.L DOUGLAs ASTRONAUTICS COMPAVNY- EAST
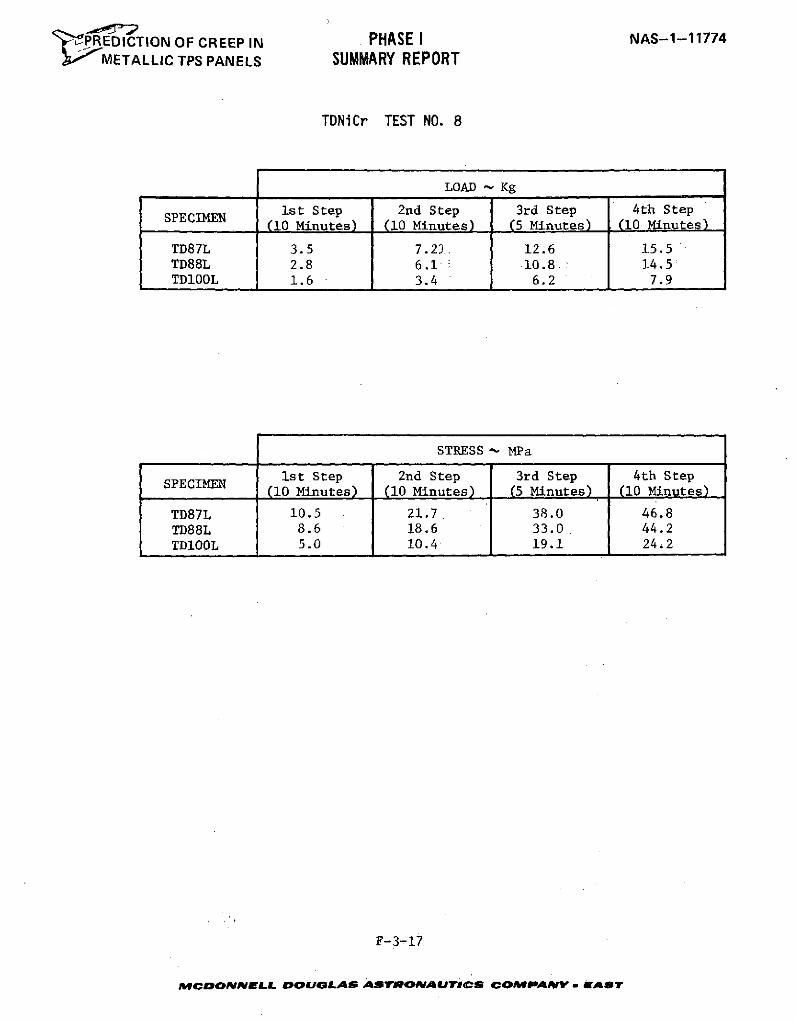
"tPREDICTION OF CREEP IN PHASE I NAS-1-11774
METALLIC TPS PANELS SUMMARY REPORT
TDNiCr TEST NO. 8
LOAD . Kg
ist Step 2nd Step 3rd Step 4th StepSPECIMEN (10 Minutes) (10 Minutes) (5 Minutes) (10 Minutes)
TD87L 3.5 7.21 12.6 15.5TD88L 2.8 6.1 10.8.: 14.5TD100L 1.6 3.4 6.2 7.9
STRESS - MPa
SPECIMEN 1st Step 2nd Step 3rd Step 4th Step(10 Minutes) (10 Minutes) (5 Minutes) (10 Minutes)
TD87L 10.5 21.7 38.0 46.8TD88L 8.6 18.6 33.0 44.2TD100L 5.0 10.4 19.1 24.2
F-3-17
MCDONNELL DOUGLAS ASTRONAUTICS COMPANV EASr
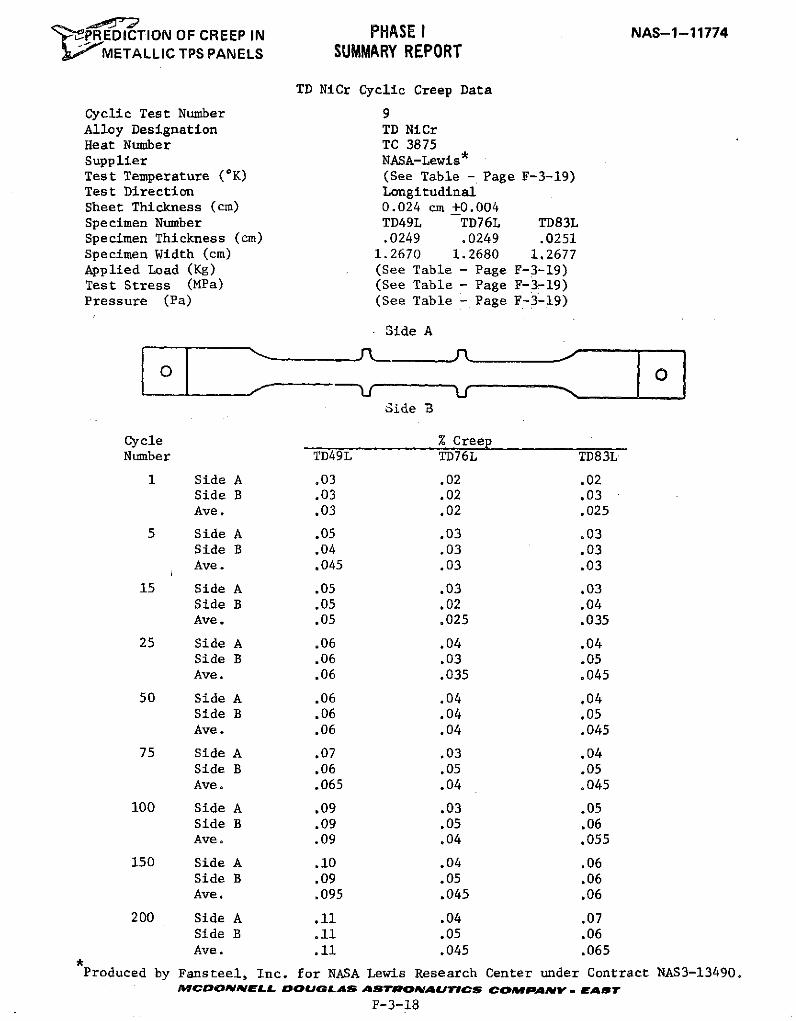
'jP REDICTION OF CREEP IN PHASE I NAS-1-11774METALLIC TPS PANELS SUMMARY REPORT
TD NiCr Cyclic Creep Data
Cyclic Test Number 9Alloy Designation TD NiCrHeat Number TC 3875Supplier NASA-Lewis*Test Temperature (*K) (See Table - Page F-3-19)Test Direction LongitudinalSheet Thickness (cm) 0.024 cm +0.004Specimen Number TD49L TD76L TD83LSpecimen Thickness (cm) .0249 .0249 .0251Specimen Width (cm) 1.2670 1.2680 1,2677Applied Load (Kg) (See Table - Page F-3-19)Test Stress (MPa) (See Table - Page F-3-19)Pressure (Pa) (See Table - Page F-3-19)
Side A
Side B
Cycle % CreepNumber TD49L TD76L TD83L
1 Side A .03 .02 .02Side B .03 .02 .03Ave. .03 .02 .025
5 Side A .05 .03 .03Side B .04 .03 .03Ave. .045 .03 .03
15 Side A .05 .03 .03Side B .05 .02 .04Ave. .05 .025 .035
25 Side A .06 .04 .04Side B .06 .03 .05Ave. .06 .035 .045
50 Side A .06 .04 .04Side B .06 .04 .05Ave. .06 .04 .045
75 Side A .07 .03 .04Side B .06 .05 .05Ave. .065 .04 .045
100 Side A .09 .03 .05Side B .09 .05 .06Ave. .09 .04 .055
150 Side A .10 .04 .06Side B .09 .05 .06Ave. .095 .045 .06
200 Side A .11 .04 .07Side B .11 .05 .06Ave. .11 .045 .065
Produced by Fansteel, Inc. for NASA Lewis Research Center under Contract NAS3-13490.MCDOMNELL DOUOLAS ASTRONAUTICS coMPANV w EAST
F-3-18
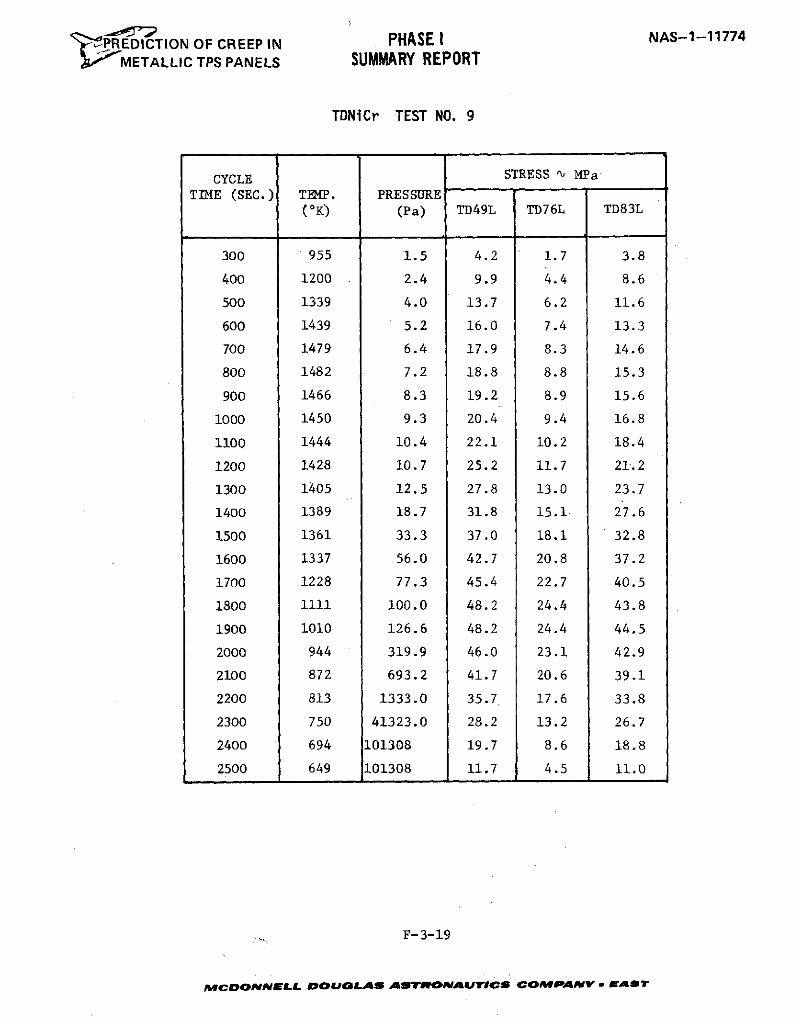
.PHASE I NAS-1-117747PREDICTION OF CREEP IN PHASE I,'" METALLIC TPS PANELS SUMMARY REPORT
TDNICr TEST NO. 9
CYCLE STRESS ' MPa
TIME (SEC.) TEMP. PRESSURE
(oK) (Pa) TD49L TD76L TD83L
300 955 1.5 4.2 1.7 3.8
400 1200 2.4 9.9 4.4 8.6
500 1339 4.0 13.7 6.2 11.6
600 1439 5.2 16.0 7.4 13.3
700 1479 6.4 17.9 8.3 14.6
800 1482 7.2 18.8 8.8 15.3
900 1466 8.3 19.2 8.9 15.6
1000 1450 9.3 20.4 9.4 16.8
1100 1444 10.4 22.1 10.2 18.4
1200 1428 10.7 25.2 11.7 21.2
1300 1405 12.5 27.8 13.0 23.7
1400 1389 18.7 31.8 15.1 27.6
1500 1361 33.3 37.0 18.1 32.8
1600 1337 56.0 42.7 20.8 37.2
1700 1228 77.3 45.4 22.7 40.5
1800 1111 100.0 48.2 24.4 43.8
1900 1010 126.6 48.2 24.4 44.5
2000 944 319.9 46.0 23.1 42.9
2100 872 693.2 41.7 20.6 39.1
2200 813 1333.0 35.7 17.6 33.8
2300 750 41323.0 28.2 13.2 26.7
2400 694 101308: 19.7 8.6 18.8
2500 649 101308 11.7 4.5 11.0
F-3-19
MCDoONNELL DOUGLAS ASTRvONAUlrICS COMPANVY- EASr
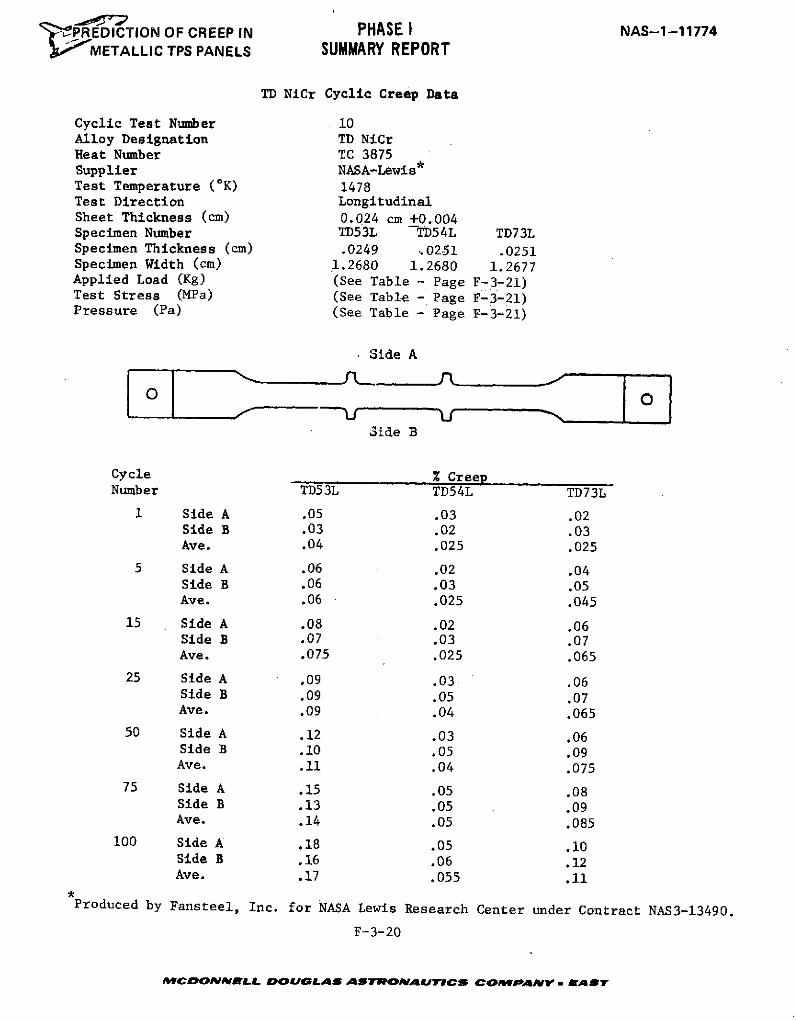
,PREDICTION OF CREEP IN PHASE I NAS-1-11774METALLIC TPS PANELS SUMMARY REPORT
TD NiCr Cyclic Creep Data
Cyclic Test Number 10Alloy Designation TD NiCrHeat Number TC 3875Supplier NASA-Lewis*Test Temperature (OK) 1478Test Direction LongitudinalSheet Thickness (cm) 0.024 cm +0.004Specimen Number TD53L TD54L TD73LSpecimen Thickness (cm) .0249 ,0251 .0251Specimen Width (cm) 1.2680 1.2680 1.2677Applied Load (Kg) (See Table - Page F-3-21)Test Stress (MPa) (See Table - Page F-3-21)Pressure (Pa) (See Table - Page F-3-21)
Side A
Side B3
Cycle % CreepNumber TD53L TD54L TD73L
1 Side A .05 .03 .02Side B .03 .02 .03Ave. .04 .025 .025
5 Side A .06 .02 .04Side B .06 .03 .05Ave. .06 .025 .045
15 Side A .08 .02 .06Side B .07 .03 .07Ave. .075 .025 .065
25 Side A .09 .03 .06Side B .09 .05 .07Ave. .09 .04 .065
50 Side A .12 .03 .06Side B .10 .05 .09Ave. .11 .04 .075
75 Side A .15 .05 .08Side B .13 .05 .09Ave. .14 .05 .085
100 Side A .18 .05 .10Side B .16 .06 .12Ave. .17 .055 .11
Produced by Fansteel, Inc. for NASA Lewis Research Center under Contract NAS3-13490.
F-3-20
MCDONNELma DOULAS ASTRONAeTICS COMPPANY - WAST
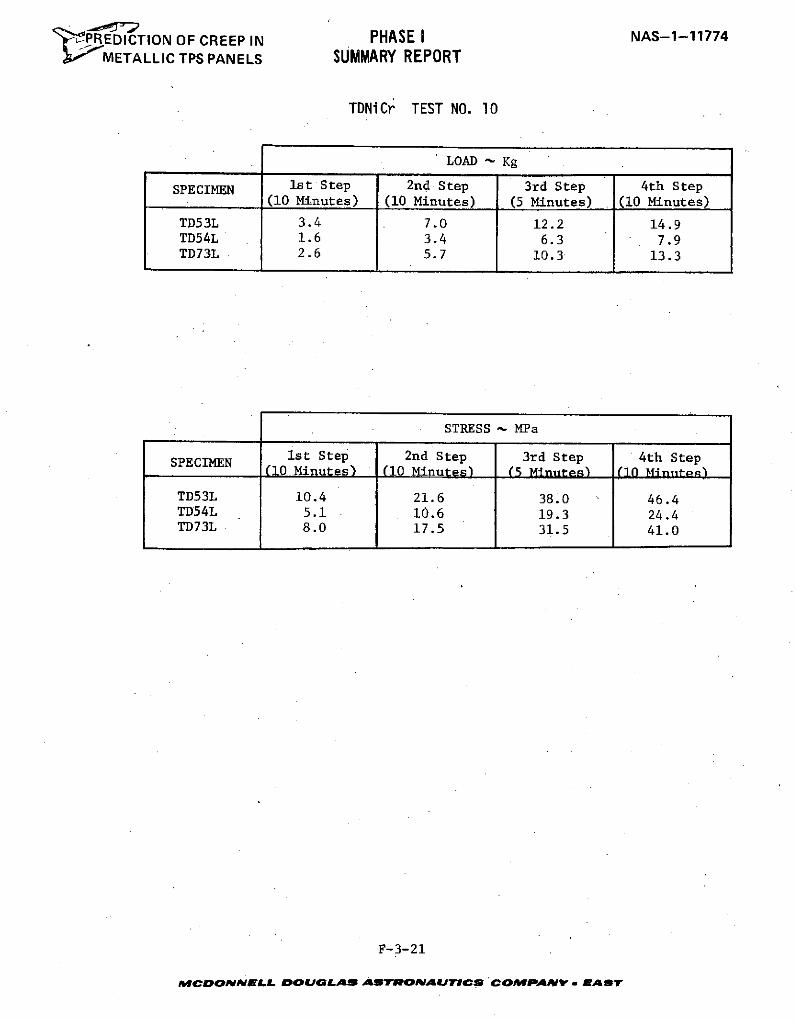
"'PREDICTION OF CREEP IN PHASE I NAS-1-11774METALLIC TPS PANELS SUMMARY REPORT
TDNiCr TEST NO. 10
LOAD Kg
SPECIMEN 1st Step 2nd Step 3rd Step 4th Step(10 Minutes) (10 Minutes) (5 Minutes) (10 Minutes)
TD53L 3.4 7.0 12.2 14.9TD54L 1.6 3.4 6.3 7.9TD73L 2.6 5.7 10.3 13.3
STRESS - MPa
SPECIMEN Ist Step 2nd Step 3rd Step 4th Step(10 Minutes) (10 Minutes) (5 Minutes) (10 Mienta))
TD53L 10.4 21.6 38.0 46.4TD54L 5.1 10.6 19.3 24.4TD73L 8.0 17.5 31.5 41.0
F-3-21
AMCONELL DOUGLAS ASTROIMArUTICS COMPOAMNY ASBaT
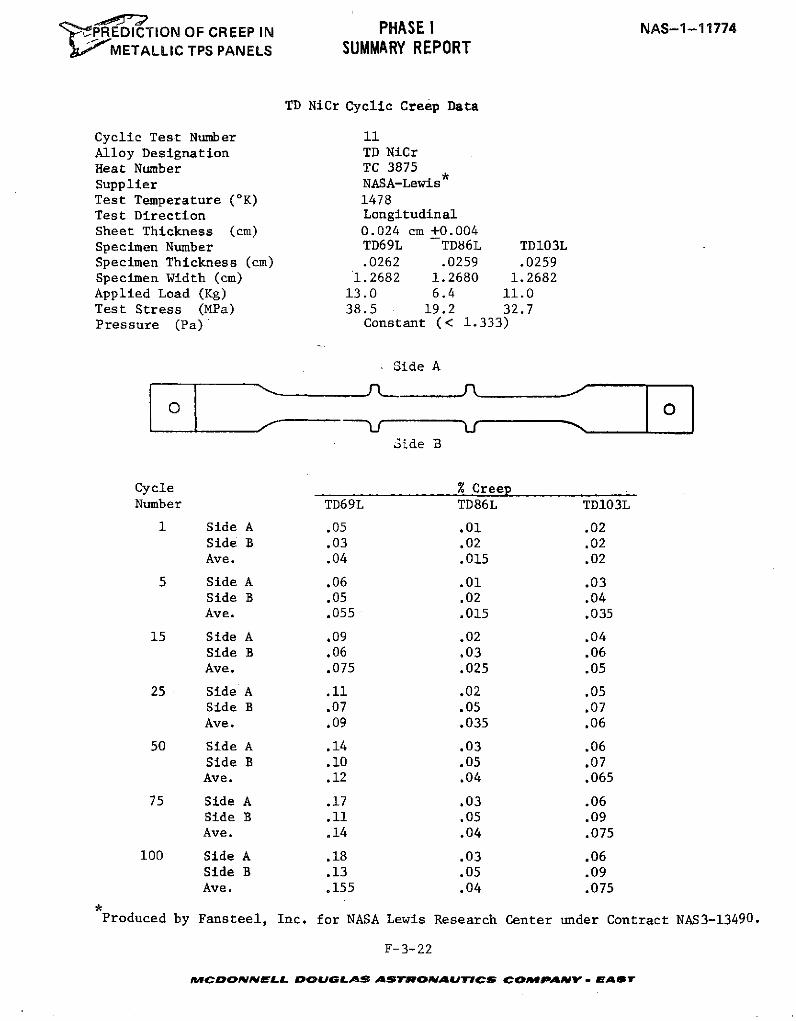
'tj PREDICTION OF CREEP IN PHASE I NAS-1-11774
SMETALLIC TPS PANELS SUMMARY REPORT
TD NiCr Cyclic Creep Data
Cyclic Test Number 11Alloy Designation TD NiCrHeat Number TC 3875Supplier NASA-Lewis*Test Temperature (oK) 1478Test Direction LongitudinalSheet Thickness (cm) 0.024 cm +0.004Specimen Number TD69L TD86L TD103LSpecimen Thickness (cm) .0262 .0259 .0259Specimen Width (cm) 1.2682 1.2680 1.2682Applied Load (Kg) 13.0 6.4 11.0Test Stress (MPa) 38.5 19.2 32.7Pressure (Pa) Constant (< 1.333)
Side A
Side B
Cycle % CreepNumber TD69L TD86L TD103L
1 Side A .05 .01 .02Side B .03 .02 .02Ave. .04 .015 .02
5 Side A .06 .01 .03Side B .05 .02 .04Ave. .055 .015 .035
15 Side A .09 .02 .04Side B .06 .03 .06Ave. .075 .025 .05
25 Side A .11 .02 .05Side B .07 .05 .07Ave. .09 .035 .06
50 Side A .14 .03 .06Side B .10 .05 .07Ave. .12 .04 .065
75 Side A .17 .03 .06Side B .11 .05 .09Ave. .14 .04 .075
100 Side A .18 .03 .06Side B .13 .05 .09Ave. .155 .04 .075
Produced by Fansteel, Inc. for NASA Lewis Research Center under Contract NAS3-13490.
F-3-22
MCDONNELL DOUGLAS ASTRONAUTICS COMPANvy - EAST
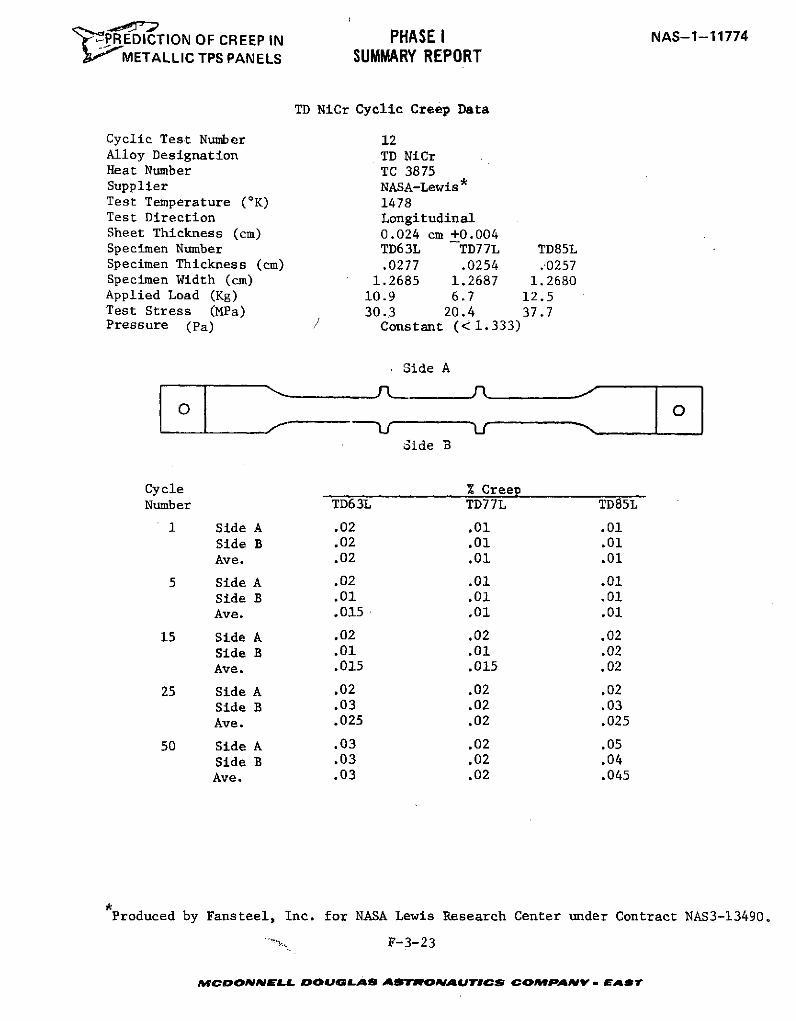
rLPREDICTION OF CREEP IN PHASE I NAS-1-11774
METALLIC TPS PANELS SUMMARY REPORT
TD NiCr Cyclic Creep Data
Cyclic Test Number 12Alloy Designation TD NiCrHeat Number TC 3875Supplier NASA-Lewis*Test Temperature (OK) 1478Test Direction LongitudinalSheet Thickness (cm) 0.024 cm +0.004Specimen Number TD63L TD77L TD85LSpecimen Thickness (cm) .0277 .0254 .0257Specimen Width (cm) 1.2685 1.2687 1.2680Applied Load (Kg) 10.9 6.7 12.5Test Stress (MPa) 30.3 20.4 37.7Pressure (Pa) Constant (< 1.333)
Side A
Side B
Cycle % CreepNumber TD63L TD77L TD85L
1 Side A .02 .01 .01
Side B .02 .01 .01
Ave. .02 .01 .01
5 Side A .02 .01 .01
Side B .01 .01 .01Ave. .015. .01 .01
15 Side A .02 .02 .02
Side B .01 .01 .02
Ave. .015 .015 .02
25 Side A .02 .02 .02
Side B .03 .02 .03
Ave. .025 .02 .025
50 Side A .03 .02 .05
Side B .03 .02 .04
Ave. .03 .02 .045
Produced by Fansteel, Inc. for NASA Lewis Research Center under Contract NAS3-13490.
F-3-23
MCDONNELL DOUOLAS ASTROAUrICS COMPANY v - EAT
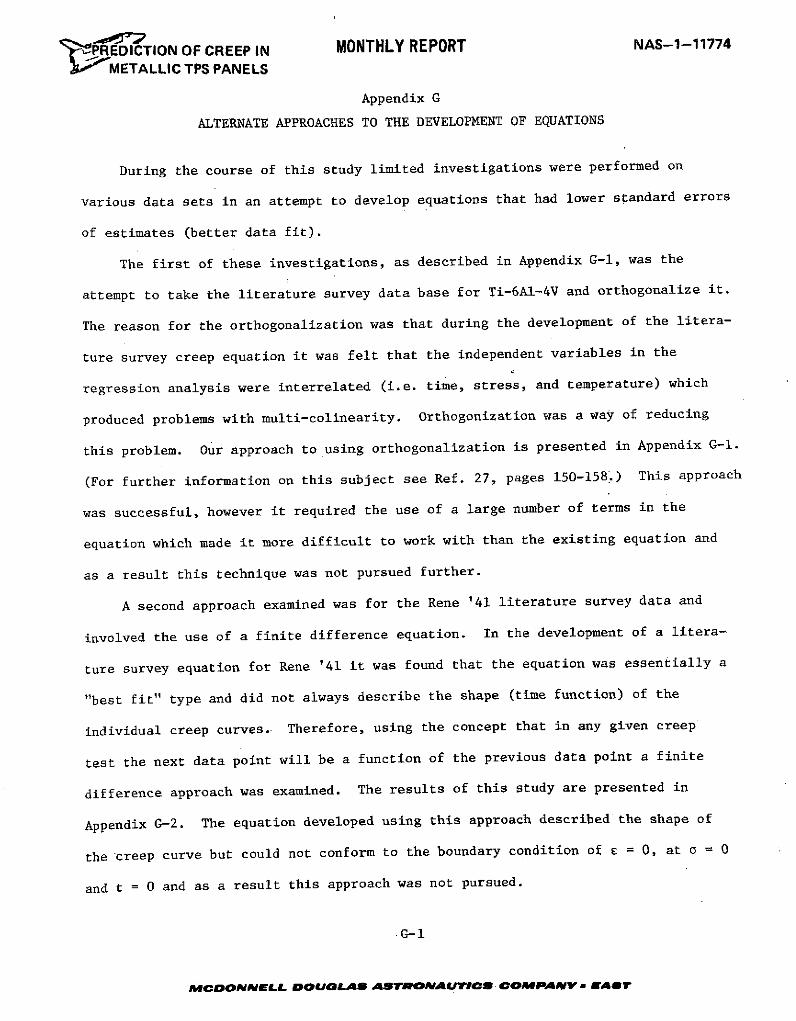
''tPREDICTION OF CREEP IN MONTHLY REPORT NAS-1-11774
METALLIC TPS PANELS
Appendix G
ALTERNATE APPROACHES TO THE DEVELOPMENT OF EQUATIONS
During the course of this study limited investigations were performed on
various data sets in an attempt to develop equations that had lower standard errors
of estimates (better data fit).
The first of these investigations, as described in Appendix G-1, was the
attempt to take the literature survey data base for Ti-6AI-4V and orthogonalize it.
The reason for the orthogonalization was that during the development of the litera-
ture survey creep equation it was felt that the independent variables in the
regression analysis were interrelated (i.e. time, stress, and temperature) which
produced problems with multi-colinearity. Orthogonization was a way of reducing
this problem. Our approach to using orthogonalization is presented in Appendix G-l.
(For further information on this subject see Ref. 27, pages 150-158.) This approach
was successful, however it required the use of a large number of terms in the
equation which made it more difficult to work with than the existing equation and
as a result this technique was not pursued further.
A second approach examined was for the Rene '41 literature survey data and
involved the use of a finite difference equation. In the development of a litera-
ture survey equation for Rene '41 it was found that the equation was essentially a
"best fit" type and did not always describe the shape (time function) of the
individual creep curves. Therefore, using the concept that in any given creep
test the next data point will be a function of the previous data point a finite
difference approach was examined. The results of this study are presented in
Appendix G-2. The equation developed using this approach described the shape of
the creep curve but could not conform to the boundary condition of E = 0, at a 0
and t = 0 and as a result this approach was not pursued.
G-1
MCDONNELL DOUGJLAS ASTRONAURTIO COAPANV - EAST
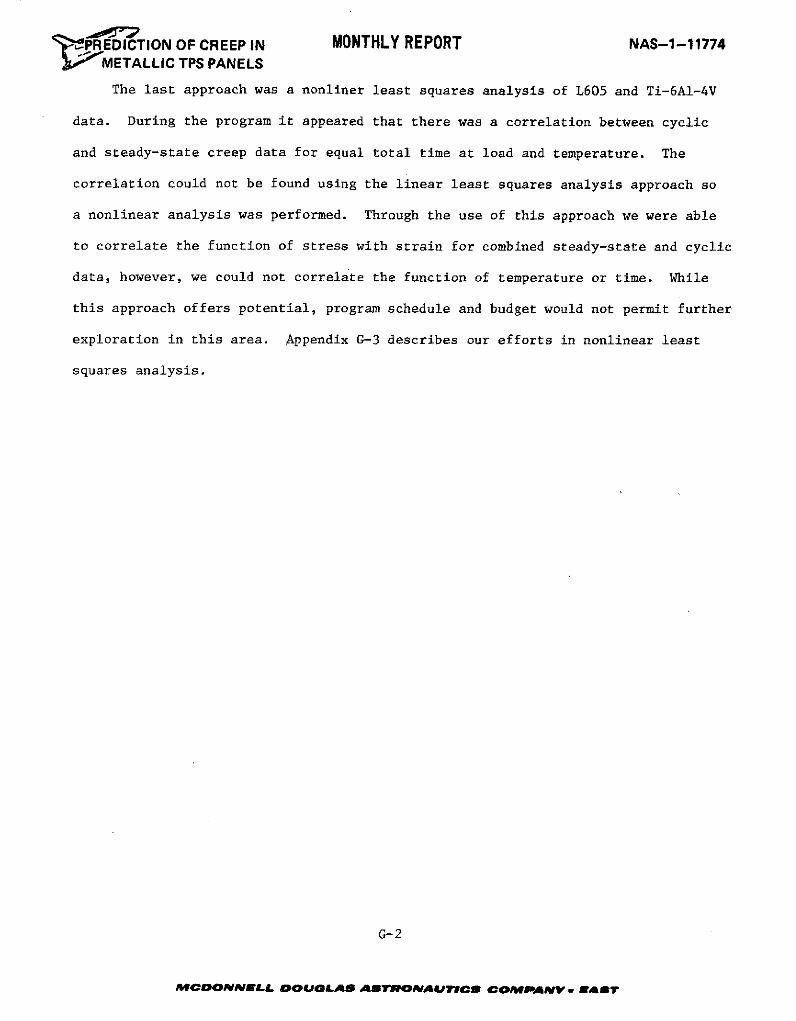
' PEDICTION OF CREEP IN MONTHLY REPORT NAS-1-11774J;o METALLIC TPS PANELS
The last approach was a nonliner least squares analysis of L605 and Ti-6Al-4V
data. During the program it appeared that there was a correlation between cyclic
and steady-state creep data for equal total time at load and temperature. The
correlation could not be found using the linear least squares analysis approach so
a nonlinear analysis was performed. Through the use of this approach we were able
to correlate the function of stress with strain for combined steady-state and cyclic
data, however, we could not correlate the function of temperature or time. While
this approach offers potential, program schedule and budget would not permit further
exploration in this area. Appendix G-3 describes our efforts in nonlinear least
squares analysis.
G-2
MCDONNELL DOUOLAS AbTRONAUTICS COMPANV . EaT
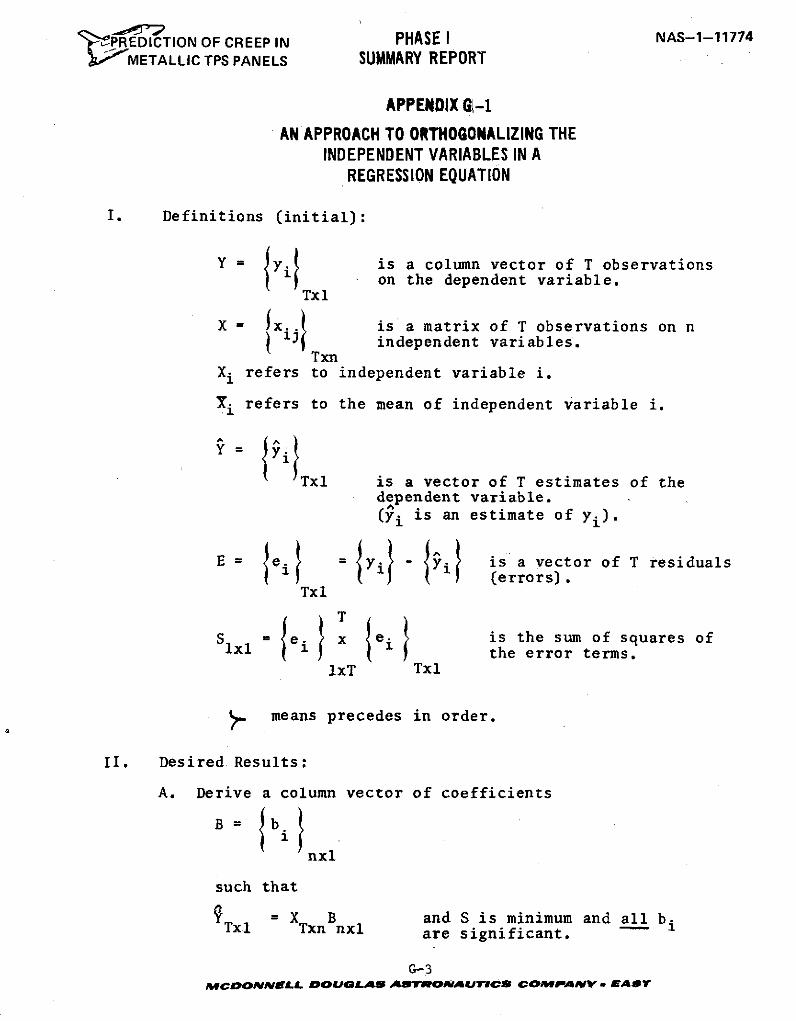
PREDICTION OF CREEP IN PHASE I NAS-1-11774METALLIC TPS PANELS SUMMARY REPORT
APPENDIX GI-1
AN APPROACH TO ORTHOGONALIZING THEINDEPENDENT VARIABLES IN A
REGRESSION EQUATION
I. Definitions (initial):
Y = yi is a column vector of T observationsI on the dependent variable.
Txl
X = fx..j is a matrix of T observations on nSindependent variables.Txn
Xi refers to independent variable i.
Xi refers to the mean of independent variable i.
Y { yi
Txl is a vector of T estimates of thedependent variable.
(yi is an estimate of yi).
E ei = jyj - yi i s a vector of T residuals(errors).
Txl
S = e i x lei is the sum of squares oflxl the error terms.
IxT Txl
ameans precedes in order.
II. Desired Results:
A. Derive a column vector of coefficients
B = fb. {nxl
such that
= X B and S is minimum and all bTxl Txn nxl are significant.
G-3MCDONNELL DOULAS ATNOILMPJAI CS COMPAIV - MAST
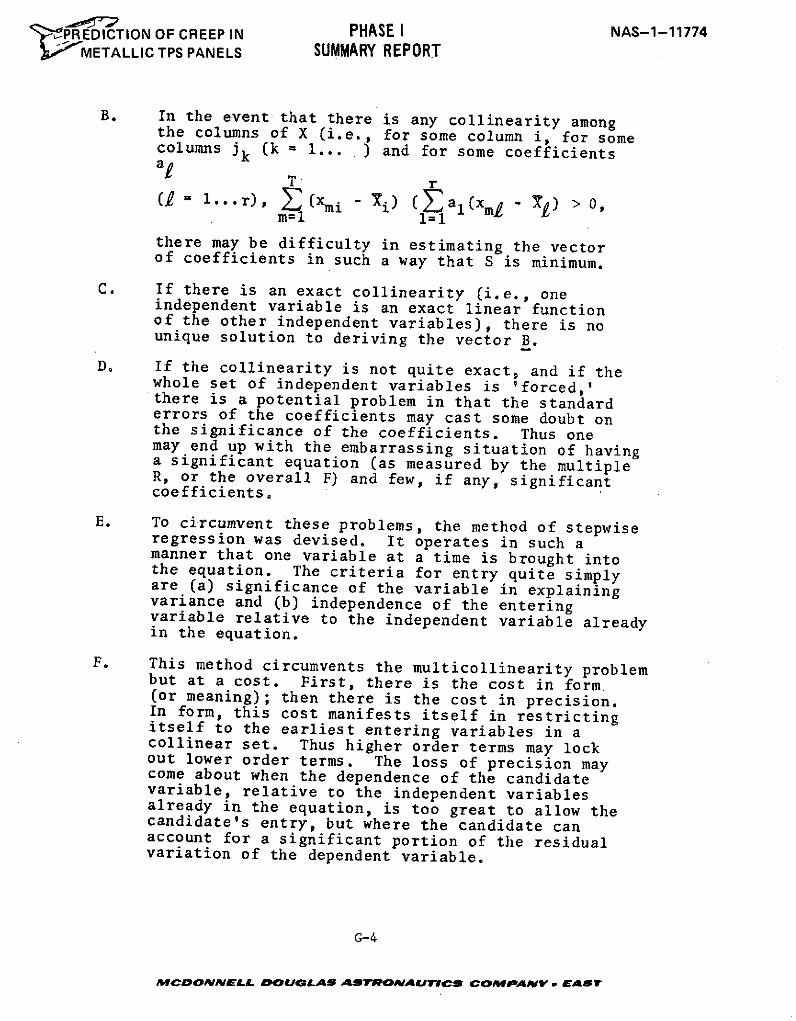
'~ZPREDICTION OF CREEP IN PHASE I NAS-1-11774METALLIC TPS PANELS SUMMARY REPORT
B. In the event that there is any collinearity amongthe columns of X (i.e., for some column i, for somecolumns jk (k = i... ) and for some coefficientsat T
rS... i i (al(xmi > 0,
m=l 1=1
there may be difficulty in estimating the vectorof coefficients in such a way that S is minimum.
C. If there is an exact collinearity (i.e., oneindependent variable is an exact linear functionof the other independent variables), there is nounique solution to deriving the vector B.
D. If the collinearity is not quite exact, and if thewhole set of independent variables is 'forced,'there is a potential problem in that the standarderrors of the coefficients may cast some doubt onthe significance of the coefficients. Thus onemay end up with the embarrassing situation of havinga significant equation (as measured by the multipleR, or the overall F) and few, if any, significantcoefficients.
E. To circumvent these problems, the method of stepwiseregression was devised. It operates in such amanner that one variable at a time is brought intothe equation. The criteria for entry quite simplyare (a) significance of the variable in explainingvariance and (b) independence of the enteringvariable relative to the independent variable alreadyin the equation.
F. This method circumvents the multicollinearity problembut at a cost. First, there is the cost in form(or meaning); then there is the cost in precision.In form, this cost manifests itself in restrictingitself to the earliest entering variables in acollinear set. Thus higher order terms may lockout lower order terms. The loss of precision maycome about when the dependence of the candidatevariable, relative to the independent variablesalready in the equation, is too great to allow thecandidate's entry, but where the candidate canaccount for a significant portion of the residualvariation of the dependent variable.
G-4
MCDONNELL OUOLA ASTRONAUTICS COMPANY . EAST
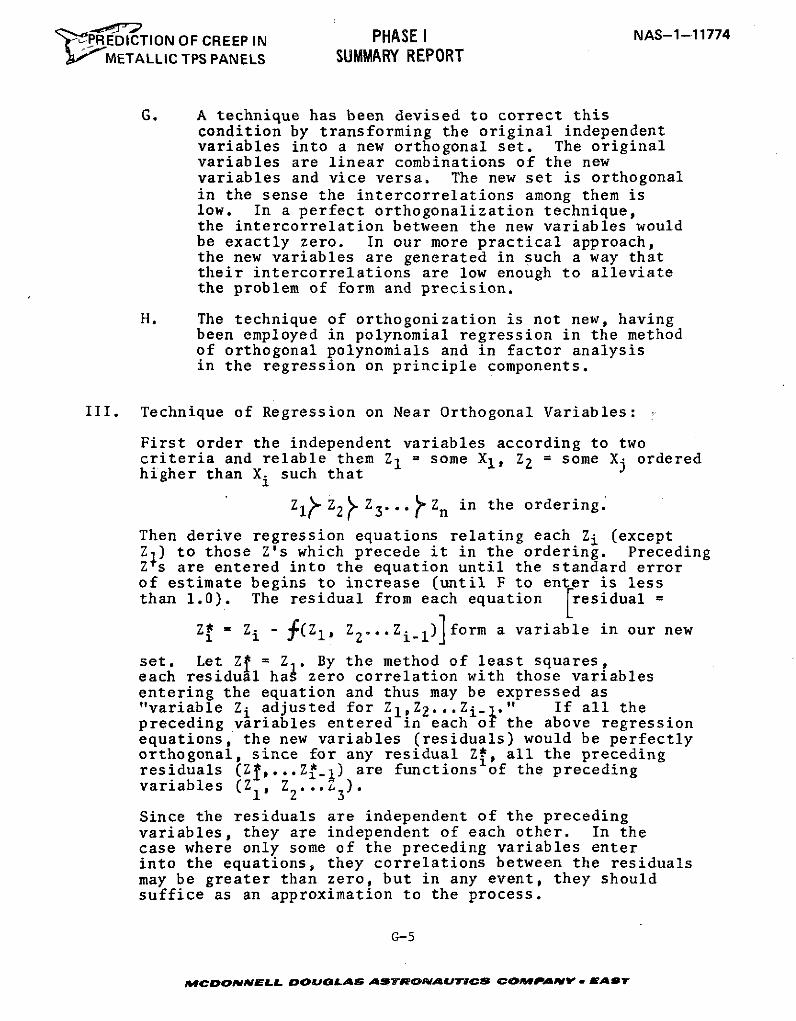
' EDICTION OF CREEP IN PHASE I NAS-1-11774
METALLIC TPS PANELS SUMMARY REPORT
G. A technique has been devised to correct thiscondition by transforming the original independentvariables into a new orthogonal set. The originalvariables are linear combinations of the newvariables and vice versa. The new set is orthogonalin the sense the intercorrelations among them islow. In a perfect orthogonalization technique,the intercorrelation between the new variables wouldbe exactly zero. In our more practical approach,the new variables are generated in such a way thattheir intercorrelations are low enough to alleviatethe problem of form and precision.
H. The technique of orthogonization is not new, havingbeen employed in polynomial regression in the methodof orthogonal polynomials and in factor analysisin the regression on principle components.
III. Technique of Regression on Near Orthogonal Variables:
First order the independent variables according to twocriteria and relable them Z1 = some X1, Z2 = some Xj orderedhigher than Xi such that
Zl~ Z2 Z3 .* Zn in the ordering.
Then derive regression equations relating each Zi (exceptZ1 ) to those Z's which precede it in the ordering. PrecedingZ s are entered into the equation until the standard errorof estimate begins to increase (until F to enter is lessthan 1.0). The residual from each equation [residual =
Z = Zi (Z1, Z2 Zi-1)]form a variable in our new
set. Let Zf = Z . By the method of least squares,each residual hai zero correlation with those variablesentering the equation and thus may be expressed as"variable Zi adjusted for Zl Z2... Z. i-1 If all thepreceding variables entered in each of the above regressionequations, the new variables (residuals) would be perfectlyorthogonal, since for any residual Z#, all the precedingresiduals (Zf,...Z-_1) are functions of the precedingvariables (ZI, Z2 .. 3 ).
Since the residuals are independent of the precedingvariables, they are independent of each other. In thecase where only some of the preceding variables enterinto the equations, they correlations between the residualsmay be greater than zero, but in any event, they shouldsuffice as an approximation to the process.
G-5
MCDOANELL CDOUGLA ASTRIONeAUICS COMPANI . EAsT

PEDICTION OF CREEP IN PHASE I NAS-1-11774
METALLIC TPS PANELS SUMMARY REPORT
The new set of variables (consisting of Z = Zf and Z*...Z*)is then run against the dependent variabl to derive acolumn vector of coefficients
C = ci
such that
or
Y = zi} ci +lei
Let the set of coefficients relating Z*'s with Z's be representedby the matrix G = {gik such that
Szit - Zitf gik
or
Zt = zit (I - G)
where I is the identity matrix. Then substitute
Izitl (I - G) for I t to yield Y = zit (I - G) ci + E.
The product (I - G) I c gives a column vector D = dij
such that Y = IZit D + E.
By rearranging the columns of zit and the rows of D, wecanexpress this equation in oigial form Y = XB + Eor Y = XB.
G-6
MCDONNELL DOUGLAS ASTRONAUTICS COMPANYV * AST
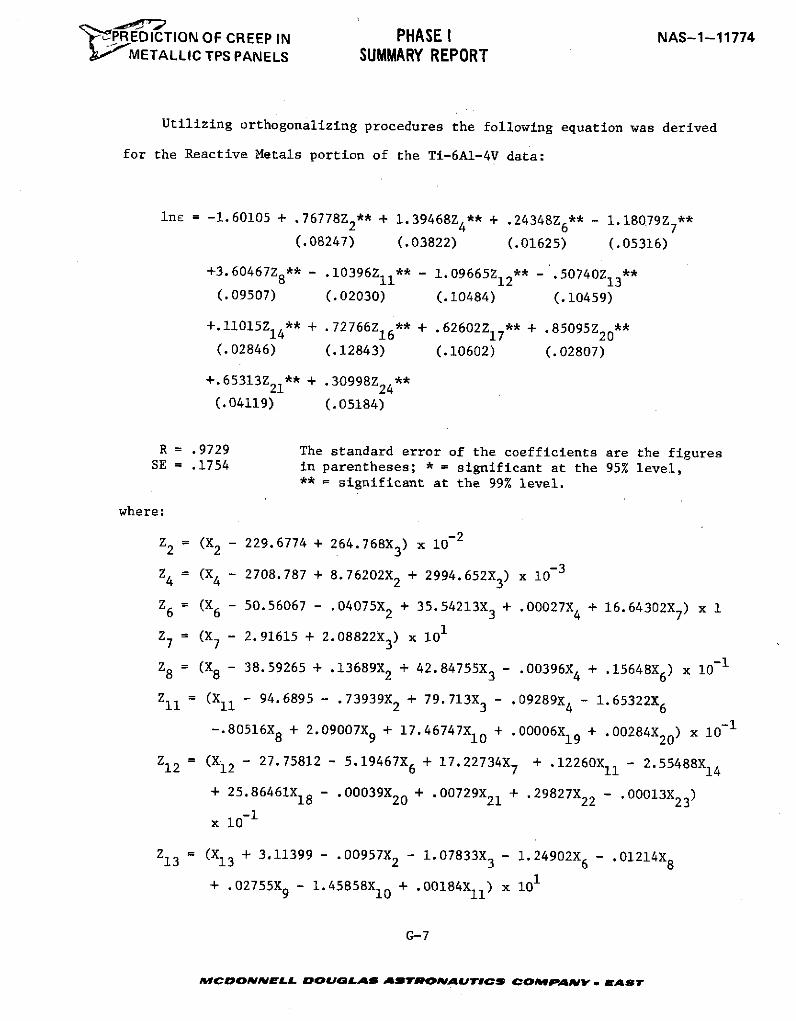
PREDICTION OF CREEP IN PHASE I NAS-1-11774METALLIC TPS PANELS SUMMARY REPORT
Utilizing orthogonalizing procedures the following equation was derived
for the Reactive Metals portion of the Ti-6Al-4V data:
inc = -1.60105 + .76778Z 2** + 1.39468Z4** + .24348Z6** - 1.18079Z *7(.08247) (.03822) (.01625) (.05316)
+3.60467Z 8** - .10396211** - 1.09665Z12** - .50740Z13*(.09507) (.02030) (.10484) (.10459)
+.11015Z14** + .72766Z16** + .62602Z17** + .85095Z20*(.02846) (.12843) (.10602) (.02807)
+.65313Z21** + .30998Z24*(.04119) (.05184)
R = .9729 The standard error of the coefficients are the figuresSE = .1754 in parentheses; * = significant at the 95% level,
** = significant at the 99% level.
where:
Z2 = (X2 - 229.6774 + 264.768X3 ) x 10- 2
Z4 = (X4 - 2708.787 + 8.76202X2 + 2994.652X3) x 10-3
Z6 = (X6 - 50.56067 - .04075X2 + 35.54213X3 + .00027X4 + 16.64302X7) x 1
Z7 = (X7 - 2.91615 + 2.08822X3) x 101
Z8 = (X8 - 38.59265 + .13689X2 + 42.84755X 3 - .00396X4 + .15648X6) x 10-1
Z11 = (X11 - 94.6895 - .73939X 2 + 79.713X 3 - .09289X - 1.65322X6
-.80516X8 + 2.09007X9 + 17.46747X1 0 + .00006X1 9 + .00284X20) x 10-1
Z12 = (X12 - 27.75812 - 5.19467X 6 + 17.22734X7 + .12260X11 - 2.55488X14+ 25.86461X18 - .00039X20 + .00729X21 + .29827X22 - .00013X23 )
x 10-1
Z1 3 = (X1 3 + 3.11399 - .00957X2 - 1.07833X3 - 1.24902X6 - .01214X8
+ .02755X9 - 1.45858XI0 + .00184Xl ) x 101
G-7
MCADONNELL DOUGLAS ASTRONAUITIC COMPA VY . EAST
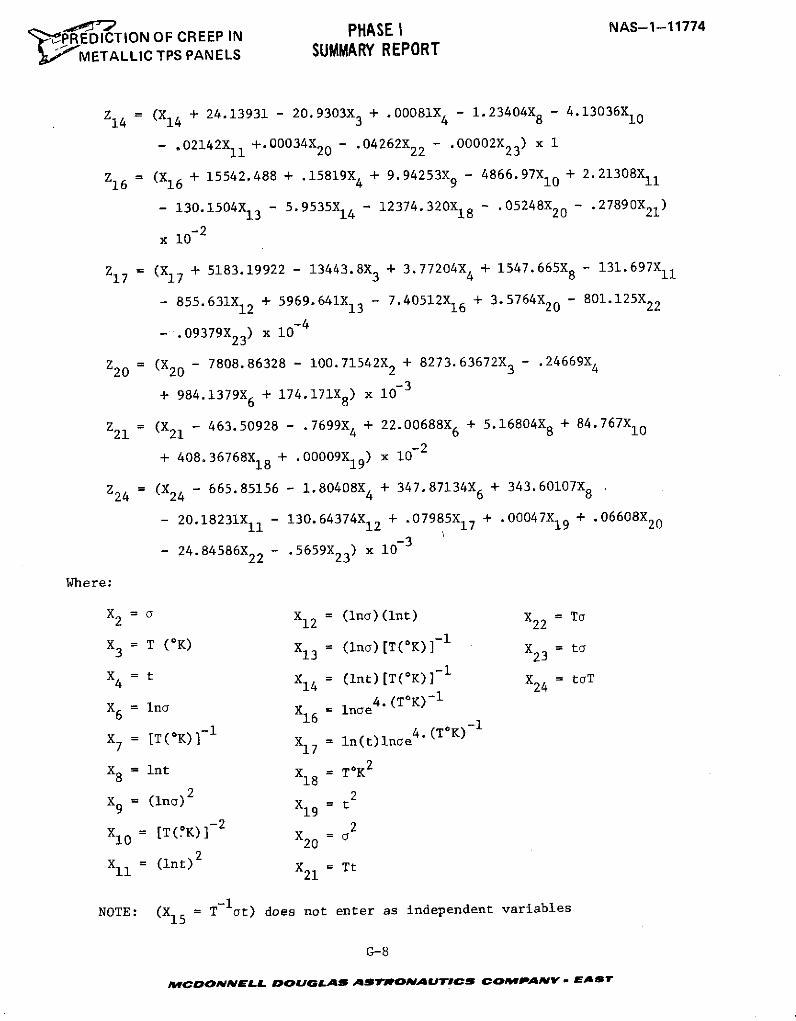
SPHASE I NS-1-11774'PREDICTION OF CREEP IN
METALLIC TPS PANELS SUMMARY REPORT
Z14 = (X14 + 24.13931 - 20.9303X 3 + .00081X4 - 1.23404X8 - 4.13036X10
- .02142X11 +.00034X 20 - .04262X 2 2 - .00002X2 3 ) x 1
Z16 = (X1 6 + 15542.488 + .15819X4 + 9.94253X 9 - 4866.97X10 + 2.21308X11
- 130.1504X1 3 - 5.9535X1 4 - 12374.320X18 - .05248X20 - .27890X 21)
x 10 - 2
ZI7 = (X 1 7 + 5183.19922 - 13443.8X3 + 3.77204X4 + 1547.665X8 - 131.697X11
- 855.631X12 + 5969.641X13 - 7.40512X16 + 3.5764X20 - 801.125X 2 2
- .09379X 23) x 10- 4
Z20 = (X20 - 7808.86328 - 100.71542X2 + 8273.63672X 3 - .24669X4
r ) x 1-3+ 984.1379X6 + 174.171X8) x 10- 3
Z21 - (X21 - 463.50928 - .7699X 4 + 22.00688X6 + 5.16804X 8 + 84.767X10
+ 408.36768X18 + .00009X1 9) x 10 - 2
Z24 = (X2 4 - 665.85156 - 1.80408X4 + 347.87134X 6 + 343.60107X 8
- 20.18231X11 - 130.64374X12 + .07985X17 + .00047X19 + .06608X2 0
- 24.84586X22 - .5659X 2 3 ) x 10
Where:
X 2 = o X12 = (Ina)(int) X22 = To
X3 = T (OK) X13 = (ino)[T(OK)]- X2 3 = to
14 X24X4 = t X14 = ( 4nt)[T(OK)] - X24 = taT
X6 = Ino X = Ine4.(ToK)-
7 = [T(OK)]- 17 = ln(t)lnoe 4. (TOK)
X8 = Int X18 = TOK2
X9 = (Ina)2 X19 = t2
X10 = ET(OK)]- 2 20 = 2
X1 1 = (Int)2 X21 = Tt
NOTE: (X1 5 = T-lot) does not enter as independent variables
G-8
MCOONNMELL DOUGLAS ASVTROMAUTICS COMPANY " EAST
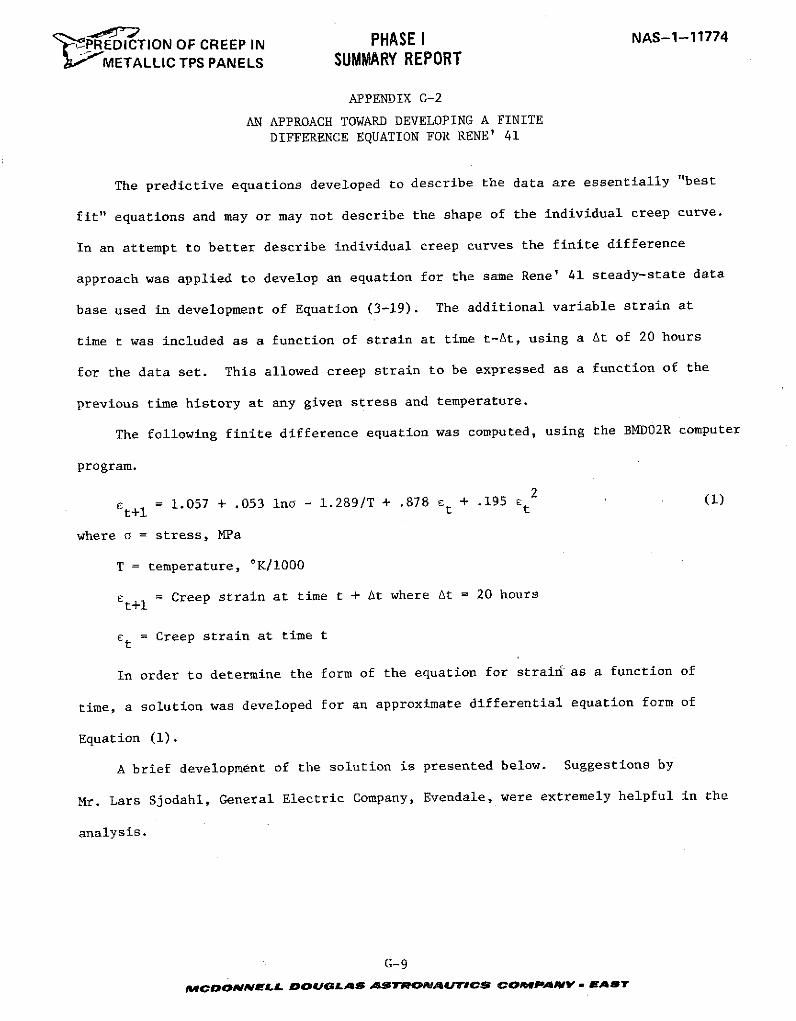
- PREDICTION OF CREEP IN PHASE NAS-1-11774
METALLIC TPS PANELS SUMMARY REPORT
APPENDIX G-2
AN APPROACH TOWARD DEVELOPING A FINITEDIFFERENCE EQUATION FOR RENE' 41
The predictive equations developed to describe the data are essentially "best
fit" equations and may or may not describe the shape of the individual creep curve.
In an attempt to better describe individual creep curves the finite difference
approach was applied to develop an equation for the same Rene' 41 steady-state data
base used in development of Equation (3-19). The additional variable strain at
time t was included as a function of strain at time t-At, using a At of 20 hours
for the data set. This allowed creep strain to be expressed as a function of the
previous time history at any given stress and temperature.
The following finite difference equation was computed, using the BMD02R computer
program.
Ct+1 = 1.057 + .053 Ino - 1.289/T + .878 t + .195 t2 (1)
where a = stress, MPa
T = temperature, 'K/1000
t+l = Creep strain at time t + At where At = 20 hours
Et = Creep strain at time t
In order to determine the form of the equation for strain as a function of
time, a solution was developed for an approximate differential equation form of
Equation (1).
A brief development of the solution is presented below. Suggestions by
Mr. Lars Sjodahl, General Electric Company, Evendale, were extremely helpful in the
analysis.
G-9
MCDONNEALL DOULAS ASTIRONAUTrICS COIawPAY - RAAT
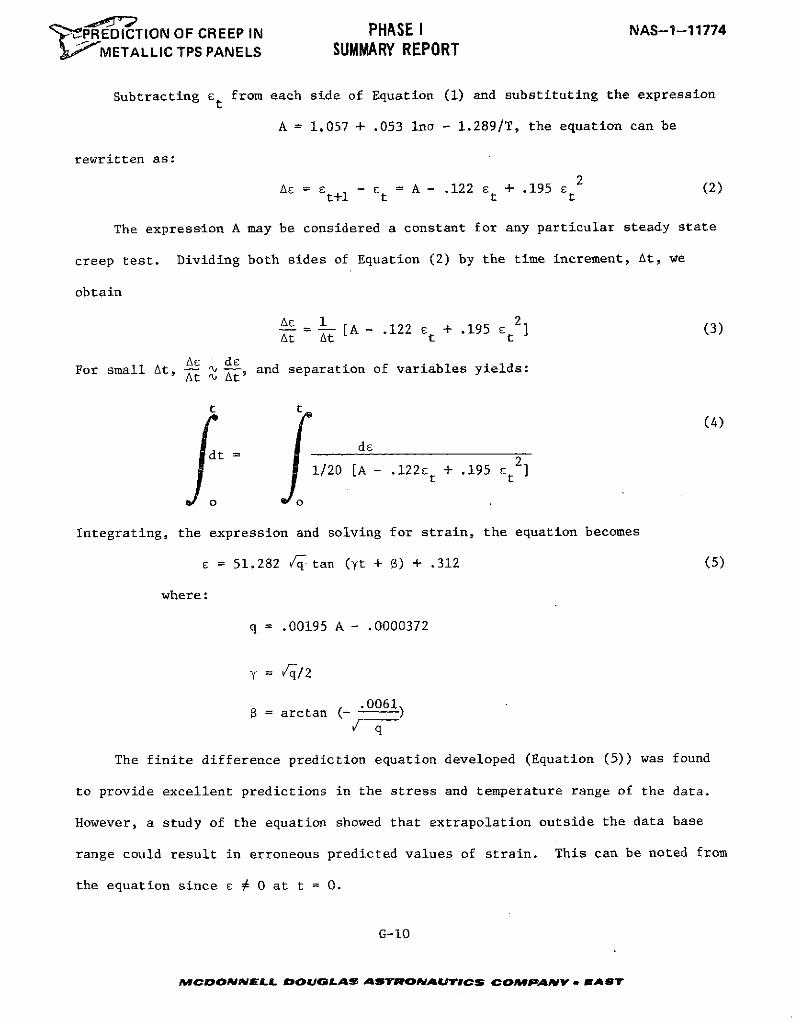
,PREDICTION OF CREEP IN PHASE I NAS-1-11774METALLIC TPS PANELS SUMMARY REPORT
Subtracting et from each side of Equation (1) and substituting the expression
A = 1.057 + .053 Ina - 1.289/T, the equation can be
rewritten as:
As = t+ - Et = A - .122 st + .195 et2 (2)
The expression A may be considered a constant for any particular steady state
creep test. Dividing both sides of Equation (2) by the time increment, At, we
obtain
A_ 1 2-A = [A - .122 S + .195 E i (3)
At At t t
For small At, A , and separation of variables yields:At n At
t t(4)
dt = d21/20 [A - .122 t + .195 E ]
Integrating, the expression and solving for strain, the equation becomes
s = 51.282 Vq tan (yt + B) + .312 (5)
where:
q = .00195 A - .0000372
y = 'q/2
S = arctan (- 0061)
J q
The finite difference prediction equation developed (Equation (5)) was found
to provide excellent predictions in the stress and temperature range of the data.
However, a study of the equation showed that extrapolation outside the data base
range could result in erroneous predicted values of strain. This can be noted from
the equation since E # 0 at t = 0.
G-10
MCDONNmELL DOUGLAS ASTRONAUTICS COMPAmVNY AST
REDICTION OF CREEP IN PHASE I NAS-1-11774
VO/ METALLIC TPS PANELS SUMMARY REPORT
Since it will, in general, be difficult to solve resulting finite difference
equations and may be impossible to control resulting boundary conditions of E = 0
at 0 = 0 and t = 0, which must be met for application of the equation to TPS creep
deflection analysis, the approach was not pursued further during this program.
G-11
MCDONNELL DOUGLAS ASr mONAUTICS COMPANV y EAAST
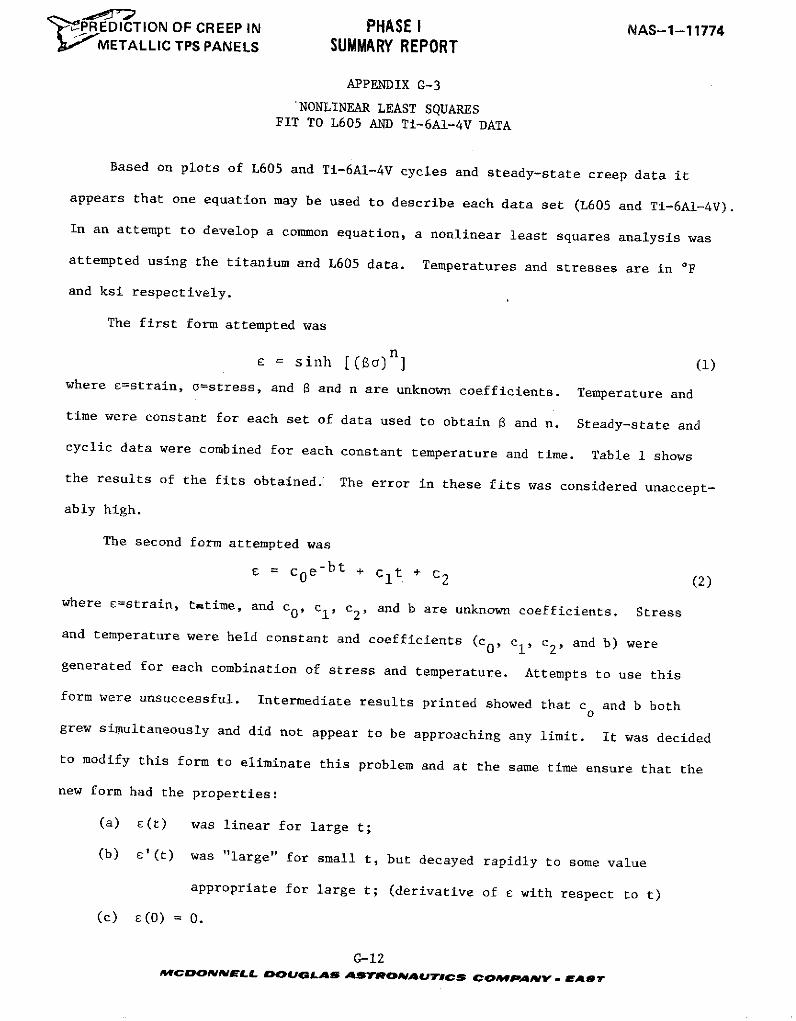
' PREDICTION OF CREEP IN PHASE I NAS-1-11774METALLIC TPS PANELS SUMMARY REPORT
APPENDIX G-3
'NONLINEAR LEAST SQUARESFIT TO L605 AND Ti-6Al-4V DATA
Based on plots of L605 and Ti-6AI-4V cycles and steady-state creep data it
appears that one equation may be used to describe each data set (L605 and Ti-6AI-4V).
In an attempt to develop a common equation, a nonlinear least squares analysis was
attempted using the titanium and L605 data. Temperatures and stresses are in OF
and ksi respectively.
The first form attempted was
E = sinh [( a)n] (1)
where e=strain, o=stress, and a and n are unknown coefficients. Temperature and
time were constant for each set of data used to obtain and n. Steady-state and
cyclic data were combined for each constant temperature and time. Table 1 shows
the results of the fits obtained. The error in these fits was considered unaccept-
ably high.
The second form attempted was
e = c0 e-bt + Clt + c 2 (2)
where e=strain, t=time, and cO, cl, c2 , and b are unknown coefficients. Stress
and temperature were held constant and coefficients (c0 , C1 , c2 , and b) were
generated for each combination of stress and temperature. Attempts to use this
form were unsuccessful. Intermediate results printed showed that c0 and b both
grew simultaneously and did not appear to be approaching any limit. It was decided
to modify this form to eliminate this problem and at the same time ensure that the
new form had the properties:
(a) E(t) was linear for large t;
(b) e'(t) was "large" for small t, but decayed rapidly to some value
appropriate for large t; (derivative of £ with respect to t)
(c) E(0) = 0.
G-12MCDONNELL DOUGLAS ASTRONAUTICS COMPANy . WAST
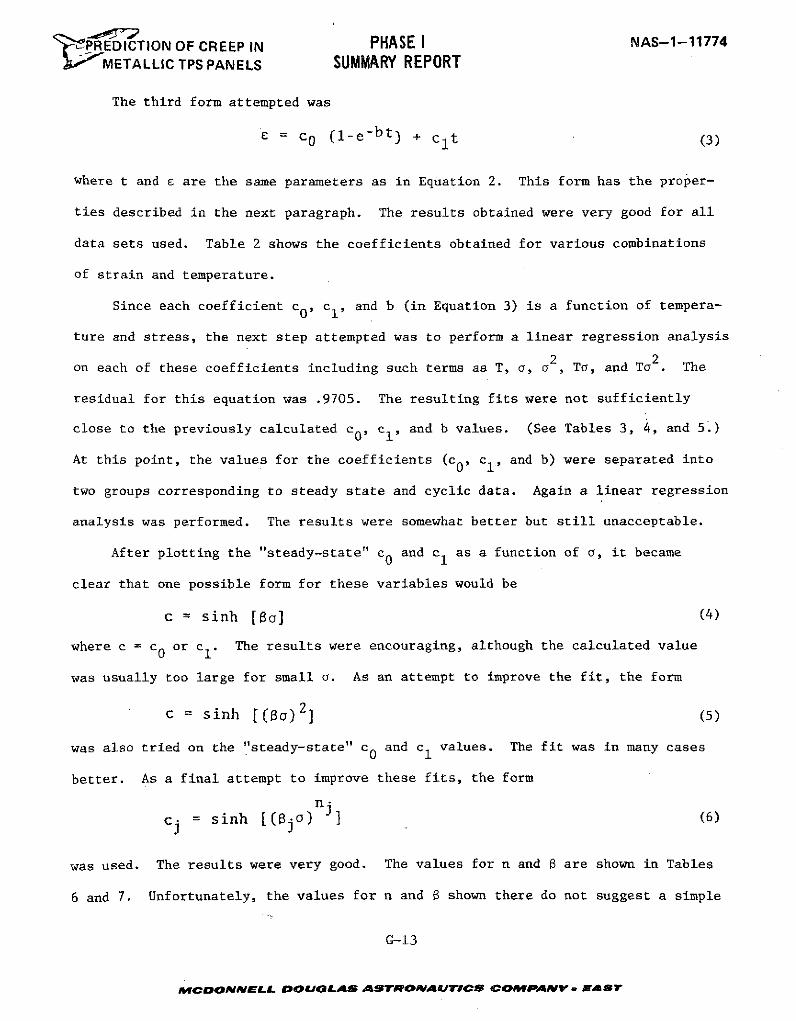
PREDICTION OF CREEP IN PHASE I NAS-1-11774
METALLIC TPS PANELS SUMMARY REPORT
The third form attempted was
= c O (1-e-bt) + c1t (3)
where t and e are the same parameters as in Equation 2. This form has the proper-
ties described in the next paragraph. The results obtained were very good for all
data sets used. Table 2 shows the coefficients obtained for various combinations
of strain and temperature.
Since each coefficient c0 , cl, and b (in Equation 3) is a function of tempera-
ture and stress, the next step attempted was to perform a linear regression analysis
on each of these coefficients including such terms as T, a, a 2 , Ta, and Ta 2 . The
residual for this equation was .9705. The resulting fits were not sufficiently
close to the previously calculated c0 , cl, and b values. (See Tables 3, 4, and 5.)
At this point, the values for the coefficients (co, C1 , and b) were separated into
two groups corresponding to steady state and cyclic data. Again a linear regression
analysis was performed. The results were somewhat better but still unacceptable.
After plotting the "steady-state" co and c 1 as a function of a, it became
clear that one possible form for these variables would be
c = sinh [Ba] (4)
where c = c0 or cl. The results were encouraging, although the calculated value
was usually too large for small a. As an attempt to improve the fit, the form
c = sinh [(8a)2] (5)
was also tried on the "steady-state" c0 and cl values. The fit was in many cases
better. As a final attempt to improve these fits, the form
n.= sinh [( o) 1 (6)
was used. The results were very good. The values for n and 8 are shown in Tables
6 and 7. Unfortunately, the values for n and shown there do not suggest a simple
G-13
MCDONNELL DOUGLAS ASTRONAUTICS COMPANY - EAST
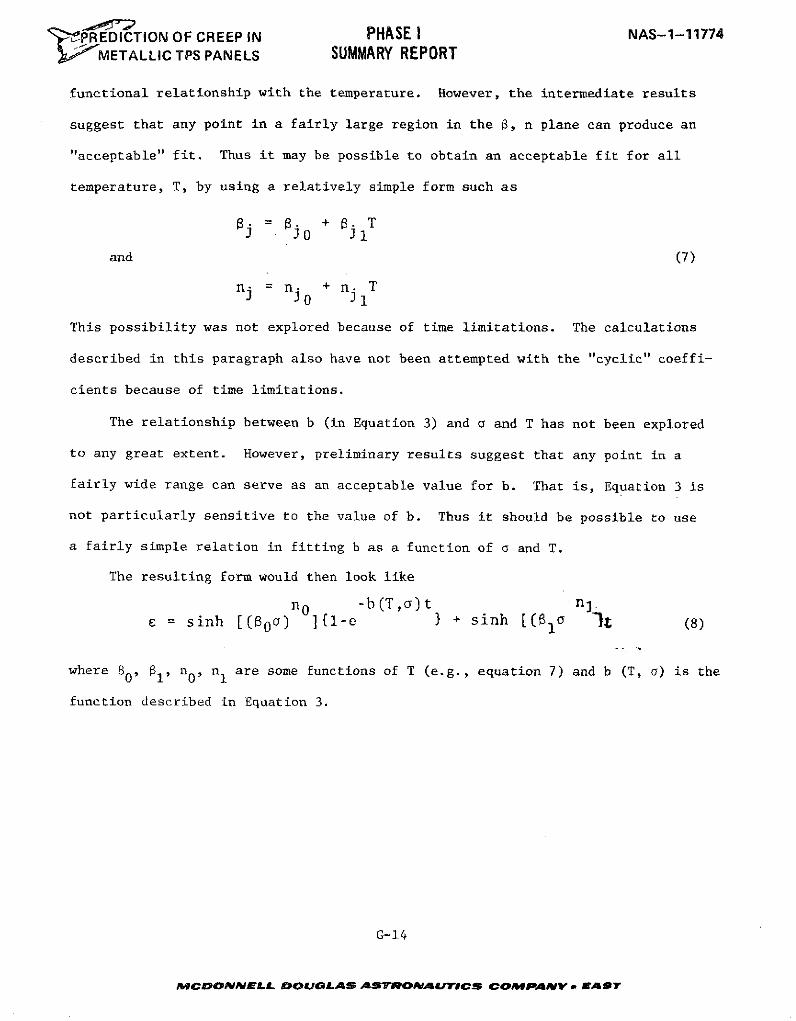
'OIPlREDICTION OF CREEP IN PHASE I NAS-1-11774SMETALLIC TPS PANELS SUMMARY REPORT
functional relationship with the temperature. However, the intermediate results
suggest that any point in a fairly large region in the B, n plane can produce an
"acceptable" fit. Thus it may be possible to obtain an acceptable fit for all
temperature, T, by using a relatively simple form such as
= 8 + 8 T
and (7)
nj = nj + nj T
This possibility was not explored because of time limitations. The calculations
described in this paragraph also have not been attempted with the "cyclic" coeffi-
cients because of time limitations.
The relationship between b (in Equation 3) and a and T has not been explored
to any great extent. However, preliminary results suggest that any point in a
fairly wide range can serve as an acceptable value for b. That is, Equation 3 is
not particularly sensitive to the value of b. Thus it should be possible to use
a fairly simple relation in fitting b as a function of a and T.
The resulting form would then look like
n -b(T,o)t n n.e = sinh [() ]{l-e } + sinh [(81t ] (8)
where B', 1, no, n1 are some functions of T (e.g., equation 7) and b (T, a) is the
function described in Equation 3.
G-14
MCDONNPELL DOUGLAS ASTRONAUTICS COMPANV V AST
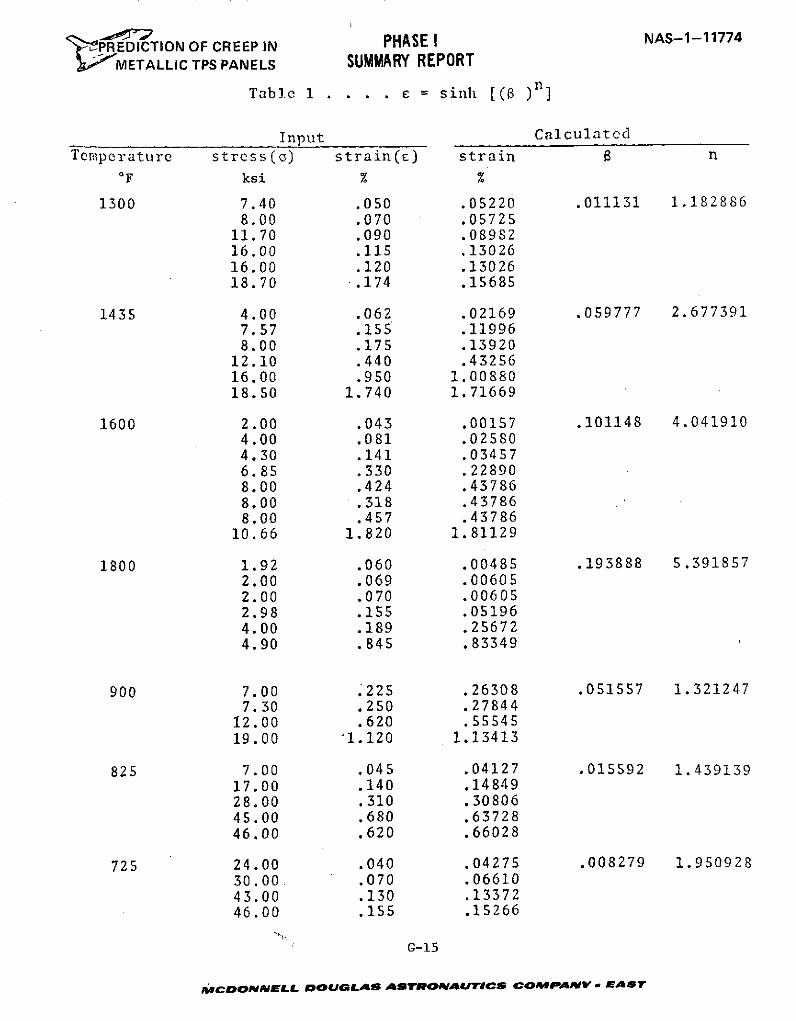
t-''PRE DICTION OF CREEP IN PHASE I NAS-1-11774
METALLIC TPS PANELS SUMMARY REPORT
Table 1 .... = sinh [(a )n]
Input Calculated
Temperature stress(a) strain(c) strain 8 n
OF ksi % %
1300 7.40 .050 .05220 .011131 1.1828868.00 .070 .05725
11.70 .090 .0898216.00 .115 .1302616.00 .120 .1302618.70 .174 .15685
1435 4.00 .062 .02169 .059777 2.6773917.57 .155 .119968.00 .175 .13920
12.10 .440 .4325616.00 .950 1.0088018.50 1.740 1.71669
1600 2.00 .043 .00157 .101148 4.0419104.00 .081 .025804.30 .141 .034576.85 .330 .228908.00 .424 .437868.00 .318 .437868.00 .457 .43786
10.66 1.820 1.81129
1800 1.92 .060 .00485 .193888 5.3918572.00 .069 .006052.00 .070 .006052.98 .155 .051964.00 .189 .256724.90 .845 .83349
900 7.00 ;225 .26308 .051557 1.3212477.30 .250 .27844
12.00 .620 .5554519.00 '1.120 1.13413
825 7.00 .045 .04127 .015592 1.43913917.00 .140 .1484928.00 .310 .3080645.00 .680 .6372846.00 .620 .66028
725 24.00 .040 .04275 .008279 1.95092830.00. .070 .0661043.00 .130 .1337246.00 .155 .15266
G-15
CmDONNELL DOUvoLAS AaSvwONAUrTIC COaMPANmv. AST
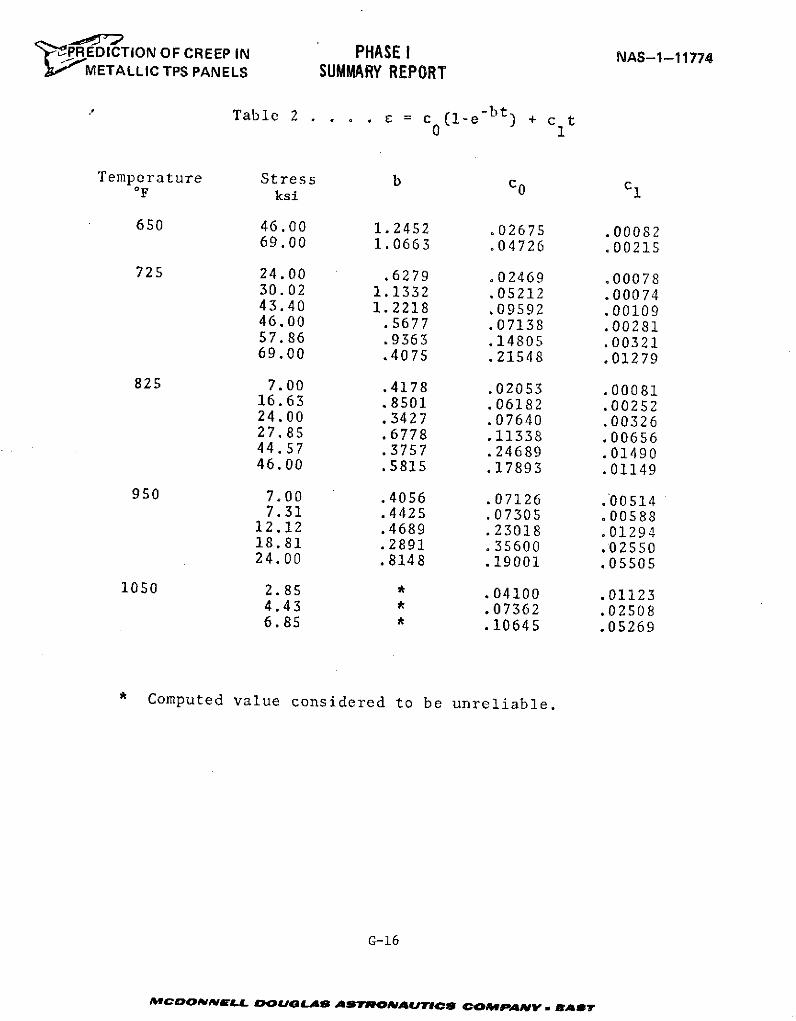
REDICTION OF CREEP IN PHASE I NAS-1-11774P METALLIC TPS PANELS SUMMARY REPORT
Table 2. . . . = c (1-e-bt) + c t0 1
Temperature Stress b co C1OF ksi
650 46.00 1.2452 .02675 .0008269.00 1.0663 .04726 .00215
725 24.00 .6279 .02469 .0007830.02 1.1332 .05212 .0007443.40 1.2218 .09592 .0010946.00 .5677 .07138 .0028157.86 .9363 .14805 .0032169.00 .4075 .21548 .01279
825 7.00 .4178 .02053 .0008116.63 .8501 .06182 .0025224.00 .3427 .07640 .0032627.85 .6778 .11338 .0065644.57 .3757 .24689 .0149046.00 .5815 .17893 .01149
950 7.00 .4056 .07126 .005147.31 .4425 .07305 .00588
12.12 .4689 .23018 .0129418.81 .2891 .35600 .0255024.00 .8148 .19001 .05505
1050 2.85 * .04100 .011234.43 * .07362 .025086.85 * .10645 .05269
* Computed value considered to be unreliable.
G-16
MCDONNmmLL DOU8oLAL ASVWOJAUTIrs COMPANVy o WAT
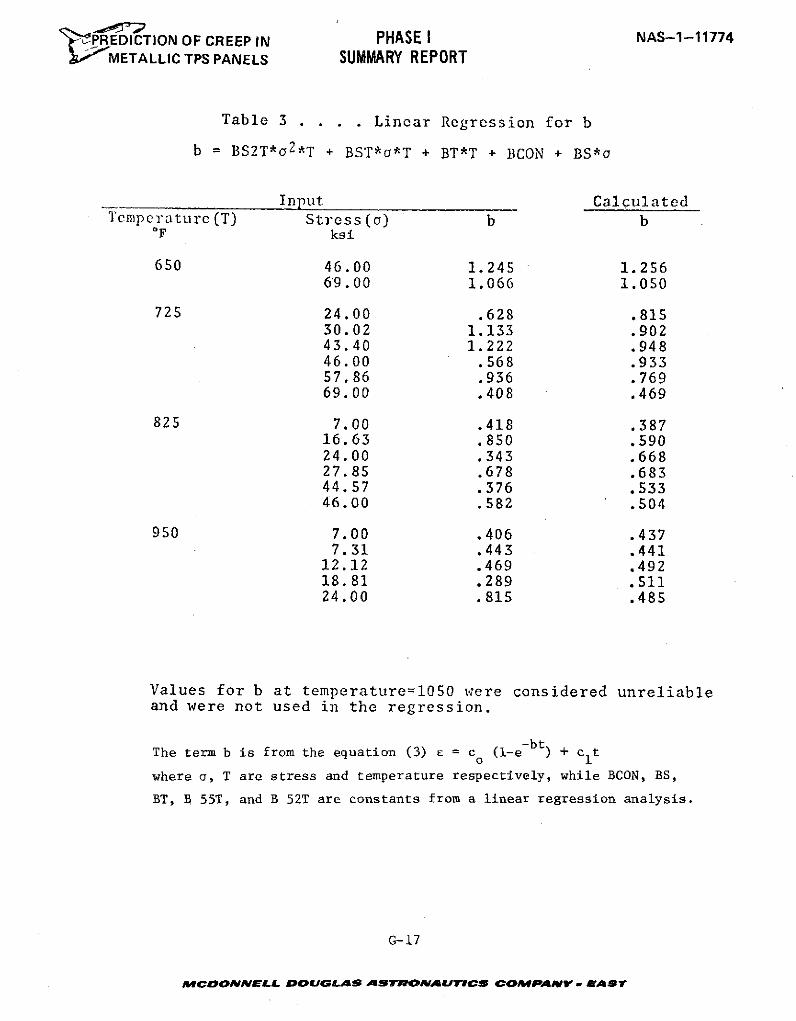
"i tPREDICTION OF CREEP IN PHASE I NAS-1-11774METALLIC TPS PANELS SUMMARY REPORT
Table 3 . . .. Linear Regression for b
b = BS2T*o 2*T + BST*o*T + BT*T + BCON + BS*o
Input CalculatedTemperature(T) Stress(c) b b
OF ksi
650 46.00 1.245 1.25669.00 1.066 1.050
725 24.00 .628 .81530.02 1.133 .90243.40 1.222 .94846.00 .568 .93357.86 .936 .76969.00 .408 .469
825 7.00 .418 .38716.63 .850 .59024.00 .343 .66827.85 .678 .68344.57 .376 .53346.00 .582 .504
950 7.00 .406 .4377.31 .443 .441
12.12 .469 .49218.81 .289 .51124.00 .815 .485
Values for b at temperature=1050 were considered unreliableand were not used in the regression.
The term b is from the equation (3) E = co (1-e-bt) + clt
where a, T are stress and temperature respectively, while BCON, BS,
BT, B 55T, and B 52T are constants from a linear regression analysis.
G-17
MCOONNELL DOUGLAS ASTwONAUTICS COMPAVV - EAT
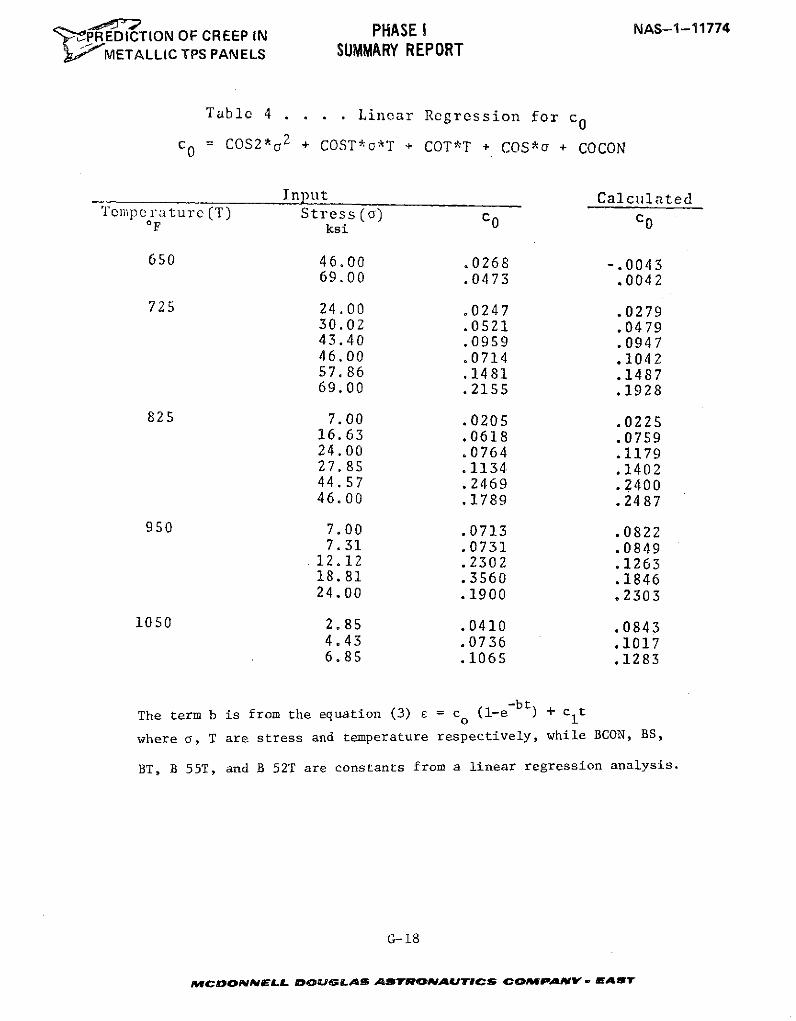
HASE I NAS-1-11774',OPREDICTION OF CREEP IN PHASE IMETALLIC TPS PANELS SUMMARY REPORT
Table 4 . . . . Linear Regression for c O
C0 = COS2*o 2 + COST*o*T + COT*T + COS*o + COCON
Input CalculatedTemprc ature (T) Stress(o) Co CoOF ksi
650 46.00 .0268 -.004369.00 .0473 .0042
725 24.00 .0247 .027930.02 .0521 .047943.40 .0959 .094746.00 .0714 .104257.86 .1481 .148769.00 .2155 .1928
825 7.00 .0205 .022516.63 .0618 .075924.00 .0764 .117927.85 .1134 .140244.57 .2469 .240046.00 .1789 .2487
950 7.00 .0713 .08227.31 .0731 .0849
12.12 .2302 .126318.81 .3560 .184624.00 .1900 .2303
1050 2.85 .0410 .08434.43 .0736 .10176.85 .1065 .1283
The term b is from the equation (3) E = co (1-e- b t) + clt
where a, T are stress and temperature respectively, while BCON, BS,
BT, B 55T, and B 52T are constants from a linear regression analysis.
G-18
MCONPNjELL DOUG LAS ASTRONAUTICS COMPpANwY . AST
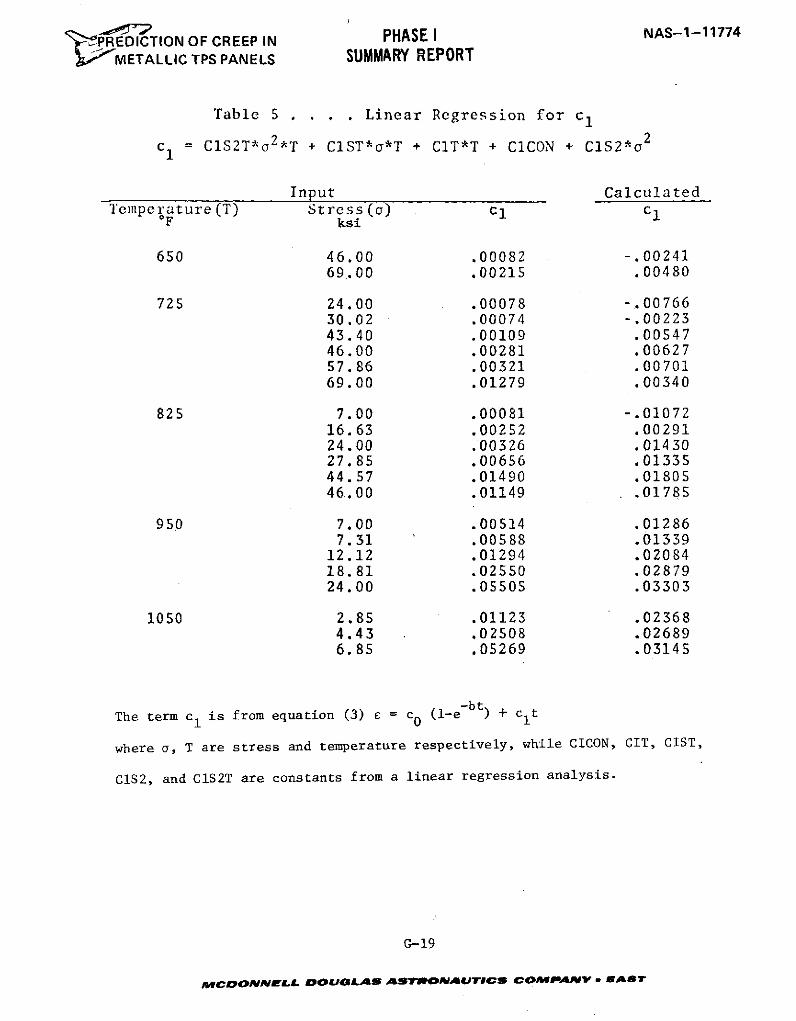
OF CREEP IN PHASE I NAS-1-11774PREDICTION OF CREEP IN
METALLIC TPS PANELS SUMMARY REPORT
Table 5 . . . . Linear Regression for cl
c, = C1S2T*o 2 *T + CIST*a*T + C1T*T + CICON + C1S2*o 2
Input CalculatedTemperature (T) Stress(a) cl C1OF ksi
650 46.00 .00082 -.0024169.00 .00215 .00480
725 24.00 .00078 -.0076630.02 .00074 -.0022343.40 .00109 .0054746.00 .00281 .0062757.86 .00321 .0070169.00 .01279 .00340
825 7.00 .00081 -.0107216.63 .00252 .0029124.00 .00326 .0143027.85 .00656 .0133544.57 .01490 .0180546.00 .01149 .01785
950 7.00 .00514 .012867.31 .00588 .01339
12.12 .01294 .0208418.81 .02550 .0287924.00 .05505 .03303
1050 2.85 .01123 .023684.43 .02508 .026896.85 .05269 .03145
The term cl is from equation (3) e = c (l-e - b t ) + clt
where a, T are stress and temperature respectively, while CICON, CIT, CIST,
CIS2, and CIS2T are constants from a linear regression analysis.
G-19
MCDONNELL DOUGLAS AsTOmNAVUTCS COMPANY - EAST
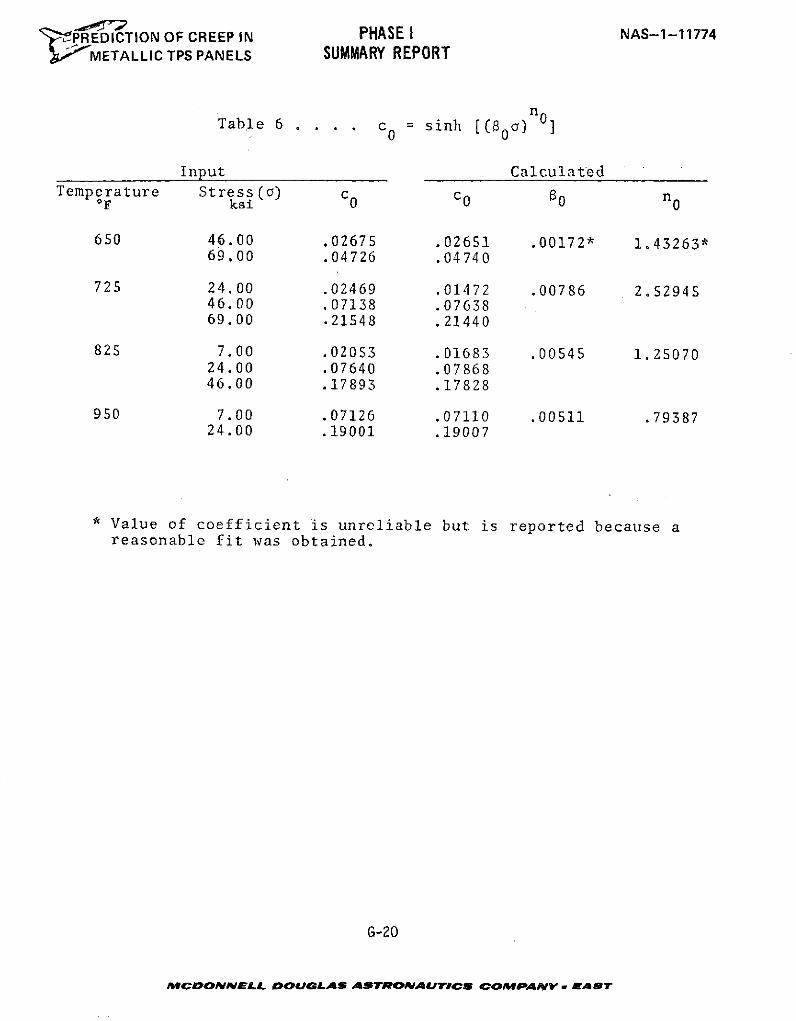
P'PREDICTION OF CREEP IN PHASE I NAS-1-11774METALLIC TPS PANELS SUMMARY REPORT
Table 6 . . . . c0 = sinh [(Bg0) n ]
Input CalculatedTemperature Stress(a) C CO no
OF ksi 0 0
650 46.00 .02675 .02651 .00172* 1.43263*69.00 .04726 .04740
725 24.00 .02469 .01472 .00786 2.5294546.00 .07138 .0763869.00 .21548 .21440
825 7.00 .02053 .01683 .00545 1.2507024.00 .07640 .0786846.00 .17893 .17828
950 7.00 .07126 .07110 .00511 .7938724.00 .19001 .19007
* Value of coefficient is unreliable but is reported because areasonable fit was obtained.
G-20
MCCOONNELL DOUGLAS ASTRONAUTICs COMPANV- ASy
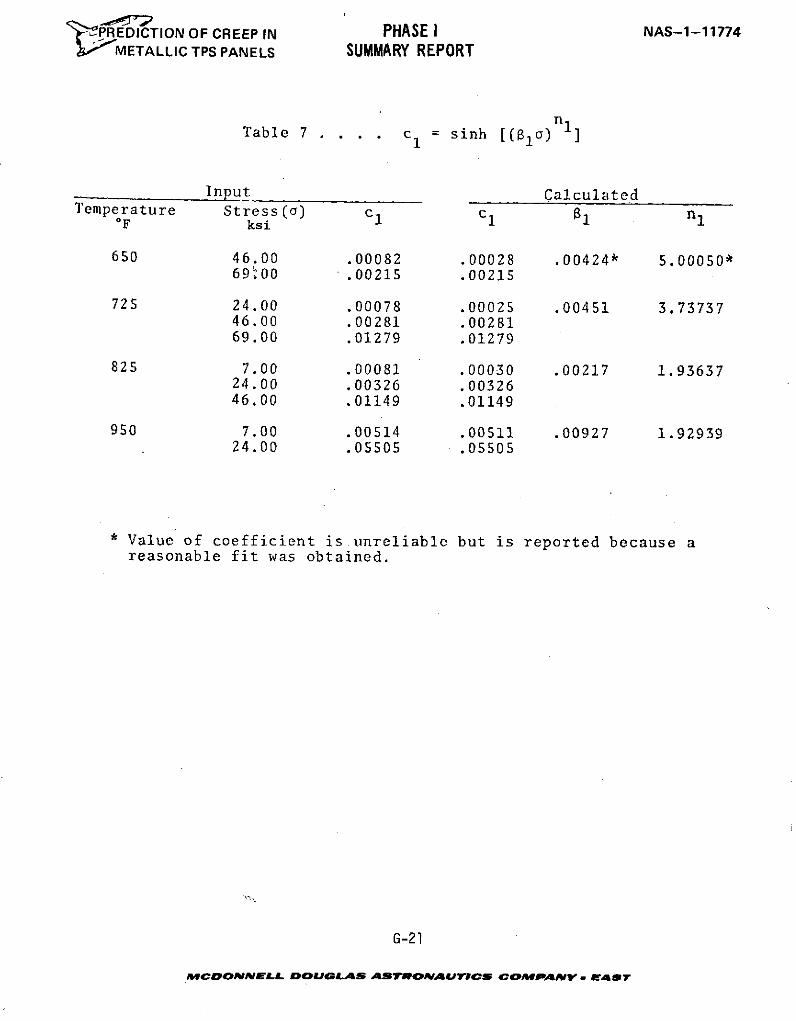
PREDICTION OF CREEP IN PHASE I NAS-1-11774METALLIC TPS PANELS SUMMARY REPORT
Table 7 . ... c = sinh [(Bloa)n
Input CalculatedTemperature Stress(a) cI c 8 n
OF ksi 1 1 1 1
650 46.00 .00082 .00028 .00424* 5.00050*69"00 .00215 .00215
725 24.00 .00078 .00025 .00451 3.7373746.00 .00281 .0028169.00 .01279 .01279
825 7.00 .00081 .00030 .00217 1.9363724.00 .00326 .0032646.00 .01149 .01149
950 7.00 .00514 .00511 .00927 1.9293924.00 .05505 .05505
* Value of coefficient is unreliable but is reported because areasonable fit was obtained.
G-21
MCCDONNELL DOUGLAS ASTRONIAUTICS COPANY * AST
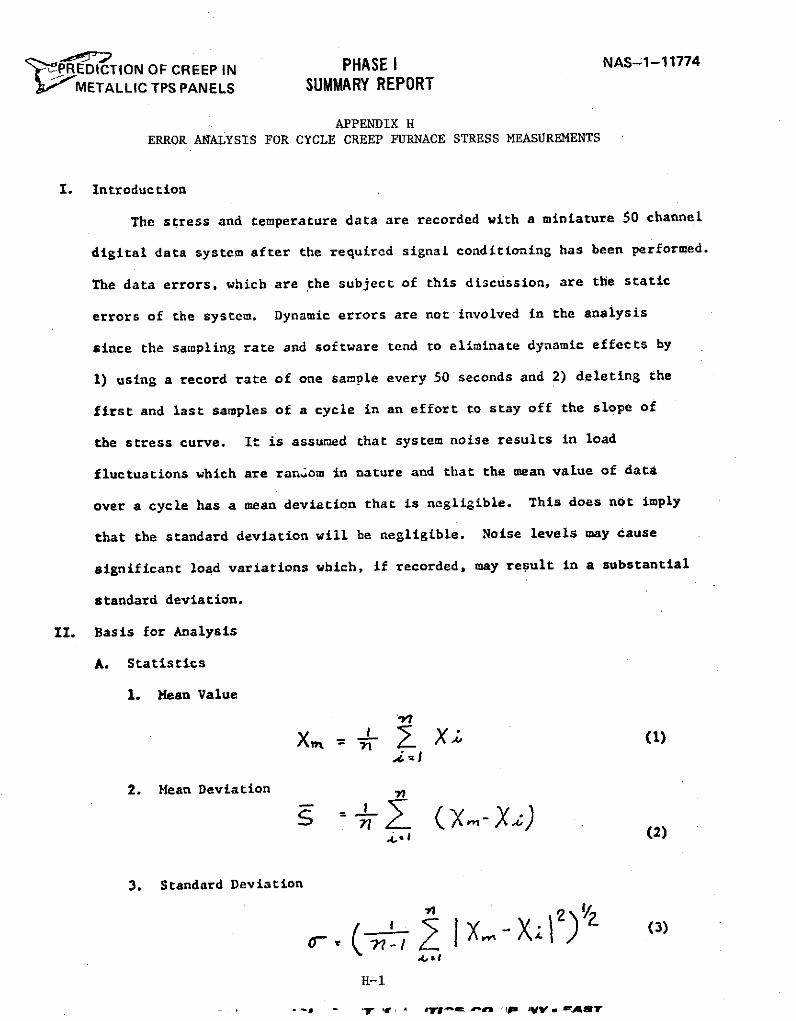
PHASE NAS-1-11774' PREDICTION OF CREEP IN PHASE I
r;J' METALLIC TPS PANELS SUMMARY REPORT
APPENDIX H
ERROR ANALYSIS FOR CYCLE CREEP FURNACE STRESS MEASUREMENTS
I. Introduction
The stress and temperature data are recorded with a miniature 50 channel
digital data system after the required signal conditioning has been performed.
The data errors, which are the subject of this discussion, are the static
errors of the system. Dynamic errors are not involved in the analysis
since the sampling rate and software tend to eliminate dynamic effects by
1) using a record rate of one sample every 50 seconds and 2) deleting the
first and last samples of a cycle in an effort to stay off the slope of
the stress curve. It is assumed that system noise results in load
fluctuations which are random in nature and that the mean value of data
over a cycle has a mean deviation that is negligible. This does not imply
that the standard deviation will be negligible. Noise levels may cause
significant load variations which, if recorded, may result in a substantial
standard deviation.
II. Basis for Analysis
A. Statistics
1. Mean Value
4iI
2. Mean Deviation
(2)
3. Standard Deviation
- X (3)
H-1
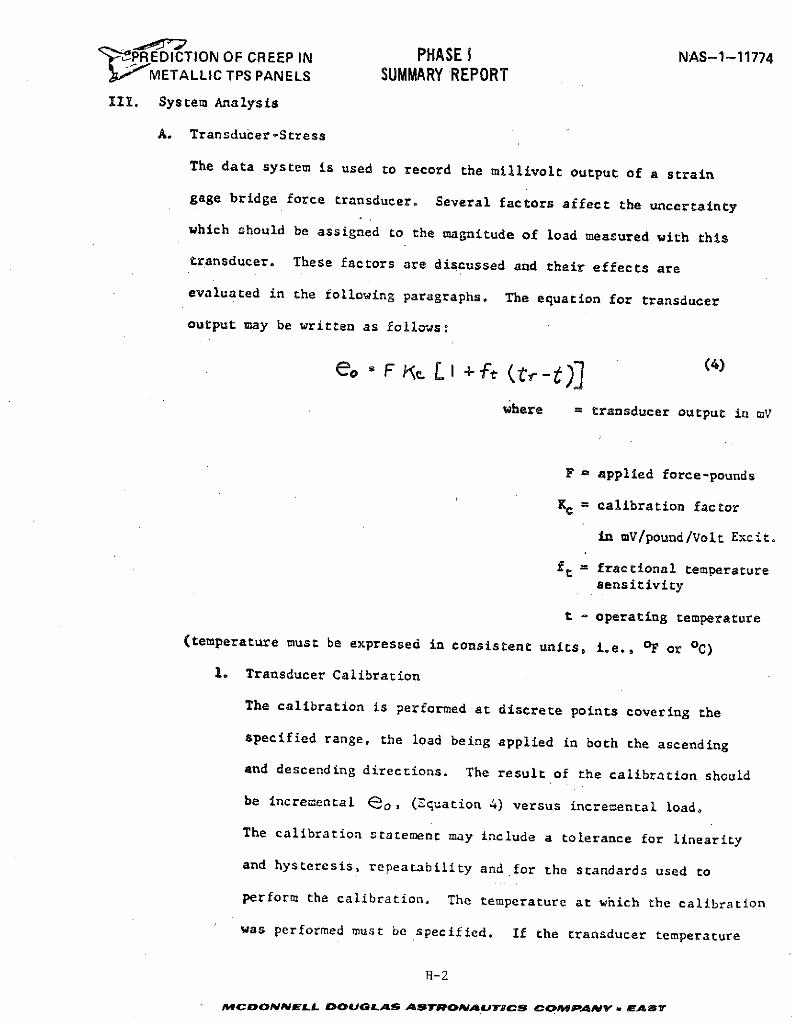
' PREDICTION OF CREEP IN PHASE I NAS-1-11774J.METALLIC TPS PANELS SUMMARY REPORTIII. System Analysis
A. Transducer-Stress
The data system is used to record the millivolt output of a strain
gage bridge force transducer. Several factors affect the uncertainty
which should be assigned to the magnitude of load measured with this
transducer. These factors are discussed and their effects are
evaluated in the following paragraphs. The equation for transducer
output may be written as follows:
e = F Li ftl + tr-t) (4)
where = transducer output in mV
F = applied force-pounds
K = calibration factor
in mV/pound/Volt Excit.
ft = fractional temperaturesensitivity
t - operating temperature
(temperature must be expressed in consistent units, i.e., OF or oC)
1. Transducer Calibration
The calibration is performed at discrete points covering the
specified range, the load being applied in both the ascending
and descending directions. The result of the calibration should
be incremental eo, (Equation 4) versus incremental load.
The calibration statement may include a tolerance for linearity
and hysteresis, repeatability and for the standards used to
perform the calibration. The temperature at which the calibration
was performed must be specified. If the transducer temperature
H-2
MCDONNELL DOUGLAS ASTRONAUTICS COMP4.ANV , LAST
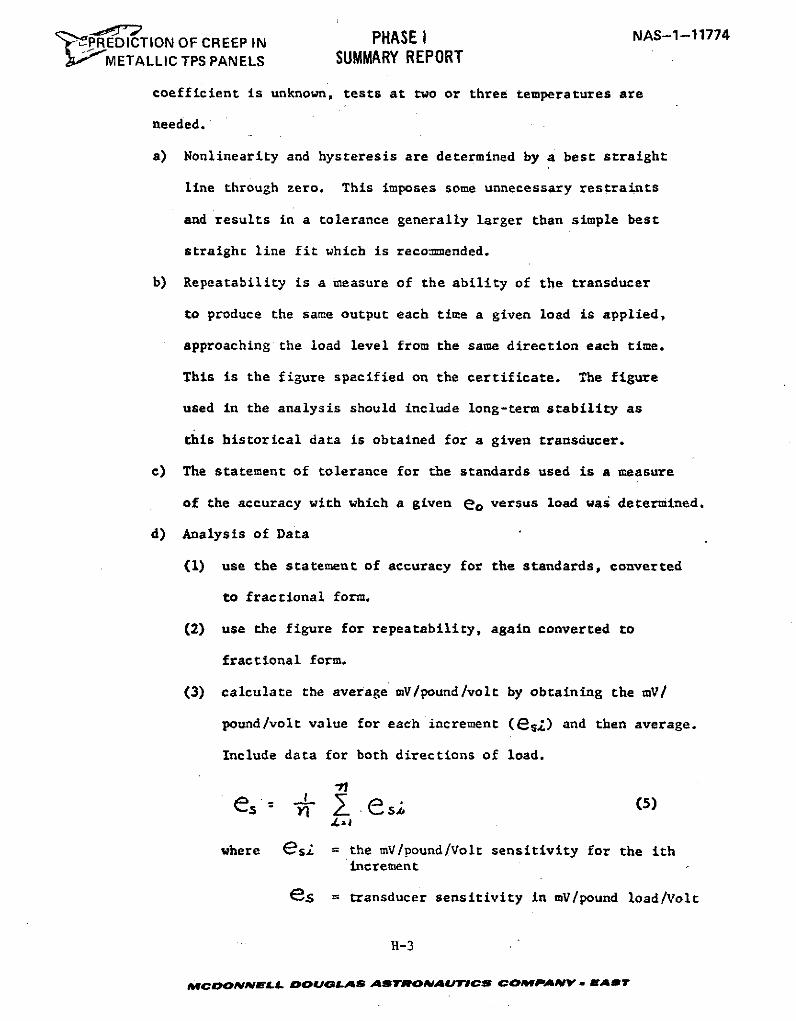
EDICTION OF CREEP IN PHASE I NAS-1-11774
L,'METALLIC TPS PANELS SUMMARY REPORT
coefficient is unknown, tests at two or three temperatures are
needed.
a) Nonlinearity and hysteresis are determined by a best straight
line through zero. This imposes some unnecessary restraints
and results in a tolerance generally larger than simple best
straighc line fit which is recommended.
b) Repeatability is a measure of the ability of the transducer
to produce the same output each time a given load is applied,
approaching the load level from the same direction each time.
This is the figure specified on the certificate. The figure
used in the analysis should include long-term stability as
this historical data is obtained for a given transducer.
c) The statement of tolerance for the standards used is a measure
of the accuracy with which a given eo versus load was determined.
d) Analysis of Data
(1) use the statement of accuracy for the standards, converted
to fractional form.
(2) use the figure for repeatability, again converted to
fractional form.
(3) calculate the average mV/pound/volt by obtaining the mV/
pound/volt value for each increment (es,) and then average.
Include data for both directions of load.
es iek (5)
where esi = the mV/pound/Volt sensitivity for the ithincrement
es = transducer sensitivity in mV/pound load/Volt
H-3
MCDONNELL DOUGLAS ASTRONAUTrCS COMPAN*AmY EAST
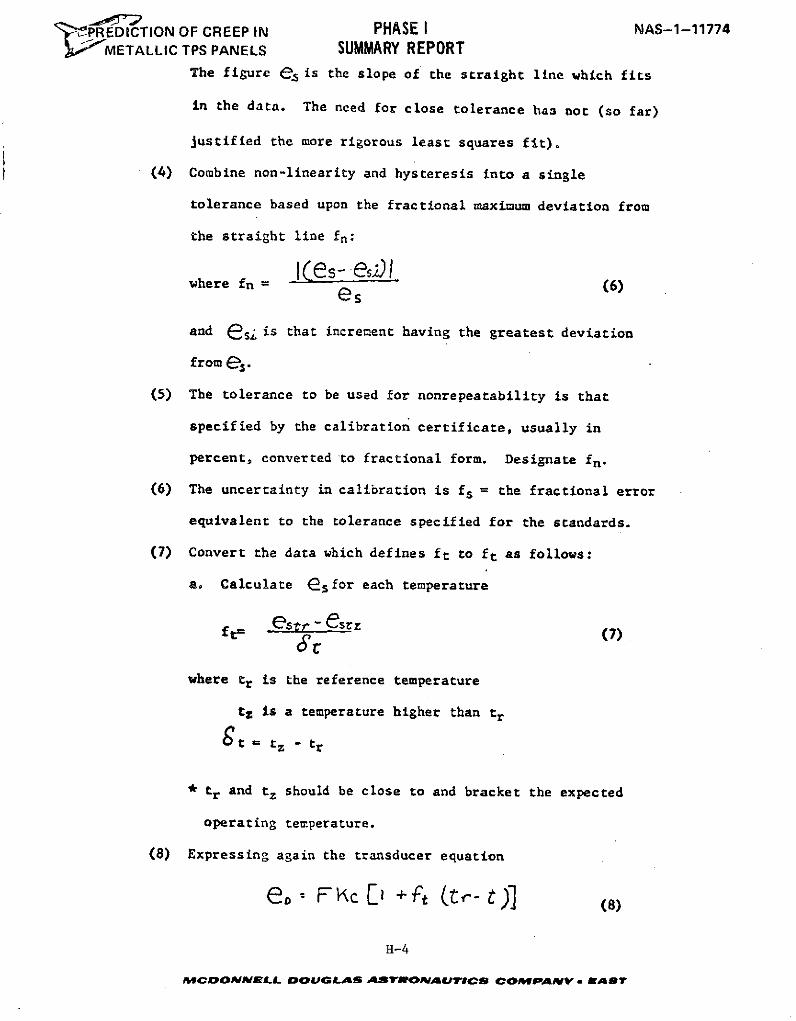
C'-PEDICTION OF CREEP IN PHASE I NAS-1-11774'~METALLIC TPS PANELS SUMMARY REPORT
The figure es is the slope of the straight line which fits
in the data. The need for close tolerance has not (so far)
justified the more rigorous least squares fit).
(4) Combine non-linearity and hysteresis into a single
tolerance based upon the fractional maximum deviation from
the straight line fn:
where fn = (6)esand esi is that increment having the greatest deviation
from e.
(5) The tolerance to be used for nonrepeatability is that
specified by the calibration certificate, usually in
percent, converted to fractional form. Designate fn.
(6) The uncertainty in calibration is fs = the fractional error
equivalent to the tolerance specified for the standards.
(7) Convert the data which defines ft to ft as follows:
a. Calculate e5 for each temperature
f -estr - esrz (7)it" (7)
where tr is the reference temperature
t z is a temperature higher than tr
Gt = t z - t r
* tr and t z should be close to and bracket the expected
operating temperature.
(8) Expressing again the transducer equation
e, FPc[i +ft (,- t)] (8)
H-4
MCaCONNELL DOUGLAS ASTROmAUTICS COMPANy - EaST
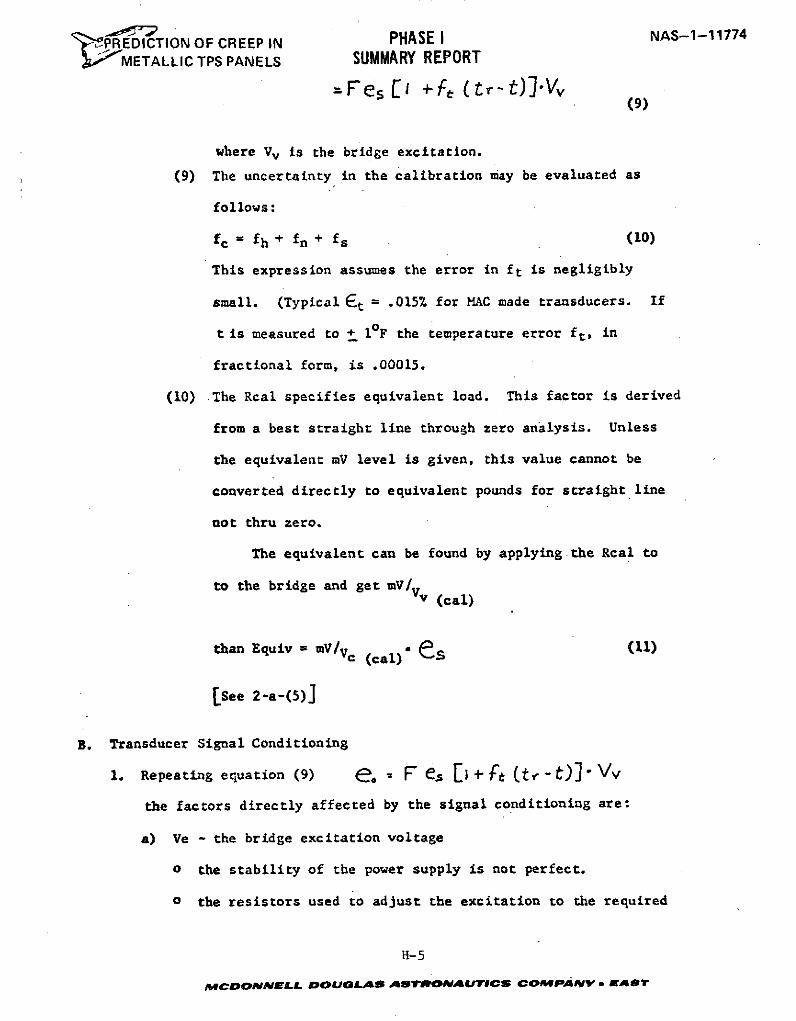
PHASEI NAS-1-11774" PREDICTION OF CREEP IN PHASE I
I METALLIC TPS PANELS SUMMARY REPORT
=Fes EL ft (tr-t)}Vv(9)
where V, is the bridge excitation.
(9) The uncertainty in the calibration may be evaluated as
follows:
fc = fh + fn + fs (10)
This expression assumes the error in ft is negligibly
small. (Typical Et = .015% for MAC made transducers. If
t is measured to + 10F the temperature error ft, in
fractional form, is .00015.
(10) The Real specifies equivalent load. This factor is derived
from a best straight line through zero analysis. Unless
the equivalent mV level is given, this value cannot be
converted directly to equivalent pounds for straight line
not thru zero.
The equivalent can be found by applying the Real to
to the bridge and get mV/ (cal)V (cal)
than Equiv = mV/v (cal) (
Isee 2-a-(5)]
B. Transducer Signal Conditioning
1. Repeating equation (9) e. - F e5 I + t (t - t) Vv
the factors directly affected by the signal conditioning are:
a) Ve - the bridge excitation voltage
o the stability of the power supply is not perfect.
o the resistors used to adjust the excitation to the required
H-5
MCONNEaL DOULAS ASW RONAIUICS COWMPANY V EAST
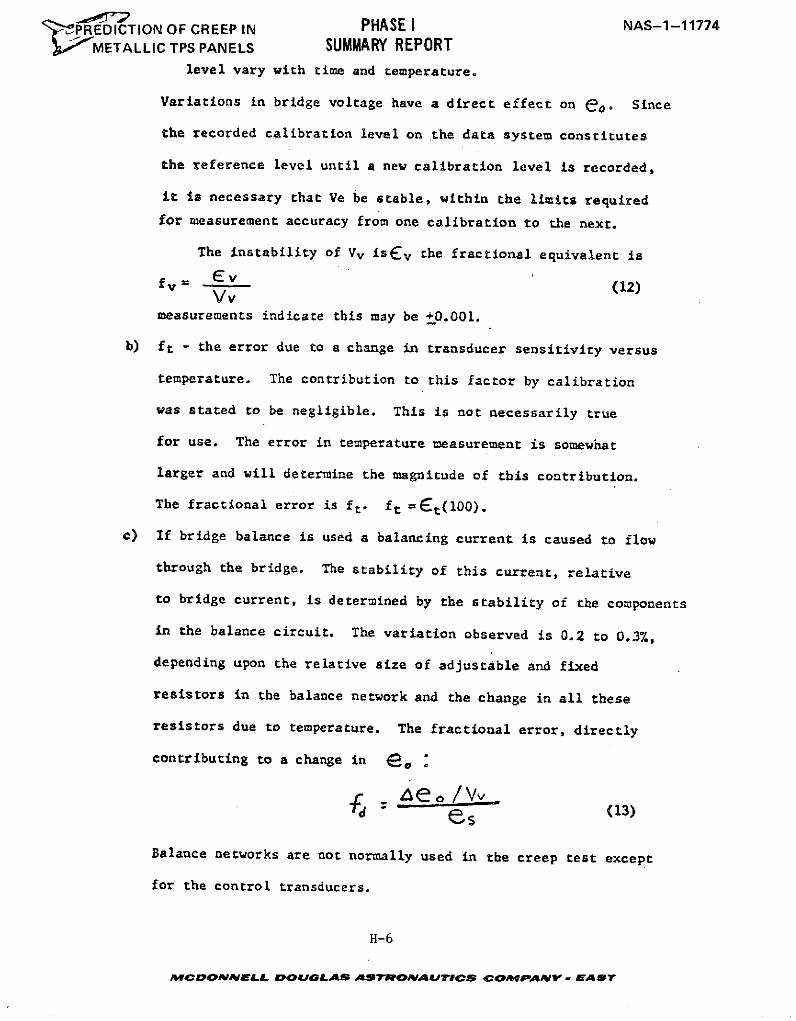
'tPR EDICTION OF CREEP IN PHASE I NAS-1-11774
METALLIC TPS PANELS SUMMARY REPORTlevel vary with time and temperature.
Variations in bridge voltage have a direct effect on eo. Since
the recorded calibration level on the data system constitutes
the reference level until a new calibration level is recorded,
it is necessary that Ve be stable, within the limits required
for measurement accuracy from one calibration to the next.
The instability of Vv isEv the fractional equivalent is
f v (12)Vvmeasurements indicate this may be +0.001.
b) ft - the error due to a change in transducer sensitivity versus
temperature. The contribution to this factor by calibration
was stated to be negligible. This is not necessarily true
for use. The error in temperature measurement is somewhat
larger and will determine the magnitude of this contribution.
The fractional error is ft. ft =~t(100).
c) If bridge balance is used a balancing current is caused to flow
through the bridge. The stability of this current, relative
to bridge current, is determined by the stability of the components
in the balance circuit. The variation observed is 0.2 to 0.37%,
depending upon the relative size of adjustable and fixed
resistors in the balance network and the change in all these
resistors due to temperature. The fractional error, directly
contributing to a change in e, ,
d1 (13)
Balance networks are not normally used in the creep test except
for the control transducers.
H-6
MCDONNELL DOUGLAS ASTRONAUVICS COMPANY - EAST
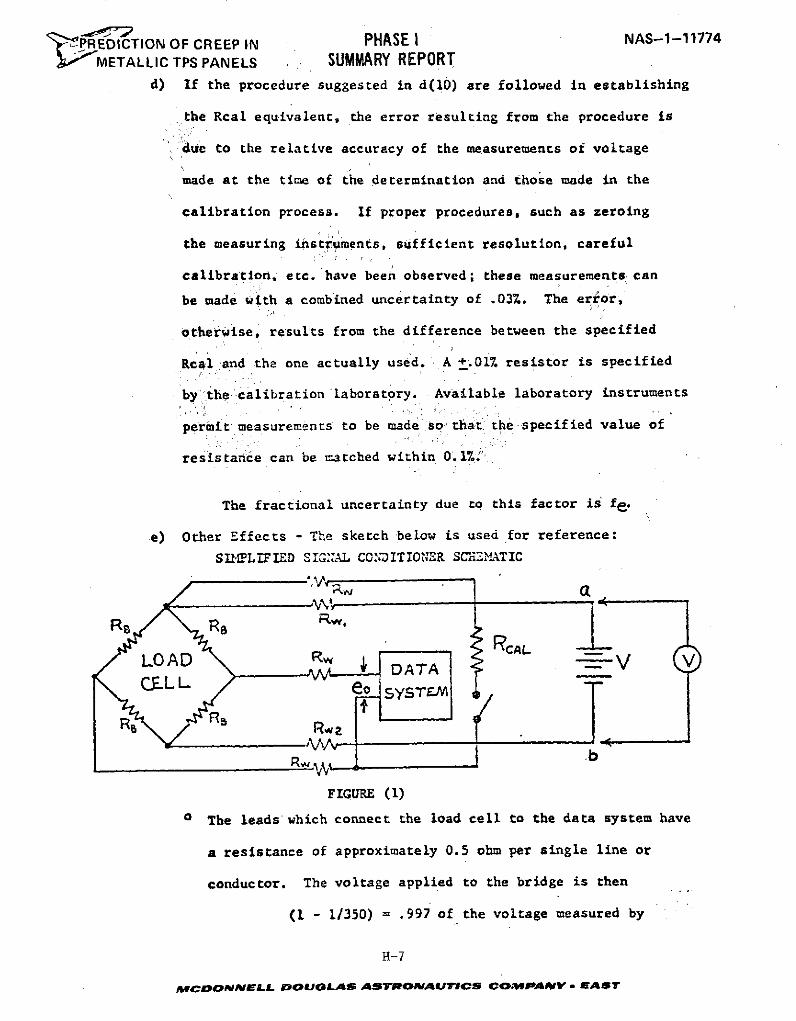
'P REDICTION OF CREEP IN PHASE I NAS-1-11774
METALLIC TPS PANELS SUMMARY REPORT
d) If the procedure suggested in d(10) are followed in establishing
the Rcal equivalent, the error resulting from the procedure is
due to the relative accuracy of the measurements of voltage
made at the time of the determination and those made in the
calibration process. If proper procedures, such as zeroing
the measuring instruments, sufficient resolution, careful
calibration, etc. have been observed; these measurements can
be made with a combined uncertainty of .03%. The error,
otherwise, results from the difference between the specified
Rc4 and the one actually used. A +.017. resistor is specified
by:the calibration laboratory. Available laboratory instruments
permit measurements to be made so that the specified value of
resistance can be matched within 0.1%.
The fractional uncertainty due to this factor is f.
e) Other Effects - The sketch below is used for reference:
SIMPLIFIED SIGNIAL CONDITIONER SClHEiiTIC
RB RSLLDL
C.FL L -- '-eo SYSTFM
R b
FIGURE (1)
o The leads which connect the load cell to the data system have
a resistance of approximately 0.5 ohm per single line or
conductor. The voltage applied to the bridge is then
(1 - 1/350) = .997 of the voltage measured by
H-7
MCDONNELL DOUGLAS ASTRONAUTICS COWPANY - EA#T
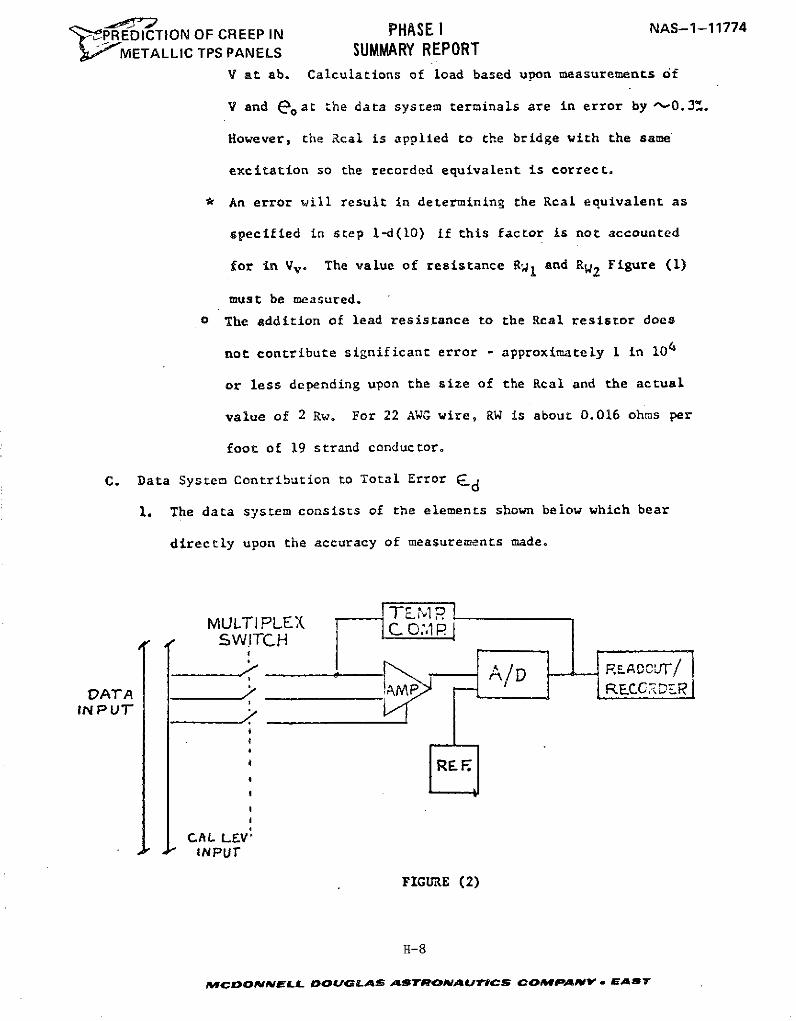
PREDICTION OF CREEP IN PHASE I NAS-1-11774
METALLIC TPS PANELS SUMMARY REPORT
V at ab. Calculations of load based upon measurements of
V and eoat the data system terminals are in error by "-0.3'.
However, the Rcal is applied to the bridge with the same
excitation so the recorded equivalent is correct.
* An error will result in determining the Rcal equivalent as
specified in step 1-d(10) if this factor is not accounted
for in Vv . The value of resistance RWI and Ry2 Figure (1)
must be measured.
o The addition of lead resistance to the Rcal resistor does
not contribute significant error - approximately 1 in 104
or less depending upon the size of the Rcal and the actual
value of 2 Rw. For 22 AWG wire, RW is about 0.016 ohms per
foot of 19 strand conductor.
C. Data System Contribution to Total Error Ed
1. The data system consists of the elements shown below which bear
directly upon the accuracy of measurements made.
MULTI PLEX I "E. 1SWITCH
:
VATA P._aCC__D
INPUT'
CAL LEVIINPUT
FIGURE (2)
H-8
AICOONNELL DOUGLAS ASTRONVAUTICS COMPAV * EAST
' PREDICTION OF CREEP IN PHASE I NAS-1-11774
METALLIC TPS PANELS SUMMARY REPORT2. The use of an Real equivalent for transducer inputs calibrates
the system-from transducer through data system-each rime a Zcal/Rcal
record is made. The data processing software uses this recorded
calibration signal for scaling. If the amplifier gain or zero
changes or an A/D conversion error due to a resistor change would
occur, the software will correct for that. However, if the internal
calibration reference level changes, a correction may be applied
which will be erroneous. The stability of the reference supply is,
therefore, a key parameter. er is the variation in the reference
voltage (Vr ). The fractional error fr
r e (14)
A more useful form is fr (counts equivalent to Vr). Measurements
indicate fr is less than .001.
3. If the amplifier is non-linear, this will result in an error related
to level of signal. This effect has been evaluated by measurements.
This error is designated fj. The magnitude of this factor is
.0005.
4. The data system direct measurement accuracy must be assigned to data
from thermocouples since no calibration level is used. This factor
is part of the evaluation, designatedEd.
Interims of Counts
q/100 (counts full scale) = (fr + ft) (counts full scale)
5. This analysis of the data system makes some assumptions.
a) That the thermal units of the input circuits are negligible.
b) That the digitizing error is constant.
c) That for typical applications and installations the effect
H-9
MeCDONNELL DOUOLAS AS TROIVAUJTICS COMPA yV m AST
'PREDICTION OF CREEP IN PHASE I NAS-1-11774METALLIC TPS PANELS SUMMARY REPORT
of temperature is negligible.
Bench tests indicate the effect of these factors to be negligible.
6. The following is a summary of the data obtained using the digital
system to measure reference inputs over a period of three months.
a) The stability of the reference - deviation is less that 0.1%
of full scale or fr (counts) = 2; fractional = .001.
b) Non-lin.!arity - 0.05% or 1 count. So ft (counts) = 1fractional = .0005D. Analysis Applied to Direct Voltage Inputs
1. The system can be analyzed as a voltmeter since the only
consideration is the direct measurement accuracy of the digital
data system which has been expressed in fractional form (fraction
of full scale) as:
fD = fr + fQ (in counts) = 3fractional = .0015
2. For thermocouples the error can be expressed in equivalent
temperature as
fD (mV f.S. - data system) = T(mV/F)T/C
T = 15 x 10- 6 v .68 =0.70F22 x 10"~v/o-
IV. Summary of the Analysis
A. Transducer Uncertainty
1. Equation - re-writing equation (9)
= eoe 8 t k )j VL(15)
the error ine s may be expressed as
es= (1 + fc) (16)
= s (1 + fh2:fnL.fs)
H-10
MCONNELL DOUGLAS ASTRONAUTICS COMPDAIVV .EAST
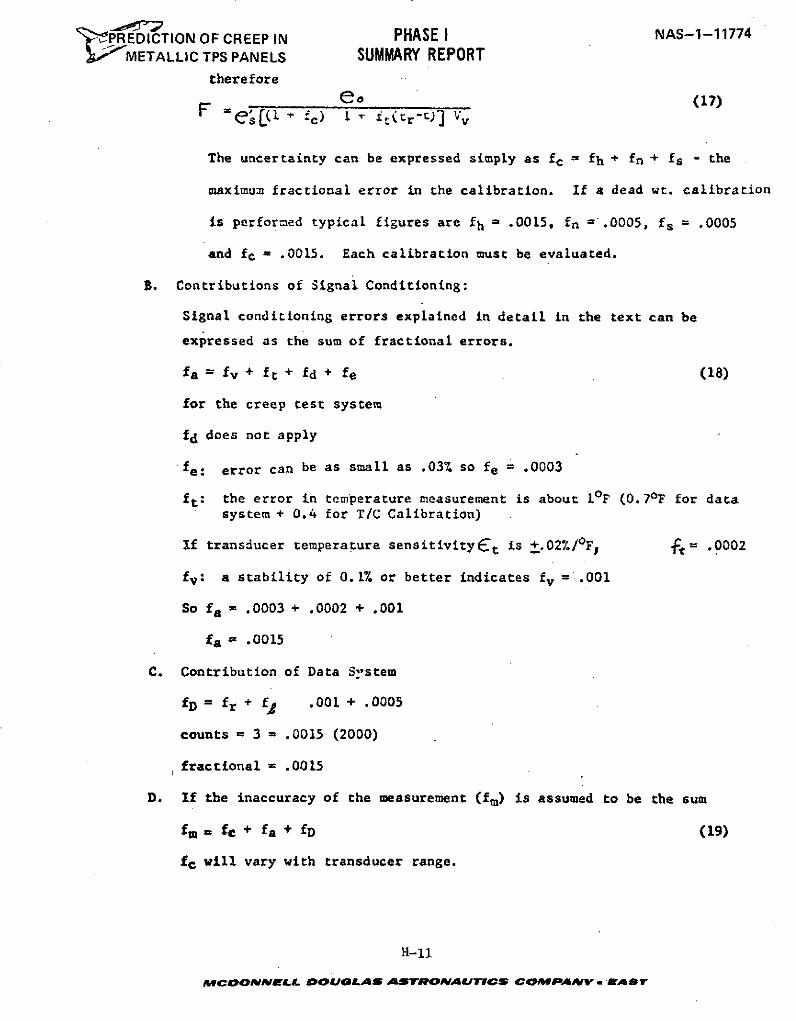
tPR EDICTION OF CREEP IN PHASE I NAS-1-11774
# METALLIC TPS PANELS SUMMARY REPORTtherefore
eb (17)
The uncertainty can be expressed simply as fc = fh + fn + fs - the
maximum fractional error in the calibration. If a dead wt. calibration
is performed typical figures are fh = .0015, fn = '.0005, fs = .0005
and fc - .0015. Each calibration must be evaluated.
B. Contributions of Signal Conditioning:
Signal conditioning errors explained in detail in the text can be
expressed as the sum of fractional errors.
fa = fv + ft + fd + fe (18)
for the creep test system
fd does not apply
fe: error can be as small as .03% so fe = .0003
ft: the error in temperature measurement is about 10F (0.70 F for datasystem + 0.4 for T/C Calibration)
If transducer temperature sensitivity t is +.02%/oF, f= .0002
fv: a stability of 0.1% or better indicates fv = .001
So fa = .0003 + .0002 + .001
fa = .0015
C. Contribution of Data Sstem
fD = fr + f2 .001 + .0005
counts = 3 = .0015 (2000)
fractional = .0015
D. If the inaccuracy of the measurement (fm) is assumed to be the sum
fm = fc + fa + fD (19)
fc will vary with transducer range.
H-11
MCDONNELL DOUGLAS ASTRONAUTICS COOMPANV - AT

PREDICTION OF CREEP IN PHASE I NAS-1-11774SMETALLIC TPS PANELS SUMMARY REPORT
If the example given for f. is used:
fm= fc + fa + fD
So.0015 + .0015 + .0015 = .0045
= 0.45%
H-12
MCDONNELL DOUGLAS ASTRONAUTICS COMPAY - WEAST

ICDONrVELL DOUGLAS ASTRONAUTICS COMPANY -EAST
Saint Louis, Missouri63166 (314) 232-0232
MCDONNELL CODOUGLA
CORPOATION
Related Documents