Page 1 of 25 Predefined Views in vRealize Operations Manager View Description Subject Metrics and Properties Transformation Time Range Cluster VM Growth Trend View Cluster VM Growth Trend View Cluster Compute Resource summary|total_number_vms None, Trend, Forecast 30 days Virtual Machine CPU Demand Distribution This view shows a bar chart of the last weeks peak demand. Virtual Machine cpu|demandPct Maximum 7 days VMs Min/Max/Avg IOPs 30 Days List View VMs Min/Max/Avg IOPs 30 Days List View Virtual Machine virtualDisk:Aggregate of all instances|commandsAveraged_average virtualDisk:Aggregate of all instances|commandsAveraged_average virtualDisk:Aggregate of all instances|commandsAveraged_average Maximum Minimum Average 30 days Cluster CPU Diagnose Show the last 24 hours of CPU Demand and Contention Cluster Compute Resource cpu|capacity_contentionPct cpu|demandPct None None 1 days Cluster Memory Usage and Demand (%) Trend View Cluster Memory Usage and Demand (%) Trend View Cluster Compute Resource mem|usage_average mem|demand|object.demand.percent mem|demand|workload None, Trend, Forecast None, Trend, Forecast None, Trend, Forecast 30 days Virtual Machine Properties List List of Virtual Machines with their properties. Virtual Machine summary|parentHost config|guestFullName summary|runtime|powerState summary|guest|fullName summary|guest|ipAddress summary|guest|toolsRunningStatus config|hardware|numCpu cpu|speed cpu|reservation cpu|limit config|hardware|memoryKB config|memoryAllocation|reservation config|memoryAllocation|limit config|hardware|diskSpace config|hardware|thinEnabled ‐ ‐ ‐ ‐ ‐ ‐ Last Last Last Last Last Last Last Last ‐ 1 weeks

Welcome message from author
This document is posted to help you gain knowledge. Please leave a comment to let me know what you think about it! Share it to your friends and learn new things together.
Transcript

Page 1 of 25
Predefined Views in vRealize Operations Manager View Description Subject Metrics and Properties Transformation Time Range Cluster VM Growth Trend View
Cluster VM Growth Trend View Cluster Compute Resource
summary|total_number_vms
None, Trend, Forecast
30 days
Virtual Machine CPU Demand Distribution
This view shows a bar chart of the last weeks peak demand.
Virtual Machine cpu|demandPct
Maximum
7 days
VMs Min/Max/Avg IOPs 30 Days List View
VMs Min/Max/Avg IOPs 30 Days List View Virtual Machine virtualDisk:Aggregate of all instances|commandsAveraged_average
virtualDisk:Aggregate of all instances|commandsAveraged_average
virtualDisk:Aggregate of all instances|commandsAveraged_average
Maximum
Minimum
Average
30 days
Cluster CPU Diagnose Show the last 24 hours of CPU Demand and Contention
Cluster Compute Resource
cpu|capacity_contentionPct
cpu|demandPct
None
None
1 days
Cluster Memory Usage and Demand (%) Trend View
Cluster Memory Usage and Demand (%) Trend View
Cluster Compute Resource
mem|usage_average
mem|demand|object.demand.percent
mem|demand|workload
None, Trend, Forecast
None, Trend, Forecast
None, Trend, Forecast
30 days
Virtual Machine Properties List
List of Virtual Machines with their properties.
Virtual Machine summary|parentHost
config|guestFullName
summary|runtime|powerState
summary|guest|fullName
summary|guest|ipAddress
summary|guest|toolsRunningStatus
config|hardware|numCpu
cpu|speed
cpu|reservation
cpu|limit
config|hardware|memoryKB
config|memoryAllocation|reservation
config|memoryAllocation|limit
config|hardware|diskSpace
config|hardware|thinEnabled
‐
‐
‐
‐
‐
‐
Last
Last
Last
Last
Last
Last
Last
Last
‐
1 weeks

Page 2 of 25
guestfilesystem|capacity_property_total
summary|config|numEthernetCards
Last
LastHost Disk Read IOps Forecast
Shows the last 12 weeks of data along with the next 30 days forecast.
Host System datastore|maxObserved_NumberRead
datastore|numberReadAveraged_average
datastore|number_read|object.capacity
datastore|number_read|object.demand
None, Forecast
None, Forecast
None, Forecast
None, Forecast
12 weeks
Virtual Machine Guest OS Name
Distribution of Virtual Machines by OS Name selected in the VM configuration
Virtual Machine config|guestFullName
‐
7 days
Virtual Machine Badge Analysis Forecast Trend
12 week history and 30 day forecast of selected Virtual Machine with analysis answers for Anomalies, Workload, Faults, Stress, Capacity Remaining and Reclaimable Capacity.
Virtual Machine badge|anomaly
badge|workload
badge|fault
badge|stress
badge|capacityRemaining
badge|waste
None, Forecast
None, Forecast
None, Forecast
None, Forecast
None, Forecast
None, Forecast
12 weeks
Virtual Machine Rightsizing CPU, Memory, and Disk Space
List of Virtual Machine Rightsizing CPU, Memory, and Disk Space. This list is filtered to only VMs that are oversized and are currently powered on.
Virtual Machine name
cpu|corecount_provisioned
cpu|size.recommendation
cpu|wasteValue
mem|guest_provisioned
mem|size.recommendation
mem|wasteValue
diskspace|provisionedSpace
diskspace|size.recommendation
diskspace‐waste|snapshot|wasteValue
summary|runtime|powerState
summary|idle
Last
Last
Last
Last
Last
Last
Last
Last
Last
Last
Last
Last
1 minutes
Host CPU Demand and Usage (%) Trend View
Host CPU Demand and Usage (%) Trend View
Host System cpu|demandPct
cpu|usage_average
None, Trend, Forecast
None
30 days
Virtual Machine Reclaimable Capacity
This is a list of compute resources that can be reclaimed for other VMs to use.
Virtual Machine cpu|wasteValue
mem|wasteValue
diskspace‐waste|wasteValue
diskspace‐waste|snapshot|wasteValue
summary|runtime|powerState
Last
Last
Last
Last
Last
7 days

Page 3 of 25
Alerts that are currently active
Show alerts for the selected object and its descendents that are currently active
Alert alertType
alertSubType
criticalityLevel
resourceName
objectType
alertTarget
alertImpact
creationDate
updateDate
duration
status
state
ownerId
‐
‐
‐
‐
‐
‐
‐
‐
‐
‐
‐
‐
‐
1 hours
Reclaimable Disk Space from Virtual Machines Powered Off for a significant time
Useful for reclaiming unused capacity. Virtual Machine cpu|object.capacity
mem|object.capacity
Last
Last
1 minutes
Cluster Disk Write MBps Forecast
Shows the last 12 weeks of data along with the next 30 days of forecast.
Cluster Compute Resource
datastore|maxObserved_Write
datastore|write_average
datastore|write|object.capacity
datastore|write|object.demand
None, Forecast
None, Forecast
None, Forecast
None, Forecast
12 weeks
Cluster CPU Demand Forecast Trend
Shows the last 12 weeks of data along with the next 30 days of forecast.
Cluster Compute Resource
cpu|capacity_provisioned
cpu|demand|object.capacity
cpu|demand|object.demand
cpu|demandmhz
None, Forecast
None, Forecast
None, Forecast
None, Forecast
12 weeks
Virtual Machine Disk I/O Demand Forecast Trend
Shows the last 12 weeks of data along with the next 30 days forecast.
Virtual Machine datastore|maxObserved_Read
datastore|maxObserved_Write
datastore|read_average
datastore|write_average
None, Forecast
None, Forecast
None, Forecast
None, Forecast
12 weeks
Virtual Machine Disk I/O IOps Diagnose
Show the last 24 hours of Disk I/O Read IOps and Disk I/O Write IOps compared to their estimated capacity for diagnosing Disk I/O performance.
Virtual Machine datastore|numberReadAveraged_average
datastore|numberWriteAveraged_average
datastore|maxObserved_NumberRead
datastore|maxObserved_NumberWrite
None
None
None
None
1 days
Resource Pool Memory Usage (%) Forecast Trend
Resource Pool Memory Usage (%) Forecast Trend
Resource Pool mem|usage_average
None, Trend, Forecast
30 days

Page 4 of 25
Cluster Disk Read MBps Forecast
Shows the last 12 weeks of data along with the next 30 days of forecast.
Cluster Compute Resource
datastore|maxObserved_Read
datastore|read_average
datastore|read|object.capacity
datastore|read|object.demand
None, Forecast
None, Forecast
None, Forecast
None, Forecast
12 weeks
Virtual Machine Workload Demand Summary List
A list of Virtual Machines and the resources they consumed in the last week. This list will help you find Virtual Machines with high workload requirements.
Virtual Machine cpu|demandPct
cpu|capacity_contentionPct
cpu|demandmhz
mem|object.demand.percent
mem|host_demand
datastore|workload
storage|demandKBps
net|workload
net|usage_average
guestfilesystem|percentage_total
guestfilesystem|freespace_total
summary|runtime|powerState
Average
Maximum
Average
Average
Average
Average
Average
Average
Average
Last
Last
Last
7 days
Virtual Machine Recommended CPU and Memory Size
List of stressed Virtual Machines that shows the current configuration compared to the recommended size.
Virtual Machine cpu|object.capacity
cpu|size.recommendation
mem|object.capacity
mem|size.recommendation
summary|runtime|powerState
Last
Last
Last
Last
Last
1 minutes
Datastore Inventory I/O List
Datastore Inventory I/O List. Datastore name
datastore|maxObserved_NumberRead
datastore|numberReadAveraged_average
datastore|maxObserved_NumberWrite
datastore|numberWriteAveraged_average
datastore|maxObserved_OIO
datastore|demand_oio
datastore|maxObserved_Read
datastore|read_average
datastore|maxObserved_Write
datastore|write_average
Last
Last
Average
Last
Average
Last
Average
Last
Average
Last
Average
7 days

Page 5 of 25
Virtual Machine Stress This is a list of Virtual Machines sorted by overall stress.
Virtual Machine badge|stress
cpu|stress
config|hardware|num_Cpu
cpu|size.recommendation
mem|stress
mem|guest_provisioned
mem|size.recommendation
datastore|stress
datastore|read|size.recommendation
datastore|write|size.recommendation
net|stress
net|usage|size.recommendation
summary|runtime|powerState
Last
Last
Last
Last
Last
Last
Last
Last
Last
Last
Last
Last
Last
7 days
VMs IOPs Distribution VMs IOPs Distribution Virtual Machine virtualDisk:Aggregate of all instances|commandsAveraged_average
Last
7 days
Cluster CPU Demand Distribution
This view shows a bar chart of the last weeks peak demand.
Cluster Compute Resource
cpu|demandPct
Maximum
7 days
Virtual Machine Disk I/O Diagnose List
List of Virtual Machines and various columns for Disk I/O problems.
Virtual Machine summary|parentHost
datastore|workload
datastore|stress
datastore|demand_oio
datastore|numberReadAveraged_average
datastore|numberWriteAveraged_average
datastore|read_average
datastore|write_average
mem|swapinRate_average
mem|swapoutRate_average
summary|runtime|powerState
‐
Average
Last
Average
Average
Average
Average
Average
Average
Average
Last
7 days
Host Badge Analysis Summary
A list of all the Hosts with analysis answers for Anomalies, Workload, Faults, Stress, Capacity Remaining, Time Remaining and Reclaimable Capacity.
Host System badge|anomaly
badge|workload
badge|fault
badge|capacityRemaining
badge|stress
badge|timeRemainingStandard
Last
Last
Last
Last
Last
Last
7 days

Page 6 of 25
badge|waste LastVirtual Machine Disk Read I/O Capacity Requirements Distribution
This view shows a pie chart of the latest estimated Disk Read I/O capacity requirements for a VM population.
Virtual Machine datastore|maxObserved_NumberRead
Last
1 days
Cluster Networking Usage (KBps) Trend View
Cluster Networking Usage (KBps) Trend View
Cluster Compute Resource
net|usage_average
None, Trend, Forecast
30 days
Virtual Machine CPU Diagnose
Show the last 24 hours of CPU Demand, IO Wait, Swap Wait, Ready, Co‐stop, and Idle for diagnosing CPU performance
Virtual Machine cpu|demandPct
cpu|iowaitPct
cpu|idlePct
cpu|swapwaitPct
cpu|costopPct
cpu|usage_average
cpu|readyPct
None
None
None
None
None
None
None
1 days
Virtual Machine Disk Write I/O Capacity Requirements Distribution
This view shows a pie chart of the latest estimated Disk Write I/O capacity requirements for a VM population.
Virtual Machine datastore|maxObserved_Write
Last
1 days
Cluster IOPs Trend View Cluster IOPs Trend View Cluster Compute Resource
disk|commandsAveraged_average
None, Trend, Forecast
30 days
Top Objects with Highest Average Workload in last 7 days
This is a list of all the objects in the system that have the highest average % workloads.
Cluster Compute Resource, Virtual Machine, Resource Pool, Host System, Datastore
System Properties|resource_kind_type
name
badge|workload
badge|workload
badge|workload
‐
‐
Last
Average
Maximum
7 days
Cluster Badge Analysis Summary
A list of all the Clusters with analysis answers for Anomalies, Workload, Faults, Stress, Capacity Remaining, Time Remaining and Reclaimable Capacity.
Cluster Compute Resource
badge|anomaly
badge|workload
badge|fault
badge|capacityRemaining
badge|stress
badge|timeRemainingStandard
badge|waste
Last
Last
Last
Last
Last
Last
Last
7 days
Virtual Machine Disk Write MBps Forecast
Shows the last 12 weeks of data along with the next 30 days forecast.
Virtual Machine datastore|maxObserved_Write
datastore|write_average
None, Forecast
None, Forecast
12 weeks
Cluster Disk I/O Outstanding IO Diagnose
Show the last 24 hours of Disk I/O outstanding IOs. Outstanding IO are disk requests waiting to be serviced. If your
Cluster Compute Resource
datastore|maxObserved_OIO
datastore|demand_oio
None
None
1 days

Page 7 of 25
OIOs exceed your queue depth, your disk subsystem is maxed out.
Virtual Machine Network Diagnose List
List of Virtual Machines and various columns for Network problems.
Virtual Machine summary|parentHost
net|stress
net|usage_average
net|maxObserved_Rx_KBps
net|bytesRx_average
net|maxObserved_Tx_KBps
net|bytesTx_average
net|transmitted_average
summary|runtime|powerState
Last
Last
Maximum
Last
Maximum
Maximum
Maximum
Maximum
Last
7 days
Cluster Disk I/O IOps Diagnose
Show the last 24 hours of Disk I/O Read IOps and Disk I/O Write IOps compared to their estimated capacity for diagnosing Disk I/O performance.
Cluster Compute Resource
datastore|numberReadAveraged_average
datastore|numberWriteAveraged_average
datastore|maxObserved_NumberRead
datastore|maxObserved_NumberWrite
None
None
None
None
1 days
VMs CPU Usage (%) Distribution
VMs CPU Usage (%) Distribution Virtual Machine cpu|usage_average
Average
30 days
Host Disk I/O IOps Diagnose
Show the last 24 hours of Disk I/O Read IOps and Disk I/O Write IOps compared to their estimated capacity for diagnosing Disk I/O performance.
Host System datastore|maxObserved_NumberRead
datastore|maxObserved_NumberWrite
datastore|numberReadAveraged_average
datastore|numberWriteAveraged_average
None
None
None
None
1 days
Cluster Disk Write I/O Capacity Requirements Distribution
This view shows a pie chart of the latest estimated Disk Write I/O capacity requirements for a Cluster population.
Cluster Compute Resource
datastore|maxObserved_Write
Last
1 days
VM Networking Usage (KBps) Trend View
VM Networking Usage (KBps) Trend View Virtual Machine net|usage_average
None, Trend, Forecast
30 days
Host Workload Trend Host Workload for the last 30 days. Good to use for showing how Stress uses historical peak loads.
Host System badge|workload
None
30 days
Datacenter Networking Usage (KBps) Trend View
Datacenter Networking Usage (KBps) Trend View
Datacenter net|usage_average
None, Trend, Forecast
30 days
Virtual Machine Disk Read IOps Forecast
Shows the last 12 weeks of data along with the next 30 days forecast.
Virtual Machine datastore|numberReadAveraged_average
datastore|maxObserved_NumberRead
datastore|number_read|object.capacity
datastore|number_read|object.demand
None, Forecast
None, Forecast
None, Forecast
None, Forecast
12 weeks

Page 8 of 25
Host Properties List of Hosts with their properties. Host System summary|hostuuid
summary|version
summary|tag
hardware|biosVersion
cpu|cpuModel
hardware|cpuInfo|numCpuCores
cpu|speed
config|hyperThread|active
config|hyperThread|available
config|network|nnic
config|ntp|server
name
Last
Last
Last
Last
Last
Last
Last
Last
Last
Last
Last
Last
7 days
Host Disk Write IOps Forecast
Shows the last 12 weeks of data along with the next 30 days forecast.
Host System datastore|numberWriteAveraged_average
datastore|maxObserved_NumberWrite
datastore|number_write|object.capacity
datastore|number_write|object.demand
None, Forecast
None, Forecast
None, Forecast
None, Forecast
12 weeks
Host Memory Diagnose List
List of Hosts and various columns for Memory problems.
Host System summary|parentCluster
mem|host_usable
mem|host_provisioned
mem|vmmemctl_average
mem|swapout_average
mem|host_usage
mem|host_demand
mem|heap_average
mem|compressed_average
mem|host_contentionPct
Last
Last
Average
Average
Average
Average
Average
Average
Average
Average
7 days
Host Network Diagnose List
List of Hosts and various columns for Network problems.
Host System summary|parentCluster
net|stress
net|usage_average
net|maxObserved_Rx_KBps
net|bytesRx_average
net|maxObserved_Tx_KBps
net|bytesTx_average
Last
Maximum
Maximum
Last
Maximum
Last
Maximum
7 days

Page 9 of 25
net:aggregate of all instances|packetsRxPerSec
net:aggregate of all instances|packetsTxPerSec
net|errorsRx_summation
net|errorsTx_summation
net:aggregate of all instances|droppedRx_summation
net:aggregate of all instances|droppedTx_summation
Maximum
Maximum
Maximum
Maximum
Maximum
Maximum
Symptoms This view provides a list of active symptoms for the selected object. It is useful for a dashboard that is focused on diagnosing problems that do not have an alert.
Symptom criticalityLevel
resourceName
objectType
createdOn
Last
Last
Last
Last
7 days
VMs Min/Max/Avg Network Usage (KBps) 30 Days List View
VMs Min/Max/Avg Network Usage (KBps) 30 Days List View
Virtual Machine net|usage_average
net|usage_average
net|usage_average
summary|runtime|powerState
Maximum
Minimum
Average
Last
30 days
Resource Pool CPU Configuration Distribution
This view shows a pie chart of all your resource pools and their approximate GHz of CPU capacity they support.
Resource Pool cpu|object.capacity
Last
1 days
Host CPU Diagnose List List of Hosts and various columns for CPU problems.
Host System cpu|demand|actual.capacity
cpu|corecount_provisioned
cpu|capacity_contentionPct
cpu|demandmhz
cpu|usagemhz_average
cpu|swapwait_summation
cpu|iowait
cpu|costop_summation
cpu|idle_summation
Last
Last
Maximum
Metric Correlation
Metric Correlation
Metric Correlation
Metric Correlation
Metric Correlation
Metric Correlation
7 days

Page 10 of 25
Cluster Badge Analysis History Trend
1 week history of selected Cluster with analysis values for Anomalies, Workload, Faults, Stress, Capacity Remaining and Reclaimable Capacity.
Cluster Compute Resource
badge|anomaly
badge|workload
badge|fault
badge|stress
badge|capacityRemaining
badge|waste
None
None
None
None
None
None
1 weeks
Cluster Disk I/O Demand Forecast Trend
Shows the last 12 weeks of data along with the next 30 days of forecast.
Cluster Compute Resource
datastore|workload
datastore|stress
None, Forecast
None, Forecast
12 weeks
Host Network I/O Trend Host Network I/O Trend Host System net|workload
None, Trend, Forecast
12 weeks
Cluster Disk I/O Latency Diagnose
Show the last 24 hours of Disk I/O Read Latency and Disk I/O Write Latency compared to their estimated capacity for diagnosing Disk I/O performance.
Cluster Compute Resource
disk|totalReadLatency_average
disk|totalWriteLatency_average
disk|totalLatency_average
None
None
None
1 days
Host Disk Space Demand Forecast Trend
Shows the last 12 weeks of data along with the next 30 days forecast.
Host System diskspace|total_provisioned
diskspace|total_capacity
diskspace|total_usage
diskspace|used
diskspace|snapshot
None, Forecast
None, Forecast
None, Forecast
None, Forecast
None, Forecast
12 weeks
Datastore Disk I/O Latency Diagnose
Show the last 24 hours of Disk I/O Read Latency and Disk I/O Write Latency compared to their estimated capacity for diagnosing Disk I/O performance.
Datastore datastore|maxObserved_ReadLatency
datastore|maxObserved_WriteLatency
datastore|totalReadLatency_average
datastore|totalWriteLatency_average
datastore|totalLatency_average
None
None
None
None
None
1 days
Cluster CPU Demand (%) Trend View
Cluster CPU Demand (%) Trend View Cluster Compute Resource
cpu|demandPct
None, Trend, Forecast
30 days
Datastore Disk Read I/O Capacity Requirements Distribution
This view shows a pie chart of the latest estimated Disk Read I/O capacity requirements for a Datastore population.
Datastore datastore|maxObserved_NumberRead
Last
1 days
Cluster Average Latency (ms) Trend View
Cluster Average Latency (ms) Trend View Cluster Compute Resource
disk|totalLatency_average
None, Trend, Forecast
30 days
Host Memory Usage (%) Distribution
Host Memory Usage (%) Distribution Host System mem|usage_average
Average
30 days

Page 11 of 25
Idle Virtual Machines List of idle Virtual Machines that are candidates for deleting to recover disk space and CPU and memory overhead.
Virtual Machine name
cpu|idletimepercent
net|usage|idletimepercent
datastore|oio|idletimepercent
diskspace|object.capacity
mem|consumed_average
Last
Last
Last
Last
‐
Last
1 minutes
Host Disk I/O Demand Forecast Trend
Shows the last 12 weeks of data along with the next 30 days forecast.
Host System datastore|workload
None, Trend, Forecast
12 weeks
Host Disk Space Usage Breakdown
Host Disk Space Usage Breakdown Host System diskspace|total_capacity
diskspace|total_provisioned
diskspace|total_usage
diskspace|used
diskspace|diskused
diskspace|snapshot
Last
Last
Last
Last
Last
Last
7 days
VM CPU Demand (%) Trend View
VM CPU Demand (%) Trend View Virtual Machine cpu|demandPct
None, Trend, Forecast
30 days
VMs Memory Usage (%) Distribution
VMs Memory Usage (%) Distribution Virtual Machine mem|usage_average
Average
30 days
Cluster CPU Configuration Distribution
This view shows a pie chart of the current distribution of configured CPU core count.
Cluster Compute Resource
cpu|corecount_provisioned
Last
1 days
Datacenter VM Growth Trend View
Datacenter VM Growth Trend View Datacenter summary|total_number_vms
None, Trend, Forecast
30 days
Virtual Machine CPU Demand Forecast Trend
Shows the last 12 weeks of data along with the next 30 days forecast.
Virtual Machine cpu|capacity_provisioned
cpu|object.capacity
cpu|object.demand
cpu|demandmhz
None, Forecast
None, Forecast
None, Forecast
None, Forecast
12 weeks
Virtual Machine Disk Space Demand Forecast Trend
Shows the last 12 weeks of data along with the next 30 days forecast.
Virtual Machine diskspace|provisionedSpace
guestfilesystem|usage_total
diskspace|used
None, Forecast
None, Forecast
None, Forecast
12 weeks
Virtual Machine Configuration Summary List View
Virtual Machine Configuration Summary List View.
Virtual Machine config|hardware|numCpu
config|hardware|memoryKB
config|hardware|diskSpace
summary|config|numEthernetCards
summary|runtime|powerState
Last
Last
Last
Last
Last
1 minutes
vCenter VM Growth Trend View
vCenter VM Growth Trend View vCenter Server summary|total_number_vms
None, Trend, Forecast
30 days

Page 12 of 25
Datastore Disk I/O Diagnose List
List of Datastores and various columns for Disk I/O problems.
Datastore datastore|workload
datastore|stress
datastore|demand_oio
datastore|numberReadAveraged_average
datastore|numberWriteAveraged_average
datastore|read_average
datastore|write_average
datastore|totalReadLatency_average
datastore|totalWriteLatency_average
Average
Last
Average
Average
Average
Average
Average
Average
Average
7 days
Virtual Machine Disk Write IOps Forecast
Shows the last 12 weeks of data along with the next 30 days forecast.
Virtual Machine datastore|numberWriteAveraged_average
datastore|maxObserved_NumberWrite
None, Forecast
None, Forecast
12 weeks
Host Disk I/O Diagnose List
List of Hosts and various columns for Disk I/O problems.
Host System datastore|workload
datastore|stress
datastore|demand_oio
datastore|numberReadAveraged_average
datastore|numberWriteAveraged_average
datastore|read_average
datastore|write_average
mem|swapinRate_average
mem|swapoutRate_average
Average
Last
Average
Average
Average
Average
Average
Average
Average
7 days
Datastore Used Space (%) Distribution
Datastore Used Space (%) Distribution Datastore diskspace|workload
Last
10 minutes
Virtual Machine Badge Analysis Summary
A list of all the Virtual Machines with analysis answers for Anomalies, Workload, Faults, Stress, Capacity Remaining, Time Remaining and Reclaimable Capacity.
Virtual Machine summary|parentHost
badge|anomaly
badge|workload
badge|fault
badge|capacityRemaining
badge|stress
badge|timeRemaining
badge|waste
summary|runtime|powerState
Last
Last
Last
Last
Last
Last
Last
Last
Last
7 days
Page 13 of 25
Virtual Machine Disk and Filesystem Usage List
List of VMs with all the disk space storage usage amounts.
Virtual Machine summary|guest|ipAddress
summary|parentHost
diskspace|provisionedSpace
diskspace|used
diskspace|diskused
diskspace|snapshot
guestfilesystem|percentage_total
guestfilesystem|capacity_total
guestfilesystem|usage_total
summary|runtime|powerState
Last
Last
Last
Last
Last
Last
Last
Last
Last
Last
1 days
Resource Pool CPU Demand Distribution
This view shows a bar chart of the last weeks peak demand.
Resource Pool cpu|object.demand.percent
Maximum
7 days
Datacenter CPU Usage (MHz) Trend View
Datacenter CPU Usage (MHz) Trend View Datacenter cpu|usagemhz_average
None, Trend, Forecast
30 days
Host Disk Read I/O Capacity Requirements Distribution
This view shows a pie chart of the latest estimated Disk Read I/O capacity requirements for a Host population.
Host System datastore|maxObserved_NumberRead
Last
1 days
Cluster Disk Space Usage Breakdown
Cluster Disk Space Usage Breakdown Cluster Compute Resource
diskspace|total_capacity
diskspace|total_provisioned
diskspace|total_usage
diskspace|used
diskspace|diskused
diskspace|snapshot
Last
Last
Last
Last
Last
Last
7 days
Cluster Disk I/O KBps Diagnose
Show the last 24 hours of Disk I/O Read KBps and Disk I/O Write KBps compared to their estimated capacity for diagnosing Disk I/O performance.
Cluster Compute Resource
datastore|maxObserved_Read
datastore|maxObserved_Write
datastore|read_average
datastore|write_average
None
None
None
None
1 days
Virtual Machine Network I/O Demand Forecast Trend
Shows the last 12 weeks of data along with the next 30 days forecast.
Virtual Machine net|workload
None, Trend, Forecast
12 weeks
Host Memory Demand vs. Capacity
This trend view shows the configured capacity, usable capacity, recommended size and the actual demand all on one chart.
Host System mem|host_provisioned
mem|host_usable
mem|demand|size.recommendation
mem|host_usage
mem|host_demand
mem|sharedcommon_average
None
None
None
None
None
None
24 hours

Page 14 of 25
mem|sysUsage_average
mem|vmmemctl_average
mem|swapused_average
mem|activewrite_average
None
None
None
NoneHost ESX Version Distribution of Hosts by ESX version
installed Host System summary|version
Last
7 days
Cluster Memory Diagnose List
List of Clusters and various columns for Memory problems.
Cluster Compute Resource
summary|parentDatacenter
mem|host_provisioned
mem|workload
mem|vmmemctl_average
mem|swapout_average
mem|host_usage
mem|host_demand
mem|heap_average
mem|compressed_average
mem|host_contention
Last
Last
Average
Average
Average
Average
Average
Average
Average
Average
7 days
Virtual Machine CPU Configuration Distribution
This view shows a bar chart of the current distribution of configured CPU core count.
Virtual Machine cpu|corecount_provisioned
Last
7 days
Datastore Disk I/O Demand Forecast Trend
Shows the last 12 weeks of data along with the next 30 days forecast.
Datastore datastore|workload
datastore|stress
None, Forecast
None, Forecast
12 weeks
Datastore Properties List of datastores with their properties. Datastore datastore|hostScsiDiskPartition
summary|diskCapacity
Last
Last
7 days
Virtual Machine Disk I/O KBps Diagnose
Show the last 24 hours of Disk I/O Read KBps and Disk I/O Write KBps compared to their estimated capacity for diagnosing Disk I/O performance.
Virtual Machine datastore|maxObserved_Read
datastore|maxObserved_Write
datastore|read_average
datastore|write_average
None
None
None
None
1 days
VM Inventory ‐ CPU VM Inventory ‐ CPU Virtual Machine name
summary|runtime|powerState
cpu|timeRemaining
cpu|capacityRemaining
cpu|vm_capacity_provisioned
cpu|capacity_contentionPct
cpu|demandPct
cpu|usage_average
‐
‐
Last
Last
Last
Last
Last
Last
1 minutes

Page 15 of 25
Datastore Badge Analysis Summary
A list of all the Datastores with analysis answers for Anomalies, Workload, Faults, Stress, Capacity Remaining, Time Remaining and Reclaimable Capacity.
Datastore badge|anomaly
badge|workload
badge|fault
badge|capacityRemaining
badge|stress
badge|timeRemainingStandard
badge|waste
Last
Last
Last
Last
Last
Last
Last
7 days
VM Memory Usage (%) Trend View
VM Memory Usage (%) Trend View Virtual Machine mem|usage_average
None, Trend, Forecast
7 days
Datastore Min/Max/Avg IOPs 30 Days List View
Datastore Min/Max/Avg IOPs 30 Days List View
Datastore devices:Aggregate of all instances|commandsAveraged_average
devices:Aggregate of all instances|commandsAveraged_average
devices:Aggregate of all instances|commandsAveraged_average
Maximum
Minimum
Average
30 days
Virtual Machine Inventory ‐ Disk Space
Virtual Machine Inventory ‐ Disk Space Virtual Machine name
diskspace|capacityRemaining
diskspace|timeRemaining
guestfilesystem|capacity_total
guestfilesystem|percentage_total
diskspace‐waste|snapshot|actual.capacity
summary|runtime|powerState
‐
Last
Last
Last
Last
Last
‐
1 minutes
Virtual Machine Memory Demand Distribution
This view shows a bar chart of the last weeks peak demand.
Virtual Machine mem|guest_demand
Maximum
7 days
Datastore IOPs Trend View
Datastore IOPs Trend View Datastore devices:Aggregate of all instances|commandsAveraged_average
None, Trend, Forecast
30 days
Datastore Space Usage Breakdown
Datastore Disk Space Usage Breakdown Datastore diskspace|capacity
diskspace|provisioned
diskspace|disktotal
diskspace|used
diskspace|diskused
diskspace|snapshot
diskspace|swap
diskspace|overhead
Last
Last
Last
Last
Last
Last
Last
Last
7 days

Page 16 of 25
Cluster CPU Diagnose List List of Clusters and various columns for CPU problems.
Cluster Compute Resource
cpu|capacity_provisioned
cpu|corecount_provisioned
cpu|capacity_contentionPct
cpu|demandmhz
cpu|usagemhz_average
cpu|overhead_average
cpu|wait
cpu|iowait
Last
Last
Maximum
Metric Correlation
Metric Correlation
Metric Correlation
Metric Correlation
Metric Correlation
7 days
Virtual Machine Disk Read MBps Forecast
Shows the last 12 weeks of data along with the next 30 days forecast.
Virtual Machine datastore|maxObserved_Read
datastore|read_average
datastore|read|object.capacity
datastore|read|object.demand
None, Forecast
None, Forecast
None, Forecast
None, Forecast
12 weeks
VM IOPs Trend View VM IOPs Trend View Virtual Machine virtualDisk:Aggregate of all instances|commandsAveraged_average
None, Trend, Forecast
30 days
Cluster Capacity Risk Forecast
Cluster Capacity Risk Forecast Cluster Compute Resource
summary|number_running_vms
summary|number_running_hosts
summary|capacityRemaining_min
summary|capacityRemaining_min
summary|capacityRemaining_min
Last
Last
Forecast
Forecast
Forecast
7 days
Datastore Average Latency (ms) Trend View
Datastore Average Latency (ms) Trend View
Datastore devices:Aggregate of all instances|totalLatency_average
None, Trend, Forecast
30 days
Virtual Machine Memory Demand Forecast Trend
Shows the last 12 weeks of data along with the next 30 days forecast.
Virtual Machine mem|guest_provisioned
mem|guest_demand
None, Forecast
None, Forecast
12 weeks
Virtual Machine Inventory ‐ Datastore I/O
Virtual Machine Inventory ‐ Datastore I/O Virtual Machine datastore|maxObserved_NumberRead
datastore|numberReadAveraged_average
datastore|maxObserved_NumberWrite
datastore|numberWriteAveraged_average
datastore|maxObserved_OIO
datastore|demand_oio
datastore|maxObserved_Read
Last
Average
Last
Average
Last
Average
Last
7 days

Page 17 of 25
datastore|read_average
datastore|maxObserved_Write
datastore|write_average
storage|totalReadLatency_average
storage|totalWriteLatency_average
summary|runtime|powerState
Average
Last
Average
Last
Last
Last Virtual Machine Memory Diagnose
Show the last 24 hours of Memory Demand, Consumed, Balloon, Swap, and Compressed
Virtual Machine mem|guest_provisioned
mem|size.recommendation
mem|guest_demand
mem|swapped_average
mem|vmmemctl_average
mem|compressed_average
mem|consumed_average
mem|shared_average
None
None
None
None
None
None
None
None
1 days
Host Memory Usage and Demand (%) Trend View
Host Memory Usage and Demand (%) Trend View
Host System mem|usage_average
mem|demand|workload
None, Trend, Forecast
None, Trend, Forecast
30 days
Datastore Badge Analysis History Trend
1 week of history for selected Datastore with analysis values for Anomalies, Workload, Faults, Stress, Capacity Remaining and Reclaimable Capacity.
Datastore badge|anomaly
badge|workload
badge|fault
badge|stress
badge|capacityRemaining
badge|waste
None
None
None
None
None
None
1 weeks
VMware Cluster CPU Demand Forecast Trend
VMware Cluster CPU Demand Forecast Trend
Cluster Compute Resource
cpu|capacity_provisioned
cpu|demandmhz
None, Trend, Forecast
None, Trend, Forecast
12 weeks
Resource Pool CPU Demand (MHz) Trend View
Resource Pool CPU Demand (MHz) Trend View
Resource Pool cpu|demandmhz
None, Trend, Forecast
30 days
Host Disk I/O Outstanding IO Diagnose
Show the last 24 hours of Disk I/O outstanding IOs. Outstanding IO are disk requests waiting to be serviced. If your OIOs exceed your queue depth, your disk subsystem is maxed out.
Host System datastore|maxObserved_OIO
datastore|demand_oio
None
None
1 days

Page 18 of 25
Cluster Disk I/O Diagnose List
List of Clusters and various columns for Disk I/O problems.
Cluster Compute Resource
datastore|workload
datastore|stress
datastore|demand_oio
datastore|numberReadAveraged_average
datastore|numberWriteAveraged_average
datastore|read_average
datastore|write_average
mem|swapinRate_average
mem|swapoutRate_average
Average
Last
Average
Average
Average
Average
Average
Average
Average
7 days
Datastore Disk Write I/O Capacity Requirements Distribution
This view shows a pie chart of the latest estimated Disk Write I/O capacity requirements for a Datastore population.
Datastore datastore|maxObserved_Write
Last
1 days
Cluster CPU Demand Forecast Trend
Shows the last 12 weeks of data along with the next 12 weeks.
Cluster Compute Resource
cpu|capacity_provisioned
cpu|demand|object.capacity
cpu|demand|object.demand
cpu|demandmhz
None, Forecast
None, Forecast
None, Forecast
None
12 weeks
Datastore Disk I/O Outstanding IO Diagnose
Show the last 24 hours of Disk I/O outstanding IOs. Outstanding IO are disk requests waiting to be serviced. If your OIOs exceed your queue depth, your disk subsystem is maxed out.
Datastore datastore|maxObserved_OIO
datastore|demand_oio
None
None
1 days
Host CPU Demand Forecast Trend
Shows the last 12 weeks of data along with the next 30 days forecast.
Host System cpu|capacity_provisioned
cpu|demand|object.capacity
cpu|demand|object.demand
cpu|demandmhz
None, Forecast
None, Forecast
None, Forecast
None, Forecast
12 weeks
Datastore Disk Read IOps Forecast
Shows the last 12 weeks of data along with the next 30 days forecast.
Datastore datastore|maxObserved_NumberRead
datastore|numberReadAveraged_average
datastore|number_read|object.demand
datastore|number_read|object.capacity
None, Forecast
None, Forecast
None, Forecast
None, Forecast
12 weeks
Virtual Machine Memory Configuration Distribution
This view shows a bar chart of the current distribution of configured memory size.
Virtual Machine mem|guest_provisioned
Last
7 days
Host CPU Demand Distribution
This view shows a bar chart of the last weeks peak demand.
Host System cpu|demandPct
Maximum
7 days
Datastore Disk I/O IOps Diagnose
Show the last 24 hours of Disk I/O Read IOps and Disk I/O Write IOps compared to their estimated capacity for diagnosing Disk I/O performance.
Datastore datastore|maxObserved_NumberRead
datastore|maxObserved_NumberWrite
datastore|numberReadAveraged_average
datastore|numberWriteAveraged_average
None
None
None
None
1 days

Page 19 of 25
Host CPU Capacity Analysis
Host CPU Capacity Analysis Host System cpu|demand|actual.capacity.normalized
cpu|demand|base.demand
cpu|usagemhz_average
None
None
None
7 days
Datastore Virtual Machine Growth Forecast
Datastore Virtual Machine Growth Forecast
Datastore summary|total_number_vms
summary|total_number_vms
summary|total_number_vms
summary|total_number_vms
Last
Forecast
Forecast
Forecast
7 days
Datastore Reclaimable Space List View
List of datastores highlighting space that can be recovered from Templates, Snapshots, and Idle VMs.
Datastore diskspace‐waste|wastePercent
diskspace|capacity
diskspace‐waste|wasteValue
diskspace‐waste|activeNotShared|wasteValue
diskspace‐waste|template|wasteValue
diskspace‐waste|snapshot|wasteValue
Last
Last
Last
Last
Last
Last
1 days
Datastore Disk Read MBps Forecast
Shows the last 12 weeks of data along with the next 30 days forecast.
Datastore datastore|maxObserved_Read
datastore|read_average
datastore|number_read|object.capacity
datastore|number_read|object.demand
None, Forecast
None, Forecast
None, Forecast
None, Forecast
12 weeks
Virtual Machine Memory Diagnose List
List of Virtual Machines and various columns for Memory problems.
Virtual Machine summary|parentHost
mem|guest_provisioned
mem|estimated_entitlement
mem|effective_limit
mem|size.recommendation
mem|host_contentionPct
cpu|swapwaitPct
mem|guest_demand
mem|consumed_average
mem|vmmemctl_average
mem|compressed_average
mem|shared_average
Last
Last
Last
Last
Last
Maximum
Metric Correlation
Metric Correlation
Metric Correlation
Metric Correlation
Metric Correlation
Metric Correlation
7 days

Page 20 of 25
mem|swapped_average
summary|runtime|powerState
Metric Correlation
Last VM Average Latency (ms) Trend View
VM Average Latency (ms) Trend View Virtual Machine virtualDisk:Aggregate of all instances|totalLatency
None, Trend, Forecast
30 days
vCenter Hosts Growth Trend View
vCenter Hosts Growth Trend View vCenter Server summary|total_number_hosts
None, Trend, Forecast
30 days
Datastore Configured Size Distribution
Distribution of Datastores by configured size
Datastore summary|diskCapacity
Last
7 days
Host CPU Diagnose Show the last 24 hours of CPU Demand, Usage and Contention for diagnosing CPU performance
Host System cpu|capacity_contentionPct
cpu|usage_average
cpu|demandPct
None
None
None
1 days
Host Disk Write I/O Capacity Requirements Distribution
This view shows a pie chart of the latest estimated Disk Write I/O capacity requirements for a Host population.
Host System datastore|maxObserved_Write
Last
1 days
Virtual Machine Disk I/O Outstanding IO Diagnose
Show the last 24 hours of Disk I/O outstanding IOs. Outstanding IO are disk requests waiting to be serviced. If your OIOs exceed your queue depth, your disk subsystem is maxed out.
Virtual Machine datastore|maxObserved_OIO
datastore|demand_oio
None
None
1 days
Cluster Disk Read I/O Capacity Requirements Distribution
This view shows a pie chart of the latest estimated Disk Read I/O capacity requirements for a Cluster population.
Cluster Compute Resource
datastore|maxObserved_NumberRead
Last
1 days
Host Disk Read MBps Forecast
Shows the last 12 weeks of data along with the next 30 days forecast.
Host System datastore|read_average
datastore|maxObserved_Read
datastore|read|object.capacity
datastore|read|object.demand
None, Forecast
None, Forecast
None, Forecast
None, Forecast
12 weeks
Host Disk I/O KBps Diagnose
Show the last 24 hours of Disk I/O Read KBps and Disk I/O Write KBps compared to their estimated capacity for diagnosing Disk I/O performance.
Host System datastore|maxObserved_Read
datastore|maxObserved_Write
datastore|write_average
datastore|read_average
None
None
None
None
1 days
Virtual Machine Network I/O Diagnose
Show the last 24 hours of Network Packets sent and received.
Virtual Machine net:Aggregate of all instances|packetsRxPerSec
net:Aggregate of all instances|packetsTxPerSec
None
None
1 days
Host CPU Configuration Distribution
This view shows a pie chart of the current distribution of configured CPU core count.
Host System cpu|corecount_provisioned
Last
1 days
Datastore Inventory ‐ Disk Space
Datastore Inventory ‐ Disk Space Datastore name
diskspace|total|timeRemaining
capacity|total_capacity
‐
Last
Last
7 days

Page 21 of 25
capacity|used_space
diskspace|provisioned
diskspace|overhead
capacity|contention
diskspace|template|used
Last
Last
Last
Last
LastVirtual Machine Disk I/O Latency Diagnose
Show the last 24 hours of Disk I/O Read Latency and Disk I/O Write Latency compared to their estimated capacity for diagnosing Disk I/O performance.
Virtual Machine datastore:Aggregate of all instances|totalReadLatency_average
datastore:Aggregate of all instances|totalWriteLatency_average
datastore:Aggregate of all instances|totalLatency_average
None
None
None
1 days
Datacenter Host Growth Trend View
Datacenter Host Growth Trend View Datacenter summary|total_number_hosts
None, Trend, Forecast
30 days
Virtual Machine Inventory ‐ Memory
Virtual Machine Inventory ‐ Memory Virtual Machine name
mem|timeRemaining
mem|capacityRemaining
mem|guest_provisioned
mem|host_contentionPct
mem|usage_average
summary|runtime|powerState
‐
Last
Last
Last
Last
Last
‐
1 minutes
Host Rightsizing CPU, Memory, and Disk Space
Host Rightsizing CPU, Memory, and Disk Space
Host System name
cpu|corecount_provisioned
cpu|demand|size.recommendation
cpu|demand|wasteValue
mem|host_provisioned
mem|demand‐waste|size.recommendation
mem|demand‐waste|wasteValue
diskspace|total_provisioned
diskspace|demand|size.recommendation
diskspace‐waste|wasteValue
‐
Last
Last
Last
Last
Last
Last
Last
Last
Last
7 days
Datastore Disk I/O KBps Diagnose
Show the last 24 hours of Disk I/O Read KBps and Disk I/O Write KBps compared to their estimated capacity for diagnosing Disk I/O performance.
Datastore datastore|maxObserved_Read
datastore|maxObserved_Write
datastore|read_average
datastore|write_average
None
None
None
None
1 days
Page 22 of 25
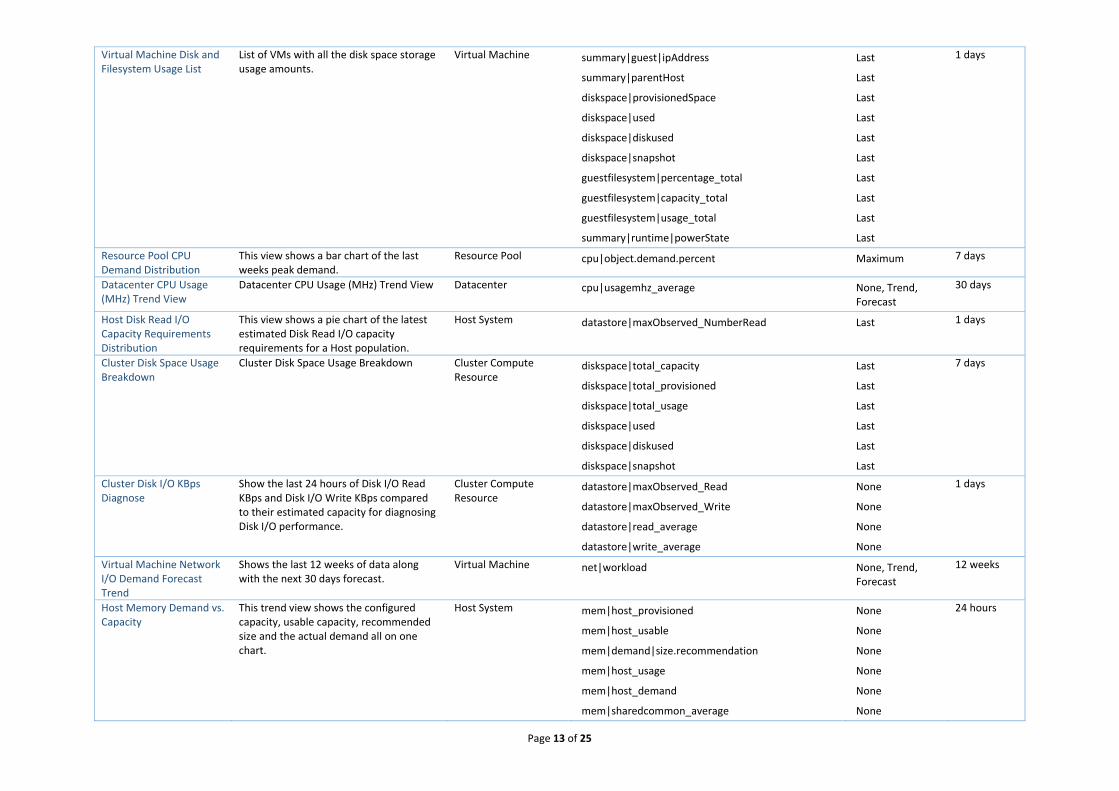
Cluster Disk Read IOps Forecast
Shows the last 12 weeks of data along with the next 30 days of forecast.
Cluster Compute Resource
datastore|maxObserved_NumberRead
datastore|numberReadAveraged_average
datastore|number_read|object.capacity
datastore|number_read|object.demand
None, Forecast
None, Forecast
None, Forecast
None, Forecast
12 weeks
Virtual Machine CPU Diagnose List
List of Virtual Machines and various columns for CPU problems.
Virtual Machine summary|parentHost
cpu|capacity_provisioned
cpu|corecount_provisioned
cpu|estimated_entitlement
cpu|effective_limit
cpu|capacity_contentionPct
cpu|swapwaitPct
cpu|demandmhz
cpu|usagemhz_average
cpu|swapwaitPct
cpu|iowaitPct
cpu|costopPct
cpu|idlePct
summary|runtime|powerState
‐
Last
Last
Last
Last
Maximum
Metric Correlation
Metric Correlation
Metric Correlation
Metric Correlation
Metric Correlation
Metric Correlation
Metric Correlation
Last
7 days
Host Disk I/O Latency Diagnose
Show the last 24 hours of Disk I/O Read Latency and Disk I/O Write Latency compared to their estimated capacity for diagnosing Disk I/O performance.
Host System datastore:Aggregate of all instances|totalLatency_average
datastore:Aggregate of all instances|totalReadLatency_average
datastore:Aggregate of all instances|totalWriteLatency_average
None
None
None
1 days
Cluster Configuration Summary
Cluster Configuration Summary Cluster Compute Resource
cpu|capacity_provisioned
mem|host_usable
configuration|dasConfig|enabled
configuration|dasConfig|admissionControlEnabled
configuration|drsConfig|enabled
Last
Last
Last
Last
Last
7 days

Page 23 of 25
configuration|drsConfig|defaultVmBehavior
summary|total_number_hosts
summary|total_number_vms
summary|total_number_datastores
summary|parentDatacenter
summary|parentVcenter
Last
Last
Last
Last
Last
LastHost Hardware Summary Host Hardware Summary Host System runtime|powerState
cpu|cpuModel
cpu|speed
hardware|cpuInfo|numCpuPackages
hardware|cpuInfo|numCpuCores
config|hyperThread|available
config|hyperThread|active
hardware|powerManagementTechnoloy
hardware|powerManagementPolicy
hardware|memorySize
config|network|nnic
hardware|biosVersion
Last
Last
Last
Last
Last
Last
Last
Last
Last
Last
Last
Last
7 days
Host Important Services Summary
Host Important Services Summary Host System config|security|service:SSH|isRunning
config|security|service:NTP Daemon|isRunning
config|security|ntpServer
config|security|service:ESXi Shell|isRunning
config|security|service:Direct Console UI|isRunning
summary|parentVcenter
summary|parentCluster
Last
Last
Last
Last
Last
Last
Last
7 days
Host Status Summary Host Status Summary Host System runtime|connectionState
runtime|maintenanceState
summary|version
summary|parentCluster
summary|parentVcenter
Last
Last
Last
Last
Last
7 days
Hosts in Maintenance Mode
Hosts in Maintenance Mode Host System runtime|maintenanceState
‐
7 days
Virtual Machine Configured OS Compared to the In‐Guest OS
Virtual Machine Configured OS Compared to the In‐Guest OS
Virtual Machine config|guestFullName
summary|guest|fullName
Last
Last
7 days

Page 24 of 25
summary|guest|ipAddress
summary|runtime|powerState
summary|parentCluster
Last
Last
LastVirtual Machine Hardware Summary
Virtual Machine Hardware Summary Virtual Machine summary|runtime|powerState
config|guestFullName
config|hardware|numCpu
cpu|limit
cpu|reservation
config|hardware|memoryKB
mem|host_limit
mem|host_reservation
config|hardware|diskSpace
config|hardware|thinEnabled
summary|config|numEthernetCards
summary|guest|ipAddress
summary|parentCluster
summary|parentVcenter
Last
Last
Last
Last
Last
Last
Last
Last
Last
Last
Last
Last
Last
Last
7 days
Virtual Machines Configured Memory Distribution
Virtual Machines Configured Memory Distribution
Virtual Machine config|hardware|memoryKB
Last
7 days
Virtual Machines Number of vCPUs Distribution
Virtual Machines Number of vCPUs Distribution
Virtual Machine config|hardware|numCpu
Last
7 days
Virtual machines OS Distribution
Virtual machines OS Distribution Virtual Machine summary|guest|fullName
‐
7 days
Virtual Machines Power State Distribution
Virtual Machines Power State Distribution Virtual Machine summary|runtime|powerState
‐
7 days
VMware Tools Status Distribution
VMware Tools Status Distribution Virtual Machine summary|guest|toolsRunningStatus
‐
7 days
VMware Tools Status Summary
VMware Tools Status Summary Virtual Machine summary|runtime|powerState
summary|guest|toolsVersionStatus2
summary|guest|toolsRunningStatus
config|guestFullName
summary|guest|ipAddress
summary|parentCluster
summary|parentVcenter
summary|runtime|powerState
‐
‐
‐
‐
‐
‐
‐
‐
7 days

Page 25 of 25
VMware Tools Version Distribution
VMware Tools Version Distribution Virtual Machine summary|guest|toolsVersionStatus2
‐
7 days
vSphere Cluster Admission Control Enabled
vSphere Cluster Admission Control Enabled
Cluster Compute Resource
configuration|dasConfig|admissionControlEnabled
‐
7 days
vSphere Cluster DPM Configuration
vSphere Cluster DPM Configuration Cluster Compute Resource
configuration|dpmConfiginfo|enabled
‐
7 days
vSphere Cluster DRS Configuration
vSphere Cluster DRS Configuration Cluster Compute Resource
configuration|drsConfig|enabled
‐
7 days
vSphere Cluster HA Status vSphere Cluster HA Status Cluster Compute Resource
configuration|dasConfig|enabled
‐
7 days
vSphere Host Connection State
vSphere Host Connection State Host System runtime|connectionState
‐
7 days
vSphere Host SSH Enabled
vSphere Host SSH Enabled Host System config|security|service:SSH|isRunning
‐
7 days
vSphere Host Version vSphere Host Version Host System summary|version ‐ 7 days
vSphere Hosts NTP Service Status
vSphere Hosts NTP Service Status Host System config|security|service:NTP Daemon|isRunning
‐
7 days
vSphere Hosts SSH Service Status
vSphere Hosts SSH Service Status Host System config|security|service:SSH|isRunning
‐
7 days
vSphere World VM Growth Trend View
vSphere World VM Growth Trend View vSphere World summary|total_number_vms
summary|number_running_vms
None, Forecast
None, Forecast
7 days
Related Documents