Special Issue | October 2014 171 BARC NEWSLETTER Founder’s Day PORE DIFFUSION CONTROLLED LEACHING MODEL INCORPORATING PARTICLE SIZE DISTRIBUTION: A CASE STUDY K. Anand Rao and T. Sreenivas Mineral Processing Division, BARC Hyderabad and A.K. Suri Bhabha Atomic Research Centre Abstract High rock permeability and liberation of uranium minerals in coarser sizes render leaching kinetics of medium to high grade (>0.2% U 3 O 8 ) uranium ores to be best described either by homogeneous or topochemical reaction models. But in case of low-grade uranium ores with very fine dissemination of uranium minerals, the rate controlling step is observed to be the process of diffusion of dissolved ions in liquid within pores of rock particles. In the present study, the experimental leaching data generated on a low grade uranium ore from Tummalapalle in Andhra Pradesh, India is described by a pore diffusion model integrating particle size distribution. The Tummalapalle ore contains 0.01% pitchblende as uranium mineral in intimate association with pyrite. The gangue minerals are 83% carbonates, 11.3% quartz, 0.47% pyrite. The diffusion of leachant phases like CO 3 -2 and O -2 inside the ore particles and the counter current diffusion of the reaction product uranyl carbonate anions is assumed to be the rate controlling step. The Effective diffusivity (Deff) in turn is a function of porosity and tortousity of the ground ore particles. Experiments included variation of partial pressure of oxygen from 4.5 kg/cm 2 to 6.5 kg/cm 2 , stirring speed between 573 rpm to 900 rpm, reaction temperature in the range 125 0 C to 165 0 C and average particle size from 25.8 µ to 34.76 µ. Gates-Gaudin-Schumann size distribution was incorporated into the kinetic model developed and the effective diffusivity was computed for different combinations of experimental conditions. The effective diffusivity was found to be in the range 0.61 cm 2 /s to 5.67 cm 2 /s. It is observed to be increasing with increase in partial pressure of oxygen, increase in stirring speed, increase in temperature and decrease in average particle size. Arrhenius plot of log(D eff ) Vs 1/T yielded activation energy of 3.27 kcal/mole, which qualifies the assumption of diffusion controlled mechanism. The calculated and experimental conversions of uranium with time were found to be in good agreement. Keywords: Pore diffusion model; Particle size distribution; Tummalapalle uranium ore; Alkaline leaching; Diffusivity This Paper received the Misra Award for paper presented at the IIME Mineral Processing Technology Seminar, held at Bhubaneswar, from Dec.10-12, 2013 Home NEXT PREVIOUS ê ê CONTENTS

Welcome message from author
This document is posted to help you gain knowledge. Please leave a comment to let me know what you think about it! Share it to your friends and learn new things together.
Transcript
Special Issue | October 2014 171
BARC NEWSLETTERFounder’s DayPORE DIFFUSION CONTROLLED LEACHING MODEL
INCORPORATING PARTICLE SIZE DISTRIBUTION: A CASE STUDY
K. Anand Rao and T. SreenivasMineral Processing Division, BARC Hyderabad
andA.K. Suri
Bhabha Atomic Research Centre
Abstract
High rock permeability and liberation of uranium minerals in coarser sizes render leaching kinetics of medium
to high grade (>0.2% U3O8) uranium ores to be best described either by homogeneous or topochemical
reaction models. But in case of low-grade uranium ores with very fine dissemination of uranium minerals,
the rate controlling step is observed to be the process of diffusion of dissolved ions in liquid within pores of
rock particles. In the present study, the experimental leaching data generated on a low grade uranium ore
from Tummalapalle in Andhra Pradesh, India is described by a pore diffusion model integrating particle size
distribution.
The Tummalapalle ore contains 0.01% pitchblende as uranium mineral in intimate association with pyrite.
The gangue minerals are 83% carbonates, 11.3% quartz, 0.47% pyrite. The diffusion of leachant phases like
CO3-2 and O-2 inside the ore particles and the counter current diffusion of the reaction product uranyl carbonate
anions is assumed to be the rate controlling step. The Effective diffusivity (Deff) in turn is a function of porosity
and tortousity of the ground ore particles. Experiments included variation of partial pressure of oxygen from
4.5 kg/cm2 to 6.5 kg/cm2, stirring speed between 573 rpm to 900 rpm, reaction temperature in the range
1250C to 1650C and average particle size from 25.8 µ to 34.76 µ. Gates-Gaudin-Schumann size distribution
was incorporated into the kinetic model developed and the effective diffusivity was computed for different
combinations of experimental conditions. The effective diffusivity was found to be in the range 0.61 cm2/s to
5.67 cm2/s. It is observed to be increasing with increase in partial pressure of oxygen, increase in stirring speed,
increase in temperature and decrease in average particle size. Arrhenius plot of log(Deff) Vs 1/T yielded activation
energy of 3.27 kcal/mole, which qualifies the assumption of diffusion controlled mechanism. The calculated and
experimental conversions of uranium with time were found to be in good agreement.
Keywords: Pore diffusion model; Particle size distribution; Tummalapalle uranium ore; Alkaline leaching;
Diffusivity
This Paper received the Misra Award for paper presented at the IIME Mineral Processing Technology Seminar, held at Bhubaneswar, from Dec.10-12, 2013
Home
NEXTPREVIOUS ê ê
CONTENTS
172 Special Issue | October 2014
BARC NEWSLETTERFounder’s DayIntroduction
The demand for uranium is on steady increase in
India in recent past due to setting-up of new nuclear
power plants in various parts of the country. These
requirements are planned to be met with a mix of
indigenous resources and imports (Anon 2012). An
outcome of this scenario is the expansion programmes
of the existing mills at Jaduguda and Turamdih in
Singhbhum and setting-up of the third uranium mill
at Tummalapalle in Andhra Pradesh based on alkaline
leaching technology. A kinetic model is developed to
describe the leaching behaviour of uranium from the
Tummalapalle ore. Results of this study are presented
in the paper.
Alkaline leaching of uranium ores involve oxidation of
uranium present in uraninite / pitchblende followed by
its dissolution in carbonate solution. The macroscopic
chemical reaction, combining both the above steps, is
given by Eq.(1) (Merrit, 1970).
[1]
The hydroxyl ion precipitates uranium back as
Na2U2O7 according to Eq.(2), if not neutralized by
sodium bicarbonate. The neutralization reaction is
given by Eq.(3) (Merrit, 1970)
[2]
[3]
The above chemical reactions during extraction of
uranium into fluid phase from ground ore particles are
controlled by various factors (1) degree of liberation
of uranium in the ore, grain size of uranium, porosity
of gangue as well as uranium minerals (2) type of
leachant (3) type of oxidant and (4) system properties
like temperature, pressure, stirring speed and type
of stirrer, leachant vessel. If uranium minerals are
fully liberated, the popular shrinking core model
mechanisms (1) mass transport through the boundary
layer fluid film surrounding each particle or (2) internal
surface chemical reaction are applicable. If the product
layer is porous, (3) core-shell (topochemical reaction
model) diffusion, is applicable. Usually, the uranium
minerals in the ground ore are fully / partially liberated
by grinding. In high grade ores, even if uranium is
partially liberated, the above mechanisms of shrinking
core model generally fit the kinetic data. This is due
to high rock permeability to the leachants (Barlett,
1971; Du Preez et al, 1981). But for low grade and
finely disseminated uranium ores like Tummalapalle
ore in Andhra Pradesh, no single mechanism of
shrinking core model was found to be applicable.
Earlier attempts to fit a shrinking core kinetic model
to the leaching data obtained on this ore resulted in a
mixed controlled model, initially chemical reaction and
later shell diffusion controlled (Anand Rao, 2010). This
could be due to low rock permeability of the rock. Low
permeability is evident from the low average specific
surface area (0.42 m2/g given in Table 1) and low pore
volume (0.002 cm3/g given in Table 1). Transport of
dissolved metal in liquid within pores of rock particles
is likely to be rate controlling step in overall extraction
process, especially for low grade ores (Roach et al,
1978). Counter current diffusion of uranyl anion
out of the particle with CO3-2 and O-2 ions of the
fluid phase diffusing into the particle is involved.
The diffusivity in turn is a function of porosity and
tortousity of the ground ore particles. Hence, a pore
diffusion rate controlling extraction kinetic model is
presented herein for the case of low grade uranium
ore from Tummalapalle, Andhra Pradesh, India.
Experimental
Materials
The low grade uranium ore from Tummalapalle, India
is phosphatic silicious dolomitic limestone containing
about 80% carbonates, 12% quartz, 1.2% pyrite as the
main gangue minerals and 0.01% pitchblende in intimate
association with pyrite. Due to high acid consuming
gangue, the alkaline reagent, mixture of Na2CO3 and
NaHCO3 dissolved in water, was used as leachant. Oxygen
gas under pressure was used as oxidant.

Special Issue | October 2014 173
BARC NEWSLETTERFounder’s DayA five litre capacity cylindrical shape autoclave made
of stainless steel is used for carrying out kinetic tests of
leaching. It is equipped with gas induction type hallow
shaft fitted with 50 mm diameter single stage turbine
type impeller, oxygen inlet pipe one end connected
to oxygen cylinder through pressure reducing valve,
cooling water coil, pressure sensor, rupture disk and
a solenoid valve which releases pressure whenever
exceeds the set point. Top lid of the vessel is coupled to
motor drive with a magnetic seal and provided with a
thermo well for thermocouple. Electrical heater along
with insulation is wrapped outside the cylindrical
vessel. Heater is connected to temperature indicator
and controller to maintain constant temperature.
Cooling water tank with pump is provided with auto
mechanism of starting the pump whenever there
is a rise in temperature due to exothermicity of the
reactions inside the vessel.
Method
The Tummalapalle uranium ore was crushed to -1/4”
size in a laboratory jaw crusher and then ground using
ball mill for three different time periods to prepare
different sized feed samples. The specific surface area
determined by BET method using CO2 adsorption and
the porosity determined by Mercury Porosimeter of the
ore sample (-1/4”) are given in Table 1.
Table 1: Characteristics of Tummalapalle ore
Surface area (m2/g) 0.42 Pore volume (cm3/g) 0.002 6 PoreVolume(c.c. / g) Poredia.(μ)= 0.03 Surface area(m2 / g)
In each leaching experiment, dry ground ore (1 kg)
and predetermined amount of tap water were placed
in the autoclave. Autoclave lid was then closed;
agitator started at low speed and heated up to
800 C, at which instance the reactor was pressurized
to arbitrarily chosen pressure of about 3 kg/cm2 using
oxygen. The contents were then continued to be
heated using electrical heater, which was set to the
desired temperature (>1000C). Incidental increase in
pressure of the reactor was observed, while heating
so. Required amounts of alkali reagents dissolved in
small amount of water were loaded into the autoclave
using positive displacement pump. The pressure of
the reactor was increased to the desired total pressure
using oxygen, the agitator motor was set to the desired
stirring speed and the clock time noted as starting
time of leaching experiment. Leaching continued for
6 hr. Slurry samples at time intervals of 1 hr, 2 hr, 4
hr and 6 hr were drawn, solids filtered out and the
leach liquors were analysed for their U3O8 content by
spectrophotometry. Solid samples at the end of 6 hr
were also analysed for their U3O8 content. The average
of back calculated feed values of U3O8 computed in all
the experiments was used in calculating experimental
conversion (αexp) with time in each leaching test.
The constant parameters and levels of the variable
parameters of present study, given in Table 2, were
fixed around the optimum values observed in previous
studies (Suri et al, 2010) on Tummalapalle ore.
Table 2 Constant and variable parameters of Tummalapalle ore leaching
Constant Parameter Value Pulp density 50% (by wt.)Na2CO3 50 kg/ton of oreNaHCO3 50 kg/ton of ore Variable Parameter LevelsPartial pressure of oxygen, 4.5, 5.5*, 6.5Po2 in kg/cm2 (absolute)Stirring speed, s in rpm 573, 764*, 900ParticleSize,dinμ 25.8*,32.36,34.76Temperature,TinK 398*,413,438
* The constant values used when the effect of other parameters was investigated
Pore diffusion rate controlled extraction model
The fraction of uranium extracted, α, from a single
spherical particle of radius Ri in time t, is given by
following Eq.(4) according to pore diffusion model
(Jost, 1960; Perry, 1950).
174 Special Issue | October 2014
BARC NEWSLETTERFounder’s Day
(4)
where K = 1,2,..... and Deff = Effective diffusivity which
can be described by Eq.(5).
(5)
where, ε = porosity and the τD = tortousity factor of
the ground ore particle and DAB = Diffusivity of solute
A in solvent B.
Incorporating particle size distribution into the pore diffusion model
Murhammer et al (1986) showed that the error
obtained by assuming uniform particle size distribution
(= average of minimum and maximum size) was less
than 5%, only if the ratio of maximum to minimum
particle size is less than 5 (Murhammer et al, 1986).
Gbor et al (2004) showed that if coefficient of
variation of particle size distribution following gamma
function is more than 0.3, shrinking core model
without considering particle size distribution would
lead to substantial errors. Hence, the size distribution
of ground ore particles is considered. Gates-Gaudin-
Schumann (GGS) relation, the most common
representation of particle size distribution, is given by
Eqs.(6) and (7) (Kelly and Spottiswood, 1982).
(6)
where y(Ri) is cumulative weight fraction finer than
size Ri and Rmax is size of largest particle. The fraction
of material, Δy(Ri), in size range between Ri and Ri-ΔRi
is obtained by differentiation of the above equation
(7)
Sum of weight fractions of discrete size intervals
between the smallest and largest size should be
constrained to 1.
(8)
The cumulative fraction extracted after an extraction
time period t is obtained by summation of products
of fraction extracted in each size Ri according to Eq.(4)
and the fraction of material in small interval size Ri and
Ri-ΔRi according to Eq.(7),
(9)
Fitting experimental data
The fractional conversion (αexp) was calculated
using the average back calculated feed assay, 737
ppm U3O8, obtained from residue assay and leach
liquor assay in each experiment and the leach liquor
concentration measured at different time intervals in
all the experiments.
where, C= Concentration of U3O8 in the leach liquor
at time t,g/L
V= Volume of leach liquor=0.9 L
W=weight of feed=1000 g
f=average %U3 O8 in the feed=0.0737
Sieve analysis data of three feed samples are fitted by
GGS distribution function according to Eq.(6) as shown
in Fig.1. The plots of all the three products yielded a
liner relation with high degree of correlation. From the
slope and intercept values of straight lines obtained in
Fig.1, the values of m and Rmax corresponding to three
different sized feed samples are tabulated in Table 3.

Special Issue | October 2014 175
BARC NEWSLETTERFounder’s Day
Eq.(9) can be solved for the only unknown Deff
for each set of leaching conditions. In order to fit
the experimental data to this model equation, a
computer program is written to find the effective
diffusion coefficient, Deff, in each experiment. Using
m and Rmax values of the feed sample used in each
experiment, the value of Δy(Ri) is computed according
to Eq.(7) for each Ri, using 600 values of Ri = Rmax/600
to Rmax with step size of Rmax/600, and stored. The
step size used was found to be lower enough to meet
the constraint stated as Eq.(8). For a value of t, for
which αexp is available, sum of the terms of infinite
series in Eq.(9) is approximated to a finite series sum
such that values of K ranged from 1 to k where k is
the least value of K whose term in the sum is less
than 0.0005 of the cumulative sum of all previous
terms. The omitted terms in the finite series make a
negligible contribution to the sum. For each value of
t, the cumulative conversion, α(t) was computed by
summing the product of α(t,Ri) and Δy(Ri) over all the
values of Ri (no. of Ri values being 600 as indicated
above). Value of Deff is calculated to minimize the
error given by
(11)
where αexp is the experimental value of fractional
conversion, αcal is the calculated value of fraction
reacted using Eq.(9), and Nm is the total number of
data, which is 4 in the present case, as αexp in each
kinetic experiment is available for four time periods of
leaching.
Fig. 1: Gates Gaudin Schuhmann plots of three feeds of Tummalapalle ore generated with different time periods of grinding
Rav Gates Gaudin Schumann distribution parameters (µ) m Rmax (µ) 12.4 0.46 54 16.2 0.56 79 17.4 0.62 83
Table 3: Particle size distribution parameters of Tummalapalle ore samples used in leaching experiments
176 Special Issue | October 2014
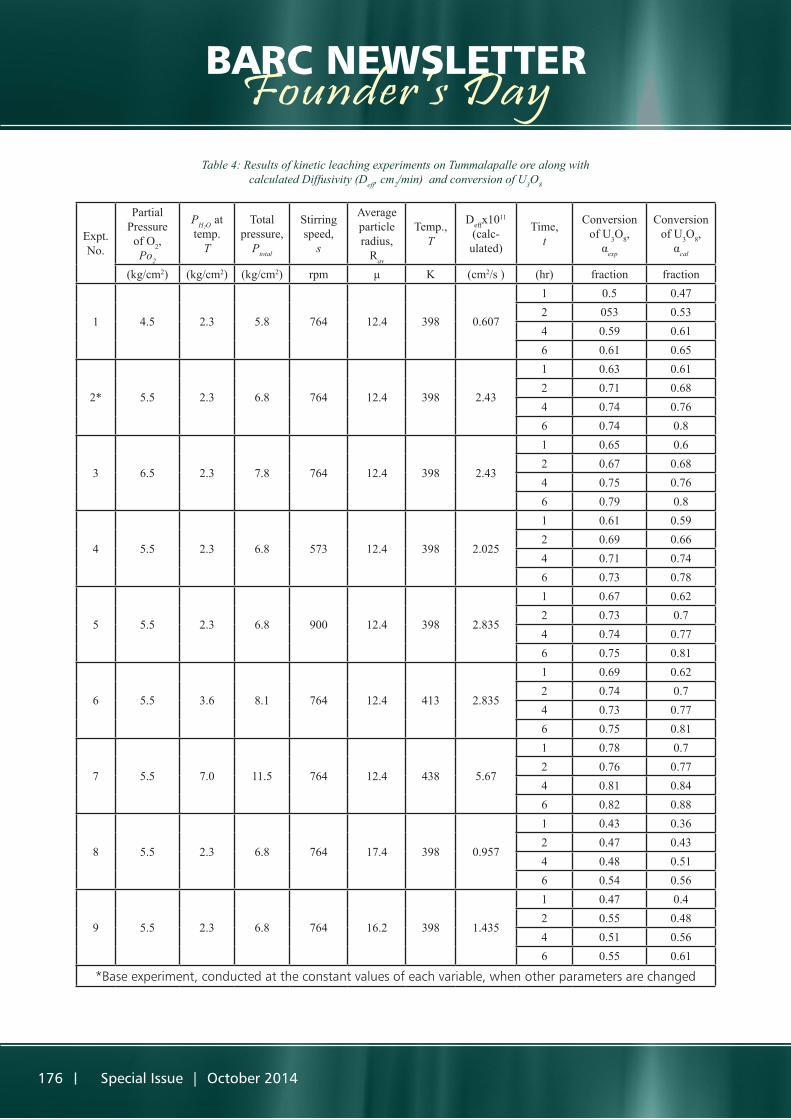
BARC NEWSLETTERFounder’s DayTable 4: Results of kinetic leaching experiments on Tummalapalle ore along with
calculated Diffusivity (Deff, cm2/min) and conversion of U3O8
Expt.No.
PartialPressure
of O2,Po2
PH2O attemp.
T
Totalpressure,
Ptotal
Stirringspeed,
s
Averageparticleradius,
Rav
Temp.,T
Deffx1011
(calc-ulated)
Time,t
Conversionof U3O8,αexp
Conversionof U3O8,αcal
(kg/cm2) (kg/cm2) (kg/cm2) rpm μ K (cm2/s ) (hr) fraction fraction
1 4.5 2.3 5.8 764 12.4 398 0.607
1 0.5 0.472 053 0.534 0.59 0.616 0.61 0.65
2* 5.5 2.3 6.8 764 12.4 398 2.43
1 0.63 0.612 0.71 0.684 0.74 0.766 0.74 0.8
3 6.5 2.3 7.8 764 12.4 398 2.43
1 0.65 0.62 0.67 0.684 0.75 0.766 0.79 0.8
4 5.5 2.3 6.8 573 12.4 398 2.025
1 0.61 0.592 0.69 0.664 0.71 0.746 0.73 0.78
5 5.5 2.3 6.8 900 12.4 398 2.835
1 0.67 0.622 0.73 0.74 0.74 0.776 0.75 0.81
6 5.5 3.6 8.1 764 12.4 413 2.835
1 0.69 0.622 0.74 0.74 0.73 0.776 0.75 0.81
7 5.5 7.0 11.5 764 12.4 438 5.67
1 0.78 0.72 0.76 0.774 0.81 0.846 0.82 0.88
8 5.5 2.3 6.8 764 17.4 398 0.957
1 0.43 0.362 0.47 0.434 0.48 0.516 0.54 0.56
9 5.5 2.3 6.8 764 16.2 398 1.435
1 0.47 0.42 0.55 0.484 0.51 0.566 0.55 0.61
*Base experiment, conducted at the constant values of each variable, when other parameters are changed
Special Issue | October 2014 177
BARC NEWSLETTERFounder’s DayResults and Discussion
The values of Deff computed using Eq.(11) and
corresponding values of αcal along with the set of
experimental conditions of each experiment are given
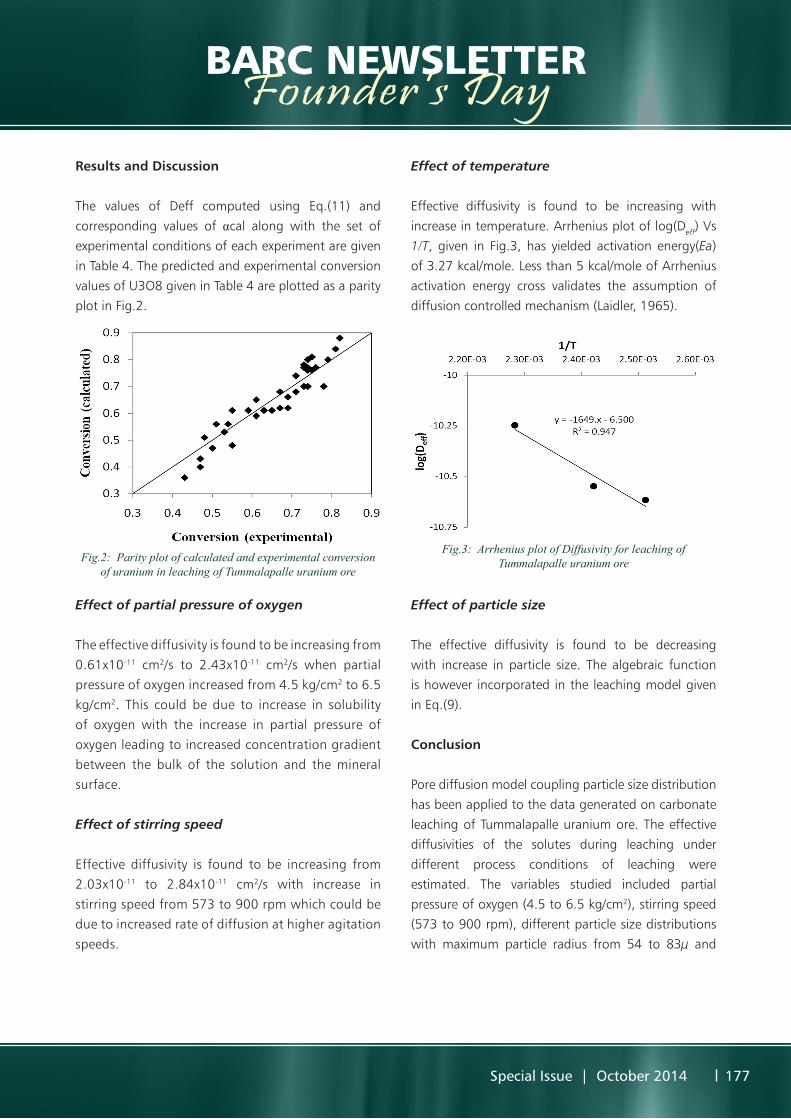
in Table 4. The predicted and experimental conversion
values of U3O8 given in Table 4 are plotted as a parity
plot in Fig.2.
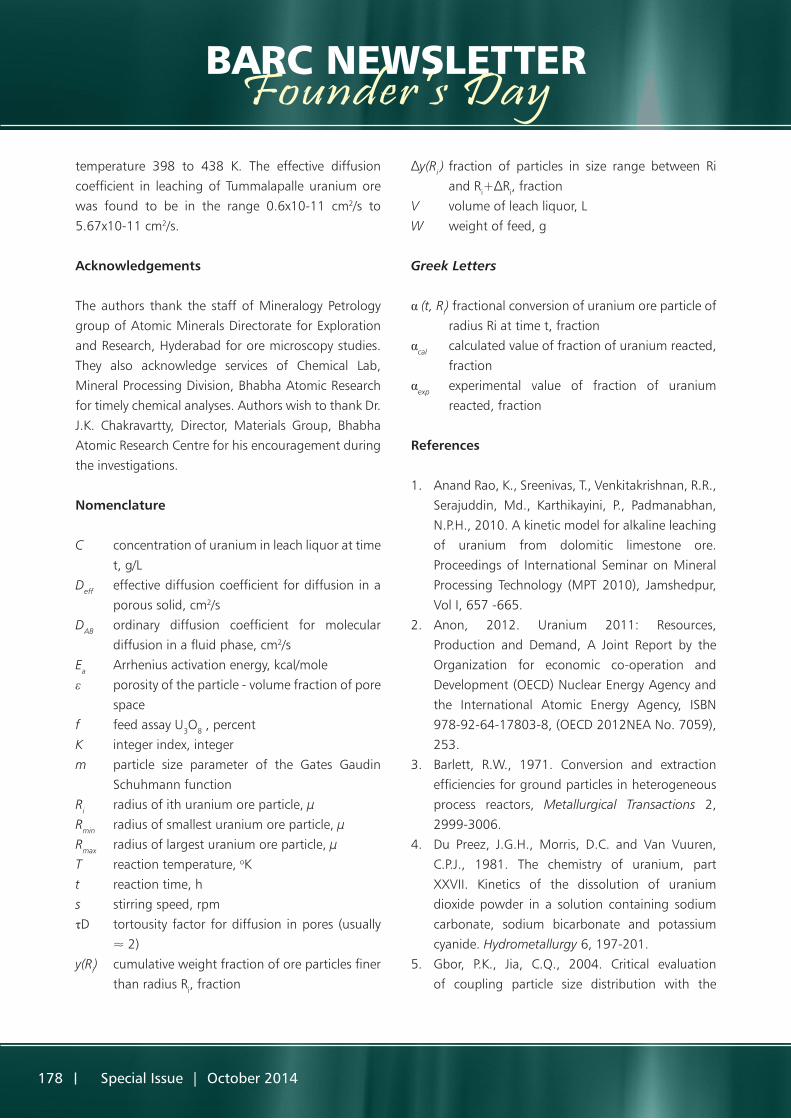
Effect of temperature
Effective diffusivity is found to be increasing with
increase in temperature. Arrhenius plot of log(Deff) Vs
1/T, given in Fig.3, has yielded activation energy(Ea)
of 3.27 kcal/mole. Less than 5 kcal/mole of Arrhenius
activation energy cross validates the assumption of
diffusion controlled mechanism (Laidler, 1965).
Fig.2: Parity plot of calculated and experimental conversion of uranium in leaching of Tummalapalle uranium ore
Effect of partial pressure of oxygen
The effective diffusivity is found to be increasing from
0.61x10⁻¹¹ cm2/s to 2.43x10⁻¹¹ cm2/s when partial
pressure of oxygen increased from 4.5 kg/cm2 to 6.5
kg/cm2. This could be due to increase in solubility
of oxygen with the increase in partial pressure of
oxygen leading to increased concentration gradient
between the bulk of the solution and the mineral
surface.
Effect of stirring speed
Effective diffusivity is found to be increasing from
2.03x10⁻¹¹ to 2.84x10⁻¹¹ cm2/s with increase in
stirring speed from 573 to 900 rpm which could be
due to increased rate of diffusion at higher agitation
speeds.
Fig.3: Arrhenius plot of Diffusivity for leaching of Tummalapalle uranium ore
Effect of particle size
The effective diffusivity is found to be decreasing
with increase in particle size. The algebraic function
is however incorporated in the leaching model given
in Eq.(9).
Conclusion
Pore diffusion model coupling particle size distribution
has been applied to the data generated on carbonate
leaching of Tummalapalle uranium ore. The effective
diffusivities of the solutes during leaching under
different process conditions of leaching were
estimated. The variables studied included partial
pressure of oxygen (4.5 to 6.5 kg/cm2), stirring speed
(573 to 900 rpm), different particle size distributions
with maximum particle radius from 54 to 83µ and
178 Special Issue | October 2014
BARC NEWSLETTERFounder’s Daytemperature 398 to 438 K. The effective diffusion
coefficient in leaching of Tummalapalle uranium ore
was found to be in the range 0.6x10⁻¹¹ cm2/s to
5.67x10⁻¹¹ cm2/s.
Acknowledgements
The authors thank the staff of Mineralogy Petrology
group of Atomic Minerals Directorate for Exploration
and Research, Hyderabad for ore microscopy studies.
They also acknowledge services of Chemical Lab,
Mineral Processing Division, Bhabha Atomic Research
for timely chemical analyses. Authors wish to thank Dr.
J.K. Chakravartty, Director, Materials Group, Bhabha
Atomic Research Centre for his encouragement during
the investigations.
Nomenclature
C concentration of uranium in leach liquor at time
t, g/L
Deff effective diffusion coefficient for diffusion in a
porous solid, cm2/s
DAB ordinary diffusion coefficient for molecular
diffusion in a fluid phase, cm2/s
Ea Arrhenius activation energy, kcal/mole
ε porosity of the particle - volume fraction of pore
space
f feed assay U3O8 , percent
K integer index, integer
m particle size parameter of the Gates Gaudin
Schuhmann function
Ri radius of ith uranium ore particle, µ
Rmin radius of smallest uranium ore particle, µ
Rmax radius of largest uranium ore particle, µ
T reaction temperature, oK
t reaction time, h
s stirring speed, rpm
τD tortousity factor for diffusion in pores (usually
≈ 2)
y(Ri) cumulative weight fraction of ore particles finer
than radius Ri, fraction
Δy(Ri ) fraction of particles in size range between Ri
and Ri+ΔRi, fraction
V volume of leach liquor, L
W weight of feed, g
Greek Letters
α (t, Ri) fractional conversion of uranium ore particle of
radius Ri at time t, fraction
αcal calculated value of fraction of uranium reacted,
fraction
αexp experimental value of fraction of uranium
reacted, fraction
References
1. Anand Rao, K., Sreenivas, T., Venkitakrishnan, R.R.,
Serajuddin, Md., Karthikayini, P., Padmanabhan,
N.P.H., 2010. A kinetic model for alkaline leaching
of uranium from dolomitic limestone ore.
Proceedings of International Seminar on Mineral
Processing Technology (MPT 2010), Jamshedpur,
Vol I, 657 -665.
2. Anon, 2012. Uranium 2011: Resources,
Production and Demand, A Joint Report by the
Organization for economic co-operation and
Development (OECD) Nuclear Energy Agency and
the International Atomic Energy Agency, ISBN
978-92-64-17803-8, (OECD 2012NEA No. 7059),
253.
3. Barlett, R.W., 1971. Conversion and extraction
efficiencies for ground particles in heterogeneous
process reactors, Metallurgical Transactions 2,
2999-3006.
4. Du Preez, J.G.H., Morris, D.C. and Van Vuuren,
C.P.J., 1981. The chemistry of uranium, part
XXVII. Kinetics of the dissolution of uranium
dioxide powder in a solution containing sodium
carbonate, sodium bicarbonate and potassium
cyanide. Hydrometallurgy 6, 197-201.
5. Gbor, P.K., Jia, C.Q., 2004. Critical evaluation
of coupling particle size distribution with the
Special Issue | October 2014 179
BARC NEWSLETTERFounder’s Dayshrinking core model, Chemical Engineering
Science 59, 1979-1987.
6. Jost, W., 1960. Diffusion in solids, liquids, gases,
Academic Press Inc., New York, 46.
7. Kelly,E,G., Spottiswood,D,J., 1982. Introduction to
Mineral Processing, John Wiley, 26.
8. Laidler, K.J., (1965), Chemical Kinetics, Second ed.,
McGraw-Hill Book Co., New York.
9. Merrit, C. Robert., 1970. The Extractive Metallurgy
of Uranium, Colorado School of Mines Research
Institute, Golden Colorado, United States Atomic
Energy Commission, Colorado.
10. Murhammer, D., Davis, D., Levenspiel, O., 1986,
Shrinking core model/reaction control for a wide
size distribution of solids, Chemical Engineering
Journal 32, 87-91.
11. Perry J.H., (1950), Chemical Engineers Handbook,
3rd edition, 1230 (1950).
12. Roach,G,I,D., Prosser,A,P., 1978. Prediction of
rates of chemical processes for treatment of low-
grade materials: theory and tests for mass transfer
controlled reactions, Institution of Mining and
Metallurgy, C129-C137.
13. Suri, A.K., Padmanabhan, N.P.H., Sreenivas, T.,
Anand Rao, K., Singh, A.K., Shenoy, K.T., Mishra,T.,
Ghosh, S.K., 2010. Process development studies
for low-grade uranium deposit in alkaline host
rocks of Tummalapalle, Proceedings of IAEA
Technical Meeting on low-grade uranium deposits
at Vienna.
Related Documents