Government of India Ministry of Agriculture Department of Agriculture & Cooperation Directorate of Economics & Statistics New Delhi Government of India Ministry of Agriculture Department of Agriculture & Cooperation Directorate of Economics & Statistics New Delhi

Welcome message from author
This document is posted to help you gain knowledge. Please leave a comment to let me know what you think about it! Share it to your friends and learn new things together.
Transcript

Government of IndiaMinistry of Agriculture
Department of Agriculture & CooperationDirectorate of Economics & Statistics
New Delhi
Government of IndiaMinistry of Agriculture
Department of Agriculture & CooperationDirectorate of Economics & Statistics
New Delhi

Pocket book of
AgriculturAlStAtiSticS
2014
Government of IndiaMinistry of Agriculture
Department of Agriculture & CooperationDirectorate of Economics & Statistics
New Delhi
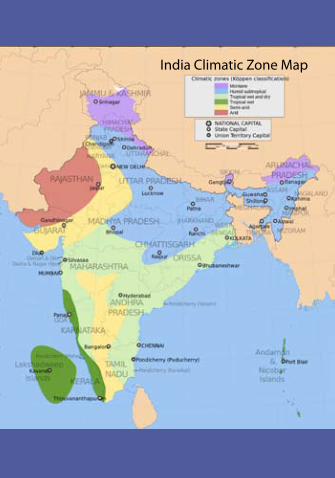
India Climatic Zone Map

vFkZ ,oa lkaf[;dh funs”kky;d`f’k ,oa lgdkfjrk foHkkxd`f’k ea=ky; Hkkjr ljdkj
d`f’k Hkou] ubZ fnYyh&110001Directorate of Economics & Statistics
Department of Agriculture & CooperationMinistry of Agriculture
Government of IndiaKrishi Bhawan, New Delhi-110001
Tele: 011-23384036, Telefax: 23382016Email: [email protected]
PREFACE
An abridged version of this Directorate’s authoritative, annual publication ‘Agricultural Statistics at a Glance’ was introduced in 2013 as quick reference guide for essential data frequently used by policy makers and related agencies. This was very well received and has, since then, become a regular feature.
In this edition of the ‘Pocket Book of Agriculture Statistics’, in addition to the key data from the latest edition of “At a Glance”, we have also added other useful data. These relate to “Key Indicators of Situation of Agricultural HouseHolds in India” from NSS 70th round, OECD-FAO Agricultural Outlook (2014-23) and other international aspects.
A copy of this publication has also been uploaded on our website http:/eands.dacnet.nic.in
Suggestions for improvement are most welcome.
(SANGEETA VERMA)Economic & Statistical Adviser
Directorate of Economics & Statistics
Date: 5th February 2015New Delhi
(SANGEETA VERMA)Economic & Statistical Adviser

STATISTICAL TABLESAcronyms xi1 Socio-Economic Indicators 11.1 Selected Economic and Social Indicators 21.2 Gross Domestic Product by Economic Activity at
Constant (2004-05) prices 51.3 Gross Domestic Product by Economic Activity at
Current Prices 61.4 Percentage share of major economic activities in Gross
Domestic Product (GDP) at Constant (2004-05) Prices 71.5 Percentage Growth of Gross Domestic Product (GDP)
at Constant (2004-05) Prices 8
2 Outlays, Expenditure & Capital Formation 92.1 Year-wise Expenditure by Departments under Ministry of
Agriculture 102.2 Public Sector Outlays/ Expenditure 112.3 Outlays/ Expenditure under Agriculture and allied Activities 122.4 Plan-wise share of Public Sector Outlays and Expenditure
under Agriculture and allied activities 132.5 Comparison of States Outlay and Expenditure for Eleventh
and Twelfth Plan 142.6 Expenditure on Agricultural Research and Education 162.7 Gross Capital Formation in Agriculture & Allied Sector
(Current and Constant prices) 172.8 Share of Public and Private Investment in Agriculture and
Allied Sectors in Total GDP at Market Prices (2004-05 prices) 17
Contents

vi | Pocket Book of Agricultural Statistics 2014 Contents | vii
2.9 Share of Gross Capital Formation in GDP of Agriculture & Allied Sectors (current prices) 18
2.10 Share of Gross Capital Formation in GDP of Agriculture & Allied Sectors (at 2004-05 prices) 18
3 Labour Force, Poverty & Unemployment 193.1 Population and Agricultural Workers 203.2 Population & Labour Force Projections 213.3(a)Population Below Poverty Line (Tendulkar Methodology) 213.3(b) Population Below Poverty Line (Rangarajan Methodology) 233.4 All India Rural & Urban Unemployment Rates (2011-12) (%) 24
4 Agricultural Land-use Statistics 254.1 Agricultural Land by use in India 264.2 Percentage Distribution of Gross Cropped Area 294.3 Changes in Share of Area under Major Crops 304.4 Average Size of Operational Holdings by Size Group 314.5 Performance of South West Monsoon (1 June- 30 September) 32
5 Area, Production and Yield of Principal Crops 335.1 Production of major Agricultural Crops 345.2 Three Largest Producing States of Important Crops during
2013-14 355.3 Area, Production and Yield of Foodgrains during 2012-13
and 2013-14 in major producing States alongwith coverage under Irrigation 37
5.4 Normal Area, Production and Yield of Major Crops in India (Average of 2008-09 to 2012-13) 38
5.5 Target and Achievement of Production of Major Crops from 2011-12 onwards 38
5.6 Production of Oilseeds/Oils and Net Domestic Availability of Edible Oils 39
5.7 Average Annual Growth Rates of Area, Production and Yield of major Crops (Base T.E 2007-08 = 100) 40
5.8 All India Crop-wise Irrigated Area (%) 41
vi | Pocket Book of Agricultural Statistics 2014 Contents | vii
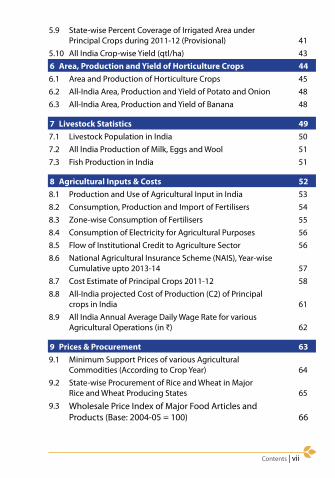
5.9 State-wise Percent Coverage of Irrigated Area under Principal Crops during 2011-12 (Provisional) 41
5.10 All India Crop-wise Yield (qtl/ha) 436 Area, Production and Yield of Horticulture Crops 446.1 Area and Production of Horticulture Crops 456.2 All-India Area, Production and Yield of Potato and Onion 486.3 All-India Area, Production and Yield of Banana 48
7 Livestock Statistics 497.1 Livestock Population in India 507.2 All India Production of Milk, Eggs and Wool 517.3 Fish Production in India 51
8 Agricultural Inputs & Costs 528.1 Production and Use of Agricultural Input in India 538.2 Consumption, Production and Import of Fertilisers 548.3 Zone-wise Consumption of Fertilisers 558.4 Consumption of Electricity for Agricultural Purposes 568.5 Flow of Institutional Credit to Agriculture Sector 568.6 National Agricultural Insurance Scheme (NAIS), Year-wise
Cumulative upto 2013-14 578.7 Cost Estimate of Principal Crops 2011-12 588.8 All-India projected Cost of Production (C2) of Principal
crops in India 618.9 All India Annual Average Daily Wage Rate for various
Agricultural Operations (in `) 62
9 Prices & Procurement 639.1 Minimum Support Prices of various Agricultural
Commodities (According to Crop Year) 649.2 State-wise Procurement of Rice and Wheat in Major
Rice and Wheat Producing States 659.3 Wholesale Price Index of Major Food Articles and
Products (Base: 2004-05 = 100) 66
viii | Pocket Book of Agricultural Statistics 2014 Contents | ix
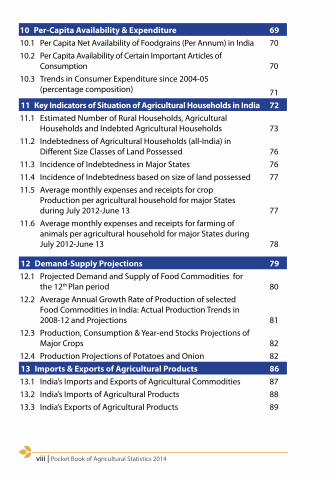
10 Per-Capita Availability & Expenditure 6910.1 Per Capita Net Availability of Foodgrains (Per Annum) in India 7010.2 Per Capita Availability of Certain Important Articles of
Consumption 7010.3 Trends in Consumer Expenditure since 2004-05
(percentage composition) 7111 Key Indicators of Situation of Agricultural Households in India 7211.1 Estimated Number of Rural Households, Agricultural
Households and Indebted Agricultural Households 7311.2 Indebtedness of Agricultural Households (all-India) in
Different Size Classes of Land Possessed 7611.3 Incidence of Indebtedness in Major States 7611.4 Incidence of Indebtedness based on size of land possessed 7711.5 Average monthly expenses and receipts for crop
Production per agricultural household for major States during July 2012-June 13 77
11.6 Average monthly expenses and receipts for farming of animals per agricultural household for major States during July 2012-June 13 78
12 Demand-Supply Projections 7912.1 Projected Demand and Supply of Food Commodities for
the 12th Plan period 8012.2 Average Annual Growth Rate of Production of selected
Food Commodities in India: Actual Production Trends in 2008-12 and Projections 81
12.3 Production, Consumption & Year-end Stocks Projections of Major Crops 82
12.4 Production Projections of Potatoes and Onion 8213 Imports & Exports of Agricultural Products 8613.1 India’s Imports and Exports of Agricultural Commodities 8713.2 India’s Imports of Agricultural Products 8813.3 India’s Exports of Agricultural Products 89

viii | Pocket Book of Agricultural Statistics 2014 Contents | ix
14 International Comparisons 9114.1 India’s Position in World Agriculture in 2012 9214.2 Global Comparison of Area, Production and Yield of Principal
Crops in 2012 9414.3 Major Macro-Economic Indicators of India, G-20 and the
World in 2012 9614.4 Major Macro Economic, Land-Use and Social Indicators of
BRICS Economies in 2012 9714.5 Major Economic and Land-Use Indicators: India and China 9914.6 Inflation, (Consumer prices) in Major Economies (Annual %) 100
15 Agricultural Emissions 102
CHARTSChart 1 (a) Percentage share of major economic activities in Gross
Domestic Product (GDP) at constant (2004-05) Prices 7Chart 1 (b) Growth of Agriculture and allied sector GDP and Overall
GDP at constant (2004-05) Prices 8Chart 4 (a) Agriculture Land by Use in India 28Chart 4 (b) Changes in Gross Cropped and Gross Irrigated Area 28Chart 4 (c) Changes in share of Area under Major Crops 31Chart 8 (a) Trends in Consumption, Production and Imports of
Fertilizers in India 55Chart 8 (b) Trends in Average Daily Wage Rate of Male & Female
Workers in Agricultural Operations 62Chart 9 (a) Comparison of Inflation from WPI and CPI 68Chart 9 (b) Trends in Inflation (WPI) of Food Products, Food
Articles and all Commodities 68Chart 11 (a) Distribution of Agricultural Households over
Social Groups 75Chart 11 (b) Percentage Distribution of Agricultural Households
by principal source of income 75Chart 12 (a) Projected Production of Rice, Wheat and Coarse
Grains in India 83

x | Pocket Book of Agricultural Statistics 2014
Chart 12 (b) Projected Production of Vegetables and Fruits in India 83Chart 12 (c) Projected Market Support Prices in India and World
Prices for Rice and Wheat 84Chart 12 (d)Projected Per capita Consumption of Cereals in India 84Chart 12 (e) Projected Calorie and Protein Consumption in India 85Chart 13 (a) Trends in Agricultural Imports/ Exports and share
out of Total National Imports/ Exports 87Chart 14 (a) Projected Wheat production in China and India 101Chart 14 (b)Projected Coarse Grains production in U.S, China
and India 101Chart 14 (c) Projected Oilseeds production in China, India and
Canada 101Chart 15 (a) All GHG Emission from Agriculture sector by major
Continents in 2012 (CO2 equivalent) 103Chart 15 (b) Total GHG Emissions from Agriculture Sector in Major
Countries in 2012 103
Appendices 104A.1 Explanatory Notes 105A.2 Conversion Factors between Important Primary and
Secondary Agricultural Commodities 106A.3 General Seed Rate of Sowing for Important Field Crops* 109A.4 Major Economic Groups/Institutions 110

x | Pocket Book of Agricultural Statistics 2014
Acronyms

xii | Pocket Book of Agricultural Statistics 2014 Acronyms | xiii
AAY Antyodaya Anna YojanaAE Advance EstimateAGDP Gross Domestic Product from AgricultureAPL Above Poverty LineBE Budget EstimatesBPL Below Poverty LineCACP Commission for Agricultural Costs and PricesCBB Commercial Bank BranchCCE Crop Cutting ExperimentsCCI Cotton Corporation of IndiaCDSBO Crude Degumed Soyabean OilCES Crop Estimation SurveysCFA Central Financial AgencyCIF Cost, Insurance & FreightCIP Central Issue PriceCPI-IW Consumer Price Index for Industrial WorkersCWWG Crop Weather Watch GroupDAC Department of Agriculture & CooperationDAP Di Ammonium Phosphate DES Directorate of Economics and StatisticsE EstimatedEARAS Establishment of an Agency for Reporting of
Agricultural StatisticsFAO Food and Agriculture Organisation of United NationsFAQ Fair Average QualityF2 Black SoilF-414/H-777/J-34 Cotton variety (of Medium Staple Length)H-4/H-6 Cotton variety (of Long Staple Length)FCI Food Corporation of IndiaFDI Foreign Direct InvestmentFFB Fresh Fruit BunchFOD Field Operations Division of NSSOFRL Full Reservoir LevelFYM Farm Yard Manure GCA Gross Cropped Area
xii | Pocket Book of Agricultural Statistics 2014 Acronyms | xiii
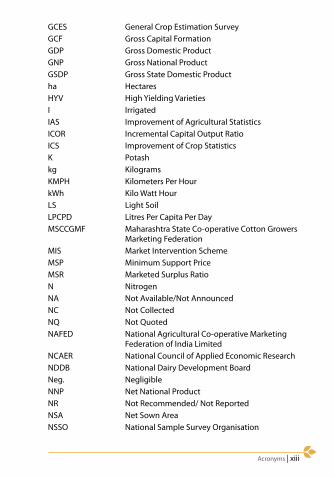
GCES General Crop Estimation SurveyGCF Gross Capital FormationGDP Gross Domestic ProductGNP Gross National ProductGSDP Gross State Domestic Productha HectaresHYV High Yielding VarietiesI Irrigated IAS Improvement of Agricultural StatisticsICOR Incremental Capital Output RatioICS Improvement of Crop StatisticsK Potashkg KilogramsKMPH Kilometers Per HourkWh Kilo Watt HourLS Light SoilLPCPD Litres Per Capita Per DayMSCCGMF Maharashtra State Co-operative Cotton Growers
Marketing FederationMIS Market Intervention SchemeMSP Minimum Support PriceMSR Marketed Surplus RatioN NitrogenNA Not Available/Not Announced NC Not CollectedNQ Not QuotedNAFED National Agricultural Co-operative Marketing
Federation of India LimitedNCAER National Council of Applied Economic ResearchNDDB National Dairy Development BoardNeg. NegligibleNNP Net National ProductNR Not Recommended/ Not Reported NSA Net Sown AreaNSSO National Sample Survey Organisation
xiv | Pocket Book of Agricultural Statistics 2014
OECD Organisation of Economic Cooperation and Development
OPDP Oil Palm Development ProgrammeP Provisional/ Phosphate PACS Primary Agricultural Credit SocietyPDS Public Distribution SystemPLDB Primary Land Development BankPSE Producers Support EstimatePSEs Public Sector EnterprisesPSS Price Support SchemeQE Quick Estimate R RevisedR&D Research & DevelopmentR&M Rapeseed & MustardRMC Regional Ministers ConferenceRE Revised EstimatesRRBB Regional Rural Bank BranchSCB State Cooperative BankSDP State Domestic ProductSASA State Agricultural Statistical AuthoritySLDB State Land Development BankSRS Sample Registration SchemeSSP Single Super Phosphate T TargetT E Triennium EndingTD-5 A Variety of JuteTPDS Targeted Public Distribution SystemTRQ Tariff Rate QuotaTRRM Tropical Rains Measuring MissionTT Tentative TargetsUI Un-irrigatedUT Union TerritoryWPI Wholesale Price IndexWTO World Trade OrganizationY Yield (Index Number of Yield) per hectare

xiv | Pocket Book of Agricultural Statistics 2014
1Socio-Economic
Indicators

2 | Pocket Book of Agricultural Statistics 2014 Socio-Economic Indicators | 3
Econ
omic
Indi
cato
rs19
50-5
119
90-9
120
00-0
120
10-1
120
11-1
220
12-1
320
13-1
4(1
)(2
)(3
)(4
)(5
)(6
)(7
) (8
)EC
ON
OM
IC IN
DIC
ATO
RSG
DP
at fa
ctor
cos
t:
(at c
urre
nt p
rices
in `
cro
re)
1003
653
1814
2000
743
7248
8603R
8391
6912R
9388
8761R
1047
2807
f
GD
P at
fact
or c
ost:
(at c
onst
ant p
rices
in
` c
rore
)27
9618
1347
889
2348
481
4918
5333R
5247
5302R
5482
1111R
5741
791f
Per c
apita
Net
Nat
iona
l Inc
ome
at
fact
or c
ost a
t con
stan
t pric
es in
`71
1414
330
2036
236
2023R
3804
82R38
8561R
3990
4f
Gro
ss D
omes
tic C
apita
l For
mat
ion
as
perc
enta
ge o
f GD
P (a
t cur
rent
mar
ket
pric
es)
9.3
26.0
24.4
36.5
3R35
.5 2R
34.8
1Rna
Gro
ss d
omes
tic s
avin
gs a
s pe
rcen
tage
of G
DP
(at c
urre
nt m
arke
t pr
ices
)
9.5
22.9
23.8
33.7
3R31
.32R
30.1
1Rna
Inde
x of
agr
icul
tura
l pro
duct
ion
[bas
e: T
rienn
ium
end
ing
1981
-82]
for
the
data
giv
en ti
ll 20
00-0
1 an
d ba
se
i.e. e
ndin
g 20
07-0
8 fr
om 2
009-
10
onw
ards
46.2
148.
416
5.7
121.
012
5.2
124.
212
8.92
r
Inde
x of
indu
stria
l pro
duct
ion
(Bas
e:
2004
-05=
100)
a7.
991
.616
2.6
165.
517
0.3
172.
217
2.1
Who
lesa
le P
rice
Inde
x av
erag
ec 6.
873
.715
5.7
143.
315
6.1
167.
617
7.6f
Cons
umer
Pric
e In
dex
for I
ndus
tria
l w
orke
rsd
1719
3.0
444.
018
0.0
195.
021
5.0
236.
0
Tabl
e 1.
1 S
elec
ted
Econ
omic
and
Soc
ial I
ndic
ator
s
Cont
d...

2 | Pocket Book of Agricultural Statistics 2014 Socio-Economic Indicators | 3
Econ
omic
Indi
cato
rs19
50-5
119
90-9
120
00-0
120
10-1
120
11-1
220
12-1
320
13-1
4(1
)(2
)(3
)(4
)(5
)(6
)(7
) (8
)OU
TPUT
(a) F
oodg
rain
s [m
illio
n to
nnes
]50
.817
6.4
196.
824
4.5
259.
325
7.1
264.
77e
(b) C
oal a
nd li
gnite
g [mill
ion
tonn
es]
32.3
225.
533
2.6
570.
458
2.3
602.
960
9.8
(c) C
rude
oil
[mill
ion
tonn
es]
0.3
33.0
32.4
37.7
38.1
37.9
f37
.8f
(d) E
lect
ricity
gen
erat
ed [u
tiliti
es
only
] [bi
llion
kW
h]5.
026
4.0
500
845.
092
3.0
907.
096
2.0
Plan
out
lay
(` c
rore
)26
0158
369
1857
3782
6268
9362
9211
0969
2 (R
E)13
7093
6 (B
E)FO
REIG
N TR
ADE
(i) E
xpor
ts (`
Cro
re)
606
3255
320
3571
1142
922
1465
959
1634
319
1894
182
(U
S $
mill
ion)
1269
1814
344
076
2511
3630
4624
3004
0131
2610
(ii) I
mpo
rts
(` C
rore
)60
843
198
2308
7316
8346
723
4546
326
6916
227
1418
2 (
US
$ m
illio
n)12
7324
075
4997
536
9769
4891
8149
0737
4500
68Fo
reig
n ex
chan
ge re
serv
esh
[exc
ludi
ng g
old,
SDRs
and
Rev
erse
Tr
anch
e Po
sitio
n at
IMF]
; (`
Cror
e)
911
4388
1844
8212
2488
313
3051
114
1263
116
6091
4
(U
S $
mill
ion)
1914
2236
3955
427
4330
2600
6925
9726
2763
59SO
CIAL
INDI
CATO
RSPo
pula
tion
(Mill
ion)
i36
1.0
846.
410
28.7
1186
.012
02.0
1217
.012
33.0
Birt
h Ra
te (p
er 1
000)
j39
.929
.525
.421
.821
.6b
nana
Dea
th R
ate
(per
100
0)j
27.4
9.8
8.4
7.1
7.0b
nana
Life
Exp
ecta
ncy
at B
irth
(in
Year
s)k
32.1
58.7
62.5
66.1
bna
nana
(a)
Mal
e32
.558
.661
.664
.6b
nana
na (
b) F
emal
e31
.759
.063
.367
.6b
nana
na Cont
d...

4 | Pocket Book of Agricultural Statistics 2014 Socio-Economic Indicators | 5
Econ
omic
Indi
cato
rs19
50-5
119
90-9
120
00-0
120
10-1
120
11-1
220
12-1
320
13-1
4(1
)(2
)(3
)(4
)(5
)(6
)(7
) (8
)Ed
ucat
ion:
Lite
racy
Rat
e (%
)l18
.352
.264
.874
.04
nana
na(a
) Mal
e27
.264
.175
.382
.14
nana
na(b
) Fem
ale
8.9
39.3
53.7
65.4
6na
nana
1R:
1st R
evis
ed E
stim
ates
, 2R:
2nd
Rev
ised
Est
imat
es, 3
R: 3
rd R
evis
ed, B
E: B
udge
t Est
imat
e, R
E: R
evis
ed E
stim
ate
na :
Not
ava
ilabl
e.a
The
Inde
x of
Indu
stria
l Pro
duct
ion
has
been
revi
sed
sinc
e 20
05-0
6 on
bas
e (2
004-
05=1
00).
The
figur
es fo
r the
yea
r 200
9-10
on
war
ds a
re b
ased
on
curr
ent s
erie
s (2
004-
05=1
00) a
nd e
arlie
r dat
a ar
e ba
sed
on o
ld b
ase
year
s.b
Abr
idge
d Li
fe T
able
200
6-10
, Reg
istr
ar G
ener
al o
f Ind
iac
The
figu
res
from
200
9-10
are
bas
ed o
n cu
rren
t ser
ies
2004
-05=
100
and
earli
er d
ata
are
base
d on
old
bas
e ye
ars.
d T
he fi
gure
s fr
om 2
009-
10 a
re b
ased
on
curr
ent s
erie
s 20
01=1
00 a
nd e
arlie
r dat
a ar
e ba
sed
on o
ld b
ase
year
s.e
4th Ad
vanc
e Es
timat
es.
f Pr
ovis
iona
l.g
Coal
out
put i
nclu
des
Meg
hala
ya C
oal f
rom
200
5-06
onw
ards
.h
As
on e
nd-M
arch
.i
Rela
te to
mid
-fina
ncia
l yea
r (as
on
Oct
ober
1) b
ased
on
popu
latio
n fig
ures
of C
.S.O
.j
For c
alen
dar y
ear.
Figu
re s
how
n ag
ains
t 199
0-91
is fo
r cal
enda
r yea
r 199
1 an
d so
on.
Sou
rce
: Offi
ce o
f R.G
.I.k
Dat
a fo
r 195
0-51
, 196
0-61
, 197
0-71
and
198
0-81
rela
te to
the
deca
des
1941
-50,
195
1-60
, 196
1-70
and
197
1-80
resp
ectiv
ely,
ce
nter
ed a
t mid
poin
ts o
f the
dec
ade,
i.e.
, 194
6, 1
956,
196
6 an
d 19
76. T
he e
stim
ates
for 1
990-
91 a
nd 1
991-
92 re
fer t
o th
e pe
riods
19
88-9
2 an
d 19
89-9
3 re
spec
tivel
y. T
he e
stim
ates
for 2
005-
06 re
fers
to th
e pe
riod
2001
-05.
The
est
imat
es fo
r 200
6-07
refe
rs to
the
perio
d 20
02-0
6.l
Dat
a fo
r 195
0-51
, 196
0-61
, 197
0-71
, 198
0-81
, 199
0-91
and
200
0-01
are
as
per C
ensu
s of
Indi
a 19
51,1
961,
197
1, 1
981,
199
1 an
d 20
01. T
he fi
gure
s fo
r 195
1 19
61 a
nd 1
971
rela
te to
pop
ulat
ion
aged
5 y
ears
and
abo
ve a
nd th
ose
for 1
981,
199
1 an
d 20
01 to
po
pula
tion
aged
7 y
ears
and
abov
e. A
ll In
dia
liter
acy
rate
s ex
clud
e A
ssam
for 1
981
and
J&K
for 1
991.
For
200
5-06
, dat
a is
bas
ed o
n N
atio
nal F
amily
Hea
lth S
urve
y (2
005-
06) (
+ 6
year
s).
2R:
2nd a
dvan
ce e
stim
ate.
Sour
ce: E
cono
mic
Sur
vey
2013
-14
and
CSO
.

4 | Pocket Book of Agricultural Statistics 2014 Socio-Economic Indicators | 5
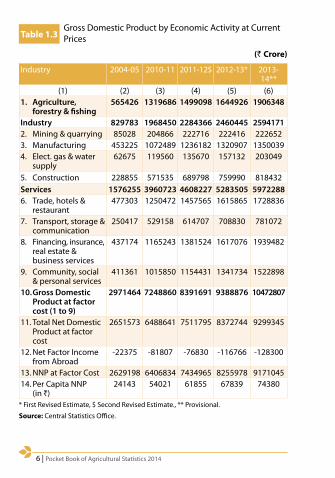
Industry 2004-05 2010-11 2011-12$ 2012-13 * 2013-14 **(1) (2) (3) (4) (5) (6)
1. Agriculture, forestry & fishing
565426 717814 753832 764510 800548
Industry 829783 1373339 1480657 1494921 15002252. Mining & quarrying 85028 110617 110725 108328 1068383. Manufacturing 453225 795152 854098 863876 8577054. Elect. gas & water
supply62675 92862 100646 102922 109018
5. Construction 228855 374708 415188 419795 426664Services 1576255 2827380 3013041 3222680 34410176. Trade, hotels &
restaurant477303 836352 846630 884308 892958
7. Transport, storage & communication
250417 507672 555631 589045 624868
8. Financing, insurance, real estate & business services
437174 849189 945534 1048748 1183714
9. Community, social & personal services
411361 634167 665246 700579 739477
10. Gross Domestic Product at factor cost (1 to 9)
2971464 4918533 5247530 5482111 5741790
11. Total Net Domestic Product at factor cost
2651573 4348233 4619695 4794228 4988116
12. Net Factor Income from Abroad
-22375 -54647 -46367 -65452 -67933
13. NNP at Factor Cost 2629198 4293586 4573328 4728776 492018314. Per Capita NNP
(in `)24143 36202 38048 38856 39904
* First Revised Estimate.
$ Second Revised Estimate.
** Provisional.
Source: Central Statistics Office.
Table 1.2
Gross Domestic Product by Economic Activity at Constant (2004-05) prices
(` Crore)
6 | Pocket Book of Agricultural Statistics 2014 Socio-Economic Indicators | 7
Industry 2004-05 2010-11 2011-12$ 2012-13* 2013-14**
(1) (2) (3) (4) (5) (6)1. Agriculture,
forestry & fishing565426 1319686 1499098 1644926 1906348
Industry 829783 1968450 2284366 2460445 25941712. Mining & quarrying 85028 204866 222716 222416 2226523. Manufacturing 453225 1072489 1236182 1320907 13500394. Elect. gas & water
supply62675 119560 135670 157132 203049
5. Construction 228855 571535 689798 759990 818432Services 1576255 3960723 4608227 5283505 59722886. Trade, hotels &
restaurant477303 1250472 1457565 1615865 1728836
7. Transport, storage & communication
250417 529158 614707 708830 781072
8. Financing, insurance, real estate & business services
437174 1165243 1381524 1617076 1939482
9. Community, social & personal services
411361 1015850 1154431 1341734 1522898
10. Gross Domestic Product at factor cost (1 to 9)
2971464 7248860 8391691 9388876 10472807
11. Total Net Domestic Product at factor cost
2651573 6488641 7511795 8372744 9299345
12. Net Factor Income from Abroad
-22375 -81807 -76830 -116766 -128300
13. NNP at Factor Cost 2629198 6406834 7434965 8255978 917104514. Per Capita NNP
(in `)24143 54021 61855 67839 74380
* First Revised Estimate, $ Second Revised Estimate., ** Provisional.
Source: Central Statistics Office.
Table 1.3
Gross Domestic Product by Economic Activity at Current Prices
(` Crore)

6 | Pocket Book of Agricultural Statistics 2014 Socio-Economic Indicators | 7
Industry 1950-51
1990-91
2000-01
2004-05
2010-11^
2011-12$
2012-13*
2013-14**
(1) (2) (3) (4) (5) (6) (7) (8) (9)I. Agriculture,
forestry & fishing
51.9 29.5 28.5 19.0 14.6 14.4 13.9 13.9
Agriculture 41.8 24.9 24.0 16.0 12.4 12.3 11.8 NA Forestry &
logging14.3 3.9 3.8 2.1 1.4 1.4 1.3 NA
Fishing 1.0 1.1 1.1 0.9 0.7 0.7 0.8 NAII. Industry 16.2 27.6 27.3 27.9 27.9 28.2 27.3 26.1 Mining &
quarrying1.8 3.5 3.0 2.9 2.2 2.1 2.0 1.9
Manufacturing 9.0 15.1 15.5 15.3 16.2 16.3 15.8 14.9 Elect. gas &
water supply0.3 2.0 2.2 2.1 1.9 1.9 1.9 1.9
Construction 5.1 7.1 6.6 7.7 7.6 7.9 7.7 7.4III. Services 31.9 42.5 43.9 53.0 57.5 57.4 58.8 59.9Gross Domestic Product at factor cost
100.0 100.0 100.0 100.0 100.0 100.0 100.0 100.0
NA: Not Available* First Revised Estimate, $ Second Revised Estimate, ^ Third Revised Estimates ** Provisional Estimates.Source: Central Statistics Office.
Chart 1(a) Percentage Share of major economic activities in Gross Domestic Product (GDP) at constant (2004-05) Prices
Source: Central Statistics Office.
51.929.5 28.5 19.0 14.6 14.4 13.9 13.9
16.2
27.6 27.327.9 27.9 28.2 27.3 26.1
31.942.5 43.9 53.0 57.5 57.4 58.8 59.9
0%10%20%30%40%50%60%70%80%90%
100%
1950-51 1990-91 2000-01 2004-05 2010-11 2011-12 2012-13 2013-14Agriculture & Allied sector Industry Services
Table 1.4 Percentage Share of major economic activities in Gross Domestic Product (GDP) at constant (2004-05) Prices
8 | Pocket Book of Agricultural Statistics 2014
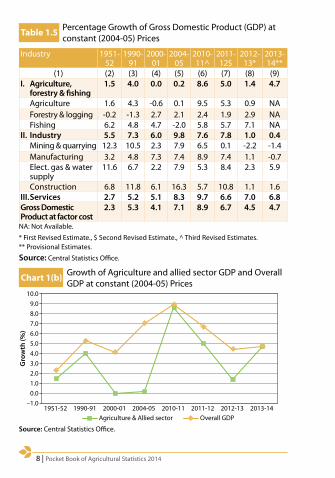
Industry 1951-52
1990-91
2000-01
2004-05
2010-11^
2011-12$
2012-13*
2013-14**
(1) (2) (3) (4) (5) (6) (7) (8) (9)I. Agriculture,
forestry & fishing1.5 4.0 0.0 0.2 8.6 5.0 1.4 4.7
Agriculture 1.6 4.3 -0.6 0.1 9.5 5.3 0.9 NA Forestry & logging -0.2 -1.3 2.7 2.1 2.4 1.9 2.9 NA Fishing 6.2 4.8 4.7 -2.0 5.8 5.7 7.1 NAII. Industry 5.5 7.3 6.0 9.8 7.6 7.8 1.0 0.4 Mining & quarrying 12.3 10.5 2.3 7.9 6.5 0.1 -2.2 -1.4 Manufacturing 3.2 4.8 7.3 7.4 8.9 7.4 1.1 -0.7 Elect. gas & water
supply11.6 6.7 2.2 7.9 5.3 8.4 2.3 5.9
Construction 6.8 11.8 6.1 16.3 5.7 10.8 1.1 1.6III. Services 2.7 5.2 5.1 8.3 9.7 6.6 7.0 6.8Gross Domestic Product at factor cost
2.3 5.3 4.1 7.1 8.9 6.7 4.5 4.7
NA: Not Available.
* First Revised Estimate., $ Second Revised Estimate., ^ Third Revised Estimates. ** Provisional Estimates.
Source: Central Statistics Office.
Source: Central Statistics Office.
0.01.02.03.04.05.06.07.08.09.0
10.0
Gro
wth
(%)
1951-52 1990-91 2000-01 2004-05 2010-11 2011-12 2012-13 2013-14–1.0
Agriculture & Allied sector Overall GDP
Table 1.5 Percentage Growth of Gross Domestic Product (GDP) at constant (2004-05) Prices
Chart 1(b) Growth of Agriculture and allied sector GDP and Overall GDP at constant (2004-05) Prices

8 | Pocket Book of Agricultural Statistics 2014
2Outlays, Expenditure
& Capital Formation

10 | Pocket Book of Agricultural Statistics 2014 Outlays, Expenditure & Capital Formation | 11
Tab
le 2
.1
Year
-wis
e Ex
pend
iture
by
Dep
artm
ents
und
er M
inis
try
of A
gric
ultu
re
(`Cr
ore)
Year
DAC
DA
RED
AH
D&
F
Budg
et
Estim
ate
Revi
sed
Estim
ate
Actu
al
Expe
nditu
re
Budg
et
Estim
ate
Revi
sed
Estim
ate
Actu
al
Expe
nditu
re
Budg
et
Estim
ate
Revi
sed
Estim
ate
Actu
al
Expe
nditu
re
(1)
(2)
(3)
(4)
(5)
(6)
(7)
(8)
(9)
(10)
1991
-92
1041
.35
1016
.93
957.
8619
0.00
180.
5117
3.07
--
-
2001
-02
1985
.00
1985
.00
1792
.92
684.
0055
0.00
683.
6930
0.00
240.
0023
9.68
2004
-05
2650
.00
-26
57.4
210
00.0
090
0.00
881.
8150
0.00
-56
6.22
2009
-10
1130
7.07
1096
5.23
1087
0.15
1833
.37
1821
.32
1821
.26
1100
.00
930.
0087
3.38
2010
-11
1504
2.00
1725
4.00
1705
2.59
2307
.50
2307
.50
2529
.29
1300
.00
1257
.00
1104
.68
2011
-12
1712
2.87
1651
5.05
1635
4.70
2808
.54
2858
.54
2831
.46
1600
.00
1356
.52
1243
.11
2012
-13
2020
8.00
1786
7.32
1776
5.24
3232
.00
2520
.00
2519
.09
1910
.00
1800
.00
1736
.88
2013
-14
2160
9.00
1900
0.00
1872
1.69
3415
.00
2600
.00
2599
.97
2025
.00
1800
.00
1748
.80
2014
-15
2230
9.00
1950
0.00
1253
9.88
*37
15.0
025
00.0
016
97.5
0*21
74.0
018
00.0
012
89.2
4**
* Ex
pend
iture
till
Nov
. 201
4.
** E
xpen
ditu
re ti
ll 10
.12.
2014
.
DAC
: D/o
Agr
icul
ture
& C
oope
ratio
n, D
ARE
: D/o
Agr
icul
tura
l Res
earc
h an
d Ed
ucat
ion.
DA
HD
&F:
D/o
Ani
mal
Hus
band
ry, D
airy
ing
& F
ishe
ries.
Sour
ce: M
inis
try
of A
gric
ultu
re.

10 | Pocket Book of Agricultural Statistics 2014 Outlays, Expenditure & Capital Formation | 11
Table 2.2 Public Sector Outlays/Expenditure
(`Crore)
Sector 2011-12 2012-13 2013-14 2014-15 12th Plan*
AE(#) BE RE(#) BE(#) BE(#) Outlays(1) (2) (3) (4) (5) (6) (7)
Agriculture and Allied Activities
16194 54748 15971 18781 11531 363273
Rural Development
37599 72248 35583 42772 3061 457464
Special Area Programmes
- 15342 - - - 80370
Irrigation & Flood Control
506 72169 428 1200 1797 422012
Energy 121855 208711 148230 158287 166275 1438466Industry & Minerals
36235 71491 39228 48010 40209 377302
Transport 107532 183015 103023 133488 116202 1204172Communi-cations
6586 15411 8257 12380 13009 80984
Science, Technology & Environment
11735 24220 12119 17587 18792 167350
General Economic Services
19697 51525 21017 31602 26318 305612
Social Services 145352 419267 166460 206709 79433 2664843General Services
5305 66040 5860 9307 7906 107959
Total 508596 1254187 556176 680123 484533 7669807
Notes: Totals may not tally due to rounding off of the figures. * 12th Plan Projection. # For Centre only, as figures for States & UTs are not available.
Source: Plan Documents and Budget Documents. For State Outlays, States Plans Division, Planning Commission.

12 | Pocket Book of Agricultural Statistics 2014 Outlays, Expenditure & Capital Formation | 13
Table 2.3 Outlays/Expenditure under Agriculture and allied Activities
(`Crore)Sector 2011-12 2012-13 2013-14 2014-15
AE(#) BE RE(#) BE BE(1) (2) (3) (4) (5) (6)
Crop Husbandry 8066 9034 8071 9876 4432Horticulture NA NA NA NA NASoil & Water Conservation
15 16 16 19 18
Animal Husbandry
724 1063 849 975 172
Dairy Development
196 353 494 525 411
Fisheries 304 299 273 317 423Forestry & Wild Life
914 907 755 1041 379
Plantation 595 446 404 458 370Food Storage & Warehousing
703 787 726 801 727
Agriculture, Research & Edn.
2573 2898 2294 3113 3354
Agricultural Financial Inst.
NA NA NA NA NA
Cooperation 124 125 93 121 125Other Agricultural Programmes
1980 1764 1996 1535 1120
Total 16194 17692 15971 18781 11531
Notes: Totals may not tally due to rounding off of the figures. NA - Not Available, BE - Budget Estimates, RE - Revised Estimates. # For Centre only, as figures for States & UTs are not available.
Source: Plan Documents and Budget Documents. For State Outlays, States Plans Division, Planning Commission.

12 | Pocket Book of Agricultural Statistics 2014 Outlays, Expenditure & Capital Formation | 13
Table 2.4 Plan-wise share of Public Sector Outlays and Expenditure under Agriculture and allied Activities
(`Crore)Five Year Plan/Annual Plan
Percentage share of Agriculture and AlliedActivities to Total
Plan Outlays Actual Expenditure(1) (2) (3)
Ninth Plan (1997-2002) 4.4 4.0Tenth Plan (2002-07) 3.9 3.8Eleventh Plan (2007-12) 3.7 4.4Annual Plan (2007-08) 3.2 5.4Annual Plan (2008-09) 4.0 5.7Annual Plan (2009-10) 3.6 4.1Annual Plan (2010-11) 4.0 4.9Annual Plan (2011-12) 4.2 3.2Twelfth Plan (2012-17)* 4.7 NAAnnual Plan (2012-13) 4.4 2.9Annual Plan (2013-14)# 2.8 NAAnnual Plan (2014-15) 2.4 NA
NA: Not Available
Note: From Annual Plan (2009-10) the Centre Expenditure figures include IEBR. # For Centre only, as figures for States & UTs are not available yet. * 12th Plan Projections.
Source: 1st Plan Documents and Budget Documents. For State Outlays, States Plans Division, Planning Commission.

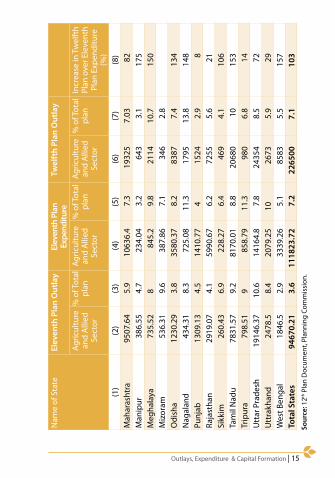
14 | Pocket Book of Agricultural Statistics 2014 Outlays, Expenditure & Capital Formation | 15
Tab
le 2
.5
Com
paris
on o
f Sta
tes
Out
lay
and
Expe
nditu
re fo
r Ele
vent
h an
d Tw
elft
h Pl
an
(` in
cro
re a
t cur
rent
pri
ces)
Nam
e of
Sta
teEl
even
th P
lan
Out
lay
Elev
enth
Pla
n Ex
pend
iture
Twel
fth
Plan
Out
lay
Agric
ultu
re
and
Alli
ed
Sect
or
% o
f Tot
al
plan
Agric
ultu
re
and
Alli
ed
Sect
or
% o
f Tot
al
plan
Agric
ultu
re
and
Alli
ed
Sect
or
% o
f Tot
al
plan
Incr
ease
in T
wel
fth
Plan
ove
r Ele
vent
h Pl
an E
xpen
ditu
re
(%)
(1)
(2)
(3)
(4)
(5)
(6)
(7)
(8)
And
hra
Prad
esh
3487
.44
2.4
9510
.46
6.0
1713
85
80A
runa
chal
Pra
desh
752
9.5
617.
715.
711
145.
380
Ass
am87
7.86
2.1
2335
.56
7.8
3272
5.9
40Bi
har
3672
.73
4.8
4805
.33
6.3
1561
36
225
Chha
ttis
garh
4613
8.6
5637
12.7
8284
6.9
47G
oa21
1.76
2.5
325.
393.
610
463.
922
1G
ujar
at90
92.9
40.
788
79.8
6.9
1971
27.
812
2H
arya
na16
38.8
24.
727
33.0
25.
762
885.
413
0H
imac
hal P
rade
sh14
70.0
810
.716
42.8
212
.121
749.
732
Jam
mu
& K
ashm
ir18
18.2
17
892.
983.
528
439.
721
8Jh
arkh
and
3130
.53
0.8
2319
.85
5.9
4157
3.8
79Ka
rnat
aka
8426
.85
8.3
1048
4.4
7.7
1982
48.
989
Kera
la
2649
.11
7.8
2931
.54
7.6
8831
11.5
201
Mad
hya
Prad
esh
3408
.18
4.8
6057
.09
7.3
1707
68.
518
2Co
ntd.
..
14 | Pocket Book of Agricultural Statistics 2014 Outlays, Expenditure & Capital Formation | 15
Nam
e of
Sta
teEl
even
th P
lan
Out
lay
Elev
enth
Pla
n Ex
pend
iture
Twel
fth
Plan
Out
lay
Agric
ultu
re
and
Alli
ed
Sect
or
% o
f Tot
al
plan
Agric
ultu
re
and
Alli
ed
Sect
or
% o
f Tot
al
plan
Agric
ultu
re
and
Alli
ed
Sect
or
% o
f Tot
al
plan
Incr
ease
in T
wel
fth
Plan
ove
r Ele
vent
h Pl
an E
xpen
ditu
re
(%)
(1)
(2)
(3)
(4)
(5)
(6)
(7)
(8)
Mah
aras
htra
9507
.64
5.9
1063
6.4
7.3
1932
57.
0382
Man
ipur
386.
554.
723
4.04
3.2
643
3.1
175
Meg
hala
ya73
5.52
884
5.2
9.8
2114
10.7
150
Miz
oram
536.
319.
638
7.86
7.1
346
2.8
Odi
sha
1230
.29
3.8
3580
.37
8.2
8387
7.4
134
Nag
alan
d43
4.31
8.3
725.
0811
.317
9513
.814
8Pu
njab
1309
.13
4.5
1410
.77
415
242.
98
Raja
stha
n 29
19.0
74.
159
90.6
76.
272
555.
621
Sikk
im26
0.43
6.9
228.
276.
446
94.
110
6Ta
mil
Nad
u78
31.5
79.
281
70.0
18.
820
680
1015
3Tr
ipur
a79
8.51
985
8.79
11.3
980
6.8
14U
ttar
Pra
desh
1914
6.37
10.6
1416
4.8
7.8
2435
48.
572
Utt
rakh
and
2478
.58.
420
79.2
510
2673
5.9
29W
est B
enga
l 18
46.5
2.9
3339
.26
5.1
8583
5.5
157
Tota
l Sta
tes
9467
0.21
3.6
1118
23.7
27.
222
6500
7.1
103
Sour
ce: 1
2th P
lan
Doc
umen
t, Pl
anni
ng C
omm
issi
on.

16 | Pocket Book of Agricultural Statistics 2014 Outlays, Expenditure & Capital Formation | 17
Tab
le 2
.6
Expe
nditu
re o
n Ag
ricul
tura
l Res
earc
h an
d Ed
ucat
ion
(` C
rore
at 2
006-
07 p
rice
s)Te
nth
Plan
2007
-08
2008
-09
2009
-10
2010
-11
2011
-12
Elev
enth
Pl
an(1
)(2
)(3
)(4
)(5
)(6
)(7
)(8
)(9
)St
ate
Plan
4151
694
965
1070
1289
1382
5401
Non
-Pla
n64
7714
6413
1514
9717
5515
9976
29To
tal
1062
921
5822
7925
6730
4429
8113
030
Cent
rePl
an49
7712
1014
1814
0219
0919
9879
38N
on-P
lan
4125
852
1040
1235
2168
1512
6808
Tota
l91
0220
6324
5826
3640
7735
1014
745
RKVY
Plan
5519
763
100
160
576
Cent
re a
nd
Stat
esPl
an91
2819
6125
8025
3432
9835
4013
914
Non
-Pla
n10
603
2316
2355
2732
3923
3111
1443
7To
tal
1973
242
7749
3552
6672
2166
5228
351
GD
P A
gric
ultu
re
and
Alli
ed (2
006-
07 p
rice
s)
3340
648
7648
9076
5601
7735
6582
7969
8508
1239
8283
7
Rese
arch
/Ed
ucat
ion
as %
G
DP
Agr
icul
ture
0.59
%0.
55%
0.61
%0.
67%
0.86
%0.
76%
0.70
%
Sour
ce: 1
2th P
lan
Doc
umen
t, Pl
anni
ng C
omm
issi
on.

16 | Pocket Book of Agricultural Statistics 2014 Outlays, Expenditure & Capital Formation | 17
Table 2.7 Gross Capital Formation in Agriculture & Allied Sector (Current and Constant prices)
Year Share of Agriculture & Allied sector in total GCF(%)
(at current prices)
Share of Agriculture & Allied sector in total GCF(%)
at constant prices (2004-05)Public Sec. Pvt. Sec. Total Public Sec. Pvt. Sec. Total
(1) (2) (3) (4) (5) (6) (7)2004-05 6.7 7.8 7.5 6.7 7.8 7.52009-10 5.6 9.2 8.3 5.0 8.6 7.72010-11^ 4.9 8.2 7.4 4.2 7.5 6.72011-12$ 5.3 9.2 8.3 4.6 8.3 7.52012-13* 5.5 9.6 8.6 4.7 8.6 7.7
Table 2.8 Share of Public and Private Investment in Agriculture and Allied Sectors in Total GDP at Market Prices (2004-05 prices)
Year Share (%) in TotalPublic Private Total
(1) (2) (3) (4)2004-05 0.5 1.8 2.32005-06 0.6 1.9 2.42006-07 0.6 1.8 2.42007-08 0.5 1.9 2.52008-09 0.5 2.4 2.92009-10 0.5 2.3 2.82010-11^ 0.4 2.1 2.52011-12$ 0.4 2.4 2.82012-13* 0.4 2.3 2.7
Note: Total GCF is excluding valuables. * First Revised Estimates, $ Second Revised Estimates, ^ Third Revised Estimates
Source: Central Statistics Office.
* First Revised Estimates, $ Second Revised Estimates, ^ Third Revised Estimates.
Source: Central Statistics Office.

18 | Pocket Book of Agricultural Statistics 2014
Table 2.9 Share of Gross Capital Formation in GDP of Agriculture & Allied Sectors (current prices)
(Figures in Percentage)Year Public Private Total
(1) (2) (3) (4)2004-05 2.9 10.6 13.52005-06 3.3 10.9 14.12006-07 3.5 10.4 14.02007-08 3.3 11.4 14.72008-09 2.8 14.2 17.02009-10 3.1 14.0 17.02010-11^ 2.4 12.5 15.02011-12@ 2.5 14.3 16.82012-13* 2.8 14.1 16.9
Table 2.10 Share of Gross Capital Formation in GDP of Agriculture & Allied Sectors (at 2004-05 prices)
(Figures in Percentage)Year Public Private Total
(1) (2) (3) (4)2004-05 2.9 10.6 13.52005-06 3.4 11.2 14.62006-07 3.7 11.2 14.92007-08 3.6 12.6 16.12008-09 3.1 16.3 19.42009-10 3.4 16.7 20.12010-11^ 2.8 15.7 18.52011-12@ 2.8 18.0 20.82012-13* 3.1 18.1 21.2
^ 3rd revised estimates
@ 2nd revised estimates
* 1st revised estimates
Source: Central Statistics Office (CSO).
^ 3rd Revised Estimates
@ 2nd Revised Estimates
* 1st Revised Estimates
Source: Central Statistics Office.
18 | Pocket Book of Agricultural Statistics 2014
3Labour Force,
Poverty & Unemployment
20 | Pocket Book of Agricultural Statistics 2014 Labour Force, Poverty & Unemployment | 21
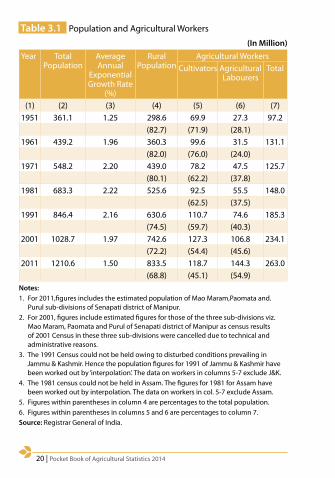
Notes: 1. For 2011,figures includes the estimated population of Mao Maram,Paomata and.
Purul sub-divisions of Senapati district of Manipur.2. For 2001, figures include estimated figures for those of the three sub-divisions viz.
Mao Maram, Paomata and Purul of Senapati district of Manipur as census results of 2001 Census in these three sub-divisions were cancelled due to technical and administrative reasons.
3. The 1991 Census could not be held owing to disturbed conditions prevailing in Jammu & Kashmir. Hence the population figures for 1991 of Jammu & Kashmir have been worked out by ‘interpolation’. The data on workers in columns 5-7 exclude J&K.
4. The 1981 census could not be held in Assam. The figures for 1981 for Assam have been worked out by interpolation. The data on workers in col. 5-7 exclude Assam.
5. Figures within parentheses in column 4 are percentages to the total population. 6. Figures within parentheses in columns 5 and 6 are percentages to column 7. Source: Registrar General of India.
Table 3.1 Population and Agricultural Workers
(In Million)Year Total
PopulationAverage Annual
Exponential Growth Rate
(%)
Rural Population
Agricultural Workers Cultivators Agricultural
LabourersTotal
(1) (2) (3) (4) (5) (6) (7)1951 361.1 1.25 298.6 69.9 27.3 97.2
(82.7) (71.9) (28.1)1961 439.2 1.96 360.3 99.6 31.5 131.1
(82.0) (76.0) (24.0)1971 548.2 2.20 439.0 78.2 47.5 125.7
(80.1) (62.2) (37.8)1981 683.3 2.22 525.6 92.5 55.5 148.0
(62.5) (37.5)1991 846.4 2.16 630.6 110.7 74.6 185.3
(74.5) (59.7) (40.3)2001 1028.7 1.97 742.6 127.3 106.8 234.1
(72.2) (54.4) (45.6)2011 1210.6 1.50 833.5 118.7 144.3 263.0
(68.8) (45.1) (54.9)

20 | Pocket Book of Agricultural Statistics 2014 Labour Force, Poverty & Unemployment | 21
Source: 12th Plan Document ( Volume III, Chapter 22: Employment & Skill Development) Planning Commission.
Table 3.2 Population & Labour Force Projections
(Percent per Annum)Year 2011 2012 2013 2014 2015 2016 2017
(1) (2) (3) (4) (5) (5) (6) (7)Total Population (0+) (in million)
1210.2 1227.1 1244.0 1260.6 1277.1 1293.5 1309.7
15 & above population (%)
70.2 71.0 71.8 72.6 73.4 74.2 75.0
Population (15 & above) (in million)
849.6 871.3 893.2 915.2 937.4 959.8 982.2
LFPR for 15 and above age group (%)
56.3 55.4 54.6 53.7 52.9 52.0 51.2
Labour Force (15 & above) (in million)
477.9 482.7 487.2 491.5 495.4 499.1 502.4
Table 3.3 (a) Population Below Poverty Line (Tendulkar Methodology)
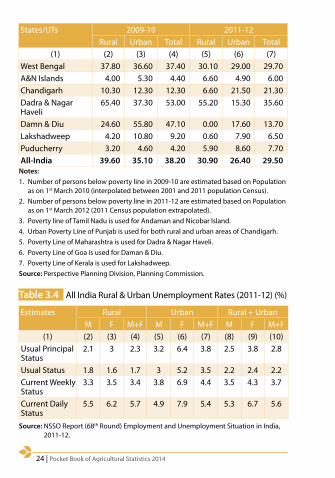
(Figs. in Percentage)States/UTs 2009-10 2011-12
Rural Urban Total Rural Urban Total(1) (2) (3) (4) (5) (6) (7)
Andhra Pradesh 22.80 17.70 21.10 10.96 5.81 9.20Arunachal Pradesh 26.20 24.90 25.90 38.93 20.33 34.67Assam 39.90 26.10 37.90 33.89 20.49 31.98Bihar 55.30 39.40 53.50 34.06 31.23 33.74Chhattisgarh 56.10 23.80 48.70 44.61 24.75 39.93Delhi 7.70 14.40 14.20 12.92 9.84 9.91Goa 11.50 6.90 8.70 6.81 4.09 5.09Gujarat 26.70 17.90 23.00 21.54 10.14 16.63Haryana 18.60 23.00 20.10 11.64 10.28 11.16Himachal Pradesh 9.10 12.60 9.50 8.48 4.33 8.06Jammu & Kashmir 8.10 12.80 9.40 11.54 7.20 10.35Jharkhand 41.60 31.10 39.10 40.84 24.83 36.96Karnataka 26.10 19.60 23.60 24.53 15.25 20.91Kerala 12.00 12.10 12.00 9.14 4.97 7.05
Contd...

22 | Pocket Book of Agricultural Statistics 2014 Labour Force, Poverty & Unemployment | 23
States/UTs 2009-10 2011-12Rural Urban Total Rural Urban Total
(1) (2) (3) (4) (5) (6) (7)Madhya Pradesh 42.00 22.90 36.70 35.74 21.00 31.65Maharashtra 29.50 18.30 24.50 24.22 9.12 17.35Manipur 47.40 46.40 47.10 38.80 32.59 36.89Meghalaya 15.30 24.10 17.10 12.53 9.26 11.87Mizoram 31.10 11.50 21.10 35.43 6.36 20.40Nagaland 19.30 25.00 20.90 19.93 16.48 18.88Odisha 39.20 25.90 37.00 35.69 17.29 32.59Punjab 14.60 18.10 15.90 7.66 9.24 8.26Rajasthan 26.40 19.90 24.80 16.05 10.69 14.71Sikkim 15.50 5.00 13.10 9.85 3.66 8.19Tamil Nadu 21.20 12.80 17.10 15.83 6.54 11.28Tripura 19.80 10.00 17.40 16.53 7.42 14.05Uttar Pradesh 39.40 31.70 37.70 30.40 26.06 29.43Uttrakhand 14.90 25.20 18.00 11.62 10.48 11.26West Bengal 28.80 22.00 26.70 22.52 14.66 19.98A&N Islands 0.40 0.30 0.40 1.57 0.00 1.00Chandigarh 10.30 9.20 9.20 1.64 22.31 21.81Dadra & Nagar Haveli 55.90 17.70 39.10 62.59 15.38 39.31Damn & Diu 34.20 33.00 33.30 0.00 12.62 9.86Lakshadweep 22.20 1.70 6.80 0.00 3.44 2.77Puducherry 0.20 1.60 1.20 17.06 6.30 9.69All-India 33.80 20.90 29.80 25.70 13.70 21.92
Notes:1. Number of persons below poverty line in 2009-10 are estimated based on Population
as on 1st March 2010 (interpolated between 2001 and 2011 population Census).2. Number of persons below poverty line in 2011-12 are estimated based on Population
as on 1st March 2012 (2011 Census population extrapolated).3. Poverty line of Tamil Nadu is used for Andaman and Nicobar Island.4. Urban Poverty Line of Punjab is used for both rural and urban areas of Chandigarh.5. Poverty Line of Maharashtra is used for Dadra & Nagar Haveli.6. Poverty Line of Goa is used for Daman & Diu.7. Poverty Line of Kerala is used for Lakshadweep.Source: Perspective Planning Division, Planning Commission.

22 | Pocket Book of Agricultural Statistics 2014 Labour Force, Poverty & Unemployment | 23
Table 3.3(b) Population Below Poverty Line (Rangarajan Methodology)
(Figs. in Percentage)States/UTs 2009-10 2011-12
Rural Urban Total Rural Urban Total(1) (2) (3) (4) (5) (6) (7)
Andhra Pradesh 27.00 30.50 28.10 12.70 15.60 13.70Arunachal Pradesh 31.30 34.10 31.90 39.30 30.90 37.40Assam 42.90 40.20 42.50 42.00 34.20 40.90Bihar 65.10 55.00 63.90 40.10 50.80 41.30Chhattisgarh 58.90 36.50 53.80 49.20 43.70 47.90Delhi 4.90 24.70 24.10 11.90 15.70 15.60Goa 7.20 13.10 10.80 1.40 9.10 6.30Gujarat 37.00 35.60 36.40 31.40 22.20 27.40Haryana 19.20 24.80 21.10 11.00 15.30 12.50Himachal Pradesh 11.20 22.50 12.30 11.10 8.80 10.90Jammu & Kashmir 14.40 32.40 19.20 12.60 21.60 15.10Jharkhand 55.30 42.10 52.10 45.90 31.30 42.40Karnataka 24.30 26.70 25.20 19.80 25.10 21.90Kerala 9.70 23.70 16.00 7.30 15.30 11.30Madhya Pradesh 51.30 45.00 49.60 45.20 42.10 44.30Maharashtra 27.60 30.30 28.80 22.50 17.00 20.00Manipur 44.40 76.70 54.10 34.90 73.40 46.70Meghalaya 25.80 36.80 28.00 26.30 16.70 24.40Mizoram 29.90 24.80 27.30 33.70 21.50 27.40Nagaland 11.10 37.20 18.30 6.10 32.10 14.00Odisha 50.00 41.20 48.50 47.80 36.30 45.90Punjab 14.80 28.60 20.00 7.40 17.60 11.30Rajasthan 31.90 38.50 33.50 21.40 22.50 21.70Sikkim 25.00 16.70 23.10 20.00 11.70 17.80Tamil Nadu 25.90 29.70 27.70 24.30 20.30 22.40Tripura 16.20 31.70 20.10 22.50 31.30 24.90Uttar Pradesh 46.30 49.60 47.00 38.10 45.70 39.80Uttrakhand 22.50 36.40 26.70 12.60 29.50 17.80
Contd...
24 | Pocket Book of Agricultural Statistics 2014
States/UTs 2009-10 2011-12Rural Urban Total Rural Urban Total
(1) (2) (3) (4) (5) (6) (7)West Bengal 37.80 36.60 37.40 30.10 29.00 29.70A&N Islands 4.00 5.30 4.40 6.60 4.90 6.00Chandigarh 10.30 12.30 12.30 6.60 21.50 21.30Dadra & Nagar Haveli
65.40 37.30 53.00 55.20 15.30 35.60
Damn & Diu 24.60 55.80 47.10 0.00 17.60 13.70Lakshadweep 4.20 10.80 9.20 0.60 7.90 6.50Puducherry 3.20 4.60 4.20 5.90 8.60 7.70All-India 39.60 35.10 38.20 30.90 26.40 29.50
Notes:1. Number of persons below poverty line in 2009-10 are estimated based on Population
as on 1st March 2010 (interpolated between 2001 and 2011 population Census).2. Number of persons below poverty line in 2011-12 are estimated based on Population
as on 1st March 2012 (2011 Census population extrapolated).3. Poverty line of Tamil Nadu is used for Andaman and Nicobar Island.4. Urban Poverty Line of Punjab is used for both rural and urban areas of Chandigarh.5. Poverty Line of Maharashtra is used for Dadra & Nagar Haveli.6. Poverty Line of Goa is used for Daman & Diu.7. Poverty Line of Kerala is used for Lakshadweep.Source: Perspective Planning Division, Planning Commission.
Source: NSSO Report (68th Round) Employment and Unemployment Situation in India, 2011-12.
Table 3.4 All India Rural & Urban Unemployment Rates (2011-12) (%)
Estimates Rural Urban Rural + UrbanM F M+F M F M+F M F M+F
(1) (2) (3) (4) (5) (6) (7) (8) (9) (10)Usual Principal Status
2.1 3 2.3 3.2 6.4 3.8 2.5 3.8 2.8
Usual Status 1.8 1.6 1.7 3 5.2 3.5 2.2 2.4 2.2Current Weekly Status
3.3 3.5 3.4 3.8 6.9 4.4 3.5 4.3 3.7
Current Daily Status
5.5 6.2 5.7 4.9 7.9 5.4 5.3 6.7 5.6

24 | Pocket Book of Agricultural Statistics 2014
4Agricultural
Land-use Statistics

26 | Pocket Book of Agricultural Statistics 2014 Agricultural Land-use Statistics | 27
Tab
le 4
.1
Agric
ultu
ral L
and
by u
se in
Indi
a
(Mill
ion
ha)
S.N
o.Cl
assi
ficat
ion
1950
-51
1990
-91
2000
-01
2009
-10
(P)
2010
-11
(P)
2011
-12
(P)
(1)
(2)
(3)
(4)
(5)
(6)
(7)
(8)
I.G
eogr
aphi
cal A
rea
328.
7332
8.73
328.
7332
8.73
328.
7332
8.73
II.Re
port
ing
Are
a fo
r Lan
d U
tilis
atio
n St
atis
tics
(1 to
5)
284.
3230
4.86
305.
1930
5.83
305.
9030
5.81
1. F
ores
t40
.48
67.8
169
.84
69.9
970
.01
70.0
22.
Not
Ava
ilabl
e fo
r Cul
tivat
ion
(A+B
)47
.52
40.4
841
.23
43.3
443
.58
43.5
2
(A) A
rea
Und
er N
on-a
gric
ultu
ral U
ses
9.36
21.0
923
.75
26.1
626
.39
26.2
9
(B) B
arre
n &
Un-
cultu
rabl
e La
nd38
.16
19.3
917
.48
17.1
817
.18
17.2
33.
Oth
er U
ncul
tivat
ed la
nd e
xclu
ding
Fa
llow
Lan
d (A
+B+C
)49
.45
30.2
227
.74
26.5
026
.16
26.1
0
(A
) Per
man
ent P
astu
re &
oth
er
Gra
zing
Lan
d6.
6811
.40
10.6
610
.34
10.3
010
.30
(B
) Lan
d un
der M
isce
llane
ous T
ree
Crop
s &
Gro
ves
not i
nclu
ded
in
Net
Are
a So
wn
19.8
33.
823.
443.
213.
213.
16
(C
) Cul
tura
ble
Was
te L
and
22.9
415
.00
13.6
312
.95
12.6
512
.64
4. Fa
llow
Lan
ds (A
+B)
28.1
223
.37
25.0
426
.85
24.6
025
.38
Cont
d...

26 | Pocket Book of Agricultural Statistics 2014 Agricultural Land-use Statistics | 27
S.N
o.Cl
assi
ficat
ion
1950
-51
1990
-91
2000
-01
2009
-10
(P)
2010
-11
(P)
2011
-12
(P)
(1)
(2)
(3)
(4)
(5)
(6)
(7)
(8)
(A
) Fal
low
Lan
ds o
ther
than
Cur
rent
Fa
llow
s17
.45
9.66
10.2
710
.84
10.3
210
.67
(B
) Cur
rent
Fal
low
s10
.68
13.7
014
.78
16.0
114
.28
14.7
25.
Net
Are
a So
wn
(6-7
)11
8.75
143.
0014
1.34
139.
1714
1.56
140.
806.
Tota
l Cro
pped
Are
a (G
ross
Cro
pped
A
rea)
131.
8918
5.74
185.
3418
8.99
197.
3219
5.25
7. A
rea
Sow
n m
ore
than
onc
e13
.15
42.7
444
.00
49.8
255
.76
54.4
48.
Cro
ppin
g In
tens
ity*
111.
0712
9.89
131.
1313
5.80
139.
3913
8.67
Net
Irrig
ated
Are
a20
.85
48.0
255
.20
61.9
463
.60
65.2
6G
ross
Irrig
ated
Are
a22
.56
63.2
076
.19
85.0
888
.63
91.5
3
* Cr
oppi
ng In
tens
ity is
per
cent
age
of th
e gr
oss
crop
ped
area
to th
e ne
t are
a so
wn.
(P
) Pro
visi
onal
.
Sour
ce: D
irect
orat
e of
Eco
nom
ics
& S
tatis
tics,
Min
istr
y of
Agr
icul
ture
.

28 | Pocket Book of Agricultural Statistics 2014 Agricultural Land-use Statistics | 29
Source: Directorate of Economics & Statistics, Ministry of Agriculture.
Forest14%
Otheruncultivable
land exclFallow 17%
Not availablefor cultivation
17%
Net Area Sown 42%
FallowLands 10%
Other uncultivableland excl Fallow 9%Fallow
Lands 8%
Forest23%
Net Area Sown 46%
Not availablefor cultivation
14%
2011-121950-51
Chart 4 (a) Agriculture Land by Use in India
Source: Directorate of Economics & Statistics, Ministry of Agriculture.
0.00
50.00
100.00
150.00
200.00
250.00
(Mill
ion
Hec
tare
s)
1950-51 1990-91 2000-01 2009-10(P) 2010-11(P) 2011-12 (P)
Gross Cropped Area Area Sown more than once Gross Irrigated Area
Chart 4 (b) Changes in Gross Cropped and Gross Irrigated Area

28 | Pocket Book of Agricultural Statistics 2014 Agricultural Land-use Statistics | 29
* ProvisionalSource: Directorate of Economics & Statistics, Department of Agriculture & Cooperation.
Table 4.2 Percentage Distribution of Gross Cropped Area
Crop Percentage Share of Area to Gross Cropped Area2010-11* 2011-12*
(1) (2) (3)Rice 21.88 22.33Jowar 3.73 3.17Bajra 4.91 4.51Maize 4.25 4.41Ragi 0.64 0.60Wheat 15.12 15.41Barley 0.36 0.33Other Cereals & Millets 0.43 0.44Coarse Cereals 14.31 13.46Total Cereals 51.32 51.20Gram 4.44 3.97Tur 2.12 1.93Other Pulses 6.27 6.09Total Pulses 12.83 11.98Total Food-grains 64.15 63.19Sugarcane 2.67 2.79Condiments & Spices 1.67 1.86Total Fruits 2.01 2.03Potatoes 0.81 0.84Onions 0.30 0.32Total Vegetables 2.76 2.79Groundnut 2.93 2.66Sesamum 1.09 0.99Rapeseed & Mustard 2.82 2.83Linseed 0.15 0.13Other Oil Seeds 7.68 7.82Total Oil Seeds 14.68 14.43Cotton 5.54 6.23Jute 0.39 0.41Mesta 0.04 0.04Total Fibers 6.01 6.73Tobacco 0.22 0.20Other Crops 5.84 5.98Gross Cropped Area 100.00 100.00

30 | Pocket Book of Agricultural Statistics 2014 Agricultural Land-use Statistics | 31
Tab
le 4
.3
Chan
ges
in S
hare
of A
rea
unde
r Maj
or C
rops
(Fig
s. in
Per
cent
age)
Year
Ri
ceW
heat
Coar
se
Cere
als
Puls
esFo
od
grai
nsO
ilsee
dsSu
garc
ane
Cott
onO
ther
sA
ll Cr
ops
(1)
(2)
(3)
(4)
(5)
(6)
(7)
(8)
(9)
(10)
(11)
2007
-08
23.3
114
.88
15.1
212
.54
65.8
414
.17
2.68
5.00
12.3
110
0.00
2008
-09
24.1
714
.73
14.5
711
.72
65.1
814
.62
2.34
4.99
12.8
610
0.00
2009
-10
22.5
815
.33
14.9
112
.54
65.3
713
.99
2.25
5.46
12.9
410
0.00
2010
-11
21.8
414
.81
14.4
413
.45
64.5
613
.87
2.49
5.73
13.3
510
0.00
2011
-12
22.4
615
.24
13.4
912
.49
63.6
713
.43
2.57
6.22
14.1
110
0.00
2012
-13
22.1
215
.53
12.8
112
.03
62.5
013
.70
2.59
6.20
15.0
210
0.00
2013
-14*
22.1
515
.43
12.7
812
.50
62.8
514
.26
2.54
5.85
14.5
010
0.00
*4th
adv
ance
est
imat
es.
Not
e: (1
) Dat
a fo
r Foo
dgra
in, O
ilsee
d an
d Co
mm
erci
al C
rops
are
as
per s
econ
d Ad
vanc
e Es
timat
es fo
r 201
3-14
. (2
) Dat
a fo
r Hor
ticul
ture
cro
ps a
re a
s pe
r Firs
t Adv
ance
Est
imat
es fo
r 201
3-14
rele
ased
by
Hor
ticul
ture
Div
isio
n, D
AC.
Sour
ce: D
irect
orat
e of
Eco
nom
ics
& S
tatis
tics,
Dep
artm
ent o
f Agr
icul
ture
& C
oope
ratio
n.

30 | Pocket Book of Agricultural Statistics 2014 Agricultural Land-use Statistics | 31
* Excluding Jharkhand.
Source: Department of Agriculture and Cooperation (Agriculture Census 2010-11, (P): Provisional).
2007-08 2013-14
Rice22%
Wheat15%
CoarseCereals
13%
Pulses12%
Oilseeds14%
Sugarcane3%
Cotton6%
Others15%Rice
23%
Wheat15%
Pulses13%
Oilseeds14%
Sugarcane3%
Cotton5% Others
12%
CoarseCereals
15%
Chart 4 (c) Changes in share of Area under Major Crops
Table 4.4 Average Size of Operational Holdings by Size Group
Category of Holdings Average Size of Holdings2000-01* 2005-06* 2010-11(P)
(1) (2) (3) (4)Marginal(Less than 1 ha)
0.40 0.38 0.39
Small(1.0 to 2.0 ha)
1.42 1.38 1.42
Semi-Medium(2.0 to 4.0 ha)
2.72 2.68 2.71
Medium(4.0 to 10.0 ha)
5.81 5.74 5.76
Large(10.0 ha and above)
17.12 17.08 17.38
All Holdings 1.33 1.23 1.15

32 | Pocket Book of Agricultural Statistics 2014
@ Total number of Meteorological sub-divisions was 35 upto 2001. From 2002 onwards, the no. of meteorological sub-divisions is 36.
Excess: + 20% or more of Long Period Average Rainfall.
Normal: Between + 19% and -19% of Long Period Average Rainfall.
Deficient: Between -20% and -59% of Long Period Average Rainfall.
Scanty: Between -60% and -99% of Long Period Average Rainfall.
Source: Directorate of Economics and Statistics, Department of Agriculture and Cooperation.
Table 4.5 Performance of South West Monsoon (1 June - 30 September)
Year Number of Meteorological Sub-Divisions @
Percentage of Districts with
Normal/Excess Rainfall
Actual Rainfallas % of Normal
Rainfall (All India)
Excess/Normal Rainfall
Deficient/Scanty Rainfall
(1) (2) (3) (4) (5)1990 32 3 88 1191991 27 8 68 912001 30 5 68 922010 31 5 69 1022011 33 3 76 1012012 23 13 58 922013 30 6 72 1062014 24 12 55 88

32 | Pocket Book of Agricultural Statistics 2014
5Area, Production
and Yield of Principal Crops

34 | Pocket Book of Agricultural Statistics 2014 Area, Production and Yield of Principal Crops | 35
Tab
le 5
.1
Prod
uctio
n of
Maj
or A
gric
ultu
ral C
rops
(Mill
ion
Tonn
es)
S.N
o.Cr
ops
1950
-51
1960
-61
1970
-71
1980
-81
1990
-91
2000
-01
2010
-11
2011
-12
2012
-13
2013
-14*
(1)
(2)
(3)
(4)
(5)
(6)
(7)
(8)
(9)
(10)
(11)
(12)
1Fo
odgr
ains
50.8
282
.02
108.
4212
9.59
176.
3919
6.81
244.
4925
9.29
257.
1326
4.77
Rice
20.5
834
.58
42.2
253
.63
74.2
984
.98
95.9
810
5.30
105.
2410
6.54
Whe
at6.
4611
.00
23.8
336
.31
55.1
469
.68
86.8
794
.88
93.5
195
.91
Mai
ze1.
734.
087.
496.
968.
9612
.04
21.7
321
.76
22.2
624
.35
Coar
se
Cere
als
15.3
823
.74
30.5
529
.02
32.7
031
.08
43.4
042
.01
40.0
443
.05
2Pu
lses
8.41
12.7
011
.82
10.6
314
.26
11.0
818
.24
17.0
918
.34
19.2
7G
ram
3.65
6.25
5.20
4.33
5.36
3.86
8.22
7.70
8.83
9.88
Tur (
Arh
ar)
1.72
2.07
1.88
1.96
2.41
2.25
2.86
2.65
3.02
3.29
Lent
il (M
asur
)-
-0.
370.
470.
850.
920.
941.
061.
13-
3O
ilsee
ds5.
166.
989.
639.
3718
.61
18.4
432
.48
29.8
030
.94
32.8
8G
roun
dnut
3.48
4.81
6.11
5.01
7.51
6.41
8.26
6.96
4.70
9.67
Rape
seed
&
Mus
tard
0.76
1.35
1.98
2.30
5.23
4.19
8.18
6.60
8.03
7.96
Soya
bean
--
0.01
0.44
2.60
5.28
12.7
412
.21
14.6
711
.99
Sunfl
ower
--
0.08
0.07
0.87
0.65
0.65
0.52
0.54
0.55
4Co
tton
#3.
045.
604.
767.
019.
849.
5233
.00
35.2
034
.22
36.5
95
Jute
&
Mes
ta @
3.31
5.26
6.19
8.16
9.23
10.5
610
.62
11.4
010
.93
11.5
8
6Su
garc
ane
57.0
511
0.00
126.
3715
4.25
241.
0529
5.96
342.
3836
1.04
341.
2035
0.02
7To
bacc
o0.
260.
310.
360.
480.
560.
340.
880.
750.
66-
* 4th
Adv
ance
Est
imat
es
# M
illio
n ba
les
of 1
70 k
g ea
ch
@ M
illio
n ba
les
of 1
80 k
g ea
chSo
urce
: Dire
ctor
ate
of E
cono
mic
s an
d St
atis
tics,
Dep
artm
ent o
f Agr
icul
ture
and
Coo
pera
tion.

34 | Pocket Book of Agricultural Statistics 2014 Area, Production and Yield of Principal Crops | 35
Table 5.2 Three Largest Producing States of Important Crops during 2013-14
Production: Million TonnesGroup of Crops
Crops States Production % Share in All India
Production(1) (2) (3) (4) (5)
I. Foodgrains
Rice West Bengal 15.31 14.37Uttar Pradesh 14.63 13.73Andhra Pradesh 13.03 12.23All - India 106.54 100.00
Wheat Uttar Pradesh 30.25 31.54Punjab 17.04 17.77Madhya Pradesh 13.93 14.52All - India 95.91 100.00
Maize Andhra Pradesh 4.97 20.41Karnataka 3.98 16.34Maharashtra 3.08 12.65All - India 24.35 100.00
Total Coarse Cereals
Karnataka 6.75 15.68Rajasthan 6.60 15.33Maharashtra 6.25 14.52All - India 43.05 100.00
Total Pulses Madhya Pradesh 5.09 26.41Maharashtra 3.12 16.19Rajasthan 2.47 12.82All - India 19.27 100.00
Total Foodgrains
Uttar Pradesh 50.05 18.90Punjab 28.90 10.92Madhya Pradesh 24.24 9.16All - India 264.77 100.00
II .Oilseeds Groundnut Gujarat 4.92 50.88Andhra Pradesh 1.23 12.72Tamil Nadu 0.96 9.93All - India 9.67 100.00
Contd...
36 | Pocket Book of Agricultural Statistics 2014 Area, Production and Yield of Principal Crops | 37
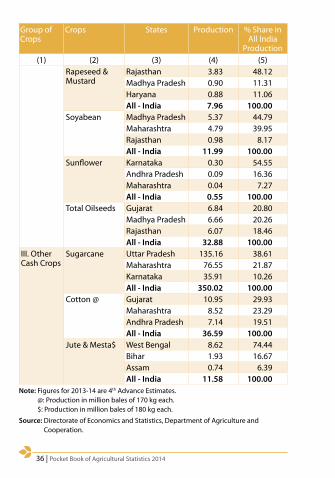
Note: Figures for 2013-14 are 4th Advance Estimates. @: Production in million bales of 170 kg each. $: Production in million bales of 180 kg each.
Source: Directorate of Economics and Statistics, Department of Agriculture and Cooperation.
Group of Crops
Crops States Production % Share in All India
Production(1) (2) (3) (4) (5)
Rapeseed & Mustard
Rajasthan 3.83 48.12Madhya Pradesh 0.90 11.31Haryana 0.88 11.06All - India 7.96 100.00
Soyabean Madhya Pradesh 5.37 44.79Maharashtra 4.79 39.95Rajasthan 0.98 8.17All - India 11.99 100.00
Sunflower Karnataka 0.30 54.55Andhra Pradesh 0.09 16.36Maharashtra 0.04 7.27All - India 0.55 100.00
Total Oilseeds Gujarat 6.84 20.80Madhya Pradesh 6.66 20.26Rajasthan 6.07 18.46All - India 32.88 100.00
III. Other Cash Crops
Sugarcane Uttar Pradesh 135.16 38.61Maharashtra 76.55 21.87Karnataka 35.91 10.26All - India 350.02 100.00
Cotton @ Gujarat 10.95 29.93Maharashtra 8.52 23.29Andhra Pradesh 7.14 19.51All - India 36.59 100.00
Jute & Mesta$ West Bengal 8.62 74.44Bihar 1.93 16.67Assam 0.74 6.39All - India 11.58 100.00

36 | Pocket Book of Agricultural Statistics 2014 Area, Production and Yield of Principal Crops | 37
Tabl
e 5.
3A
rea,
Pro
duct
ion
and
Yiel
d of
Foo
dgra
ins
durin
g 20
12-1
3 an
d 20
13-1
4 in
maj
or P
rodu
cing
Sta
tes
alon
gwith
cov
erag
e un
der I
rrig
atio
nA
rea
- Mill
ion
ha, P
rodu
ctio
n - M
illio
n To
nnes
, Yie
ld -
kg/h
aSt
ate
2013
-14#
20
12-1
3A
rea
Und
er
Irrig
atio
n(%
)20
11-1
2*A
rea
% to
All
- Ind
iaPr
oduc
tion
% to
All
- In
dia
Yiel
dA
rea
% to
All
- Ind
iaPr
oduc
tion
% to
All
- Ind
iaYi
eld
(1)
(2)
(3)
(4)
(5)
(6)
(7)
(8)
(9)
(10)
(11)
(12)
Utt
ar P
rade
sh
20.2
3 16
.05
50.0
5 18
.90
2474
19.9
6 16
.53
50.7
5 19
.73
2542
76.1
Punj
ab6.
56
5.20
28
.90
10.9
2 44
096.
57
5.44
25
.54
9.93
38
9098
.7M
adhy
a Pra
desh
14.9
4 11
.85
24.2
4 9.
15
1622
14.1
4 11
.70
23.6
9 9.
21
1676
50.5
Andh
ra P
rade
sh7.
61
6.04
20
.10
7.59
26
416.
99
5.79
18
.66
7.26
26
7062
.5Ra
jast
han
13.4
2 10
.64
18.3
0 6.
91
1364
12.4
1 10
.28
18.3
7 7.
14
1480
27.7
Wes
t Ben
gal
6.24
4.
95
17.0
56.
4427
326.
09
5.04
16
.55
6.43
27
1749
.3H
arya
na4.
40
3.49
16
.97
6.41
38
544.
40
3.64
16
.23
6.31
36
8988
.9M
ahar
asht
ra11
.62
9.22
13
.92
5.26
11
9810
.58
8.76
10
.97
4.27
10
3816
.4Bi
har
6.67
5.
29
13.1
5 4.
97
1971
6.74
5.
58
15.9
4 6.
20
2366
67.4
Karn
atak
a7.
51
5.95
12
.17
4.60
16
227.
30
6.04
10
.86
4.22
14
8828
.2Ta
mil
Nad
u3.
55
2.81
8.
49
3.21
23
962.
63
2.17
5.
59
2.18
21
3163
.5O
dish
a5.
15
4.09
8.
33
3.15
16
175.
03
4.17
8.
01
3.11
15
9229
.0G
ujar
at4.
29
3.40
8.
21
3.10
19
173.
58
2.97
7.
06
2.74
19
7046
.0Ch
hatt
isga
rh
4.95
3.
93
7.58
2.
86
1532
5.08
4.
20
7.64
2.
97
1506
29.7
Ass
am2.
53
2.01
4.
94
1.87
19
522.
69
2.23
5.
28
2.05
19
624.
6Jh
arkh
and
2.24
1.
77
4.19
1.
58
1874
2.43
2.
01
4.56
1.
77
1876
7.0
Utt
rakh
and
0.89
0.
71
1.78
0.
67
2001
0.93
0.
77
1.83
0.
71
1962
44.0
Oth
ers
3.26
2.
59
23.4
3 8.
85
@3.
25
2.69
9.
61
3.74
@
-A
ll In
dia
126.
04 1
00.0
0 26
4.77
10
0.00
21
0112
0.78
100
.00
257.
13
100.
00
2129
49.8
# Fo
urth
Adv
ance
Est
imat
es, *
Pro
visi
onal
, @ S
ince
are
a/ p
rodu
ctio
n is
low
in in
divi
dual
sta
tes,
yiel
d ra
te is
not
wor
ked
out.
Not
e: S
tate
s ha
ve b
een
arra
nged
in d
esce
ndin
g or
der o
f per
cent
age
shar
e of
pro
duct
ion
durin
g 20
13-1
4.
Sour
ce: D
irect
orat
e of
Eco
nom
ics
and
Stat
istic
s, D
epar
tmen
t of A
gric
ultu
re a
nd C
oope
ratio
n.

38 | Pocket Book of Agricultural Statistics 2014 Area, Production and Yield of Principal Crops | 39
Table 5.4Normal Area, Production and Yield of Major Crops in India (Average of 2008-09 to 2012-13)
Area - Million ha, Production - Million Tonnes, Yield - kg/ haGroup of Crops
Crops Season Area Production Yield
(1) (2) (3) (4) (5) (6)I. Foodgrains
Rice Total 43.42 98.95 2279Wheat Rabi 29.04 87.39 3009Jowar Total 7.03 6.44 916Bajra Kharif 8.67 8.96 1033Maize Total 8.49 20.43 2406Total Coarse Cereals
Total 26.93 39.8 1478
Tur Kharif 3.82 2.65 694Gram Rabi 8.41 7.86 935Total Pulses Total 23.9 16.58 694Total Foodgrains
Total 123.29 242.73 1969
II .Oilseeds Groundnut Total 5.5 6.5 1182Nine Oilseeds Total 26.71 29.16 1092
III . Other Cash Crops
Sugarcane Total 4.7 324.39 69019Cotton @ Total 10.98 29.55 458Jute & Mesta$ Total 0.89 11.03 2232
Table 5.5Target and Achievement of Production of Major Crops from 2011-12 onwards
(Million Tonnes)Crop 2011-12 2012-13 2013-14*
Target Achievement Target Achievement Target(1) (2) (3) (4) (5) (6)
Rice 102.00 105.30 104.00 105.24 105.00Wheat 84.00 94.88 88.00 93.51 92.50Coarse Cereals 42.00 42.01 44.00 40.04 42.50Pulses 17.00 17.09 18.24 18.34 19.00Foodgrains 245.00 259.29 254.24 257.13 259.00Oilseeds 33.60 30.01 33.50 30.94 31.00Sugarcane 350.00 361.04 352.00 341.20 340.00Cotton # 34.00 35.20 35.00 34.22 35.00Jute & Mesta@ 12.30 11.40 12.00 10.93 12.00
@ : Production in million bales of 170 kg each., $ : Production in million bales of 180 kg each.Source: Directorate of Economics and Statistics, Department of Agriculture and Cooperation.
* 4th Advance Estimates, # Million Bales of 170 kg each, @ Million Bales of 180 kg each.

38 | Pocket Book of Agricultural Statistics 2014 Area, Production and Yield of Principal Crops | 39
** Based on final Estimate (released by Ministry of Agriculture on 14.2.2014).
*** Based on 4th Advance Estimates (released by Ministry of Agriculture on 14.08.2014).
Source: Directorate General of Commercial Intelligence & Statistics (Department of Commerce).
Table 5.6Production of Oilseeds/Oils and Net Domestic Availability of Edible Oils
Qty. in Lakh TonnesOilseeds/Oils 2012-13** 2013-14***
Oilseeds Oils Oilseeds Oils (1) (2) (3) (4) (5)
A. Primary SourceGroundnut 46.95 10.80 96.73 22.25Rapeseed & Mustard 80.29 24.89 79.6 24.68Soyabean 146.66 23.47 119.89 19.19Sunflower 5.44 1.80 5.47 1.80Sesamum 6.85 2.12 6.75 2.09Nigerseed 1.02 0.31 0.89 0.26Safflower 1.09 0.33 1.14 0.34Castor 19.64 7.86 16.89 6.76Linseed 1.49 0.45 1.43 0.43Sub Total 309.43 72.03 328.79 77.80B. Secondary SourceCoconut - 3.90 4.30Cottonseed - 11.57 - 12.40Ricebran - 7.8 - 8.10Solvent Extracted Oils - 4.10 - 4.10Tree & Forest Origin - 1.20 - 1.20Sub Total - 28.57 - 30.10Total(A+B) - 100.60 - 107.90C. Less: Exports & Industrial Use
- 8.41 - 7.1
D. Net Domestic Availability of Edible Oils
- 92.19 - 100.80
E. Import of Edible Oils - 106.05 - 88.6F. Total Availability/Consumption of Edible Oils
- 198.24 -

40 | Pocket Book of Agricultural Statistics 2014 Area, Production and Yield of Principal Crops | 41
Table 5.7Average Annual Growth Rate of Area, Production and Yield of major Crops (Base T.E. 2007-08=100)
A=Average of Annual Growth Rate of Area, P=Average of Annual Growth Rate of Production, Y=Average of Annual Growth Rate of Yield
Crops 2008-09 to 2013-14A P Y
(1) (2) (3) (4)Rice 0.1 1.8 1.6Wheat 1.5 3.4 1.9Jowar -4.8 -5.5 -0.4Bajra -2.6 1.1 3.4Maize 1.9 4.3 2.3Ragi -3.2 -3.3 -0.3Small Millets -6.4 -3.6 2.7Barley 4.4 9.9 4.6Coarse Cereals
-1.8 1.3 3.1
Cereals -0.1 2.2 2.2Tur 1.3 2.6 1.4Gram 4.5 9.6 5.1Moong -2.8 11.0 10.5Urad -0.6 3.3 3.5Lentil 2.5 7.9 5.7
Other Pulses -1.0 4.8 5.5Total Pulses 1.1 5.4 4.3Foodgrains 0.1 2.4 2.2Groundnut -1.5 8.7 6.9Castorseed 7.9 11.8 3.5Nigerseed -6.2 -1.3 5.6Sesamum -1.7 0.3 1.6Rapeseed & Mustard
3.0 7.3 3.9
Linseed -6.7 -2.5 5.3Safflower -9.9 -9.7 0.5Sunflower -13.9 -16.6 -1.6Soyabean 5.3 3.3 -1.4Total Oilseeds 1.1 2.6 1.3
Crops 2008-09 to 2013-14A P Y
(1) (2) (3) (4)Sugarcane 0.3 0.5 0.1Cotton 3.7 6.5 2.4Jute -1.0 1.2 2.0Mesta -8.9 -7.6 1.2Coconut 2.2 8.7 6.1Cotton seed 3.7 6.5 2.4Sannhamp -8.6 3.8 14.3Potato 4.7 8.8 3.9Tapioca -2.4 -1.4 0.9Sweet potato 1.3 3.6 2.3Onion 8.7 14.5 5.7Banana 7.5 9.1 0.9Tobacco 3.8 8.1 3.6Guar seed 8.9 32.2 19.1Black pepper -5.3 3.1 17.0Dry chillies -0.2 0.1 0.4Dry ginger 5.6 13.5 6.0Turmeric 2.0 4.3 1.9Arecanut 2.6 5.3 2.1Cardamom 2.1 5.2 3.1Coriander 7.3 14.7 4.6Garlic 4.2 3.9 -0.4Tea 0.0 0.6 0.6Coffee 1.1 3.4 2.2Rubber 3.0 1.8 -1.2Non Foodgrains
2.3 2.2 -0.2
All Crops 0.9 2.2 1.2Note: (1) Data for Foodgrain, Oilseed and Commercial Crops are as per second Advance
Estimates for 2013-14. Note: (2) Data for Horticulture crops are as per First Advance Estimates for 2013-14
released by Horticulture Division, DAC.Source: Directorate of Economics and Statistics, Department of Agriculture and Cooperation.

40 | Pocket Book of Agricultural Statistics 2014 Area, Production and Yield of Principal Crops | 41
NA: Not Available, (P): Provisional.Source: Directorate of Economics & Statistics, Department of Agriculture & Cooperation.
Table 5.8 All India Crop-wise Irrigated Area (%)
Crops 1950-51 1990-91 2000-01 2010-11 2011-12 (P)
(1) (2) (3) (4) (5) (6)Rice 31.7 45.5 53.6 58.6 58.7Jowar 3.0 5.6 7.9 8.7 9.7Bajra 3.4 5.1 8.0 8.3 8.5Maize 11.4 19.7 22.4 24.3 25.3Wheat 34.0 81.1 88.1 92.1 92.9Barley NA NA 65.5 70.3 74.9Coarse Cereal 7.9 9.0 12.5 14.4 17.89Total Cereals NA NA 49.8 56.2 57.7Gram 12.5 20.5 30.9 29.7 33.5Tur or Arhar 0.5 5.5 4.2 4.0 3.9Total Pulses 9.4 10.5 12.5 14.8 16.1Total Foodgrains 18.1 35.1 43.4 47.8 49.8Sugarcane 67.3 86.9 92.1 92.5 94.3Groundnut NA 18.6 17.6 22.4 24.3Rapeseed & Mustard NA 59.8 66.1 69.9 73.2Soyabean NA NA 1.4 0.6 0.6Sunflower NA NA 27.6 31.7 32.4Total Oilseeds NA 22.9 23.0 25.1 27.6Cotton 8.2 32.9 34.3 33.8 35.9Tobacco NA 43.2 52.8 47.1 50.9Total area under all crops
… … 40.2 44.9 46.9
Table 5.9State-wise Percent Coverage of Irrigated Area under Principal Crops during 2011-12 (Provisional)
Stat
e/U
T
Rice
Jow
ar
Tota
l Ce
real
s
Tota
l Pul
ses
Tota
l Fo
odgr
ains
Tota
l O
ilsee
ds
Cott
on
Toba
cco
Tota
l are
a un
der a
ll cr
ops
(1) (2) (3) (4) (5) (6) (7) (8) (9) (10)A.P. 97.1 17.2 83.7 3.7 62.5 23.2 18.2 32.5 49.3Arunachal Pradesh
38.7 - 25.7 - 24.6 - - - 20.1
Contd...

42 | Pocket Book of Agricultural Statistics 2014 Area, Production and Yield of Principal Crops | 43
Stat
e/U
T
Rice
Jow
ar
Tota
l Ce
real
s
Tota
l Pul
ses
Tota
l Fo
odgr
ains
Tota
l O
ilsee
ds
Cott
on
Toba
cco
Tota
l are
a un
der a
ll cr
ops
Assam 4.9 - 4.9 - 4.6 0.4 - - 3.9Bihar 61.1 2.2 72.8 3.2 67.4 54.0 - 96.3 67.4Chhattisgarh 34.2 - 33.2 12.1 29.7 4.0 92.9 90.5 29.1Goa 33.9 - 33.7 97.9 44.9 13.5 - - 25.0Gujarat** 61.5 19.8 53.7 15.2 46.0 34.9 58.7 100.0 48.2Haryana 99.9 71.9 90.6 27.6 88.9 79.9 99.9 100.0 87.5H.P.** 64.4 - 19.9 12.5 19.6 16.1 - - 19.7J & K 90.2 - 38.7 12.5 38.0 69.4 - - 41.3Jharkhand** 3.2 - 7.4 2.9 7.0 6.2 - - 12.1Karnataka 75.2 11.5 37.5 7.6 28.2 30.1 26.0 13.4 34.3Kerala 100.0 - 99.7 - 97.9 22.1 - - 20.5M.P. 21.7 0.2 59.0 35.1 50.5 4.8 49.8 53.3 36.5Mahara-shtra**
26.1 9.5 19.7 8.7 16.4 3.6 2.7 16.7 18.7
Manipur** 30.7 - 27.4 - 24.6 - - - 18.8Meghalaya 49.9 - 42.5 - 41.3 36.4 - - 23.6Mizoram 50.9 - 40.2 - 36.0 - - - 13.5Nagaland 47.4 - 33.0 1.3 29.3 6.4 - - 19.4Odisha 33.2 - 31.7 3.0 29.0 16.0 - - 28.9Punjab 99.5 100.0 98.7 83.4 98.7 84.3 100.0 - 98.3Rajasthan 55.1 0.2 34.1 13.1 27.7 57.0 93.0 75.5 36.3Sikkim** 84.5 - 19.3 3.0 17.8 12.2 - - 13.7Tamil Nadu 93.7 15.5 77.4 10.6 63.5 62.4 29.1 100.0 59.7Tripura** 38.4 - 38.0 16.2 37.4 5.5 5.4 - 34.9Uttrakhand 68.9 - 46.1 9.9 44.0 25.7 0.0 50.0 49.0U. P.** 80.4 0.9 83.7 21.0 76.1 46.4 98.1 100.0 76.7W. B.** 48.2 19.6 50.2 23.3 49.3 82.6 79.2 97.5 58.1ALL INDIA 58.7 9.7 57.7 16.1 49.8 27.6 35.9 50.9 46.9
**The figures related to irrigated area (Part-II) are either estimated based on the data for the the latest available year received from the State/UT or are estimated/taken from Agriculture Census.
Source: Directorate of Economics & Statistics, Department of Agriculture & Cooperation.

42 | Pocket Book of Agricultural Statistics 2014 Area, Production and Yield of Principal Crops | 43
NA: Not Available.
* 4th Advance Estimate.
Source: Directorate of Economics & Statistics, Department of Agriculture & Cooperation.
Table 5.10 All India Crop-wise Yield (qtl/ha)
Crops 1950-51
1990-91
2000-01
2010-11
2011-12
2012-13
2013-14*
(1) (2) (3) (4) (5) (6) (7) (8)Rice 6.68 17.40 19.01 22.39 23.93 24.61 24.24Jowar 3.53 8.14 7.64 9.49 9.57 8.50 9.26Bajra 2.88 6.58 6.88 10.79 11.71 11.98 11.64Maize 5.47 15.18 18.22 25.40 24.78 25.66 25.83Wheat 6.63 22.81 27.08 29.88 31.77 31.69 30.75Coarse Cereal 4.08 9.00 10.27 15.31 15.90 16.17 16.77Gram 4.82 7.12 7.44 8.95 9.28 10.36 9.67Tur or Arhar 7.88 6.73 6.18 6.55 6.62 7.76 8.49Total Pulses 4.41 5.78 5.44 6.91 6.99 7.89 7.64Total Foodgrains
5.22 13.80 16.26 19.30 20.78 21.29 21.01
Sugarcane 334.22 653.95 685.78 700.91 703.17 682.54 698.38Groundnut 7.75 9.04 9.77 14.11 13.05 9.95 17.50Rapeseed & Mustard
3.68 9.04 9.36 11.85 11.45 12.62 11.88
Soyabean 4.26 10.15 8.23 13.27 12.07 13.53 9.83Sunflower 6.53 5.35 6.05 7.01 6.92 6.55 7.91Total Oilseeds 4.81 7.71 8.10 11.93 11.35 11.68 11.53Cotton 0.88 2.25 1.90 4.99 4.91 4.86 5.32Tobacco 7.31 13.53 13.18 16.87 16.13 15.42 NA

Area, Production and Yield of Horticulture Crops | 45
6Area, Production
and Yield of Horticulture Crops

Area, Production and Yield of Horticulture Crops | 45
Table 6.1 Area and Production of Horticulture Crops Area in 000’ ha, Production in ‘000’ Tonnes
Crops 2012-13 2013-14 (P)Area Production Area Production
(1) (2) (3) (4) (5)FruitsAlmond 21 9 21 13Aonla/Gooseberry 108 1266 110 1282Apple 311 1915 315 2544Banana 776 26509 831 29530Ber 41 438 40 382Citrus (i) Lime/Lemon 255 2524 258 2565 (ii) Mandarin (Orange) 311 2906 330 3109 (iii) Sweet
Orange(Mosambi)323 3520 326 3676
(iv) Others 153 1140 157 1134Citrus Total (i to iv) 1042 10090 1071 10484Custardapple 20 136 23 174Grapes 118 2483 119 2525Guava 236 3198 272 3637Jackfruit 67 1176 68 1278Kiwi 4 7 5 9Litchi 83 580 84 599Mango 2500 18002 2528 17938Papaya 132 5382 135 5573Passion Fruit 18 101 19 123Peach 19 98 19 99Pear 42 295 44 334Pineapple 105 1571 109 1681Plum 24 74 24 82Pomegranate 113 745 129 1072Sapota 164 1495 165 1523
Contd...

46 | Pocket Book of Agricultural Statistics 2014 Area, Production and Yield of Horticulture Crops | 47
Crops 2012-13 2013-14 (P)Area Production Area Production
(1) (2) (3) (4) (5)Walnut 123 233 125 246Others 915 5482 930 5695Total Fruits 6982 81285 7186 86822VegetablesBeans 124 1269 119 1213Bitterguard 83 940 88 971Bottleguard 114 2090 118 2192Brinjal 722 13444 722 13842Cabbage 372 8534 412 9109Capsicum 29 153 29 156Carrot 64 1145 69 1190Cauliflower 402 7887 432 8585Cucumber 41 641 45 690Muskmelon 42 868 37 702Okra 531 6350 533 6461Onion 1052 16813 1211 19769Peas 421 4006 438 4165Potato 1992 45344 2017 44306Radish 170 2411 177 2561Sitaphal/Pumpkin 16 373 15 356Sweet Potato 112 1132 110 1126Tapioca 207 7237 216 7778Tomato 880 18227 910 19193Watermelon 81 1789 81 1827Others 1751 21535 1788 21953Total Vegetables 9205 162187 9567 168142Aromatic 557 918 554 931Flowers Cut* 76732 542Flowers Loose 233 1729 241 1824Plantation Crops
Contd...

46 | Pocket Book of Agricultural Statistics 2014 Area, Production and Yield of Horticulture Crops | 47
Crops 2012-13 2013-14 (P)Area Production Area Production
(1) (2) (3) (4) (5)Arecanut 446 609 452 626Cashewnut 992 753 1009 757Cocoa 66 13 71 15Coconut 2137 15609 2143 15200Total Pantation Crops 3641 16985 3674 16598SpicesAjwan 35 27 39 27Cardamom 92 18 99 21Chillies (Dried) 794 1304 791 1376Cinnamon/Tejpata 3 5 3 5Celery, Dill & Poppy 33 33 33 33Clove 2 1 2 1Coriander 543 524 425 428Cumin 594 394 866 456F.Greek 93 113 76 97Fennel 100 143 94 136Garlic 248 1259 227 1181Ginger 136 683 140 688Nutmeg 17 13 19 13Pepper 125 53 122 49Vanilla 7 1 7 1Tamarind 58 202 59 192Turmeric 194 971 234 1229Spice Total 3076 5744 3236 5932Grand Total 23694 268848 24458 280792
P: Provisional
Note: From 2013-14 (3rd adv. Est.) * Cut Flower Production is being given in Thousand MT as compared to earlier reporting in Lakh Numbers. Figure of Production under Grand Total does not include Production of Cut-Flowers upto 2012-13.
Source: Department of Agriculture and Cooperation (Horticulture Division).

48 | Pocket Book of Agricultural Statistics 2014
Table 6.2 All-India Area, Production and Yield of Potato and Onion
Area - Million ha, Production - Million Tonnes, Yield - kg/ha
Year Potato OnionArea Production Yield Area Production Yield
(1) (2) (3) (4) (5) (6) (7)1980-81 0.73 9.67 13258 0.25 2.50 99611990-91 0.94 15.21 16254 0.30 3.23 106862000-01 1.22 22.49 18404 0.42 4.55 107862010-11 1.86 42.34 22724 1.06 15.12 142102011-12 1.91 41.48 21753 1.09 17.51 161092012-13 1.99 45.34 22784 1.05 16.81 160102013-14 (3rd Adv. Est.)
2.02 44.31 21967 1.21 19.77 16318
Source : Department of Agriculture and Cooperation (Horticulture Division).
Table 6.3 All-India Area, Production and Yield of Banana
Area - Million ha, Production - Million Tonnes, Yield - kg/ha
Year Banana
Area Production Yield
(1) (2) (3) (4)
2000-01 0.46 12.90 28133
2009-10 0.77 26.47 34363
2010-11 0.83 29.78 35880
2011-12 0.80 28.46 35725
2012-13 0.77 26.51 34161
2013-14 (3rd Adv. Est.) 0.83 29.53 35526
Source : Department of Agriculture and Cooperation (Horticulture Division).

48 | Pocket Book of Agricultural Statistics 2014
7Livestock
Statistics

50 | Pocket Book of Agricultural Statistics 2014 Livestock Statistics | 51
Table 7.1 Livestock Population in India (Million Numbers)
Species 1951 1982 1992 2003 2007$
(1) (2) (3) (4) (5) (6)
Cattle 155.3 192.5 204.6 185.2 199.1
Adult Female Cattle 54.4 59.2 64.4 64.5 73.0
Buffalo 43.4 69.8 84.2 97.9 105.3
Adult Female Buffalo 21.0 32.5 43.8 51.0 54.5
Total Bovines 198.7 262.4 289.0 283.1 304.4
Sheep 39.1 48.8 50.8 61.5 71.6
Goats 47.2 95.3 115.3 124.4 140.5
Horses & Ponies 1.5 0.9 0.8 0.8 0.6
Camels 0.6 1.1 1.0 0.6 0.5
Pigs 4.4 10.1 12.8 13.5 11.1
Mules 0.1 0.1 0.2 0.2 0.1
Donkeys 1.3 1.0 1.0 0.7 0.4
Yaks NC 0.1 0.1 0.1 0.1
Total Livestock 292.8 419.6 470.9 485.0 529.7
Poultry* 73.5 207.7 307.1 489.0 648.8
Dogs NC 18.5 21.8 29.0 19.1
Rabbits NC NC NC 0.5 0.4NC: Not Collected.
* Includes chicken, ducks, turkey & other birds.
$ Provisional derived from village level total.
Source: Department of Animal Husbandry, Dairying & Fisheries.

50 | Pocket Book of Agricultural Statistics 2014 Livestock Statistics | 51
Table 7.2 All India Production of Milk, Eggs and Wool
Year Milk(Million Tonnes)
Eggs(Billion Nos.)
Wool(Million Kgs.)
(1) (2) (3) (4)
1990-91 53.9 21.1 41.2
2000-01 80.6 36.6 48.4
2009-10 116.4 60.3 43.1
2010-11 121.8 63.0 43.0
2011-12 127.9 66.5 44.7
2012-13 132.4 69.7 46.1
2013-14 137.7 73.4 47.9
Table 7.3 Fish Production in India(‘000 Tonnes)
Year Marine Inland Total(1) (2) (3) (4)
1950-51 534 218 752
1980-81 1555 887 2442
1990-91 2300 1536 3836
2000-01 2811 2845 5656
2009-10 3104 4894 7998
2010-11 3250 4981 8231
2011-12 3372 5294 8666
2012-13 3321 5720 9040
Source: Department of Animal Husbandry, Dairying & Fisheries.
Source: Department of Animal Husbandry Dairying & Fisheries.

Agricultural Inputs & Costs | 53
8Agricultural Inputs & Costs

Agricultural Inputs & Costs | 53
Table 8.1 Production and Use of Agricultural Inputs in India
Programme Unit 2000-01 2010-11 2011-12 2012-13 2013-14(1) (2) (3) (4) (5) (6) (7)
1. Seeds (i) Production of
Breeder Seeds Thousand qtl
42.69 118.85 123.38 110.20 82.29
(ii) Production of Foundation Seeds
Lakh qtl 5.91 17.53 21.86 16.17 17.43
(iii) Distribution of Certified/Quality Seeds
Lakh qtl 86.27 277.34 294.85 313.44 301.39
2. Consumption of Chemical Fertilisers Nitrogenous (N) Lakh
Tonnes109.20 165.58 173.00 168.21 167.5
Phosphatic(P) Lakh Tonnes
42.15 80.50 79.14 66.53 56.33
Potassic(K) Lakh Tonnes
15.67 35.14 25.26 20.62 20.99
Total (N+P+K) Lakh Tonnes
167.02 281.22 277.40 255.36 244.82
Per ha** kg 89.63 142.52 142.33 130.79 125.393. Consumption of Pesticides (Technical Grade Material)
Thousand Tonnes
43.58 55.54 52.98 45.62* 58.21*
4. Area Covered Under Soil Conservation (Cumulative)
Lakh Ha 4.36 7.49 4.72 5.46 NA
NA: Not Available, E: Estimated
*(as on 30.4.2014)
** Based on 2009-10 Provisional Gross Cropped Area.
Sources: 1) Department of Agriculture & Cooperation, New Delhi. 2) States/UTs Zonal Conference, Kharif & Rabi.

54 | Pocket Book of Agricultural Statistics 2014 Agricultural Inputs & Costs | 55
Tab
le 8
.2
Cons
umpt
ion,
Pro
duct
ion
and
Impo
rt o
f Fer
tilis
ers
(Lak
h To
nnes
)
Year
Cons
umpt
ion
Prod
uctio
nIm
port
sC
&.F
Val
ueof
Impo
rts
(` C
rore
)N
PK
TOTA
LN
PTO
TAL
NP
KTO
TAL
(1)
(2)
(3)
(4)
(5)
(6)
(7)
(8)
(9)
(10)
(11)
(12)
(13)
1981
-82
40.6
9 13
.22
6.73
60.6
4 31
.44
9.49
40
.93
10.5
4 3.
43
6.44
20
.41
716.
62
1990
-91
79.9
7 32
.21
13.2
812
5.46
69
.93
20.5
2 90
.45
4.14
10
.16
13.2
8 27
.58
1335
.82
2000
-01
109.
20
42.1
5 15
.67
167.
02 1
09.6
1 37
.43
147.
04
1.54
3.
96
15.4
1 20
.91
#
2010
-11
165.
5880
.50
35.1
428
1.22
221.
5642
.22
263.
7845
.64
37.3
838
.81
121.
8383
48.8
9
2011
-12
173.
0079
.14
25.7
627
7.90
122
.59
41.0
116
3.60
52.4
044
.27
33.3
513
0.02
1544
2.02
2012
-13
180.
3659
.55
18.1
325
8.04
121
.94
35.4
115
7.35
46.9
027
.78
12.3
086
.98
1598
0.22
2013
-14
165.
2554
.58
19.7
623
9.59
123.
7837
.14
160.
9238
.08
15.9
13.3
367
.31
-
# Th
ere
was
no
impo
rt o
f Ure
a in
200
0-01
, 200
2-03
and
200
3-04
in G
over
nmen
t acc
ount
.
Not
e: 1
. Fig
ures
rela
te to
impo
rts
mad
e on
Gov
t. Ac
coun
t onl
y.
2. T
he im
port
s m
ade
afte
r dec
anal
isat
ion
of p
hosp
hatic
fert
ilise
rs (w
.e.f.
17.
9.19
92) a
nd p
otas
sic
fert
ilise
rs (w
.e.f.
17.
6.19
93)
incl
ude
the
quan
titie
s im
port
ed b
y pr
ivat
e pa
rtie
s al
so.
Sour
ce: D
epar
tmen
t of F
ertil
iser
s.

54 | Pocket Book of Agricultural Statistics 2014 Agricultural Inputs & Costs | 55
Chart 8(a)Trends in Consumption, Production and Imports of Fertilizers in India
0.00
50.00
100.00
150.00
200.00
250.00
300.00(L
akh
Tonn
es)
Production ImportsConsumption
1981-82 1990-91 2000-01 2010-11 2011-12 2012-13 2013-14
Table 8.3 Zone-wise Consumption of Fertilizers ( Thousand Tonnes)
S.N. State/Zone 2010-11 2011-12 2012-13 2013-14(1) (2) (3) (4) (5) (6)
1 South Zone 7150.24 7266.62 5519.08 6004.82(212.01) (201.7) (153.19) (174.47)
2 West Zone 9152.32 8607.24 7636.3 8042.24(110.73) (95.40) (84.64) (91.51)
3 North Zone 7918.70 7872.37 8284.48 7039.97(187.29) (183.92) (192.32) (161.88)
4 East Zone 3588.57 3683.41 3775.01 3078.25(130.37) (157.18) (161.08) (132.57)
5 North East Zone
312.38 310.36 321.28 317.13(52.01) (49.97) (51.73) (50.84)
6 All India 28122.21 27740.00 25536.15 24482.41(146.32) (139.67) (128.34) (125.39)
Note: Figures in parentheses indicates estimated Consumption of Fertilizer per ha.
Source: Department of Agriculture and Cooperation, INM Division.
Source: Department of Fertilisers.
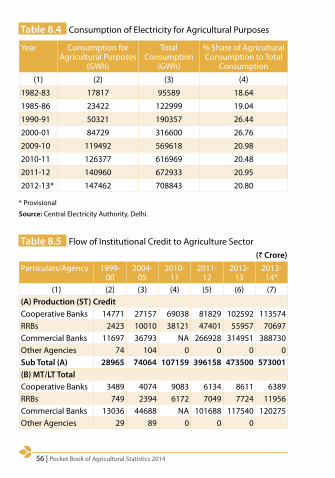
56 | Pocket Book of Agricultural Statistics 2014 Agricultural Inputs & Costs | 57
Table 8.4 Consumption of Electricity for Agricultural Purposes
Year Consumption for Agricultural Purposes
(GWh)
Total Consumption
(GWh)
% Share of Agricultural Consumption to Total
Consumption
(1) (2) (3) (4)
1982-83 17817 95589 18.64
1985-86 23422 122999 19.04
1990-91 50321 190357 26.44
2000-01 84729 316600 26.76
2009-10 119492 569618 20.98
2010-11 126377 616969 20.48
2011-12 140960 672933 20.95
2012-13* 147462 708843 20.80
* Provisional
Source: Central Electricity Authority, Delhi.
Table 8.5 Flow of Institutional Credit to Agriculture Sector (` Crore)
Particulars/Agency 1999-00
2004-05
2010-11
2011-12
2012-13
2013-14*
(1) (2) (3) (4) (5) (6) (7)(A) Production (ST) CreditCooperative Banks 14771 27157 69038 81829 102592 113574RRBs 2423 10010 38121 47401 55957 70697Commercial Banks 11697 36793 NA 266928 314951 388730Other Agencies 74 104 0 0 0 0Sub Total (A) 28965 74064 107159 396158 473500 573001(B) MT/LT TotalCooperative Banks 3489 4074 9083 6134 8611 6389RRBs 749 2394 6172 7049 7724 11956Commercial Banks 13036 44688 NA 101688 117540 120275Other Agencies 29 89 0 0 0
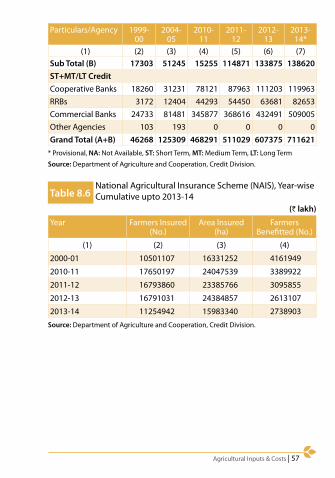
56 | Pocket Book of Agricultural Statistics 2014 Agricultural Inputs & Costs | 57
Particulars/Agency 1999-00
2004-05
2010-11
2011-12
2012-13
2013-14*
(1) (2) (3) (4) (5) (6) (7)Sub Total (B) 17303 51245 15255 114871 133875 138620ST+MT/LT CreditCooperative Banks 18260 31231 78121 87963 111203 119963RRBs 3172 12404 44293 54450 63681 82653Commercial Banks 24733 81481 345877 368616 432491 509005Other Agencies 103 193 0 0 0 0Grand Total (A+B) 46268 125309 468291 511029 607375 711621
Source: Department of Agriculture and Cooperation, Credit Division.
Table 8.6National Agricultural Insurance Scheme (NAIS), Year-wise Cumulative upto 2013-14
(` lakh)
Year Farmers Insured (No.)
Area Insured (ha)
Farmers Benefitted (No.)
(1) (2) (3) (4)
2000-01 10501107 16331252 4161949
2010-11 17650197 24047539 3389922
2011-12 16793860 23385766 3095855
2012-13 16791031 24384857 2613107
2013-14 11254942 15983340 2738903
* Provisional, NA: Not Available, ST: Short Term, MT: Medium Term, LT: Long Term
Source: Department of Agriculture and Cooperation, Credit Division.

58 | Pocket Book of Agricultural Statistics 2014 Agricultural Inputs & Costs | 59
Tab
le 8
.7
Cost
Est
imat
e of
Prin
cipa
l Cro
ps 2
011-
12
Crop
Stat
eCo
st o
f Cul
tivat
ion
(`/h
a)Co
st o
f Pro
duct
ion
( `/q
tl)Yi
eld
(qtl.
/ha)
A2+
FLC2
C2(1
)(2
)(3
)(4
)(5
)(6
)A
rhar
Mah
aras
htra
3248
2.97
4644
5.03
3138
.74
14.1
5Ka
rnat
aka
1118
5.71
1999
3.36
2426
.42
7.65
Mad
hya
Prad
esh
1606
7.60
2605
2.49
2642
.58
9.55
Bajra
Raja
stha
n13
117.
3816
867.
9193
1.01
11.3
Utt
ar P
rade
sh14
301.
8521
266.
8486
8.86
19.0
9G
ujar
at23
407.
5431
002.
9288
4.33
24.4
9Co
tton
Guj
arat
4146
8.38
5803
7.88
3267
.52
17.4
8M
ahar
asht
ra45
743.
3861
907.
4939
85.0
515
.34
And
hra
Prad
esh
3877
2.50
6163
4.00
3557
.48
17.3
2G
roun
dnut
Guj
arat
3290
5.07
4283
6.57
2916
.12
11.9
5A
ndhr
a Pr
ades
h 40
676.
2165
632.
1337
14.4
416
.99
Tam
il N
adu
3788
8.68
4791
5.18
3270
.77
13.5
9Jo
war
Mah
aras
htra
2415
0.05
3474
4.7
1523
.81
15.9
2Ka
rnat
aka
1373
4.25
2104
5.98
1778
.27
10.2
9Ta
mil
Nad
u14
766.
4020
393.
5915
59.8
66.
53M
aize
And
hra
Prad
esh
2797
5.52
4403
8.14
891.
5447
.28
Karn
atak
a24
790.
3336
272.
4590
1.33
37.4
6Ta
mil
Nad
u42
503.
1057
022.
8591
6.23
60.4
2M
oong
And
hra
Prad
esh
1069
2.69
2066
9.87
2855
.81
7.22
Mah
aras
htra
2085
3.94
2600
8.25
5072
.10
5.05
Cont
d...
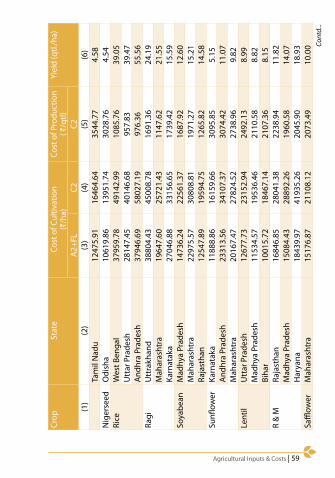
58 | Pocket Book of Agricultural Statistics 2014 Agricultural Inputs & Costs | 59
Crop
Stat
eCo
st o
f Cul
tivat
ion
(`/h
a)Co
st o
f Pro
duct
ion
( `/q
tl)Yi
eld
(qtl.
/ha)
A2+
FLC2
C2(1
)(2
)(3
)(4
)(5
)(6
)Ta
mil
Nad
u12
475.
9116
464.
6435
44.7
74.
58N
iger
seed
Odi
sha
1061
9.86
1395
1.74
3028
.76
4.54
Rice
Wes
t Ben
gal
3795
9.78
4914
2.99
1085
.76
39.0
5U
ttar
Pra
desh
2814
7.45
4014
6.68
957.
8339
.47
And
hra
Prad
esh
3794
6.69
5802
7.19
976.
3655
.56
Ragi
Utt
rakh
and
3880
4.43
4500
8.78
1691
.36
24.1
9M
ahar
asht
ra19
647.
6025
721.
4311
47.6
221
.55
Karn
atak
a27
046.
8833
156.
6517
39.4
215
.59
Soya
bean
Mad
hya
Prad
esh
1473
6.24
2256
1.37
1687
.92
12.6
0M
ahar
asht
ra22
975.
5730
808.
8119
71.2
715
.21
Raja
stha
n12
547.
8919
594.
7512
65.8
214
.58
Sunfl
ower
Karn
atak
a11
888.
8616
159.
6630
95.8
55.
15A
ndhr
a Pr
ades
h 23
313.
5634
107.
3730
74.4
211
.07
Mah
aras
htra
2016
7.47
2782
4.52
2738
.96
9.82
Lent
ilU
ttar
Pra
desh
1267
7.73
2315
2.94
2492
.13
8.99
Mad
hya
Prad
esh
1153
4.57
1953
6.46
2110
.58
8.82
Biha
r10
015.
7218
467.
1421
07.3
68.
15R
& M
Raja
stha
n16
846.
8528
041.
3822
38.9
411
.82
Mad
hya
Prad
esh
1508
4.43
2889
2.26
1960
.58
14.0
7H
arya
na18
439.
9741
935.
2620
45.9
018
.93
Saffl
ower
Mah
aras
htra
1517
6.87
2110
8.12
2073
.49
10.0
0 Cont
d...

60 | Pocket Book of Agricultural Statistics 2014 Agricultural Inputs & Costs | 61
Crop
Stat
eCo
st o
f Cul
tivat
ion
(`/h
a)Co
st o
f Pro
duct
ion
( `/q
tl)Yi
eld
(qtl.
/ha)
A2+
FLC2
C2(1
)(2
)(3
)(4
)(5
)(6
)W
heat
Utt
ar P
rade
sh26
001.
2742
383.
5793
0.55
37.5
2Pu
njab
2571
1.09
4929
8.84
888.
5549
.51
Mad
hya
Prad
esh
1787
1.12
3339
6.15
851.
9533
.6Ju
teA
ssam
3711
8.76
4755
8.94
2011
.34
22.3
5O
dish
a39
329.
1450
522.
6922
85.2
520
.36
Wes
t Ben
gal
4012
2.51
5408
5.15
1973
.31
23.9
2O
nion
And
hra
Prad
esh
5823
3.64
9364
0.80
636.
0214
6.88
Guj
arat
6184
3.81
7165
0.55
461.
9015
4.63
Mah
aras
htra
7076
1.25
9182
7.13
353.
1125
5.48
Suga
rcan
e U
ttar
Pra
desh
4312
9.23
7854
9.41
141.
1352
9.05
Mah
aras
htra
1022
89.8
214
6726
.70
138.
6410
08.5
5Ka
rnat
aka
5906
9.94
9458
5.62
122.
9675
3.51
Pota
toBi
har
4592
5.51
5299
2.70
320.
1516
5.52
Utt
ar P
rade
sh47
551.
6964
763.
4743
5.92
148.
57W
est B
enga
l79
585.
0210
8621
.30
423.
7725
6.32
Not
e: 1
. Cos
t A2
incl
udes
all
actu
al e
xpen
ses
in c
ash
and
kind
incu
rred
in p
rodu
ctio
n by
ow
ner a
nd re
nt p
aid
for l
ease
d in
land
.
2. C
ost C
2 in
clud
es a
ll ac
tual
exp
ense
s in
cas
h an
d ki
nd in
curr
ed in
pro
duct
ion
by o
wne
r,int
eres
t on
valu
e of
ow
ned
fixed
cap
ital
asse
ts (i
nclu
ding
land
), re
ntal
val
ue o
f ow
ned
land
(net
of l
and
reve
nue)
, ren
t pai
d fo
r lea
sed
in la
nd a
nd im
pute
d va
lue
of
fixed
cap
ital a
sset
s.
3.
FL:
Fam
ily L
abou
r, is
impu
ted
on th
e ba
sis
of s
tatu
tory
wag
e ra
te o
r the
act
ual m
arke
t rat
e w
hich
ever
is h
ighe
r.
Sour
ce: D
irect
orat
e of
Eco
nom
ics
and
Stat
istic
s, D
epar
tmen
t of A
gric
ultu
re a
nd C
oope
ratio
n.

60 | Pocket Book of Agricultural Statistics 2014 Agricultural Inputs & Costs | 61
Table 8.8All-India projected Cost of Production (C2) of Principal crops in India
(` per qtl)S. N.
Commodity 2009-10
2010-11
2011-12
2012-13
2013-14
2014-15
(1) (2) (3) (4) (5) (6) (7) (8)Kharif Crops1 Paddy 645 742 888 1152 1234 12672 Jowar 804 965 1141 1612 1648 17883 Bajra 658 768 840 1059 1003 10754 Maize 738 790 921 1070 1112 11655 Ragi 861 1107 1271 1884 1687 17946 Arhar(Tur) 2197 2422 2702 4167 3958 42147 Moong 2705 3109 3373 4699 4759 49718 Urad 2257 2490 2799 4334 4112 43179 Cotton 2111 2129 2528 2772 3533 348010 Groundnut In Shell 1879 2100 2633 3714 3398 388011 Sunflower Seed 1915 2257 2795 3698 3679 386312 Soyabeen (Black) 1200 1298 1560 2343 2216 222613 Sesamum 3035 2847 3393 4186 4134 481214 Nigerseed 2368 2264 2945 4555 3628 3480Rabi Crops**1 Wheat 701 826 927 1066 1109 11472 Barley 608 677 734 862 1035 10653 Gram 1641 1902 2121 2328 2865 29814 Masur (Lentil) 1626 2191 2592 3162 2760 29525 Rapeseed/Mustard 1276 1520 1786 1987 2368 24556 Safflower 1884 2038 3322 3338 3501 3685Other Crops1 Jute 1193 1301 1496 1808 2160 22512 Sugarcane 81 90 102 148 185 193.13*
Note: For Kharif crops projected cost for 2014-15 crop season is excluding the cost of marketing, transportation and crop insurance premium. ** For RMS (2015-16), * Adjusted for recovery.
Source: Price Policy Reports of Commission for Agricultural Costs and Prices.

62 | Pocket Book of Agricultural Statistics 2014
Tab
le 8
.9
All
Indi
a A
nnua
l Ave
rage
Dai
ly W
age
Rate
for v
ario
us A
gric
ultu
ral O
pera
tions
(in
`)
Crop
Yea
rPl
ough
ing
Sow
ing
Wee
ding
Tran
spla
ntin
gH
arve
stin
g Ag
ri. W
ages
Mal
eFe
mal
eM
ale
Fem
ale
Mal
eFe
mal
eM
ale
Fem
ale
Mal
eFe
mal
eM
ale
Fem
ale
(1)
(2)
(3)
(4)
(5)
(6)
(7)
(8)
(9)
(10)
(11)
(12)
(13)
2006
-07
81.7
942
.37
73.2
941
.41
64.9
752
.82
69.1
756
.44
68.4
555
.69
71.5
349
.75
2007
-08
91.3
849
.96
79.2
857
.18
70.0
758
.27
73.7
961
.93
75.2
462
.31
77.9
557
.93
2008
-09
102.
9055
.43
90.0
065
.00
80.1
568
.02
83.2
871
.43
87.0
571
.58
88.6
866
.29
2009
-10
120.
8570
.43
104.
5279
.47
92.7
878
.94
98.2
986
.71
102.
8284
.95
103.
8580
.10
2010
-11
145.
5187
.23
125.
7598
.17
111.
2295
.79
120.
1910
4.17
122.
5310
2.36
125.
0497
.54
2011
-12
170.
4799
.09
152.
0712
0.14
134.
0111
7.67
140.
1412
4.79
148.
4912
3.29
149.
0411
7.00
2012
-13
204.
1112
1.25
177.
3614
1.17
158.
8713
9.31
165.
1714
6.84
176.
1714
4.83
176.
3413
8.68
Not
e: 1
. All
Indi
a an
nual
ave
rage
is c
alcu
late
d fo
r 20
maj
or S
tate
s., 2
. Agr
i. W
age
is a
vera
ge o
f five
ope
ratio
ns.
Sour
ce: L
abor
Bur
eau
0.00
20.0
040
.00
60.0
080
.00
100.
0012
0.00
140.
0016
0.00
180.
0020
0.00
Avg. Wage Rate (`)
2006
-07
2007
-08
2008
-09
2009
-10
2010
-11
2011
-12
2012
-13
Mal
e W
age
Rate
(Ave
rage
)Fe
mal
e W
age
Rate
(Ave
rage
)
Cha
rt 8
(b)
Tre
nds
in A
vera
ge D
aily
Wag
e Ra
te o
f Mal
e &
Fem
ale
Wor
kers
in A
gric
ultu
ral O
pera
tions

62 | Pocket Book of Agricultural Statistics 2014
9Prices
& Procurement

64 | Pocket Book of Agricultural Statistics 2014 Prices & Procurement | 65
Table 9.1Minimum Support Prices of various Agricultural Commodities (According to Crop Year)
(As on 29.10.2014) (` Per qtl)S. N. Commodity Variety 2011-12 2012-13 2013-14 2014-15(1) (2) (3) (4) (5) (6) (7)
Kharif Crops1 Paddy Common 1080 1250 1310 1360
Grade 'A' 1110 1280 1345 14002 Jowar Hybrid 980 1500 1500 1530
Maldandi 1000 1520 1520 15503 Bajra 980 1175 1250 12504 Maize 980 1175 1310 13105 Ragi 1050 1500 1500 15506 Arhar(Tur) 3200# 3850 4300 43507 Moong 3500# 4400 4500 46008 Urad 3300# 4300 4300 43509 Cotton Medium
Staple2800ª 3600 3700 3750
Long Staple 3300ªª 3900 4000 405010 Groundnut in
shell2700 3700 4000 4000
11 Sunflower Seed
2800 3700 3700 3750
12 Soyabeen Black 1650 2200 2500 2500Yellow 1690 2240 2560 2560
13 Sesamum 3400 4200 4500 460014 Nigerseed 2900 3500 3500 3600Rabi Crops15 Wheat 1285 1350 1400 145016 Barley 980 980 1100 115017 Gram 2800 3000 3100 317518 Masur (Lentil) 2800 2900 2950 307519 Rapeseed/
Mustard2500 3000 3050 3100
20 Safflower 2500 2800 3000 305021 Toria 2425 2970 3020 3020Other Crops22 Copra
(Calendar Year)Milling 4525 5100 5250 5250Ball 4775 5350 5500 5500
Contd...

64 | Pocket Book of Agricultural Statistics 2014 Prices & Procurement | 65
S. N. Commodity Variety 2011-12 2012-13 2013-14 2014-1523 De-Husked
Coconut (Calendar Year)
1200 1400 1425 1425
24 Jute 1675 2200 2300 240025 Sugarcane* 145.00 170.00 210.00 220.00ª Staple length (mm) of 24.5 - 25.5 and Micronaire value of 4.3 - 5.1.ªª Staple length (mm) of 29.5 - 30.5 and Micronaire value of 3.5 - 4.3.# Additional incentive at the rate of ` 500 per qtl of tur, urad and moong sold to
procurement agencies was payable during the harvest/arrival period of two months.* Fair and remunerative price.Source: Directorate of Economics and Statistics, Department of Agriculture and Cooperation.
*Position upto 23.07.2014, **Position upto 16.07.2014 for RMS 2014-15, Neg: Below 500 tonnes. Source: Department of Food and Public Distribution.
Table 9.2 State-wise Procurement of Rice and Wheat in Major Rice and Wheat Producing States
(‘000 Tonnes)State 2011-12 2012-13 2013-14 2014-15*
(1) (2) (3) (4) (5)Rice (Oct-Sept)Andhra Pradesh 7540 6464 3647Punjab 7731 8558 4830Chhattisgarh 4115 4804 4289Uttar Pradesh 3355 2286 1127Odisha 2864 3613 2819Haryana 2007 2609 1985Tamil Nadu 1596 481 35West Bengal 2036 1766 1087Madhya Pradesh 635 898 1044Uttrakhand 378 497 463Others 2769 2044 5495All-India 35026 34020 23174Wheat (April-March)**Punjab 10958 12834 10897 11641Haryana 6928 8665 5873 6495Madhya Pradesh 4965 8493 6355 7094Uttar Pradesh 3461 5063 682 628Rajasthan 1303 1964 1268 2158Bihar 557 772 0 0Others 163 357 16 5All-India 28335 38148 25092 28022

66 | Pocket Book of Agricultural Statistics 2014 Prices & Procurement | 67
Table 9.3 Wholesale Price Index of Major Food Articles andProducts (Base: 2004-05 = 100)
Commodity Weight 2010-11 2011-12 2012-13 2013-14(1) (2) (3) (4) (5) (6)
All Commodities 100.00 143.32 156.13 167.62 177.64I Primary Articles 20.12 182.44 200.32 219.97 241.61(A) Food Articles 14.34 179.63 192.74 211.82 238.85A. Food Grains
(Cereals+Pulses)4.09 174.43 180.72 207.13 225.97
a1. Cereals 3.37 169.67 176.23 199.87 225.53 Rice 1.79 167.19 172.29 194.16 226.22 Wheat 1.12 171.44 168.29 194.39 212.27 a2. Pulses 0.72 196.86 201.82 241.32 228.00 Gram 0.33 149.97 193.78 266.31 217.28 Arhar 0.14 205.06 183.20 199.35 212.28 Urad 0.10 271.75 240.00 227.67 234.32b. Fruits & Vegetables 3.84 172.05 183.15 198.40 244.26 a1. Vegetables 1.74 182.83 179.26 210.08 294.45 Potato 0.20 131.95 128.98 206.95 220.08 Onion 0.18 259.60 186.67 232.51 482.22 a2. Fruits 2.11 163.17 186.37 188.79 202.92 Banana 0.34 163.01 173.42 210.53 246.64 Mango 0.65 191.52 237.15 219.68 191.47 Apple 0.10 173.59 220.38 241.42 228.61 Orange 0.13 185.32 237.35 228.29 208.85c. Milk 3.24 175.88 194.01 208.05 220.63d. Eggs,Meat & Fish 2.41 190.13 214.33 244.52 275.74e. Condiments & Spices 0.57 243.98 237.53 209.50 245.58 Chillies(Dry) 0.16 221.80 277.12 235.13 267.04 Turmeric 0.08 401.72 214.87 166.32 215.28f. Other Food Articles 0.18 181.94 216.45 242.19 229.11 Tea 0.11 148.33 150.85 198.56 196.11 Coffee 0.07 235.01 320.08 311.09 281.22(B) Non-Food Articles 4.26 166.63 182.70 201.92 213.23a. Fibres 0.88 198.38 218.39 208.32 239.73b. Oil Seeds 1.78 141.33 158.75 198.02 202.59
Contd...

66 | Pocket Book of Agricultural Statistics 2014 Prices & Procurement | 67
Commodity Weight 2010-11 2011-12 2012-13 2013-14(1) (2) (3) (4) (5) (6)
Groundnut Seed 0.40 164.82 200.02 246.92 219.13 Rape & Mustard Seed 0.34 135.09 149.77 202.65 189.28 Copra (Coconut) 0.25 92.92 112.92 92.36 117.38c. OTHER NON-FOOD
ARTICLES1.39 176.71 195.30 211.13 213.54
d. FLOWERS 0.21 181.91 153.91 148.46 190.78II MANUFACTURED
PRODUCTS64.97 130.07 139.51 147.06 151.46
(A) FOOD PRODUCTS 9.97 141.15 151.20 163.49 168.79a. DAIRY PRODUCTS 0.57 152.07 171.60 176.05 180.39 Powder Milk 0.20 150.22 176.99 180.73 182.78 Ghee 0.22 163.71 184.83 188.31 193.22b. CANNING,
PRESERVING & PROCESSING OF FOOD
0.36 127.21 139.58 143.96 164.92
Canned Fish 0.06 136.59 151.49 156.51 149.58 Fish Meal 0.06 100.20 113.11 119.35 113.58 Processed Prawn 0.12 122.53 128.92 124.23 183.34 Wheat Flour ( Atta) 0.39 158.94 163.94 171.80 196.65c. GRAIN MILL PRODUCTS 1.34 145.79 146.19 156.00 167.91d. BAKERY PRODUCTS 0.44 126.25 127.19 129.97 139.21 Biscuit/Cookies 0.35 121.02 121.63 123.01 130.78 Bread & Buns 0.06 147.45 145.46 153.31 166.54e. SUGAR, KHANDSARI
& GUR2.09 160.50 167.72 185.74 183
Sugar 1.74 165.02 173.44 193.10 188.42 Gur 0.08 197.20 197.15 217.14 220.05 Khandsari 0.06 159.87 170.90 183.65 182.01 Molasses 0.13 105.10 103.46 102.28 116.08f. EDIBLE OILS 3.04 120.58 135.72 148.11 146.95 Vanaspati 0.71 116.32 121.40 125.62 126.19 Groundnut Oil 0.30 145.25 163.83 192.58 181.59 Palm Oil 0.42 111.30 119.74 124.78 126.25 Rice Bran Oil 0.18 120.12 146.82 154.12 151.23 Cotton Seed Oil 0.26 124.31 149.52 175.48 176.83
Contd...

68 | Pocket Book of Agricultural Statistics 2014
Chart 9(a) Comparison of Inflation from WPI and CPI14.0
12.0
10.0
8.0
6.0
4.0
2.0
0.0
Jan-
13
YoY
Infla
tion
(%)
Feb-
13
Mar
-13
Apr
-13
May
-13
June
-13
July
-13
Aug-
13
Sep-
13
Oct
-13
Nov
-13
Dec
-13
Jan-
14
Feb-
14
Mar
-14
Apr
-14
May
-14
June
-14
July
-14
Aug-
14
Sep-
14
Oct
-14
Nov
-14
CPI-Rural CPI-UrbanWPI-All Commodities (2004-05=100)CPI-Combined (2010=100)
0
2
4
6
8
10
12
(YoY
) Infl
atio
n (%
)
All Commodities Food Articles Food Products
Jan-2014
Feb-2014
Mar-2014
Apr-2014
May-2014
Jun-2014
Jul-2014
Aug-2014
Sep-2014
Oct-2014
Nov-2014
Chart 9(b) Trends in Inflation (WPI) of Food Products, Food Articles and All Commodities
Commodity Weight 2010-11 2011-12 2012-13 2013-14(1) (2) (3) (4) (5) (6)
Mustard & Rapeseed Oil 0.45 116.30 135.89 154.22 154.01 Soyabean Oil 0.38 125.57 147.17 162.18 159.16 Copra Oil 0.10 100.08 119.87 114.39 121.16Source: Office of Economic Adviser, M/o Commerce & Industry.

68 | Pocket Book of Agricultural Statistics 2014
10Per-Capita
Availability & Expenditure

70 | Pocket Book of Agricultural Statistics 2014 Per-Capita Availability & Expenditure | 71
Table 10.1 Per Capita Net Availability of Foodgrains (Per Annum) in India
(kg Per Year), (as on 06.03.2014)Year Rice Wheat Other
CerealsCereals Gram Pulses Food
Grains(1) (2) (3) (4) (5) (6) (7) (8)
1951 58.0 24.0 40.0 122.0 8.2 22.1 144.11961 73.4 28.9 43.6 145.9 11.0 25.2 171.11971 70.3 37.8 44.3 152.4 7.3 18.7 171.11981 72.2 47.3 32.8 152.3 4.9 13.7 166.01991 80.9 60.0 29.2 171.0 4.9 15.2 186.22001 69.5 49.6 20.5 141.0 2.9 10.9 151.92011 66.3 59.7 23.9 .149.9 5.3 15.7 165.62012 69.4 57.7 21.9 149.0 4.9 15.2 164.22013(P) 84.8 66.9 19.4 171.2 5.6 15.3 186.4
P- ProvisionalNote: 1. The net availability of foodgrains is estimated to be Gross Production (-)
seed, feed & wastage, (-) exports (+) imports, (+/-) change in stocks. The net availability of foodgrains divided by the population estimates for a particular year indicate per capita availability of foodgrains in terms of kg/year.
2. For calculation of per capita net availability the figures of net imports from 1981 to 1994 are based on imports and exports on Government of India account only. Net imports from 1995 onwards are the total exports and imports (on Government as well as private accounts).
Source: Directorate of Economics and Statistics, Department of Agriculture and Cooperation.
P: Provisional, NA: Not Available Note: a: Includes Groundnut Oil, Rapeseed and mustard Oil, Sesamum Oil, Nigerseed Oil,
Soyabean oil and Sunflower oil but excludes oil for manufacture of vanaspati.
Table 10.2 Per Capita Availability of Certain Important Articles of Consumption
Year EdibleOilsa
(kg)
Vana-spatib
(kg)
Sugar(Nov-Oct) (kg)c
Cloth (meters)d Tea (gm)
Coffee (gm)Cottone Man-
madeTotal
(1) (2) (3) (4) (5) (6) (7) (8) (9)1980-81 3.8 1.2 7.3 12.9 4.4 17.3 511 791990-91 5.5 1.0 12.7 15.1 9.0 24.1 612 592000-01 8.2 1.3 15.8 14.2 16.5 30.7 631 582009-10 13.3 1.1 17.9 19.7 23.4 43.1 709 862010-11 13.6 1.0 17.0 21.4 22.6 44.0 715 902011-12 13.8 1.0 18.7 19.8 20.7 40.5 728 952012-13 (P) 15.8 0.7 18.7 19.9 18.6 38.5 NA NA

70 | Pocket Book of Agricultural Statistics 2014 Per-Capita Availability & Expenditure | 71
b: Relates to calendar year. c: Relates to actual releases for domestic consumption. d: The data of cloth; prior to 1980-81 is calendar year wise, in meters up to 1984-
85 and square meter from 1985-86 onwards. e: Figures for blended/mixed fabrics were not separately available prior to 1969.
These have been included under man-made fibre fabrics after 1969.Source: Economic Survey 2013-14.
Table 10.3 Trends in Consumer Expenditure since 2004-05 (percentage composition)
Item group Rural UrbanShare in total consumer
expenditure Share in total consumer
expenditure 2004-05 2009-10 2011-12 2004-05 2009-10 2011-12
(1) (2) (3) (4) (5) (6) (7)Cereal 18.0 15.6 12.0 10.1 9.1 7.3Gram 0.1 0.2 0.2 0.1 0.1 0.1Cereal substitutes 0.1 0.1 0.1 0.0 0.0 0.1Pulses & products 3.1 3.7 3.1 2.1 2.7 2.1Milk & products 8.5 8.6 9.1 7.9 7.8 7.8Edible oil 4.6 3.7 3.8 3.5 2.6 2.7Egg fish & meat 3.3 3.5 3.6 2.7 2.7 2.8Vegetables 6.1 6.2 4.8 4.5 4.3 3.4Fruits & nuts 1.9 1.6 1.9 2.2 2.1 2.3Sugar 2.4 2.4 1.8 1.5 1.5 1.2Salt & spices 2.5 2.4 2.4 1.7 1.5 1.7Beverages, etc. 4.5 5.6 5.8 6.2 6.3 7.1Food Total 55.0 53.6 48.6 42.5 40.7 38.6Pan, tobacco, intox. 2.7 2.2 2.4 1.6 1.2 1.4Fuel & light 10.2 9.5 9.2 9.9 8.0 7.6Clothing & bedding 4.5 4.9 6.3 4.0 4.7 5.3Footwear 0.8 1.0 1.3 0.7 0.9 1.2Misc. & services 23.4 24.0 26.1 37.2 37.8 39.7Durable goods 3.4 4.8 6.1 4.1 6.7 6.3Non-food Total 45.0 46.4 51.4 57.5 59.3 61.5Total expenditure 100.0 100.0 100.0 100.0 100.0 100.0
Note: Figures may not tally due to rounding off.Source: NSSO, M/O Statistics & Programme Implementation , Key Indicators of
Household Consumer Expenditure NSSO 68th Round Survey (July'11 - June'12).

Key Indicators of Situation of Agricultural Households in India | 73
11Key Indicators
of Situation of Agricultural Households in India

Key Indicators of Situation of Agricultural Households in India | 73
Tabl
e 11
.1Es
timat
ed N
umbe
r of R
ural
Hou
seho
lds,
Agric
ultu
ral H
ouse
hold
s an
d In
debt
ed
Agric
ultu
ral H
ouse
hold
s
Stat
e Es
timat
ed
Num
ber o
f Rur
al
Hou
seho
lds
('00)
Estim
ated
Num
ber
of A
gric
ultu
ral
Hou
seho
lds
('00)
Agric
ultu
ral
Hou
seho
lds a
s pe
rcen
tage
of r
ural
ho
useh
olds
(%)
Estim
ated
Num
ber
of A
gric
ultu
ral
Hou
seho
lds
havi
ng lo
an ('
00)
% o
f Agr
icul
tura
l H
ouse
hold
s in
debt
ed
(1)
(2)
(3)
(4)
(5)
(6)
And
hra
Prad
esh*
8676
335
968
41.5
3342
192
.9A
runa
chal
Pra
desh
1659
1080
65.1
206
19.1
Ass
am52
494
3423
065
.259
9517
.5Bi
har
1406
1170
943
50.5
3015
642
.5Ch
hatt
isga
rh37
472
2560
868
.395
3837
.2G
ujar
at58
719
3930
566
.916
743
42.6
Har
yana
2584
915
693
60.7
6645
42.3
Him
acha
l Pra
desh
1325
188
1166
.524
5727
.9Ja
mm
u &
Kas
hmir
1374
611
283
82.1
3463
30.7
Jhar
khan
d37
516
2233
659
.564
6428
.9Ka
rnat
aka
7743
042
421
54.8
3277
577
.3Ke
rala
5137
714
043
27.3
1090
877
.7M
adhy
a Pr
ades
h84
666
5995
070
.827
414
45.7
Mah
aras
htra
1251
8270
970
56.7
4067
257
.3M
anip
ur25
8417
6268
.242
123
.9Co
ntd.
..
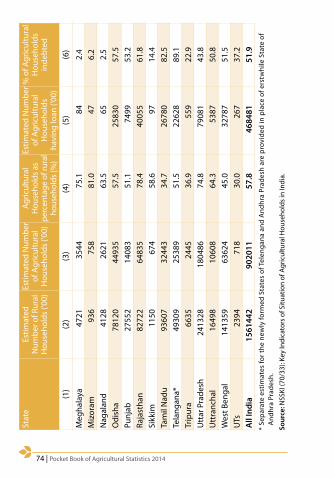
74 | Pocket Book of Agricultural Statistics 2014 Key Indicators of Situation of Agricultural Households in India | 75
Stat
e Es
timat
ed
Num
ber o
f Rur
al
Hou
seho
lds
('00)
Estim
ated
Num
ber
of A
gric
ultu
ral
Hou
seho
lds
('00)
Agric
ultu
ral
Hou
seho
lds a
s pe
rcen
tage
of r
ural
ho
useh
olds
(%)
Estim
ated
Num
ber
of A
gric
ultu
ral
Hou
seho
lds
havi
ng lo
an ('
00)
% o
f Agr
icul
tura
l H
ouse
hold
s in
debt
ed
(1)
(2)
(3)
(4)
(5)
(6)
Meg
hala
ya47
2135
4475
.184
2.4
Miz
oram
936
758
81.0
476.
2N
agal
and
4128
2621
63.5
652.
5O
dish
a78
120
4493
557
.525
830
57.5
Punj
ab27
552
1408
351
.174
9953
.2Ra
jast
han
8272
264
835
78.4
4005
561
.8Si
kkim
11
5067
458
.697
14.4
Tam
il N
adu
9360
732
443
34.7
2678
082
.5Te
lang
ana*
4930
925
389
51.5
2262
889
.1Tr
ipur
a66
3524
4536
.955
922
.9U
ttar
Pra
desh
2413
2818
0486
74.8
7908
143
.8U
ttra
ncha
l16
498
1060
864
.353
8750
.8W
est B
enga
l14
1359
6362
445
.032
787
51.5
UTs
2394
718
30.0
267
37.2
All
Indi
a15
6144
290
2011
57.8
4684
8151
.9*
Sepa
rate
est
imat
es fo
r the
new
ly fo
rmed
Sta
tes
of T
elen
gana
and
And
hra
Prad
esh
are
prov
ided
in p
lace
of e
rstw
hile
Sta
te o
f A
ndhr
a Pr
ades
h.
Sour
ce: N
SSKI
(70/
33):
Key
Indi
cato
rs o
f Situ
atio
n of
Agr
icul
tura
l Hou
seho
lds
in In
dia.

74 | Pocket Book of Agricultural Statistics 2014 Key Indicators of Situation of Agricultural Households in India | 75
Source: Key Indicators of Situation of Agricultural Households in India, NSS- 70th Round (Jan-Dec 2013).
* Others’ include pension and remittance also.
Source: Key Indicators of Situation of Agricultural Households in India, NSS- 70th
Round (Jan-Dec 2013).
ST13.4%
SC16.3%
OBC45.4%
Others24.9%
Cultivation63.4%Other Agri
Activity 1.1%
Wage/Salaried
Employment22.0%
Others*5.1%
Non-AgriculturalEnterprise 4.7%
Livestock3.7%
Chart 11(a) Distribution of Agricultural Households over Social Groups
Chart 11(b) Percentage Distribution of Agricultural Households by principal source of income

76 | Pocket Book of Agricultural Statistics 2014 Key Indicators of Situation of Agricultural Households in India | 77
Table 11.2Indebtedness of Agricultural Households (all-India) in Different Size Classes of Land Possessed
Land Possessed (ha)
Estimated Number of Agricultural Households
(lakh)
% to Total
in each Class
Estimated No. of Indebted Agricultural Households
(lakh)
% to Total
in each Class
% of Indebted
Agricultural Households
to Total
Average Outstanding
LoanAmount
(`)(1) (2) (3) (4) (5) (6) (7)
< 0.01 23.89 2.65 10.02 2.1 41.9 311000.01-0.40 287.66 31.89 135.97 29.0 47.3 239000.41-1.00 314.81 34.90 152.16 32.5 48.3 354001.01-2.00 154.58 17.14 86.11 18.4 55.7 548002.01-4.00 84.35 9.35 56.10 12.0 66.5 949004.01-10.00 33.02 3.66 25.21 5.4 76.3 18270010 & above 3.71 0.41 2.92 0.6 78.7 290300All India 902.01 100.00 468.48 100.0 51.9 47000Source : NSS KI (70/33), Key Indicators of Situation of Agricultural Households in India.
*Separate estimates for the newly formed States of Telengana and Andhra Pradesh are provided in place of erstwhile State of Andhra Pradesh, # separate figure for Telangana is not available, Telangana share is included in Andhra Pradesh figure.
Source: NSSKI(70/33): Key Indicators of Situation of Agricultural Households in India.
Table 11.3 Incidence of Indebtedness in Major States
State Estimated Number of Indebted Agricultural Households
% to Total Indebted
Agricultural Households
% Share in Total Foodgrains (2013-14)
Area Production
(1) (2) (3) (4) (5)Uttar Pradesh 79081 16.9 16.05 18.9Maharashtra 40672 8.7 9.22 5.26Madhya Pradesh 27414 5.9 11.85 9.15Rajasthan 40055 8.5 10.64 6.91Karnataka 32775 7.0 5.95 4.6Andhra Pradesh* 33421 7.1 6.04 7.59Telangana* 22628 4.8 # #Bihar 30156 6.4 5.29 4.97West Bengal 32787 7.0 4.95 6.44Punjab 7499 1.6 5.2 10.92Odisha 25830 5.5 4.09 3.15Other States/UTs 96163 20.5 20.72 22.11All India 468481 100 100 100

76 | Pocket Book of Agricultural Statistics 2014 Key Indicators of Situation of Agricultural Households in India | 77
Table 11.4 Incidence of Indebtedness based on size of land possessed
State % of Marginal Indebted
Agricultural Households (upto 1.0 ha
of land)
% of Small Indebted
Agricultural Households (1.01 to 2.00
ha)
% of Semi-Medium Indebted
Agricultural Household
(2.01 to 4.00 ha)
% of Medium Indebted
Agricultural Households
(4.01 to 10.00 ha)
% of Large Indebted
Agricultural Households (>10.00 ha)
(1) (2) (3) (4) (5) (6)U.P. 77.2 13.4 7.1 2.1 0.2Maharashtra 35.6 29.3 22.8 11.6 0.7M.P. 42.3 27.4 21.4 7.5 1.3Rajasthan 50.9 18.3 16.8 12.1 1.9Karnataka 52 24.4 14.8 7.4 1.3A.P.* 52.2 23.9 16.1 6.9 0.9Telangana* 51 23.6 19.6 5 0.9Bihar 86.7 10 2.6 0.7 0West Bengal 91.1 7.4 1.4 0.1 0Punjab 46.2 15.9 17.9 17.6 2.4Odisha 78.7 15.2 4.3 1.8 0.1All India 63.6 18.4 12 5.4 0.6*Separate estimates for the newly formed States of Telengana and Andhra Pradesh are provided in place of erstwhile State of Andhra Pradesh
Source: NSS 70th round SAS Survey.
Table 11.5Average monthly expenses and receipts for crop Production per agricultural household for major States during July’ 2012-June’13
State Average Total
Expenses (`)
Average Total
Receipts (`)
No. per 1000 households
engaged in crop production
Estimated No. of Households
engaged in Crop Production (00)
(1) (2) (3) (4) (5)Andhra Pradesh 6191 8482 883 31747Assam 788 5197 955 32689Bihar 1454 3358 900 63872Chhattisgarh 1128 4551 978 25035Gujarat 2250 5773 832 32787Haryana 6228 17144 721 11310Jharkhand 571 2049 982 21939Karnataka 2779 7908 961 40770Kerala 2270 5872 980 13765Madhya Pradesh 2284 6538 944 56604
Contd...

78 | Pocket Book of Agricultural Statistics 2014
State Average Total
Expenses (`)
Average Total
Receipts (`)
No. per 1000 households
engaged in crop production
Estimated No. of Households
engaged in Crop Production (00)
(1) (2) (3) (4) (5)Maharashtra 2654 6675 959 68051Odisha 1001 2438 979 43999Punjab 11768 28117 664 9357Rajasthan 1730 5192 906 58705Tamil Nadu 2538 5012 775 25148Telangana 4267 8666 961 24397Uttar Pradesh 1790 4912 914 165029West Bengal 1819 2836 962 61206All India 2192 5542 920 829485Source: Key Indicators of Situation of Agricultural Households in India, NSS- 70th Round
(Jan-Dec 2013).
Table 11.6Average monthly expenses and receipts for farming of animals per agricultural household for major States during Jul’ 2012- Jun’13
State Average Total
Expenses (`)
Average Total
Receipts (`)
No. per 1000 households engaged in
farming of animals
Estimated No. of Households
engaged in farming of animals (00)
(1) (2) (3) (4) (5)Andhra Pradesh 1405 3619 486 17478Assam 627 1890 633 21661Bihar 1324 1810 574 40743Chhattisgarh 491 426 298 7624Gujarat 2399 4874 780 30726Haryana 3256 6089 933 14649Jharkhand 283 2420 558 12478Karnataka 1524 2485 624 26452Kerala 2249 3356 519 7288Madhya Pradesh 914 2210 565 33881Maharashtra 2118 3039 586 41572Odisha 501 2919 544 24432Punjab 3561 5303 952 13412Rajasthan 1868 3131 766 49626Tamil Nadu 1370 3196 603 19556Telangana 1044 1994 394 9995Uttar Pradesh 1068 1845 699 126168West Bengal 916 1261 652 41506All India 1388 2604 627 565620
Source: Key Indicators of Situation of Agricultural Households in India, NSS- 70th Round (Jan-Dec 2013).
78 | Pocket Book of Agricultural Statistics 2014
12Demand-Supply
Projections

80 | Pocket Book of Agricultural Statistics 2014 Demand-Supply Projections | 81
Table 12.1Projected Demand and Supply of Food Commodities for the 12th Plan period
(in million tonnes)
Crop/Group of Crops
Projected Demand Projected Supply
Actual Production
2016-17 2020-21 2016-17 2006-07 2011-12(1) (2) (3) (4) (5) (6)
Rice 110 117 98-106 93 104*Wheat 89 98 93-104 76 94*Maize 19 22 15 22*Coarse Cereals 36 38 42-48 34 42*Cereals 235 253 240-251 203 240*Pulses 22 25 18-21 14 17*Foodgrains 257 277 258-272 217 257*Oilseeds/Edible oils
59 71 33-41 24 30*
Sugarcane/Sugar
279 312 365-411 355 358*
Vegetables 161 189 116 147**Fruits 97 124 59 75**Milk 141 173 103 122**Fish 11 6.9 8.3**Meat, other than poultry
3.7 5.0 2.3 2.7**
Poultry Meat 3.3 4.3 2.2 @* 4th advance estimate for 2011-12
** Production for the year 2010-11
@ Production 2010-11 for only commercial poultry meat.
Source: 12th Plan Document, Planning Commission.

80 | Pocket Book of Agricultural Statistics 2014 Demand-Supply Projections | 81
Table 12.2Average Annual Growth Rate of Production of Selected Food Commodities in India: Actual Production Trends in 2008–12 and Projections
Commodities Average (% YoY)
OECD/ FAO Projections, June 2013
Medium Term Outlook by NCAER
2008-12 Actual 2014-172018-222014-22 2012-2020(1) (2) (3) (4) (5) (6)Wheat 3.34 2.68 2.61 2.64 1.31-1.69Rice 1.77 1.22 0.91 1.05 2.47-2.62Coarse grains 0.76 1.64 3.7 2.78 1.27-2.96Oilseeds 1.85 0.8 1.98 1.45 4.47-4.75Vegetable Oils
3 1.56 1.98 1.79 NA
Sugarcane 0.13 3.52 -0.7 1.18 3Sugar 2.7 4.66 1.04 2.65 NA
NA: Not Available
Note: Actual growth rates are obtained from official statistics; projected growth rates are from OECD-FAO Global Agricultural Outlook (June 2013) and NCAER’s Medium-term Agricultural Outlook Report (February, 2013). In the case of sugarcane, the NCAER projections were for the period 2012–2017. No projections were made in the NCAER report for vegetable oils and sugar.

82 | Pocket Book of Agricultural Statistics 2014 Demand-Supply Projections | 83
Tab
le 1
2.3
Pro
duct
ion,
Con
sum
ptio
n &
Yea
r-en
d St
ocks
Pro
ject
ions
of M
ajor
Cro
ps(‘0
00 T
onne
s)Co
mm
odity
Agen
cyPr
oduc
tion
Cons
umpt
ion
Stoc
ks (Y
ear-
end)
20
1320
1720
2120
1320
1720
2120
1320
1720
21(1
)(2
)(3
)(4
)(5
)(6
)(7
)(8
)(9
)(1
0)(1
1)W
heat
FAO
/OEC
D85
,364
85,5
9888
,739
86,3
8088
,901
91,6
0215
,070
14,1
7214
,759
USD
A84
,750
89,1
9393
,476
84,7
7289
,137
93,4
5611
,881
8,79
96,
799
Rice
FAO
/OEC
D10
6,19
11,
123,
088
118,
507
101,
972
108,
352
113,
176
19,3
6416
,717
14,9
91U
SDA
101,
676
106,
318
110,
376
96,8
6210
2,14
610
6,99
525
,688
24,6
9920
,038
Mai
zeU
SDA
22,1
6724
,360
26,8
6120
,226
22,4
1024
,822
608
694
793
Soya
bean
USD
A10
,957
11,5
1812
,314
10,9
4411
,509
12,3
0526
526
426
0Su
gar
FAO
/OEC
D26
,779
28,3
3229
,348
25,8
5528
,510
31,8
1310
,877
11,1
9511
,323
Sour
ce: A
gric
ultu
ral O
utlo
ok &
Situ
atio
n A
naly
sis
Repo
rt (S
emi-A
nnua
l Med
ium
Term
), Fe
brua
ry 2
013,
NCA
ER.
Tab
le 1
2.4
Pro
duct
ion
Proj
ectio
ns o
f Pot
atoe
s an
d O
nion
Com
mod
ityPr
oduc
tion
2012
2013
2017
2020
(1)
(2)
(3)
(4)
(5)
(6)
Pota
to
Prod
uctio
n (M
MT)
37.2
38.5
50.5
61.8
Indi
a sh
are
in w
orld
%11
.411
.815
.418
.8O
nion
Prod
uctio
n (M
MT)
17.0
16.7
20.3
23.5
Indi
a sh
are
in w
orld
%19
.818
.719
.620
.4N
ote:
The
re a
re n
o gl
obal
med
ium
-ter
m p
roje
ctio
ns fo
r pot
ato
and
onio
ns. P
roje
ctio
ns h
ere
are
mad
e by
NCA
ER u
sing
the
FAO
dat
a on
glo
bal a
rea,
pro
duct
ion
and
yiel
d of
thes
e co
mm
oditi
es (2
000–
2010
) and
app
lyin
g a
tren
d gr
owth
rate
.
Sour
ce: A
gric
ultu
ral O
utlo
ok &
Situ
atio
n A
naly
sis
Repo
rt (S
emi-A
nnua
l Med
ium
Term
), Fe
brua
ry 2
013,
NCA
ER.

82 | Pocket Book of Agricultural Statistics 2014 Demand-Supply Projections | 83
93.5
95.1
94.7
96.1
97.5
99.3
101.
1
102.
9
104.
7
106.
5
108.
6
106.
2
109.
8
111.
2
111.
0
112.
9
114.
7
116.
9
118.
0
120.
0
122.
0
124.
2
41.1
41.7
42.4
43.3
44.4
45.3
46.0
46.6
47.3
48.0
48.7
0
50
100
150
200
250
300
2013 2014 2015 2016 2017 2018 2019 2020 2021 2022 2023
Mill
ion
Tonn
es
Wheat Rice Coarse Grains
020406080
100120140160180
2004
2005
2006
2007
2008
2009
2010
2011
2012
2013
2014
2015
2016
2017
2018
2019
2020
2021
2022
2023
MT
Vegetables Fruits
Chart 12(a)Projected Production of Rice, Wheat and Coarse Grains in India
Source: OECD- FAO Agriculture Outlook (2014-2023).
Source: OECD- FAO Agriculture Outlook (2014-2023).
Chart 12 (b) Projected Production of Vegetables and Fruits in India

84 | Pocket Book of Agricultural Statistics 2014 Demand-Supply Projections | 85
0
20
40
60
80
100
120
140
160
180
2004
2005
2006
2007
2008
2009
2010
2011
2012
2013
2014
2015
2016
2017
2018
2019
2020
2021
2022
2023
kg/ c
apita
Rice Wheat Coarse Grains
0
100
200
300
400
500
600
70020
0020
0120
0220
0320
0420
0520
0620
0720
0820
0920
1020
1120
1220
1320
1420
1520
1620
1720
1820
1920
2020
2120
2220
23
USD
/ ton
ne
MSP Rice World Rice MSP Wheat World Wheat
Chart 12(c)Projected Market Support Prices in India and World Prices for Rice and Wheat
Chart 12(d)Projected Per capita Consumption of Cereals in India
Note: Minimum Support Price (MSP) for paddy rice is adjusted to milled basis. Market Margins of 15% are added to MSP. The world refernce price for wheat is US Gulf HRW, and for rice is Vietnam 5%.
Source: OECD- FAO Agriculture Outlook (2014-2023).
Source: OECD- FAO Agriculture Outlook (2014-2023).
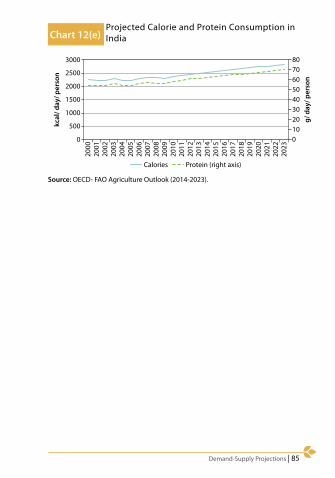
84 | Pocket Book of Agricultural Statistics 2014 Demand-Supply Projections | 85
2023
2000
2001
2002
2003
2004
2005
2006
2007
2008
2009
2010
2011
2012
2013
2014
2015
2016
2017
2018
2019
2020
2021
2022
Calories Protein (right axis)
01020304050607080
0
500
1000
1500
2000
2500
3000
g/ d
ay/ p
erso
n
kcal
/ day
/ per
son
Chart 12(e)Projected Calorie and Protein Consumption in India
Source: OECD- FAO Agriculture Outlook (2014-2023).

Imports & Exports of Agricultural Products | 87
Imports & Exports of Agricultural Products
13

Imports & Exports of Agricultural Products | 87
Tab
le 1
3.1
Indi
a’s Im
port
s an
d Ex
port
s of
Agr
icul
tura
l Com
mod
ities
(V
alue
` C
rore
)Ye
ar
Agric
ultu
re
Impo
rts
Tota
l N
atio
nal
Impo
rts
% a
ge A
gric
ultu
re
Impo
rts
to To
tal
Nat
iona
l Im
port
s
Agric
ultu
re
Expo
rts
Tota
l N
atio
nal
Expo
rts
% a
ge A
gric
ultu
re
Expo
rts
to To
tal
Nat
iona
l Exp
orts
(1)
(2)
(3)
(4)
(5)
(6)
(7)
1990
-91
1205
.86
4317
0.82
2.79
60
12.7
6 32
527.
2818
.49
2000
-01
1208
6.23
22
8306
.64
5.29
28
657.
37
2013
56.4
514
.23
2010
-11
5733
4.32
1683
466.
963.
41
1174
83.6
111
4292
1.92
10.2
8 20
11-1
2 82
819.
1523
4546
3.24
3.53
18
7609
.33
1465
959.
3912
.80
2012
-13
1096
10.6
826
6916
1.96
4.11
23
2041
.11
1634
318.
8414
.20
2013
-14
(P)
1051
49.0
027
1418
1.50
3.87
26
8469
.05
1894
181.
9514
.17
P: P
rovi
sion
al, S
ourc
e: D
irect
or G
ener
al o
f Com
mer
cial
Inte
llige
nce
& S
tatis
tics,
Min
istr
y of
Com
mer
ce, K
olka
ta.
Sour
ce: D
irect
or G
ener
al o
f Com
mer
cial
Inte
llige
nce
& S
tatis
tics,
Min
istr
y of
Com
mer
ce, K
olka
ta.
Cha
rt 1
3(a)
Tr
ends
in A
gric
ultu
ral I
mpo
rts/
Exp
orts
and
sha
re o
ut o
f Tot
al N
atio
nal I
mpo
rts/
Exp
orts
0.00
2.00
4.00
6.00
8.00
10.0
012
.00
14.0
016
.00
18.0
020
.00
0.00
500.
00
1000
.00
1500
.00
2000
.00
2500
.00
3000
.00
% Share out of TotalExports/ Imports
(` in '00 Crore)
Agric
ultu
re Im
port
sAg
ricul
ture
Exp
orts
% o
f Tot
al E
xpor
ts%
of T
otal
Impo
rts
1990
-91
2000
-01
2010
-11
2011
-12
2012
-13
2013
-14

88 | Pocket Book of Agricultural Statistics 2014 Imports & Exports of Agricultural Products | 89
Table 13.2 India’s Imports of Agricultural Products (Quantity: ‘000 tonnes), (Value in ` Crore)
Commodity 2012-13 2013-14 (P)Quantity Value Quantity Value
(1) (2) (3) (4) (5)Pulses 3839.30 12733.70 3049.29 10550.97Wheat 2.94 6.03 11.27 26.92Rice 0.72 3.96 1.44 8.29Other Cereals 45.58 111.01 22.34 99.32Cereal Preparation 51.56 346.17 57.2 404.29Milk & Cream 5.34 107.20 8.21 153.51Cashew Nuts 892.37 5331.74 771.36 4563.99Cashew shelled 6.15 102.17 4.98 103.81Fruits & Nuts Excluding Cashew Nuts
6297.93 7777.79
Spices 157.64 2615.14 148.49 3430.56Sugar 1122.26 3094.38 880.96 2286.86Oil Seeds 406.07 973.55Vegetable Oils Fixed (Edible)
11013.73 61106.59 10434.21 56488.51
Vegetable & Animal fats 1.16 37.04 0.9 28.98Cotton (Raw & Waste) 232.55 2466.74 177.71 2371.14Jute (Raw) 148.73 370.79 52.65 146.25Tea 22.30 274.52 21.16 280.08Wood & Wood Products
14199.51 15454.17
Total Agricultural Imports
109610.68 105149
Total National Imports 2669161.96 2714181.5% Share of Agricultural Import in National Exports 4.11 3.87
P: Provisional
Source: Director General of Commercial Intelligence & Statistics, Ministry of Commerce, Kolkata.

88 | Pocket Book of Agricultural Statistics 2014 Imports & Exports of Agricultural Products | 89
Table 13.3 India’s Exports of Agricultural Products (Quantity: ‘000 tonnes), (Value ` Crore)
Commodity 2012-13 2013-14 (P)Quantity Value Quantity Value
(1) (2) (3) (4) (5)Pulses 201.70 1280.00 343.49 1737.00Rice Basmati 3459.89 19409.39 3757.36 29300.12Rice (Other than Basmati)
6688.00 14448.81 7018.53 17493.16
Wheat 6514.82 10529.00 5559.83 9257.11Other Cereals 5441.31 8180.61 4609.24 7132.37Tea 268.80 4718.79 247.62 4831.80Coffee 254.02 4711.07 253.92 4797.14Tobacco Unmanufactured
230.41 3815.76 237.08 4782.63
Tobacco Manufactured 1214.47 1351.09Dairy Products 1768.77 3763.08Floriculture Products 423.45 455.89Spices 1008.86 15364.97 1029.31 15981.42Cashewnut Shell Liquid 9.19 29.84 9.48 38.61Cashew 104.04 4067.21 120.49 5095.89Sesamum Seed 299.48 2880.85 257.44 3583.46Nigerseed 17.90 90.13 20.84 113.61Groundnut 535.64 4065.36 511.66 3212.06Guargum Meal 406.31 21287.00 601.74 11734.03Oil Meals 6578.18 16519.53 6564.05 17034.43Castor Oil 565.99 4309.82 544.82 4364.33Shellac 3.60 401.74 7.60 504.30Sugar 2794.49 8576.63 2459.61 7125.69Molasses 342.15 223.03 211.64 147.28Fruits/Vegetable Seeds 17.17 347.72 17.18 402.78Fresh Fruits 3295.12 4364.26Fresh Vegetables 3288.33 5117.48
Contd...

90 | Pocket Book of Agricultural Statistics 2014
Commodity 2012-13 2013-14 (P)Quantity Value Quantity Value
(1) (2) (3) (4) (5)Processed Vegetables 1119.66 1316.62Processed Fruit Juices 1968.77 2556.33Miscellaneous Processed Items
4962.66 6881.89
Meat & Preparations 17903.20 27246.91Marine Products 965.10 18841.20 999.19 30616.62Cotton Raw including Waste
2056.69 20276.51 1940.74 22248.48
Jute Hessian 876.68 843.18Poultry Products 460.13 509.41Paper/Wood products 10384.94 12528.63Total Agricultural Exports
232041.11 268469.05
Total National Exports 1634318.84 1894181.95% Share of Agricultural Exports in National Exports
14.20 14.17
P: Provisional
Source: DGCIS, Ministry of Commerce, Kolkata.

90 | Pocket Book of Agricultural Statistics 2014
14International
Comparisons

92 | Pocket Book of Agricultural Statistics 2014 International Comparisons | 93
Item India World % Share
India’s Rank
Next to
(1) (2) (3) (4) (5) (6)1. Total Area
(Million ha)329 13442 2.4 Seventh Russian
Federation, Canada, USA, China, Brazil, Australia
Land Area 297 13009 2.3 Seventh Russian Federation, China, USA, Canada, Brazil, Australia
Arable Land 159 1411 11.3 Second USA2. Total Population
(Million)1241 6909 18.0 Second China
Agriculture 661 2617 25.2 Second China3. Economically Active Population (Million)Total 491 3282 15.0 Second ChinaAgriculture 267 1310 20.4 Second China4. Crop Production (Million Tonnes)(A): Total Cereals 260 2458 10.6 Third China, USAWheat 86 701 12.3 Second ChinaRice (Paddy) 157 722 21.7 Second ChinaTotal Pulses 17 67 25.5 First(B): OilseedsGroundnut (in shell) 7 38 18.2 Second ChinaRapeseed 8.1 59.0 13.7 Third Canada, China5. Fruits & Vegetables (Million Tonnes)(A) : Vegetables &
Melons105 1090 9.6 Second China
(B) : Fruits excluding Melons
74 637 11.6 Second China
(C) : Potatoes 42 373 11.3 Second China(D) : Onion (Dry) 15 86 17.4 Second China6. Commercial Crops (Million Tonnes)(A) : Sugarcane 342 1800 19.0 Second Brazil
Table 14.1 India’s Position in World Agriculture in 2012
Contd...

92 | Pocket Book of Agricultural Statistics 2014 International Comparisons | 93
Item India World % Share
India’s Rank
Next to
(1) (2) (3) (4) (5) (6)(B) : Tea 0.96 4.7 20.6 Third China, Turkey(C) : Coffee (green) 0.30 8.45 3.6 Seventh Brazil, Vietnam,
Colombia, Indonesia, Ethiopia, Mexico
(D) : Jute & Jute like Fibres
1.96 3.58 54.7 First
(E) : Cotton (lint) 8.50 26.14 32.5 Second China(F) : Tobacco Leaves 0.83 7.37 11.3 Third China, Brazil7. Livestock (Million Heads)(A) : Cattle 210 1430 14.7 Second Brazil(B) : Buffaloes 111 194 57.3 First(C) : Camels 0.45 25 1.8 Tenth Somalia, Sudan,
Ethiopia, Niger, Mauritania, Kenya, Mali, Pakistan, Chad
(D) : Sheep 74 1078 6.9 Third China, Australia(E) : Goats 154 910 16.9 Second China(F) : Chicken 774 19571 4.0 Fifth China, USA,
Indonesia, Brazil
8. Animal Products(A) : Total Milk
(000 MT)121847 723143.305 16.8 First
(B) : Eggs Total (000 MT)
3378.1 69102.734 4.9 Third China, USA
(C) : Total Meat (000 MT)
6190 295462 2.1 Fifth China, USA, Brazil, Germany
9. ImplementsAgriculturalTractors-in-use*
3149 29320 10.7 Second USA
* Figure relates to 2007.
Source: FAO Statistics.

94 | Pocket Book of Agricultural Statistics 2014 International Comparisons | 95
Table 14.2 Global Comparison of Area, Production and Yield of Principal Crops (2012)
Area (000 ha), Production (000 Tonnes), Yield (kg/ha)
Country Area Production Yield Production (%)
(1) (2) (3) (4) (5)1. PaddyWorld 162317.21 738187.64 4547.81 100.00China 30397.76 205936.23 6774.72 27.90India 42410.00 157800.00 3720.82 21.38Indonesia 13445.52 69056.13 5135.99 9.35Bangladesh 11423.00 50497.00 4420.64 6.84Vietnam 7753.16 43661.57 5631.45 5.912. WheatWorld 217319.74 671496.87 3089.90 100.00China 24270.36 121029.86 4986.74 18.02India 29860.00 94880.00 3177.49 14.13USA 19797.64 61677.39 3115.39 9.19Russian Federation 21277.90 37719.64 1773.00 5.62Australia 13500.00 29905.01 2215.15 4.453. Maize World 178551.62 872791.60 4888.18 100.00USA 35359.44 273820.07 7743.90 31.37China 35046.45 205718.65 5869.89 23.57Brazil 14198.50 71072.81 5005.66 8.14India 8710.00 22260.00 2555.68 2.55Mexico 6923.90 22069.25 3187.40 2.53Argentina 3696.30 21196.64 5734.56 2.434. SugarcaneWorld 26094.63 1842266.28 70599.45 100.00Brazil 9705.39 721077.29 74296.60 39.14India 5090.00 361037.00 70930.65 19.60
Contd...
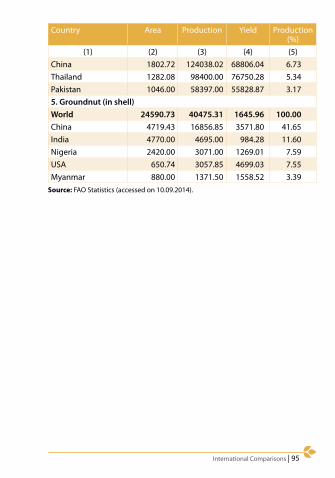
94 | Pocket Book of Agricultural Statistics 2014 International Comparisons | 95
Country Area Production Yield Production (%)
(1) (2) (3) (4) (5)China 1802.72 124038.02 68806.04 6.73Thailand 1282.08 98400.00 76750.28 5.34Pakistan 1046.00 58397.00 55828.87 3.175. Groundnut (in shell)World 24590.73 40475.31 1645.96 100.00China 4719.43 16856.85 3571.80 41.65India 4770.00 4695.00 984.28 11.60Nigeria 2420.00 3071.00 1269.01 7.59USA 650.74 3057.85 4699.03 7.55Myanmar 880.00 1371.50 1558.52 3.39
Source: FAO Statistics (accessed on 10.09.2014).

96 | Pocket Book of Agricultural Statistics 2014 International Comparisons | 97
Coun
try
Are
a (s
q km
) 20
10Po
pula
tion
(Mill
ions
)G
DP
Billi
ons
(US$
)D
omes
tic
Prod
uct P
er
Capi
ta In
com
e (U
S$)
Purc
hasi
ng
Pow
er in
Bill
ions
U
S $
(1)
(2)
(3)
(4)
(5)
(6)
Arg
entin
a27
6689
041
.03
474.
8111
572.
7674
6.93
Aust
ralia
7686
850
22.6
815
42.0
667
982.
7496
0.72
Braz
il85
1196
519
6.53
2425
.05
1233
9.58
2365
.88
Cana
da99
7614
034
.83
1770
.08
5082
6.05
1445
.53
Chin
a95
9696
013
53.8
282
50.2
460
94.0
512
382.
56Fr
ance
5470
3063
.42
2580
.42
4068
9.93
2252
.54
Ger
man
y35
7021
81.7
833
66.6
541
167.
5531
94.2
0In
dia
3287
590
1223
.17
1946
.77
1591
.57
4710
.81
Indo
nesi
a19
1944
024
4.47
894.
8536
60.4
212
11.9
6Ita
ly30
1230
60.9
019
80.4
532
521.
9618
33.9
5Ja
pan
3778
3512
7.61
5984
.39
4689
5.74
4616
.88
Mex
ico
1972
550
114.
8711
62.8
910
123.
3517
57.5
8Ru
ssia
1707
5200
141.
9219
53.5
613
764.
7825
11.7
1Sa
udi A
rabi
a19
6058
228
.79
657.
0522
822.
8274
0.53
Sout
h A
fric
a12
1991
251
.20
390.
9276
35.5
757
8.64
Repu
blic
of K
orea
9848
050
.01
1151
.27
2302
0.91
1621
.87
Turk
ey78
0580
74.8
978
3.06
1045
6.89
1125
.42
Uni
ted
King
dom
2448
2063
.07
2433
.78
3859
1.46
2316
.25
Tab
le 1
4.3
Maj
or M
acro
-Eco
nom
ic In
dica
tors
of I
ndia
, G-2
0 an
d th
e W
orld
in 2
012
Cont
d...

96 | Pocket Book of Agricultural Statistics 2014 International Comparisons | 97
*GD
P in
cas
e of
EU
is b
ased
on
PPP
(Cur
rent
Inte
rnat
iona
l Dol
lars
).
Sour
ce: S
tatis
tical
Yea
r Boo
k In
dia-
201
3, M
inis
try
of S
tatis
tics
& P
rogr
amm
e Im
plem
enta
tion.
Coun
try
Are
a (s
q km
) 20
10Po
pula
tion
(Mill
ions
)G
DP
Billi
ons
(US$
)D
omes
tic
Prod
uct P
er
Capi
ta In
com
e (U
S$)
Purc
hasi
ng
Pow
er in
Bill
ions
U
S $
(1)
(2)
(3)
(4)
(5)
(6)
USA
9629
091
314.
3115
653.
3749
802.
1515
653.
37Eu
rope
an U
nion
4324
782
503.
8216
414.
48 3
2028
.88*
1607
3.55
Wor
ld51
0072
000
7017
.54
7127
7.37
1015
7.03
8276
2.15
Indi
cato
rsBr
azil
Russ
iaCh
ina
Indi
aSo
uth
Afr
ica
(1)
(2)
(3)
(4)
(5)
(6)
Mac
ro-E
cono
mic
Indi
cato
rsTo
tal P
opul
atio
n (M
illio
n)19
9.24
143.
3013
54.0
412
27.1
952
.28
Urb
an P
opul
atio
n (%
of T
otal
)85
.00
74.0
052
.00
32.0
063
.00
Shar
e in
Wor
ld E
xpor
ts (%
)1.
302.
9011
.10
1.60
0.50
GD
P in
PPP
(US
$ Bi
llion
)28
96.4
633
96.2
114
774.
3863
57.5
464
0.78
GD
P (U
S $
Billi
on)
2247
.75
2017
.47
8386
.68
1858
.75
382.
34Pe
r Cap
ita G
DP
(US
$) 2
012
1128
1.48
1407
8.64
6193
.82
1514
.63
7314
.01
Land
Use
Indi
cato
rsLa
nd A
rea
(Mill
ion
ha)
835.
8116
37.6
994
2.47
297.
3212
1.31
Tab
le 1
4.4
Maj
or M
acro
Eco
nom
ic, L
and-
Use
and
Soc
ial I
ndic
ator
s of
BRI
CS E
cono
mie
s in
201
2
Cont
d...

98 | Pocket Book of Agricultural Statistics 2014 International Comparisons | 99
Indi
cato
rsBr
azil
Russ
iaCh
ina
Indi
aSo
uth
Afr
ica
(1)
(2)
(3)
(4)
(5)
(6)
Ara
ble
Land
Are
a (M
illio
n ha
)72
.61
119.
7510
6.52
156.
2012
.00
Irrig
ated
Lan
d (M
illio
n ha
)5.
404.
3069
.39
66.7
01.
67Irr
igat
ed L
and
(% o
f ara
ble
land
)7.
443.
5965
.14
42.7
013
.92
Are
a H
arve
sted
for C
erea
ls (M
illio
n ha
)19
.61
36.9
992
.90
97.1
03.
87Pr
oduc
tion
of C
erea
ls (M
illio
n To
nnes
)89
.91
68.7
754
1.16
293.
2914
.27
Maj
or H
ealth
Indi
cato
rsH
ealth
exp
endi
ture
per
cap
ita (c
urre
nt U
S$)
1056
.00
887.
0032
2.00
61.0
064
5.00
Hea
lth e
xpen
ditu
re, p
ublic
(% o
f GD
P)4.
303.
803.
001.
304.
20H
ealth
exp
endi
ture
, tot
al (%
of G
DP)
9.30
6.30
5.40
4.00
8.80
Life
exp
ecta
ncy
at b
irth,
tota
l (ye
ars)
74.0
070
.00
75.0
066
.00
56.0
0M
orta
lity
rate
, inf
ant (
per 1
,000
live
birt
hs)
13.0
09.
0012
.00
43.0
034
.00
Labo
r and
Soc
ial P
rote
ctio
n In
dica
tors
Age
depe
nden
cy ra
tio, y
oung
(% o
f wor
king
-ag
e po
pula
tion)
36.0
022
.00
25.0
045
.00
45.0
0
Birt
h ra
te, c
rude
(per
1,0
00 p
eopl
e)15
.33
12.6
011
.93
21.0
021
.32
Popu
latio
n gr
owth
(ann
ual %
)0.
900.
200.
501.
301.
30La
bor p
artic
ipat
ion
rate
, tot
al (%
of t
otal
po
pula
tion
ages
15+
)70
.00
64.0
071
.00
54.0
052
.00
Une
mpl
oym
ent,
tota
l (%
of t
otal
labo
r for
ce)
6.10
5.50
4.50
3.60
25.0
0So
urce
: 1. I
MF,
Wor
ld E
cono
mic
Out
look
Dat
abas
e, O
ct 2
014.
2.
Wor
ld B
ank,
Wor
ld D
evel
opm
ent I
ndic
ator
s, 20
14.
3. W
orld
Ban
k, In
tern
atio
nal T
rade
Sta
tistic
s, 20
13.
4. F
AO S
tatis
tics.

98 | Pocket Book of Agricultural Statistics 2014 International Comparisons | 99
Indi
cato
r Nam
eCh
ina
Indi
a20
1120
1220
1320
1120
1220
13(1
)(2
)(3
)(4
)(5
)(6
)(7
)G
DP
grow
th (a
nnua
l %)
9.30
7.70
7.70
6.60
4.70
5.00
Popu
latio
n gr
owth
(ann
ual %
)0.
480.
490.
501.
281.
261.
20A
rabl
e la
nd (%
of l
and
area
)11
.96
11.3
0…
52.9
252
.5…
Agric
ultu
ral l
and
(sq
km)
5191
482
5145
530
…17
9799
017
9300
0…
Agric
ultu
ral l
and
(% o
f lan
d ar
ea)
55.6
654
.80
…60
.47
60.3
…Ag
ricul
tura
l irr
igat
ed la
nd (%
of t
otal
agr
icul
tura
l lan
d)…
……
……
…Ag
ricul
ture
, val
ue a
dded
(% o
f GD
P)10
.05
10.0
010
.00
18.0
018
.00
18.0
0Ag
ricul
tura
l met
hane
em
issi
ons
(% o
f tot
al)
……
……
……
Fert
ilize
r con
sum
ptio
n (k
ilogr
ams p
er h
a of
ara
ble
land
)55
8.30
647.
60…
177.
9016
3.70
…In
flatio
n, c
onsu
mer
pric
es (a
nnua
l %)
5.41
2.65
2.60
8.86
9.31
10.9
0La
nd-U
se In
dica
tors
Are
a H
arve
sted
(Mill
ion
ha)
Whe
at24
.27
24.2
724
.10
29.0
729
.86
29.6
5Ri
ce (P
addy
)30
.31
30.4
030
.49
43.9
742
.41
43.5
0*M
aize
33.5
635
.05
35.2
88.
788.
719.
50*
Soya
bean
7.89
6.75
6.60
10.1
810
.84
12.2
0*Pr
oduc
tion
(Mill
ion
Tonn
es)
Whe
at11
7.41
121.
0312
1.73
86.8
794
.88
93.5
1Ri
ce (P
addy
)20
2.67
205.
9420
5.02
157.
9015
7.80
159.
20M
aize
192.
9020
5.72
217.
8321
.76
22.2
623
.29
Soya
bean
14.4
913
.05
12.5
012
.21
14.6
711
.95
Tab
le 1
4.5
Maj
or E
cono
mic
and
Lan
d-U
se In
dica
tors
: In
dia
and
Chin
a
* U
noffi
cial
figu
re.
Not
e: F
igur
es fo
r Chi
na p
erta
ins
to C
hina
Mai
nlan
d on
ly.
Sour
ce: F
AO S
tatis
tics
and
Wor
ld D
evel
opm
ent I
ndic
ator
s 20
14, W
orld
Ban
k.

100 | Pocket Book of Agricultural Statistics 2014 International Comparisons | 101
Country 2010 2011 2012 2013(1) (2) (3) (4) (5)
Australia 2.8 3.4 1.8 2.4Bangladesh 8.1 10.7 6.2 7.5Brazil 5.0 6.6 5.4 6.2Canada 1.8 2.9 1.5 0.9Switzerland 0.7 0.2 -0.7 -0.2China 3.3 5.4 2.7 2.6Germany 1.1 2.1 2.0 1.5Euro area 1.5 3.3 2.5 1.4European Union 1.7 3.3 2.7 1.4United Kingdom 3.3 4.5 2.8 2.6Hong Kong SAR, China 2.3 5.3 4.1 4.4Indonesia 5.1 5.4 4.3 6.4India 12.0 8.9 9.3 10.9Italy 1.5 2.7 3.0 1.2Japan -0.7 -0.3 0.00 0.4Mexico 4.2 3.4 4.1 3.8OECD Members 1.8 3.3 2.5 1.4Pakistan 13.9 11.9 9.7 7.7Russian Federation 6.9 8.4 5.1 6.8South Asia 9.1 9.2 9.4 8.0Singapore 2.8 5.3 4.5 2.4United States 1.6 3.2 2.1 1.5World 3.6 5.0 3.7 2.6
Table 14.6 Inflation (Consumer prices) in Major Economies (Annual %)
Source: World Bank.

100 | Pocket Book of Agricultural Statistics 2014 International Comparisons | 101
0
20000
40000
60000
80000
100000
120000
140000
2013 2014 2015 2016 2017 2018 2019 2020 2021 2022 2023
'000
Ton
nes
China India Linear (China) Linear (India)
0
100000
200000
300000
400000
500000
600000
700000
800000
2013 2014 2015 2016 2017 2018 2019 2020 2021 2022 2023
'000
Ton
nes
United States China India
0
20000
40000
60000
80000
100000
120000
2013 2014 2015 2016 2017 2018 2019 2020 2021 2022 2023
'000
Ton
nes
Canada India China
Chart 14(a) Projected Wheat Production in China and India
Chart 14(b) Projected Coarse Grains Production in US, China and India
Chart 14(c) Projected Oilseeds Production in China, India and Canada
Source: OECD- FAO Agriculture Outlook 2014-23.
Source: OECD- FAO Agriculture Outlook 2014-23.
Note: Oilseeds include soybeans, sunflower and rapeseed/canola. Year beginning 1st October.Source: OECD- FAO Agriculture Outlook 2014-23.

Agricultural Emissions | 103
15Agricultural
Emissions

Agricultural Emissions | 103
Oceania 4%
Asia 46%
Europe11%
Americas24%
Africa15%
831.6
658.8
444.4
353.9
190.6163.2 139.4
106.7 106.4 92.9
0.0
100.0
200.0
300.0
400.0
500.0
600.0
700.0
800.0
900.0
'000
Gig
agra
ms
CO� Equivalent value
China India Brazil USA Australia Indonesia Pakistan Argentina Sudan(former)
RussianFederation
Chart 15 (a) All GHG Emission from Agriculture sector by major Continents in 2012 (CO2 equivalent)
Chart 15 (b) Total GHG Emissions from Agriculture Sector in Major Countries in 2012
Source: FAO Statistics.
Source: FAO Statistics.

Appendices | 105
Appendices
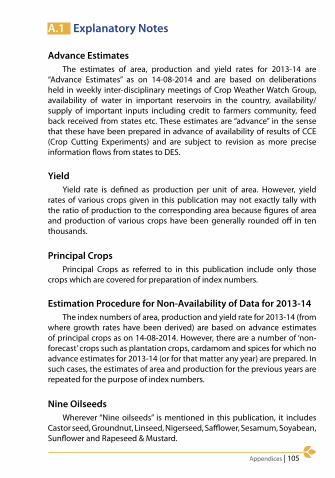
Appendices | 105
A.1 Explanatory Notes
Advance Estimates The estimates of area, production and yield rates for 2013-14 are “Advance Estimates” as on 14-08-2014 and are based on deliberations held in weekly inter-disciplinary meetings of Crop Weather Watch Group, availability of water in important reservoirs in the country, availability/supply of important inputs including credit to farmers community, feed back received from states etc. These estimates are “advance” in the sense that these have been prepared in advance of availability of results of CCE (Crop Cutting Experiments) and are subject to revision as more precise information flows from states to DES.
Yield Yield rate is defined as production per unit of area. However, yield rates of various crops given in this publication may not exactly tally with the ratio of production to the corresponding area because figures of area and production of various crops have been generally rounded off in ten thousands.
Principal Crops Principal Crops as referred to in this publication include only those crops which are covered for preparation of index numbers.
Estimation Procedure for Non-Availability of Data for 2013-14 The index numbers of area, production and yield rate for 2013-14 (from where growth rates have been derived) are based on advance estimates of principal crops as on 14-08-2014. However, there are a number of ‘non-forecast’ crops such as plantation crops, cardamom and spices for which no advance estimates for 2013-14 (or for that matter any year) are prepared. In such cases, the estimates of area and production for the previous years are repeated for the purpose of index numbers.
Nine Oilseeds Wherever “Nine oilseeds” is mentioned in this publication, it includes Castor seed, Groundnut, Linseed, Nigerseed, Safflower, Sesamum, Soyabean, Sunflower and Rapeseed & Mustard.

106 | Pocket Book of Agricultural Statistics 2014 Appendices | 107
Total Oilseeds Total oilseeds include cottonseed and coconut besides nine oilseeds mentioned in the above paragraph.
Net Availability of Foodgrains The Net availability of foodgrains is defined as, where
NAF = GP – SFW - e + i + s NAF = Net availability of Foodgrains GP = Gross Production of Foodgrains SFW = Seed, feed and wastages of Foodgrains e = Exports of Foodgrains i = Imports of Foodgrains s = Change in Stocks of Foodgrains To work out per capita net availability of foodgrains in terms of kg. per year, NAF is divided by the estimated population for a particular year. When this is further divided by the number of days in a year i.e. 365 days, it gives net availability of foodgrains per day.
A. 2 Conversion Factors between Important Primary and Secondary Agricultural Commodities
Commodity Conversion Factor(1) (2)
Rice (Cleaned) Production 2/3 of Paddy ProductionCottonCotton Lint Production 1/3 of Kapas ProductionCotton Seed Production 2/3 of Kapas Production
2 Times of Cotton Lint ProductionJute100 Yards of Hessian 54 lbs. of Raw Jute4148 Yards of Hessian 1 Ton of Raw Jute
5.55 Bales of Raw Jute (of 180 kg Each)1 Ton of Sacking 1.11 Tons of Raw Jute
6.17 Bales of Raw Jute (of 180 kg Each)1 Ton of Hessian 1.05 Tons of Raw JuteSacking etc. 5.85 Bales of Raw Jute (of 180 kg Each)
Contd...

106 | Pocket Book of Agricultural Statistics 2014 Appendices | 107
Commodity Conversion Factor(1) (2)
GroundnutKernel to Nuts in Shell 70 PercentOil to Nuts in Shell 28 PercentOil to Kernels Crushed 40 PercentCake to Kernels Crushed 60 PercentSesamumOil to Seeds Crushed 40 PercentCake to Seeds Crushed 60 PercentRapseed and MustardOil to Seeds Crushed 33 PercentCake to Seeds Crushed 67 PercentLinseedOil to seeds Crushed 33 PercentCake to Seeds Crushed 67 PercentCastorseedOil to Seeds Crushed 37 PercentCake to Seeds Crushed 63 PercentCotton SeedOil to Seeds Crushed 14 to 18 PercentCake to Seeds Crushed 82 to 86 PercentCoconutCopra to Nuts One Ton of Copra = 6773 NutsOil to Copra Crushed 62 PercentCake to Copra Crushed 38 PercentNigerseedOil to Seeds Crushed 28 PercentCake to Seeds Crushed 72 PercentKardi SeedOil to Seeds Crushed 40 PercentCake to Seeds Crushed 60 PercentMahua SeedOil to Seeds Crushed 36 Percent
Contd...

108 | Pocket Book of Agricultural Statistics 2014 Appendices | 109
Commodity Conversion Factor(1) (2)
Cake to Seeds Crushed 64 PercentNeem SeedOil to Kernels Crushed 45 to 50 PercentCake to Kernels Crushed 50 to 55 PercentSoyabean SeedOil to Soyabean Seed Crushed 18 PercentMeal to Soyabean Seed Crushed 73 PercentHull from Soyabean Seed Crushed 8 PercentWastage from Soyabean Seed Crushed
1 Percent
SugarGur from Cane Crushed 11.20 Percent to 11.50 PercentCrystal Sugar from Gur Refined (Gur Refineries)
62.5 Percent
Crystal Sugar from Cane Crushed (Cane Factories)
10.20 Percent
Khandasari Sugar (Sulpher and Non-sulpher)
46 Percent
from standard Gur Refined Molasses from Cane Crushed 4.0 Percent to 4.5 PercentCane - Trash* from Cane Harvested
8.0 Percent to 12.0 Percent
LacSeed Lac 66.0 Percent of Stick LacShell Lac 57.4 Percent of Stick LacCashewnutCashew Kernel 25 Percent of Cashewnuts
* This consists of leaves and portion of the top of stalk which are removed from the canestalk, while harvesting and before sending the cane for milling.

108 | Pocket Book of Agricultural Statistics 2014 Appendices | 109
A. 3 General Seed Rate of Sowing for Important Field Crops*kg/ha.
Crop Others Varieties Hybrid(1) (2) (3)
Cereal CropsRiceDirect sowing 75-100 -Transplanting 50-75 15Wheat 100-125 -Maize 20 15Barley 100 -Jowar 12-15 7.5Bajra 5 5Ragi 5 -Sorghum 8-10 8-10PulsesGram 75-100 -Tur(Arhar) 10 10Green Gram (Kharif) 15-20, (Rabi) 25-30 & (Summer) 30-35 -Black Gram (Kharif) 15-20, (Rabi) 25-30 & (Summer) 30-35 -Lentil 50-60 -Peas 80-100 -Chickpea (Desi) 65-75Chickpea (Kabuli) 100-120Pigeonpea 15-20 -Rajmash 75-100 -Moth 15-18 -Kulthi 22-30 -OilseedGroundnut 90-110 -Rape/Mustard 5 3.5Soyabean 75-85 -Til (Sesamum) 5 -Castor 6 5Sunflower 6 5Safflower 10 - 12 8 -10 Linseed 25-30 & Linseed (DP) 40-45 -Niger 5-Aug -
Contd...

110 | Pocket Book of Agricultural Statistics 2014
Crop Others Varieties Hybrid(1) (2) (3)
Cotton 7.5 2.5Jute 8-10 -Mesta 12-5 -Sunhemp 25 -Foder CropsJowar 20-25 12Barseem 20-25 -Lucern 7.5 -Oats 62.5 -Maize 25 -OthersSugarcane 5500-6000
35000-40000 setts with 3- buds)-
* The quantity of seed may vary according to variety (duration), seed size, recommended spacing, method of sowing, agro - climatic conditions and cropping system.
* EU is represented within the G8 but cannot host or chair summits.
Note: Since 2014, the G8 effectively comprises seven nations and the European Union as the eighth member.
A. 4 Major Economic Groups/ Institutions
Group/ Institution Member CountriesSouth Asian Association for Regional Cooperation (SAARC)
Afghanistan, Bangladesh, Bhutan, India, Maldives, Nepal, Pakistan, Sri Lanka
Association of Southeast Asian Nations (ASEAN)
Brunei Darussalam, Cambodia, Indonesia, Lao PDR, Malaysia, Philippines, Singapore, Thailand, Vietnam
Group of Twenty (G-20) Australia, Brazil, Canada, France, Germany, India, Indonesia, Italy, Japan, Mexico, Russian Federation, South Africa, Turkey, United Kingdom, United States, Argentina, China, South Korea, European Union, Saudi Arabia
Group of Eight (G-8) Canada, France, Germany, Italy, Japan, Russia, United Kingdom, USA, European Union*
BRICS Economies Brazil, Russian Federation. India, China, South Africa

110 | Pocket Book of Agricultural Statistics 2014

112 | Pocket Book of Agricultural Statistics 2014
Government of IndiaMinistry of Agriculture
Department of Agriculture & CooperationDirectorate of Economics & Statistics
New Delhi
Related Documents