Philip M. Napoli Professor and Area Chair, Communication & Media Management Co-Director, Center for Communications Graduate School of Business Fordham University This research was conducted in partnership with, and with the assistance of, The Collaborative Alliance

Welcome message from author
This document is posted to help you gain knowledge. Please leave a comment to let me know what you think about it! Share it to your friends and learn new things together.
Transcript
Philip M. Napoli Professor and Area Chair, Communication & Media Management
Co-Director, Center for Communications Graduate School of Business
Fordham University
This research was conducted in partnership with, and with the assistance of, The Collaborative Alliance
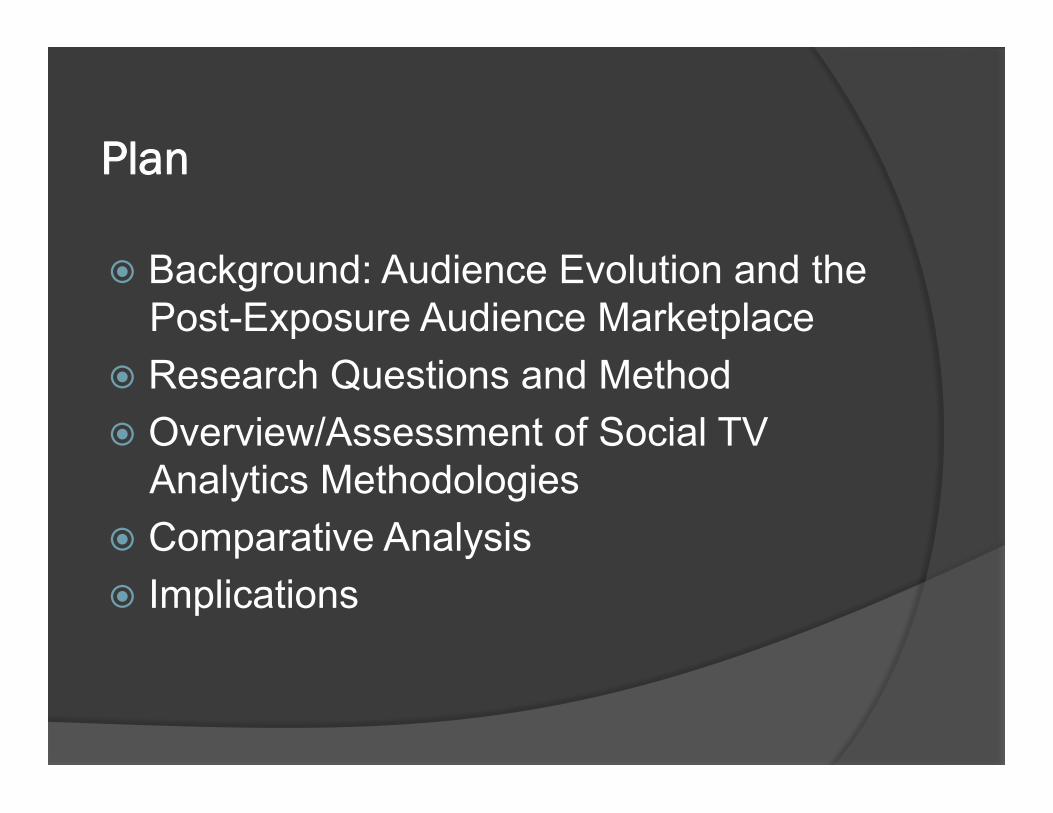
Plan
� Background: Audience Evolution and the Post-Exposure Audience Marketplace
� Research Questions and Method � Overview/Assessment of Social TV
Analytics Methodologies � Comparative Analysis � Implications
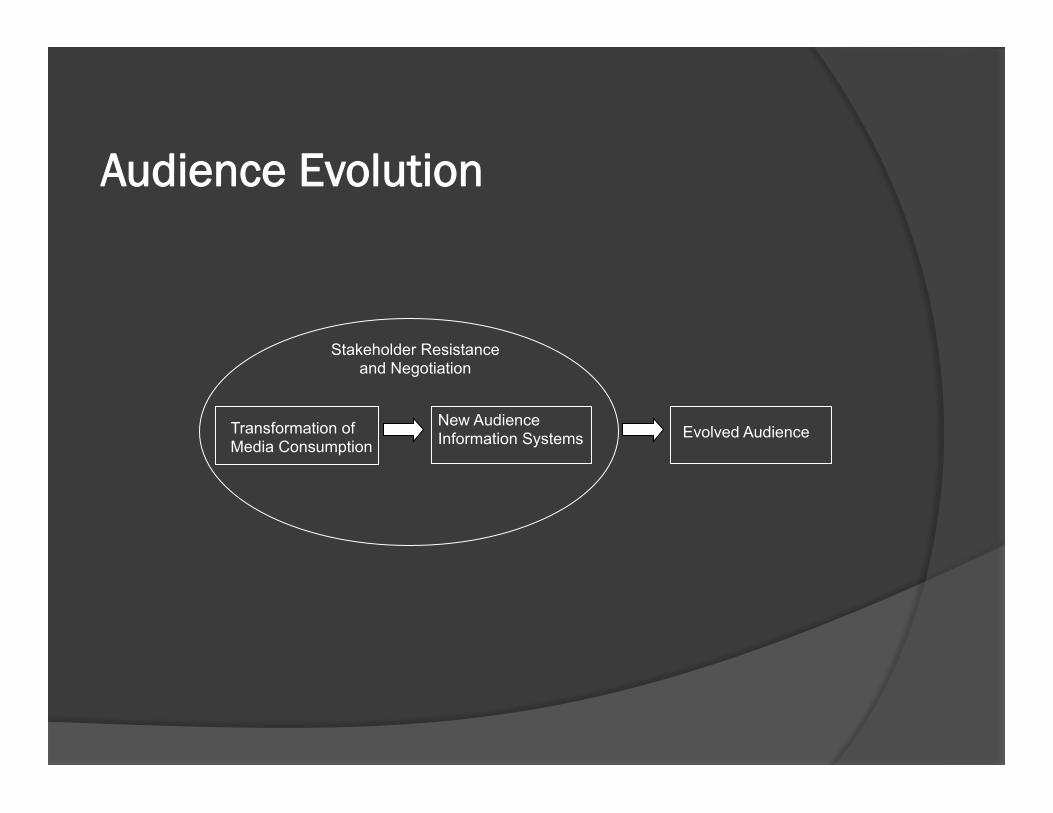
Audience Evolution
New Audience Information Systems Evolved Audience Transformation of
Media Consumption
Stakeholder Resistance and Negotiation
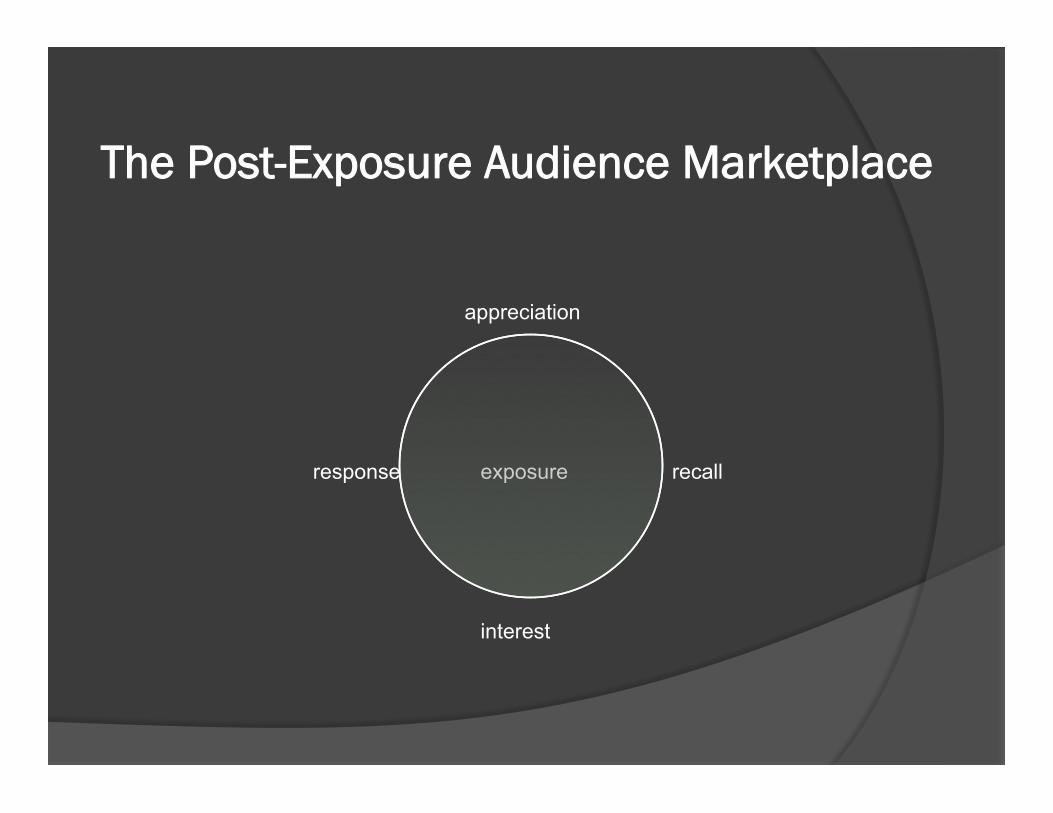
The Post-Exposure Audience Marketplace
exposure
appreciation
response recall
interest

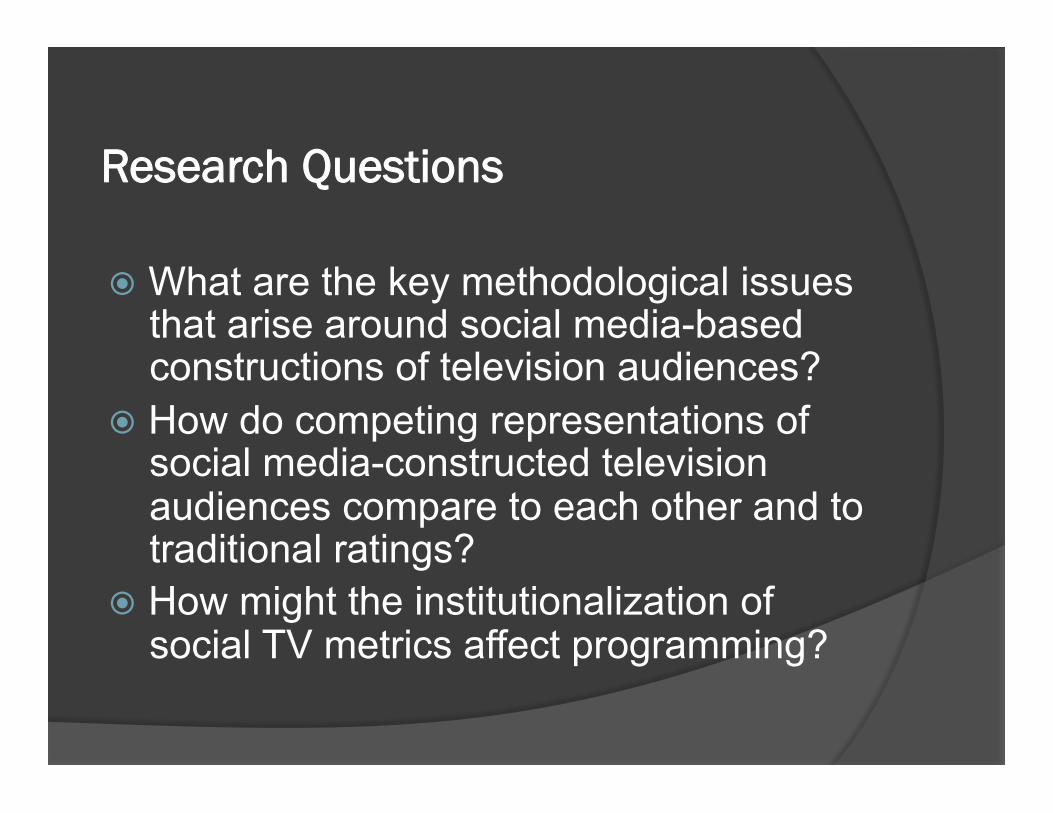
Research Questions
� What are the key methodological issues that arise around social media-based constructions of television audiences?
� How do competing representations of social media-constructed television audiences compare to each other and to traditional ratings?
� How might the institutionalization of social TV metrics affect programming?
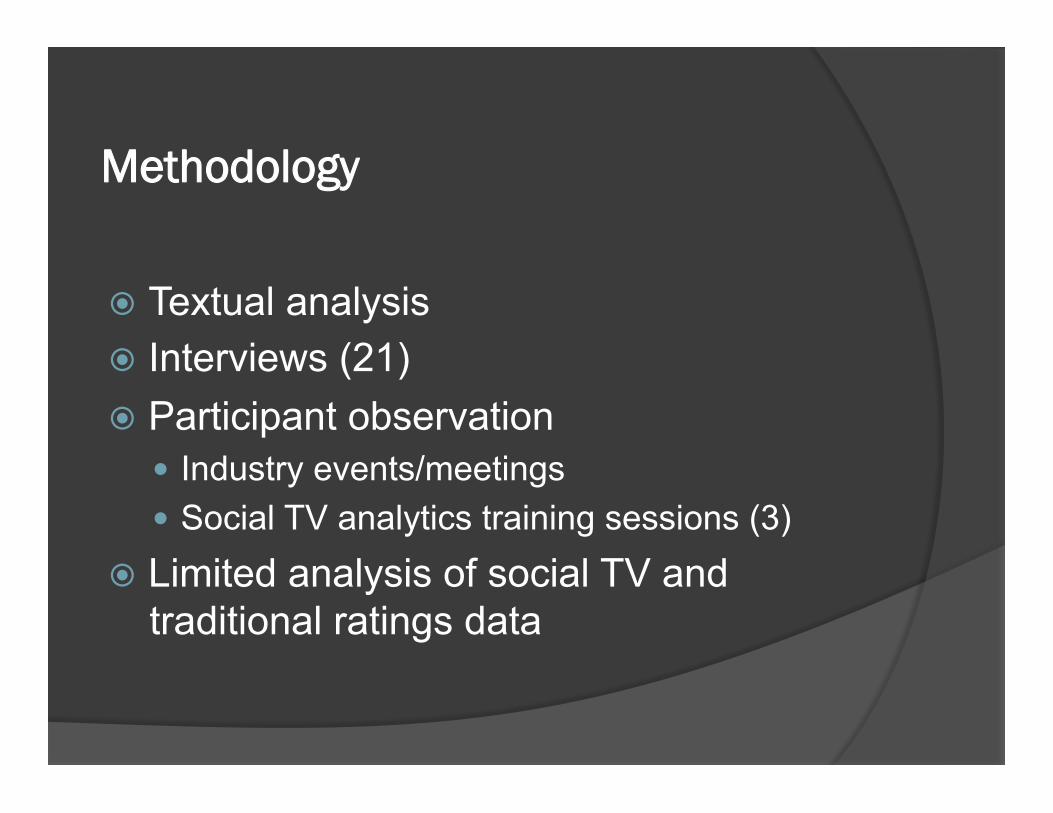
Methodology
� Textual analysis � Interviews (21) � Participant observation
� Industry events/meetings � Social TV analytics training sessions (3)
� Limited analysis of social TV and traditional ratings data
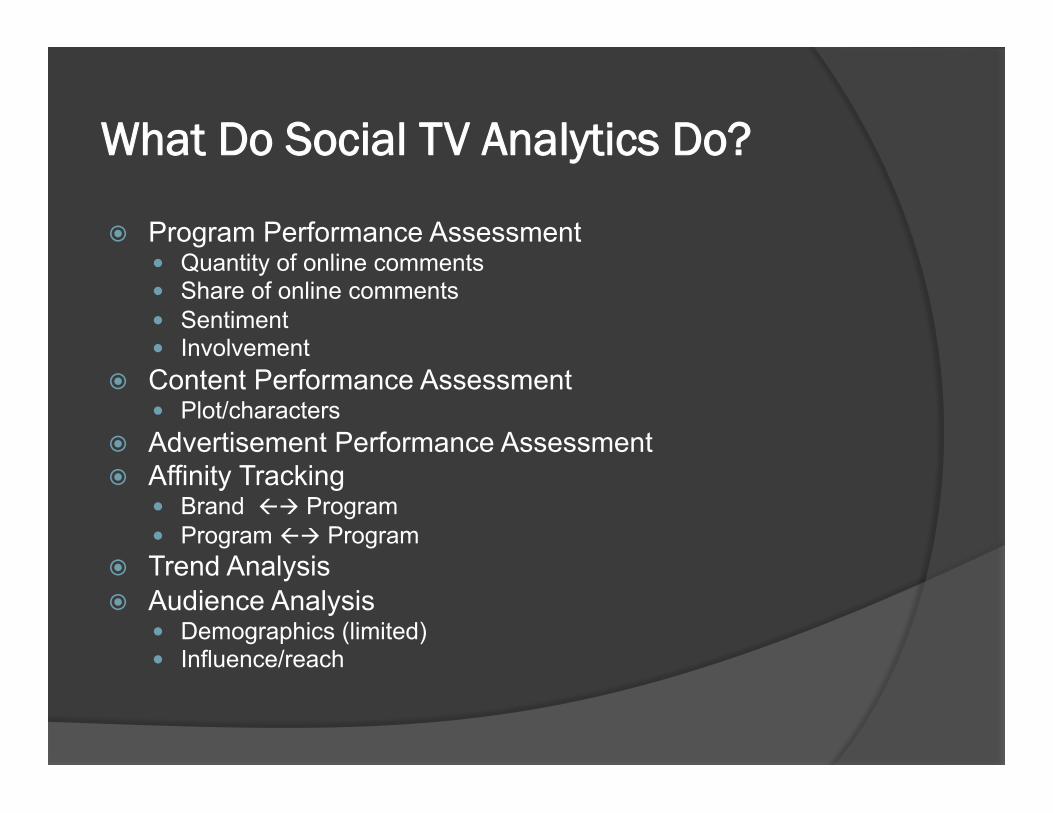
What Do Social TV Analytics Do?
� Program Performance Assessment � Quantity of online comments � Share of online comments � Sentiment � Involvement
� Content Performance Assessment � Plot/characters
� Advertisement Performance Assessment � Affinity Tracking
� Brand ßà Program � Program ßà Program
� Trend Analysis � Audience Analysis
� Demographics (limited) � Influence/reach
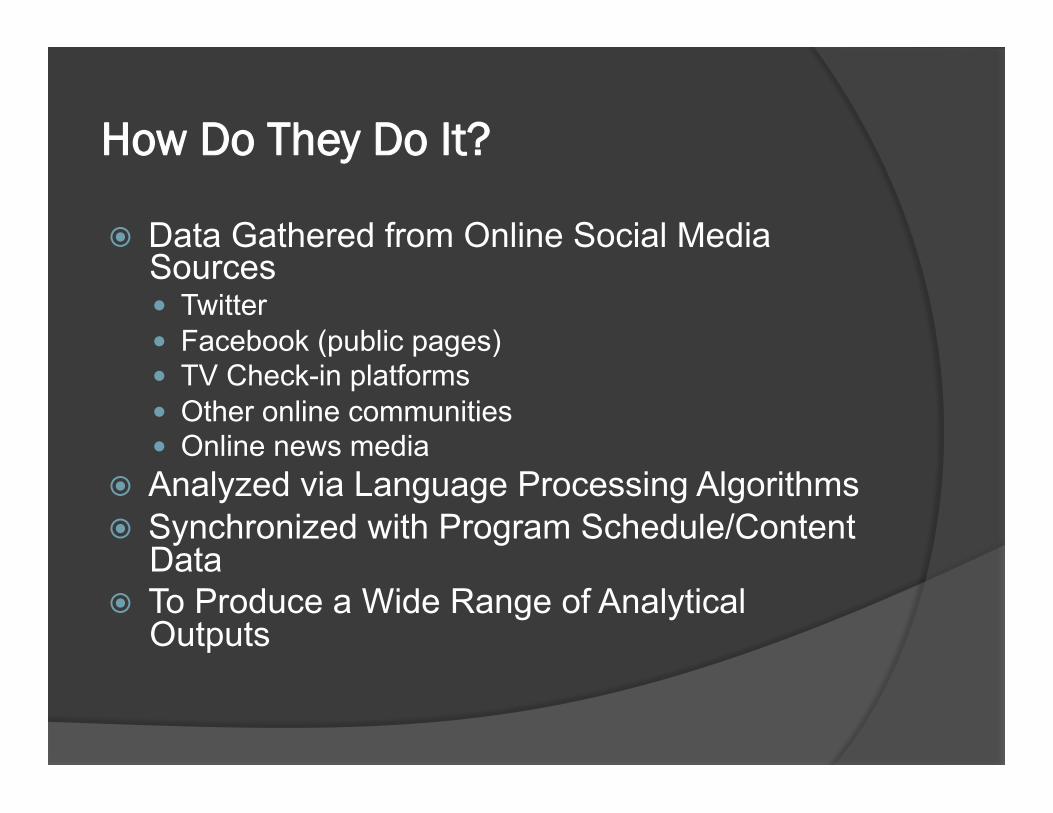
How Do They Do It?
� Data Gathered from Online Social Media Sources � Twitter � Facebook (public pages) � TV Check-in platforms � Other online communities � Online news media
� Analyzed via Language Processing Algorithms � Synchronized with Program Schedule/Content
Data � To Produce a Wide Range of Analytical
Outputs
Points of Differentiation
� Data sources � Algorithm/search terms � Measurement period � Granularity
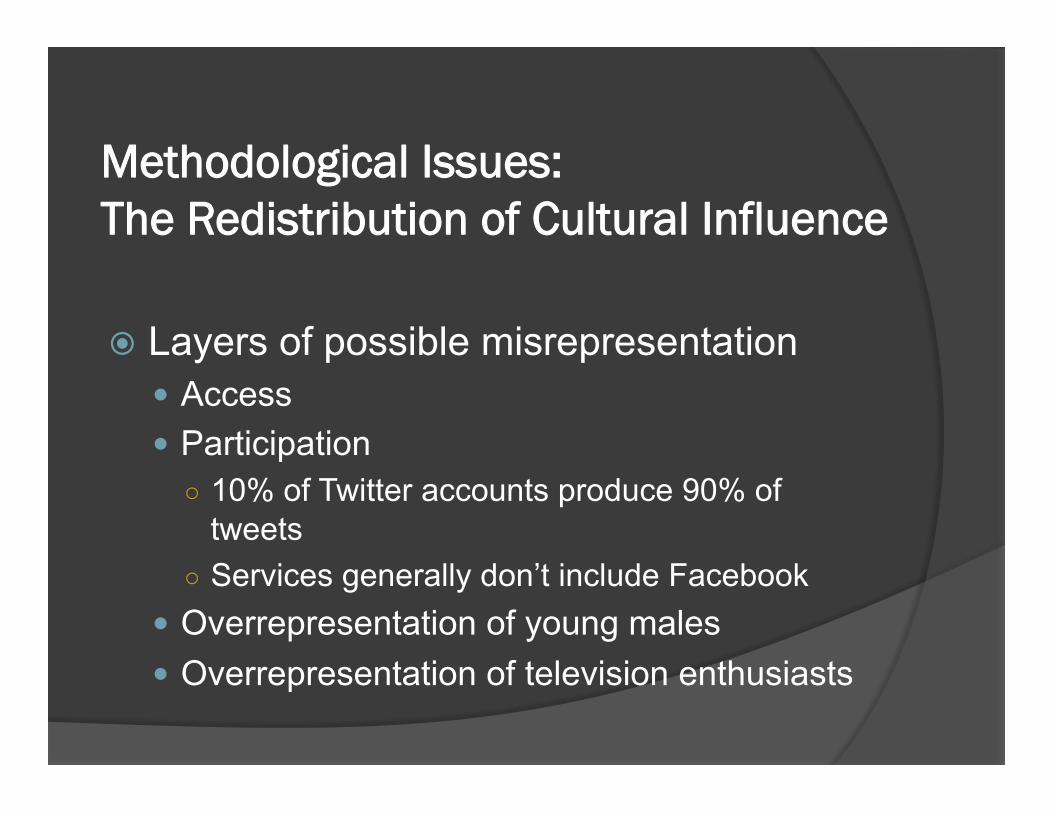
Methodological Issues: The Redistribution of Cultural Influence
� Layers of possible misrepresentation � Access � Participation ○ 10% of Twitter accounts produce 90% of
tweets ○ Services generally don’t include Facebook
� Overrepresentation of young males � Overrepresentation of television enthusiasts
Methodological Issues: “Black Box” Audiences
� “They never tell you what’s in the black box. There’s no transparency.”
� “People who are qualified to come up with solutions are coming from a completely different direction from traditional media research people. There’s no overlap in terms of skill sets, pedigree, etc.”
Methodological Issues: Compatibility with Established Practices � Demographics � Dayparts � Local markets
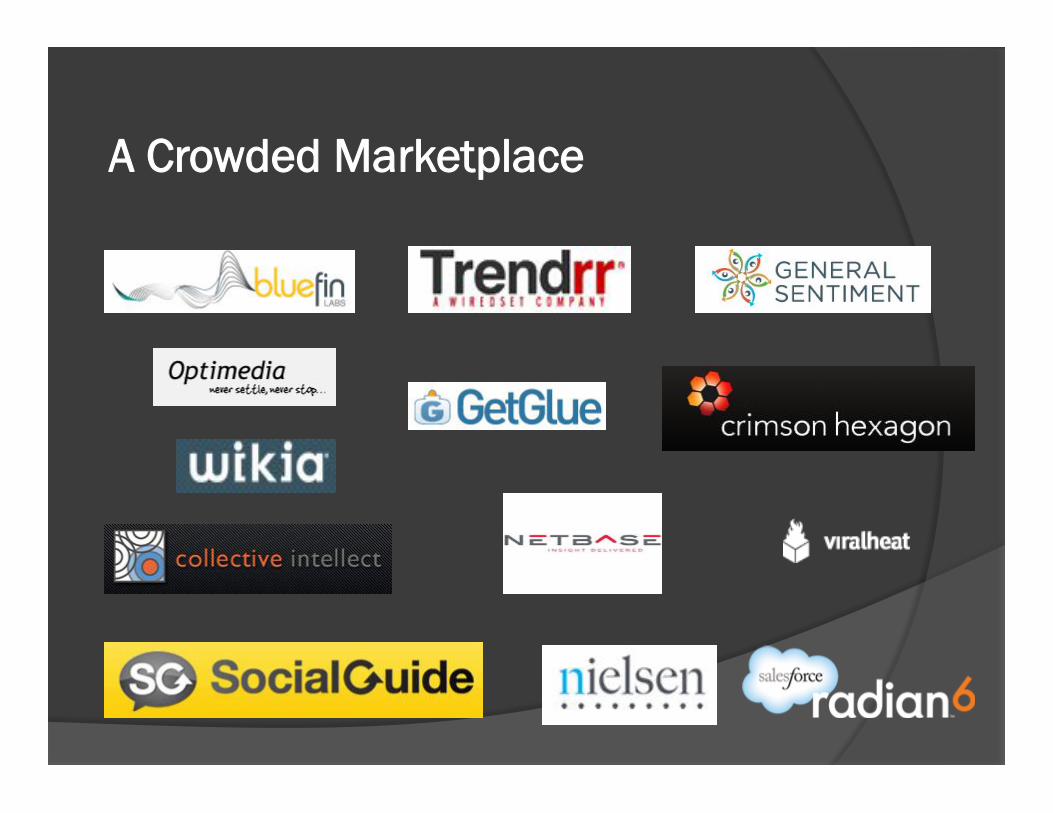
A Crowded Marketplace
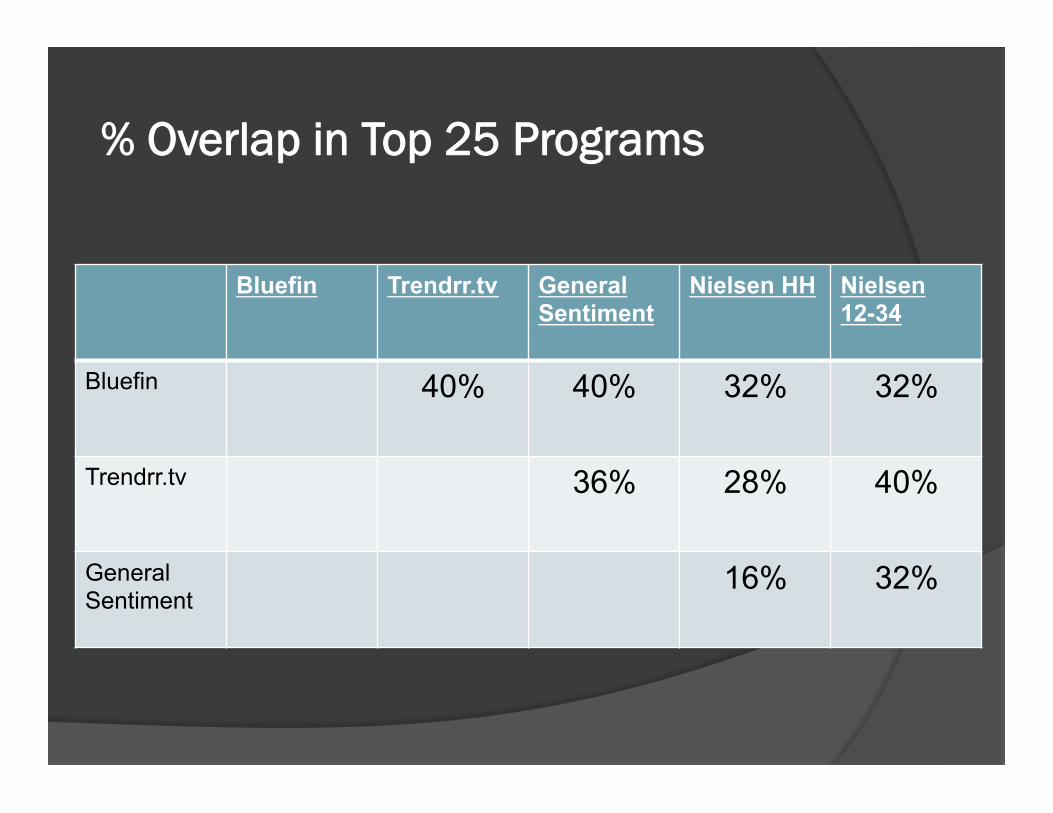
% Overlap in Top 25 Programs
Bluefin Trendrr.tv General Sentiment
Nielsen HH Nielsen 12-34
Bluefin 40% 40% 32% 32%
Trendrr.tv 36% 28% 40%
General Sentiment
16% 32%
0%
10%
20%
30%
40%
50%
60%
70%
80%
90%
100%
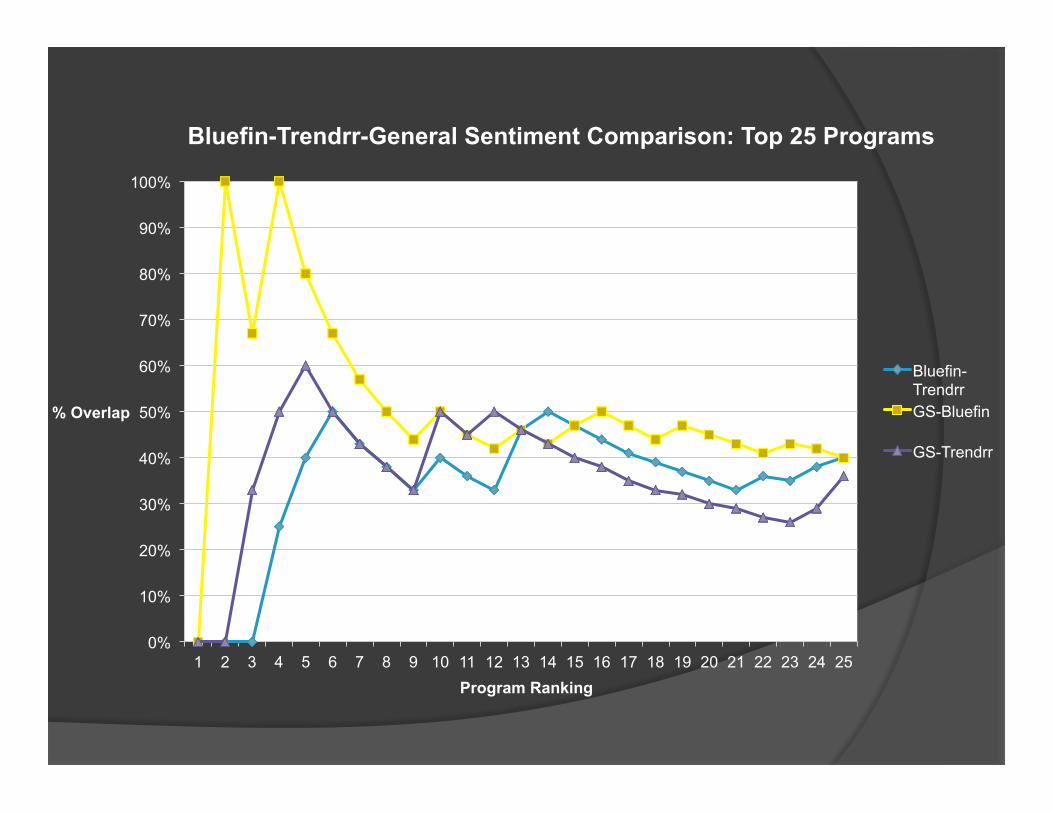
1 2 3 4 5 6 7 8 9 10 11 12 13 14 15 16 17 18 19 20 21 22 23 24 25
% Overlap
Program Ranking
Bluefin-Trendrr-General Sentiment Comparison: Top 25 Programs
Bluefin-Trendrr GS-Bluefin
GS-Trendrr
0%
10%
20%
30%
40%
50%
60%
70%
80%
90%
100%
1 2 3 4 5 6 7 8 9 10 11 12 13 14 15 16 17 18 19 20 21 22 23 24 25
% Overlap
Program Ranking
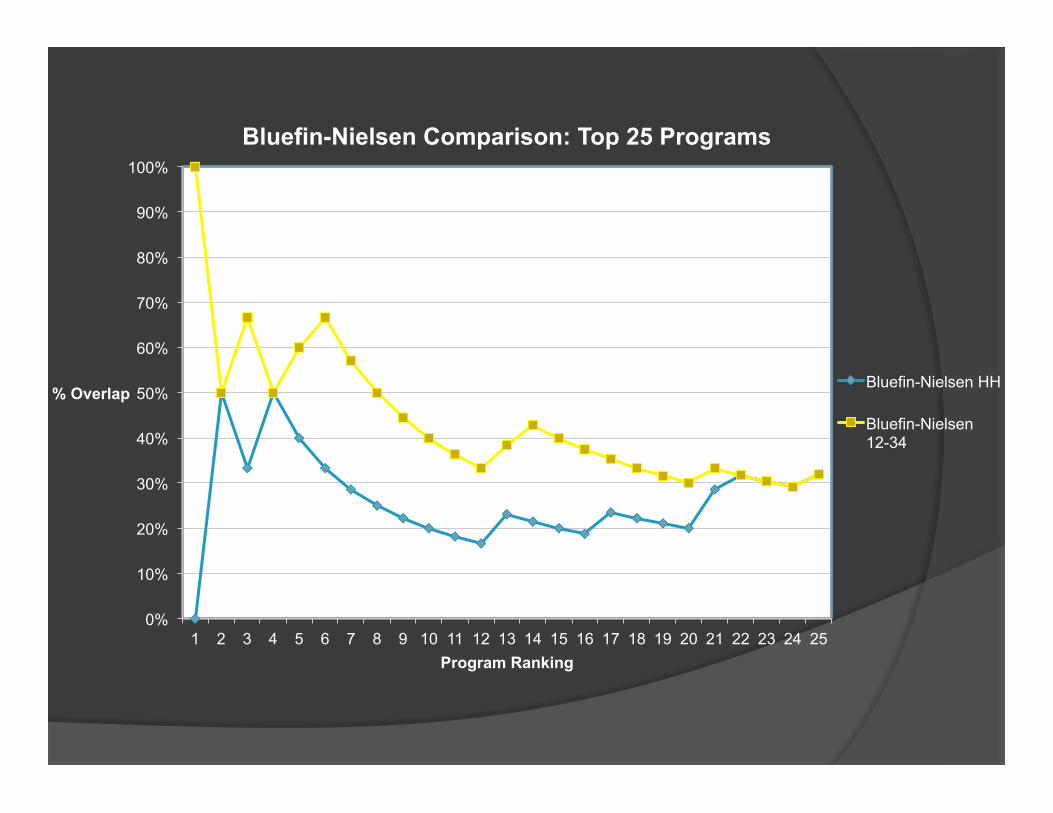
Bluefin-Nielsen Comparison: Top 25 Programs
Bluefin-Nielsen HH
Bluefin-Nielsen 12-34
0%
10%
20%
30%
40%
50%
60%
70%
80%
90%
1 2 3 4 5 6 7 8 9 10 11 12 13 14 15 16 17 18 19 20 21 22 23 24 25
% Overlap
Program Ranking
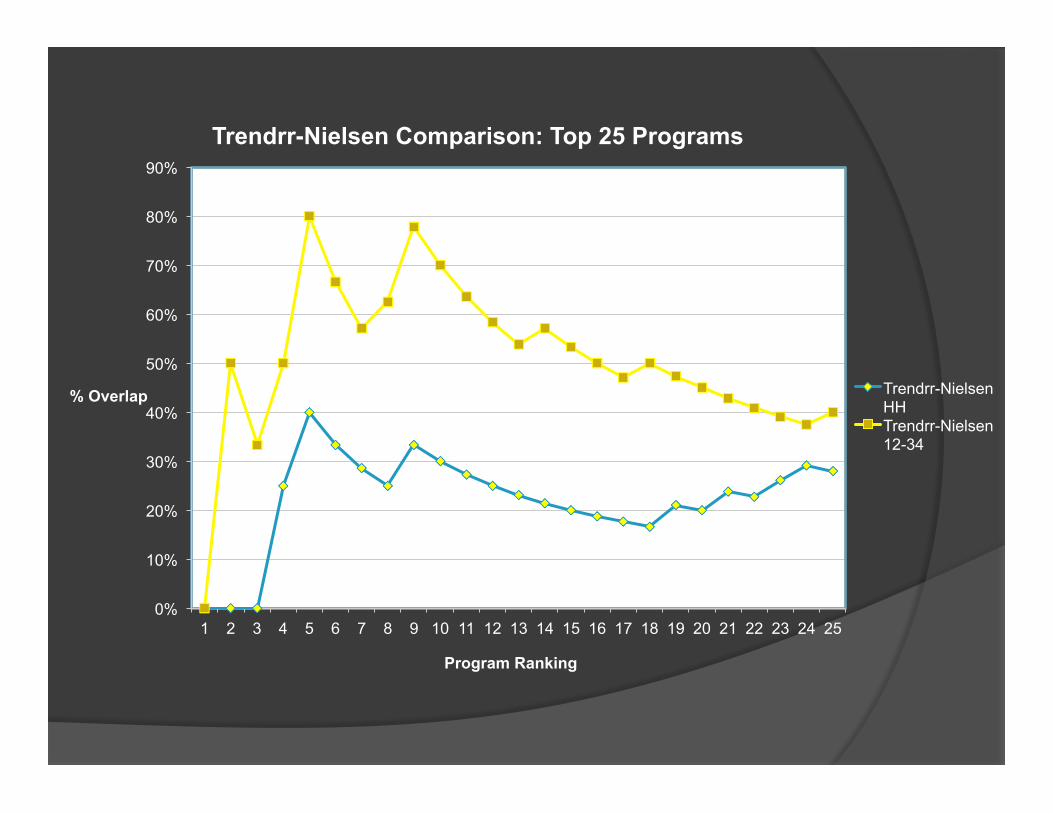
Trendrr-Nielsen Comparison: Top 25 Programs
Trendrr-Nielsen HH Trendrr-Nielsen 12-34
0%
10%
20%
30%
40%
50%
60%
70%
80%
90%
100%
1 2 3 4 5 6 7 8 9 10 11 12 13 14 15 16 17 18 19 20 21 22 23 24 25
% Overlap
Program Ranking
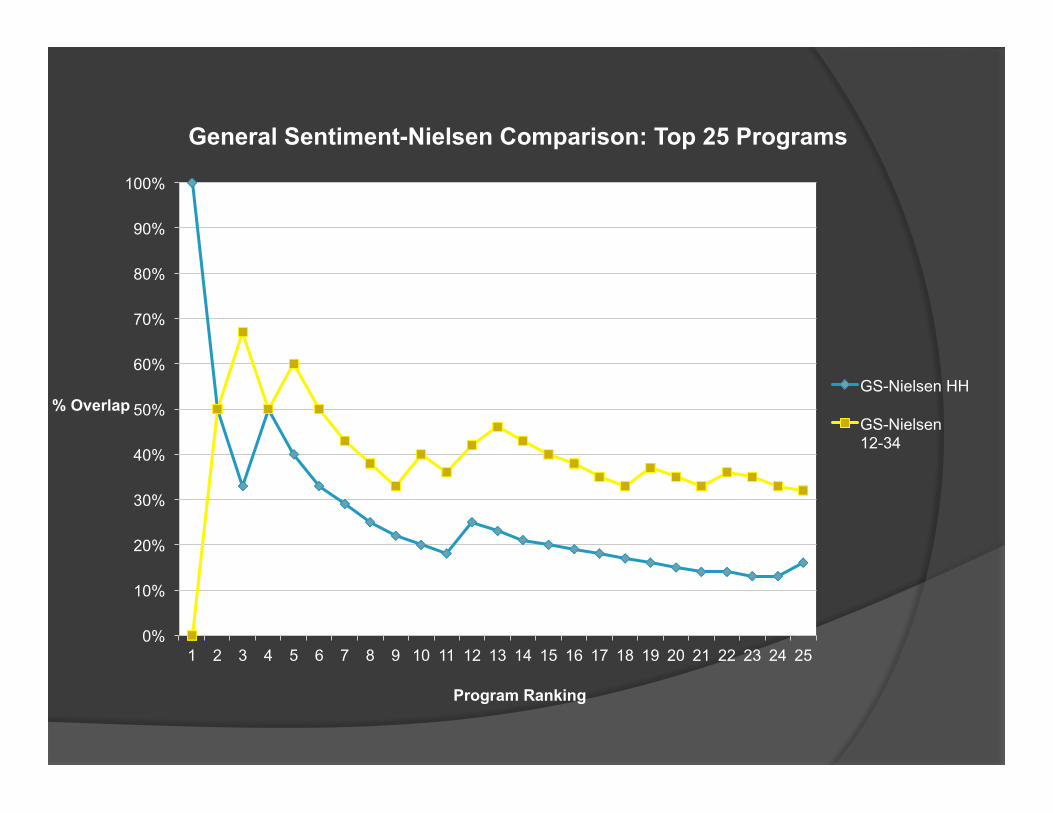
General Sentiment-Nielsen Comparison: Top 25 Programs
GS-Nielsen HH
GS-Nielsen 12-34
0%
10%
20%
30%
40%
50%
60%
70%
80%
90%
100%
1 2 3 4 5 6 7 8 9 10 11 12 13 14 15 16 17 18 19 20 21 22 23 24 25
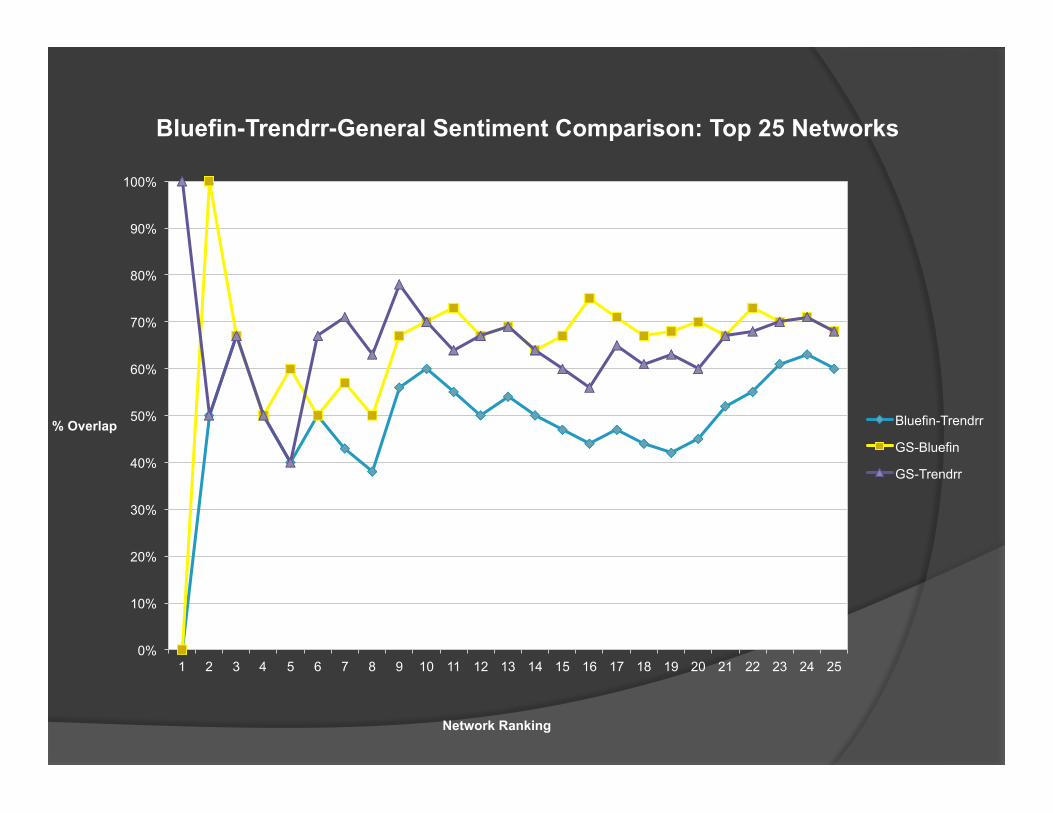
% Overlap
Network Ranking
Bluefin-Trendrr-General Sentiment Comparison: Top 25 Networks
Bluefin-Trendrr
GS-Bluefin
GS-Trendrr
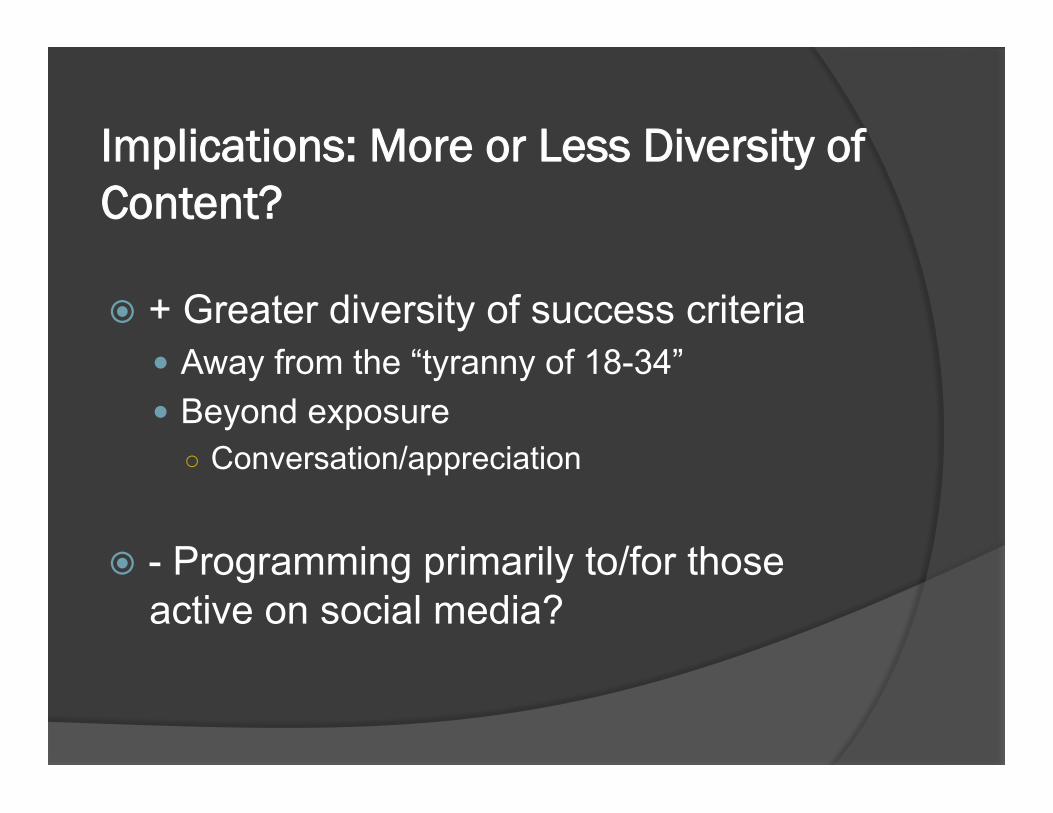
Implications: More or Less Diversity of Content?
� + Greater diversity of success criteria � Away from the “tyranny of 18-34” � Beyond exposure ○ Conversation/appreciation
� - Programming primarily to/for those
active on social media?
Thank You!
For more, visit:
http://audienceevolution.wordpress.com
Related Documents