Philip M. Napoli Professor and Area Chair, Communication & Media Management
Co-Director, Center for Communications Graduate School of Business
Fordham University
This research was conducted in partnership with, and with the assistance of, The Collaborative Alliance
Plan
� Background: Audience Evolution and the Post-Exposure Audience Marketplace
� Research Questions and Method � Overview/Assessment of Social TV
Analytics Methodologies � Comparative Analysis � Implications
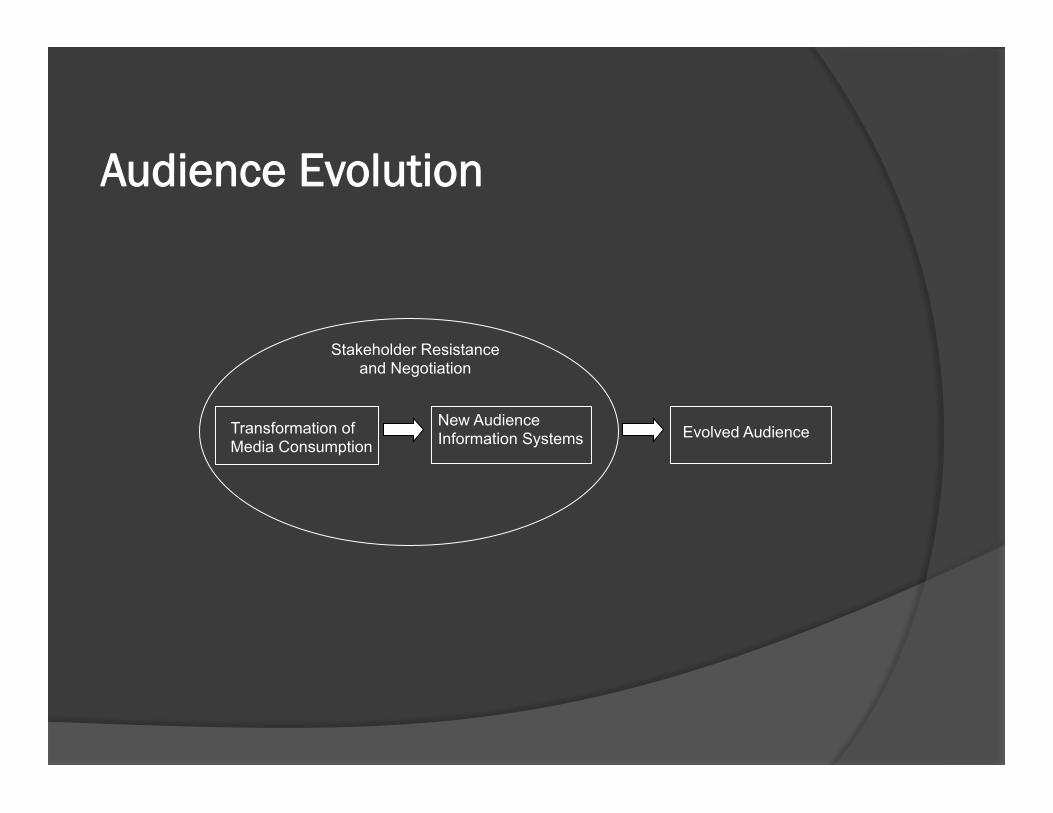
Audience Evolution
New Audience Information Systems Evolved Audience Transformation of
Media Consumption
Stakeholder Resistance and Negotiation
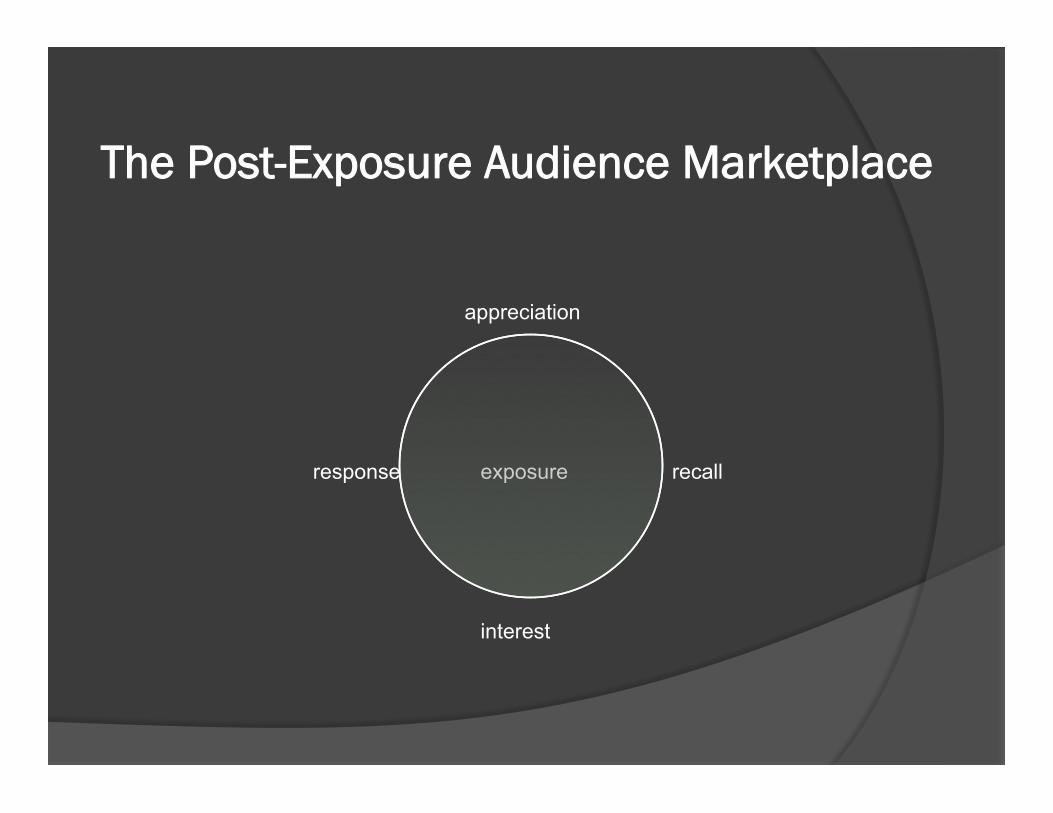
The Post-Exposure Audience Marketplace
exposure
appreciation
response recall
interest

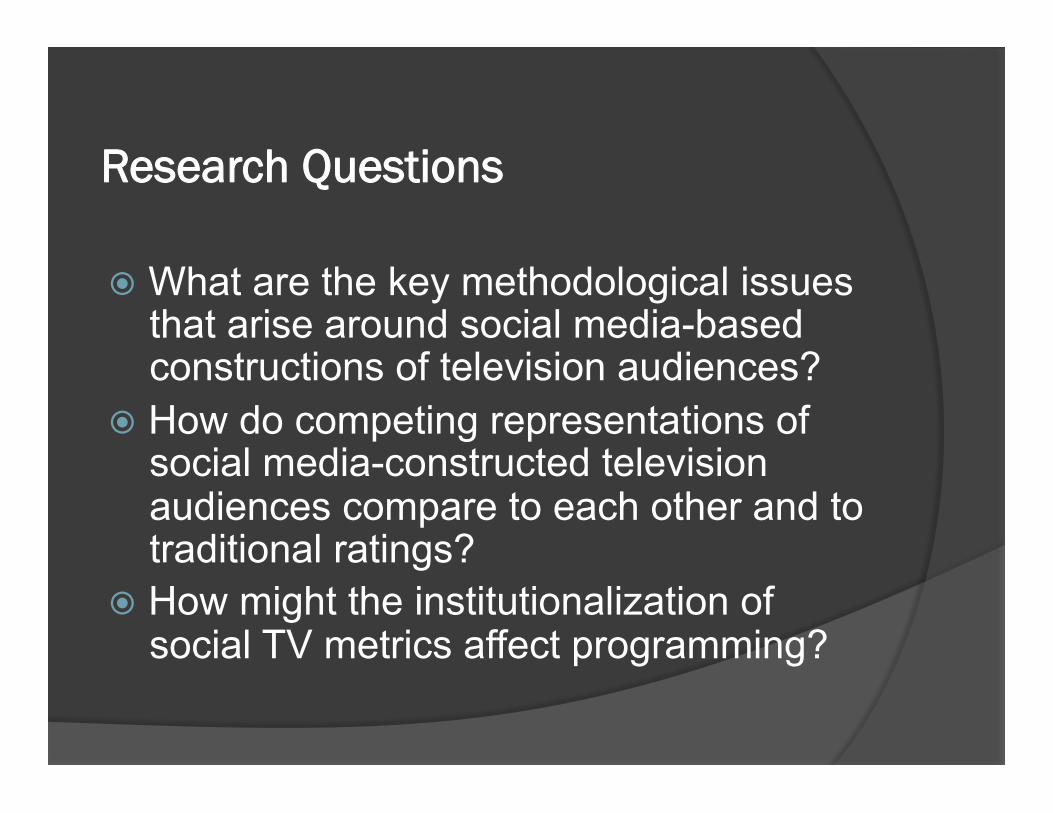
Research Questions
� What are the key methodological issues that arise around social media-based constructions of television audiences?
� How do competing representations of social media-constructed television audiences compare to each other and to traditional ratings?
� How might the institutionalization of social TV metrics affect programming?
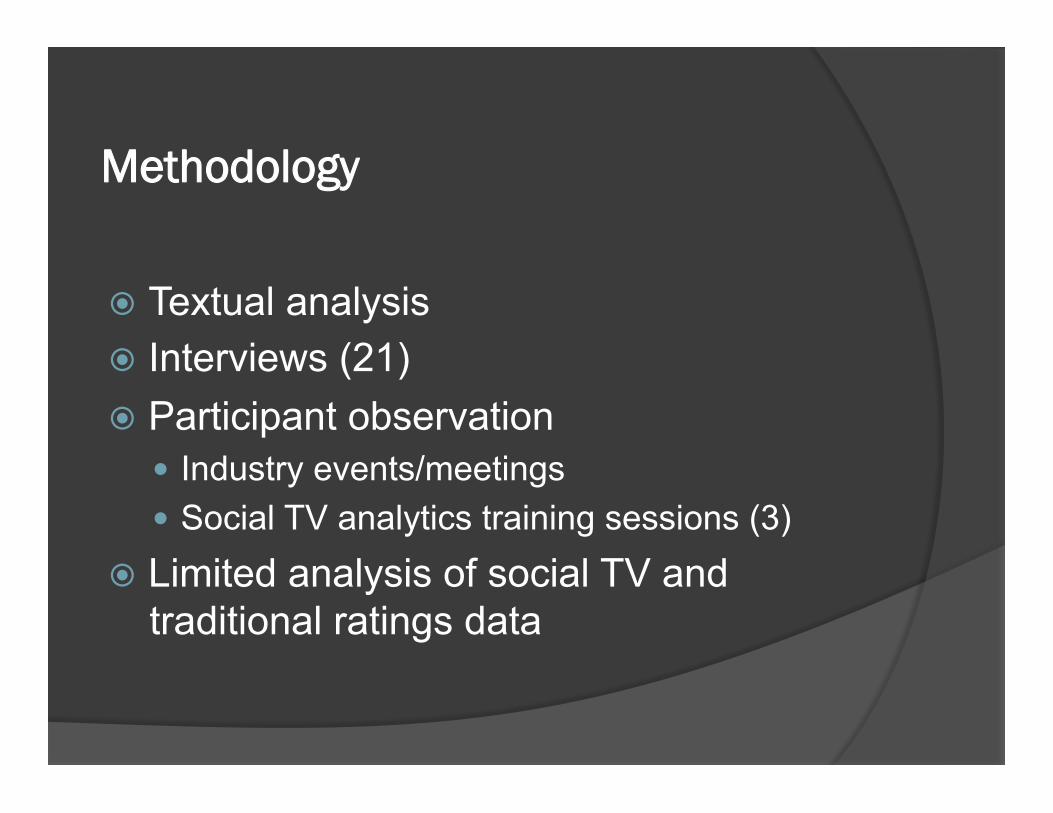
Methodology
� Textual analysis � Interviews (21) � Participant observation
� Industry events/meetings � Social TV analytics training sessions (3)
� Limited analysis of social TV and traditional ratings data
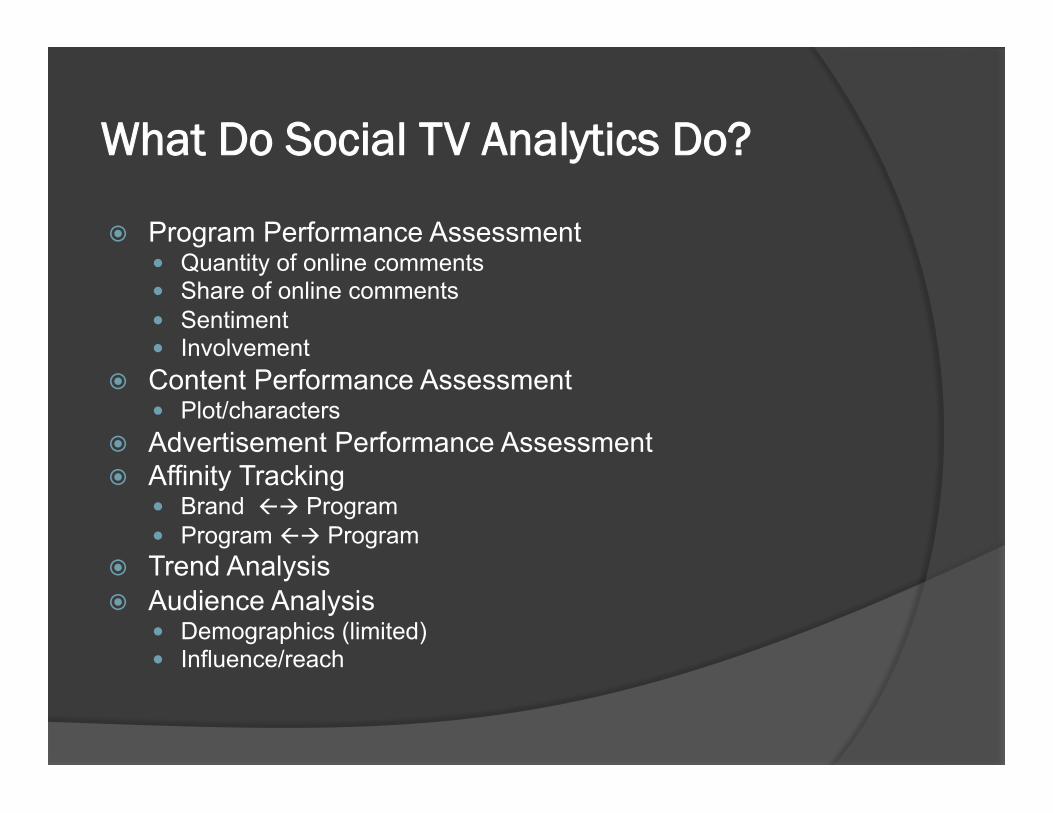
What Do Social TV Analytics Do?
� Program Performance Assessment � Quantity of online comments � Share of online comments � Sentiment � Involvement
� Content Performance Assessment � Plot/characters
� Advertisement Performance Assessment � Affinity Tracking
� Brand ßà Program � Program ßà Program
� Trend Analysis � Audience Analysis
� Demographics (limited) � Influence/reach
How Do They Do It?
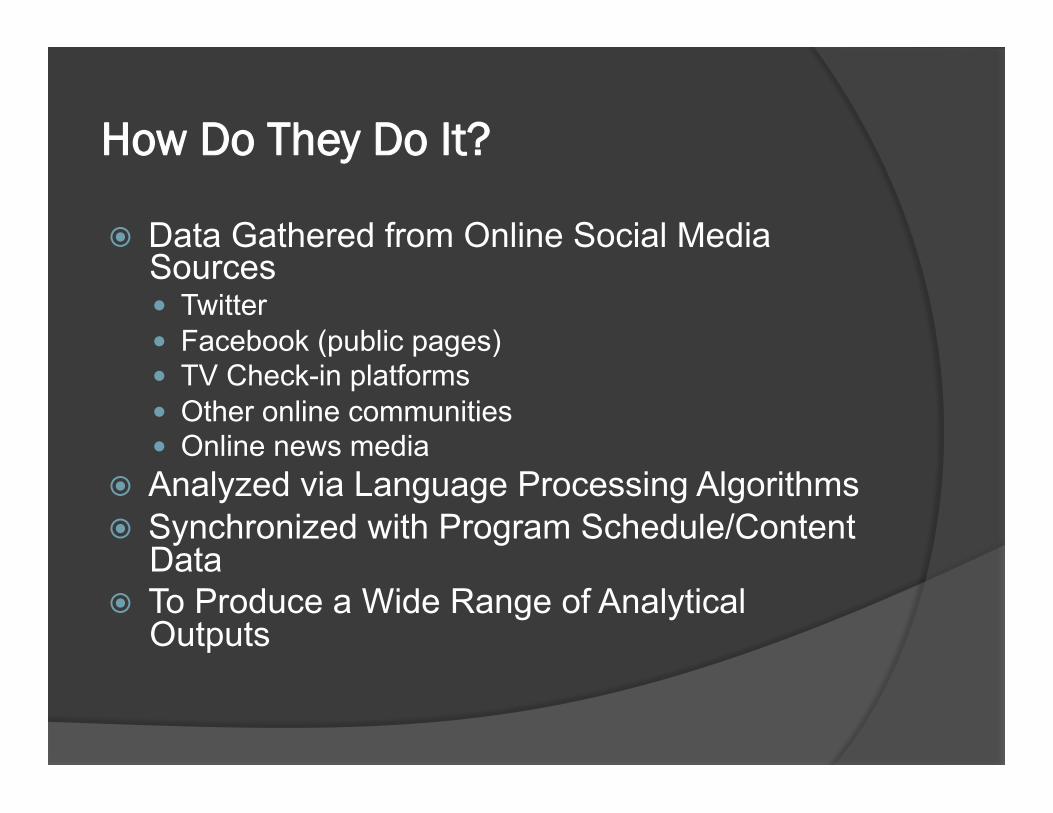
� Data Gathered from Online Social Media Sources � Twitter � Facebook (public pages) � TV Check-in platforms � Other online communities � Online news media
� Analyzed via Language Processing Algorithms � Synchronized with Program Schedule/Content
Data � To Produce a Wide Range of Analytical
Outputs
Points of Differentiation
� Data sources � Algorithm/search terms � Measurement period � Granularity
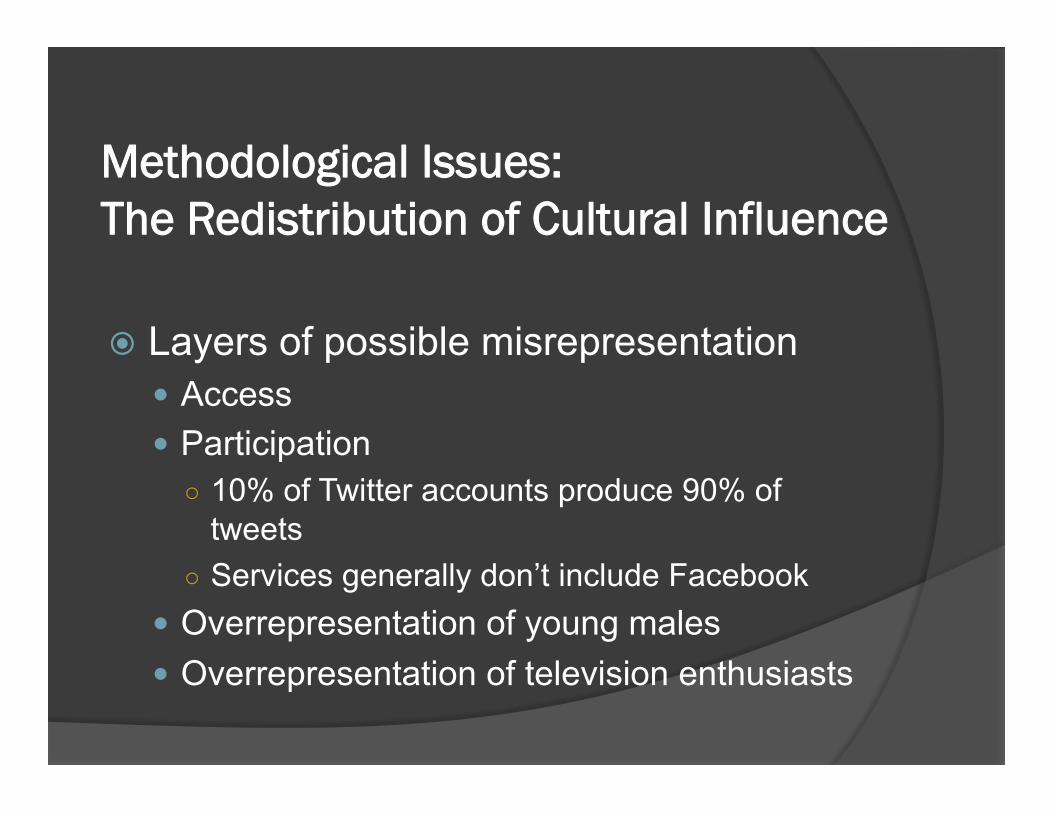
Methodological Issues: The Redistribution of Cultural Influence
� Layers of possible misrepresentation � Access � Participation ○ 10% of Twitter accounts produce 90% of
tweets ○ Services generally don’t include Facebook
� Overrepresentation of young males � Overrepresentation of television enthusiasts
Methodological Issues: “Black Box” Audiences
� “They never tell you what’s in the black box. There’s no transparency.”
� “People who are qualified to come up with solutions are coming from a completely different direction from traditional media research people. There’s no overlap in terms of skill sets, pedigree, etc.”
Methodological Issues: Compatibility with Established Practices � Demographics � Dayparts � Local markets
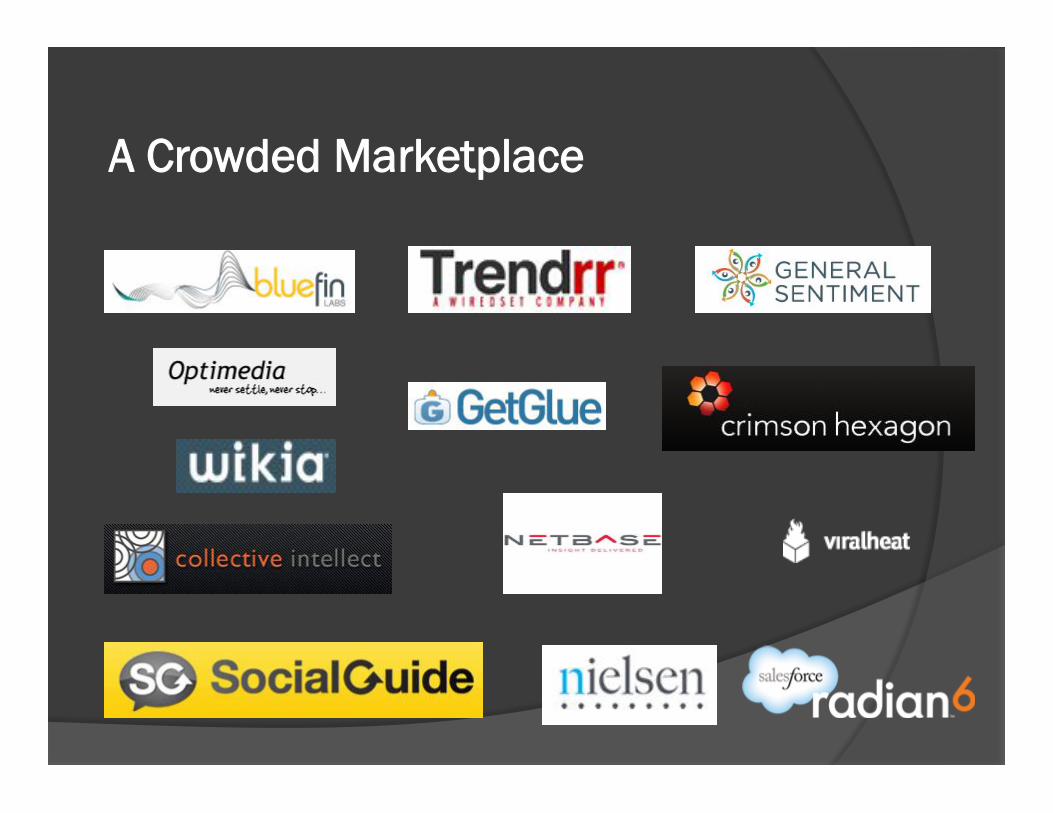
A Crowded Marketplace
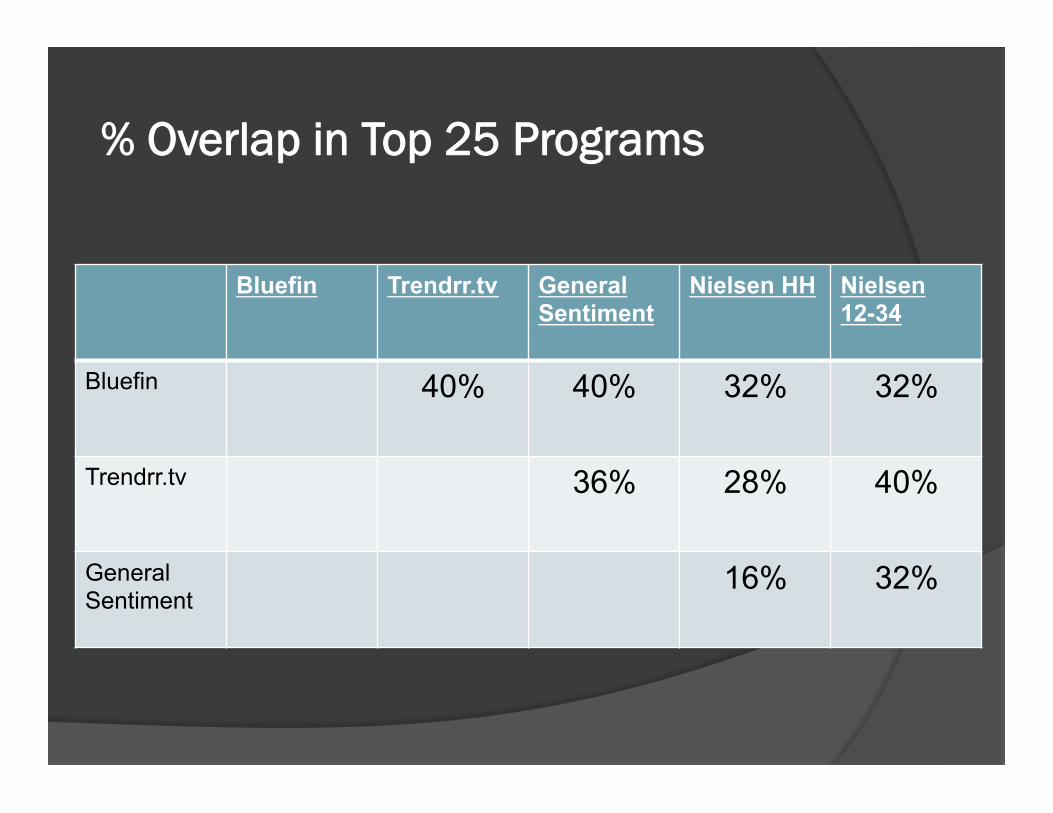
% Overlap in Top 25 Programs
Bluefin Trendrr.tv General Sentiment
Nielsen HH Nielsen 12-34
Bluefin 40% 40% 32% 32%
Trendrr.tv 36% 28% 40%
General Sentiment
16% 32%
0%
10%
20%
30%
40%
50%
60%
70%
80%
90%
100%
1 2 3 4 5 6 7 8 9 10 11 12 13 14 15 16 17 18 19 20 21 22 23 24 25
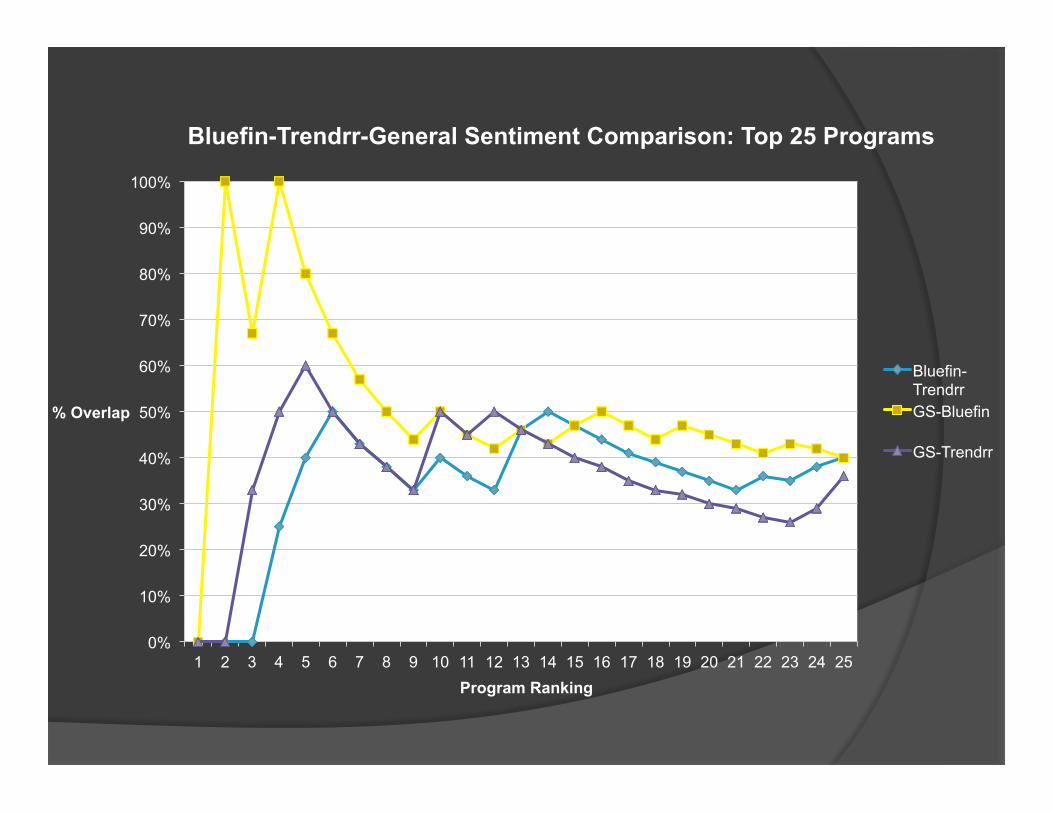
% Overlap
Program Ranking
Bluefin-Trendrr-General Sentiment Comparison: Top 25 Programs
Bluefin-Trendrr GS-Bluefin
GS-Trendrr
0%
10%
20%
30%
40%
50%
60%
70%
80%
90%
100%
1 2 3 4 5 6 7 8 9 10 11 12 13 14 15 16 17 18 19 20 21 22 23 24 25
% Overlap
Program Ranking
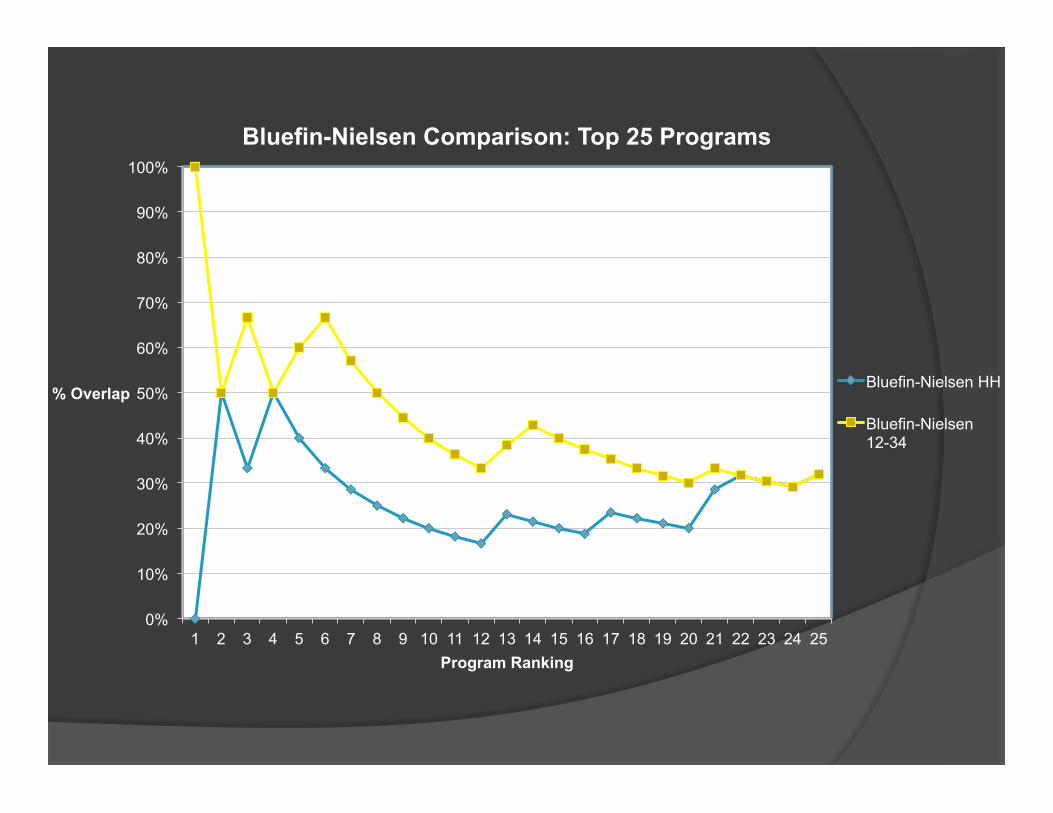
Bluefin-Nielsen Comparison: Top 25 Programs
Bluefin-Nielsen HH
Bluefin-Nielsen 12-34
0%
10%
20%
30%
40%
50%
60%
70%
80%
90%
1 2 3 4 5 6 7 8 9 10 11 12 13 14 15 16 17 18 19 20 21 22 23 24 25
% Overlap
Program Ranking
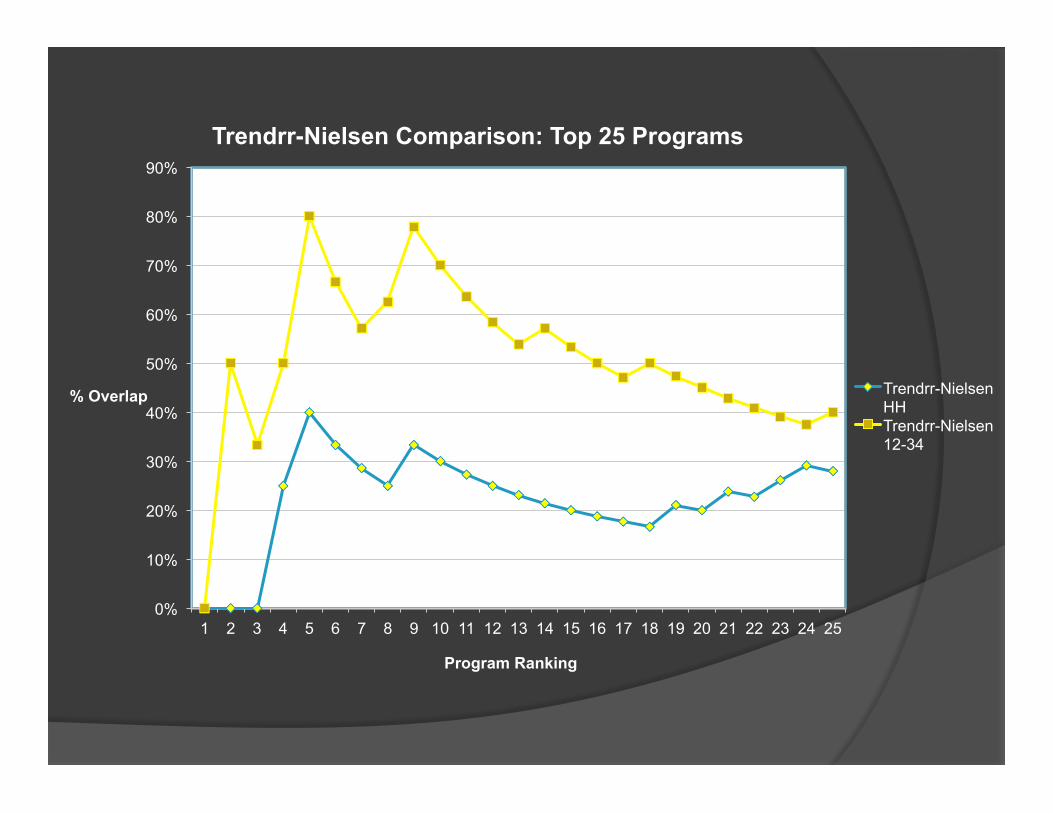
Trendrr-Nielsen Comparison: Top 25 Programs
Trendrr-Nielsen HH Trendrr-Nielsen 12-34
0%
10%
20%
30%
40%
50%
60%
70%
80%
90%
100%
1 2 3 4 5 6 7 8 9 10 11 12 13 14 15 16 17 18 19 20 21 22 23 24 25
% Overlap
Program Ranking
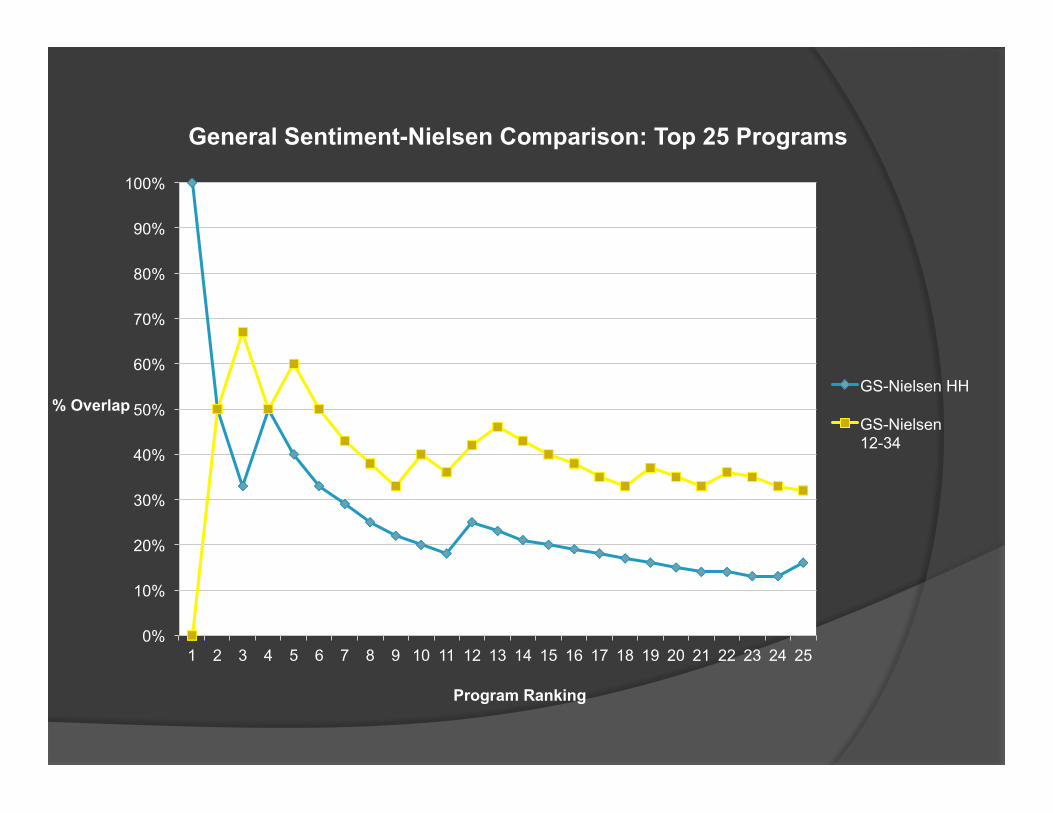
General Sentiment-Nielsen Comparison: Top 25 Programs
GS-Nielsen HH
GS-Nielsen 12-34
0%
10%
20%
30%
40%
50%
60%
70%
80%
90%
100%
1 2 3 4 5 6 7 8 9 10 11 12 13 14 15 16 17 18 19 20 21 22 23 24 25
% Overlap
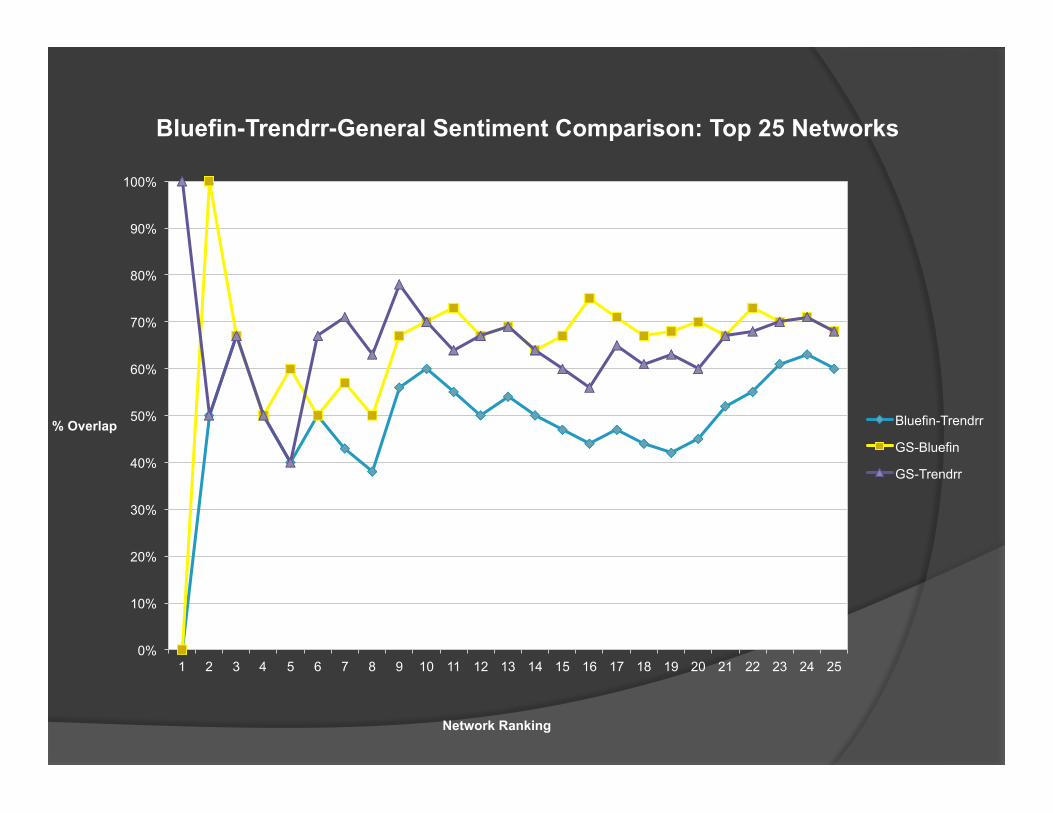
Network Ranking
Bluefin-Trendrr-General Sentiment Comparison: Top 25 Networks
Bluefin-Trendrr
GS-Bluefin
GS-Trendrr
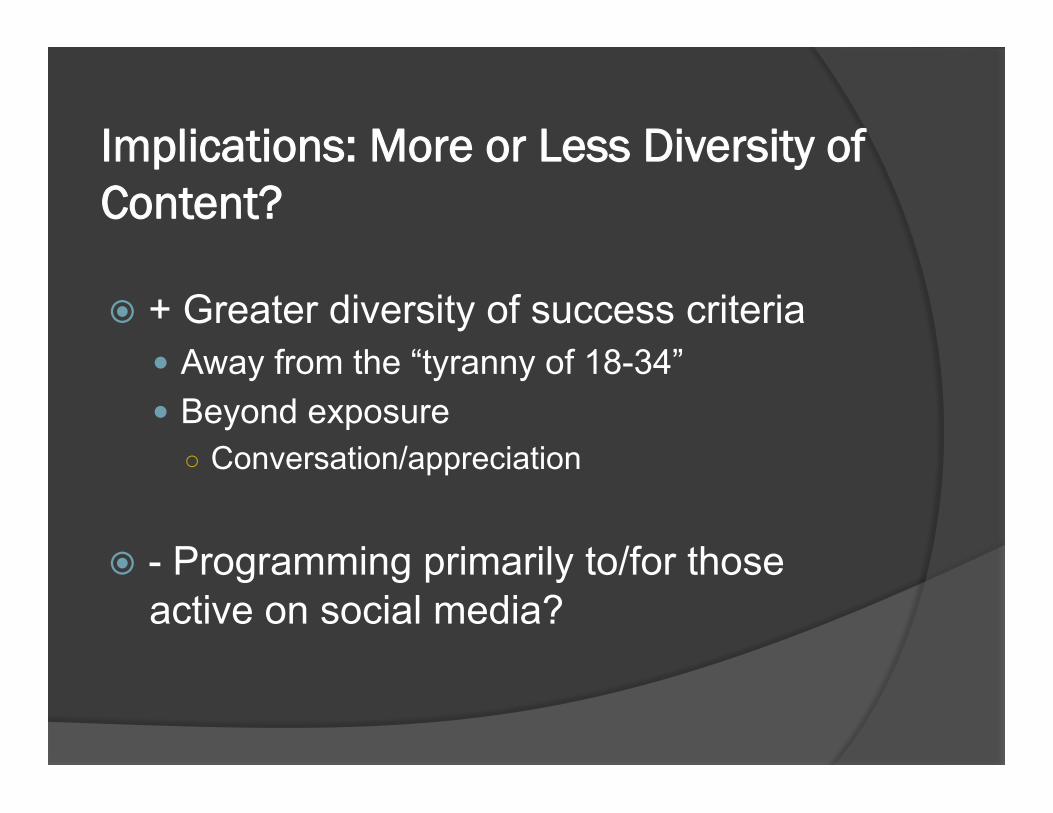
Implications: More or Less Diversity of Content?
� + Greater diversity of success criteria � Away from the “tyranny of 18-34” � Beyond exposure ○ Conversation/appreciation
� - Programming primarily to/for those
active on social media?
Thank You!
For more, visit:
http://audienceevolution.wordpress.com