IEEE TRANSACTIONS ON BIOMEDICAL ENGINEERING, VOL. 58, NO. 12, DECEMBER 2011 3339 Personalization of a Cardiac Electrophysiology Model Using Optical Mapping and MRI for Prediction of Changes With Pacing Jatin Relan, Mihaela Pop, Herv´ e Delingette ∗ , Graham A. Wright, Nicholas Ayache, and Maxime Sermesant Abstract—Computer models of cardiac electrophysiology (EP) can be a very efficient tool to better understand the mechanisms of arrhythmias. Quantitative adjustment of such models to experi- mental data (personalization) is needed in order to test their realism and predictive power, but it remains challenging at the organ scale. In this paper, we propose a framework for the personalization of a 3-D cardiac EP model, the Mitchell–Schaeffer (MS) model, and evaluate its volumetric predictive power under various pac- ing scenarios. The personalization was performed on ex vivo large porcine healthy hearts using diffusion tensor MRI (DT-MRI) and optical mapping data. The MS model was simulated on a 3-D mesh incorporating local fiber orientations, built from DT-MRI. The 3-D model parameters were optimized using features such as 2-D epicardial depolarization and repolarization maps, extracted from the optical mapping. We also evaluated the sensitivity of our per- sonalization framework to different pacing locations and showed results on its robustness. Further, we evaluated volumetric model predictions for various epi- and endocardial pacing scenarios. We demonstrated promising results with a mean personalization error around 5 ms and a mean prediction error around 10 ms (5% of the total depolarization time). Finally, we discussed the potential translation of such work to clinical data and pathological hearts. Index Terms—Biomedical imaging, electrocardiography, elec- trophysiology, optical imaging, parameter estimation. I. INTRODUCTION M ODELING cardiac electrophysiology in silico has been an important research topic for the last decades [1]–[4], Manuscript received July 29, 2010; revised October 26, 2010 and December 3, 2010; accepted December 13, 2010. Date of publication January 20, 2011; date of current version November 18, 2011. This research received funding from the European Community’s Seventh Framework Programme (FP7/2007-2013) under Grant agreement in 224495 (euHeart project). Asterisk indicates corre- sponding author. J. Relan and N. Ayache are with Inria, Asclepios team, Sophia-Antipolis, 06902 France (e-mail: [email protected]; [email protected]). M. Pop and G. A. Wright are with the Department of Medical Biophysics, Sunnybrook Health Sciences Centre, University of Toronto, ON M5S 1A1, Canada (e-mail: [email protected]; [email protected]). ∗ H. Delingette is with Inria, Asclepios team, Sophia-Antipolis, 06902 France (e-mail: [email protected]). M. Sermesant is with Inria, Asclepios team, Sophia-Antipolis, 06902 France (e-mail: [email protected]). This paper has supplementary downloadable material available at http://ieeexplore.ieee.org, provided by the authors. This includes three mul- timedia AVI format movie clips, which show personalization and prediction stages. Color versions of one or more of the figures in this paper are available online at http://ieeexplore.ieee.org. Digital Object Identifier 10.1109/TBME.2011.2107513 and it can be a very efficient tool to better understand the mecha- nisms of arrhythmias. Personalization of such models to experi- mental data is needed in order to test their realism and predictive power, but remains difficult at the scale of the organ. Person- alization is defined as the estimation of model parameters that best fit simulations to data. In this paper, we propose a robust personalization method for a volumetric cardiac electrophysiol- ogy model using surface data and we test its predictive power. The personalization and prediction evaluation were done using the high-quality ex vivo electrophysiology data obtained from the fusion of optical and MRI. Cardiac electrophysiology models of the myocyte action po- tential (AP) at cellular and subcellular scales can be broadly classified into three main categories: 1) ionic models (IM); 2) phenomenological models (PM); and 3) eikonal models (EM). IM [1], [2], [4]–[6] characterize ionic currents flowing through the cardiac cell membrane with varying complexity and accuracy and have many parameters and variables (it can be more than 50). Most of them are computationally expensive to simulate in volumetric domains and not well suited to solve inverse problems (parameter estimation). EM [3], [7], [8] are very simple, describing only the time at which a depolarization wave reaches a given point without precisely modeling the po- tential value. At the intermediate level, there are PM [9]–[11], which describe and capture just the shape of AP generation and propagation along the cell membrane, without modeling all the ionic currents. Here, we personalized a simplified biophysical model, the Mitchell–Schaeffer (MS) model [12], modeling the AP as a combination of sodium (Na + ), calcium (Ca 2+ ), and potassium (K + ) phenomenological ionic currents. We chose this model because of the following reasons: 1) it provides a good ana- lytical understanding of the membrane dynamics; 2) it has a limited number of parameters (5) to estimate; 3) each param- eter has a simple physical interpretation; and 4) it has explicit analytical formulae to express most of the measured features and restitution properties using model parameters [12]. Fi- nally, it was compared to another classical PM models (the Aliev–Panfilov model [10]), and the MS model was providing a better fit (lower final error, especially for the action potential duration (APD) with a more homogeneous parameter map for conductivity [13]. In this paper, the cardiac electrical activity was acquired ex vivo from controlled experiments using optical imaging of the epicardium of healthy porcine hearts [14]. The optical signal directly represents the tissue AP. These data were then processed 0018-9294/$26.00 © 2011 IEEE

Welcome message from author
This document is posted to help you gain knowledge. Please leave a comment to let me know what you think about it! Share it to your friends and learn new things together.
Transcript
IEEE TRANSACTIONS ON BIOMEDICAL ENGINEERING, VOL. 58, NO. 12, DECEMBER 2011 3339
Personalization of a Cardiac ElectrophysiologyModel Using Optical Mapping and MRI for
Prediction of Changes With PacingJatin Relan, Mihaela Pop, Herve Delingette∗, Graham A. Wright, Nicholas Ayache, and Maxime Sermesant
Abstract—Computer models of cardiac electrophysiology (EP)can be a very efficient tool to better understand the mechanismsof arrhythmias. Quantitative adjustment of such models to experi-mental data (personalization) is needed in order to test their realismand predictive power, but it remains challenging at the organ scale.In this paper, we propose a framework for the personalizationof a 3-D cardiac EP model, the Mitchell–Schaeffer (MS) model,and evaluate its volumetric predictive power under various pac-ing scenarios. The personalization was performed on ex vivo largeporcine healthy hearts using diffusion tensor MRI (DT-MRI) andoptical mapping data. The MS model was simulated on a 3-D meshincorporating local fiber orientations, built from DT-MRI. The3-D model parameters were optimized using features such as 2-Depicardial depolarization and repolarization maps, extracted fromthe optical mapping. We also evaluated the sensitivity of our per-sonalization framework to different pacing locations and showedresults on its robustness. Further, we evaluated volumetric modelpredictions for various epi- and endocardial pacing scenarios. Wedemonstrated promising results with a mean personalization erroraround 5 ms and a mean prediction error around 10 ms (5% ofthe total depolarization time). Finally, we discussed the potentialtranslation of such work to clinical data and pathological hearts.
Index Terms—Biomedical imaging, electrocardiography, elec-trophysiology, optical imaging, parameter estimation.
I. INTRODUCTION
MODELING cardiac electrophysiology in silico has beenan important research topic for the last decades [1]–[4],
Manuscript received July 29, 2010; revised October 26, 2010 and December3, 2010; accepted December 13, 2010. Date of publication January 20, 2011;date of current version November 18, 2011. This research received funding fromthe European Community’s Seventh Framework Programme (FP7/2007-2013)under Grant agreement in 224495 (euHeart project). Asterisk indicates corre-sponding author.
J. Relan and N. Ayache are with Inria, Asclepios team, Sophia-Antipolis,06902 France (e-mail: [email protected]; [email protected]).
M. Pop and G. A. Wright are with the Department of Medical Biophysics,Sunnybrook Health Sciences Centre, University of Toronto, ON M5S 1A1,Canada (e-mail: [email protected]; [email protected]).
∗H. Delingette is with Inria, Asclepios team, Sophia-Antipolis, 06902 France(e-mail: [email protected]).
M. Sermesant is with Inria, Asclepios team, Sophia-Antipolis, 06902 France(e-mail: [email protected]).
This paper has supplementary downloadable material available athttp://ieeexplore.ieee.org, provided by the authors. This includes three mul-timedia AVI format movie clips, which show personalization and predictionstages.
Color versions of one or more of the figures in this paper are available onlineat http://ieeexplore.ieee.org.
Digital Object Identifier 10.1109/TBME.2011.2107513
and it can be a very efficient tool to better understand the mecha-nisms of arrhythmias. Personalization of such models to experi-mental data is needed in order to test their realism and predictivepower, but remains difficult at the scale of the organ. Person-alization is defined as the estimation of model parameters thatbest fit simulations to data. In this paper, we propose a robustpersonalization method for a volumetric cardiac electrophysiol-ogy model using surface data and we test its predictive power.The personalization and prediction evaluation were done usingthe high-quality ex vivo electrophysiology data obtained fromthe fusion of optical and MRI.
Cardiac electrophysiology models of the myocyte action po-tential (AP) at cellular and subcellular scales can be broadlyclassified into three main categories: 1) ionic models (IM);2) phenomenological models (PM); and 3) eikonal models(EM). IM [1], [2], [4]–[6] characterize ionic currents flowingthrough the cardiac cell membrane with varying complexityand accuracy and have many parameters and variables (it canbe more than 50). Most of them are computationally expensiveto simulate in volumetric domains and not well suited to solveinverse problems (parameter estimation). EM [3], [7], [8] arevery simple, describing only the time at which a depolarizationwave reaches a given point without precisely modeling the po-tential value. At the intermediate level, there are PM [9]–[11],which describe and capture just the shape of AP generation andpropagation along the cell membrane, without modeling all theionic currents.
Here, we personalized a simplified biophysical model, theMitchell–Schaeffer (MS) model [12], modeling the AP as acombination of sodium (Na+ ), calcium (Ca2+ ), and potassium(K+ ) phenomenological ionic currents. We chose this modelbecause of the following reasons: 1) it provides a good ana-lytical understanding of the membrane dynamics; 2) it has alimited number of parameters (5) to estimate; 3) each param-eter has a simple physical interpretation; and 4) it has explicitanalytical formulae to express most of the measured featuresand restitution properties using model parameters [12]. Fi-nally, it was compared to another classical PM models (theAliev–Panfilov model [10]), and the MS model was providinga better fit (lower final error, especially for the action potentialduration (APD) with a more homogeneous parameter map forconductivity [13].
In this paper, the cardiac electrical activity was acquired exvivo from controlled experiments using optical imaging of theepicardium of healthy porcine hearts [14]. The optical signaldirectly represents the tissue AP. These data were then processed
0018-9294/$26.00 © 2011 IEEE
3340 IEEE TRANSACTIONS ON BIOMEDICAL ENGINEERING, VOL. 58, NO. 12, DECEMBER 2011
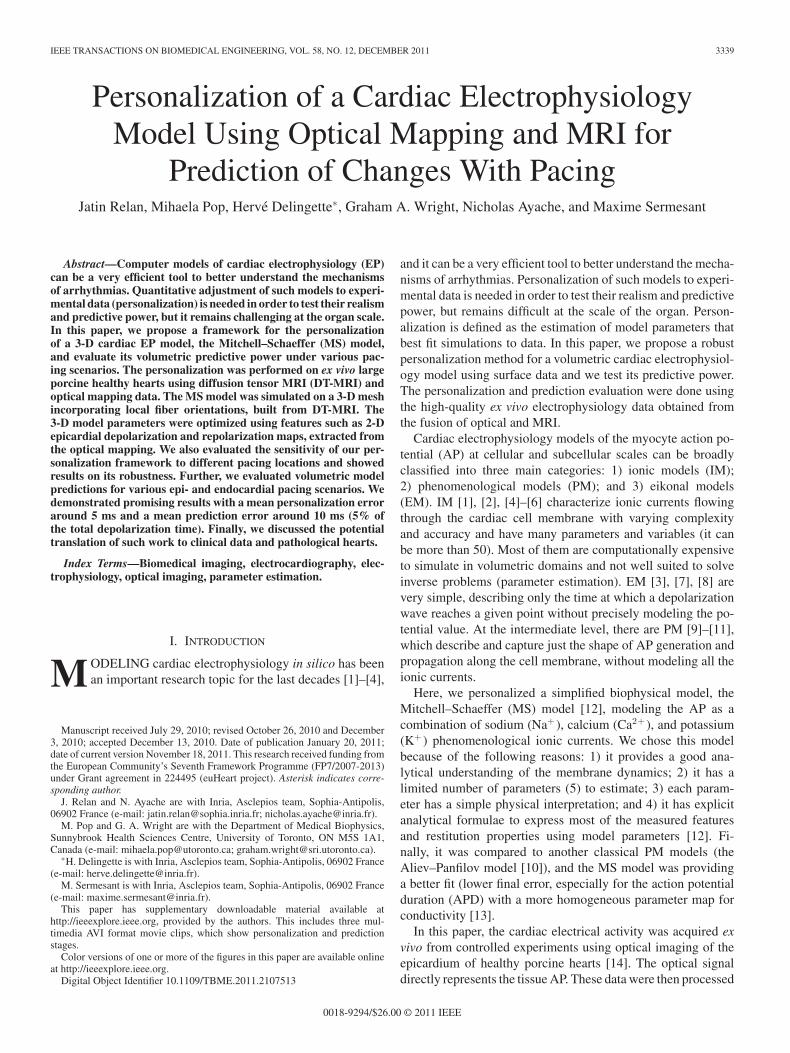
Fig. 1. Flowchart describing the outline of this paper.
to extract features of the AP propagation such as depolarizationtime (DT), repolarization time (RT), conduction velocity (CV),APD, and their restitutions. These features were then fused witha volumetric mesh created from MRI of the ex vivo hearts, toobtain epicardial surface data.
Electrophysiology model personalization can be basically ad-dressed as an inverse problem of parameter estimation. Thisproblem was first addressed using a single heart cycle for 2-Dphenomenological Aliev–Panfilov model in [15], where the APpropagation was simulated on a simple surface mesh modelinga dog’s heart epicardium. Only the model parameter for the DTfeature was adjusted. It was also performed for 2-D EM in [16]again with adjustment of the same feature but for patient data.Finally, an initial step toward personalization of the 3-D Aliev–Panfilov model was taken in [17] with adjustment of DT andAPD features from a single cycle.
In this paper, we propose a personalization framework fora 3-D macroscopic MS model on a volumetric biventricularmesh of the myocardium using 2-D epicardial surface data. Therobustness of this method to different pacing locations and itspredictive power was assessed.
II. DATA ACQUISITION AND PROCESSING
The experimental data acquired consist of epicardial opti-cal imaging that records the AP wave propagation, and diffu-sion tensor MRI (DT-MRI) representing the anatomy and fiberorientations. The optical data have a higher spatial resolutioncompared to in vivo mapping data and provide a direct measure-
ment of the AP [18]. Such dense and controlled data enabledthe validation of the personalization method and prediction re-sults. The data were acquired and processed in three stages (seeFig. 2).
A. Stage 1: Optical Imaging Data
The explanted heart was attached to a Langendorff perfu-sion system with fluorescence dye and the electromechanicaluncoupler (to suppress heart motion) injected into the perfu-sion line. More details of the experimental setup can be foundelsewhere [14]. The heart was paced at a given rate, with anelectrode near the apex with a square wave voltage stimulus of2–4 V for 5 ms. The fluorescence signals were captured withhigh temporal (270 frames/s) and spatial (<1 mm) resolution,using a pair of charge-coupled device (CCD) cameras. Lastly,five to seven opaque markers were glued onto the epicardiumand imaged, so as to provide a way to register the optical imageswith the epicardial surface of the model generated from MRIvolume. Recorded 2-D optical movie represents the changes inthe fluorescent signal intensity, which follow the changes in theAP. The signal intensity was then analyzed for each pixel ofthe movie to get DT and RT isochrones in the following way.First, the signal was scaled for each pixel between its baselineand maximum value, cropping under the baseline that we gotfrom segmenting the values into two clusters, the baseline be-ing defined as the mean value of the lowest cluster. The scaledrecordings were then filtered with a 3-D Gaussian convolution,
RELAN et al.: PERSONALIZATION OF CARDIAC ELECTROPHYSIOLOGY MODEL 3341
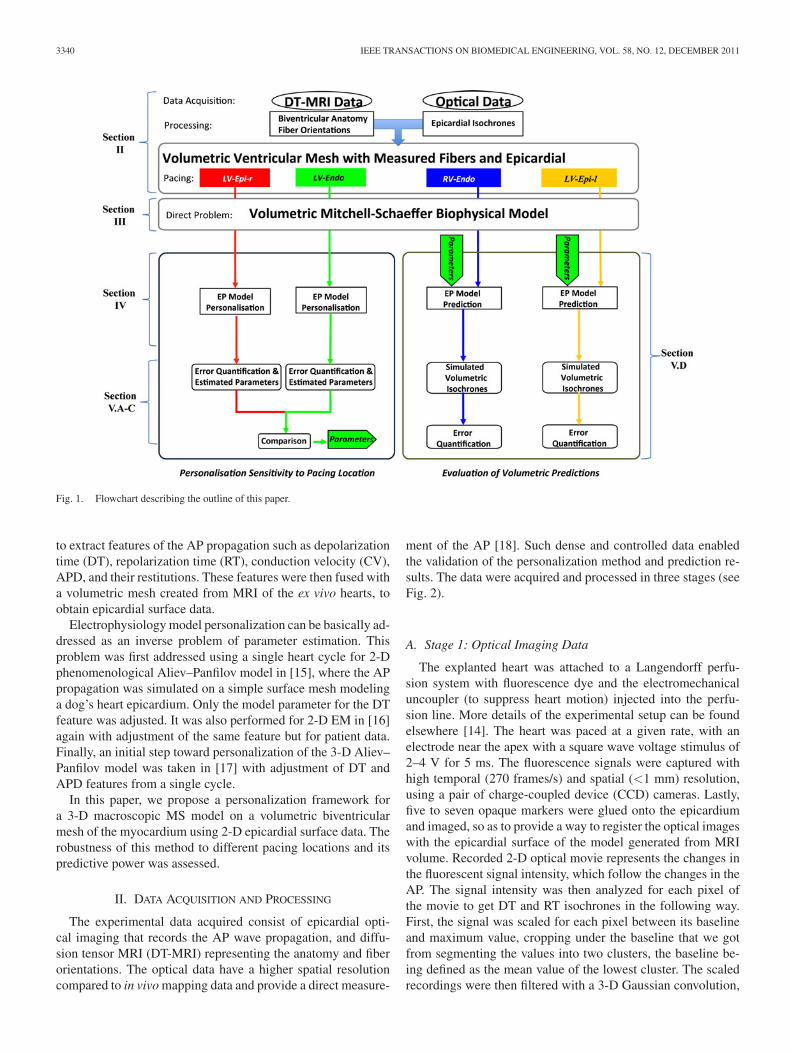
Fig. 2. Stage 1: (a) Raw optical data acquired (antero-lateral view). (b) Extraction of DT (blue dots) and APD90 (gray dots). (c), (d) Extracted DT and APDisochronal maps. Stage 2: (e) DT-MRI slice. (f), (g) Fiber tracking from DT-MRI. (h) Volumetric mesh with assigned fiber orientations. Stage 3: (i) Top: Snapshotshowing the epicardial markers using optical camera, bottom: MRI slice showing markers. (j) Stereoscopic surface generated from the two optical CCD cameraswith extracted features. (k) Registration of stereoscopic surface to the volumetric mesh using markers and features projection. (l), (m) Resulting DT and APDmaps on the mesh for epicardial surface only.
spatially isotropic with a kernel width of 1.0 and temporallyusing a kernel width of 3.0.
The DT was detected using the zero crossing of the second(d2F/dt2) derivatives of the fluorescence signal intensity F[see Fig. 2(b)]. The RT was detected using APD90 (APD at 90%repolarization, which is 0.9 times the difference between the APpeak amplitude and the baseline [see Fig. 2(b)]). Finally, the DTisochrones and APD maps for each cycle were reconstructed as2-D images [see Fig. 2(c) and (d)].
B. Stage 2: DT-MRI Data
The hearts were then imaged using an MR scanner. MRpulse sequences and setup used are described in detail in[14]. An in-plane resolution of 0.5 mm × 0.5 mm and slicethickness of 1.5 mm were used. The heart anatomy wasextracted from the MR data using classical segmentationalgorithms such as thresholding, mathematical morphology,isosurface extraction, and used to generate a volumetrictetrahedral mesh using Computational Geometry AlgorithmsLibrary (CGAL) (http://www.cgal.org) and GHS3D (TetMesh,
http://www.distene.com) software. For each vertex, the assignedfiber direction is the principal eigenvector of the correspondingvoxel in the reconstructed tensor image [see Fig. 2(h)].
C. Stage 3: Optical and MR Data Fusion
The optical images recorded by the two CCD cameras wereused to reconstruct the 3-D surface of the heart using stereoscopy[see Fig. 2(i)] [19]. The 2-D isochronal maps generated werethen rectified based on the cameras calibration and stereoscopicparameters. Each pixel of the isochronal maps corresponds to avertex on the grid mesh of the stereoscopic surface [see Fig. 2(j)].The glued opaque markers were imaged with optical as well asMR data. An affine registration of the stereoscopic surface ontothe volumetric mesh was then performed using these markers[14] [see Fig. 2(i)].
The DT isochrones and APD maps for each cycle were pro-jected onto the volumetric mesh with an interpolation fromthe triangular stereoscopic surface, resulting in epicardial DTisochrones and APD maps on the biventricular mesh [seeFig. 2(k)–(m)].
3342 IEEE TRANSACTIONS ON BIOMEDICAL ENGINEERING, VOL. 58, NO. 12, DECEMBER 2011
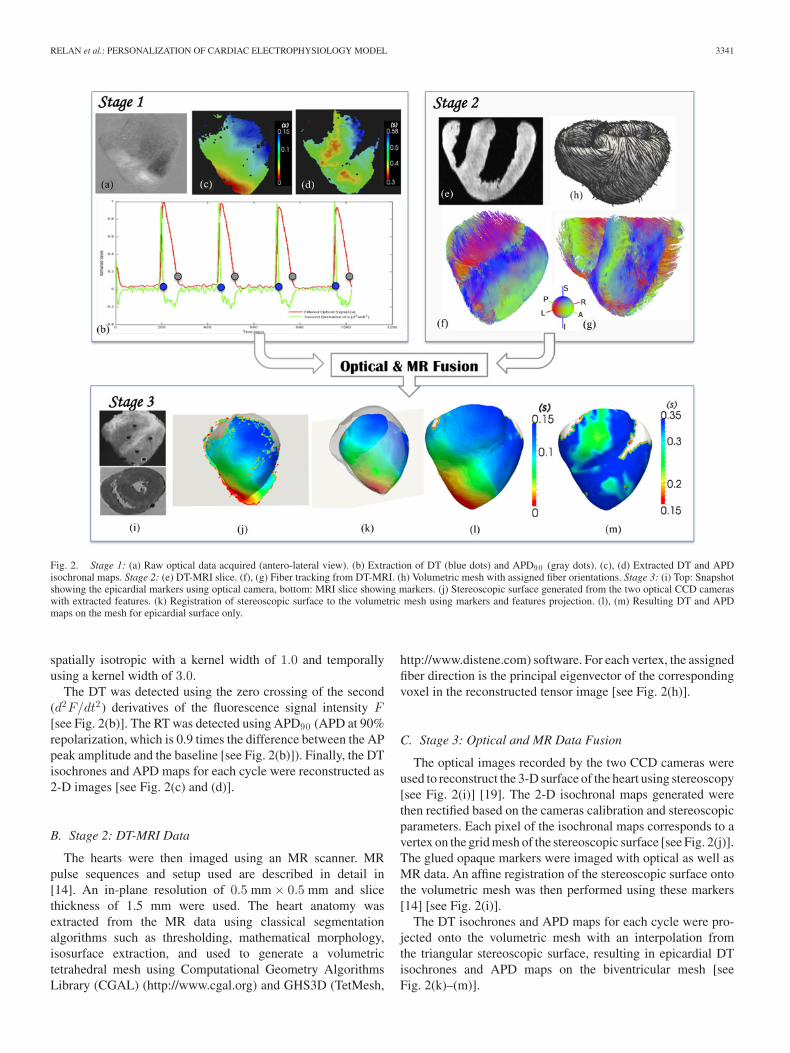
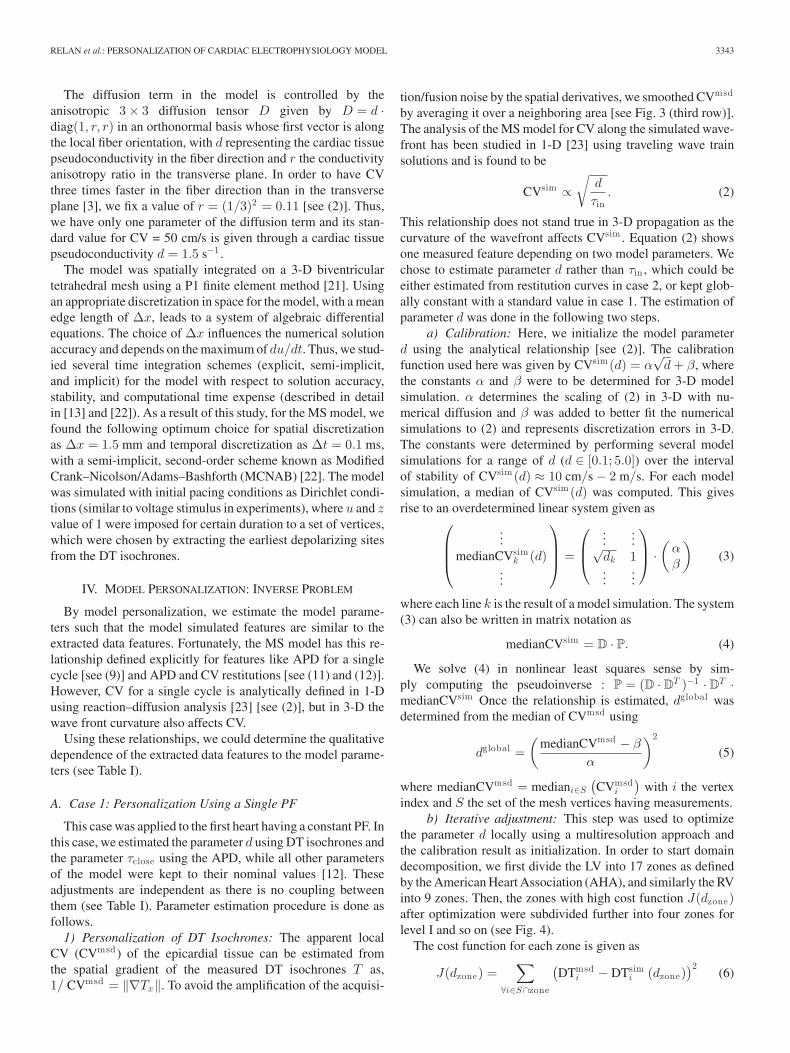
Fig. 3. First four columns are for dataset 1 and the last column is for dataset 2. The first row shows the measured epicardial DT isochrones for various pacinglocations (depicted by arrows), the second row shows the respective APD maps, and the third row shows the local CVm sd computed from the measured DTisochrones (small arrows on the surface show CV direction). Black ellipses highlight the regions having low conductivity.
D. Dataset Used for Personalization
We used two ex vivo hearts, which were optically imaged forsteady-state heart cycles and scanned with DT-MRI. The firstheart was paced to produce four different optical datasets, all ata frequency of 1.1 Hz, but obtained using four different pacinglocations [see Fig. 3(first, second, third, and fourth columns)]that were near the apex of:
1) 1A-LV-Epi-l: left ventricle epicardium (left side);2) 1B-LV-Epi-r: left ventricle epicardium (right side);3) 1C-LV-Endo: left ventricle endocardium;4) 1D-RV-Endo: right ventricle endocardium.The second heart was paced to produce five different optical
datasets, all paced at one location near the apex of the leftventricle epicardium, but for five different pacing frequencies(PFs) [see Fig. 3(fifth column)]: 0.5 Hz (2A), 0.7 Hz (2B), 0.9Hz (2C), 1.1 Hz (2D), 1.2 Hz (2E).
Although these were healthy hearts, we could identify dis-crete areas of low conductivity (see the black ellipse in Fig. 3).This was most likely due to tissue becoming ischemic arounda small branch of blood vessel, partially occluded by an airbubble accidentally trapped into the perfusion line, resulting inoxygen deprivation of the tissue and further installation of acuteischemia and cellular uncoupling. As a result, an altered mor-phology of APs accompanied by a lowering of CV was observedin these areas.
III. MODEL SIMULATION: DIRECT PROBLEM
The MS model [12] is a two-current simplified biophysi-cal model derived from the three-current ionic Fenton–Karmamodel [20]. The MS model is described by the following systemof partial differential equations:
⎧⎪⎪⎪⎨
⎪⎪⎪⎩
∂tu = div(D∇u) + zu2(1 − u)τin
− uτout
+ Jstim (t)
∂tz =
⎧⎨
⎩
(1 − z)τopen
if u < ugate
−zτclose
if u > ugate
(1)
where u is the normalized AP variable, and z is the gating vari-able, which makes the gate open and close, thus depicting the de-polarization and repolarization phases. Jin = (zu2(1 − u))/τinrepresents combination of all inward phenomenological ioniccurrents, primarily Na+ and Ca2+ , which raises the AP volt-age and Jout = −u/τout represents combination of all outwardphenomenological currents, primarily K+ that decreases the APvoltage describing repolarization. Jstim is the stimulation cur-rent at the pacing location.
The parameters of the reaction terms and their standard valuesas reported in [12] are as follows:
1) τopen : opening time constant of the gate = 0.120 s;2) τclose : closing time constant of the gate = 0.150 s;3) τin : time constant for inward currents = 0.003 s;4) τout : time constant for outward currents = 0.06 s.
RELAN et al.: PERSONALIZATION OF CARDIAC ELECTROPHYSIOLOGY MODEL 3343
The diffusion term in the model is controlled by theanisotropic 3 × 3 diffusion tensor D given by D = d ·diag(1, r, r) in an orthonormal basis whose first vector is alongthe local fiber orientation, with d representing the cardiac tissuepseudoconductivity in the fiber direction and r the conductivityanisotropy ratio in the transverse plane. In order to have CVthree times faster in the fiber direction than in the transverseplane [3], we fix a value of r = (1/3)2 = 0.11 [see (2)]. Thus,we have only one parameter of the diffusion term and its stan-dard value for CV = 50 cm/s is given through a cardiac tissuepseudoconductivity d = 1.5 s−1 .
The model was spatially integrated on a 3-D biventriculartetrahedral mesh using a P1 finite element method [21]. Usingan appropriate discretization in space for the model, with a meanedge length of Δx, leads to a system of algebraic differentialequations. The choice of Δx influences the numerical solutionaccuracy and depends on the maximum of du/dt. Thus, we stud-ied several time integration schemes (explicit, semi-implicit,and implicit) for the model with respect to solution accuracy,stability, and computational time expense (described in detailin [13] and [22]). As a result of this study, for the MS model, wefound the following optimum choice for spatial discretizationas Δx = 1.5 mm and temporal discretization as Δt = 0.1 ms,with a semi-implicit, second-order scheme known as ModifiedCrank–Nicolson/Adams–Bashforth (MCNAB) [22]. The modelwas simulated with initial pacing conditions as Dirichlet condi-tions (similar to voltage stimulus in experiments), where u and zvalue of 1 were imposed for certain duration to a set of vertices,which were chosen by extracting the earliest depolarizing sitesfrom the DT isochrones.
IV. MODEL PERSONALIZATION: INVERSE PROBLEM
By model personalization, we estimate the model parame-ters such that the model simulated features are similar to theextracted data features. Fortunately, the MS model has this re-lationship defined explicitly for features like APD for a singlecycle [see (9)] and APD and CV restitutions [see (11) and (12)].However, CV for a single cycle is analytically defined in 1-Dusing reaction–diffusion analysis [23] [see (2)], but in 3-D thewave front curvature also affects CV.
Using these relationships, we could determine the qualitativedependence of the extracted data features to the model parame-ters (see Table I).
A. Case 1: Personalization Using a Single PF
This case was applied to the first heart having a constant PF. Inthis case, we estimated the parameter d using DT isochrones andthe parameter τclose using the APD, while all other parametersof the model were kept to their nominal values [12]. Theseadjustments are independent as there is no coupling betweenthem (see Table I). Parameter estimation procedure is done asfollows.
1) Personalization of DT Isochrones: The apparent localCV (CVmsd ) of the epicardial tissue can be estimated fromthe spatial gradient of the measured DT isochrones T as,1/ CVmsd = ‖∇Tx‖. To avoid the amplification of the acquisi-
tion/fusion noise by the spatial derivatives, we smoothed CVmsd
by averaging it over a neighboring area [see Fig. 3 (third row)].The analysis of the MS model for CV along the simulated wave-front has been studied in 1-D [23] using traveling wave trainsolutions and is found to be
CVsim ∝√
d
τin. (2)
This relationship does not stand true in 3-D propagation as thecurvature of the wavefront affects CVsim . Equation (2) showsone measured feature depending on two model parameters. Wechose to estimate parameter d rather than τin , which could beeither estimated from restitution curves in case 2, or kept glob-ally constant with a standard value in case 1. The estimation ofparameter d was done in the following two steps.
a) Calibration: Here, we initialize the model parameterd using the analytical relationship [see (2)]. The calibrationfunction used here was given by CVsim (d) = α
√d + β, where
the constants α and β were to be determined for 3-D modelsimulation. α determines the scaling of (2) in 3-D with nu-merical diffusion and β was added to better fit the numericalsimulations to (2) and represents discretization errors in 3-D.The constants were determined by performing several modelsimulations for a range of d (d ∈ [0.1; 5.0]) over the intervalof stability of CVsim (d) ≈ 10 cm/s − 2 m/s. For each modelsimulation, a median of CVsim (d) was computed. This givesrise to an overdetermined linear system given as
⎛
⎜⎜⎝
...medianCVsim
k (d)...
⎞
⎟⎟⎠ =
⎛
⎜⎝
......√
dk 1...
...
⎞
⎟⎠ ·
(αβ
)
(3)
where each line k is the result of a model simulation. The system(3) can also be written in matrix notation as
medianCVsim = D · P. (4)
We solve (4) in nonlinear least squares sense by sim-ply computing the pseudoinverse : P = (D · D
T )−1 · DT ·
medianCVsim Once the relationship is estimated, dglobal wasdetermined from the median of CVmsd using
dglobal =(
medianCVmsd − β
α
)2
(5)
where medianCVmsd = mediani∈S
(CVmsd
i
)with i the vertex
index and S the set of the mesh vertices having measurements.b) Iterative adjustment: This step was used to optimize
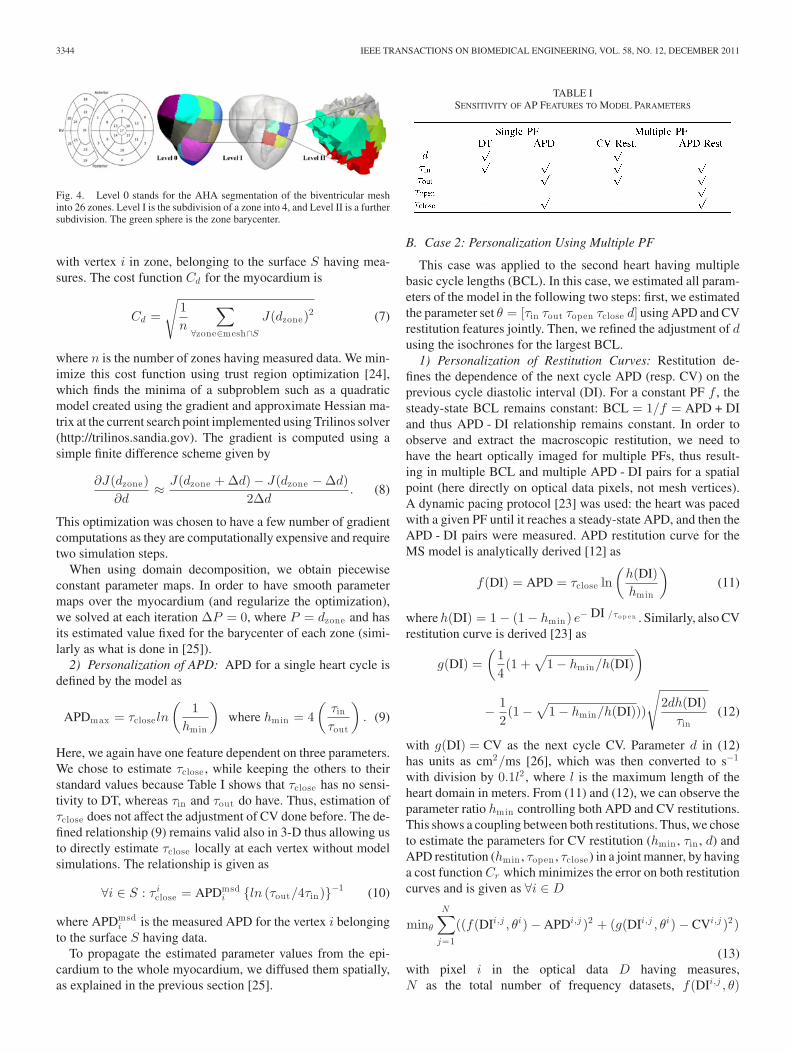
the parameter d locally using a multiresolution approach andthe calibration result as initialization. In order to start domaindecomposition, we first divide the LV into 17 zones as definedby the American Heart Association (AHA), and similarly the RVinto 9 zones. Then, the zones with high cost function J(dzone)after optimization were subdivided further into four zones forlevel I and so on (see Fig. 4).
The cost function for each zone is given as
J(dzone) =∑
∀i∈S∩zone
(DTmsd
i − DTsimi (dzone)
)2(6)
3344 IEEE TRANSACTIONS ON BIOMEDICAL ENGINEERING, VOL. 58, NO. 12, DECEMBER 2011
Fig. 4. Level 0 stands for the AHA segmentation of the biventricular meshinto 26 zones. Level I is the subdivision of a zone into 4, and Level II is a furthersubdivision. The green sphere is the zone barycenter.
with vertex i in zone, belonging to the surface S having mea-sures. The cost function Cd for the myocardium is
Cd =
√1n
∑
∀zone∈mesh∩S
J(dzone)2 (7)
where n is the number of zones having measured data. We min-imize this cost function using trust region optimization [24],which finds the minima of a subproblem such as a quadraticmodel created using the gradient and approximate Hessian ma-trix at the current search point implemented using Trilinos solver(http://trilinos.sandia.gov). The gradient is computed using asimple finite difference scheme given by
∂J(dzone)∂d
≈ J(dzone + Δd) − J(dzone − Δd)2Δd
. (8)
This optimization was chosen to have a few number of gradientcomputations as they are computationally expensive and requiretwo simulation steps.
When using domain decomposition, we obtain piecewiseconstant parameter maps. In order to have smooth parametermaps over the myocardium (and regularize the optimization),we solved at each iteration ΔP = 0, where P = dzone and hasits estimated value fixed for the barycenter of each zone (simi-larly as what is done in [25]).
2) Personalization of APD: APD for a single heart cycle isdefined by the model as
APDmax = τclose ln
(1
hmin
)
where hmin = 4(
τin
τout
)
. (9)
Here, we again have one feature dependent on three parameters.We chose to estimate τclose , while keeping the others to theirstandard values because Table I shows that τclose has no sensi-tivity to DT, whereas τin and τout do have. Thus, estimation ofτclose does not affect the adjustment of CV done before. The de-fined relationship (9) remains valid also in 3-D thus allowing usto directly estimate τclose locally at each vertex without modelsimulations. The relationship is given as
∀i ∈ S : τ iclose = APDmsd
i {ln (τout/4τin )}−1 (10)
where APDmsdi is the measured APD for the vertex i belonging
to the surface S having data.To propagate the estimated parameter values from the epi-
cardium to the whole myocardium, we diffused them spatially,as explained in the previous section [25].
TABLE ISENSITIVITY OF AP FEATURES TO MODEL PARAMETERS
B. Case 2: Personalization Using Multiple PF
This case was applied to the second heart having multiplebasic cycle lengths (BCL). In this case, we estimated all param-eters of the model in the following two steps: first, we estimatedthe parameter set θ = [τin τout τopen τclose d] using APD and CVrestitution features jointly. Then, we refined the adjustment of dusing the isochrones for the largest BCL.
1) Personalization of Restitution Curves: Restitution de-fines the dependence of the next cycle APD (resp. CV) on theprevious cycle diastolic interval (DI). For a constant PF f , thesteady-state BCL remains constant: BCL = 1/f = APD + DIand thus APD - DI relationship remains constant. In order toobserve and extract the macroscopic restitution, we need tohave the heart optically imaged for multiple PFs, thus result-ing in multiple BCL and multiple APD - DI pairs for a spatialpoint (here directly on optical data pixels, not mesh vertices).A dynamic pacing protocol [23] was used: the heart was pacedwith a given PF until it reaches a steady-state APD, and then theAPD - DI pairs were measured. APD restitution curve for theMS model is analytically derived [12] as
f(DI) = APD = τclose ln(
h(DI)hmin
)
(11)
where h(DI) = 1 − (1 − hmin) e− DI /τo p e n . Similarly, also CVrestitution curve is derived [23] as
g(DI) =(
14(1 +
√1 − hmin/h(DI)
)
− 12(1 −
√1 − hmin/h(DI)))
√
2dh(DI)τin
(12)
with g(DI) = CV as the next cycle CV. Parameter d in (12)has units as cm2/ms [26], which was then converted to s−1
with division by 0.1l2 , where l is the maximum length of theheart domain in meters. From (11) and (12), we can observe theparameter ratio hmin controlling both APD and CV restitutions.This shows a coupling between both restitutions. Thus, we choseto estimate the parameters for CV restitution (hmin , τin , d) andAPD restitution (hmin , τopen , τclose) in a joint manner, by havinga cost function Cr which minimizes the error on both restitutioncurves and is given as ∀i ∈ D
minθ
N∑
j=1
((f(DIi,j , θi) − APDi,j )2 + (g(DIi,j , θi) − CVi,j )2)
(13)with pixel i in the optical data D having measures,N as the total number of frequency datasets, f(DIi,j , θ)
RELAN et al.: PERSONALIZATION OF CARDIAC ELECTROPHYSIOLOGY MODEL 3345
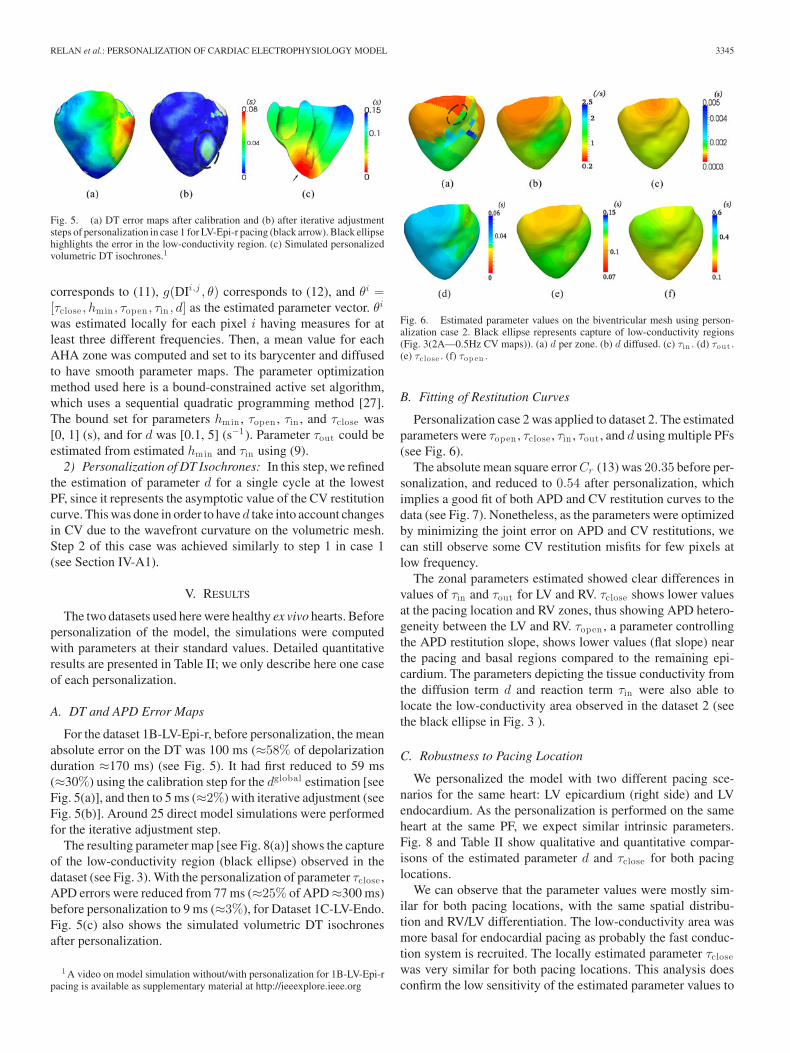
Fig. 5. (a) DT error maps after calibration and (b) after iterative adjustmentsteps of personalization in case 1 for LV-Epi-r pacing (black arrow). Black ellipsehighlights the error in the low-conductivity region. (c) Simulated personalizedvolumetric DT isochrones.1
corresponds to (11), g(DIi,j , θ) corresponds to (12), and θi =[τclose , hmin , τopen , τin , d] as the estimated parameter vector. θi
was estimated locally for each pixel i having measures for atleast three different frequencies. Then, a mean value for eachAHA zone was computed and set to its barycenter and diffusedto have smooth parameter maps. The parameter optimizationmethod used here is a bound-constrained active set algorithm,which uses a sequential quadratic programming method [27].The bound set for parameters hmin , τopen , τin , and τclose was[0, 1] (s), and for d was [0.1, 5] (s−1). Parameter τout could beestimated from estimated hmin and τin using (9).
2) Personalization of DT Isochrones: In this step, we refinedthe estimation of parameter d for a single cycle at the lowestPF, since it represents the asymptotic value of the CV restitutioncurve. This was done in order to have d take into account changesin CV due to the wavefront curvature on the volumetric mesh.Step 2 of this case was achieved similarly to step 1 in case 1(see Section IV-A1).
V. RESULTS
The two datasets used here were healthy ex vivo hearts. Beforepersonalization of the model, the simulations were computedwith parameters at their standard values. Detailed quantitativeresults are presented in Table II; we only describe here one caseof each personalization.
A. DT and APD Error Maps
For the dataset 1B-LV-Epi-r, before personalization, the meanabsolute error on the DT was 100 ms (≈58% of depolarizationduration ≈170 ms) (see Fig. 5). It had first reduced to 59 ms(≈30%) using the calibration step for the dglobal estimation [seeFig. 5(a)], and then to 5 ms (≈2%) with iterative adjustment (seeFig. 5(b)]. Around 25 direct model simulations were performedfor the iterative adjustment step.
The resulting parameter map [see Fig. 8(a)] shows the captureof the low-conductivity region (black ellipse) observed in thedataset (see Fig. 3). With the personalization of parameter τclose ,APD errors were reduced from 77 ms (≈25% of APD ≈300 ms)before personalization to 9 ms (≈3%), for Dataset 1C-LV-Endo.Fig. 5(c) also shows the simulated volumetric DT isochronesafter personalization.
1 A video on model simulation without/with personalization for 1B-LV-Epi-rpacing is available as supplementary material at http://ieeexplore.ieee.org
Fig. 6. Estimated parameter values on the biventricular mesh using person-alization case 2. Black ellipse represents capture of low-conductivity regions(Fig. 3(2A—0.5Hz CV maps)). (a) d per zone. (b) d diffused. (c) τin . (d) τout .(e) τclose . (f) τop en .
B. Fitting of Restitution Curves
Personalization case 2 was applied to dataset 2. The estimatedparameters were τopen , τclose , τin , τout , and d using multiple PFs(see Fig. 6).
The absolute mean square error Cr (13) was 20.35 before per-sonalization, and reduced to 0.54 after personalization, whichimplies a good fit of both APD and CV restitution curves to thedata (see Fig. 7). Nonetheless, as the parameters were optimizedby minimizing the joint error on APD and CV restitutions, wecan still observe some CV restitution misfits for few pixels atlow frequency.
The zonal parameters estimated showed clear differences invalues of τin and τout for LV and RV. τclose shows lower valuesat the pacing location and RV zones, thus showing APD hetero-geneity between the LV and RV. τopen , a parameter controllingthe APD restitution slope, shows lower values (flat slope) nearthe pacing and basal regions compared to the remaining epi-cardium. The parameters depicting the tissue conductivity fromthe diffusion term d and reaction term τin were also able tolocate the low-conductivity area observed in the dataset 2 (seethe black ellipse in Fig. 3 ).
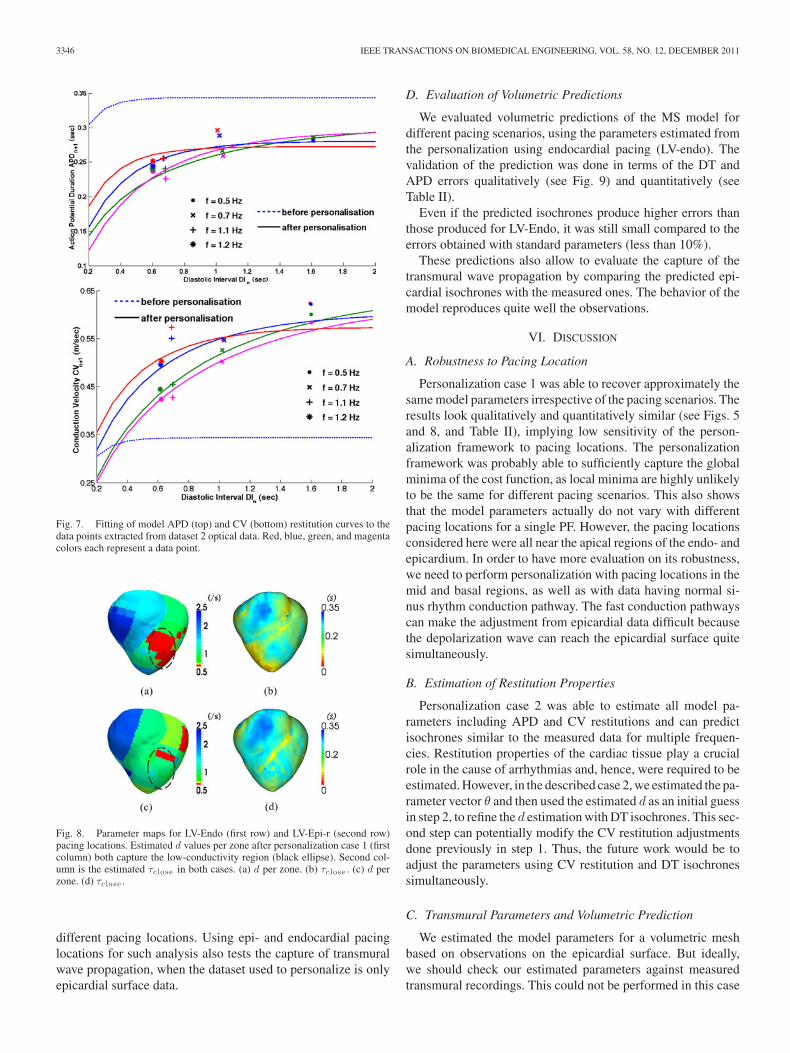
C. Robustness to Pacing Location
We personalized the model with two different pacing sce-narios for the same heart: LV epicardium (right side) and LVendocardium. As the personalization is performed on the sameheart at the same PF, we expect similar intrinsic parameters.Fig. 8 and Table II show qualitative and quantitative compar-isons of the estimated parameter d and τclose for both pacinglocations.
We can observe that the parameter values were mostly sim-ilar for both pacing locations, with the same spatial distribu-tion and RV/LV differentiation. The low-conductivity area wasmore basal for endocardial pacing as probably the fast conduc-tion system is recruited. The locally estimated parameter τclosewas very similar for both pacing locations. This analysis doesconfirm the low sensitivity of the estimated parameter values to
3346 IEEE TRANSACTIONS ON BIOMEDICAL ENGINEERING, VOL. 58, NO. 12, DECEMBER 2011
Fig. 7. Fitting of model APD (top) and CV (bottom) restitution curves to thedata points extracted from dataset 2 optical data. Red, blue, green, and magentacolors each represent a data point.
Fig. 8. Parameter maps for LV-Endo (first row) and LV-Epi-r (second row)pacing locations. Estimated d values per zone after personalization case 1 (firstcolumn) both capture the low-conductivity region (black ellipse). Second col-umn is the estimated τclose in both cases. (a) d per zone. (b) τclose . (c) d perzone. (d) τclose .
different pacing locations. Using epi- and endocardial pacinglocations for such analysis also tests the capture of transmuralwave propagation, when the dataset used to personalize is onlyepicardial surface data.
D. Evaluation of Volumetric Predictions
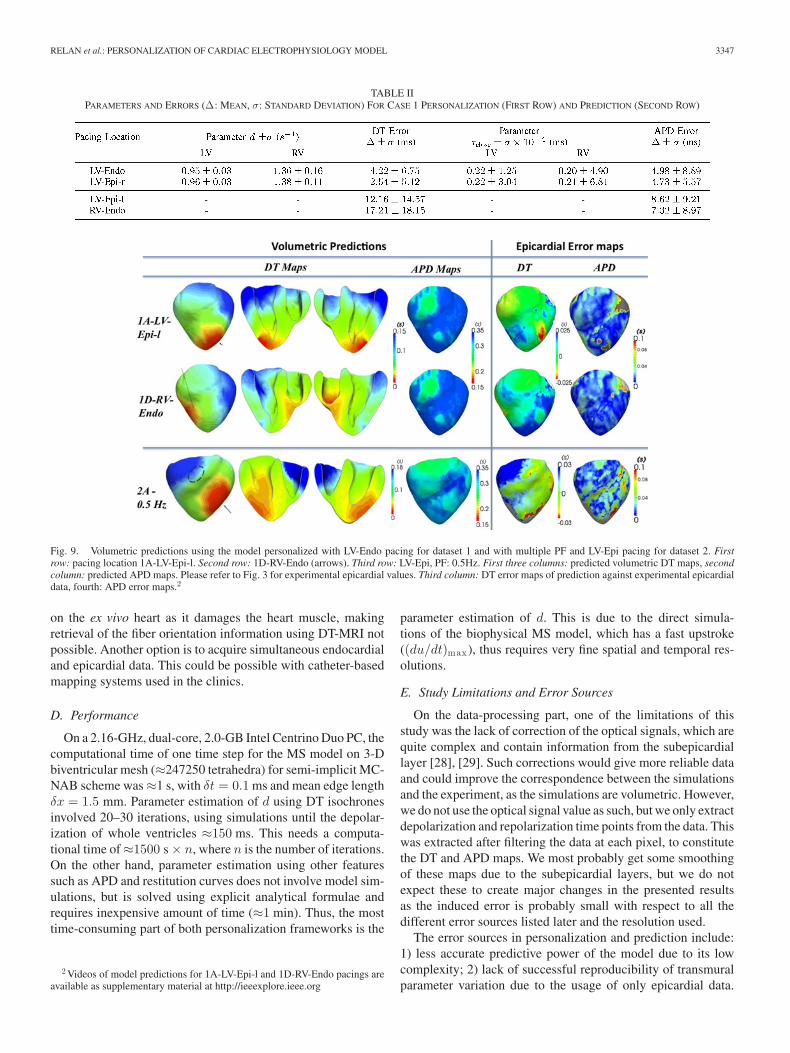
We evaluated volumetric predictions of the MS model fordifferent pacing scenarios, using the parameters estimated fromthe personalization using endocardial pacing (LV-endo). Thevalidation of the prediction was done in terms of the DT andAPD errors qualitatively (see Fig. 9) and quantitatively (seeTable II).
Even if the predicted isochrones produce higher errors thanthose produced for LV-Endo, it was still small compared to theerrors obtained with standard parameters (less than 10%).
These predictions also allow to evaluate the capture of thetransmural wave propagation by comparing the predicted epi-cardial isochrones with the measured ones. The behavior of themodel reproduces quite well the observations.
VI. DISCUSSION
A. Robustness to Pacing Location
Personalization case 1 was able to recover approximately thesame model parameters irrespective of the pacing scenarios. Theresults look qualitatively and quantitatively similar (see Figs. 5and 8, and Table II), implying low sensitivity of the person-alization framework to pacing locations. The personalizationframework was probably able to sufficiently capture the globalminima of the cost function, as local minima are highly unlikelyto be the same for different pacing scenarios. This also showsthat the model parameters actually do not vary with differentpacing locations for a single PF. However, the pacing locationsconsidered here were all near the apical regions of the endo- andepicardium. In order to have more evaluation on its robustness,we need to perform personalization with pacing locations in themid and basal regions, as well as with data having normal si-nus rhythm conduction pathway. The fast conduction pathwayscan make the adjustment from epicardial data difficult becausethe depolarization wave can reach the epicardial surface quitesimultaneously.
B. Estimation of Restitution Properties
Personalization case 2 was able to estimate all model pa-rameters including APD and CV restitutions and can predictisochrones similar to the measured data for multiple frequen-cies. Restitution properties of the cardiac tissue play a crucialrole in the cause of arrhythmias and, hence, were required to beestimated. However, in the described case 2, we estimated the pa-rameter vector θ and then used the estimated d as an initial guessin step 2, to refine the d estimation with DT isochrones. This sec-ond step can potentially modify the CV restitution adjustmentsdone previously in step 1. Thus, the future work would be toadjust the parameters using CV restitution and DT isochronessimultaneously.
C. Transmural Parameters and Volumetric Prediction
We estimated the model parameters for a volumetric meshbased on observations on the epicardial surface. But ideally,we should check our estimated parameters against measuredtransmural recordings. This could not be performed in this case
RELAN et al.: PERSONALIZATION OF CARDIAC ELECTROPHYSIOLOGY MODEL 3347
TABLE IIPARAMETERS AND ERRORS (Δ: MEAN, σ: STANDARD DEVIATION) FOR CASE 1 PERSONALIZATION (FIRST ROW) AND PREDICTION (SECOND ROW)
Fig. 9. Volumetric predictions using the model personalized with LV-Endo pacing for dataset 1 and with multiple PF and LV-Epi pacing for dataset 2. Firstrow: pacing location 1A-LV-Epi-l. Second row: 1D-RV-Endo (arrows). Third row: LV-Epi, PF: 0.5Hz. First three columns: predicted volumetric DT maps, secondcolumn: predicted APD maps. Please refer to Fig. 3 for experimental epicardial values. Third column: DT error maps of prediction against experimental epicardialdata, fourth: APD error maps.2
on the ex vivo heart as it damages the heart muscle, makingretrieval of the fiber orientation information using DT-MRI notpossible. Another option is to acquire simultaneous endocardialand epicardial data. This could be possible with catheter-basedmapping systems used in the clinics.
D. Performance
On a 2.16-GHz, dual-core, 2.0-GB Intel Centrino Duo PC, thecomputational time of one time step for the MS model on 3-Dbiventricular mesh (≈247250 tetrahedra) for semi-implicit MC-NAB scheme was ≈1 s, with δt = 0.1 ms and mean edge lengthδx = 1.5 mm. Parameter estimation of d using DT isochronesinvolved 20–30 iterations, using simulations until the depolar-ization of whole ventricles ≈150 ms. This needs a computa-tional time of ≈1500 s × n, where n is the number of iterations.On the other hand, parameter estimation using other featuressuch as APD and restitution curves does not involve model sim-ulations, but is solved using explicit analytical formulae andrequires inexpensive amount of time (≈1 min). Thus, the mosttime-consuming part of both personalization frameworks is the
2 Videos of model predictions for 1A-LV-Epi-l and 1D-RV-Endo pacings areavailable as supplementary material at http://ieeexplore.ieee.org
parameter estimation of d. This is due to the direct simula-tions of the biophysical MS model, which has a fast upstroke((du/dt)max ), thus requires very fine spatial and temporal res-olutions.
E. Study Limitations and Error Sources
On the data-processing part, one of the limitations of thisstudy was the lack of correction of the optical signals, which arequite complex and contain information from the subepicardiallayer [28], [29]. Such corrections would give more reliable dataand could improve the correspondence between the simulationsand the experiment, as the simulations are volumetric. However,we do not use the optical signal value as such, but we only extractdepolarization and repolarization time points from the data. Thiswas extracted after filtering the data at each pixel, to constitutethe DT and APD maps. We most probably get some smoothingof these maps due to the subepicardial layers, but we do notexpect these to create major changes in the presented resultsas the induced error is probably small with respect to all thedifferent error sources listed later and the resolution used.
The error sources in personalization and prediction include:1) less accurate predictive power of the model due to its lowcomplexity; 2) lack of successful reproducibility of transmuralparameter variation due to the usage of only epicardial data.
3348 IEEE TRANSACTIONS ON BIOMEDICAL ENGINEERING, VOL. 58, NO. 12, DECEMBER 2011
We hypothesize that these juvenile pigs do not have transmu-ral variations; 3) insufficiency in modeling the actual Purkinjesystem, and its potential retrograde activation. However, therewas no evidence from the presented data; and 4) insufficiencyof domain decomposition to reproduce accurately the spatialvariation of the parameters.
F. Application to Pathological Cases and Clinical Data
This study can be applied to clinical data by replacing the sur-face optical data with surface epi- or endocardial electroanatom-ical mapping of the patient. Most of the challenge lies in the re-liable extraction of features such as DT and RT from sparse andnoisy patient data consisting of extracellular potentials. Alsothe in vivo acquisition of fiber orientations is challenging due tothe heart motion. Nevertheless, the personalization frameworkcan be performed using the rule-based fiber orientation, and stillprovides promising results [30]. Personalization case 1 wouldprove to be more efficient for predictions at a constant PF asit is the case in cardiac resynchronization therapy. On the con-trary, case 2 would be more preferred for arrhythmias as it canreveal more features such as APD and CV restitution proper-ties for healthy, scars, and gray zones. Also, an evaluation onthe level of complexity required for simulating arrhythmias inpathological cases is needed. However, additional complexityhas a strong impact on the tractability [31] and on the parametersidentifiability [32].
VII. CONCLUSION
We presented a novel method for estimating volumetric modelparameters from surface data with single and multiple PFs. Weextracted features such as CV, APD, CV, and APD restitutionsmacroscopically from the measured cardiac data and used themto personalize the model. We estimated all the model parametersmaking the model heart-specific. We evaluated the sensitivityof the personalization to different epi- and endocardial pacingscenarios and the results show a robust behavior of the frame-work to pacing location. Then, we also tested the volumetricprediction ability of the model for different pacing scenariosand showed promising results.
REFERENCES
[1] A. Hodgkin and A. Huxley, “A quantitative description of membranecurrent and its application to conduction and excitation in nerve,” J.Physiol., vol. 117, no. 4, pp. 500–504, 1952.
[2] D. Noble, A. Varghese, P. Kohl, and P. Noble, “Improved guinea-pigventricular cell model incorporating a diadic space, IKr and IKs, andlength-and tension-dependent processes,” Can. J. Cardiol., vol. 14, no. 1,pp. 123–134, 1998.
[3] J. Keener, J. Keener, and J. Sneyd, Mathematical Physiology: CellularPhysiology. New York: Springer-Verlag, 2009.
[4] K. Ten Tusscher, D. Noble, P. Noble, and A. Panfilov, “A model for humanventricular tissue,” Amer. J. Physiol.—Heart Circulat. Physiol., vol. 286,no. 4, pp. H1573–H1589, 2004.
[5] G. Beeler and H. Reuter, “Reconstruction of the action potential of ven-tricular myocardial fibres,” J. Physiol., vol. 268, no. 1, pp. 177–210,1977.
[6] C. Luo and Y. Rudy, “A model of the ventricular cardiac action poten-tial. depolarization, repolarization, and their interaction,” Circulat. Res.,vol. 68, no. 6, pp. 1501–1526, 1991.
[7] P. ColliFranzone, L. Guerri, M. Pennacchio, and B. Taccardi, “Spreadof excitation in 3-D models of the anisotropic cardiac tissue. II. Effects
of fiber architecture and ventricular geometry,” Math. Biosci., vol. 147,no. 2, pp. 131–172, 1998.
[8] M. Sermesant, E. Konukoglu, H. Delingette, Y. Coudiere, P. Chinchapat-nam, K. Rhode, R. Razavi, and N. Ayache, “An anisotropic multi-frontfast marching method for real-time simulation of cardiac electrophys-iology,” in Lecture Notes in Computer Science, vol. 4466, New York:Springer-Verlag, 2007, pp. 160–169.
[9] R. Fitzhugh, “Impulses and physiological states in theoretical models ofnerve membrane,” Biophys. J., vol. 1, no. 6, pp. 445–466, 1961.
[10] R. R. Aliev and A. V. Panfilov, “A simple two-variable model of cardiacexcitation,” Chaos, Solitons Fractals, vol. 7, no. 3, pp. 293–301, 1996.
[11] O. Bernus, R. Wilders, C. Zemlin, H. Verschelde, and A. Panfilov, “Acomputationally efficient electrophysiological model of human ventricu-lar cells,” Amer. J. Physiol.—Heart Circulat. Physiol., vol. 282, no. 6,pp. H2296–H2308, 2002.
[12] C. Mitchell and D. Schaeffer, “A two-current model for the dynamics ofcardiac membrane,” Bull. Math. Biol., vol. 65, no. 5, pp. 767–793, 2003.
[13] J. Relan, M. Sermesant, H. Delingette, M. Pop, G. Wright, and N. Ayache,“Quantitative comparison of two cardiac electrophysiology models usingpersonalisation to optical and MR data,” in Proc. 6th IEEE Int. Symp.Biomed. Imag., 2009, pp. 1027–1030.
[14] M. Pop, M. Sermesant, D. Lepiller, M. Truong, E. McVeigh, E. Crystal,A. Dick, H. Delingette, N. Ayache, and G. Wright, “Fusion of opticalimaging and MRI for the evaluation and adjustment of macroscopic mod-els of cardiac electrophysiology: A feasibility study,” Med. Image Anal.,vol. 13, no. 2, pp. 370–380, 2009.
[15] V. Moreau-Villeger, H. Delingette, M. Sermesant, H. Ashikaga,E. McVeigh, and N. Ayache, “Building maps of local apparent conductiv-ity of the epicardium with a 2-D electrophysiological model of the heart,”IEEE Trans. Biomed. Eng., vol. 53, no. 8, pp. 1457–1466, Aug. 2006.
[16] P. Chinchapatnam, K. Rhode, M. Ginks, C. Rinaldi, P. Lambiase,R. Razavi, S. Arridge, and M. Sermesant, “Model-based imaging of car-diac apparent conductivity and local conduction velocity for diagnosis andplanning of therapy,” IEEE Trans. Med. Imag., vol. 27, no. 11, pp. 1631–1642, Nov. 2008.
[17] D. Lepiller, M. Sermesant, M. Pop, H. Delingette, G. Wright, andN. Ayache, “Cardiac electrophysiology model adjustment using the fu-sion of MR and optical imaging,” in Lecture Notes in Computer Science,vol. 5241, New York: Springer-Verlag, 2008, pp. 678–685.
[18] I. Efimov, V. Nikolski, and G. Salama, “Optical imaging of the heart,”Circulat. Res., vol. 95, no. 1, pp. 21–33, 2004.
[19] D. Chung, M. Pop, M. Sermesant, and G. Wright, “Stereo reconstructionof the epicardium for optical fluorescence imaging,” in Proc. Med. ImageComput. Comput.-Assisted Intervention (MICCAI) Workshop on Biopho-tonics for diagnosis and treatment, IMM-Tech. Rep., 2006, pp. 33–40.
[20] F. Fenton and A. Karma, “Vortex dynamics in three-dimensional continu-ous myocardium with fiber rotation: Filament instability and fibrillation,”Chaos, vol. 8, no. 1, pp. 20–47, 1998.
[21] M. Sermesant, H. Delingette, and N. Ayache, “An electromechanicalmodel of the heart for image analysis and simulation,” IEEE Trans.Med. Imag., vol. 25, no. 5, pp. 612–625, May 2006.
[22] M. Ethier and Y. Bourgault, “Semi-implicit time-discretization schemesfor the bidomain model,” SIAM J. Numer. Anal., vol. 46, pp. 2443–2468,2008.
[23] J. Cain, E. Tolkacheva, D. Schaeffer, and D. Gauthier, “Rate-dependentpropagation of cardiac action potentials in a one-dimensional fiber,” Phys.Rev. E, vol. 70, no. 6, pp. 061 906-1–061 906-7, 2004.
[24] A. Conn, N. Gould, and P. Toint, Trust-Region Methods. Book series isMPS-SIAM Series on Optimization, Philadelphia, PA: SIAM, 2000.
[25] R. Keldermann, K. Ten Tusscher, M. Nash, R. Hren, P. Taggart, andA. Panfilov, “Effect of heterogeneous apd restitution on vf organizationin a model of the human ventricles,” Amer. J. Physiol.—Heart Circulat.Physiol., vol. 294, no. 2, pp. H764–H774, 2008.
[26] J. Cain, “A kinematic model of wave propagation,” Int. J. Pure Appl.Math., vol. 49, pp. 599–605, 2008.
[27] R. Fletcher and M. Powell, “A rapidly convergent descent method forminimization,” Comput. J., vol. 6, no. 2, pp. 163–168, 1963.
[28] C. Hyatt, S. Mironov, F. Vetter, C. Zemlin, and A. Pertsov, “Optical actionpotential upstroke morphology reveals near-surface transmural propaga-tion direction,” Circulat. Res., vol. 97, no. 3, pp. 277–284, 2005.
[29] M. Bishop, B. Rodriguez, J. Eason, J. Whiteley, N. Trayanova, andD. Gavaghan, “Synthesis of voltage-sensitive optical signals: Applicationto panoramic optical mapping,” Biophys. J., vol. 90, no. 8, pp. 2938–2945,2006.
[30] J. Relan, P. Chinchapatnam, M. Sermesant, K. Rhode, H. Delingette, R.Razavi, and N. Ayache, “Coupled personalisation of electrophysiology
RELAN et al.: PERSONALIZATION OF CARDIAC ELECTROPHYSIOLOGY MODEL 3349
models for simulation of induced ischemic ventricular tachycardia,” inProc. Medical Image Comput. Comput.-Assisted Intervention (MICCAI2010), LNCS 6362,, pp. 420–428.
[31] A. Garny, D. Noble, and P. Kohl, “Dimensionality in cardiac modelling,”Progr. Biophys. Mol. Biol., vol. 87, no. 1, pp. 47–66, 2005.
[32] M. Fink and D. Noble, “Markov models for ion channels: versatility versusidentifiability and speed,” Philosoph. Trans. R. Soc. A: Math., Phys. Eng.Sci., vol. 367, no. 1896, pp. 2161–2179, 2009.
Jatin Relan received the M.Sc. degree in biomed-ical engineering from Fachhochschule Lubeck andUniversitat zu Lubeck, Lubeck, Germany, in 2008.He is currently working toward the Ph.D. degree incomputer science at Ecole de Mines ParisTech, Paris,France, and is working with the Asclepios ResearchTeam at the National Institute for Research in Com-puter Science and Control (INRIA) Research Centerin Sophia Antipolis, France. His Ph.D. work is on theplanning of cardiac radio-frequency ablation therapyfor ventricular tachycardia and is a part of an Euro-
pean project euHeart: Personalized and Integrated Cardiac Care using patient-specific cardiovascular modeling.
His research interests include biomedical image processing, computationalcardiac modeling, and building patient-specific cardiac electrophysiology mod-els from clinical data analysis for diagnosis and pathology simulation such ascardiac arrhythmias for therapy planning.
Mihaela Pop received the M.Sc. degree from theDepartment of Medical Biophysics, University ofToronto, Toronto, ON, Canada, worked on charac-terization of dielectric properties of kidney tissue atRF ablation frequencies during heating, as well as onbuilding computer models for treatment planning, in2003. She received the Ph.D. degree from the depart-ment of Medical Biophysics, University of Toronto,worked on the construction of 3-D MR image-basedcomputer models of electrophysiology, which inte-grated experimental measures from optical fluores-
cence imaging and electroanatomical CARTO voltage maps, in 2010.She is currently a Postdoctoral Fellow at Sunnybrook Research Centre,
Toronto, ON, Canada, working on the development of biophysical models andpreclinical experimental models, as well as on the integration of image-guidedablative therapies into clinical platforms, with an aim to understand and predictthe inducibility of arrhythmias in patients with prior myocardial infarction.
Herve Delingette received the Master and Ph.D. de-grees from the Ecole Centrale des Arts et Manufac-tures de Paris, Chatenay-Malabry, France, in 1989and 1994, respectively, and was habilitated in 2006.
He is currently the Research Director in the Ascle-pios Research Team at the National Institute for Re-search in Computer Science and Control (INRIA) Re-search Center, Sophia Antipolis, France. From 1989to 1992, he was a Visiting Scientist at the RoboticsInstitute of Carnegie Mellon University (CMU) andthe Human Interface Laboratory of Nippon Telegraph
and Telephone (NTT). His research interests are in the fields of medical imageanalysis, image segmentation, soft tissue modeling, surgery simulation, andcomputational models of the human body. He is the author of more than 60journal papers in those fields.
Dr. Delingette is the Co-Chair of the First Symposium on Surgery Simulationand Soft Tissue Modeling in 2003 and the Fifth International Conference onFunctional Imaging and Modeling of the Heart in 2009.
Graham A. Wright received the BASc and MAScdegrees in systems design engineering from the Uni-versity of Waterloo, ON, Canada, and the Ph.D. de-gree in electrical engineering from Stanford Univer-sity, Palo Alto, CA, in 1991.
He is currently the Director of the Schulich HeartResearch Program at Sunnybrook Health SciencesCentre, a Senior Scientist at Sunnybrook ResearchInstitute, and a Professor in the Department of Med-ical Biophysics, University of Toronto, Toronto, ON,Canada. In May 2010, he was appointed the Canada
Research Chair in Imaging for Cardiovascular Therapeutics. His research inter-ests include the development and application of magnetic resonance imagingfor assessment of cardiovascular pathophysiology and guidance of associatedtherapies.
Nicholas Ayache received the Ph.D degree and the“These d’Etat” from the University of Paris XI (Com-puter Science), Paris, France, in 1983 and 1988, re-spectively, introducing new recognition and stereovi-sion capabilities for autonomous robots.
He is currently the Research Director at the Na-tional Institute for Research in Computer Science andControl (INRIA), Sophia Antipolis, France, where heleads the Asclepios Research Team. Since 1988, hisresearch activities have been dedicated to computa-tional medical image analysis and simulation applied
to medicine to better assist diagnosis and therapy. His research interests includethe design of novel geometrical, statistical, physical and functional models forimage analysis, surgery simulation and image-guided therapy. He is the authorof more than 350 peer-reviewed scientific articles in these domains, the author,or editor of eight books, and the co-founder of four startup companies in com-puter vision, computer graphics, medical and biological imaging.
Dr. Ayache received prestigious awards, including the EADS Grand Prizeawarded by the French Academy of Sciences in 2006, and the Microsoft Awardfor Science in Europe, awarded jointly by the U.K. Royal Society and the FrenchAcademy of Sciences in 2008. He is the Co-Editor-in-Chief (and Co-Founder)of the Medical Image Analysis journal (Elsevier), and an Associate Editor ofseveral scientific journals including IEEE TRANSACTIONS ON MEDICAL IMAG-ING. He has been involved in the organization of several major and pioneeringconferences in the field including Medical Image Computing and Computer As-sisted Intervention (MICCAI). He was an Invited Scientist at MIT and Harvard(Boston) for a semester in 2007.
Maxime Sermesant received the Diploma degreein general engineering from Ecole Centrale Paris,Paris, France, in 1999, the M.Sc. degree from EcoleNormale Superieure de Cachan, Cachan, France, in1999, and the Ph.D. degree in control, signal, andimage processing from the University of Nice SophiaAntipolis, Nice, France, in 2003.
From June 2003 to December 2005, he was a Re-search Fellow with the Cardiac MR Research Group,Guys Hospital, Kings College London, London, U.K.Since 2005, he has been a Research Scientist at the
National Institute for Research in Computer Science and Control (INRIA) in theAsclepios Team and a Part-Time Lecturer at King’s College London, Division ofImaging Sciences, St Thomas’ Hospital. His research interests include biomed-ical image processing and organ modeling. The integration of these two areasopen up possibilities in clinical data analysis for diagnosis, and in pathologysimulation for therapy planning. His main focus in the recent years has been theapplication of patient-specific models of the heart to cardiac pathologies.
Related Documents