Report based on advertisement analysis Council for Technical Education and Vocational Training Research and Information Division Sanothimi, Bhaktapur July, 2014 Dynamics and Dimensions of Labour Migration from Nepal Final Draft

Welcome message from author
This document is posted to help you gain knowledge. Please leave a comment to let me know what you think about it! Share it to your friends and learn new things together.
Transcript

Report based on advertisement analysis
Council for Technical Education and Vocational Training
Research and Information Division Sanothimi, Bhaktapur
July, 2014
Dynamics and Dimensions of
Labour Migration from Nepal
Final
Draft

CTEVT, Research and Information Division
Dynamics and Dimensions of Labour Migration from Nepal
Dynamics and Dimensions
of
Labour Migration from Nepal (A report based on advertisement analysis)
Technical Contribution Samgam Gautam
Nagendra Yadav
Amitananda Neupane
Data Entry Team Ishwor Rimal
Bandita Rajbhandari
Sunil Sigdel
Kalawati Bhatta
Filed Visit Team Manoj Sharma Neupane
Prem Kumar Gurung
Data Analysis and Report Writing Manoj Sharma Neupane
Adviser Saurav Ram Joshi
Council for Technical Education and Vocational Training
Research and Information Division Sanothimi, Bhaktapur
2014

CTEVT, Research and Information Division
Dynamics and Dimensions of Labour Migration from Nepal
ACKNOWLEDGEMENTS
This is immense pleasure for CTEVT, Research and Information Division that it has completed
the third successive edition of this advertisement analysis report. This edition has attempted to
incorporate more information regarding the employment opportunities for Nepalese technical
human resources in global labour market as well as adopt more statistical and scientific analytical
techniques than used in earlier editions.
This volume of report is the outcome of synergic efforts of many individuals inside and outside
the CTEVT system. It is beyond the imagination if those individuals didn't provide their valuable
time and painstaking efforts to bring the report in this shape. I therefore take this opportunity to
offer sincere thanks to all of those individuals and organizations who have direct or indirect
contribution in this report. At first, I would like to offer my heartily thanks to the management of
CTEVT, Dr. Ramhari Lamichhane, Member Secretary, Mr. Ramesh Kumar Bhakhati, Director,
Administration Division and Mr. Yam Prasad Bhurtel, Account Controller for providing conducive
environment for carrying out this study.
I feel great privileged to offer my heartfelt thanks to Mr. Saurav Ram Joshi, Director Research and
Information Division for providing continuous inspiration, professional guidance, and critical
feedbacks form drafting to finalizing the report. His feedbacks and guidance helped to enhance the
quality of the report as well as widened my understanding in the subject matter.It will be injustice
if I forgot the contributions of other fellow staffs of CTEVT, Mr. Prem Kumar Gurung, Mr. Ishwor
Rimal, Mr. Sunil Sigdel, Mrs. Bandita Rajbhandari, and Mrs. Kalawati Bhatta for their
contribution through out the process of data collection, data entry as well asin other technical
works.
I would also like to remember the sincere cooperation of Training Institute for Technical
Instruction (TITI) for providing the collection of news papers and also to those foreign
employment professionals who provided valuable information during the personal interview.
Finally I would also like to offer my sincere thanks to those organizations and individuals who
directly or indirectly provided valuable information to make this report more informative and
enhance its quality.
Manoj Sharma Neupane
Deputy-Director
Research and Information Division

CTEVT, Research and Information Division
Dynamics and Dimensions of Labour Migration from Nepal
EXECUTIVE SUMMARY
Remittance is becoming the backbone of Nepalese economy since recent past, however the
conditions of Nepalese migrant workers is extremely vulnerable and per worker income is also
significantly low. The undesirable situation faced by migrant workers can partly be attributed to
their low level of skills or efficiency. This study is therefore aims to analyze the role of skills
training among the migrant workers despite the limited information available to the research team.
The major source of information for this analysis is the published advertisements regarding the
foreign employment in some major National News Papers.
The objectives of the study are to identify the mostly demanded skills in foreign employment and
speculate the tentative numbers of demand of such skilled workers; spell out the gap between
demand and supply of Nepalese workforce in global labour market in terms of both the type of
skill and number of workforces; and suggest the measures for improvement in the existing training
programs to bridge this gap.
Almost thirty three hundred advertisement cases were entered and analyzed by means of statistical
program named SPSS. These advertisement cases were collected from Kantipur National Daily
and Nagarik Daily published between Shrawan to Paush, 2070. Besides the quantitative demand
side information of these advertisement cases, some qualitative information regarding the supply
side issue were also collected from personnel interview with foreign employment professionals
with the help of semi-structured questionnaires.
Altogether 95,144 workforce were demanded from 3,295 advertisement cases. Among these
demanded posts, 95% demand were obtained from five major countries like UAE, Qatar, Malaysia,
Saudi-Arabia and Kuwait, where the demand obtained from UAE is 29.33%,followed by Qatar
(28.02%), Malaysia (20.27%) and so on. While categorizing the demand in terms of level of skills,
skilled category occupies greatest share of demand with 36.86%share followed by Semi-skilled
35.19%, Unskilled (26.37) and Professional (1.58%).
There is significant variation in the expected salary among the migrant workers. A skilled worker
can expect monthly salary higher by 41% than the expectation of unskilled worker and
corresponding expectation of professional workers is 188% higher.Although level of skill is the
major source for income variation among the migrant workers, this is not a single source that can
be responsible for such variation. Type of skill, economic and social status of destination countries,
and educational qualification of migrant workers are the other factors that are also responsible for
income variation.
There is not any significant relationship between expected salary and cost of migration, however
the average cost of migration of unskilled workers is found significantly higher than that of skilled
and professional workers.

CTEVT, Research and Information Division
Dynamics and Dimensions of Labour Migration from Nepal
Rapid change in skill composition can be observed among Nepalese migrant workers in recent
years. The proportion of unskilled workers is decreased by 18 percentage point during 2004 to
2014, where as corresponding figures of skilled and professional workers are increased by 17 and
1 percentage point with in the same period of time.
Nepalese foreign employment professionals have received increasing demand of skilled workers
in recent years. This is also creating pressure to increase the supply of workers accordingly,
however the capacity of training institutes in Nepal is not in the position to satisfy the received
demand.
There seems mismatch between demand and supply of skilled workforce in foreign employment
sectors. Scarcity of skilled workforce is still the problem in some trades however some trades are
found already saturated in terms of numbers of graduates. Type and number of training should
therefore always be the matter of revision in every couple of years.
Safer migration is the function of education and training which includes both hard skills and soft
skills. Both of these skills should be provided as in package. The orientation training provided by
Foreign Employment Promotion Board should be linked up with the skills training provided by
various training institutes.
The skilled workers not only expect to earn higher income from foreign employment but also
expect to migrate in low cost and enjoy secured jobs, however unskilled workers are hardly found
motivated to take training before flying to abroad. Those people should be made aware as a mission
about such benefit of training.
Despite the major role of skills in safer migration, neither the Foreign Employment Act 2064 has
incorporate strict provisions regarding necessity of skill certificate for skilled jobs, nor majority of
foreign employment professionals are found honest to follow the sentiments of the act regarding
this issue. Reform in Foreign Employment Act 2064 and the corresponding rules is therefore
essential to guarantee the "Skill Certificate for Skill Job" and should be implemented according.
Last but not least, skills training always augments the potentials and enhances productivity thus
widens the economic horizons of not only individuals but nation in totality. But majority of
graduates of presently available training programs neither get the employment opportunities in the
country nor satisfy the needs of abroad demand. Reason is simple, the aspect of training quality
and needs of labour market are not getting due emphasis in every phase from designing to
implementation.

CTEVT, Research and Information Division
Dynamics and Dimensions of Labour Migration from Nepal
TABLE OF CONTENTS
Page No.
Acknowledgement i
Executive Summary ii
Table of Contents iii
List of Tables and Charts iv
Acronyms and Abbreviation v
CHAPTER TITLE 1
ONE INTRODUCTION 1
1.1 Background 1
1.2 Significance of the Study 2
1.3 Objectives of the Study 2
1.4 Methodology 2
1.5 Limitations and Assumptions 2
1.5 Organization of the Study 2
TWO CURRENT LABOUR MARKET SCENARIO 4-12
2.1 Background 4
2.2 Composition and Distribution of Labour Force 4
2.3 Labour Migration Situation from Nepal 5
2.4 Dynamics of labour Market Situation 6
2.5 Overview of Labour and Employment Policy in Nepal 8
2.5.1 National Labour Policy 2056 8
2.5.2 Labour and Employment Policy 2062 9
1.5.3 Policy on Foreign Employment 11
2.5.3.1 Safeguarding the Workers Right 11
2.5.3.2 Lowering the Transaction Cost 12
THREE ADVERTISEMENT ANALYSIS 13-25
3.1 General Profile of the Data 13
3.2 Advertisement by Months 13
3.3 Country wise Demand Distribution 13
3.4 Demand by Occupational Category 14
3.5 Demand by Skill Category 15
3.6 Variation in Salary Level 16
3.7 Sources of Variation in Salary 17

CTEVT, Research and Information Division
Dynamics and Dimensions of Labour Migration from Nepal
3.7.1 Salary by Destination Country 17
3.7.2 Salary by the Skill Category 18
3.7.3 Distribution by Educational Qualification 20
3.8 Tentative Expenditure 20
3.9 Variation of Migration Cost by Level of Skill 21
3.10 Provisions of Extra Facilities 22
3.11 Composition of Human Resources 23
3.11.1 Transformation on Demand Situation 23
3.11.2 Transformation of Supply Situation 24
3.12 Undersupplied and Saturated Sectors 25
FOUR CONCLUSION AND FINDINGS 27-28
4.1 Major Findings 27
4.2 Conclusions 28
4.3 Recommendations 28
REFERENCES 30
ANNEX ONE LIST OF TYPES AND NUMBERS OF DEMANDED JOBS
ANNEX TWO SALARY BY NATURE OF JOBS
ANNEX THREE QUESTIONNAIRE FOR QUALITATIVE DATA COLLECTION

CTEVT, Research and Information Division
Dynamics and Dimensions of Labour Migration from Nepal
LIST OF TABLES AND CHARTS
Chart 2.1 Employment by Consumption Quintile
Table 2.1 Trends of Migrants and Inflow of Remittance
Table 2.2 Trend Analysis of Employment Status
Table 3.1 Distribution of Advertisements by Months
Table 3.2 Advertisement by Country
Table 3.3 Demand by Skill Category
Table 3.4 Descriptive Statistics on Offered Salary
Chart 3.1 Distribution by Salary Range
Table 3.5 Distribution of Salary by Destination Country
Table 3.6 Distribution of Salary by Skilled Category
Table 3.7 Salary by Countries and Skilled Category Cross Tabulation
Table 3.8 Migration Cost by Country
Table 3.9 Migration Cost by Level of Skills
Table 3.10 'A' Category of Skills vs Food Facilities Cross Tabulation
Table 3.10 'B' Chi-square Test
Chart 3.2 Country Wise Demand Composition
Chart 3.3 Transformation of Demand Structure
Chart 3.4 Transformation of Supply Structure
Table 3.11 'A' List of Undersupplied Jobs
Table 3.11 'B' List of Saturated Jobs

CTEVT, Research and Information Division
Dynamics and Dimensions of Labour Migration from Nepal
ACRONYMS AND ABBREVIATION
ANOVA Analysis of Variance
CBS Central Bureau of Statistics
CTEVT Council for Technical Education and vocational Training
EPZ Export Promotion Zone
EVENT Enhanced Vocational and Technical Training
FDI Foreign Direct Investment
GDP Gross Domestic Product
HR Human Resource
I/NGO International / Non-Governmental Organization
MoF Ministry of Finance
MoLTM Ministry of Labour and Transportation Management
NLSS Nepal Living Standard Survey
NPC Nepal Planning Commission
SPSS Statistical Program for Social Science
Std. Standard
TVET Technical and Vocational Education and Training
UAE United Arab Emirates
WTO World Trade Organization

CTEVT, Research and Information Division 1
Dynamics and Dimensions of Labour Migration from Nepal
CHAPTER ONE
INTRODUCTION
1.1 Background
Presently, remittance is becoming the backbone of Nepalese economy and it is widely believed
that 22% of GDP is contributed by remittance resulting from the involvement of almost 2 million
of Nepalese youths in foreign employment. Although, out-migration of human resources itself is
not an encouraging sign for any economy, the further disappointing fact is that only negligible
numbers of migrants from Nepal are involved in skilled-job. It is widely believed that alarming
number of migrant workers from Nepal are unskilled (69.1 percent) while corresponding figures
of semiskilled, skilled, and highly skilled are only 27.1%, 3.4% and 0.4% respectively (Gurung,
2007). On the one hand, it has been reported that foreign employment professionals are facing
scarcity of skilled workers to supply for foreign employment. On the other hand, negligible
numbers of migrant workers from Nepal are only found in skilled jobs.
Presently, substantial numbers of training institutions under both governmental and private sectors
provides vocational training programs related to different trades and sectors. In contrast, the
graduates of these training are not getting satisfactory job as per the skills and their competency.
Serious mismatch was found between the skill taught during training and the actual need of job
market. This type of skill-work mismatch is found further serious in foreign labour market than
domestic own. Identifying such mismatch is the basic requirement to prepare demand based
skilled human resources.
1.3 Objectives of the study
The broader objective of this study was to explore the present status of demand and supply of
Nepalese workforces in foreign employment and provide way outs for concerned agencies to
deliver demand based TVET programs in the country. The specific objectives of this study were
to:
Identify the mostly demanded skills for foreign employment and speculate the tentative
numbers of demand of such skilled workers;
Spell out the gap between demand and supply of Nepalese workforce in global labour
market in terms of both the type of skill and number of workforces;
Suggest the measures for improvement in the existing training programs to bridge this gap.
1.2 Significance of the Study
As per the Foreign Employment Act 2064, manpower companies have to publish a notice with
adequate information about the nature of the job and cost of migration before sending such workers
to employment. These advertisements give great deal of information about foreign employment
including the qualification of workers, working conditions, proposed incentives to workers and
tentative cost of migration. On the one hand, these information are vital to analyze the demand

CTEVT, Research and Information Division 2
Dynamics and Dimensions of Labour Migration from Nepal
side aspect of foreign employment. On the other hand, the cost and duration of study can also be
significantly reduced by adopting this approach. Moreover, a longitudinal study is also possible
by these information.
Although, this study is being carried out as a part of the annual program of CTEVT, Research and
Information Division, this gives vital information to both TVET institutions as well as manpower
agencies for their better performance in future thereby contributes to increase income for
individual workers and remittance to country.
1.4 Methodology
This study is based on both qualitative and quantitative data and information including both
demand and supply sides. The major source of demand side information was the advertisement
published by manpower agencies in Kantipur National Daily and Nagarik Daily, since these two
news papers found covered large share of such advertisement cases. About 3500 advertisement
cases were collected from Shrawan 2070 to Paush 2070 which were published in these two
newspapers and entered in to the statistical program named SPSS. After processing and cleaning
the data, only 3295 cases were found appropriate for analysis and analyzed them accordingly.
Instead of these published information, some other information regarding the demand and supply
of HR as per the skill-categories were obtained as a qualitative information. In this regard, personal
interview with foreign employment professionals were carried out and analyze as per the
requirement. A semi-structured interview format was developed for such purpose.
1.5 Limitations and assumptions
The valid analysis for any type of scientific research should satisfy some pre-conditions however
fulfillment of all the pre-conditions is hardly possible by any research in social science. The
analysis in this research also carried out under some limitations which is listed out as follows.
Source of information analyzed in this study is fully based on the published advertisement.
Therefore, both validity and reliability of the information can't be justified by the
methodology adopted in the analysis. The information undertaken in this research are
assumed to be valid and reliable since these activities are operating according to the law.
The supply side information is fully based on personnel interview with foreign employment
professionals selecting a few individuals. The sample size is therefore too low to make the
statistically significance conclusion from this analysis. The analysis is therefore just the
glimpse of supply situation.
The skill categorization in this report was made on the basis of the definition relevant with
the Nepalese context as mentioned in the report, however there is still reservation on the
categorization basisof the available data which is compared with the findings of the report.
CTEVT, Research and Information Division 3
Dynamics and Dimensions of Labour Migration from Nepal
1.5 Organization of the report
The report is organized in to four different chapters. The first chapter of the report is the
introductory chapter which gives some justifications or background information on why this study
was initiated. This chapter also states the objectives of the study with detail descriptions on its
methodology. Likewise the second chapter gives the snap shop on Nepalese labour market; past
trends and present situation of migration and remittance inflow to the country. This chapter also
presents some information of foreign and domestic labour policy. The third chapter which is also
the heart of this report gives the detail descriptions on analysis and interpretation of the advertise
cases. Finally the report ends up with major findings together with conclusions and
recommendations in the fifth or last chapter.

CTEVT, Research and Information Division 4
Dynamics and Dimensions of Labour Migration from Nepal
CHAPTER TWO
CURRENT LABOUR MARKET SCENARIO
2.1 Background
Nepal is an agrarian economy. More than 74% of populations of Nepal are engaged in traditional
agricultural occupations, however the contribution of this sector in national income is confined
within 37.4% (CBS, 2008 & MoF, 2011). The discrepancy between these two figures indicates
that the productivity of labour force engaged in this occupation is extremely low, which is further
verified by underutilization rate of labour force. According to Nepal Labour Force Survey, the
underutilization rate of labour force is extremely high (30%) (CBS, 2008). On the one hand, large
majority of workforce are engaged in agricultural sector, which is comparatively unproductive. On
the other hand, the manufacturing sector, which is highly productive sector was shrinking during
the last decade. The share of manufacturing sector in GDP was 9% in 2004/05 but decreased to
6.5% in 2010/11 (MoF, 2011). Likewise, the labour force participation rate of Nepal is also not
much encouraging (83.5%). In this scenario, both to increase the labour force participation rate
and productivity can be instrumental to raise the economic growth of the country. A labour policy
therefore should focus on such matters.
2.2 Composition and distribution of labour force
The report of Nepal Labour Force Survey has revealed that the labour force participation rate is
decreased by 1.4 percentage point from 1998/99 to 2008. Considering the gender wise data, the
economically active male population (87.5%) is significantly higher than economically active
female population (80.1%). At the same time, economically active boys’ population is slightly
lower than that of the girls’ which further suggests that the access to education to girls is still lower
than that to boys. On the one hand labour, force participation rate is declining during the analyzed
period. On the other hand, the employment rate during the same period has decreased by 2.6
percentage point, despite the rise of paid worker by 0.9 percentage point (CBS, 2008). The increase
of paid worker reveals the fact of displacement of workforces form subsistence agricultural
occupation to other sectors, however the rate is far lower than it was desired. Out of the total
economically active population of 11.8 million, only 2 million are wage employed rest 9.8 million
are self employed (CBS, 2008).
The line graph in chart 2.1 depicts the trend of employment as per the consumption quintiles.
While analyzing the trends, we find that the proportion of employment in agriculture decreases
moving from lower to upper quintile in both wage and self employment, however the rate is higher
for self employment than wage employment. Unlike the agriculture, the employment proportion
in non-agriculture occupation increases while moving from lower consumption quintile to upper
consumption quintile. This discrepancy on data suggests that productivity of workforce is lower
in agriculture occupation since the impact of productivity can be observed in income and
consumption.

CTEVT, Research and Information Division 5
Dynamics and Dimensions of Labour Migration from Nepal
Chart 2.1: Employment by Consumption Quintile
Source: Nepal Living Standard Survey 2010/11
2.3 Labour migration situation from Nepal
It is reported that 450,000 labour force are entering annually in the labour market, however the job
created by an economy is very lower than that number (MoF, 2011). These entrants therefore have
no choice than leaving to foreign employment for their ends meet regardless of the salary and
nature of work. It is also widely reported that most of migrant workers are involved in menial and
lower paid jobs. Moreover, the conditions of female workers are even critical who migrates for
house maid jobs (MoLTM, 2010).
After the liberalization of economy in 1985, the foreign employment opportunities for Nepalese
started to emerge up. As a result, the unemployed youth began to migrate to countries with
emerging economics like Malaysia and some gulf countries to seek employment. The chart
depicted in Table 2.1 reflects that the number of migrants was not significant until fiscal year
1997/98, since then it was sky rocketed. Presently, it is reported that almost 1500 Nepalese youth
are migrating daily to seek better employment opportunities.
CTEVT, Research and Information Division 6
Dynamics and Dimensions of Labour Migration from Nepal
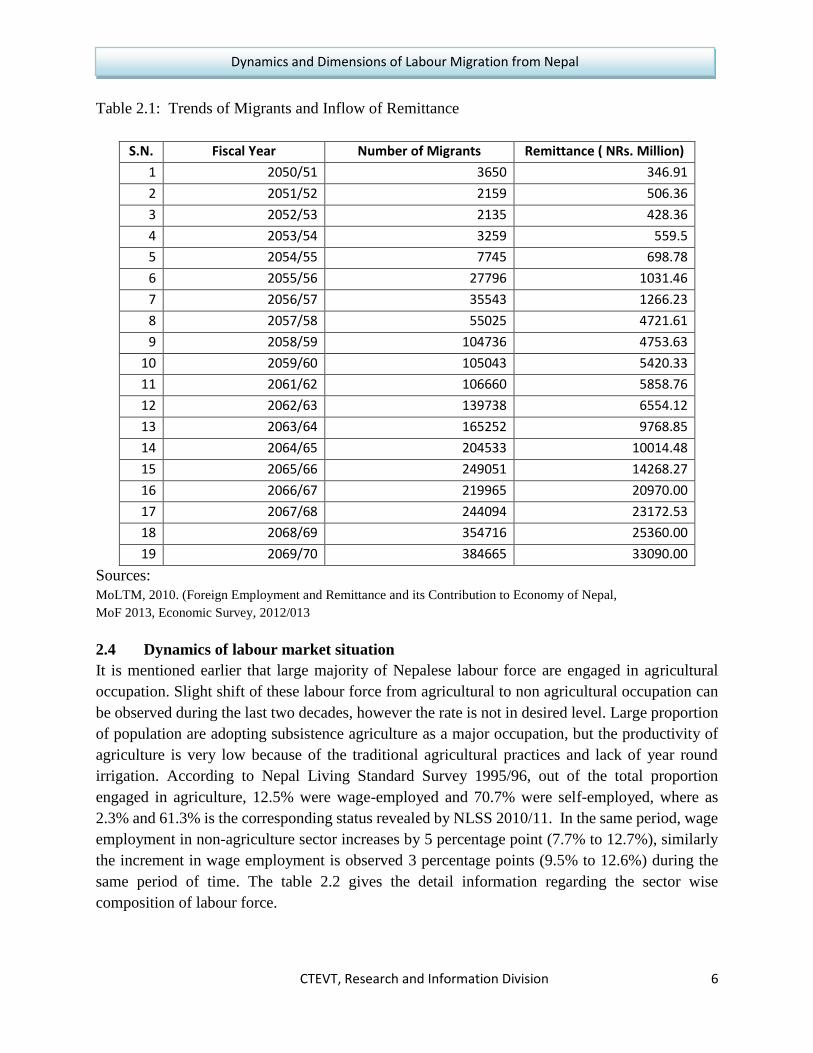
Table 2.1: Trends of Migrants and Inflow of Remittance
S.N. Fiscal Year Number of Migrants Remittance ( NRs. Million)
1 2050/51 3650 346.91
2 2051/52 2159 506.36
3 2052/53 2135 428.36
4 2053/54 3259 559.5
5 2054/55 7745 698.78
6 2055/56 27796 1031.46
7 2056/57 35543 1266.23
8 2057/58 55025 4721.61
9 2058/59 104736 4753.63
10 2059/60 105043 5420.33
11 2061/62 106660 5858.76
12 2062/63 139738 6554.12
13 2063/64 165252 9768.85
14 2064/65 204533 10014.48
15 2065/66 249051 14268.27
16 2066/67 219965 20970.00
17 2067/68 244094 23172.53
18 2068/69 354716 25360.00
19 2069/70 384665 33090.00
Sources:
MoLTM, 2010. (Foreign Employment and Remittance and its Contribution to Economy of Nepal,
MoF 2013, Economic Survey, 2012/013
2.4 Dynamics of labour market situation
It is mentioned earlier that large majority of Nepalese labour force are engaged in agricultural
occupation. Slight shift of these labour force from agricultural to non agricultural occupation can
be observed during the last two decades, however the rate is not in desired level. Large proportion
of population are adopting subsistence agriculture as a major occupation, but the productivity of
agriculture is very low because of the traditional agricultural practices and lack of year round
irrigation. According to Nepal Living Standard Survey 1995/96, out of the total proportion
engaged in agriculture, 12.5% were wage-employed and 70.7% were self-employed, where as
2.3% and 61.3% is the corresponding status revealed by NLSS 2010/11. In the same period, wage
employment in non-agriculture sector increases by 5 percentage point (7.7% to 12.7%), similarly
the increment in wage employment is observed 3 percentage points (9.5% to 12.6%) during the
same period of time. The table 2.2 gives the detail information regarding the sector wise
composition of labour force.

CTEVT, Research and Information Division 7
Dynamics and Dimensions of Labour Migration from Nepal
Table 2.1: Trend Analysis of Employment Status
Description Nepal Living Standard Survey
1995/96 2003/04 2010/11
Employed Population (%) 67.2 74.3 78.3
Unemployment Population ( %) 3.4 2.9 1.8
Not in labour Force (%) 29.4 22.8 19.9
Labour Force Participation Rate 70.6 77.2 80.1
Unemployment Rate (age 10-14 years) 4.9 3.8 2.2
Unemployment Rate (age 15-24 years) 7.9 3.4 1.1
Employed by Number of Hours of Work
1-19 Hours 21.5 24.4 31.7
20-39 Hours 25.6 23.4 22.1
40 Hours and Above 52.9 52.2 46.2
Share by Main Sector of Employment
Share of Self Employment in Agriculture 12.2 6.8 2.8
Share of Wage Employment in Agriculture 70.7 64.3 61.3
Share of Self Employment in Non-Agriculture 9.5 10.2 12.6
Share of Wage Employment in Non-Agriculture 7.7 9.3 12.7
Share of Extended Economic Work 9.4 10.7
Incidence of Child Labour, Age 5-14 Years 31.4% 27.6%
Source: Nepal Living Standard Survey, 2010/11)
During the last two decades, Nepalese labour market sector witnessed positive symptoms including
increase in labour force participation rate, employment proportion, incidence of child labour,
displacement of worker form unproductive sector by productive sectors. The data in table 2.1,
gives the comparative status of labour market indicators among three subsequent living standard
surveys from 1995/96 to 2010/11. According to NLSS 2010/11, unemployment problem in not
severe in Nepal, however underemployment seems more challenging. Only 46.2% of population
are in full time employment (more than 40 hours in a week) however sizeable proportion (31.7%),
works less than 20 hours a week. Similarly, 22.1% of population works between 20 to 39 hours.
Considering them only ¼ and ¾ time employed, total unemployment rate becomes alarming
(31.1%)1. But according to the survey, unemployment rate is decreased by 1.6 percentage point
during the last one and half decade (3.4% to 1.8%). Detail information is presented in table 2.1.
World Economic Forum has been publishing a Global Competitiveness Report since 2001. In this
report, competitiveness of any country is measured on the basis of twelve different indicators
1 Unemployment rate = unemployed proportion (1.8%) + ¼ * 31.7% (employed 1-19 hours per week) + ¾
* 22.1% (employed 20-39 hours per week) or unemployment rate =1.8% +23.7% +5.5 =31.1%
CTEVT, Research and Information Division 8
Dynamics and Dimensions of Labour Migration from Nepal
mentioning them as piller. Labour Market Efficiency is one of these pillars, which is further
calculated on the basis of nine different aspects of labour market sector. The aggregate score of
labour market efficiency index is 3.61 as per the report of 2007/08, whereas the respective score
is decreased to 3.58 in 2011/12 which further depicts the ineffectiveness of present labour policies.
2.5 Overview of labour and employment policy in Nepal
It is obvious that Nepalese economy is being remained subsistence agriculture economy and the
labour forces in this occupation are unorganized. History of organized Labour force dates back to
1938 alongside the establishment of first modern industry in Biratnagar (Riman& Upadhyaya,
1999). At the same time the industrial council was also established however no specific policy
was there regarding labour issue. Although the planned development has started in 1956, labour
issues got due importance only after reestablishment of democratic political system. Eighth
Development Plan, which was the first development plan after reestablishment of democracy in
1989, had identified some problems and challenges of Nepalese labour market. In this planned
document, some policies were also formulated to address such problems. Some activities for
addressing labour and employment issues such as establishment of Ministry of Labour and Social
Welfare in 1981, launching of employment generation activities in Seventh Five Yearly
Development Plan were already been there, however it is found that major stride in reform and
regulating activities in labour and employment sector takes places only after the reestablishment
of democracy (Riman & Upadhyaya, 1999).
In this regard, Eight Development Plan incorporated various policy matters regarding labour and
employment issues and several systems and programmes were also proposed in order to safeguard
the labour rights and enhanced the productivity of labour force. These reform activities included
various vocational training and skill development activities, and some institutional and legal
provisions. The following are the main objectives regarding labour and employment issues
incorporated in the Eighth Development Plan (NPC, 2048).
a. Reducing unemployment by maintaining a balance between demand and
supply of labour.
b. Producing skilled workers for the purpose of development activities.
c. Creating enabling environment for employment opportunities both at home and
abroad.
d. Protecting the basic rights of labours effectively.
2.5.1 National Labour Policy 2056
Unlike the general understanding, Labour policy is not only related with safeguarding the rights
of the labour but also deals with the factors that are related with the production activities or
enhances productivity of labour force. A policy dealing only with labour issues, was therefore
essential for properly addressing the problems and challenges of labour and employment sector so
as to maximize the production activities using scarce means and resources tactfully.

CTEVT, Research and Information Division 9
Dynamics and Dimensions of Labour Migration from Nepal
National Labour Policy 2056, was the first and foremost policy formulated to deal with labour
related problems as a separate document. This policy had covered several issues relating to
harmonizing the relationship with industrial sector, employment promotion, training and skill
development, reforming the existing labour related rules and regulations and other social security
issues.
As summarizing the main objectives of that policy, some provisions such as creating production
friendly environment in industrial sector by harmonizing the relationships between workers and
management, safeguarding the basic rights, welfare and workplace-security for the workers, giving
due consideration on the issue of disadvantaged group including women and handicapped, and
training and supply of skilled workers in desired quantity and quality appropriately incorporated
in the policy. No doubt, that the labour policy was wide inclusive, but the dynamism of
globalization has changed the global production scenario in such a way that a new policy in this
regard became essential. Thus, the new labour and employment policy has been formulated in
2062 B.S.
2.5.2 Labour and Employment Policy 2062
The labour and employment policy 2062 was devised making necessary modification in the earlier
policy. Some essential provisions were incorporated in existing policy to make it compatible with
the recent developments like WTO membership in 2004, the increasing globalization of labour
market as well as capital, goods and service market.
According to this policy, its longer term goal is to provide productive, non-discriminatory,
exploitation-free, decent, safe and healthy work opportunities for citizens of the working
ages by building an environment of friendly investments, in addition to building and
managing a labour market that contributes to the national economy so that it can compete at
the global level. (MoLTM, 2062)
As a short term objectives, it has given due emphasis to provide productive and full employment,
eliminate illegal labour activities like child labour, bonded labour and other forms of labour
discrimination, developing multi skilled and productive labour force, safeguarding the labour
rights, harmonizing the relationships between labour and management and so on. Some effective
working policies are also proposed to make these objectives achievable.
Provisions regarding identification of labour intensive employment sectors and creating
investment friendly environment to boost up both internal investment and FDI are incorporated in
the policy. Providing special facilities to those industries which are providing fixed numbers of
employments or more is also incorporated. Sufficient attentions is given for the skilled
development activities and establishment of labour market information system. In addition to this,

CTEVT, Research and Information Division 10
Dynamics and Dimensions of Labour Migration from Nepal
attention is paid to control strikes and closers specially in the industries established at EPZ which
jeopardize the total production system.
Provisions of the policy are focused on creating positive thinking towards labour and workers to
establish dignity of labour in society. Development of labour relation according to the concept of
decent work and ILO labour standard, encouragement of global parameters of labour also in
informal sectors. Employment will be considered as a fundamental rights as well as tripartite and
bipartite consultation and partnerships between the government, employers and workers will be
constantly encouraged for productivity growth and harmonious industrial relations. Any type of
unfair labour practices from the side of worker and workers’ organization as well as employer and
employers’ organization will be entirely prohibited.
Along with developing labour elasticity, social security, and occupational safety and health as
intrinsic components of labour administration, the social security network will be expanded in a
graduated manner by coordinating them on the initiative of the government, social partners and
non-governmental sector. For this to achieve, flexibility encouraged in labour market,
comprehensive and integrated system of social security will be developed and expanded, balance
will be maintained between elasticity of labour market, investment friendly environment and
minimum social security, due emphasis are given on occupational health and safety and
reproductive health, vocational training and skilled development programmes will be
decentralized etc.
To enlarge the employment and self-employment opportunities for the youth, women, indigenous
peoples, dalits, elderly, differently able and backward sections and groups, special target
programmes that support employment will be conducted. Merit-based employment encouraged.
There are sufficient provisions for positive discrimination towards indigenous nationalities,
differently able, vulnerable and poor groups, and appropriate positive to encourage them for
employment. Several reform programmes will be proposed to encourage for the higher
participation of women in labour market adapting gender balanced approach discourage
harassment for women, making women and family friendly working environment
The master plan on child labour will be effectively implemented by establishing cordial relation
with other sectoral work plans prepared for the protection and development of children. This will
be achieved by coordinated effort made by GOs, INGOs, NGOs, private sectors, donor community
as well as other international community, legal provisions will be made adequate and effective
alongside the institutional frameworks
Activities that contribute to capacity building, expansion, and system improvement of the offices
engaged in employment promotion and labour administration, in addition to boosting the morale
of personnel, will be carried out.
CTEVT, Research and Information Division 11
Dynamics and Dimensions of Labour Migration from Nepal
2.5.3 Policy on foreign employment
Neither any specific policy nor act or regulation was there to address the issue of labour migration
since long past time. The existing labour and employment policies and respective laws and bylaws
have been consideringto regulate the issues of foreign employment. In the beginning of sixties
decade, the issue of foreign employment got due importance and respective policies were felt
urgent to regulate the existing situation of labour migration. Promulgation of Foreign Employment
Act, 2064 and Foreign Employment Regulation, 2064 were the result of the initiation form the
government side.
Anglo-Nepal Treaty of Peace and Friendship signed in 1890 was one of the examples which
justifies how government policies are vital to solve the problems of foreign employment. This
treaty paved the way for more than 3000 Nepalese solider recruit in British Gorkha Regiment.
Likewise the Friendship Treaty singed between Nepal and India in July1950 was a turning point
in the movement of Nepalese in India (Kayastha, 2002 cited on Shrestha, (2009). Public policies
can play vital role both to safeguard the labour right and to lower the transaction cost of the
government. Although safeguarding the labours' right is more depends upon the policies taken by
destination countries, there are still some areas on which government of source country can play
vital role in it.
2.5.3.1 Safeguarding labours' right
Because of the democratic political system, safeguarding the labour right is the primary concern
of the Government of Nepal, which is reflected not only in related laws and bylaws but also in
interim constitution. The Interim constitution of Nepal 2007 has validated employment as one of
the elementary rights of the Nepalese citizens (Gurung 2010). Nepalese citizens are allowed to
carry out any kind of business or involve in any type of wage or self-employment activities which
is not restricted by constitution or existing laws (Interim Constitution, article 18). The
promulgation of Foreign Employment Act 2064 and The Foreign Employment Rules 2064 are
positive attempts in themselves towards both safeguarding the workers rights and lowering the
migration cost. Moreover, there are ample provisions in this act and regulation, the major points
of which are listed out as hereunder.
Provisions up to 5 years’ imprisonment and 7 lakhs capital punishment to discourage one
who involve in cheating and deceiving while sending workers in employment (Chapter 9)
Establishment of Foreign Employment Department and provision to appoint labour
attaché in a destination country where more than five thousand Nepalese migrant workers
are currently working (Section 67 and 68)
A person under eighteen years is strictly prohibited for foreign employment. (Section 7)

CTEVT, Research and Information Division 12
Dynamics and Dimensions of Labour Migration from Nepal
In order to ensure compensation, provision of deposit either 30 lakhs in cash or 7 lakhs in
cash and rest as a form of bank guarantee is compulsion to get approval for running foreign
employment business is available in the law (Section 11)
Provision of foreign employment welfare fund (Chapter 6) and Foreign Employment
Promotion Board chaired by Labour and transport management minister (Chapter 8)
Provision for compulsory advertisement incorporating some essential information
(Section 16)
Compulsory provision of getting skilled training form the government recognized
agencies (CTEVT constituent or affiliated training institute) to migrate as a skilled worker
(Section 30)
Compulsory provision of imparting orientation training prior to foreign employment
(Section 27)
2.5.3.2 Lowering the transaction cost of migration
The period between 1997 and 2003 could be considered as the boom period regarding foreign
employment (Shrestha, 2009). The rapid out flow of labour migration during this period can be
attributed to the policy taken by government to issue passport form the respectively District
Administration Office. This decision had played vital role to lower the cost of migration. Likewise,
the provision under the existing laws and by laws which contribute in lowering the cost and
accelerating the flow of migration are as follows.
Provision of fixing ceiling amount to be paid by foreign job seeker ( Section 24)
Provision for refund if the worker reluctant to migrate due to otherwise provisions than
advertised (Sub section 3 of section 20)
CTEVT, Research and Information Division 13
Dynamics and Dimensions of Labour Migration from Nepal
CHAPTER THREE
ADVERTISEMENT ANALYSIS
3.1 General profile of the data
This report is mainly based on the information provided in the advertisements published by the
foreign employment agencies to fulfill the demand obtained from foreign employers. There is a
compulsory provision in the Foreign Employment Act 2064 for publishing an advertisements in
national daily newspaper incorporating the particular information regarding the working
conditions and offered facilities. This information must incorporate the proposed salary and other
benefits, tentative costs, minimum qualification, name of employers' company and country,
working conditions etc.
Since, over 3000 advertisements published within six months time period from Shrawan to Paush
2070 was initially proposed to analyze, all data could not be entered due to the reason mentioned
hereafter. The advertisements published in Kantipur National Daily form Shrawan to Kartic was
completely incorporated in the analysis but data of last two months, Mangsir and Paush was partly
entered since the data already exceeded the predetermined limit of 3000. Large share of
advertisements have been found covered in Kantipur National Daily, data only in small number
was entered from Nararik Daily. In total 3295 advertisement cases are incorporated in the analysis.
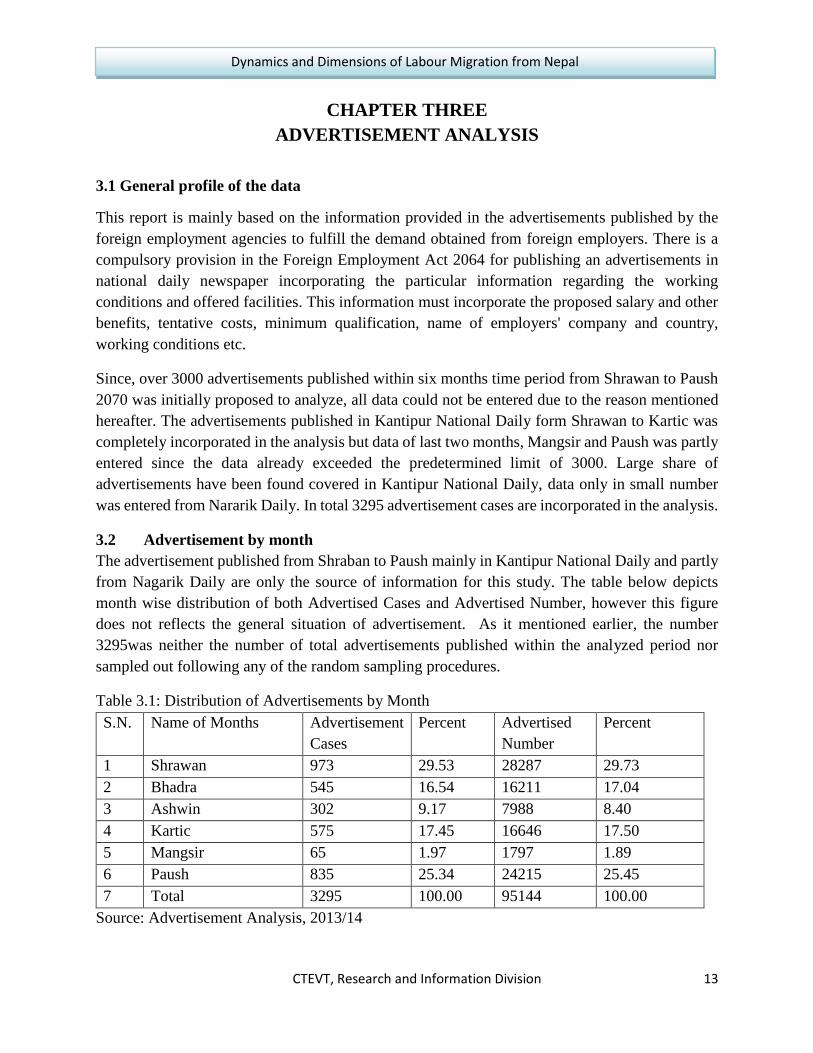
3.2 Advertisement by month
The advertisement published from Shraban to Paush mainly in Kantipur National Daily and partly
from Nagarik Daily are only the source of information for this study. The table below depicts
month wise distribution of both Advertised Cases and Advertised Number, however this figure
does not reflects the general situation of advertisement. As it mentioned earlier, the number
3295was neither the number of total advertisements published within the analyzed period nor
sampled out following any of the random sampling procedures.
Table 3.1: Distribution of Advertisements by Month
S.N. Name of Months Advertisement
Cases
Percent Advertised
Number
Percent
1 Shrawan 973 29.53 28287 29.73
2 Bhadra 545 16.54 16211 17.04
3 Ashwin 302 9.17 7988 8.40
4 Kartic 575 17.45 16646 17.50
5 Mangsir 65 1.97 1797 1.89
6 Paush 835 25.34 24215 25.45
7 Total 3295 100.00 95144 100.00
Source: Advertisement Analysis, 2013/14

CTEVT, Research and Information Division 14
Dynamics and Dimensions of Labour Migration from Nepal
The two figures depicted in the Table 3.1 and after this, under the title of Advertised Cases and
Advertised Number are different. Single advertisement used to publish for a same nature of job,
however the demanded number would be ranges from one to many. The formal title indicates only
the number of advertisements where as the later data counted the demanded numbers as well.
Altogether 3295 published advertisement cases were entered and analyzed in this study which
incorporates the demand of 95,144 numbers of workforces. Among the entered data, majority
(29.5%) are advertised in Shrawan followed by Paush (25.35%) and Kartik (17.45). Somehow the
advertised numbers are also proportionately similar to the advertised cases. The detail of this
distribution is depicted in Table 3.1.
3.3 Country wise demand distribution
Although more than 109 countries are opened up for foreign employment to Nepalese Workforces,
analysis in this report has explored notably fewer countries (11 countries) from which demand of
workforces has been received. Among these eleven countries, UAE has the greatest share
(29.33%) of demands followed by Qatar 28.03%, Malaysia 20.47% and Kuwait (13.38%). No
notable figure of demand has been received from rest of the countries. Although, South Korea is
also the major destination country for labour migration from Nepal, it was not found in regular
advertisements since different procedure is adopted to select the workforce to South Korea2. The
detail of the country wise distribution of workforce demand is presented in Table 3.2.
Table 3.2: Advertisements by Country
S.N. Name of Months Advertisement
Cases
Percent Advertised
Number
Percent
1 UAE 944 28.65 27903 29.33
2 Qatar 1118 33.93 26668 28.03
3 Malaysia 372 11.29 19478 20.47
4 Saudi Arabia 290 8.80 12729 13.38
5 Kuwait 272 8.25 4713 4.95
6 Oman 183 5.55 1588 1.67
7 Bahrain 78 2.37 1476 1.55
8 Cyprus 20 0.61 324 0.34
9 Europe 12 0.36 130 0.14
10 Macau 3 0.09 102 0.11
11 Japan 3 0.09 33 0.03
12 Total 3295 100.00 95144 100.00
Source: Advertisement Analysis, 2013/14
2 EPS was the process under which workers were selected for the Korea.

CTEVT, Research and Information Division 15
Dynamics and Dimensions of Labour Migration from Nepal
3.4 Demand by occupational category
During the analyzed period, demand of 95,144 workforce under various job titles were observed,
which is too long to present in the report and understand by the readers. The job titles are therefore
subsumed under the 52 categories which is presented in Annex I. Among these categories,
unskilled workers covers large share (25%) of total demand. Under the unskilled category, various
job titles are subsumed which does not require any defined skills or prior experience to perform
the job such as Labour, factory worker, cleaner, agriculture labour etc. Similarly, second highest
obtained demand was of Security Guard which occupies 16% share of total demand. Helpers in
skill related jobs are also in significant numbers. Substantial numbers of workforce having skills
like carpentry, masonry, plumbing, electrician, mechanical are also found significantly demanded
with in the analyzed period. (See Annex I for detail breakdown)
3.5 Demand by skill category
These demanded jobs are further classified as per the level of working efficiency or competency
such as Unskilled, Semi-skilled, Skilled and Professionals. Although universal or wide acceptable
classification of these terms are difficult to find, attempt was made to define these terms based on
international standard and national practice. The definition of these terminologies mentioned
hereafter are followed to classify the job categories stated in the previous topic 3.4.
Unskilled jobs: Those nature of jobs that can be performed with out having prior experience or
knowledge about the jobs and the offered remuneration is also relatively lower.
Semi-Skilled jobs: Those types of jobs that require some level of prior experience or knowledge
but individuals are not capable enough to perform without the supervision or guidelines of seniors.
Moreover, the offered remuneration for such jobs is more than 20% than that received by average
unskilled job holders.
Skilled Jobs: Those types of Jobs that need sufficient level of prior experience or knowledge and
individuals are capable enough to independently perform with out the guidelines of seniors.
Moreover, the offered remuneration is also more than 50% than that received by average unskilled
job holders.
Table 3.3: Demand by Skill Category
SN Skill Category Advertised Cases Percent Advertised Number Percent
1 Unskilled 569 17 25088 26.37
2 Semi-skilled 958 29 33479 35.19
3 Skilled 1627 49 35069 36.86
4 Professional 141 4 1508 1.58
5 Total 3295 100 95144 100
Source: Advertisement Analysis 2013/14
CTEVT, Research and Information Division 16
Dynamics and Dimensions of Labour Migration from Nepal
Professional Jobs: Those categories of knowledge-based jobs which require higher level of
academic degree and prior knowledge to perform and the offered remuneration was also lucrative.
The advertised title of the jobs were classified based on the above definition. As per this
classification, large demand was obtained for skilled workers under various sectors from
construction to hotel managements. Among the total demanded numbers, 36.85% demands are of
skilled workers, likewise 35.85% for semi-skilled workers, 26.36% are for unskilled and 1.85%
demanded numbers falls under professional category. The Table 3.3 depicts the detail of this
classification
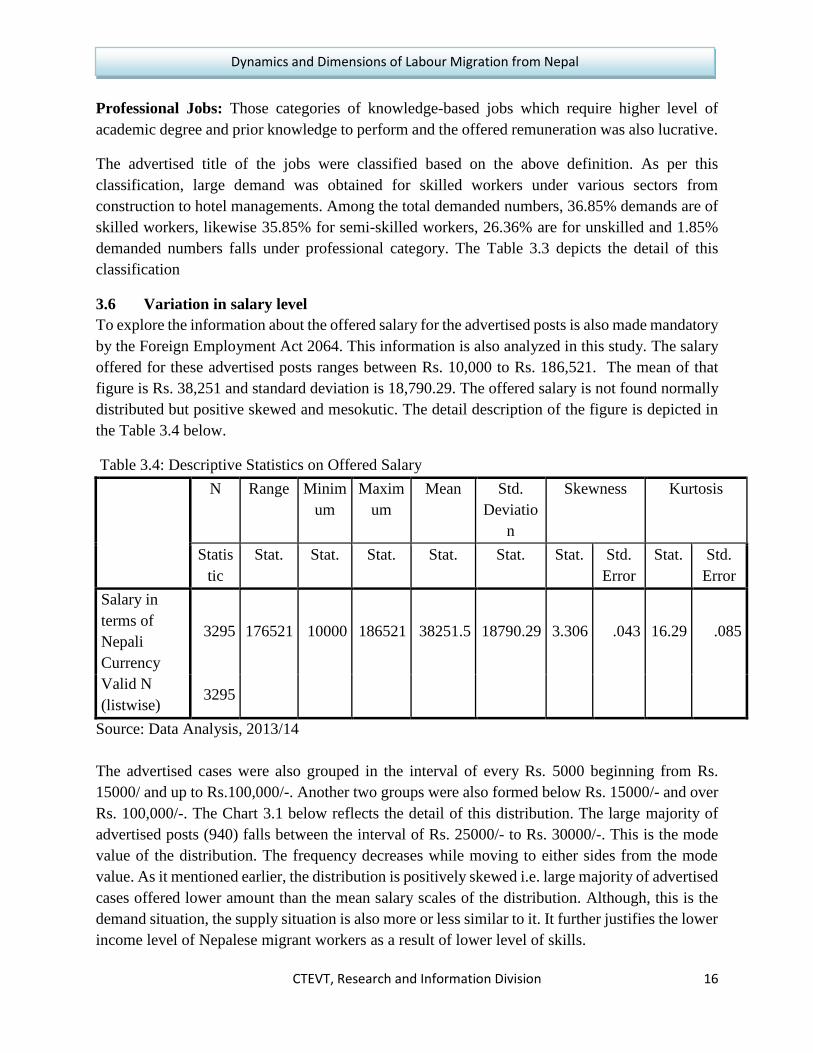
3.6 Variation in salary level
To explore the information about the offered salary for the advertised posts is also made mandatory
by the Foreign Employment Act 2064. This information is also analyzed in this study. The salary
offered for these advertised posts ranges between Rs. 10,000 to Rs. 186,521. The mean of that
figure is Rs. 38,251 and standard deviation is 18,790.29. The offered salary is not found normally
distributed but positive skewed and mesokutic. The detail description of the figure is depicted in
the Table 3.4 below.
Source: Data Analysis, 2013/14
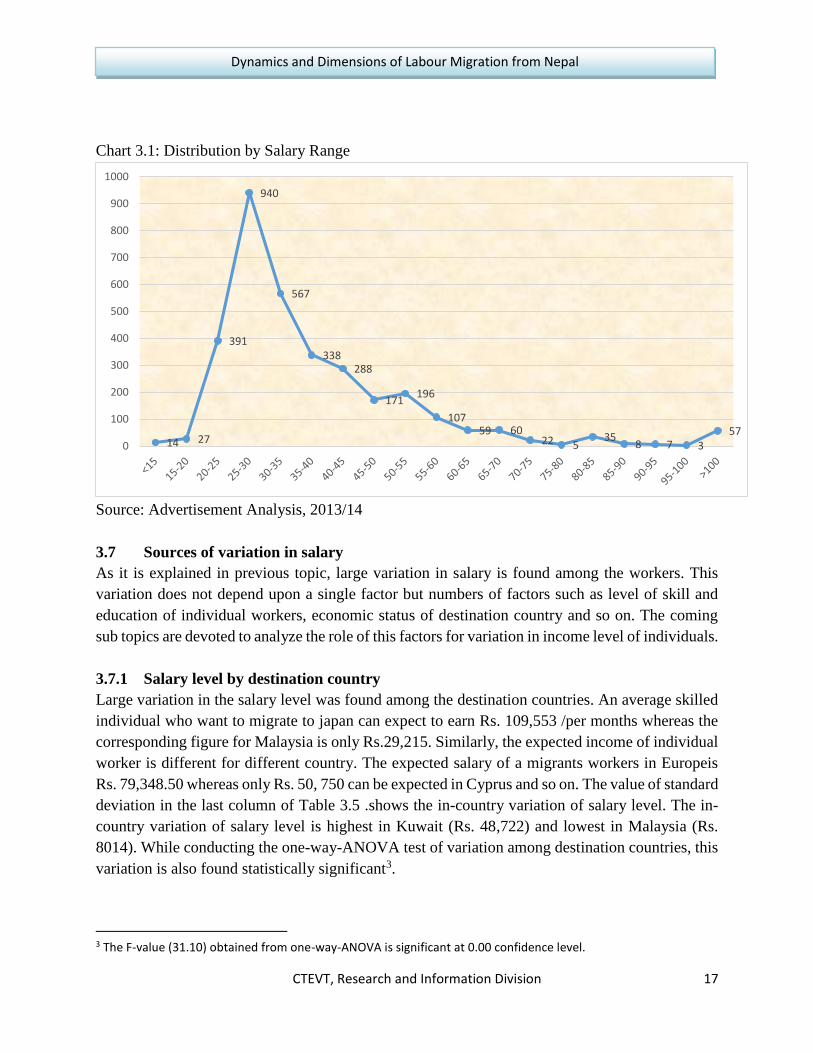
The advertised cases were also grouped in the interval of every Rs. 5000 beginning from Rs.
15000/ and up to Rs.100,000/-. Another two groups were also formed below Rs. 15000/- and over
Rs. 100,000/-. The Chart 3.1 below reflects the detail of this distribution. The large majority of
advertised posts (940) falls between the interval of Rs. 25000/- to Rs. 30000/-. This is the mode
value of the distribution. The frequency decreases while moving to either sides from the mode
value. As it mentioned earlier, the distribution is positively skewed i.e. large majority of advertised
cases offered lower amount than the mean salary scales of the distribution. Although, this is the
demand situation, the supply situation is also more or less similar to it. It further justifies the lower
income level of Nepalese migrant workers as a result of lower level of skills.
Table 3.4: Descriptive Statistics on Offered Salary
N Range Minim
um
Maxim
um
Mean Std.
Deviatio
n
Skewness Kurtosis
Statis
tic
Stat. Stat. Stat. Stat. Stat. Stat. Std.
Error
Stat. Std.
Error
Salary in
terms of
Nepali
Currency
3295 176521 10000 186521 38251.5 18790.29 3.306 .043 16.29 .085
Valid N
(listwise) 3295
CTEVT, Research and Information Division 17
Dynamics and Dimensions of Labour Migration from Nepal
Chart 3.1: Distribution by Salary Range
Source: Advertisement Analysis, 2013/14
3.7 Sources of variation in salary
As it is explained in previous topic, large variation in salary is found among the workers. This
variation does not depend upon a single factor but numbers of factors such as level of skill and
education of individual workers, economic status of destination country and so on. The coming
sub topics are devoted to analyze the role of this factors for variation in income level of individuals.
3.7.1 Salary level by destination country
Large variation in the salary level was found among the destination countries. An average skilled
individual who want to migrate to japan can expect to earn Rs. 109,553 /per months whereas the
corresponding figure for Malaysia is only Rs.29,215. Similarly, the expected income of individual
worker is different for different country. The expected salary of a migrants workers in Europeis
Rs. 79,348.50 whereas only Rs. 50, 750 can be expected in Cyprus and so on. The value of standard
deviation in the last column of Table 3.5 .shows the in-country variation of salary level. The in-
country variation of salary level is highest in Kuwait (Rs. 48,722) and lowest in Malaysia (Rs.
8014). While conducting the one-way-ANOVA test of variation among destination countries, this
variation is also found statistically significant3.
3 The F-value (31.10) obtained from one-way-ANOVA is significant at 0.00 confidence level.
14 27
391
940
567
338288
171196
10759 60
22 535
8 7 357
0
100
200
300
400
500
600
700
800
900
1000

CTEVT, Research and Information Division 18
Dynamics and Dimensions of Labour Migration from Nepal
Table: 3.5: Distribution of Salary by Destination Country
S.
N.
Name of Destination
Country
Number of
Advertised Cases
Mean Salary in
NRs.
Std.
Deviation
1 Japan 3 109553.33 20697.43
2
Europe (Country not
specified
12 79348.50 28954.83
3 Cyprus 20 50750.75 28737.99
4 Kuwait 272 48722.19 28945.37
5 Macau 3 48256.53 19579.31
6 Oman 183 39619.28 15742.58
7 United Arab Emirates 944 38658.88 17121.19
8 Qatar 1118 37696.47 15095.41
9 Bahrain 78 37007.86 27509.94
10 Saudi Arabia 290 36903.42 22831.13
11 Malaysia 372 29215.68 8014.30
12 Total 3295 38251.55 18790.29
Source: Advertisement Analysis, 2013/14
3.7.2 Salary as per the skill category
As it mentioned above, advertisements were classified based on the level of skills. As per this
classification the variation in salary level among the skilled categories like Unskilled, Semi-
skilled, Skilled and Professionals was also found significantly different to each other while
conducting one-way-ANOVA test of variation4.
Table 3.6: Offered Salary by Skilled Category
SN Skilled Based Classification
Number of
Cases
Average Salary
Offered Std. Deviation
1 Unskilled 569 27170.591 9175.4467
2 Semi-skilled 958 37082.525 14456.6196
3 Skilled 1627 40411.025 26450.0854
4 Professional 141 78296.097 43063.3725
5 Total 3295 38778.031 24324.2805
Source: Advertisement Analysis, 2013/14
The Table 3.6 below shows the detail of the variation in salary as per the skill-wise classification.
Large scale of variation in the salary level was found. An unskilled workers can expect to earn
4 The F-value (380.10) obtained from one-way-ANOVA is significant at 0.00 confidence level.
CTEVT, Research and Information Division 19
Dynamics and Dimensions of Labour Migration from Nepal
Rs. 27,170 from foreign employment whereas the corresponding expectation of semi-skilled,
skilled and professional workers are Rs. 37082, Rs. 40411 and Rs. 78296 respectively. The small
difference between skilled and semi-skilled category may be due to the confusion in the
classification between them.
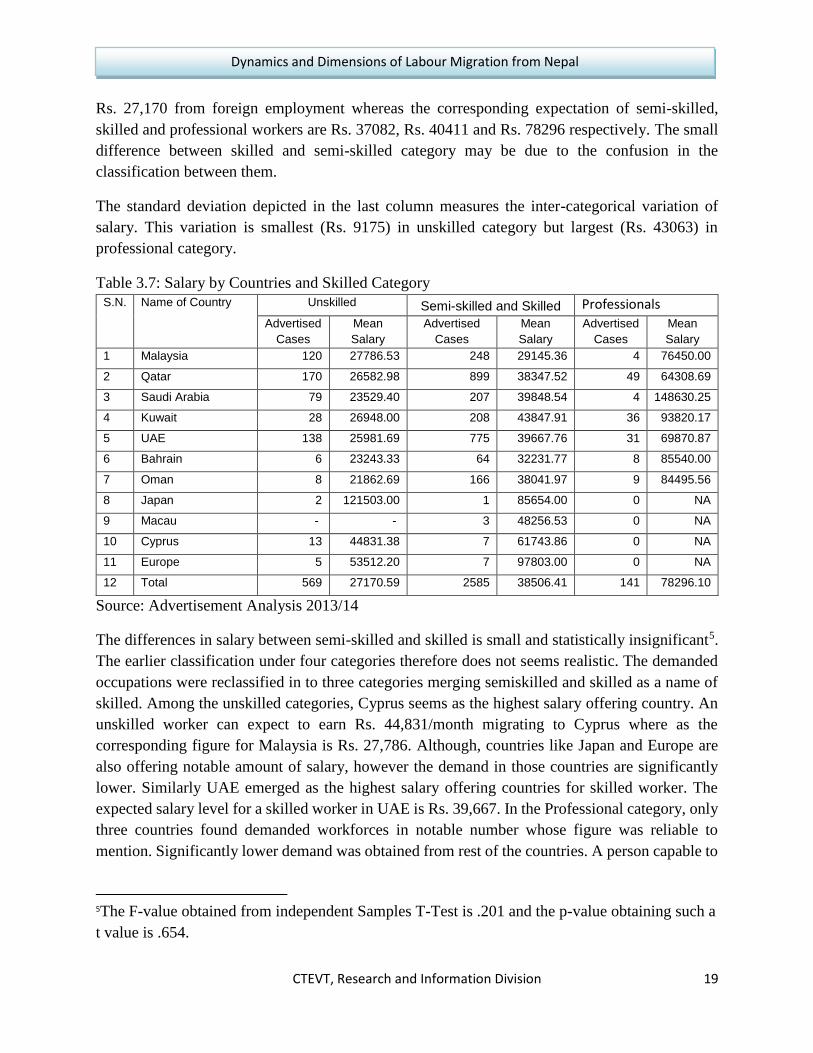
The standard deviation depicted in the last column measures the inter-categorical variation of
salary. This variation is smallest (Rs. 9175) in unskilled category but largest (Rs. 43063) in
professional category.
Table 3.7: Salary by Countries and Skilled Category
S.N. Name of Country Unskilled Semi-skilled and Skilled Professionals
Advertised
Cases
Mean
Salary
Advertised
Cases
Mean
Salary
Advertised
Cases
Mean
Salary
1 Malaysia 120 27786.53 248 29145.36 4 76450.00
2 Qatar 170 26582.98 899 38347.52 49 64308.69
3 Saudi Arabia 79 23529.40 207 39848.54 4 148630.25
4 Kuwait 28 26948.00 208 43847.91 36 93820.17
5 UAE 138 25981.69 775 39667.76 31 69870.87
6 Bahrain 6 23243.33 64 32231.77 8 85540.00
7 Oman 8 21862.69 166 38041.97 9 84495.56
8 Japan 2 121503.00 1 85654.00 0 NA
9 Macau - - 3 48256.53 0 NA
10 Cyprus 13 44831.38 7 61743.86 0 NA
11 Europe 5 53512.20 7 97803.00 0 NA
12 Total 569 27170.59 2585 38506.41 141 78296.10
Source: Advertisement Analysis 2013/14
The differences in salary between semi-skilled and skilled is small and statistically insignificant5.
The earlier classification under four categories therefore does not seems realistic. The demanded
occupations were reclassified in to three categories merging semiskilled and skilled as a name of
skilled. Among the unskilled categories, Cyprus seems as the highest salary offering country. An
unskilled worker can expect to earn Rs. 44,831/month migrating to Cyprus where as the
corresponding figure for Malaysia is Rs. 27,786. Although, countries like Japan and Europe are
also offering notable amount of salary, however the demand in those countries are significantly
lower. Similarly UAE emerged as the highest salary offering countries for skilled worker. The
expected salary level for a skilled worker in UAE is Rs. 39,667. In the Professional category, only
three countries found demanded workforces in notable number whose figure was reliable to
mention. Significantly lower demand was obtained from rest of the countries. A person capable to
5The F-value obtained from independent Samples T-Test is .201 and the p-value obtaining such a
t value is .654.

CTEVT, Research and Information Division 20
Dynamics and Dimensions of Labour Migration from Nepal
perform professional jobs can expect to earn Rs. 93,820 from migrating to Kuwait where as s/he
expect to earn only Rs. 69,870 from UAE. The Table 3.7 depicts the detail information in it.
3.7.3 Variation of salary by job category
As it mentioned earlier that long list of job titles was obtained from these advertisements. These
job titles are not only skill specific but also working country or working sector specific. The same
type of job was called differently in different countries. These job titles were subsumed on the
basis of type and nature of work they have to perform and given a common name. The number of
demands as per these job titles are mentioned in Annex I. The expected salary level for these job
titles which have significant demand in foreign employment are only mentioned and discussed
here.
The category- Engineers and Equivalent which includes engineers of various sectors and other
equivalent posts is listed in the top of rank with salary level Rs. 116,733/ month. Similarly,
Managing Supervisor is in the second order with expected salary level Rs. 79958/month. The
Senior Managers which includes project manager, administrative manager, HSE officers have their
expected per month salary Rs. 62,235/-. All of these top ranked salaried posts are falls under
professional category.
Among the skilled category, Foreman, Chef, Backing Technicians, Auto-equipment Operators
(includes various categories Dozer Operator, Roller Operators, Heavy equipment Operators etc.)
Housekeeping, Cooking, Electronics Equipment Repairer, General Electrician, Industrial
Electricians are highly salaried posts. Those skilled technicians can expect salary between Rs.
35000 to Rs. 45000/- irrespective of countries they migrate.
3.7.4 Distribution by educational qualification
Although educational qualification is not found considered as a signal for the efficiency of the
workers in foreign employment. Among the 3295 advertised cases, only 2972 cased were found
mention the qualification column. Out of this 2972 cases, Basic literacy was mentioned as a
minimum requirements for workers. Similarly, 55 cases mentioned SLC as minimum qualification
for workers. In twelve cases, higher secondary was mentioned as minimum qualification. Only
one case was found where bachelor degree was indicated as minimum qualification. In large
majority (2758) cases, experience and efficiency in similar jobs are mentioned as a basic necessity
for the workers who migrate for foreign employment. The distribution by educational qualification
therefore does not have any reliability.
3.8 Tentative expenditure
Although, mentioning tentative cost for migration was mandatory as per the foreign employment
act 2064, less than half of the advertisement was found mentioning the tentative expenditure for
migration in the advertisements. This analysis was carried out by selecting the cases in which such
cost was mentioned. Out of 3295 advertised cases, 1410 cases was selected and included in the
analysis. Europe was found most expensive destination where migration cost was Rs. 180,833.00,

CTEVT, Research and Information Division 21
Dynamics and Dimensions of Labour Migration from Nepal
followed by Cyprus Rs. 131,000.00, and Macau Rs. 67,500.00 All of these countries have only
small share in the foreign employment market. If we consider only those countries which occupies
significant share, Malaysia was found as an expensive destination where the tentative cost of
migration is Rs. 66,857.00 followed by Oman Rs. 65,144.00 and Saudi Arabia Rs. 58,820.00.
Kuwait was found the cheapest destination among those countries which provides significant
numbers of employment to Nepalese youths. The tentative cost for migrating to Kuwait is Rs.
50,118.01. This variation of cost as per the country is statistically significant at 99.99% confidence
level with F-value 26.755.
Table 3.8: Migration Cost by Country
S.N.
Name of destination
country N Mean Std. Deviation
1 Europe 12 180833.33 46163.412
2 Cyprus 15 131000 59437.843
3 Macau 3 67500 26339.134
4 Malaysia 315 66857.14 17947.071
5 Oman 69 65144.93 3926.813
6 Saudi Arabia 178 58820.22 60727.801
7 UAE 560 57363.09 34233.281
8 Bahrain 62 55725.81 12734.578
9 Kuwait 161 50118.01 16721.759
10 Japan 3 50000 0
11 Qatar 32 45125 12855.901
12 Total 1410 60711.94 36130.995
Source: Advertisement Analysis, 2013/14
3.9 Variation of migration cost by level of skill
There found large variation in migration cost as per the level of skills, however this variation was
significant only in 90% confidence level. The obtained F-value in one-way-ANOVA test (2.558)
is significant at only 94.20% confidence level. The one-way-ANOVA test explores the variation
of migration cost among the five categories of level of skills. If the difference is compared only
between Unskilled and Professional categories by conducting the independent sample T-test, the
obtained F-Value is statistically significant at 99% confidence interval. If we observe directly the
amount of cost among these three categories, the average cost of migration for unskilled worker is
highest (Rs. 64,437), where as the corresponding figure for skilled (Semi-skilled and Skilled) and
professional workers are Rs. 60,025 and Rs. 53,365 respectively.

CTEVT, Research and Information Division 22
Dynamics and Dimensions of Labour Migration from Nepal
Table 3.9: Migration Cost by Level of Skills
S.N. Three Category of skills Average Cost
Number of
Advertised Cases Std. Deviation
1 Unskilled 64437.35 298 35834.594
2 Semi-skilled and Skilled 60025.00 1060 36847.766
3 Professional 53365.38 52 15771.691
4 Total 60711.94 1410 36130.995
Source: Advertisement Analysis, 2013/14
3.10 Provisions of extra facilities
Workers are provided extra facilities like overtime, food facilities, and accommodation facilities.
Accommodation facility was found mentioned almost in every advertisements, however food
facility is not mentioned in that proportion. Additional analysis was no more required regarding
the overtime facility since it is stated in almost every advertisement that it will be provided as per
the company rule. Regarding the food facility, 83.3% of advertised posts are offered food facilities.
Unlike the 83.3% in total figure, the corresponding figure of unskilled worker is only 76.8% where
as that of Skilled and Professionals are 84.4% and 89.4% respectively. While conducting the Chi-
square test of association, the calculated figure of Chi-square coefficient (22.888) is significant at
almost 100% confidence level. This is the evident of strong association between provision of food
facilities and level of skills.
Chart 3.2: Country Wise Demand Composition
Source: Advertisement Analysis 2013/14
0.00
10.00
20.00
30.00
40.00
50.00
60.00
70.00
80.00
90.00
Bahrain UAE Oman Qatar Kuwait Malaysia Saudi Arabia
8.13
21.60 18.70 20.75 20.33
34.49
40.58
83.74
77.70 77.20 76.4871.74
65.47
59.37
8.13
0.704.09 2.77
7.94
0.040.05
Distribution by Level of Skill
Unkilled Skilled Professional

CTEVT, Research and Information Division 23
Dynamics and Dimensions of Labour Migration from Nepal
Table 3.10 A: Category of skills vs Food facilities Cross-tabulation
Food Facilities Total
yes No
Cat
egori
es o
f sk
ill
Unsk
ille
d Count 431 130 561
% within Categories of skills 76.8% 23.2% 100.0%
% within Food Facilities 15.8% 23.8% 17.1%
Sem
i-
skil
led
and
Skil
led Count 2170 401 2571
% within Categories of skills 84.4% 15.6% 100.0%
% within Food Facilities 79.6% 73.4% 78.6%
Pro
fess
i
onal
Count 126 15 141
% within Categories of skills 89.4% 10.6% 100.0%
% within Food Facilities 4.6% 2.7% 4.3%
Total
Count 2727 546 3273
% within Categories of skills 83.3% 16.7% 100.0%
% within Food Facilities 100.0% 100.0% 100.0%
Chi-Square Tests 'B'
Measurement Type Value df Asymp. Sig. (2-
sided)
Pearson Chi-Square 22.888a 2 .000
Likelihood Ratio 21.903 2 .000
Linear-by-Linear Association 22.409 1 .000
N of Valid Cases 3273
a. 0 cells (0.0%) have expected count less than 5. The minimum expected count is 23.52.
3.11 Composition of human resource
Composition of human resources has the prominent role in economic development. The economic
development is the function of productivity of resources which is further the function of
composition of workforce. A country is said to be in favorable economic environment, If the stock
of human resource of any country has skilled and educated members in higher proportion. Opposite
is the situation for otherwise cases. The major problem of Nepal that economists have always been
pointing out is the lack of skilled human resources as per the countries requirements. The coming
few paragraphs are devoted to explain the present situations of Nepal regarding transformation on
composition of Human Resource Stock of the country.
3.11.1 Transformation on demand situation
In the last decade vocational training is getting due priority both from government and non
governmental sectors. Several bilateral and multilateral donor agencies are supporting these
activities by investing substantial resources in it. Skill for Employment Project, Enhanced
Vocational and Training (EVENT) Projects and presently Skill Development Projects are some

CTEVT, Research and Information Division 24
Dynamics and Dimensions of Labour Migration from Nepal
notable endeavors for skilling Nepalese from government side. Likewise, Training for
Employment Projects, F-Skills, Skill Nepal and Employment Fund are some notable efforts put
from non-governmental sectors which have great contribution for imparting necessary skills in
people. These collective efforts have largely contributed on transformation of skill-composition of
country's human resources.
A study carried out by CTEVT Research and Information Division in 2010 have explored a
composition of skill in foreign demand. At that time total demand of foreign employment was
composed of 37% unskilled, 26% semi-skilled, 36% skilled and 1% professional. A different
composition of demand was emerged form this analysis which includes 26% unskilled, 35% semi-
skilled, 37% skilled and 2 % professionals. These skill-composition of foreign employment
demand in different time period is depicted in the Chart 3.1 A and B. The demand of skilled
workforces has been found largely replaced by semi-skilled workforce where as the volume of
skilled and professionals workforces are also found slightly increased.
Chart .3.3: Transformation of Demand Composition
Source: Advertisement Analysis, 2013/14
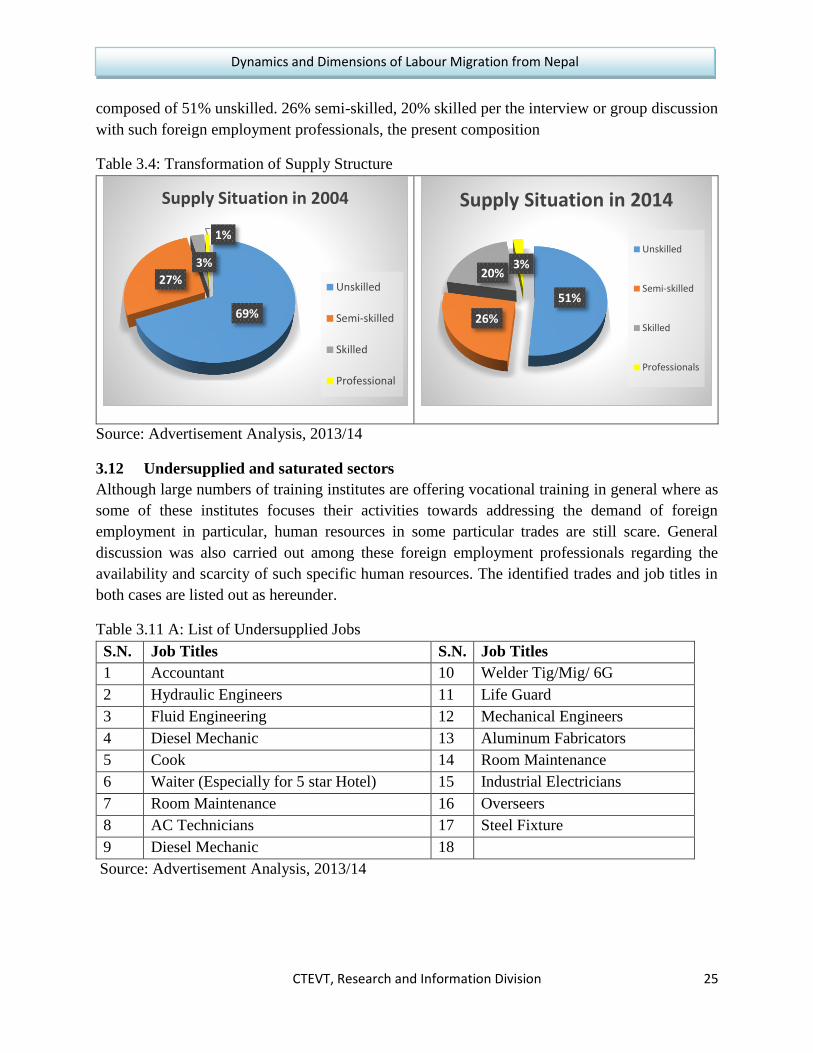
3.11.2 Transformation of supply composition
Neither a proper record system nor a broader study is available to us regarding distribution of
migrant workers by level of levels. Exact status on the dynamics of level of skills is therefore
difficult to figure out. A situation was floated by Dr. Ganesh Bahadur Gurung regarding the skill-
composition of migrant workers which was largely referred in the professional literature since
then. According to Gurung, (2004), the volume of migrant workers at that time was composed of
69% unskilled, 27% Semi-skilled, 3% Skilled and 1% professionals. Some supplementary
information was also collected during this advertisement analysis in the form of personal interview
or discussion with the owner of foreign employment agencies regarding present situation of foreign
employment market for Nepalese workers. Although interviewed group is significantly small
(around 10 peoples), they were asked a written questionnaire about the number and type of workers
left for foreign employment during the last fiscal year including other questions. The obtained data
was compiled, analyzed and aggregated to draw the finding about the skill composition of
Nepalese workforces. The finding of this analysis tells that the present labour migrants from Nepal
CTEVT, Research and Information Division 25
Dynamics and Dimensions of Labour Migration from Nepal
composed of 51% unskilled. 26% semi-skilled, 20% skilled per the interview or group discussion
with such foreign employment professionals, the present composition
Table 3.4: Transformation of Supply Structure
Source: Advertisement Analysis, 2013/14
3.12 Undersupplied and saturated sectors
Although large numbers of training institutes are offering vocational training in general where as
some of these institutes focuses their activities towards addressing the demand of foreign
employment in particular, human resources in some particular trades are still scare. General
discussion was also carried out among these foreign employment professionals regarding the
availability and scarcity of such specific human resources. The identified trades and job titles in
both cases are listed out as hereunder.
Table 3.11 A: List of Undersupplied Jobs
S.N. Job Titles S.N. Job Titles
1 Accountant 10 Welder Tig/Mig/ 6G
2 Hydraulic Engineers 11 Life Guard
3 Fluid Engineering 12 Mechanical Engineers
4 Diesel Mechanic 13 Aluminum Fabricators
5 Cook 14 Room Maintenance
6 Waiter (Especially for 5 star Hotel) 15 Industrial Electricians
7 Room Maintenance 16 Overseers
8 AC Technicians 17 Steel Fixture
9 Diesel Mechanic 18
Source: Advertisement Analysis, 2013/14
69%
27%
3%
1%
Supply Situation in 2004
Unskilled
Semi-skilled
Skilled
Professional
51%
26%
20%3%
Supply Situation in 2014
Unskilled
Semi-skilled
Skilled
Professionals

CTEVT, Research and Information Division 26
Dynamics and Dimensions of Labour Migration from Nepal
Table 3.11 B: List of Saturated Jobs
S.N. Job Titles S.N. Job Titles
1 Mobile Technician 6 General Welder
2 Super Market Technician 7 Electrician
3 Painter 8 Junior Plumber
4 Scaffolding 9 General Mason
5 Finishing Carpenter 10 General Electrician
Source: Field Survey 2014
List of under supplied jobs As per their experiences, the According to the foreign employment
professionals, there are some fields in which the obtained demand is difficult to meet. There are
still lack of such technical human resources in particular fields. In many cases, the requirements
of employers in abroad is not properly address even by the trained workers in the related fields.
This happens due the technology and skill mismatch. The separate list under the both situation is
presented below.

CTEVT, Research and Information Division 27
Dynamics and Dimensions of Labour Migration from Nepal
CHAPTER FOUR
FINDINGS AND CONCLUSION
4.1 Major findings
Presently foreign employment and remittance is justified as a central pillar of Nepalese Economy,
however Nepal is not reaping the desired benefit from the foreign employment sector. The main
gap is the lack of appropriate and sufficient skill in Nepalese Youths. This is the advertisement
analysis which is based on the limited data published by foreign employment professionals as an
advertisement. This published figure therefore may be exaggerated, however this report fully relied
upon this information. The following are the major findings of the analysis carried out in this study.
Unlike the demand of national job market, international job market demands workers with
more specialized and technology intensive skills where working environment is also
different with an extensive use of safety measures.
There is significant variation in the expected salary among the migrant workers. A skilled
worker can expect monthly salary higher by 41% than the expectation of unskilled worker
and corresponding expectation of professional workers is 188% higher.
Although level of skill is the foremost component of income variation among migrant
workers, this is not a single factor for such variation. Type of skill, economic and social
status of destination country, and educational qualification of migrant workers are the other
factors that are responsible for income variation.
There is not any significant relationship between expected salary and cost of migration,
however the average cost of migration of unskilled workers is found significantly higher
than that of skilled and professional workers.
Rapid change can be observed in the skill composition of Nepalese migrant workers in
recent years. The proportion of unskilled workers is decreased by 18 percentage point
between 2004 to 2014, where as corresponding figures of skilled and professional workers
increased by 17 and 1 percentage point with in the same period of time.
Nepalese foreign employment professionals have received increasing demand of skilled
workers in recent years. This is also creating pressure to increase the supply of workers
accordingly, however the capacity of training institutes in Nepal are not in the position to
satisfy the received demand.

CTEVT, Research and Information Division 28
Dynamics and Dimensions of Labour Migration from Nepal
Skilled workers gets not only the higher level of salary but also other facilities. The Chi-
square test for association between food facility and level of skills of migrant workers
justifies the positive association between these two variables.
4.2 Conclusion
There is a perfect interconnection among skills training, income level of migrants and remittance
to the country. Although remittance is the bad choice to sustain the economy among the presently
available worst choices, this can also be considered as a silver lining in the black cloud. We can
make people skilled if or if not stop them from migration, in both case, skills training will be
profitable for the nation.
All migrations are not bad but the culture of migration is always bad. If a person migrates either
internally or externally, to capitalize his potentials this may be a welcome effort. But those types
of migration must be discouraged who migrates to gulf to work in agriculture leaving his own land
barren. The later type of migration culture which is proliferating in recent years is becoming huge
economic as well as social challenge of the Nation.
Skills training always augments the potentials, enhances productivity thus widens the economic
horizons of not only individuals but nation in totality. But majority of graduates of presently
available training programs neither gets the employment opportunities in the country nor satisfy
the needs of abroad demand. Reason is simple, the aspect of training quality and needs of labour
market are not getting due emphasis in every phase from designing to implementation.
4.3 Recommendations
Based on the above conclusion and findings, some points are recommended regarding this issues
and as per the objectives of the study. These points are listed out as hereunder.
There seems mismatch between demand and supply of skilled workforce in foreign
employment sectors. Scarcity of skilled workforce is still the problem in some trades
however some trades are found already saturated in terms of numbers of graduates.
Type and number of training should always be the matter of revision in every couple
of years.
Safer migration is the function of education and training which includes both hard skills
and soft skills. Both skills should be provided as single package. The orientation
training provided by Foreign Employment Promotion Board should be linked up with
the skills training provided under various institutes under training.
The skilled workers not only expect to earn higher income from foreign employment
but also expect to migrate in low cost and enjoy secured jobs, but unskilled workers are

CTEVT, Research and Information Division 29
Dynamics and Dimensions of Labour Migration from Nepal
hardly found motivated to take training before flying to abroad. Those people make
aware as a mission about such benefit of training.
Tight provision should be incorporated in Foreign Employment Act 2064 regarding "
Skill-Certificate for Skill-Job" and implemented according.
The foreign employment professionals are encouraged to publish the detail information
regarding the level of skills among other factors.

CTEVT, Research and Information Division 30
Dynamics and Dimensions of Labour Migration from Nepal
REFERENCES
CBS, (2008). Nepal labour force survey-2008. Kathmandu, Nepal. Central Bureau of Statistics.
CBS, (2011). Nepal living standard survey-2010/11. Kathmandu, Nepal. Central Bureau of
Statistics.
GoN, (2056). National labour policy 2056. Kathmandu. Government of Nepal.
GoN, (2062). Labour and Employment Policy 2062. Kathmandu.Government of Nepal.
GoN, (2064). Foreign Employment Act. 2064. Kathmandu. Government of Nepal.
Kaufman, B.E. & Hotchkiss, J.L. (2003). Labour market economics. South Western, Cengage
Learning. New Delhi, India.
Kayastha, N. L.(2002).Nepalese migrant workers and remittance economy of Nepal. A paper
submitted to Faculty of Humanities and Social Sciences at Tribhuvan University.
Malla, P. (2009). Foreign employment and remittance in Nepal, Economic Journal of Nepal
125(32)No.1
MoF, (2011). Economic survey, fiscal year 2010/2011. Ministry of Finance. Kathmandu.
MoLTM, (2010). Foreign employment remittance and its contribution to economy of Nepal.
Kathmandu, Nepal. International Organization for Migration
NPC, (2008). Eighth development plan (199--1997). National Planning Commission, Nepal.
Kathmandu.
Rimal, B. & Upadhyaya, U. (1999). National labour policy. Kathmandu. GEFONT-Nepal.
SAWTEE & Action Aid Nepal, (2007). A review of trade and industrial policy of Nepal
(2007(3)). UNDP, Nepal. Kathmandu.
WEF, (2008). Global competitiveness report 2007/08. Geneva, Switzerland. World Economic
Forum.
WEF, (2012). Global competitiveness report 2011/12. Geneva, Switzerland. World Economic
Forum.

CTEVT, Research and Information Division 31
Dynamics and Dimensions of Labour Migration from Nepal
ANNEXES
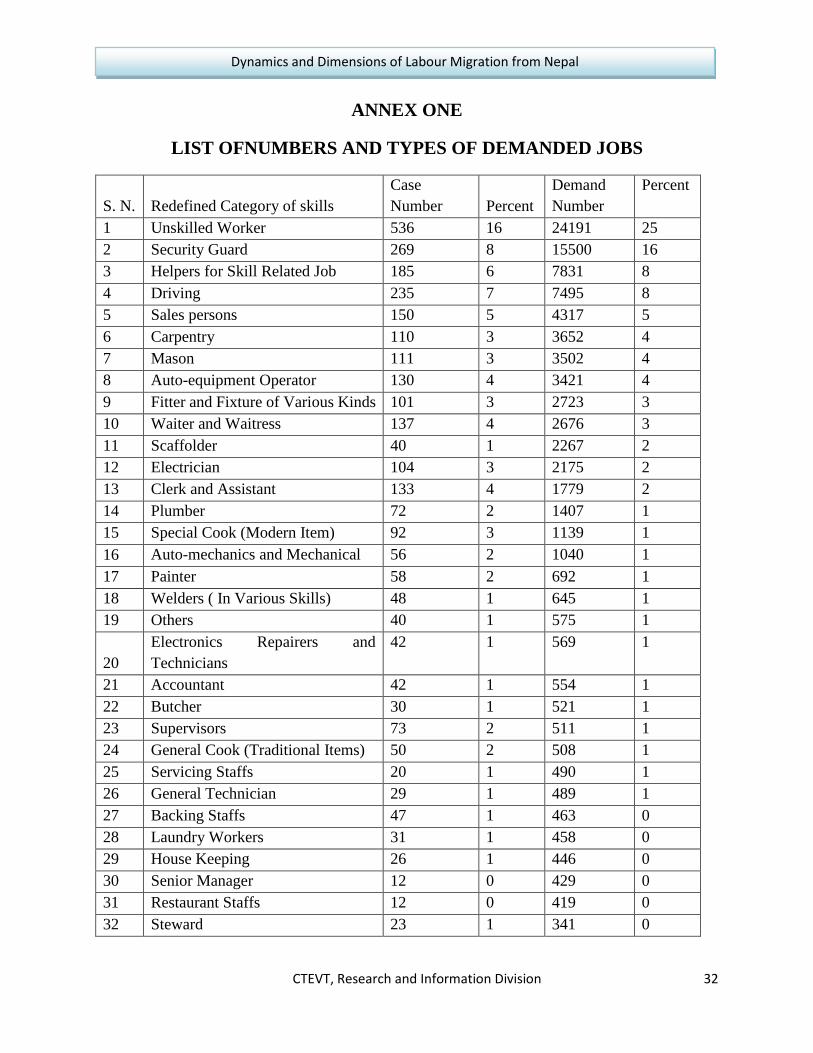
CTEVT, Research and Information Division 32
Dynamics and Dimensions of Labour Migration from Nepal
ANNEX ONE
LIST OFNUMBERS AND TYPES OF DEMANDED JOBS
S. N. Redefined Category of skills
Case
Number Percent
Demand
Number
Percent
1 Unskilled Worker 536 16 24191 25
2 Security Guard 269 8 15500 16
3 Helpers for Skill Related Job 185 6 7831 8
4 Driving 235 7 7495 8
5 Sales persons 150 5 4317 5
6 Carpentry 110 3 3652 4
7 Mason 111 3 3502 4
8 Auto-equipment Operator 130 4 3421 4
9 Fitter and Fixture of Various Kinds 101 3 2723 3
10 Waiter and Waitress 137 4 2676 3
11 Scaffolder 40 1 2267 2
12 Electrician 104 3 2175 2
13 Clerk and Assistant 133 4 1779 2
14 Plumber 72 2 1407 1
15 Special Cook (Modern Item) 92 3 1139 1
16 Auto-mechanics and Mechanical 56 2 1040 1
17 Painter 58 2 692 1
18 Welders ( In Various Skills) 48 1 645 1
19 Others 40 1 575 1
20
Electronics Repairers and
Technicians
42 1 569 1
21 Accountant 42 1 554 1
22 Butcher 30 1 521 1
23 Supervisors 73 2 511 1
24 General Cook (Traditional Items) 50 2 508 1
25 Servicing Staffs 20 1 490 1
26 General Technician 29 1 489 1
27 Backing Staffs 47 1 463 0
28 Laundry Workers 31 1 458 0
29 House Keeping 26 1 446 0
30 Senior Manager 12 0 429 0
31 Restaurant Staffs 12 0 419 0
32 Steward 23 1 341 0

CTEVT, Research and Information Division 33
Dynamics and Dimensions of Labour Migration from Nepal
S. N. Redefined Category of skills
Case
Number Percent
Demand
Number
Percent
33 Fish Monger 5 0 210 0
34 Metal Worker 9 0 175 0
35 Sand Blaster 8 0 160 0
36 Chef 31 1 157 0
37 Reinforce Fitter 7 0 152 0
38 Ductman 6 0 148 0
39 Health and Fitness 32 1 142 0
40 Engineers and equivalent 40 1 141 0
41 Care Taker 5 0 95 0
42 Foreman 21 1 93 0
43 Receptionist 20 1 76 0
44 Commis (Comprising different level) 8 0 71 0
45 Room Attendant 8 0 66 0
46 Bar Attendant 10 0 59 0
47 Beautician 12 0 47 0
48 Agriculture Technicians 2 0 32 0
49 Therapist 6 0 31 0
50 Glass Worker and Fitter 7 0 25 0
51 Surveyor 6 0 22 0
52 Gardner 8 0 17 0
53 Total 3295 100 95144 100

CTEVT, Research and Information Division 34
Dynamics and Dimensions of Labour Migration from Nepal
ANNEX TWO
SALARY BY NATURE OF JOBS
S. N. Type of Jobs
Demanded
Cases Expected Salary
1 Engineers ( Engineers in various trades) 40 116733.35
2 Managing Supervisors (Higher Level) 47 79958.28
3 Senior Manager (Including Project
Manager)
12 62235.67
4 Foreman 21 60846.31
5 Chef 31 58653.52
6 Health and Fitness 32 48895.31
7 Receptionist 20 47138.95
8 Beautician 12 46360.33
9 Others 40 45986.65
10 Backing Staffs 47 45914.72
11 Driving 235 45237.14
12 Auto-equipment Operator 130 45052.93
13 Accountant 42 44417.83
14 Supervisors 26 44105.96
15 Clerk and Assistant 133 42049.49
16 Security Guard 269 40599.19
17 Special Cook (In Modern Item) 92 40524.04
18 House Keeping 26 40164.92
19 Auto-mechanics and Mechanical 56 39483.94
20 Electronics Repairers and Technicians 42 39403.48
21 General Cook (In Traditional Item) 50 38915.74
22 Sales Persons (Sales and Marketing) 150 38539.02
23 Servicing Staffs 20 38358.15
24 General Technician 29 37162.72
25 Electricians 104 36267.48
26 Welders (Incorporating Various Technologies) 48 35394.03
27 Waiter and Waitress 137 35302.55
28 Butcher 30 35185.83
29 Fitter and Fixture(Pipe /Aluminum & Steel) 101 33840.85
30 Painter 58 33798.01
31 Laundry Workers 11 33041.18
32 Carpentry 110 32556.04

CTEVT, Research and Information Division 35
Dynamics and Dimensions of Labour Migration from Nepal
S. N. Type of Jobs
Demanded
Cases Expected Salary
33 Bar Attendant 10 32265.20
34 Plumber 72 32254.51
35 Scaffolding 40 31000.92
36 Mason 111 30752.50
37 Skilled helper 185 28313.52
38 Unskilled worker 536 27268.33
39 Steward 23 25436.87
40 Laundry Helper 20 24210.50

CTEVT, Research and Information Division 36
Dynamics and Dimensions of Labour Migration from Nepal
ANNEX THREE
QUESTIONNAIRE FOR QUALITATIVE DATA COLLECTION
cGt/fli6«o >dahf/sf] dfu Pj+ g]kfnL hgzlQm lar ;Lksf] cGt/
a}b]lzs /f]huf/ Jofj;foLx? ;+u lng] hfgsf/Lx?sf] af/]df k|ZgfjnL
!= pQ/bftfsf] gfd M
@= ;DjlGwt lgsfosf] gfd / 7]ufgf M =====================================================
#= :yfkgf jif{ M
+++———————— +++———————— +++———————— +++—————k|ZgfjnL———————— +++————————+++————
! oxfFsf] /f]huf/ sDkgLaf6 ut aif{df j}b]lzs /f]huf/df ;+nUg sfdbf/x?sf] ;+Vof slt
lyof] <
l;=g+
kbsf] gfd Joj;fosf] gfd s'n
;+Vof
bIftfsf] tx -k|ltztdf_
pRr bIf bIf cw{bIf cbIf
!
@
#
$
%
@= oxfFsf] cg'ejdf dfu pRr ePsf] t/ g]kfndf pQm ;Lko'Qm hgzlQmsf] cefj ePsf]
sDtLdf kfFraf6 Jofj;fo÷kbsf] gfd pNn]v ul/lbg' xf]nf .
!= =============================== @= ==========================================
#= ================================== $= =========================================
%= ================================== ^= =================================================

CTEVT, Research and Information Division 37
Dynamics and Dimensions of Labour Migration from Nepal
#= oxfFsf] cg'ejdf dfu Go"g ePsf] t/ g]kfndf pQm ;Lko'Qm hgzlQm kof{Kt dfqfdf /x]sf
kfFraf6 Jofj;fo ÷kbsf] gfd pNn]v ul/lbg' xf]nf .
!= =============================== @= ==========================================
#= ================================== $= =========================================
%= ================================== ^= =================================================
$= g]kfndf lnPsf] tfnLd cGt/fl6«o >dahf/df ;Dkfbg ug'{kg]{ sfo{;+u ;fdGhZotf eP
gePsf] af/]df oxfFsf] s:tf] hfgsf/L /x]sf] 5 <
Jofj;fosf] gfd >dahf/ ;u+sf] ;Lksf] cGt/
!=
@=
#=
$=
%=
!=
@=
#=
$=
%=
%= a}b]lzs /f]huf/Lsf] nflu >d zlQmsf] dfusf] k|j[ltdf ljut s]xL aif{ b]lv s:tf] kl/jt{g
dxz'; ug'{ ePsf] 5 <
=================================================================================================================================
CTEVT, Research and Information Division 38
Dynamics and Dimensions of Labour Migration from Nepal
^= oFxfsf] jLrf/df at{dfg cj:yfdf j}b]lzs /f]huf/Lsf] If]qsf ;Lk / tfnLd ;+u ;DjlGwt
d'Vo ;d:ofx? Pj+ To;sf ;dfwfgsf pkfox? s] s] xf]nfg <
;d:ofx? ;dfwfgsf ;+efljt pkfox?
!=
@=
#=
$=
%=
!=
@=
#=
$=
%=
&= kl/ifb\sf] sfo{If]q Pj+ o; cg';Gwfg ;+u ;DjlGwt ljifodf cGo s]xL ;'emfj lbg rfxfg'x'G5
ls <
oxfFsf] cd'No ;do tyf ljrf/sf nflu kl/ifb\sf tkm{af6 xflb{s wGojfb .
Related Documents