Part III: Tools and Techniques for TQM Dr. Ayham Jaaron Second Semester 2010/2011

Part III: Tools and Techniques for TQM Dr. Ayham Jaaron Second Semester 2010/2011.
Dec 24, 2015
Welcome message from author
This document is posted to help you gain knowledge. Please leave a comment to let me know what you think about it! Share it to your friends and learn new things together.
Transcript

Part III: Tools and Techniques for TQM
Dr. Ayham JaaronSecond Semester 2010/2011

TQM Tools and Techniques
These tools can be broadly divided into two categories:
a) Tools for Quality Planning. b) Tools for Continuous Improvement.
Tools for Quality Planning.
1. Quality Function Deployment (QFD).2. Concurrent Engineering (CE).3. The New Seven Management & Planning
Tools

1) Quality Function Deployment (QFD)
• A system to translate customer requirements into appropriate company requirements at every stage, from research through design, manufacturing, distribution, marketing sales and services
• The main features of QFD are a focus on meeting market needs by using actual customer statements (referred to as the "Voice of the Customer"), its effective application of multidisciplinary teamwork and the use of a comprehensive matrix (called the "House of Quality") for documenting information, perceptions and decisions.

The QFD Approach

The QFD Planning

House of Quality (HOQ)
Is a matrix which serves to describe the transition from a list of customer requirements, the what, to a list of considerations as to “how “ the requirements will be met.
The relationship between the what and the how is represented by symbols :
• Triangle for weak relationship• Circle for medium relationship• Two concentric circles for strong relationship

HOQ

HOQ: Example

The QFD organizational Structure
A teamwork must be established to develop an efficient QFD including the functions:
MarketingDesignQualityTechnologyProduction LogisticsSuppliers

The QFD organizational Structure
Every function participate in the work team, reporting to a Project Leader, nominated for each product or program.
The work team for every function should not exceed the number of seven people, to respond quickly to the requirements to be met

The QFD organizational Structure
There are also disadvantages and risks applying the QFD method, compared with the traditional hierarchical approach:
1. Construction of long and complex tables of data difficult to handle
2. Confusion in defining customer requisites
3. Risk of misunderstanding the customer requirements
4. Incorrect data given the difficulty to classify requirements
5. Difficult correlation between customer needs and technical characteristics of the product

The QFD Usage Benefits
The most renowned benefit of QFD usage is its ability to:
Generate and maintain involvement within thework team over the whole product development
cycle

The QFD Usage Benefits ( Cont.)
• The first benefit of QFD is the solution of 3 main problems:
1. The customer’s voice was held to be of no account
2. Loss of information during the cycle of product development
3. Different interpretation by the various departments on technical specifications

The QFD Usage Benefits...cont.
• Reduced time to market • Reduction in design changes • Decreased design and manufacturing costs • Improved quality • Increased customer satisfaction• Notable improvement in planning cycles• Creation of a solid platform of basic knowledge thus
creating a data bank storing important information for future products
Applying QFD
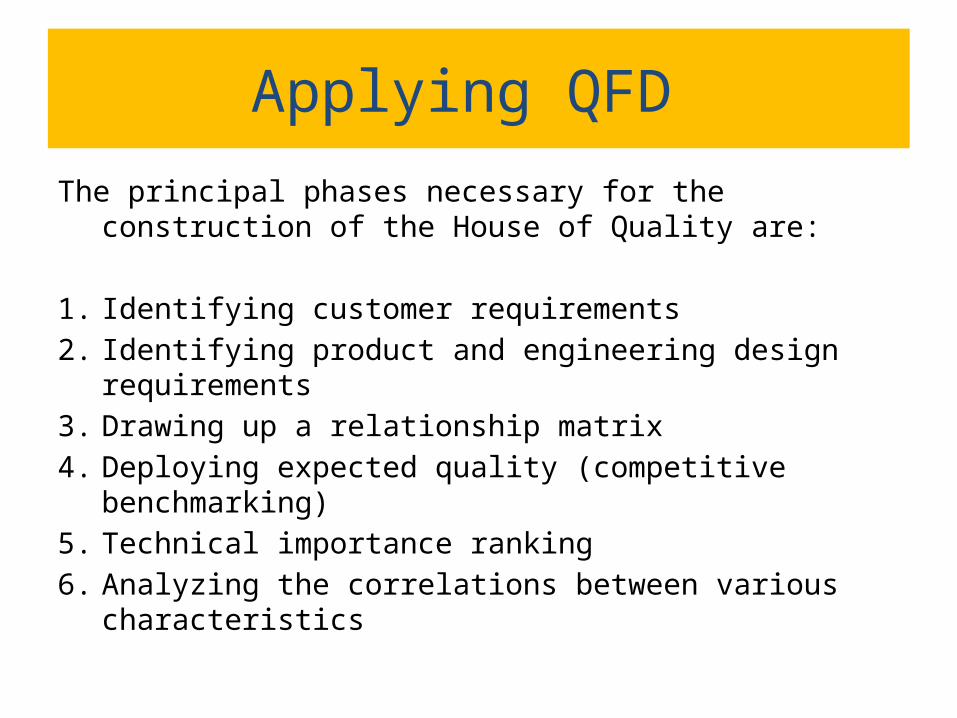
The principal phases necessary for the construction of the House of Quality are:
1. Identifying customer requirements
2. Identifying product and engineering design requirements
3. Drawing up a relationship matrix
4. Deploying expected quality (competitive benchmarking)
5. Technical importance ranking
6. Analyzing the correlations between various characteristics
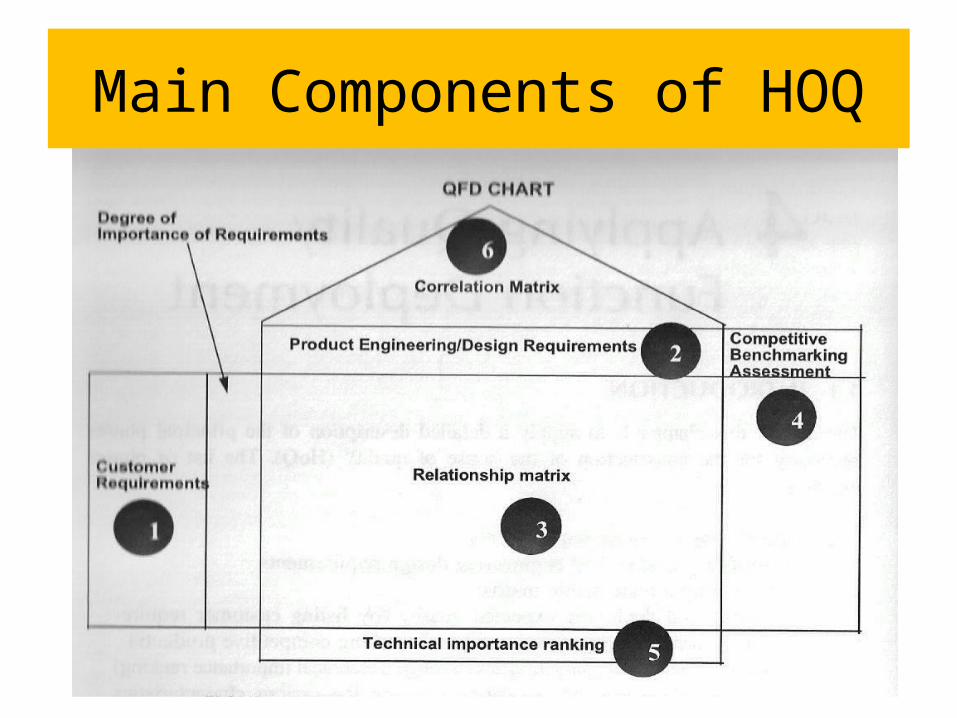
Main Components of HOQ

Applying QFD
• The raw data obtained from customers are called the voice of the customer ( VoC ) and represents the requirements of customers/users
• The QFD specialists rewrite the VoC into reworded data that become the technical specifications, to give the users greater satisfaction

Applying QFD
• The ranking order of the requirements is also identified: a cluster is prepared according to team’s members opinions
• An example of clustering requirements is given for a Portable Instrument for a Remote Control of a Model Aircraft

Applying QFD: Example

Techniques used to determine customer requirements:
1. Personal interviews :empirically it has been found
that 20-30 persons interviewed are enough2. Focus groups : 6 to 8 customers put together in a
meeting lasting 2 hours3. Qualitative techniques :the customers are
requested to choose the products most similar and the ones most different
4. Product analysis techniques : customers are requested to say how they buy, use, and evaluate a single product
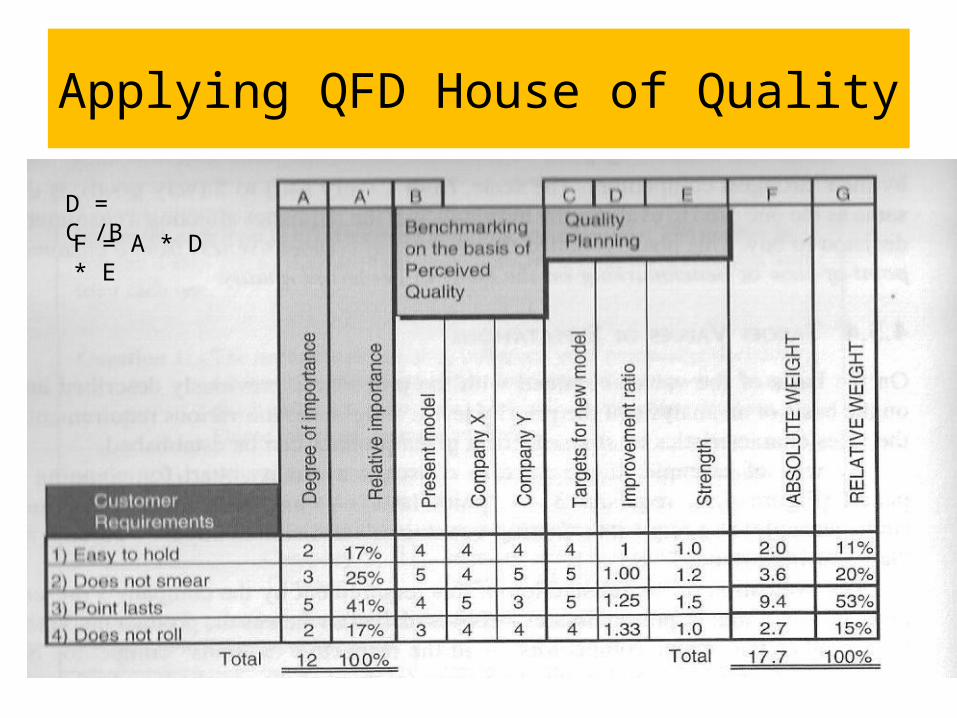
Applying QFD House of Quality
D = C /B
F = A * D * E

2) Concurrent Engineering ( CE )
Is a systematic approach to the integrated design of products and their processes including manufacture and support
The target of CE is to improve the design phase of a product , considering :
the costs of production aesthetics Producibility assemblability, maintainability and
recyclability

Tools for Design Quality /CE
Tools are divided in four Macro areas:1. Market Studies for an estimation of actual
and potential market dimensions2. Design activities focused toward:• Function analysis• Costs benefit analysis• Planning & scheduling ( Project Management)• Creative group methods ( brainstorming)• Problem solving

Tools for Design Quality/CE
3. Detail design activities tools:• CAD ( Computer aided design )• CAE ( Computer aided engineering )• CAM ( Computer aided manufacturing )• CAT ( Computer aided testing )

Tools for Design Quality/CE
4. Process design verification :Includes:• Rapid prototyping ( CAD 3D system )• Variety reduction• Change management• Documentation management• Design review

3) The Seven Management & Planning Tools
• The following are some of the most common TQM tools in use today.
• Each is used for, and identifies, specific information in a specific manner.
• It should be noted that tools should be used in conjunction with other tools to understand the full scope of the issue being analyzed or illustrated.

Pie Charts and Bar Graphs
• Used to identify and compare data units as they relate to one issue or the whole, such as budgets… etc.
• Histograms To illustrate and examine various data element
in order to make decisions regarding them.Effective when comparing statistical, survey, or
questionnaire results.
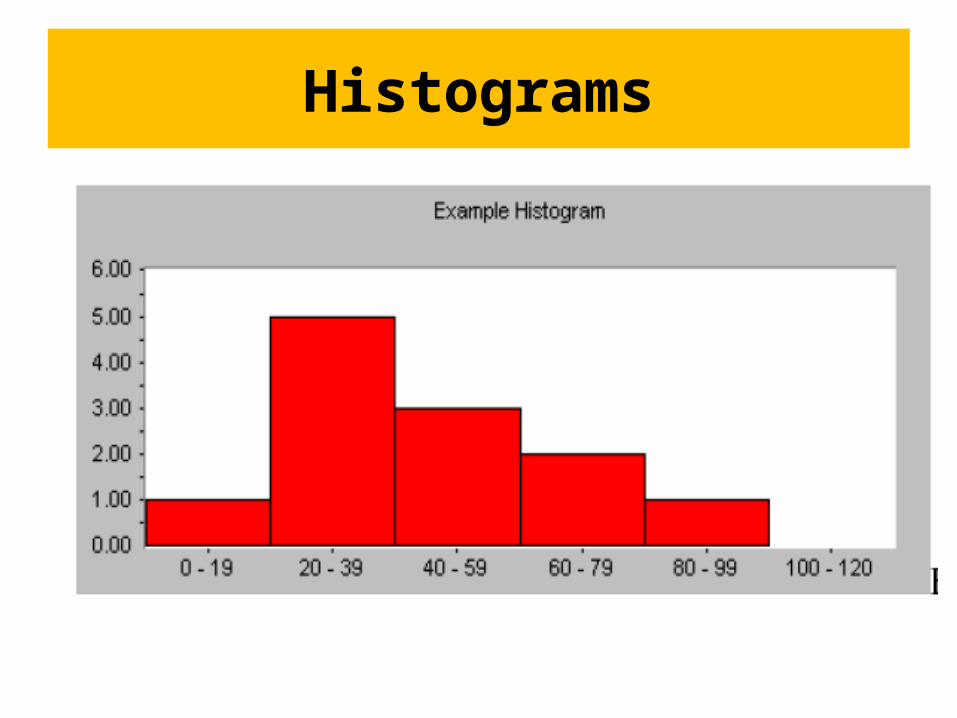
Histograms

Pareto Charts / Analysis (designed by Vilfredo Pareto)
• Rates issues according to importance and frequency by prioritizing specific problems or causes in a manner that facilitates problem solving.
• Identify groupings of qualitative data, such as most frequent complaint, most commonly purchased preservation aid, etc. in order to measure which have priority
• Can be scheduled over select periods of time to track changes. They can also be created in retrospect, as a before and after analysis of a process change.

Pareto Charts

Cause and Effect, Ishikawa or Fishbone Diagrams
• Illustrates multiple levels of potential causes (inputs), and ultimate effects (outputs), of problems or issues that may arise in the course of business.
• May be confusing if too many inputs and outputs are identified. An alternative would be a tree diagram, which is much easier to follow.

Fishbone Diagrams

Flowcharts and Modelling Diagrams
• Assist in the definition and analysis of each step in a process by illustrating it in a clear and comprehensive manner.
• Identify areas where workflow may be blocked, or diverted, and where workflow is fluid.
• Identify where steps need to be added or removed to improve efficiency and creates tandardized workflow.
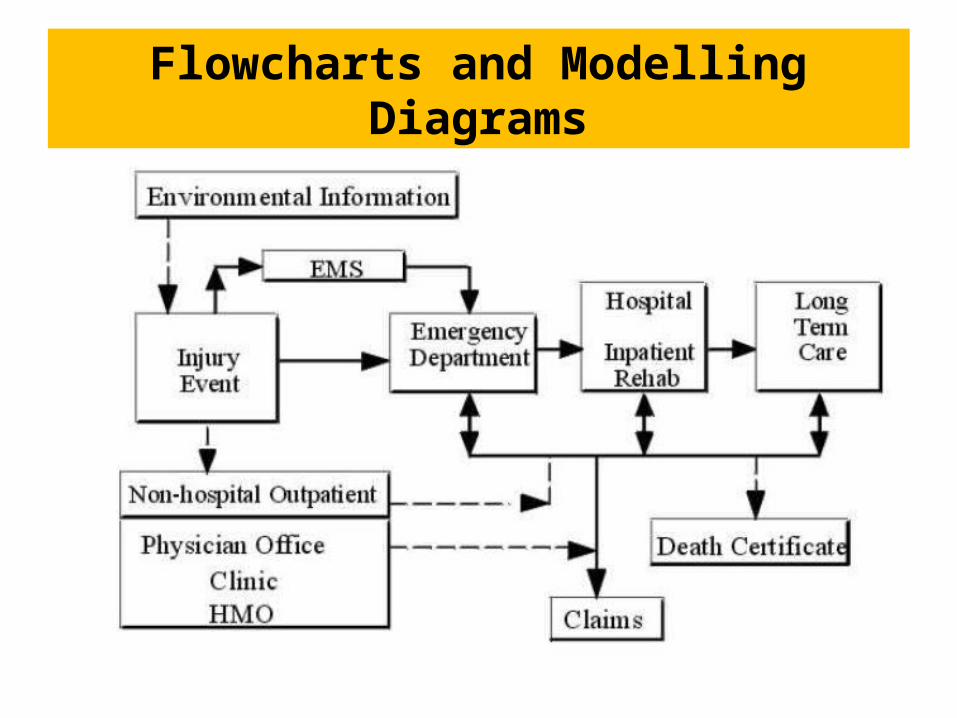
Flowcharts and Modelling Diagrams
Relations Diagram
• To understand the relationships between various factors, issues, events, etc. so as to understand their importance in the overall organizational view.

Scatter Diagram
• To discover cause and effect relationships, as well as bonds and correlations, between two variables
• To illustrate and validate hunches• To chart the positive and negative direction of
relationships
Related Documents