PAKISTAN POLICY NOTE—MOBILIZING REVENUE 1 Pakistan Policy Note 16 Jose R. Lopez-Calix and Irum Touqeer Mobilizing Revenue THE WORLD BANK GROUP SOUTH ASIA REGION JUNE 2013 This note reviews key shortcomings in Pakistan’s rev- enue mobilization system and provides directions for revitalizing it and raising collection by 3–4 percent- age points of GDP over the next five years. Pakistan has one of the world’s lowest tax ratios, stemming from five main weaknesses: complexity, a narrow tax base, low compliance, inefficient tax administra- tion, and low and declining provincial tax revenues. Complexity provides scope for discretion and corrup- tion. A narrow tax base and low compliance are the outcomes of inequitable exemptions and preferential treatments, low tax registration or filing, and mas- sive tax evasion by potential taxpayers that prefer to stay informal. Provincial taxation is low and declin- ing. For its part, nontax revenue is also declining. Proposed reforms aim for a tax system that is broad, simple, and equitable, that facilitates tax- payer registration and compliance, and that pro- motes provincial revenue efforts commensurate with their new expenditure responsibilities. This implies implementing effective tax policy and administra- tion, particularly eliminating exemptions and zero rates to broaden the base, adjusting income tax rates, simplifying tariffs, expanding user-friendly electronic registration and filing, enforcing a zero-tolerance policy for noncompliance and evasion, and overhaul- ing the technical capacity and accountability of Fed- eral Board of Revenue staff, especially in information technology systems, auditing, and enforcement. At the provincial level, this implies introducing incen- tives for collecting provincial taxes, enhancing the capacity of tax administration, and updating selected rates. In this regard, broadening the general sales tax on services, collecting the motor vehicle tax more efficiently, and revamping the property tax would be desirable. One of Pakistan’s major challenges is to expand government revenues. The economy is structur- ally weak on the revenue front, as evidenced by large and recurrent fiscal deficits, financed with loans from commercial banks or the State Bank of Pakistan, which until recently contributed to double-digit inflation. Rev- enue collection—at 12.5 percent of GDP in 2010/11—is much lower than averages for the world, South Asia, and emerging and develop- ing countries (Figure 1). The tax to GDP ratio, declining from a 10.8 percent average in the 2000s to a bottom 9.6 percent in 2010/11, is now among the world’s lowest. The authorities need to address this to raise public investment and secure stronger growth and develop- ment. Indeed, public investment also fell, from 5.6 percent of GDP in 1999/2000 to 2.6 percent in 2010/11. The public debt burden is above the upper limit allowed by the Fiscal Responsibility Bill, and the fis- cal space is shrinking. With inadequate tax reve- nues, to create fiscal space the government has relied increasingly on high nontax revenues (Figure 2), but since 2009 this source has also declined—due to falling State Bank of Paki- stan profits, defense receipts (coalition support funds from the U.S. government for military expenditures), and dividends from state-owned enterprises. 1 The wide fiscal deficits reached 8.5 percent of GDP in 2011/12, the financing of which added to a public debt burden that exceeded the 60 percent of GDP ceiling allowed by the country’s Fiscal Responsibility Bill (Fig- ure 3). More important, despite a benevolent Public Disclosure Authorized Public Disclosure Authorized Public Disclosure Authorized Public Disclosure Authorized Public Disclosure Authorized Public Disclosure Authorized Public Disclosure Authorized Public Disclosure Authorized

Welcome message from author
This document is posted to help you gain knowledge. Please leave a comment to let me know what you think about it! Share it to your friends and learn new things together.
Transcript
P a k i s t a n P o l i c y n o t e — M o b i l i z i n g R e v e n u e
1
Pakistan Policy Note 16
Jose R. Lopez-Calix and Irum Touqeer
Mobilizing Revenue
TH
E W
OR
LD
BA
NK
GR
OU
P S
OUT
H AS
IA R
EGIO
N JU
NE
20
13
This note reviews key shortcomings in Pakistan’s rev-enue mobilization system and provides directions for revitalizing it and raising collection by 3–4 percent-age points of GDP over the next five years. Pakistan has one of the world’s lowest tax ratios, stemming from five main weaknesses: complexity, a narrow tax base, low compliance, inefficient tax administra-tion, and low and declining provincial tax revenues. Complexity provides scope for discretion and corrup-tion. A narrow tax base and low compliance are the outcomes of inequitable exemptions and preferential treatments, low tax registration or filing, and mas-sive tax evasion by potential taxpayers that prefer to stay informal. Provincial taxation is low and declin-ing. For its part, nontax revenue is also declining.
Proposed reforms aim for a tax system that is broad, simple, and equitable, that facilitates tax-payer registration and compliance, and that pro-motes provincial revenue efforts commensurate with their new expenditure responsibilities. This implies implementing effective tax policy and administra-tion, particularly eliminating exemptions and zero rates to broaden the base, adjusting income tax rates, simplifying tariffs, expanding user-friendly electronic registration and filing, enforcing a zero-tolerance policy for noncompliance and evasion, and overhaul-ing the technical capacity and accountability of Fed-eral Board of Revenue staff, especially in information technology systems, auditing, and enforcement. At the provincial level, this implies introducing incen-tives for collecting provincial taxes, enhancing the capacity of tax administration, and updating selected rates. In this regard, broadening the general sales tax on services, collecting the motor vehicle tax more efficiently, and revamping the property tax would be desirable.
One of Pakistan’s major challenges is to expand government revenues. The economy is structur-ally weak on the revenue front, as evidenced by large and recurrent fiscal deficits, financed with loans from commercial banks or the State Bank of Pakistan, which until recently contributed to double-digit inf lation. Rev-enue collection—at 12.5 percent of GDP in 2010/11—is much lower than averages for the world, South Asia, and emerging and develop-ing countries (Figure 1). The tax to GDP ratio, declining from a 10.8 percent average in the 2000s to a bottom 9.6 percent in 2010/11, is now among the world’s lowest. The authorities need to address this to raise public investment and secure stronger growth and develop-ment. Indeed, public investment also fell, from 5.6 percent of GDP in 1999/2000 to 2.6 percent in 2010/11.
The public debt burden is above the upper limit allowed by the Fiscal Responsibility Bill, and the fis-cal space is shrinking. With inadequate tax reve-nues, to create fiscal space the government has relied increasingly on high nontax revenues (Figure 2), but since 2009 this source has also declined—due to falling State Bank of Paki-stan profits, defense receipts (coalition support funds from the U.S. government for military expenditures), and dividends from state-owned enterprises.1 The wide fiscal deficits reached 8.5 percent of GDP in 2011/12, the financing of which added to a public debt burden that exceeded the 60 percent of GDP ceiling allowed by the country’s Fiscal Responsibility Bill (Fig-ure 3). More important, despite a benevolent
Pub
lic D
iscl
osur
e A
utho
rized
Pub
lic D
iscl
osur
e A
utho
rized
Pub
lic D
iscl
osur
e A
utho
rized
Pub
lic D
iscl
osur
e A
utho
rized
Pub
lic D
iscl
osur
e A
utho
rized
Pub
lic D
iscl
osur
e A
utho
rized
Pub
lic D
iscl
osur
e A
utho
rized
Pub
lic D
iscl
osur
e A
utho
rized
WB456288
Typewritten Text
79583
P a k i s t a n P o l i c y n o t e — M o b i l i z i n g R e v e n u e
2
Figure General government revenue, 2000/01–2011/12
1
0
10
20
30
40
2011/12(projected)
2010/11(estimated)
2009/102008/092007/082006/072005/062004/052003/042002/032001/022000/01
Afghanistan Bangladesh Bhutan India MaldivesNepal Pakistan Sri Lanka World Emerging and developing economies
Perc
ent
of G
DP
Source: World Bank 2012a.
Figure Pakistan’s tax and nontax revenue position
2
5 7 9 11 13 15
World (2001–10)
Latin America (developing, 2000)
South Asia (2000–10)
India (2000–10)
Pakistan (2011/12 estimate)
Pakistan (2010/11)
Pakistan (1999/2000–2009/10)
Tax to GDP ratio (percent)
0.0
0.5
1.0
1.5
2.0
Non
tax
reve
nue
buoy
ancy
Nontax revenue (percent of GDP)
Bhutan
Maldives
Pakistan
Sri Lanka
India
Bangladesh
AfghanistanNepal
0 2 4 6 8 10 12 14
Note: Pakistan’s tax ratio refers to federal revenue. Nonfederal tax revenue is about 0.5 percent of GDP. Buoyancy was calculated using log regression from data spanning a number of years (number of years varied for countries and was based on data availability). Nontax revenue as a share of GDP was based on the latest available GDP or estimates, in most cases 2010.Source: World Bank 2012a; International Monetary Fund database; World Bank staff calculations based on World Bank (2012b).
3
negative differential between real interest rates and growth that points to a decline in the real value of debt given currently high inflation lev-els, the rising primary deficit endangers debt sustainability. The country’s medium-term fiscal space depends less on declining nontax revenue and more on mobilizing additional revenue (with a goal of 3–4 percentage points of GDP in the next five years) to finance the country’s development agenda.
The buoyancy of the country’s tax system is low and declining. Tax buoyancy (for taxes collected by the Federal Board of Revenue, or FBR) decreased from above unity in the 1960s to 0.93 in the 2000s, indicating that tax revenues are growing more slowly than GDP (World Bank 2009, 2012c).2
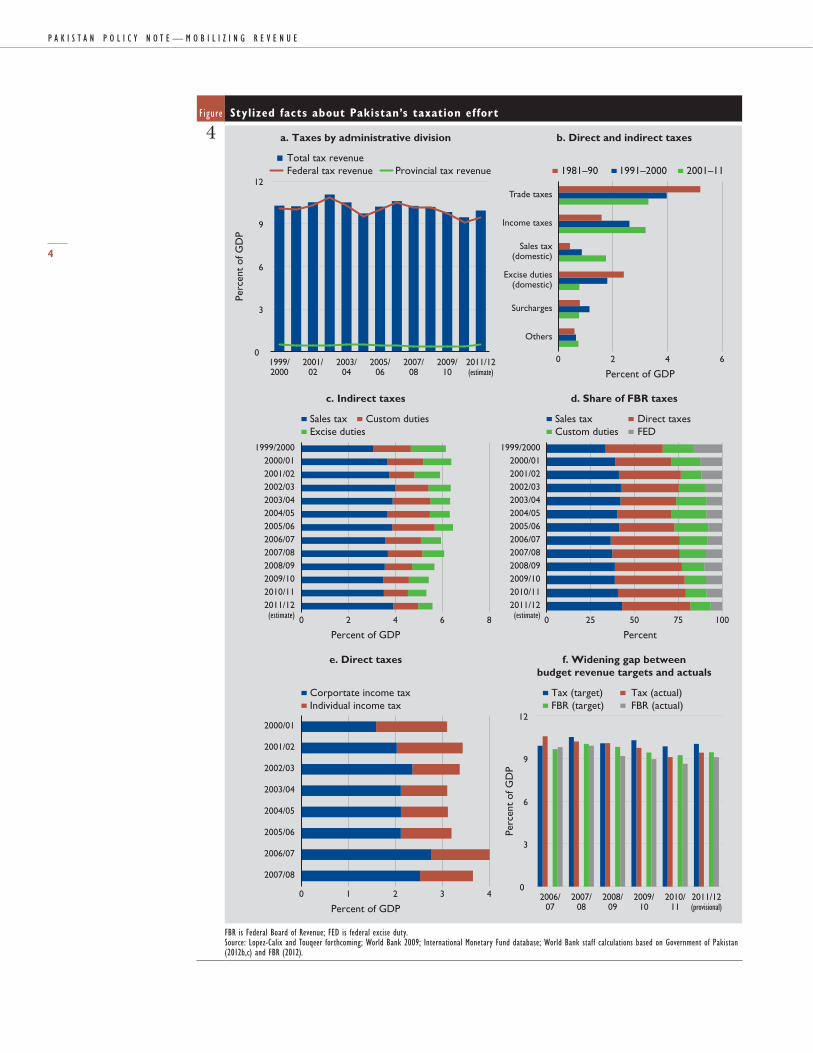
Tax revenues rely mainly on federal taxes, and much less on provincial taxes, but the overall level of fed-eral taxes is low, despite their changing mix. Federal taxes accounted for about 95 percent of total tax revenues in 2010/11, with minimal contri-butions from provincial taxes—0.4 percent of GDP in 2010/11 (Figure 4, panel a).3 The coun-try has, though, moved gradually from trade and excise taxes toward income and sales taxes (panels b, c, and d). However, further efforts are needed to mobilize revenues from corporate and individual income taxes, as well as the sales tax. Moreover, direct taxes are skewed heavily toward corporate income tax (CIT)—which provides disincentives to firms to increase
investment and become more profitable—and biased away from personal income tax, whose revenues are dismal (panel e). Overall, federal revenue collection remains quite low, and the budgeted revenue targets have been missed in recent years (panel f).
Key Shortcomings in Tax Policy and AdministrationPakistan’s tax system underperforms because of a complicated and unfriendly taxpayer sys-tem, a narrow tax base, low compliance, weak and inefficient tax administration, and inad-equate subnational taxation.
Complexity
The taxpayer system is complex. Most of the coun-try’s revenues—customs and general sales tax (GST)—are generated by trade. Customs regu-latory duties are an example of complexity (as are sales and income taxes). The generalized use of statutory regulatory orders (SROs) intro-duces wide deviations between applied and statutory official rates on an extremely disperse range of tax slabs. The 2010/11 tariff schedule, for example, had 17 slabs (16 plus zero rate) under most-favored nation statutory official ad valorem tariffs, ranging from 0 to 150 per-cent and with the greatest frequency (about 40 percent) on or below the low tariff slab of 5 percent. Yet Pakistan effectively applies some 40 tariff slabs and, including SROs and partial exemptions, around 55 percent of the effective
Figure Declining revenues and rising deficits, 2000/01–2011/12
3
2011/12(estimate)
2010/112009/102008/092007/082006/072005/062004/052003/042002/032001/022000/010
3
6
9
12
15
Perc
ent
of G
DP
Overall �scal de�cit Nontax revenue Tax revenue
Source: International Monetary Fund database.
P a k i s t a n P o l i c y n o t e — M o b i l i z i n g R e v e n u e
4
Figure Stylized facts about Pakistan’s taxation effort
4
0
3
6
9
12
Perc
ent
of G
DP
0
3
6
9
12
2011/12(provisional)
2010/11
2009/10
2008/09
2007/08
2006/07
Perc
ent
of G
DP
Percent of GDP
Total tax revenueFederal tax revenue Provincial tax revenue
0 2 4 6
Others
Surcharges
Excise duties(domestic)
Sales tax(domestic)
Income taxes
Trade taxes
1981–90 1991–2000 2001–11
Percent0 25 50 75 100
2011/12(estimate)
2010/112009/102008/092007/082006/072005/062004/052003/042002/032001/022000/01
1999/2000
Sales tax Direct taxesCustom duties FED
Sales tax Custom dutiesExcise duties
Percent of GDP
b. Direct and indirect taxesa. Taxes by administrative division
d. Share of FBR taxesc. Indirect taxes
f. Widening gap betweenbudget revenue targets and actuals
e. Direct taxes
0 2 4 6 8
2011/12(estimate)
2010/112009/102008/092007/082006/072005/062004/052003/042002/032001/022000/01
1999/2000
0 1 2 3 4
2007/08
2006/07
2005/06
2004/05
2003/04
2002/03
2001/02
2000/01
Corportate income taxIndividual income tax
Tax (target) Tax (actual)FBR (target) FBR (actual)
Percent of GDP
2011/12(estimate)
2009/10
2007/08
2005/06
2003/04
2001/02
1999/2000
FBR is Federal Board of Revenue; FED is federal excise duty.Source: Lopez-Calix and Touqeer forthcoming; World Bank 2009; International Monetary Fund database; World Bank staff calculations based on Government of Pakistan (2012b,c) and FBR (2012).
5
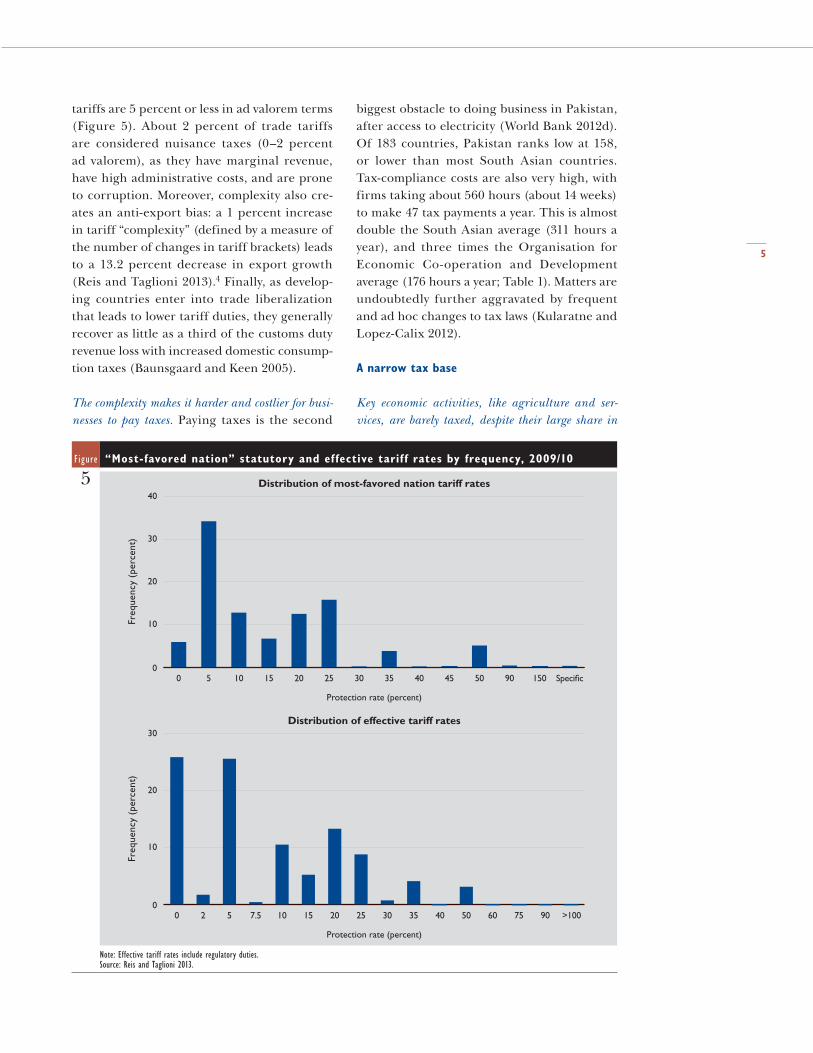
tariffs are 5 percent or less in ad valorem terms (Figure 5). About 2 percent of trade tariffs are considered nuisance taxes (0–2 percent ad valorem), as they have marginal revenue, have high administrative costs, and are prone to corruption. Moreover, complexity also cre-ates an anti-export bias: a 1 percent increase in tariff “complexity” (defined by a measure of the number of changes in tariff brackets) leads to a 13.2 percent decrease in export growth (Reis and Taglioni 2013).4 Finally, as develop-ing countries enter into trade liberalization that leads to lower tariff duties, they generally recover as little as a third of the customs duty revenue loss with increased domestic consump-tion taxes (Baunsgaard and Keen 2005).
The complexity makes it harder and costlier for busi-nesses to pay taxes. Paying taxes is the second
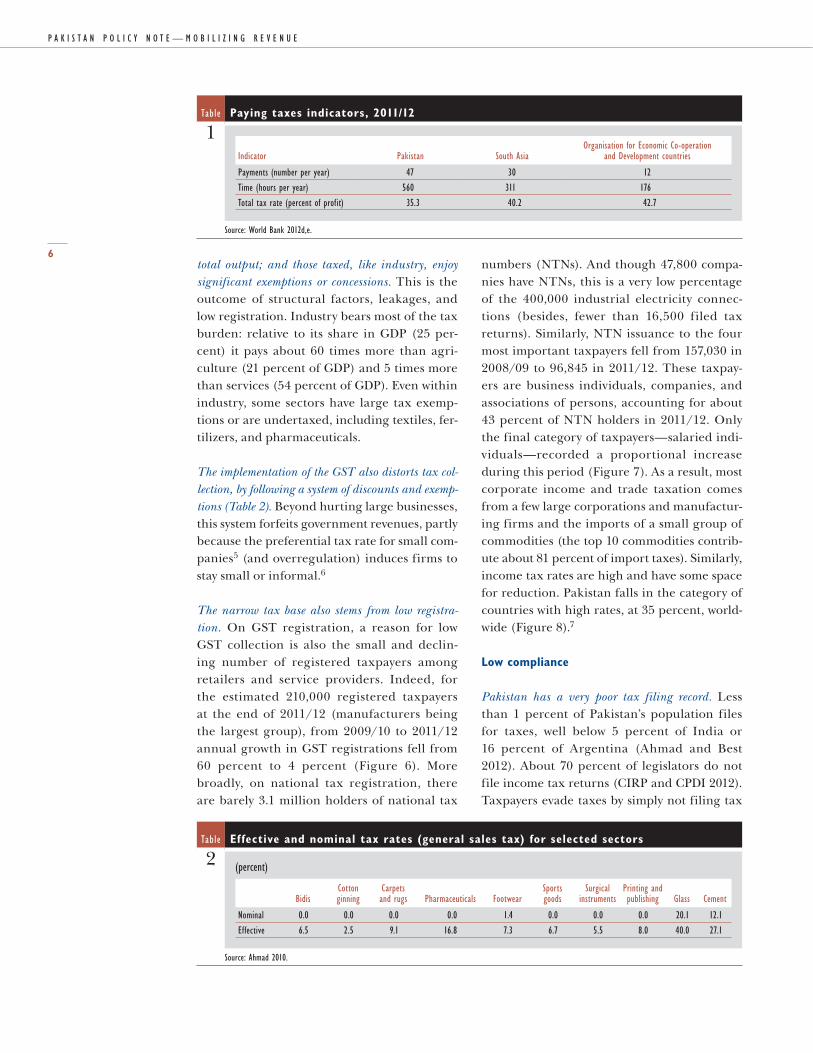
biggest obstacle to doing business in Pakistan, after access to electricity (World Bank 2012d). Of 183 countries, Pakistan ranks low at 158, or lower than most South Asian countries. Tax-compliance costs are also very high, with firms taking about 560 hours (about 14 weeks) to make 47 tax payments a year. This is almost double the South Asian average (311 hours a year), and three times the Organisation for Economic Co-operation and Development average (176 hours a year; Table 1). Matters are undoubtedly further aggravated by frequent and ad hoc changes to tax laws (Kularatne and Lopez-Calix 2012).
A narrow tax base
Key economic activities, like agriculture and ser-vices, are barely taxed, despite their large share in
Figure “Most-favored nation” statutory and effective tariff rates by frequency, 2009/10
5
0
10
20
30
40
Speci�c1509050454035302520151050
Freq
uenc
y (p
erce
nt)
Distribution of most-favored nation tariff rates
Protection rate (percent)
0
10
20
30
>10090756050403530252015107.5520
Freq
uenc
y (p
erce
nt)
Distribution of effective tariff rates
Protection rate (percent)
Note: Effective tariff rates include regulatory duties.Source: Reis and Taglioni 2013.
P a k i s t a n P o l i c y n o t e — M o b i l i z i n g R e v e n u e
6total output; and those taxed, like industry, enjoy significant exemptions or concessions. This is the outcome of structural factors, leakages, and low registration. Industry bears most of the tax burden: relative to its share in GDP (25 per-cent) it pays about 60 times more than agri-culture (21 percent of GDP) and 5 times more than services (54 percent of GDP). Even within industry, some sectors have large tax exemp-tions or are undertaxed, including textiles, fer-tilizers, and pharmaceuticals.
The implementation of the GST also distorts tax col-lection, by following a system of discounts and exemp-tions (Table 2). Beyond hurting large businesses, this system forfeits government revenues, partly because the preferential tax rate for small com-panies5 (and overregulation) induces firms to stay small or informal.6
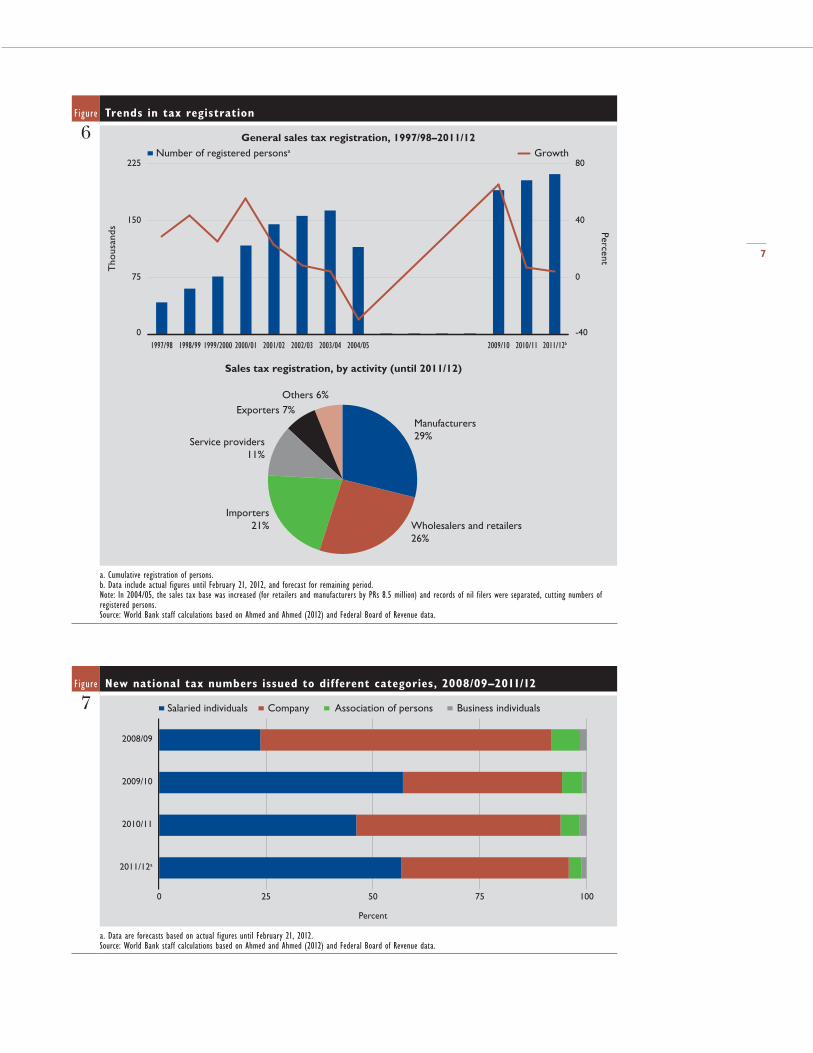
The narrow tax base also stems from low registra-tion. On GST registration, a reason for low GST collection is also the small and declin-ing number of registered taxpayers among retailers and service providers. Indeed, for the estimated 210,000 registered taxpayers at the end of 2011/12 (manufacturers being the largest group), from 2009/10 to 2011/12 annual growth in GST registrations fell from 60 percent to 4 percent (Figure 6). More broadly, on national tax registration, there are barely 3.1 million holders of national tax
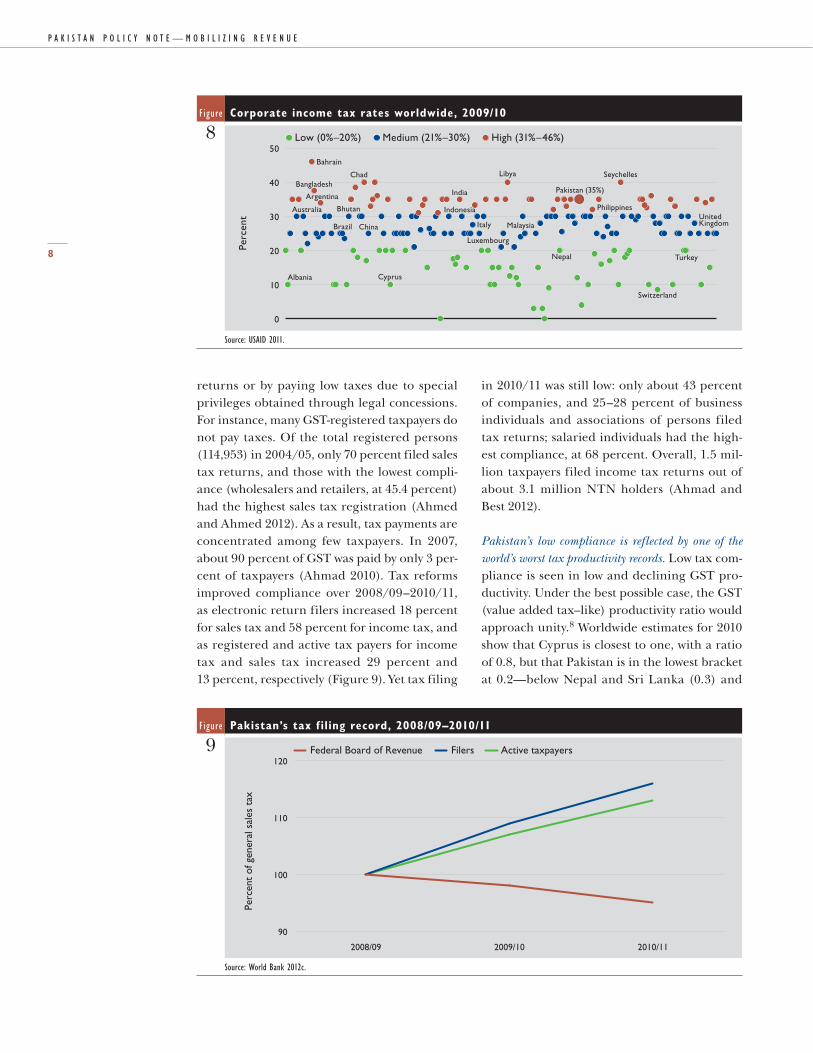
numbers (NTNs). And though 47,800 compa-nies have NTNs, this is a very low percentage of the 400,000 industrial electricity connec-tions (besides, fewer than 16,500 filed tax returns). Similarly, NTN issuance to the four most important taxpayers fell from 157,030 in 2008/09 to 96,845 in 2011/12. These taxpay-ers are business individuals, companies, and associations of persons, accounting for about 43 percent of NTN holders in 2011/12. Only the final category of taxpayers—salaried indi-viduals—recorded a proportional increase during this period (Figure 7). As a result, most corporate income and trade taxation comes from a few large corporations and manufactur-ing firms and the imports of a small group of commodities (the top 10 commodities contrib-ute about 81 percent of import taxes). Similarly, income tax rates are high and have some space for reduction. Pakistan falls in the category of countries with high rates, at 35 percent, world-wide (Figure 8).7
Low compliance
Pakistan has a very poor tax filing record. Less than 1 percent of Pakistan’s population files for taxes, well below 5 percent of India or 16 percent of Argentina (Ahmad and Best 2012). About 70 percent of legislators do not file income tax returns (CIRP and CPDI 2012). Taxpayers evade taxes by simply not filing tax
Table Paying taxes indicators, 2011/12
1Indicator Pakistan South Asia
Organisation for Economic Co-operation and Development countries
Payments (number per year) 47 30 12
Time (hours per year) 560 311 176
Total tax rate (percent of profit) 35.3 40.2 42.7
Source: World Bank 2012d,e.
Table Effective and nominal tax rates (general sales tax) for selected sectors
2 (percent)
BidisCotton ginning
Carpets and rugs Pharmaceuticals Footwear
Sports goods
Surgical instruments
Printing and publishing Glass Cement
Nominal 0.0 0.0 0.0 0.0 1.4 0.0 0.0 0.0 20.1 12.1
Effective 6.5 2.5 9.1 16.8 7.3 6.7 5.5 8.0 40.0 27.1
Source: Ahmad 2010.
7
Figure Trends in tax registration
6
0
75
150
225
2011/12b2010/112009/102004/052003/042002/032001/022000/011999/20001998/991997/98-40
0
40
80
Tho
usan
ds
Number of registered personsa Growth
Percent
General sales tax registration, 1997/98–2011/12
Manufacturers29%
Wholesalers and retailers26%
Importers21%
Service providers11%
Exporters 7%Others 6%
Sales tax registration, by activity (until 2011/12)
a. Cumulative registration of persons.b. Data include actual figures until February 21, 2012, and forecast for remaining period.Note: In 2004/05, the sales tax base was increased (for retailers and manufacturers by PRs 8.5 million) and records of nil filers were separated, cutting numbers of registered persons.Source: World Bank staff calculations based on Ahmed and Ahmed (2012) and Federal Board of Revenue data.
Figure New national tax numbers issued to different categories, 2008/09–2011/12
7
0 25 50 75 100
2011/12a
2010/11
2009/10
2008/09
Percent
Salaried individuals Company Association of persons Business individuals
a. Data are forecasts based on actual figures until February 21, 2012.Source: World Bank staff calculations based on Ahmed and Ahmed (2012) and Federal Board of Revenue data.
P a k i s t a n P o l i c y n o t e — M o b i l i z i n g R e v e n u e
8
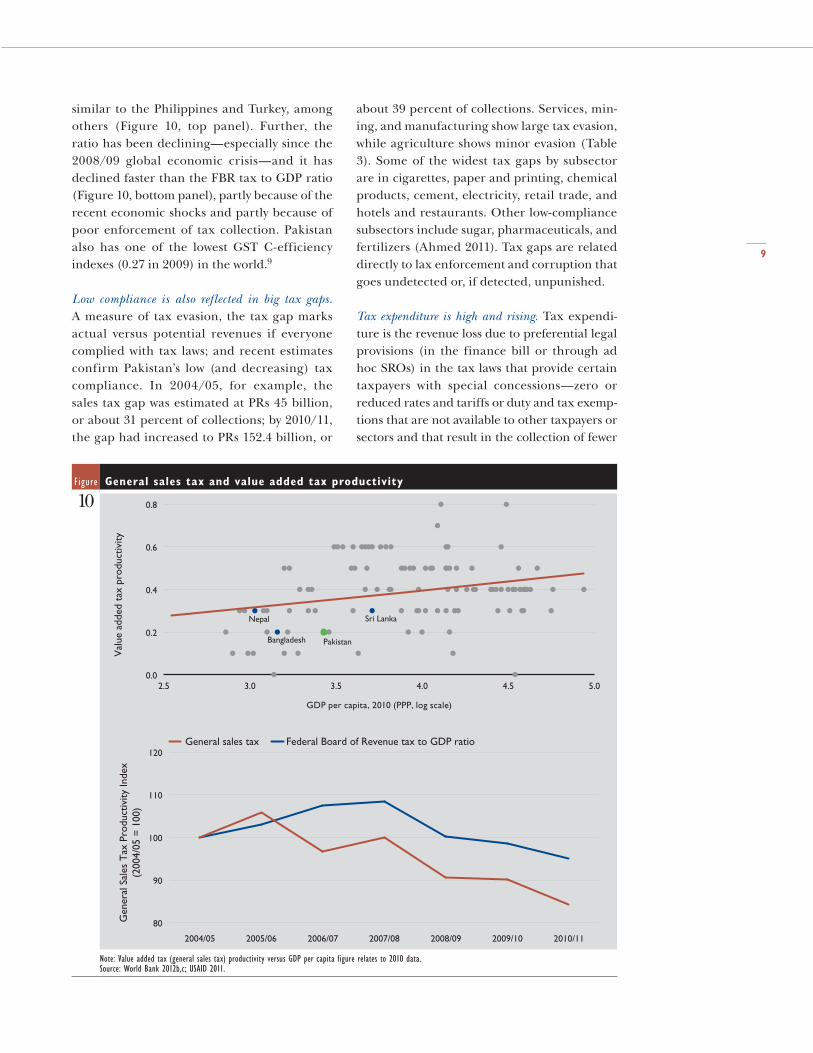
returns or by paying low taxes due to special privileges obtained through legal concessions. For instance, many GST-registered taxpayers do not pay taxes. Of the total registered persons (114,953) in 2004/05, only 70 percent filed sales tax returns, and those with the lowest compli-ance (wholesalers and retailers, at 45.4 percent) had the highest sales tax registration (Ahmed and Ahmed 2012). As a result, tax payments are concentrated among few taxpayers. In 2007, about 90 percent of GST was paid by only 3 per-cent of taxpayers (Ahmad 2010). Tax reforms improved compliance over 2008/09–2010/11, as electronic return filers increased 18 percent for sales tax and 58 percent for income tax, and as registered and active tax payers for income tax and sales tax increased 29 percent and 13 percent, respectively (Figure 9). Yet tax filing
in 2010/11 was still low: only about 43 percent of companies, and 25–28 percent of business individuals and associations of persons filed tax returns; salaried individuals had the high-est compliance, at 68 percent. Overall, 1.5 mil-lion taxpayers filed income tax returns out of about 3.1 million NTN holders (Ahmad and Best 2012).
Pakistan’s low compliance is reflected by one of the world’s worst tax productivity records. Low tax com-pliance is seen in low and declining GST pro-ductivity. Under the best possible case, the GST (value added tax–like) productivity ratio would approach unity.8 Worldwide estimates for 2010 show that Cyprus is closest to one, with a ratio of 0.8, but that Pakistan is in the lowest bracket at 0.2—below Nepal and Sri Lanka (0.3) and
Figure Corporate income tax rates worldwide, 2009/10
8
0
10
20
30
40
50
Perc
ent
Bahrain
Chad Libya
Argentina
Brazil China Italy Malaysia
Luxembourg
Australia
Nepal
Albania
Bhutan
India
Indonesia
Pakistan (35%)
Seychelles
Philippines
Turkey
Switzerland
Cyprus
Low (0%–20%) Medium (21%–30%) High (31%–46%)
UnitedKingdom
Bangladesh
Source: USAID 2011.
Figure Pakistan’s tax f iling record, 2008/09–2010/11
9
90
100
110
120
2010/112009/102008/09
Federal Board of Revenue Filers Active taxpayers
Perc
ent
of g
ener
al s
ales
tax
Source: World Bank 2012c.
9
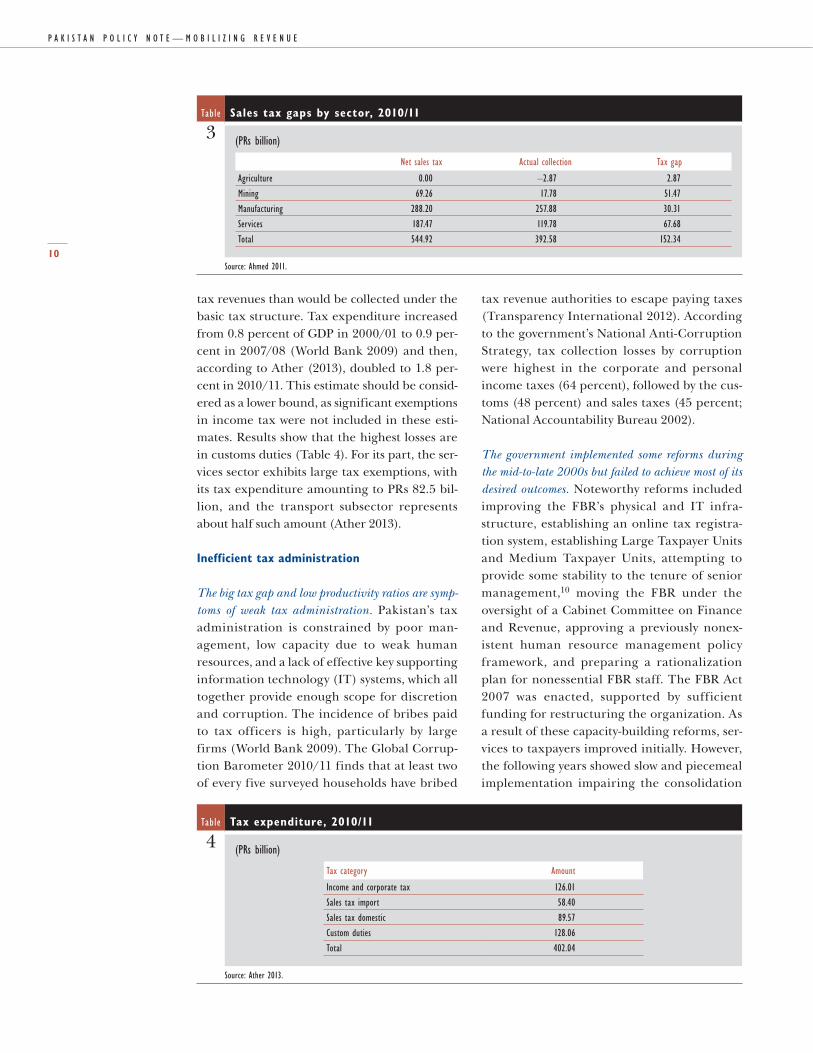
similar to the Philippines and Turkey, among others (Figure 10, top panel). Further, the ratio has been declining—especially since the 2008/09 global economic crisis—and it has declined faster than the FBR tax to GDP ratio (Figure 10, bottom panel), partly because of the recent economic shocks and partly because of poor enforcement of tax collection. Pakistan also has one of the lowest GST C-efficiency indexes (0.27 in 2009) in the world.9
Low compliance is also reflected in big tax gaps. A measure of tax evasion, the tax gap marks actual versus potential revenues if everyone complied with tax laws; and recent estimates confirm Pakistan’s low (and decreasing) tax compliance. In 2004/05, for example, the sales tax gap was estimated at PRs 45 billion, or about 31 percent of collections; by 2010/11, the gap had increased to PRs 152.4 billion, or
about 39 percent of collections. Services, min-ing, and manufacturing show large tax evasion, while agriculture shows minor evasion (Table 3). Some of the widest tax gaps by subsector are in cigarettes, paper and printing, chemical products, cement, electricity, retail trade, and hotels and restaurants. Other low-compliance subsectors include sugar, pharmaceuticals, and fertilizers (Ahmed 2011). Tax gaps are related directly to lax enforcement and corruption that goes undetected or, if detected, unpunished.
Tax expenditure is high and rising. Tax expendi-ture is the revenue loss due to preferential legal provisions (in the finance bill or through ad hoc SROs) in the tax laws that provide certain taxpayers with special concessions—zero or reduced rates and tariffs or duty and tax exemp-tions that are not available to other taxpayers or sectors and that result in the collection of fewer
Figure General sales tax and value added tax productivity
10
2.5 3.0 3.5 4.0 4.5 5.00.0
0.2
0.4
0.6
0.8
Val
ue a
dded
tax
pro
duct
ivity
GDP per capita, 2010 (PPP, log scale)
Pakistan
Sri Lanka
Bangladesh
Nepal
80
90
100
110
120
2010/112009/102008/092007/082006/072005/062004/05
General sales tax Federal Board of Revenue tax to GDP ratio
Gen
eral
Sal
es T
ax P
rodu
ctiv
ity In
dex
(200
4/05
= 1
00)
Note: Value added tax (general sales tax) productivity versus GDP per capita figure relates to 2010 data.Source: World Bank 2012b,c; USAID 2011.
P a k i s t a n P o l i c y n o t e — M o b i l i z i n g R e v e n u e
10
tax revenues than would be collected under the basic tax structure. Tax expenditure increased from 0.8 percent of GDP in 2000/01 to 0.9 per-cent in 2007/08 (World Bank 2009) and then, according to Ather (2013), doubled to 1.8 per-cent in 2010/11. This estimate should be consid-ered as a lower bound, as significant exemptions in income tax were not included in these esti-mates. Results show that the highest losses are in customs duties (Table 4). For its part, the ser-vices sector exhibits large tax exemptions, with its tax expenditure amounting to PRs 82.5 bil-lion, and the transport subsector represents about half such amount (Ather 2013).
Inefficient tax administration
The big tax gap and low productivity ratios are symp-toms of weak tax administration. Pakistan’s tax administration is constrained by poor man-agement, low capacity due to weak human resources, and a lack of effective key supporting information technology (IT) systems, which all together provide enough scope for discretion and corruption. The incidence of bribes paid to tax officers is high, particularly by large firms (World Bank 2009). The Global Corrup-tion Barometer 2010/11 finds that at least two of every five surveyed households have bribed
tax revenue authorities to escape paying taxes (Transparency International 2012). According to the government’s National Anti-Corruption Strategy, tax collection losses by corruption were highest in the corporate and personal income taxes (64 percent), followed by the cus-toms (48 percent) and sales taxes (45 percent; National Accountability Bureau 2002).
The government implemented some reforms during the mid-to-late 2000s but failed to achieve most of its desired outcomes. Noteworthy reforms included improving the FBR’s physical and IT infra-structure, establishing an online tax registra-tion system, establishing Large Taxpayer Units and Medium Taxpayer Units, attempting to provide some stability to the tenure of senior management,10 moving the FBR under the oversight of a Cabinet Committee on Finance and Revenue, approving a previously nonex-istent human resource management policy framework, and preparing a rationalization plan for nonessential FBR staff. The FBR Act 2007 was enacted, supported by sufficient funding for restructuring the organization. As a result of these capacity-building reforms, ser-vices to taxpayers improved initially. However, the following years showed slow and piecemeal implementation impairing the consolidation
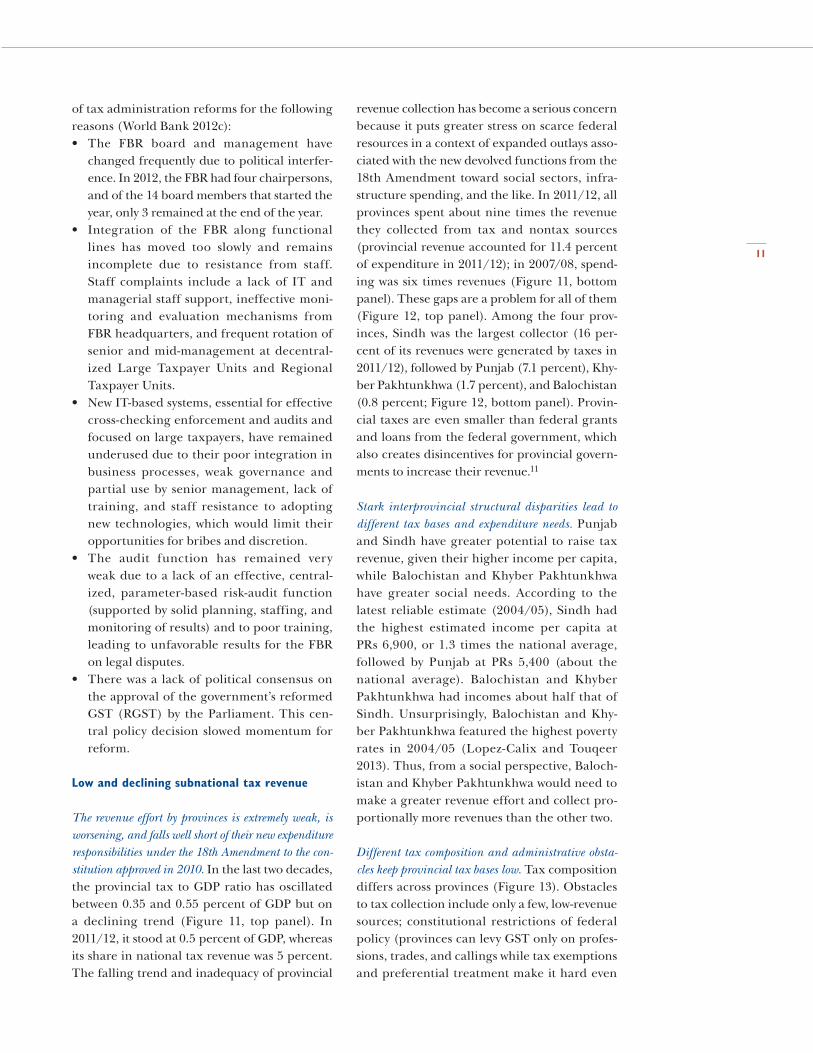
Table Sales tax gaps by sector, 2010/11
3 (PRs billion)
Net sales tax Actual collection Tax gap
Agriculture 0.00 –2.87 2.87
Mining 69.26 17.78 51.47
Manufacturing 288.20 257.88 30.31
Services 187.47 119.78 67.68
Total 544.92 392.58 152.34
Source: Ahmed 2011.
Table Tax expenditure, 2010/11
4 (PRs billion)
Tax category Amount
Income and corporate tax 126.01
Sales tax import 58.40
Sales tax domestic 89.57
Custom duties 128.06
Total 402.04
Source: Ather 2013.
11
of tax administration reforms for the following reasons (World Bank 2012c):• The FBR board and management have
changed frequently due to political interfer-ence. In 2012, the FBR had four chairpersons, and of the 14 board members that started the year, only 3 remained at the end of the year.
• Integration of the FBR along functional lines has moved too slowly and remains incomplete due to resistance from staff. Staff complaints include a lack of IT and managerial staff support, ineffective moni-toring and evaluation mechanisms from FBR headquarters, and frequent rotation of senior and mid-management at decentral-ized Large Taxpayer Units and Regional Taxpayer Units.
• New IT-based systems, essential for effective cross-checking enforcement and audits and focused on large taxpayers, have remained underused due to their poor integration in business processes, weak governance and partial use by senior management, lack of training, and staff resistance to adopting new technologies, which would limit their opportunities for bribes and discretion.
• The audit function has remained very weak due to a lack of an effective, central-ized, parameter-based risk-audit function (supported by solid planning, staffing, and monitoring of results) and to poor training, leading to unfavorable results for the FBR on legal disputes.
• There was a lack of political consensus on the approval of the government’s reformed GST (RGST) by the Parliament. This cen-tral policy decision slowed momentum for reform.
Low and declining subnational tax revenue
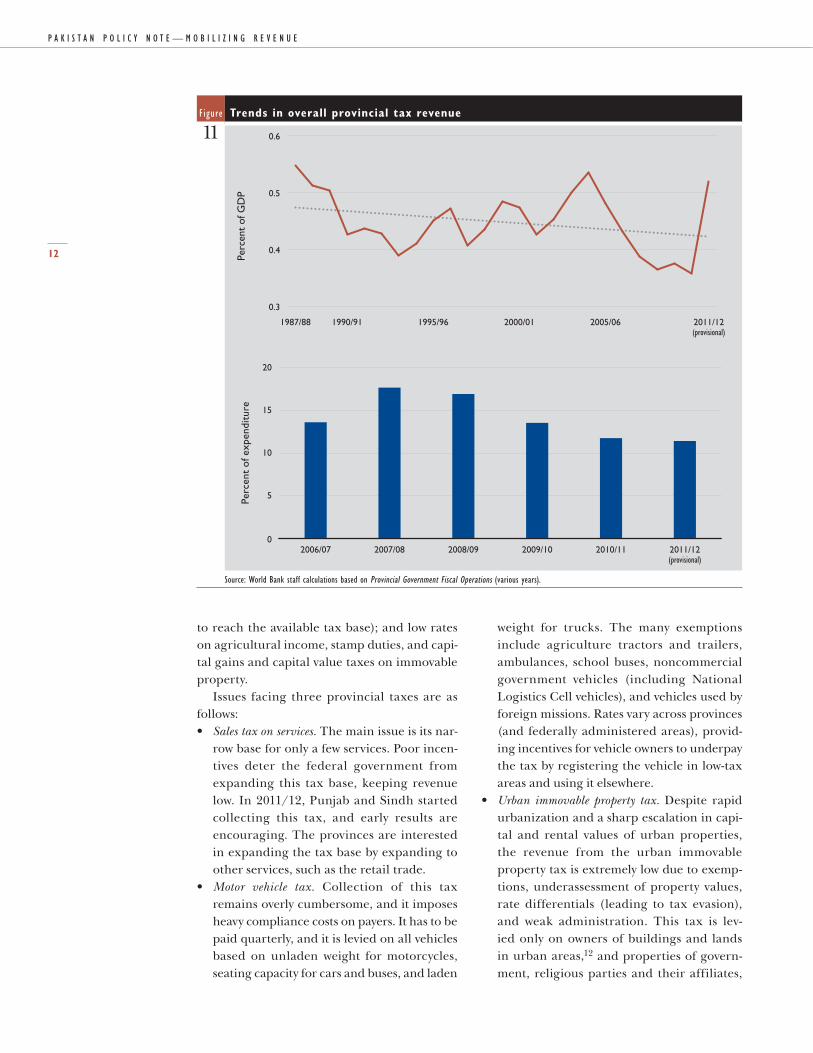
The revenue effort by provinces is extremely weak, is worsening, and falls well short of their new expenditure responsibilities under the 18th Amendment to the con-stitution approved in 2010. In the last two decades, the provincial tax to GDP ratio has oscillated between 0.35 and 0.55 percent of GDP but on a declining trend (Figure 11, top panel). In 2011/12, it stood at 0.5 percent of GDP, whereas its share in national tax revenue was 5 percent. The falling trend and inadequacy of provincial
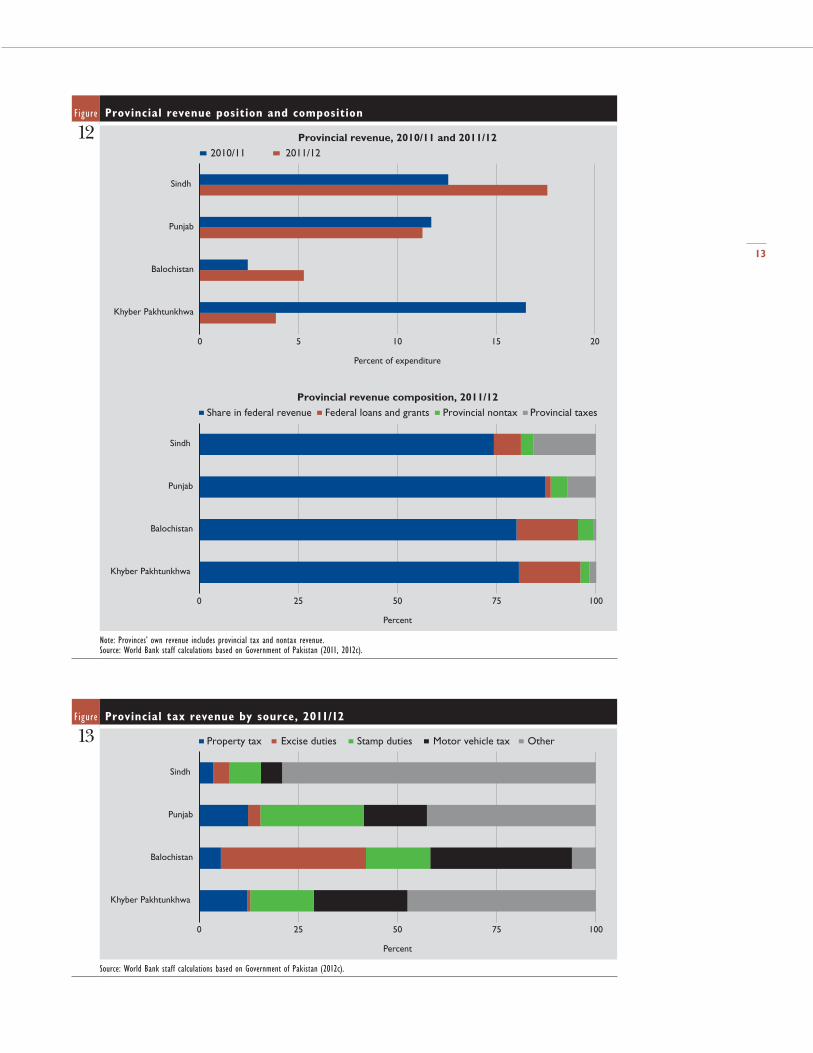
revenue collection has become a serious concern because it puts greater stress on scarce federal resources in a context of expanded outlays asso-ciated with the new devolved functions from the 18th Amendment toward social sectors, infra-structure spending, and the like. In 2011/12, all provinces spent about nine times the revenue they collected from tax and nontax sources (provincial revenue accounted for 11.4 percent of expenditure in 2011/12); in 2007/08, spend-ing was six times revenues (Figure 11, bottom panel). These gaps are a problem for all of them (Figure 12, top panel). Among the four prov-inces, Sindh was the largest collector (16 per-cent of its revenues were generated by taxes in 2011/12), followed by Punjab (7.1 percent), Khy-ber Pakhtunkhwa (1.7 percent), and Balochistan (0.8 percent; Figure 12, bottom panel). Provin-cial taxes are even smaller than federal grants and loans from the federal government, which also creates disincentives for provincial govern-ments to increase their revenue.11
Stark interprovincial structural disparities lead to different tax bases and expenditure needs. Punjab and Sindh have greater potential to raise tax revenue, given their higher income per capita, while Balochistan and Khyber Pakhtunkhwa have greater social needs. According to the latest reliable estimate (2004/05), Sindh had the highest estimated income per capita at PRs 6,900, or 1.3 times the national average, followed by Punjab at PRs 5,400 (about the national average). Balochistan and Khyber Pakhtunkhwa had incomes about half that of Sindh. Unsurprisingly, Balochistan and Khy-ber Pakhtunkhwa featured the highest poverty rates in 2004/05 (Lopez-Calix and Touqeer 2013). Thus, from a social perspective, Baloch-istan and Khyber Pakhtunkhwa would need to make a greater revenue effort and collect pro-portionally more revenues than the other two.
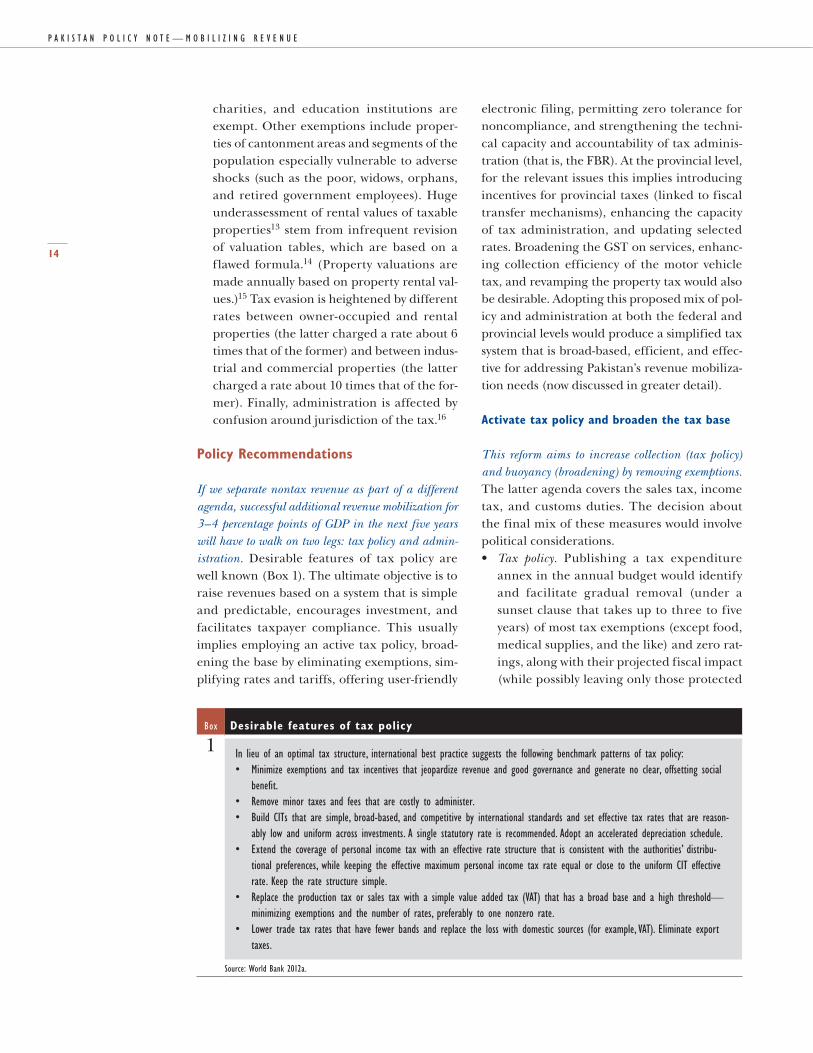
Different tax composition and administrative obsta-cles keep provincial tax bases low. Tax composition differs across provinces (Figure 13). Obstacles to tax collection include only a few, low-revenue sources; constitutional restrictions of federal policy (provinces can levy GST only on profes-sions, trades, and callings while tax exemptions and preferential treatment make it hard even
P a k i s t a n P o l i c y n o t e — M o b i l i z i n g R e v e n u e
12
to reach the available tax base); and low rates on agricultural income, stamp duties, and capi-tal gains and capital value taxes on immovable property.
Issues facing three provincial taxes are as follows:• Sales tax on services. The main issue is its nar-
row base for only a few services. Poor incen-tives deter the federal government from expanding this tax base, keeping revenue low. In 2011/12, Punjab and Sindh started collecting this tax, and early results are encouraging. The provinces are interested in expanding the tax base by expanding to other services, such as the retail trade.
• Motor vehicle tax. Collection of this tax remains overly cumbersome, and it imposes heavy compliance costs on payers. It has to be paid quarterly, and it is levied on all vehicles based on unladen weight for motorcycles, seating capacity for cars and buses, and laden
weight for trucks. The many exemptions include agriculture tractors and trailers, ambulances, school buses, noncommercial government vehicles (including National Logistics Cell vehicles), and vehicles used by foreign missions. Rates vary across provinces (and federally administered areas), provid-ing incentives for vehicle owners to underpay the tax by registering the vehicle in low-tax areas and using it elsewhere.
• Urban immovable property tax. Despite rapid urbanization and a sharp escalation in capi-tal and rental values of urban properties, the revenue from the urban immovable property tax is extremely low due to exemp-tions, underassessment of property values, rate differentials (leading to tax evasion), and weak administration. This tax is lev-ied only on owners of buildings and lands in urban areas,12 and properties of govern-ment, religious parties and their affiliates,
Figure Trends in overall provincial tax revenue
11
0.3
0.4
0.5
0.6
2011/12(provisional)
2005/062000/011995/961990/911987/88
Perc
ent
of G
DP
0
5
10
15
20
2011/12(provisional)
2010/112009/102008/092007/082006/07
Perc
ent
of e
xpen
ditu
re
Source: World Bank staff calculations based on Provincial Government Fiscal Operations (various years).
13
Figure Provincial revenue position and composition
12
0 5 10 15 20
Khyber Pakhtunkhwa
Balochistan
Punjab
Sindh
Percent of expenditure
Provincial revenue, 2010/11 and 2011/122010/11 2011/12
0 25 50 75 100
Khyber Pakhtunkhwa
Balochistan
Punjab
Sindh
Percent
Share in federal revenue Federal loans and grants Provincial nontax Provincial taxesProvincial revenue composition, 2011/12
Note: Provinces’ own revenue includes provincial tax and nontax revenue.Source: World Bank staff calculations based on Government of Pakistan (2011, 2012c).
Figure Provincial tax revenue by source, 2011/12
13
0 25 50 75 100
Khyber Pakhtunkhwa
Balochistan
Punjab
Sindh
Percent
Property tax Excise duties Stamp duties Motor vehicle tax Other
Source: World Bank staff calculations based on Government of Pakistan (2012c).
P a k i s t a n P o l i c y n o t e — M o b i l i z i n g R e v e n u e
14
charities, and education institutions are exempt. Other exemptions include proper-ties of cantonment areas and segments of the population especially vulnerable to adverse shocks (such as the poor, widows, orphans, and retired government employees). Huge underassessment of rental values of taxable properties13 stem from infrequent revision of valuation tables, which are based on a flawed formula.14 (Property valuations are made annually based on property rental val-ues.)15 Tax evasion is heightened by different rates between owner-occupied and rental properties (the latter charged a rate about 6 times that of the former) and between indus-trial and commercial properties (the latter charged a rate about 10 times that of the for-mer). Finally, administration is affected by confusion around jurisdiction of the tax.16
Policy Recommendations
If we separate nontax revenue as part of a different agenda, successful additional revenue mobilization for 3–4 percentage points of GDP in the next five years will have to walk on two legs: tax policy and admin-istration. Desirable features of tax policy are well known (Box 1). The ultimate objective is to raise revenues based on a system that is simple and predictable, encourages investment, and facilitates taxpayer compliance. This usually implies employing an active tax policy, broad-ening the base by eliminating exemptions, sim-plifying rates and tariffs, offering user-friendly
electronic filing, permitting zero tolerance for noncompliance, and strengthening the techni-cal capacity and accountability of tax adminis-tration (that is, the FBR). At the provincial level, for the relevant issues this implies introducing incentives for provincial taxes (linked to fiscal transfer mechanisms), enhancing the capacity of tax administration, and updating selected rates. Broadening the GST on services, enhanc-ing collection efficiency of the motor vehicle tax, and revamping the property tax would also be desirable. Adopting this proposed mix of pol-icy and administration at both the federal and provincial levels would produce a simplified tax system that is broad-based, efficient, and effec-tive for addressing Pakistan’s revenue mobiliza-tion needs (now discussed in greater detail).
Activate tax policy and broaden the tax base
This reform aims to increase collection (tax policy) and buoyancy (broadening) by removing exemptions. The latter agenda covers the sales tax, income tax, and customs duties. The decision about the final mix of these measures would involve political considerations.• Tax policy. Publishing a tax expenditure
annex in the annual budget would identify and facilitate gradual removal (under a sunset clause that takes up to three to five years) of most tax exemptions (except food, medical supplies, and the like) and zero rat-ings, along with their projected fiscal impact (while possibly leaving only those protected
Box Desirable features of tax policy
1 In lieu of an optimal tax structure, international best practice suggests the following benchmark patterns of tax policy:• Minimize exemptions and tax incentives that jeopardize revenue and good governance and generate no clear, offsetting social
benefit.• Remove minor taxes and fees that are costly to administer.• Build CITs that are simple, broad-based, and competitive by international standards and set effective tax rates that are reason-
ably low and uniform across investments. A single statutory rate is recommended. Adopt an accelerated depreciation schedule.• Extend the coverage of personal income tax with an effective rate structure that is consistent with the authorities’ distribu-
tional preferences, while keeping the effective maximum personal income tax rate equal or close to the uniform CIT effective rate. Keep the rate structure simple.
• Replace the production tax or sales tax with a simple value added tax (VAT) that has a broad base and a high threshold—minimizing exemptions and the number of rates, preferably to one nonzero rate.
• Lower trade tax rates that have fewer bands and replace the loss with domestic sources (for example, VAT). Eliminate export taxes.
Source: World Bank 2012a.
15
by the constitution). Creating a joint FBR-Ministry of Finance unit on tax policy would support sound policy design and solid rev-enue forecasting.
• Sales tax. The goal is to have a simple broad-based and nationally integrated RGST on goods and a provincially harmonized RGST on services. To fill exiting leaks that affect compliance, serious consideration should be given to eliminating most exemptions and zero rates that would have an impact equivalent to about 1.8 percent of GDP. Alternatively, zero rates could be converted into exemptions for domestic sales of main exports. Exemptions on special regimes (particularly preferential trade agreements) should be scrutinized.
• Corporate and individual income taxes. In the medium term, the high CIT needs to be lowered from 35 percent to a 25–30 per-cent international benchmark and its base widened with new registrations, as current coverage is low. A lower CIT would encour-age investment and attract new businesses to file. Similarly, the individual income tax requires a massive registration and filing effort. Continually simplifying tax returns and streamlining personal tax credits would also encourage tax compliance.
• Other measures. A complementary but not exhaustive agenda for the government includes reintroducing special excise duties; introducing a retail tax similar to that intro-duced successfully by China, which favors lottery tickets for new registered sales tax-payers; bringing in a capital gains tax on property transfers; and increasing levies like those on petroleum and gas.
Simplify taxes and make compliance effective and noncompliance expensive
A simple tax system that does not rely on only a few people or sectors for revenues and that has low rates encourages voluntary compliance and reduces the incentives for tax evasion. Recent improvements in tax administration allowing a high percent-age of e-filers are encouraging, but further gains are needed:• For simplicity, make an immediate freeze
in issuing the distortive trade, income, and
GST-related SROs, and ensure the passage of a clear schedule of gradual elimination (cleansing) of the remaining SROs in three years; fully revamp customs duties by con-solidating effective tariffs into fewer slabs (ideally three), while reducing tariff peaks to a predefined ceiling; streamline special tariff regimes for selected industries (such as automobiles and pharmaceuticals); and complete the gradual phasing out of the negative list with India in the first half of 2013, while allowing for a few still applica-ble, well-justified but temporary exceptions (list under preparation).
• For strengthening compliance, carry out effective audits of a significant share (30–50 percent) of large taxpayers selected through parametrized risk-based criteria, with quantitative performance benchmarks to attain; complete the audit of withholding agents and eliminate illegal input adjust-ments; and adopt a zero-tolerance policy against tax evasion detected through audits by penalizing nonfiling of or understate-ment in tax returns.
Modernize tax administration
Stability in tenure of senior tax managers, invest-ment in key soft infrastructure (IT) and qualified human resources, and governance improvements are all urgently required. These actions have been on the tax reform agenda for years, if not decades. Their success depends largely on the deci-sion power—and sustained implementation capacity—of the political leadership.• Consider presenting a bill to the Parliament con-
verting the FBR into a fully autonomous institu-tion. This is consistent with best practices worldwide. It would help prevent political interference, foster accountability, and sup-port its move into a performance-based institution.
• Fully integrate automated computerized systems. As a myriad of different systems work at vari-ous levels, functioning in “silos,” they are inefficient, disconnected, and unreliable. Upgrading and effectively integrating the current IT software and databases (to facili-tate multiple taxes cross-checking and data exchanges with NADRA and other national
P a k i s t a n P o l i c y n o t e — M o b i l i z i n g R e v e n u e
16
databases—credit cards, banking accounts, and so on), providing IT equipment to field offices, and making special arrangements for safe data storage for the interrelated systems would be beneficial. It would also help to improve e-filing, make the refund process more reliable, improve the auditing function by field offices, and facilitate their tasks by preparing the long due tax ledger, using computerized discrepancies to cross-check or detect potential tax evaders and noncompliers.
• Invest in human resource capacity building. Governance effectiveness of the automated IT-supported tax system and its piloting require massive training for senior and mid-level staff both at Large Taxpayer Units and Regional Taxpayer Units, in parallel to the new system’s design. Some accreditation mechanism should be considered.
• Improve management and human resource policies. This implies improvement in the FBR’s human resource management poli-cies, which should include new job descrip-tions, hiring policies, and performance, merit, and integrity criteria for staff evalu-ation. Bonuses should be attached to function-specific targets to evaluate job performance. Managers should be made accountable in enforcing codes of conduct across the institution.
• Strengthen the FBR along functional lines. Its organization should strengthen perfor-mance reporting and monitoring tools and procedures per function. Preparing an annual action plan as a management tool including key performance indicators to be regularly assessed (perhaps monthly or quarterly) is essential; and the plan should include corrective actions. Stability of ten-ure at mid-management levels also needs to be ensured. FBR staff ownership of change management will require extensive and reg-ular consultations with all stakeholders, as well as constant training.
Increase provincial tax revenues
The government probably needs to step back and look at the entire intergovernmental fiscal system, which is broken and unbalanced, and its revenue
mobilization, which has a narrow lens. At the heart of the tax problem is that provinces have the wrong incentives to collect taxes, though from the pure perspective of raising taxes, the pro-vincial agenda is quite straightforward.• Approve a provincial tax-friendly fiscal
transfer mechanism. This implies review-ing the current fiscal transfer mechanism to rebalance provincial revenue collection with expenditure needs. As the 18th Amend-ment stipulated that the share of provinces in the divisible pool of federal revenue can-not drop below the level defined by the 7th National Finance Commission Award (57.5 percent), this requires a constitutional amendment.
• Enhance capacity of provincial tax administra-tion. The original model adopted by Sindh and Punjab for creating a new revenue authority is a workable model of moderniz-ing tax administration.17
• Broaden the base of GST on services. The split in the GST regime between federal and provin-cial entities is not optimal, and an obvious measure is to bring more services into the tax net, including retail trade. Merging pro-fessional tax and stamp duties into the GST are also promising approaches.
• Enhance collection efficiency of the motor vehicle tax. This would require harmonizing vehicle registration rates. Replacing the one-time registration tax and annual token tax on motor vehicles with an annual license tax and a fixed fuel levy (provincial) would also help increase tax collection.
• Revamp the urban property tax. First is a need for removing the confusion surrounding ownership. The tax should be devolved to the larger Tehsil Municipal Administration (or municipal corporations), while smaller municipalities retain the provincial collec-tion of the tax, with a transparent revenue-sharing arrangement. Further measures include rationalizing exemptions and tax rates, re-indexing the base and prepar-ing realistic property valuation tables to increase the tax base, and reducing dispari-ties between owner-owned and industrial and commercial properties. A potential second-best option would be to reform the urban property tax in combination with the
17
property transfer tax and an agricultural income tax (Bahl, Wallace, and Cyan 2008).
• Eliminate the myriad minor provincial taxes that generate little revenue.
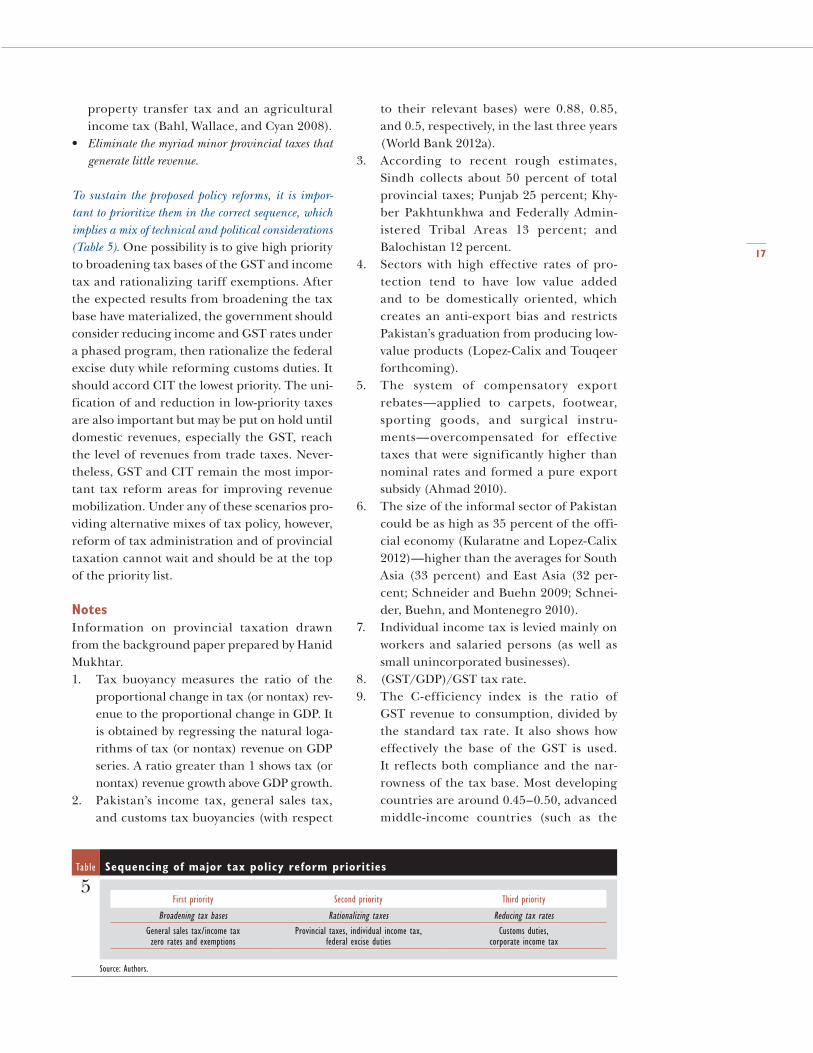
To sustain the proposed policy reforms, it is impor-tant to prioritize them in the correct sequence, which implies a mix of technical and political considerations (Table 5). One possibility is to give high priority to broadening tax bases of the GST and income tax and rationalizing tariff exemptions. After the expected results from broadening the tax base have materialized, the government should consider reducing income and GST rates under a phased program, then rationalize the federal excise duty while reforming customs duties. It should accord CIT the lowest priority. The uni-fication of and reduction in low-priority taxes are also important but may be put on hold until domestic revenues, especially the GST, reach the level of revenues from trade taxes. Never-theless, GST and CIT remain the most impor-tant tax reform areas for improving revenue mobilization. Under any of these scenarios pro-viding alternative mixes of tax policy, however, reform of tax administration and of provincial taxation cannot wait and should be at the top of the priority list.
NotesInformation on provincial taxation drawn from the background paper prepared by Hanid Mukhtar.1. Tax buoyancy measures the ratio of the
proportional change in tax (or nontax) rev-enue to the proportional change in GDP. It is obtained by regressing the natural loga-rithms of tax (or nontax) revenue on GDP series. A ratio greater than 1 shows tax (or nontax) revenue growth above GDP growth.
2. Pakistan’s income tax, general sales tax, and customs tax buoyancies (with respect
to their relevant bases) were 0.88, 0.85, and 0.5, respectively, in the last three years (World Bank 2012a).
3. According to recent rough estimates, Sindh collects about 50 percent of total provincial taxes; Punjab 25 percent; Khy-ber Pakhtunkhwa and Federally Admin-istered Tribal Areas 13 percent; and Balochistan 12 percent.
4. Sectors with high effective rates of pro-tection tend to have low value added and to be domestically oriented, which creates an anti-export bias and restricts Pakistan’s graduation from producing low-value products (Lopez-Calix and Touqeer forthcoming).
5. The system of compensatory export rebates—applied to carpets, footwear, sporting goods, and surgical instru-ments—overcompensated for effective taxes that were significantly higher than nominal rates and formed a pure export subsidy (Ahmad 2010).
6. The size of the informal sector of Pakistan could be as high as 35 percent of the offi-cial economy (Kularatne and Lopez-Calix 2012)—higher than the averages for South Asia (33 percent) and East Asia (32 per-cent; Schneider and Buehn 2009; Schnei-der, Buehn, and Montenegro 2010).
7. Individual income tax is levied mainly on workers and salaried persons (as well as small unincorporated businesses).
8. (GST/GDP)/GST tax rate.9. The C-efficiency index is the ratio of
GST revenue to consumption, divided by the standard tax rate. It also shows how effectively the base of the GST is used. It reflects both compliance and the nar-rowness of the tax base. Most developing countries are around 0.45–0.50, advanced middle-income countries (such as the
Table Sequencing of major tax policy reform priorities
5First priority Second priority Third priority
Broadening tax bases Rationalizing taxes Reducing tax rates
General sales tax/income tax zero rates and exemptions
Provincial taxes, individual income tax, federal excise duties
Customs duties, corporate income tax
Source: Authors.
P a k i s t a n P o l i c y n o t e — M o b i l i z i n g R e v e n u e
18
Republic of Korea and Singapore) 0.6–0.7, and developed countries (such as New Zea-land) much closer to 1.00 (Ahmad 2010).
10. In 2007, the government confirmed the tenure of the Chairman of the FBR for three years and renewed the terms of the members responsible for functional areas. But as described, frequent managerial changes continue to plague the institution.
11. Other financing sources of provincial expenditure are drawings from balances created by unfilled positions, slow dis-bursements of project funds, and bank financing.
12. The Local Government Ordinance of 2001 abolished the distinction between urban and rural municipalities, making it pos-sible for local governments to levy the tax on all properties. But no local government taxed rural properties. With the subse-quent lapsing of the 2001 Ordinance, the former distinction was reinstated and the tax levied only on urban properties.
13. In Punjab, for a market-set rent of PRs 50,000 a month, its tax-rental value is PRs 18,518 a year (3.6 percent of the mar-ket rate).
14. By law, these tables (prepared by excise and taxation departments and based on surveys of properties) have to be updated every five years—a long period when real estate and rental prices climb rapidly. Worse, provincial governments generally take much longer to update them.
15. The rental value is assessed based on the valuation tables. Net value deducts repair and maintenance costs, depreciation based on their age, and any land tax that may be paid by the property owner. Moves to change the tax base to capital value have been thwarted by local courts.
16. This tax falls under the jurisdiction of urban local governments, but provincial governments have administered it through provincial excise and taxation depart-ments. Tax revenue is transferred back to the urban local governments on a collec-tion basis but only after making significant deductions for collection fees and financ-ing provincial development authorities.
17. The Punjab model intends to reform one provincial tax at a time, and the Punjab Revenue Authority would be given author-ity to collect the reformed tax. Over time, all provincial taxes would be reformed. This would remove fragmentation in the provincial tax administration.
ReferencesAhmad, Ehtisham. 2010. “The Political-
Economy of Tax Reforms in Pakistan: The Ongoing Saga of the GST.” Asia Research Centre Working Paper 33, London School of Economics, London.
Ahmad, Ehtisham, and Michael Best. 2012. “Pakistan: Using Third Party Information to Plug Tax Gaps—Alternatives to Policy Reforms.” Mimeo, October 2012.
Ahmed, Athar M. 2011. “Revenue Analysis and Forecasting: Sectoral and Tax-Gap Analyses.” FBR-USAID-CSF Tax Assistance Program, Islamabad.
Ahmed, Robina, and Athar M. Ahmed. 2012. “Estimates of Domestic Sales Tax Gap.” Pre-sentation made in Islamabad.
Ather, Robina. 2013. “Study on Tax Expendi-tures in Pakistan.” Pakistan Policy Paper Series, World Bank, Washington, DC.
Bahl, Roy, Sally Wallace, and Musharraf Cyan. 2008. “Pakistan Provincial Government Tax-ation.” Working Paper 08–07, Georgia State University, Atlanta, Georgia.
Baunsgaard, Thomas and Michael Keen. 2005. “Tax Revenue and (or?) Trade Liberaliza-tion.” IMF Working Paper 05/112, Interna-tional Monetary Fund, Washington, DC.
CIRP (Center for Investigative Reporting in Pakistan) and CPDI (Centre for Peace and Development Initiatives). 2012. Represen-tation without Taxation: An Analysis of MPs Income Tax Returns for 2011. Islamabad: CIRP and CPDI.
FBR (Federal Board of Revenue). 2012. Year Book 2010–2011. Islamabad: Government of Pakistan.
Government of Pakistan. 2001. The SBNP Local Government Ordinance 2001. Islamabad.
———. 2011. Pakistan: Provincial Government Fis-cal Operations, 2010/11. Islamabad: Ministry of Finance.
19
———. 2012a. Pakistan: Consolidated Federal and Provincial Budgetary Operations, 2011–12. Islamabad: Ministry of Finance.
———. 2012b. Pakistan Economic Survey 2011/12. Islamabad: Ministry of Finance.
———. 2012c. Pakistan: Provincial Government Budgetary Operations, 2011–12. Islamabad: Ministry of Finance.
———. Various years. Pakistan Economic Survey. Islamabad: Ministry of Finance.
———. Various years. Provincial Government Fiscal Operations. Islamabad: Ministry of Finance.
Kularatne, Chandana, and Jose R. Lopez-Calix. 2012. “Addressing Regulatory Software Bar-riers to Business Growth.” Pakistan Policy Paper Series 07/12, World Bank, Islamabad.
Lopez-Calix, Jose R., and Irum Touqeer. 2013. “Pakistan’s Development Strategies: Possible Synergies Between Federal and Provincial Strategies.” Background Paper for Pakistan: Finding the Path to Job-Creating Growth. World Bank, Washington DC.
Lopez-Calix, Jose R., and Irum Touqeer. Forth-coming. “Pakistan: Revisiting the Constraints to Pakistan’s Growth.” Pakistan Policy Paper Series, World Bank, Washington, DC.
National Accountability Bureau. 2002. National Anti-Corruption Strategy. Islamabad: Govern-ment of Pakistan.
Reis, Jose G., and Daria Taglioni. 2013. “Rein-vigorating the Agenda for Open Trade.” Pakistan Policy Note 2, World Bank, Wash-ington, DC.
Schneider, Friedrich, and Andreas Buehn. 2009. “Shadow Economies and Corruption All over the World: Revised Estimates for 120 Countries.” Economics: the Open Access, Open-Assessment E-Journal 1 (2).
Schneider, Friedrich, Andreas Buehn, and Claudio E. Montenegro. 2010. “Shadow Economies All over the World: New Esti-mates for 162 Countries from 1999–2007.” Policy Research Working Paper 5356, World Bank, Washington, DC.
Transparency International 2012. Global Corrup-tion Barometer 2010/11. Berlin. Available at http://gcb.transparency.org/gcb201011/.
USAID (United States Agency for International Development). 2011. “Collecting Taxes (2009–10).” Fiscal Reform and Economic Governance Project, Washington, DC.
World Bank. 2009. Pakistan Tax Policy Report: Tapping Tax Bases for Development. Report 50078-PK. Washington, DC.
———. 2012a. South Asian Economic Focus, June 2012: A Review of Economic Developments in South Asian Countries: Creating Fiscal Space through Revenue Mobilization. Washington, DC.
———. 2012b. World Development Indicators 2012. Washington, DC.
———. 2012c. Implementation Completion and Results Report for Pakistan Tax Administration Reform Project. Report ICR00002147. Wash-ington, DC.
———. 2012d. Doing Business 2012: Doing Business in a More Transparent World. Washington, DC.
———. 2012e. Doing Business database. Wash-ington, DC.
© 2013 The International Bank for Reconstruction and Development/THE WORLD BANK1818 H Street NWWashington, DC 20433USA
All rights reserved
This report was prepared by the staff of the South Asia Region. The findings, interpretations, and conclusions expressed herein are those of the authors and do not necessarily reflect the views of the World Bank’s Board of Executive Directors or the countries they represent.
The report was designed, edited, and typeset by Communications Development Incorporated,Washington, DC.
Related Documents