OXFORD CITY COUNCIL RETAIL AND LEISURE STUDY 201 7 FINAL REPORT May 2017 One Chapel Place, London, W1G 0BG

Welcome message from author
This document is posted to help you gain knowledge. Please leave a comment to let me know what you think about it! Share it to your friends and learn new things together.
Transcript
OXFORD CITY COUNCIL RETAIL AND LEISURE STUDY 2017 FINAL REPORT
May 2017
One Chapel Place, London, W1G 0BG
RETAIL AND LEISURE STUDY 2017 Page 2
CONTENTS
1 INTRODUCTION 5
2 PLANNING POLICY REVIEW 7 National Planning Policy Framework (NPPF) 7 Local Planning Policy Context 9 Other Relevant Planning Policy Documents and Evidence 13 Summary 17
3 RETAIL AND TOWN CENTRE TRENDS 19 Retail Trends 19 Special Forms of Trading and Internet Shopping 20 Floorspace ‘Productivity’ Growth 22 Impact of Out-of-Centre Retailing 22 Changing Retailer Requirements 23 Vacancy Levels 24 Trends in Retail-led Investment and Development 25 Independents and Markets 28 Summary 29
4 CATCHMENT AREA & SHOPPING PATTERNS 32 Study Area and Zones 32 Household Telephone Interview Survey 33 Summary 38
5 TOWN CENTRE HEALTH CHECKS: METHODOLOGY 40
6 OXFORD CITY CENTRE - HEALTH CHECK ASSESSMENT 42 Context 42 Retail Composition & Diversity of Uses 43 Multiple and Independent Retail Representation 46 Markets 46 Vacancies 47 Retailer Demand & Requirements 47 Prime Zone A Rents 48 Accessibility & Pedestrian Flows 50 Customer Views and Perceptions 51 Environmental Quality 55 Out of Centre Provision 55 New Investment & Potential Development 56 Summary 56
7 SUMMERTOWN DISTRICT CENTRE- HEALTH CHECK ASSESSMENT 59 Context 59 Retail Composition & Diversity of Uses 59 Vacancies 60 Market 61 Multiple and Independent Retail Representation 61 Retailer Demand 61 Prime Zone A Rents 61 Accessibility & Pedestrian Flows 62 New Investment & Potential Development 62 Customer Views and Perceptions 63 Environmental Quality 66 Summary 66
RETAIL AND LEISURE STUDY 2017 Page 3
8 COWLEY DISTRICT CENTRE - HEALTH CHECK ASSESSMENT 68 Context 68 Retail Composition & Diversity of Uses 68 Street Market 71 Vacancies 71 Retailer Demand & Requirements 72 Prime Zone A Rents 72 Accessibility & Pedestrian Flows 72 Customer Views and Perceptions 72 Environmental Quality 75 Out of Centre Provision 75 New Investment & Potential Development 76 Summary 76
9 HEADINGTON DISTRICT CENTRE - HEALTH CHECK ASSESSMENT 78 Context 78 Retail Composition & Diversity of Uses 78 Street Market 81 Vacancies 81 Retailer Demand & Requirements 81 Prime Zone A Rents 81 Accessibility & Pedestrian Flows 82 Customer Views and Perceptions 82 Environmental Quality 85 Summary 86
10 COWLEY ROAD DISTRICT CENTRE - HEALTH CHECK ASSESSMENT 88 Context 88 Retail Composition & Diversity of Uses 88 Street Market 90 Vacancies 91 Retailer Demand & Requirements 91 Prime Zone A Rents 91 Accessibility & Pedestrian Flows 91 Customer Views and Perceptions 92 Environmental Quality 95 New Investment & Potential Development 95 Summary 96
11 BLACKBIRD LEYS DISTRICT CENTRE – HEALTH CHECK ASSESSMENT 98 Context 98 Retail Composition & Diversity of Uses 98 Vacancies 98 Accessibility & Parking 99 In Centre Survey 99 Environmental Quality 101 Summary 101
12 ECONOMIC RETAIL NEED/CAPACITY ASSESSMENT 102 The CREATe Model: Key Baseline Assumptions & Forecasts 102 Population and Expenditure Forecasts 103 Market Share Analysis 105 ‘Inflow’ (Trade Draw) 105 Retail Floorspace Commitments & Allocations 106 Oxford City Council Area: Capacity Forecasts 107 Convenience Goods Capacity 108 Comparison Goods Capacity 110 Summary 112
13 COMMERCIAL LEISURE NEED / ‘GAP’ ASSESSMENT 114
RETAIL AND LEISURE STUDY 2017 Page 4
Leisure Expenditure Growth 114 Cinema Capacity 116 Eating & Drinking Out 119 Health & Fitness Need 122 Bingo & Gambling Needs 125 Other Commercial Leisure Needs 126 Cultural Activities 127 Hotel Provision 128 Summary 129
14 EXECUTIVE SUMMARY: KEY FINDINGS & RECOMMENDATIONS 131 Centre Overview 131 Retail Needs Assessment 134 Leisure Needs/Gap Assessment 136 Meeting Needs in the Main Centres 137 Local Impact Threshold: Recommendations 138 Primary and Secondary Shop Frontages: Recommendations 139 Conclusions 140
15 GLOSSARY 141
APPENDIX 1: STUDY AREA 143
APPENDIX 2: HOUSEHOLD SURVEY RESULTS (WEIGHTED) 144
APPENDIX 3: IN-CENTRE SURVEY RESULTS 145
APPENDIX 4: OXFORD CITY CENTRE – RETAILER REQUIREMENTS 146
APPENDIX 5: POPULATION PROJECTIONS: SCENARIO(S) 1 AND 2 147
APPENDIX 6: AVAILABLE CONVENIENCE AND COMPARISON GOODS EXPENDITURE: SCENARIO(S) 1 AND 2148
APPENDIX 7: CONVENIENCE GOODS - MARKET SHARES (INCL SFT) SCENARIO 1 149
APPENDIX 8: COMPARISON GOODS - MARKET SHARES (INCL SFT) SCENARIO 1 150
APPENDIX 9: CONVENIENCE GOODS TURNOVER: BASELINE: SCENARIO 1 151
APPENDIX 10: COMPARISON GOODS TURNOVER: BASELINE: SCENARIO 1 152
APPENDIX 11: CONVENIENCE GOODS CAPACITY FORECASTS: BASELINE: SCENARIO 1 153
APPENDIX 12: COMPARISON GOODS CAPACITY ASSESSMENT: BASELINE: SCENARIO 1 154
APPENDIX 13: CONVENIENCE GOODS CAPACITY ASSESSMENT: HIGHER POPULATION GROWTH: SCENARIO 2 155
APPENDIX 14: COMPARISON GOODS CAPACITY ASSESSMENT: HIGHER POPULATION GROWTH: SCENARIO 2 156
APPENDIX 15: FRONTAGES POLICY REVIEW 157
RETAIL AND LEISURE STUDY 2017 Page 5
1 INTRODUCTION
1.1 Carter Jonas (CJ) was commissioned by Oxford City Council in November 2016 to prepare the ‘Retail and
Leisure Study’ to help inform both plan-making and development management across the local authority area.
The City Council is currently making progress towards producing the Oxford Local Plan 2036. The findings of
the study will specifically provide the robust evidence base required to help inform the preparation of this
emerging local plan and other relevant supplementary planning documents.
1.2 The study has been prepared in the context of current and emerging national and development plan policy
guidance, as well as other key material considerations; principally the National Planning Policy Framework
(NPPF) published in March 2012. Where relevant the study also draws on advice set out in the National
Planning Practice Guidance (PPG), published in March 2014, which places significant weight on the
development of positive plan-led visions and strategies to help ensure the vitality of town centres. The
sequential and impact ‘tests’ are also key to both plan-making and decision-taking at the local level.
1.3 The assessment of the need (or ‘capacity’) for new retail (convenience and comparison goods) floorspace has
been carried out at the strategic City Council wide level to help inform the likely scale, type, location and
phasing of new retail development over the short (0-5 years), medium (6-10 years) and long term (11-15
years).
1.4 The study/catchment area defined for the purpose of this study principally covers the Oxford City Council local
authority area, but also extends to a wider area incorporating parts of neighbouring local planning authority
areas (Appendix 1). The Study Area has been divided into nine zones that broadly reflect the population
distribution and local catchments of the main study centres. For analysis purposes Zones 1-2 broadly cover
the Oxford City local authority area.
1.5 The defined Study Area and zones provide the framework for the new telephone interview survey of some
1,000 households conducted by NEMS Market Research (NEMS) in December 2016. The full (weighted)
survey results are set out in Appendix 2. The survey provides the most up-to-date and robust evidence on
shopping patterns, leisure preferences and expenditure flows within the Study Area. The survey findings have
also informed the health check assessments for the main study centres, as well as the quantitative (‘capacity’)
and qualitative need assessments for new retail (convenience and comparison goods) floorspace and leisure
uses.
1.6 For ease of reference this report is structured as follows:
Section 2 reviews the national and local planning policy context material to retail planning and town centres.
Section 3 highlights some of the key trends that are driving the dynamic changes in the retail sector at the national and local level, and how this has shaped (and is likely to shape) the UK’s urban and retail landscape.
Section 4 sets out the results of the market share analysis for convenience and comparison goods shopping and leisure use across the Study Area based on the household telephone interview survey. The market share tabulations for convenience and comparison goods are set out in Appendix 7 and Appendix 8 respectively.
Sections 5-11 set out the health check methodology and key findings for Oxford City Centre and the main District Centres of Summertown, Cowley, Headington, Cowley Road and Blackbird Leys. These
RETAIL AND LEISURE STUDY 2017 Page 6
assessments draw on the Key Performance Indicators (KPIs) identified by the Planning Practice Guidance, recent research and the latest town centre audits for the centres based on site visits. The health check assessment also takes account of the results of the household and in-centre surveys for the main centres. The full survey results are set out in Appendices 2 and 3.
Section 12 sets out the key assumptions and outputs of CJ’s in-house CREATe (excel spreadsheet) capacity model, including: the forecast population and expenditure available in the study area (Appendices 5 & 6); the forecast convenience (Appendix 9) and comparison (Appendix 10) turnovers of all existing centres/stores; and the forecast trading characteristics of all known committed retail floorspace at the time of preparing this assessment. It also presents the detailed City Council-wide and main centre capacity forecasts for both convenience (Appendix 14) and comparison goods (Appendix 15).
Section 13 sets out the findings of the commercial leisure and other town centre uses ‘gap’ assessment. This looks at the main leisure uses, including the need for new food and beverage uses, cinema and gyms.
Finally, Section 14 provides high level advice on where any forecast need for new retail floorspace and leisure uses could be accommodated in Oxford City and the main study centres, carried out in accordance with the main aims of national and local plan policy.
1.7 When considering and assessing the findings of this retail assessment it is important to understand at the
outset that capacity forecasts beyond a five year time period should be interpreted with caution by the City
Council as they are subject to increasing margins of error. We therefore advise that although this updated
study provides the robust evidence base required to help inform plan-making, site allocations and the
determination of planning applications at the local level, the forecasts should be constantly monitored, and
updated. These should take into account any significant new retail development and changes in the retail
expenditure and population growth forecasts over time, as well as any potential impacts arising from other key
trends in the retail and leisure sectors (such as, the growth in internet shopping) and commercial leisure
sectors.
RETAIL AND LEISURE STUDY 2017 Page 7
2 PLANNING POLICY REVIEW
2.1 This section provides a high level overview of the relevant national and local development plan planning policy
pertaining to retail and town centre uses, along with other material considerations.
National Planning Policy Framework (NPPF)
2.2 The NPPF was published in March 2012 and sets out the planning policies for England and how these are
expected to be applied. It reinforces the importance of up-to-date plans and strengthens local decision making.
The NPPF must be taken into account in the preparation of Local Plans and Neighbourhood Plans. At the
heart of the NPPF is a presumption in favour of sustainable development, which is seen as “a golden thread
running through both plan-making and decision-taking” (paragraph 14). The NPPF (paragraph 14) sets out the
Government’s view of what sustainable development means in practice for both plan-making and decision-
taking at the local level.
2.3 For plan-making the Framework states that local planning authorities should positively seek opportunities to
meet the development needs of their area. Local Plans should meet objectively assessed needs, with
sufficient flexibility to adapt to rapid change, unless any adverse impacts of doing so would significantly and
demonstrably outweigh the benefits. The Framework (paragraph 15) states that policies in Local Plans should
follow the approach of the presumption in favour of sustainable development so that “…it is clear that
development which is sustainable can be approved without delay”.
2.4 The NPPF (paragraph 17) sets out twelve core planning principles that underpin both plan-making and
decision-taking. Amongst other objectives these principles confirm that planning should be genuinely plan-led;
proactively drive and support sustainable economic development to deliver thriving local places; promote
mixed use developments; focus significant development in locations which are or can be made sustainable;
and deliver sufficient community and cultural facilities and services to meet local needs.
2.5 The Framework (paragraph 150) emphasises that Local Plans are “…the key to delivering sustainable
development that reflects the vision and aspirations of local communities”. They should be “aspirational but
realistic” and should set out the opportunities for development and clear policies on “…what will or will not be
permitted and where” (paragraph 154). Only those policies that provide a clear indication of how a decision
maker should react to a development proposal should be included in the plan. Any additional Development
Plan Documents (DPDs) should only be used where clearly justified (paragraph 153).
2.6 The NPPF (paragraph 156) requires strategic priorities for the area covered by the Local Plan to deliver the
homes and jobs needed in the area; the provision of retail, leisure and other commercial development; and the
provision of health, security, community and cultural infrastructure and other local facilities; etc. Crucially the
NPPF (paragraph 157) indicates that Local Plans should, amongst other key requirements: plan positively for
the development and infrastructure required in the area; be drawn up over an appropriate time scale
(preferably 15 years), take account of longer term requirements and be kept up to date. Local Plans should
also allocate sites to promote development and flexible use of land, bringing forward new land where
necessary, and provide detail on form, scale, access and quantum of development where appropriate.
2.7 In terms of the evidence-based approach to planning, the Framework states LPAs should ensure that the
Local Plan is based on “…adequate, up-to-date and relevant evidence about the economic, social and
environmental characteristics and prospects of the area” (paragraph 158). Furthermore the assessment of and
strategies for housing, employment and other uses should be integrated, and take full account of relevant
RETAIL AND LEISURE STUDY 2017 Page 8
market and economic signals. LPAs should use this evidence base to assess the needs for land or floorspace
for economic development, including for retail and leisure development; examine the role and function of town
centres and the relationship between them; assess the capacity of existing centres to accommodate new town
centre development; and identify locations of deprivation that may benefit from planned remedial action.
2.8 The NPPF is clear that pursuing sustainable development requires “…careful attention to viability and costs in
plan-making and decision-taking” (paragraph 173). Plans should be deliverable and, in this context, sites and
the scale of development identified in the plan should “…not be subject to such a scale of obligations and
policy burdens that their ability to be delivered viably is threatened” (paragraph 173).
2.9 The Framework (paragraphs 18-149) sets out thirteen key ‘principles’ for delivering sustainable development,
including building a strong, competitive economy; ensuring the vitality of town centres; promoting sustainable
transport; delivering a wide choice of high quality homes; requiring good design; promoting healthy
communities; protecting Green Belt land; and conserving and enhancing the natural and historic environment.
2.10 In terms of ‘ensuring the vitality of town centres’ the NPPF (paragraph 23) states that planning policies should
be positive and promote competitive town centre environments, as well as setting out policies for the
management and growth of centres over the plan period. When drawing up Local Plans, LPAs should:
recognise town centres as the heart of their communities and pursue policies to support their viability and vitality;
define a network and hierarchy of centres;
define the extent of town centres and primary shopping areas, based on a clear definition of primary and secondary frontages in designated centres, and set policies that make clear which uses will be permitted in such locations;
promote competitive town centres that provide customer choice and a diverse retail offer;
retain and enhance existing markets and, where appropriate, re-introduce or create new ones;
allocate a range of suitable sites to meet the scale and type of retail and leisure development needed in town centres;
ensure that the needs for retail and leisure are “met in full” and “not compromised by limited site availability”. Assessments should therefore be undertaken of the need to expand town centres to ensure a sufficient supply of suitable sites;
allocate appropriate edge of centre sites for main town centre uses that are well connected to the town centre where suitable and viable town centre sites are not available. If sufficient edge of centre sites cannot be identified, set policies for meeting the identified needs in other accessible locations that are well connected to the town centre;
set policies for the consideration of proposals for main town centre uses which cannot be accommodated in or adjacent to town centres;
recognise that residential development can play an important role in ensuring the vitality of centres and set out policies to encourage residential development on appropriate sites; and
where town centres are in decline, local planning authorities should plan positively for their future to encourage economic activity.
RETAIL AND LEISURE STUDY 2017 Page 9
2.11 When assessing and determining applications for main town centre uses that are not in an existing centre and
not in accordance with an up-to-date Local Plan, the NPPF states that LPAs should:
Apply a sequential test, which requires applications for main town centre uses to be located in town centres first, then in edge-of-centre locations and only consider out-of-centre locations if suitable sequentially more preferable sites are not available. When considering edge and out of centre proposals, “…preference should be given to accessible sites that are well connected to the town centre” (paragraph 24). Applicants and LPAs should demonstrate flexibility on issues such as format and scale.
Require an impact assessment if the development is over a proportionate, locally set floorspace threshold (if there is no locally set threshold, the default threshold is 2,500 sqm). The NPPF (paragraph 26) states that this should include assessment of the impact of the proposal on existing, committed and planned public and private investment in a centre or centres in the catchment area of the proposal; and on town centre vitality and viability, including local consumer choice and trade in the town centre and wider area, up to five years from the time the application is made.
2.12 The NPPF (paragraph 27) states that “…where an application fails to satisfy the sequential test or is likely to
have significant adverse impact on one or more of the above factors, it should be refused”.
2.13 As previously stated in Section 1, this study also draws on advice set out in the National Planning Practice
Guidance (PPG), published in March 2014. The PPG has streamlined and replaced the advice previously set
out in the PPS4 Practice Guidance on Need, Impact and the Sequential Approach. The revised PPG places
significant weight on the development of positive plan-led visions and strategies for town centres, and has
retained the key sequential and ‘impact tests’. Of relevance to this study the PPG (para 003) states that the
assessment of the potential for centres to accommodate new development and different types of development
should cover a “three-five year period” but should “also take the lifetime of the Local Plan into account and
be regularly reviewed”.
Local Planning Policy Context
2.14 The extant development plans and policies for Oxford City Council consist of the following documents:
Oxford Local Plan 2001 -2016;
Oxford Core Strategy 2026;
West End Area Action Plan 2007-2016;
The Barton Area Action Plan (2012);
The Northern Gateway AAP (2015);
Sites and Housing Plan 2011-2026;
Oxfordshire Strategic Housing Market Assessment (SHMA) 2014; and
Oxford Housing and Economic Land Availability Assessment (HELAA).
2.15 The City Council is making progress towards producing a new Local Plan for Oxford. The Oxford Local Plan
2036 will replace the Local Plan 2001-2016, the Core Strategy 2026 and the Sites and Housing Plan. The
outputs of this study will help inform the new Local Plan.
RETAIL AND LEISURE STUDY 2017 Page 10
Oxford Local Plan 2001-2016
The Oxford Local Plan 2001-2016 sets out detailed policies which planning applications are judged against.
Some of the policies are now out-of-date and have been superseded by the Oxford Core Strategy (see below).
However, there are a number of saved policies pertaining to town centre, retail and leisure uses that are still
relevant. Some of the key policies are listed in the table below for ease of reference:
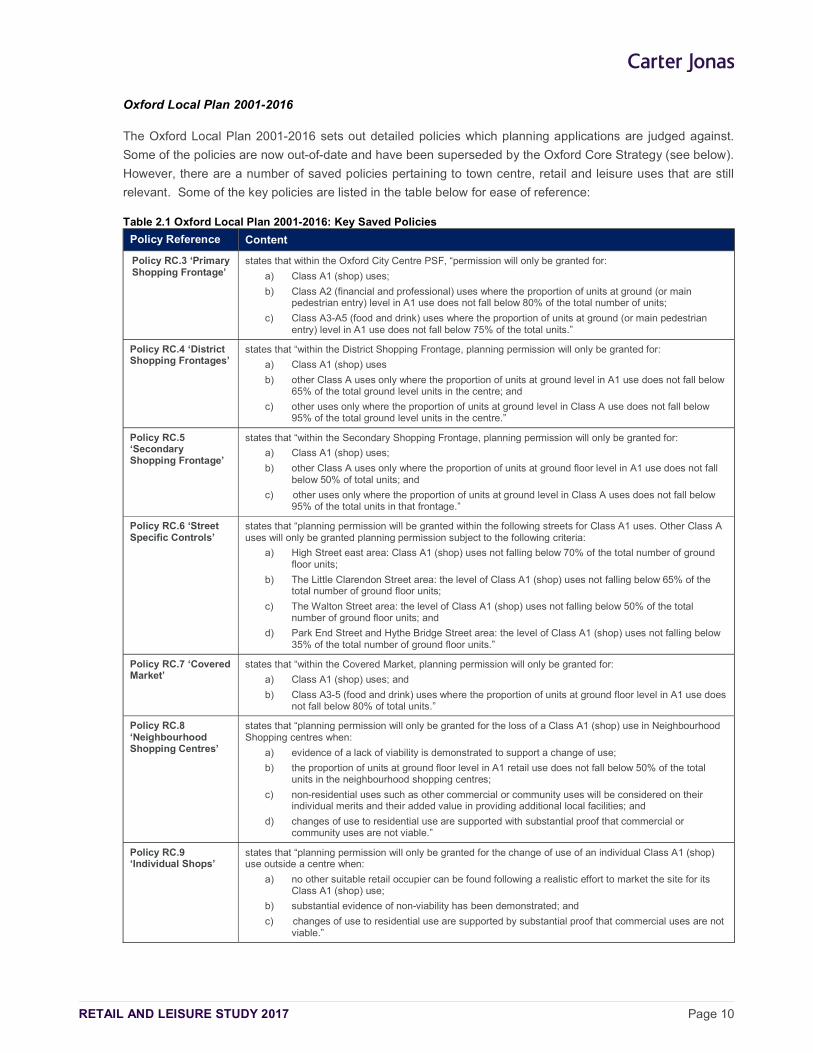
Table 2.1 Oxford Local Plan 2001-2016: Key Saved Policies
Policy Reference Content
Policy RC.3 ‘Primary Shopping Frontage’
states that within the Oxford City Centre PSF, “permission will only be granted for:
a) Class A1 (shop) uses;
b) Class A2 (financial and professional) uses where the proportion of units at ground (or main pedestrian entry) level in A1 use does not fall below 80% of the total number of units;
c) Class A3-A5 (food and drink) uses where the proportion of units at ground (or main pedestrian entry) level in A1 use does not fall below 75% of the total units.”
Policy RC.4 ‘District Shopping Frontages’
states that “within the District Shopping Frontage, planning permission will only be granted for:
a) Class A1 (shop) uses
b) other Class A uses only where the proportion of units at ground level in A1 use does not fall below 65% of the total ground level units in the centre; and
c) other uses only where the proportion of units at ground level in Class A use does not fall below 95% of the total ground level units in the centre.”
Policy RC.5 ‘Secondary Shopping Frontage’
states that “within the Secondary Shopping Frontage, planning permission will only be granted for:
a) Class A1 (shop) uses;
b) other Class A uses only where the proportion of units at ground floor level in A1 use does not fall below 50% of total units; and
c) other uses only where the proportion of units at ground level in Class A uses does not fall below 95% of the total units in that frontage.”
Policy RC.6 ‘Street Specific Controls’
states that “planning permission will be granted within the following streets for Class A1 uses. Other Class A uses will only be granted planning permission subject to the following criteria:
a) High Street east area: Class A1 (shop) uses not falling below 70% of the total number of ground floor units;
b) The Little Clarendon Street area: the level of Class A1 (shop) uses not falling below 65% of the total number of ground floor units;
c) The Walton Street area: the level of Class A1 (shop) uses not falling below 50% of the total number of ground floor units; and
d) Park End Street and Hythe Bridge Street area: the level of Class A1 (shop) uses not falling below 35% of the total number of ground floor units.”
Policy RC.7 ‘Covered Market’
states that “within the Covered Market, planning permission will only be granted for:
a) Class A1 (shop) uses; and
b) Class A3-5 (food and drink) uses where the proportion of units at ground floor level in A1 use does not fall below 80% of total units.”
Policy RC.8 ‘Neighbourhood Shopping Centres’
states that “planning permission will only be granted for the loss of a Class A1 (shop) use in Neighbourhood Shopping centres when:
a) evidence of a lack of viability is demonstrated to support a change of use;
b) the proportion of units at ground floor level in A1 retail use does not fall below 50% of the total units in the neighbourhood shopping centres;
c) non-residential uses such as other commercial or community uses will be considered on their individual merits and their added value in providing additional local facilities; and
d) changes of use to residential use are supported with substantial proof that commercial or community uses are not viable.”
Policy RC.9 ‘Individual Shops’
states that “planning permission will only be granted for the change of use of an individual Class A1 (shop) use outside a centre when:
a) no other suitable retail occupier can be found following a realistic effort to market the site for its Class A1 (shop) use;
b) substantial evidence of non-viability has been demonstrated; and
c) changes of use to residential use are supported by substantial proof that commercial uses are not viable.”
RETAIL AND LEISURE STUDY 2017 Page 11
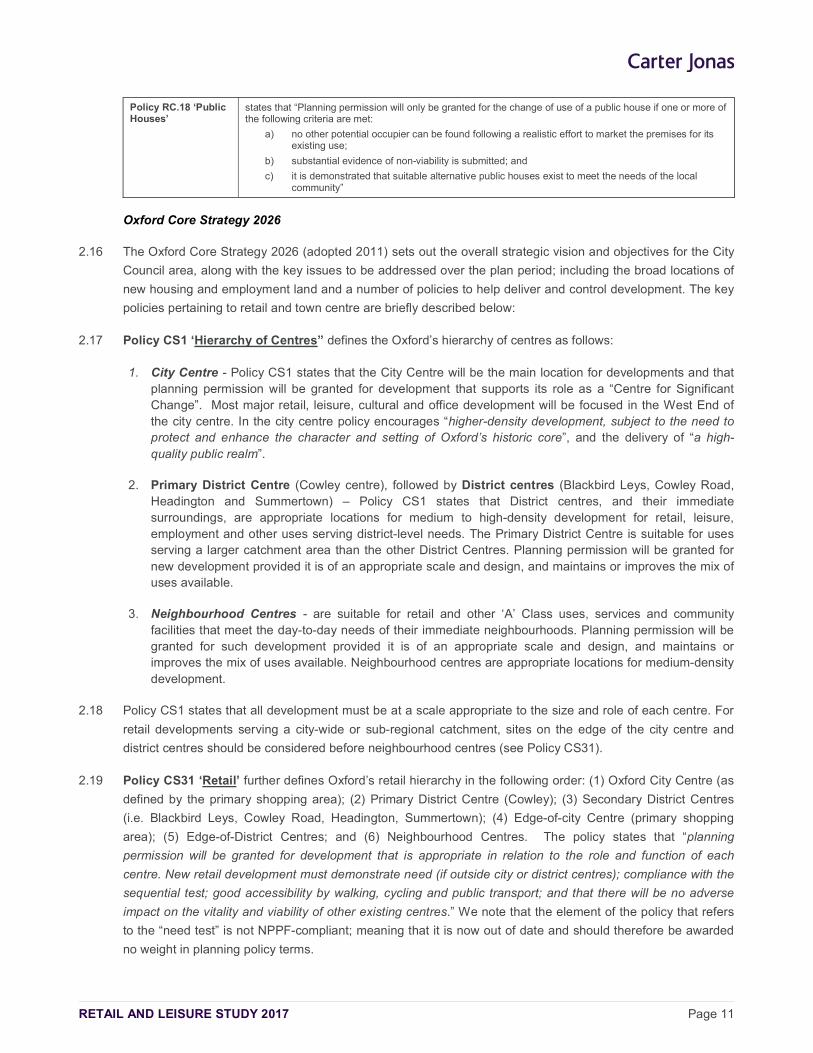
Policy RC.18 ‘Public Houses’
states that “Planning permission will only be granted for the change of use of a public house if one or more of the following criteria are met:
a) no other potential occupier can be found following a realistic effort to market the premises for its existing use;
b) substantial evidence of non-viability is submitted; and
c) it is demonstrated that suitable alternative public houses exist to meet the needs of the local community”
Oxford Core Strategy 2026
2.16 The Oxford Core Strategy 2026 (adopted 2011) sets out the overall strategic vision and objectives for the City
Council area, along with the key issues to be addressed over the plan period; including the broad locations of
new housing and employment land and a number of policies to help deliver and control development. The key
policies pertaining to retail and town centre are briefly described below:
2.17 Policy CS1 ‘Hierarchy of Centres” defines the Oxford’s hierarchy of centres as follows:
1. City Centre - Policy CS1 states that the City Centre will be the main location for developments and that planning permission will be granted for development that supports its role as a “Centre for Significant Change”. Most major retail, leisure, cultural and office development will be focused in the West End of the city centre. In the city centre policy encourages “higher-density development, subject to the need to protect and enhance the character and setting of Oxford’s historic core”, and the delivery of “a high-quality public realm”.
2. Primary District Centre (Cowley centre), followed by District centres (Blackbird Leys, Cowley Road, Headington and Summertown) – Policy CS1 states that District centres, and their immediate surroundings, are appropriate locations for medium to high-density development for retail, leisure, employment and other uses serving district-level needs. The Primary District Centre is suitable for uses serving a larger catchment area than the other District Centres. Planning permission will be granted for new development provided it is of an appropriate scale and design, and maintains or improves the mix of uses available.
3. Neighbourhood Centres - are suitable for retail and other ‘A’ Class uses, services and community facilities that meet the day-to-day needs of their immediate neighbourhoods. Planning permission will be granted for such development provided it is of an appropriate scale and design, and maintains or improves the mix of uses available. Neighbourhood centres are appropriate locations for medium-density development.
2.18 Policy CS1 states that all development must be at a scale appropriate to the size and role of each centre. For
retail developments serving a city-wide or sub-regional catchment, sites on the edge of the city centre and
district centres should be considered before neighbourhood centres (see Policy CS31).
2.19 Policy CS31 ‘Retail’ further defines Oxford’s retail hierarchy in the following order: (1) Oxford City Centre (as
defined by the primary shopping area); (2) Primary District Centre (Cowley); (3) Secondary District Centres
(i.e. Blackbird Leys, Cowley Road, Headington, Summertown); (4) Edge-of-city Centre (primary shopping
area); (5) Edge-of-District Centres; and (6) Neighbourhood Centres. The policy states that “planning
permission will be granted for development that is appropriate in relation to the role and function of each
centre. New retail development must demonstrate need (if outside city or district centres); compliance with the
sequential test; good accessibility by walking, cycling and public transport; and that there will be no adverse
impact on the vitality and viability of other existing centres.” We note that the element of the policy that refers
to the “need test” is not NPPF-compliant; meaning that it is now out of date and should therefore be awarded
no weight in planning policy terms.
RETAIL AND LEISURE STUDY 2017 Page 12
2.20 Policy CS5 ‘West End’ states that The West End area of Oxford city centre is allocated as “a strategic
location which will deliver a mixed–use development. Planning permission will be granted for development that
includes:
significant housing provision (approximately 700-800 dwellings);
retail floorspace (at least 37,000 sqm);
office space (15,000sqm for the private sector and 20,000sqm for the public sector);
new leisure and cultural attractions;
a high-quality network of streets and public spaces; and
a new one-form entry Primary School to serve the area.”
2.21 Policy CS3 ‘Regeneration areas” refers to Barton, Northway, Rose Hill, Blackbird Leys and Wood Farm, and
sets out areas “for regeneration with the purpose of revitalising these housing estates and building balanced
and sustainable communities”:. One of these areas is Blackbird Leys where “planning permission will be
granted…for development that…supports the vitality and viability of…the district centre”, as well as “enhances
or provides local community facilities and services” and “improves accessibility to employment and key
services by walking, cycling and public transport”.
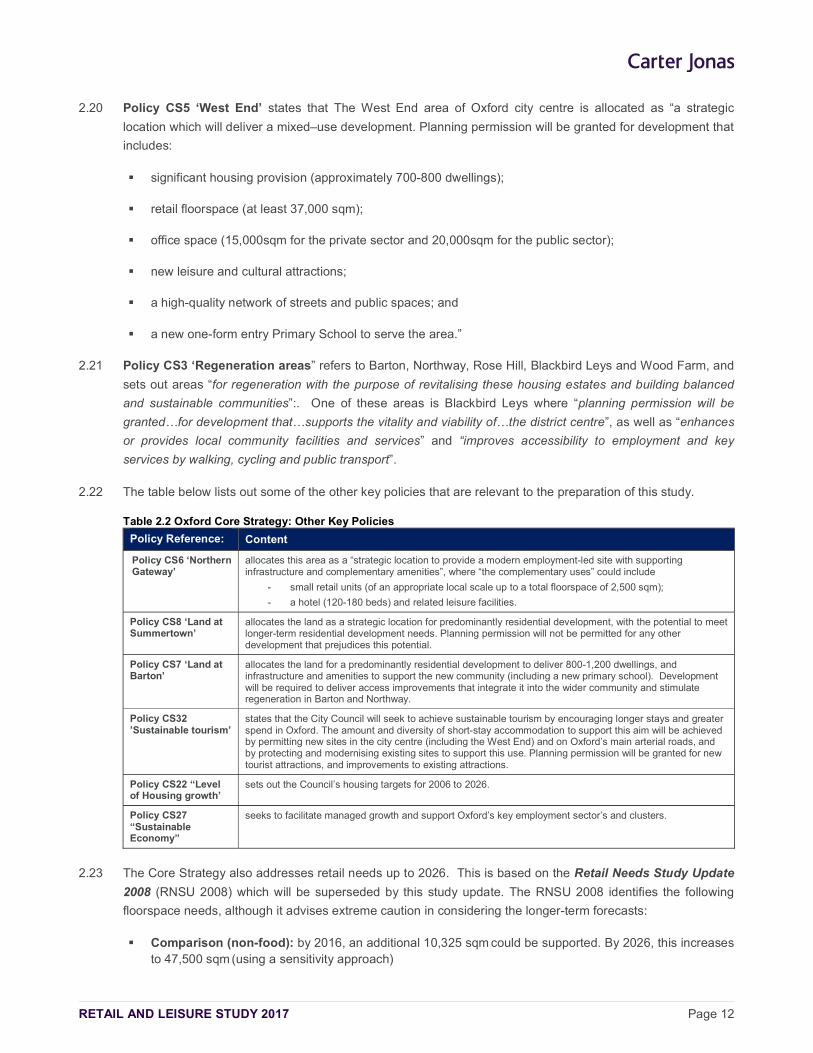
2.22 The table below lists out some of the other key policies that are relevant to the preparation of this study.
Table 2.2 Oxford Core Strategy: Other Key Policies
Policy Reference: Content
Policy CS6 ‘Northern Gateway’
allocates this area as a “strategic location to provide a modern employment-led site with supporting infrastructure and complementary amenities”, where “the complementary uses” could include
- small retail units (of an appropriate local scale up to a total floorspace of 2,500 sqm);
- a hotel (120-180 beds) and related leisure facilities.
Policy CS8 ‘Land at Summertown’
allocates the land as a strategic location for predominantly residential development, with the potential to meet longer-term residential development needs. Planning permission will not be permitted for any other development that prejudices this potential.
Policy CS7 ‘Land at Barton’
allocates the land for a predominantly residential development to deliver 800-1,200 dwellings, and infrastructure and amenities to support the new community (including a new primary school). Development will be required to deliver access improvements that integrate it into the wider community and stimulate regeneration in Barton and Northway.
Policy CS32 ’Sustainable tourism’
states that the City Council will seek to achieve sustainable tourism by encouraging longer stays and greater spend in Oxford. The amount and diversity of short-stay accommodation to support this aim will be achieved by permitting new sites in the city centre (including the West End) and on Oxford’s main arterial roads, and by protecting and modernising existing sites to support this use. Planning permission will be granted for new tourist attractions, and improvements to existing attractions.
Policy CS22 “Level of Housing growth’
sets out the Council’s housing targets for 2006 to 2026.
Policy CS27 “Sustainable Economy”
seeks to facilitate managed growth and support Oxford’s key employment sector’s and clusters.
2.23 The Core Strategy also addresses retail needs up to 2026. This is based on the Retail Needs Study Update
2008 (RNSU 2008) which will be superseded by this study update. The RNSU 2008 identifies the following
floorspace needs, although it advises extreme caution in considering the longer-term forecasts:
Comparison (non-food): by 2016, an additional 10,325 sqm could be supported. By 2026, this increases to 47,500 sqm (using a sensitivity approach)
RETAIL AND LEISURE STUDY 2017 Page 13
Convenience (food): by 2016, between 3,210 sqm (low-density operator) and 1,650 sqm (high-density operator) could be supported. By 2026, this increases to between 6,311 sqm (low density) and 3,156 sqm (high density).
Other Relevant Planning Policy Documents and Evidence
West End Area Action Plan 2007-2016
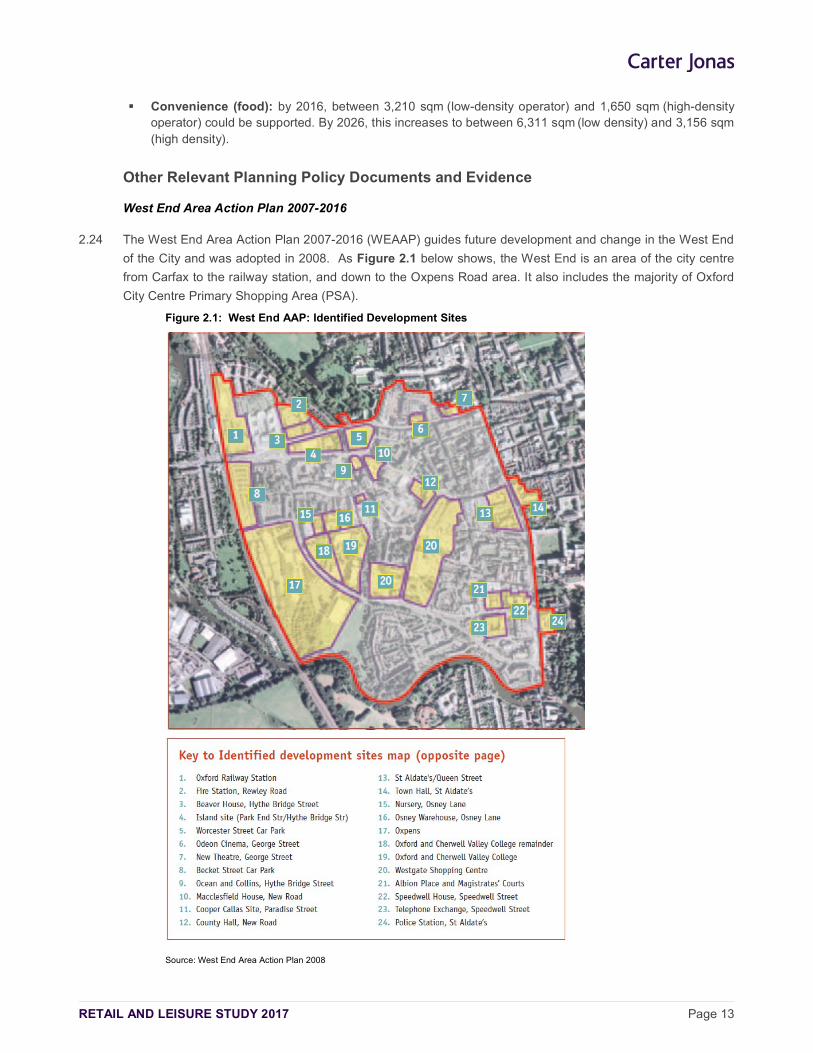
2.24 The West End Area Action Plan 2007-2016 (WEAAP) guides future development and change in the West End
of the City and was adopted in 2008. As Figure 2.1 below shows, the West End is an area of the city centre
from Carfax to the railway station, and down to the Oxpens Road area. It also includes the majority of Oxford
City Centre Primary Shopping Area (PSA).
Figure 2.1: West End AAP: Identified Development Sites
Source: West End Area Action Plan 2008
RETAIL AND LEISURE STUDY 2017 Page 14
2.25 The AAP contains policies against which all planning applications made in the West End will be judged. It also
acts as a guide to stimulate the renaissance of the area.
2.26 The AAP states that the West End is underutilised and does not meet its potential as a high quality area of the
city centre, improving the area is essential to the city’s long-term success.
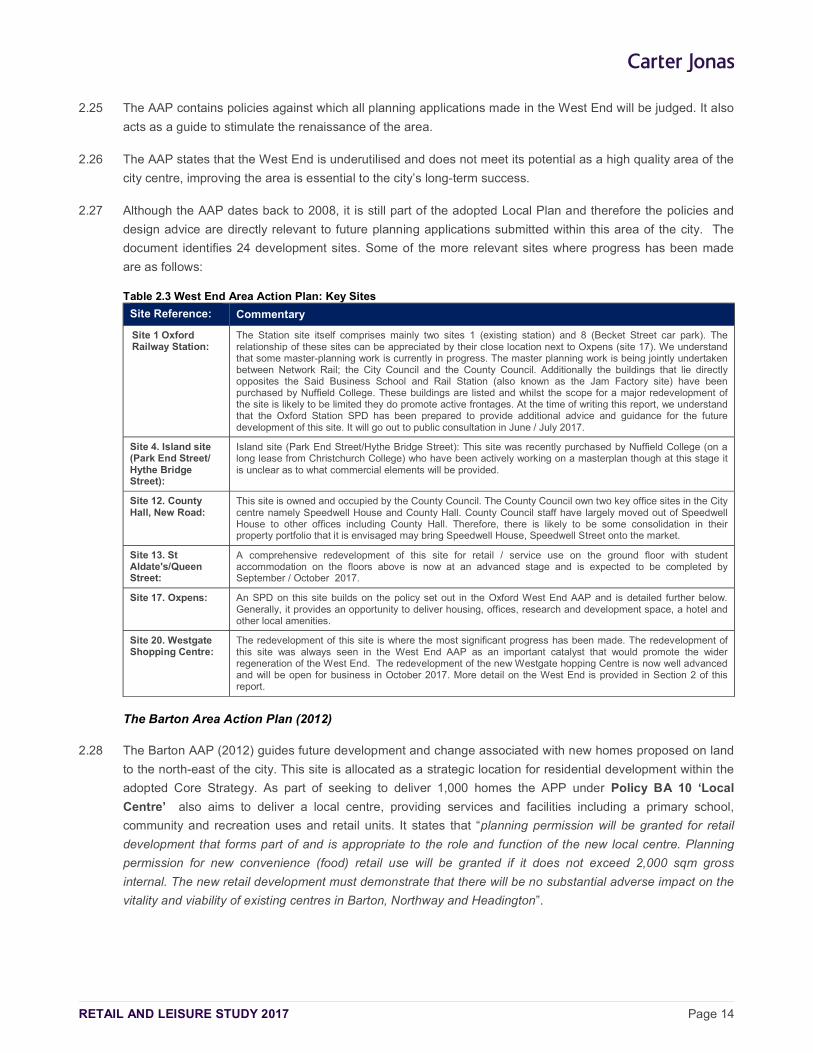
2.27 Although the AAP dates back to 2008, it is still part of the adopted Local Plan and therefore the policies and
design advice are directly relevant to future planning applications submitted within this area of the city. The
document identifies 24 development sites. Some of the more relevant sites where progress has been made
are as follows:
Table 2.3 West End Area Action Plan: Key Sites
Site Reference: Commentary
Site 1 Oxford Railway Station:
The Station site itself comprises mainly two sites 1 (existing station) and 8 (Becket Street car park). The relationship of these sites can be appreciated by their close location next to Oxpens (site 17). We understand that some master-planning work is currently in progress. The master planning work is being jointly undertaken between Network Rail; the City Council and the County Council. Additionally the buildings that lie directly opposites the Said Business School and Rail Station (also known as the Jam Factory site) have been purchased by Nuffield College. These buildings are listed and whilst the scope for a major redevelopment of the site is likely to be limited they do promote active frontages. At the time of writing this report, we understand that the Oxford Station SPD has been prepared to provide additional advice and guidance for the future development of this site. It will go out to public consultation in June / July 2017.
Site 4. Island site (Park End Street/ Hythe Bridge Street):
Island site (Park End Street/Hythe Bridge Street): This site was recently purchased by Nuffield College (on a long lease from Christchurch College) who have been actively working on a masterplan though at this stage it is unclear as to what commercial elements will be provided.
Site 12. County Hall, New Road:
This site is owned and occupied by the County Council. The County Council own two key office sites in the City centre namely Speedwell House and County Hall. County Council staff have largely moved out of Speedwell House to other offices including County Hall. Therefore, there is likely to be some consolidation in their property portfolio that it is envisaged may bring Speedwell House, Speedwell Street onto the market.
Site 13. St Aldate's/Queen Street:
A comprehensive redevelopment of this site for retail / service use on the ground floor with student accommodation on the floors above is now at an advanced stage and is expected to be completed by September / October 2017.
Site 17. Oxpens: An SPD on this site builds on the policy set out in the Oxford West End AAP and is detailed further below. Generally, it provides an opportunity to deliver housing, offices, research and development space, a hotel and other local amenities.
Site 20. Westgate Shopping Centre:
The redevelopment of this site is where the most significant progress has been made. The redevelopment of this site was always seen in the West End AAP as an important catalyst that would promote the wider regeneration of the West End. The redevelopment of the new Westgate hopping Centre is now well advanced and will be open for business in October 2017. More detail on the West End is provided in Section 2 of this report.
The Barton Area Action Plan (2012)
2.28 The Barton AAP (2012) guides future development and change associated with new homes proposed on land
to the north-east of the city. This site is allocated as a strategic location for residential development within the
adopted Core Strategy. As part of seeking to deliver 1,000 homes the APP under Policy BA 10 ‘Local
Centre’ also aims to deliver a local centre, providing services and facilities including a primary school,
community and recreation uses and retail units. It states that “planning permission will be granted for retail
development that forms part of and is appropriate to the role and function of the new local centre. Planning
permission for new convenience (food) retail use will be granted if it does not exceed 2,000 sqm gross
internal. The new retail development must demonstrate that there will be no substantial adverse impact on the
vitality and viability of existing centres in Barton, Northway and Headington”.
RETAIL AND LEISURE STUDY 2017 Page 15
The Northern Gateway AAP (2015)
2.29 This site is allocated by the Core Strategy for major employment-led development and the Northern Gateway
AAP (2015) supports the delivery of the site, and guides future development. Policy NG2 ‘Mix of uses’
specifically states that planning permission will be granted at the Northern Gateway for: up to 90,000 sqm
(gross internal area) of employment development; up to 500 new homes; a range of local scale retail uses (up
to a total of 2,500 sqm gross internal area); and a hotel with associated leisure facilities (up to 180 bedrooms).
Sites and Housing Plan 2011-2026
2.30 The Sites and Housing Plan (SHP) 2011-2026, adopted in 2013, allocates sites for development for new
housing, employment and other uses (including retail), and sets out policies for residential development
including affordable housing. This adopted Plan is in force until such a time as the Local Plan 2036 is formally
adopted with new replacement policies.
2.31 Within the Sites and Housing Plan 2011-2026 (2013) there are a number of polices that include provision for
new retail and wider town centre uses as part of the regeneration and development objectives for specific
sites/areas, including the following:
SP5 Blackbird Leys Central Area - seeks to assist the aim of Blackbird Leys Regeneration Area and improve local facilities, shops, new housing, educational and employment opportunities are appropriate. Blackbird Leys is one of Oxford’s four district centres in the retail hierarchy and a mix of town centre and community uses are encouraged here. A such Policy SP5 states “planning permission will be granted for a mixed use development that includes retail, start-up employment units, residential and community facilities at the Blackbird Leys Central Area site. Other uses should be appropriate to a district centre and could include education, live/work units, sport and commercial leisure. Planning permission will not be granted for any other uses. Planning permission will not be granted for development that prejudices the comprehensive development of the whole site.”
SP10 Cowley Centre - deals with the site that predominantly includes the Templars Square shopping centre, which is identified as “dated and is in need of improvement” (para B2.30). The policy states that “planning permission will be granted for a retail-led mixed use development at Cowley Centre which could include the following uses: commercial leisure; community facilities; employment; and residential. Other town centre uses may also be appropriate. Planning permission will not be granted for development that prejudices the comprehensive development of the whole site. The Policy also states that regard should be had for any Cowley Centre masterplan, although no Masterplan has been produced by the Council.
SP11 Cowley Community Centre - seeks the replacement of community facility and residential development at Cowley Community Centre with the Cowley District Centre Boundary, with additional retail uses at ground floor.
SP14 Diamond Place and Ewert House - seeks the redevelopment of a Summertown District Centre site that comprises car parks, office and academic use. It states that planning permission will be granted for a retail-led mixed use development which could include residential, employment and student accommodation.
SP57 ‘Union Street Car Park” seeks the redevelopment of a Cowley Road District Centre site for residential or student accommodation.
2.32 Other policies include:
SP8 Churchill Hospital Site and Ambulance Resource Centre
RETAIL AND LEISURE STUDY 2017 Page 16
SP18 Fox and Hounds Public House and Former Petrol Station
SP23 John Radcliffe Hospital Site
SP24 Kassam Stadium Sites
SP24 Oriel College Land at King Edward Street
SP24 Oxford Brookes University Gipsy Lane Campus
Diamond Place Supplementary Planning Document (2015)
2.33 The Diamond Place Supplementary Planning Document (DPSPD) is a material consideration in the
determination of planning applications. It supplements Policy SP14 of the Sites and Housing Plan, which
allocates the site for retail-led development, with potential for a wide mix of other uses, and retaining parking
adequate to serve the local area. The SPD states that the re-development of this site provides an opportunity
to enhance the offer of Summertown District Centre. Development should include retail of around 1,000 sqm
and should be provided as more than one unit. This could also include restaurants and cafés to encourage
variety (see para 21).
Oxpens Masterplan SPD
2.34 The Oxpens site is located between Oxford Railway Station, the Westgate Centre and the River Thames. It
provides an opportunity to deliver new housing, offices, research and development space, a hotel, local
amenities. The Oxpens site is owned jointly by Oxford City Council and London and County Railways. At the
time of writing this report, it is understood that the City Council recently acquired a significant land holding from
the Rail Residuary Body and are now the main landowner. In order to progress the development of this site
the City Council have set up a development partnership arrangement with Nuffield College.
2.35 This SPD specifically builds on the policy set out in the Oxford West End Area Action Plan. The document sets
out appropriate land use as follows (see Policy DP0 Appropriate land use mix) and an Illustrative Masterplan
sets out the amount of floorspace the Council wishes to achieve on the site, including: Residential (houses
and apartments) – 15,700 sqm (flats) and 25,500 sqm (houses); Employment (offices, research &
development); Hotel - 7,400 sqm; Class A1 – A5 Land Uses (retail, food, drink, professional services) – 1,500
sqm; Student Accommodation – 10,600; Educational Uses; Retirement Accommodation; Café (Oxpens
Meadow attraction); and a potential Energy Centre.
Neighbourhood Plans
2.36 Oxford City Council has formally designated three neighbourhood areas – Wolvercote, Summertown and St
Margaret's and Headington. The following Neighbourhood Forums have been designated:
Headington - formally designated on 10th September 2014.
Wolvercote - formally designated on 22 January 2014
Summertown/St Margaret's - formally designated on 22 January 2014
2.37 It is intended that the plans will be used to guide future development and manage change alongside Oxford’s
Local Plan. The Headington Neighbourhood Forum has submitted to Oxford City Council their Plan Proposal
under Part 5 of the Neighbourhood Planning (General) Regulations 2012, and the consultation took place
between August and October 2016. The Headington Neighbourhood Plan has been formally submitted and
RETAIL AND LEISURE STUDY 2017 Page 17
subject to Examination, the Inspector’s Report was received in January 2017, with some recommendations for
changes to be made. The Council approved the Plan for referendum (which took place on 4th May 2017). In
the meantime, the Summertown and St. Margaret’s Neighbourhood Forum have prepared a Draft
Neighbourhood Plan, which is subject to pre-submission consultation in 2017. Littlemore are also actively
considering setting up a Neighbourhood Forum.
Oxfordshire Strategic Housing Market Assessment (SHMA) 2014
2.38 The main evidence about housing need for Oxford is the Oxfordshire Strategic Housing Market Assessment
(SHMA, 2014). The SHMA identifies the overall scale of housing need, as well as the mix of housing and
range of tenures which the local population is likely to need in the period to 2031. It considers household and
population projections, taking account of migration and demographic change. It also addresses the need for all
types of housing, including affordable housing needs, and the needs of different groups in the community. It
then brings this information together to identify the ‘objectively assessed need’ (OAN). The SHMA identified
Objectively Assessment Need (OAN) for Oxford of 24,000‐32,000 new homes between 2011 and 2031. The
Local Plan period will run until 2036 and therefore some further technical work will be needed to roll forward
the Oxford OAN calculations from 2031 to 2036, and to ensure the latest population and household projections
are taken into account.
Oxford Housing and Economic Land Availability Assessment (HELAA)
2.39 The HELAA reviews the supply of potential sites to meet future needs for housing and for economic growth
between 2016 and 2036. The HELAA identifies there is potential capacity in Oxford to accommodate around
7,511 additional homes. This is made up of 6,356 from identified sites which meet HELAA criteria (listed in
Table B of the HELAA. Includes site allocations and extant permissions for sites >5 dwellings); 135 homes
from small site commitments (extant permissions for sites of 5 or fewer dwellings); and windfall (unidentified
sites of <5 dwellings) at 60 homes per year totalling 1020 (years 2019 to 2036 only to avoid double counting).
This means there is currently a significant shortfall of sites to meet the identified housing need in Oxford.
Summary
2.40 In summary, the underlying objective of both the NPPF and Local Plan policy is to maintain and enhance the
vitality and viability of town centres, and to promote new sustainable development and economic growth in
town centre locations “first”. This policy objective is crucial as town centres are facing increasing economic
challenges associated with alternative forms of retailing; in particular online shopping and competition from
major out-of-centre developments (discussed further in Section 3).
2.41 Notwithstanding the town centre first policy, this does not rule out edge of centre development where identified
needs cannot be met in existing PSAs. Indeed the NPPF (paragraph 23) encourages local planning
authorities to assess the potential to expand town centres to ensure a sufficient supply of suitable sites. If
edge of centre sites cannot be identified to meet the identified needs “in full”, then local planning authorities
are required by the NPPF to set policies for meeting the identified needs in other accessible locations that are
well connected to the town centre, subject to an assessment of the impact of any proposed retail and town
centre uses on the vitality and viability of existing centres.
2.42 In the context of this study the City Council’s policies have provided a context to maintaining and enhancing
town centres. For the future, this has to be set in context with the dynamics of the retail economy (Section 3)
and planning policy. Our recommendations on maintaining a dynamic shopping frontage policy (Appendix 15)
provides further context to this approach.

RETAIL AND LEISURE STUDY 2017 Page 18
RETAIL AND LEISURE STUDY 2017 Page 19
3 RETAIL AND TOWN CENTRE TRENDS
3.1 This section summarises some of the key trends that have fuelled the changes in the retail sector over the last
three decades, and the impact of these trends on the UK’s town centres. It provides a commentary on the
impact of the downturn in the economy since 2007 and the growth of internet (‘multi-channel’) retailing on
consumer spending, retail development and retailers’ business strategies. Drawing on the latest research it
also describes how these trends may continue to shape changes in the future, and whether and how town
centres can respond to help maintain and enhance their overall vitality and viability.
Retail Trends
3.2 Following an unprecedented period of growth in retail sales and expenditure since the mid-1990s, the onset of
the longest and deepest economic recession in living memory in 2007/08 had a dramatic impact on consumer
spending and market demand. Business and consumer confidence was further weakened by public sector
cuts, the rise in VAT, increasing unemployment, less expansionary consumer credit and the rising cost of
living (including higher energy costs, petrol and housing prices). This reduced disposable income and
retailers’ margins were squeezed further.
3.3 Official figures show that the UK recovery began in early 2013 and although GDP growth peaked at 2.9% in
2014, it slowed to 2.2% in 2015 against the backdrop of a waning global economy and further uncertainty on
financial markets. The Brexit vote will further dampen business/consumer confidence and the prospects for
growth in 2016/17.
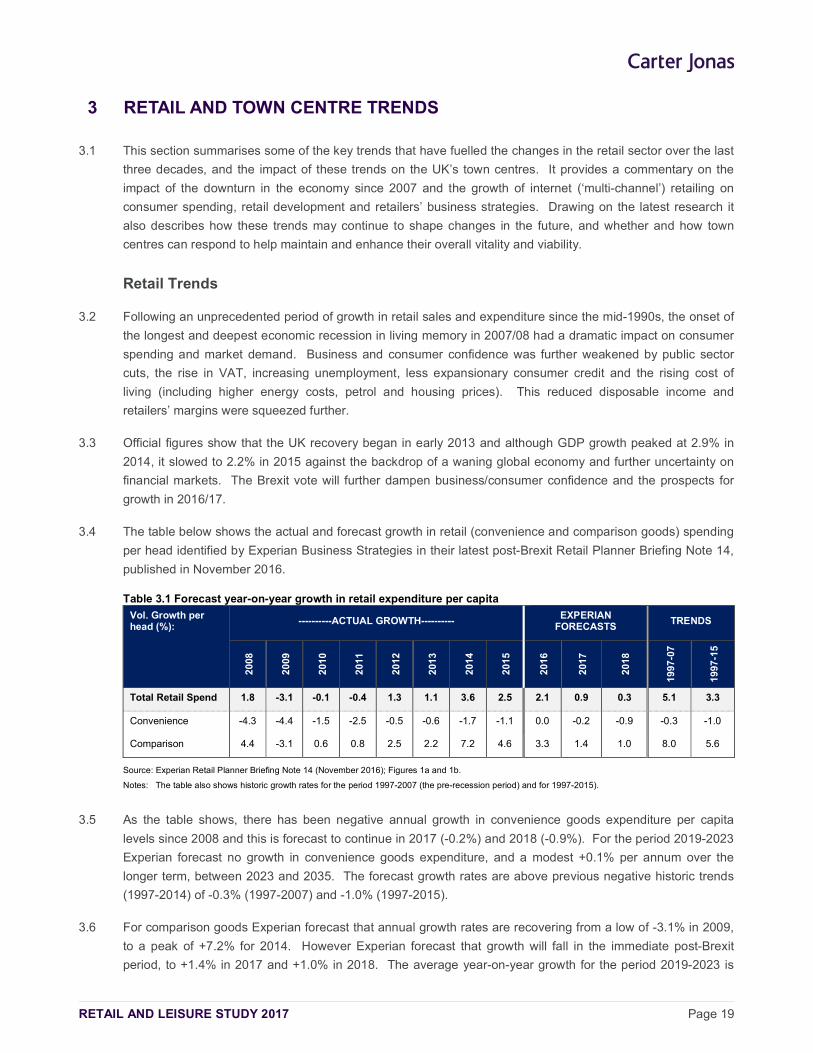
3.4 The table below shows the actual and forecast growth in retail (convenience and comparison goods) spending
per head identified by Experian Business Strategies in their latest post-Brexit Retail Planner Briefing Note 14,
published in November 2016.
Table 3.1 Forecast year-on-year growth in retail expenditure per capita
Vol. Growth per head (%):
----------ACTUAL GROWTH---------- EXPERIAN FORECASTS
TRENDS
200
8
200
9
201
0
201
1
201
2
201
3
201
4
201
5
201
6
201
7
201
8
199
7-0
7
199
7-1
5
Total Retail Spend 1.8 -3.1 -0.1 -0.4 1.3 1.1 3.6 2.5 2.1 0.9 0.3 5.1 3.3
Convenience -4.3 -4.4 -1.5 -2.5 -0.5 -0.6 -1.7 -1.1 0.0 -0.2 -0.9 -0.3 -1.0
Comparison 4.4 -3.1 0.6 0.8 2.5 2.2 7.2 4.6 3.3 1.4 1.0 8.0 5.6
Source: Experian Retail Planner Briefing Note 14 (November 2016); Figures 1a and 1b.
Notes: The table also shows historic growth rates for the period 1997-2007 (the pre-recession period) and for 1997-2015).
3.5 As the table shows, there has been negative annual growth in convenience goods expenditure per capita
levels since 2008 and this is forecast to continue in 2017 (-0.2%) and 2018 (-0.9%). For the period 2019-2023
Experian forecast no growth in convenience goods expenditure, and a modest +0.1% per annum over the
longer term, between 2023 and 2035. The forecast growth rates are above previous negative historic trends
(1997-2014) of -0.3% (1997-2007) and -1.0% (1997-2015).
3.6 For comparison goods Experian forecast that annual growth rates are recovering from a low of -3.1% in 2009,
to a peak of +7.2% for 2014. However Experian forecast that growth will fall in the immediate post-Brexit
period, to +1.4% in 2017 and +1.0% in 2018. The average year-on-year growth for the period 2019-2023 is
RETAIL AND LEISURE STUDY 2017 Page 20
forecast to be +2%, increasing slightly to +2.3% between 2024 and 2035. Despite the return to growth
forecast by Experian, it is clear that comparison goods growth rates are well below historic trends of +8% per
annum1. Furthermore, the retail sector is still vulnerable to fluctuations in the UK economy, and future
changes in the Eurozone (including the outcome of Brexit) and the wider global economy (such as the
slowdown in growth in China’s economy). This further dampening of growth rates will have implications for the
viability of existing retail businesses and the capacity for new retail floorspace over the short to medium term.
3.7 Experian’s research also shows that retail sales have prospered in the past two years on the back of buoyant
consumer confidence and spending. However, Experian warn that this buoyancy is true only in sales volume
terms, as values have been depressed by heavy discounting and persistent deflation of goods prices.
Experian (pre-Brexit) forecast that retail sales volume growth will ease from around +4% growth on average
over the past two years, to +2.9% in 2016 given the dampening in consumer spending power. They also
forecast that growth will continue at the same levels in 2017 as welfare cuts and rising interest rates bear
down on spending, offsetting the gains from continuing overall economic growth.
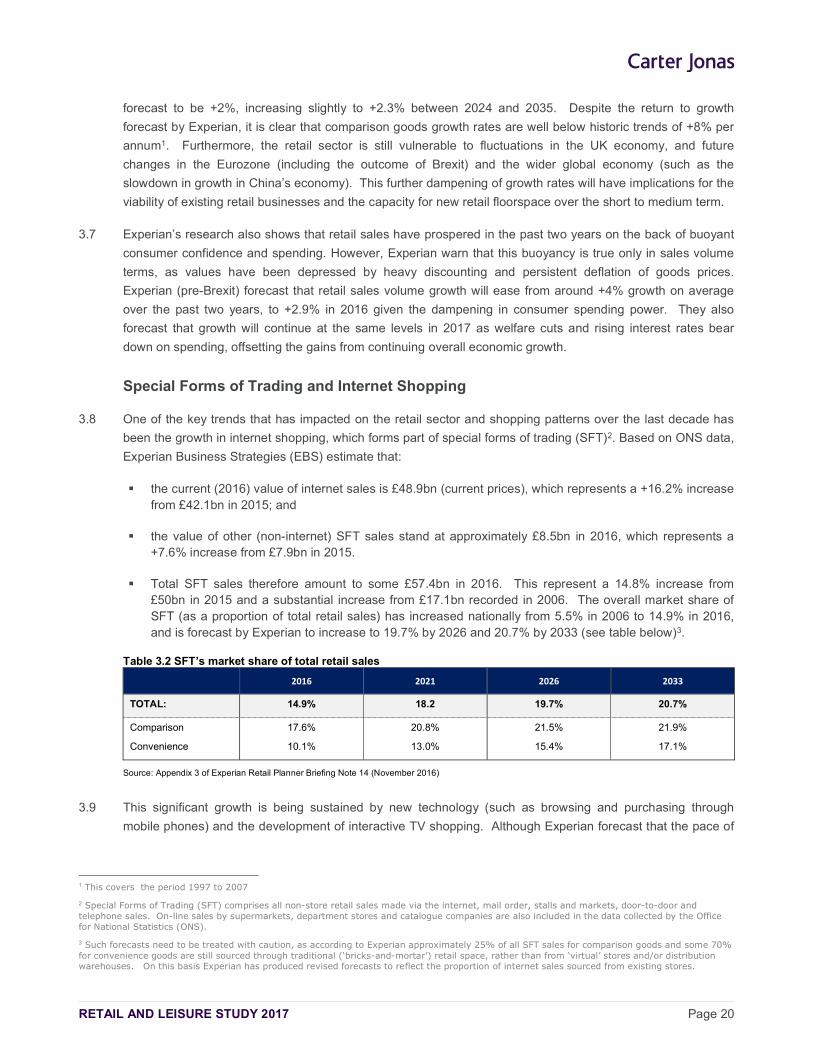
Special Forms of Trading and Internet Shopping
3.8 One of the key trends that has impacted on the retail sector and shopping patterns over the last decade has
been the growth in internet shopping, which forms part of special forms of trading (SFT)2. Based on ONS data,
Experian Business Strategies (EBS) estimate that:
the current (2016) value of internet sales is £48.9bn (current prices), which represents a +16.2% increase from £42.1bn in 2015; and
the value of other (non-internet) SFT sales stand at approximately £8.5bn in 2016, which represents a +7.6% increase from £7.9bn in 2015.
Total SFT sales therefore amount to some £57.4bn in 2016. This represent a 14.8% increase from £50bn in 2015 and a substantial increase from £17.1bn recorded in 2006. The overall market share of SFT (as a proportion of total retail sales) has increased nationally from 5.5% in 2006 to 14.9% in 2016, and is forecast by Experian to increase to 19.7% by 2026 and 20.7% by 2033 (see table below)3.
Table 3.2 SFT’s market share of total retail sales
2016 2021 2026 2033
TOTAL: 14.9% 18.2 19.7% 20.7%
Comparison
Convenience
17.6%
10.1%
20.8%
13.0%
21.5%
15.4%
21.9%
17.1%
Source: Appendix 3 of Experian Retail Planner Briefing Note 14 (November 2016)
3.9 This significant growth is being sustained by new technology (such as browsing and purchasing through
mobile phones) and the development of interactive TV shopping. Although Experian forecast that the pace of
1 This covers the period 1997 to 2007
2 Special Forms of Trading (SFT) comprises all non-store retail sales made via the internet, mail order, stalls and markets, door-to-door and telephone sales. On-line sales by supermarkets, department stores and catalogue companies are also included in the data collected by the Office for National Statistics (ONS).
3 Such forecasts need to be treated with caution, as according to Experian approximately 25% of all SFT sales for comparison goods and some 70% for convenience goods are still sourced through traditional (‘bricks-and-mortar’) retail space, rather than from ‘virtual’ stores and/or distribution warehouses. On this basis Experian has produced revised forecasts to reflect the proportion of internet sales sourced from existing stores.
RETAIL AND LEISURE STUDY 2017 Page 21
e-commerce growth will slow after 2020, other commentators suggest that the growth and market share could
be higher.
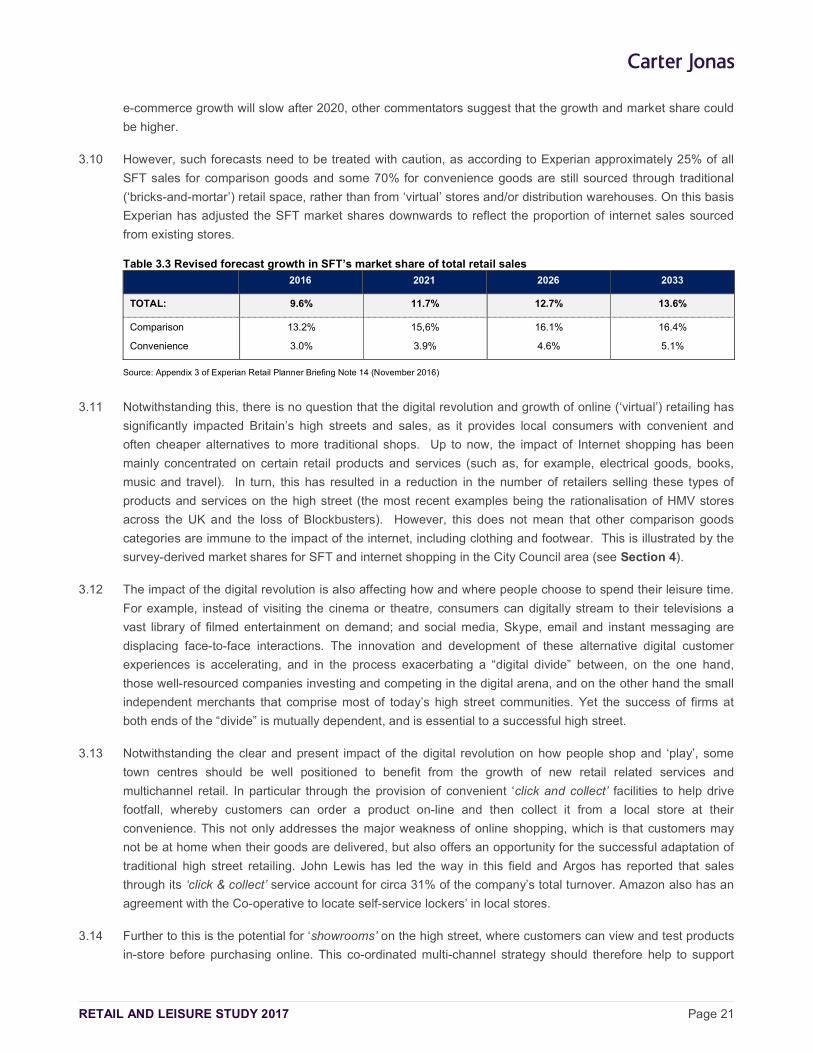
3.10 However, such forecasts need to be treated with caution, as according to Experian approximately 25% of all
SFT sales for comparison goods and some 70% for convenience goods are still sourced through traditional
(‘bricks-and-mortar’) retail space, rather than from ‘virtual’ stores and/or distribution warehouses. On this basis
Experian has adjusted the SFT market shares downwards to reflect the proportion of internet sales sourced
from existing stores.
Table 3.3 Revised forecast growth in SFT’s market share of total retail sales
2016 2021 2026 2033
TOTAL: 9.6% 11.7% 12.7% 13.6%
Comparison
Convenience
13.2%
3.0%
15,6%
3.9%
16.1%
4.6%
16.4%
5.1%
Source: Appendix 3 of Experian Retail Planner Briefing Note 14 (November 2016)
3.11 Notwithstanding this, there is no question that the digital revolution and growth of online (‘virtual’) retailing has
significantly impacted Britain’s high streets and sales, as it provides local consumers with convenient and
often cheaper alternatives to more traditional shops. Up to now, the impact of Internet shopping has been
mainly concentrated on certain retail products and services (such as, for example, electrical goods, books,
music and travel). In turn, this has resulted in a reduction in the number of retailers selling these types of
products and services on the high street (the most recent examples being the rationalisation of HMV stores
across the UK and the loss of Blockbusters). However, this does not mean that other comparison goods
categories are immune to the impact of the internet, including clothing and footwear. This is illustrated by the
survey-derived market shares for SFT and internet shopping in the City Council area (see Section 4).
3.12 The impact of the digital revolution is also affecting how and where people choose to spend their leisure time.
For example, instead of visiting the cinema or theatre, consumers can digitally stream to their televisions a
vast library of filmed entertainment on demand; and social media, Skype, email and instant messaging are
displacing face-to-face interactions. The innovation and development of these alternative digital customer
experiences is accelerating, and in the process exacerbating a “digital divide” between, on the one hand,
those well-resourced companies investing and competing in the digital arena, and on the other hand the small
independent merchants that comprise most of today’s high street communities. Yet the success of firms at
both ends of the “divide” is mutually dependent, and is essential to a successful high street.
3.13 Notwithstanding the clear and present impact of the digital revolution on how people shop and ‘play’, some
town centres should be well positioned to benefit from the growth of new retail related services and
multichannel retail. In particular through the provision of convenient ‘click and collect’ facilities to help drive
footfall, whereby customers can order a product on-line and then collect it from a local store at their
convenience. This not only addresses the major weakness of online shopping, which is that customers may
not be at home when their goods are delivered, but also offers an opportunity for the successful adaptation of
traditional high street retailing. John Lewis has led the way in this field and Argos has reported that sales
through its ‘click & collect’ service account for circa 31% of the company’s total turnover. Amazon also has an
agreement with the Co-operative to locate self-service lockers’ in local stores.
3.14 Further to this is the potential for ‘showrooms’ on the high street, where customers can view and test products
in-store before purchasing online. This co-ordinated multi-channel strategy should therefore help to support
RETAIL AND LEISURE STUDY 2017 Page 22
the vitality and viability of town centres over time, and the demand for retail space. This represents a clear
and present opportunity for the City Centre in particular given its retail profile and draw.
Floorspace ‘Productivity’ Growth
3.15 Floorspace ‘productivity’ (or turnover ‘efficiency’) growth represents the ability of retailers to absorb higher than
inflation increases in their costs over time (such as rents, rates and service charges) to help maintain their
profitability and viability. It is standard practice for retail planning assessments to make an allowance for the
year-on-year growth in the average sales densities of existing comparison and convenience goods retail
floorspace. However, there is limited evidence detailing actual changes in the turnover and profitability of
retailers over time. Furthermore analysis of past data and trends is complicated by the fact that sales density
increases have been affected by changes in the use of retail floorspace over the last 20 years; such as, for
example, the growth in out-of-centre retailing; Sunday-trading; longer opening hours; and the very strong
growth of retail expenditure relative to the growth in floorspace. Following the recession many retailers
struggled to increase or even maintain sales density levels and, together with other financial problems, this
resulted in some retailers going out of business.
3.16 The table below sets out the latest sales density growth forecasts for comparison and convenience goods
floorspace published by Experian Business Strategies (EBS), based on predicted changes in retail floorspace
over time and after making an allowance for ‘non-store’ (SFT) retailing.
Table 3.4 Forecast ‘productivity’ growth rates
2014 2015 2016 2017 2018 2019-23 2024-35
Convenience
Comparison
-2.0
+5.4
-1.2
+5.3
-0.3
+2.7
-0.1
+1.5
-0.4
+1.0
-0.1
+2.3
+0.1
+2.2
Source: Figures 4a and 4b, Experian Retail Planner Briefing Note 14 (November 2016)
3.17 The forecasts show that the scope for sales density growth is very limited for convenience goods retailing.
This is mainly due to slow growth in sales volumes and limited additions to the floorspace stock. For
comparison goods retailing, the trends towards more modern, higher density stores and the demolition of older
inefficient space is forecast to continue, resulting in average growth rates of over +2.0% per annum over the
next two decades. However, this is still well below the rate seen during the boom of the early years of this
century.
3.18 The floorspace ‘productivity’ growth rates forecast by EBS have been used to inform the retail capacity
assessment set out in Section 12 of this study. It should be noted however that we consider that existing
retailers and floorspace will have to achieve higher annual growth rates to absorb increasing costs in order to
remain viable.
Impact of Out-of-Centre Retailing
3.19 Alongside the dramatic growth in online shopping and sales over the last decade, it is apparent that the
appetite from investors and operators for new retail and leisure floorspace in out of centre locations has not
diminished. Research4 shows that there has been a significant shift of institutional retail investment away from
town centres over the last 20 years. In 1993, the proportion of investment held out of town was less than a
4 Property Data Report 2012, sourced from English Heritage Report (2013), The Changing Face of the High Street: Decline and Revival
RETAIL AND LEISURE STUDY 2017 Page 23
fifth of that in town centres; today the value of property owned out of town has overtaken that held in town
centres.
3.20 Larger format units in out-of-centre shopping parks are increasingly attractive locations for more traditional
high street retailers, with the benefits of good accessibility, lower costs and ample surface car parking
compared with town centres. Out-of-centre retailing also accounts for a significant proportion of existing and
new retail floorspace and sales in the UK. For example, research has highlighted the fact that of the new retail
developments approved since the NPPF was published in March 2012, 72% were in out of town locations,
16% were edge of centre and just 12% were in town centres.
3.21 Although planning policies and more restrictive conditions on what goods can and cannot be sold from some
retail warehouses and parks has slowed down the growth of out-of-centre retailing to a degree, the sector
continues to mature and move away from ‘bulky’ goods5 retailing to the provision of larger stores selling
fashion and homewares that compete directly with the high street. Examples include Next at Home (which now
includes a significant proportion of fashion sales), John Lewis at Home and Outfit (which includes the Arcadia
brands in one store, including Dorothy Perkins, Topshop, Burton, Wallis, etc.).
3.22 Continuation of this trend will further challenge the future vitality of many high streets as retailers choose edge
and out of centre locations ahead of town centres. The impact of these changes will also affect centres
differently depending on their function and the future growth in their catchment populations and expenditure.
For many towns, the simple fact is that in the future they will require a smaller, more concentrated retail core
repositioned for future consumer and retailer needs, and not focused on the past. This will further reinforce the
polarisation trend already being witnessed. The impact is likely to be felt across all centres to a greater or
lesser extent, manifested through high vacancy rates, falling rent levels, decreasing footfall, weakening
multiple retail offer and, potentially, a worsening town centre environment.
Changing Retailer Requirements
3.23 The economic downturn, the growth in internet shopping and the continued demand for out-of-centre shopping
has resulted in national retailers reviewing and rapidly adapting their business strategies, requirements and
store formats to keep pace with the dynamic changes in the sector and consumer demand.
3.24 This is probably best illustrated by the changes in the grocery sector over the last 2-3 years. Following a
sustained period of growth over almost 20 years, which was principally driven by new store openings, the
focus for the main grocery operators (i.e. Tesco, Sainsbury’s, Asda, Waitrose and Morrisons) has now shifted
to growing market share through new smaller convenience store formats (such as Tesco Express, Sainsbury’s
Local and Little Waitrose) and online sales. Over this period applications for large store formats have slowed
to a virtual standstill and in some cases permissions are not being built out6. At the other end of the grocery
spectrum, the European-led ‘deep discount’ food operators (namely Aldi and Lidl) are increasing their market
shares through new store openings across the UK. This will inevitably have implications for the scale and type
of new floorspace required by foodstore in the future.
3.25 In the non-food sector, those retailers that experienced significant growth up to 2007 have had to adapt to the
very different market conditions. The retailers that have not been flexible enough to respond to changing
5 ‘Bulky’ goods retailing is generally defined as comprising DIY goods, furniture and floor coverings, major household appliances and audio-visual equipment.
6 For example, Tesco is disposing of some 49 sites with relatively recent permissions for new foodstores, including sites in Ipswich, Basingstoke and Dartford.
RETAIL AND LEISURE STUDY 2017 Page 24
consumer needs, or are being squeezed in the increasingly competitive ‘middle ground’ between high-end and
value retailing, have largely struggled to maintain market share. In some cases, this has resulted in a series of
high profile ‘casualties’ and a number of key retailers have either disappeared from our high streets altogether
(e.g. Woolworths, TJ Hughes, Jessops and Jane Norman), or have significantly reduced their store portfolio in
centres across the UK (e.g. HMV etc.). Although the number of retailer ‘casualties’ has slowed over the last
12-18 months, there are still a number of traditional high street retailers that have recently been forced into
administration, most notably BHS and Austin Reed.
3.26 Research also shows that there is an increasing concentration of retailer demand and investment interest in
the larger regional and sub-regional centres (i.e. the ‘top 100’ centres), and specifically on the prime retail
pitches, with the secondary and tertiary pitches deteriorating. This is because these centres usually have
large and established catchment areas, and therefore represent less ‘risky’ investments in the current
uncertain economic climate. These larger centres have also generally benefitted from recent new shopping
centre development and investment over the last decade, and are therefore better placed than smaller and
medium sized centres to accommodate retailers’ requirements for modern larger format units. The
continuation of these trends will influence future operator requirements, with retailers looking to satisfy their
demand for larger modern premises in prime shopping locations, with strong catchment areas and a good
supply of appropriate retail space.
3.27 In addition to focusing their attention on larger, dominant centres, many of the multiples and traditional high
street retailers are changing their store formats and locational requirements. For example, key anchor retailers
such as Boots, Next, Mothercare, TK Maxx, John Lewis and Marks & Spencer are actively seeking larger
format units to showcase their full product range and to provide an exciting shopper environment backed by
the latest (digital) technology. As a result, it is the larger centres and out-of-centre retail parks that are often
best placed to meet this demand; as larger units are difficult to accommodate within existing high streets and
town centres, particularly historic areas characterised by conservation areas and listed buildings. As a result,
some traditional high street retailers are moving out of town centres to retail parks. For example, Marks &
Spencer has recently closed its traditional variety stores in Harlow, Great Yarmouth and Rugby, and opened
new stores in out-of-centre locations. This further underlines the growing demand from multiple retailers for
larger format shop units, and the need for town centres to provide a good mix of large modern units to help
attract and retain high street retailers, or potentially risk their relocation to new competing shopping
destinations.
3.28 These changes in retailer requirements and market demand will continue to have a significant impact on the
UK’s town centres and high streets, particularly in those cases where retailers make the decision to relocate
from town centres to out-of-centre locations, or even out of the area altogether.
Vacancy Levels
3.29 The impact of retail closures in town centres due to administration (beginning with Woolworths in 2008) and
portfolio rationalisation has led to a dramatic increase in national vacancy rates. Experian indicate that
national average vacancy levels almost more than doubled between 2006 and 2013, from circa 7% to 16%,
and more recently have fallen back to just over 9.1% in 2016, these national average figures do ‘mask’ the
reality for different centres and locations.
First, research shows that there is a significant polarisation in vacancy levels between prime and secondary centres, and between centres in the north and south. The generally more “healthy” centres, closer to London and the south-east have vacancy levels of less than 10%, whereas the more
RETAIL AND LEISURE STUDY 2017 Page 25
challenging conditions in centres such as Blackpool, Grimsby and Hull is resulting in vacancy levels over 20-25%.
Second, since 20127 a significant number of shopping centre and high street retail leases have expired as 25 year leases agreed in the late 1980’s and early 1990’s and more recently agreed sub-10 year leases all reach maturity. In some cases/locations, this has helped retailers with their portfolio rationalisation as they adjust their store requirements for the new multi-channel environment.
Third, in many centres, there can be as many as 25–30% of the occupied shops on temporary short-term lets, with little or no rent being paid8.
3.30 Experience shows that long-term vacancies and concentrations of vacant properties in centres can lead to a
‘spiral of decline’, engender feelings of neglect and lack of confidence in town centres, and act as a magnet for
crime and antisocial behaviour. Redeveloping and bringing vacant and under-used sites and properties back
into use can help stimulate vitality and economic viability, and kick-start local growth9.
3.31 In cases where these vacancies are long-term and units cannot be let, it will be necessary to consider
alternative uses and options for redevelopment. This can include temporary uses that ensure town centres
and frontages remain active, with the potential to accommodate business start-ups, art studios and galleries,
community/youth centres, etc. Another option is ‘meanwhile leases’ which can facilitate temporary occupation
of empty buildings while a permanent solution is being found. Furthermore, local planning authorities can
provide greater flexibility for changes of use in areas with high vacancy levels, particularly secondary frontages
(see Appendix 15), through local plan policies, Area Action Plans and other planning tools.
Trends in Retail-led Investment and Development
3.32 The weak UK retail economy, the low growth in retail sales volumes and the adverse impact of vacant space
all combined with the absence of development finance to create a very difficult climate for new shopping
centre development and investment in town centres since 2007. One of the key impacts was to ‘weed out’
some of the more expensive and unviable development schemes that were in the pipeline before the
economic downturn.
3.33 The Shopping Centre Development Pipeline Report published by the British Council of Shopping Centres
(BCSC) shows that the UK experienced, on average, nine new centre openings in each of the first 10 years of
the 21st century. However, following the development of circa 260,000 sqm in 2009, 232,000 sqm in 2010
and 280,000 sqm in 2011, 2012 was the first year since records began in 1983 that no significant new
shopping centres opened. Notwithstanding this, there are more positive and recent signs of new shopping
centre investment and development activity, with UK-based and international funds seeking assets (principally
in prime and secondary locations) that offer the potential for growth. In terms of new development, three
major schemes opened in 2013 with a total floorspace of circa 140,000 sqm (including Trinity Leeds).The Old
Market scheme in Hereford opened in 2014; and in 2015 there were a number of significant openings,
including Grand Central in Birmingham as part of the New Street station redevelopment and Friars Walk in
Newport (see case study below). Within the City Council area and the city centre in particular, the £440m
redevelopment of Westgate Shopping Centre represents a major investment. The 800,000 sq ft retail-led
mixed use development will have a 142,000 sq ft flagship John Lewis as its anchor department store, it will
7 Jones Lang LaSalle, Property Predictions, 2012.
8 Sourced from Beyond Retail (2013)
9 London Assembly Economy Committee: Open for Business. Empty shops on London’s high streets GLA, March 2013.
RETAIL AND LEISURE STUDY 2017 Page 26
provide space for shops, restaurants, cafés and leisure uses including a boutique 5- screen Curzon Cinema,
set in a mix of covered streets, arcades, lanes and squares.
3.34 Recent trends suggest that average scheme size is generally smaller than during the ‘golden age’ of shopping
centre development - less than 27,870 sqm (300,000 sq ft) - other than in the largest cities with the strongest
catchment populations and expenditure to support new floorspace. Furthermore, recent developments and
schemes in the pipeline have a significantly higher proportion of leisure uses and space than earlier shopping
centre developments. For example, Land Securities recently reported that leisure space had grown four-fold
in their new development schemes over the last 10 years; as illustrated by their major Trinity Leeds scheme
that includes a significant leisure and catering offer. In London, the High Street Quarter scheme in Hounslow
Metropolitan Centre will also include a significant food and beverage offer, anchored by a multi-screen cinema,
with a reduced retail offer (see case study below).
CASE STUDY 1: FRIARS WALK, NEWPORT, GWENT
Following the failure of previous retail led regeneration projects in Newport, the City Council began to implement a CPO strategy in 2010 to acquire land in its own name. It also commissioned a full design team to redesign the scheme, hold developer workshops and secure a new development partner, with Queensberry Real Estate appointed in September 2011.
In order to expedite design, planning and pre-letting, the Council then supported the developer by contributing £2m towards seed funding which greatly reduced the overall delivery programme and provided confidence to retailers of an opening window. It then secured a £1.5m grant from the Welsh government to progress demolition and site enabling work, prudentially borrowed £90m to provide a development loan facility to its development partner on commercial terms and committed a transport grant and capital funding towards the cost of a new integrated bus station.
In a coordinated private / public sector collaboration akin to a commercial joint venture, Queensberry has been able to engage in direct dialogue with key anchor retailers throughout the entire process, helping to maintain momentum and confidence in the scheme. These same retailers have also been reassured to see the Council’s £2m investment in high street public improvements and the renovation of the Municipal Market at the same time Friars Walk Shopping Centre (400,000 sq ft) opened on 12 November 2015. Major retailers secured include Debenhams, H&M, Next, Topshop and New Look, as well as an eight-screen Cineworld, and eleven restaurants.
By taking a direct interest in the financing of the development, and fully supporting its development partner, the Council ensured it achieved the scheme they wanted and was instrumental in creating a retail-led, mixed use project. Most importantly, the development is of sufficient critical mass to act as a catalyst to further future investment and deliver a step change in the perception of Newport City Centre.
CASE STUDY 2: HOUNSLOW HIGH STREET QUARTER, LONDON BOROUGH OF HOUNSLOW
The development of the Blenheim Centre in 2006, intended as phase one of the town centre regeneration, with a major Asda store and surface parking, had become isolated with weak links to the existing high street pitch. The high street was also declining due to a lack of right sized larger units for modern retailing and phase two of the project re-establishing links to the high street had become essential.
Hounslow Council commissioned a comprehensive masterplan in 2012 that identified the preferred development site to enhance the town centre retail and leisure offer. The Council then selected a development partner - Barratt London and Wilson Bowden - following a comprehensive marketing and procurement strategy.
The Council also resolved to use its Compulsory Purchase Order (CPO) powers to assemble the site and secured £500,000 in Round One of the Outer London Fund for a programme of shopfront improvements, events, and street markets. It also secured the largest combined award in Round Two for Hounslow high street and Brentford, worth £3m, matched by £750,000 from Hounslow Council. The investment kick-started the regeneration of Hounslow and Brentford town centres. With £100,000 of support from the Mayor’s Outer London Fund, Hounslow improved traders’ shopfronts in Hounslow and Brentford.
The Council has a vision to transform Hounslow town centre into one of west London’s most vibrant and exciting shopping and leisure destinations. Working with its development partners, the circa £100m leisure-led and mixed-use development in Hounslow town centre has been granted planning permission. Known as ‘High Street Quarter’, the scheme will provide 400 new residential units, a multiplex, restaurants, public space and underground parking.
3.35 Even smaller schemes, such as those in Hereford and Salisbury, are providing between 5-10 restaurant
(Class A3) units. Such demand is especially true in those town centres that have wider employment, tourist or
other attractions and offer the potential for longer stay shopping. It is apparent that the trend towards more
eating out and more informal restaurants and catering outlets across town centres is now very much part of
new investment and development. This trend clearly has implications for the future planning and development
of the City Council’s main centres and the delivery of a realistic retail vision.
RETAIL AND LEISURE STUDY 2017 Page 27
3.36 Given that it takes on average over ten years for a town centre scheme to be planned and developed, then it
follows that it will take a number of years for centres to benefit from the economic upturn and renewed
investment and development confidence. Town centre redevelopment is complex and complicated by
fragmented ownership in many centres, which acts as a barrier to site assembly and the creation of new
development and infill schemes that might provide the right type of larger format retail units to attract
expanding retailers. Small units and fragmented ownership are not conducive to accommodating many of
today’s retailer requirements. As a result, local planning authorities will need to take a more proactive role in
attracting and/or delivering new investment and development in town centres. This was a key
recommendation of the recent BCSC research ‘Enabling Retail Development’ (2015) which identified the
following interventions by local authorities based on their case study research:
Investor: Newport (see case study), Sheffield, Oldham, Walsall
Developer: Sheffield , Oldham, Bradford, Walsall
Masterplanner/site assembly: Ealing, Hounslow (see case study), Newport
Owner and management company: Woking (see case study)
Public Realm delivery: Hemel Hempstead, Bradford
High Street improvements and grants: Newport, Hounslow, Bradford
3.37 Furthermore, the more challenging retail environment means that those shopping locations outside the ‘top
100’ centres that missed the previous (pre-recession) development cycle may face a long wait for new town
centre development, as investors look to reduce their exposure and risks. While existing shopping centres
may provide the opportunity for asset management by their owners to improve their overall attraction, offer
and turnover (such as, for example, through extensions and/or increasing the food, beverage and leisure
offer), it can still be problematical and prohibitively expensive to reconfigure units in the more dated early
generation shopping centres. In addition, a lack of finance in recent years has severely limited investment in
these centres. Therefore, even where there is single ownership and control, activity to create the right type of
units for retailers has been restricted. However, it is preferable to work with existing schemes, where possible,
to avoid simply moving retailers from one scheme to another and creating yet more vacant units.
CASE STUDY 3: WOLSEY PLACE, WOKING
Woking Council’s business development strategy at the start of the millennium was to expand the number of major head office buildings in the Borough, and create new inward investment through business development. However, the sub-standard town centre environment was undermining these objectives. Lack of direct control in the town centre made a remedy difficult to achieve. The purchase of the Peacocks shopping centre by Northern Irish investors Moyallen was the catalyst for change. A willingness to engage positively and collaboratively with the local authority provided the foundation for a joint venture which has transformed the town centre. Woking Borough Council purchased Wolsey Place shopping Centre in 2010 to ensure direct control. It created a management structure with Moyallen to create Woking Shopping, to ensure the town centre enjoyed effective asset management and tenant mix planning. This saw private sector experience and expertise supporting the creation of a credible plan to deliver on key objectives over a defined timescale.
The first phase saw the exploration of deficiencies in the town centre offer and creation of plans to remedy these deficiencies quickly. This resulted in a phased programme to upgrade the public realm, introduce new family dining offers and further refine the retail offer, resulting in new traders opening in Woking. The Council then looked at a more ambitious project to deliver a new M&S store – to provide an opportunity for associated development and new hotel accommodation, as well as a strong market for town centre apartments on Victoria Square. Both the Borough Council and County Council have taken a direct interest in the proposals that provide for a new 60,000 sq ft M&S store with 58,000 sq ft of associated retail, a 190 bedroom hotel with Spa, conference facilities and restaurants. The plan also features two new civic spaces and associated new public realm, 392 apartments in two towers and 380 new car parking spaces.
Site assembly for Victoria Square has required the relocation of the market, with a collaborative approach between Woking and Moyallen market specialising in food. The approach supported the vision to enhance the town centre environment by creating improved public realm, a better retail offer and a significantly improved and enhanced trading opportunity for the market. The positive impacts to date have included increased footfall, improved car park usage, better quality retailers and improved engagement with the local shopping catchment. Also, to validate the original criteria, over 100 new inward investment enquiries have been received in the last two years, over 1,000 new jobs have been created and over £3.5m of new third party funding has been attracted.
RETAIL AND LEISURE STUDY 2017 Page 28
3.38 Even with internet growth, additional floorspace remains one of the primary mechanisms that retailers use to
grow profit and if they cannot occupy or adapt existing space, they will often look elsewhere. This means that
new retail development solutions are likely to need to become more imaginative in the way in which existing
properties (including listed buildings) are altered in order to help prevent further diversion of trade to out-of-
centre locations. Notwithstanding this, the economic rationale for new floorspace in many town centres is
much reduced and some commentators10 argue that the focus will increasingly be on enhancing and updating
the existing town centre fabric.
Independents and Markets
3.39 Multiples continue to be a powerful force within the retail sector, both as marketable brands, and in their ability
to secure prime locations in town centres. However, this does not underestimate or undervalue the important
role of small independent shops11 and street markets, which help to improve consumer choice and
convenience to the communities they serve, as well as generating significant benefits for town centre
economies in terms of local employment and income generation. Furthermore, it is widely accepted that a
good mix of independent shops and market stalls help to enhance the character, diversity and vibrancy of
town centres, preventing the growth of so-called “clone towns”12 due to the increasing colonisation of centres
by larger chain stores.
“Is the spread of clone towns and the creeping homogenisation of the high street anything more than an
aesthetic blight? We think so. Yes, distinctiveness and a sense of place matter to people. Without
character in our urban centres, living history and visible proof that we can in some way shape and
influence our living environment we become alienated in the very places that we should feel at home.”
(New Economics Foundation, Reimagining the High Street, 2010)
3.40 Notwithstanding this, research shows that the number of small shops in the UK has declined in the past
decade. This decline has been caused by multiple factors, including changes in shopping behaviour,
competition from supermarkets, internet shopping and rising costs (including rents and rates).
3.41 In terms of street markets, the 1994 Rhodes Report into the Retail Market sector demonstrated its collective
and economic strength. From this report, the industry has been successful in demonstrating its national
economic value and successive governments have started to value the role of markets as a vibrant and active
part of the future of our town centres and the High Street. This is illustrated by the NPPF (paragraph 23),
which places weight on the need to “retain and enhance existing markets and, where appropriate, re-introduce
or create new ones, ensuring that markets remain attractive and competitive”.
3.42 The Portas Review also identified markets as an important factor in the future of successful town centres. This
review produced 28 recommendations for reforms and whilst the success (or otherwise) of the Portas Pilots
and other interventions are still the subject of debate, recommendation No 17, a national market day, was
grasped by the retail market industry. In May 2012 the first ‘Love Your Local Market Fortnight’ (LYM) was
rolled out as an annual national celebration of all things positive about retail markets in the UK. The
Department for Communities and Local Government (DCLG) have also been very proactive in supporting the
positive role of markets in the UK and town centre economies, and there is a Minister with responsibility for
Town Centres and Markets. The Great Yarmouth MP Brandon Lewis held this position in the first year and
10 English Heritage (2013), The Changing Face of the High Street: Decline and Revival 11 Defined by the Town Centres SPG as a shop with a gross floorspace of 80 sqm or less.
12 New Economics Foundation (NEF) Clone Town Britain Report (2005 and 2010)
RETAIL AND LEISURE STUDY 2017 Page 29
Marcus Jones MP is now the current Minister. It is important to note however that whilst DCLG continue to
support the market industry the initial government funding for LYM is ending.
3.43 Retail Markets continue to make a meaningful contribution to Towns and Cities across the UK. The successful
markets we see today are those that have embraced change and adapted alongside the town in which they
trade. As the demographics of a town change a successful market will reflect this change and continue to
cater for and attract the residents creating a vibrant and successful market. This will in turn attract visitors from
outside the area and increase the value of the market. Recent research documents supporting the benefits of
Markets can be found via the following link: http://www.nabma.com/publications/research-documents/.
3.44 In summary, providing for the needs of modern retailers in larger format stores, principally through new retail-
led developments, whilst maintaining the viability, representation and mix of independent businesses and
market stalls is a difficult balancing act for local planning authorities. It will be a greater challenge going
forward with the threat of internet shopping and a fragile economy in the post-Brexit age, but it is vitally
important that the diversity of a centre’s offer is not undermined by the new retail brands.
Summary
3.45 This section has illustrated that existing floorspace in town centres face a myriad of challenges. These will
continue to grow over the Council’s Plan period. This notwithstanding, for the centres within the City Council
area to perform strongly they will need to adapt and embrace the new dynamics. There is still a role for
existing floorspace and physical ‘store based’ retailing in town centres.
3.46 There are positive signs that the UK is emerging from the shadow of the longest and deepest economic
downturn in living memory, but it is clear that it is clear that our town centres and high streets post-recession
are facing a myriad of challenges and pressures to simply retain retail businesses, let alone attract new
investment and development.
First, although the economy in general and retail sector in particular is forecast to experience growth over the short to medium term at least13, albeit at a slower pace than in 2014 and 2015, there are risks to these growth forecasts. This is not least due to the slowdown in global economies, an increase in interest rates and the potential fallout from Brexit and global uncertainties arising from international politics.
Second, the growth of online shopping is affecting the vitality and viability of many of Britain’s centres and high streets.
Third, although the NPPF reinforces the longstanding policy objective of promoting development and investment in town centres first, the market appetite for new and extended shopping facilities in out-of-centre locations shows no signs of slowing. The lack of available, suitable and viable sites in town centres to meet the demands of modern retailers and commercial leisure operators for larger format units will inevitably result in an increase in new out-of-centre applications and/or applications to widen ‘bulky goods’ conditions on existing retail parks.
3.47 Within the Oxford City Council area, the redevelopment of the Westgate Centre is a positive investment sign
responding to changing shopping and spending patterns. The same applies to lower order centres for their
need to adapt to the changes in shopping habits, which move away from solely being retail led locations to
those that offer a wider range of retail, leisure, cultural and other amenities. This is to encourage increased
dwell times and to create more purpose in frequenting centres.
RETAIL AND LEISURE STUDY 2017 Page 30
3.48 These trends, and others, are placing pressures on rental growth and market demand in many centres;
particularly the smaller secondary centres and market towns outside the ‘top 100’ shopping locations. This
has been further compounded by rising vacancy levels and the loss of key retailers. As a result, the share of
non-food retail sales conducted through town centre shops has declined from 64% in 2002 to just over 40% by
2013. Indeed research predicts that by 2020, the impact of declining in-store sales will result in a 31%
reduction in high street stores14.
3.49 As a result a far more uncertain future awaits the next wave of new retail investment and development. The
evidence suggests that:
At one end of the spectrum the larger, more dominant centres will get stronger; attracting high profile domestic and international retailers and combining these attractors with an increasingly diverse leisure and food and beverage offer.
At the other end of the spectrum the smaller local and neighbourhood centres are less affected; they are principally meeting the everyday retail, service and community needs of their local (‘walk-in’) resident catchment populations.
It is the medium-sized towns that occupy the middle ground that are increasingly being squeezed by the dynamic shifts in retailer demand and investment. Historically, such towns have had a reasonably large comparison shopping function, but this is beginning to shrink back because the demand from multiples is slowing and the space offered is often of the wrong size and configuration, and in the wrong location to meet today’s retailer requirements.
3.50 Notwithstanding these threats, industry experts still predict that the demand from major retailers for new
physical space in the right locations with strong catchments will continue, as it still remains one of the primary
mechanisms for retailers to ‘reach’ their customers, to grow their businesses and to increase market share and
profitability. Over the short to medium term, any increased demand for space from retailers will have to be
met by the current retail stock (i.e. existing shopping centres, the high street and out-of-centre facilities). This
is because there is limited new retail floorspace in the pipeline in town centres and, in any case, it can take a
long time to deliver new development on complex town centres sites.
3.51 With increased demand and the lack of supply over the short to medium term, research for the British Council
of Shopping Centres (BCSC) predicts that this will effectively ‘push up’ rental levels for the larger modern
desirable units until a significant amount of new development reaches completion. As a result, over the
medium term, retailers will be competing for limited available space.
3.52 Therefore, those shopping locations that are able to accommodate and deliver new developments over the
next 5-10 years should be in a good position to attract operator interest. However, this will depend on the new
retail floorspace being in the right location (i.e. preferably prime shopping locations, with good accessibility,
parking, etc.) and having the right size, format and specification to meet the needs of modern retailers. Due
care and attention will also need to be paid to ensuring that the new floorspace and tenants complement
rather than compete with the centre’s existing offer, and strengthen rather than weaken the existing pedestrian
circuit so as to generate the maximum benefits for the centre’s overall vitality and viability.
3.53 In this context, it is clear that the ‘top 50-100’ prime centres and shopping locations in Britain should continue
to flourish once the economy recovers. The greatest challenge facing local planning authorities will be how to
14 Javelin Group (October 2011), ‘How Many Stores Will We Really Need?’

RETAIL AND LEISURE STUDY 2017 Page 31
revitalise the fortunes of struggling small and medium sized centres and market towns that do not have the
critical mass of retail, leisure and other uses to compete for more limited investment and development.
3.54 This provides the important background and context for assessing and understanding the potential for new
retail investment and development in Oxford City and the main District Centres over the short, medium and
long term.
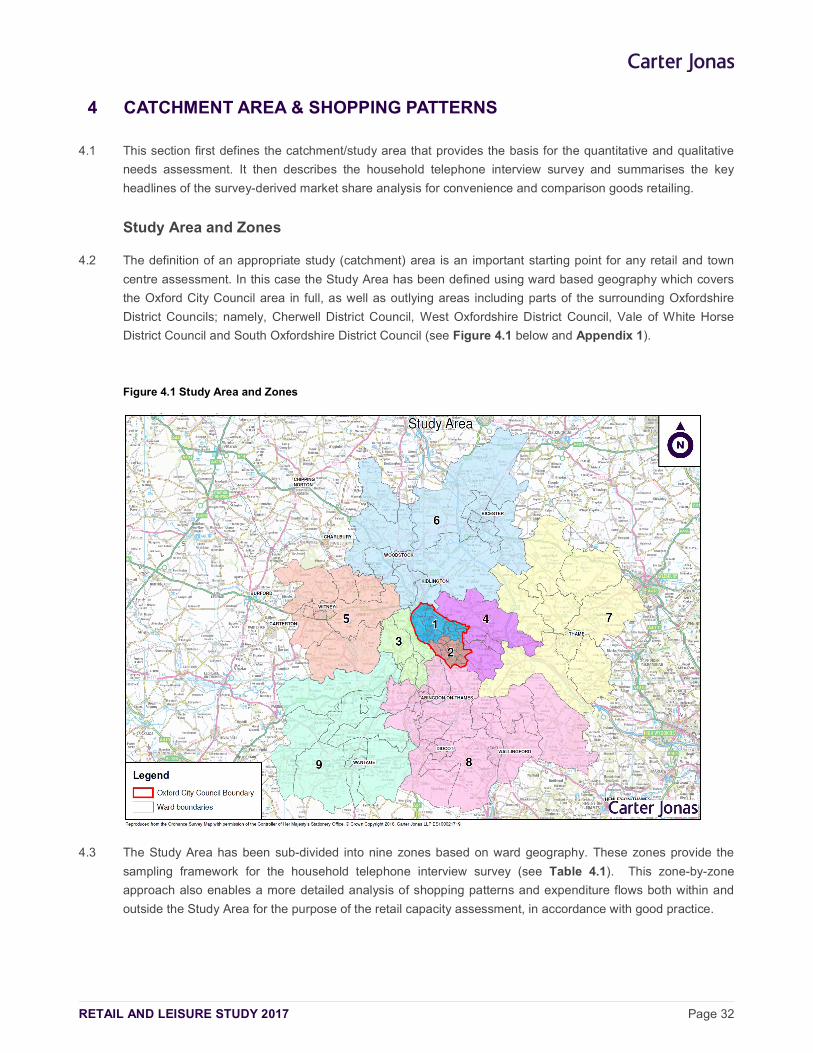
RETAIL AND LEISURE STUDY 2017 Page 32
4 CATCHMENT AREA & SHOPPING PATTERNS
4.1 This section first defines the catchment/study area that provides the basis for the quantitative and qualitative
needs assessment. It then describes the household telephone interview survey and summarises the key
headlines of the survey-derived market share analysis for convenience and comparison goods retailing.
Study Area and Zones
4.2 The definition of an appropriate study (catchment) area is an important starting point for any retail and town
centre assessment. In this case the Study Area has been defined using ward based geography which covers
the Oxford City Council area in full, as well as outlying areas including parts of the surrounding Oxfordshire
District Councils; namely, Cherwell District Council, West Oxfordshire District Council, Vale of White Horse
District Council and South Oxfordshire District Council (see Figure 4.1 below and Appendix 1).
Figure 4.1 Study Area and Zones
4.3 The Study Area has been sub-divided into nine zones based on ward geography. These zones provide the
sampling framework for the household telephone interview survey (see Table 4.1). This zone-by-zone
approach also enables a more detailed analysis of shopping patterns and expenditure flows both within and
outside the Study Area for the purpose of the retail capacity assessment, in accordance with good practice.
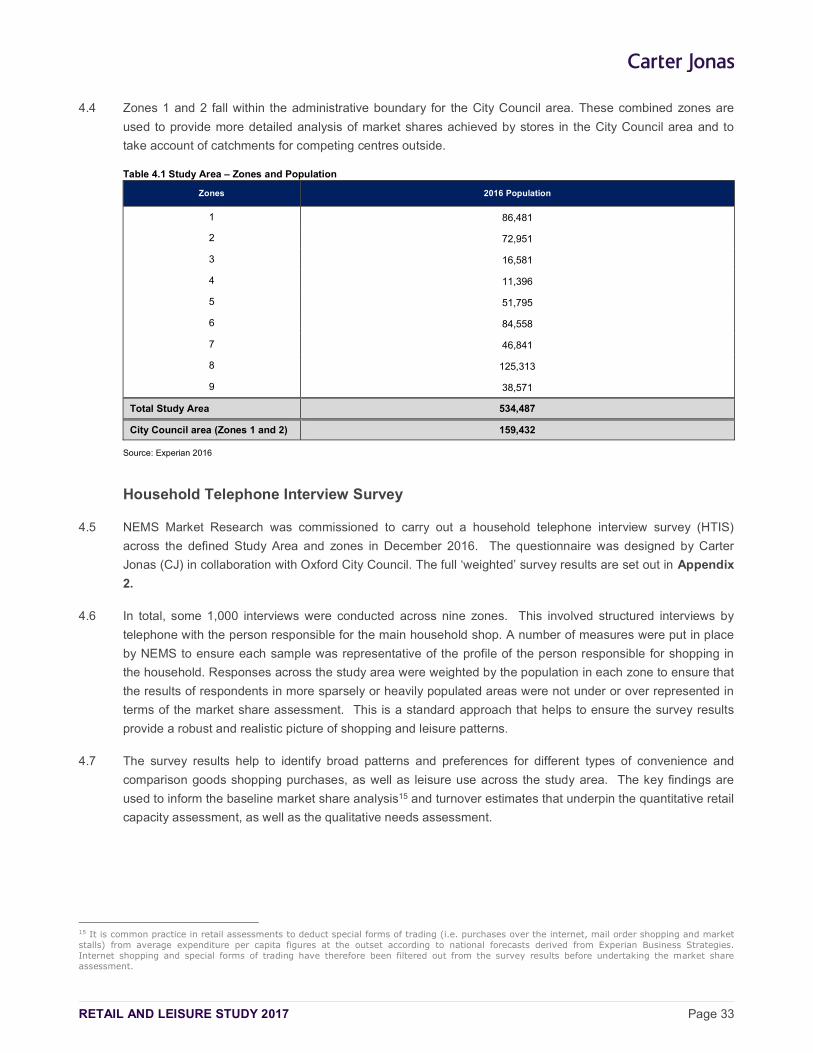
RETAIL AND LEISURE STUDY 2017 Page 33
4.4 Zones 1 and 2 fall within the administrative boundary for the City Council area. These combined zones are
used to provide more detailed analysis of market shares achieved by stores in the City Council area and to
take account of catchments for competing centres outside.
Table 4.1 Study Area – Zones and Population
Zones 2016 Population
1 86,481
2 72,951
3 16,581
4 11,396
5 51,795
6 84,558
7 46,841
8 125,313
9 38,571
Total Study Area 534,487
City Council area (Zones 1 and 2) 159,432
Source: Experian 2016
Household Telephone Interview Survey
4.5 NEMS Market Research was commissioned to carry out a household telephone interview survey (HTIS)
across the defined Study Area and zones in December 2016. The questionnaire was designed by Carter
Jonas (CJ) in collaboration with Oxford City Council. The full ‘weighted’ survey results are set out in Appendix
2.
4.6 In total, some 1,000 interviews were conducted across nine zones. This involved structured interviews by
telephone with the person responsible for the main household shop. A number of measures were put in place
by NEMS to ensure each sample was representative of the profile of the person responsible for shopping in
the household. Responses across the study area were weighted by the population in each zone to ensure that
the results of respondents in more sparsely or heavily populated areas were not under or over represented in
terms of the market share assessment. This is a standard approach that helps to ensure the survey results
provide a robust and realistic picture of shopping and leisure patterns.
4.7 The survey results help to identify broad patterns and preferences for different types of convenience and
comparison goods shopping purchases, as well as leisure use across the study area. The key findings are
used to inform the baseline market share analysis15 and turnover estimates that underpin the quantitative retail
capacity assessment, as well as the qualitative needs assessment.
15 It is common practice in retail assessments to deduct special forms of trading (i.e. purchases over the internet, mail order shopping and market stalls) from average expenditure per capita figures at the outset according to national forecasts derived from Experian Business Strategies. Internet shopping and special forms of trading have therefore been filtered out from the survey results before undertaking the market share assessment.
RETAIL AND LEISURE STUDY 2017 Page 34
Convenience Goods – Market Share Analysis
4.8 Convenience goods16 retailing is generally defined as comprising everyday essential items (including food,
drinks, newspapers/magazines and confectionery), as well as an element of non-durable housing goods (such
as washing up liquid, kitchen roll, bin bags, etc.). The survey-derived market share (%) analysis for all
convenience goods shopping is set out in Table 1 of Appendix 7. It should be noted that for this stage of the
analysis the market shares for both convenience and comparison goods retailing include expenditure on
Special Forms of Trading17 (including internet sales), but exclude ‘null’ responses (such as ‘don’t knows’, etc.)
in accordance with good practice.
4.9 The overall market shares in Table 1 have been derived from the analysis of the responses as to where
people normally shop for their main (‘bulk’) and ‘top up’ grocery purchases. The market shares for these
different types of food shopping are set out in detail in Tables 2-3 of Appendix 7.
4.10 In order to avoid the market share analysis of food shopping patterns being ‘skewed’ by larger superstores
and foodstores in the study area, the survey also asked respondents where else they normally shop (if
anywhere) for their ‘main’ and ‘top up’ purchases in addition to the first store identified. The market shares are
set out in Table 4 for ‘top up food purchases’ and Table 5 for ‘other top up food purchases’ (Appendix 7).
4.11 The responses for ‘primary’ and ‘secondary’ food shopping purchase have then been merged through the
application of a weighting based on judgements as to the proportion of household expenditure normally
accounted for by each type of convenience goods shopping. Assumptions are informed by Question 6 of the
household survey that identifies the proportion of expenditure spent on main food shopping. In this case we
have applied a weighting of 60% for main ‘bulk’ shopping; 15% for secondary main ‘bulk’ shopping; 15% for
primary ‘top-up’ shopping; and 10% for secondary ‘top-up’ shopping.
4.12 The key findings of the market share analysis are briefly described below.
4.13 In terms of the market share of Special Forms of Trading (SFT), and principally internet shopping, Table 1
(Appendix 7) shows that the share of all food shopping across the study area (i.e. Zones 1-9) is 7.9%;
decreasing to 5.6% based on the City Council catchment area zones (Zones 1 and 2). SFT’s share varies
across the Study Area from a low of 3.5% in Zone 2 to 10.5% in Zone 6. Higher SFT market shares in less
built up areas correlates to a greater reliance on online grocery shopping where there is less access to
foodstore provision compared to more urban areas.
4.14 Experian’s latest Retail Planning Briefing Note 14 (November 2016) shows that the national average market
share for non-store (SFT) convenience goods retail sales is 10.1% (see Section 3). This is higher than the
market share for the Core Catchment Study Area (Zones 1 and 2) of 5.6% but lower than that for Zone 6
(10.5%). A number of factors may influence this lower than average market share such as good access to
foodstores and the extent/quality of internet infrastructure. This highlights the potential for SFT market
penetration to increase in the future as online grocery shopping becomes more popular and convenient. If this
was to occur, then it would potentially reduce the expenditure available to support the need (‘capacity’) for new
(‘physical’) retail floorspace over the forecast period to 2036 (see Section 12).
4.15 Turning to the market share analysis for the main centres and stores in the City Council Area, Table 1 shows
that they are achieving an overall market share (‘retention level’) of 29.7% within the study area (Zones 1 - 9),
16 For the purpose of this retail assessment ‘convenience goods’ and ‘food’ shopping have the same meaning.
17 A more detailed explanation of SFT is set out in Section 3.
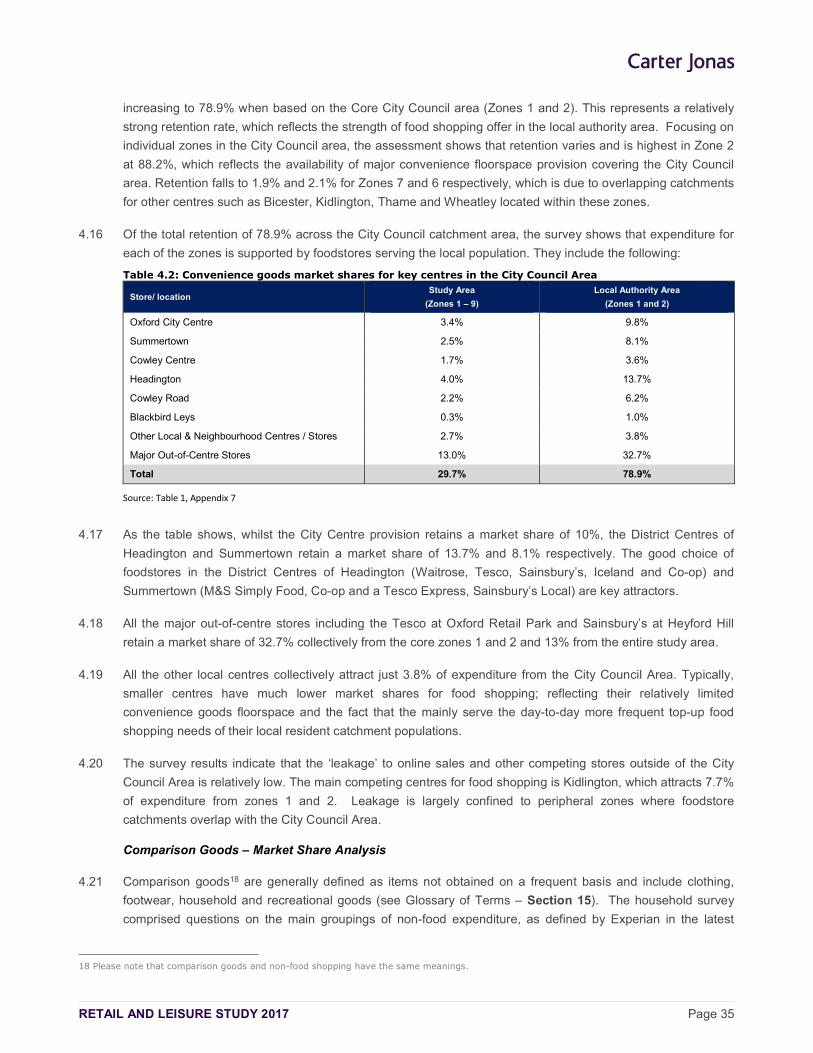
RETAIL AND LEISURE STUDY 2017 Page 35
increasing to 78.9% when based on the Core City Council area (Zones 1 and 2). This represents a relatively
strong retention rate, which reflects the strength of food shopping offer in the local authority area. Focusing on
individual zones in the City Council area, the assessment shows that retention varies and is highest in Zone 2
at 88.2%, which reflects the availability of major convenience floorspace provision covering the City Council
area. Retention falls to 1.9% and 2.1% for Zones 7 and 6 respectively, which is due to overlapping catchments
for other centres such as Bicester, Kidlington, Thame and Wheatley located within these zones.
4.16 Of the total retention of 78.9% across the City Council catchment area, the survey shows that expenditure for
each of the zones is supported by foodstores serving the local population. They include the following:
Table 4.2: Convenience goods market shares for key centres in the City Council Area
Store/ location Study Area
(Zones 1 – 9)
Local Authority Area
(Zones 1 and 2)
Oxford City Centre 3.4% 9.8%
Summertown 2.5% 8.1%
Cowley Centre 1.7% 3.6%
Headington 4.0% 13.7%
Cowley Road 2.2% 6.2%
Blackbird Leys 0.3% 1.0%
Other Local & Neighbourhood Centres / Stores 2.7% 3.8%
Major Out-of-Centre Stores 13.0% 32.7%
Total 29.7% 78.9%
Source: Table 1, Appendix 7
4.17 As the table shows, whilst the City Centre provision retains a market share of 10%, the District Centres of
Headington and Summertown retain a market share of 13.7% and 8.1% respectively. The good choice of
foodstores in the District Centres of Headington (Waitrose, Tesco, Sainsbury’s, Iceland and Co-op) and
Summertown (M&S Simply Food, Co-op and a Tesco Express, Sainsbury’s Local) are key attractors.
4.18 All the major out-of-centre stores including the Tesco at Oxford Retail Park and Sainsbury’s at Heyford Hill
retain a market share of 32.7% collectively from the core zones 1 and 2 and 13% from the entire study area.
4.19 All the other local centres collectively attract just 3.8% of expenditure from the City Council Area. Typically,
smaller centres have much lower market shares for food shopping; reflecting their relatively limited
convenience goods floorspace and the fact that the mainly serve the day-to-day more frequent top-up food
shopping needs of their local resident catchment populations.
4.20 The survey results indicate that the ‘leakage’ to online sales and other competing stores outside of the City
Council Area is relatively low. The main competing centres for food shopping is Kidlington, which attracts 7.7%
of expenditure from zones 1 and 2. Leakage is largely confined to peripheral zones where foodstore
catchments overlap with the City Council Area.
Comparison Goods – Market Share Analysis
4.21 Comparison goods18 are generally defined as items not obtained on a frequent basis and include clothing,
footwear, household and recreational goods (see Glossary of Terms – Section 15). The household survey
comprised questions on the main groupings of non-food expenditure, as defined by Experian in the latest
18 Please note that comparison goods and non-food shopping have the same meanings.
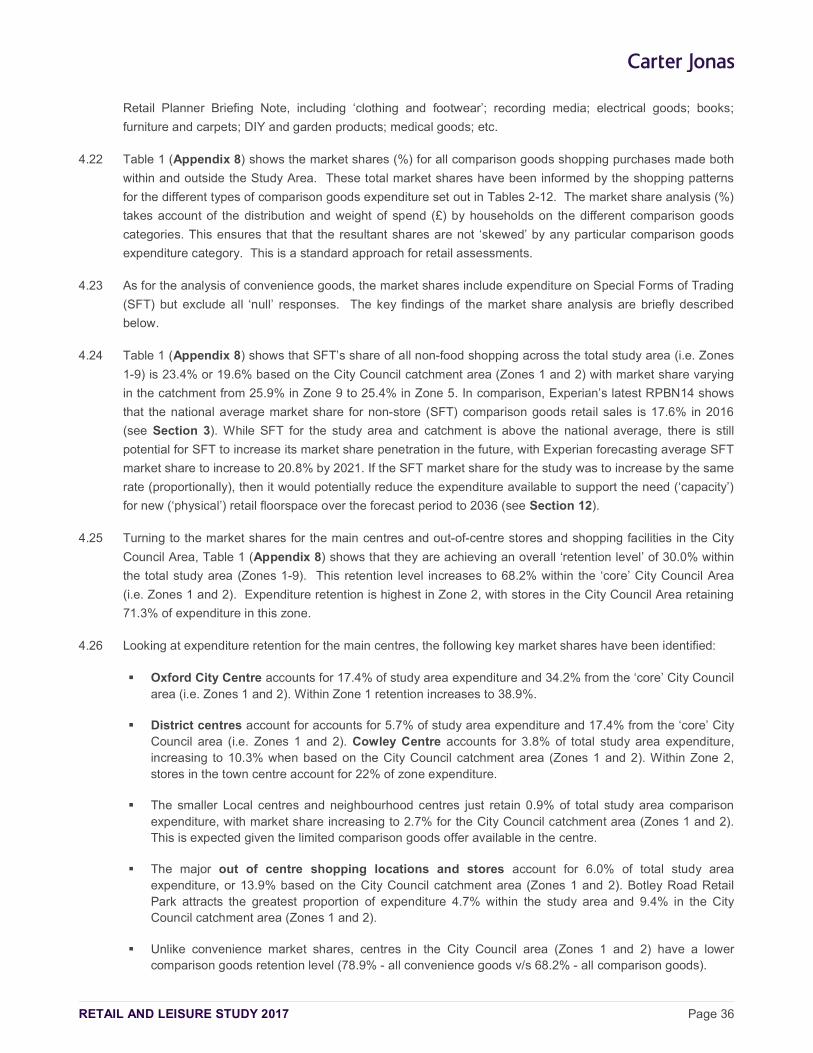
RETAIL AND LEISURE STUDY 2017 Page 36
Retail Planner Briefing Note, including ‘clothing and footwear’; recording media; electrical goods; books;
furniture and carpets; DIY and garden products; medical goods; etc.
4.22 Table 1 (Appendix 8) shows the market shares (%) for all comparison goods shopping purchases made both
within and outside the Study Area. These total market shares have been informed by the shopping patterns
for the different types of comparison goods expenditure set out in Tables 2-12. The market share analysis (%)
takes account of the distribution and weight of spend (£) by households on the different comparison goods
categories. This ensures that that the resultant shares are not ‘skewed’ by any particular comparison goods
expenditure category. This is a standard approach for retail assessments.
4.23 As for the analysis of convenience goods, the market shares include expenditure on Special Forms of Trading
(SFT) but exclude all ‘null’ responses. The key findings of the market share analysis are briefly described
below.
4.24 Table 1 (Appendix 8) shows that SFT’s share of all non-food shopping across the total study area (i.e. Zones
1-9) is 23.4% or 19.6% based on the City Council catchment area (Zones 1 and 2) with market share varying
in the catchment from 25.9% in Zone 9 to 25.4% in Zone 5. In comparison, Experian’s latest RPBN14 shows
that the national average market share for non-store (SFT) comparison goods retail sales is 17.6% in 2016
(see Section 3). While SFT for the study area and catchment is above the national average, there is still
potential for SFT to increase its market share penetration in the future, with Experian forecasting average SFT
market share to increase to 20.8% by 2021. If the SFT market share for the study was to increase by the same
rate (proportionally), then it would potentially reduce the expenditure available to support the need (‘capacity’)
for new (‘physical’) retail floorspace over the forecast period to 2036 (see Section 12).
4.25 Turning to the market shares for the main centres and out-of-centre stores and shopping facilities in the City
Council Area, Table 1 (Appendix 8) shows that they are achieving an overall ‘retention level’ of 30.0% within
the total study area (Zones 1-9). This retention level increases to 68.2% within the ‘core’ City Council Area
(i.e. Zones 1 and 2). Expenditure retention is highest in Zone 2, with stores in the City Council Area retaining
71.3% of expenditure in this zone.
4.26 Looking at expenditure retention for the main centres, the following key market shares have been identified:
Oxford City Centre accounts for 17.4% of study area expenditure and 34.2% from the ‘core’ City Council area (i.e. Zones 1 and 2). Within Zone 1 retention increases to 38.9%.
District centres account for accounts for 5.7% of study area expenditure and 17.4% from the ‘core’ City Council area (i.e. Zones 1 and 2). Cowley Centre accounts for 3.8% of total study area expenditure, increasing to 10.3% when based on the City Council catchment area (Zones 1 and 2). Within Zone 2, stores in the town centre account for 22% of zone expenditure.
The smaller Local centres and neighbourhood centres just retain 0.9% of total study area comparison expenditure, with market share increasing to 2.7% for the City Council catchment area (Zones 1 and 2). This is expected given the limited comparison goods offer available in the centre.
The major out of centre shopping locations and stores account for 6.0% of total study area expenditure, or 13.9% based on the City Council catchment area (Zones 1 and 2). Botley Road Retail Park attracts the greatest proportion of expenditure 4.7% within the study area and 9.4% in the City Council catchment area (Zones 1 and 2).
Unlike convenience market shares, centres in the City Council area (Zones 1 and 2) have a lower comparison goods retention level (78.9% - all convenience goods v/s 68.2% - all comparison goods).
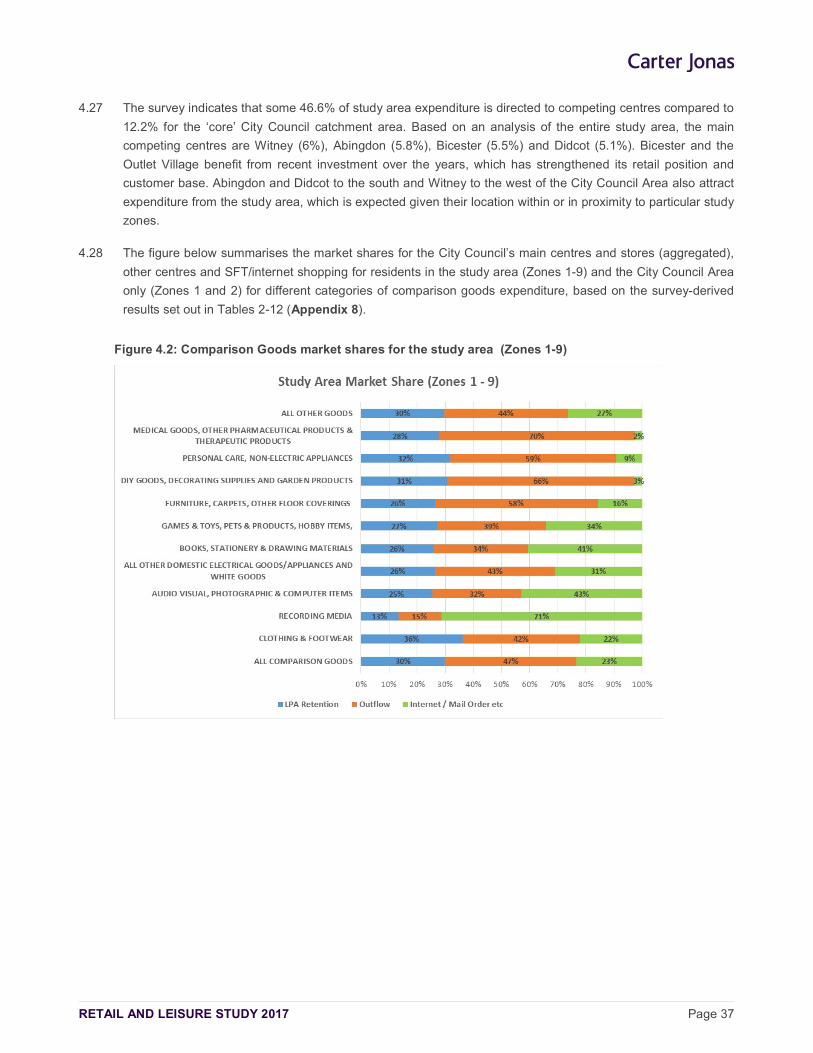
RETAIL AND LEISURE STUDY 2017 Page 37
4.27 The survey indicates that some 46.6% of study area expenditure is directed to competing centres compared to
12.2% for the ‘core’ City Council catchment area. Based on an analysis of the entire study area, the main
competing centres are Witney (6%), Abingdon (5.8%), Bicester (5.5%) and Didcot (5.1%). Bicester and the
Outlet Village benefit from recent investment over the years, which has strengthened its retail position and
customer base. Abingdon and Didcot to the south and Witney to the west of the City Council Area also attract
expenditure from the study area, which is expected given their location within or in proximity to particular study
zones.
4.28 The figure below summarises the market shares for the City Council’s main centres and stores (aggregated),
other centres and SFT/internet shopping for residents in the study area (Zones 1-9) and the City Council Area
only (Zones 1 and 2) for different categories of comparison goods expenditure, based on the survey-derived
results set out in Tables 2-12 (Appendix 8).
Figure 4.2: Comparison Goods market shares for the study area (Zones 1-9)
RETAIL AND LEISURE STUDY 2017 Page 38
Figure 4.3: Comparison Goods market shares for the City Council Area Catchment area (Zones 1 and 2)
4.29 The figures show the relatively strong competition from other centres and shopping facilities located both
within and outside the defined study area (Zones 1 -9) and City Council Catchment area (Zones 1 and 2) for
different types of comparison goods expenditure. For example, based on the study area, expenditure retention
is strongest for the City Council locations for clothing and footwear (36%) and Personal Care products (32%)
purchases, increasing to 67% and 90%, respectively when based on the City Council catchment area. These
are particularly strong market shares.
4.30 In contrast, City Council retention at study area and catchment area level is lowest for recording media and
audio visual goods which is largely due to SFT sales; principally internet shopping. For example, SFT
accounts for 71% of the study area catchment expenditure on recording media. In contrast, SFT’s market
share is more limited for including DIY (3% of study area expenditure), medical goods (2%) and personal care
products (9%). However, this does not necessarily mean that these specific sectors will be ‘immune’ from the
growth in internet shopping over the medium to long term.
Summary
4.31 The key headlines stemming from the household survey are detailed below:
Convenience Goods
4.32 There is a good provision of convenience goods foodstores serving the City Council area. The main centres
and stores in the City Council area achieve a retention level of 29.7% within the study area (Zones 1 - 9),
increasing to 78.9% when based on the Core City Council area (Zones 1 and 2). This represents a relatively
strong rate of retention, reflecting the strength of food shopping offer in the local authority area.
RETAIL AND LEISURE STUDY 2017 Page 39
4.33 The City Centre provision retains a market share of 10% and the District Centres of Headington and
Summertown retain a market share of 13.7% and 8.1% respectively.
4.34 The major out-of-centre stores retain a market share of 32.7% collectively from the core zones 1 and 2 and
13% from the entire study area.
4.35 Local centres collectively attract just 3.8% of expenditure from the City Council Area reflecting the scale of
their provision and in meeting day to day needs.
4.36 Leakage to online sales and other competing stores outside of the City Council Area is relatively low. The
main competing centre for food shopping is Kidlington, which attracts 7.7% of expenditure from Zones 1 and 2.
4.37 The share of internet shopping for food shopping across the study area (i.e. Zones 1-9) is 7.9%; decreasing to
5.6% based on the City Council catchment area (Zones 1 and 2). This is lower than the national of 10.1%.
Comparison Goods
4.38 Oxford City Centre performs well as a comparison goods shopping destination. It is a higher-order shopping
destination and a tourist draw attracting trade from a wide area. The centre’s appeal is enhanced by the
presence of national retailers that enhance the offer and broaden its demographic appeal. This is coupled with
a good range of complementary leisure uses, particularly cafes and restaurants, cinemas and hotels. This
creates a pleasant shopping environment, all of which contribute to the overall appeal of the centre. Oxford
City Centre accounts for 17.4% of study area expenditure and 34.2% from the ‘core’ City Council area (i.e.
Zones 1 and 2).
4.39 Considering the main centres including out-of-centre shopping facilities in the City Council Area, these are
achieving an overall ‘retention level’ of 30.0% within the total study area (Zones 1-9). This retention level
increases to 68.2% within the ‘core’ City Council Area (i.e. Zones 1 and 2).
4.40 District centres account for 5.7% of study area expenditure and 17.4% from the ‘core’ City Council area (i.e.
Zones 1 and 2).
4.41 The smaller Local centres and neighbourhood centres just retain 0.9% of total study area comparison
expenditure, with market share increasing to 2.7% for the City Council catchment area (Zones 1 and 2).
4.42 The major out of centre shopping locations and stores account for 6.0% of total study area expenditure, or
13.9% based on the City Council catchment area (Zones 1 and 2).
4.43 The share of all non-food shopping across the total study area (i.e. Zones 1-9) is 23.4% or 19.6% based on
the City Council catchment area (Zones 1 and 2) which is higher than the national average of 17.6%.
RETAIL AND LEISURE STUDY 2017 Page 40
5 TOWN CENTRE HEALTH CHECKS: METHODOLOGY
5.1 Section 6-11 provide detailed health check assessment for the Oxford City Council’s main centres, namely:
Oxford City Centre
Cowley District Centre
Summertown District Centre
Headington District Centre
Cowley Road District Centre
Blackbird Leys District Centre
5.2 Health checks are recognised as important planning ‘tools’ for appraising and monitoring the changes in the
overall vitality and viability of town centres, and informing both plan-making and decision-taking at the local
level.
5.3 In accordance with the PPG (paragraph 005), there are a number of Key Performance Indicators (KPIs) that
are widely used (where the information exists) to help assess and monitor the overall health and performance
of centres. Some of the KPIs include:
the scale and diversity of uses (e.g. retail and services offer);
retailer representation and demand;
commercial property indicators (such as Prime Zone A Rents);
changes in vacancy levels;
accessibility and parking provision;
the quality of the town centre environment;
pedestrian footfall; and
customers’ views and behaviour.
5.4 In this case the most reliable KPIs have been gathered (where possible) for the centres to help inform the
assessment of their overall strengths and weaknesses in terms of their retail and leisure provision, the
opportunities for new sustainable development and growth, and any potential current and future threats to their
overall vitality and viability.
5.5 The health check assessments of the town centres have been informed Experian Goad Category Report’s
(classifications of shops and businesses audited i.e. convenience, comparison and service uses, and vacant
units) and anecdotal analysis from the Town Centre Audits produced by the Council. It should be noted that
‘services’ as defined by Experian Goad can be sub-divided into the following three sub-categories.
Retail services - including hairdressers, beauty salons, travel agents, launderettes, opticians, etc.;
RETAIL AND LEISURE STUDY 2017 Page 41
Leisure services - which comprise cafes and restaurants (Class A3), betting shops (sui generis), fast food/ takeaway outlets (Class A5); and
Financial and professional services - covering all Class A2 uses (such as banks, estate agents, etc).
5.6 In addition, we have also referred to other datasets and research to help assess the relative vitality and
viability of the City Council’s main town centres, as referenced throughout the report. The applicability and
robustness of the different data is discussed separately for the individual town centres in the respective
sections of this report.
5.7 As described above, the health checks provide an effective ‘gap’ analysis tool to help identify retail types and
categories that are under or over represented in centres. This is based on benchmarking against Goad UK
averages for all circa 1,950 centres and shopping locations covered by Experian. It should be noted that
commercial property indicators normally include Prime Zone A Rents and Yields assessment. Therefore, an
assessment of Prime Zone A rents and yields is provided where available.
RETAIL AND LEISURE STUDY 2017 Page 42
6 OXFORD CITY CENTRE - HEALTH CHECK ASSESSMENT
6.1 This section sets out the key findings of the detailed health check assessment and town centre audit for
Oxford City Centre. Sections 7-11 provide health checks for the other main centres covered by this study;
namely Cowley, Summertown, Headington, Cowley Road and Blackbird Leys District Centres.
6.2 These health checks have been prepared in compliance with the Key Performance Indicators (KPIs) set out in
the Planning Practice Guidance (PPG), where available. In brief, the health checks draw on a range of key
datasets and research, including Experian Goad, CoStar, EGi, etc. They are also informed by the findings of
the market research (telephone and in-centre) surveys and the market knowledge of CJ’s commercial property
agents.
Context
6.3 Oxford is a city in the South East region of England. It is a relatively compact, historic centre that attracts
tourists from not only across the UK but from around the world attracted by the city’s built heritage and
university colleges. Oxford City Centre is also the main focus for retail development within Oxfordshire due to
the wide catchment it serves, and it fulfils many functions catering for residents, students, tourists and visiting
shoppers. The City also sits within the ‘Oxfordshire Knowledge Spine’. This runs through the centre of the
county with the three key areas for growth potential in population, employment and housing at Bicester, Oxford
City and Science Vale Oxford.
6.4 It is regarded as a regional shopping destination and is the focus for a broad range of leisure and cultural
uses. Despite its historic environment, the centre is currently experiencing significant new investment and
development; including:
the completion of the redevelopment of Frideswide Square;
the redevelopment of Westgate Shopping Centre, expected to be completed in October 2017;
the Oxpens redevelopment; and
the Station redevelopment as part of the West End strategic allocation.
6.5 Oxford is ranked 42nd in the 2015 Javelin Venuescore19 ranking of all town and shopping centres. This is a
marginal improvement in ranking since 2007 when it was placed 48th. The redevelopment of the Westgate
Centre, to be anchored by John Lewis and a number of multiple retailers new to the City Centre will further
help to improve its ranking in 2017/18. The centre is also classified in the ‘Upper Middle’ market position by
Javelin based on its shopping and fashion offer20. Oxford City’s main competitors are set in the table below.
19 Venuescore is Javelin Group’s annual ranking of the UK’s top 3,000+ retail venues based on provision of multiple retailers including anchor stores, fashion operators, and non-fashion multiples, where each operator is given a weighted score to reflect its overall impact on shopping patterns and the attraction of centres. The Market Position Index measures the degree to which the centre's offer has a high-end or discount focus (High=Bias towards High-end retailers; Low=Bias towards Discount-oriented retailers)
20 The criteria hierarchy is as follows: Upscale (e.g. London West End), Upper Middle (e.g. Manchester), Middle (e.g. Newcastle Upon Tyne, Reading), Lower Middle (e.g. Sunderland), and Lower.
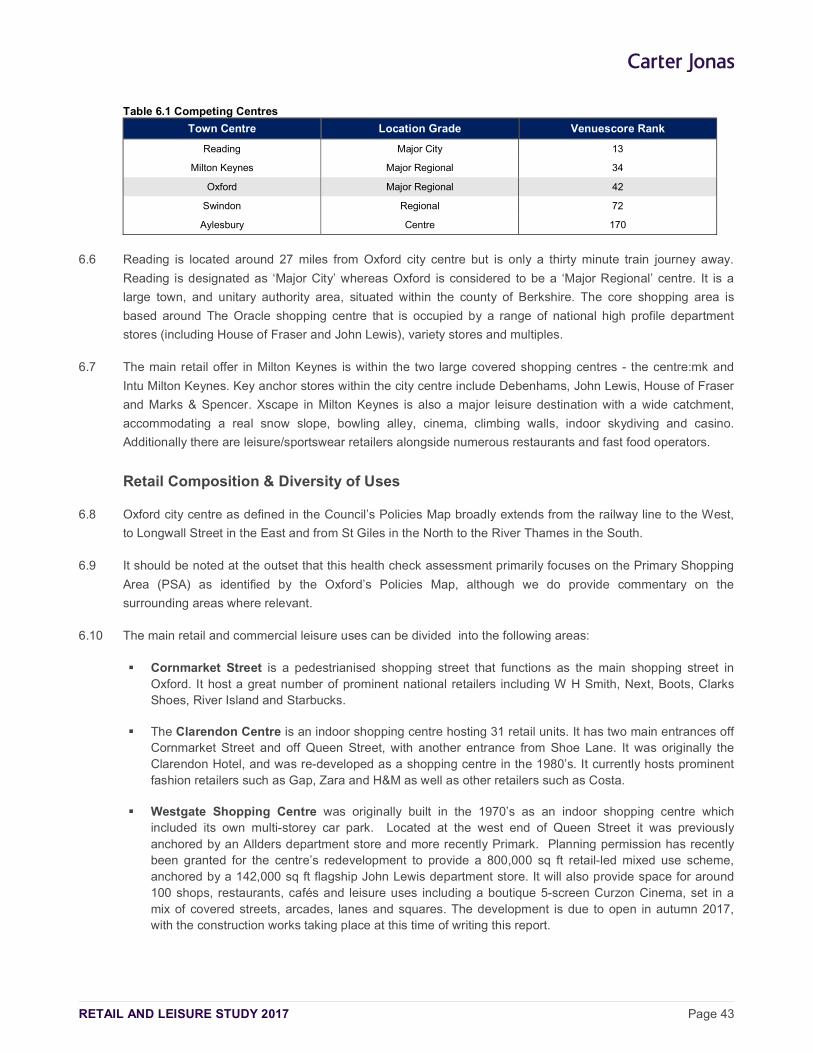
RETAIL AND LEISURE STUDY 2017 Page 43
Table 6.1 Competing Centres
Town Centre Location Grade Venuescore Rank
Reading Major City 13
Milton Keynes Major Regional 34
Oxford Major Regional 42
Swindon Regional 72
Aylesbury Centre 170
6.6 Reading is located around 27 miles from Oxford city centre but is only a thirty minute train journey away.
Reading is designated as ‘Major City’ whereas Oxford is considered to be a ‘Major Regional’ centre. It is a
large town, and unitary authority area, situated within the county of Berkshire. The core shopping area is
based around The Oracle shopping centre that is occupied by a range of national high profile department
stores (including House of Fraser and John Lewis), variety stores and multiples.
6.7 The main retail offer in Milton Keynes is within the two large covered shopping centres - the centre:mk and
Intu Milton Keynes. Key anchor stores within the city centre include Debenhams, John Lewis, House of Fraser
and Marks & Spencer. Xscape in Milton Keynes is also a major leisure destination with a wide catchment,
accommodating a real snow slope, bowling alley, cinema, climbing walls, indoor skydiving and casino.
Additionally there are leisure/sportswear retailers alongside numerous restaurants and fast food operators.
Retail Composition & Diversity of Uses
6.8 Oxford city centre as defined in the Council’s Policies Map broadly extends from the railway line to the West,
to Longwall Street in the East and from St Giles in the North to the River Thames in the South.
6.9 It should be noted at the outset that this health check assessment primarily focuses on the Primary Shopping
Area (PSA) as identified by the Oxford’s Policies Map, although we do provide commentary on the
surrounding areas where relevant.
6.10 The main retail and commercial leisure uses can be divided into the following areas:
Cornmarket Street is a pedestrianised shopping street that functions as the main shopping street in Oxford. It host a great number of prominent national retailers including W H Smith, Next, Boots, Clarks Shoes, River Island and Starbucks.
The Clarendon Centre is an indoor shopping centre hosting 31 retail units. It has two main entrances off Cornmarket Street and off Queen Street, with another entrance from Shoe Lane. It was originally the Clarendon Hotel, and was re-developed as a shopping centre in the 1980’s. It currently hosts prominent fashion retailers such as Gap, Zara and H&M as well as other retailers such as Costa.
Westgate Shopping Centre was originally built in the 1970’s as an indoor shopping centre which included its own multi-storey car park. Located at the west end of Queen Street it was previously anchored by an Allders department store and more recently Primark. Planning permission has recently been granted for the centre’s redevelopment to provide a 800,000 sq ft retail-led mixed use scheme, anchored by a 142,000 sq ft flagship John Lewis department store. It will also provide space for around 100 shops, restaurants, cafés and leisure uses including a boutique 5-screen Curzon Cinema, set in a mix of covered streets, arcades, lanes and squares. The development is due to open in autumn 2017, with the construction works taking place at this time of writing this report.
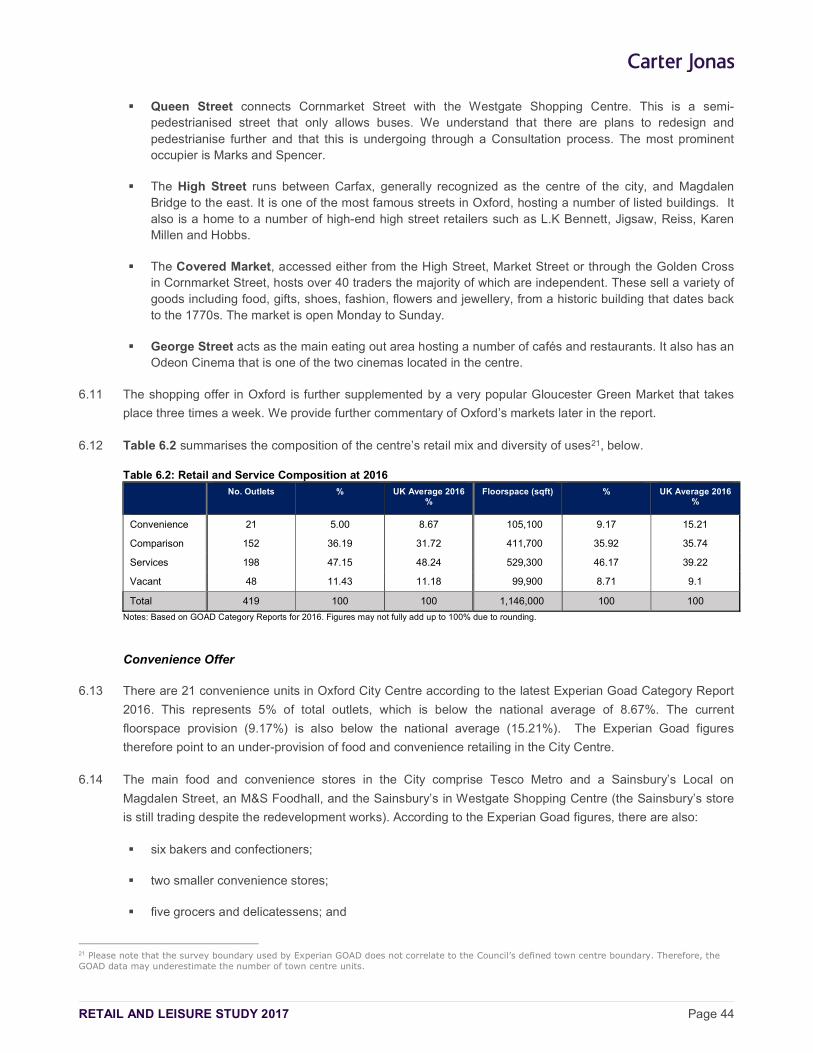
RETAIL AND LEISURE STUDY 2017 Page 44
Queen Street connects Cornmarket Street with the Westgate Shopping Centre. This is a semi-pedestrianised street that only allows buses. We understand that there are plans to redesign and pedestrianise further and that this is undergoing through a Consultation process. The most prominent occupier is Marks and Spencer.
The High Street runs between Carfax, generally recognized as the centre of the city, and Magdalen Bridge to the east. It is one of the most famous streets in Oxford, hosting a number of listed buildings. It also is a home to a number of high-end high street retailers such as L.K Bennett, Jigsaw, Reiss, Karen Millen and Hobbs.
The Covered Market, accessed either from the High Street, Market Street or through the Golden Cross in Cornmarket Street, hosts over 40 traders the majority of which are independent. These sell a variety of goods including food, gifts, shoes, fashion, flowers and jewellery, from a historic building that dates back to the 1770s. The market is open Monday to Sunday.
George Street acts as the main eating out area hosting a number of cafés and restaurants. It also has an Odeon Cinema that is one of the two cinemas located in the centre.
6.11 The shopping offer in Oxford is further supplemented by a very popular Gloucester Green Market that takes
place three times a week. We provide further commentary of Oxford’s markets later in the report.
6.12 Table 6.2 summarises the composition of the centre’s retail mix and diversity of uses21, below.
Table 6.2: Retail and Service Composition at 2016
No. Outlets % UK Average 2016
% Floorspace (sqft) % UK Average 2016
%
Convenience 21 5.00 8.67 105,100 9.17 15.21
Comparison 152 36.19 31.72 411,700 35.92 35.74
Services 198 47.15 48.24 529,300 46.17 39.22
Vacant 48 11.43 11.18 99,900 8.71 9.1
Total 419 100 100 1,146,000 100 100
Notes: Based on GOAD Category Reports for 2016. Figures may not fully add up to 100% due to rounding.
Convenience Offer
6.13 There are 21 convenience units in Oxford City Centre according to the latest Experian Goad Category Report
2016. This represents 5% of total outlets, which is below the national average of 8.67%. The current
floorspace provision (9.17%) is also below the national average (15.21%). The Experian Goad figures
therefore point to an under-provision of food and convenience retailing in the City Centre.
6.14 The main food and convenience stores in the City comprise Tesco Metro and a Sainsbury’s Local on
Magdalen Street, an M&S Foodhall, and the Sainsbury’s in Westgate Shopping Centre (the Sainsbury’s store
is still trading despite the redevelopment works). According to the Experian Goad figures, there are also:
six bakers and confectioners;
two smaller convenience stores;
five grocers and delicatessens; and
21 Please note that the survey boundary used by Experian GOAD does not correlate to the Council’s defined town centre boundary. Therefore, the GOAD data may underestimate the number of town centre units.
RETAIL AND LEISURE STUDY 2017 Page 45
three health food shops (including Holland and Barrett).
6.15 The Covered Market also has a good choice of food and convenience stalls (including a butchers, bakers and
greengrocers) that supplements and strengthens the City’s overall offer.
6.16 The household survey (Section 4) identified that 9.8% of respondents in the Oxford ‘core’ catchment area
(Zones 1 and 2) visit the City Centre for their food shopping needs. The main stores frequented are Marks &
Spencer (Queen Street) (2.6%), Sainsbury’s Wesgate (1.7%) and Tesco Metro on Magdalen Street (1.6%).
6.17 However, the household survey also identified that only 0.2% of respondents’ main reason for visiting the
centre is for food shopping. This reflects the fact that Oxford principally functions as a comparison goods
shopping and service destination. The majority of respondents in Zones 1 and 2 carry out their main food
shopping in edge and out of centre locations, and in the main District Centres, as well as online.
6.18 Overall, we consider that Oxford City Centre has a relatively good convenience provision given its principal
role as a comparison goods shopping destination. Notwithstanding this, there would appear to be potential
improve its foodstore offer, if the need and demand exists.
Comparison Offer
6.19 According to the 2016 Goad Category Report, Oxford City Centre has 152 comparison outlets. This
represents 36.19% of total units and is significantly above the national average of 31.72%. The current
floorspace provision represents 35.92% of total floorspace in the centre, which is also slightly above the
national average of 35.74%.
6.20 Across the different comparison sub-categories, the centre has a high representation of many categories
including footwear, ladies’ and men’s wear, toiletries and cosmetics and beauty production, and department
stores. This indicates that the centre is a prominent shopping location. The centre has two department stores
(Debenhams and Marks and Spencer), and a large number of prominent fashion retailers (including Hobbs,
Reis, Topshop/Topman, H&M, Gap, River Island, Karen Millen, Next etc.). Overall, the Goad figures confirm
that Oxford City Centre has a strong and diverse comparison goods offer.
6.21 The findings of the household survey show that the majority of people visit the centre for non-food shopping
(34.22%) compared to 9.8% who visit for food shopping from core Zones 1 and 2. This confirms that Oxford
City Centre is a popular destination for comparison goods shopping. Some 15.4% of all respondents to the
household survey ‘liked’ the good range and choice of non-food shops in the City Centre.
6.22 The redevelopment of the Westgate Shopping Centre will significantly increase the amount of comparison
floorspace in the City Centre. The introduction of a new John Lewis as an anchor and other new retailers
(including Ted Baker, Tommy Hilfiger, Jo Malone, H&M, Joules and Primark) will strengthen the quality and
attraction of the City’s comparison retail offer, increasing its overall attraction to shoppers and improving its
national ranking.
Service Offer
6.23 Service businesses are defined by Experian Goad as including retail, professional and financial services. As
Table 6.2 shows, there are 198 service outlets in Oxford City Centre. They account for 47.15% of all units,
which is marginally below the national average of 48.24%. However, the current floorspace provision
(46.20%) is significantly above the national average (39.22%). The following provides a brief summary of
provision in the different service categories:
RETAIL AND LEISURE STUDY 2017 Page 46
There are 28 retail services in 2016, which represented 6.67% of total outlets. This is significantly below the national average of 14.06%. This category is mostly made up of the health and beauty outlets (16) (predominantly hairdressers, nail bars and beauty salons). There are also six opticians, three travel agents, a dry cleaner and a post office.
In terms of financial services, there are 37 outlets in 2016, which represented 8.81% of total units and is below the national average of 10.56%. The mix of services is dominated by banks and building societies (20), and the centre also hosts financial services (4), employment and careers (5), property services (5) and legal services (2).
There are 133 leisure service outlets in 2016. This is equivalent to 31.67% of total provision and is significantly above the national average of 23.50%. The current leisure offer is varied and provides a good choice for customers and visitors to the City Centre. For example, the leisure mix includes cafés and restaurants (65 outlets), takeaways (15), pubs and bars (8), betting shops (5), two cinemas, three theatres (Oxford New Theatre, Oxford Theatre Guild, and the Playhouse) and Nightclubs (2). As such Oxford City Centre has a vibrant day time and night time leisure economy that caters for residents, students and those that work in the City but live outside the local authority area.
6.24 Given the size and the role of the centre, we consider that the overall representation of services is adequate.
We assess the potential need for new commercial leisure uses in more detail in Section 13 of this study.
Multiple and Independent Retail Representation
6.25 Experian Goad defines a multiple as being part of a network of nine or more outlets. It is widely accepted that
a good presence and mix of multiples in a town centre, alongside a strong independent offer, helps to increase
the overall attraction and performance of shopping centres. Multiples are a strong draw for customers and they
help to generate frequent shopping trips and footfall, and linked expenditure for other shops, businesses and
services.
6.26 The 2016 Goad Category Report identified that there are 197 multiple retailers in Oxford City Centre. This
included a number of prominent names including two department stores (Debenhams, and Marks and
Spencer), a larger number of mid-range to high end high street fashion retails (e.g. Next, Clarks, Hobbs, Karen
Millen) and national supermarket names (e.g. Tesco, Sainsbury’s and M&S Foodhall).
6.27 The town centre also has a strong independent retail and service offer, particularly focussed along the
secondary streets and the Covered Market. This includes independent cafés/restaurants/takeaway operators,
health and beauty service and fashion and shoes retailers. The independent stores and shops all contribute
significantly to the overall diversity, vitality and viability of the town centre’s offer.
6.28 In summary, we consider that there is a good and complementary mix of multiple and independent retailers,
serving the centre and its catchment population. Furthermore, the redevelopment of the Westgate Centre will
increase the number of major department stores (John Lewis) and multiples in the City Centre.
Markets
6.29 There are currently two regular markets that operate in Oxford City Centre.
Oxford Covered Market operates Monday to Saturday 8 am - 5.30 pm, and Sunday 10 am – 4 pm. It is accessed either from the High Street, Market Street or through the Golden Cross in Cornmarket Street. It hosts over 40 traders, the majority of which are independent. These sell a variety of goods including food, gifts, shoes, fashion, flowers and jewellery, from a historic building that dates back to 1770’s. The market
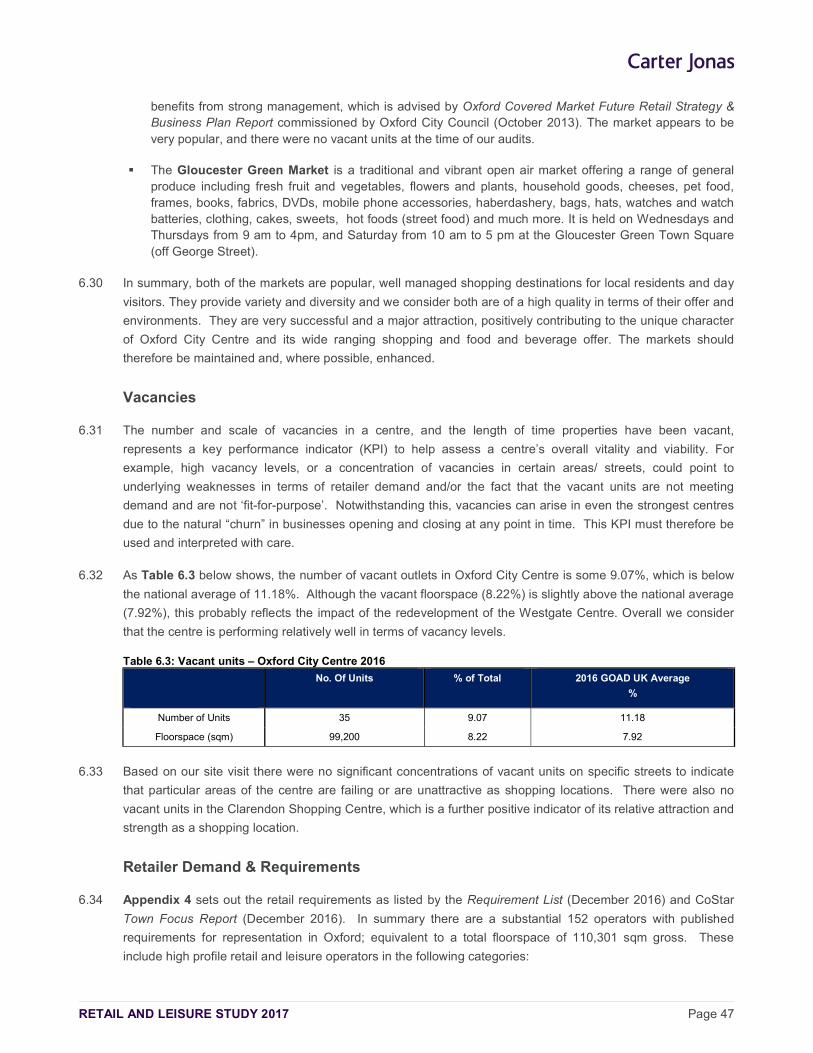
RETAIL AND LEISURE STUDY 2017 Page 47
benefits from strong management, which is advised by Oxford Covered Market Future Retail Strategy & Business Plan Report commissioned by Oxford City Council (October 2013). The market appears to be very popular, and there were no vacant units at the time of our audits.
The Gloucester Green Market is a traditional and vibrant open air market offering a range of general produce including fresh fruit and vegetables, flowers and plants, household goods, cheeses, pet food, frames, books, fabrics, DVDs, mobile phone accessories, haberdashery, bags, hats, watches and watch batteries, clothing, cakes, sweets, hot foods (street food) and much more. It is held on Wednesdays and Thursdays from 9 am to 4pm, and Saturday from 10 am to 5 pm at the Gloucester Green Town Square (off George Street).
6.30 In summary, both of the markets are popular, well managed shopping destinations for local residents and day
visitors. They provide variety and diversity and we consider both are of a high quality in terms of their offer and
environments. They are very successful and a major attraction, positively contributing to the unique character
of Oxford City Centre and its wide ranging shopping and food and beverage offer. The markets should
therefore be maintained and, where possible, enhanced.
Vacancies
6.31 The number and scale of vacancies in a centre, and the length of time properties have been vacant,
represents a key performance indicator (KPI) to help assess a centre’s overall vitality and viability. For
example, high vacancy levels, or a concentration of vacancies in certain areas/ streets, could point to
underlying weaknesses in terms of retailer demand and/or the fact that the vacant units are not meeting
demand and are not ‘fit-for-purpose’. Notwithstanding this, vacancies can arise in even the strongest centres
due to the natural “churn” in businesses opening and closing at any point in time. This KPI must therefore be
used and interpreted with care.
6.32 As Table 6.3 below shows, the number of vacant outlets in Oxford City Centre is some 9.07%, which is below
the national average of 11.18%. Although the vacant floorspace (8.22%) is slightly above the national average
(7.92%), this probably reflects the impact of the redevelopment of the Westgate Centre. Overall we consider
that the centre is performing relatively well in terms of vacancy levels.
Table 6.3: Vacant units – Oxford City Centre 2016
No. Of Units % of Total 2016 GOAD UK Average
%
Number of Units 35 9.07 11.18
Floorspace (sqm) 99,200 8.22 7.92
6.33 Based on our site visit there were no significant concentrations of vacant units on specific streets to indicate
that particular areas of the centre are failing or are unattractive as shopping locations. There were also no
vacant units in the Clarendon Shopping Centre, which is a further positive indicator of its relative attraction and
strength as a shopping location.
Retailer Demand & Requirements
6.34 Appendix 4 sets out the retail requirements as listed by the Requirement List (December 2016) and CoStar
Town Focus Report (December 2016). In summary there are a substantial 152 operators with published
requirements for representation in Oxford; equivalent to a total floorspace of 110,301 sqm gross. These
include high profile retail and leisure operators in the following categories:
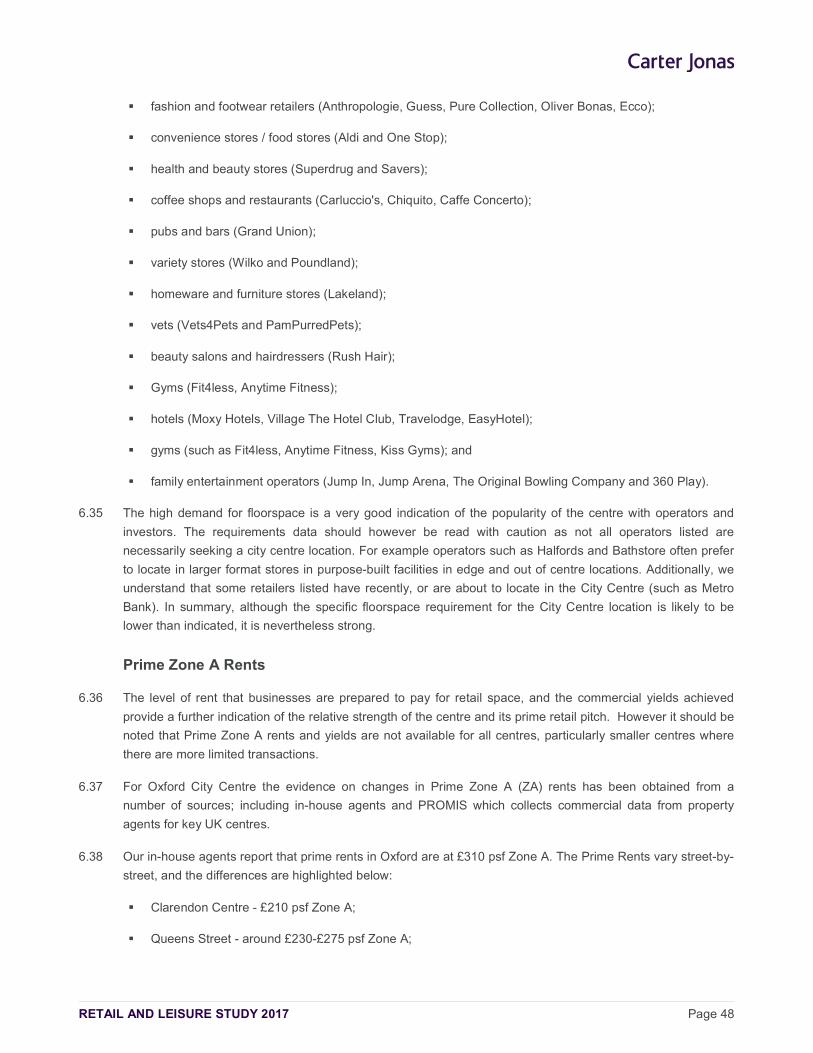
RETAIL AND LEISURE STUDY 2017 Page 48
fashion and footwear retailers (Anthropologie, Guess, Pure Collection, Oliver Bonas, Ecco);
convenience stores / food stores (Aldi and One Stop);
health and beauty stores (Superdrug and Savers);
coffee shops and restaurants (Carluccio's, Chiquito, Caffe Concerto);
pubs and bars (Grand Union);
variety stores (Wilko and Poundland);
homeware and furniture stores (Lakeland);
vets (Vets4Pets and PamPurredPets);
beauty salons and hairdressers (Rush Hair);
Gyms (Fit4less, Anytime Fitness);
hotels (Moxy Hotels, Village The Hotel Club, Travelodge, EasyHotel);
gyms (such as Fit4less, Anytime Fitness, Kiss Gyms); and
family entertainment operators (Jump In, Jump Arena, The Original Bowling Company and 360 Play).
6.35 The high demand for floorspace is a very good indication of the popularity of the centre with operators and
investors. The requirements data should however be read with caution as not all operators listed are
necessarily seeking a city centre location. For example operators such as Halfords and Bathstore often prefer
to locate in larger format stores in purpose-built facilities in edge and out of centre locations. Additionally, we
understand that some retailers listed have recently, or are about to locate in the City Centre (such as Metro
Bank). In summary, although the specific floorspace requirement for the City Centre location is likely to be
lower than indicated, it is nevertheless strong.
Prime Zone A Rents
6.36 The level of rent that businesses are prepared to pay for retail space, and the commercial yields achieved
provide a further indication of the relative strength of the centre and its prime retail pitch. However it should be
noted that Prime Zone A rents and yields are not available for all centres, particularly smaller centres where
there are more limited transactions.
6.37 For Oxford City Centre the evidence on changes in Prime Zone A (ZA) rents has been obtained from a
number of sources; including in-house agents and PROMIS which collects commercial data from property
agents for key UK centres.
6.38 Our in-house agents report that prime rents in Oxford are at £310 psf Zone A. The Prime Rents vary street-by-
street, and the differences are highlighted below:
Clarendon Centre - £210 psf Zone A;
Queens Street - around £230-£275 psf Zone A;

RETAIL AND LEISURE STUDY 2017 Page 49
Carfax - up to £240 psf Zone A can be achieved, although there has been little tenant movement along High Street over recent years;
6.39 Moving eastwards, Zone A rents are around £70-90 psf Zone A past King Edward Street. There has been
limited market activity on Broad Street and Zone A rents range from £150-170 psf Zone A near to Cornmarket
Street, reducing to £50-60 psf Zone A around the junction with Turl Street. New Inn Hall Street remain at
around £65-75 psf. Elsewhere within the city centre, Zone A rents on Turl Street stand at £60-£70 psf and at
around £140-£150 psf for Magdalen Street.
6.40 Our agents further report that prime retail yields22 in Oxford are around 4.25%. This further indicates that the
current yield level points to a good position regarding investor and market confidence in Oxford as a shopping
location.
6.41 By way of comparison, PROMIS reports that whilst many centres experienced a sharp fall in prime rents
following the credit crunch and the recession of 2008/09, the impact was significantly less severe in Oxford,
which experienced only a very slight fall in prime rents and has since regained lost ground. Oxford is one of
PMA's highest ranking PROMIS Centres on the basis of prime Zone A rents. At mid-2016, collective agent
sources also estimated prime rents in Oxford at £310 psf Zone A, in line with our in-house view. This
represents no change on the end 2015 level of prime rents in the city with rents now 6.9% above the pre-
recession peak of £290 psf Zone A. On average, prime rents across the PROMIS 200 Towns remain 28.1%
below the pre-recession peak, and hence it would appear that Oxford city centre is preforming well.
6.42 The figure below is sourced from the PROMIS report and illustrates the changes in the centre’s Prime Zone A
Rents since 1989, benchmarked against the sub-regional and PROMIS average for all centres.
Figure 6.1: Oxford City Centre – Changes in Prime Zone A Rents
Source: PROMIS
6.43 The table below also compares Prime Zone A rents achieved in Oxford City Centre at mid-2016 with other
centres of similar role and function, namely Bath, Reading and Cambridge. This shows that in comparison to
these centres, Oxford city centre performs better in terms of rental performance.
22 Yields provide an indication of the strength of a tenant’s covenant and the long-term potential for rental and capital growth of a
location.
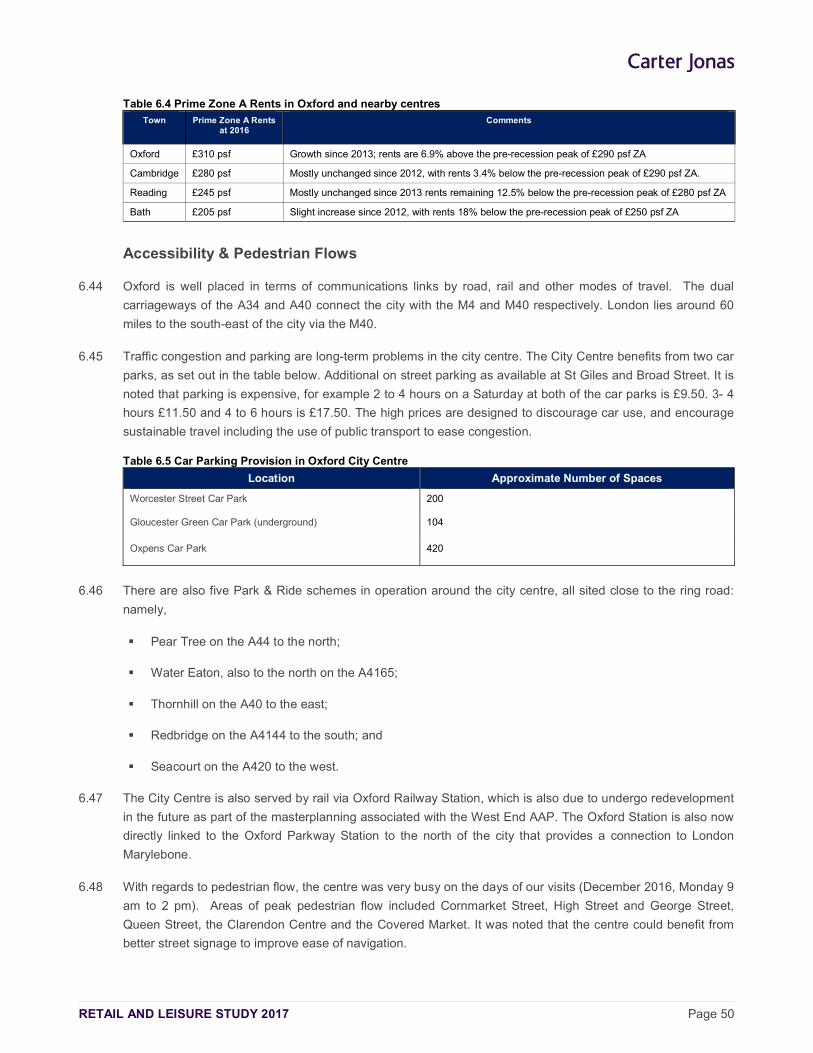
RETAIL AND LEISURE STUDY 2017 Page 50
Table 6.4 Prime Zone A Rents in Oxford and nearby centres Town Prime Zone A Rents
at 2016 Comments
Oxford £310 psf Growth since 2013; rents are 6.9% above the pre-recession peak of £290 psf ZA
Cambridge £280 psf Mostly unchanged since 2012, with rents 3.4% below the pre-recession peak of £290 psf ZA.
Reading £245 psf Mostly unchanged since 2013 rents remaining 12.5% below the pre-recession peak of £280 psf ZA
Bath £205 psf Slight increase since 2012, with rents 18% below the pre-recession peak of £250 psf ZA
Accessibility & Pedestrian Flows
6.44 Oxford is well placed in terms of communications links by road, rail and other modes of travel. The dual
carriageways of the A34 and A40 connect the city with the M4 and M40 respectively. London lies around 60
miles to the south-east of the city via the M40.
6.45 Traffic congestion and parking are long-term problems in the city centre. The City Centre benefits from two car
parks, as set out in the table below. Additional on street parking as available at St Giles and Broad Street. It is
noted that parking is expensive, for example 2 to 4 hours on a Saturday at both of the car parks is £9.50. 3- 4
hours £11.50 and 4 to 6 hours is £17.50. The high prices are designed to discourage car use, and encourage
sustainable travel including the use of public transport to ease congestion.
Table 6.5 Car Parking Provision in Oxford City Centre
Location Approximate Number of Spaces
Worcester Street Car Park 200
Gloucester Green Car Park (underground) 104
Oxpens Car Park 420
6.46 There are also five Park & Ride schemes in operation around the city centre, all sited close to the ring road:
namely,
Pear Tree on the A44 to the north;
Water Eaton, also to the north on the A4165;
Thornhill on the A40 to the east;
Redbridge on the A4144 to the south; and
Seacourt on the A420 to the west.
6.47 The City Centre is also served by rail via Oxford Railway Station, which is also due to undergo redevelopment
in the future as part of the masterplanning associated with the West End AAP. The Oxford Station is also now
directly linked to the Oxford Parkway Station to the north of the city that provides a connection to London
Marylebone.
6.48 With regards to pedestrian flow, the centre was very busy on the days of our visits (December 2016, Monday 9
am to 2 pm). Areas of peak pedestrian flow included Cornmarket Street, High Street and George Street,
Queen Street, the Clarendon Centre and the Covered Market. It was noted that the centre could benefit from
better street signage to improve ease of navigation.
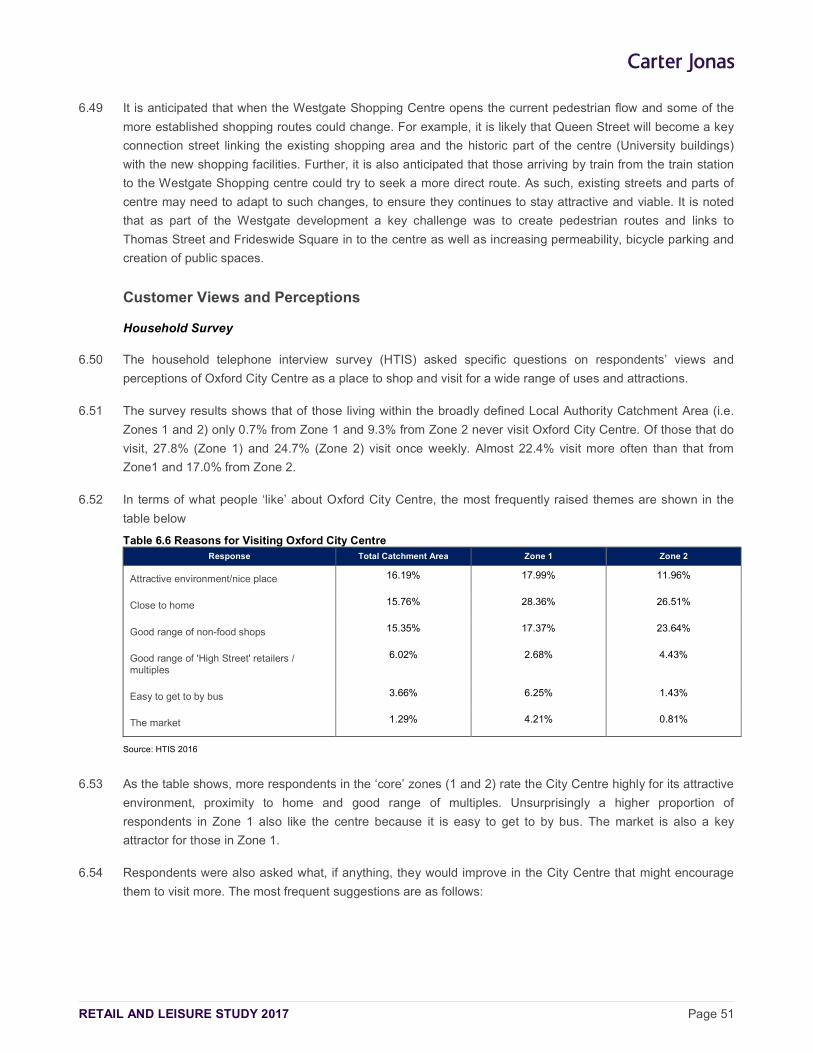
RETAIL AND LEISURE STUDY 2017 Page 51
6.49 It is anticipated that when the Westgate Shopping Centre opens the current pedestrian flow and some of the
more established shopping routes could change. For example, it is likely that Queen Street will become a key
connection street linking the existing shopping area and the historic part of the centre (University buildings)
with the new shopping facilities. Further, it is also anticipated that those arriving by train from the train station
to the Westgate Shopping centre could try to seek a more direct route. As such, existing streets and parts of
centre may need to adapt to such changes, to ensure they continues to stay attractive and viable. It is noted
that as part of the Westgate development a key challenge was to create pedestrian routes and links to
Thomas Street and Frideswide Square in to the centre as well as increasing permeability, bicycle parking and
creation of public spaces.
Customer Views and Perceptions
Household Survey
6.50 The household telephone interview survey (HTIS) asked specific questions on respondents’ views and
perceptions of Oxford City Centre as a place to shop and visit for a wide range of uses and attractions.
6.51 The survey results shows that of those living within the broadly defined Local Authority Catchment Area (i.e.
Zones 1 and 2) only 0.7% from Zone 1 and 9.3% from Zone 2 never visit Oxford City Centre. Of those that do
visit, 27.8% (Zone 1) and 24.7% (Zone 2) visit once weekly. Almost 22.4% visit more often than that from
Zone1 and 17.0% from Zone 2.
6.52 In terms of what people ‘like’ about Oxford City Centre, the most frequently raised themes are shown in the
table below
Table 6.6 Reasons for Visiting Oxford City Centre Response Total Catchment Area Zone 1 Zone 2
Attractive environment/nice place 16.19% 17.99% 11.96%
Close to home 15.76% 28.36% 26.51%
Good range of non-food shops 15.35% 17.37% 23.64%
Good range of 'High Street' retailers / multiples
6.02% 2.68% 4.43%
Easy to get to by bus 3.66% 6.25% 1.43%
The market 1.29% 4.21% 0.81%
Source: HTIS 2016
6.53 As the table shows, more respondents in the ‘core’ zones (1 and 2) rate the City Centre highly for its attractive
environment, proximity to home and good range of multiples. Unsurprisingly a higher proportion of
respondents in Zone 1 also like the centre because it is easy to get to by bus. The market is also a key
attractor for those in Zone 1.
6.54 Respondents were also asked what, if anything, they would improve in the City Centre that might encourage
them to visit more. The most frequent suggestions are as follows:
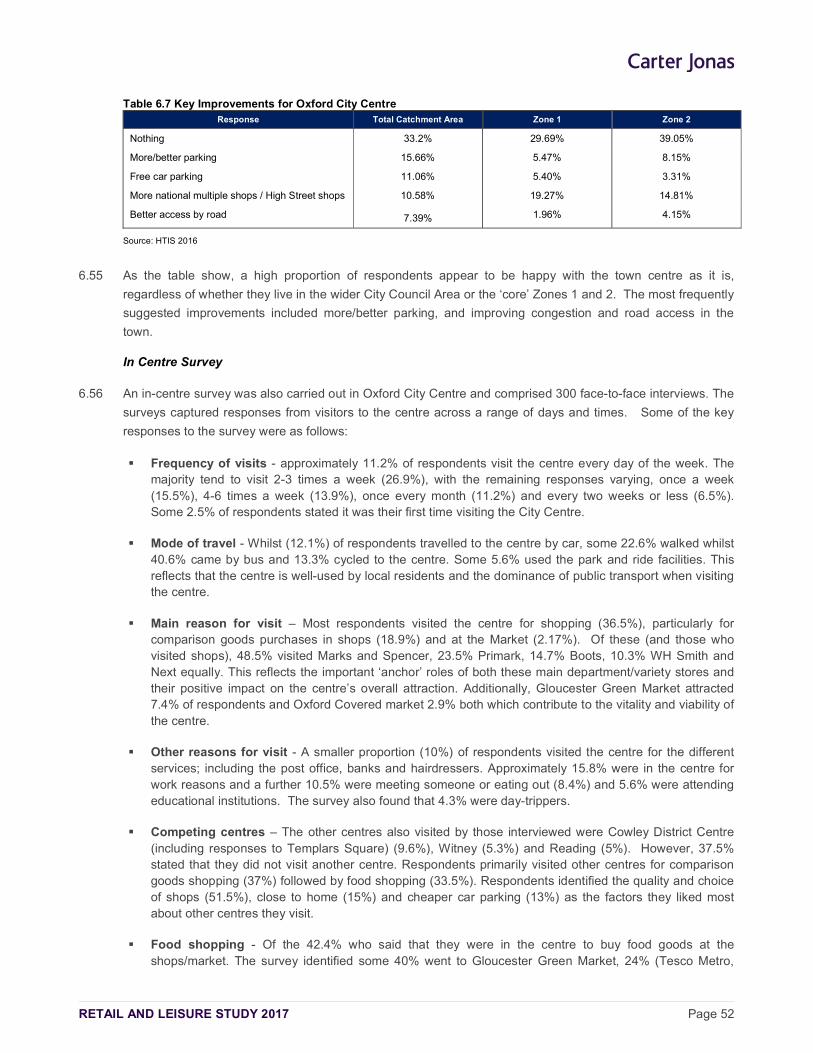
RETAIL AND LEISURE STUDY 2017 Page 52
Table 6.7 Key Improvements for Oxford City Centre Response Total Catchment Area Zone 1 Zone 2
Nothing 33.2% 29.69% 39.05%
More/better parking 15.66% 5.47% 8.15%
Free car parking 11.06% 5.40% 3.31%
More national multiple shops / High Street shops 10.58% 19.27% 14.81%
Better access by road 7.39% 1.96% 4.15%
Source: HTIS 2016
6.55 As the table show, a high proportion of respondents appear to be happy with the town centre as it is,
regardless of whether they live in the wider City Council Area or the ‘core’ Zones 1 and 2. The most frequently
suggested improvements included more/better parking, and improving congestion and road access in the
town.
In Centre Survey
6.56 An in-centre survey was also carried out in Oxford City Centre and comprised 300 face-to-face interviews. The
surveys captured responses from visitors to the centre across a range of days and times. Some of the key
responses to the survey were as follows:
Frequency of visits - approximately 11.2% of respondents visit the centre every day of the week. The majority tend to visit 2-3 times a week (26.9%), with the remaining responses varying, once a week (15.5%), 4-6 times a week (13.9%), once every month (11.2%) and every two weeks or less (6.5%). Some 2.5% of respondents stated it was their first time visiting the City Centre.
Mode of travel - Whilst (12.1%) of respondents travelled to the centre by car, some 22.6% walked whilst 40.6% came by bus and 13.3% cycled to the centre. Some 5.6% used the park and ride facilities. This reflects that the centre is well-used by local residents and the dominance of public transport when visiting the centre.
Main reason for visit – Most respondents visited the centre for shopping (36.5%), particularly for comparison goods purchases in shops (18.9%) and at the Market (2.17%). Of these (and those who visited shops), 48.5% visited Marks and Spencer, 23.5% Primark, 14.7% Boots, 10.3% WH Smith and Next equally. This reflects the important ‘anchor’ roles of both these main department/variety stores and their positive impact on the centre’s overall attraction. Additionally, Gloucester Green Market attracted 7.4% of respondents and Oxford Covered market 2.9% both which contribute to the vitality and viability of the centre.
Other reasons for visit - A smaller proportion (10%) of respondents visited the centre for the different services; including the post office, banks and hairdressers. Approximately 15.8% were in the centre for work reasons and a further 10.5% were meeting someone or eating out (8.4%) and 5.6% were attending educational institutions. The survey also found that 4.3% were day-trippers.
Competing centres – The other centres also visited by those interviewed were Cowley District Centre (including responses to Templars Square) (9.6%), Witney (5.3%) and Reading (5%). However, 37.5% stated that they did not visit another centre. Respondents primarily visited other centres for comparison goods shopping (37%) followed by food shopping (33.5%). Respondents identified the quality and choice of shops (51.5%), close to home (15%) and cheaper car parking (13%) as the factors they liked most about other centres they visit.
Food shopping - Of the 42.4% who said that they were in the centre to buy food goods at the shops/market. The survey identified some 40% went to Gloucester Green Market, 24% (Tesco Metro,
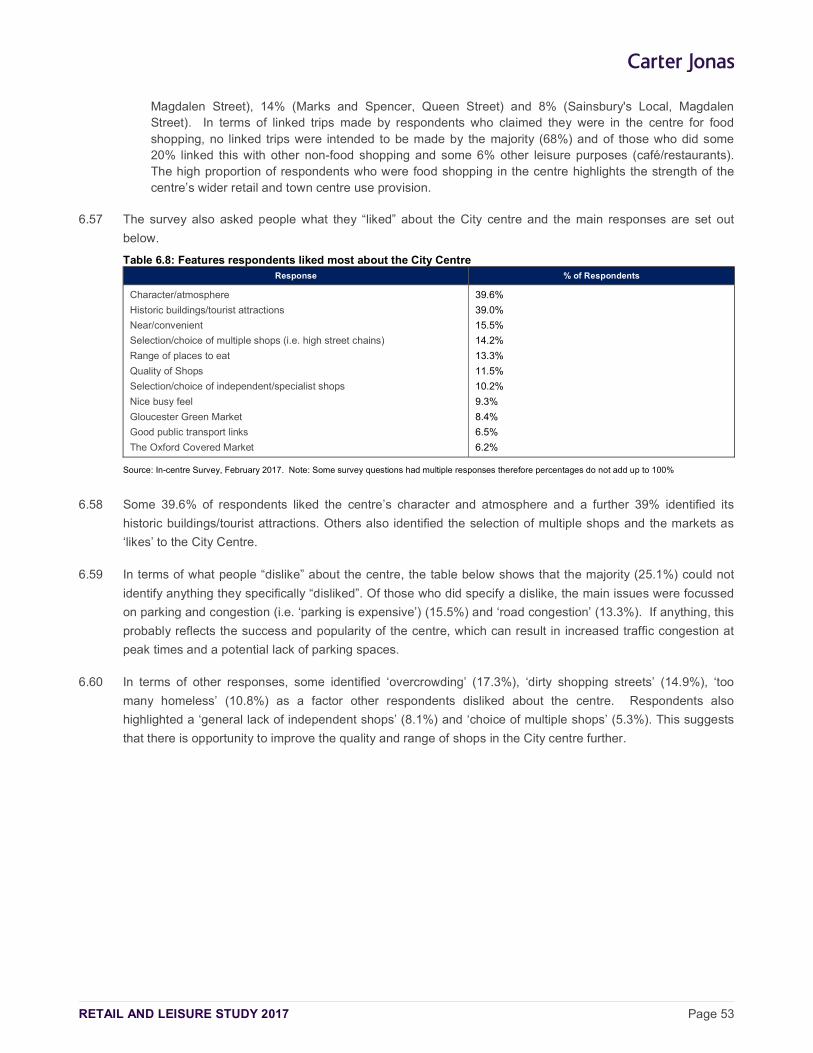
RETAIL AND LEISURE STUDY 2017 Page 53
Magdalen Street), 14% (Marks and Spencer, Queen Street) and 8% (Sainsbury's Local, Magdalen Street). In terms of linked trips made by respondents who claimed they were in the centre for food shopping, no linked trips were intended to be made by the majority (68%) and of those who did some 20% linked this with other non-food shopping and some 6% other leisure purposes (café/restaurants). The high proportion of respondents who were food shopping in the centre highlights the strength of the centre’s wider retail and town centre use provision.
6.57 The survey also asked people what they “liked” about the City centre and the main responses are set out
below.
Table 6.8: Features respondents liked most about the City Centre Response % of Respondents
Character/atmosphere
Historic buildings/tourist attractions
Near/convenient
Selection/choice of multiple shops (i.e. high street chains)
Range of places to eat
Quality of Shops
Selection/choice of independent/specialist shops
Nice busy feel
Gloucester Green Market
Good public transport links
The Oxford Covered Market
39.6%
39.0%
15.5%
14.2%
13.3%
11.5%
10.2%
9.3%
8.4%
6.5%
6.2%
Source: In-centre Survey, February 2017. Note: Some survey questions had multiple responses therefore percentages do not add up to 100%
6.58 Some 39.6% of respondents liked the centre’s character and atmosphere and a further 39% identified its
historic buildings/tourist attractions. Others also identified the selection of multiple shops and the markets as
‘likes’ to the City Centre.
6.59 In terms of what people “dislike” about the centre, the table below shows that the majority (25.1%) could not
identify anything they specifically “disliked”. Of those who did specify a dislike, the main issues were focussed
on parking and congestion (i.e. ‘parking is expensive’) (15.5%) and ‘road congestion’ (13.3%). If anything, this
probably reflects the success and popularity of the centre, which can result in increased traffic congestion at
peak times and a potential lack of parking spaces.
6.60 In terms of other responses, some identified ‘overcrowding’ (17.3%), ‘dirty shopping streets’ (14.9%), ‘too
many homeless’ (10.8%) as a factor other respondents disliked about the centre. Respondents also
highlighted a ‘general lack of independent shops’ (8.1%) and ‘choice of multiple shops’ (5.3%). This suggests
that there is opportunity to improve the quality and range of shops in the City centre further.
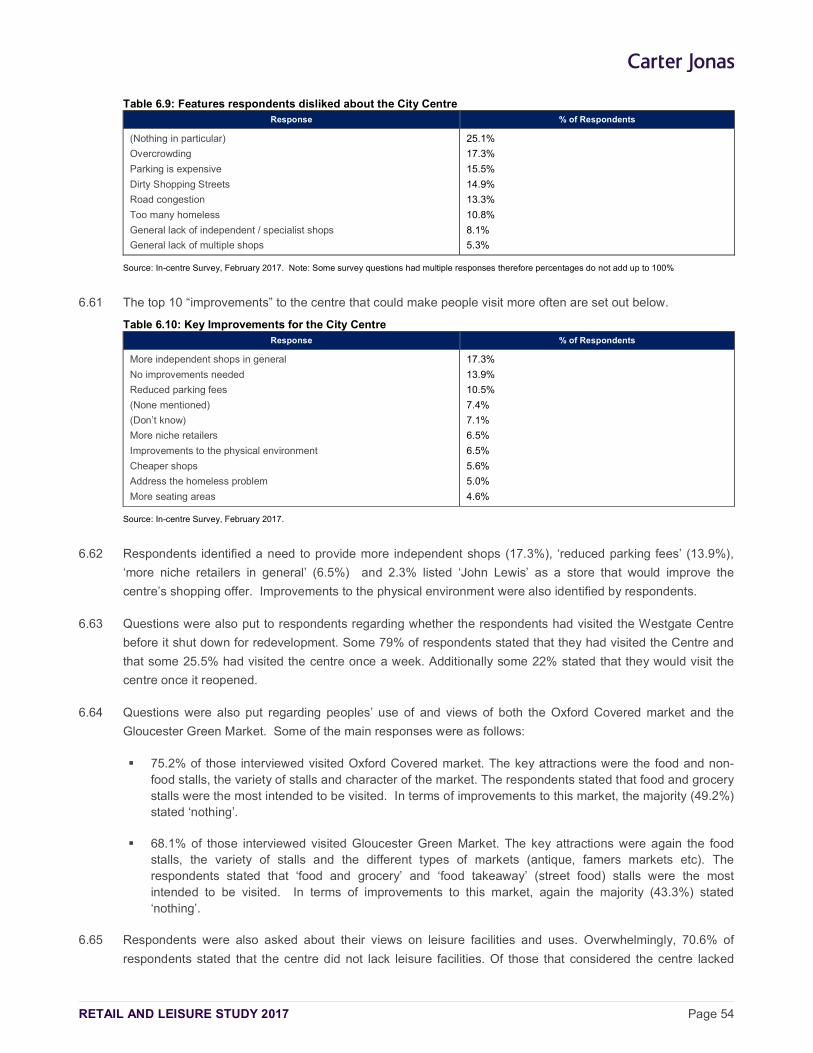
RETAIL AND LEISURE STUDY 2017 Page 54
Table 6.9: Features respondents disliked about the City Centre Response % of Respondents
(Nothing in particular)
Overcrowding
Parking is expensive
Dirty Shopping Streets
Road congestion
Too many homeless
General lack of independent / specialist shops
General lack of multiple shops
25.1%
17.3%
15.5%
14.9%
13.3%
10.8%
8.1%
5.3%
Source: In-centre Survey, February 2017. Note: Some survey questions had multiple responses therefore percentages do not add up to 100%
6.61 The top 10 “improvements” to the centre that could make people visit more often are set out below.
Table 6.10: Key Improvements for the City Centre Response % of Respondents
More independent shops in general
No improvements needed
Reduced parking fees
(None mentioned)
(Don’t know)
More niche retailers
Improvements to the physical environment
Cheaper shops
Address the homeless problem
More seating areas
17.3%
13.9%
10.5%
7.4%
7.1%
6.5%
6.5%
5.6%
5.0%
4.6%
Source: In-centre Survey, February 2017.
6.62 Respondents identified a need to provide more independent shops (17.3%), ‘reduced parking fees’ (13.9%),
‘more niche retailers in general’ (6.5%) and 2.3% listed ‘John Lewis’ as a store that would improve the
centre’s shopping offer. Improvements to the physical environment were also identified by respondents.
6.63 Questions were also put to respondents regarding whether the respondents had visited the Westgate Centre
before it shut down for redevelopment. Some 79% of respondents stated that they had visited the Centre and
that some 25.5% had visited the centre once a week. Additionally some 22% stated that they would visit the
centre once it reopened.
6.64 Questions were also put regarding peoples’ use of and views of both the Oxford Covered market and the
Gloucester Green Market. Some of the main responses were as follows:
75.2% of those interviewed visited Oxford Covered market. The key attractions were the food and non-food stalls, the variety of stalls and character of the market. The respondents stated that food and grocery stalls were the most intended to be visited. In terms of improvements to this market, the majority (49.2%) stated ‘nothing’.
68.1% of those interviewed visited Gloucester Green Market. The key attractions were again the food stalls, the variety of stalls and the different types of markets (antique, famers markets etc). The respondents stated that ‘food and grocery’ and ‘food takeaway’ (street food) stalls were the most intended to be visited. In terms of improvements to this market, again the majority (43.3%) stated ‘nothing’.
6.65 Respondents were also asked about their views on leisure facilities and uses. Overwhelmingly, 70.6% of
respondents stated that the centre did not lack leisure facilities. Of those that considered the centre lacked
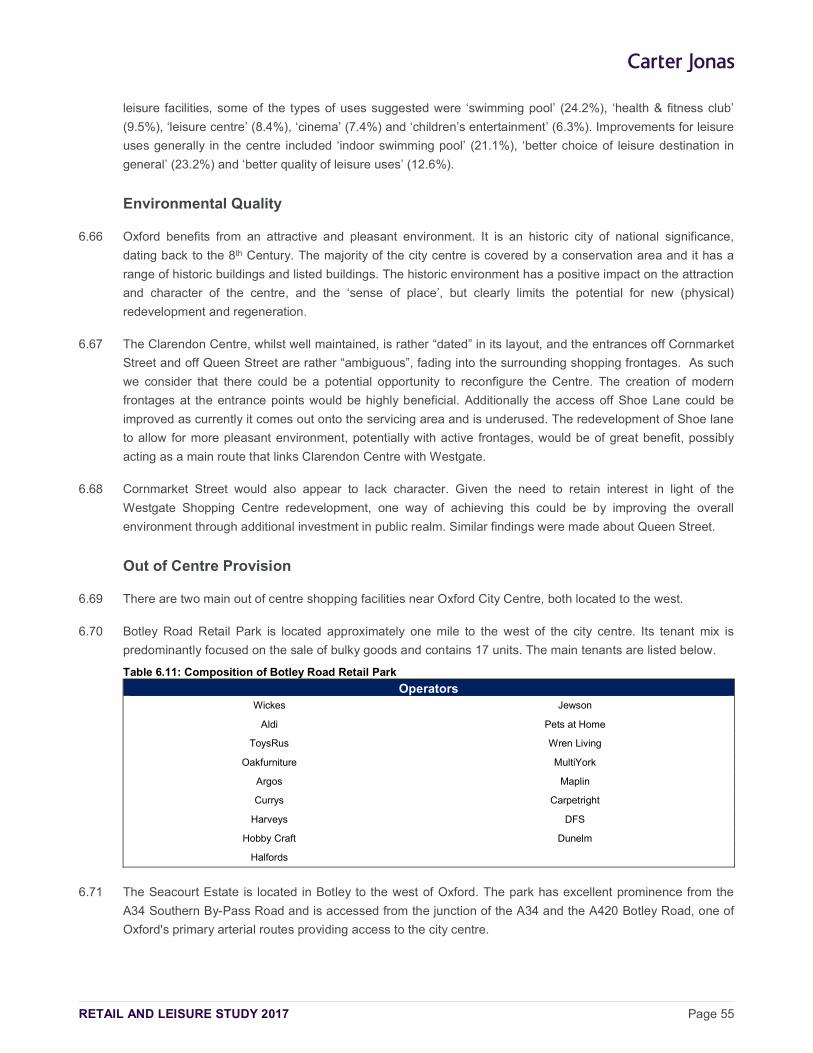
RETAIL AND LEISURE STUDY 2017 Page 55
leisure facilities, some of the types of uses suggested were ‘swimming pool’ (24.2%), ‘health & fitness club’
(9.5%), ‘leisure centre’ (8.4%), ‘cinema’ (7.4%) and ‘children’s entertainment’ (6.3%). Improvements for leisure
uses generally in the centre included ‘indoor swimming pool’ (21.1%), ‘better choice of leisure destination in
general’ (23.2%) and ‘better quality of leisure uses’ (12.6%).
Environmental Quality
6.66 Oxford benefits from an attractive and pleasant environment. It is an historic city of national significance,
dating back to the 8th Century. The majority of the city centre is covered by a conservation area and it has a
range of historic buildings and listed buildings. The historic environment has a positive impact on the attraction
and character of the centre, and the ‘sense of place’, but clearly limits the potential for new (physical)
redevelopment and regeneration.
6.67 The Clarendon Centre, whilst well maintained, is rather “dated” in its layout, and the entrances off Cornmarket
Street and off Queen Street are rather “ambiguous”, fading into the surrounding shopping frontages. As such
we consider that there could be a potential opportunity to reconfigure the Centre. The creation of modern
frontages at the entrance points would be highly beneficial. Additionally the access off Shoe Lane could be
improved as currently it comes out onto the servicing area and is underused. The redevelopment of Shoe lane
to allow for more pleasant environment, potentially with active frontages, would be of great benefit, possibly
acting as a main route that links Clarendon Centre with Westgate.
6.68 Cornmarket Street would also appear to lack character. Given the need to retain interest in light of the
Westgate Shopping Centre redevelopment, one way of achieving this could be by improving the overall
environment through additional investment in public realm. Similar findings were made about Queen Street.
Out of Centre Provision
6.69 There are two main out of centre shopping facilities near Oxford City Centre, both located to the west.
6.70 Botley Road Retail Park is located approximately one mile to the west of the city centre. Its tenant mix is
predominantly focused on the sale of bulky goods and contains 17 units. The main tenants are listed below.
Table 6.11: Composition of Botley Road Retail Park
Operators Wickes Jewson
Aldi Pets at Home
ToysRus Wren Living
Oakfurniture MultiYork
Argos Maplin
Currys Carpetright
Harveys DFS
Hobby Craft Dunelm
Halfords
6.71 The Seacourt Estate is located in Botley to the west of Oxford. The park has excellent prominence from the
A34 Southern By-Pass Road and is accessed from the junction of the A34 and the A420 Botley Road, one of
Oxford's primary arterial routes providing access to the city centre.
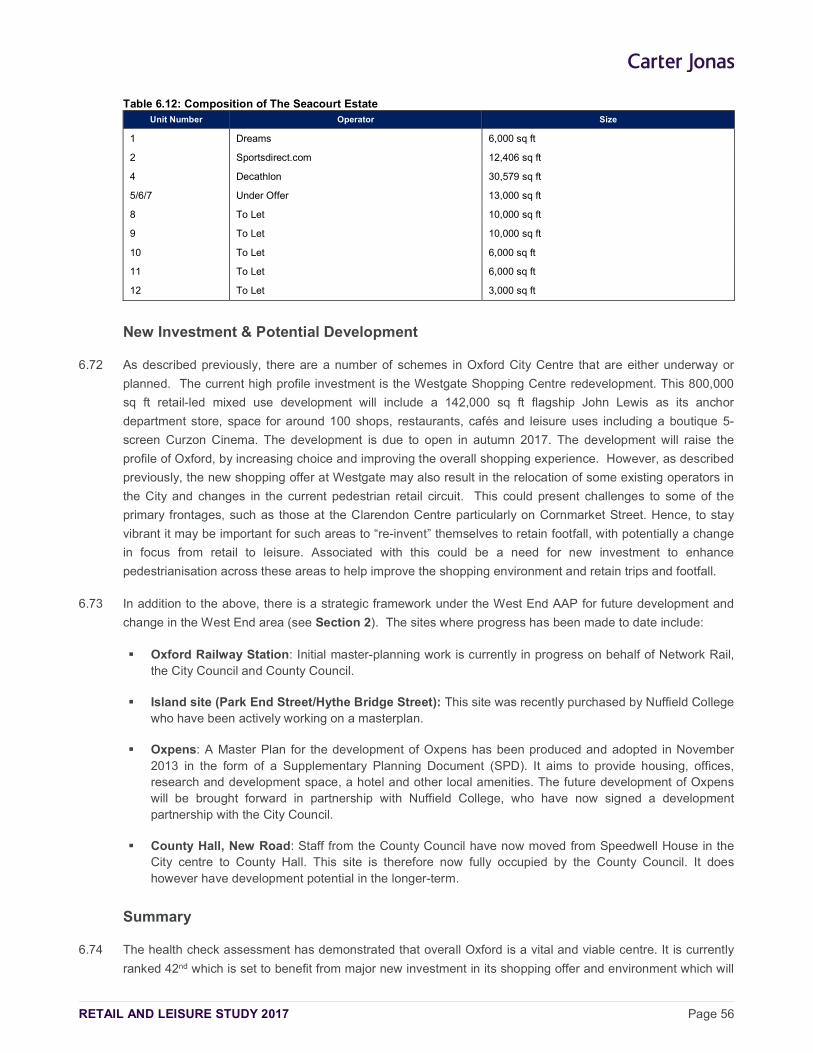
RETAIL AND LEISURE STUDY 2017 Page 56
Table 6.12: Composition of The Seacourt Estate Unit Number Operator Size
1 Dreams 6,000 sq ft
2 Sportsdirect.com 12,406 sq ft
4 Decathlon 30,579 sq ft
5/6/7 Under Offer 13,000 sq ft
8 To Let 10,000 sq ft
9 To Let 10,000 sq ft
10 To Let 6,000 sq ft
11 To Let 6,000 sq ft
12 To Let 3,000 sq ft
New Investment & Potential Development
6.72 As described previously, there are a number of schemes in Oxford City Centre that are either underway or
planned. The current high profile investment is the Westgate Shopping Centre redevelopment. This 800,000
sq ft retail-led mixed use development will include a 142,000 sq ft flagship John Lewis as its anchor
department store, space for around 100 shops, restaurants, cafés and leisure uses including a boutique 5-
screen Curzon Cinema. The development is due to open in autumn 2017. The development will raise the
profile of Oxford, by increasing choice and improving the overall shopping experience. However, as described
previously, the new shopping offer at Westgate may also result in the relocation of some existing operators in
the City and changes in the current pedestrian retail circuit. This could present challenges to some of the
primary frontages, such as those at the Clarendon Centre particularly on Cornmarket Street. Hence, to stay
vibrant it may be important for such areas to “re-invent” themselves to retain footfall, with potentially a change
in focus from retail to leisure. Associated with this could be a need for new investment to enhance
pedestrianisation across these areas to help improve the shopping environment and retain trips and footfall.
6.73 In addition to the above, there is a strategic framework under the West End AAP for future development and
change in the West End area (see Section 2). The sites where progress has been made to date include:
Oxford Railway Station: Initial master-planning work is currently in progress on behalf of Network Rail, the City Council and County Council.
Island site (Park End Street/Hythe Bridge Street): This site was recently purchased by Nuffield College who have been actively working on a masterplan.
Oxpens: A Master Plan for the development of Oxpens has been produced and adopted in November 2013 in the form of a Supplementary Planning Document (SPD). It aims to provide housing, offices, research and development space, a hotel and other local amenities. The future development of Oxpens will be brought forward in partnership with Nuffield College, who have now signed a development partnership with the City Council.
County Hall, New Road: Staff from the County Council have now moved from Speedwell House in the City centre to County Hall. This site is therefore now fully occupied by the County Council. It does however have development potential in the longer-term.
Summary
6.74 The health check assessment has demonstrated that overall Oxford is a vital and viable centre. It is currently
ranked 42nd which is set to benefit from major new investment in its shopping offer and environment which will
RETAIL AND LEISURE STUDY 2017 Page 57
improve its ranking further. The centre not only caters for its local catchment, wide rural catchment population,
as well as drawing shoppers, visitors and tourists from further afield including those that come from abroad.
The strong and growing student population further boosts the City’s retail and leisure economy. Overall, it
appears that Oxford City Centre has a very good range of shopping and leisure facilities typically found in a
centre of its size and position in the retail hierarchy.
6.75 The key strengths identified are as follows:
Oxford City Centre has a welcoming and attractive environment. It has many historic and listed buildings, and its relatively compact structure contribute well to the sense of place and character.
The centre has good accessibility and pedestrian flows.
The University, its buildings and students bring in trade to the centre and help to underpin the City’s daytime and evening economy. The University is also a major tourist and visitor draw.
The centre has a relatively good convenience provision anchored by the Sainsbury’s supermarket in Westgate and Marks & Spencer. This offer is supplemented by smaller supermarkets, convenience retailers and market stalls catering for the day-to-day needs of the working population, as well as shoppers and visitors to the City.
There is a good mix of multiple and independent retailers. It has a strong, diverse and growing (with the opening of the Westgate redevelopment) representation of comparison retailers, above the national average, and a good representation of fashion retailers.
There are department and variety stores (Debenhams and Marks & Spencer) that act as are key anchor retailers that help to underpin the town’s overall vitality and viability. Additionally the opening of the new John Lewis department store in Autumn 2017 as part of the Westgate Shopping Centre redevelopment will further elevate the City’s retail profile and raise its national ranking.
The redevelopment of the Westgate Shopping Centre represents a significant investment that will provide modern retail floorspace and a mix of places to eat and drink. It will have a positive impact on the scale and quality of the City’s offer.
The City has a good representation of leisure service provision. For example, it currently has two cinemas, theatres and a wide range of cafés and restaurants. This provision is set to be enhanced further with the opening of the new cinema as part of the redevelopment of the Westgate Shopping Centre.
Vacancy levels are below the national average, indicating that the centre is a desirable location. There is no significant concentration of vacant units across the centre.
There is very strong and growing market demand from retail and leisure operators for representation in the town centre and it is performing well in terms of reported Prime Zone A Rents and shopping yields.
The centre benefits from two popular markets which provide a positive contribution and uniqueness to the centre. The markets should be retained and enhanced where possible.
6.76 The key weaknesses identified are as follows:
Due to the Centre’s historic environment there are limits the potential for new redevelopment and investment in the heart of the City Centre.
Congestion and difficulty and cost of parking are an ongoing concern.
RETAIL AND LEISURE STUDY 2017 Page 58
6.77 Suggestions for improvements:
The opening of the Westgate Centre may result in some footfall and spend being diverted from the current primary frontages, especially the Clarendon Centre and Cornmarket Street. This therefore could mean that the existing retail frontages may need to "re-invent" themselves to remain attractive and viable.
Cornmarket Street and Queen Street lack “character”, and improvements here could help retail footfall once Westgate Shopping Centre opens.
The City centre has good accessibility and pedestrian flows, however it could benefit from better street signage to improve permeability and wayfinding.
With the redevelopment of the Westgate Shopping Centre the existing pedestrian retail circuit may change, as shoppers seek more direct access to the new facilities. This could result in the overall structure of the City centre changing, with some traditional streets experiencing a fall in footfall, spend and vibrancy over time. There will therefore be a need for the city to adapt to the changes arising from new investment and development across the City Centre.
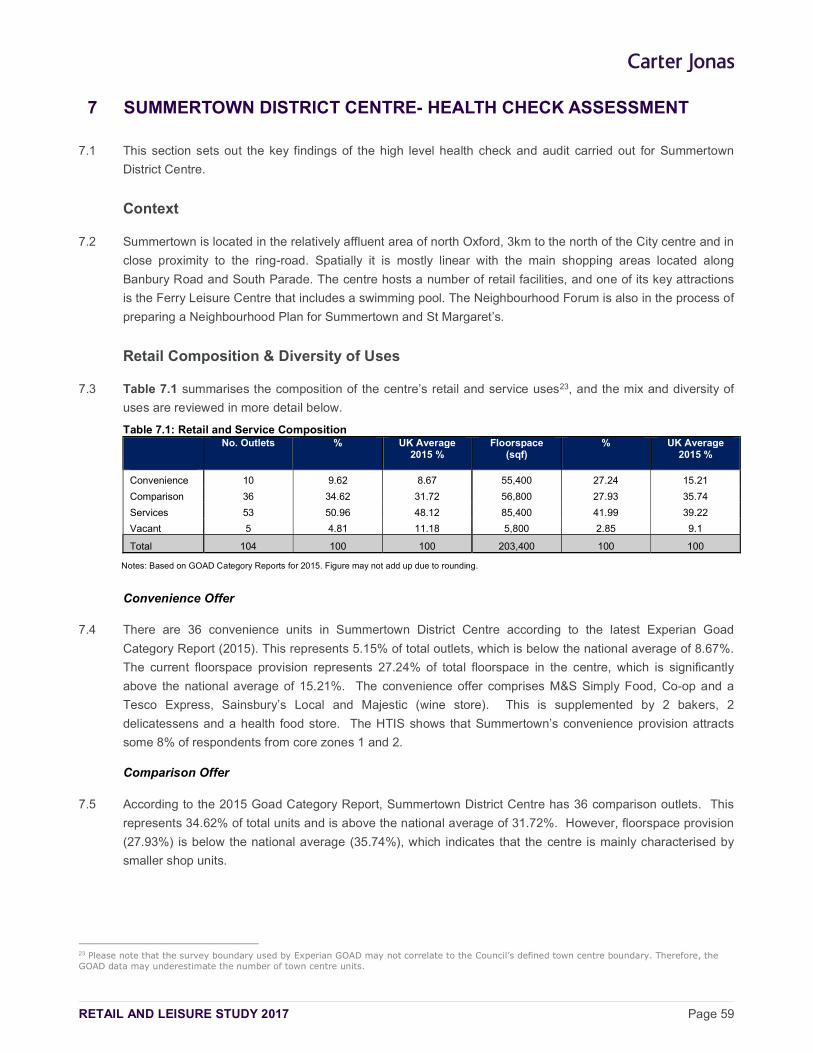
RETAIL AND LEISURE STUDY 2017 Page 59
7 SUMMERTOWN DISTRICT CENTRE- HEALTH CHECK ASSESSMENT
7.1 This section sets out the key findings of the high level health check and audit carried out for Summertown
District Centre.
Context
7.2 Summertown is located in the relatively affluent area of north Oxford, 3km to the north of the City centre and in
close proximity to the ring-road. Spatially it is mostly linear with the main shopping areas located along
Banbury Road and South Parade. The centre hosts a number of retail facilities, and one of its key attractions
is the Ferry Leisure Centre that includes a swimming pool. The Neighbourhood Forum is also in the process of
preparing a Neighbourhood Plan for Summertown and St Margaret’s.
Retail Composition & Diversity of Uses
7.3 Table 7.1 summarises the composition of the centre’s retail and service uses23, and the mix and diversity of
uses are reviewed in more detail below.
Table 7.1: Retail and Service Composition
No. Outlets % UK Average 2015 %
Floorspace (sqf)
% UK Average 2015 %
Convenience 10 9.62 8.67 55,400 27.24 15.21
Comparison 36 34.62 31.72 56,800 27.93 35.74
Services 53 50.96 48.12 85,400 41.99 39.22
Vacant 5 4.81 11.18 5,800 2.85 9.1
Total 104 100 100 203,400 100 100
Notes: Based on GOAD Category Reports for 2015. Figure may not add up due to rounding.
Convenience Offer
7.4 There are 36 convenience units in Summertown District Centre according to the latest Experian Goad
Category Report (2015). This represents 5.15% of total outlets, which is below the national average of 8.67%.
The current floorspace provision represents 27.24% of total floorspace in the centre, which is significantly
above the national average of 15.21%. The convenience offer comprises M&S Simply Food, Co-op and a
Tesco Express, Sainsbury’s Local and Majestic (wine store). This is supplemented by 2 bakers, 2
delicatessens and a health food store. The HTIS shows that Summertown’s convenience provision attracts
some 8% of respondents from core zones 1 and 2.
Comparison Offer
7.5 According to the 2015 Goad Category Report, Summertown District Centre has 36 comparison outlets. This
represents 34.62% of total units and is above the national average of 31.72%. However, floorspace provision
(27.93%) is below the national average (35.74%), which indicates that the centre is mainly characterised by
smaller shop units.
23 Please note that the survey boundary used by Experian GOAD may not correlate to the Council’s defined town centre boundary. Therefore, the GOAD data may underestimate the number of town centre units.
RETAIL AND LEISURE STUDY 2017 Page 60
7.6 The key national anchor operators are Oliver Bonas and Boots pharmacy. The centre’s comparison offer is
mainly dominated by independent operators. We consider that the overall mix of comparison stores is
appropriate given the role and function of the centre.
7.7 The number of charity shops is much higher than the national average (5.77% vs 2.71%) with 6 stores
present. We do not consider that the number of charity shops is a concern, although provision should be
monitored in the context of the broader mix of the retail offer across the centre over time. At this stage, they
contribute to the diversity of the comparison offer and are an important generator of shopping trips and footfall.
Additionally, the number of fitted furniture stores is also higher than the national average (3.85% vs 0.39%)
with 4 stores present. However, it is quite common for district centres to act as “local hubs” for specialist
stores (such as fitted kitchens in this case), and hence such concentration is not as a concern. The HTIS also
shows that Summertown’s comparison goods provision attracts only 2.52% of respondents from the core
zones (1 and 2).
Service Offer
7.8 Service businesses are defined by Experian Goad as including retail, professional and financial services. As
Table 7.1 shows, there are 53 service outlets in Summertown District Centre, which account for 50.96% of all
units. The current provision is above the national average of 48.24%. The current floorspace provision
represents 41.99% of total floorspace in the centre, which is significantly above with the national average of
39.22%. Based on our examination of other similar towns and district centres, we find that the higher
concentration of services is quite common, and should not be a cause for concern.
7.9 The following provides a brief summary of provision in the different service categories:
There were 15 retail services in 2015 according Experian Goad, which represented 14.42% of total outlets in the town centre. This is slightly above the national average of 14.06%. This category is mostly made up of health and beauty outlets (15 - predominantly hairdressers and beauty salons). There are also 2 dry cleaners, 2 opticians, and 2 travel agents. Given the role and function of the district centre, that seeks to cater for its local catchment, we consider the retail services offer to be appropriate.
In terms of financial services, there are 23 outlets in 2015. This represented 22.12% of total units and is below the national average of 23.05%. The mix of services is dominated by property services (14), and the centre also hosts four financial services. There are also 5 retail banks (albeit it we note that at the time of our visit this has decreased to 4, with Barclays anticipated to be leaving the centre).
There are 15 leisure service outlets in 2015, which was equivalent to 14.42% of total provision. This is significantly below the national average of 23.50%. The current leisure offer consist of 7 cafes and restaurant, 5 bars and wine bars, a takeaway and a betting shop. On our site visit we observed 3 takeaways and one public house. We also understand that the centre is “quite lively” during the evening due to the number of cafes and restaurants staying open. This contributes to the evening economy. Furthermore, one of the centre’s key attractions is the Ferry Leisure Centre that includes a swimming pool. Additional leisure facilities include the sports centre in Diamond Place and we also understand that the nearby St. Edwards School hosts a theatre and exhibition venue.
Vacancies
7.10 The number and scale of vacancies in a centre, and the length of time properties have been vacant,
represents a key performance indicator (KPI) to help assess a centre’s overall vitality and viability. For
example, high vacancy levels, or a concentration of vacancies in certain areas/streets, could point to
underlying weaknesses in terms of retailer demand and/or the fact that the vacant units are not meeting
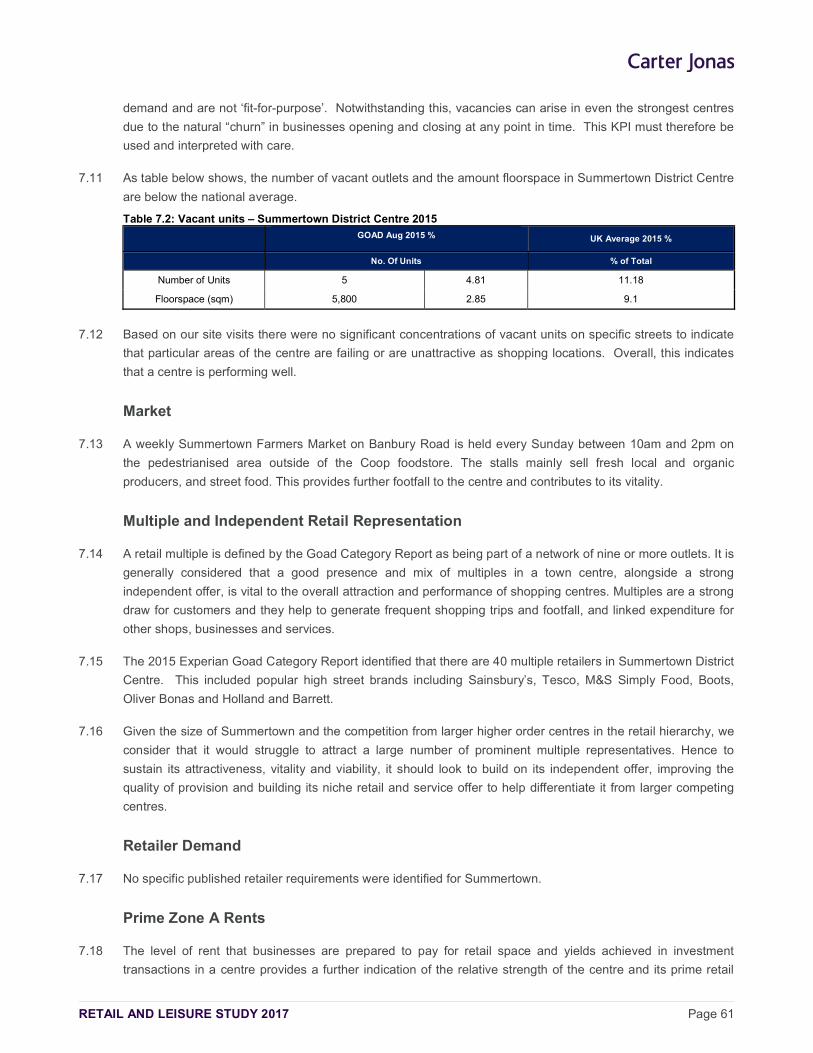
RETAIL AND LEISURE STUDY 2017 Page 61
demand and are not ‘fit-for-purpose’. Notwithstanding this, vacancies can arise in even the strongest centres
due to the natural “churn” in businesses opening and closing at any point in time. This KPI must therefore be
used and interpreted with care.
7.11 As table below shows, the number of vacant outlets and the amount floorspace in Summertown District Centre
are below the national average.
Table 7.2: Vacant units – Summertown District Centre 2015 GOAD Aug 2015 % UK Average 2015 %
No. Of Units % of Total
Number of Units 5 4.81 11.18
Floorspace (sqm) 5,800 2.85 9.1
7.12 Based on our site visits there were no significant concentrations of vacant units on specific streets to indicate
that particular areas of the centre are failing or are unattractive as shopping locations. Overall, this indicates
that a centre is performing well.
Market
7.13 A weekly Summertown Farmers Market on Banbury Road is held every Sunday between 10am and 2pm on
the pedestrianised area outside of the Coop foodstore. The stalls mainly sell fresh local and organic
producers, and street food. This provides further footfall to the centre and contributes to its vitality.
Multiple and Independent Retail Representation
7.14 A retail multiple is defined by the Goad Category Report as being part of a network of nine or more outlets. It is
generally considered that a good presence and mix of multiples in a town centre, alongside a strong
independent offer, is vital to the overall attraction and performance of shopping centres. Multiples are a strong
draw for customers and they help to generate frequent shopping trips and footfall, and linked expenditure for
other shops, businesses and services.
7.15 The 2015 Experian Goad Category Report identified that there are 40 multiple retailers in Summertown District
Centre. This included popular high street brands including Sainsbury’s, Tesco, M&S Simply Food, Boots,
Oliver Bonas and Holland and Barrett.
7.16 Given the size of Summertown and the competition from larger higher order centres in the retail hierarchy, we
consider that it would struggle to attract a large number of prominent multiple representatives. Hence to
sustain its attractiveness, vitality and viability, it should look to build on its independent offer, improving the
quality of provision and building its niche retail and service offer to help differentiate it from larger competing
centres.
Retailer Demand
7.17 No specific published retailer requirements were identified for Summertown.
Prime Zone A Rents
7.18 The level of rent that businesses are prepared to pay for retail space and yields achieved in investment
transactions in a centre provides a further indication of the relative strength of the centre and its prime retail
RETAIL AND LEISURE STUDY 2017 Page 62
pitch as a shopping location. After Oxford City Centre, Summertown has the highest Prime Zone A Rents with
Carter Jonas’ commercial property agents estimating that these are currently between £60 and £80 per sqft.
This is considered to be a relatively healthy rent given Summertown’s relative scale, role and function in the
retail hierarchy.
Accessibility & Pedestrian Flows
7.19 Summertown is well served by public transport with regular buses running to a number of destinations
included Oxford City Centre, Oxford Railway station, and John Radcliffe Hospital. There are also a number of
Park and Ride buses that stop at Summertown on their way to Oxford City centre. The centre also has a good
provision of bicycle stands.
7.20 There are three public (pay and display) car parks serving the centre including Summertown car park
(Diamond Place) and Ferry Leisure Centre car park. The latter offer a service where the parking fee can be
paid or topped-up via the phone. These facilities help to increase dwell times at the centre.
7.21 There is limited on-street parking in the Summertown shopping area, on the west side of Banbury Road and
on South Parade. In most of the side streets in Summertown a significant amount of the parking is for
Resident Permit Holders only. This generally operates 8am-10pm. There are a few spaces for time-limited
non-residents’ parking.
7.22 Oxford Parkway station is located approximately one mile north of Summertown on the Banbury Road/Oxford
Road (A4260) to Kidlington, at the same site as the Water Eaton Park & Ride (OX2 8HA). Trains run to and
from Oxford Parkway to London Marylebone every half an hour; the journey time is just under an hour.
Chiltern Railways operate the service and the train also stops at Bicester Village and High Wycombe.
7.23 On the day of our visit (Monday between 2 pm and 4 pm), the centre was quite busy with good pedestrian
flow. However being a linear centre Banbury Road acts as an impediment to pedestrian movement between
the two sides of the high street. There are three dedicated light controlled pedestrian crossings: one close to
the junction of Banbury Road with South Parade, one at the other at the junction of Banbury Road with
Oakthorpe Road, and one at the other at the junction of Banbury Road with Summerfield Road. However,
these are quite spread out.
New Investment & Potential Development
7.24 The Sites and Housing Plan 2011-2026 (2013) allocated sites for development for housing, employment and
other uses, including retail, and sets out policies for residential development including affordable housing (see
Section 2). Policy SP14 ‘Diamond Place and Ewert House’ specifically seeks the redevelopment of a
Summertown District Centre site that comprises car parks, office and academic use. It states that planning
permission will be granted for a retail-led mixed use development which could include residential, employment
and student accommodation. The Diamond Place Supplementary Planning Document (SPD) supplements
Policy SP14 of the Sites and Housing Plan, which allocates the site for retail-led development, with potential
for a wide mix of other uses, and retaining parking adequate to serve the local area. The SPD states that the
re-development of this site provides an opportunity to enhance the offer of Summertown’s district centre.
Development should include retail of around 1,000 sqm and the new retail floorspace should be provided as
more than one unit and could also include restaurants and cafés to encourage variety (see para 21). At the
time of writing this report there are no planning applications in relation to this allocation.
RETAIL AND LEISURE STUDY 2017 Page 63
7.25 The most notable areas that could benefit from redevelopment are the Majestic Wine Warehouse building, and
Suffolk House that lies directly opposite and is currently occupied by Tesco Express and Sainsbury’s Local.
Such redevelopment could provide more modern floorspace that may be more attractive to retailers that could
raise Summertown’s profile, as well as enhance the overall aesthetic of the streetscape.
7.26 We also understand that Library on the edge of the District centre in South Parade is very well used and is a
key hub for the local community. Furthermore ‘The Friends of Summertown Library’ are raising funds to
undertake improvements and enhancement to the facilities.
7.27 Other potential development sites include:
Diamond Place: This site is owned by the City Council and the University (Examination Buildings). An SPD has been approved for the redevelopment of the site to comprise a mixed-use development. It represents a key development site within the centre.
Majestic Warehouse, Banbury Road: This site is under one ownership but let out on individual leases to a range of occupiers. The leases we understand will be coming to an end in the next few years. There is therefore a prospect for a site with potential mixed-use development.
Suffolk House: This site fronts Banbury Road and South Parade. The site appears to be under-used and clearly has some potential to make better and more efficient use of the site.
Garage/Parking sites: It was observed on our site visit that there are a number of individual sites around the centre with either open surface parking or lock-up garages that are mainly located on the north side of South Parade and to the west side of Banbury Road behind the existing shops. These too represent potential for enhancement as part of a wider regeneration strategy.
Customer Views and Perceptions
Household Survey
7.28 The household telephone interview survey asked specific questions on respondents’ views and perceptions of
Summertown as a place to shop and visit for a wide range of uses and attractions. This included identifying
key improvements residents would like to see that might encourage them to visit the centre more often for
shopping and other purposes.
7.29 The survey indicates that 27.99% from Zone 1 and 79.16% from Zone 2 never visit Summertown. Of those
that do visit from the core zones, 11.34% (Zone 1) and 2.04% (Zone 2) visit once a week and 24.85% (Zone 1)
and 2.72% (Zone 2) visit more often than that.
7.30 The survey results also showed that respondents like the following features of Summertown District centre.
The most frequently raised themes are shown in the table below.
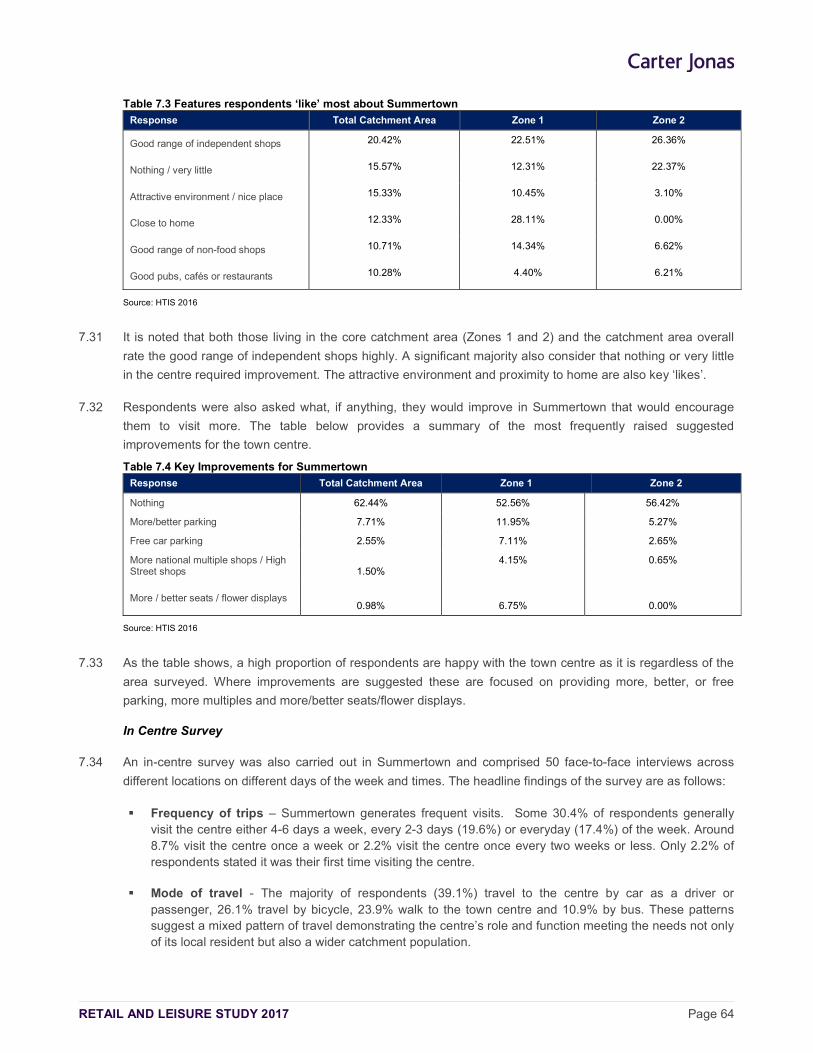
RETAIL AND LEISURE STUDY 2017 Page 64
Table 7.3 Features respondents ‘like’ most about Summertown
Response Total Catchment Area Zone 1 Zone 2
Good range of independent shops 20.42% 22.51% 26.36%
Nothing / very little 15.57% 12.31% 22.37%
Attractive environment / nice place 15.33% 10.45% 3.10%
Close to home 12.33% 28.11% 0.00%
Good range of non-food shops 10.71% 14.34% 6.62%
Good pubs, cafés or restaurants 10.28% 4.40% 6.21%
Source: HTIS 2016
7.31 It is noted that both those living in the core catchment area (Zones 1 and 2) and the catchment area overall
rate the good range of independent shops highly. A significant majority also consider that nothing or very little
in the centre required improvement. The attractive environment and proximity to home are also key ‘likes’.
7.32 Respondents were also asked what, if anything, they would improve in Summertown that would encourage
them to visit more. The table below provides a summary of the most frequently raised suggested
improvements for the town centre.
Table 7.4 Key Improvements for Summertown
Response Total Catchment Area Zone 1 Zone 2
Nothing 62.44% 52.56% 56.42%
More/better parking 7.71% 11.95% 5.27%
Free car parking 2.55% 7.11% 2.65%
More national multiple shops / High Street shops 1.50%
4.15% 0.65%
More / better seats / flower displays 0.98%
6.75%
0.00%
Source: HTIS 2016
7.33 As the table shows, a high proportion of respondents are happy with the town centre as it is regardless of the
area surveyed. Where improvements are suggested these are focused on providing more, better, or free
parking, more multiples and more/better seats/flower displays.
In Centre Survey
7.34 An in-centre survey was also carried out in Summertown and comprised 50 face-to-face interviews across
different locations on different days of the week and times. The headline findings of the survey are as follows:
Frequency of trips – Summertown generates frequent visits. Some 30.4% of respondents generally visit the centre either 4-6 days a week, every 2-3 days (19.6%) or everyday (17.4%) of the week. Around 8.7% visit the centre once a week or 2.2% visit the centre once every two weeks or less. Only 2.2% of respondents stated it was their first time visiting the centre.
Mode of travel - The majority of respondents (39.1%) travel to the centre by car as a driver or passenger, 26.1% travel by bicycle, 23.9% walk to the town centre and 10.9% by bus. These patterns suggest a mixed pattern of travel demonstrating the centre’s role and function meeting the needs not only of its local resident but also a wider catchment population.
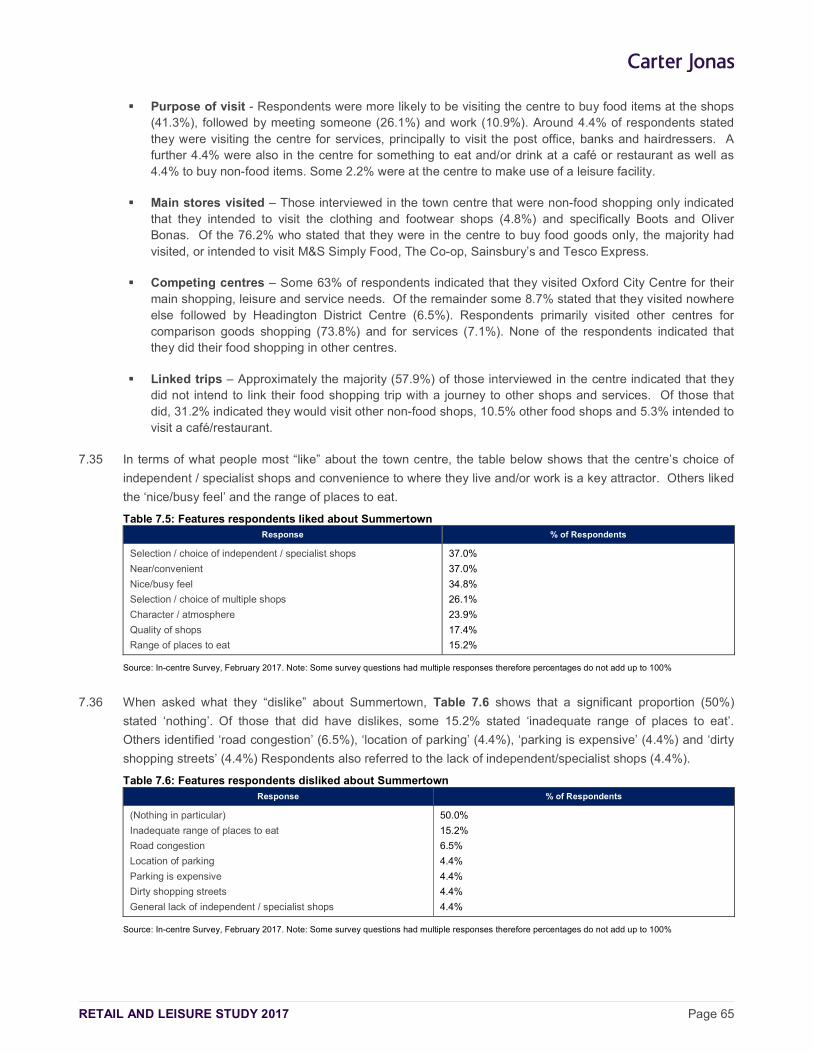
RETAIL AND LEISURE STUDY 2017 Page 65
Purpose of visit - Respondents were more likely to be visiting the centre to buy food items at the shops (41.3%), followed by meeting someone (26.1%) and work (10.9%). Around 4.4% of respondents stated they were visiting the centre for services, principally to visit the post office, banks and hairdressers. A further 4.4% were also in the centre for something to eat and/or drink at a café or restaurant as well as 4.4% to buy non-food items. Some 2.2% were at the centre to make use of a leisure facility.
Main stores visited – Those interviewed in the town centre that were non-food shopping only indicated that they intended to visit the clothing and footwear shops (4.8%) and specifically Boots and Oliver Bonas. Of the 76.2% who stated that they were in the centre to buy food goods only, the majority had visited, or intended to visit M&S Simply Food, The Co-op, Sainsbury’s and Tesco Express.
Competing centres – Some 63% of respondents indicated that they visited Oxford City Centre for their main shopping, leisure and service needs. Of the remainder some 8.7% stated that they visited nowhere else followed by Headington District Centre (6.5%). Respondents primarily visited other centres for comparison goods shopping (73.8%) and for services (7.1%). None of the respondents indicated that they did their food shopping in other centres.
Linked trips – Approximately the majority (57.9%) of those interviewed in the centre indicated that they did not intend to link their food shopping trip with a journey to other shops and services. Of those that did, 31.2% indicated they would visit other non-food shops, 10.5% other food shops and 5.3% intended to visit a café/restaurant.
7.35 In terms of what people most “like” about the town centre, the table below shows that the centre’s choice of
independent / specialist shops and convenience to where they live and/or work is a key attractor. Others liked
the ‘nice/busy feel’ and the range of places to eat.
Table 7.5: Features respondents liked about Summertown Response % of Respondents
Selection / choice of independent / specialist shops
Near/convenient
Nice/busy feel
Selection / choice of multiple shops
Character / atmosphere
Quality of shops
Range of places to eat
37.0%
37.0%
34.8%
26.1%
23.9%
17.4%
15.2%
Source: In-centre Survey, February 2017. Note: Some survey questions had multiple responses therefore percentages do not add up to 100%
7.36 When asked what they “dislike” about Summertown, Table 7.6 shows that a significant proportion (50%)
stated ‘nothing’. Of those that did have dislikes, some 15.2% stated ‘inadequate range of places to eat’.
Others identified ‘road congestion’ (6.5%), ‘location of parking’ (4.4%), ‘parking is expensive’ (4.4%) and ‘dirty
shopping streets’ (4.4%) Respondents also referred to the lack of independent/specialist shops (4.4%).
Table 7.6: Features respondents disliked about Summertown Response % of Respondents
(Nothing in particular)
Inadequate range of places to eat
Road congestion
Location of parking
Parking is expensive
Dirty shopping streets
General lack of independent / specialist shops
50.0%
15.2%
6.5%
4.4%
4.4%
4.4%
4.4%
Source: In-centre Survey, February 2017. Note: Some survey questions had multiple responses therefore percentages do not add up to 100%
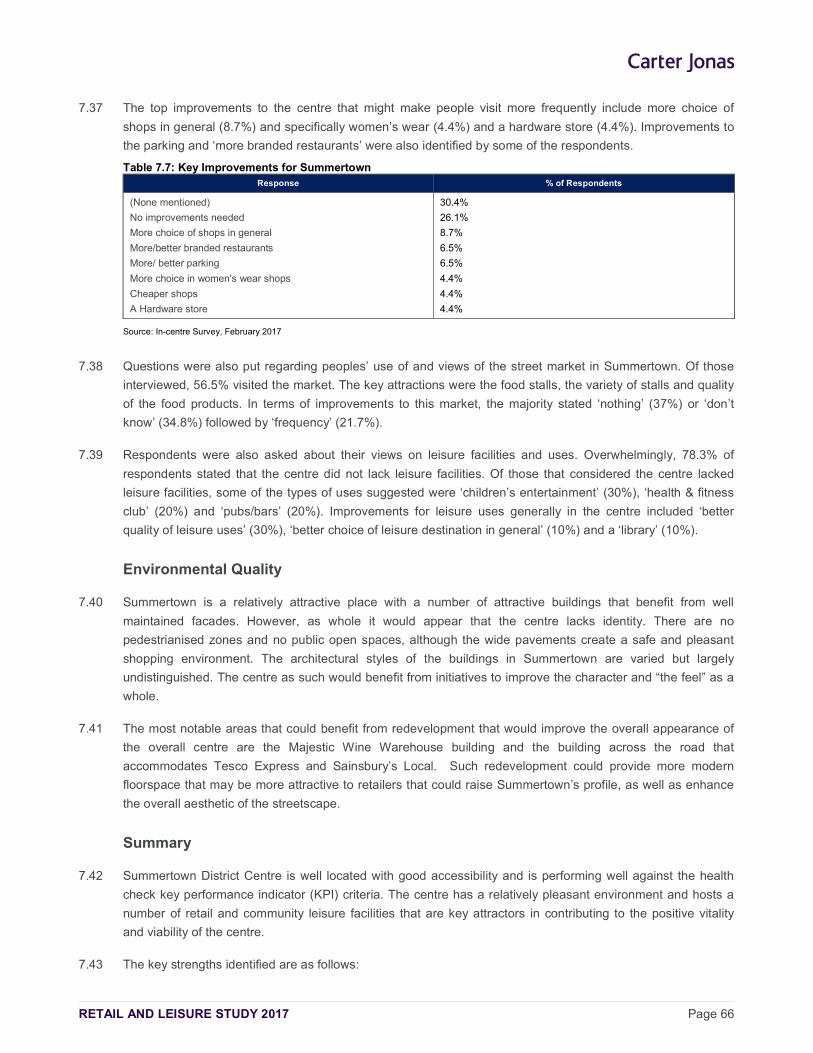
RETAIL AND LEISURE STUDY 2017 Page 66
7.37 The top improvements to the centre that might make people visit more frequently include more choice of
shops in general (8.7%) and specifically women’s wear (4.4%) and a hardware store (4.4%). Improvements to
the parking and ‘more branded restaurants’ were also identified by some of the respondents.
Table 7.7: Key Improvements for Summertown Response % of Respondents
(None mentioned)
No improvements needed
More choice of shops in general
More/better branded restaurants
More/ better parking
More choice in women's wear shops
Cheaper shops
A Hardware store
30.4%
26.1%
8.7%
6.5%
6.5%
4.4%
4.4%
4.4%
Source: In-centre Survey, February 2017
7.38 Questions were also put regarding peoples’ use of and views of the street market in Summertown. Of those
interviewed, 56.5% visited the market. The key attractions were the food stalls, the variety of stalls and quality
of the food products. In terms of improvements to this market, the majority stated ‘nothing’ (37%) or ‘don’t
know’ (34.8%) followed by ‘frequency’ (21.7%).
7.39 Respondents were also asked about their views on leisure facilities and uses. Overwhelmingly, 78.3% of
respondents stated that the centre did not lack leisure facilities. Of those that considered the centre lacked
leisure facilities, some of the types of uses suggested were ‘children’s entertainment’ (30%), ‘health & fitness
club’ (20%) and ‘pubs/bars’ (20%). Improvements for leisure uses generally in the centre included ‘better
quality of leisure uses’ (30%), ‘better choice of leisure destination in general’ (10%) and a ‘library’ (10%).
Environmental Quality
7.40 Summertown is a relatively attractive place with a number of attractive buildings that benefit from well
maintained facades. However, as whole it would appear that the centre lacks identity. There are no
pedestrianised zones and no public open spaces, although the wide pavements create a safe and pleasant
shopping environment. The architectural styles of the buildings in Summertown are varied but largely
undistinguished. The centre as such would benefit from initiatives to improve the character and “the feel” as a
whole.
7.41 The most notable areas that could benefit from redevelopment that would improve the overall appearance of
the overall centre are the Majestic Wine Warehouse building and the building across the road that
accommodates Tesco Express and Sainsbury’s Local. Such redevelopment could provide more modern
floorspace that may be more attractive to retailers that could raise Summertown’s profile, as well as enhance
the overall aesthetic of the streetscape.
Summary
7.42 Summertown District Centre is well located with good accessibility and is performing well against the health
check key performance indicator (KPI) criteria. The centre has a relatively pleasant environment and hosts a
number of retail and community leisure facilities that are key attractors in contributing to the positive vitality
and viability of the centre.
7.43 The key strengths identified are as follows:
RETAIL AND LEISURE STUDY 2017 Page 67
The centre has a strong convenience offer including M&S Simply Food, Co-op, Tesco Express, Sainsbury’s Local.
The centre’s mix of comparison stores is appropriate given the role and function of the centre.
The centre has an above average provision of services with cafes and restaurants significantly contributing in creating a vibrant evening economy. The Ferry Leisure Centre and provision of additional leisure facilities (sports centre in Diamond Place, St. Edwards School – theatre/exhibition venue) act as a further draw to the centre.
Broadly, the centre has a relatively good retail, leisure and financial services provision, and is serving the day-to-day needs of its local resident catchment well.
There are no significant concentrations of vacant units across the centre, which is a good indicator of its overall vitality and viability.
The Summertown Farmers Market on Banbury Road contributes to the centre’s vitality generating footfall and interest.
The centre exhibits a relatively healthy rent level given its relative scale, role and function in the retail hierarchy.
The centre benefits from a vibrant evening economy that helps to increase dwell times and footfall across the centre.
7.44 The key weaknesses identified are as follows:
The centre lacks identity.
There are no pedestrianised zones and no public open spaces.
7.45 Suggestions for improvements:
The Centre should look to build on its independent offer, improving the quality of provision and building its niche retail and service offer to help differentiate it from larger competing centres.
There is scope to enhance the variety and choice of retailers.
The current and emerging potential development sites need to be considered as part of the emerging Local Plan for the continued vitality and viability of the centre. These need to be actively promoted and capitalised upon to proactively enhance the offer across the centre e.g. Diamond Place.
The centre would benefit from initiatives to improve the character and "the feel" as a whole.
RETAIL AND LEISURE STUDY 2017 Page 68
8 COWLEY DISTRICT CENTRE - HEALTH CHECK ASSESSMENT
8.1 This section sets out the key findings of the health check assessment for Cowley District Centre (also known
as the ‘Cowley Centre’).
Context
8.2 The Cowley Centre is located some 3.7km southeast of the City Centre. It is approximately 3.1km from
Headington and 2.25km from Cowley Road. It comprises of two distinct parts:
the Templars Square Shopping Centre; and
the adjacent Templars Shopping Park.
8.3 The B4495 (Between Towns Road) dissects the two constituent parts. The B4495 is a busy road with access
to the retail park being a regular congestion point. The District Centre is surrounded by substantial public
sector housing that acts a “captive audience” for walk-in trade to both centres. At the time of our site visit,
these housing units were undergoing substantial recladding and energy improvement works.
Retail Composition & Diversity of Uses
8.4 Cowley Centre is ranked 482nd in Javelin’s 2014 Venuescore24 above Summertown (659th). This reflects the
relative scale and quality of its shopping offer. It is also classified as ‘Lower Market’ in terms of its fashion and
shopping offer.
8.5 The 26,914 sqm Templars Square Shopping Centre was acquired by its current owners, NewRiver REIT, in
2012. It is mainly covered and provides a safe pedestrianised environment. Templars Square Shopping
Centre is surrounded to the north by Between Towns Road, to the east by Barns Road, to the south by
Hockmore Street and to the west by Crowell Road. Frontages along these roads are limited and along
Hockmore Street the street scene is blighted by the presence of lock-up garages. We understand this road is
also used as a short cut to Barns Road (to the East) and Crowell Road (to the west). The centre is served by
a number of dedicated car parks including Knight’s Car Park, Castle Car Park and Barns Road Car Park.
8.6 The £60m renovation of Templars Square Shopping Centre by its owners NewRiver REIT aims to transform
the Templars Square shopping centre and its immediate surroundings. The mixed-use proposals will preserve
the existing Templars Square shops, whilst bringing forward a range of significant improvements to create a
more vibrant and thriving community across the District Centre.
8.7 The tenant mix in Templar’s Square Shopping Centre includes a number of high profile national multiples,
such as Dorothy Perkins, New Look, Shoe Zone, Peacocks, Superdrug, Claire’s Accessories, Savers, Boots,
and B&M Bargains. There are also a range of independent retail units, service and leisure uses, including
independent cafés, takeaways and sandwich bars. There are a number of foodstores and leisure facilities in
the centre, which include Co-op, Iceland and Greggs.
8.8 The table below summarises the broad composition and diversity of the centre’s retail and service offer.
24 Venuescore is Javelin Group’s annual ranking of the UK’s top 3,000+ retail venues based on provision of multiple retailers including anchor stores, fashion operators, and non-fashion multiples, where each operator is given a weighted score to reflect its overall impact on shopping patterns and the attraction of centres. The Market Position Index measures the degree to which the centre's offer has a high-end or discount focus (High=Bias towards High-end retailers; Low=Bias towards Discount-oriented retailers)
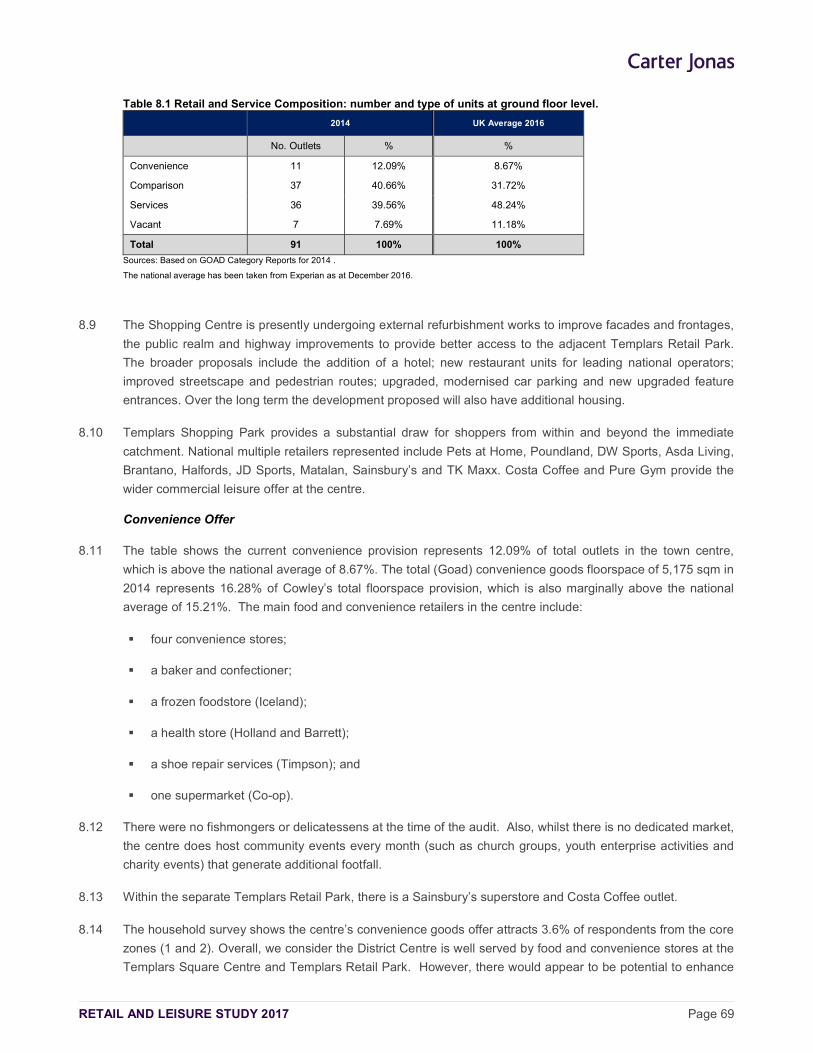
RETAIL AND LEISURE STUDY 2017 Page 69
Table 8.1 Retail and Service Composition: number and type of units at ground floor level.
2014 UK Average 2016
No. Outlets % %
Convenience 11 12.09% 8.67%
Comparison 37 40.66% 31.72%
Services 36 39.56% 48.24%
Vacant 7 7.69% 11.18%
Total 91 100% 100%
Sources: Based on GOAD Category Reports for 2014 .
The national average has been taken from Experian as at December 2016.
8.9 The Shopping Centre is presently undergoing external refurbishment works to improve facades and frontages,
the public realm and highway improvements to provide better access to the adjacent Templars Retail Park.
The broader proposals include the addition of a hotel; new restaurant units for leading national operators;
improved streetscape and pedestrian routes; upgraded, modernised car parking and new upgraded feature
entrances. Over the long term the development proposed will also have additional housing.
8.10 Templars Shopping Park provides a substantial draw for shoppers from within and beyond the immediate
catchment. National multiple retailers represented include Pets at Home, Poundland, DW Sports, Asda Living,
Brantano, Halfords, JD Sports, Matalan, Sainsbury’s and TK Maxx. Costa Coffee and Pure Gym provide the
wider commercial leisure offer at the centre.
Convenience Offer
8.11 The table shows the current convenience provision represents 12.09% of total outlets in the town centre,
which is above the national average of 8.67%. The total (Goad) convenience goods floorspace of 5,175 sqm in
2014 represents 16.28% of Cowley’s total floorspace provision, which is also marginally above the national
average of 15.21%. The main food and convenience retailers in the centre include:
four convenience stores;
a baker and confectioner;
a frozen foodstore (Iceland);
a health store (Holland and Barrett);
a shoe repair services (Timpson); and
one supermarket (Co-op).
8.12 There were no fishmongers or delicatessens at the time of the audit. Also, whilst there is no dedicated market,
the centre does host community events every month (such as church groups, youth enterprise activities and
charity events) that generate additional footfall.
8.13 Within the separate Templars Retail Park, there is a Sainsbury’s superstore and Costa Coffee outlet.
8.14 The household survey shows the centre’s convenience goods offer attracts 3.6% of respondents from the core
zones (1 and 2). Overall, we consider the District Centre is well served by food and convenience stores at the
Templars Square Centre and Templars Retail Park. However, there would appear to be potential to enhance
RETAIL AND LEISURE STUDY 2017 Page 70
and widen the offer by attracting more independent food and convenience retailers, such as a fishmonger or
delicatessen for example. The potential for a dedicated street market should also be considered to help
improve the range and choice of independent stores/stalls and goods.
Comparison Offer
8.15 As Table 8.1 shows Cowley has 37 comparison outlets. This represents 40.66% of total provision and is
above the national average of 31.72%. The (Goad) comparison floorspace is 18,079 sqm representing
56.88% of the total floorspace in the town centre, which is also significantly above the national average of
35.74% in 2016.
8.16 In general terms the centre has a good representation across the different comparison goods categories, and
strong provision in the following areas:
Clothing and ladies’ wear - the seven shops in this category represent over 18% of total floorspace, which is considerably higher than the national average of 5.42%. This fashion offer acts as a substantial draw, helping to extend the centre’s catchment over a wider area than would normally be expected for a more ‘traditional’ District Centre.
Charity shops – the six stores represent 6.59% of total outlets, which is significantly higher than the national average figure of 2.71%. This is not necessarily a cause for concern, as charity shops are an important generator of shopping trips and footfall.
Hardware and household goods – the four outlets in this category represent 16.92% of total floorspace, which is substantially higher than the national average of 3.78%.
8.17 The household survey results show that Cowley Centre’s comparison goods provision attracts 10.26% of
respondents from the core zones (1 and 2), which is second highest after the City Centre. This further reflects
the relative attraction and strength of the centre’s comparison goods offer.
Service Provision
8.18 There are 36 retail, leisure and financial services in the town centre. This represents 39.56% of total provision
and is below the 2016 national average of 48.24%. The current distribution of service uses is as follows:
There were 13 retail services in 2015. Current provision represents 14.29% of total units, which is marginally above the (2016) national average of 14.06%. The retail service offer is dominated by five health and beauty outlets (5.49%) of all retail outlets. There are also two opticians, two travel agents, one photo studio, one post office and one vehicle repairs service.
There were 8 financial service outlets in 2015, including five banks and building societies; two property services and one financial services outlet. Current provision represents 8.79% of total units in the town, which is lower than the national average of 10.56%.
Leisure services accounted for 15 outlets in 2015, equivalent to 16.48% of total provision. This is below the national average figure (23.50%). There is a good mix of places to eat and drink in the centre including cafés (4 outlets), takeaways (4), public houses (2), bingo & amusements (1) and sports facility (1). However, there are no restaurants, cinemas, theatres or clubs. The food and beverage offer in the main shopping area is mostly made up of low to mid-range businesses.
8.19 The shops and associated leisure facilities generate linked trips with the centre. Templars Square Shopping
Centre has both independent and multiple leisure provision (e.g. Dominos and Greggs) whilst Costa is the sole
national multiple at the Templars Shopping Park. We understand that the current refurbishment of the
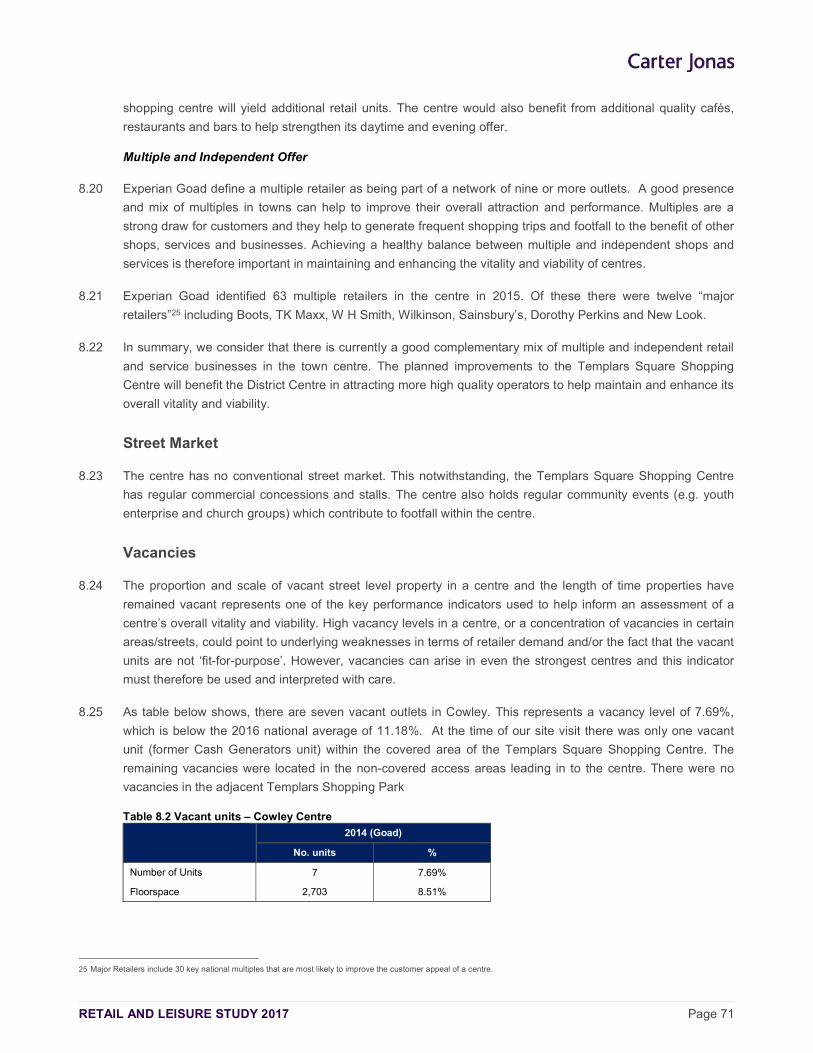
RETAIL AND LEISURE STUDY 2017 Page 71
shopping centre will yield additional retail units. The centre would also benefit from additional quality cafés,
restaurants and bars to help strengthen its daytime and evening offer.
Multiple and Independent Offer
8.20 Experian Goad define a multiple retailer as being part of a network of nine or more outlets. A good presence
and mix of multiples in towns can help to improve their overall attraction and performance. Multiples are a
strong draw for customers and they help to generate frequent shopping trips and footfall to the benefit of other
shops, services and businesses. Achieving a healthy balance between multiple and independent shops and
services is therefore important in maintaining and enhancing the vitality and viability of centres.
8.21 Experian Goad identified 63 multiple retailers in the centre in 2015. Of these there were twelve “major
retailers”25 including Boots, TK Maxx, W H Smith, Wilkinson, Sainsbury’s, Dorothy Perkins and New Look.
8.22 In summary, we consider that there is currently a good complementary mix of multiple and independent retail
and service businesses in the town centre. The planned improvements to the Templars Square Shopping
Centre will benefit the District Centre in attracting more high quality operators to help maintain and enhance its
overall vitality and viability.
Street Market
8.23 The centre has no conventional street market. This notwithstanding, the Templars Square Shopping Centre
has regular commercial concessions and stalls. The centre also holds regular community events (e.g. youth
enterprise and church groups) which contribute to footfall within the centre.
Vacancies
8.24 The proportion and scale of vacant street level property in a centre and the length of time properties have
remained vacant represents one of the key performance indicators used to help inform an assessment of a
centre’s overall vitality and viability. High vacancy levels in a centre, or a concentration of vacancies in certain
areas/streets, could point to underlying weaknesses in terms of retailer demand and/or the fact that the vacant
units are not ‘fit-for-purpose’. However, vacancies can arise in even the strongest centres and this indicator
must therefore be used and interpreted with care.
8.25 As table below shows, there are seven vacant outlets in Cowley. This represents a vacancy level of 7.69%,
which is below the 2016 national average of 11.18%. At the time of our site visit there was only one vacant
unit (former Cash Generators unit) within the covered area of the Templars Square Shopping Centre. The
remaining vacancies were located in the non-covered access areas leading in to the centre. There were no
vacancies in the adjacent Templars Shopping Park
Table 8.2 Vacant units – Cowley Centre 2014 (Goad)
No. units %
Number of Units 7 7.69%
Floorspace 2,703 8.51%
25 Major Retailers include 30 key national multiples that are most likely to improve the customer appeal of a centre.
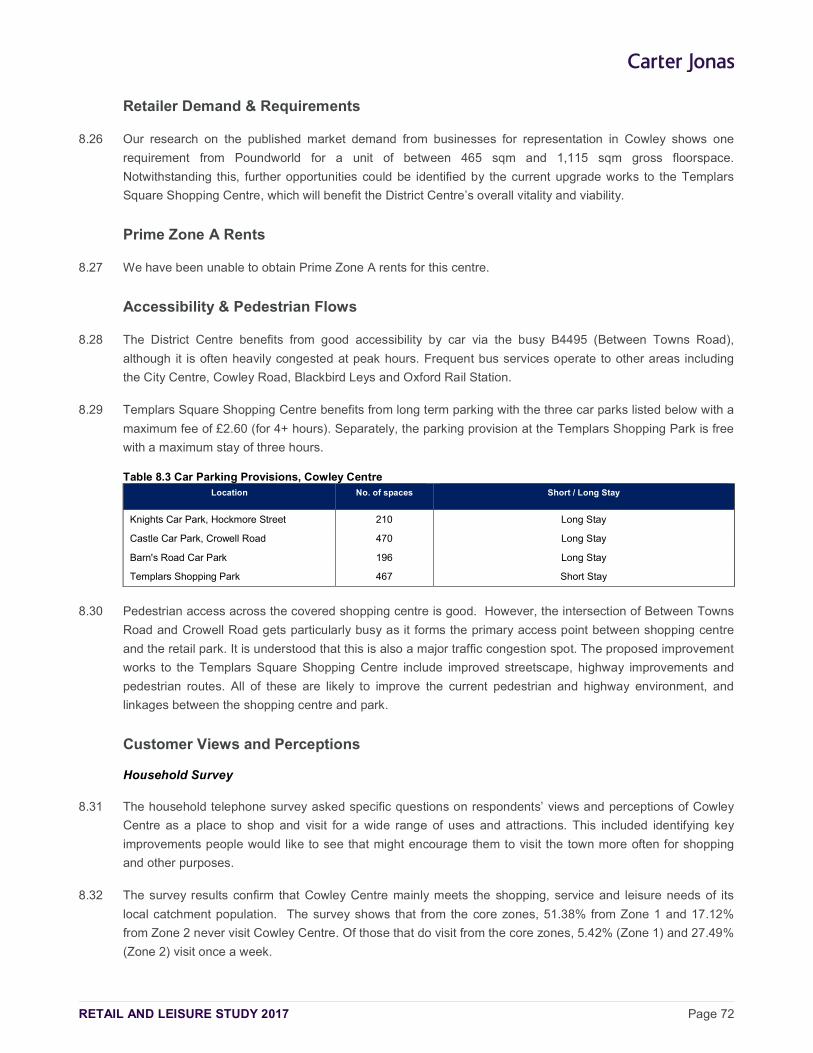
RETAIL AND LEISURE STUDY 2017 Page 72
Retailer Demand & Requirements
8.26 Our research on the published market demand from businesses for representation in Cowley shows one
requirement from Poundworld for a unit of between 465 sqm and 1,115 sqm gross floorspace.
Notwithstanding this, further opportunities could be identified by the current upgrade works to the Templars
Square Shopping Centre, which will benefit the District Centre’s overall vitality and viability.
Prime Zone A Rents
8.27 We have been unable to obtain Prime Zone A rents for this centre.
Accessibility & Pedestrian Flows
8.28 The District Centre benefits from good accessibility by car via the busy B4495 (Between Towns Road),
although it is often heavily congested at peak hours. Frequent bus services operate to other areas including
the City Centre, Cowley Road, Blackbird Leys and Oxford Rail Station.
8.29 Templars Square Shopping Centre benefits from long term parking with the three car parks listed below with a
maximum fee of £2.60 (for 4+ hours). Separately, the parking provision at the Templars Shopping Park is free
with a maximum stay of three hours.
Table 8.3 Car Parking Provisions, Cowley Centre Location No. of spaces Short / Long Stay
Knights Car Park, Hockmore Street 210 Long Stay
Castle Car Park, Crowell Road 470 Long Stay
Barn's Road Car Park 196 Long Stay
Templars Shopping Park 467 Short Stay
8.30 Pedestrian access across the covered shopping centre is good. However, the intersection of Between Towns
Road and Crowell Road gets particularly busy as it forms the primary access point between shopping centre
and the retail park. It is understood that this is also a major traffic congestion spot. The proposed improvement
works to the Templars Square Shopping Centre include improved streetscape, highway improvements and
pedestrian routes. All of these are likely to improve the current pedestrian and highway environment, and
linkages between the shopping centre and park.
Customer Views and Perceptions
Household Survey
8.31 The household telephone survey asked specific questions on respondents’ views and perceptions of Cowley
Centre as a place to shop and visit for a wide range of uses and attractions. This included identifying key
improvements people would like to see that might encourage them to visit the town more often for shopping
and other purposes.
8.32 The survey results confirm that Cowley Centre mainly meets the shopping, service and leisure needs of its
local catchment population. The survey shows that from the core zones, 51.38% from Zone 1 and 17.12%
from Zone 2 never visit Cowley Centre. Of those that do visit from the core zones, 5.42% (Zone 1) and 27.49%
(Zone 2) visit once a week.
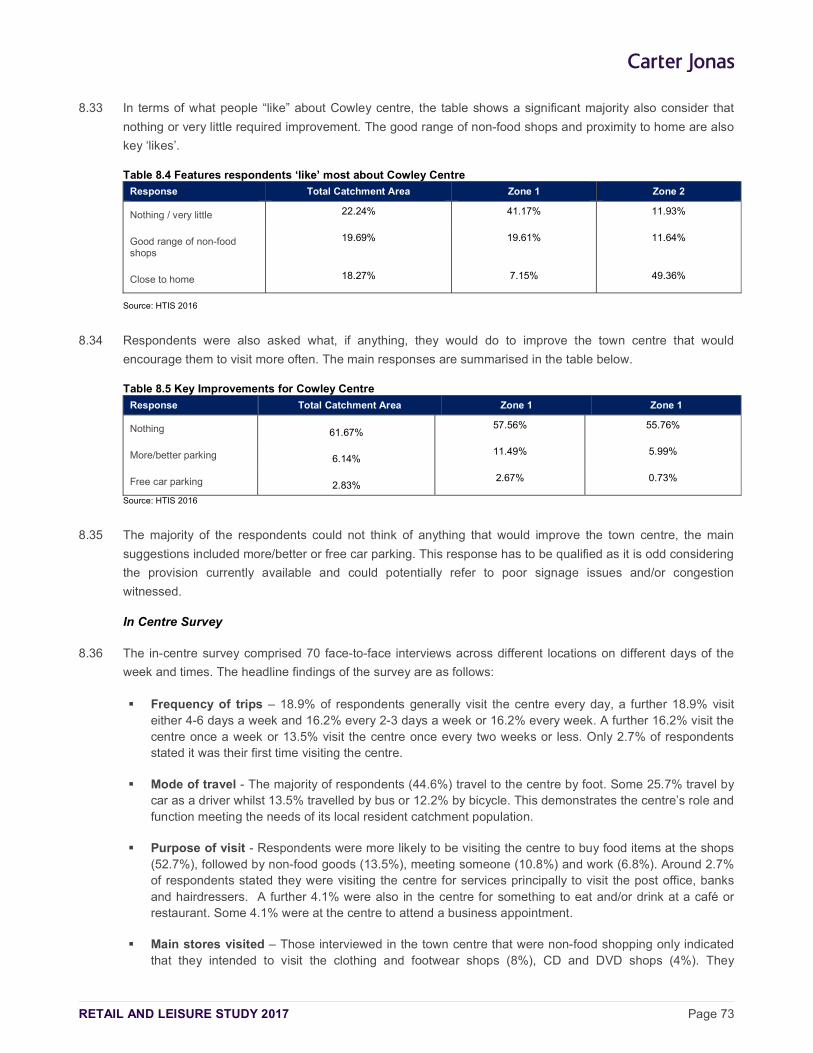
RETAIL AND LEISURE STUDY 2017 Page 73
8.33 In terms of what people “like” about Cowley centre, the table shows a significant majority also consider that
nothing or very little required improvement. The good range of non-food shops and proximity to home are also
key ‘likes’.
Table 8.4 Features respondents ‘like’ most about Cowley Centre
Response Total Catchment Area Zone 1 Zone 2
Nothing / very little 22.24% 41.17% 11.93%
Good range of non-food shops
19.69% 19.61% 11.64%
Close to home 18.27% 7.15% 49.36%
Source: HTIS 2016
8.34 Respondents were also asked what, if anything, they would do to improve the town centre that would
encourage them to visit more often. The main responses are summarised in the table below.
Table 8.5 Key Improvements for Cowley Centre
Response Total Catchment Area Zone 1 Zone 1
Nothing 61.67% 57.56% 55.76%
More/better parking 6.14% 11.49% 5.99%
Free car parking 2.83% 2.67% 0.73%
Source: HTIS 2016
8.35 The majority of the respondents could not think of anything that would improve the town centre, the main
suggestions included more/better or free car parking. This response has to be qualified as it is odd considering
the provision currently available and could potentially refer to poor signage issues and/or congestion
witnessed.
In Centre Survey
8.36 The in-centre survey comprised 70 face-to-face interviews across different locations on different days of the
week and times. The headline findings of the survey are as follows:
Frequency of trips – 18.9% of respondents generally visit the centre every day, a further 18.9% visit either 4-6 days a week and 16.2% every 2-3 days a week or 16.2% every week. A further 16.2% visit the centre once a week or 13.5% visit the centre once every two weeks or less. Only 2.7% of respondents stated it was their first time visiting the centre.
Mode of travel - The majority of respondents (44.6%) travel to the centre by foot. Some 25.7% travel by car as a driver whilst 13.5% travelled by bus or 12.2% by bicycle. This demonstrates the centre’s role and function meeting the needs of its local resident catchment population.
Purpose of visit - Respondents were more likely to be visiting the centre to buy food items at the shops (52.7%), followed by non-food goods (13.5%), meeting someone (10.8%) and work (6.8%). Around 2.7% of respondents stated they were visiting the centre for services principally to visit the post office, banks and hairdressers. A further 4.1% were also in the centre for something to eat and/or drink at a café or restaurant. Some 4.1% were at the centre to attend a business appointment.
Main stores visited – Those interviewed in the town centre that were non-food shopping only indicated that they intended to visit the clothing and footwear shops (8%), CD and DVD shops (4%). They
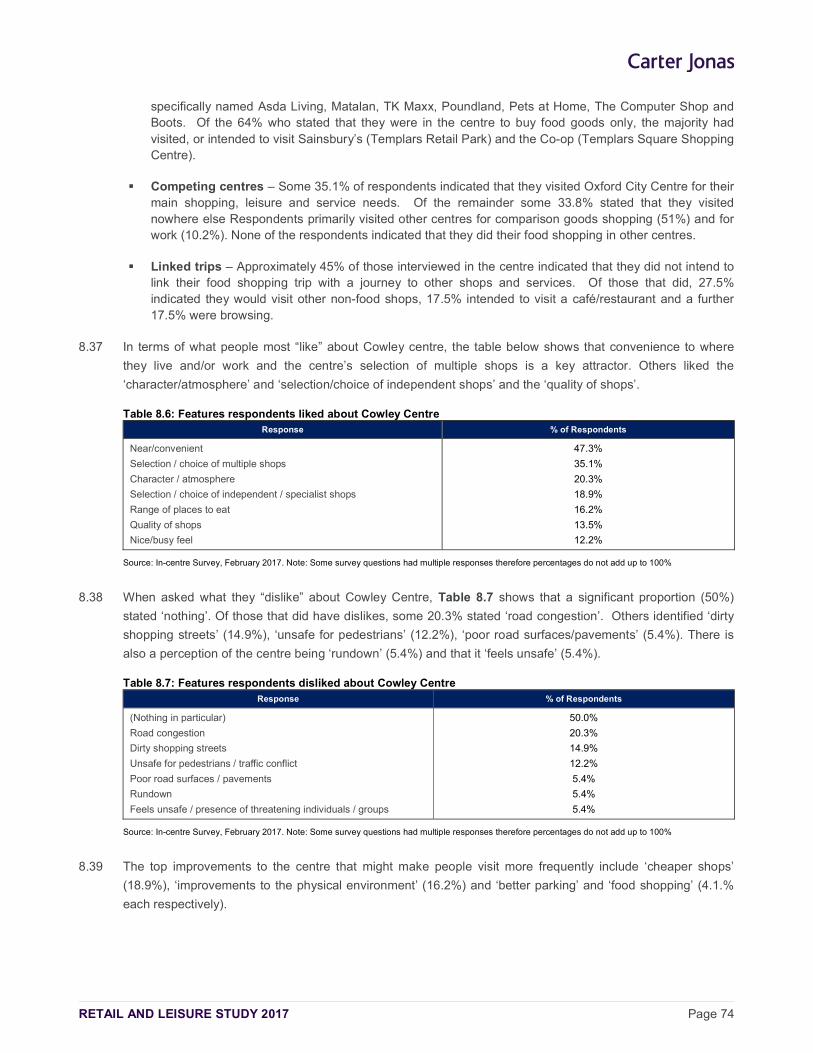
RETAIL AND LEISURE STUDY 2017 Page 74
specifically named Asda Living, Matalan, TK Maxx, Poundland, Pets at Home, The Computer Shop and Boots. Of the 64% who stated that they were in the centre to buy food goods only, the majority had visited, or intended to visit Sainsbury’s (Templars Retail Park) and the Co-op (Templars Square Shopping Centre).
Competing centres – Some 35.1% of respondents indicated that they visited Oxford City Centre for their main shopping, leisure and service needs. Of the remainder some 33.8% stated that they visited nowhere else Respondents primarily visited other centres for comparison goods shopping (51%) and for work (10.2%). None of the respondents indicated that they did their food shopping in other centres.
Linked trips – Approximately 45% of those interviewed in the centre indicated that they did not intend to link their food shopping trip with a journey to other shops and services. Of those that did, 27.5% indicated they would visit other non-food shops, 17.5% intended to visit a café/restaurant and a further 17.5% were browsing.
8.37 In terms of what people most “like” about Cowley centre, the table below shows that convenience to where
they live and/or work and the centre’s selection of multiple shops is a key attractor. Others liked the
‘character/atmosphere’ and ‘selection/choice of independent shops’ and the ‘quality of shops’.
Table 8.6: Features respondents liked about Cowley Centre Response % of Respondents
Near/convenient
Selection / choice of multiple shops
Character / atmosphere
Selection / choice of independent / specialist shops
Range of places to eat
Quality of shops
Nice/busy feel
47.3%
35.1%
20.3%
18.9%
16.2%
13.5%
12.2%
Source: In-centre Survey, February 2017. Note: Some survey questions had multiple responses therefore percentages do not add up to 100%
8.38 When asked what they “dislike” about Cowley Centre, Table 8.7 shows that a significant proportion (50%)
stated ‘nothing’. Of those that did have dislikes, some 20.3% stated ‘road congestion’. Others identified ‘dirty
shopping streets’ (14.9%), ‘unsafe for pedestrians’ (12.2%), ‘poor road surfaces/pavements’ (5.4%). There is
also a perception of the centre being ‘rundown’ (5.4%) and that it ‘feels unsafe’ (5.4%).
Table 8.7: Features respondents disliked about Cowley Centre Response % of Respondents
(Nothing in particular)
Road congestion
Dirty shopping streets
Unsafe for pedestrians / traffic conflict
Poor road surfaces / pavements
Rundown
Feels unsafe / presence of threatening individuals / groups
50.0%
20.3%
14.9%
12.2%
5.4%
5.4%
5.4%
Source: In-centre Survey, February 2017. Note: Some survey questions had multiple responses therefore percentages do not add up to 100%
8.39 The top improvements to the centre that might make people visit more frequently include ‘cheaper shops’
(18.9%), ‘improvements to the physical environment’ (16.2%) and ‘better parking’ and ‘food shopping’ (4.1.%
each respectively).
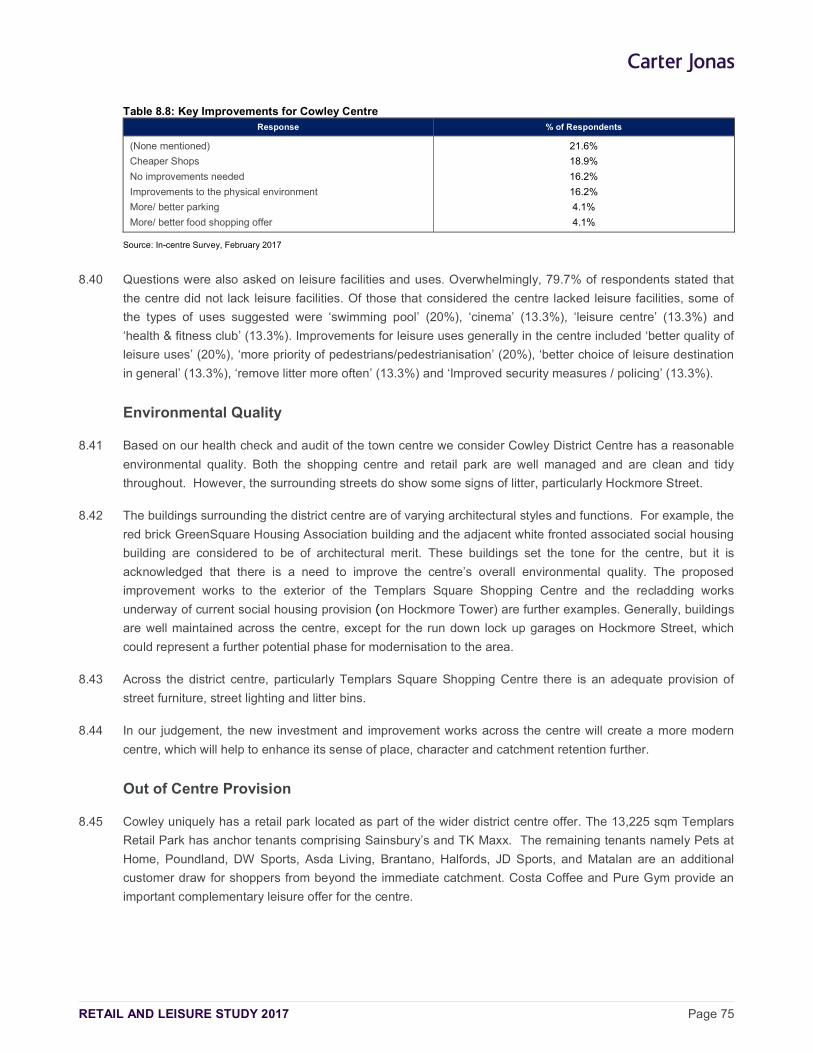
RETAIL AND LEISURE STUDY 2017 Page 75
Table 8.8: Key Improvements for Cowley Centre Response % of Respondents
(None mentioned)
Cheaper Shops
No improvements needed
Improvements to the physical environment
More/ better parking
More/ better food shopping offer
21.6%
18.9%
16.2%
16.2%
4.1%
4.1%
Source: In-centre Survey, February 2017
8.40 Questions were also asked on leisure facilities and uses. Overwhelmingly, 79.7% of respondents stated that
the centre did not lack leisure facilities. Of those that considered the centre lacked leisure facilities, some of
the types of uses suggested were ‘swimming pool’ (20%), ‘cinema’ (13.3%), ‘leisure centre’ (13.3%) and
‘health & fitness club’ (13.3%). Improvements for leisure uses generally in the centre included ‘better quality of
leisure uses’ (20%), ‘more priority of pedestrians/pedestrianisation’ (20%), ‘better choice of leisure destination
in general’ (13.3%), ‘remove litter more often’ (13.3%) and ‘Improved security measures / policing’ (13.3%).
Environmental Quality
8.41 Based on our health check and audit of the town centre we consider Cowley District Centre has a reasonable
environmental quality. Both the shopping centre and retail park are well managed and are clean and tidy
throughout. However, the surrounding streets do show some signs of litter, particularly Hockmore Street.
8.42 The buildings surrounding the district centre are of varying architectural styles and functions. For example, the
red brick GreenSquare Housing Association building and the adjacent white fronted associated social housing
building are considered to be of architectural merit. These buildings set the tone for the centre, but it is
acknowledged that there is a need to improve the centre’s overall environmental quality. The proposed
improvement works to the exterior of the Templars Square Shopping Centre and the recladding works
underway of current social housing provision (on Hockmore Tower) are further examples. Generally, buildings
are well maintained across the centre, except for the run down lock up garages on Hockmore Street, which
could represent a further potential phase for modernisation to the area.
8.43 Across the district centre, particularly Templars Square Shopping Centre there is an adequate provision of
street furniture, street lighting and litter bins.
8.44 In our judgement, the new investment and improvement works across the centre will create a more modern
centre, which will help to enhance its sense of place, character and catchment retention further.
Out of Centre Provision
8.45 Cowley uniquely has a retail park located as part of the wider district centre offer. The 13,225 sqm Templars
Retail Park has anchor tenants comprising Sainsbury’s and TK Maxx. The remaining tenants namely Pets at
Home, Poundland, DW Sports, Asda Living, Brantano, Halfords, JD Sports, and Matalan are an additional
customer draw for shoppers from beyond the immediate catchment. Costa Coffee and Pure Gym provide an
important complementary leisure offer for the centre.
RETAIL AND LEISURE STUDY 2017 Page 76
New Investment & Potential Development
8.46 The major proportion of the district centre is presently undergoing refurbishment. The £60m renovation of
Templars Square Shopping Centre by its owners NewRiver REIT aims to transform the Templars Square
shopping centre and its immediate surroundings. The mixed-use proposals will preserve the existing Templars
Square shops, whilst bringing forward a range of significant improvements to create a more vibrant and
thriving community across the District Centre.
8.47 The proposed plans include the addition of a hotel; new restaurant units for leading national operators; a
dramatically improved streetscape and pedestrian routes; upgraded, modernised car parking and new feature
entrances. Importantly, the development proposed is expected to have a significant residential component of
over 200 apartments.
8.48 The above investment, combined with other improvement works in the centre, will increase the vitality and
viability of the centre.
Summary
8.49 Cowley District Centre performs a specific role in the retail hierarchy serving, to varying degrees, not only the
day-to-day needs of the local resident catchment population but also a wider catchment. Overall, the centre
has a generally pleasant environment. The public realm and other improvements planned for the centre will
help to create a more modern and attractive shopping environment, which would help to enhance its sense of
place, character and catchment retention further.
8.50 The key strengths identified are as follows:
The District Centre is served well by food and convenience stores at both the Templars Square Centre and Templars Retail Park.
The centre has a good representation across comparison goods provision particularly clothing and ladies wear.
Broadly, above average provision of both convenience and comparison goods.
The shops and associated leisure facilities generate linked trips within the centre.
There is currently a good complementary mix of multiple and independent retail and service businesses in the town centre.
Low vacancy rates across the centre.
The centre has very good accessibility from the rest of the surrounding settlements.
The refurbishment of the Templars Square Shopping Centre will bring forward a range of significant improvements to create a more vibrant and thriving community across the Centre this will help elevate its overall vitality and viability.
8.51 The key weakness identified was as follows:
Whilst readily accessible there are congestion points via the busy B4495 (Between Towns Roads).
8.52 Suggestions for improvements:
RETAIL AND LEISURE STUDY 2017 Page 77
There would appear to be potential to enhance and widen the offer by attracting more independent food and convenience retailers.
Attracting further high quality operators will help to maintain the centre’s overall vitality and viability.
Improving the bottle neck and pedestrian connections between the shopping centre and retail park will help to encourage seamless movement between the two areas and further promote linked trips.
Improve signage across the centre to facilitate seamless permeability.
The centre would also benefit from additional quality cafés, restaurants and bars to help strengthen its daytime and evening offer, increase dwell times and compete effectively with other centres.
RETAIL AND LEISURE STUDY 2017 Page 78
9 HEADINGTON DISTRICT CENTRE - HEALTH CHECK ASSESSMENT
9.1 This section sets out the key findings of the health check assessment for Headington District centre.
Context
9.2 Headington is located within the eastern part of the City Council border. It is approximately 3.4km from Oxford
City Centre. The centre is situated on the busy A420 London Road, which runs in an east/west pattern and
Windmill Road, which runs in a north/south direction. These streets provide the centre’s main retail and
commercial offer, although there are “pockets” of commercial uses along some of the side streets, including
the Old High Street and Osler Road.
9.3 To the north east the centre is bounded by Bury Knowle Park and a library. Located within a major
thoroughfare, it is also an interchange hub for passengers using the buses to and from Oxford to London. The
centre is also surrounded by major employers including the John Radcliffe Hospital, Nuffield Orthopaedic
Centre and Oxford Brookes University.
9.4 In shopping terms, the centre has a local shopping catchment and is defined as being a District centre in the
City Council’s retail hierarchy.
Retail Composition & Diversity of Uses
9.5 Headington is ranked 935th in Javelin’s 2014 Venuescore26 rankings. This is below Cowley (482nd) but above
Cowley Road (1,468th). Its ranking reflects the relative scale and quality of its shopping offer. It is classified
by Javelin as ‘Middle Market’ in terms of its fashion and shopping offer.
9.6 The main shopping provision in Headington is concentrated along London Road, between Blackburn Close /
Lime Close junction(s) to the west extending eastwards towards Wharton Road. Additionally, shops are also
located the Old High Street and Windmill Road. Retail units are located on both sides of these streets. There
are a number of national multiples represented particularly in the convenience sector including Tesco
(Express), Sainsburys (Local), Iceland, Co-op and Holland & Barrett. Comparison retailers include Boots,
Savers and Card Factory.
9.7 Windmill Road and the Old High Street (running north/south of the defined centre) is mainly characterised by
quality independent service and leisure uses, including independent cafés, takeaways, laundrettes and
sandwich bars. Waitrose is the only national multiple represented in this area. Both these streets are
thoroughfares to existing residential neighbourhoods and are therefore busy with traffic.
9.8 The leisure provision is dominated primarily by public houses, takeaways and restaurants (including Caffe
Nero, Buongiono e Buonasera, The Rose Tree, La Croissanterie, Café Bonjour, Greggs Bakers and Subway).
All of these act as important draws to the centre.
9.9 The table below summarises the composition and diversity of the centre’s retail and service offer.
26 Venuescore is Javelin Group’s annual ranking of the UK’s top 3,000+ retail venues based on provision of multiple retailers including anchor stores, fashion operators, and non-fashion multiples, where each operator is given a weighted score to reflect its overall impact on shopping patterns and the attraction of centres. The Market Position Index measures the degree to which the centre's offer has a high-end or discount focus (High=Bias towards High-end retailers; Low=Bias towards Discount-oriented retailers)
RETAIL AND LEISURE STUDY 2017 Page 79
Table 9.1 Retail and Service Composition: number and type of units at ground floor level.
2015 UK Average 2016
No. Outlets % %
Convenience 14 12.61% 8.67%
Comparison 30 27.03% 31.72%
Services 61 54.96% 48.24%
Vacant 6 5.41% 11.18%
Total 111 100% 100%
Sources: Based on GOAD Category Report August 2015. The national average has been taken from Experian as at December 2016.
Convenience Offer
9.10 The table shows that there are 14 convenience goods outlets in the town centre. Current provision represents
12.61% of total outlets, which is above the national average of 8.67%. The total convenience floorspace
(5,268 sqm) represents some 25.54% of total floorspace, which is also above the national average of 15.21%.
This is explained by the significant representation of key supermarket operators including Waitrose, Tesco,
Sainsburys, Iceland and Co-op in Headington.
9.11 Analysis of the centre revealed that there were no fishmongers or greengrocers at the time of the audit.
9.12 The household survey shows that Headington’s convenience provision attracts some 14% of respondents
from the core zones (1 and 2), which is second highest after the city centre.
9.13 The centre also has a regular Farmer’s market on Saturdays. On average 20 stalls sell street food, fresh bread
and other fresh produce.
9.14 Overall we consider that Headington is well served in terms of foodstores and convenience goods shops.
There could be the potential to further enhance the convenience offer by attracting more independent food and
convenience retailers, such as a greengrocers and fishmonger, although this will be dependent on market
demand.
Comparison Offer
9.15 Headington has 30 comparison outlets. This represents 27.03% of total provision and is below the national
average of 31.72%. The (Goad) comparison floorspace is 5,509 sqm in 2015, which represents 26.71% of
total floorspace and is below the national average of 35.74%.
9.16 In general terms the centre has a good representation of the different comparison goods categories.
However, we note that it currently has ten charity shops, which represent 9.01% of total outlets and is
significantly higher than the national average figure of 2.71%. The GOAD reports indicate limited ladies’ wear
and clothing as well as footwear stores in the centre. This results in residents visiting other higher order
centres to meet their needs.
9.17 In response to the household survey some 11.6% of respondents in Zone 1 identified that “more/better”
comparison retailers would help to improve the town centre’s appeal.
9.18 In summary, we consider that Headington has potential to improve its comparison goods offer, to both meet
the needs of the local catchment and to help prevent loss of expenditure to nearby competing centres. A
RETAIL AND LEISURE STUDY 2017 Page 80
balance between attracting new national multiples and quality independents would help to enhance the
centre’s retail offer.
Service Provision
9.19 There are 61 retail, leisure and financial services in the town centre. This represents 54.96% of total provision
and is above the 2016 national average of 48.24%. In our experience, smaller town centres generally tend to
have a higher service provision, and therefore the current representation in Headington should not be a cause
for concern. Notwithstanding this we advise the Council to monitor the scale and quality of the service uses
over time to ensure that provision does not have a negative impact on the town’s overall diversity and
important shopping offer.
9.20 The current distribution of service uses is as follows:
There were 21 retail services in 2015. Current provision represents 18.92% of total units, which is above the (2016) national average of 14.06%. The retail service offer in Headington is dominated by health and beauty outlets (11 units). There are also two dry cleaners/launderettes, two opticians and one travel agent.
There were 17 financial service outlets in 2015, including eight property services outlets and five retail banks and two building societies. Current provision represents 15.32% of total units in the town, which is above the national average of 10.56%.
Leisure services accounted for 22 outlets in 2015. The number of leisure service outlets represent 19.82% of total provision, which is below the national average figure (23.50%). There is a good mix of places to eat and drink in the town including cafés (5), takeaways (6), restaurants (4) and public houses (2). We note that the proportion of takeaways is slightly below the national average (5.41% vs 5.71%) as is the proportion of restaurants (3.60% vs 4.57%). The centre has attracted some multiple leisure operators over recent years (including Café Nero and Subway) which are located on the main London Road. The majority of the leisure provision is dominated by independent providers such as Jacob’s Chop House, Café Bonjour, and CRAFT Burger. The food and beverage offer in the main shopping area comprises mainly of low to mid-range businesses.
Multiple and Independent Offer
9.21 Experian Goad define a multiple retailer as being part of a network of nine or more outlets. It is recognised
that a good presence and mix of multiples in towns can help to greatly improve their overall attraction and
performance. Multiples are a strong draw for customers and they help to generate frequent shopping trips and
footfall to the benefit of other shops, services and businesses. Achieving a healthy balance between multiple
and independent shops and services is therefore important in maintaining and enhancing the vitality and
viability of centres.
9.22 As described above, Headington has a good representation of independent businesses, particularly in the
leisure services sector. According to Experian Goad comparison multiple outlets in Headington represented
28.57% of total provision in 2015, which is below the national average of 42.80%. The only major multiple
retailers in the centre as defined by Experian Goad are Boots the Chemist, WH Smith Tesco and Waitrose27.
However other significant multiple retailers not classified by Experian include Poundland, Co-Op, Iceland,
Savers and Greggs.
9.23 In summary, although we consider that there is currently a good complementary mix of multiple and
independent retail and service businesses in the town centre, it would benefit in our view from attracting more
27 Major Retailers include 30 key national multiples that are most likely to improve the customer appeal of a centre.
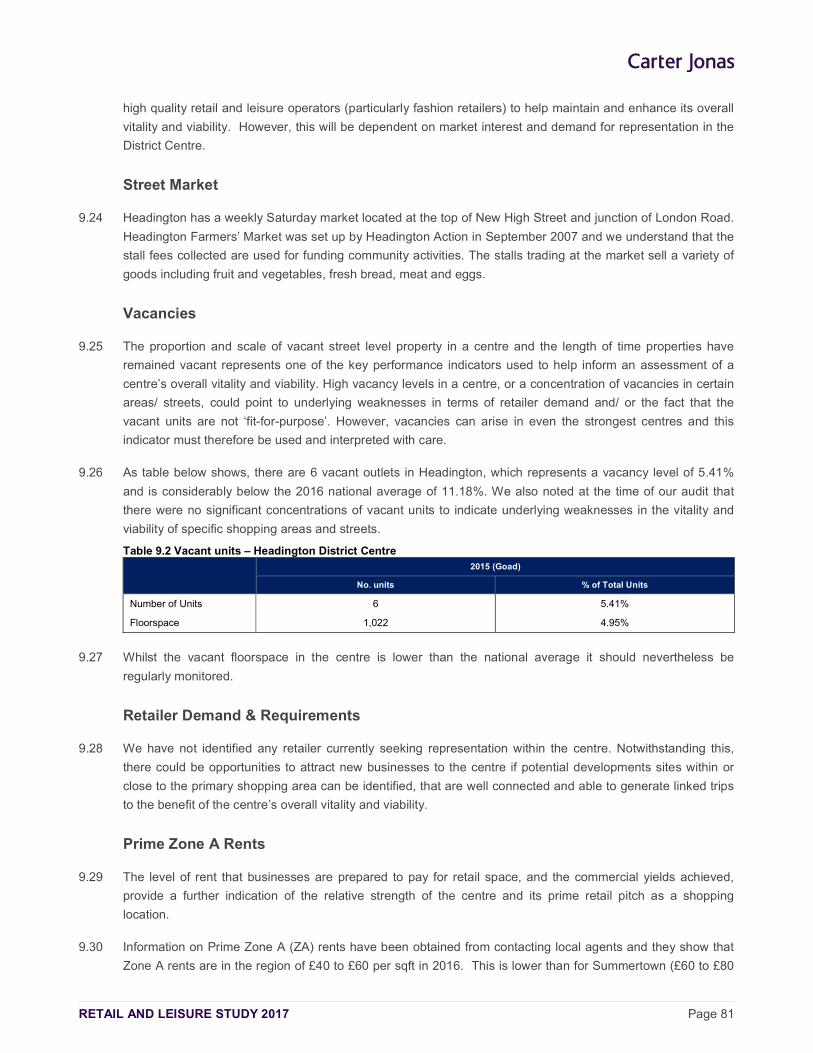
RETAIL AND LEISURE STUDY 2017 Page 81
high quality retail and leisure operators (particularly fashion retailers) to help maintain and enhance its overall
vitality and viability. However, this will be dependent on market interest and demand for representation in the
District Centre.
Street Market
9.24 Headington has a weekly Saturday market located at the top of New High Street and junction of London Road.
Headington Farmers’ Market was set up by Headington Action in September 2007 and we understand that the
stall fees collected are used for funding community activities. The stalls trading at the market sell a variety of
goods including fruit and vegetables, fresh bread, meat and eggs.
Vacancies
9.25 The proportion and scale of vacant street level property in a centre and the length of time properties have
remained vacant represents one of the key performance indicators used to help inform an assessment of a
centre’s overall vitality and viability. High vacancy levels in a centre, or a concentration of vacancies in certain
areas/ streets, could point to underlying weaknesses in terms of retailer demand and/ or the fact that the
vacant units are not ‘fit-for-purpose’. However, vacancies can arise in even the strongest centres and this
indicator must therefore be used and interpreted with care.
9.26 As table below shows, there are 6 vacant outlets in Headington, which represents a vacancy level of 5.41%
and is considerably below the 2016 national average of 11.18%. We also noted at the time of our audit that
there were no significant concentrations of vacant units to indicate underlying weaknesses in the vitality and
viability of specific shopping areas and streets.
Table 9.2 Vacant units – Headington District Centre
2015 (Goad)
No. units % of Total Units
Number of Units 6 5.41%
Floorspace 1,022 4.95%
9.27 Whilst the vacant floorspace in the centre is lower than the national average it should nevertheless be
regularly monitored.
Retailer Demand & Requirements
9.28 We have not identified any retailer currently seeking representation within the centre. Notwithstanding this,
there could be opportunities to attract new businesses to the centre if potential developments sites within or
close to the primary shopping area can be identified, that are well connected and able to generate linked trips
to the benefit of the centre’s overall vitality and viability.
Prime Zone A Rents
9.29 The level of rent that businesses are prepared to pay for retail space, and the commercial yields achieved,
provide a further indication of the relative strength of the centre and its prime retail pitch as a shopping
location.
9.30 Information on Prime Zone A (ZA) rents have been obtained from contacting local agents and they show that
Zone A rents are in the region of £40 to £60 per sqft in 2016. This is lower than for Summertown (£60 to £80
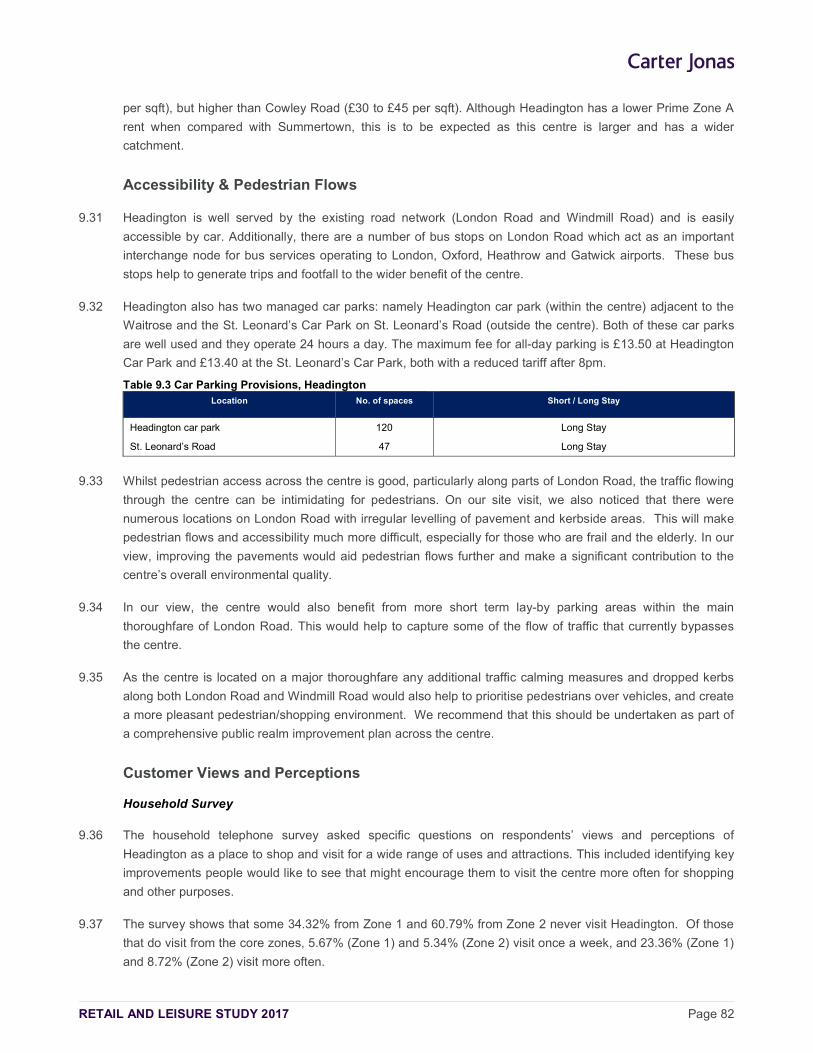
RETAIL AND LEISURE STUDY 2017 Page 82
per sqft), but higher than Cowley Road (£30 to £45 per sqft). Although Headington has a lower Prime Zone A
rent when compared with Summertown, this is to be expected as this centre is larger and has a wider
catchment.
Accessibility & Pedestrian Flows
9.31 Headington is well served by the existing road network (London Road and Windmill Road) and is easily
accessible by car. Additionally, there are a number of bus stops on London Road which act as an important
interchange node for bus services operating to London, Oxford, Heathrow and Gatwick airports. These bus
stops help to generate trips and footfall to the wider benefit of the centre.
9.32 Headington also has two managed car parks: namely Headington car park (within the centre) adjacent to the
Waitrose and the St. Leonard’s Car Park on St. Leonard’s Road (outside the centre). Both of these car parks
are well used and they operate 24 hours a day. The maximum fee for all-day parking is £13.50 at Headington
Car Park and £13.40 at the St. Leonard’s Car Park, both with a reduced tariff after 8pm.
Table 9.3 Car Parking Provisions, Headington Location No. of spaces Short / Long Stay
Headington car park 120 Long Stay
St. Leonard’s Road 47 Long Stay
9.33 Whilst pedestrian access across the centre is good, particularly along parts of London Road, the traffic flowing
through the centre can be intimidating for pedestrians. On our site visit, we also noticed that there were
numerous locations on London Road with irregular levelling of pavement and kerbside areas. This will make
pedestrian flows and accessibility much more difficult, especially for those who are frail and the elderly. In our
view, improving the pavements would aid pedestrian flows further and make a significant contribution to the
centre’s overall environmental quality.
9.34 In our view, the centre would also benefit from more short term lay-by parking areas within the main
thoroughfare of London Road. This would help to capture some of the flow of traffic that currently bypasses
the centre.
9.35 As the centre is located on a major thoroughfare any additional traffic calming measures and dropped kerbs
along both London Road and Windmill Road would also help to prioritise pedestrians over vehicles, and create
a more pleasant pedestrian/shopping environment. We recommend that this should be undertaken as part of
a comprehensive public realm improvement plan across the centre.
Customer Views and Perceptions
Household Survey
9.36 The household telephone survey asked specific questions on respondents’ views and perceptions of
Headington as a place to shop and visit for a wide range of uses and attractions. This included identifying key
improvements people would like to see that might encourage them to visit the centre more often for shopping
and other purposes.
9.37 The survey shows that some 34.32% from Zone 1 and 60.79% from Zone 2 never visit Headington. Of those
that do visit from the core zones, 5.67% (Zone 1) and 5.34% (Zone 2) visit once a week, and 23.36% (Zone 1)
and 8.72% (Zone 2) visit more often.
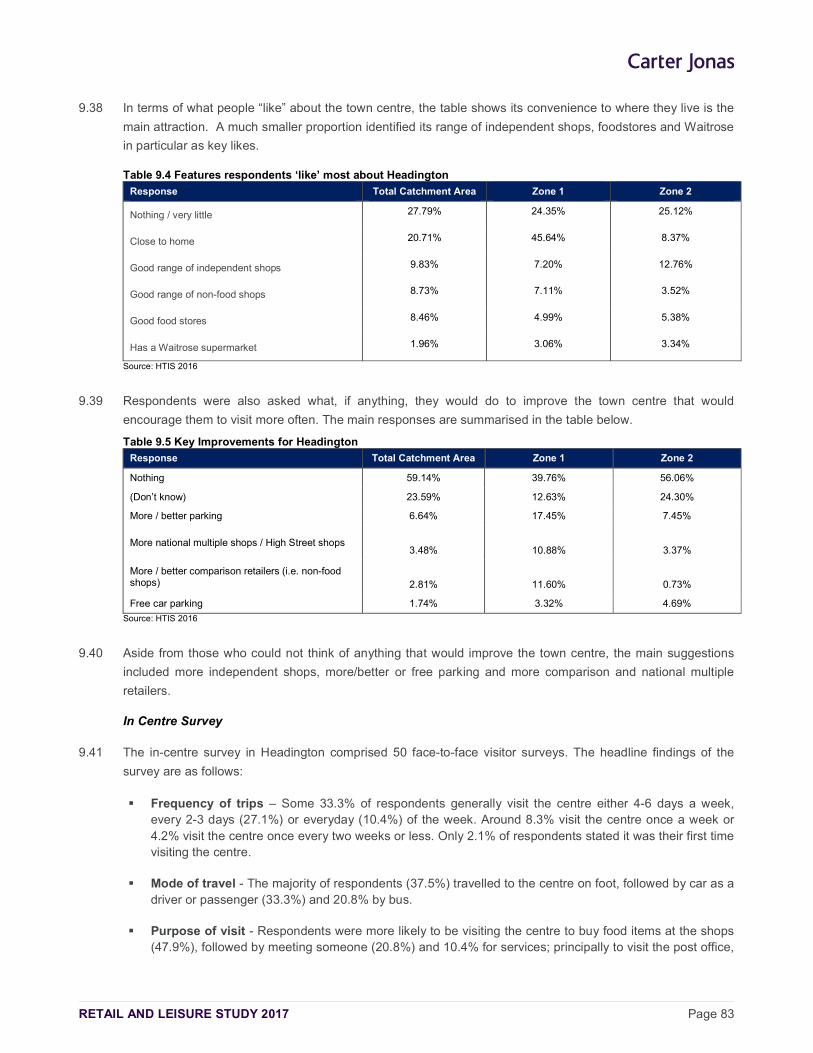
RETAIL AND LEISURE STUDY 2017 Page 83
9.38 In terms of what people “like” about the town centre, the table shows its convenience to where they live is the
main attraction. A much smaller proportion identified its range of independent shops, foodstores and Waitrose
in particular as key likes.
Table 9.4 Features respondents ‘like’ most about Headington
Response Total Catchment Area Zone 1 Zone 2
Nothing / very little 27.79% 24.35% 25.12%
Close to home 20.71% 45.64% 8.37%
Good range of independent shops 9.83% 7.20% 12.76%
Good range of non-food shops 8.73% 7.11% 3.52%
Good food stores 8.46% 4.99% 5.38%
Has a Waitrose supermarket 1.96% 3.06% 3.34%
Source: HTIS 2016
9.39 Respondents were also asked what, if anything, they would do to improve the town centre that would
encourage them to visit more often. The main responses are summarised in the table below.
Table 9.5 Key Improvements for Headington
Response Total Catchment Area Zone 1 Zone 2
Nothing 59.14% 39.76% 56.06%
(Don’t know) 23.59% 12.63% 24.30%
More / better parking 6.64% 17.45% 7.45%
More national multiple shops / High Street shops 3.48%
10.88%
3.37%
More / better comparison retailers (i.e. non-food shops) 2.81%
11.60%
0.73%
Free car parking 1.74% 3.32% 4.69%
Source: HTIS 2016
9.40 Aside from those who could not think of anything that would improve the town centre, the main suggestions
included more independent shops, more/better or free parking and more comparison and national multiple
retailers.
In Centre Survey
9.41 The in-centre survey in Headington comprised 50 face-to-face visitor surveys. The headline findings of the
survey are as follows:
Frequency of trips – Some 33.3% of respondents generally visit the centre either 4-6 days a week, every 2-3 days (27.1%) or everyday (10.4%) of the week. Around 8.3% visit the centre once a week or 4.2% visit the centre once every two weeks or less. Only 2.1% of respondents stated it was their first time visiting the centre.
Mode of travel - The majority of respondents (37.5%) travelled to the centre on foot, followed by car as a driver or passenger (33.3%) and 20.8% by bus.
Purpose of visit - Respondents were more likely to be visiting the centre to buy food items at the shops (47.9%), followed by meeting someone (20.8%) and 10.4% for services; principally to visit the post office,
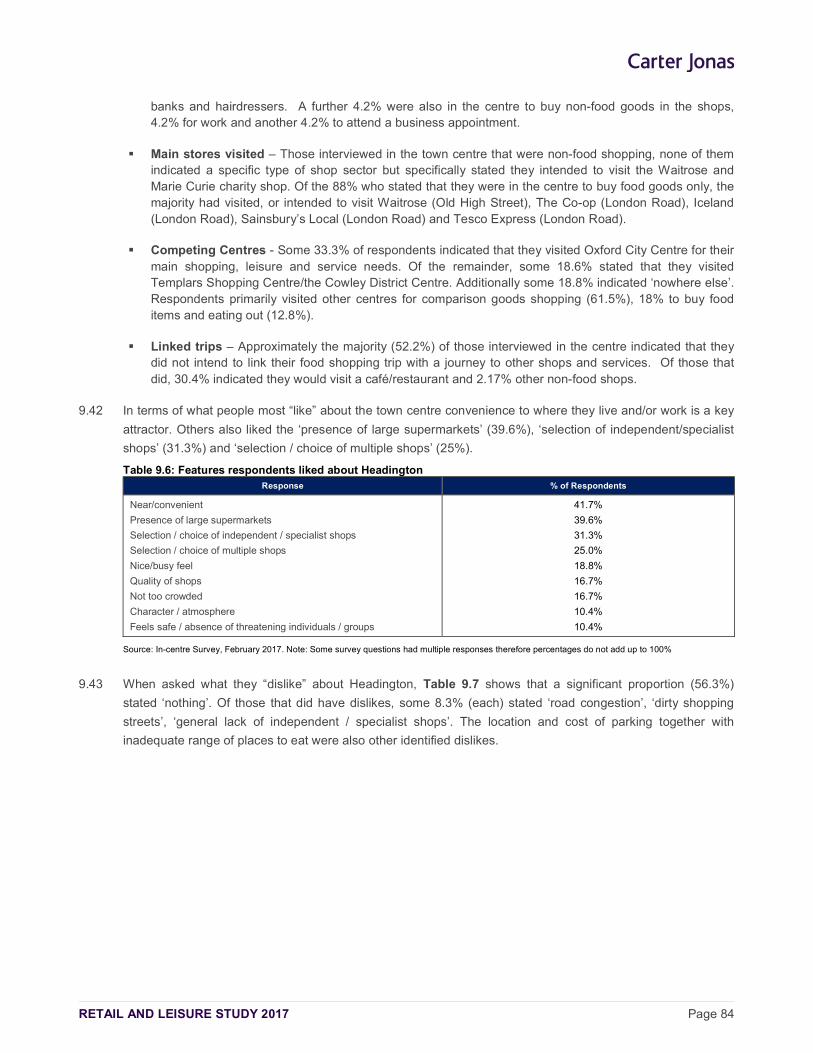
RETAIL AND LEISURE STUDY 2017 Page 84
banks and hairdressers. A further 4.2% were also in the centre to buy non-food goods in the shops, 4.2% for work and another 4.2% to attend a business appointment.
Main stores visited – Those interviewed in the town centre that were non-food shopping, none of them indicated a specific type of shop sector but specifically stated they intended to visit the Waitrose and Marie Curie charity shop. Of the 88% who stated that they were in the centre to buy food goods only, the majority had visited, or intended to visit Waitrose (Old High Street), The Co-op (London Road), Iceland (London Road), Sainsbury’s Local (London Road) and Tesco Express (London Road).
Competing Centres - Some 33.3% of respondents indicated that they visited Oxford City Centre for their main shopping, leisure and service needs. Of the remainder, some 18.6% stated that they visited Templars Shopping Centre/the Cowley District Centre. Additionally some 18.8% indicated ‘nowhere else’. Respondents primarily visited other centres for comparison goods shopping (61.5%), 18% to buy food items and eating out (12.8%).
Linked trips – Approximately the majority (52.2%) of those interviewed in the centre indicated that they did not intend to link their food shopping trip with a journey to other shops and services. Of those that did, 30.4% indicated they would visit a café/restaurant and 2.17% other non-food shops.
9.42 In terms of what people most “like” about the town centre convenience to where they live and/or work is a key
attractor. Others also liked the ‘presence of large supermarkets’ (39.6%), ‘selection of independent/specialist
shops’ (31.3%) and ‘selection / choice of multiple shops’ (25%).
Table 9.6: Features respondents liked about Headington Response % of Respondents
Near/convenient
Presence of large supermarkets
Selection / choice of independent / specialist shops
Selection / choice of multiple shops
Nice/busy feel
Quality of shops
Not too crowded
Character / atmosphere
Feels safe / absence of threatening individuals / groups
41.7%
39.6%
31.3%
25.0%
18.8%
16.7%
16.7%
10.4%
10.4%
Source: In-centre Survey, February 2017. Note: Some survey questions had multiple responses therefore percentages do not add up to 100%
9.43 When asked what they “dislike” about Headington, Table 9.7 shows that a significant proportion (56.3%)
stated ‘nothing’. Of those that did have dislikes, some 8.3% (each) stated ‘road congestion’, ‘dirty shopping
streets’, ‘general lack of independent / specialist shops’. The location and cost of parking together with
inadequate range of places to eat were also other identified dislikes.
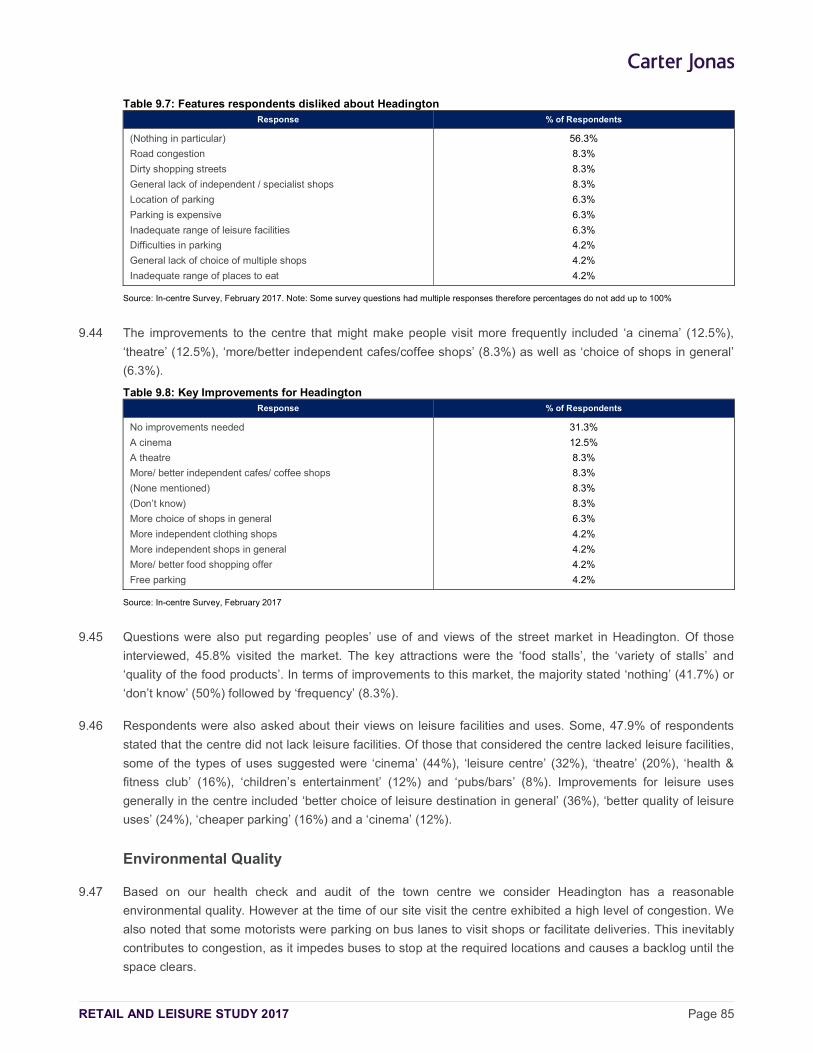
RETAIL AND LEISURE STUDY 2017 Page 85
Table 9.7: Features respondents disliked about Headington Response % of Respondents
(Nothing in particular)
Road congestion
Dirty shopping streets
General lack of independent / specialist shops
Location of parking
Parking is expensive
Inadequate range of leisure facilities
Difficulties in parking
General lack of choice of multiple shops
Inadequate range of places to eat
56.3%
8.3%
8.3%
8.3%
6.3%
6.3%
6.3%
4.2%
4.2%
4.2%
Source: In-centre Survey, February 2017. Note: Some survey questions had multiple responses therefore percentages do not add up to 100%
9.44 The improvements to the centre that might make people visit more frequently included ‘a cinema’ (12.5%),
‘theatre’ (12.5%), ‘more/better independent cafes/coffee shops’ (8.3%) as well as ‘choice of shops in general’
(6.3%).
Table 9.8: Key Improvements for Headington Response % of Respondents
No improvements needed
A cinema
A theatre
More/ better independent cafes/ coffee shops
(None mentioned)
(Don’t know)
More choice of shops in general
More independent clothing shops
More independent shops in general
More/ better food shopping offer
Free parking
31.3%
12.5%
8.3%
8.3%
8.3%
8.3%
6.3%
4.2%
4.2%
4.2%
4.2%
Source: In-centre Survey, February 2017
9.45 Questions were also put regarding peoples’ use of and views of the street market in Headington. Of those
interviewed, 45.8% visited the market. The key attractions were the ‘food stalls’, the ‘variety of stalls’ and
‘quality of the food products’. In terms of improvements to this market, the majority stated ‘nothing’ (41.7%) or
‘don’t know’ (50%) followed by ‘frequency’ (8.3%).
9.46 Respondents were also asked about their views on leisure facilities and uses. Some, 47.9% of respondents
stated that the centre did not lack leisure facilities. Of those that considered the centre lacked leisure facilities,
some of the types of uses suggested were ‘cinema’ (44%), ‘leisure centre’ (32%), ‘theatre’ (20%), ‘health &
fitness club’ (16%), ‘children’s entertainment’ (12%) and ‘pubs/bars’ (8%). Improvements for leisure uses
generally in the centre included ‘better choice of leisure destination in general’ (36%), ‘better quality of leisure
uses’ (24%), ‘cheaper parking’ (16%) and a ‘cinema’ (12%).
Environmental Quality
9.47 Based on our health check and audit of the town centre we consider Headington has a reasonable
environmental quality. However at the time of our site visit the centre exhibited a high level of congestion. We
also noted that some motorists were parking on bus lanes to visit shops or facilitate deliveries. This inevitably
contributes to congestion, as it impedes buses to stop at the required locations and causes a backlog until the
space clears.
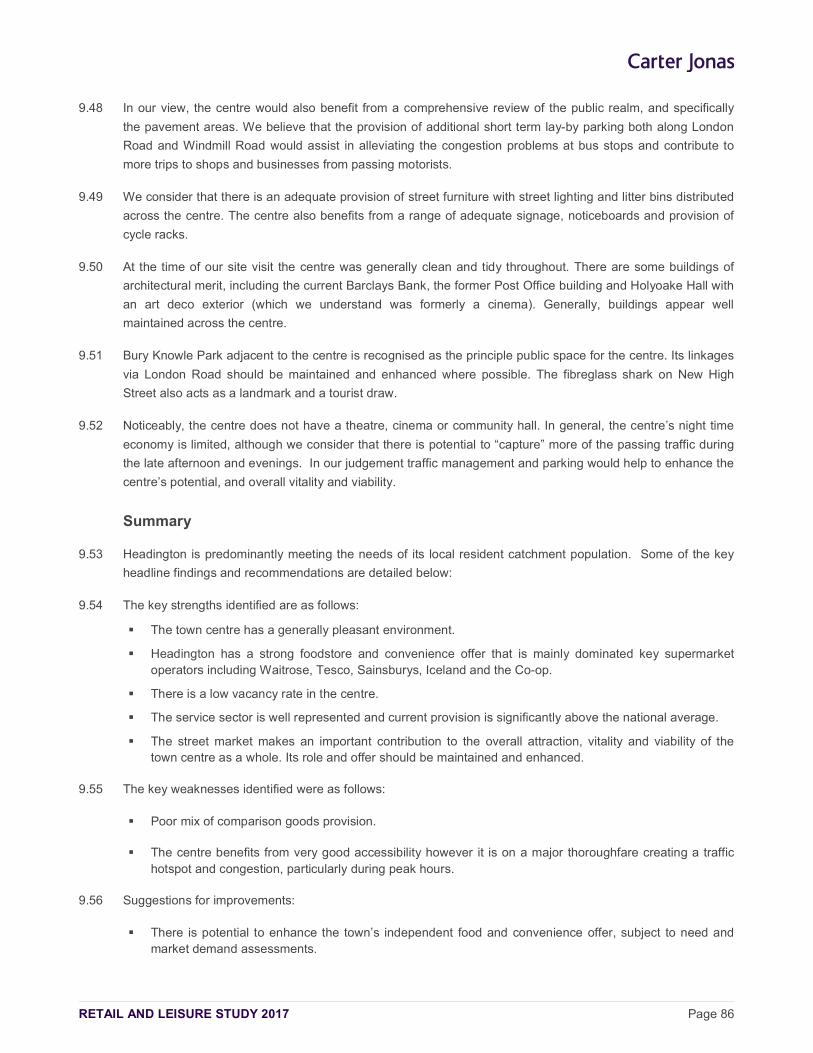
RETAIL AND LEISURE STUDY 2017 Page 86
9.48 In our view, the centre would also benefit from a comprehensive review of the public realm, and specifically
the pavement areas. We believe that the provision of additional short term lay-by parking both along London
Road and Windmill Road would assist in alleviating the congestion problems at bus stops and contribute to
more trips to shops and businesses from passing motorists.
9.49 We consider that there is an adequate provision of street furniture with street lighting and litter bins distributed
across the centre. The centre also benefits from a range of adequate signage, noticeboards and provision of
cycle racks.
9.50 At the time of our site visit the centre was generally clean and tidy throughout. There are some buildings of
architectural merit, including the current Barclays Bank, the former Post Office building and Holyoake Hall with
an art deco exterior (which we understand was formerly a cinema). Generally, buildings appear well
maintained across the centre.
9.51 Bury Knowle Park adjacent to the centre is recognised as the principle public space for the centre. Its linkages
via London Road should be maintained and enhanced where possible. The fibreglass shark on New High
Street also acts as a landmark and a tourist draw.
9.52 Noticeably, the centre does not have a theatre, cinema or community hall. In general, the centre’s night time
economy is limited, although we consider that there is potential to “capture” more of the passing traffic during
the late afternoon and evenings. In our judgement traffic management and parking would help to enhance the
centre’s potential, and overall vitality and viability.
Summary
9.53 Headington is predominantly meeting the needs of its local resident catchment population. Some of the key
headline findings and recommendations are detailed below:
9.54 The key strengths identified are as follows:
The town centre has a generally pleasant environment.
Headington has a strong foodstore and convenience offer that is mainly dominated key supermarket operators including Waitrose, Tesco, Sainsburys, Iceland and the Co-op.
There is a low vacancy rate in the centre.
The service sector is well represented and current provision is significantly above the national average.
The street market makes an important contribution to the overall attraction, vitality and viability of the town centre as a whole. Its role and offer should be maintained and enhanced.
9.55 The key weaknesses identified were as follows:
Poor mix of comparison goods provision.
The centre benefits from very good accessibility however it is on a major thoroughfare creating a traffic hotspot and congestion, particularly during peak hours.
9.56 Suggestions for improvements:
There is potential to enhance the town’s independent food and convenience offer, subject to need and market demand assessments.
RETAIL AND LEISURE STUDY 2017 Page 87
There would also appear to be potential to improve the quality of the centre's comparison goods offer. Attracting a wider range of quality (multiple and independent) retailers particularly fashion and footwear to the centre would help the centre compete with other nearby District Centres. However, attracting and accommodating new retailers will also depend on forecast need and market demand, and the potential availability of suitable sites/buildings in or on the edge of Headington.
The centre has a particularly high overprovision of charity shops and this should be monitored in the context of the centre’s comparison goods mix.
The centre would benefit from improving the quality of its independent and multiple restaurant and café offer to benefit both its daytime and evening economy.
In our judgement the centre would benefit from a comprehensive review of its public realm and specifically the pavement areas. We believe there could be potential to accommodate additional short term lay-by parking both along London Road and Windmill Road, without compromising the pedestrian environment. The provision of short term parking bays would help to extend dwell times within the centre, thereby improving the early evening and night-time economy.
In our view the key to unlocking the potential of Headington as a retail and commercial leisure destination would be to “capture” more of the traffic passing through the centre, and increase trips and dwell times.
Additionally, there is potential to create an offer that is targeted, and taps in to, the passing trade as well as the substantial student and worker populations that surround the centre.
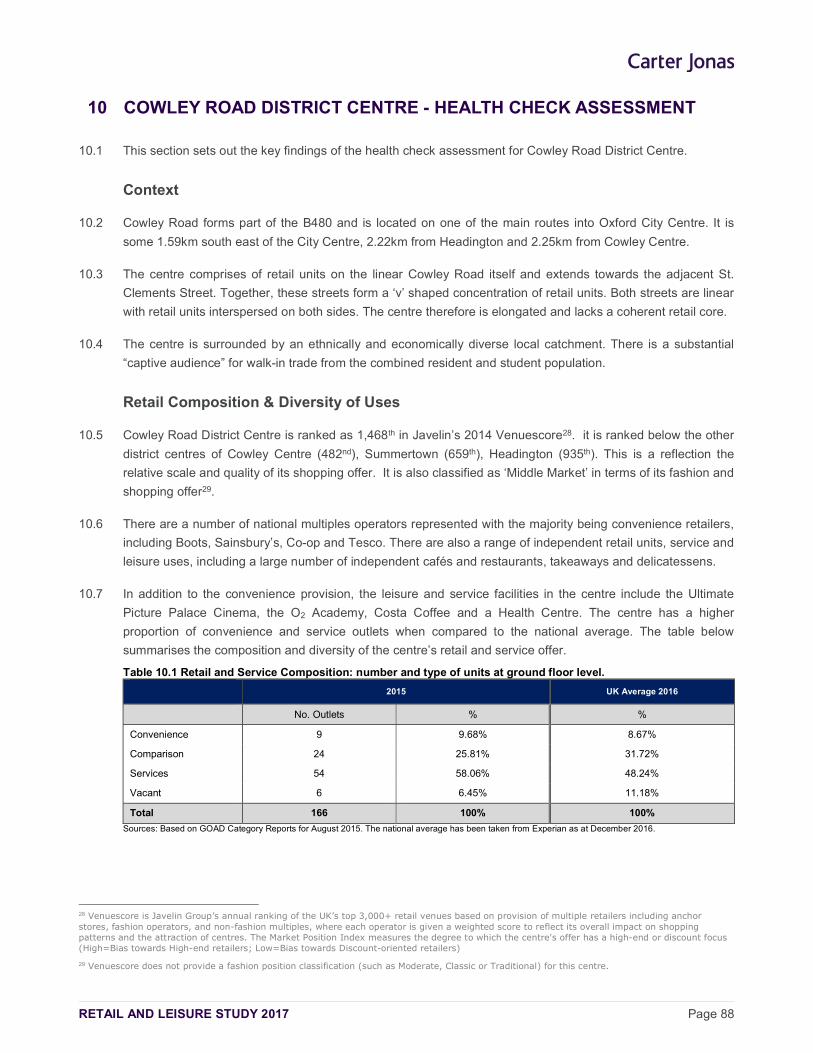
RETAIL AND LEISURE STUDY 2017 Page 88
10 COWLEY ROAD DISTRICT CENTRE - HEALTH CHECK ASSESSMENT
10.1 This section sets out the key findings of the health check assessment for Cowley Road District Centre.
Context
10.2 Cowley Road forms part of the B480 and is located on one of the main routes into Oxford City Centre. It is
some 1.59km south east of the City Centre, 2.22km from Headington and 2.25km from Cowley Centre.
10.3 The centre comprises of retail units on the linear Cowley Road itself and extends towards the adjacent St.
Clements Street. Together, these streets form a ‘v’ shaped concentration of retail units. Both streets are linear
with retail units interspersed on both sides. The centre therefore is elongated and lacks a coherent retail core.
10.4 The centre is surrounded by an ethnically and economically diverse local catchment. There is a substantial
“captive audience” for walk-in trade from the combined resident and student population.
Retail Composition & Diversity of Uses
10.5 Cowley Road District Centre is ranked as 1,468th in Javelin’s 2014 Venuescore28. it is ranked below the other
district centres of Cowley Centre (482nd), Summertown (659th), Headington (935th). This is a reflection the
relative scale and quality of its shopping offer. It is also classified as ‘Middle Market’ in terms of its fashion and
shopping offer29.
10.6 There are a number of national multiples operators represented with the majority being convenience retailers,
including Boots, Sainsbury’s, Co-op and Tesco. There are also a range of independent retail units, service and
leisure uses, including a large number of independent cafés and restaurants, takeaways and delicatessens.
10.7 In addition to the convenience provision, the leisure and service facilities in the centre include the Ultimate
Picture Palace Cinema, the O2 Academy, Costa Coffee and a Health Centre. The centre has a higher
proportion of convenience and service outlets when compared to the national average. The table below
summarises the composition and diversity of the centre’s retail and service offer.
Table 10.1 Retail and Service Composition: number and type of units at ground floor level.
2015 UK Average 2016
No. Outlets % %
Convenience 9 9.68% 8.67%
Comparison 24 25.81% 31.72%
Services 54 58.06% 48.24%
Vacant 6 6.45% 11.18%
Total 166 100% 100%
Sources: Based on GOAD Category Reports for August 2015. The national average has been taken from Experian as at December 2016.
28 Venuescore is Javelin Group’s annual ranking of the UK’s top 3,000+ retail venues based on provision of multiple retailers including anchor stores, fashion operators, and non-fashion multiples, where each operator is given a weighted score to reflect its overall impact on shopping patterns and the attraction of centres. The Market Position Index measures the degree to which the centre's offer has a high-end or discount focus (High=Bias towards High-end retailers; Low=Bias towards Discount-oriented retailers)
29 Venuescore does not provide a fashion position classification (such as Moderate, Classic or Traditional) for this centre.
RETAIL AND LEISURE STUDY 2017 Page 89
Convenience Offer
10.8 The table shows the current provision represents 9.68% of total outlets, which is above the national average of
8.67%. The total (Goad) convenience goods of 3,047 sqm in 2015 represents 21.16% of Cowley Road’s total
floorspace provision, which is also above the national average of 15.21%.
10.9 The main food and convenience outlets in the centre include:
five convenience stores and supermarkets;
three grocers & delicatessens; and
a baker.
10.10 There were no butchers, fishmongers or greengrocers outlets at the time of the audit.
10.11 In addition, the East Oxford Farmers' and Community Market is held every Saturday at East Oxford Primary
School. This school is located behind Tesco and therefore not on the Cowley Road itself. The markets
provides stalls selling groceries and produce as well as some jewellery and clothing.
10.12 The household survey results shows that Cowley Road’s convenience provision attracts some 6.2% of
respondents from the core zones (1 and 2).
10.13 In summary, Cowley Road District Centre is well served in terms of foodstores and convenience goods shops
based on its relative role and function within the retail hierarchy. However there would appear to be potential
to enhance the offer by attracting more specialist convenience retailers such as butchers, fishmongers or
greengrocers.
Comparison Offer
10.14 Cowley Road has 24 comparison outlets. This represents 25.81% of total provision, which is below the
national average of 31.72% in 2016. The (Goad) comparison floorspace is 3,800 sqm; equivalent to 26.39% of
total floorspace, which is also below the national average of 35.74%.
10.15 In general terms the centre’s comparison goods offer comprises a relatively good representation of:
charity shops – the four stores represent 4.30% of total outlets, which is higher than the national average figure of 2.71%.
cycle and accessories shop – the two stores represent 2.15% of outlets which is also higher than the national average of 0.25%.
electrical goods outlets – the two stores account for 2.15% of outlets which is above the national average of 1.31%.
toys, games and hobby outlets – the two stores represent 2.15% of outlets compared with the national average of 0.77%.
10.16 The centre has no comparison goods representation in the following categories – booksellers, carpets &
flooring as well as ladies’ and mens’ wear.
10.17 The HTIS also shows that Cowley Road’s comparison goods provision attracts only 1.33% of respondents
from the core Zones 1 and 2.
RETAIL AND LEISURE STUDY 2017 Page 90
10.18 In summary, we consider that Cowley Road District Centre meets the needs of the local catchment, and its
comparison offer is commensurate with its role and function in the retail hierarchy. Opportunities to improve
the quality of its comparison goods offer should be explored, although this will be subject to need and market
demand for represent in the centre.
Service Provision
10.19 There are 54 retail, leisure and financial services outlets. This represents 58.06% of total provision and is
above the 2016 national average of 48.24%. The current distribution of service uses is as follows:
There are 10 retail services in 2015. Current provision represents 10.75% of total units, which is lower than the (2016) national average of 14.06%. The retail service offer is dominated by five health and beauty outlets, which represent almost 5.38% of all retail outlets. There are also two dry cleaners, two post offices and one vehicle repairs service.
There were seven financial service outlets in 2015, including two retail banks, three property services, one financial service and one other unclassified service business. Current provision represents 7.53% of total units in the town, which is below the national average of 10.56%.
Leisure services accounted for 37 outlets in 2015, which represented 39.78% of total provision. This was considerably above the national average figure (23.50%). National multiples include Nandos and Costa Coffee. There is a good mix of places to eat and drink in the centre including restaurants (14), cafés (8 outlets), takeaways (6), Public Houses (4), casinos & betting offices (2), cinemas, theatres and concert halls (2), and wine bar (1). However, there are no sports & leisure facilities or disco, dance and nightclubs. The food and beverage offer across the District Centre is varied and ethnically diverse. The businesses are primarily low to mid-range businesses.
10.20 The shops and associated leisure facilities generate significant linked trips with the centre. The centre is also
well positioned in providing a thriving night time economy with the varied provision of leisure services outlets.
Multiple and Independent Offer
10.21 Experian Goad define a multiple retailer as being part of a network of nine or more outlets. It is recognised
that a good presence and mix of multiples in towns can help to greatly improve their overall attraction and
performance. Multiples are a strong draw for customers and they help to generate frequent shopping trips and
footfall to the benefit of other shops, services and businesses. Achieving a healthy balance between multiple
and independent shops and services is therefore important in maintaining and enhancing the vitality and
viability of centres.
10.22 Experian Goad state there were 23 multiple retailers in the centre in 2015. Of these there were three “major
retailers”30 identified by Experian Goad; namely, Boots, Sainsbury’s and Tesco. In summary, we consider that
there is currently a good complementary mix of multiple and independent retail and service businesses in the
town centre.
Street Market
10.23 As indicated previously, the East Oxford Farmers' and Community Market is held every Saturday at East
Oxford Primary School. However, this school is located behind Tesco and therefore technically not on Cowley
Road but on the adjacent Union Street. The offer at the market includes groceries and produce as well as
30 Major Retailers include 30 key national multiples that are most likely to improve the customer appeal of a centre.
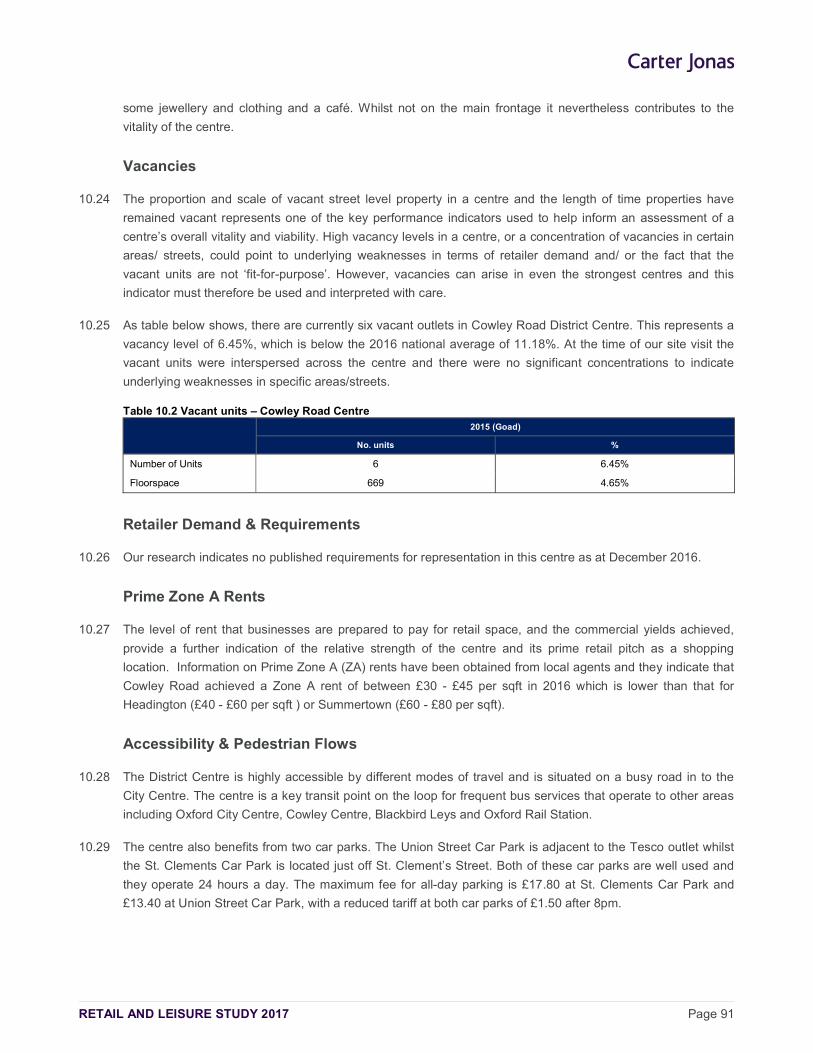
RETAIL AND LEISURE STUDY 2017 Page 91
some jewellery and clothing and a café. Whilst not on the main frontage it nevertheless contributes to the
vitality of the centre.
Vacancies
10.24 The proportion and scale of vacant street level property in a centre and the length of time properties have
remained vacant represents one of the key performance indicators used to help inform an assessment of a
centre’s overall vitality and viability. High vacancy levels in a centre, or a concentration of vacancies in certain
areas/ streets, could point to underlying weaknesses in terms of retailer demand and/ or the fact that the
vacant units are not ‘fit-for-purpose’. However, vacancies can arise in even the strongest centres and this
indicator must therefore be used and interpreted with care.
10.25 As table below shows, there are currently six vacant outlets in Cowley Road District Centre. This represents a
vacancy level of 6.45%, which is below the 2016 national average of 11.18%. At the time of our site visit the
vacant units were interspersed across the centre and there were no significant concentrations to indicate
underlying weaknesses in specific areas/streets.
Table 10.2 Vacant units – Cowley Road Centre
2015 (Goad)
No. units %
Number of Units 6 6.45%
Floorspace 669 4.65%
Retailer Demand & Requirements
10.26 Our research indicates no published requirements for representation in this centre as at December 2016.
Prime Zone A Rents
10.27 The level of rent that businesses are prepared to pay for retail space, and the commercial yields achieved,
provide a further indication of the relative strength of the centre and its prime retail pitch as a shopping
location. Information on Prime Zone A (ZA) rents have been obtained from local agents and they indicate that
Cowley Road achieved a Zone A rent of between £30 - £45 per sqft in 2016 which is lower than that for
Headington (£40 - £60 per sqft ) or Summertown (£60 - £80 per sqft).
Accessibility & Pedestrian Flows
10.28 The District Centre is highly accessible by different modes of travel and is situated on a busy road in to the
City Centre. The centre is a key transit point on the loop for frequent bus services that operate to other areas
including Oxford City Centre, Cowley Centre, Blackbird Leys and Oxford Rail Station.
10.29 The centre also benefits from two car parks. The Union Street Car Park is adjacent to the Tesco outlet whilst
the St. Clements Car Park is located just off St. Clement’s Street. Both of these car parks are well used and
they operate 24 hours a day. The maximum fee for all-day parking is £17.80 at St. Clements Car Park and
£13.40 at Union Street Car Park, with a reduced tariff at both car parks of £1.50 after 8pm.
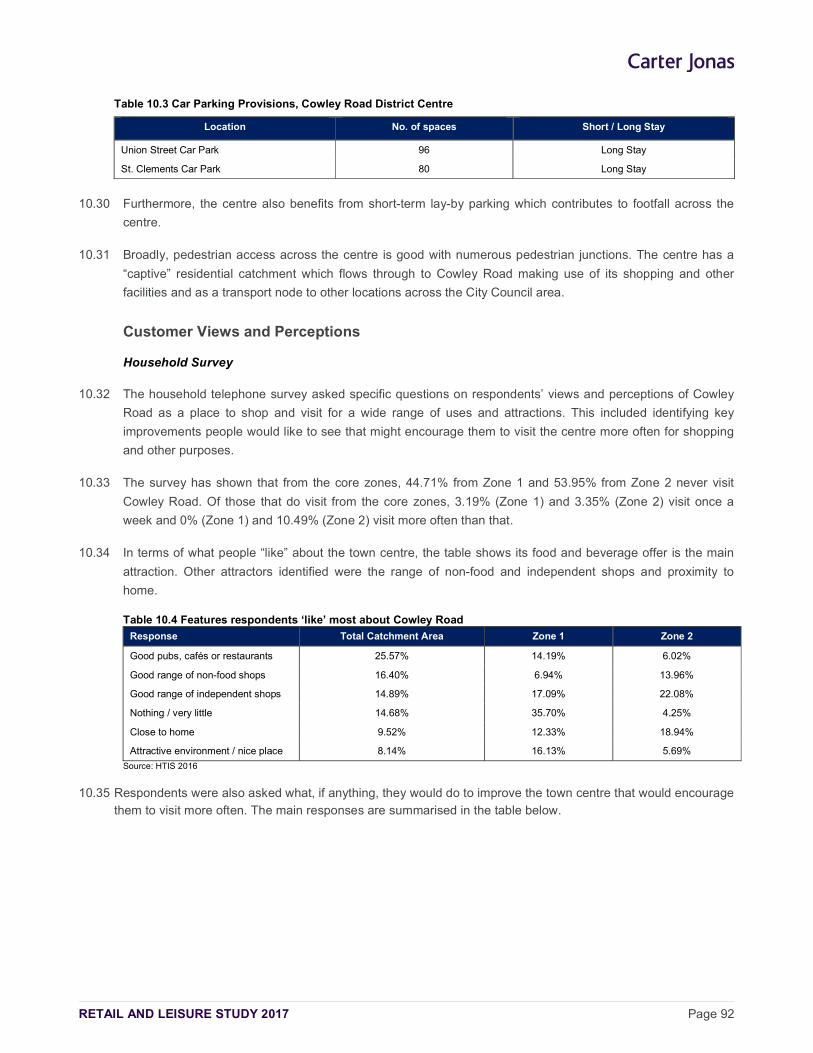
RETAIL AND LEISURE STUDY 2017 Page 92
Table 10.3 Car Parking Provisions, Cowley Road District Centre
Location No. of spaces Short / Long Stay
Union Street Car Park 96 Long Stay
St. Clements Car Park 80 Long Stay
10.30 Furthermore, the centre also benefits from short-term lay-by parking which contributes to footfall across the
centre.
10.31 Broadly, pedestrian access across the centre is good with numerous pedestrian junctions. The centre has a
“captive” residential catchment which flows through to Cowley Road making use of its shopping and other
facilities and as a transport node to other locations across the City Council area.
Customer Views and Perceptions
Household Survey
10.32 The household telephone survey asked specific questions on respondents’ views and perceptions of Cowley
Road as a place to shop and visit for a wide range of uses and attractions. This included identifying key
improvements people would like to see that might encourage them to visit the centre more often for shopping
and other purposes.
10.33 The survey has shown that from the core zones, 44.71% from Zone 1 and 53.95% from Zone 2 never visit
Cowley Road. Of those that do visit from the core zones, 3.19% (Zone 1) and 3.35% (Zone 2) visit once a
week and 0% (Zone 1) and 10.49% (Zone 2) visit more often than that.
10.34 In terms of what people “like” about the town centre, the table shows its food and beverage offer is the main
attraction. Other attractors identified were the range of non-food and independent shops and proximity to
home.
Table 10.4 Features respondents ‘like’ most about Cowley Road
Response Total Catchment Area Zone 1 Zone 2
Good pubs, cafés or restaurants 25.57% 14.19% 6.02%
Good range of non-food shops 16.40% 6.94% 13.96%
Good range of independent shops 14.89% 17.09% 22.08%
Nothing / very little 14.68% 35.70% 4.25%
Close to home 9.52% 12.33% 18.94%
Attractive environment / nice place 8.14% 16.13% 5.69%
Source: HTIS 2016
10.35 Respondents were also asked what, if anything, they would do to improve the town centre that would encourage
them to visit more often. The main responses are summarised in the table below.
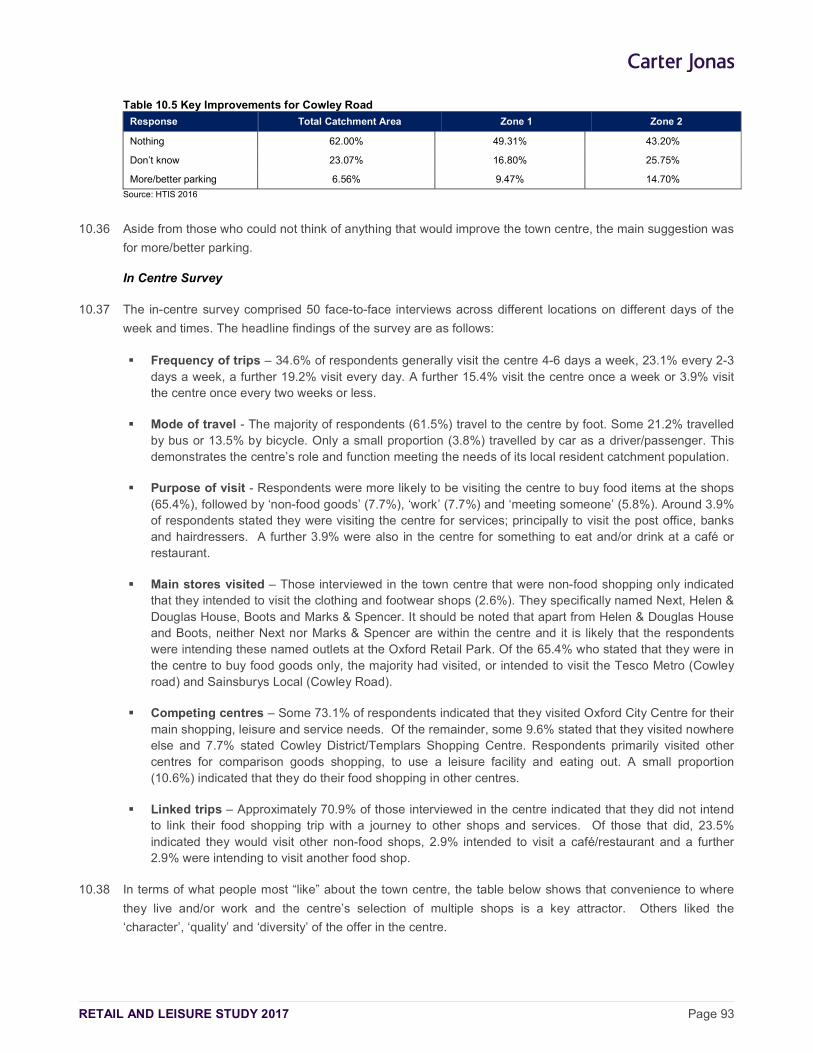
RETAIL AND LEISURE STUDY 2017 Page 93
Table 10.5 Key Improvements for Cowley Road
Response Total Catchment Area Zone 1 Zone 2
Nothing 62.00% 49.31% 43.20%
Don’t know 23.07% 16.80% 25.75%
More/better parking 6.56% 9.47% 14.70%
Source: HTIS 2016
10.36 Aside from those who could not think of anything that would improve the town centre, the main suggestion was
for more/better parking.
In Centre Survey
10.37 The in-centre survey comprised 50 face-to-face interviews across different locations on different days of the
week and times. The headline findings of the survey are as follows:
Frequency of trips – 34.6% of respondents generally visit the centre 4-6 days a week, 23.1% every 2-3 days a week, a further 19.2% visit every day. A further 15.4% visit the centre once a week or 3.9% visit the centre once every two weeks or less.
Mode of travel - The majority of respondents (61.5%) travel to the centre by foot. Some 21.2% travelled by bus or 13.5% by bicycle. Only a small proportion (3.8%) travelled by car as a driver/passenger. This demonstrates the centre’s role and function meeting the needs of its local resident catchment population.
Purpose of visit - Respondents were more likely to be visiting the centre to buy food items at the shops (65.4%), followed by ‘non-food goods’ (7.7%), ‘work’ (7.7%) and ‘meeting someone’ (5.8%). Around 3.9% of respondents stated they were visiting the centre for services; principally to visit the post office, banks and hairdressers. A further 3.9% were also in the centre for something to eat and/or drink at a café or restaurant.
Main stores visited – Those interviewed in the town centre that were non-food shopping only indicated that they intended to visit the clothing and footwear shops (2.6%). They specifically named Next, Helen & Douglas House, Boots and Marks & Spencer. It should be noted that apart from Helen & Douglas House and Boots, neither Next nor Marks & Spencer are within the centre and it is likely that the respondents were intending these named outlets at the Oxford Retail Park. Of the 65.4% who stated that they were in the centre to buy food goods only, the majority had visited, or intended to visit the Tesco Metro (Cowley road) and Sainsburys Local (Cowley Road).
Competing centres – Some 73.1% of respondents indicated that they visited Oxford City Centre for their main shopping, leisure and service needs. Of the remainder, some 9.6% stated that they visited nowhere else and 7.7% stated Cowley District/Templars Shopping Centre. Respondents primarily visited other centres for comparison goods shopping, to use a leisure facility and eating out. A small proportion (10.6%) indicated that they do their food shopping in other centres.
Linked trips – Approximately 70.9% of those interviewed in the centre indicated that they did not intend to link their food shopping trip with a journey to other shops and services. Of those that did, 23.5% indicated they would visit other non-food shops, 2.9% intended to visit a café/restaurant and a further 2.9% were intending to visit another food shop.
10.38 In terms of what people most “like” about the town centre, the table below shows that convenience to where
they live and/or work and the centre’s selection of multiple shops is a key attractor. Others liked the
‘character’, ‘quality’ and ‘diversity’ of the offer in the centre.
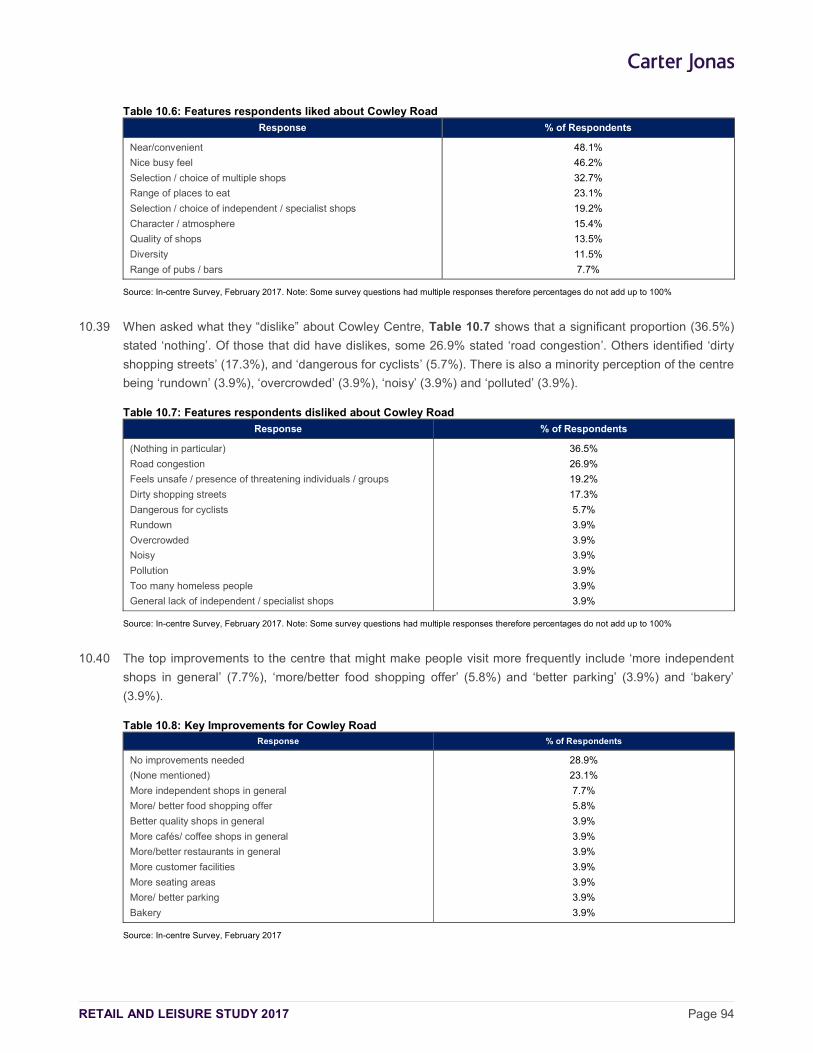
RETAIL AND LEISURE STUDY 2017 Page 94
Table 10.6: Features respondents liked about Cowley Road
Response % of Respondents
Near/convenient
Nice busy feel
Selection / choice of multiple shops
Range of places to eat
Selection / choice of independent / specialist shops
Character / atmosphere
Quality of shops
Diversity
Range of pubs / bars
48.1%
46.2%
32.7%
23.1%
19.2%
15.4%
13.5%
11.5%
7.7%
Source: In-centre Survey, February 2017. Note: Some survey questions had multiple responses therefore percentages do not add up to 100%
10.39 When asked what they “dislike” about Cowley Centre, Table 10.7 shows that a significant proportion (36.5%)
stated ‘nothing’. Of those that did have dislikes, some 26.9% stated ‘road congestion’. Others identified ‘dirty
shopping streets’ (17.3%), and ‘dangerous for cyclists’ (5.7%). There is also a minority perception of the centre
being ‘rundown’ (3.9%), ‘overcrowded’ (3.9%), ‘noisy’ (3.9%) and ‘polluted’ (3.9%).
Table 10.7: Features respondents disliked about Cowley Road
Response % of Respondents
(Nothing in particular)
Road congestion
Feels unsafe / presence of threatening individuals / groups
Dirty shopping streets
Dangerous for cyclists
Rundown
Overcrowded
Noisy
Pollution
Too many homeless people
General lack of independent / specialist shops
36.5%
26.9%
19.2%
17.3%
5.7%
3.9%
3.9%
3.9%
3.9%
3.9%
3.9%
Source: In-centre Survey, February 2017. Note: Some survey questions had multiple responses therefore percentages do not add up to 100%
10.40 The top improvements to the centre that might make people visit more frequently include ‘more independent
shops in general’ (7.7%), ‘more/better food shopping offer’ (5.8%) and ‘better parking’ (3.9%) and ‘bakery’
(3.9%).
Table 10.8: Key Improvements for Cowley Road Response % of Respondents
No improvements needed
(None mentioned)
More independent shops in general
More/ better food shopping offer
Better quality shops in general
More cafés/ coffee shops in general
More/better restaurants in general
More customer facilities
More seating areas
More/ better parking
Bakery
28.9%
23.1%
7.7%
5.8%
3.9%
3.9%
3.9%
3.9%
3.9%
3.9%
3.9%
Source: In-centre Survey, February 2017
RETAIL AND LEISURE STUDY 2017 Page 95
10.41 Questions were also asked on leisure facilities and uses. Overwhelmingly, 73.1% of respondents stated that
the centre did not lack leisure facilities. Of those that considered the centre lacked leisure facilities, some of
the types of uses suggested were ‘health & fitness club’ (57.1%), ‘leisure centre’ (21.4%) ‘swimming pool’
(14.3%), ‘community centre’ (14.3%) and a ‘library (7.9%). Improvements for leisure uses generally in the
centre included ‘better choice of leisure destination in general’ (71.4%), ‘better quality of leisure uses’ (28.6%),
‘gym’ (14.3%), ‘more priority of pedestrians / pedestrianisation’ (7.1%), ‘improve appearance / environment of
centre’ (7.1%), ‘more parking’ (7.1%) and ‘improved security measures / policing’ (7.1%).
10.42 Questions were also put regarding peoples’ use of and views of the street market. Of those interviewed, only
21.2% visited the market. The key attractions were the food stalls and quality of the food products. In terms of
improvements to this market, the majority stated ‘don’t know’ (50%) or ‘nothing’ (38.5%) followed by ‘more
advertising’ (5.8%), ‘a larger market’ (1.9%), ‘more bakery stalls’ (1.9%) and ‘more fishmonger stalls’ (1.9%).
10.43 Respondents were also asked about their views on leisure facilities and uses. Overwhelmingly, 78.3% of
respondents stated that the centre did not lack leisure facilities. Of those that considered the centre lacked
leisure facilities, some of the types of uses suggested were ‘children’s entertainment’ (30%), ‘health & fitness
club’ (20%) and ‘pubs/bars’ (20%). Improvements for leisure uses generally in the centre included ‘better
quality of leisure uses’ (30%), ‘better choice of leisure destination in general’ (10%) and a ‘library’ (10%).
Environmental Quality
10.44 Cowley Road District Centre has a reasonable environmental quality. The long linear nature of the centre
means that the built environment is interspersed with buildings in a range of styles and from different periods.
There are some buildings of architectural merit including The Ultimate Picture Palace building, the Cowley
Road Methodist Church building, Old Music Hall building and the Big Society Bar. These buildings set the
tone, although they are interspersed against a variety of other architectural styles leading to a discontinuity
and lack of focus across the centre.
10.45 The District Centre is broadly clean and tidy. However due to its long linear nature some pockets of litter and
flyposting were present at the time of our site visit such as near the public space adjacent to the East Oxford
Health Centre. It is acknowledged that the street art on the buildings towards the south east portion of the
centre provide an eclectic mix of artwork above the retail frontages.
10.46 There is an adequate provision of street furniture, bicycle racks, street lighting and litter bins across the District
Centre.
10.47 In our judgement the centre requires a consolidation of a retail core and a definition of the primary retail area
to create a sense of place and character.
New Investment & Potential Development
10.48 The feasibility study commissioned by the City Council has presented proposals for a £2 million
redevelopment of the East Oxford Community Centre (EOCC) site on Princes Street off Cowley Road. The
proposed refurbishment and redevelopment scheme aims to provide modern facilities for community use.
10.49 Along Cowley Road new investment is also visible at the following locations:
the new East Oxford Health Centre (and associated residential housing);
Raja Court at the junction of Cowley Road and Marston street (retail units with residential above); and
RETAIL AND LEISURE STUDY 2017 Page 96
59 – 63 Cowley Road (the new development between Circus Street and Temple Street at the northern end of the Cowley Road) this has retail units with residential above.
10.50 Broadly, the above investments are a positive sign and reflect Cowley Road’s important role and function
serving its local resident and student population. The new residential development will help to strengthen the
“captive” population increasing the vitality and viability of the centre.
Summary
10.51 The health check assessment shows that the District Centre is predominantly meeting the needs of its
ethnically and economically diverse resident catchment population. It is highly accessible and is situated on a
busy road in to the City Centre and as an interchange to the other District Centres of Cowley and Blackbird
Leys. Some of the headline findings are as detailed below.
10.52 The key strengths identified are as follows:
The Centre is highly accessible by different modes of travel.
Cowley Road has a strong convenience and service outlet provision when compared to the national average.
The centre has a “captive” residential catchment which flows through to Cowley Road.
The District Centre’s leisure facilities (principally its cafés and restaurants) are a key attractor which help to generate footfall and significant linked trips across the centre.
The Centre has a thriving night time economy with the varied provision of leisure services outlets.
The East Oxford Farmers' and Community Market should be maintained as it enhances the footfall to the centre.
Low vacancy rates.
The centre has benefitted from recent new investment, which has enhanced the centre’s overall vitality and viability.
The centre has relatively good accessibility by foot and different modes from the rest of the surrounding residential community.
10.53 The key weaknesses identified were as follows:
The centre is elongated and lacks a coherent retail core.
The District Centre has a weak comparison goods provision.
10.54 Suggestions for improvements:
There would appear to be potential to enhance the convenience offer by attracting more specialist retailers such as butchers, fishmongers or greengrocers subject to further assessment of need and market demand.
The centre requires a consolidation of a retail core and a clearer definition of the primary shopping area to create a sense of character.

RETAIL AND LEISURE STUDY 2017 Page 97
There is significant potential to capitalise on the current leisure provision (both multiples and independents), particularly to enhance the night time economy of the centre and to help increase dwell times across the centre.
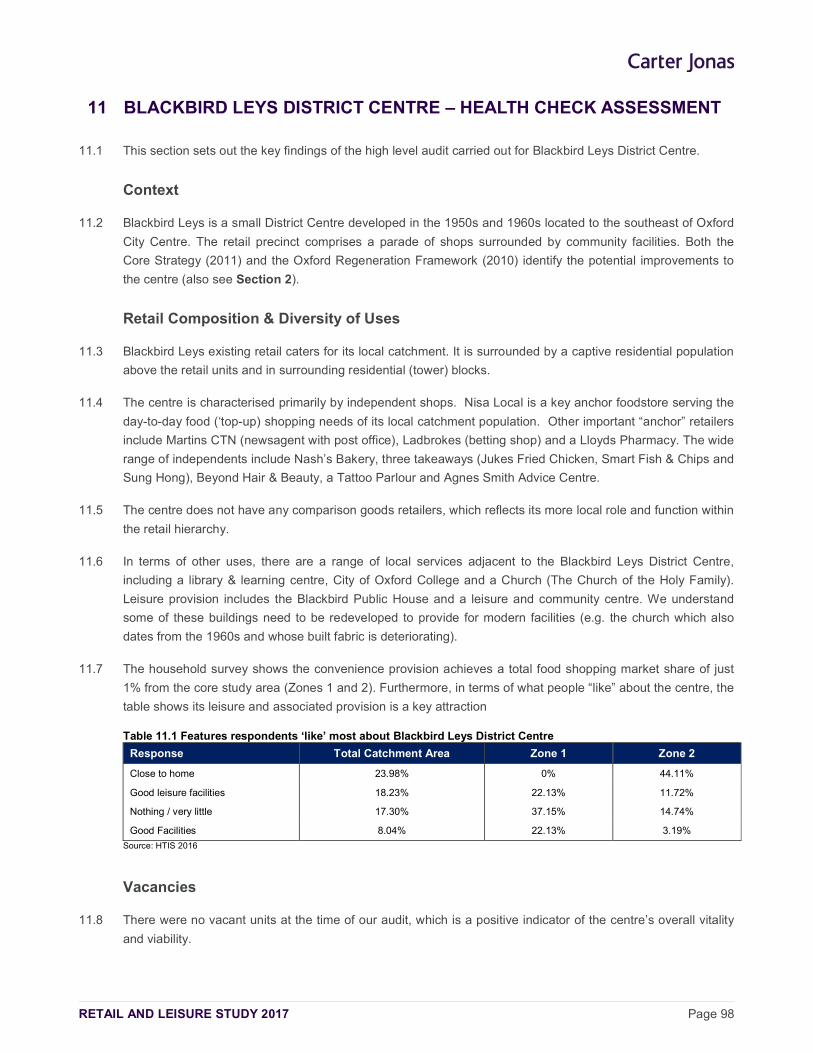
RETAIL AND LEISURE STUDY 2017 Page 98
11 BLACKBIRD LEYS DISTRICT CENTRE – HEALTH CHECK ASSESSMENT
11.1 This section sets out the key findings of the high level audit carried out for Blackbird Leys District Centre.
Context
11.2 Blackbird Leys is a small District Centre developed in the 1950s and 1960s located to the southeast of Oxford
City Centre. The retail precinct comprises a parade of shops surrounded by community facilities. Both the
Core Strategy (2011) and the Oxford Regeneration Framework (2010) identify the potential improvements to
the centre (also see Section 2).
Retail Composition & Diversity of Uses
11.3 Blackbird Leys existing retail caters for its local catchment. It is surrounded by a captive residential population
above the retail units and in surrounding residential (tower) blocks.
11.4 The centre is characterised primarily by independent shops. Nisa Local is a key anchor foodstore serving the
day-to-day food (‘top-up) shopping needs of its local catchment population. Other important “anchor” retailers
include Martins CTN (newsagent with post office), Ladbrokes (betting shop) and a Lloyds Pharmacy. The wide
range of independents include Nash’s Bakery, three takeaways (Jukes Fried Chicken, Smart Fish & Chips and
Sung Hong), Beyond Hair & Beauty, a Tattoo Parlour and Agnes Smith Advice Centre.
11.5 The centre does not have any comparison goods retailers, which reflects its more local role and function within
the retail hierarchy.
11.6 In terms of other uses, there are a range of local services adjacent to the Blackbird Leys District Centre,
including a library & learning centre, City of Oxford College and a Church (The Church of the Holy Family).
Leisure provision includes the Blackbird Public House and a leisure and community centre. We understand
some of these buildings need to be redeveloped to provide for modern facilities (e.g. the church which also
dates from the 1960s and whose built fabric is deteriorating).
11.7 The household survey shows the convenience provision achieves a total food shopping market share of just
1% from the core study area (Zones 1 and 2). Furthermore, in terms of what people “like” about the centre, the
table shows its leisure and associated provision is a key attraction
Table 11.1 Features respondents ‘like’ most about Blackbird Leys District Centre
Response Total Catchment Area Zone 1 Zone 2
Close to home 23.98% 0% 44.11%
Good leisure facilities 18.23% 22.13% 11.72%
Nothing / very little 17.30% 37.15% 14.74%
Good Facilities 8.04% 22.13% 3.19%
Source: HTIS 2016
Vacancies
11.8 There were no vacant units at the time of our audit, which is a positive indicator of the centre’s overall vitality
and viability.
RETAIL AND LEISURE STUDY 2017 Page 99
Accessibility & Parking
11.9 Blackbird Leys District Centre is situated along the Blackbird Leys Road, Knights Road and Cuddesdon Way.
It is easily accessible via car from surrounding residential areas. Bus journeys to both nearby Cowley and to
the City Centre are fast and operate a fairly regular service.
11.10 On-street parking is available free of charge across the centre, including along the Blackbird Leys Road and
Knights Road. It is therefore not controlled or subject to parking tariffs, unlike the other District Centres.
In Centre Survey
11.11 The in-centre survey in Blackbird Leys comprised 30 face-to-face visitor surveys and was conducted in
different locations on different days of the week and times. The headline findings of the survey are as follows:
Frequency of trips – 23.3% of respondents generally visit the centre 4-6 days a week, a further 20% visit every day and 6.7% every 2-3 days a week. A further 10% visit the centre once a week or 13.3% visit the centre once every two weeks or less.
Mode of travel - The respondents either travelled to the centre by foot (40%) or by car (as a driver or passenger) (40%). Some 16.7% travelled by bus.
Purpose of visit - Respondents were more likely to be visiting the centre to buy food items at the shops (36.7%), followed by ‘to use a leisure facility’ (30%) and ‘meeting someone’ (16.7%). Around 6.7% of respondents stated they were visiting the centre for work.
Main stores visited – All those interviewed in the town centre stated that they were food shopping only. The majority had visited, or intended to visit the Nisa Local (Blackbird Leys Road) and Martins (Blackbird Leys Road).
Competing centres – The key competing centres were Cowley District Centre (53.3%), followed by Oxford City Centre (10%). Some 73.1% of respondents indicated that they visited Oxford City Centre for their main shopping, leisure and service needs. Respondents primarily visited other centres for comparison goods shopping, services, work, proximity to home, as a visitor or for eating out. A small proportion (14.3%) indicated that they did their food shopping in other centres.
Linked trips – All those interviewed in the centre indicated that they did not intend to link their food shopping trip with a journey to other shops and services.
11.12 In terms of what people most “like” about the town centre, the table below shows that convenience to where
they live and/or work and ease of parking is a key attractor. Others liked the ‘range of leisure facilities’ (i.e.
proximity to the adjacent leisure facilities) as well as the good public transport links.
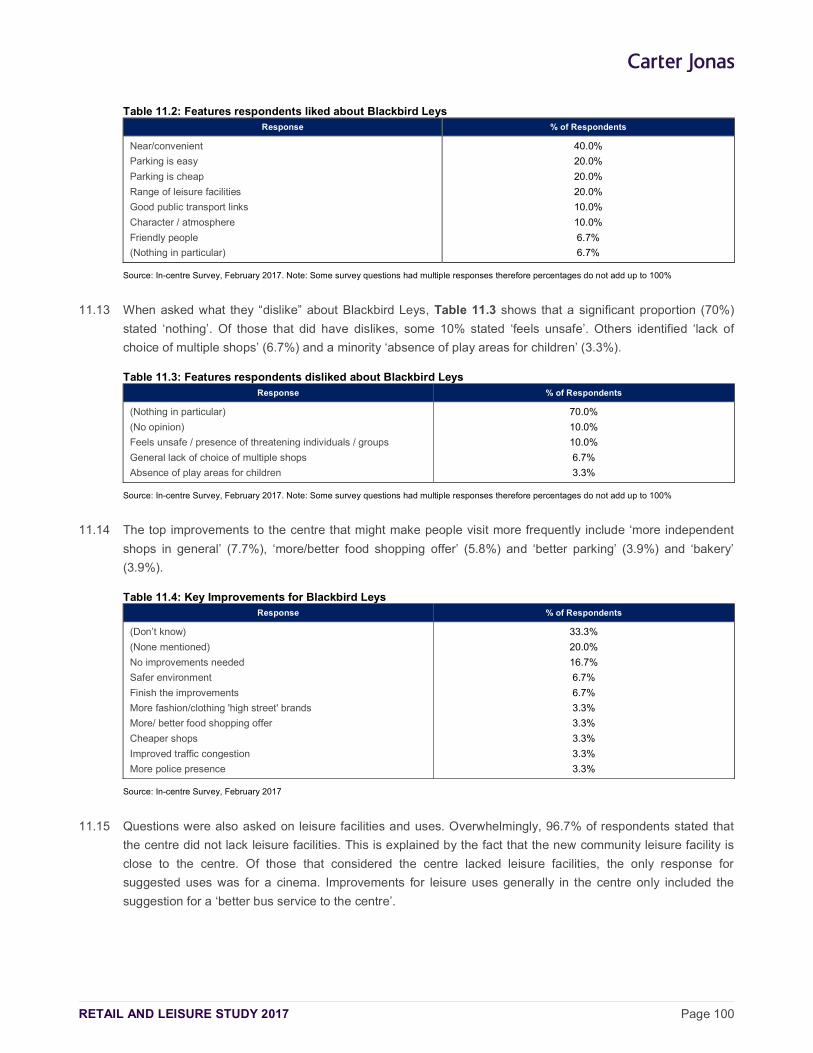
RETAIL AND LEISURE STUDY 2017 Page 100
Table 11.2: Features respondents liked about Blackbird Leys Response % of Respondents
Near/convenient
Parking is easy
Parking is cheap
Range of leisure facilities
Good public transport links
Character / atmosphere
Friendly people
(Nothing in particular)
40.0%
20.0%
20.0%
20.0%
10.0%
10.0%
6.7%
6.7%
Source: In-centre Survey, February 2017. Note: Some survey questions had multiple responses therefore percentages do not add up to 100%
11.13 When asked what they “dislike” about Blackbird Leys, Table 11.3 shows that a significant proportion (70%)
stated ‘nothing’. Of those that did have dislikes, some 10% stated ‘feels unsafe’. Others identified ‘lack of
choice of multiple shops’ (6.7%) and a minority ‘absence of play areas for children’ (3.3%).
Table 11.3: Features respondents disliked about Blackbird Leys Response % of Respondents
(Nothing in particular)
(No opinion)
Feels unsafe / presence of threatening individuals / groups
General lack of choice of multiple shops
Absence of play areas for children
70.0%
10.0%
10.0%
6.7%
3.3%
Source: In-centre Survey, February 2017. Note: Some survey questions had multiple responses therefore percentages do not add up to 100%
11.14 The top improvements to the centre that might make people visit more frequently include ‘more independent
shops in general’ (7.7%), ‘more/better food shopping offer’ (5.8%) and ‘better parking’ (3.9%) and ‘bakery’
(3.9%).
Table 11.4: Key Improvements for Blackbird Leys Response % of Respondents
(Don’t know)
(None mentioned)
No improvements needed
Safer environment
Finish the improvements
More fashion/clothing 'high street' brands
More/ better food shopping offer
Cheaper shops
Improved traffic congestion
More police presence
33.3%
20.0%
16.7%
6.7%
6.7%
3.3%
3.3%
3.3%
3.3%
3.3%
Source: In-centre Survey, February 2017
11.15 Questions were also asked on leisure facilities and uses. Overwhelmingly, 96.7% of respondents stated that
the centre did not lack leisure facilities. This is explained by the fact that the new community leisure facility is
close to the centre. Of those that considered the centre lacked leisure facilities, the only response for
suggested uses was for a cinema. Improvements for leisure uses generally in the centre only included the
suggestion for a ‘better bus service to the centre’.
RETAIL AND LEISURE STUDY 2017 Page 101
Environmental Quality
11.16 We consider Blackbird Leys District Centre to be clean and tidy throughout with a good provision of litter bins.
At the time of our site visit there were no vacant units and there were no signs of litter.
11.17 However the buildings are showing signs of disrepair and are dated by modern standards. This reflects the
fact that much of the centre was built in the 1950s and 1960s and has since deteriorated. It was observed that
the lock-up garages adjacent to the retail precinct appear to be underutilised and this could represent an
opportunity for redevelopment and modernisation.
11.18 The attraction and vitality of the centre is supported by residential units above and surrounding the shops, as
well as its location close to local community facilities and services.
11.19 As stated previously, the Blackbird Leys area has been identified by the Core Strategy (2011) and the Oxford
Regeneration Framework (2010) for comprehensive redevelopment and regeneration, to include new
commercial and residential accommodation. We understand that a regeneration partner is being sought to
develop the plans and help deliver this vision. Regeneration work is currently on-going including a major
refurbishment of the tower blocks (Windrush and Evenlode Towers).
Summary
11.20 Blackbird Leys primarily consists of a retail precinct surrounded by community facilities and housing. It is
highly accessible and surrounded by a range of leisure provision.
11.21 The key strengths identified are as follows:
The Nisa supermarket is an important “anchor” serving the day-to-day needs of the local resident population also benefiting other shops, businesses, services and facilities in the centre through linked trips, spin-off expenditure and increased footfall.
The centre has relatively good accessibility by foot and different modes from the rest of the surrounding residential community.
There are no vacant units.
Good community leisure facilities.
11.22 The key weaknesses identified were as follows:
No comparison goods representation.
Built environment deteriorating.
11.23 The Suggestions for improvements:
For Blackbird Leys District Centre to continue performing and enhancing its current role it requires a comprehensive masterplan for improvement and investment. This would need to consider all the surrounding services and facilities to bring forward a modern centre that is fit for purpose
Without this redevelopment and modernisation we consider that the centre currently functions below District Centre level in the retail hierarchy, and has the typical characteristics of a local centre at best.
RETAIL AND LEISURE STUDY 2017 Page 102
12 ECONOMIC RETAIL NEED/CAPACITY ASSESSMENT
12.1 This section sets out the results of the quantitative retail need (‘capacity’) assessment for new retail
(comparison and convenience goods) floorspace in the Oxford City Council area covering the period from
2016 to 2036; further broken down into five year periods (i.e. 2022, 2027, 2032 and 2036). This assessment
updates and supersedes the findings of the Council’s previous evidence-based studies.
The CREATe Model: Key Baseline Assumptions & Forecasts
12.2 The CREATe economic model has been specifically designed and developed by Carter Jonas over a number
of years to assess the capacity for and impact of new retail (convenience and comparison goods)
development and investment.
12.3 The (Excel-based) model adopts a transparent ‘step-by-step’ approach in which all the key assumptions and
forecasts can be easily tested, in accordance with good practice advice. The model draws on the market
share analysis derived from the household telephone interview to help inform the assessment of the current
turnover and trading performance of existing centres, shops and stores at the base year.
12.4 In simple terms the quantitative capacity for new retail floorspace is broadly derived from the forecast growth
in population and expenditure, after making an allowance for new commitments, and the increased
‘productivity’ (or ‘efficiency’) of all existing and new floorspace. In certain cases capacity can also occur where
there is a clearly identified ‘imbalance’ (or ‘over-trading’) between the turnover of existing facilities and the total
available expenditure in the defined study/catchment area at the base year (2016).
12.5 The assumptions and forecasts underpinning the CREATe model are based on robust evidence, research and
best practice, specifically:
The 2016 population estimates for the study area and zones have been sourced from the Retail Planner Reports (‘RPR’) derived from CJ’s in-house Experian MMG3 Geographic Information System (MMG3 GIS). The population figures are based on the latest ONS Sub-National Population Projections.
The average retail (convenience and comparison goods) expenditure per capita levels by zone in 2016 have also been sourced from Experian’s MMG3 GIS (please note all expenditure and turnover figures are expressed in 2015 prices).
The year-on-year retail expenditure growth forecasts for both convenience and comparison goods have been informed by the latest Experian Retail Planner Briefing Note 14 (RPBN) published in November 2016. As described in Section 3 (Table 3.1) Experian forecast negative annual growth in convenience goods expenditure per capita levels since 2008 and this is forecast to continue in 2017 (-0.2%) and 2018 (-0.9%). For the period 2019-2023 Experian forecast no growth in convenience goods expenditure, and a modest +0.1% per annum over the longer term, between 2023 and 2035. For comparison goods Experian forecast that a recovery in growth rates from a low of -3.1% in 2009, to a peak of +7.2% for 2014. However Experian forecast that growth will fall to +1.4% in 2017 and +1.0% in 2018. The average year-on-year growth for the period 2019-2023 is forecast to be +3%, increasing slightly to +3.2% between 2024 and 2035.
The survey-derived market shares for Special Forms of Trading (i.e. ‘non-store’ retail sales, including internet sales) have been deducted from the expenditure per capita figures at the outset. This is standard practice for retail capacity and impact assessments. As described in Section 3 (Table 3.2) Experian estimated that SFT in 2016 accounted for a 13.2% market share of comparison goods sales,
RETAIL AND LEISURE STUDY 2017 Page 103
and 3% for convenience goods (adjusted downwards to reflect the proportion of online sales sourced from traditional retail space).
An allowance for floorspace “productivity” growth (or “turnover efficiency”) in the retail sales densities of existing and committed retail (convenience and comparison goods) floorspace to 2036 has also been informed by Experian’s latest RPBN. As described in Section 3 (Table 3.4) Experian forecast annual average growth of around +2.2% for comparison goods between 2024-2036, and a nominal +0.1% growth for convenience goods.
12.6 It is important to restate that long-term forecasts should be treated with caution, as they will be influenced by
changes in economic, demographic and market trends. As a result we advise that greater weight should be
placed on the short term forecasts carried out over a five year period (see PPG, para 003). Notwithstanding
this, the Council will need to take account of the forecast capacity for new retail floorspace over the plan
period to inform its policy making and site allocations, as the NPPF (paragraph 23) states that local planning
authorities should meet the need for retail and town centre uses “in full” (see Section 2 of this study)
12.7 The updated capacity forecasts set out in this section are intended as a guide to enable the City Council to
assess the broad strategic options for the spatial distribution of new retail-led development over the plan
period, and make informed policy choices about where any forecast need should be met, in accordance with
the advice set out in the NPPF. It follows that the allocation of sites to meet any identified need over the next
five years, and over the lifetime of the development plan, will depend on a range of key considerations,
including the suitability, viability and availability of sites in or on the edge of existing centres, and the potential
to expand existing centres to accommodate the forecast needs.
12.8 The key steps in the retail capacity assessment, and the main assumptions and forecasts underpinning the
CREATe Model are described in more detail below.
Population and Expenditure Forecasts
Population Projections
12.9 To help inform the assessment of population growth over the forecast period we have assessed two different
scenarios for the defined study area:
Scenario 1 - Experian Growth Scenario including Extant Commitments: The population forecasts under this scenario are based on Experian’s ‘demographic component model’, which takes into account age, gender, birth rates, ageing, net migration and death rates based on ONS Sub-National Population Projections. However, these projections do not make an allowance for the impact of significant new policy-led housing and employment allocations at the local level.
Scenario 2 – County Population Projections and Commitments (including allocations): The population forecasts under this scenario are informed by the Oxford County Council’s initial assessment of the expected level of policy-led housing growth in the Oxford City Council area and surrounding authorities. These figures are an interim release and subject to change in the future. For the Oxford City Council area (Zones 1 and 2) these show an increase in population between 2017 and 2036 of +13.5% (22,281 persons), which is higher than Experian’s projected growth of +9.0% (14,376 persons) over the same period (Scenario 1). From the same source, and for the remainder of the zones (3 to 9), we have derived annual growth rate apportioned on the basis of the housing growth expected within the study area and applied it to the Experian population data. The projected increase in population between 2017 and 2036 across the study area is estimated to be +15.5% (84,113 persons), which is higher than Experian’s projected growth of +10.2% (54,831 persons). This scenario testing also incorporates the retail component of the Northern Gateway allocation detailed previously.
RETAIL AND LEISURE STUDY 2017 Page 104
Expenditure Per Capita and Special Forms of Trading (SFT)
12.10 Appendix 6 sets out the average expenditure per capita estimates for convenience goods (Table 1) and
comparison goods (Table 3) in 2016 for each of the study zones, after making an allowance for Special Forms
of Trading (SFT)31.
12.11 The base year average expenditure per capita figures have been derived from our in-house Experian MMG3
GIS and have been grown up to 2036 in line with the annual forecasts set out in Experian’s latest RPBN. As
described in Section 3 Experian forecast more limited year-on-year growth in convenience and comparison
goods expenditure than previous forecasts. It should be noted that these forecasts do not take account of the
(as yet unknown) impact of external factors, such as the potential future impact of Brexit on economic growth
and consumer spending.
12.12 Our allowance for SFT at the local level has been informed by the results of the household survey. The
survey-derived shares have necessarily been adjusted downwards to reflect the fact that a proportion of online
sales are still sourced from traditional stores rather than from dedicated (‘dotcom’) warehouses32. This is in
compliance with the advice set out in Experian’s latest RPBN. The adjusted market share analysis shows that
SFT’s current share of available expenditure in the total study area is 16.4% for comparison goods in 2016,
which is above the national average figure of 13.2% identified by Experian (for 2016). For convenience goods
the locally adjusted SFT market share is 2.0%, which is lower than the national average of 3.0% (in 2016).
Clearly if the growth in SFT is higher in the City Council area than the national projections, then this would
effectively reduce the total available expenditure to support existing and new floorspace over the forecast
period.
Total Available Expenditure
12.13 Tables 2 and 3 (Appendix 6) set out the total available retail expenditure for convenience and comparison
goods respectively in the Study Area and zones. This is derived by multiplying the population and average
expenditure per capita levels together. In summary the Scenario 1 expenditure forecasts indicate that:
Convenience Goods expenditure is forecast to increase by +8% (+£92.9m) within the Study Area, from £1,159.8m in 2017 to £1,252.7m by 2036. For the ‘Core’ Study Area (i.e. Zones 1 and 2) total expenditure is forecast to increase over the same period by +6.7% (£20.8m).
Comparison Goods expenditure is forecast to increase by +84.8% (£1,397.0m) within the Study Area, from £1,646.5m in 2017 to £3,043.5m by 2036. The forecast growth for the ‘Core’ Study Area is +82.3% (£338.4m).
12.14 The growth in available comparison goods expenditure significantly outstrips convenience goods spend up to
2036. This effectively means that there should be greater capacity potential for new comparison goods
floorspace over the forecast period than for convenience goods retailing; although this will be dependent on
the level of retail commitments in the pipeline and the forecast growth in the ‘productivity’ levels of existing
floorspace and stores.
31 SFT comprises non-store sales via the internet, mail order, stalls and markets, door-to-door and telephone sales.
32 Drawing on Experian’s latest research we have assumed that some 25% of SFT convenience goods sales and 70% of comparison goods sales are sourced from traditional (‘physical’) retail space.
RETAIL AND LEISURE STUDY 2017 Page 105
Market Share Analysis
12.15 Section 4 described the headline results of the survey-derived (%) market share analysis, including SFT. For
the purpose of the retail capacity assessment the market share analysis has been adjusted for both
convenience goods (Table 1, Appendix 9) and comparison goods (Table 1, Appendix 10) to exclude SFT33.
12.16 The next key stage in the capacity assessment involves allocating the baseline convenience and comparison
expenditure (£ million) within the Study Area and zones to the identified centres, stores and floorspace based
on the survey-derived market shares. This helps to establish the current ‘baseline’ (2016) trading performance
for the main centres and stores across the City Council area based on expenditure drawn from the Study Area
only (Table 2). It should be noted that no allowance is made at this stage for any potential “inflow” (trade
draw) of expenditure to centres and stores from outside the defined Study Area.
12.17 For both convenience and comparison goods the ‘baseline’ turnovers are projected forward to 2022 (Table 5),
2027 (Table 6), 2032 (Table 7) and 2036 (Table 8), assuming no changes in market shares. This ‘constant
market share approach’ is standard practice for retail capacity and impact assessments. However, the
Council will be aware that it is a highly theoretical in that it does not, for example, take account of the potential
impact of new retail investment and development (both within and outside the City Council area) on existing
shopping patterns and market shares over time.
‘Inflow’ (Trade Draw)
12.18 In order to provide a complete picture of the current trading (turnover) performance of the main centres and
stores in the City Council area we have necessarily made informed judgements with regard to the likely ‘inflow’
(trade draw) from outside the Study Area. In the absence of detailed published turnover and trade draw
information at the local level, our judgements have been informed by previous studies and retail assessments,
as well as the survey and health check evidence. The ’inflow‘ assumptions also take account of:
the scale, offer and location of all existing centres and stores in the City Council area;
the likely extent of their catchment areas;
the competition from centres, stores and shopping facilities outside the City Council area and the wider Study Area; and
the likely retail expenditure derived from people who live outside the Study Area (including visitors and commuters) to main centres and stores in the City Council area.
12.19 Although the assessment of ‘inflow’ is not a straightforward exercise, due to the complex nature of overlapping
catchments and shopping patterns, it is reasonable to assume that the City Council’s main centres will draw a
proportion of their turnovers from outside the widely defined study area. In this case we estimate that 20% of
Oxford City Centre’s total comparison turnover and 10% of its convenience turnover will be drawn from outside
the Study Area. We have also assumed that the out-of-centre Botley Road Retail Park and could draw 10%
and the both the Oxford Retail Park and Horspath Driftway Retail Park draw some 5% of their total comparison
goods turnover from outside the Study Area. This reflects the relative scale and quality of their retail offer. In
relation to the out-of-centre convenience provision in the centre we have assume a 5% “inflow”.
33 This is in accordance with the standard approach for retail assessments, which make a deduction for SFT at the outset from the expenditure per capita figures.
RETAIL AND LEISURE STUDY 2017 Page 106
12.20 Turning to the District Centres we have assumed that both Cowley Centre and Summertown will draw
approximately 10% of their total comparison turnover from outside the Study Area. This reflects the relative
scale and quality of their retail and wider offer, and also the positive impact of visitor/tourist expenditure on
their local economies and turnover. We have assumed more limited “inflow” for the other District Centres of
Headington (5%) and Cowley Road (5%), and no inflow for Blackbird Leys based on the critical mass of their
retail and wider offer. For convenience goods we have assumed a 5% ‘inflow’ of expenditure to all the District
(except Blackbird Leys) and Local Centres based on the reasonable assumption that food and convenience
stores in these smaller centres principally serve their local resident catchment populations, as households
generally choose to shop at their most convenient and accessible stores.
12.21 Based on the (survey-derived) market analysis and the ‘inflow’ assumptions, Table 1 sets out the revised
(survey-derived) ‘current’ turnover levels for convenience goods (Appendix 9) and comparison goods
(Appendix 10) for the City Council’s main centres and stores.
Retail Floorspace Commitments & Allocations
12.22 Section 2 sets out the major known commitments and policy-led floorspace allocations in the City Council
area. Based on the information provided by the Council, and our forecasts of the likely convenience goods and
comparison goods turnovers of the new floorspace based on the available evidence and our own judgements.
The following provides a brief overview of the major new retail floorspace commitments and allocations known
at the time of preparing this study (see the detailed footnotes to Table 1).
Oxford City - Westgate Quarter (ref: 13/02557/OUT): As described in Section 6 the 2014 permission allows for the demolition of the southern part of Westgate Centre. Based on the planning permission and evidence provided by the City Council we understand that the scheme will provide up to 81,922 sqm gross additional retail floorspace (Use Class A1); up to 26,712 sqm gross of additional A2 and/or A3 and/or A4 and/or A5 uses; and up to 5,986 sqm gross leisure uses (Use Class D2) provided at first and second floor levels. The mixed use scheme will be anchored by a 13,192 sqm flagship John Lewis department store. It will also provide space for around 100 shops, restaurants, cafés and leisure uses including a boutique 5-screen Curzon Cinema, set in a mix of covered streets, arcades, lanes and squares. The development is due to open in Autumn 2017.
Oxford City - Demolition of 4-5 Queen Street & rear of 114-119 St. Aldates (ref: 14/02256/FUL): The permission allows for the demolition of 4-5 Queen Street and rear of 114-119 St Aldates. It includes the renovation and alteration of remaining properties at 114-119 St. Aldates with roof extension, plus erection of new building to Queen St on five levels, plus basement. Additionally it involves the change of use from offices and retail to form two Class A1 retail units, and a further unit for Class A1-A3 at basement and ground floor levels. It also includes the provision of 133 student study rooms at upper levels, plus ancillary facilities at basement level and cycle parking for 110 cycles at ground floor level. We understand that the ground floor unit (308 sqm gross) is to be occupied by Sainsbury’s (and this unit was under construction at the time of writing this report). The remaining two units comprise 515 sqm gross and 130 sqm gross respectively for A1 use. The redevelopment of this site has now reached an advanced stage and should be complete by September / October 2017.
Barton – Land West of Barton North (A40) & South of Bayswater Brook Oxford (ref: 13/01383/OUT): The permission allows for the erection of a maximum of 885 residential units (Class C3); a maximum of 2,500 sqm gross Class A1-A5 uses (and a maximum of 50 extra car parking spaces). We have been informed by the Council that the proposal will include a class A1 foodstore with a maximum floorspace of a maximum of 2,000 sqm gross (this foodstore has been incorporated in to our capacity assessment).
RETAIL AND LEISURE STUDY 2017 Page 107
Horspath Driftway Retail Park (ref: 14/02256/FUL): This former Currys unit was recently acquired by Aldi and the plans include the erection of a two-storey side extension and first floor front extension; installation of new shop front; and re-configuration of the car park to accommodate a new Aldi store.
Northern Gateway Allocation: As described in Section 2, under Policy CS6 (‘Northern Gateway’) the site is allocated for major employment-led development. The Northern Gateway AAP (2015) supports the delivery of the site, and guides future development. Policy NG2 'Mix of uses' specifically states that planning permission will be granted at the Northern Gateway for up to 90,000 sqm (gross internal area) of employment development; up to 500 new homes; a range of local scale retail uses (up to a total of 2,500 sq m gross internal area); and a hotel with associated leisure facilities (up to 180 bedrooms). Within our capacity assessment, under Scenario 2, we have necessarily assumed that the allocated floorspace of 2,500 sqm is primarily going to be convenience floorspace (2,000 sqm gross), supported by some ancillary comparison goods (500 sqm gross).
12.23 In summary, we forecast that all the known retail commitments at the time of preparing this study will achieve
a total convenience goods turnover of £13.2m in 2022, increasing to £13.4m by 2036, based on Experian’s
‘productivity’ growth rate for existing and new retail floorspace (Appendix 11). We also forecast that all the
major comparison goods floorspace commitments will achieve a total combined turnover of £345.7m in 2022,
increasing to £385.8m by 2027 and £469.3m by 2036 (Appendix 15).
12.24 In terms of the Northern Gateway allocation we forecast that the assumed non-food retail floorspace could
achieve a potential total turnover of £1.6m in 2022, increasing to £2.2m by 2036 (under Scenario 2). We also
forecast that the convenience component of the Northern Gateway allocation could achieve a total a turnover
of £7.2m in 2022, increasing to £7.3m by 2036 (Scenario 2).
12.25 This would produce a total combined comparison goods turnover for all commitments and allocations of
£347.3m in 2022, increasing to £471.5m by 2036 (see Table 2, Appendix 14). For convenience goods the
total combined convenience turnover is forecast to be £20.5m in 2022, increasing to £20.7m by 2036 (see
Table 2, Appendix 13).
Oxford City Council Area: Capacity Forecasts
12.26 The ‘global’ capacity forecasts for new retail floorspace in the City Council area up to 2036 are set out in Table
3 for convenience goods (Appendix 11) and comparison goods (Appendix 12).
12.27 It is assumed for the purpose of the capacity assessment that the City Council’s retail market is in ‘equilibrium’
at the base year. In other words all existing centres and stores in the City Council area are broadly assumed to
be trading in line with ‘benchmark’ turnover levels at the base year. We consider that this approach is
reasonable, robust and realistic in this case. For example, it is supported by the findings of the centre audits
and site visits which did not show any strong indication of ‘overtrading’34 in the main town centres and free-
standing stores. This approach also reflects the impact of the economic recession and the growth in internet
sales, which has reduced trading levels across the UK. It also reflects the potential impact of Brexit on the
economy and retail sector going forward. On this basis any residual expenditure available to support new
retail floorspace over the development plan period will be derived from the difference between the forecast
34 Overtrading normally manifests itself at the local level in terms of pedestrian and car park congestion, long queues at checkouts, congestion in aisles, etc.
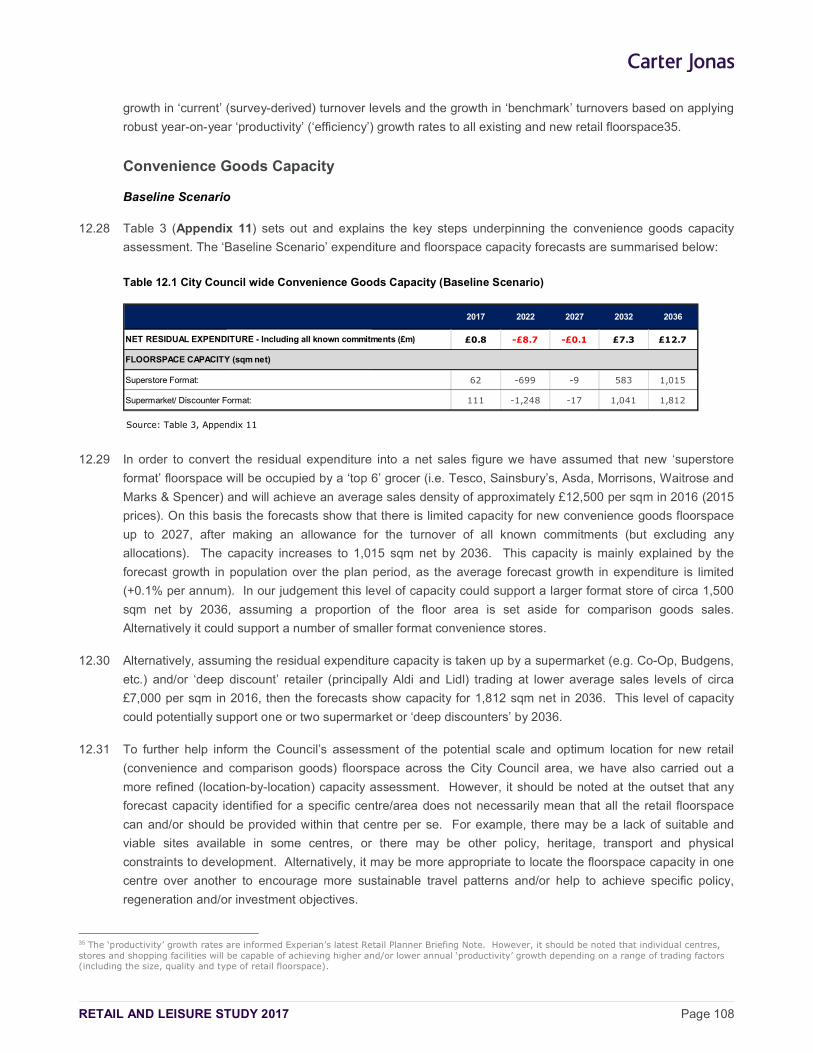
RETAIL AND LEISURE STUDY 2017 Page 108
growth in ‘current’ (survey-derived) turnover levels and the growth in ‘benchmark’ turnovers based on applying
robust year-on-year ‘productivity’ (‘efficiency’) growth rates to all existing and new retail floorspace35.
Convenience Goods Capacity
Baseline Scenario
12.28 Table 3 (Appendix 11) sets out and explains the key steps underpinning the convenience goods capacity
assessment. The ‘Baseline Scenario’ expenditure and floorspace capacity forecasts are summarised below:
Table 12.1 City Council wide Convenience Goods Capacity (Baseline Scenario)
2017 2022 2027 2032 2036
NET RESIDUAL EXPENDITURE - Including all known commitments (£m) £0.8 -£8.7 -£0.1 £7.3 £12.7
FLOORSPACE CAPACITY (sqm net)
Superstore Format: 62 -699 -9 583 1,015
Supermarket/ Discounter Format: 111 -1,248 -17 1,041 1,812
Source: Table 3, Appendix 11
12.29 In order to convert the residual expenditure into a net sales figure we have assumed that new ‘superstore
format’ floorspace will be occupied by a ‘top 6’ grocer (i.e. Tesco, Sainsbury’s, Asda, Morrisons, Waitrose and
Marks & Spencer) and will achieve an average sales density of approximately £12,500 per sqm in 2016 (2015
prices). On this basis the forecasts show that there is limited capacity for new convenience goods floorspace
up to 2027, after making an allowance for the turnover of all known commitments (but excluding any
allocations). The capacity increases to 1,015 sqm net by 2036. This capacity is mainly explained by the
forecast growth in population over the plan period, as the average forecast growth in expenditure is limited
(+0.1% per annum). In our judgement this level of capacity could support a larger format store of circa 1,500
sqm net by 2036, assuming a proportion of the floor area is set aside for comparison goods sales.
Alternatively it could support a number of smaller format convenience stores.
12.30 Alternatively, assuming the residual expenditure capacity is taken up by a supermarket (e.g. Co-Op, Budgens,
etc.) and/or ‘deep discount’ retailer (principally Aldi and Lidl) trading at lower average sales levels of circa
£7,000 per sqm in 2016, then the forecasts show capacity for 1,812 sqm net in 2036. This level of capacity
could potentially support one or two supermarket or ‘deep discounters’ by 2036.
12.31 To further help inform the Council’s assessment of the potential scale and optimum location for new retail
(convenience and comparison goods) floorspace across the City Council area, we have also carried out a
more refined (location-by-location) capacity assessment. However, it should be noted at the outset that any
forecast capacity identified for a specific centre/area does not necessarily mean that all the retail floorspace
can and/or should be provided within that centre per se. For example, there may be a lack of suitable and
viable sites available in some centres, or there may be other policy, heritage, transport and physical
constraints to development. Alternatively, it may be more appropriate to locate the floorspace capacity in one
centre over another to encourage more sustainable travel patterns and/or help to achieve specific policy,
regeneration and/or investment objectives.
35 The ‘productivity’ growth rates are informed Experian’s latest Retail Planner Briefing Note. However, it should be noted that individual centres, stores and shopping facilities will be capable of achieving higher and/or lower annual ‘productivity’ growth depending on a range of trading factors (including the size, quality and type of retail floorspace).
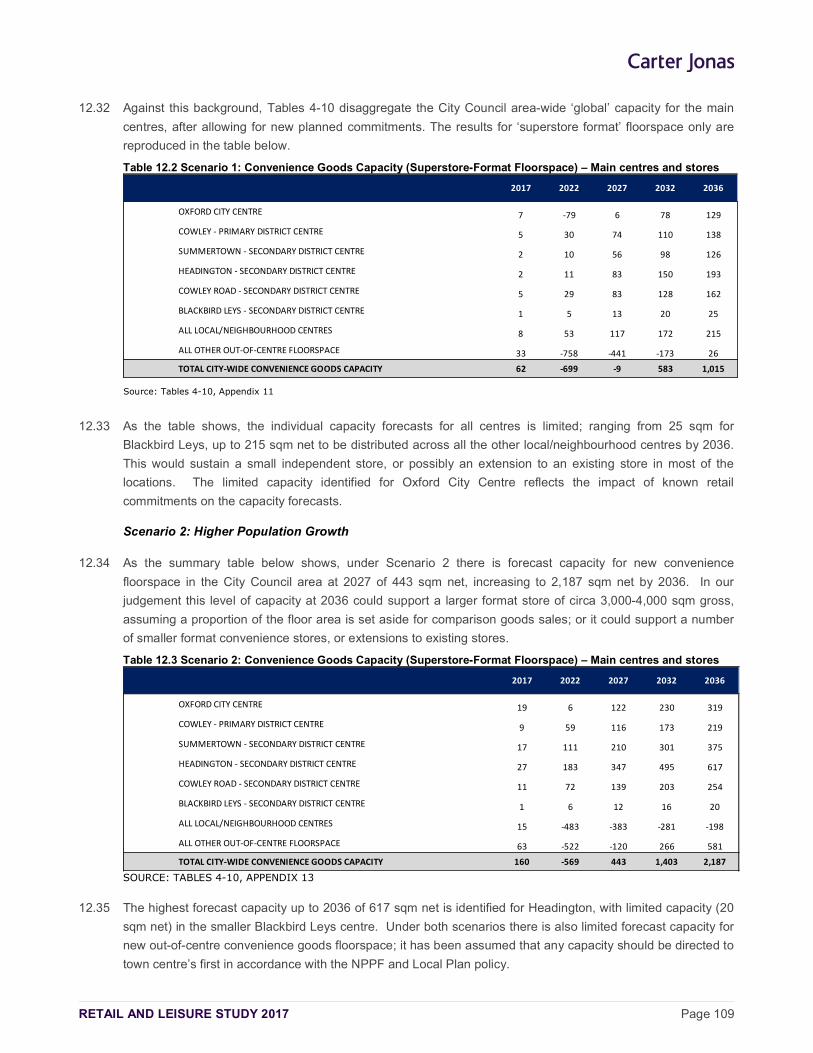
RETAIL AND LEISURE STUDY 2017 Page 109
12.32 Against this background, Tables 4-10 disaggregate the City Council area-wide ‘global’ capacity for the main
centres, after allowing for new planned commitments. The results for ‘superstore format’ floorspace only are
reproduced in the table below.
Table 12.2 Scenario 1: Convenience Goods Capacity (Superstore-Format Floorspace) – Main centres and stores
2017 2022 2027 2032 2036
OXFORD CITY CENTRE 7 -79 6 78 129
COWLEY - PRIMARY DISTRICT CENTRE 5 30 74 110 138
SUMMERTOWN - SECONDARY DISTRICT CENTRE 2 10 56 98 126
HEADINGTON - SECONDARY DISTRICT CENTRE 2 11 83 150 193
COWLEY ROAD - SECONDARY DISTRICT CENTRE 5 29 83 128 162
BLACKBIRD LEYS - SECONDARY DISTRICT CENTRE 1 5 13 20 25
ALL LOCAL/NEIGHBOURHOOD CENTRES 8 53 117 172 215
ALL OTHER OUT-OF-CENTRE FLOORSPACE 33 -758 -441 -173 26
TOTAL CITY-WIDE CONVENIENCE GOODS CAPACITY 62 -699 -9 583 1,015
Source: Tables 4-10, Appendix 11
12.33 As the table shows, the individual capacity forecasts for all centres is limited; ranging from 25 sqm for
Blackbird Leys, up to 215 sqm net to be distributed across all the other local/neighbourhood centres by 2036.
This would sustain a small independent store, or possibly an extension to an existing store in most of the
locations. The limited capacity identified for Oxford City Centre reflects the impact of known retail
commitments on the capacity forecasts.
Scenario 2: Higher Population Growth
12.34 As the summary table below shows, under Scenario 2 there is forecast capacity for new convenience
floorspace in the City Council area at 2027 of 443 sqm net, increasing to 2,187 sqm net by 2036. In our
judgement this level of capacity at 2036 could support a larger format store of circa 3,000-4,000 sqm gross,
assuming a proportion of the floor area is set aside for comparison goods sales; or it could support a number
of smaller format convenience stores, or extensions to existing stores.
Table 12.3 Scenario 2: Convenience Goods Capacity (Superstore-Format Floorspace) – Main centres and stores
2017 2022 2027 2032 2036
OXFORD CITY CENTRE 19 6 122 230 319
COWLEY - PRIMARY DISTRICT CENTRE 9 59 116 173 219
SUMMERTOWN - SECONDARY DISTRICT CENTRE 17 111 210 301 375
HEADINGTON - SECONDARY DISTRICT CENTRE 27 183 347 495 617
COWLEY ROAD - SECONDARY DISTRICT CENTRE 11 72 139 203 254
BLACKBIRD LEYS - SECONDARY DISTRICT CENTRE 1 6 12 16 20
ALL LOCAL/NEIGHBOURHOOD CENTRES 15 -483 -383 -281 -198
ALL OTHER OUT-OF-CENTRE FLOORSPACE 63 -522 -120 266 581
TOTAL CITY-WIDE CONVENIENCE GOODS CAPACITY 160 -569 443 1,403 2,187
SOURCE: TABLES 4-10, APPENDIX 13
12.35 The highest forecast capacity up to 2036 of 617 sqm net is identified for Headington, with limited capacity (20
sqm net) in the smaller Blackbird Leys centre. Under both scenarios there is also limited forecast capacity for
new out-of-centre convenience goods floorspace; it has been assumed that any capacity should be directed to
town centre’s first in accordance with the NPPF and Local Plan policy.
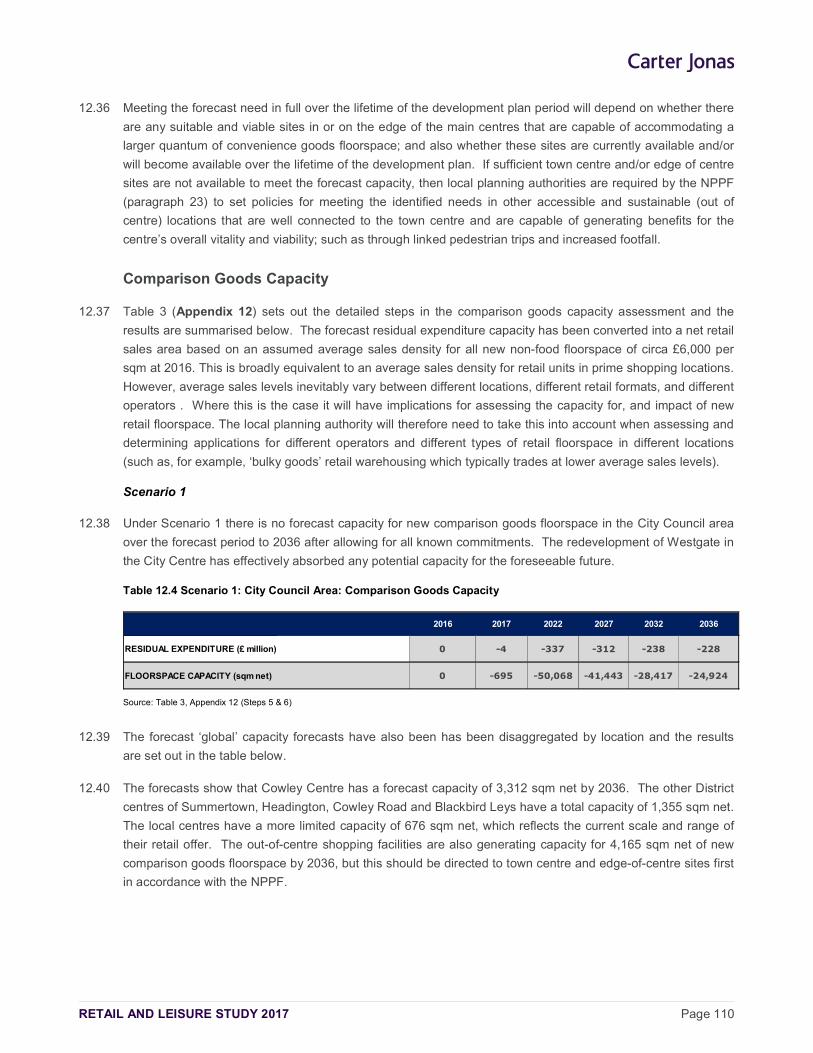
RETAIL AND LEISURE STUDY 2017 Page 110
12.36 Meeting the forecast need in full over the lifetime of the development plan period will depend on whether there
are any suitable and viable sites in or on the edge of the main centres that are capable of accommodating a
larger quantum of convenience goods floorspace; and also whether these sites are currently available and/or
will become available over the lifetime of the development plan. If sufficient town centre and/or edge of centre
sites are not available to meet the forecast capacity, then local planning authorities are required by the NPPF
(paragraph 23) to set policies for meeting the identified needs in other accessible and sustainable (out of
centre) locations that are well connected to the town centre and are capable of generating benefits for the
centre’s overall vitality and viability; such as through linked pedestrian trips and increased footfall.
Comparison Goods Capacity
12.37 Table 3 (Appendix 12) sets out the detailed steps in the comparison goods capacity assessment and the
results are summarised below. The forecast residual expenditure capacity has been converted into a net retail
sales area based on an assumed average sales density for all new non-food floorspace of circa £6,000 per
sqm at 2016. This is broadly equivalent to an average sales density for retail units in prime shopping locations.
However, average sales levels inevitably vary between different locations, different retail formats, and different
operators . Where this is the case it will have implications for assessing the capacity for, and impact of new
retail floorspace. The local planning authority will therefore need to take this into account when assessing and
determining applications for different operators and different types of retail floorspace in different locations
(such as, for example, ‘bulky goods’ retail warehousing which typically trades at lower average sales levels).
Scenario 1
12.38 Under Scenario 1 there is no forecast capacity for new comparison goods floorspace in the City Council area
over the forecast period to 2036 after allowing for all known commitments. The redevelopment of Westgate in
the City Centre has effectively absorbed any potential capacity for the foreseeable future.
Table 12.4 Scenario 1: City Council Area: Comparison Goods Capacity
2016 2017 2022 2027 2032 2036
RESIDUAL EXPENDITURE (£ million) 0 -4 -337 -312 -238 -228
FLOORSPACE CAPACITY (sqm net) 0 -695 -50,068 -41,443 -28,417 -24,924
Source: Table 3, Appendix 12 (Steps 5 & 6)
12.39 The forecast ‘global’ capacity forecasts have also been has been disaggregated by location and the results
are set out in the table below.
12.40 The forecasts show that Cowley Centre has a forecast capacity of 3,312 sqm net by 2036. The other District
centres of Summertown, Headington, Cowley Road and Blackbird Leys have a total capacity of 1,355 sqm net.
The local centres have a more limited capacity of 676 sqm net, which reflects the current scale and range of
their retail offer. The out-of-centre shopping facilities are also generating capacity for 4,165 sqm net of new
comparison goods floorspace by 2036, but this should be directed to town centre and edge-of-centre sites first
in accordance with the NPPF.
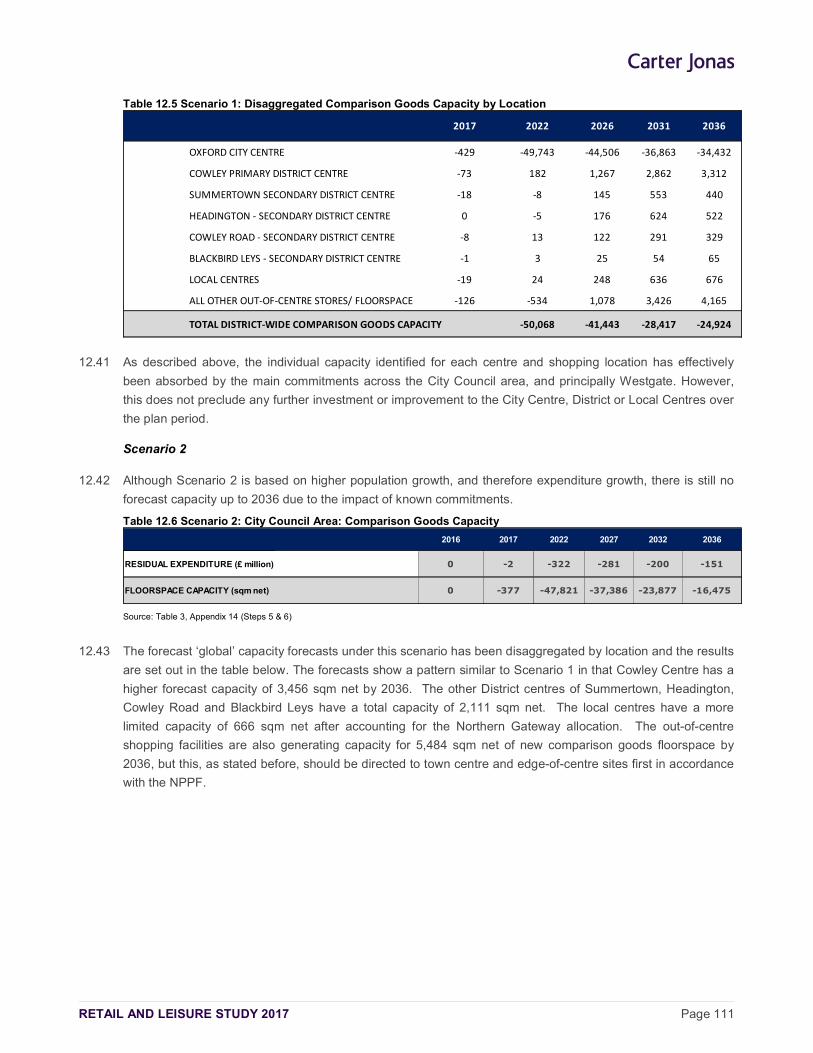
RETAIL AND LEISURE STUDY 2017 Page 111
Table 12.5 Scenario 1: Disaggregated Comparison Goods Capacity by Location
2017 2022 2026 2031 2036
OXFORD CITY CENTRE -429 -49,743 -44,506 -36,863 -34,432
COWLEY PRIMARY DISTRICT CENTRE -73 182 1,267 2,862 3,312
SUMMERTOWN SECONDARY DISTRICT CENTRE -18 -8 145 553 440
HEADINGTON - SECONDARY DISTRICT CENTRE 0 -5 176 624 522
COWLEY ROAD - SECONDARY DISTRICT CENTRE -8 13 122 291 329
BLACKBIRD LEYS - SECONDARY DISTRICT CENTRE -1 3 25 54 65
LOCAL CENTRES -19 24 248 636 676
ALL OTHER OUT-OF-CENTRE STORES/ FLOORSPACE -126 -534 1,078 3,426 4,165
TOTAL DISTRICT-WIDE COMPARISON GOODS CAPACITY -50,068 -41,443 -28,417 -24,924
12.41 As described above, the individual capacity identified for each centre and shopping location has effectively
been absorbed by the main commitments across the City Council area, and principally Westgate. However,
this does not preclude any further investment or improvement to the City Centre, District or Local Centres over
the plan period.
Scenario 2
12.42 Although Scenario 2 is based on higher population growth, and therefore expenditure growth, there is still no
forecast capacity up to 2036 due to the impact of known commitments.
Table 12.6 Scenario 2: City Council Area: Comparison Goods Capacity
2016 2017 2022 2027 2032 2036
RESIDUAL EXPENDITURE (£ million) 0 -2 -322 -281 -200 -151
FLOORSPACE CAPACITY (sqm net) 0 -377 -47,821 -37,386 -23,877 -16,475
Source: Table 3, Appendix 14 (Steps 5 & 6)
12.43 The forecast ‘global’ capacity forecasts under this scenario has been disaggregated by location and the results
are set out in the table below. The forecasts show a pattern similar to Scenario 1 in that Cowley Centre has a
higher forecast capacity of 3,456 sqm net by 2036. The other District centres of Summertown, Headington,
Cowley Road and Blackbird Leys have a total capacity of 2,111 sqm net. The local centres have a more
limited capacity of 666 sqm net after accounting for the Northern Gateway allocation. The out-of-centre
shopping facilities are also generating capacity for 5,484 sqm net of new comparison goods floorspace by
2036, but this, as stated before, should be directed to town centre and edge-of-centre sites first in accordance
with the NPPF.
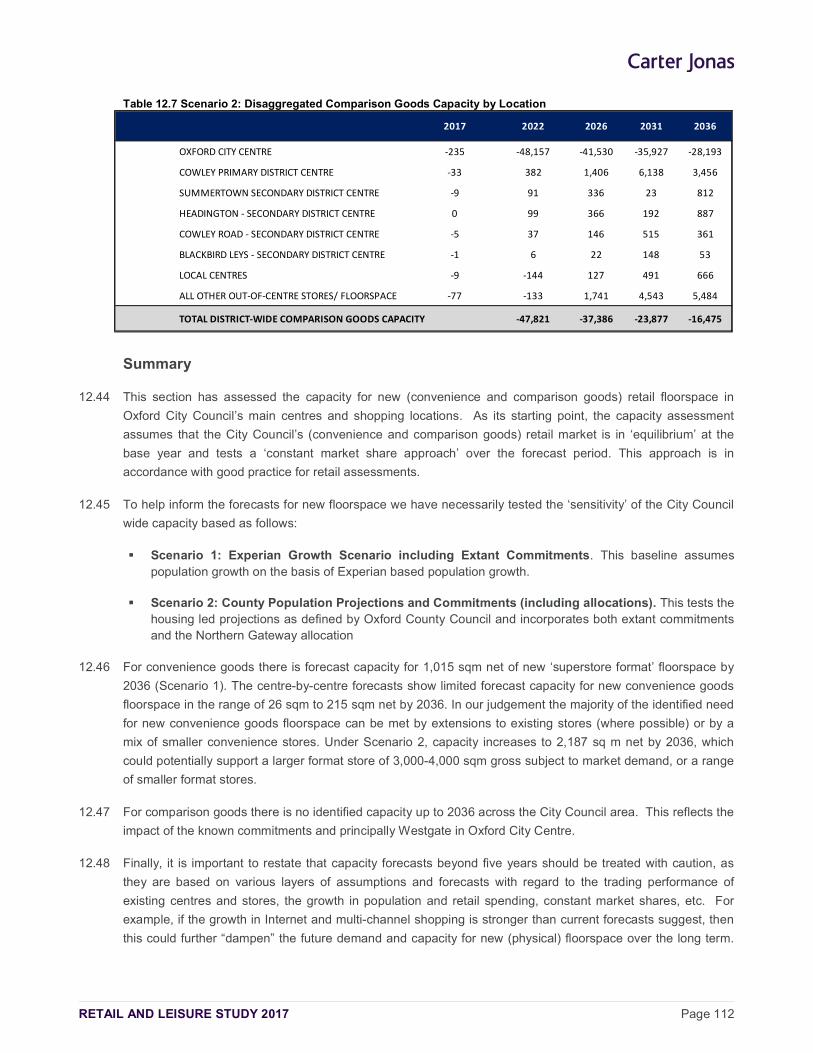
RETAIL AND LEISURE STUDY 2017 Page 112
Table 12.7 Scenario 2: Disaggregated Comparison Goods Capacity by Location
2017 2022 2026 2031 2036
OXFORD CITY CENTRE -235 -48,157 -41,530 -35,927 -28,193
COWLEY PRIMARY DISTRICT CENTRE -33 382 1,406 6,138 3,456
SUMMERTOWN SECONDARY DISTRICT CENTRE -9 91 336 23 812
HEADINGTON - SECONDARY DISTRICT CENTRE 0 99 366 192 887
COWLEY ROAD - SECONDARY DISTRICT CENTRE -5 37 146 515 361
BLACKBIRD LEYS - SECONDARY DISTRICT CENTRE -1 6 22 148 53
LOCAL CENTRES -9 -144 127 491 666
ALL OTHER OUT-OF-CENTRE STORES/ FLOORSPACE -77 -133 1,741 4,543 5,484
TOTAL DISTRICT-WIDE COMPARISON GOODS CAPACITY -47,821 -37,386 -23,877 -16,475
Summary
12.44 This section has assessed the capacity for new (convenience and comparison goods) retail floorspace in
Oxford City Council’s main centres and shopping locations. As its starting point, the capacity assessment
assumes that the City Council’s (convenience and comparison goods) retail market is in ‘equilibrium’ at the
base year and tests a ‘constant market share approach’ over the forecast period. This approach is in
accordance with good practice for retail assessments.
12.45 To help inform the forecasts for new floorspace we have necessarily tested the ‘sensitivity’ of the City Council
wide capacity based as follows:
Scenario 1: Experian Growth Scenario including Extant Commitments. This baseline assumes population growth on the basis of Experian based population growth.
Scenario 2: County Population Projections and Commitments (including allocations). This tests the housing led projections as defined by Oxford County Council and incorporates both extant commitments and the Northern Gateway allocation
12.46 For convenience goods there is forecast capacity for 1,015 sqm net of new ‘superstore format’ floorspace by
2036 (Scenario 1). The centre-by-centre forecasts show limited forecast capacity for new convenience goods
floorspace in the range of 26 sqm to 215 sqm net by 2036. In our judgement the majority of the identified need
for new convenience goods floorspace can be met by extensions to existing stores (where possible) or by a
mix of smaller convenience stores. Under Scenario 2, capacity increases to 2,187 sq m net by 2036, which
could potentially support a larger format store of 3,000-4,000 sqm gross subject to market demand, or a range
of smaller format stores.
12.47 For comparison goods there is no identified capacity up to 2036 across the City Council area. This reflects the
impact of the known commitments and principally Westgate in Oxford City Centre.
12.48 Finally, it is important to restate that capacity forecasts beyond five years should be treated with caution, as
they are based on various layers of assumptions and forecasts with regard to the trading performance of
existing centres and stores, the growth in population and retail spending, constant market shares, etc. For
example, if the growth in Internet and multi-channel shopping is stronger than current forecasts suggest, then
this could further “dampen” the future demand and capacity for new (physical) floorspace over the long term.

RETAIL AND LEISURE STUDY 2017 Page 113
The Council should therefore take into account these margins for error when assessing the need for new retail
floorspace over the medium to long term.
RETAIL AND LEISURE STUDY 2017 Page 114
13 COMMERCIAL LEISURE NEED / ‘GAP’ ASSESSMENT
13.1 The NPPF (paragraph 23) states that in drawing up Local Plans to ensure the vitality of town centres, local
planning authorities should promote competitive town centres that provide customer choice and a diverse
retail offer and which reflect the individuality of town centres. Against this background leisure uses can make a
significant contribution to a town centre's vitality and viability. A good provision and choice of leisure facilities
and uses can help to increase 'dwell times', footfall and turnover in centres, with significant benefits for both
daytime and evening economies. However, forecasting the need for new commercial leisure uses is more
complicated and problematic than for retailing, as the sector is highly complex and dynamic, and particularly
sensitive to changes in economic, demographic, lifestyle and fashion trends. Consequently, the methods and
approaches developed to forecast the need for new commercial leisure floorspace and uses are more wide-
ranging and less sophisticated than for retail capacity forecasts.
13.2 The NPPF recommends that need assessments for new leisure uses and floorspace should take account of
both quantitative and qualitative considerations (paragraph 161). In this context our analysis focuses on the
following key elements:
a review of the key trends driving market demand in the sector over the last 10-15 years;
an audit of existing commercial leisure uses in the City Council area to help identify any marked ‘gaps’ in provision;
a review of the results of the household survey to understand current commercial leisure participation rates and preferences across the City Council area; and
a broad economic assessment of the need for new additional leisure facilities across the main centres based on different datasets and accepted approaches.
13.3 For the purpose of our assessment we have necessarily focussed on the main commercial leisure uses that
are widely accepted as making a significant contribution to the overall vitality and viability of town centres;
namely food and beverage uses (Class A3-A5), cinemas and health clubs and gyms, and to a lesser extent
ten-pin bowling, casinos and bingo halls.
13.4 Detailed tables on forecast commercial leisure capacity, including projections on expenditure and need are set
out below.
Leisure Expenditure Growth
13.5 Like the retail market, the commercial leisure sector has experienced significant growth in consumer and
market demand since the mid-1990s; fuelled by a buoyant economy, growing disposable income and low
unemployment levels. Although the leisure sector has not been immune to the impact of the recent economic
downturn, leisure activities remain an important lifestyle choice for many consumers who are prioritising
leisure over other areas of spending. The table below shows the UK average expenditure per head on
commercial leisure services36 and the average for the defined Study Area based on Experian data. It shows
36 Excludes expenditure on education, insurance, social protection, and ‘other leisure’ as identified by Experian.
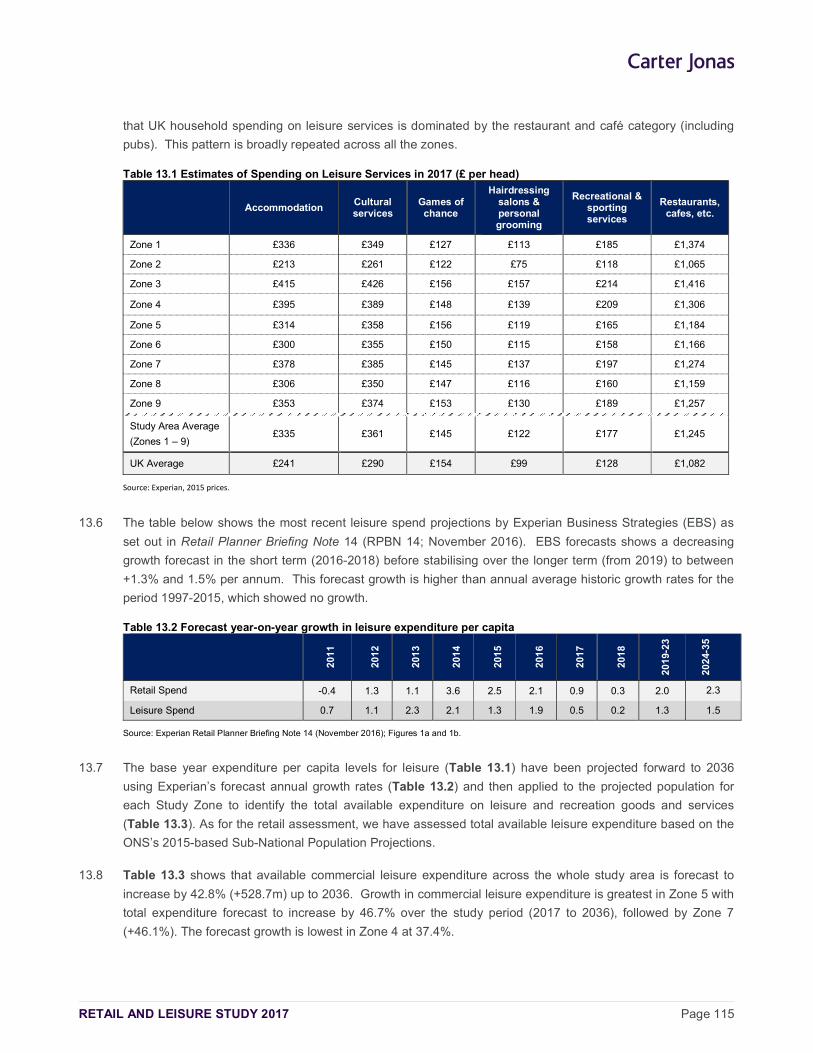
RETAIL AND LEISURE STUDY 2017 Page 115
that UK household spending on leisure services is dominated by the restaurant and café category (including
pubs). This pattern is broadly repeated across all the zones.
Table 13.1 Estimates of Spending on Leisure Services in 2017 (£ per head)
Accommodation Cultural services
Games of chance
Hairdressing salons & personal grooming
Recreational & sporting services
Restaurants, cafes, etc.
Zone 1 £336 £349 £127 £113 £185 £1,374
Zone 2 £213 £261 £122 £75 £118 £1,065
Zone 3 £415 £426 £156 £157 £214 £1,416
Zone 4 £395 £389 £148 £139 £209 £1,306
Zone 5 £314 £358 £156 £119 £165 £1,184
Zone 6 £300 £355 £150 £115 £158 £1,166
Zone 7 £378 £385 £145 £137 £197 £1,274
Zone 8 £306 £350 £147 £116 £160 £1,159
Zone 9 £353 £374 £153 £130 £189 £1,257
Study Area Average
(Zones 1 – 9) £335 £361 £145 £122 £177 £1,245
UK Average £241 £290 £154 £99 £128 £1,082
Source: Experian, 2015 prices.
13.6 The table below shows the most recent leisure spend projections by Experian Business Strategies (EBS) as
set out in Retail Planner Briefing Note 14 (RPBN 14; November 2016). EBS forecasts shows a decreasing
growth forecast in the short term (2016-2018) before stabilising over the longer term (from 2019) to between
+1.3% and 1.5% per annum. This forecast growth is higher than annual average historic growth rates for the
period 1997-2015, which showed no growth.
Table 13.2 Forecast year-on-year growth in leisure expenditure per capita
201
1
201
2
201
3
201
4
201
5
201
6
201
7
201
8
201
9-23
202
4-35
Retail Spend -0.4 1.3 1.1 3.6 2.5 2.1 0.9 0.3 2.0 2.3
Leisure Spend 0.7 1.1 2.3 2.1 1.3 1.9 0.5 0.2 1.3 1.5
Source: Experian Retail Planner Briefing Note 14 (November 2016); Figures 1a and 1b.
13.7 The base year expenditure per capita levels for leisure (Table 13.1) have been projected forward to 2036
using Experian’s forecast annual growth rates (Table 13.2) and then applied to the projected population for
each Study Zone to identify the total available expenditure on leisure and recreation goods and services
(Table 13.3). As for the retail assessment, we have assessed total available leisure expenditure based on the
ONS’s 2015-based Sub-National Population Projections.
13.8 Table 13.3 shows that available commercial leisure expenditure across the whole study area is forecast to
increase by 42.8% (+528.7m) up to 2036. Growth in commercial leisure expenditure is greatest in Zone 5 with
total expenditure forecast to increase by 46.7% over the study period (2017 to 2036), followed by Zone 7
(+46.1%). The forecast growth is lowest in Zone 4 at 37.4%.
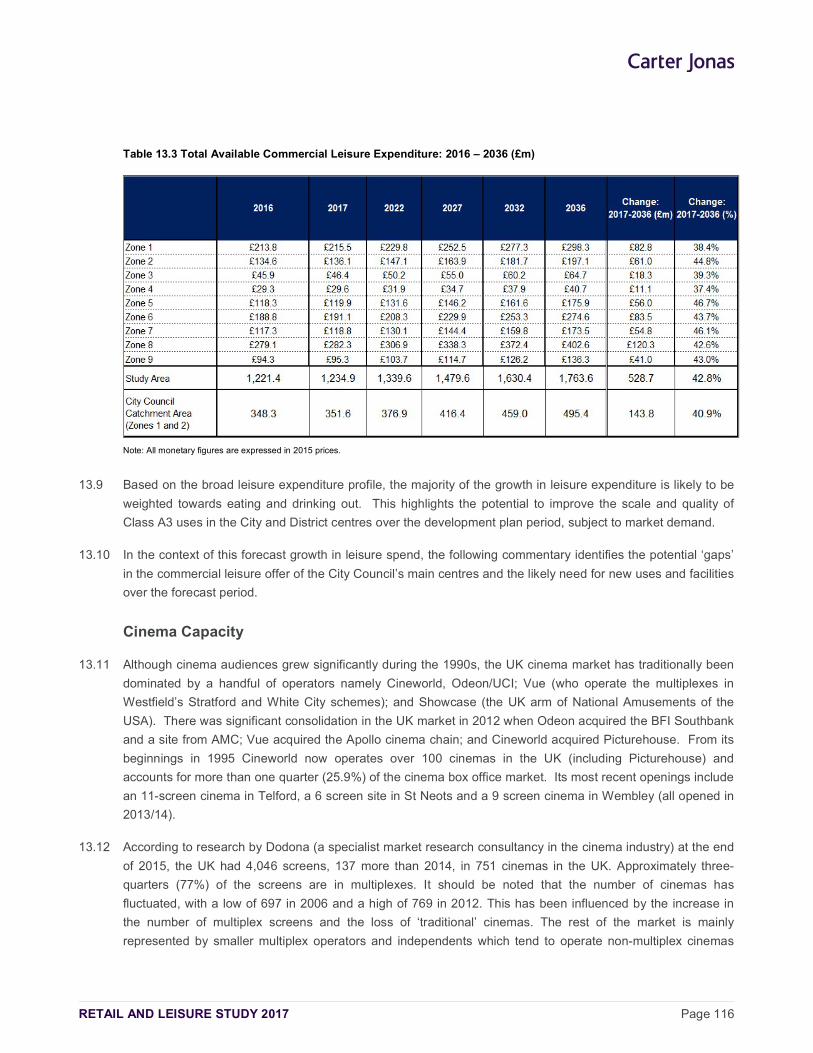
RETAIL AND LEISURE STUDY 2017 Page 116
Table 13.3 Total Available Commercial Leisure Expenditure: 2016 – 2036 (£m)
Note: All monetary figures are expressed in 2015 prices.
13.9 Based on the broad leisure expenditure profile, the majority of the growth in leisure expenditure is likely to be
weighted towards eating and drinking out. This highlights the potential to improve the scale and quality of
Class A3 uses in the City and District centres over the development plan period, subject to market demand.
13.10 In the context of this forecast growth in leisure spend, the following commentary identifies the potential ‘gaps’
in the commercial leisure offer of the City Council’s main centres and the likely need for new uses and facilities
over the forecast period.
Cinema Capacity
13.11 Although cinema audiences grew significantly during the 1990s, the UK cinema market has traditionally been
dominated by a handful of operators namely Cineworld, Odeon/UCI; Vue (who operate the multiplexes in
Westfield’s Stratford and White City schemes); and Showcase (the UK arm of National Amusements of the
USA). There was significant consolidation in the UK market in 2012 when Odeon acquired the BFI Southbank
and a site from AMC; Vue acquired the Apollo cinema chain; and Cineworld acquired Picturehouse. From its
beginnings in 1995 Cineworld now operates over 100 cinemas in the UK (including Picturehouse) and
accounts for more than one quarter (25.9%) of the cinema box office market. Its most recent openings include
an 11-screen cinema in Telford, a 6 screen site in St Neots and a 9 screen cinema in Wembley (all opened in
2013/14).
13.12 According to research by Dodona (a specialist market research consultancy in the cinema industry) at the end
of 2015, the UK had 4,046 screens, 137 more than 2014, in 751 cinemas in the UK. Approximately three-
quarters (77%) of the screens are in multiplexes. It should be noted that the number of cinemas has
fluctuated, with a low of 697 in 2006 and a high of 769 in 2012. This has been influenced by the increase in
the number of multiplex screens and the loss of ‘traditional’ cinemas. The rest of the market is mainly
represented by smaller multiplex operators and independents which tend to operate non-multiplex cinemas
RETAIL AND LEISURE STUDY 2017 Page 117
(i.e. less than six screens) and screens in mixed-use venues (such as arts centres); including The Light,
Curzon and Everyman cinemas.
13.13 The cinema industry has not been immune from the recession and there have been some closures since
2008, although the majority have been smaller art centre venues rather than the larger chains.
Notwithstanding this, the industry generally appears to be in good health and the UK is the second largest
consumer market for filmed entertainment in the world after the USA. The latest research shows that box
office revenue in 2015 in the UK exceeded £1bn for the fifth year in succession, based on 171.5m admissions.
Overall the cinema sector has remained relatively resilient in the prevailing economic and consumer
environment.
13.14 In recent years, cinema operators have also introduced changes to the cinema experience, including premium
seating areas and better quality refreshments, such as alcohol and higher quality food. For example, Vue
Cinemas introduced their ‘Evolution’ concept which provides a mix of seating types comprising bean bags and
sofas, as well as regular seats. Cineworld has also introduced the ‘Screening Room’ concept, characterised by
leather chairs and table service. The first 558 sqm ‘Screening Room’ cinema opened in June 2011; in the
Brewery, Cheltenham.
13.15 There has also been a growth in smaller (Digital) cinemas to serve smaller catchment areas. These Digital
cinemas are more flexible and less “space-hungry” as they do not require the large sloping auditoriums
needed to accommodate traditional projectors. There are therefore opportunities for the modern cinema offer
to be provided in existing buildings. Examples include the HMV in Wimbledon which has a small Curzon
cinema above the store.
13.16 Turning to cinema provision in the Oxford City Council area the main operators are:
Odeon – which operates two cinemas on George Street and Magdalan Street, Oxford;
Phoenix Picturehouse - Oxford
The Ultimate Picture Palace - Cowley Road
Vue - Ozone Leisure Park, Oxford
13.17 In addition to the above, the proposed Westgate redevelopment in the City Centre will have a five screen
Curzon cinema.
13.18 The household survey shows that some 16.9% of respondents visited a cinema as a leisure attraction from
Zones 1 and 2 – the Core Catchment Area (CCA). Across the wider study area, the survey results show that
respondents are most likely to visit the nearest cinema venue to where they live. For example, Cineworld in
Didcot is the most popular cinema across the study area (22.1%); and is more popular with those who live in
Zones 8 and 9. The Vue Cinema at the Ozone Leisure Park is the second most popular; attracting 21.4% of
respondents from across the study area, but mainly those living in Zones 1 to 4.
13.19 The survey results show that cinemas within the City Council area retain a market share of 39.9% from within
the wider study area. This retention level increases considerably within the CCA (Zones 1 and 2); for example
The Vue Cinema at Ozone Leisure Park achieves a market share of 49%, followed by 25% for the Phoenix
Picturehouse.
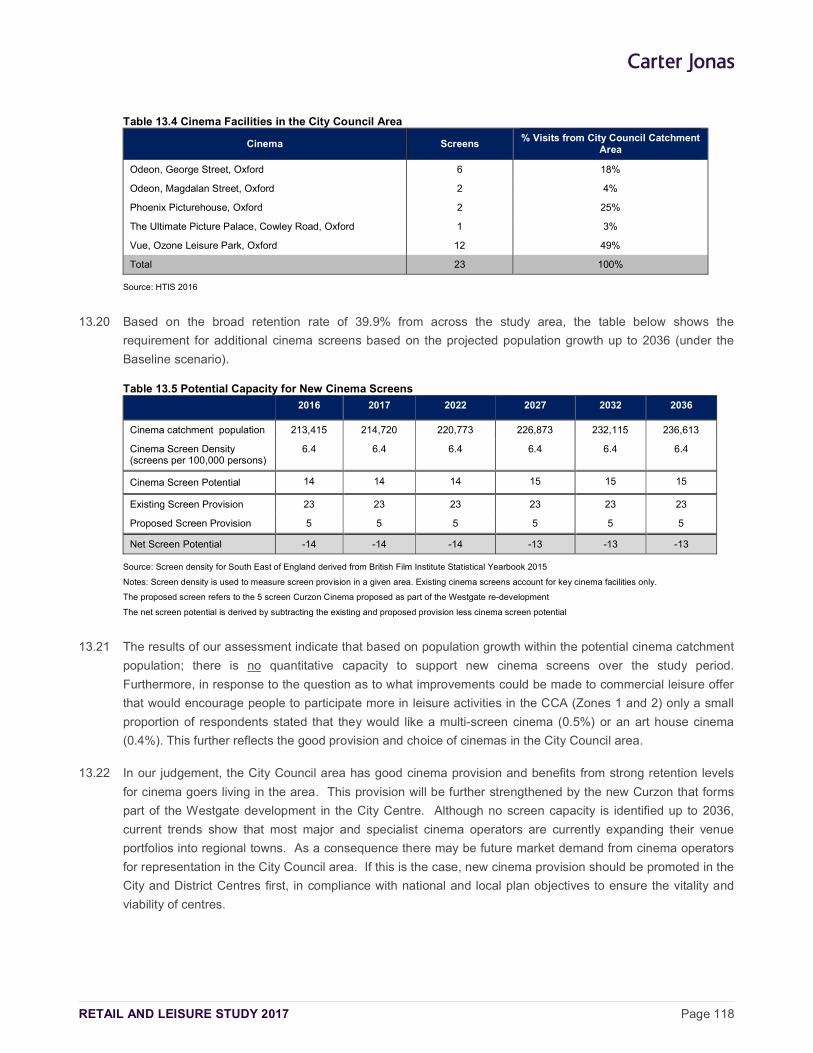
RETAIL AND LEISURE STUDY 2017 Page 118
Table 13.4 Cinema Facilities in the City Council Area
Cinema Screens % Visits from City Council Catchment
Area
Odeon, George Street, Oxford 6 18%
Odeon, Magdalan Street, Oxford 2 4%
Phoenix Picturehouse, Oxford 2 25%
The Ultimate Picture Palace, Cowley Road, Oxford 1 3%
Vue, Ozone Leisure Park, Oxford 12 49%
Total 23 100%
Source: HTIS 2016
13.20 Based on the broad retention rate of 39.9% from across the study area, the table below shows the
requirement for additional cinema screens based on the projected population growth up to 2036 (under the
Baseline scenario).
Table 13.5 Potential Capacity for New Cinema Screens
2016 2017 2022 2027 2032 2036
Cinema catchment population 213,415 214,720 220,773 226,873 232,115 236,613
Cinema Screen Density (screens per 100,000 persons)
6.4 6.4 6.4 6.4 6.4 6.4
Cinema Screen Potential 14 14 14 15 15 15
Existing Screen Provision 23 23 23 23 23 23
Proposed Screen Provision 5 5 5 5 5 5
Net Screen Potential -14 -14 -14 -13 -13 -13
Source: Screen density for South East of England derived from British Film Institute Statistical Yearbook 2015
Notes: Screen density is used to measure screen provision in a given area. Existing cinema screens account for key cinema facilities only.
The proposed screen refers to the 5 screen Curzon Cinema proposed as part of the Westgate re-development
The net screen potential is derived by subtracting the existing and proposed provision less cinema screen potential
13.21 The results of our assessment indicate that based on population growth within the potential cinema catchment
population; there is no quantitative capacity to support new cinema screens over the study period.
Furthermore, in response to the question as to what improvements could be made to commercial leisure offer
that would encourage people to participate more in leisure activities in the CCA (Zones 1 and 2) only a small
proportion of respondents stated that they would like a multi-screen cinema (0.5%) or an art house cinema
(0.4%). This further reflects the good provision and choice of cinemas in the City Council area.
13.22 In our judgement, the City Council area has good cinema provision and benefits from strong retention levels
for cinema goers living in the area. This provision will be further strengthened by the new Curzon that forms
part of the Westgate development in the City Centre. Although no screen capacity is identified up to 2036,
current trends show that most major and specialist cinema operators are currently expanding their venue
portfolios into regional towns. As a consequence there may be future market demand from cinema operators
for representation in the City Council area. If this is the case, new cinema provision should be promoted in the
City and District Centres first, in compliance with national and local plan objectives to ensure the vitality and
viability of centres.
RETAIL AND LEISURE STUDY 2017 Page 119
Eating & Drinking Out
13.23 The Class A3-A5 food and beverage sector (including restaurants, cafes, bars and pubs) provide an
increasingly important part of a town centre’s wider offer and make a significant positive contribution to the
daytime, evening and night-time economies. They also complement other town centres uses, particularly
shops, offices and cinemas, helping to lengthen ‘dwell times’ (the time people spend in centres) and increase
expenditure as part of the same trip. Research shows that average household spending on leisure services in
the UK is largely dominated by eating and drinking out. Even in the context of the current economic recession
this sector has remained buoyant and the year-on-year forecasts for growth by Experian are strong.
13.24 The following provides a summary of some of the key trends driving changes in the food and beverage sector
over recent years:
Pubs and Wine Bars - pub operators have widened their food and non-alcoholic beverage offer, resulting in the growth of so-called “gastro-pubs” in competition with more established restaurants, and the rise in ‘micro pubs’. Notwithstanding this the sector has also been characterised by increasing consolidation and closures. According to the Campaign for Real Ale (CAMRA) there have been 5,800 pub closures since 200837. Recent research by CAMRA also suggests that on average around 29 pubs closed every week in the UK between June and December 201438. The sale of pubs for conversion to alternative uses has also increased over recent years, particularly for convenience retailing (e.g. Tesco Express and Sainsbury’s Local).
Restaurants – this sector has also experienced mixed fortunes during the economic downturn. Some of the key trends driving change in this sector include an increase in ‘eating at home’, which has increased sales for take-aways and deliveries. At the same time customers are increasingly basing their decisions to eat out on ‘value for money’, but not at the expense of quality in terms of service, food and the overall experience. Recent successes include Jamie’s Italian, Bill’s and Cote, with branded restaurants increasing their share in the market. There has also been a growth in ‘all-you-can-eat’ style restaurants which are aimed at offering value for money (examples include the Taybarns brand owned by Whitbread).
Cafés/Coffee Shops – This sector has experienced strong growth over the last five years. The branded coffee chains dominate the market with some 6,495 outlets in 2014 and a £3.3bn turnover. Of these, the three leading multiple chains are Costa Coffee (1,821 outlets), Starbucks Coffee Company (824) and Caffè Nero (590), representing a combined 56% of the branded chain market by outlet numbers39. Costa Coffee has a recorded £878m turnover alone. Notwithstanding the rise of the multiples, there has also been growth in independent and specialist cafés and coffee houses, particularly those serving a more luxury or specialist offer (e.g. organic and Fairtrade). The strong independent coffee sector has fuelled many new start-up businesses in local centres. While many forecasters considered the café market to be saturated a few years ago, a recent study by management consultancy Allegra Strategies predicts that the total UK coffee shop market still has potential for strong growth, and there is forecast to be over 20,500 outlets by 2018, with a total turnover of £8.7 billion. There would therefore appear to be potential for further growth in the café market, driven mainly by branded coffee chain expansion and non-specialist operator growth. Meanwhile, the independent café and coffee shop market is growing from strength to strength, with approximately 6,500 coffee shops recorded in the UK in 2015.
37 Source: Article published by CAMRA on 20th March 2013, www.camra.org.uk
38 Source: Published results from the CGA-CAMRA Pub Tracker published in January 2015
39 Source: Allegra Strategies
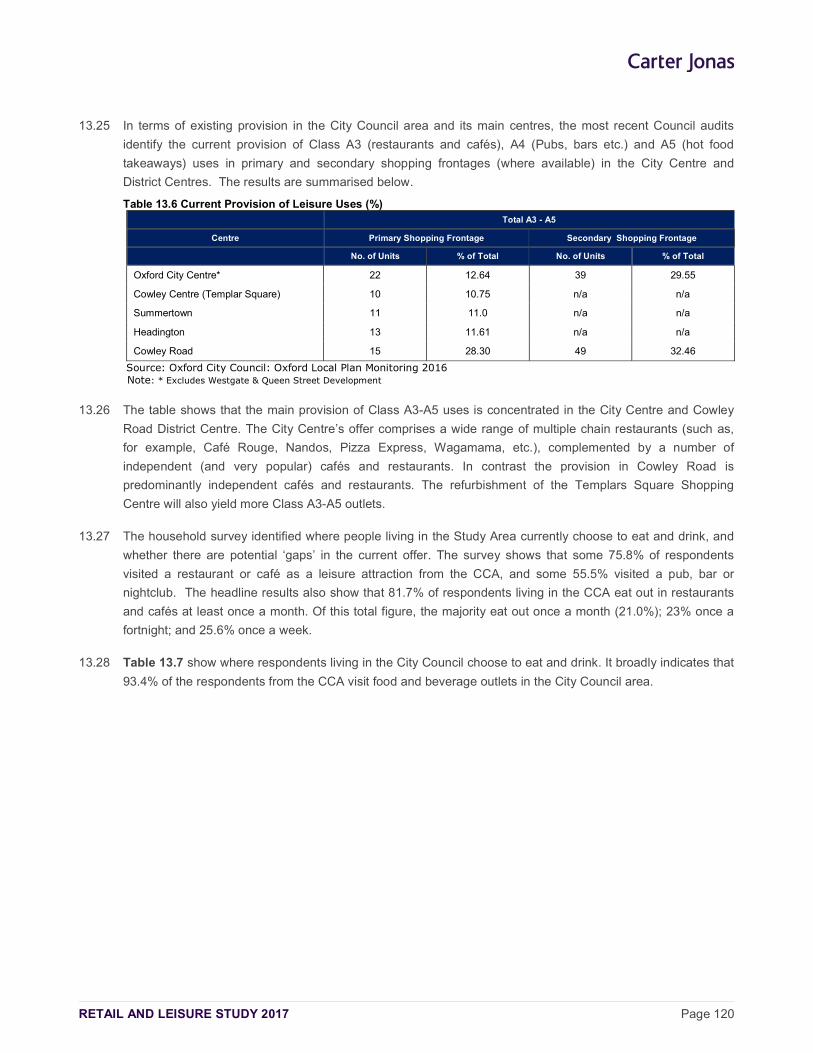
RETAIL AND LEISURE STUDY 2017 Page 120
13.25 In terms of existing provision in the City Council area and its main centres, the most recent Council audits
identify the current provision of Class A3 (restaurants and cafés), A4 (Pubs, bars etc.) and A5 (hot food
takeaways) uses in primary and secondary shopping frontages (where available) in the City Centre and
District Centres. The results are summarised below.
Table 13.6 Current Provision of Leisure Uses (%) Total A3 - A5
Centre Primary Shopping Frontage Secondary Shopping Frontage
No. of Units % of Total No. of Units % of Total
Oxford City Centre* 22 12.64 39 29.55
Cowley Centre (Templar Square) 10 10.75 n/a n/a
Summertown 11 11.0 n/a n/a
Headington 13 11.61 n/a n/a
Cowley Road 15 28.30 49 32.46
Source: Oxford City Council: Oxford Local Plan Monitoring 2016 Note: * Excludes Westgate & Queen Street Development
13.26 The table shows that the main provision of Class A3-A5 uses is concentrated in the City Centre and Cowley
Road District Centre. The City Centre’s offer comprises a wide range of multiple chain restaurants (such as,
for example, Café Rouge, Nandos, Pizza Express, Wagamama, etc.), complemented by a number of
independent (and very popular) cafés and restaurants. In contrast the provision in Cowley Road is
predominantly independent cafés and restaurants. The refurbishment of the Templars Square Shopping
Centre will also yield more Class A3-A5 outlets.
13.27 The household survey identified where people living in the Study Area currently choose to eat and drink, and
whether there are potential ‘gaps’ in the current offer. The survey shows that some 75.8% of respondents
visited a restaurant or café as a leisure attraction from the CCA, and some 55.5% visited a pub, bar or
nightclub. The headline results also show that 81.7% of respondents living in the CCA eat out in restaurants
and cafés at least once a month. Of this total figure, the majority eat out once a month (21.0%); 23% once a
fortnight; and 25.6% once a week.
13.28 Table 13.7 show where respondents living in the City Council choose to eat and drink. It broadly indicates that
93.4% of the respondents from the CCA visit food and beverage outlets in the City Council area.
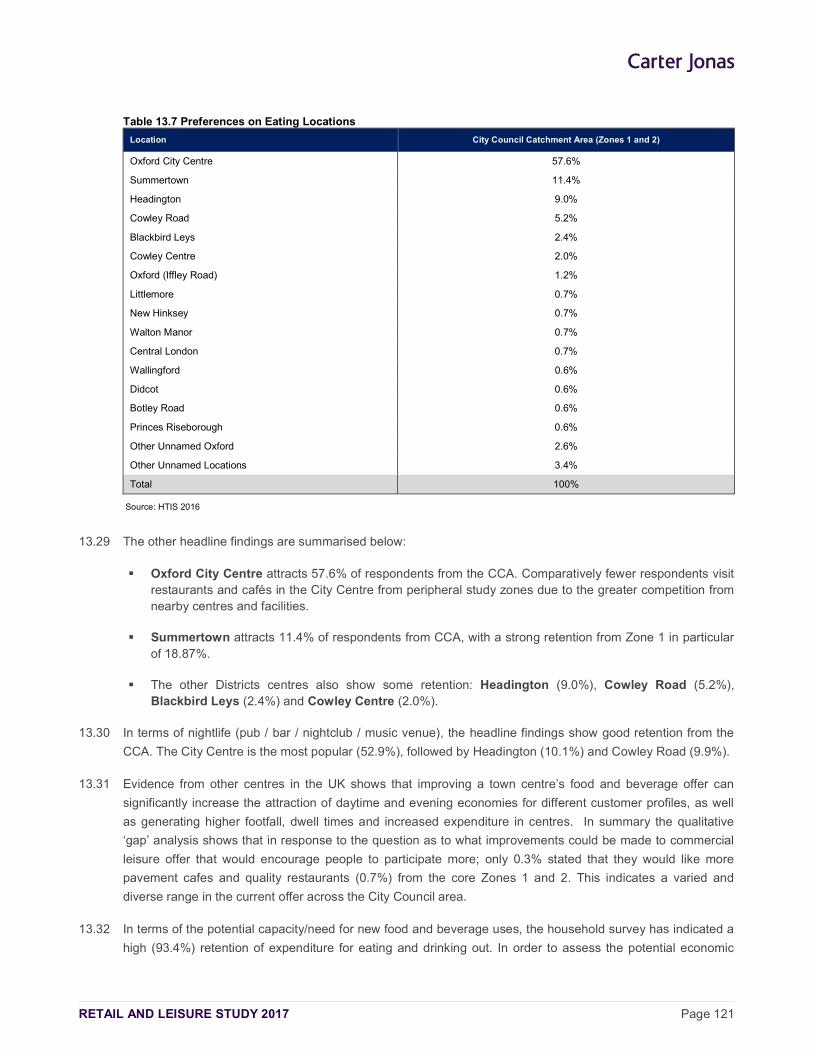
RETAIL AND LEISURE STUDY 2017 Page 121
Table 13.7 Preferences on Eating Locations
Location City Council Catchment Area (Zones 1 and 2)
Oxford City Centre 57.6%
Summertown 11.4%
Headington 9.0%
Cowley Road 5.2%
Blackbird Leys 2.4%
Cowley Centre 2.0%
Oxford (Iffley Road) 1.2%
Littlemore 0.7%
New Hinksey 0.7%
Walton Manor 0.7%
Central London 0.7%
Wallingford 0.6%
Didcot 0.6%
Botley Road 0.6%
Princes Riseborough 0.6%
Other Unnamed Oxford 2.6%
Other Unnamed Locations 3.4%
Total 100%
Source: HTIS 2016
13.29 The other headline findings are summarised below:
Oxford City Centre attracts 57.6% of respondents from the CCA. Comparatively fewer respondents visit restaurants and cafés in the City Centre from peripheral study zones due to the greater competition from nearby centres and facilities.
Summertown attracts 11.4% of respondents from CCA, with a strong retention from Zone 1 in particular of 18.87%.
The other Districts centres also show some retention: Headington (9.0%), Cowley Road (5.2%), Blackbird Leys (2.4%) and Cowley Centre (2.0%).
13.30 In terms of nightlife (pub / bar / nightclub / music venue), the headline findings show good retention from the
CCA. The City Centre is the most popular (52.9%), followed by Headington (10.1%) and Cowley Road (9.9%).
13.31 Evidence from other centres in the UK shows that improving a town centre’s food and beverage offer can
significantly increase the attraction of daytime and evening economies for different customer profiles, as well
as generating higher footfall, dwell times and increased expenditure in centres. In summary the qualitative
‘gap’ analysis shows that in response to the question as to what improvements could be made to commercial
leisure offer that would encourage people to participate more; only 0.3% stated that they would like more
pavement cafes and quality restaurants (0.7%) from the core Zones 1 and 2. This indicates a varied and
diverse range in the current offer across the City Council area.
13.32 In terms of the potential capacity/need for new food and beverage uses, the household survey has indicated a
high (93.4%) retention of expenditure for eating and drinking out. In order to assess the potential economic
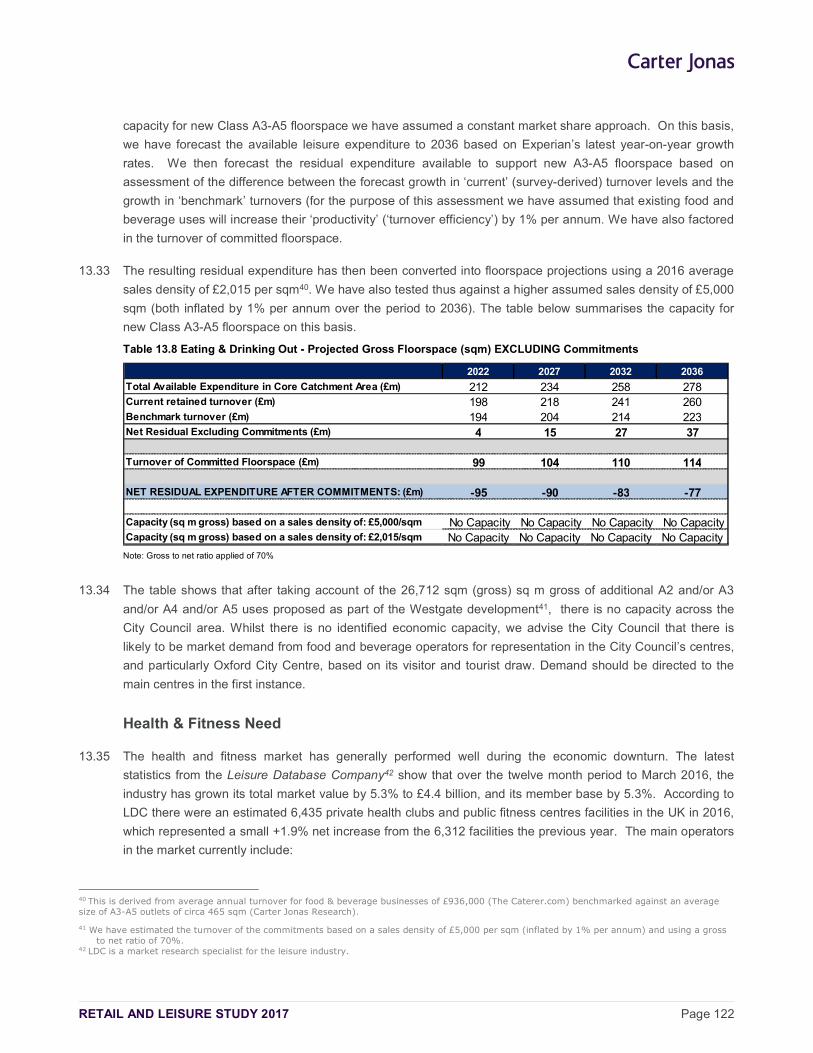
RETAIL AND LEISURE STUDY 2017 Page 122
capacity for new Class A3-A5 floorspace we have assumed a constant market share approach. On this basis,
we have forecast the available leisure expenditure to 2036 based on Experian’s latest year-on-year growth
rates. We then forecast the residual expenditure available to support new A3-A5 floorspace based on
assessment of the difference between the forecast growth in ‘current’ (survey-derived) turnover levels and the
growth in ‘benchmark’ turnovers (for the purpose of this assessment we have assumed that existing food and
beverage uses will increase their ‘productivity’ (‘turnover efficiency’) by 1% per annum. We have also factored
in the turnover of committed floorspace.
13.33 The resulting residual expenditure has then been converted into floorspace projections using a 2016 average
sales density of £2,015 per sqm40. We have also tested thus against a higher assumed sales density of £5,000
sqm (both inflated by 1% per annum over the period to 2036). The table below summarises the capacity for
new Class A3-A5 floorspace on this basis.
Table 13.8 Eating & Drinking Out - Projected Gross Floorspace (sqm) EXCLUDING Commitments
2022 2027 2032 2036
Total Available Expenditure in Core Catchment Area (£m) 212 234 258 278Current retained turnover (£m) 198 218 241 260Benchmark turnover (£m) 194 204 214 223Net Residual Excluding Commitments (£m) 4 15 27 37
Turnover of Committed Floorspace (£m) 99 104 110 114
NET RESIDUAL EXPENDITURE AFTER COMMITMENTS: (£m) -95 -90 -83 -77
Capacity (sq m gross) based on a sales density of: £5,000/sqm No Capacity No Capacity No Capacity No CapacityCapacity (sq m gross) based on a sales density of: £2,015/sqm No Capacity No Capacity No Capacity No Capacity
Note: Gross to net ratio applied of 70%
13.34 The table shows that after taking account of the 26,712 sqm (gross) sq m gross of additional A2 and/or A3
and/or A4 and/or A5 uses proposed as part of the Westgate development41, there is no capacity across the
City Council area. Whilst there is no identified economic capacity, we advise the City Council that there is
likely to be market demand from food and beverage operators for representation in the City Council’s centres,
and particularly Oxford City Centre, based on its visitor and tourist draw. Demand should be directed to the
main centres in the first instance.
Health & Fitness Need
13.35 The health and fitness market has generally performed well during the economic downturn. The latest
statistics from the Leisure Database Company42 show that over the twelve month period to March 2016, the
industry has grown its total market value by 5.3% to £4.4 billion, and its member base by 5.3%. According to
LDC there were an estimated 6,435 private health clubs and public fitness centres facilities in the UK in 2016,
which represented a small +1.9% net increase from the 6,312 facilities the previous year. The main operators
in the market currently include:
40 This is derived from average annual turnover for food & beverage businesses of £936,000 (The Caterer.com) benchmarked against an average size of A3-A5 outlets of circa 465 sqm (Carter Jonas Research).
41 We have estimated the turnover of the commitments based on a sales density of £5,000 per sqm (inflated by 1% per annum) and using a gross to net ratio of 70%.
42 LDC is a market research specialist for the leisure industry.
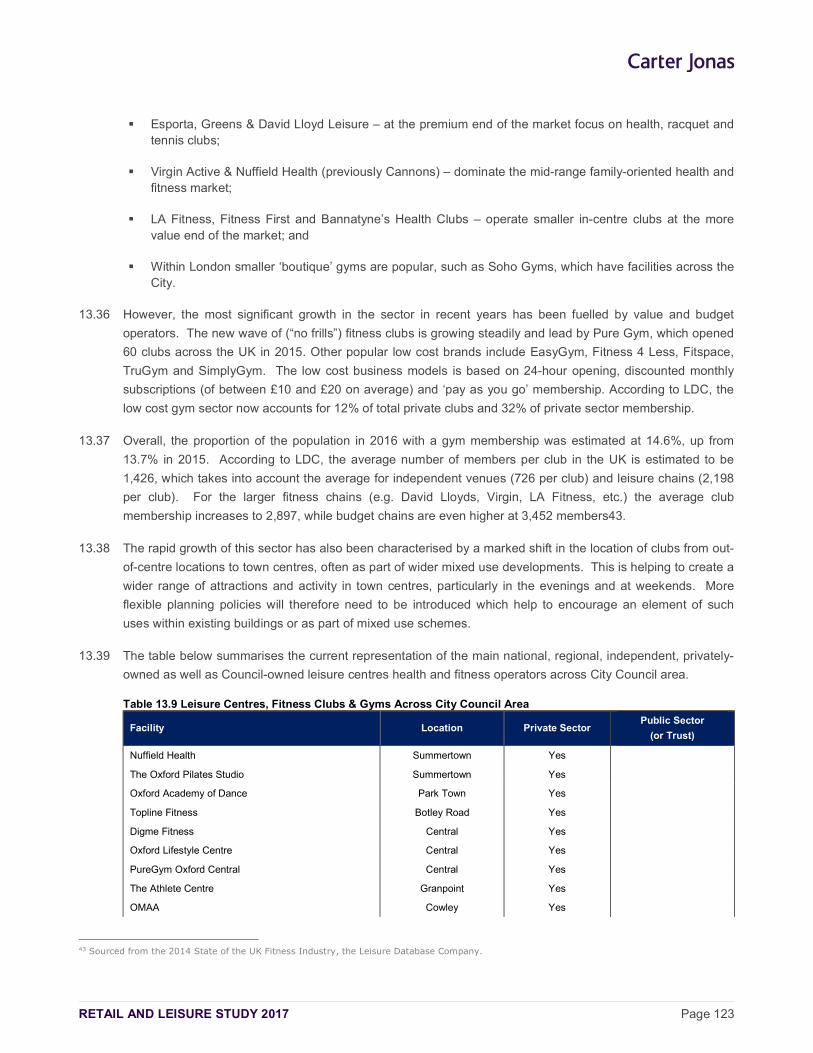
RETAIL AND LEISURE STUDY 2017 Page 123
Esporta, Greens & David Lloyd Leisure – at the premium end of the market focus on health, racquet and tennis clubs;
Virgin Active & Nuffield Health (previously Cannons) – dominate the mid-range family-oriented health and fitness market;
LA Fitness, Fitness First and Bannatyne’s Health Clubs – operate smaller in-centre clubs at the more value end of the market; and
Within London smaller ‘boutique’ gyms are popular, such as Soho Gyms, which have facilities across the City.
13.36 However, the most significant growth in the sector in recent years has been fuelled by value and budget
operators. The new wave of (“no frills”) fitness clubs is growing steadily and lead by Pure Gym, which opened
60 clubs across the UK in 2015. Other popular low cost brands include EasyGym, Fitness 4 Less, Fitspace,
TruGym and SimplyGym. The low cost business models is based on 24-hour opening, discounted monthly
subscriptions (of between £10 and £20 on average) and ‘pay as you go’ membership. According to LDC, the
low cost gym sector now accounts for 12% of total private clubs and 32% of private sector membership.
13.37 Overall, the proportion of the population in 2016 with a gym membership was estimated at 14.6%, up from
13.7% in 2015. According to LDC, the average number of members per club in the UK is estimated to be
1,426, which takes into account the average for independent venues (726 per club) and leisure chains (2,198
per club). For the larger fitness chains (e.g. David Lloyds, Virgin, LA Fitness, etc.) the average club
membership increases to 2,897, while budget chains are even higher at 3,452 members43.
13.38 The rapid growth of this sector has also been characterised by a marked shift in the location of clubs from out-
of-centre locations to town centres, often as part of wider mixed use developments. This is helping to create a
wider range of attractions and activity in town centres, particularly in the evenings and at weekends. More
flexible planning policies will therefore need to be introduced which help to encourage an element of such
uses within existing buildings or as part of mixed use schemes.
13.39 The table below summarises the current representation of the main national, regional, independent, privately-
owned as well as Council-owned leisure centres health and fitness operators across City Council area.
Table 13.9 Leisure Centres, Fitness Clubs & Gyms Across City Council Area
Facility Location Private Sector Public Sector
(or Trust)
Nuffield Health Summertown Yes
The Oxford Pilates Studio Summertown Yes
Oxford Academy of Dance Park Town Yes
Topline Fitness Botley Road Yes
Digme Fitness Central Yes
Oxford Lifestyle Centre Central Yes
PureGym Oxford Central Central Yes
The Athlete Centre Granpoint Yes
OMAA Cowley Yes
43 Sourced from the 2014 State of the UK Fitness Industry, the Leisure Database Company.
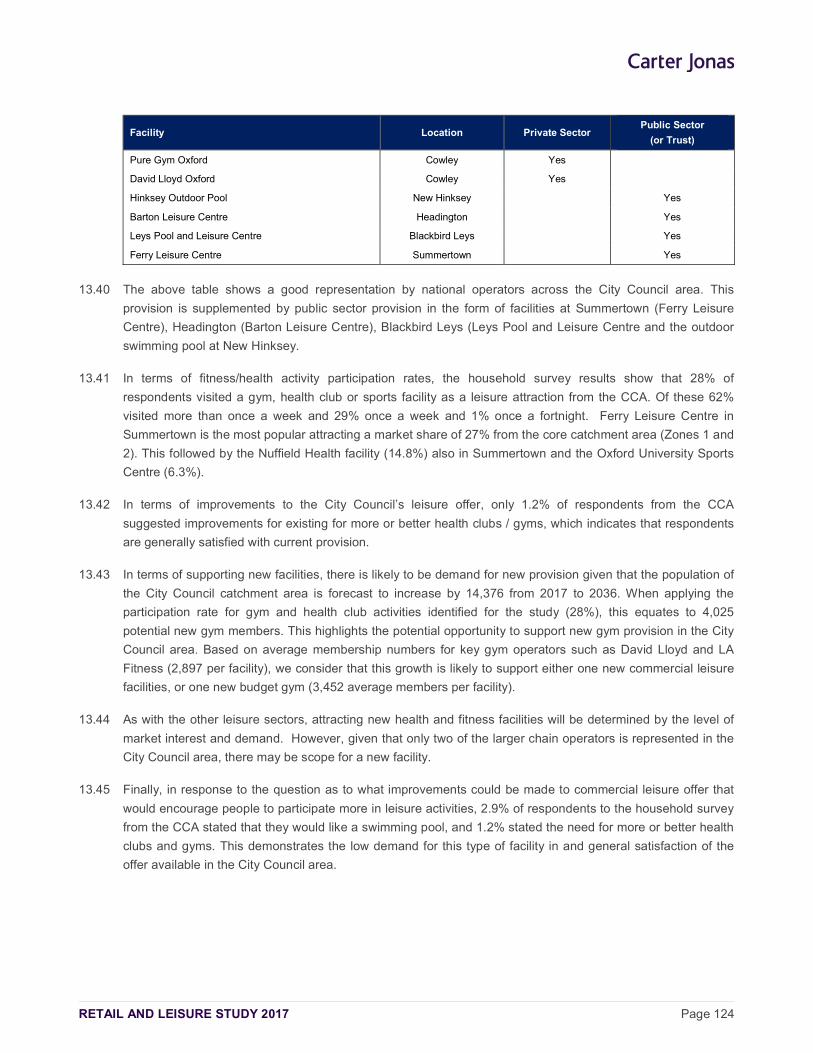
RETAIL AND LEISURE STUDY 2017 Page 124
Facility Location Private Sector Public Sector
(or Trust)
Pure Gym Oxford Cowley Yes
David Lloyd Oxford Cowley Yes
Hinksey Outdoor Pool New Hinksey Yes
Barton Leisure Centre Headington Yes
Leys Pool and Leisure Centre Blackbird Leys Yes
Ferry Leisure Centre Summertown Yes
13.40 The above table shows a good representation by national operators across the City Council area. This
provision is supplemented by public sector provision in the form of facilities at Summertown (Ferry Leisure
Centre), Headington (Barton Leisure Centre), Blackbird Leys (Leys Pool and Leisure Centre and the outdoor
swimming pool at New Hinksey.
13.41 In terms of fitness/health activity participation rates, the household survey results show that 28% of
respondents visited a gym, health club or sports facility as a leisure attraction from the CCA. Of these 62%
visited more than once a week and 29% once a week and 1% once a fortnight. Ferry Leisure Centre in
Summertown is the most popular attracting a market share of 27% from the core catchment area (Zones 1 and
2). This followed by the Nuffield Health facility (14.8%) also in Summertown and the Oxford University Sports
Centre (6.3%).
13.42 In terms of improvements to the City Council’s leisure offer, only 1.2% of respondents from the CCA
suggested improvements for existing for more or better health clubs / gyms, which indicates that respondents
are generally satisfied with current provision.
13.43 In terms of supporting new facilities, there is likely to be demand for new provision given that the population of
the City Council catchment area is forecast to increase by 14,376 from 2017 to 2036. When applying the
participation rate for gym and health club activities identified for the study (28%), this equates to 4,025
potential new gym members. This highlights the potential opportunity to support new gym provision in the City
Council area. Based on average membership numbers for key gym operators such as David Lloyd and LA
Fitness (2,897 per facility), we consider that this growth is likely to support either one new commercial leisure
facilities, or one new budget gym (3,452 average members per facility).
13.44 As with the other leisure sectors, attracting new health and fitness facilities will be determined by the level of
market interest and demand. However, given that only two of the larger chain operators is represented in the
City Council area, there may be scope for a new facility.
13.45 Finally, in response to the question as to what improvements could be made to commercial leisure offer that
would encourage people to participate more in leisure activities, 2.9% of respondents to the household survey
from the CCA stated that they would like a swimming pool, and 1.2% stated the need for more or better health
clubs and gyms. This demonstrates the low demand for this type of facility in and general satisfaction of the
offer available in the City Council area.
RETAIL AND LEISURE STUDY 2017 Page 125
Bingo & Gambling Needs
13.46 Gambling represents a significant element of the leisure industry. The main sectors of the gambling industry
comprise ‘games of chance’ (i.e. bingo clubs, casinos, betting shops, amusement arcades, etc.). We briefly
describe the key trends in this sector and the forecast need/demand for new facilities in the City Council area,
if any, based on the available evidence.
13.47 In terms of Bingo Halls, the latest research by The Gambling Commission (Industry Statistics November
2015) indicates that there are over 599 licensed premises in operation in the UK, which is a reduction from
653 recorded in 2014. Gala Leisure and Mecco Bingo are the leading operators accounting for over a third
(36.9%) of all premises. Research by Mintel indicates that the industry has experienced a fall in revenues and
admissions over recent years as a result of legislative changes (such as the ban on smoking in public places),
the impact of the economic downturn and the growth of online gaming. In response to falling admissions,
bingo operators are increasingly taking advantage of the online market and embracing smart-phone
technology through new ‘app’ development. This forms part of a wider trend and growth in ‘remote/online’
gambling, which including gambling activities through the internet, telephone, radio, etc. Bingo operators are
also increasingly looking to diversity their customer profile, and are marketing their clubs at a younger,
predominantly female audience. As a result there has been an increase in the number of younger and more
affluent bingo players over recent years, particularly as deregulation has enabled clubs to offer bigger
(national) prizes. The above has resulted in the closure of many bingo halls across the UK.
13.48 For Casinos research shows that there were some 147 in the UK in September 2015. The number of
premises has remained fairly static over the past five years44. This sector is dominated by two companies: the
Rank Group (incorporating Grosvenor Casinos and Gala Coral Casinos) and Genting UK. There has been
consolidation of the sector in the past few years, with acquisitions such as Rank Group’s purchase of Gala
Coral Casinos making it the largest operator in the UK. While casino attendance has grown from 18.24m in
2012 to 20.44m in 2015, attendance dropped by 2.6% from 2014 (20.99m). The increase in attendance since
2012 is largely explained by larger new casino venues granted licences under the 2005 Gambling Act. As far
as we are aware there are no major casinos located within the City Council area with the nearest facility in
Reading (Grosvenor), Milton Keynes (Casino MK at the Xscape facility) and various in Central London.
13.49 Betting shops represent a growing market in the gambling sector and are ever present on the UK’s high
streets. There are approximately 9,000 betting shops in the UK, of which around half are operated by
Ladbrokes and William Hill. Regulatory changes in 2015 led to a fall in revenue and profit. In response, William
Hill announced their intention to close 150 of their 2,300 outlets. As gambling activities continue their shift to
online channels, demand for physical outlets could dampen in the future. The presence of betting shops in
high streets is a contentious issue, particularly the perceived social issues that are linked to this particular
activity (e.g. anti-social behaviour) and their concentration in deprived areas. The reclassification of betting
shops from A2 to Sui Generis was aimed at giving local authorities greater control on managing the number of
outlets in town centres. We note that according to Experian Goad Category Report 2016 for the City Centre
shows five betting offices, forming 1.19% of all units consistent with the national average of 1.44%.
Summertown has one unit, forming 0.96% of all units in the centre, which is also below the national average.
Comparatively the other District centres have units above the national average of 1.44%; Headington has two
units forming 1.8% of all units; Cowley Centre has 3 units representing 3.3% of all units, Cowley Road has 2
44 Source: Gambling Commission Industry Statistics 2016.
RETAIL AND LEISURE STUDY 2017 Page 126
units representing 2.15% of all units. We would advise the Council to monitor betting shop provision across all
centres, but particularly Headington, Cowley Centre and Cowley Road to prevent proliferation and to ensure a
healthy balance and diversity of town centre uses.
13.50 The household survey results indicate that going to bingo halls, bookmakers and/or casinos is not a major
leisure activity for the vast majority of respondents living in the CCA; with just 5.9% indicating that they visited
bingo clubs, casinos or bookmakers as a leisure attraction. Typically, participation rate for gambling activities
is lower. Of those that do partake, 45% of respondents visit once a week or more, 13% visit once a fortnight,
28% once a month and 13% once every two months. In terms of venues, the household survey indicates that
of those who participate in the CCA, Gala Bingo at the Ozone Leisure Park is the most popular venue (61%).
13.51 In our judgement, there is no demonstrable need to enhance existing provision to improve competition and
choice at the local level, although this will be subject to market interest and demand from other bingo and
casino operators. If demand arises in the future, we advise that this should be directed to City Centre first in
accordance with national and local plan policy. Given that current trends for bingos and casinos show activity
moving online instead of physical venues, future demand for new venues is expected to be very limited.
13.52 Finally, in response to the question as to what improvements could be made to commercial leisure offer that
would encourage people to participate more in leisure activities, no respondents to the household survey
stated that they would like a casino or bingo. These findings further demonstrate the lack of demand for bingo
and gambling facilities in the City Council area.
Other Commercial Leisure Needs
13.53 Other commercial leisure facilities can be grouped together under ‘family entertainment’ venues which include
paid activities that appeal to adults and children; such as, for example, tenpin bowling, roller skating, ice
skating, and similar uses.
13.54 Tenpin bowling is possibly the most popular of this category and has been established as a commercial leisure
activity in the UK for over 40 years. It remains a strong family and group activity. Research shows that there
are currently over 321 bowling centres in the UK45. This sector benefited from a period of growth from the
mid-1990s onwards, fuelled by the development of large entertainment ‘boxes’ and leisure parks at one end of
the spectrum, and smaller independent specialist bowling facilities at the other end. A number of the
successful bowling facilities opened over the last 15-20 years tend to form part of larger leisure complexes that
include multi-screen cinemas, restaurants and nightclubs. It is the critical mass of leisure uses under one roof
or as part of leisure parks that helps to underpin the viability of ten-pin bowling centres, which can struggle as
standalone attractions. Examples of the smaller specialist operators include All Star Lanes which operates
five bowling venues in the UK (four in London and one in Manchester) and largely targets the corporate/private
hire market. Bloomsbury Bowl Lanes also operates from smaller venues with sites in Bloomsbury (8 lanes)
and Bristol (5 lanes). The company offers a 1950’s American-themed bowling venue with ancillary karaoke
rooms, venue rooms for hire, DJ booths, bars, small scale cinema and a venue for bands and live
performers/comedy nights.
45 Tenpin Bowling Market UK, Mintel (November 2012)
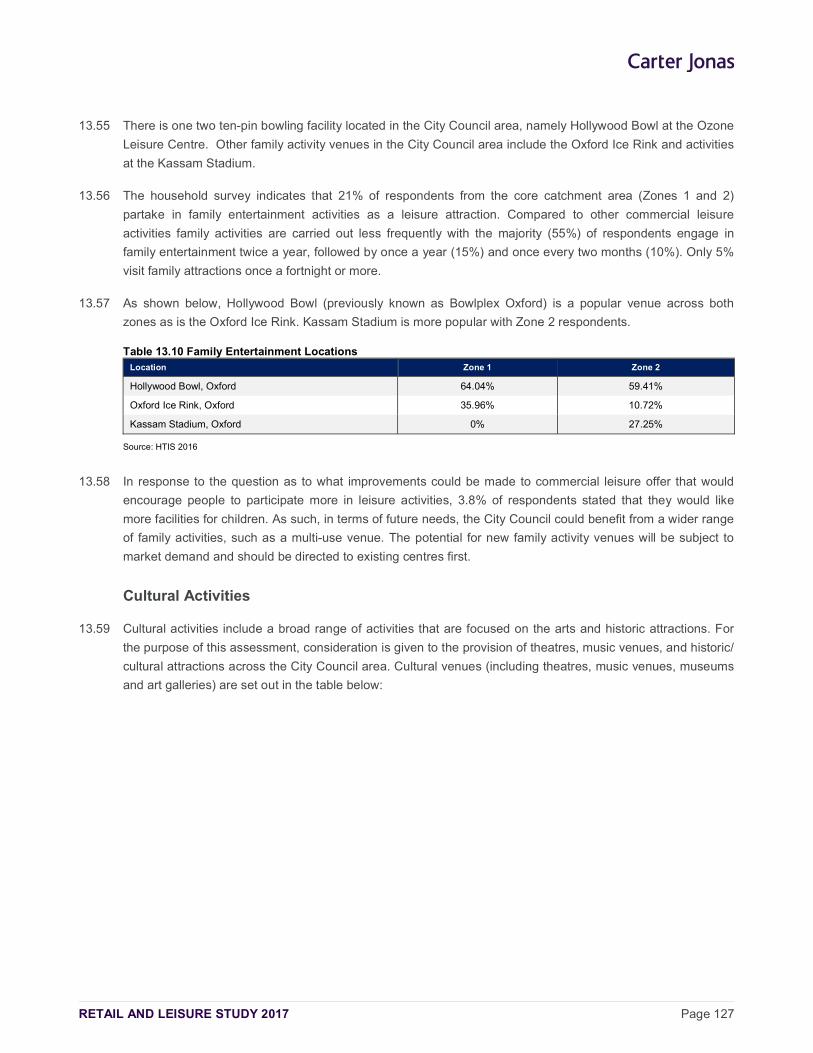
RETAIL AND LEISURE STUDY 2017 Page 127
13.55 There is one two ten-pin bowling facility located in the City Council area, namely Hollywood Bowl at the Ozone
Leisure Centre. Other family activity venues in the City Council area include the Oxford Ice Rink and activities
at the Kassam Stadium.
13.56 The household survey indicates that 21% of respondents from the core catchment area (Zones 1 and 2)
partake in family entertainment activities as a leisure attraction. Compared to other commercial leisure
activities family activities are carried out less frequently with the majority (55%) of respondents engage in
family entertainment twice a year, followed by once a year (15%) and once every two months (10%). Only 5%
visit family attractions once a fortnight or more.
13.57 As shown below, Hollywood Bowl (previously known as Bowlplex Oxford) is a popular venue across both
zones as is the Oxford Ice Rink. Kassam Stadium is more popular with Zone 2 respondents.
Table 13.10 Family Entertainment Locations Location Zone 1 Zone 2
Hollywood Bowl, Oxford 64.04% 59.41%
Oxford Ice Rink, Oxford 35.96% 10.72%
Kassam Stadium, Oxford 0% 27.25%
Source: HTIS 2016
13.58 In response to the question as to what improvements could be made to commercial leisure offer that would
encourage people to participate more in leisure activities, 3.8% of respondents stated that they would like
more facilities for children. As such, in terms of future needs, the City Council could benefit from a wider range
of family activities, such as a multi-use venue. The potential for new family activity venues will be subject to
market demand and should be directed to existing centres first.
Cultural Activities
13.59 Cultural activities include a broad range of activities that are focused on the arts and historic attractions. For
the purpose of this assessment, consideration is given to the provision of theatres, music venues, and historic/
cultural attractions across the City Council area. Cultural venues (including theatres, music venues, museums
and art galleries) are set out in the table below:
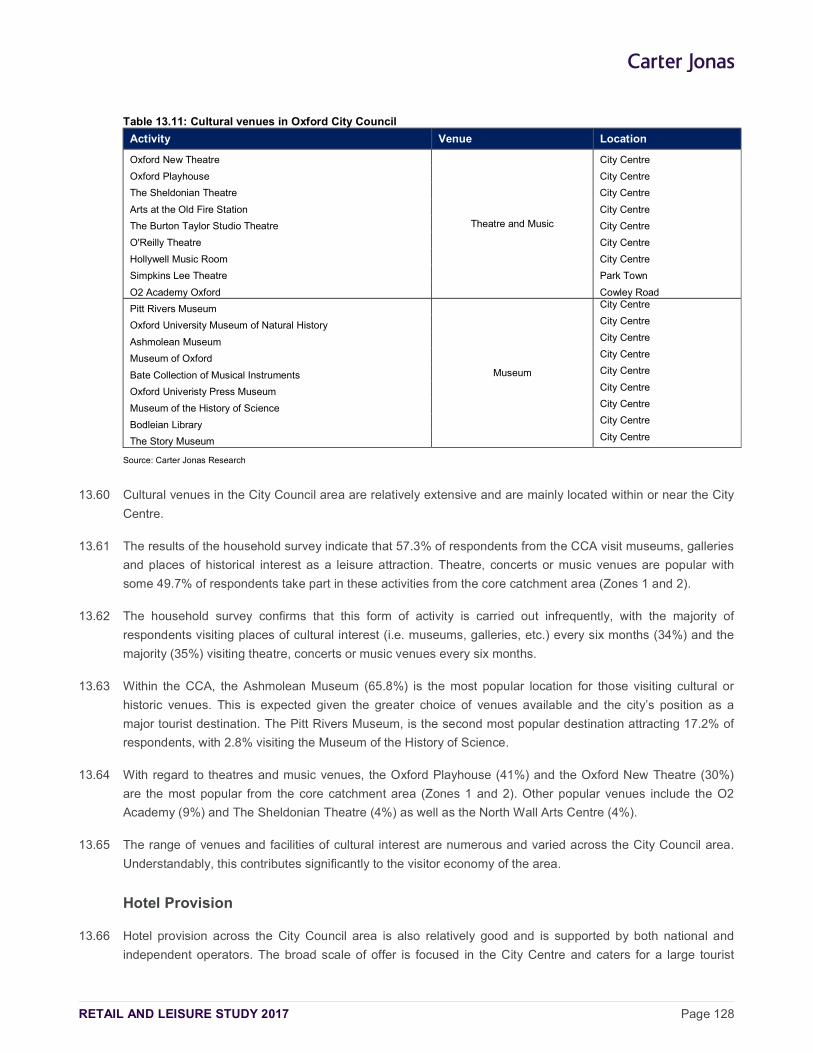
RETAIL AND LEISURE STUDY 2017 Page 128
Table 13.11: Cultural venues in Oxford City Council
Activity Venue Location
Oxford New Theatre
Theatre and Music
City Centre
Oxford Playhouse City Centre
The Sheldonian Theatre City Centre
Arts at the Old Fire Station City Centre
The Burton Taylor Studio Theatre City Centre
O'Reilly Theatre City Centre
Hollywell Music Room City Centre
Simpkins Lee Theatre Park Town
O2 Academy Oxford Cowley Road
Pitt Rivers Museum
Museum
City Centre
Oxford University Museum of Natural History City Centre
Ashmolean Museum City Centre
Museum of Oxford City Centre
Bate Collection of Musical Instruments City Centre
Oxford Univeristy Press Museum City Centre
Museum of the History of Science City Centre
Bodleian Library City Centre
The Story Museum City Centre
Source: Carter Jonas Research
13.60 Cultural venues in the City Council area are relatively extensive and are mainly located within or near the City
Centre.
13.61 The results of the household survey indicate that 57.3% of respondents from the CCA visit museums, galleries
and places of historical interest as a leisure attraction. Theatre, concerts or music venues are popular with
some 49.7% of respondents take part in these activities from the core catchment area (Zones 1 and 2).
13.62 The household survey confirms that this form of activity is carried out infrequently, with the majority of
respondents visiting places of cultural interest (i.e. museums, galleries, etc.) every six months (34%) and the
majority (35%) visiting theatre, concerts or music venues every six months.
13.63 Within the CCA, the Ashmolean Museum (65.8%) is the most popular location for those visiting cultural or
historic venues. This is expected given the greater choice of venues available and the city’s position as a
major tourist destination. The Pitt Rivers Museum, is the second most popular destination attracting 17.2% of
respondents, with 2.8% visiting the Museum of the History of Science.
13.64 With regard to theatres and music venues, the Oxford Playhouse (41%) and the Oxford New Theatre (30%)
are the most popular from the core catchment area (Zones 1 and 2). Other popular venues include the O2
Academy (9%) and The Sheldonian Theatre (4%) as well as the North Wall Arts Centre (4%).
13.65 The range of venues and facilities of cultural interest are numerous and varied across the City Council area.
Understandably, this contributes significantly to the visitor economy of the area.
Hotel Provision
13.66 Hotel provision across the City Council area is also relatively good and is supported by both national and
independent operators. The broad scale of offer is focused in the City Centre and caters for a large tourist
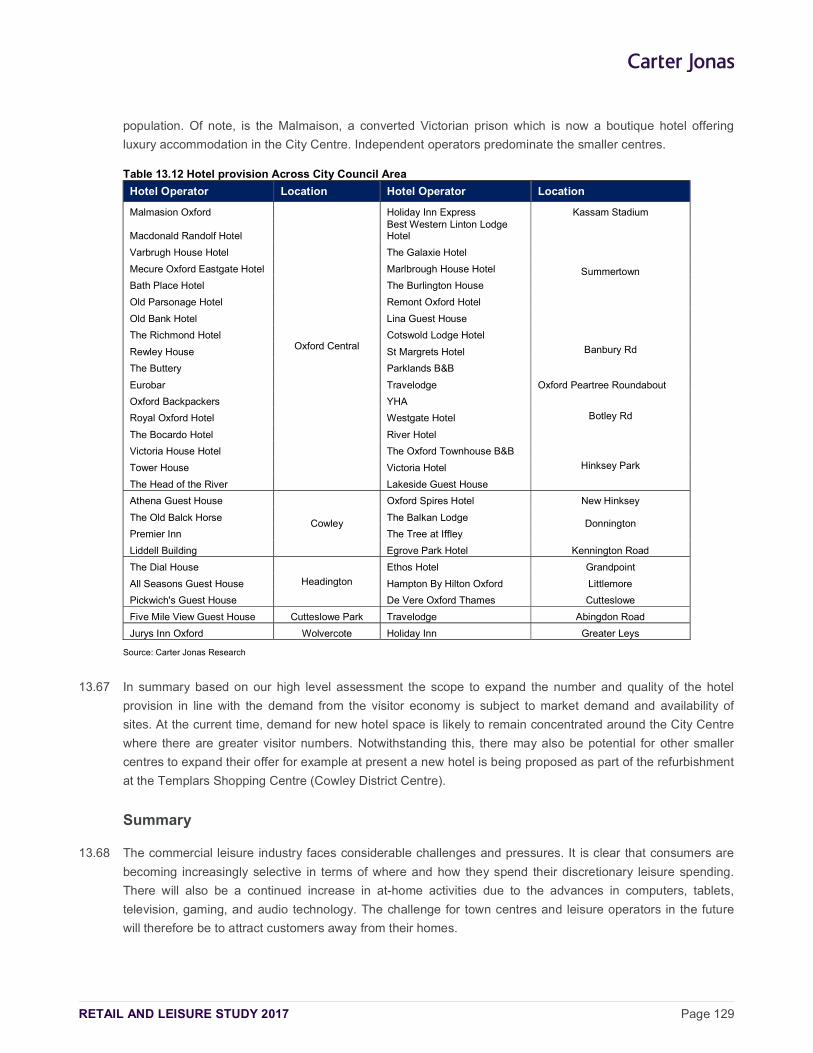
RETAIL AND LEISURE STUDY 2017 Page 129
population. Of note, is the Malmaison, a converted Victorian prison which is now a boutique hotel offering
luxury accommodation in the City Centre. Independent operators predominate the smaller centres.
Table 13.12 Hotel provision Across City Council Area
Hotel Operator Location Hotel Operator Location
Malmasion Oxford
Oxford Central
Holiday Inn Express Kassam Stadium
Macdonald Randolf Hotel Best Western Linton Lodge Hotel
Summertown
Varbrugh House Hotel The Galaxie Hotel
Mecure Oxford Eastgate Hotel Marlbrough House Hotel
Bath Place Hotel The Burlington House
Old Parsonage Hotel Remont Oxford Hotel
Old Bank Hotel Lina Guest House
The Richmond Hotel Cotswold Lodge Hotel
Banbury Rd Rewley House St Margrets Hotel
The Buttery Parklands B&B
Eurobar Travelodge Oxford Peartree Roundabout
Oxford Backpackers YHA
Botley Rd Royal Oxford Hotel Westgate Hotel
The Bocardo Hotel River Hotel
Victoria House Hotel The Oxford Townhouse B&B
Hinksey Park Tower House Victoria Hotel
The Head of the River Lakeside Guest House
Athena Guest House
Cowley
Oxford Spires Hotel New Hinksey
The Old Balck Horse The Balkan Lodge Donnington
Premier Inn The Tree at Iffley
Liddell Building Egrove Park Hotel Kennington Road
The Dial House
Headington
Ethos Hotel Grandpoint
All Seasons Guest House Hampton By Hilton Oxford Littlemore
Pickwich's Guest House De Vere Oxford Thames Cutteslowe
Five Mile View Guest House Cutteslowe Park Travelodge Abingdon Road
Jurys Inn Oxford Wolvercote Holiday Inn Greater Leys
Source: Carter Jonas Research
13.67 In summary based on our high level assessment the scope to expand the number and quality of the hotel
provision in line with the demand from the visitor economy is subject to market demand and availability of
sites. At the current time, demand for new hotel space is likely to remain concentrated around the City Centre
where there are greater visitor numbers. Notwithstanding this, there may also be potential for other smaller
centres to expand their offer for example at present a new hotel is being proposed as part of the refurbishment
at the Templars Shopping Centre (Cowley District Centre).
Summary
13.68 The commercial leisure industry faces considerable challenges and pressures. It is clear that consumers are
becoming increasingly selective in terms of where and how they spend their discretionary leisure spending.
There will also be a continued increase in at-home activities due to the advances in computers, tablets,
television, gaming, and audio technology. The challenge for town centres and leisure operators in the future
will therefore be to attract customers away from their homes.
RETAIL AND LEISURE STUDY 2017 Page 130
13.69 Our review of the City Council’s commercial leisure sector and offer, and the results of the household survey,
indicate that there is a relatively good level of leisure facilities (for example cinema and food and drink
provision), although there is scope to improve the range and quality of this provision. The participation rate for
certain leisure activities is particularly high (e.g. restaurants and cinemas) and this offers the potential to
enhance the overall offer, subject to market demand. There is clearly potential to improve and strengthen the
leisure offer in the main centres to help stimulate their evening economies and increase “dwell times” during
the day to the benefit of other shops, businesses and facilities. Across all centres attention should be paid to
increasing provision within the main retail area rather than on the edge of the centre.
13.70 In terms of cinema provision, the assessment found that a high proportion of respondents frequent the
cinemas in the City Council area and retention levels are strong. The quantitative assessment identifies that
there is no capacity to support new cinema screens. However, if market demand from operators arises for
new cinemas in the City Council area, this should be directed to town centres first.
13.71 Whilst no economic capacity has been identified for eating and drinking out this does not preclude potential
qualitative improvements. There is potential to enhance the quality and type of food and drink offer (e.g.
pavement cafes and quality restaurants), although current provision is good.
13.72 Given that the population of the CCA is forecast to increase by 14,367 between 2017 and 2036 (under the
Baseline scenario) and compounded by the popularity of the need for a healthier lifestyle, attracting new
health and fitness facilities there is potential scope to support either one new commercial facility or one new
budget gym. However, this will be determined by the level of market interest and demand.
13.73 Additionally, in terms of addressing future needs, the City Council could benefit from a wider range of family
activities, such as a multi-use venue. The potential for new family activity venues will be subject to market
demand and should be directed to a town centre location.
13.74 The City Council area benefits from a diverse range of arts and historic attractions the majority of which are
located within or near the City Centre. These contribute significantly to the visitor economy of the area and
need to be maintained and promoted to maintain their current status. The scope to expand the number and
quality of the hotel provision in line with the demand from the visitor economy is subject to market demand and
availability of sites.
RETAIL AND LEISURE STUDY 2017 Page 131
14 EXECUTIVE SUMMARY: KEY FINDINGS & RECOMMENDATIONS
14.1 This final section provides a summary of the key findings of the Oxford Retail and Leisure Study and
recommendations to help inform plan-making and future strategies. It sets out high level advice on how the
local planning authority can effectively plan for, manage and promote the vitality and viability of the City Centre
and main district centres over the development plan period.
14.2 Our advice is based on the updated assessment of the quantitative and qualitative need for new retail
(comparison and convenience goods) floorspace and commercial leisure uses up to 2036. The need
assessment draws on a robust and up-to-date evidence base and new primary research, including:
a health check of the City Centre and main District's centres;
a telephone interview survey of some 1,000 households across the local authority area and a wider defined Study Area to help establish current shopping patterns, leisure preferences and market shares.
An in-centre survey of the City Centre and the main District Centres. This comprised 300 interviews in the City Centre; 70 in Cowley District Centre; 50 in the District Centres of Summertown, Headington and Cowley Road; and 30 in Blackbird Leys.
14.3 The study has been prepared in the context of national and development plan policy guidance, as well as
other key material considerations. This includes the National Planning Policy Framework (NPPF) and the
Planning Practice Guidance (PPG), which place weight on the development of positive plan-led visions and
strategies for town centres, and promote new investment and development in town centres first ahead of edge
and out of centre locations.
14.4 Based on the City Council-wide and centre capacity forecasts, the following provides a brief summary of:
each centres’ relative health, role and function;
the forecast quantitative and qualitative need for new convenience goods retail floorspace;
the preferred options for accommodating some and/or all of the identified need over the short, medium and long term;
a reasonable and robust impact ‘threshold’ in accordance with the NPPF and PPG that will allow the City Council to assess and understand any likely impacts from new edge and out of centre applications on the vitality and viability of each main centre; and
recommendations for primary and secondary shop frontages, as well as suitable Primary Shopping Area (PSA).
Centre Overview
Oxford City Centre
14.5 The health check assessment has demonstrated that overall Oxford is a vital and viable centre. It is currently
ranked 42nd in the national centre rankings. The major new current and planned investment in its shopping
offer and environment will help to further improve its ranking.
RETAIL AND LEISURE STUDY 2017 Page 132
14.6 The City Centre meets the new of a wide and diverse catchment and student population, as well as drawing
shoppers, visitors and tourists from further afield including from abroad. The strong and growing student
population further boosts the City’s retail and leisure economy. Overall, it appears that Oxford City Centre has
a very good range of shopping and leisure facilities typically found in a centre of its size and position in the
retail hierarchy.
14.7 Oxford City Centre has a welcoming and attractive environment. It has many historic and listed buildings, and
its relatively compact structure contributes well to the sense of place and character. The redevelopment of the
Westgate Shopping Centre represents a significant investment that will provide modern retail floorspace and a
mix of places to eat and drink in the heart of the City. This scheme will have a positive impact on the scale
and quality of the City’s offer.
14.8 The City centre has a good representation of leisure service provision with two cinemas, theatres and a wide
range of cafés and restaurants. This provision is set to be enhanced further with the opening of the new 5-
screen Curzon cinema as part of the redevelopment of the Westgate Shopping Centre.
14.9 The City Centre’s offer also benefits from two popular markets that provide a positive contribution and
uniqueness to the centre.
14.10 The opening of the Westgate Centre may result in some footfall and spend being diverted from the current
primary frontages, especially the Clarendon Centre and Cornmarket Street. This could mean that the existing
retail frontages may need to "re-invent" themselves to remain attractive and viable. The City centre has good
accessibility and pedestrian flows, however it could benefit from better street signage to improve permeability
and wayfinding. With the redevelopment of the Westgate Shopping Centre the existing pedestrian retail circuit
may change, as shoppers seek more direct access to the new facilities. This could result in the overall
structure of the City centre changing, with some traditional streets experiencing a fall in footfall, spend and
vibrancy over time. There will therefore be a need for the city to adapt to the changes arising from new
investment and development across the City Centre.
14.11 We recommend that he Council undertakes a strategic masterplan once the Westgate scheme has undergone
a ‘settling in’ period. This will enable the Council to assess the impacts of the new development on adjacent
retail areas and the wider retail circuit. This output could also contribute to providing a vision for the future of
the City Centre.
Summertown District Centre
14.12 Summertown District Centre is well located, with good accessibility and has a relatively pleasant environment.
The centre hosts a number of retail and retail facilities that are key attractors in contributing to the positive
vitality and viability of the centre. The centre has an above average provision of services with cafés and
restaurants significantly contributing in creating a vibrant evening economy.
14.13 The Ferry Leisure Centre and provision of additional leisure facilities (sports centre in Diamond Place, St.
Edwards School – theatre/exhibition venue) act as a further draw to the centre. The centre benefits from a
vibrant evening economy that helps to increase dwell times and footfall across the centre
14.14 The Centre should look to build on its independent offer, improving the quality of provision and building its
niche retail and service offer to help differentiate it from larger competing centres. There is also scope to
enhance the variety and choice of retailers. The current and emerging potential development sites need to be
considered (as part of the emerging Local Plan) for the continued vitality and viability of the centre.
RETAIL AND LEISURE STUDY 2017 Page 133
Cowley District Centre
14.15 Cowley District Centre performs a specific role in the retail hierarchy serving, to varying degrees, not only the
day-to-day needs of the local resident catchment population but also a wider catchment. Overall, the centre
has a generally pleasant environment. The refurbishment of the Templars Square Shopping Centre will bring
forward a range of significant improvements to create a more vibrant and thriving community across the
Centre this will help elevate its overall vitality and viability.
14.16 Attracting further high quality operators will help to maintain the centre’s overall vitality and viability especially
from additional quality cafés, restaurants and bars to help strengthen its daytime and evening offer, increase
dwell times and compete effectively with other centres. Improving the bottleneck and pedestrian connections
between the shopping centre and retail park will help to encourage seamless movement between the two
areas and further promote linked trips.
Headington District Centre
14.17 The centre meets the needs of its local resident catchment population. The centre has a strong foodstore and
convenience offer that is mainly dominated key supermarket operators; including Waitrose, Tesco,
Sainsburys, Iceland and the Co-op. The street market also makes an important contribution to the overall
attraction, vitality and viability of the town centre as a whole.
14.18 There would appear to be potential to improve the quality of the centre's comparison goods offer. Attracting a
wider range of quality (multiple and independent) retailers particularly fashion and footwear to the centre would
help the centre compete with other nearby District Centres. However, attracting and accommodating new
retailers will depend on forecast need and market demand, and the potential availability of suitable
sites/buildings in or on the edge of Headington.
14.19 The centre would benefit from a comprehensive review of its public realm and specifically the pavement areas.
We believe there could be potential to accommodate additional short-term lay-by parking along both London
Road and Windmill Road, without compromising the pedestrian environment. The provision of short term
parking bays would help to extend dwell times within the centre, thereby improving the early evening and
night-time economy.
14.20 The key to unlocking the potential of Headington as a retail and commercial leisure destination would be to
“capture” more of the traffic passing through the centre, and increase trips and dwell times.
Cowley Road District Centre
14.21 Cowley Road predominantly meets the needs of its ethnically and economically diverse resident catchment
population. It is highly accessible and is situated on a busy road in to the City Centre and as an interchange to
the other District Centres of Cowley and Blackbird Leys. It has a strong convenience and service outlet
provison when compared to the national average. The Centre’s leisure facilities (principally its cafés and
restaurants) are a key attractor that help to generate footfall and significant linked trips across the centre.
14.22 The centre requires a consolidation of a retail core and a clearer definition of the primary shopping area to
create a sense of character. There is significant potential to capitalise on the current leisure provision (both
multiples and independents), particularly to enhance the night time economy of the centre and to help increase
dwell times across the centre.
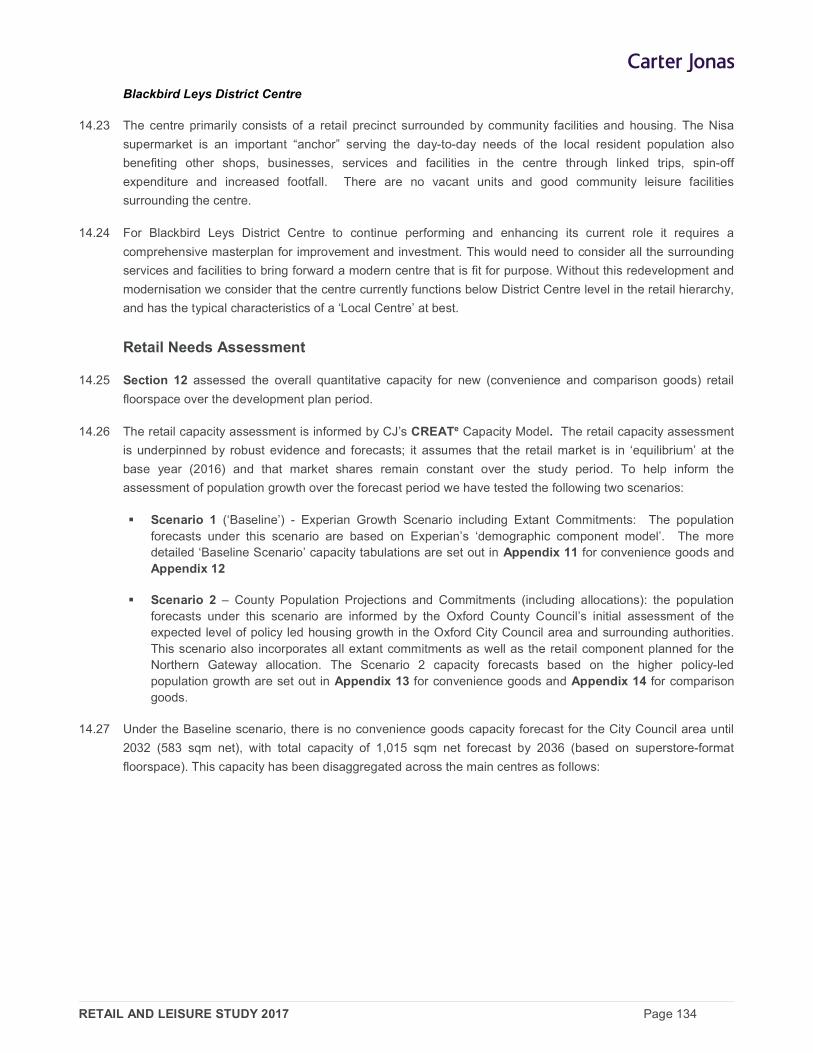
RETAIL AND LEISURE STUDY 2017 Page 134
Blackbird Leys District Centre
14.23 The centre primarily consists of a retail precinct surrounded by community facilities and housing. The Nisa
supermarket is an important “anchor” serving the day-to-day needs of the local resident population also
benefiting other shops, businesses, services and facilities in the centre through linked trips, spin-off
expenditure and increased footfall. There are no vacant units and good community leisure facilities
surrounding the centre.
14.24 For Blackbird Leys District Centre to continue performing and enhancing its current role it requires a
comprehensive masterplan for improvement and investment. This would need to consider all the surrounding
services and facilities to bring forward a modern centre that is fit for purpose. Without this redevelopment and
modernisation we consider that the centre currently functions below District Centre level in the retail hierarchy,
and has the typical characteristics of a ‘Local Centre’ at best.
Retail Needs Assessment
14.25 Section 12 assessed the overall quantitative capacity for new (convenience and comparison goods) retail
floorspace over the development plan period.
14.26 The retail capacity assessment is informed by CJ’s CREATe Capacity Model. The retail capacity assessment
is underpinned by robust evidence and forecasts; it assumes that the retail market is in ‘equilibrium’ at the
base year (2016) and that market shares remain constant over the study period. To help inform the
assessment of population growth over the forecast period we have tested the following two scenarios:
Scenario 1 (‘Baseline’) - Experian Growth Scenario including Extant Commitments: The population forecasts under this scenario are based on Experian’s ‘demographic component model’. The more detailed ‘Baseline Scenario’ capacity tabulations are set out in Appendix 11 for convenience goods and Appendix 12
Scenario 2 – County Population Projections and Commitments (including allocations): the population forecasts under this scenario are informed by the Oxford County Council’s initial assessment of the expected level of policy led housing growth in the Oxford City Council area and surrounding authorities. This scenario also incorporates all extant commitments as well as the retail component planned for the Northern Gateway allocation. The Scenario 2 capacity forecasts based on the higher policy-led population growth are set out in Appendix 13 for convenience goods and Appendix 14 for comparison goods.
14.27 Under the Baseline scenario, there is no convenience goods capacity forecast for the City Council area until
2032 (583 sqm net), with total capacity of 1,015 sqm net forecast by 2036 (based on superstore-format
floorspace). This capacity has been disaggregated across the main centres as follows:
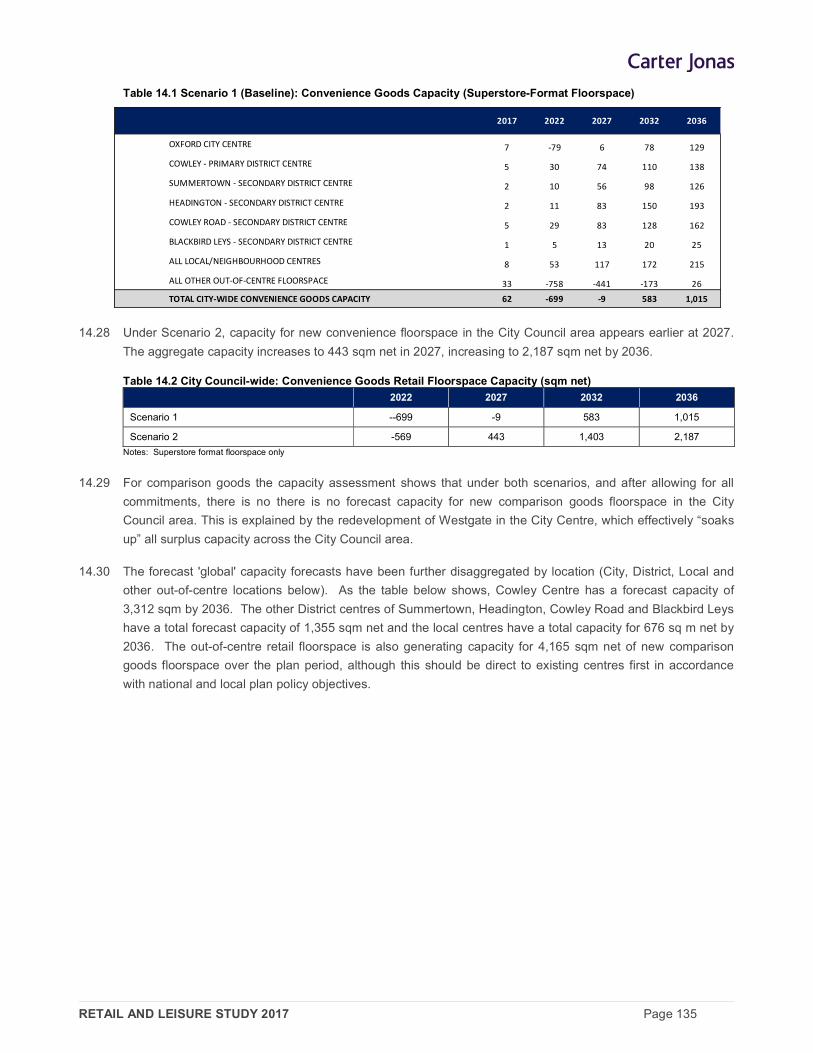
RETAIL AND LEISURE STUDY 2017 Page 135
Table 14.1 Scenario 1 (Baseline): Convenience Goods Capacity (Superstore-Format Floorspace)
2017 2022 2027 2032 2036
OXFORD CITY CENTRE 7 -79 6 78 129
COWLEY - PRIMARY DISTRICT CENTRE 5 30 74 110 138
SUMMERTOWN - SECONDARY DISTRICT CENTRE 2 10 56 98 126
HEADINGTON - SECONDARY DISTRICT CENTRE 2 11 83 150 193
COWLEY ROAD - SECONDARY DISTRICT CENTRE 5 29 83 128 162
BLACKBIRD LEYS - SECONDARY DISTRICT CENTRE 1 5 13 20 25
ALL LOCAL/NEIGHBOURHOOD CENTRES 8 53 117 172 215
ALL OTHER OUT-OF-CENTRE FLOORSPACE 33 -758 -441 -173 26
TOTAL CITY-WIDE CONVENIENCE GOODS CAPACITY 62 -699 -9 583 1,015
14.28 Under Scenario 2, capacity for new convenience floorspace in the City Council area appears earlier at 2027.
The aggregate capacity increases to 443 sqm net in 2027, increasing to 2,187 sqm net by 2036.
Table 14.2 City Council-wide: Convenience Goods Retail Floorspace Capacity (sqm net)
2022 2027 2032 2036
Scenario 1 --699 -9 583 1,015
Scenario 2 -569 443 1,403 2,187
Notes: Superstore format floorspace only
14.29 For comparison goods the capacity assessment shows that under both scenarios, and after allowing for all
commitments, there is no there is no forecast capacity for new comparison goods floorspace in the City
Council area. This is explained by the redevelopment of Westgate in the City Centre, which effectively “soaks
up” all surplus capacity across the City Council area.
14.30 The forecast 'global' capacity forecasts have been further disaggregated by location (City, District, Local and
other out-of-centre locations below). As the table below shows, Cowley Centre has a forecast capacity of
3,312 sqm by 2036. The other District centres of Summertown, Headington, Cowley Road and Blackbird Leys
have a total forecast capacity of 1,355 sqm net and the local centres have a total capacity for 676 sq m net by
2036. The out-of-centre retail floorspace is also generating capacity for 4,165 sqm net of new comparison
goods floorspace over the plan period, although this should be direct to existing centres first in accordance
with national and local plan policy objectives.
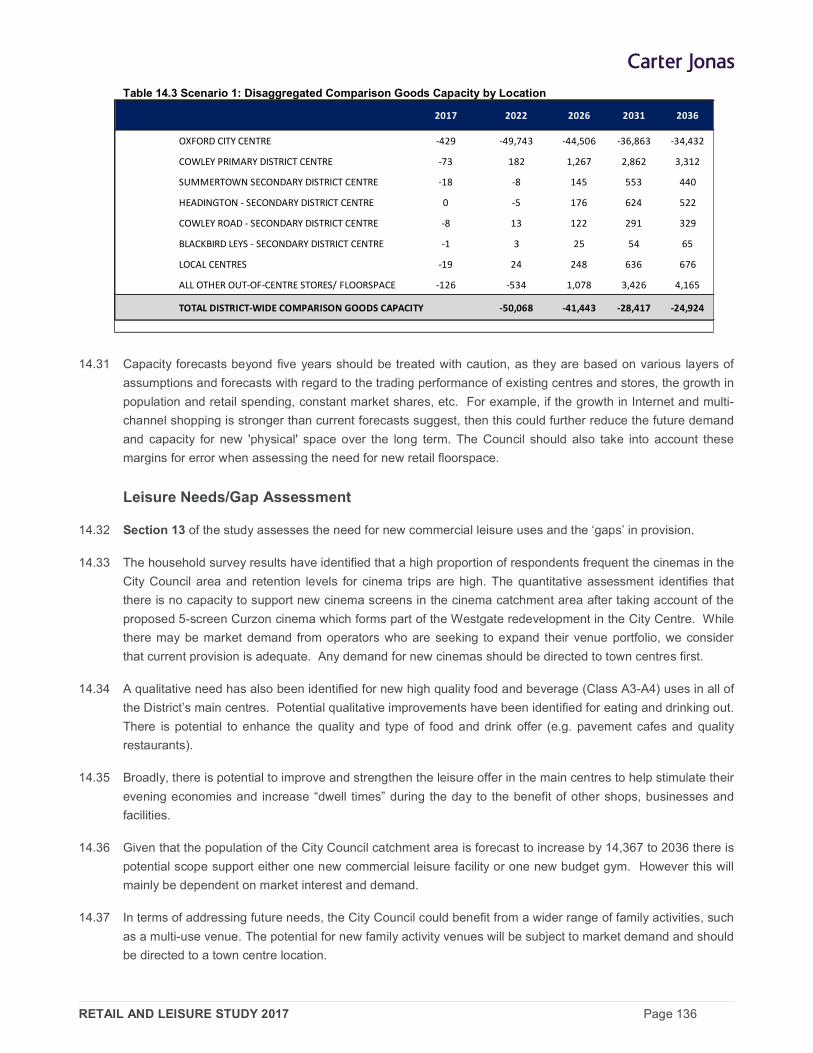
RETAIL AND LEISURE STUDY 2017 Page 136
Table 14.3 Scenario 1: Disaggregated Comparison Goods Capacity by Location
2017 2022 2026 2031 2036
OXFORD CITY CENTRE -429 -49,743 -44,506 -36,863 -34,432
COWLEY PRIMARY DISTRICT CENTRE -73 182 1,267 2,862 3,312
SUMMERTOWN SECONDARY DISTRICT CENTRE -18 -8 145 553 440
HEADINGTON - SECONDARY DISTRICT CENTRE 0 -5 176 624 522
COWLEY ROAD - SECONDARY DISTRICT CENTRE -8 13 122 291 329
BLACKBIRD LEYS - SECONDARY DISTRICT CENTRE -1 3 25 54 65
LOCAL CENTRES -19 24 248 636 676
ALL OTHER OUT-OF-CENTRE STORES/ FLOORSPACE -126 -534 1,078 3,426 4,165
TOTAL DISTRICT-WIDE COMPARISON GOODS CAPACITY -50,068 -41,443 -28,417 -24,924
14.31 Capacity forecasts beyond five years should be treated with caution, as they are based on various layers of
assumptions and forecasts with regard to the trading performance of existing centres and stores, the growth in
population and retail spending, constant market shares, etc. For example, if the growth in Internet and multi-
channel shopping is stronger than current forecasts suggest, then this could further reduce the future demand
and capacity for new 'physical' space over the long term. The Council should also take into account these
margins for error when assessing the need for new retail floorspace.
Leisure Needs/Gap Assessment
14.32 Section 13 of the study assesses the need for new commercial leisure uses and the ‘gaps’ in provision.
14.33 The household survey results have identified that a high proportion of respondents frequent the cinemas in the
City Council area and retention levels for cinema trips are high. The quantitative assessment identifies that
there is no capacity to support new cinema screens in the cinema catchment area after taking account of the
proposed 5-screen Curzon cinema which forms part of the Westgate redevelopment in the City Centre. While
there may be market demand from operators who are seeking to expand their venue portfolio, we consider
that current provision is adequate. Any demand for new cinemas should be directed to town centres first.
14.34 A qualitative need has also been identified for new high quality food and beverage (Class A3-A4) uses in all of
the District’s main centres. Potential qualitative improvements have been identified for eating and drinking out.
There is potential to enhance the quality and type of food and drink offer (e.g. pavement cafes and quality
restaurants).
14.35 Broadly, there is potential to improve and strengthen the leisure offer in the main centres to help stimulate their
evening economies and increase “dwell times” during the day to the benefit of other shops, businesses and
facilities.
14.36 Given that the population of the City Council catchment area is forecast to increase by 14,367 to 2036 there is
potential scope support either one new commercial leisure facility or one new budget gym. However this will
mainly be dependent on market interest and demand.
14.37 In terms of addressing future needs, the City Council could benefit from a wider range of family activities, such
as a multi-use venue. The potential for new family activity venues will be subject to market demand and should
be directed to a town centre location.
RETAIL AND LEISURE STUDY 2017 Page 137
14.38 Furthermore, the City Council area benefits from a diverse range of arts and historic attractions the majority of
which are located within or near the City Centre. These contribute significantly to the visitor economy of the
area and need to be maintained and promoted to maintain their current status. The scope to expand the
number and quality of the hotel provision in line with the demand from the visitor economy is subject to market
demand and availability of sites.
Meeting Needs in the Main Centres
14.39 The capacity assessment has shown that there is no identified capacity for comparison goods and a limited
amount for convenience goods. For convenience goods there is forecast capacity for 1,015 sqm net of new
‘superstore format’ floorspace by 2036 (Scenario 1), increasing to 2,187 sq m net under Scenario 2. In our
judgement the majority of the identified need for new convenience goods floorspace can be met by extensions
to existing stores (where possible) or by small convenience stores. The capacity identified under Scenario 2,
could support a larger format store up to 3,000-4,000 sqm gross.
14.40 Our review of the current performance of the main centres has been informed by the findings of the most up-
to-date evidence and research, including the health checks, centre audits and household survey. Our
assessment is based on our understanding of the potential availability and suitability of key sites in the main
town centres based on discussions with the local planning authority. It also draws on our market knowledge of
the current businesses models and requirements of retailers, and the likely scale, format and location of space
that they will be seeking over the development plan period. On this basis, the identified capacity should be
directed to the City and District centres as the sequentially preferable locations.
14.41 Broadly, our assessment shows the realistic potential for the following sites to accommodate the identified
need:
City centre - Oxpens site: It is located between Oxford Railway Station, the Westgate Centre and the River Thames. The Oxpens site is owned jointly by Oxford City Council and London and County Railways. At the time of writing this report we understand that the City Council recently acquired a significant land holding from the Rail Residuary Body and are now the main landowner. In order to progress the development of this site the City Council have set up a development partnership arrangement with Nuffield College. The Oxpens SPD builds on the policy set out in the Oxford West End AAP. The site provides an opportunity to deliver housing, offices, research and development space, a hotel and other local amenities. Additionally, some initial masterplanning has jointly been undertaken between Network Rail; City Council and County Council. This illustrative masterplan indicates that the Council wishes to achieve up to 1,500 sq m of A1 – A5 floorspace. This site could therefore provide an opportunity to accommodate new more viable retail/leisure uses.
City Centre - Station site: The site itself comprises mainly two sites: namely site 1 (existing station) and site 8 (Becket Street car park). The site is closely located to the Oxpens site. The Oxford Station Masterplan has been developed in partnership between Oxford City Council, Oxfordshire County Council and Network Rail and was launched in July 2014. The masterplan outlines the long-term vision for the station and its surrounding area. Development opportunities in and around the station entrance include the potential for leisure / retail / office / hotel / education / residential uses. We consider that this area has the potential to grow and flourish to accommodate ancillary retail particularly convenience provision to satisfy the transient commuting population.
Summertown – Majestic Warehouse Site: This site is under one ownership but let out on individual leases to a range of occupiers. The leases we understand will be ending in the next few years. The site is in a prominent location and could accommodate additional food and beverage uses to complement the existing provision in this area. There is therefore a prospect for a potential mixed-use development.
RETAIL AND LEISURE STUDY 2017 Page 138
Local Impact Threshold: Recommendations
14.42 We have also assessed whether there is a requirement for the local planning authority to set a local
(floorspace-based) impact threshold, rather than use the default of 2,500 sqm gross identified by the NPPF
(paragraph 26). This is important as it will determine whether applicants should carry out an impact
assessment for new retail, leisure and office development outside of town centres that are not in accordance
with an up-to-date Local Plan.
14.43 In summary the Planning Practice Guidance (PPG) published in March 2014 provides advice in setting a
locally appropriate threshold and states that it will be important to consider the:
scale of proposals relative to town centres;
the existing viability and vitality of town centres;
cumulative effects of recent developments;
whether local town centres are vulnerable;
likely effects of development on any town centre strategy; and
impact on any other planned investment.
14.44 While the quantitative and qualitative research evidence indicates that the main towns and smaller centres in
appear to be vital and viable, they are nevertheless vulnerable to increased competition from out-of-centre
retailing and the growth of internet shopping.
14.45 Our assessment of retail trends in Section 3 has highlighted the dynamic growth in smaller convenience
stores operated by the major grocers (i.e. Sainsbury’s Local, Tesco Express, Little Waitrose, etc.). Although
sizes vary from location-to-location, the main grocers are generally seeking new convenience stores (e.g.
Tesco Express, Sainsbury’s Local, Little Waitrose) with a minimum gross floorspace of circa 4,000 sq ft (372
sqm) gross. In circumstances where these smaller stores are proposed on the edge or outside of smaller local
and village centres, often as part of petrol filling stations, they could result in a significant adverse impact on
their trading performance, and overall vitality and viability. This will particularly be the case where smaller
centres and villages are dependent on smaller supermarkets and convenience (‘top-up’) stores to anchor their
retail offer and generate footfall and linked trips/expenditure to the benefit of other shops, services and
facilities.
14.46 In addition, modern retailers selling a range of comparison goods (including fashion, homestore and ‘bulky’
goods retailers) generally have requirements for larger format shop units with a minimum floorspace of
approximately 5,000 sq ft (465 sqm) gross. This scale of floorspace provides operators with the necessary
minimum ‘critical mass’ of sales needed to display their full range of goods in-store and attract customers from
a wider catchment area, particularly where they are co-located alongside similar stores in town centre and out-
of-centre locations. In general terms larger format non-food stores of over 5,000 sq ft gross are also unlikely
to trade as a purely local facility.
14.47 We therefore conclude in this case that it is reasonable for applicants proposing developments for new
comparison and convenience goods retailing of 350 sqm gross and above to demonstrate that they will not
have a significant adverse impact cumulatively with other commitments in the area, in accordance with the
NPPF on any defined centre within the City Council area.
RETAIL AND LEISURE STUDY 2017 Page 139
14.48 In our judgement this is a reasonable impact threshold as it will provide the local planning authority with
sufficient flexibility to assess the merits and implications of edge and out-of-centre foodstore applications that
could potentially have significant implications for the viability and delivery of new or extended floorspace in
these existing centres. We also advise that this threshold should be applied, where relevant, to change of use
applications and applications seeking variations of conditions.
14.49 In our experience a 350 sqm gross impact threshold is reasonable in this case based on our experience of
advising other local planning authorities, and also drawing on the minimum impact thresholds identified in
recently adopted local plans (including, for example, Richmondshire District Council, Rother District Council,
Rotherham Metropolitan Council, Stafford Borough Council, Warrington Borough Council and Norwich City
Council).
14.50 Notwithstanding the adoption of a lower locally set impact threshold, it is important that the scope of any Retail
Impact Assessment (RIA) in support of planning applications is discussed and agreed between the applicants
and the Council at an early stage in the pre-application process. The level of detail included within a RIA
should be proportionate to the scale and type of retail floorspace proposed, and should be agreed between the
Council and applicant on a case-by-case basis. In all cases the local planning authority should adopt a
pragmatic and reasonable approach with regard to the scope and detail of evidence required in support of
planning applications.
Primary and Secondary Shop Frontages: Recommendations
14.51 We have also reviewed and identified the extent of each centre's primary and secondary shopping frontages.
Our detailed assessment is set out in Appendix 15.
14.52 In setting out policies for the management and growth of centres over the plan period, and promoting
competitive town centre environments, local planning authorities are required by the NPPF (paragraph 23) to
define the extent of town centres and primary shopping areas, based on a clear definition of primary and
secondary frontages in designated centres and set policies that make clear which uses will be permitted in
such locations.
14.53 Our assessment has been informed by the evidence provided by Oxford City Council, including audits
detailing the current mix of Class A uses in each of the main centres on a street-by-street basis. This has been
further supplemented by our health checks and site visits of the main centres. Additionally, we have also
undertaken a review of policies from Development Plan Documents issued by other Local Planning
Authorities.
14.54 Our broad conclusion is that the Council’s current policies are restrictive with a tendency towards measuring
and retaining a proportion of the number of A1 units within the defined Primary Shopping frontage (PSF) or
Secondary Shopping Frontage (SSF). However, there is a need for the centres within the City Council area to
adapt to future changes. As noted in Section 2, the ratio of Use Class ‘A’ type of uses is changing with an
inclination towards leisure related uses such as bars, cafes and restaurants as well as other leisure uses.
14.55 Our recommendation is therefore towards a ‘hybrid’ policy. We recommend that policies aim to retain a certain
proportion of A1 type uses in the PSF, but allow, as an ‘exception’, for other town centre uses (as defined by
the NPPF) where these would not have a significant adverse impact on the role and function of the centre in
question assessed against a defined criteria. A similar approach could be adopted to control development of
SSF’s where a certain percentage of Class ‘A’ uses is retained.
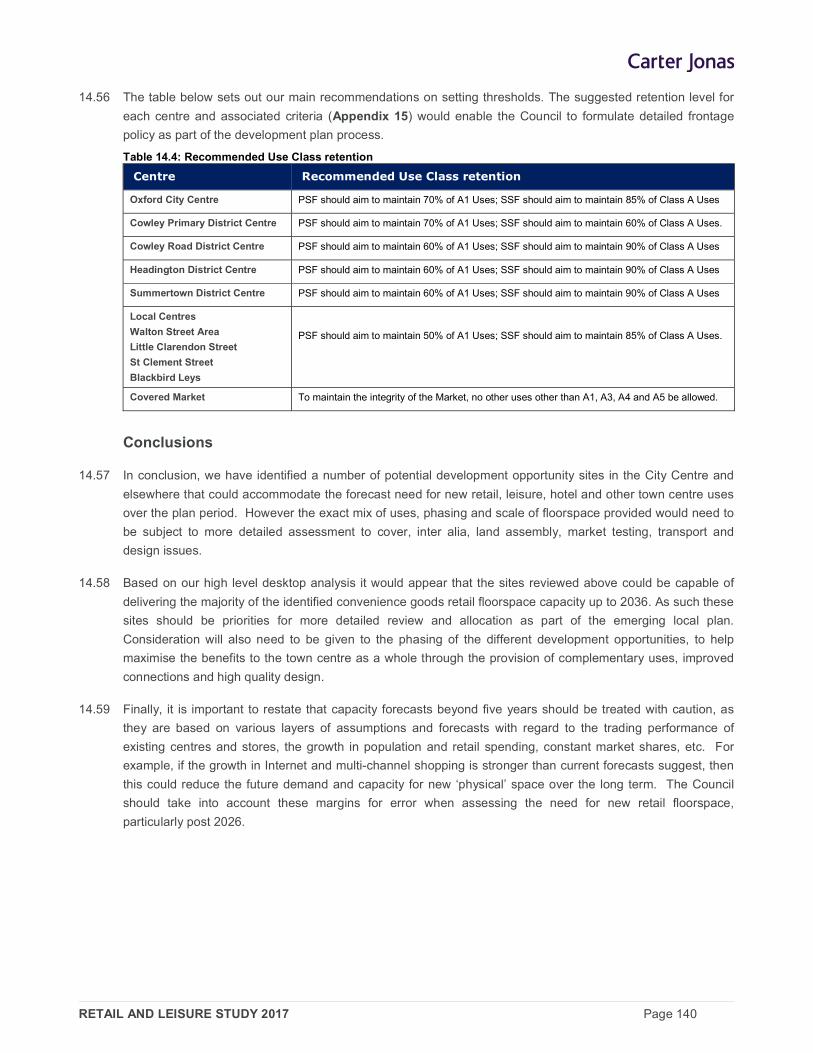
RETAIL AND LEISURE STUDY 2017 Page 140
14.56 The table below sets out our main recommendations on setting thresholds. The suggested retention level for
each centre and associated criteria (Appendix 15) would enable the Council to formulate detailed frontage
policy as part of the development plan process.
Table 14.4: Recommended Use Class retention
Centre Recommended Use Class retention
Oxford City Centre PSF should aim to maintain 70% of A1 Uses; SSF should aim to maintain 85% of Class A Uses
Cowley Primary District Centre PSF should aim to maintain 70% of A1 Uses; SSF should aim to maintain 60% of Class A Uses.
Cowley Road District Centre PSF should aim to maintain 60% of A1 Uses; SSF should aim to maintain 90% of Class A Uses
Headington District Centre PSF should aim to maintain 60% of A1 Uses; SSF should aim to maintain 90% of Class A Uses
Summertown District Centre PSF should aim to maintain 60% of A1 Uses; SSF should aim to maintain 90% of Class A Uses
Local Centres
Walton Street Area
Little Clarendon Street
St Clement Street
Blackbird Leys
PSF should aim to maintain 50% of A1 Uses; SSF should aim to maintain 85% of Class A Uses.
Covered Market To maintain the integrity of the Market, no other uses other than A1, A3, A4 and A5 be allowed.
Conclusions
14.57 In conclusion, we have identified a number of potential development opportunity sites in the City Centre and
elsewhere that could accommodate the forecast need for new retail, leisure, hotel and other town centre uses
over the plan period. However the exact mix of uses, phasing and scale of floorspace provided would need to
be subject to more detailed assessment to cover, inter alia, land assembly, market testing, transport and
design issues.
14.58 Based on our high level desktop analysis it would appear that the sites reviewed above could be capable of
delivering the majority of the identified convenience goods retail floorspace capacity up to 2036. As such these
sites should be priorities for more detailed review and allocation as part of the emerging local plan.
Consideration will also need to be given to the phasing of the different development opportunities, to help
maximise the benefits to the town centre as a whole through the provision of complementary uses, improved
connections and high quality design.
14.59 Finally, it is important to restate that capacity forecasts beyond five years should be treated with caution, as
they are based on various layers of assumptions and forecasts with regard to the trading performance of
existing centres and stores, the growth in population and retail spending, constant market shares, etc. For
example, if the growth in Internet and multi-channel shopping is stronger than current forecasts suggest, then
this could reduce the future demand and capacity for new ‘physical’ space over the long term. The Council
should take into account these margins for error when assessing the need for new retail floorspace,
particularly post 2026.
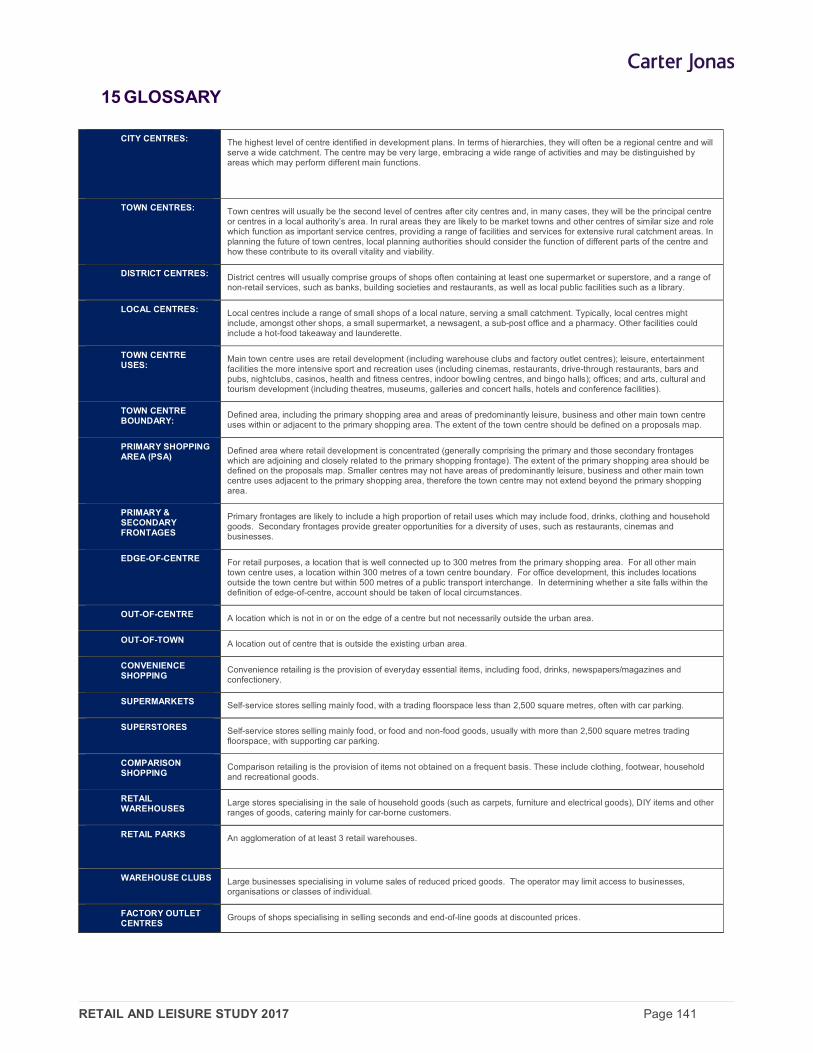
RETAIL AND LEISURE STUDY 2017 Page 141
15 GLOSSARY
CITY CENTRES: The highest level of centre identified in development plans. In terms of hierarchies, they will often be a regional centre and will serve a wide catchment. The centre may be very large, embracing a wide range of activities and may be distinguished by areas which may perform different main functions.
TOWN CENTRES: Town centres will usually be the second level of centres after city centres and, in many cases, they will be the principal centre or centres in a local authority’s area. In rural areas they are likely to be market towns and other centres of similar size and role which function as important service centres, providing a range of facilities and services for extensive rural catchment areas. In planning the future of town centres, local planning authorities should consider the function of different parts of the centre and how these contribute to its overall vitality and viability.
DISTRICT CENTRES: District centres will usually comprise groups of shops often containing at least one supermarket or superstore, and a range of non-retail services, such as banks, building societies and restaurants, as well as local public facilities such as a library.
LOCAL CENTRES: Local centres include a range of small shops of a local nature, serving a small catchment. Typically, local centres might include, amongst other shops, a small supermarket, a newsagent, a sub-post office and a pharmacy. Other facilities could include a hot-food takeaway and launderette.
TOWN CENTRE USES:
Main town centre uses are retail development (including warehouse clubs and factory outlet centres); leisure, entertainment facilities the more intensive sport and recreation uses (including cinemas, restaurants, drive-through restaurants, bars and pubs, nightclubs, casinos, health and fitness centres, indoor bowling centres, and bingo halls); offices; and arts, cultural and tourism development (including theatres, museums, galleries and concert halls, hotels and conference facilities).
TOWN CENTRE BOUNDARY:
Defined area, including the primary shopping area and areas of predominantly leisure, business and other main town centre uses within or adjacent to the primary shopping area. The extent of the town centre should be defined on a proposals map.
PRIMARY SHOPPING AREA (PSA)
Defined area where retail development is concentrated (generally comprising the primary and those secondary frontages which are adjoining and closely related to the primary shopping frontage). The extent of the primary shopping area should be defined on the proposals map. Smaller centres may not have areas of predominantly leisure, business and other main town centre uses adjacent to the primary shopping area, therefore the town centre may not extend beyond the primary shopping area.
PRIMARY & SECONDARY FRONTAGES
Primary frontages are likely to include a high proportion of retail uses which may include food, drinks, clothing and household goods. Secondary frontages provide greater opportunities for a diversity of uses, such as restaurants, cinemas and businesses.
EDGE-OF-CENTRE For retail purposes, a location that is well connected up to 300 metres from the primary shopping area. For all other main town centre uses, a location within 300 metres of a town centre boundary. For office development, this includes locations outside the town centre but within 500 metres of a public transport interchange. In determining whether a site falls within the definition of edge-of-centre, account should be taken of local circumstances.
OUT-OF-CENTRE A location which is not in or on the edge of a centre but not necessarily outside the urban area.
OUT-OF-TOWN A location out of centre that is outside the existing urban area.
CONVENIENCE SHOPPING
Convenience retailing is the provision of everyday essential items, including food, drinks, newspapers/magazines and confectionery.
SUPERMARKETS Self-service stores selling mainly food, with a trading floorspace less than 2,500 square metres, often with car parking.
SUPERSTORES Self-service stores selling mainly food, or food and non-food goods, usually with more than 2,500 square metres trading floorspace, with supporting car parking.
COMPARISON SHOPPING
Comparison retailing is the provision of items not obtained on a frequent basis. These include clothing, footwear, household and recreational goods.
RETAIL WAREHOUSES
Large stores specialising in the sale of household goods (such as carpets, furniture and electrical goods), DIY items and other ranges of goods, catering mainly for car-borne customers.
RETAIL PARKS An agglomeration of at least 3 retail warehouses.
WAREHOUSE CLUBS Large businesses specialising in volume sales of reduced priced goods. The operator may limit access to businesses, organisations or classes of individual.
FACTORY OUTLET CENTRES
Groups of shops specialising in selling seconds and end-of-line goods at discounted prices.
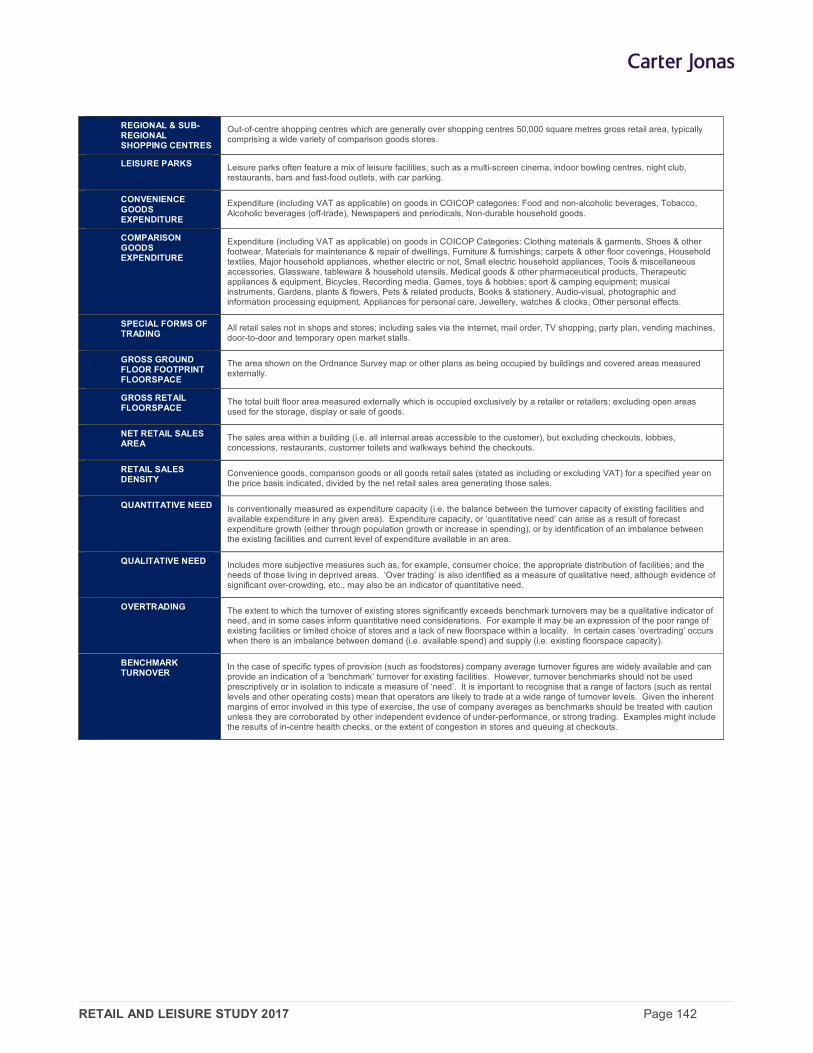
RETAIL AND LEISURE STUDY 2017 Page 142
REGIONAL & SUB-REGIONAL SHOPPING CENTRES
Out-of-centre shopping centres which are generally over shopping centres 50,000 square metres gross retail area, typically comprising a wide variety of comparison goods stores.
LEISURE PARKS Leisure parks often feature a mix of leisure facilities, such as a multi-screen cinema, indoor bowling centres, night club, restaurants, bars and fast-food outlets, with car parking.
CONVENIENCE GOODS EXPENDITURE
Expenditure (including VAT as applicable) on goods in COICOP categories: Food and non-alcoholic beverages, Tobacco, Alcoholic beverages (off-trade), Newspapers and periodicals, Non-durable household goods.
COMPARISON GOODS EXPENDITURE
Expenditure (including VAT as applicable) on goods in COICOP Categories: Clothing materials & garments, Shoes & other footwear, Materials for maintenance & repair of dwellings, Furniture & furnishings; carpets & other floor coverings, Household textiles, Major household appliances, whether electric or not, Small electric household appliances, Tools & miscellaneous accessories, Glassware, tableware & household utensils, Medical goods & other pharmaceutical products, Therapeutic appliances & equipment, Bicycles, Recording media, Games, toys & hobbies; sport & camping equipment; musical instruments, Gardens, plants & flowers, Pets & related products, Books & stationery, Audio-visual, photographic and information processing equipment, Appliances for personal care, Jewellery, watches & clocks, Other personal effects.
SPECIAL FORMS OF TRADING
All retail sales not in shops and stores; including sales via the internet, mail order, TV shopping, party plan, vending machines, door-to-door and temporary open market stalls.
GROSS GROUND FLOOR FOOTPRINT FLOORSPACE
The area shown on the Ordnance Survey map or other plans as being occupied by buildings and covered areas measured externally.
GROSS RETAIL FLOORSPACE
The total built floor area measured externally which is occupied exclusively by a retailer or retailers; excluding open areas used for the storage, display or sale of goods.
NET RETAIL SALES AREA
The sales area within a building (i.e. all internal areas accessible to the customer), but excluding checkouts, lobbies, concessions, restaurants, customer toilets and walkways behind the checkouts.
RETAIL SALES DENSITY
Convenience goods, comparison goods or all goods retail sales (stated as including or excluding VAT) for a specified year on the price basis indicated, divided by the net retail sales area generating those sales.
QUANTITATIVE NEED Is conventionally measured as expenditure capacity (i.e. the balance between the turnover capacity of existing facilities and available expenditure in any given area). Expenditure capacity, or ‘quantitative need’ can arise as a result of forecast expenditure growth (either through population growth or increase in spending), or by identification of an imbalance between the existing facilities and current level of expenditure available in an area.
QUALITATIVE NEED Includes more subjective measures such as, for example, consumer choice; the appropriate distribution of facilities; and the needs of those living in deprived areas. ‘Over trading’ is also identified as a measure of qualitative need, although evidence of significant over-crowding, etc., may also be an indicator of quantitative need.
OVERTRADING The extent to which the turnover of existing stores significantly exceeds benchmark turnovers may be a qualitative indicator of need, and in some cases inform quantitative need considerations. For example it may be an expression of the poor range of existing facilities or limited choice of stores and a lack of new floorspace within a locality. In certain cases ‘overtrading’ occurs when there is an imbalance between demand (i.e. available spend) and supply (i.e. existing floorspace capacity).
BENCHMARK TURNOVER
In the case of specific types of provision (such as foodstores) company average turnover figures are widely available and can provide an indication of a ‘benchmark’ turnover for existing facilities. However, turnover benchmarks should not be used prescriptively or in isolation to indicate a measure of ‘need’. It is important to recognise that a range of factors (such as rental levels and other operating costs) mean that operators are likely to trade at a wide range of turnover levels. Given the inherent margins of error involved in this type of exercise, the use of company averages as benchmarks should be treated with caution unless they are corroborated by other independent evidence of under-performance, or strong trading. Examples might include the results of in-centre health checks, or the extent of congestion in stores and queuing at checkouts.

RETAIL AND LEISURE STUDY 2017
APPENDIX 1: STUDY AREA
RETAIL AND LEISURE STUDY 2017
APPENDIX 2: HOUSEHOLD SURVEY RESULTS (WEIGHTED)

RETAIL AND LEISURE STUDY 2017
APPENDIX 3: IN-CENTRE SURVEY RESULTS

RETAIL AND LEISURE STUDY 2017
APPENDIX 4: OXFORD CITY CENTRE – RETAILER REQUIREMENTS

RETAIL AND LEISURE STUDY 2017
APPENDIX 5: POPULATION PROJECTIONS: SCENARIO(S) 1 AND 2

RETAIL AND LEISURE STUDY 2017
APPENDIX 6: AVAILABLE CONVENIENCE AND COMPARISON GOODS EXPENDITURE: SCENARIO(S) 1 AND 2

RETAIL AND LEISURE STUDY 2017
APPENDIX 7: CONVENIENCE GOODS - MARKET SHARES (INCL SFT) SCENARIO 1

RETAIL AND LEISURE STUDY 2017
APPENDIX 8: COMPARISON GOODS - MARKET SHARES (INCL SFT) SCENARIO 1

RETAIL AND LEISURE STUDY 2017
APPENDIX 9: CONVENIENCE GOODS TURNOVER: BASELINE: SCENARIO 1

RETAIL AND LEISURE STUDY 2017
APPENDIX 10: COMPARISON GOODS TURNOVER: BASELINE: SCENARIO 1

RETAIL AND LEISURE STUDY 2017
APPENDIX 11: CONVENIENCE GOODS CAPACITY FORECASTS: BASELINE: SCENARIO 1

RETAIL AND LEISURE STUDY 2017
APPENDIX 12: COMPARISON GOODS CAPACITY ASSESSMENT: BASELINE: SCENARIO 1

RETAIL AND LEISURE STUDY 2017
APPENDIX 13: CONVENIENCE GOODS CAPACITY ASSESSMENT: HIGHER POPULATION GROWTH: SCENARIO 2

RETAIL AND LEISURE STUDY 2017
APPENDIX 14: COMPARISON GOODS CAPACITY ASSESSMENT: HIGHER POPULATION GROWTH: SCENARIO 2

RETAIL AND LEISURE STUDY 2017
APPENDIX 15: FRONTAGES POLICY REVIEW
Related Documents