Royal Borough of Kensington & Chelsea Retail and Leisure Needs Assessment November 2021

Welcome message from author
This document is posted to help you gain knowledge. Please leave a comment to let me know what you think about it! Share it to your friends and learn new things together.
Transcript

Royal Borough of Kensington & Chelsea
Retail and Leisure Needs Assessment
November 2021

urbanshape.co.uk Caroline Marginson BSc (Hons) MA MRTPI Director
020 3745 8987 / 07940 571 818
Registered in England number 10720180

Royal Borough of Kensington and Chelsea Retail and Leisure Needs Assessment and Town Centre Study, November 2021
www.urbanshape.co.uk 1
Contents
Section 1 | Introduction | 02
Section 2 | Policy Framework and Legislative Change | 05
Section 3 | National Retail & Leisure Trends | 18
Section 4 | Sub-Regional Context | 28
Section 5 | Knightsbridge | 39
Section 6 | King’s Road (East) | 45
Section 7 | Kensington High Street | 51
Section 8 | Earls Court Road | 60
Section 9 | Fulham Road (West) | 67
Section 10 | King’s Road (West) | 73
Section 11 | Brompton Cross | 78
Section 12 | South Kensington | 82
Section 13 | Notting Hill Gate | 88
Section 14 | Portobello Road | 95
Section 15 | Westbourne Grove | 101
Section 16 | Quantitative Need Forecasts | 106
Section 17 | Leisure Assessment | 118
Section 18 | Conclusions and Recommendations | 131
Appendix 1 Convenience Goods Need Forecasts
Appendix 2 Comparison Goods Need Forecasts
Appendix 3 Convenience Goods Floorspace Performance

Royal Borough of Kensington and Chelsea Retail and Leisure Needs Assessment and Town Centre Study, November 2021
www.urbanshape.co.uk 2
1. Introduction
1.1 Urban Shape and Hatch have been instructed by the Royal Borough of Kensington and Chelsea
(RBKC) to undertake a Retail and Leisure Needs Assessment and Town Centre Study. The previous
evidence base is now out-of-date in light of recent planning reform, continued economic
fluctuations, and the fast paced evolution of the high street. It is timely to revisit and refresh the
borough’s retail and town centre strategy. This up-to-date assessment forms a key part of the
evidence base in support of the new Local Plan, forecasting floorspace need for retail and wider
town centre uses, and informing the future function and composition of the borough’s town
centres.
1.2 This study comes at a pivotal time for the high street, with the retail and leisure sector undergoing
a period of unprecedented change. Since the publication of the previous (full) Retail Needs Study
in 2008, town centres have had to evolve to become more than simply a place to shop, presenting
themselves as multi-purpose ‘destinations’. For many this is work in progress. Key contributory
factors to this evolution have included the continued rise of online shopping and home delivery
dining, and ongoing economic uncertainty triggered by Brexit and now the Covid-19 global health
pandemic. There is much optimism for the future of our high streets, but the need for a robust
town centre strategy is more crucial now than ever.
1.3 This evidence base includes two separate reports, which should be read in conjunction with each
other:
▪ Retail and Leisure Needs Assessment, prepared by Urban Shape
▪ Future Town Centres Report, prepared by Hatch
Retail and Leisure Needs Assessment
1.4 This study provides RBKC with an up-to-date and comprehensive understanding of the current
health and performance of the retail and leisure offer within the existing network of town centres,
sets out current and future needs for additional floorspace to the period 2043, and details robust
strategic and detail planning policy recommendations. The study meets the policy requirements of
the NPPF and PPG in the preparation of the Council’s development plan.
1.5 Our terms of reference are to:
▪ Establish the extent to which the current retail and leisure provision satisfies the level and
nature of consumer demand within the catchment – both qualitatively and quantitatively;
▪ Identify the scale and nature of additional convenience and comparison retail provision that
may be appropriate across the study area to the period 2043, taking into consideration changes
to population and forecast retail expenditure;
▪ Assess the scope for new retail and leisure development and the potential to accommodate this
sequentially across the borough;
▪ Assess the appropriateness of the existing development plan policy approach for retail and main
town centre uses, and provide recommendations to inform emerging policies for the new Local
Plan.

Royal Borough of Kensington and Chelsea Retail and Leisure Needs Assessment and Town Centre Study, November 2021
www.urbanshape.co.uk 3
1.6 In addition to on-site and desk-based research, further evidence is provided by way of a household
telephone survey of shopping and leisure patterns across the Borough, as well as adjacent
surrounding areas where residents may travel to meet their shopping and leisure needs. This is
referred to throughout the report as the ‘survey area’. The household telephone survey was
undertaken by NEMS Market Research in February 2021. The survey questionnaire and format was
agreed with the Council, and the survey area was also circulated to neighbouring authorities under
Duty to Co-Operate for comment.
Figure 1.1: RBKC Household Telephone Interview Survey
Future Town Centres Report
1.7 The Future Town Centres Report, prepared by Hatch, forms a separate accompanying document
providing complementary insight and analysis. It considers the challenges that town centres are
facing; the performance of the borough’s town centres; the strengths, weaknesses, opportunities
and threats in each of the individual town centres; and provides recommendations on how the
Council could support them to adapt and diversify, indicating future identity and characterisation.
A key complementary theme running through the report relates to non-retail uses that could be
introduced to improve the resilience of the borough’s town centres alongside retail. Some of the
recommendations and reflections provided are drawn upon and included in the Retail and Leisure
Needs Assessment.

Royal Borough of Kensington and Chelsea Retail and Leisure Needs Assessment and Town Centre Study, November 2021
www.urbanshape.co.uk 4
Report Structure
1.8 The Retail and Leisure Assessment is structured as follows:
▪ Section 2 summarises the national and local planning policies relevant to retail and town
centres across RBKC, and discusses recent legislative changes to the planning system.
▪ Section 3 considers the national context in terms of economic and sectoral trends.
▪ Section 4 considers the wider sub-regional context, analysing shopping patterns and market
share across RBKC and the wider sub-region, and providing comparisons with previous
evidence base studies in order to identify trends.
▪ Section 5-15 provides detailed town centre health checks of the 12 higher order town centres
in RBKC:
o Knightsbridge International Centre
o Knightsbridge International Centre;
o King’s Road (East) Major Centre;
o Kensington High Street Major Centre;
o Earls Court Road District Centre;
o Fulham Road (West) District Centre;
o King’s Road (West) District Centre;
o Brompton Cross District Centre;
o South Kensington District Centre;
o Notting Hill Gate District Centre;
o Portobello Road Special District Centre;
o Westbourne Grove Special District Centre.
▪ Section 16 sets out the quantitative ‘need’ for additional convenience and comparison goods
retail floorspace to the period 2043.
▪ Section 17 draws the analysis from both the ‘Retail and Leisure Assessment’ and ‘Future Town
Centres Report’ together and sets out our conclusions and recommendations.

Royal Borough of Kensington and Chelsea Retail and Leisure Needs Assessment and Town Centre Study, November 2021
www.urbanshape.co.uk 5
2. Policy Context and Legislative Change
2.1 In this section, we summarise the points of relevance from national and local planning policy,
which provide the context and framework for the remainder of this study. In recent months there
have been sweeping amendments to planning legislation which have direct and significant
implications for emerging development plans and detailed development management policies.
This section notes the most recent publication of the NPPF, and outlines the relevant key changes
to the Use Classes Order and Permitted Development Rights.
National Planning Policy Framework (July 2021)
2.2 The Government published the new version of the NPPF in July 2021, confirming in a statement
that the intention is to ‘place greater emphasis on beauty, place-making, the environment, and
sustainable development and underlines the importance of local design codes’. There are no
changes of relevance to retail and town centres, which continues to ensure the vitality of town
centres, placing them at the heart of their communities, and encouraging a positive approach to
their growth, management and adaptation.
2.3 In order to be considered ‘sound’, Local Plans should be positively prepared, justified, deliverable
and consistent with national policy. The NPPF is a material consideration in planning decisions.
2.4 Paragraph 53 and 54 of the newly published NPPF provides new guidance for the use of Article 4
Directions, in the context of newly introduced Permitted Development. Changes to planning
legislation, and the reasoning behind these new NPPF paragraphs, is discussed in more detail later
in this section, but we quote paragraph 53 and 54 of the NPPF as follows:
“53. The use of Article 4 directions to remove national permitted development
rights should:
▪ where they relate to change from non-residential use to residential use, be
limited to situations where an Article 4 direction is necessary to avoid wholly
unacceptable adverse impacts (this could include the loss of the essential core
of a primary shopping area which would seriously undermine its vitality and
viability, but would be very unlikely to extend to the whole of a town centre);
▪ in other cases, be limited to situations where an Article 4 direction is necessary
to protect local amenity or the well-being of the area (this could include the
use of Article 4 directions to require planning permission for the demolition of
local facilities);
▪ in all cases, be based on robust evidence, and apply to the smallest
geographical area possible.
54. Similarly, planning conditions should not be used to restrict national permitted
development rights unless there is clear justification to do so.”
2.5 Section 7 seeks to ensure the vitality of town centres, emphasising that planning policies and
decisions should support the role that town centres play at the heart of local communities, with a
positive approach taken to their growth, management and adaptation.

Royal Borough of Kensington and Chelsea Retail and Leisure Needs Assessment and Town Centre Study, November 2021
www.urbanshape.co.uk 6
2.6 Section 7 emphasises that planning policies are encouraged to seek a series of outcomes relating to
the long-term vitality and viability of the hierarchy of town centres, the extent of primary shopping
areas and the location of sufficient development opportunity sites. Local authorities are
encouraged to define a network and hierarchy of town centres and to promote their long-term
vitality and viability, facilitating them to grow and diversify in a way that can respond to rapid
changes in the retail and leisure industries and reflecting their distinctive characters. The NPPF
states that planning policies should also recognise the benefits of residential development and
town centre living in ensuring the vitality of centres.
2.7 In respect of Development Management, paragraph 87 of the NPPF (as revised) states that a
sequential assessment is required for planning applications for ‘main town centre uses’ (which
include retail) that are not in an existing centre and are not in accordance with an up to date Local
Plan. Proposals for main town centre uses should be located in town centre locations, then in edge
of centre locations and only if suitable sites are not available should out of centre sites be
considered. Paragraph 88 adds that when considering edge of centre and out of centre proposals,
preference should be given to accessible sites which are well connected to the town centre.
2.8 Paragraph 90 of the NPPF confirms that when assessing applications for retail and leisure
development outside of town centres, which are not in accordance with an up-to-date
development plan, LPAs should require an impact assessment if the development is over a
proportionate, locally set threshold. If there is no locally set floorspace threshold, the default
threshold is 2,500 sq m of gross floorspace. Impact assessments are required to assess:
▪ the impact of the proposal on existing, committed and planned public and private
investment in a centre or centres in the catchment area of the proposal; and
▪ the impact of the proposal on town centre vitality and viability, including local
consumer choice and trade in the town centre and the wider retail catchment (as
applicable to the scale and nature of the scheme).
2.9 The NPPF directs that where an application fails to satisfy the sequential test or is likely to have a
significant adverse impact on one or more of the considerations in paragraph 90, it should be
refused.
Planning Practice Guidance (PPG) (2014)
2.10 In March 2014 the Department for Communities and Local Government (DCLG) launched online
Planning Practice Guidance (PPG). Town centres and retail guidance was last updated in
September 2020.
2.11 Although it does not constitute a statement of Government policy, it provides technical guidance
on how to prepare a robust evidence base and how to assess the impact of proposals for main
town centre uses. The web-based resource also provides guidance on how to assess and plan to
meet the needs of main town centre uses in full through the production of a positive vision or
strategy for town centres.
2.12 The guidance provides additional detail on applying the sequential and impact test, and whilst the
NPPF has removed reference to shopping ‘frontages’, the PPG confirms that authorities may,
where appropriate, wish to define primary and secondary retail frontages where their use can be

Royal Borough of Kensington and Chelsea Retail and Leisure Needs Assessment and Town Centre Study, November 2021
www.urbanshape.co.uk 7
justified in supporting the vitality and viability of particular centres. These frontage allocations
would be in addition to Primary Shopping Areas.
2.13 The PPG confirms that the impact test only applies to proposals exceeding 2,500 square metres
gross of floorspace, unless a different locally appropriate threshold is set by the local planning
authority.
Development Plan
London Plan (March 2021)
2.14 In March 2021, the Mayor adopted the London Plan. It is a strategic spatial planning document
setting the London wide context within which individual London Borough’s must set their local
planning policies. The London Plan forms part of the Development Plan for the purposes of
development control and planning decisions, and local policy frameworks must be ‘in general
conformity’.
i) Good Growth and Opportunity Areas
2.15 The concept of ‘Good Growth’ – growth that is socially and economically inclusive and
environmentally sustainable – underpins the Plan and ensures a focus on sustainable development.
In ‘Planning for Good Growth’, paragraph 1.0.10 confirms that planning for mixed-use
developments in all parts of London will spread the success of London’s economy and create
stronger communities where everyone feels welcome.
2.16 Policy GG1 seeks to build strong and inclusive communities, stating that development must provide
access to good quality services and amenities that accommodate, encourage and strengthen
communities, increasing active participation and social integration, and addressing social isolation.
The policy adds that development must also promote the crucial role of town centres, and plan for
places that provide important opportunities for face-to-face contact and social interaction during
the daytime, evening and night-time.
2.17 Policy GG2 of the London Plan states that in order to create successful, mixed-use places that make
the best use of land, priorities for development should be Opportunity Areas, brownfield land,
surplus public sector land, sites which are well-connected by existing or planned Tube and rail
stations, sites within and on the edge of town centres, and small sites.
2.18 The London Plan identifies a total of 48 ‘Ongoing Opportunity Areas’ across Greater London
(London Plan Policy SD1), including two which fall within RBKC – Earls Court/West Kensington and
Kensal Canalside. The London Plan states that the Opportunity Areas are identified as significant
locations with development capacity to accommodate new housing, commercial development and
infrastructure (of all types), linked to existing or potential improvements in public transport
connectivity and capacity.
ii) The role of town centres
2.19 Policy SD6 of the London Plan sets out the Mayor’s approach to promoting and enhancing the
vitality and viability of London’s varied town centres. The policy emphasises that town centres will
continue to be promoted and enhanced as ‘strong, resilient, accessible, inclusive hubs with a
diverse range of uses including main town centre uses, night-time economy, civic, community,
social and residential uses’. Town centres are identified as suitable locations for mixed-use and
housing led intensification, and primary locations for commercial activity beyond the CAZ. Policy

Royal Borough of Kensington and Chelsea Retail and Leisure Needs Assessment and Town Centre Study, November 2021
www.urbanshape.co.uk 8
SD6 encourages the strengthening of the role of town centres, creating a sense of place and local
identity in the capital.
2.20 Policy SD6 acknowledges that the adaptation and diversification of town centres should be
supported in response to the challenges and opportunities presented by multi-channel shopping
and changes in technology and consumer behaviour. Policy SD6 also places particular emphasis on
promoting town and edge of centre sites for mixed-use or residential development, managing
vibrant daytime, evening and night-time activities in town centres, and directing tourist
infrastructure, attractions and hotels to town centre locations.
iii) Development principles
2.21 The London Plan takes a strong town centres first approach, confirmed under Policy SD7, which
reflects the approach of the NPPF in requiring applications for development not within a defined
centre to demonstrate compliance with the sequential and impact tests.
2.22 Policy SD7, ‘Town Centres’, states that when considering development proposals, boroughs should
take a town centres first approach. Boroughs are directed to apply the sequential test to
applications for main town centre uses, requiring them to be located in town centres. If no
suitable town centre sites are available or expected to become available within a reasonable
period, consideration should be given to sites on the edge of centres that are, or can be, well
integrated with the existing centre, local walking and cycle networks, and public transport.
Applications that fail the sequential test should be refused.
2.23 Policy SD7 requires an impact assessment on proposals for new, or extensions to existing, edge or
out-of-centre development for retail, leisure and – contrary to advice set out in the NPPF – office
uses that are not in accordance with the Development Plan. Applications that are likely to have a
significant adverse impact should be refused.
2.24 Policy SD7 adds that boroughs should:
▪ realise the full potential of existing out-of-centre retail and leisure parks to deliver
housing intensification through redevelopment;
▪ assess the need for main town centre uses, forecasting future need;
▪ allocate sites to meet need arising; review and define town centre boundaries and
shopping frontages;
▪ identify centres that have scope to accommodate new commercial development
and higher density housing as per growth potential indicators (Annex 1);
▪ identify sites suitable for intensification, which may include supermarket sites,
surface car parks or edge of centre retail/leisure parks, town centre shopping
frontages which are surplus to demand, and redevelopment of low-density town
centre buildings which are not of heritage value; and
▪ support flexibility for temporary or ‘meanwhile’ uses of vacant properties.
2.25 Policy HC6 aims to support the night time economy by promoting, improving and diversifying the
night-time economy. The policy also recognises adverse consequences and recommends local
authorities address the cumulative impact of high concentrations of licensed premises on anti-
social behaviour, noise pollution, health and wellbeing and other issues for residents and nearby
Royal Borough of Kensington and Chelsea Retail and Leisure Needs Assessment and Town Centre Study, November 2021
www.urbanshape.co.uk 9
uses, and seek ways to diversify and manage these areas. The policy recommends an integrated
management approach.
iv) Town centre network
2.26 Policy SD8 of the London Plan sets out the approach to the management of the town centre
network across Greater London, and is supported by a classification of each centre in the town
centre hierarchy at Annex 1. The London hierarchy of centres is headed by two ‘International’
centres (West End, Knightsbridge) and 14 Metropolitan Centres, followed by ‘Major’ and ‘District’
Centres, and locations which fall within CAZ Retail Frontage. The London Plan highlights that the
classification of International, Metropolitan and Major Town Centres can only be changed through
the London Plan.
2.27 Policy SD8 states that International, Metropolitan and Major Centres should be the focus for
higher-order comparison goods retailing; and district centres should focus on the ‘consolidation of
a viable range of functions’, particularly convenience goods retailing, leisure, local employment and
workspace. District centres should also ‘address the challenges of new forms of retailing and
securing opportunities to realise their potential for higher density mixed-use residential
development and improvements to their environment’.
2.28 The following centres in RBKC are identified in the London Plan centre hierarchy (Annex 1):
▪ ‘International’ centres – Knightsbridge;
▪ ‘Major’ centres – Kensington High Street and King’s Road (East);
▪ ‘District’ centres – Brompton Cross, Earls Court Road, Fulham Road, King’s Road (West), Notting Hill Gate, Portobello Road and South Kensington.
2.29 No potential hierarchical changes to town centres in the borough are identified.
v) Strategic Areas for Regeneration
2.30 Those parts of Greater London which fall within the 20% most deprived areas in England (based on
the Index of Multiple Deprivation) are identified in the DLP as ‘Strategic Areas for Regeneration’. In
a number of cases, Strategic Areas for Regeneration overlap with town centres - in RBKC, centres
which fall within a Strategic Area for Regeneration are Earls Court Road, King’s Road (West) and
Portobello Road.
Royal Borough of Kensington & Chelsea Local Plan, September 2019
2.31 The adopted 2019 Local Plan sets out policies and proposals for future development and spatial
planning requirements to 2028. The Local Plan highlights the borough’s diverse character and
vitality. Rather than being ‘just’ a residential suburb, the borough supports world class town
centres, museums, hospitals and cultural events such as the Notting Hill Carnival that give the
borough its international and national reputation. These attract large numbers of visitors from
beyond the borough boundary, representing a significant ‘economic inflow’ substantially greater
than most London Borough’s.
2.32 Chapter 19 seeks to protect the borough’s finely-grained and world class mix of uses such as shops,
businesses, arts and cultural facilities. These are noted as being at risk from decline, particularly
from the pressures of higher value residential development. Policy CO2 sets out the strategic
objective for fostering vitality:

Royal Borough of Kensington and Chelsea Retail and Leisure Needs Assessment and Town Centre Study, November 2021
www.urbanshape.co.uk 10
“…the quality of life of our predominantly residential borough is enhanced by a wide
variety of cultural, creative and commercial uses which can significantly contribute to the
well-being of residents and to the capital’s role as a world city.”
2.33 The Local Plan confirms that most of these cultural, creative and commercial uses will continue to
be concentrated within the borough’s higher order town centres. Policy CF1, ‘Location of New
Shop Uses’, commits the Council to ensuring vital and viable town centres through a town centre
first approach to new retail floorspace (see next page for full policy).
2.34 Paragraph 19.3.10 sets out the borough’s ‘higher order’ town centre hierarchy as follows:
▪ International Centre: Knightsbridge;
▪ Major Centres: King’s Road (East) and Kensington High Street;
▪ District Centres: South Kensington, King’s Road (West), Notting Hill Gate, Fulham
Road (Fulham Road (West) in the London Plan), Brompton Cross (Fulham Road
(East) in the London Plan) and Earl’s Court Road.
▪ Special District Centres: Portobello Road and Westbourne Grove.
2.35 These higher order town centres are the main shopping areas in the borough, offering both
comparison and day-to-day convenience shopping for residents and for those visiting the borough
or working within it. The Council has drawn up visions for each of the borough’s higher order
centres, as set out within the Places section of the Local Plan (Chapters 5-18). Town centre specific
policy is set out in this report within each respective town centre section (Section 5-15 of this

Royal Borough of Kensington and Chelsea Retail and Leisure Needs Assessment and Town Centre Study, November 2021
www.urbanshape.co.uk 11
report). Portobello Road and Westbourne Grove have been designated by the Council as separate
Special District Centres to reflect their unique function in having both a substantial local and
international draw.
2.36 Policy CF2 sets out how the Council will promote vital and viable town centres across the borough:
2.37 Policy CF3 aims to secure, encourage and protect the diversity of uses within town centres, driven
by the intention to protect high proportions of Use Class A1 shop floorspace.

Royal Borough of Kensington and Chelsea Retail and Leisure Needs Assessment and Town Centre Study, November 2021
www.urbanshape.co.uk 12
2.38 Policy CF4 recognises that street markets are a form of shopping greatly valued by many of the
borough’s residents. The Local Plan emphasises that they are an integral part of the borough’s
retail offer and play a vital role in maintaining the special character and the diversity of the
borough’s centres. The Local Plan supports the expansion of the Portobello Road street market
north up to Golborne Road, assisting in increased footfall in this area.
Supplementary Planning Documents
2.39 This Design Guide is a Supplementary Planning Document on the design of shopfronts within the
Royal Borough. This guidance is applicable to shopfronts in the general sense, including the
frontages of restaurants, public houses, banks, estate agents and other similar uses which occupy
the ground floor of buildings. It is relevant to all shopfronts within the Royal Borough.
2.40 This Design Guide will ensure that shopfronts throughout the Borough contribute positively to the
identity and quality of our built heritage and streetscapes. High-quality shopfronts will be required
in all our town centres, high streets and shopping parades. As required by Policy CL2 of the Core
Strategy, shopfronts must be of the highest architectural and urban design quality, taking
opportunities to improve the quality and character of buildings and the area and the way it
functions.
2.41 This document does not promote any particular style or act as a blueprint from which specific
designs may be taken. The principal aim is to provide design guidance to enable applicants to
sensitively restore, modify or construct new shopfronts. It does not however, remove the need for
skilled professional architectural advice.
▪ Shopfront Design Guidelines SPD (2011): prepared to ensure that shopfronts
throughout the Borough contribute positively to the identity and quality of the
built heritage and streetscapes. The principal aim is to provide design guidance to
enable applicants to sensitively restore, modify or construct new shopfronts;
▪ Earls Court and West Kensington Opportunity Area SPD (2012): Discussed in
Section 8, Earls Court;
▪ Notting Hill SPD (2015): Discussed in Section 13, Notting Hill;
▪ Kensal Canalside Opportunity Area SPD (2021): Located in the far north of the
borough, Kensal Canalside is the largest brownfield site in RBKC. The SPD
identifies the opportunity to transform the area into a high-quality, well-
connected, attractive and sustainable Canalside neighbourhood for people to live

Royal Borough of Kensington and Chelsea Retail and Leisure Needs Assessment and Town Centre Study, November 2021
www.urbanshape.co.uk 13
in, work in and visit. The neighbourhood will bring with it a minimum of 3,500
new homes and 10,000 sqm of office space providing new 2,000 new jobs.
Legislative Change: Use Classes Order
2.42 In October 2018, the Government published a consultation into a series of proposed planning
reforms designed to speed up and simplify the planning system; the focus of which was on
supporting the high street and increasing the delivery of new homes. The consultation recognised
the changing and evolving nature of high streets and town centres across the country, and invited
responses on a variety of development management methods which Councils could use to
promote greater flexibility.
2.43 Part 1 of the consultation included proposals in respect of new and amended Permitted
Development (PD) rights and changes to use classes, including to support the regeneration of the
high street and to extend existing buildings upwards to create new homes. The Government
proposed new PD rights to allow existing premises in typical high street uses to change to a wider
range of uses, allowing more leisure and community uses such as gyms, libraries, health care and
office use as well as homes.
2.44 With the rise of internet shopping, and the change in how people use the high street, the
consultation highlighted that it was timely to consider how the operation of the Use Classes Order
can support greater flexibility. It noted the need to support the modernisation of the high street
and enable businesses to adapt to changes in consumer demands.
2.45 The Government published their response to the consultation in May 2019, which confirmed the
intention to move away from a suggested single use class which would merge A1, A2 and A3. The
government response paper stated that ‘more than half of the 276 responses agreed that changes
to the A use classes would support the high street [and] there was considerable support to simplify

Royal Borough of Kensington and Chelsea Retail and Leisure Needs Assessment and Town Centre Study, November 2021
www.urbanshape.co.uk 14
the A1 use class to accommodate new and emerging retail models’. There was, however, concern
that:
“…merging the A1, A2 and A3 use classes would enable change to restaurant use
without any local consideration of the potential impacts from longer opening hours
and increased noise and odours. It could lead to a proliferation and increased
concentration of restaurants, including fast food restaurants, in an area with an
impact on the health of local residents and local amenity. There was also a concern
that it would limit the ability of local communities to shape their high streets as set
out in local or neighbourhood plans.”
2.46 Rather than the far-reaching amendments proposed as part of the consultation paper, and in
response to the consultation, the Government announced that it would only amend the A1 (shops)
use class to ensure it captured current and future retail models and include clarification on the
ability of (A) use classes to diversify and incorporate ancillary uses.
2.47 Shortly afterwards however, as a consequence of the Covid-19 pandemic, the Government decided
to go further and introduce more wide-reaching reforms to the Use Classes – without further
public consultation. This was a specific and swift response to the economic impact of Coronavirus
on high streets and those premises in A1 and A3 in particular. In force from 1st September 2020,
new planning regulations revoked parts A and D of the existing use classes order and introduced a
new ‘commercial, business and service’ Use Class E. In relation to retail and main town centre
uses, the changes are as follows:
▪ New Class E includes:
o Shops (former A1)
o Provision of financial and professional services (former A2)
o Sale of food and drink consumption on premises, ‘cafes and restaurants’ (former A3)
o Indoor sport, recreation, fitness (gyms) (former D2)
o Provision of medical or health services (former D1)
o Creche, day nursery or day centre (former D1)
o Offices, research and development, light industrial (former B1a, b and c)
▪ Former A4 (drinking establishments, public houses/wine bars) and A5 (hot food takeaway)
uses to become defined as Sui Generis.
▪ Former D2 cinemas, concert halls/live music venues, bingo halls and dance halls to become
defined as Sui Generis.
2.48 A series of more protected community uses have been moved into a new Class F, including isolated
small shops in rural locations, public halls, the provision of education and libraries.
Legislative Change: Permitted Development
2.49 Following consultation in December 2020, the Government confirmed on 31 March 2021 that a
new permitted development (PD) right to allow the change of use from any use, or mix of uses,
from the Commercial, Business and Service use class (Class E) to residential use (Class C3) will be

Royal Borough of Kensington and Chelsea Retail and Leisure Needs Assessment and Town Centre Study, November 2021
www.urbanshape.co.uk 15
introduced under Class MA of the Town and Country Planning (General Permitted Development
etc.) (England) Order 2021.
2.50 The government considers that the announced package of measures will help support the creation
of much-needed homes while also giving high streets a new lease of life, enabling them to adapt
and thrive – ‘transforming unused buildings and making the most of brownfield land’.
2.51 The new PD rights, which commenced on 1 August 2021, allow unused commercial buildings – or
parts of buildings – to be granted permission for residential use via a fast track prior approval
process. Councils are only able to assess prior approval applications on a narrow range of specific
considerations including: flooding, noise from commercial premises, adequate light to habitable
rooms and impact on a conservation area, for example. The PD rights include the following
restrictions:
▪ a vacancy requirement that will ensure the building changing use has been vacant for a
continuous period of 3 months before the date of the application to protect successful
businesses in existing use.
▪ the building must have been in a commercial, business, or service use for at least two
continuous years previously.
▪ a size limit of 1,500 square metres of floorspace applies, to avoid the loss of larger units. The
permitted development right does not apply if more 1,500sqm of cumulative floorspace is to be
converted. This is significantly more than the 150sqm permitted under Class M retail to
residential at present, but a significant new restriction for office to residential change of use via
permitted development.
Article 4 Directions
2.52 An article 4 direction is made by the local planning authority. It restricts the scope of permitted
development rights either in relation to a particular area or site, or a particular type of
development anywhere in the authority’s area. Where an article 4 direction is in effect, a planning
application may be required for development that would otherwise have been permitted
development.
2.53 It is possible to introduce an Article 4 Direction to prevent permitted change of use from Use Class
E to residential use. In a statement made by Robert Jenrick, Secretary of State for the Ministry of
Housing, Communities and Local Government, on 1st July 2021 it was highlighted that “in very
specific circumstances, local authorities can make Article 4 directions to suspend individual
permitted development rights, when justified by robust evidence, [but added that it must be] used
in a highly targeted way to protect the thriving core of historic high street areas, but does not
unnecessarily restrict the ability to deliver much needed housing through national permitted
development rights.
2.54 The statement confirmed the introduction of the new paragraph 53 and 54 of the National
Planning Policy Framework (see above), and encourages Councils to ‘recognise the value to housing
supply and increasing resident town centre footfall from supporting ‘flats above shops’; for
example’. The Government consider this to be important to support mixed and flexible high
streets, to deliver additional homes more easily, and to support jobs in the construction industry,
while increasing demand for local high street services through new high street homes.

Royal Borough of Kensington and Chelsea Retail and Leisure Needs Assessment and Town Centre Study, November 2021
www.urbanshape.co.uk 16
2.55 The statement encourages local authorities to carefully target any proposed Article 4 areas,
focusing on the Primary Shopping Area supported by robust evidence to justify the Article 4
direction and the area it covers.
Summary
▪ The NPPF advocates a ‘town centres first’ approach, and requires planning policies to positively
promote competitive town centre environments and manage the growth of centres over the
plan period. The NPPF encourages LPA’s to recognise that town centres are the heart of their
communities and to pursue policies which protect their health and vitality.
▪ The London Plan (2021) aims to build strong and inclusive communities, and emphasises that
development must also promote the crucial role of town centres as places that provide
important opportunities for face-to-face contact and social interaction during the daytime,
evening and night-time. The London Plan encourages the strengthening of the role of town
centres, and acknowledges that the adaptation and diversification of town centres should be
supported in response to changes in technology and consumer behaviour.
▪ The London Plan also promotes higher density mixed-use or residential development in and on
the edge of town centres – where suitable; and notes that tourist infrastructure should be
directed to town centre locations. There are two London Plan Opportunity Areas in RBKC
including Kensal Canalside and Earls Court/West Kensington; and three town centres fall within
Strategic Areas for Regeneration, including Earls Court Road, King’s Road (West) and Portobello
Road.
▪ The London Plan endorses the application of the sequential and impact test, but – contrary to
the NPPF – also requires an impact assessment on proposals for new, or extensions to existing,
edge or out-of-centre office uses [that are not in accordance with the Development Plan] – in
addition to retail and leisure uses.
▪ The Local Plan emphasises the key attributes and role of the wide variety of cultural, creative
and commercial uses significantly contributing to the capital’s role as a world city. Local plan
policy emphasises the town centre first approach to retail floorspace, and policies set out how
the Council will promote vital and viable town centres across the borough. Policy also aims to
secure, encourage and protect the diversity of uses within town centres. This is driven by the
intention to protect high proportions of Use Class A1 shop floorspace, which is now somewhat
out of date in light of recent planning legislation.
▪ There are four relevant SPD’s including the Shopfront Design Guidelines SPD (2011); the Earls
Court and West Kensington Opportunity Area SPD (2012); the Notting Hill SPD (2015); and the
Kensal Canalside Opportunity Area SPD (2021) (the largest brownfield site in RBKC).
▪ In force from 1st September 2020, new planning regulations revoked parts A and D of the
existing use classes order and introduced a new ‘commercial, business and service’ Use Class E,
incorporating former A1, A2 and A3 retail uses. Former A4 (drinking establishments, public
houses/wine bars) and A5 (hot food takeaway) uses and D2 cinemas, concert halls/live music
venues, bingo halls and dance halls are now defined as Sui Generis. Isolated rural shops are
protected under new Use Class F2(a).

Royal Borough of Kensington and Chelsea Retail and Leisure Needs Assessment and Town Centre Study, November 2021
www.urbanshape.co.uk 17
▪ A new permitted development (PD) right to allow the change of use from any use, or mix of
uses, from the Commercial, Business and Service use class (Class E) to residential use (Class C3)
will take effect on 1 August 2021. This applies to ‘unused’ buildings that have been vacant for 3
months, are no larger than 1,500 sq m, and were previously used for at least 2 years for
commercial, business or service use.

Royal Borough of Kensington and Chelsea Retail and Leisure Needs Assessment and Town Centre Study, November 2021
www.urbanshape.co.uk 18
3. National Retail and Leisure Trends
3.1 Consumer and economic trends in the retail and leisure sector have important implications on the
formulation of planning and spatial strategies and the future vitality and viability of each individual
town centre across the UK. We provide a detailed insight in this section, drawing out the key
points of relevance for town centre planning across RBKC.
3.2 Trends in recent years have been well documented. They closely follow global economic
fluctuations, growth in on-line shopping/multi-channel retailing; changes in the property and space
requirements of retail operators; evolution towards multi-dimensional town centres; the growth of
the commercial leisure sector; and changes in the convenience goods sector with the growth of
discount retailers and more varied food shopping habits. Sectoral analysis and published evidence
confirm that town centres will need to continue to evolve and adapt to remain vital and viable
locations.
3.3 As highlighted in the introduction, this study was finalised in February 2020 just one month before
the Covid-19 pandemic shut high streets across the UK. The longer term impact of Covid-19 on
wider society and our town centres is still uncertain, but it is widely accepted that town and city
centres will bounce back to varying degrees, and that Covid-19 has accelerated trends and
challenges facing our high streets. In this section, we provide an update to those trends identified
in the 2020 Study, focusing on the implications of the Covid-19 pandemic.
3.4 As highlighted in the introduction, this study was undertaken during 2021 and the ongoing the
Covid-19 pandemic. In March 2020, lockdown shut our high streets overnight, with no timeline in
place for re-opening. The longer term impact of Covid-19 on wider society and our town centres is
still uncertain, but it is widely accepted that town and city centres will bounce back to varying
degrees, and that Covid-19 has accelerated trends and challenges facing our high streets.
The Evolving Role of the Town Centre
3.5 Retail will continue to be an important footfall driver in town centres, and whilst high streets are
evolving, the role of retail and retail operators should continue to form an important element to
any town centre strategy moving forwards. Nevertheless, trends and the need to inject life into
our high streets have introduced new, multi-dimensional elements to town centres which should
be promoted and incorporated alongside retail into emerging town centre strategies. These can be
summarised as follows:
▪ The development of an ‘experience’ for visitors who are increasingly seeking to combine retail
and leisure activities as part of a single ‘going out’ trip. Town centres must provide an
attractive experience for visitors which the internet is unable to match. This might include
specialist markets, independent cinemas, street food and seasonal events, for example.
▪ Town centres acting as genuine hubs for their communities, and the need to create a vibrant
social, commercial and cultural destination. Uses might include cultural space, co-working
space, space for small and medium-sized enterprises (SME’s), community facilities including
libraries, education space, community halls/meeting venues, and health centres.
▪ Larger scale ‘destination’ uses including conference centres, hotels, offices, cultural and
performance venues.

Royal Borough of Kensington and Chelsea Retail and Leisure Needs Assessment and Town Centre Study, November 2021
www.urbanshape.co.uk 19
▪ Growth in town centre living and residential space/student accommodation – delivering
footfall in the evenings and at weekends as well as during the daytime. A town centre
strategy will require consideration of noise, environmental health and licensing hours in order
to consider residential amenity alongside a supported evening economy.
3.6 Uncertainty around the future of our town centres and observations around how they are evolving
has been taking place for some years. In December 2018, the Government published ‘The High
Street Report’, setting out the findings of the ‘High Streets Expert Panel’ which was established
earlier in 2018. The Panel, Chaired by Sir John Timpson, sought to identify the key issues facing
high streets and town centres, and advise on the best practical measures which the Government
can take to help. In introducing the report, Sir John stated:
“Town centres are evolving, and retail will not return to the high streets that
existed 10 or 20 years ago. A combination of internet shopping, the convenience
of out of town retailing and an exceptional number of well-established retail
formats reaching the end of their commercial life, has led to a marked increase in
empty shops and a decline in footfall.
In completing this report, I have more hope for the future of our town centres
than when we first started gathering evidence.”
3.7 He added that throughout their report, they use the term ‘town centre’ rather than ‘high street’
because their recommendations are not just about shops and shopping. The town centre of the
future should attract local people to take part in a variety of activities – including dining, leisure
and sport, culture and the arts, entertainment, medical services, and many more uses. They should
also contain business premises, offices, and residential including affordable housing.
3.8 Instructed by ‘Key Cities Group’, consultants ‘Infusion’ were asked to ‘review the current state of
play across our town and city centres’. The 2019 report starts by highlighting that over the course
of the last decade, the British High Street has faced some of its biggest challenges in history. From
a major economic downturn, through new retail methods and in conjunction with already-ongoing
shifts in consumer spending and visiting patterns, some of the country’s most recognisable names
have disappeared from our city centres. Many more major retailers were identified as facing huge
difficulties and consequently undertaking seismic shifts in order to maintain their viability.
3.9 The report presents a strong position statement – ‘with the retail sector undergoing such major
change, there is a very real threat to the existing model underpinning the vibrancy and
sustainability of our city centres’. It emphasises that the retail sector has historically anchored
much of our central area floor space, particularly at the visible and impactful ground floor level,
and generated the bulk of footfall. With the convenience of newer methods of shopping likely to
outweigh the convenience of central area shopping for the foreseeable future, it concludes that
city centres can no longer rely on retail to be relevant.
3.10 The report states that central areas need to be diverse in the way their space is used to maintain
their vibrancy, and activity in centres cannot be confined to daytimes. Ideally, town and city
centres should not only be locations people shop in, but also eat in, drink in, work in and live in.
The role of retail is still relevant and important, but the report concludes that ‘as well as town
Royal Borough of Kensington and Chelsea Retail and Leisure Needs Assessment and Town Centre Study, November 2021
www.urbanshape.co.uk 20
centres being a focal point for retail, they need to become areas in which people live, work and
spend their leisure time’.
Economic Trends
3.11 Since the 2008 and 2016 Retail Studies were published, the UK’s 2016 decision to leave the
European Union has become an influencing factor in forecasts of economic growth. The UK
economy slowed during 2019, sliding to a 7 year low by the end of the year, household spending
growth slowed to an 8 year low of 1.2% in 2019, income growth was disappointing, and retail sales
volumes grew by 3% - the weakest reading since 2014. The Experian ‘Retail Planner Briefing Note
17 (February 2020) attributed this to the period being dominated by heightened Brexit uncertainty
and a weaker global economy.
3.12 Experian note that the outcome of the December 2019 general election removed near-term
political uncertainty and the risk of a no deal Brexit, empowering the government to push forward
with spending pledges and EU withdrawal plans. In February 2020, Experian recorded that the
latest indicators pointed to a pick-up in business confidence and investment intentions; whilst
housing market surveys suggested activity was rebounding and consumer sentiment improving.
3.13 Nevertheless, and even before factoring in Covid-19, Experian forecast that GDP growth was set to
remain on a slower growth trajectory of 1-1.5% over 2020 and 2021, well below the performance
of earlier years. This is reflected in Section 16 when forecasting need for future retail floorspace
across RBKC, with outputs clearly demonstrating the direct consequent impacts on forecast
expenditure growth rates for both convenience and comparison goods.
Covid-19
3.14 On Monday 23rd March 2020 the country introduced ‘lockdown’ measures and social distancing
including the closure of all but essential shops and services. This had an immediate impact on town
centres and town centre businesses unable to trade, with doors shut and no timeline in place for
re-opening. In the Retail Planner Briefing Note 18, October 2020, Experian state:
“the outbreak of coronavirus (Covid-19) and measures to contain it has had a
considerable impact on the UK and global economies. During the intensive
stage of the lockdown, the economy suffered an unprecedented contraction,
employment fell markedly and over 9 million employees were furloughed.
Consumer demand suffered given social distancing and low confidence,
leading to a big drop in social consumption, especially for recreation, leisure
and travel.
In addition, investment fell markedly, as waning business confidence and
deteriorating financial positions lead to the postponement and cancellation of
projects. Exports have also been undermined by a fall in international
demand for UK goods and services, as other countries enforce lockdown or
social distancing measures to varying degrees. Supply side factors have
reinforced this trend, such as the temporary closure of factories and
businesses and disruptions to supply chains.”
3.15 In the October 2020 report, Experian forecast a ‘near-term’, ‘central/medium’ and ‘long term’
outlook. This Retail and Leisure Study incorporates forecasts based on the Experian

Royal Borough of Kensington and Chelsea Retail and Leisure Needs Assessment and Town Centre Study, November 2021
www.urbanshape.co.uk 21
‘central/medium’ term outlook on the basis that an effective medical treatment (the vaccine) was
in place by (around) mid-2021, enabling the recovery to regain momentum as confidence
recovered. Research by Savills, GfK and Bank of England (graph below) currently supports this
central trend based on the UK’s swift vaccine roll-out.
3.16 The vaccine roll-out has progressed swiftly and smoothly as expected under the ‘central/medium’
term scenario. As social distancing measures continue to unwind, social consumption is expected
to continue to recover; and alongside this, some correction in the share of online spending is
assumed, but it will nevertheless remain elevated compared to pre-Covid-19 projections.
3.17 Moving forwards, Experian explain that recovery over the coming years will be shaped by the
course of the pandemic, the success of measures to contain it and the extent of potential scarring
to the UK’s longer term economic potential. The unprecedented nature of these issues means all
forecasts will be subject to greater than usual uncertainty, with the following key variables:
▪ The role and implementation of any social-distancing measures over the coming months;
▪ How successful government measures are in mitigating the economic impact on households
and businesses;
▪ The rebound of household and business confidence levels;
▪ Global backdrop including trade and supply chain impacts on industry.
3.18 Government finances have deteriorated markedly following exceptional measures taken to support
the economy. Over the medium term, fiscal policy will likely be a constraint on growth as
corrective measures such as spending cuts or tax rises may be required. It is expected that
monetary policy will remain supportive over the medium term, with interest rates expected to
remain at exceptionally low levels of the foreseeable future.
Online and Multi-Channel Retailing
3.19 Online spending has become a firmly established method of shopping. Evidence demonstrates the
continued growth of this sector in terms of those that have internet access, those that use the
internet every day, the methods and modes used to undertake such transactions, and the breadth

Royal Borough of Kensington and Chelsea Retail and Leisure Needs Assessment and Town Centre Study, November 2021
www.urbanshape.co.uk 22
of the population taking advantage of what is on offer, with the largest rise in the 65+ age group in
recent years.
3.20 Recent data from the ONS confirms the extent to which online platforms now form part of the
population’s shopping habits. The most recent data available from the ONS on online usage is from
August 2020, which identified that:
▪ In January to February 2020, 96% of households in Great Britain had internet access, up from
93% in 2019 and 57% in 2006 when comparable records began.
▪ Over 85% of adults use the Internet every day. Daily internet usage has more than doubled
since 2008.
▪ In January to February 2020, 76% of adults in Great Britain used internet banking, increasing
from 30% in 2007 and 73% in 2019.
▪ 78% use mobile phones/smartphones to access the Internet. In certain age groups this figure
is substantially higher: in the 25-34 year old age group, the figure is 99%; for 16-24 year olds it
is 98%; and for 35-44 year olds it is 96%.
▪ In January to February 2020, 87% of all adults shopped online within the last 12 months, up
from 53% in 2008; those aged 65 years and over had the highest growth, rising from 16% to
65% over this period.
▪ In August 2020, 100% of adults in the 16-24 and 25-34 old age group shopped online; and over
96% of 35-54 age group shopped online. By contrast, only 67% of those over 65 years shop
online - however this age group has shown the largest increase in online shopping uptake,
increasing from 48% in 2018, and 16% in 2008.
3.21 When looking at the frequency of online shopping and the amount typically spent online, it can be
seen that considerable amounts of spend are now being diverted online, which is spend lost from
‘bricks and mortar’ town centre stores. The ONS identifies that:
▪ Of those adults who purchased online in the last three months, adults aged 16-24 typically
shopped online once or twice; however those in the 25-34, 35-44 and 45-54 age groups most
typically shopped online at least ten times over a three month period. In the 35-44 age group,
48% shopped online more than ten times over the three month period.
▪ Across all age groups, shoppers typically spent between £100 and £499 online in the last three
months. In the 35-44 year age group, 30% of adults spent over £1,000 online in the three
month period.
3.22 Importantly for town centres, it has been evidenced that only 15% of online shoppers buy all of
their fashion items online, with the remaining 85% using both online and physical stores. This
highlights the importance of having a ‘joined-up’ town centre ‘experience’ to lure shoppers away
from the internet and instead to visit the high street and to extend their dwell time through a
range of retail and leisure attractions.
Covid-19 and Online Shopping
3.23 Experian report that there has been a marked increase in online shopping since the Covid-19 crisis
broke, which has further accelerated the already strong growth trend seen over the past decade.
The rising share of internet sales in total retail transactions is the key trend for SFT. Internet sales

Royal Borough of Kensington and Chelsea Retail and Leisure Needs Assessment and Town Centre Study, November 2021
www.urbanshape.co.uk 23
share of total retail surpassed 19% in 2019 before lurching up to over 30% in the second quarter of
2020, against less than 5% in 2008.
3.24 With lockdown measures related to Covid-19 relaxing since the second quarter of 2020, the share
of internet sales in total retail transactions has eased from its peak (Fig.3.1 and 3.2 below). We
expect this unwinding to continue in the coming months, however it is anticipated that some of the
increase in the internet sales share seen during the pandemic will remain throughout the forecast
period. Figure 3.1 and 3.2 below illustrates the small drop from the high peak of growth, but not to
pre-Covid-19 levels, and will be followed by continued steady forecast growth.
Figure 3.1: Convenience Goods Internet Sales Growth Trends and Forecasts
Figure 3.2: Comparison Goods Internet Sales Growth Trends and Forecasts
3.25 The ease of online purchasing has also continued to improve rapidly, with technological advances,
particularly around smartphones and connectivity. Faster delivery ties, including same day
delivery, and easier returns processes have also encouraged the trend. Beyond 2021, Experian
expect the SFT market share to continue to growth strongly in the mid-term.

Royal Borough of Kensington and Chelsea Retail and Leisure Needs Assessment and Town Centre Study, November 2021
www.urbanshape.co.uk 24
Click and Collect
3.26 Research indicates that the click and collect market will grow by a further 46% by 2023. Click and
collect allows a shopper to order and pay for a product online, and then have it delivered to the
nearest physical retail store of that operator. This is an important opportunity for town centres, as
it can act as a footfall generator in its own right. Research demonstrates that 39% of consumers
make an additional purchase in that town centre when collecting an item from a store.
3.27 John Lewis, for example, state on their website press releases that “in the last five years alone,
Click & Collect orders have increased more than 50% as customers enjoy the ease and convenience
it provides. Currently 57% of all online orders are delivered through this service with 25% of
packages collected at John Lewis shops and 75% at Waitrose shops”.
3.28 A challenge to the continued growth of click and collect is the rise of instant delivery and saver
delivery services, as businesses aim to match efficient delivery options and consumer expectations.
This includes same day delivery, one-hour delivery windows, and delivery passes whereby a
consumer pays an annual subscription to guarantee same day, next day or timeslot delivery
options. The impact of this on click and collect and associated opportunities for town centres will
need to be monitored.
High Street Losses
3.29 The economic trends referred to above, combined with the continued growth in on-line sales have
had a significant and permanent impact on consumer shopping and spending behaviour. In turn,
this has created significant hurdles for traditional ‘bricks-and-mortar’ retailing and the high street.
3.30 These national trends have added to operator challenges already being experienced as a
consequence of the retail property business model. Notably, operators face high costs of running
retail outlets, including rents, business rates and high labour costs; they experience low
profitability caused by high costs, slow growth in sales, squeezed profit margins and heavy price
competition. They have been slow to respond and to prepare for the fast-paced changes being
experienced on the high street, overlooking and disregarding the need to invest.
3.31 Operators have experienced a significant impact from the economic environment, the rise in online
shopping and the property market, with many high profile high street casualties in recent years.
Many operators will survive, but may instead look to rationalise their store portfolios. In recent
years, the following found themselves in administration and in many cases, closure:
▪ Beales (2020)
▪ Hawkins Bazaar (2020)
▪ Top Shop / Top Man
▪ LK Bennett (2020)
▪ Oasis and Warehouse (2020)
▪ Dorothy Perkins (2020)
▪ Miss Selfridge (2020)
▪ Burton (2020)
▪ Jaeger (2019)
▪ TM Lewin (2020)
▪ Kath Kidston (2020)
▪ Laura Ashley (2020)
▪ Mothercare (2019)
▪ Select (2019)
▪ Debenhams (2019)
▪ Edinburgh Woollen Mill (2019)
▪ HMV (2018)
▪ House of Fraser (2018)
▪ Poundworld (2018)
▪ Conviviality Retail (2018)
▪ Maplin (2018)

Royal Borough of Kensington and Chelsea Retail and Leisure Needs Assessment and Town Centre Study, November 2021
www.urbanshape.co.uk 25
▪ Toys R Us (2018)
▪ Palmer & Harvey (2017)
▪ Store Twenty One (2017)
▪ BHS (2016)
▪ Brantano (2016)
▪ Phones4U (2014)
▪ HMV (2013)
▪ Blockbuster (2013)
▪ Comet (2012)
▪ Clinton Cards (2012)
▪ Game (2012)
▪ Peacocks (2012)
▪ JJB Sports (2012)
▪ Alexon (2012)
▪ Focus DIY (2011)
3.32 The Covid-19 Grimsey Review (June 2020) references statistics published in the months just prior to
the pandemic by CBRE, highlighting the stark downturn in the retail property market. The report
quotes a 42% fall in retail property investment between 2014 and 2018; a 78% drop in shopping
centre investment over the same period; and a 47% drop in the value of retail property assets
changing hands between 2017 and 2018. The report adds that there were no new shopping centre
openings in 2019, although some were extended, whilst a third of London shopping centres were
subject to planning applications for at least some element of conversion to residential use.
3.33 It is predicted that the Covid-19 pandemic will drive a substantial amount of retail property into the
hands of insolvency practitioners over the next few months.
Commercial Leisure Sector
3.34 In recent years, the commercial leisure sector has played an increasingly important role in the
vitality and viability of town centres, as the nature of town centres continues to evolve. In many
new town centre schemes, a cinema or family/casual dining has replaced retail as the ‘anchor’,
driven by the growth of this sector and the need for town centres to generate a more varied visitor
experience.
3.35 Leisure uses will continue to be important attractors in town centres, but the casual dining sector
has now reached saturation and increased competition is leading to casualties. Analysts suggest
that in addition to market saturation, the rise in food costs, staff costs, rents and business rates
have all impacted on operators’ profits; as well as emerging on-line delivery companies such as
Uber Eats, Deliveroo and Just Eat.
3.36 The consequences of Covid-19 and associated lockdown and social distancing, will have further far-
reaching impacts on the leisure and casual dining sector, with on-line delivery companies becoming
firmly established in people’s homes.
The Convenience Sector
3.37 The trends being experienced in the food retailing sector were establishing themselves to varying
degrees at the time of the 2016 Retail Study update. Food superstores have experienced a
substantial decline in market share, small format top-up stores are gaining market share, discount
retailers – Aldi and Lidl – are achieving strong growth, and on-line spend is continuing to grow
although not to the same extent as non-food shopping. The market leaders pulled back on large
superstore openings a number of years ago, and whilst small convenience stores continue to open
this is not at the same pace as that seen in recent years.

Royal Borough of Kensington and Chelsea Retail and Leisure Needs Assessment and Town Centre Study, November 2021
www.urbanshape.co.uk 26
Banks and Financial
3.38 The services of the high street banks have traditionally been delivered through their branch
networks, meaning that in town centres at all levels in the hierarchy the presence of a wide range
of banks and building societies formed an important part of a centre’s mix of uses. The numbers of
bank branches in the UK have been in decline for the past thirty years, due to a variety of reasons
including the desire by banks to cut costs; mergers within the industry; competitive pressures from
new entrants in the banking sector; changes in the nature of retail banking transactions; and a
growth in alternative means of accessing bank services, particularly driven by technological
advances such as online and mobile banking.
3.39 According to research from CACI1, customer visits to retail bank branches are forecast to drop by
36% between 2017 and 2022, with mobile transactions rising 121% in the same period. CACI
estimate that the typical person will visit a retail bank branch just four times a year, down from
seven in 2017.
3.40 Most banks have an alliance with the Post Office (whose own branch network has remained
relatively stable in recent years), meaning that in most smaller centres there are still banking
facilities available to those who are not able to use alternative means. However, the decline of
bank branches has also served to free up large, often historic and listed commercial premises in
central town centre locations, which are in some instances challenging to let.
Out-of-Centre Retailing
3.41 Out-of-centre retailing offers the benefits of lower rents, larger retail units and in most cases, free
car parking. According to Verdict (national retail intelligence and trend analysts), out-of-town
retailing is the only form of retailing – pre-Covid-19 – which saw store numbers increase
consistently since 2000. The Department for Business, Innovation and Skills reported that the
number of out-of-centre stores had increased by up to c.1,800 (25%) since 2000.
3.42 The recovery of market confidence which took place in the period since 2013 benefited out-of-
town retailing. Vacancy rates fell, footfall increased, and many retailers were seeking expansion in
existing – and some new – out-of-centre locations. Some traditional town centre retailers
developed out-of-town store formats, including John Lewis which opened a number of ‘At Home’
stores in prominent out-of-centre locations, as well as other traditionally ‘high street’-focussed
retailers such as, Next, Primark and H&M.
3.43 Even before Covid-19, however, the sector was feeling the impact of a changing market, with a
slow-down in new retail parks and a general evolution from mainstream retail to more mixed-use
town centre/leisure parks, and a move towards a wider mix of uses including residential. Retail
Parks have felt the impact of retail store closures in much the same way as high streets; when
businesses close, they close in all locations.
3.44 The combined effects of Covid-19 and new, more flexible planning legislation, has brought retail
parks back into favour. It is reported (Workman2, January 2021) that in the five weeks to 2 January
1 Analytical research company, providing operator trend data. 2 Workman is the largest, independent commercial property management & building consultancy firm in UK.

Royal Borough of Kensington and Chelsea Retail and Leisure Needs Assessment and Town Centre Study, November 2021
www.urbanshape.co.uk 27
2021, overall footfall at UK shopping destinations dropped 46% compared to the previous year; but
with a drop of 50% on the high street and only 17% at retail parks.
3.45 The resilience of retail parks throughout the pandemic led to a ‘flurry’ of investor acquisitions at
the end of 2020, with destinations meeting the needs of suburban home workers, enabling social-
distancing, offering click and collect, and more spacious environments. The strong weighting to
‘essential’ items also meant many could continue trading during ‘lockdown’.
3.46 Workman state:
“retail parks are not just being snapped up with the intention of repurposing into last
mile distribution centres or residential. Most have attracted investment due to their
broad base of essential retailers, with a perceived lower risk of insolvency.”
3.47 The introduction of more flexible planning regulations, including a new combined commercial Use
Class E and permitted development from Use Class E to residential, makes such destinations
attractive investments. Owners have more flexibility in respect of operator line-up and the mix of
acceptable uses, with strong opportunities for increased site intensification and place-shaping
visions. Opportunities for high density development and mixed-use development (to include
residential) at retail parks and also out-of-town foodstore locations is clearly set out in the London
Plan (2021), as discussed in Section 2.
Summary
▪ The role of town centres as a focus for retail remains relevant in today’s market to draw in
shoppers and footfall. Current thinking and research consistently repeats, however, the need to
look beyond the role of retail in order to reinvent the high street, emphasising that the town
centre of the future must add an extra dimension to the retail experience. Covid-19 and new
planning legislation have and will continue to accelerate these trends. Away from the high
street, the composition and role of out-of-centre retail and retail parks will almost certainly
evolve towards more mixed uses spaces and places as a consequence of the same factors.
▪ It is apparent that these ‘extra layers/diversity of uses’ are in addition to the core retail role, but
should be closely connected to ensure a joined-up experience within a comprehensive town
centre strategy. Investment in a wider mix of land-uses and public realm/public space
improvements will benefit a consolidated retail offer, leading to improved town centre footfall
activity. Short-term investment projects alongside longer term investment for major projects
can have far-reaching positive benefits to the performance of a town centre.

Royal Borough of Kensington and Chelsea Retail and Leisure Needs Assessment and Town Centre Study, November 2021
www.urbanshape.co.uk 28
4. Sub-Regional Context
4.1 In this section, we set out the sub-regional context within which the town centres in RBKC operate.
Administrative areas are not ‘closed systems’ and it is natural to expect a degree of expenditure
inflow from beyond the RBKC borough boundary, and also expenditure leakage to the surrounding
network of town centres and other shopping destinations outside the borough.
4.2 The analysis of catchment areas and trade flows form an important input to the baseline. It
enables historic trend line market share data to be explored, leading to an understanding of
whether the influence of a town centre in the sub-region has improved or declined over time. The
data identifies catchment areas and opportunities to enhance trade draw in the future, highlighting
key influences in the form of planning commitments and planned development which may
enhance the market share of a shopping destination over the plan period.
Household Telephone Survey
4.3 The household telephone survey area is illustrated in Figure 4.1 below; and a total of 1,000
households across 10 survey zones were interviewed. Zones 1-10 of the survey area replicates the
previous 2008 survey area to ensure direct comparisons and the identification of trends over time.
4.4 The questionnaire was designed in consultation with the Council and NEMS Market Research, who
undertook interviewing and data processing in February 2021. The findings explore where
residents living within the survey area are travelling to for their spending on different types of
goods including convenience, comparison and leisure uses; this might be within or beyond the
RBKC borough.
Figure 4.1: Household Telephone Survey Area, 2021

Royal Borough of Kensington and Chelsea Retail and Leisure Needs Assessment and Town Centre Study, November 2021
www.urbanshape.co.uk 29
2008 Retail Study - Overview
4.5 The 2008 Study identified an affluent ‘borough-wide’ socio-economic profile when compared to
other London borough’s and also the wider UK. The report added, however, that these borough
wide averages hide variations within RBKC, with the southern and central parts of the borough
being generally much more affluent than the north of the borough. A number of wards in the
north of the borough, i.e. Saint Charles, Golborne and Colville were amongst the most deprived
wards in the country, whilst wards in the south and central areas, i.e. Campden, Hans Town and
Royal Hospital, are amongst the most affluent in the country.
4.6 In terms of the sub-regional context, the 2008 study identified London’s West End as the most
popular shopping destination, with 18.5% of all respondents shopping there, followed by
Kensington High Street (12.2%) and King’s Road (10.9%). Within the borough survey zones (Zones
1-3), the most popular shopping destination was Kensington High Street (22.2% - Zone 1 / 40% -
Zone 2); and in Zone 3 it was King’s Road (54.1%). The report concluded that Kensington High
Street and King’s Road were the predominant non-food shopping destinations for residents living in
the borough (Zones 1-3).
4.7 The 2008 Study reported that the main non-food shopping destinations outside the borough for all
respondents living across the survey area, included London West End, Hammersmith and Brent
Cross, followed by Fulham, Kilburn and Clapham Junction. Centres were ranked by popularity as
follows:
▪ London West End
▪ Kensington High Street
▪ King’s Road
▪ Hammersmith
▪ Brent Cross
▪ Fulham
▪ Kilburn
▪ Clapham Junction
4.8 The 2008 Study did identify need for additional comparison goods floorspace over the plan period,
but noted the imminent opening of Westfield Shopping Centre, just beyond the borough boundary.
It was recognised at that time that the White City development, which was due to open before the
end of 2008, would change existing shopping patterns in the study area, with a view that trade
drawn from comparison shopping facilities within the borough would be significant.
4.9 The 2008 concluded that the Westfield catchment area would encompass most if not all of RBKC,
and factored the development in when forecasting for future floorspace need. Quantitative need
figures amended market shares and presented a ‘low borough growth scenario’, assuming that
Westfield would absorb a significant amount of comparison expenditure growth in the Borough
from 2008 to 2012. The forecast need figures are set out in Table 4.1 below.
4.10 The 2008 Study explains that the projections suggest that in the short term, the impact of
competing developments could lead to a reduction in comparison floorspace within the central and
north parts of the Borough, with Kensington High Street and Notting Hill Gate perhaps the most
vulnerable. The strategy for this part of the Borough should be to concentrate on retaining existing
Class A1 retail uses and the reoccupation of existing vacant units.

Royal Borough of Kensington and Chelsea Retail and Leisure Needs Assessment and Town Centre Study, November 2021
www.urbanshape.co.uk 30
Table 4.1: Forecast Comparison Goods Floorspace Need (Extract: 2008 Study)
4.11 The 2008 Study split the borough into the ‘South Sub-Area’ and the ‘Central/North Sub-Area’, and
forecast a total combined need for almost 145,000 sq m gross of comparison goods floorspace by
2028 – the development plan period. In the context of growing SFT and economic fluctuations, the
2016 Study Update identified a substantially lower ‘need’ of 21,000 sq m gross of comparison
goods floorspace to the period 2028.
2021 Shopping Patterns / Trade Retention / Leakage
4.12 The up-to-date household telephone survey (2021) prepared to inform this new evidence base
study enables us to understand the performance of the RBKC town centres in the context of the
town centre network across RBKC and the wider sub-region. The data allows us to examine the
influence of competing destinations and the associated flows of retail expenditure and levels of
trade retention.
4.13 Shopping patterns derived from the Zone 1-10 household telephone survey enable us to calculate
the amount of comparison goods expenditure that each competing centre/destination draws from
the defined RBKC survey area. As well as the strength of the retail offer, this indicator takes into
consideration accessibility across the RBKC sub-region. The total expenditure travelling to these
destinations is set out in Table 4.2 below; whilst the market share of each centre across each
survey zone is set out in Table 5, Appendix 2.
Table 4.2: Study Area (Zone 1-10) Comparison Goods Expenditure Flows
Destination Ranked by Trade Draw 2021 Trade Draw (£m) 2021 Trade Draw (%)
1 Central London/West End £337.6m 13.4%
2 King’s Road (East) £329.4m 13.1%
3 Westfield White City £281.8m 11.2%
4 Kensington High Street £201.9m 8.0%

Royal Borough of Kensington and Chelsea Retail and Leisure Needs Assessment and Town Centre Study, November 2021
www.urbanshape.co.uk 31
5 Kilburn £87.7m 3.5%
6 Brent Cross £85.5m 3.4%
7 Hammersmith £75.7m 3.0%
8 Clapham Junction £66.5m 2.6%
9 Wandsworth £57.0m 2.3%
10 Staples Corner Retail Park, Brent Cross £53.3m 2.1%
11 Ikea, Wembley £50.8m 2.0%
12 Victoria £37.0m 1.5%
13 Shepherds Bush Green £32.3m 1.3%
14 Notting Hill Gate £33.3m 1.3%
15 Knightsbridge £20.2m 0.8%
16 Fulham Broadway £18.6m 0.7%
Other RBKC Town Centres
King’s Road (West) £15.7m 0.6%
Fulham Road (West) £14.6m 0.6%
Portobello Road £12.0m 0.5%
Westbourne Grove £6.2m 0.2%
South Kensington £3.3m 0.1%
Earls Court Road £3.0m 0.1%
Brompton Cross £0.5m 0.05%
4.14 The key change since the previous household telephone survey in 2008 has been the opening and
introduction of Westfield White City into the hierarchy, identified as being the third most popular
destination to shop (Table 4.2) by those living within Zones 1-10 of the survey area. Market share
by zone is set out in Table 5, Appendix 2.
4.15 The ranking of other town centres by trade draw/popularity has changed very little since the
previous full study (2008), referenced earlier in this section. Hammersmith, Brent Cross, Kilburn
and Clapham Junction remain popular destinations for those living within the survey area, although
Fulham has less influence in comparison. King’s Road (East) and Kensington High Street remain by
far the most influential and most visited town centres in the borough, with King’s Road (East)
retaining a stronger position than Westfield White City within the full Zone 1-10 Survey Area.
4.16 Further analysis of the data enables a more in-depth understanding of the shopping patterns of
those living within the borough, and their choices of shopping destination. The borough boundary
broadly reflects the geographical area covered by Zones 1, 2 and 3 of the survey area, and it is
relevant to analyse the level of borough-wide trade retention for each RBKC town centre at the
current time. Table 4.3 sets out the trade retention of each of the RBKC higher order town centres
within RBKC (Zones 1-3), and also the wider Zone 1-10 Survey Area. For comparison, Table 4.3 also
includes London West End and Westfield White City.
4.17 Within the borough (Zone 1-3), King’s Road (East) is the strongest centre retaining £151.8m of
borough comparison goods expenditure (24.1%), followed by Kensington High Street (137.6m

Royal Borough of Kensington and Chelsea Retail and Leisure Needs Assessment and Town Centre Study, November 2021
www.urbanshape.co.uk 32
(21.9%). London West End and Westfield White City have lower levels of influence on those living
within RBKC, with only £43.3m (6.9%) and £72.4m (11.5%) respectively, leaking from the borough
(Zones 1-3) to these destinations.
Table 4.3: RBKC Comparison Goods Spending Destinations (2021)
Zone 1-3
£m
Zone 1-3
Market Share %
Zone 1-10
£m
Zone 1-10
Market Share %
Central London/West End £43.3m 6.9% £337.6m 13.4%
King’s Road (East) £151.8m 24.1% £329.4m 13.1%
Westfield White City £72.4m 11.5% £281.8m 11.2%
Kensington High Street £137.6m 21.9% £201.9m 8.0%
Notting Hill Gate £25.1m 4.0% £33.3m 1.3%
Knightsbridge £12.8m 2.0% £20.2m 0.8%
King’s Road (West) £8.4m 1.3% £15.7m 0.6%
Fulham Road (West) £4.5m 0.7% £14.6m 0.6%
Portobello Road £9.2m 1.5% £12.0m 0.5%
Westbourne Grove £1.6m 0.3% £6.2m 0.2%
South Kensington £2.7m 0.4% £3.3m 0.1%
Earls Court Road £2.7m 0.4% £3.0m 0.1%
Brompton Cross £0.5m 0.05% £0.5m 0.05%
Source: Table 6, Appendix 2
4.18 The results of the survey demonstrate that the eleven higher order town centres in RBKC retain
£649.2m (25.5%) of comparison goods expenditure generated within the Survey Area, whilst
£1,302m (51.5%) of Survey Area expenditure is being captured by competing destinations located
outside of the borough (Table 6, Appendix 2).
4.19 Within the borough, trade retention is higher. The eleven higher order RBKC town centres retain
£357m (56.7%) of comparison goods expenditure generated within the borough (Zones 1-3), whilst
£182.3m (29%) is being captured by competing destinations located outside of the borough (Table
6, Appendix 2). Residual expenditure is being spent at different ‘other’ locations either within or
beyond the borough boundary.
4.20 The above analysis provides a good indicator of the most popular town centres and destinations at
this ‘point in time’. Administrative boundaries are not, however, closed systems, and shoppers will
always flow into and out of a local authority area; whilst trade draw is a good indicator of ‘current
popularity’, a % trade retention level is not a definitive guide to the strength or success of the
retail/town centre offer based on recent trends and an increase/decrease in influence. Drawing on
the data collated it is possible, however, to compare this level of trade retention over time to
explore performance in greater depth. We discuss this below with a particular emphasis on the
opening of Westfield White City, and provide additional discussion in respect of performance in
Section 16.

Royal Borough of Kensington and Chelsea Retail and Leisure Needs Assessment and Town Centre Study, November 2021
www.urbanshape.co.uk 33
Change Since 2008 / Impact of Westfield White City
4.21 The Future Town Centres Report, prepared by Hatch, provided an up-to-date analysis of the
borough’s economic and deprivation profile, enabling a comparison with the 2008 evidence base.
The findings are consistent with the 2008 Study, which confirmed an affluent ‘borough-wide’ socio-
economic profile, but identified hidden variations within the borough, with many wards in the
north continuing to be amongst the most deprived in the country. The 2021 Future Town Centres
Report concluded:
“Most of RBKC has low levels of deprivation. Nine of the 11 centres have no areas that
are classified as being within the 20% most deprived in the country. Fulham Road
(West), Kensington High Street, Knightsbridge and South Kensington also do not have
any areas classified as being within the 50% most deprived in the country.
There are some significant concentrations of deprivation to the north, however, which
encompasses Portobello Road and parts of Westbourne Grove; 54% of areas within
Portobello Road and 51% of areas in Earls Court, are classified as being within the 20%
most deprived in the UK. When extended to the top 50% most deprived areas in the
UK, 100% of Earls Court is classified at this level, followed closely by Portobello Road
(86%) and Brompton Cross (58%).”
4.22 Figure 4.2 is a plan extract from the Future Town Centres Study (2021), illustrating areas by ‘rank of
deprivation’. This clearly shows the higher levels of deprivation in the north of the borough and
west around Earls Court.
Figure 4.2: Deprivation Around RBKC’s Town Centres

Royal Borough of Kensington and Chelsea Retail and Leisure Needs Assessment and Town Centre Study, November 2021
www.urbanshape.co.uk 34
4.23 Westfield, White City opened on 30th October 2008, following completion of the 2008 Retail and
Leisure Needs Study. The preparation of this up to date Retail and Leisure Needs Assessment
(2021) has enabled shopping patterns to be surveyed and analysed robustly for the first time in
order to fully understand the impact of the development on the town centres in RBKC. Previously,
the 2008 Study and 2016 Update have estimated impact and adjusted market shares accordingly,
drawing on published data sets where possible. Below, we discuss the findings from the new
Household Telephone Survey (2021).
4.24 Figure 4.3 below illustrates the location of Westfield, White City within the Household Telephone
Survey Area; sitting in Zone 10 but located very close to the boundary with Zone 1 and 9.
Figure 4.3: Westfield, White City Location Plan
4.25 The 2008 evidence base presented market shares by Sub-Area, combining the overall performance
of those town centres in the North/Central Sub-Area and those town centres in the South Sub-
Area. The 2021 Update has replicated this approach enabling a direct comparison of market share
trade retention and any key changes to levels of influence/performance over this period of time.
The Sub-Areas are split as follows:-
Central/North RBKC Town Centres South RBKC Town Centres
Kensington High Street Major Centre (Zone 2)
Earls Court Road District Centre (Zone 2)
Notting Hill Gate District Centre (Zone 2)
Westbourne Grove SDC (Zone 1)
Portobello Road SDC (Zone 1)
Knightsbridge International Centre (Zone 6)
Kings Road (East) Major Centre (Zone 3)
South Kensington District Centre (Zone 3)
Kings Road (West) District Centre (Zone 3)
Fulham Road West District Centre (Zone 3)
Brompton Cross District Centre (Zone 3)
Westfield White City

Royal Borough of Kensington and Chelsea Retail and Leisure Needs Assessment and Town Centre Study, November 2021
www.urbanshape.co.uk 35
4.26 Tables 4.5 and 4.6 compare market share for each Sub-Area in 2008 and 2021, identifying those
zones where the borough’s town centres have experienced an increase or decline in market share.
4.27 Table 4.5 sets out the combined market share of those town centres in the Central/North Sub-
Area, highlighting that within Zones 1-3 (the borough), the RBKC town centres have lost market
share in Zone 1 only, falling substantially from 39% to 19.6%. Given geographic proximity, this is
likely to be a consequence of Westfield, White City. Kensington High Street is located in Zone 2,
and this Zone has seen a substantial increase in market share from 38% to 51.5%, highlighting a
strong performance. Zone 3 has experienced a very small increase in market share. Elsewhere in
the survey area – outside of the borough – the Central/North Sub-Area town centres have all lost
market share in Zones 4, 5, 6, 7, 8 and 10.
Table 4.5: Central/North Sub-Area Market Share by Zone (2008 & 2021)
Note: Central/North Sub-Area Includes: Kensington High Street Major Centre (Zone 2) / Earls Court Road
District Centre (Zone 2) / Notting Hill Gate District Centre (Zone 2) / Westbourne Grove SDC (Zone 1) /
Portobello Road SDC (Zone 1)
4.28 Table 4.6 sets out the combined market share of the RBKC town centres in the South Sub-Area,
highlighting that Westfield White City has had very little impact on their performance over the
period since 2008. Market Share in Zones 1 and 2 are relatively unchanged, whilst Zone 3 market
share has seen a significant increase from 55% to 71.7%. There are five RBKC town centres in Zone
3 including King’s Road East and West, South Kensington, Fulham Road and Brompton Cross. South
Sub-Area RBKC market share in the rest of the survey area (Zones 4-10) has remained relatively
unchanged with small increases and decreases recorded (Table 4.6).
Table 4.6: South Sub-Area Market Share by Zone (2008 & 2021)
Note: South Sub-Area includes: Knightsbridge International Centre (Zone 6) / Kings Road (East) Major
Centre (Zone 3) / South Kensington District Centre (Zone 3) / Kings Road (West) District Centre (Zone 3) /
Fulham Road West District Centre (Zone 3) / Brompton Cross District Centre (Zone 3)
4.29 The analysis above suggests that Kensington High Street has strengthened its role and performance
in its core catchment Zone 2 since 2008, but that the RBKC town centres located in the Central and
North Sub-Area have, combined, lost market share. Westfield, White City has had the greatest
impact on Zone 1 trade draw since 2008, diverting expenditure from the Central/North Sub-Area
town centres. It is also evident that King’s Road has strengthened its role and performance in its
core catchment Zone 3 since 2008, and that White City has had little impact on the performance of
the South Sub-Area town centres combined across the remainder of the survey area.

Royal Borough of Kensington and Chelsea Retail and Leisure Needs Assessment and Town Centre Study, November 2021
www.urbanshape.co.uk 36
4.30 These findings are endorsed by the findings of the 2008 Study, which highlighted that within the
borough survey zones (1-3), the most popular shopping destination was Kensington High Street,
with a market share of 22.2% and 40% in Zone 1 and 2 respectively (2008). This has now fallen
(2021) to 7.8% in Zone 1 (as a consequence of Westfield), but increased to 45.3% in Zone 2 as
Kensington High Street has consolidated its role and position in this core catchment. In 2008, the
most popular shopping destination for those living in Zone 3 was King’s Road, which had a market
share of 54.1%; this has now increased to 62.8%.
4.31 Current market shares for Westfield White City are set out in Table 5, Appendix 2, as follows (Table
4.7), highlighting the core catchment Zone 1, 9 and 10.
Table 4.7: Westfield White City Market Shares (2021)
Zone1 Zone 2 Zone 3 Zone 4 Zone 5 Zone 6 Zone 7 Zone 8 Zone 9 Zone 10
22.7% 9.5% 2.2% 8.8% 7.1% 0.4% 3.7% 9.1% 17.6% 36.9%
4.32 Overall, the findings demonstrate that the RBKC town centres have increased their level of
influence and trade retention within Zones 1-3 (the borough) – but lost market share in the zones
located outside of the borough – Zones 4-10 combined:
RBKC Town Centres, Zone 1-10 Market Share
▪ 2008 – 30.9%
▪ 2021 – 25.5%
RBKC Town Centres, Zone 1-3 Market Share
▪ 2008 – 54.0%
▪ 2021 – 56.7%
4.33 The 2008 Study estimated that Westfield White City would have a market share of 21% in Zones 1-
3 in 2012, but this up-to-date assessment confirms that market share to be much lower, at 11.5%
(2021). The impact of Westfield White City on Zones 1-3 has been considerably less than initially
forecast. Beyond the borough, the 2008 Study estimated that Westfield White City would have a
market share of 11.4% in Zones 4-10 (combined) in 2012, and this up-to-date assessment confirms
that market share to be broadly correct, at 11.1% (2021).
4.34 The achievement of the RBKC town centres in increasing core catchment market share, and
attracting a higher proportion of those that live nearby, must be a response to the quality and
diversity of their offer (which we explore in later sections), but is also likely to highlight new trends
as people ‘shop local’ following the Covid-19 pandemic. It is thought that such trends will continue
into the future. This may partly benefit the RBKC town centres, but it is also proving increasingly
difficult to attract shoppers from further afield across wider sub-regions. This should be monitored
moving forwards, and demonstrates the growing need for diversity and multi-dimensional town
centres.

Royal Borough of Kensington and Chelsea Retail and Leisure Needs Assessment and Town Centre Study, November 2021
www.urbanshape.co.uk 37
Pipeline Development
4.35 The above analysis sets the RBKC town centres at a ‘point in time’, i.e. presenting the current
relationship with the surrounding network of town centres and retail shopping destinations. We
have taken this a stage further to review developments in the pipeline in competing centres to
assess the likely increase in trade draw as a consequence of a new and improved shopping
experience. The review explores future risk to RBKC retaining current levels of market share, or
inversely the opportunity for RBKC to improve market share over the Local Plan period.
4.36 The key development likely to have an impact on RBKC is Battersea Power Station – close to King’s
Road on the southern side of the River Thames, across Chelsea Bridge. The Power Station ‘town
centre’ will open during 2022, forming the centre of a planned new ’15 minute live, work and play
neighbourhood’. The retail offer is driven by high end and luxury British and International brands,
including Hugo Boss, MAC Cosmetics, Space NK, Watches of Switzerland, Jo Malone, boxing gym,
BXR and The Cinema at The Power Station - a new cinema and private members club, with sister
sites including The Cinema, Selfridges and The Cinema in The Arches located in Circus West Village.
4.37 During October 2021 additional new operators signed up, including Ralph Lauren, Calvin Klein,
Tommy Hilfiger, The Kooples, Ray-Ban, Lacoste, Gant, Mango and Reiss. A 25,000 sq ft Food Hall
offering an all-day dining experience will also be opening in the Boiler House at the heart of the
Power Station, with details scheduled to be released over the next few weeks. The Zone 1
Battersea Power Station Underground Station opened in October 2021 as part of the Northern Line
Extension, bringing the development within 15 minutes of the West End and the City. The
development and the impact – particularly on nearby King’s Road (East) – should be monitored
over the plan period.
Battersea Power Station

Royal Borough of Kensington and Chelsea Retail and Leisure Needs Assessment and Town Centre Study, November 2021
www.urbanshape.co.uk 38
Summary
▪ The key sub-regional change since the previous 2008 Study has been the opening of Westfield
White City in October 2008. The data reveals that Central London/West End remains the most
popular shopping destination for those living within the survey area, followed by King’s Road,
Westfield White City and Kensington High Street. Consistent with the 2008 Study, King’s Road
and Kensington remain by far the most popular town centres in the borough, whilst the
ranking of ‘other’ town centres beyond the borough has changed very little since the 2008
Study with Hammersmith, Brent Cross, Kilburn and Clapham Junction remaining popular
choices. Within Zones 1-3, King’s Road and Kensington have the strongest market shares.
▪ An analysis of the Central/North Sub-Area and South Sub-Area town centres concludes that
Kensington High Street and King’s Road have consolidated and increased their market share in
their respective survey zones (2 and 3) since 2008. It is also evident that:
o the South Sub-Area town centres combined have been robust, showing a significant
market share increase in Zone 3, and relatively stable market shares across the
remainder of the survey area; and
o the Central/North Sub-Area town centres combined have been more vulnerable,
and aside from a significant market share increase in Zone 2, have lost market share
in most other survey zones. Westfield White City has had a significant impact in
Zone 1, diverting trade predominantly from Kensington High Street which has seen
a significant market share reduction in this survey zone.
▪ RBKC town centres have increased their level of trade retention within Zones 1-3, and the
impact of Westfield White City on shopping patterns within the borough have been
considerably less than initial estimated. RBKC town centres have, however, lost market share
in survey zones located outside of the borough (4-10) with pre-development forecasts of
impact concluded to be broadly correct. The outer survey zones (4/5/6/7/8/9/10) are all well
connected to Westfield by overground and underground. Losing market share in areas further
afield is also likely to be a consequence of the post-pandemic ‘shop local’ trend – partly
benefitting the RBKC town centres, but also demonstrating the need for diversity and multi-
dimensional town centres to continue to attract shoppers from further afield.
▪ The opening of Battersea Power Station as a retail and leisure ‘destination’ has potential
impact implications for the borough, particularly King’s Road East and Knightsbridge. This
should be monitored moving forwards over the plan period and within evidence base updates
and annual monitoring reports where possible.

Royal Borough of Kensington and Chelsea Retail and Leisure Needs Assessment and Town Centre Study, November 2021
www.urbanshape.co.uk 39
5. Knightsbridge
5.1 Knightsbridge is identified as an International Centre in the Local Plan and London, defined as
follows:
▪ International centres: London’s globally-renowned retail and leisure destinations, providing a
broad range of high-order comparison and specialist shopping, integrated into environments
of the highest architectural quality and interspersed with internationally-recognised leisure,
culture, heritage and tourism destinations. These centres have excellent levels of public
transport accessibility. [London Plan 2021, Annex 1]
5.2 The Knightsbridge International Centre allocation reflects the concentration of flagship stores for
many British and International fashion houses and department stores, most notably Harrods, which
is the single largest visitor attraction in the borough, and Harvey Nichols. There are just two
International Centres in London; the West End and Knightsbridge, although Stratford and
Shepherds Bush are identified as having the potential to take a step change upwards to
International Centre level in the London-wide town centre hierarchy. This will be monitored over
the course of the London Plan period.
5.3 Most of the centre lies within Kensington and Chelsea, but it does straddle the boundary with the
City of Westminster. Our analysis focuses on the area of the International Centre falling within the
borough of Kensington & Chelsea (comprising 252 units), incorporating the south side of Brompton
Road from the junction with Thurloe Place at the western end, to William Street (adjoining the Park
Tower Hotel) at the eastern end; and also Sloane Street stretching to Cadogan Place at the
southern boundary of the International Centre. A number of important peripheral streets also fall
within the centre boundary and our analysis, including Beauchamp Place, Hans Road, Hans
Crescent, Cheval Place, Brompton Place and Basil Street.
5.4 Knightsbridge attracts a high number of visitors from around the UK and the World. The centre is
part of London’s Central Activities Zone (CAZ) reflecting how the world class shops and hotels in
Knightsbridge contribute to London’s role as a world city. The shopping centre is surrounded by
high level residential development, and a number of exclusive hotels. The Local Plan notes that all

Royal Borough of Kensington and Chelsea Retail and Leisure Needs Assessment and Town Centre Study, November 2021
www.urbanshape.co.uk 40
of the major footfall generators are located on the south side of Brompton Road. This, along with
the barrier presented by heavy traffic along Brompton Road, and a significant change in level
across the road west of Harrods, combines to make this a one-sided shopping street – falling within
Kensington & Chelsea.
5.5 The Local Plan sets out the vision for the borough (Policy CV 1), aiming to enhance the reputation
of national and international destinations – Knightsbridge, Portobello Road, South Kensington, the
King’s Road, Kensington High Street – by supporting and encouraging retail and cultural activities in
particular. Policy CV 1 adds that the top retail destinations of Knightsbridge, King’s Road,
Kensington High Street and Portobello will have been maintained and enhanced to the period
2028. Policy CV 13 sets the vision for Knightsbridge in 2028:
“By 2028, Knightsbridge will have maintained its role as one of London’s most exclusive
national and international shopping destinations, drawing visitors from across the world. It
will also continue its role as an important residential quarter and a service centre for
residents in both Kensington and Chelsea and Westminster. These two functions will exist
together harmoniously and the public realm will have been improved to reflect both roles.”
5.6 The London Plan identifies some opportunity for development in Knightsbridge International
Centre. Whilst it does not identify any future reclassification of the International Centre (the
highest classification) in the town centre hierarchy, it records it as having high commercial growth
potential with the opportunity to provide some low level incremental housing intensification. High
commercial growth includes town centres likely to experience strategically-significant levels of
growth with strong demand and/or large-scale retail, leisure or office development in the pipeline
and with existing or potential public transport capacity to accommodate it (typically PTAL 5-6).
5.7 The London Plan identifies Knightsbridge being within the Central Activity Zone (CAZ) office
guidelines area. Policy SD5 of the London Plan confirms that offices are to be given greater weight
relative to new residential development within the CAZ, including Knightsbridge.
5.8 The London Plan does not identify the centre as falling within a Strategic Area for Regeneration,
but does confirm a night-time economy classification of NT2, i.e. having a strategic night-time
function involving a broad mix of activity during the evening and at night including culture, leisure,
entertainment, food and drink, health services and shopping. Knightsbridge NT2 is recorded as
being of regional or sub-regional significance.
Diversity of Uses / Retailer Representation
5.9 Based on the latest survey by Experian Goad (March 2021), Knightsbridge International Centre
(falling within Kensington & Chelsea) comprises 62,250 sq m of retail, leisure and service floorspace
across 252 units. Table 1.1 and 1.2 below set out the diversity of uses in Knightsbridge compared
to the national average in respect of town centre composition. The data demonstrates that the
Major Centre continues to have a particularly strong representation of comparison goods retail
operators compared to all other categories which fall below national average levels.
5.10 The proportion of convenience goods operators (2%) is significant below the national average of
9.2%, comprising just 5 of the 252 shop units. These include one bakers, two delicatessens, one tea
and coffee merchant and one small convenience store – ‘Lord’s Food & Wine’ at the western end
of Brompton Road. On the north side of Brompton Road, in the City of Westminster, is Waitrose
Little and a Sainsbury’s Local with external ATM cash machine. It is concluded, however, that

Royal Borough of Kensington and Chelsea Retail and Leisure Needs Assessment and Town Centre Study, November 2021
www.urbanshape.co.uk 41
Knightsbridge is not a convenience goods/food purchase destination. A number of local and
London-wide residents shop in the luxury Harrods and Harvey Nichols food halls.
Table 5.1: Knightsbridge International Centre Composition of Uses (Units)
No. of units % of Total UK Average (%) Variance
Convenience 5 2.0 9.2 -7.2%
Comparison 111 44.0 29.6 14.4%
Leisure Service 48 19.0 24.4 -5.4%
Retail Service 27 10.7 15.0 -4.3%
Financial & Business Service
9 3.6 9.9 -6.3%
Vacant 52 20.6 11.7 8.9%
Total 252 100 100 -
Table 5.2: Knightsbridge International Centre Composition of Uses (Floorspace sq m gross)
Floorspace % of Total UK Average (%) Variance
Convenience 730 1.2 9.2 -8.0%
Comparison 39,070 62.8 29.6 33.2%
Leisure Service 9,950 16.0 24.4 -8.4%
Retail Service 2,290 3.7 15.0 -11.3%
Financial and Business Service
1,760 2.8 9.9 -7.1%
Vacant 8,450 13.6 11.7 1.9%
Total 62,250 100 100 -
5.11 As you would expect for an International Centre, Knightsbridge has a particularly strong proportion
of comparison goods operators (44%), significantly above the national average of 29.6%, and
comprising 111 retail operators. Within the comparison goods category 70 operators (63% of total)
are within the clothing, footwear, and clothing accessories sub-categories.
5.12 The frontage between Harrods and Harvey Nichols is a key clothing destination, including flag ship
stores for high end brands Hugo Boss, Furla, Grand Seiko, All Saints, Tommy Hilfiger, Diesel, Ted
Baker and Russell & Bromley. Zara also has a flagship store on this frontage. To the east, Sloane
Street is an exclusive retail address, home to a large number of luxury national and international
clothing brands and flagship stores including Dolce & Gabbana, Versace, Fendi, Balenciaga, Chanel,
Valentino, Roberto Cavalli, Gucci, Giorgio Armani, Prada, Luis Vuitton, Dior and Joseph.
5.13 There is also a strong concentration of luxury jewellery and watch brands, located on Beauchamp
Place, Brompton Road and Sloane Street. These include Watches of Switzerland, Grand Seiko,
Omega, Bulgari, and Graff Diamonds. Other comparison goods sub-categories include a smaller
number of art galleries, chemists, interior decorations, florists, bridal wear, and health & beauty.
The focus of comparison goods retailing in Knightsbridge is clothing, footwear and jewellery.

Royal Borough of Kensington and Chelsea Retail and Leisure Needs Assessment and Town Centre Study, November 2021
www.urbanshape.co.uk 42
5.14 Both leisure and retail services are below the national average, albeit some operators north of
Brompton Road within the City of Westminster do contribute the overall offer. The Leisure
Services category is primarily comprised of international cuisine restaurants and hotels, with a
small number of cafes. There is also a betting office (William Hill), The Park Tower Casino,
McDonalds and Pret A Manger, two public houses and two health clubs. There are 27 retail service
operators, mostly comprising beauty salons and hairdressers, with the majority located on
Beauchamp Place. There is also a dry cleaners and three opticians. There are nine financial and
business services identified including four estate agents, and five banks, with Natwest and Barclays
both represented.
5.15 The Experian Goad survey (March 2021) recorded 52 vacant units across Knightsbridge
International Centre. This proportion (20.6%) is above the national average (11.7%), and raises
some concerns about the vitality and viability of Knightsbridge as an International Centre in the
borough. Experian did, however, record that 31 of these vacant units were ‘under alteration’,
suggesting a significant level of new investment into the International Centre. As part of this
project a new and up-to-date audit of vacant units was undertaken to further explore this key
vitality indicator.
5.16 A key development block containing 15 vacant units ‘under alteration’ were identified as part of
the K1 Knightsbridge site. The site sits adjoining Harvey Nichols to the west, and is bound by
Brompton Road, Sloane Street and Basil Street. The completed mixed-use project will retain the
historic façade and create modern, high-end retail and office space, 35 residential units and a new
rooftop restaurant totalling 340,000 sq ft. A major aspect of the scheme is the creation of a new
step-free access to Knightsbridge underground station via a new entrance from Hooper’s Court.
The station entrance currently at the corner of Sloane Street and Brompton Road will be relocated
further west along Brompton Road.
5.17 A further block to the western end of the International Centre and bound by Brompton Road,
Yeomans Row and Ovington Gardens has been refurbished and reconfigured, previously comprising
5 recorded vacant units. The project involved the amalgamation of small retail units and office
space at 197-205 Brompton Road to provide one 1,500 sq m flagship retail space. This unit has
since been let to luxury retailer ‘Smallbone’, a private multi-sensory, multi-brand destination

Royal Borough of Kensington and Chelsea Retail and Leisure Needs Assessment and Town Centre Study, November 2021
www.urbanshape.co.uk 43
showcasing new and iconic kitchen, furniture and home interior collections within a ‘by
appointment only’ immersive shopping experience.
5.18 Those two blocks combined incorporated 20 of the recorded vacant units, reducing unoccupied
units to just 32, or 12.7% of total units. This remains above the national average of 11.7%, but only
marginally. Many of the ‘stand-alone’ vacant units remain empty, including a selection on
Beauchamp Place, possibly a consequence of the lengthy Covid-19 pandemic and town centre
economies only recently re-opening for business. Retailer ‘Alphatauri’ is set to shortly open on
Brompton Road, with bill board posters in Unit No.171-175 on the junction with Beauford Gardens.
Vacancies and re-occupancy across the centre should be monitored closely following the pandemic
and planning legislation change – a number of owners could be considering their occupancy
options across different land use categories.
Diversity of Uses: Town Centre Change 2008-2021
5.19 Table 5.3 below, compares the town centre composition by number of units since 2008. It is
evident that over this 13-year period the proportion of comparison goods has declined from 50.7%
to 44.0% in line with national trends; but could be of concern given the International Centre status
of Knightsbridge. Sloane Street and the eastern end of Brompton Road between Harrods and
Harvey Nichols remains the main concentration of high end and luxury clothing and footwear
retailers. The analysis suggests this downward trend is most prevalent in the western part of the
major centre, where there is a higher concentration of vacant units.
5.20 In other categories, the proportion of convenience goods and financial and business services has
fallen, whilst leisure and retail services and vacant units has increased. This should be monitored
moving forwards.
Table 5.3: Knightsbridge International Centre Diversity of Uses by Number of Units 2008-2021
No.of Units 2008 % of Total 2008 No.of Units 2021 % of Total 2021
Convenience 9 3.4% 5 2.0%
Comparison 154 57.5% 111 44.0%
Leisure Service 43 16.0% 48 19.0%
Retail Service 19 7.1% 27 10.7%
Financial & Bus. 21 7.8% 9 3.6%
Vacant 22 8.2% 52 20.6%
Accessibility
5.21 In terms of public transport accessibility levels, most of the centre is located in an area rated as
having “very good” accessibility (a score of 5). The area around Knightsbridge tube station has the
highest PTAL score of 6. Knightsbridge underground station (Piccadilly Line) is located at the
eastern end of the centre near the junction of Brompton Road and Sloane Street, and as such is
fairly central to the shopping centre. South Kensington underground station (Piccadilly, Circle and

Royal Borough of Kensington and Chelsea Retail and Leisure Needs Assessment and Town Centre Study, November 2021
www.urbanshape.co.uk 44
District Lines) is located approximately 300m from the centre. The stations provide ease of access
to Knightsbridge as a shopping destination. The new K1 development will provide step-free access
to the Piccadilly Line once complete and open – expected in 2022.
Customer Views and Behaviour
5.22 The household telephone survey asked a series of qualitative attitudinal questions probing
respondents about their usage of the town centres, their likes and dislikes, and how they think
Knightsbridge International Centre could be improved in the future. A number of the questions are
multiple response, enabling the respondent to state more than one answer, and as a result some of
the percentage figures are greater than 100%. The key findings are summarised below:
i. The lower ‘frequency of visit’ reflects the centres higher order role as an International Centre,
with only 32.6% visit once a week or more often. A further 12% visit every two weeks, 11%
visit monthly, 8.3% every two months, 15% 3-4 times a year, and 11% once a year.
ii. When people visit the centre, their dwell time is relatively long, with 36% visiting for up to an
hour, 40% staying for 1-2 hours, and 21% staying for 2-4 hours.
iii. The highest response when asked about the main purpose of their trip was non-food shopping
(58%), followed by day out/walk about (16%), for work (11%), to visit cafes/restaurants (6%),
and for food shopping (5%).
iv. When asked ‘what else’ they would be doing in Knightsbridge International Centre the
responses were focused to cafes/restaurants (22%), non-food shopping (21%) and food
shopping (12%). This highlights the relatively constrained role of the higher order, focused on
high end comparison goods shopping, with linked trips to cafés and restaurants.
v. When asked what they liked about the centre, responses included close to home (25%), good
range of non-food shops (18%), the attractive environment (16%), being enroute to work
(11%), good range of quality shops (11%), and being close to friends/relatives (7%).
vi. Respondents were then asked what they disliked about the centre, with the main issues raised
being noise, traffic congestion, insufficient parking, the need for more affordable shops and
cafes/restaurants, and the constant building works.

Royal Borough of Kensington and Chelsea Retail and Leisure Needs Assessment and Town Centre Study, November 2021
www.urbanshape.co.uk 45
6. King’s Road (East)
6.1 King’s Road (East) is defined as a Major Centre in the Local Plan and London Plan. It is located in
the south east of the borough, close to the boundary with The City of Westminster, and is less than
100 metres to the east of King’s Road (West) District Centre. Comprising 254 units, it is the fourth
largest centre in the borough after Kensington High Street, Knightsbridge and Portobello Road. It is
one of London’s most vibrant and fashionable shopping streets, stretching along King’s Road from
the junction with Oakley Street and Dovehouse Street at the western end to, and including, Sloane
Square at the eastern end.
6.2 Around Sloane Square, the centre also includes a number of nearby shopping streets including
Sloane Street, Cadogan Gardens, Duke of York Square, Symonds Street and Pavilion Road. At the
eastern end, the Major Centre is anchored by Peter Jones department store at Sloane Square and
the Duke of York Square development, which is home to the Saatchi Museum and Art Gallery. This
part of King’s Road is characterised by upmarket international chains and multiple retailers, and
has excellent levels of accessibility being served by the Sloane Square underground station with
direct access to the district and circle line.
6.3 A number of ‘other’ town centre uses are located at the western end of the centre, including the
Royal Borough of Kensington & Chelsea Council offices, the Council run (‘Better’) Chelsea Sports
Centre and – just outside but adjoining the boundary – is the Chelsea Fire Station. The main
supermarket within the centre is a Waitrose store located on King’s Road towards the western end
of the centre, with a large food hall in the Marks & Spencer store also on King’s Road further east
than Waitrose.
6.4 The Local Plan sets out the vision for the borough (Policy CV 1), aiming to enhance the reputation
of national and international destinations – Knightsbridge, Portobello Road, South Kensington, the
King’s Road, Kensington High Street – by supporting and encouraging retail and cultural activities in
particular. Policy CV 1 adds that the top retail destinations of Knightsbridge, King’s Road,
Kensington High Street and Portobello will have been maintained and enhanced to the period
2028, with a possible new Crossrail 2 station on King’s Road. Policy CV 15 sets the vision for Sloane
Square/King’s Road in 2028:

Royal Borough of Kensington and Chelsea Retail and Leisure Needs Assessment and Town Centre Study, November 2021
www.urbanshape.co.uk 46
CV 15 Vision for Sloane Square/King’s Road in 2028 The rich iconic brand and history
of King’s Road will have been consolidated to ensure it remains one of London’s most
vibrant shopping streets, containing a lively and diverse mix of shops, restaurants,
and world-class cultural attractions. It will continue to be a place where one can
shop in both independent boutiques and chain stores; a place to enjoy, to
promenade, a place which meets the day-to-day needs of local people; and a place
to experience some of the best theatre, concert, museum and gallery events that
London has to offer. Work would have commenced on a new Crossrail 2 station that
would provide Chelsea with extra underground capacity that will be required in this
part of the network, help to maintain the vitality and viability of the area’s
businesses, reduce traffic congestion along the King’s Road and improve air quality.
6.5 The London Plan identifies some opportunity for development in King’s Road (East). Whilst it does
not identify any future reclassification of King’s Road (East) in the town centre hierarchy, it records
it as having medium – rather than low – commercial and residential growth potential. The London
Plan also identifies King’s Road (East) as having mixed-use office potential; i.e. having the capacity,
demand and viability to accommodate new office development, generally as part of mixed-use
developments including residential use. This is likely to be driven by ‘possible’ sites identified for
Crossrail 2, and the Chelsea Farmers Market site – discussed below.
6.6 The London Plan does not identify the centre as falling within a Strategic Area for Regeneration,
but does confirm a night-time economy classification of NT2, i.e. having a strategic night-time
function involving a broad mix of activity during the evening and at night including culture, leisure,
entertainment, food and drink, health services and shopping. King’s Road (East) NT2 is recorded as
being of regional or sub-regional significance.
6.7 The Local Plan allocated one Strategic Site for redevelopment – the Chelsea Farmer’s Market (CA9),
Figure 2.1 below. This site is located on Sydney Street at the far western end of the King’s Road
(East) Major Centre. Sydney Street is a busy street connecting the King’s Road and Fulham Road,
and is well located for public amenity and transport hubs, as well as sports, leisure and retail
facilities. The Royal Brompton & Harefield NHS Foundation Trust are seeking to redevelop this site
to provide a high quality residential-led development (minimum 50 units), with active retail
frontages facing onto a new public square.
Figure 2.1: Site Allocation CA9, Chelsea Farmers’ Market

Royal Borough of Kensington and Chelsea Retail and Leisure Needs Assessment and Town Centre Study, November 2021
www.urbanshape.co.uk 47
Diversity of Uses / Retailer Representation
6.8 Based on the latest survey by Experian Goad (March 2021), King’s Road (East) comprises 51,660 sq
m of retail, leisure and service floorspace across 254 units. Table 6.1 and 6.2 below set out the
diversity of uses in King’s Road (East) Major Centre compared to the national average in respect of
town centre composition. The data demonstrates that the Major Centre continues to have a
particularly strong representation of comparison goods retail operators.
Table 6.1: King’s Road (East) Major Centre Composition of Uses (Units) - 2021
No. of units % of Total UK Average (%) Variance
Convenience 12 4.7 9.2 -4.5
Comparison 142 55.9 29.6 26.3
Leisure Service 40 15.7 24.4 -8.7
Retail Service 22 8.7 15.0 -6.3
Financial & Business Service
7 2.8 9.9 -7.1
Vacant 31 12.2 11.7 0.5
Total 254 100 100 -
Table 6.2: King’s Road (East) Major Centre Composition of Uses (Floorspace sq m gross) - 2021
Floorspace % of Total UK Average (%) Variance
Convenience 3,900 7.5 9.2 -1.7
Comparison 31,160 60.3 29.6 30.7
Leisure Service 6,790 13.1 24.4 -11.3
Retail Service 2,060 4.0 15.0 -11.0
Financial and Business Service
1,450 2.8 9.9 -7.1
Vacant 6,300 12.2 11.7 0.5
Total 51,660 100 100 -
6.9 The proportion of convenience goods operators (4.7%) is substantially below the national average
of 9.2%, comprising just 12 units in total. The main foodstore is Waitrose, located towards the
western end of the district centre. The store has temporarily moved to new premises a short
distance away whilst a new unit is being built within the Chelsea Manor Street redevelopment site
– currently under construction and due to open in 2022. M&S is also located in the western part of
the Major Centre, but further east than Waitrose; it includes a large ‘Simply Food’ alongside
clothing and fashion brands. Other convenience goods operators are limited, including a selection
of bakers, deli’s and health food shops – almost all of which are at the western half of the centre,
some distance from the main comparison goods shopping core.
6.10 King’s Road (East) Major Centre has a particularly strong proportion of comparison goods
operators, substantially above the national average comprising 142 units. The strongest
proportion of comparison goods operators is in the eastern half of the major centre, close to

Royal Borough of Kensington and Chelsea Retail and Leisure Needs Assessment and Town Centre Study, November 2021
www.urbanshape.co.uk 48
Sloane Square and Peter Jones, with operators interspersed only occasionally by a bank,
hairdressers or café. The majority of businesses (93) are clothing and footwear retailers occupying
65% of comparison goods units; including a high number of well-known mid to high end high street
brands such as Jigsaw, Zara, All Saints, Reiss, Boden, Anthropologie, Jigsaw, Ghost, LK Bennett,
Joseph, Hobbs, Kate Spade, Calvin Klein, Sweaty Betty, and Comptoir Des Cotonniers.
6.11 The comparison goods mix also includes art galleries, book shops, charity shops, chemists, gifts,
florists, jewellers, mobile phone shops, and health and beauty products. Rymans and Smiggle the
stationers, the White Company home furnishings, and Pet Pavilion pet shop are also represented.
Peter Jones department store anchors the centre at the eastern end fronting on to Sloane Square.
6.12 Overall, the high street clothing and footwear offer still provides many of the biggest brands in
retailing, with the concentration of operators driving a strong town centre destination for visitors
and shoppers from London and beyond. The mix is, however, comprised of mid to high end high
street chains, many of which are vulnerable to current market forces.
6.13 Leisure services, retail services and financial & business services are all below the national average.
There are 40 leisure services on King’s Road (East), primarily located in the western half of the
centre, with a small number of restaurants in the peripheral streets near to Sloane Square –
including Duke of York Square. The majority of businesses are good quality restaurants offering
international cuisine. There are ten cafes, two bar/wine bars, four fast food take-aways, and two
public houses. The fast food venues include McDonalds, Pret a Manger, Five Guys, and Cru 8 Deli.
6.14 There are three health clubs / gyms offering different facilities and exercise classes including the
Chelsea Sports Centre at the western end of the high street, Kobox Sports Club to the west of
Marks & Spencer, and Powertone health club in the King’s Walk Shopping Mall.
6.15 Retail services comprise 22 operators, including a dry cleaners, health and beauty, hairdressing,
natural therapy, opticians, film developing and clothing alterations. These are predominantly
located at the western end of the major centre, within the concentration more directly targeted
and shopping and services for a more local population. Financial and business services comparison
just 2.9% of total units in the major centre, compared to a national average of 9.9%. The seven
operators comprise two estate agents and four of the major banks including Natwest, Barclays,
HSBC and Santander. The banks are located in the eastern half of the high street, within the core
comparison goods shopping area.
6.16 There are a number of ‘other’ town centre uses driving the vitality of King’s Road (East) Major
Centre; including a dentist on Lincoln Street, doctors on Sydney Street, the Royal Borough of
Kensington & Chelsea Council offices, Citizens Advice Bureau (CAB), The Saatchi Gallery, Chelsea
Library, Michael Hoppen Gallery, and the Chelsea Methodist Church.
6.17 The Experian Goad Survey (March 2021) recorded 31 vacant units, although five were ‘under
alteration’ with new businesses investing in opening new premises. A unit on Sloane Street at the
junction with Lower Sloane Street has been re-occupied by Ralph Lauren, whilst four large units
now fall within the Chelsea Major Street redevelopment site – currently under construction. A unit
previously occupied by Reiss is also now under alteration, close to the entrance of the King’s Walk
Shopping Mall, and there are other signs of new operators moving in to the centre. The up-to-date
analysis demonstrates that the vacancy rate is comfortably under the national average, with clear
signs of new investment and new operators.

Royal Borough of Kensington and Chelsea Retail and Leisure Needs Assessment and Town Centre Study, November 2021
www.urbanshape.co.uk 49
Diversity of Uses: Town Centre Change 2008-2021
6.18 Table 6.3 below, compares the town centre composition by number of units since 2008. It is
evident that over this 13-year period the proportion of comparison goods has declined
considerably from 71.5% to 55.9%, with the loss of around 40 business. The analysis suggests this
trend is most prevalent in the western half of the major centre, whilst the eastern end continues to
offer a strong range of clothing and footwear retailing – particularly in the frontages closest to
Peter Jones department store.
6.19 As comparison representation has dropped, the proportion of convenience goods operators, retail
and leisure services, and vacant units has increased over the same period. These local trends are
broadly following national trends, with the high street potentially vulnerable to further decline
given the large proportion of mid to high end high street retailers – many of which are finding
current market conditions challenging. Given they are national chains, their presence on King’s
Road may be vulnerable to closure as part of a wider UK decision to cease trading. This should be
monitored moving forwards.
Table 6.3: King’s Road (East) Major Centre Diversity of Uses by Number of Units 2008-2021
No. of Units 2008 % of Total 2008 No. of Units 2021 % of Total 2021
Convenience 8 3.1 12 4.7
Comparison 183 71.5 142 55.9
Leisure Service 28 10.9 40 15.7
Retail Service 13 5.1 22 8.7
Financial & Bus. 10 3.9 7 2.8
Vacant 14 5.5 31 12.2
Total 256 100 254 100
Accessibility
6.20 In terms of public transport accessibility levels, most of the centre is located in an area rated as
having “very good” accessibility (a score of 5). The area around Sloane Square tube station has the
highest PTAL score of 6. Sloane Square underground station is located at the northern end of the
centre on the south eastern corner of Sloane Square, which is slightly removed from the main retail
offer along King’s Road (East). The station is on the Circle and District lines and provides ease of
access for visitors to the centre.
Customer Views and Behaviour
6.21 The household telephone survey asked a series of qualitative attitudinal questions probing
respondents about their usage of the town centres, their likes and dislikes, and how they think
King’s Road Major Centre could be improved in the future. A number of the questions are multiple

Royal Borough of Kensington and Chelsea Retail and Leisure Needs Assessment and Town Centre Study, November 2021
www.urbanshape.co.uk 50
response, enabling the respondent to state more than one answer, and as a result some of the
percentage figures are greater than 100%. The key findings are summarised below:
i. The role of King’s Road (East) as a Major Centre is reflected in a lower frequency of visit –
that would be expected of a centre of this scale. Only 18% visit twice a week or more often.
A further 35% visit once a week or once every two weeks, and 49% visit monthly or less
often. These lower frequency rates are expected for a Major Town Centre underpinned by
high street clothing, shoes and other comparison goods retailing.
ii. When analysing dwell time, 46% stayed for up to one hour; 41% stayed for between 1-3
hours; and 5% stayed between 3-4 hours.
iii. The highest response when asked about the main purpose of their trip was non-food
shopping (50%), followed by a ‘day out/window shopping’ (20%), food shopping (15%), and
to visit cafes/restaurants (5%).
iv. When asked ‘what else’ they would be doing in King’s Road (East) Major Centre there was a
wide variety of response which reflects well on the centres role, with 34% stating ‘to visit
cafes/restaurants’, 34% non-food shopping; 12% food shopping; day out/browsing (10%); to
visit bars/pubs (6%); to visit financial services (5%), to visit personal services such as the
hairdressers (2%); and for other leisure activities (2%).
v. When asked what they liked about the centre, a number of reasons were cited including ‘the
nice environment’ (26%), that it was close to home (25%), the good range of non-food shops
(24%), nice atmosphere (13%), Peter Jones department store (11%), good range of ‘high
street’ retailers (9%), good range of quality shops (9%), good cafes/restaurants (7%), and the
good range of independent shops (6%).
vi. Respondents were then asked what they disliked about the centre, the majority of
respondents said ‘nothing’; whilst a small selection cited that it was too busy/noisy,
insufficient parking, and not enough cafes/restaurants.

Royal Borough of Kensington and Chelsea Retail and Leisure Needs Assessment and Town Centre Study, November 2021
www.urbanshape.co.uk 51
7. Kensington High Street
7.1 Kensington High Street is defined as a Major Centre in the Local Plan and London Plan. It runs
east/west through the centre of the borough (in the Central and North Sub-Area), to the north of
Earls Court Road District Centre and to the south of Notting Hill Gate District Centre. To the north
east of the centre is Kensington Gardens and Hyde Park. The Major Centre is the largest town
centre in the borough comprising 411 units running in linear format for approximately 900 metres
along Kensington High Street, and also including Kensington Church Street.
7.2 The Local Plan highlights that the Major Centre is an important shopping and leisure destination,
being the focus of the local community providing public and community services such as the town
hall, library, post office, pharmacies and banks and attracts visitors from outside the borough. The
centre and surrounding side streets offer a wide range of shops, cafes, bars and restaurants that
make an important contribution to the vitality of the area. Kensington High Street underground
station provides access to both the Circle and District lines and is located within the core retail area
and is accessed via a shopping arcade.
7.3 Kensington High Street has been one of London’s top retail streets for the last 100 years and has –
in recent years – seen significant retail change. Chapter 12 of the Local Plan highlights it as once
having the biggest concentration of department stores outside Oxford Street, but that these have
now been replaced by more mainstream chain stores leaving ‘an impressive architectural legacy’
within the High Street. The Local Plan adds that the side streets provide valued lower cost retail
and Kensington Church Street retains a cluster of antique shops, and part of the centre’s strength is
that it serves the day-to-day needs of local residents.
7.4 Kensington High Street is the borough’s largest town centre office location providing a range of
accommodation from drop-in desk space and small offices above shops to large footplate offices in
the former department stores. The music industry and newspaper journalism have traditionally
focused on this location, with approximately 14,000 people working in the area. Kensington High
Street is also an important cultural centre. Bookended by Kensington Gardens and Holland Park it
features attractions such as Kensington Palace, Leighton House, Linley Sambourne House, Opera
Holland Park and the Design Museum.
7.5 The Local Plan sets out the vision for the borough (Policy CV 1), aiming to enhance the reputation
of national and international destinations – Knightsbridge, Portobello Road, South Kensington, the
King’s Road, Kensington High Street – by supporting and encouraging retail and cultural activities in
particular. Policy CV 1 adds that the top retail destinations of Knightsbridge, King’s Road,
Kensington High Street and Portobello will have been maintained and enhanced to the period
2028. Policy CV12 (Chapter 12) sets the Local Plan vision for Kensington High Street in 2028:
“By 2028, Kensington’s High Street will have strengthened its identity. The High Street will
have built upon its traditional role as the civic heart of the Royal Borough. New
development will have strengthened and enhanced the retail offer, especially within the
primary frontage, with landlords and developers collaborating with residents, businesses
and the Council to improve the diversity and quality of retail occupiers, as well as the
overall shopping experience. The High Street will have remained a well-connected location
for employment with offices on upper floors continuing to support the centre’s vital retail
function.

Royal Borough of Kensington and Chelsea Retail and Leisure Needs Assessment and Town Centre Study, November 2021
www.urbanshape.co.uk 52
The High Street will have developed a reputation as a cultural centre of national and
international importance, as efforts to promote new and existing cultural attractions draw
increasing numbers of visitors from home and abroad. The success of the Design Museum
and the opening of a new cinema will have kick-started a revitalisation of the western end
with new shops, cafes and businesses choosing to locate there. New and improved cultural
and retail uses will have contributed to a distinctive character for the area.”
7.6 The London Plan identifies some opportunity for development in Kensington High Street. Whilst it
does not identify any future reclassification of the Major Centre in the town centre hierarchy, it
records it as having medium commercial growth potential with the opportunity to provide some
low level incremental housing intensification. The London Plan identifies Kensington High Street as
having mixed-use office potential; i.e. having the capacity, demand and viability to accommodate
new office development, generally as part of mixed-use developments including residential use.
7.7 The London Plan does not identify the centre as falling within a Strategic Area for Regeneration,
but does confirm a night-time economy classification of NT2, i.e. having a strategic night-time
function involving a broad mix of activity during the evening and at night including culture, leisure,
entertainment, food and drink, health services and shopping. Kensington High Street night time
economy (NT2) is recorded as being of regional or sub-regional significance.
Diversity of Uses / Retailer Representation
7.8 Based on the latest survey by Experian Goad (March 2021), Kensington High Street Major Centre
comprises 75,990 sq m of retail, leisure and service floorspace across 411 units. Table 7.1 and 7.2
below set out the diversity of uses in Kensington High Street Major Centre compared to the
national average in respect of town centre composition. The data demonstrates that the
composition of the major centre is broadly in line with national average levels, aside from the
vacancy rate which is somewhat higher as recorded in March 2021. We discuss this further below.
7.9 The proportion of convenience goods operators (6.6%) is below the national average of 9.2%,
comprising 27 operators. The offer is anchored on Kensington High Street by a large Waitrose
foodstore at the western end, on the junction with Earls Court Road, and Whole Foods at the
eastern end on the junction with Young Street. There is also a Sainsbury’s Local store at the
northern end of Kensington Church Street, and a selection of bakers/confectioners, small
convenience stores, delicatessens, and health food shops, plus a greengrocers and off licence.
There are no butchers or fishmongers, but the range of product serves both local residents and
visitors well. Local residents are also close to the borough’s main food superstores on Cromwell
Road, including Sainsbury’s and Tesco superstores.
7.10 The proportion of comparison goods operators (28.5%) is broadly in line with the national average
of 29.6%, comprising 117 retailers. A more in-depth analysis highlights that only 27% of these are
clothing and sports wear operators, including a number of well-known high street brands Zara,
H&M, Urban Outfitters, TK Maxx, M&S, Clarks Shoes, COS, Reiss, Hobbs, Jigsaw, Accessorize and
Oliver Bonas. There are still a concentration of outdoor and sports clothing shops including
Cotswolds Outdoors, Sweaty Betty, Ellis Brigham, Columbia Sportswear, Snow & Rock, Runners
Need and Decathlon. A cluster of antique shops, art galleries and lighting/textile shops are located
on Kensington Church Street, providing a concentration and specialist destination/attraction for
visitors.

Royal Borough of Kensington and Chelsea Retail and Leisure Needs Assessment and Town Centre Study, November 2021
www.urbanshape.co.uk 53
Table 7.1: Kensington High Street Major Centre Composition of Uses (Units) - 2021
No. of units % of Total UK Average (%) Variance
Convenience 27 6.6 9.2 -2.6
Comparison 117 28.5 29.6 -1.1
Leisure Service 91 22.1 24.4 -2.3
Retail Service 68 16.5 15.0 1.5
Financial & Business Service
38 9.2 9.9 -0.7
Vacant 70 17.0 11.7 5.3
Total 411 100 100 -
Table 7.2: Kensington High Street Major Centre Composition of Uses (Floorspace sq m gross) - 2021
Floorspace % of Total UK Average (%) Variance
Convenience 7,000 9.2 9.2 0.0
Comparison 25,530 33.6 29.6 4.0
Leisure Service 17,950 23.6 24.4 -0.8
Retail Service 6,630 8.7 15.0 -6.3
Financial and Business Service
6,190 8.1 9.9 -1.8
Vacant 12,690 16.7 11.7 5.0
Total 75,990 100 100 -
7.11 Leisure services are also broadly in line with the national average, comprising 91 businesses. These
include a good range of operator with a strong number of international cuisine restaurants and
cafes/coffee shops – including Starbucks, Café Nero and Costa, but also including a strong selection
of independent businesses. There are also bar/restaurants (5), juice bars (3), betting offices (2),
sandwich bars (5), and public houses (4). McDonalds and Five Guys are both represented, and
there are a number of hotels, social clubs and six health clubs/gyms.
7.12 There are 68 retail services, with numbers reasonably well balanced between dry cleaners, beauty
salons, hairdressers, natural therapy, opticians and travel agents. There is also an undertakers,
photographic film processing shop, a Post Office and clothing alterations. The major centre
appears to serve the local catchment well in this category, offering a number of key day-to-day
requirements. Kensington High Street has 38 financial and business services including
representation from all major banks – Natwest, Barclays, Halifax, Lloyds, Metro Bank, HSBC and
Santander. There are also a number of estate agents, building societies and a financial advisor.
7.13 Kensington High Street Major Centre has a number of ‘other’ town centre uses contributing to its
overall vitality and viability including a large number of offices, three dental surgery’s, the nearby
Design Museum at the western end adjacent to Holland Park, and a number of hotels. There are
three churches including the Catholic Church of Our Lady of Victories, St Mary Abbots Church, and
Our Lady of Mount Carmel and St Simon Stock at the northern end of Kensington Church Street.
Other establishments include the Kensington Central Library, the Kensington Fire Station in Old

Royal Borough of Kensington and Chelsea Retail and Leisure Needs Assessment and Town Centre Study, November 2021
www.urbanshape.co.uk 54
Court Place, St Mary Abbots Primary School, and a number of government/municipal buildings and
embassy buildings.
7.14 The Experian Goad survey (March 2021) recorded 70 vacant units across Kensington High Street
Major Centre. This proportion (17%) is above the national average (11.7%), and raised some
concerns about the vitality and viability of Kensington High Street as a key Major Centre in the
borough. Experian did, however, record that 29 of these vacant units were ‘under alteration’,
suggesting a significant level of new investment into the high street. As part of this project a new
and up-to-date audit of vacant units was undertaken to further explore this key vitality indicator.
7.15 A number of major development blocks were identified, each incorporating a number of shop units
fronting Kensington High Street. These are set out below, and confirm the strong levels of
investment taking place at the current time:
▪ 263 Kensington High Street (3 vacant shop units): a mixed-use development at the far western
end of the major centre, opposite Holland Park, providing state-of-the-art cinema facilities,
modern office (creative workspace) and restaurant space, as well as new private and
affordable homes. The redevelopment of the former cinema, Post Office sorting office and
Whitlock House was granted planning permission in 2016 and the permission was
implemented at the start of 2019 with the demolition of these buildings commencing.
Development is ongoing. Image below:
▪ 201-207 Kensington High Street (3 vacant shop units): Once Woolworth’s London flagship
store and more recently Robert Dyas, planning permission was granted in 2016 for
redevelopment of the site involving retention and restoration of front facade, erection of two
additional storeys and alteration and extensions to rear first and second floor levels to provide
flats, creation of an additional basement level for a gym, alteration of existing basement level
to provide improved retail floorspace and provision of new shop fronts. Development is
ongoing. Image below:

Royal Borough of Kensington and Chelsea Retail and Leisure Needs Assessment and Town Centre Study, November 2021
www.urbanshape.co.uk 55
▪ 127A Kensington High Street, ‘The Kensington Building’ (2 vacant shop units): Planning
permission was granted for the alteration, refurbishment and extension of the Boots building
and the office block behind, and the demolition of the Café Nero pavilion. This will create a
westward extension of High Street Kensington Mall/Arcade. The description of development
states that the scheme will create an anchor retail unit at basement and ground, and five
retail/café units at ground and mezzanine, as well as offices at ground to fifth floor.
Development is ongoing. Image below:

Royal Borough of Kensington and Chelsea Retail and Leisure Needs Assessment and Town Centre Study, November 2021
www.urbanshape.co.uk 56
▪ 101-106 Kensington High Street (4 vacant shop units): a mixed-use development rebuilding
the former 4-storey commercial building with a retained façade to provide new office and
retail space and a small number of luxury new homes. The scheme includes an additional
mansard roof level, and will provide retail floorspace at ground level. Development is
ongoing. Image below:
▪ 165-181 Kensington High Street (3 vacant shop units): A mixed-use development, consisting
of rear extensions up to third floor to create 8 residential units and additional office space.
Retention of the retail space at ground floor with replacement shop frontages. Development
is ongoing. Image below:
▪ Lancer Square, Kensington Church Street (12 vacant shop units): Construction is nearing
completion on this mixed use scheme comprising four blocks ranging from four to seven
storeys, to include retail and cafes at ground floor, 36 apartments with pool, spa and gym, and
a new office building. Development is ongoing. Image below:

Royal Borough of Kensington and Chelsea Retail and Leisure Needs Assessment and Town Centre Study, November 2021
www.urbanshape.co.uk 57
▪ 193 Kensington High Street (1 vacant shop unit): Formerly occupied by Waterstones, this site
is undergoing major refurbishment across the ground and upper floors and will create a new
modern shop floor at ground floor level. Image below:
7.16 The redevelopment blocks listed above comprise 28 previously vacant units, reducing recorded
empty vacant units from 70 to 42, or 10.2% of total units. This brings the vacancy rate down to
below the national average, assuming new modern shop formats will be let upon completion.
Beyond these development blocks, elsewhere in the centre, a number of previously vacant units
have been re-let, with new businesses including, for example, Street Burger Gordon Ramsey and
Roar Fitness Health Club, whilst a further six individual units are being refurbished for new

Royal Borough of Kensington and Chelsea Retail and Leisure Needs Assessment and Town Centre Study, November 2021
www.urbanshape.co.uk 58
operators. This level of new investment and re-lets reduces the vacancy rate by a further eight
units, down to 34 units, or 8.3% of total units (below the national average of 11.7%).
7.17 The vacancy rate across a centre the size of High Street Kensington will fluctuate month to month,
but this analysis suggests that the Experian survey in March 2021 substantially over-inflated this
particular vitality indicator. A more in-depth analysis demonstrates a significant level of
investment, refurbishment and redevelopment across major sections of high street frontage,
suggesting a buoyant and healthy town centre. Future re-lets will need to be monitored in light of
new planning legislation.
Diversity of Uses: Town Centre Change 2008-2021
7.18 Table 7.3 below, compares the town centre composition by number of units since 2008. Whilst the
analysis above confirms a continued healthy and vibrant town centre, it is evident that over this 13-
year period, the major centre has experienced a substantial fall in the number and proportion of
comparison goods operators and a strong increase in leisure and retail services, and also
convenience and financial and business services.
7.19 The data suggests a significant increase in vacant units, but the most up-to-date analysis confirms
that the proportion of unoccupied units has only increased by less than 2%. The reoccupation of
units being refurbished and redeveloped will need to be monitored over the next 12-24 months to
understand the actual position in respect of vacant units and town centre composition.
Table 7.3: Kensington High Street Major Centre Diversity of Uses by Number of Units 2008-2021
No.of Units 2008 % of Total 2008 No.of Units 2021 % of Total 2021
Convenience 18 5.5 27 6.6
Comparison 163 49.5 117 28.5
Leisure Service 61 18.5 91 22.1
Retail Service 41 12.5 68 16.5
Financial & Bus. 24 7.3 38 9.2
Vacant 22 6.7 70 17.0
Total 329 100 411 100
Convenience examples: bakers, butchers, supermarket, fishmongers, grocers, newsagent;
Comparison examples: clothing, footwear, chemist, charity, cycle shop, DIY/electrical, florist, mobile phone;
Leisure Service examples: café, bars, restaurants, hot food take-away, bars/wine bars;
Financial & Business examples: banks, building societies, estate agents, employment and careers;
Retail Service examples: dry cleaners, opticians, Post Office, health and beauty, hairdressers.
Accessibility
7.20 In terms of public transport accessibility levels, most of the centre is located in an area rated as having
“excellent” accessibility (a score of 6). The peripheral area to the west has a lower PTAL score of 5.
Public transport accessibility to Kensington High Street is excellent. The underground station is located

Royal Borough of Kensington and Chelsea Retail and Leisure Needs Assessment and Town Centre Study, November 2021
www.urbanshape.co.uk 59
within the core retail/shopping area and is accessed via a shopping arcade. The underground station is
on both the Circle and District lines. A significant number of bus routes pass through the centre, linking
the centre with most parts of the Borough as well as Central and West London.
Customer Views and Behaviour
7.21 The household telephone survey asked a series of qualitative attitudinal questions probing respondents
about their usage of the town centres, their likes and dislikes, and how they think Kensington High
Street Major Centre could be improved in the future. A number of the questions are multiple response,
enabling the respondent to state more than one answer, and as a result some of the percentage figures
are greater than 100%. The key findings are summarised below:
i. Frequency of visit is reasonably high, with 51% visiting the Major Centre at least once a week or
more often. A further 11% visit every two weeks, 13% visit monthly, and 21% visit once every two
months or less often. Within that figure, only 3% visit twice a year, and 2% visit once a year. The
figures suggest that Kensington High Street has a relatively tight catchment predominantly
comprising the local area and some living in the wider west London sub-region.
ii. In terms of dwell time, 51% of respondents stay in the major centre for up to an hour, whilst 36%
stay between 1-3 hours, and 7% for 3-5 hours. This suggests a relatively strong dwell time, driven
by the broad range of shopping and leisure and retail service providers.
iii. The highest response when asked about the main purpose of their trip was non-food shopping
(36%), followed by food shopping (31%), day out/browsing (15%), to visit cafes/restaurants (5%),
and for work purposes (4%).
iv. When asked ‘what else’ they would be doing in Kensington High Street the range of responses
including non-food shopping (39%), to visit cafes/restaurants (29%), for food shopping (15%), for a
day out/browsing (7%), to visit financial services such as banks (6%), and for other leisure activities
(4%).
v. When asked what they liked about the centre, there was a broad range of positive responses
including the good range of non-food shops (28%), that it was close to home (23%), the
attractive/nice environment (14%), ‘you can get everything you need’ (8%), nice atmosphere (7%),
compact (5%), easy to get to by bus (5%), vibrant/diverse (5%), and the good range of high street
retailers (4%).
vi. Respondents were then asked what they disliked about the centre, half stated ‘nothing’, whilst a
number of others cited traffic congestion, too many empty shops, need better range of non-
food/high street/independent shops, too busy/noisy, and poor cycle paths/not enough cycle paths.

Royal Borough of Kensington and Chelsea Retail and Leisure Needs Assessment and Town Centre Study, November 2021
www.urbanshape.co.uk 60
8. Earls Court Road
8.1 Earls Court Road is defined as a District Centre in the Local Plan and London Plan. It is located in
the west of the borough (South Sub-Area), bordering the London Borough of Hammersmith and
Fulham. The centre comprises 125 shop units, and is predominantly linear in form running along
Earl’s Court Road from Old Brompton Road in the south to the junction of West Cromwell Road and
Cromwell Road in the north. The eastern entrance of Earls Court underground station leads
directly into the southern part of the district centre which provides a range of shops, restaurants,
cafes and pubs, primarily meeting the needs of people that live in the area and visitors.
8.2 Figure 8.1 below illustrates the location of Earls Court Road District Centre within the wider Earls
Court area, including the location of the Earls Court and West Kensington Opportunity Area. The
western entrance of Earls Court underground station leads directly to Warwick Road and the
former Earls Court Exhibition Centre; the Exhibition Centre has now been demolished (2017)
following approved outline planning permission in 2013. The now vacant site (Policy Site Allocation
CA4) lies within the Opportunity Area. Policy CV8 sets out the Earls Court future vision:
“By 2028, the former exhibition centre will be transformed into a vibrant new
urban village, which reflects the crescents and squares nearby. It will link to a
strengthened Earl’s Court Road District Centre and the wider Earl’s Court and West
Kensington Opportunity Area. A new cultural offer on the site of the former
Exhibition Centre will draw on its legacy and will add to the activity and interest of
the area continuing to make Earl’s Court a lively cultural destination.”
Figure 8.1: Earl’s Court, Key Issues and Opportunities (Local Plan, 2019)
[Local Plan 2019, Page 77]

Royal Borough of Kensington and Chelsea Retail and Leisure Needs Assessment and Town Centre Study, November 2021
www.urbanshape.co.uk 61
8.3 The London Plan does not identify any future reclassification of Earls Court District Centre in the
town centre hierarchy, and records it as having low commercial growth potential with the
opportunity to provide some incremental housing intensification. The London Plan concludes it
should protect existing office functions, but does not have the capacity, demand or viability to
accommodate new office development. The District Centre is identified as falling within a Strategic
Area for Regeneration; i.e. where the impacts of inequality and causes of deprivation are
particularly concentrated. Policy SD10 states that Boroughs should identify Strategic Areas for
Regeneration in their Local Plans and develop policies that are based on a thorough understanding
of the demographics of communities and their needs.
8.4 Nearby, the former Earls Court Exhibition Site is, however, identified for development and
regeneration (Policy CA4). Within the borough, planning permission has been granted for a mixed-
use development which includes up to 930 residential units including affordable housing, up to
10,132 sq m Class B1, 3,414 sq m retail, 7,381 sq m hotel and 6,067 sq m of education, culture,
community and leisure floorspace. The Local Plan confirms that the planning permission has been
implemented. Policy CA4 emphasises the importance of improved linkages to surrounding and
neighbouring areas, including Earls Court District Centre.
8.5 The overarching aims for Earls Court District Centre and the Opportunity Area are set out in detail
in the Local Plan. These include the creation of a new urban quarter within the Earl’s Court and
West Kensington Opportunity Area providing jobs, homes and community facilities; and support for
the existing Earl’s Court Road District Centre, helping it to establish a new identity following the
closure of the Exhibition Centre. Policy aims to prioritise good connections between Earl’s Court
Road District Centre and the new urban quarter, whilst ensuring that the new centre within the
Opportunity Area serves the day-to-day needs of the development and is of a scale that does not
have an unacceptable impact on the vitality and viability of the existing centres in Kensington and
Chelsea.
8.6 Local Plan Site Allocations within the Earls Court area are set out in Table 4.1 below, and include
the Earls Court Exhibition Centre and a number of sites on Warwick Road for residential
development. Both site allocations should benefit the vitality and viability of Earls Court Road
District Centre in the future through new residential communities, business and office workers, and
visitors to the newly developed cultural and leisure facilities on the Earls Court Exhibition Centre
site.
Table 8.1: Earls Court Site Allocations
Site Allocation Land Uses
Policy CA4
Earls Court Exhibition Centre
(Figure 8.1 above)
Minimum 900 residential units including affordable housing, minimum 10,000 sq m Class B1 offices, retail, hotel, leisure, social and community floorspace, and a significant cultural facility.
Policy CA5
Warwick Road Sites
(Figure 8.1 above)
Physically separated from Earl’s Court by the Cromwell Road these sites lie on the western boundary of the borough bordering the London Borough of Hammersmith and Fulham, adjacent to the West London line.
Allocated for residential and associated community, leisure and amenity facilities. A minimum of 1,219 new residential units.
Source: Local Plan, 2019

Royal Borough of Kensington and Chelsea Retail and Leisure Needs Assessment and Town Centre Study, November 2021
www.urbanshape.co.uk 62
Diversity of Uses / Retailer Representation
8.7 Based on the latest survey by Experian Goad (March 2021), Earls Court Road District Centre
comprises 13,590 sq m of retail, leisure and service floorspace across 125 units. Table 8.2 and 8.3
below set out the diversity of uses in Earls Court Road District Centre compared to the national
average in respect of town centre composition. The data demonstrates that the district centre has
a particularly strong representation of leisure service operators.
Table 8.2: Earls Court Road District Centre Composition of Uses (Units) - 2021
No. of units % of Total UK Average (%) Variance
Convenience 17 13.6 9.2 4.4
Comparison 12 9.6 29.6 -20.0
Leisure Service 52 41.6 24.4 17.2
Retail Service 23 18.4 15.0 3.4
Financial & Business Service
14 11.2 9.9 1.3
Vacant 7 5.6 11.7 -6.1
Total 125 100 100 -
Source: Experian Goad, March 2021
Table 8.3: Earls Court Road District Centre Composition of Uses (Floorspace sq m gross) - 2021
Floorspace % of Total UK Average (%) Variance
Convenience 2,470 18.2 9.2 9.0
Comparison 1,960 14.4 29.6 -15.2
Leisure Service 5,520 40.6 24.4 16.2
Retail Service 1,320 9.7 15.0 -5.3
Financial and Business Service
1,640 12.1 9.9 2.2
Vacant 680 5.0 11.7 -6.7
Total 13,590 100 100 -
Source: Experian Goad, March 2021
8.8 The proportion of convenience goods operators (13.6%) is above the national average,
representing 17 shop units in total. The district centre benefits from three strong anchors
distributed throughout the main high street including M&S Simply Food at the far south of the
centre; Co-op towards the middle just north of the underground station; and Sainsbury’s Local at
the far north of the centre. Sainsbury’s Local is the largest store, open from 7am-11pm and
offering fresh coffee, a bakery and cash machine outside. Both Co-op and M&S open from 7am-
10pm.
8.9 The remaining 14 units are occupied by two off licences, Holland & Barrett health food shop, and a
number of small ethnic mini-markets – a number of which are located on Kenway Road and
Hogarth Road just off the main high street. There are no independent butchers or fishmongers

Royal Borough of Kensington and Chelsea Retail and Leisure Needs Assessment and Town Centre Study, November 2021
www.urbanshape.co.uk 63
represented, but Greggs and Paul Bakers both occupy units in the district centre. The closest major
food superstores for those living in close proximity to Earls Court District Centre are Tesco, West
Cromwell Road and Sainsbury’s, Cromwell Road. The closest Waitrose stores are Kensington High
Street to the north, and Gloucester Road and Old Brompton Road to the east.
8.10 Earls Court Road has a limited comparison goods shopping offer – consistent with its district centre
role. Of the 125 shop units, just 12 are occupied by comparison retailers including a charity shop,
two chemists, a stationers, one computer equipment provider, one shoe shop, one ladies clothes
shop, a household/electrical variety shop, three mobile phone shops, and one health and beauty
product business. Multiple retailers include Boots the Chemist, Robert Dyas, Ryman, Connect, and
Vodafone. Boots, Ryman and Robert Dyas are spread throughout the main high street on the
western side – the same side as the underground station – providing good anchors spread out at
different locations.
8.11 Earls Court District Centre has a particularly strong provision of leisure service operators – 17.2%
above the national average; occupying 52 shop units. Restaurants comprise the greatest sector
with 22 operators including Zizzi, Franco Manca, Nandos; and a number of international cuisine
operators including American, Mediterranean, Italian, Japanese, Chinese, Indian, Thai, and French.
8.12 The district centre has just four cafes including Costa and Caffe Nero; one bar/wine bar (Jimmy’s
Grill); five public houses; the My Place nightclub and hotel; two further small hotels, one tanning
shop and one gym (Soho Gym). William Hill, Coral and BetFred betting shops are all represented;
and there are nine hot food take-aways including McDonalds, Burger King and KFC. Other take-
aways include sushi and noodle bars.
8.13 The proportion of financial and business service operators is broadly in line with the national
average, represented by 14 businesses. Despite national trends, there remain four banks in the
centre including Barclays, Lloyds, Metro and Bank of the Phillippine Islands, with other operators
including one employment agency, a pawnbroker, five estate agents, two bureau de change and a
financial services provider. Both Barclays and Lloyds bank are in the south of the centre, whilst
Metro Bank occupies a large anchor unit in the far north of the district centre, at the junction with
Cromwell Road.
8.14 There are 22 retail service operators in the district centre, including five dry cleaners/laundrettes,
sixteen health & beauty salons, and two travel agents. Of the sixteen health & beauty salons,
seven are hairdressers, six are beauty salons, and three are natural therapy operators. The nearest
Opticians and Post Office are outside the district centre, further south on Earls Court Road.
8.15 Earls Court District Centre currently has only 7 vacant units/5.6% of total, which is substantially
lower than the national average of 11.7%. The vacant units are scattered throughout the centre
and there are no identified concentrations, with the largest unit being the former Natwest Bank in
the south of the centre, adjacent to Barclays Bank which continues to operate. Smaller vacant
units elsewhere include two small units with the underground station façade, a unit between
Franca Manca and Coral - previously occupied by Carphone Warehouse, two small units in the
north of the centre, and one very small unit off pitch on Hogarth Place.
8.16 There are a number of additional uses that assist in underpinning the vitality and viability of Earls
Court District Centre. These include two health and well-being centres, two dental surgery’s, an
internet zone/access provider, a taxi hire company, and the Earls Court Underground Station. The

Royal Borough of Kensington and Chelsea Retail and Leisure Needs Assessment and Town Centre Study, November 2021
www.urbanshape.co.uk 64
analysis has identified that most of the key anchors, multiple retailers and the underground station
entrance are on the western side of Earls Court Road.
Diversity of Uses: Town Centre Change 2008-2021
8.17 Table 8.4 below, compares the town centre composition by number of units since 2008. It is
evident that over this 13-year period, the district centre has experienced a substantial increase in
the number of leisure operators at the expense of comparison goods and retail service businesses.
The number of convenience goods operators and vacant units have both fallen by two, whilst the
number of financial & business services has remained the same at fourteen.
8.18 Nevertheless, the centre remains at almost full occupancy, and the trend towards a stronger
leisure representation and a declining comparison goods sector is consistent with national trends.
Earls Court District Centre is not necessarily intended to provide a strong comparison goods offer
given it’s position in the town centre hierarchy and proximity to higher order town centres offering
these type of goods. Moving forwards, the centre should aim to retain a mix of uses to meet a
variety of everyday retail and service requirements. As noted earlier in this section, Earls Court
District Centre will benefit from new residential development on Warwick Road and the
development of the Earls Court Exhibition Centre site over the next 10-15 years.
Table 8.4: Earls Court Road District Centre Diversity of Uses by Number of Units 2008-2021
No.of Units 2008 % of Total 2008 No.of Units 2021 % of Total 2021
Convenience 19 14.6 17 13.6
Comparison 15 11.5 12 9.6
Leisure Service 42 32.3 52 41.6
Retail Service 31 23.8 23 18.4
Financial & Bus. 14 10.8 14 11.2
Vacant 9 6.9 7 5.6
Total 130 100 125 100
Convenience examples: bakers, butchers, supermarket, fishmongers, grocers, newsagent;
Comparison examples: clothing, footwear, chemist, charity, cycle shop, DIY/electrical, florist, mobile phone;
Leisure Service examples: café, bars, restaurants, hot food take-away, bars/wine bars;
Financial & Business examples: banks, building societies, estate agents, employment and careers;
Retail Service examples: dry cleaners, opticians, Post Office, health and beauty, hairdressers.
Accessibility
8.19 In terms of public transport accessibility levels, the centre is located in an area rated as having
“very good” accessibility (a score of 5). The main entrance to Earl’s Court underground station is
situated on Earl’s Court Road providing access to the District and Piccadilly lines. The underground
station provides direct access to the core retail frontage, and a second entrance provides access to
the west and the Exhibition Centre development site. The station will provide strong linkages
between the town centre and new development coming forwards to the west. West Brompton

Royal Borough of Kensington and Chelsea Retail and Leisure Needs Assessment and Town Centre Study, November 2021
www.urbanshape.co.uk 65
train and underground station is also within close proximity to the centre. There are also a number
of bus routes which pass along Earl’s Court Road, linking the centre with other parts of the Borough
as well as Central and West London.
Customer Views and Behaviour
8.20 The household telephone survey asked a series of qualitative attitudinal questions probing
respondents about their usage of the town centres, their likes and dislikes, and how they think
Earls Court Road District Centre could be improved in the future. A number of the questions are
multiple response, enabling the respondent to state more than one answer, and as a result some of
the percentage figures are greater than 100%. The key findings are summarised below:
vii. Earls Court Road District Centre performs the role of a local shopping centre, and consistent
with this role has a relatively high frequency of visit, with 62.4% visiting 3-4 times a week. A
further 6.3% visit once a week, and 12.5% every two weeks. A small number of people visit
less regularly, with 11.4% visiting once every two months, and 7.4% visiting twice a year. Later
questions confirm that the less frequent visits are predominantly driven by leisure uses and
medical services.
viii. The role as a local shopping centre is also reflected in identified dwell time, with shorter visits
compared to the larger major town centres. When asked, 62.4% stay less than 30 minutes,
and 13.3% between 30 and 60 minutes. A small number do, however, visit the centre for
longer; with 5.5% staying between 2-3 hours; 7.4% 3-4 hours; and 11.4% up to 6 hours. The
longer trips are likely driven by linked trips to food shops and hair and beauty, for example,
and/or visiting cafes and restaurants, or friends and family.
ix. The highest response when asked about the main purpose of their trip was food shopping
(75.7%), followed by leisure activities (11.4%), window shopping/day out (7.4%) and medical
services (5.5%). No-one asked uses any click and collect services, suggesting that there are few
or none available.
x. When asked ‘what else’ they would be doing in Earls Court District Centre there was a wide
variety of response which reflects well on the centres role, with 55.5% stating the ‘school run’;

Royal Borough of Kensington and Chelsea Retail and Leisure Needs Assessment and Town Centre Study, November 2021
www.urbanshape.co.uk 66
20.7% non-food shopping/other services; 11.4% pubs/bars; 11.4% cafes/restaurants; 5.5% hair
and beauty; and 5.5% food shopping.
xi. When asked what they liked about the centre, over half noted the good range of shops and
services; 7% stated that it was close to home; 7% said that it was familiar to them; and 7% said
that it was compact.
xii. Respondents were then asked what they disliked about the centre with 14% stating that it was
too noisy with too much traffic congestion; 11.4% stated that there was insufficient parking;
half of respondents noted the poor environment, threat of crime and homelessness/beggars.

Royal Borough of Kensington and Chelsea Retail and Leisure Needs Assessment and Town Centre Study, November 2021
www.urbanshape.co.uk 67
9. Fulham Road (West)
9.1 Fulham Road (West) is defined as a District Centre in the Local Plan and London Plan. It is located
in the south west of the borough, close to the boundary with the London Borough of Hammersmith
and Fulham. It is the smallest centre in the borough comprising 121 units, and is linear in layout
running east / west along Fulham Road (A308). In addition to general shopping and service
provision, the centre also contains the Chelsea and Westminster Hospital fronting on to Fulham
Road, and the Picturehouse Cinema (formerly Cineworld). On the southside of Fulham Road, the
retail frontage is considerably shorter, stopping at the hospital, and characterised instead by
residential uses through to Gunter Grove in the west.
9.2 The London Plan does not identify any future reclassification of Fulham Road (West) District Centre
in the town centre hierarchy, and records it as having low commercial growth potential with the
opportunity to provide some low level incremental housing intensification. The London Plan
concludes it should protect existing office functions, but does not have the capacity, demand or
viability to accommodate new office development. The Local Plan does not allocate any strategic
development sites in the district centre, and the London Plan does not identify the centre as falling
within a Strategic Area for Regeneration.
Diversity of Uses / Retailer Representation
9.3 Based on the latest survey by Experian Goad (March 2021), Fulham Road (West) comprises 18,420
sq m gross of retail, leisure and service floorspace across 121 units. Table 9.1 and 9.2 below set out
the diversity of uses in Fulham Road (West) District Centre compared to the national average in
respect of town centre composition. The data demonstrates that the district centre has a
particularly strong representation of convenience and leisure service operators, which includes
small foodstores and newsagents, cafes, restaurants and bars.
9.4 The proportion of convenience goods operators (13.2%) is above the national average of 9.2%,
representing 16 units in total. This is a strong vitality indicator for a district centre. The centre has
four key anchors, including M&S Simply Food and Sainsbury’s Local in the east, Tesco Express
opposite the Chelsea and Westminster Hospital, and another Sainsbury’s Local to the west of the
centre. M&S is open from 8am-10pm and offers a click and collect service, and the adjoining

Royal Borough of Kensington and Chelsea Retail and Leisure Needs Assessment and Town Centre Study, November 2021
www.urbanshape.co.uk 68
Sainsbury’s is open from 7am to midnight. The Tesco Express store is open 24 hours and has an
external cash machine available; and the Sainsbury’s Local to the west of the district centre is open
from 7am-11pm.
Table 9.1: Fulham Road (West) District Centre Composition of Uses (Units) - 2021
No. of units % of Total UK Average (%) Variance
Convenience 16 13.2 9.2 4.0
Comparison 27 22.3 29.6 -7.3
Leisure Service 41 33.9 24.4 9.5
Retail Service 16 13.2 15.0 -1.8
Financial & Business Service
9 7.4 9.9 -2.5
Vacant 12 9.9 11.7 -1.8
Total 121 100 100 -
Table 9.2: Fulham Road (West) District Centre Composition of Uses (Floorspace sq m gross) - 2021
Floorspace % of Total UK Average (%) Variance
Convenience 3,020 16.4 9.2 7.2
Comparison 4,050 22.0 29.6 -7.6
Leisure Service 7,540 40.9 24.4 16.5
Retail Service 1,400 7.6 15.0 -7.4
Financial and Business Service
860 4.7 9.9 -5.2
Vacant 1,550 8.4 11.7 -3.3
Total 18,420 100 100 -
9.5 The remaining 12 convenience goods units provide a good quality product range, including Oree,
Gail’s and Le Pain Quotidien bakers, Wyndhams butchers, two good quality deli’s, a general grocer,

Royal Borough of Kensington and Chelsea Retail and Leisure Needs Assessment and Town Centre Study, November 2021
www.urbanshape.co.uk 69
health food shop and two off licenses. The quality of business and contribution to the high street
remains strong.
9.6 Consistent with a district centre role, Fulham Road (West) has a below average proportion of
comparison goods operators – 22.3% compared to a national average of 29.6%. The mix of
business does include a high proportion of specialist independent retailers selling a variety of high
end comparison goods, including a strong representation of interior decorations and clothing.
Boots the Chemist and Rymans Stationers are represented, alongside two fine art galleries, Chelsea
Wild Florist, Richer Sounds high end home entertainment, Le Creuset household goods, and a high
end bridal shop. Comparison operators are predominantly located on Fulham Road and Park Walk.
9.7 Fulham Road (West) has a particularly high proportion of leisure services, occupying a third of all
units in the district centre; 9.5% above the national average. There is a strong representation of
international restaurants – Italian, Japanese, Thai, French, Asian, American and Middle Eastern –
bars, cafes, juice bars and an ice cream parlour. Two good quality public houses are represented
(The King’s Arms and Chelsea Corner), Maggie’s Nightclub is located between Park Walk and Callow
Street, and coffee/sandwich shops Starbucks, Pret a Manger and Café Nero are all trading. The
majority of businesses are independent in the high end category.
9.8 The Fulham Road Picturehouse is located on the corner of Fulham Road and Drayton Gardens.
Offering a café and members bar and internal vintage theme, the 1930’s listed building was
refurbished for opening on 8th December 2019. The district centre also has 7 gyms/health clubs
and a solarium.
9.9 The proportion of retail services is marginally below the national average (-1.8%) offering 16
businesses; 75% of which are occupied by beauty salons and hairdressers. There are also two dry
cleaners, a Post Office and a Funeral Directors. Similarly, the proportion of financial and business
operators is marginally below the national average (-2.5%), comprised entirely of door and window
businesses and estate agents. There are no banks, building societies or employment services, with
shoppers relying on external cash points at Chelsea and Westminster Hospital and Sainsbury’s Local
at the far west of the high street. Easy Hub occupies large premises on Fulham Road, just west of

Royal Borough of Kensington and Chelsea Retail and Leisure Needs Assessment and Town Centre Study, November 2021
www.urbanshape.co.uk 70
the Picturehouse; with premises offering co-working and flexible working space, a coffee shop and
financial services.
9.10 The vacancy rate on Fulham Road (West) is below the national average (-1.8%) with 12 vacant
units. These units are scattered throughout the centre and observed as being equally spaced from
east to west. Their reoccupation should be monitored in the context of the new Use Classes Order
and permitted development rights. All units are standard/small in size, and there are no
particularly large floorplates; the low vacancy rate is a positive vitality indicator for the district
centre.
9.11 ‘Other’ town centre uses include the Royal Mail Postal Sorting Office, the Women’s Wellness
Centre, two dentists, Our Lady of Dolours R C Church, Servite Roman Catholic Primary School and
Petra’s Place – a special needs and autism support centre for children.
Diversity of Uses: Town Centre Change 2008-2021
9.12 Table 9.3 below, compares the town centre composition by number of units since 2008. It is
evident that over this 13-year period, the district centre has experienced a substantial increase in
the number of leisure operators (+8) at the expense of comparison goods businesses (-11). The
number of convenience goods has remained static, whilst retail services and financial and business
services have experienced a very small fall in number. The number and proportion of vacant units
has risen slightly from 9 to 12 (+2.6%).
9.13 As observed in other centre across the borough, the centre remains at almost full occupancy, and
the trend towards a stronger leisure representation and a declining comparison goods sector is
consistent with national trends. Fulham Road (West) continues to provide a high end offer in both
the comparison and leisure sectors, with a number of ‘other’ town centre uses driving footfall,
diversity and vitality. The centre continues to offer a mix of uses consistent with a district centre
role, aside from the absence of banks and building societies.
Table 9.3: Fulham Road (West) District Centre Diversity of Uses by Number of Units 2008-2021
No.of Units 2008 % of Total 2008 No.of Units 2021 % of Total 2021
Convenience 16 12.9 16 13.2
Comparison 38 30.6 27 22.3
Leisure Service 33 26.6 41 33.9
Retail Service 18 14.5 16 13.2
Financial & Bus. 10 8.1 9 7.4
Vacant 9 7.3 12 9.9
Total 124 100 121 100
Convenience examples: bakers, butchers, supermarket, fishmongers, grocers, newsagent;
Comparison examples: clothing, footwear, chemist, charity, cycle shop, DIY/electrical, florist, mobile phone;
Leisure Service examples: café, bars, restaurants, hot food take-away, bars/wine bars;
Financial & Business examples: banks, building societies, estate agents, employment and careers;
Retail Service examples: dry cleaners, opticians, Post Office, health and beauty, hairdressers.

Royal Borough of Kensington and Chelsea Retail and Leisure Needs Assessment and Town Centre Study, November 2021
www.urbanshape.co.uk 71
Accessibility
9.14 In terms of public transport accessibility levels, most of the centre is located in an area rated as
having “good” accessibility (a score of 4). Along with Portobello Road and Westbourne Grove, the
centre is the least accessible of the main centres, and there is no underground station serving this
high street. However, Fulham Broadway, South Kensington, Earl’s Court, Gloucester Road and
Sloane Square underground stations are all located within walking distance from the centre to the
north, east and west, with direct access to the District, Circle and Piccadilly lines.
Customer Views and Behaviour
9.15 The household telephone survey asked a series of qualitative attitudinal questions probing
respondents about their usage of the town centres, their likes and dislikes, and how they think
Earls Court Road District Centre could be improved in the future. A number of the questions are
multiple response, enabling the respondent to state more than one answer, and as a result some of
the percentage figures are greater than 100%. The key findings are summarised below:
i. Fulham Road (West) is clearly performing the role of a local shopping centre, with 56.5%
visiting between once a week and every day; 12% visit every day. This suggests the centre is
offering a day-to-day product range and services required and/or used regularly. A further
36.8% visit regularly, between once a month and once every two weeks. The remaining 6.7%
visited less frequently, 3-4 times or once a year.
ii. The role as a local shopping centre is also reflected in dwell time, with shorter visits compared
to the larger and major town centres. When asked, 32% stay for up to 30 minutes, 17% stay
for between 30 minutes and 1 hour, 22% stay for 1-2 hours, and 8.5% stay for 2-3 hours. The
longer trips are likely to be driven by linked trips between the diverse range of uses including
shopping, health and beauty and eating/drinking, for example.
iii. When asked about the main purpose of their visit, the range of response reflects the strong
diversity of uses across the centre. The highest response was food shopping (42%), followed
by non-food shopping (13%), leisure activities (9%), a day out/window shopping (9%), work
(7%), to visit a medical service/hospital (6%), ‘other’ service providers (including estate and
travel agents) (5%), and cafes/restaurants (4%).
iv. The highest response when asked ‘what else’ they would be doing on Fulham Road, the highest
response was non-food shopping (25%) followed by leisure activities/cafes and restaurants
(20%), food shopping (16%), day out/window shopping (10.7%), to get petrol (9%), to meet
friends (9%), to visit a medical service/hospital (8%), to shop at the market (8%), to visit
bars/pubs (6%) and to visit hair/beauty salons (5%).
v. When asked what they liked about the centre, over a third stated that it was ‘close to home’;
9% said that it was ‘familiar’; 20% stated that it had a good range of independent shops; 17%
noted the market; 12% said the good range of ‘high street’ retailers; 10% said the good range
of non-food shops; whilst others stated that you can get everything you need (9%), good
cafes/restaurants (8%), good range of clothes shops (9%), good range of quality shops (8%),
close to work (6%), and that the centre is compact (6%).
vi. When asked what they disliked about the centre, 87% stated ‘nothing’. This is the highest
response of all the main centres in the borough, highlighting visitor/shopper satisfaction and

Royal Borough of Kensington and Chelsea Retail and Leisure Needs Assessment and Town Centre Study, November 2021
www.urbanshape.co.uk 72
loyalty to the district centre. Only 4% stated that it was too busy, 5% suggested that it needed
more shops, and 5% said that it need better quality cafes.

Royal Borough of Kensington and Chelsea Retail and Leisure Needs Assessment and Town Centre Study, November 2021
www.urbanshape.co.uk 73
10. King’s Road (West)
10.1 King’s Road (West) is defined as a District Centre in the Local Plan and London Plan. It is located in
the far south west of the borough, just north of the River Thames and the London Borough of
Wandsworth and less than 100 metres from the boundary of King’s Road (East) Major Centre. The
district centre is linear in layout running east / west along King’s Road (A3217) from the junction
with Limerston Street to the west, to the junction with Glebe Place/Manresa Road to the east. It is
bound by residential areas to the north, south, east and west.
10.2 The district centre has 131 shop units in total, and in addition to general shopping and service
provision, the centre also contains the new Everyman Cinema on the junction of Old Church Street
and King’s Road, and the well-known ‘Bluebird’ café/restaurant. Retail and service businesses
across the district centre are predominantly high end, luxury brands. The Local Plan identifies the
majority of King’s Road (West) shopping centre as being within a conservation area, and does not
allocate any strategic development sites in or adjoining the district centre.
10.3 The London Plan does not identify any future reclassification of King’s Road (West) District Centre
in the town centre hierarchy, and records it as having ‘medium’ commercial growth potential with
the opportunity to provide some incremental housing intensification – albeit no potential sites are
allocated. The London Plan concludes that the district centre should protect existing office
functions, generally within smaller units, but does not have the capacity, demand or viability to
accommodate new office development.
10.4 The London Plan identifies King’s Road (West) as falling within a Strategic Area for Regeneration,
i.e. where the impacts of inequality and causes of deprivation are particularly concentrated. Policy
SD10 states that Boroughs should identify Strategic Areas for Regeneration in their Local Plans and
develop policies that are based on a thorough understanding of the demographics of communities
and their needs.
Diversity of Uses / Retailer Representation
10.5 Based on the latest survey by Experian Goad (March 2021), King’s Road (West) District Centre
comprises 17,940 sq m gross of retail, leisure and service floorspace across 131 units. Table 10.1
Bluebird Café/Restaurant

Royal Borough of Kensington and Chelsea Retail and Leisure Needs Assessment and Town Centre Study, November 2021
www.urbanshape.co.uk 74
and 10.2 below set out the diversity of uses in King’s Road (West) compared to the national
average in respect of town centre composition. In contrast to national trends and unlike most
other centres in the borough, the data demonstrates that the district centre has a particularly
strong representation of comparison goods retailers, and a below average representation of all
other categories.
Table 10.1: King’s Road (West) District Centre Composition of Uses (Units) - 2021
No. of units % of Total UK Average (%) Variance
Convenience 6 4.6 9.2 -4.6
Comparison 57 43.5 29.6 13.9
Leisure Service 30 22.9 24.4 -1.5
Retail Service 18 13.7 15.0 -1.3
Financial & Business Service
7 5.3 9.9 -4.6
Vacant 13 9.9 11.7 -1.8
Total 131 100 100 -
Table 10.2: King’s Road (West) District Centre Composition of Uses (Floorspace sq m gross) - 2021
Floorspace % of Total UK Average (%) Variance
Convenience 540 3.0 9.2 -6.2
Comparison 7,740 43.1 29.6 13.5
Leisure Service 4,970 27.7 24.4 3.3
Retail Service 1,930 10.8 15.0 -4.2
Financial and Business Service
990 5.5 9.9 -4.4
Vacant 1,770 9.9 11.7 -1.8
Total 17,940 100 100 -
10.6 The proportion of convenience goods operators (4.6%) is below the national average of 9.2%,
representing just 6 units in total. There is one small Londis convenience store at the far eastern
end of the district centre, but no further multiple operators trading. The remaining five units are
occupied by high end, luxury bakers (2), confectioners (1), deli (1), and an off licence (1).
10.7 The proportion of comparison goods operators is 13.9% above the national average, comprising 57
businesses. Aside from the six charity shops, these predominantly comprise high end luxury brands
and goods, including art galleries, interior decorations, bridal shops, clothing, furniture, gifts,
electrical appliances, home entertainment and antiques. The district centre has two mainstream
multiple retailers including Rymans Stationers and Lloyds Chemist. There is also a bookshop,
nursery/baby goods, cycles and repairs, computer equipment and a pet shop. Comparison units
are spread evenly throughout the full extent of the district centre.
10.8 The proportion of leisure service operators is marginally below the national average, comprising 30
businesses. Again, these are quality high end operators anchored by the Bluebird Restaurant, a
renowned and long established British restaurant. Over half of the leisure services recorded are

Royal Borough of Kensington and Chelsea Retail and Leisure Needs Assessment and Town Centre Study, November 2021
www.urbanshape.co.uk 75
international cuisine restaurants, and there are also three juice bars, a social club, four
bar/restaurants, and three health clubs/gyms. The district centre also benefits from the newly
developed Everyman Cinema, a mixed-use residential development on the junction of King’s
Road/Old Church Street. The centre has very few cafes aside from within the deli’s and
confectioners.
10.9 The proportion of retail services is marginally below the national average, comprising 18 units.
These include two dry cleaners, a Post Office, two natural therapy centres, and a number of
hairdressers and beauty salons. The proportion of financial and business services is also below the
national average (-4.6%), but includes Barclays Bank, Mail Boxes business services, Kall Kwik
printing and photocopying, and two estate agents. The Post Office and bank is a good asset for a
district centre and local day-to-day requirements. This type of representation should be monitored
moving forwards.
10.10 There are 13 recorded vacant units in King’s Road (West) District Centre, albeit a number of these
are ‘under alteration’. A large unit opposite the newly opened Everyman Cinema has already be
reoccupied by the high end Wine Workshop and Kitchen restaurant, whilst the nearby Cadogan
Arms Public House is being refurbished to a high standard and is due to reopen shortly. Three
further vacant units formed part of the Everyman Cinema wider development site, and have now
been redeveloped for residential units alongside the cinema. Other vacant units have been
reoccupied by a Pet Groomers and a high end ladies fashion wear. The analysis concludes that the
vacancy rate is low, and turnover is swift with new businesses contributing strongly to the
character and diversity of the area.
10.11 Beyond the district centre boundary, the ‘town centre’ frontage continues uninterrupted, flowing
into a defined ‘Neighbourhood Shopping Centre’ to the west, and the King’s Road Major Centre to
the east. The nearby neighbourhood centre offers a range of ‘other’ town centre uses including
the Good Practice Health Centre, dentists, children’s nursery’s, dry cleaners, chemists, butchers. At
the far western end is the World’s End Garden Centre and a large Co-Op foodstore.
Diversity of Uses: Town Centre Change 2008-2021
10.12 Table 10.3 below compares the town centre composition by number of units and proportion as a
percentage between 2008 and 2021. It is evident that the proportion of convenience and

Royal Borough of Kensington and Chelsea Retail and Leisure Needs Assessment and Town Centre Study, November 2021
www.urbanshape.co.uk 76
comparison businesses has fallen marginally over this period, with the greatest difference in the
number and proportion of comparison goods operators (-10.8%), although this translates into the
loss of only six units. The leisure and retail service and financial and business categories have all
grown in presence across the district centre, and whilst the data suggests that vacancies have
increased, the analysis above confirms that the vacancy rate is actually very low, with vacant units
being reoccupied swiftly by quality operators. Overall, the diversity and mix over this period has
been relatively stable.
Table 10.3: King’s Road (West) District Centre Diversity of Uses by Number of Units 2008-2021
No.of Units 2008 % of Total 2008 No.of Units 2021 % of Total 2021
Convenience 6 5.2 6 4.6
Comparison 63 54.3 57 43.5
Leisure Service 24 20.7 30 22.9
Retail Service 9 7.8 18 13.7
Financial & Bus. 5 4.3 7 5.3
Vacant 9 7.8 13 9.9
Total 116 100 131 100
Convenience examples: bakers, butchers, supermarket, fishmongers, grocers, newsagent;
Comparison examples: clothing, footwear, chemist, charity, cycle shop, DIY/electrical, florist, mobile phone;
Leisure Service examples: café, bars, restaurants, hot food take-away, bars/wine bars;
Financial & Business examples: banks, building societies, estate agents, employment and careers;
Retail Service examples: dry cleaners, opticians, Post Office, health and beauty, hairdressers.
Accessibility
10.13 In terms of public transport accessibility levels, the centre is located in an area rated as having
“good” or “very good” accessibility (a score of 4 or 5). Sloane Square underground station is
located some distance away at the eastern end of King’s Road within King’s Road (East) Major
Centre. South Kensington station is also located within close proximity to the north of the centre.
These stations are on the Piccadilly, Circle and District lines.
Customer Views and Behaviour
10.14 The household telephone survey asked a series of qualitative attitudinal questions probing
respondents about their usage of the town centres, their likes and dislikes, and how they think
King’s Road (West) District Centre could be improved in the future. A number of the questions are
multiple response, enabling the respondent to state more than one answer, and as a result some of
the percentage figures are greater than 100%. The key findings are summarised below:
i. King’s Road (West) district centre is performing the role of a local shopping centre and also a
key attractor destination offering a specialist high end and luxury product range. This is
reflected in the frequency of visit recorded, with around half stating at least once a week or

Royal Borough of Kensington and Chelsea Retail and Leisure Needs Assessment and Town Centre Study, November 2021
www.urbanshape.co.uk 77
more frequently, and the other half visiting less often, i.e. every two weeks, every two months
or 3-4 times a year.
ii. Dwell time is strong, with 50.8% staying for between 30 minutes and 2 hours, and a further
30% staying between 2 and 4 hours. This demonstrates the strength of the comparison goods
offer combined with the linked trip opportunities of restaurants, bars and health and beauty.
iii. The highest response when asked about the main purpose of their trip was non-food shopping
(34%), followed by visiting cafes/restaurants (18%), day out/meeting friends and family (17%),
for food shopping (12%), for work (11%) and to visit the doctors/dentist (8%).
iv. When asked ‘what else’ they would be doing in King’s Road (West) District Centre the range of
response was relatively limited compared to some other centres, with 30% stating
cafes/restaurants, 26% non-food shopping, 16% food shopping, 9% bars/pubs, and 4%
hairdressers/beauty salons. Linked trips between comparison goods shopping and having
brunch/lunch/dinner in the restaurants appears to be the main role of the district centre.
v. When asked what they liked about the centre, 30% stated that it was ‘close to home’, 14%
liked the good range of non-food shops, the compact nature of the centre and the clean, well
maintained streets, 13% stated the good range of independent shops, and 9% stated the good
cafes and restaurants.
vi. When asked what they disliked about the centre, the most frequent response related to
parking, including insufficient provision, being too expensive, too much permit parking, and
the constant road works causing congestion.

Royal Borough of Kensington and Chelsea Retail and Leisure Needs Assessment and Town Centre Study, November 2021
www.urbanshape.co.uk 78
11. Brompton Cross
11.1 Brompton Cross – sometimes referred to as Fulham Road (East) – is defined as a District Centre in
the Local Plan and London Plan. It is located in the south east of the borough, north of King’s Road
(East) Major Centre and south of South Kensington District Centre. Is the seventh largest centre in
the borough comprising 175 units, and is focussed around a junction of roads which provides links
between South Kensington, Chelsea and Knightsbridge. The streets which come together at
Brompton Cross include Fulham Road (A308), Brompton Road, Walton Street, Draycott Avenue,
Sloane Avenue, Lucan Place and Pelham Street.
11.2 The district centre offers a range of high end quality international comparison clothing and
footwear retailers, and is anchored by operators including The Conran Shop, Bibendum restaurant
and Joseph clothing. The high end nature of the shopping and leisure offer attracts visitors from
wider London and beyond. Adjoining the district centre at the western end of Fulham Road is the
Royal Marsden Hospital.
11.3 The London Plan does not identify any future reclassification of Brompton Cross District Centre in
the town centre hierarchy, and records it as having medium commercial (Use Class E) and
residential growth potential, albeit no specific sites are allocated. The London Plan concludes there
is demand for existing office functions, generally within smaller units, but does not have the
capacity, demand or viability to accommodate new office development. The London Plan does not
identify the centre as falling within a Strategic Area for Regeneration; and the Local Plan does not
allocate any strategic development sites in or adjoining the district centre.
11.4 When setting the vision for the wider South Kensington area, Chapter 14 of the Local Plan ‘seeks to
maintain the function of Brompton Cross as a high quality specialist boutique retail centre with
international appeal’. Improvements to walking routes and signage between South Kensington
cultural core are highlighted as a key objective and priority for implementation.
Diversity of Uses / Retailer Representation
11.5 Based on the latest survey by Experian Goad (March 2021), Brompton Cross comprises 24,590 sq m
gross of retail, leisure and service floorspace across 175 units. Table 11.1 and 11.2 below set out
the diversity of uses in Brompton Cross District Centre compared to the national average in respect

Royal Borough of Kensington and Chelsea Retail and Leisure Needs Assessment and Town Centre Study, November 2021
www.urbanshape.co.uk 79
of town centre composition. The data demonstrates that the composition of the district centre is
entirely inconsistent with national averages, highlighting the specialist focus on high end niche
retailing concentrated within this area.
11.6 The proportion of convenience goods operators (2.3%) is substantially below the national average
(9.9%), comprising just 4 retailers. These include newsagents, deli’s and small convenience stores.
Brompton Cross is located with Zone 3 of the Household Telephone Survey, and the data confirms
that local residents are predominantly choosing nearby foodstores including M&S and Sainsbury’s
Local in Fulham Road (West) District Centre, Waitrose and M&S in King’s Road (East) Major Centre,
and the Sainsbury’s Local on Sloane Avenue.
11.7 Unlike trends across most UK town centres, the proportion of comparison goods operators (51%) is
substantially above the national average of 30%, comprising 89 units in total. This category is
focused predominantly in a small number of niche – high end – sectors including art galleries,
clothing, interior design and decorations, furniture/household textiles, kitchen furniture, lighting,
jewellery and health and beauty. The large number of art galleries and interior decoration
businesses are scattered throughout the full extent of the district centre on Sloane Avenue, Walton
Street and Fulham Road; whilst the clothing operators are concentrated near to the Brompton
Cross ‘junction’ of roads, including Brompton Road, Walton Road and Draycott Avenue.
Table 11.1: Brompton Cross District Centre Composition of Uses (Units) - 2021
No. of units % of Total UK Average (%) Variance
Convenience 4 2.3 9.2 -6.9
Comparison 89 50.9 29.6 21.3
Leisure Service 23 13.1 24.4 -11.3
Retail Service 17 9.7 15.0 -5.3
Financial & Business Service
9 5.1 9.9 -4.8
Vacant 33 18.9 11.7 7.2
Total 175 100 100 -
Table 11.2: Brompton Cross District Centre Composition of Uses (Floorspace sq m gross) - 2021
Floorspace % of Total UK Average (%) Variance
Convenience 800 3.2 9.2 -6.0
Comparison 13,470 54.0 29.6 24.4
Leisure Service 4,640 18.6 24.4 -5.8
Retail Service 1,590 6.4 15.0 -8.6
Financial and Business Service
760 3.0 9.9 -6.9
Vacant 3,690 14.8 11.7 3.1
Total 24,950 100 100 -

Royal Borough of Kensington and Chelsea Retail and Leisure Needs Assessment and Town Centre Study, November 2021
www.urbanshape.co.uk 80
11.8 The proportion of leisure services (13%) is below the national average (24%), comprising 23 units.
Consistent with the retail offer, these provide a good selection of high end venues and attractions
including bars, cafes, international cuisine restaurants, and three luxury health clubs. Retail
services are also below the national average, but do provide a good selection of dry cleaners,
beauty salons, hairdressers, travel agents, and car repairs. There are nine financial and business
services, including a solicitors, storage company, auctioneers and valuers, and a number of estate
agents. There are no high street banks represented.
11.9 Experian recorded 33 vacant units in March 2021, 18.9% of total units compared to a national
average of 11.7%. The up-to-date analysis demonstrated that there has been little change to this
figure in more recent months, although three of the larger vacant units have been re-occupied by
consistently high end brands. The large vacant unit at 91-99 Fulham Road, on the junction with
Lucan Place, has been occupied by ‘Antique Modern Mix’; the larger unit on Sloane
Avenue/Ixworth Place (No.74) has been occupied by DePadova Interior Design/Decoration; and the
adjoining unit – 74 Draycott Avenue – has been occupied by Fusalp high end clothing. Number 106
Draycott Avenue has recently been occupied by ‘Posh Pawn’, a pawn brokers.
Diversity of Uses: Town Centre Change 2008-2021
11.10 Table 11.3 below compares the town centre composition by number of units and proportion as a
percentage between 2008 and 2021. Consistent with most other centre across the borough – and
also with national trends across the UK – the number and proportion of comparison goods
operators has fallen since 2008. In other categories, convenience goods and financial
services/business have remained stable, leisure services have fallen marginally, but retail services
and vacant units have increased. The retail service category has predominantly seen a growth in
beauty salons and hairdressers.
Table 11.3: Brompton Cross District Centre Diversity of Uses by Number of Units 2008-2021
No.of Units 2008 % of Total 2008 No.of Units 2021 % of Total 2021
Convenience 4 2.4 4 2.3
Comparison 96 58.2 89 50.9
Leisure Service 26 15.8 23 13.1
Retail Service 6 3.6 17 9.7
Financial & Bus. 9 5.5 9 5.1
Vacant 24 14.5 33 18.9
Total 165 100 175 100
Convenience examples: bakers, butchers, supermarket, fishmongers, grocers, newsagent;
Comparison examples: clothing, footwear, chemist, charity, cycle shop, DIY/electrical, florist, mobile phone;
Leisure Service examples: café, bars, restaurants, hot food take-away, bars/wine bars;
Financial & Business examples: banks, building societies, estate agents, employment and careers;
Retail Service examples: dry cleaners, opticians, Post Office, health and beauty, hairdressers.

Royal Borough of Kensington and Chelsea Retail and Leisure Needs Assessment and Town Centre Study, November 2021
www.urbanshape.co.uk 81
Accessibility
11.11 In terms of public transport accessibility levels, the centre is located in an area rated as either “very
good” or “excellent” accessibility (a score of 5 or 6). Public transport accessibility to Fulham Road
(East) District Centre is good, although there are no bus stops or train/underground stations within
the core of the district centre. South Kensington is the nearest underground station and is located
approximately 250m to the west of the centre’s core frontage on Pelham Street; and Sloane Square
underground station is location c.650m to the east. The stations are on the Piccadilly, Circle and
District lines.
Customer Views and Behaviour
11.12 The household telephone survey asked a series of qualitative attitudinal questions probing
respondents about their usage of the town centres, their likes and dislikes, and how they think
each respective town centre could be improved in the future. The first question asks respondents
which of the 11 major town centres they use most often, with Brompton Cross being the only
centre not cited by any respondent. This suggests that infrequent visitors to the centre travel from
further afield across the UK and beyond, and it is not serving a local shopping function. Local
residents across the borough are choosing alternative town centres as their centre of preference,
whilst Brompton Cross is an infrequent high end destination choice.

Royal Borough of Kensington and Chelsea Retail and Leisure Needs Assessment and Town Centre Study, November 2021
www.urbanshape.co.uk 82
12. South Kensington
12.1 South Kensington is defined as a District Centre in the Local Plan and London Plan. It is located in
the centre of the borough and comprises 214 units, the main spine of which is located on Old
Brompton Road. A number of other streets also form part of the district centre including Bute
Street, Glendower Place, Harrington Road, Thurloe Street, Thurloe Place, Exhibition Road,
Cromwell Place, Pelham Street and South Kensington Arcade. The wider South Kensington area
forms the principal cultural focal point in the borough with thousands of people arriving every day
to visit the museums, and to work and study in the area.
12.2 The London Plan does not identify any future reclassification of South Kensington District Centre in
the town centre hierarchy, and records it as having ‘low’ commercial and ‘medium’ residential
growth potential. The London Plan concludes that the district centre should protect existing office
functions, generally within smaller units, but does not have the capacity, demand or viability to
accommodate new office development. The London Plan does not identify the centre as falling
within a Strategic Area for Regeneration, but does confirm a night-time economy classification of
NT1, i.e. having a strategic night-time function involving a broad mix of activity during the evening
and at night. South Kensington NT1 is recorded as being of international or national significance;
this is the strongest night-time economy of any town centre in the borough.
12.3 The Local Plan sets out the vision for the borough (Policy CV 1), aiming to enhance the reputation
of national and international destinations – Knightsbridge, Portobello Road, South Kensington, the
King’s Road, Kensington High Street – by supporting and encouraging retail and cultural activities in
particular. Policy CV 1 adds that, ‘in the borough as a whole our reputation as a national and
international destination will have been further enhanced. The borough will have avoided
becoming little more than a residential suburb, with a flourishing and rich variety of retail and
cultural activities adding so much to the quality of life of the residents. Exhibition Road in South
Kensington – leading north from the district centre – will be providing a first class experience to
visitors to the national institutions, and have set a new standard nationally of streetscape design’.
12.4 In recognition of its outstanding universal value as a visitor destination, the Council and the London
Plan have designated the museums complex as a Strategic Cultural Area; i.e. comprising
internationally important cultural institutions. The boundary is illustrated on the Kensington &
Chelsea proposals map and a vision for the area forms part of the South Kensington Place section
of the Local Plan (Chapter 14) (discussed below). Chapter 19 of the Local Plan states that the
Council recognises that any development within the Strategic Cultural Area must be of the highest
quality and reflect the historic and architectural interest of the area. Policy CF11 of the Local Plan
seeks to protect this attribute:
Policy CF11: The South Kensington Strategic Cultural Area: The Council will protect and
enhance arts and cultural uses in the South Kensington Strategic Cultural Area.
12.5 Chapter 14 of the Local Plan sets the vision for the wider South Kensington area:
“South Kensington will maintain two distinct identities: a cultural destination
and a residential neighbourhood of distinction. The South Kensington Strategic
Cultural Area will remain a world-class public cultural quarter – the home of
science, arts, education and inspiration, while the South Kensington District
Centre will continue to provide valued local facilities and services. Reconciling

Royal Borough of Kensington and Chelsea Retail and Leisure Needs Assessment and Town Centre Study, November 2021
www.urbanshape.co.uk 83
these two roles will be challenging but a balance will have been struck.” [Policy
CV14: Vision 2028]
12.6 Paragraph 14.2 of the Local Plan notes that South Kensington is home to three international
museums; the Victoria and Albert Museum, the Natural History Museum and the Science Museum,
education institutions such as Imperial College, and the Royal Colleges of Art and Music and
cultural institutions such as the Polish Club, Goethe Institute and Ismaili Centre. There is also a
diverse range of land uses in addition to the large scale of cultural and educational institutions,
including hotels, embassies and consulates.
12.7 Paragraph 14.2 adds that South Kensington District has many small shops and Bute Street Farmers’
Market that give it a village character much valued by local residents. However, over the last ten
years the area to the north of the station has become increasingly dominated by food and
beverage outlets predominantly catering for visitors. There is some concern that the diversity
needed to fulfil a district centre role for local people is being eroded. The Local Plan recognises
that there is a cluster of shops focusing on interior design, fashion and galleries in Brompton Road
and Brompton Cross that have synergies with the Victoria and Albert Museum.
12.8 An over-arching aim of the Local Plan (para.14.3) is to ensure that South Kensington District Centre
‘strikes the right balance’ between meeting the needs of both residents and visitors of the Cultural
Quarter. The policy priority is to ensure the day-to-day shopping needs of the local residents
continue to be met by the South Kensington District Centre, by protecting and increasing the retail
offer as part of the South Kensington Station improvements and in Thurloe Street, and preventing
the amalgamation of units into larger units where possible.
12.9 The Local Plan allocates one Strategic Site opportunity (CA8) on the edge of South Kensington
District Centre (Figure 8.1 below). Previous uses have been demolished and the site has remained
undeveloped and has been used as a temporary car park for a number of years. The Local Plan
confirms that the Council is keen to see this prime South Kensington site redeveloped to provide
much needed housing in the borough. Policy CA8 seeks to deliver a residential-led development
with a minimum of 50 residential dwellings and some ground floor commercial uses.
Figure 12.1: South Kensington

Royal Borough of Kensington and Chelsea Retail and Leisure Needs Assessment and Town Centre Study, November 2021
www.urbanshape.co.uk 84
Diversity of Uses / Retailer Representation
12.10 Based on the latest survey by Experian Goad (March 2021), South Kensington comprises 25,840 sq
m gross of retail, leisure and service floorspace across 214 units. Table 12.1 and 12.2 below set out
the diversity of uses in Notting Hill Gate District Centre compared to the national average in
respect of town centre composition. The data demonstrates that district centre has a particularly
strong representation of leisure services and to a lesser extent convenience goods operators, but a
below average representation of comparison goods and retail services. The data highlights that the
proportion of vacant units is below the national average.
Table 12.1: South Kensington District Centre Composition of Uses (Units) - 2021
No. of units % of Total UK Average (%) Variance
Convenience 28 13.1 9.2 3.9
Comparison 28 13.1 29.6 -16.5
Leisure Service 89 41.6 24.4 17.2
Retail Service 29 13.6 15.0 -1.4
Financial & Business Service
22 10.3 9.9 0.4
Vacant 18 8.4 11.7 -3.3
Total 214 100 100 -
Table 12.2: South Kensington District Centre Composition of Uses (Floorspace sq m gross) - 2021
Floorspace % of Total UK Average (%) Variance
Convenience 2,470 9.6 9.2 0.4
Comparison 2,920 11.3 29.6 -18.3
Leisure Service 12,210 47.3 24.4 22.9
Retail Service 2,130 8.2 15.0 -6.8
Financial and Business Service
3,430 13.3 9.9 3.4
Vacant 2,680 10.4 11.7 -1.3
Total 25,840 100 100 -
12.11 The proportion of convenience goods operators (13.1%) is above the national average of 9.2%,
representing 28 units in total. The main foodstores include Little Waitrose to the west of Old
Brompton Road, and Tesco Express further east on Old Brompton Road. The telephone survey
analysis demonstrates that these foodstores perform very localised top-up shopping roles. There is
a strong range of ‘other’ convenience stores comprised predominantly of
bakers/confectioners/delicatessens; a number of which have café seating. There is one fishmonger
and one butcher, two health food shops, two off licences, and a newsagents. The deli’s and
confectioners and generally located towards to the east of the district centre, closer to the
underground station and visitor footfall.

Royal Borough of Kensington and Chelsea Retail and Leisure Needs Assessment and Town Centre Study, November 2021
www.urbanshape.co.uk 85
12.12 South Kensington has a limited range and proportion of comparison goods, significantly below the
national average, albeit the mix of product is relatively good and the quality high end. These
include art galleries, picture framing, book shops, chemists, DIY products, interior decoration and
home entertainment, florists, cards and gifts, jewellers, bridal wear, musical instruments, Rymans
the Stationer and household textiles. There are also a number of car sale garages in and around
the district centre including HR Owen Lamborghini, Sports Classics and Peter Bradfield.
12.13 The proportion of leisure services is particularly strong (41.6%) and above the national average of
24.4%, comprising 89 businesses in total. Again, these are scattered throughout the full extent of
the district centre, and dominated by restaurants (39) offering a high quality choice of international
cuisine. Other uses include cafes (14), fast food take-aways (12), bars/wine bars (5) and public
houses (3). The fast food take-aways are generally good quality, including sandwich shops, pizzas
and fresh bakes, and Five Guys Burgers are represented.
12.14 Also in the leisure services category, Experian record seven hotels in the district centre, more than
any of the other major centres in the borough. These include Hilton, Kensington Hotel, Number
Sixteen, The Ampersand and The Pelham Hotel – all adding footfall and vibrancy to the district
centre. This reflects its role as a regional, national and international destination for visitors and
tourists as a gateway to South Kensington and the wider sub-regional cultural area. Other leisure
services include three health clubs offering different classes and a solarium.
12.15 The proportion of retail service operators (13.6%) is broadly in line with the national average of
15.0%, offering a good range of services for the local community and visitors. These include dry
cleaners, laundrettes, petrol filling station, hairdressers, beauty salons, natural therapy centres,
opticians, wedding services, photographic film developing, clothing alterations and a travel agent.
Financial and business services are also in line with the national average, largely comprising estate
agents, but also including Mail Boxes and Citibox business services and two printing and
photocopying businesses. Four major banks are represented including Lloyds, Natwest, Barclays
and RBS – all on or close to the junction of Old Brompton Road and Cromwell Place.
12.16 There are 18 vacant units in South Kensington district centre, comfortably below the national
average. A number do, however, occupy prominent locations, detracting from the street scene and
vitality of the area. Only small signs of reoccupation were noted, with a gin bar opening on Old

Royal Borough of Kensington and Chelsea Retail and Leisure Needs Assessment and Town Centre Study, November 2021
www.urbanshape.co.uk 86
Brompton Road, and Cocotte – a brunch/lunch/dinner venue – opening on Harrington Road. A
number of vacant units have been unoccupied for lengthy periods of time, perhaps a consequence
of the Covid-19 Pandemic of the last 18 month or so. Vacancies should be monitored carefully
moving forwards.
Diversity of Uses: Town Centre Change 2008-2021
12.17 Table 12.3 below compares the town centre composition by number of units and proportion as a
percentage between 2008 and 2021. There has been a significant fall in the number and
proportion of comparison goods business, replaced predominantly by leisure service operators
which has seen an increase from 56 businesses to 89 in total. There has also been a strong
increase in convenience goods operators – predominantly bakers and confectioners – and a small
increase in retail services.
12.18 The balance is much in favour of leisure services, but the product range in other categories
continues to serve a local community seeking high end goods. The mix and balance should be
monitored moving forwards to ensure continued vitality and viability for the local community as
well as visitors to the area.
Table 12.3: South Kensington District Centre Diversity of Uses by Number of Units 2008-2021
No.of Units 2008 % of Total 2008 No.of Units 2021 % of Total 2021
Convenience 19 10.6 28 13.1
Comparison 40 22.3 28 13.1
Leisure Service 56 31.3 89 41.6
Retail Service 25 14.0 29 13.6
Financial & Bus. 21 11.7 22 10.3
Vacant 18 10.1 18 8.4
Total 178 100 214 100
Convenience examples: bakers, butchers, supermarket, fishmongers, grocers, newsagent;
Comparison examples: clothing, footwear, chemist, charity, cycle shop, DIY/electrical, florist, mobile phone;
Leisure Service examples: café, bars, restaurants, hot food take-away, bars/wine bars;
Financial & Business examples: banks, building societies, estate agents, employment and careers;
Retail Service examples: dry cleaners, opticians, Post Office, health and beauty, hairdressers.
Accessibility
12.19 The centre is located in an area rated as having ‘excellent’ accessibility (PTAL 6). The South
Kensington underground station is located in the east of district centre, with entrances on Thurloe
Street and Pelham Street, providing immediate connectivity with the shopping and leisure offer.
The station is on the Piccadilly, Circle and District lines.
Royal Borough of Kensington and Chelsea Retail and Leisure Needs Assessment and Town Centre Study, November 2021
www.urbanshape.co.uk 87
Customer Views and Behaviour
12.20 The household telephone survey asked a series of qualitative attitudinal questions probing
respondents about their usage of the town centres, their likes and dislikes, and how they think
Notting Hill District Centre could be improved in the future. A number of the questions are
multiple response, enabling the respondent to state more than one answer, and as a result some of
the percentage figures are greater than 100%. The key findings are summarised below:
i. The role of South Kensington as a district centre is evident when respondents were asked
about frequency of visit with just over 50% visiting at least once a week or more often. The
centre’s role as a destination of culture, cafes and restaurants is also reflected in those that
visit less frequently; i.e. 14% visit monthly, 10% visit every two months; and 9% visit twice a
year. The less frequent visits will also be driven by the hairdressers, beauty salons and small
number of high end comparison goods operators.
ii. The limited range of comparison goods retailers and consequent opportunity for ‘linked trips’
with ‘shopping’ is reflected in the shorter dwell times compared to some other larger centres
in the borough. Visitors to the centre will pop just to the café, hairdressers, or other service
without also ‘browsing’ in the shops. Almost 70% only stay for up to an hour, whilst 12.5% stay
for 1-3 hours, and 11% stay for 3-4 hours.
iii. The highest response when asked about the main purpose of their trip was for a day out/walk
about (40%), followed by non-food shopping (19%), food shopping (10%), to visit the museums
and art galleries (8%), other leisure activities (5%), and to meet friends (3%).
iv. When asked ‘what else’ they would be doing in South Kensington the highest response was to
visit cafes/restaurants (30%), followed by non-food shopping (28%), food shopping (18%), and
to meet friends and family(16%). There was little mention of retail services such as
hairdressers or beauty salons. The majority of visits were primarily there for a day out/walk
about combined with coffee or lunch in one of the cafes or restaurants.
v. When asked what they liked about the centre there were a number of responses including
being ‘close to home’ (17%), having an attractive environment (15%), that it is vibrant and
diverse (13%), good range of bakers/butchers/greengrocers (13%), close to friends/relatives
(13%), good cafes/restaurants (12%) and a good range of other retail services such as
hairdressers (8%).
vi. Respondents were then asked what the disliked about the centre, with the majority of
responses relating to noise, congestion, insufficient parking, and the need for better and more
affordable shops.

Royal Borough of Kensington and Chelsea Retail and Leisure Needs Assessment and Town Centre Study, November 2021
www.urbanshape.co.uk 88
13. Notting Hill Gate
13.1 Notting Hill Gate is defined as a District Centre in the Local Plan and London Plan. It is located in
the northern half of the borough – north of Kensington High Street and south of Portobello Road.
The centre is the fifth largest in the borough, comprising 251 units located predominantly on
Notting Hill Gate and Kensington Church Street, and also acts as the gateway to Portobello Road
market to the north. The district centre has excellent levels of accessibility being located on the
central, district and circle line, with underground access points on either side of Notting Hill Gate
(A402). The Notting Hill Gate SPD (2015) notes that over 17 million people arrive or leave at
Notting Hill Gate station each year, compared to 12 million at Kensington High Street.
13.2 The Local Plan notes that the town centre was comprehensively redeveloped in the 1950’s and is of
a completely different scale and character to the surrounding residential areas; with many of the
buildings now dated and deteriorating. The centre suffers from traffic dominance and congestion
at the expense of a pleasant pedestrian environment. Paragraph 11.2 of the Local Plan highlights
that the centre has a longstanding reputation for arts and culture, offering a number of important
venues including the Gate Theatre, the Gate Cinema and the Coronet Cinema and Theatre. The
Local Plan confirms that the centre is surrounded by Conservation Areas and is an important
district centre serving local retail needs.
13.3 Policy CV 11 of the Local Plan sets out the vision for Notting Hill in 2028:
Notting Hill Gate will have strengthened its distinct identity as one of the Borough’s main district
centres benefitting from a high level of public transport accessibility. It will continue to be a major
office location and build upon its long-standing reputation for arts, culture and the evening
economy as well as serving the needs of local people. As one of the arrival points for Portobello
Road the public realm (e.g. paving, crossings, wayfinding) will have been improved to accommodate
the high volumes of footfall in Pembridge Road / Kensington Park Road and to make Notting Hill
Gate more pedestrian friendly. Opportunities set out in the Notting Hill Gate Supplementary
Planning Document will have been taken to refurbish or redevelop outdated 50s buildings.
13.4 The SPD highlights that many people pass through the centre going to and from work and visiting
Portobello Road, making it more of a thoroughfare than a vibrant place to stop and spend time.
The busy roads and high traffic levels are seen as a deterrent to shopping and lingering, for
residents and visitors alike. This is exacerbated by the dominance and condition of the 1950’s
buildings. The SPD notes that the nature of the shops reflects Notting Hill Gate’s function as a
transport hub and a centre serving the day-to-day needs of local people. The document adds that
Notting Hill is constrained by other retail centres nearby including Portobello Road, Westbourne
Grove, Kensington High Street, Westfield Shopping Centre and Holland Park Avenue.
13.5 As well as improvements to the public realm, the pedestrian and cycle environment and pedestrian
circulation, the following seven key development sites have been identified in the SPD (See Figure
13.1 below):
i. Newcombe House Sites
ii. Astley House
iii. The Gate Cinema Block
iv. West Block
v. Ivy Lodge to United House
vi. 66-74 Notting Hill Gate (Book
Warehouse)
vii. David Game House and Hobson
House

Royal Borough of Kensington and Chelsea Retail and Leisure Needs Assessment and Town Centre Study, November 2021
www.urbanshape.co.uk 89
Figure 13.1: Notting Hill Gate SPD Development Opportunity Sites
13.6 The seven development sites comprise large sections of frontage on Notting Hill Gate, the main
high road through the district centre, highlighting substantial opportunity for redevelopment and
refurbishment to enhance the visual appearance and pedestrian experience when visiting. Table
13.1 below provides an update of each of the seven sites.
Figure 13.1: Notting Hill Gate SPD Development Opportunity Sites
Site Planning Reference Comment
Newcombe House Sites Planning permission granted 25 June
2020, subject to S.106 / PP/17/05782
Not yet implemented
Astley House - -
The Gate Cinema Block Planning permission and listed building
consent refused 13th October 2017
West Block - -
Ivy Lodge to United House Planning permission granted 23rd
December 2016 subject to S.106.
Implemented.
PP/16/05299
Reclad and refurbishment of
United House complete, with
addition of two floors. No
change to Ivy Lodge and
Campden Hill Towers.
66-74 Notting Hill Gate
(Book Warehouse)
Planning permission granted 15th
January 2016. Implemented
PP/15/05730
Scheme currently under
construction.
David Game House and
Hobson House
Planning permission granted 6th
January 2017 subject to S.106.
Implemented.
PP/16/05236 and PP/17/07174
Refurbishment of block
completed.

Royal Borough of Kensington and Chelsea Retail and Leisure Needs Assessment and Town Centre Study, November 2021
www.urbanshape.co.uk 90
13.7 The London Plan identifies a greater opportunity for development in Notting Hill Gate than other
district centres in the borough. Whilst it does not identify any future reclassification of Notting Hill
Gate in the town centre hierarchy, it records it as having medium – rather than low - commercial
and residential growth potential. Also, whilst all other district centres in the borough are
encouraged to protect existing office support, the London Plan identifies Notting Hill Gate as
having mixed-use office potential; i.e. having the capacity, demand and viability to accommodate
new office development, generally as part of mixed-use developments including residential use.
This is reflected in the number of development sites identified and allocated for
refurbishment/redevelopment.
Diversity of Uses / Retailer Representation
13.8 Based on the latest survey by Experian Goad (March 2021), Notting Hill Gate comprises 28,900 sq
m gross of retail, leisure and service floorspace across 251 units. Table 13.2 and 13.3 below set out
the diversity of uses in Notting Hill Gate District Centre compared to the national average in
respect of town centre composition. The data demonstrates that the composition of the district
centre is broadly in line with national average, aside from a lower level of retail services. The data
suggests that the number of vacant units is high compared national average levels; this is discussed
further below. Overall, the retail, leisure and service offer is generally more mainstream and
functional when compared to many of the high end and luxury branded major centres elsewhere in
the borough.
Table 13.2: Notting Hill Gate District Centre Composition of Uses (Units) - 2021
No. of units % of Total UK Average (%) Variance
Convenience 20 8.0 9.2 -1.2
Comparison 79 31.5 29.6 1.9
Leisure Service 64 25.5 24.4 1.1
Retail Service 20 8.0 15.0 -7.0
Financial & Business Service
25 10.0 9.9 0.1
Vacant 43 17.1 11.7 5.4
Total 251 100 100 -
Table 13.3: Notting Hill Gate District Centre Composition of Uses (Floorspace sq m gross) - 2021
Floorspace % of Total UK Average (%) Variance
Convenience 2,590 9.0 9.2 -0.2
Comparison 7,400 25.6 29.6 -4.0
Leisure Service 8,930 30.9 24.4 6.5
Retail Service 1,830 6.3 15.0 -8.7
Financial and Business Service
3,170 11.0 9.9 1.1
Vacant 4,980 17.2 11.7 5.5
Total 28,900 100 100 -

Royal Borough of Kensington and Chelsea Retail and Leisure Needs Assessment and Town Centre Study, November 2021
www.urbanshape.co.uk 91
13.9 The proportion of convenience goods operators (8%) is marginally below the national average of
9.2%, representing 20 units in total. The district centre has three small national multiple retailers
including Tesco Metro, Little Waitrose and M&S Simply Food – all located to the west of Pembridge
Road in close proximity to each other. There is no ‘anchor’ foodstore to the east of the district
centre, nor on Pembridge Road or Kensington Church Street. The Tesco Metro is open for trading
the longest, through to mid-night on most days, whilst Little Waitrose and M&S trade to 10pm and
9pm respectively. Smaller and independent units are occupied by bakers, confectioners,
convenience stores and newsagents, tobacconists, and off licences.
13.10 Notting Hill Gate has a good proportion of comparison goods businesses, being marginally above
the national average (+1.9%). A closer and more in-depth analysis highlights a number of
interesting niche sectors, including 25 antique shops and art galleries, predominantly on
Kensington Church Street. Other sectors with a number of businesses include chemists, charity
shops, gifts, jewellers, ladies and menswear, second hand goods on Pembridge Road, and florists.
National multiple retailers include Rymans Stationers, Boots the Chemist, and Waterstones
bookshop, and there are a selection of mobile phone shops operating throughout the district
centre.
13.11 Notting Hill Gate has a good representation of leisure services, marginally above the national
average and comprising 64 units in total. The largest leisure category is restaurants, offering a
wide selection of international cuisine across 26 units; followed by cafes (14), and public houses
(8). There is a large selection of independent operators, and multiple retailers including Starbucks,
Café Nero and Pret a Manger. The district centre offers two ice cream parlours, one juice bar and
three bar/restaurants. There are two betting shops, and both McDonalds and KFC are represented,
but the number of take-away units is relatively low. The district centre also has one solarium and
two health clubs/gyms.
13.12 The Coronet Theatre is a Grade II listed building on the
junction of Notting Hill Gate and Hillgate Street. The venue
presents a programme of theatre, dance, music, poetry and
visual arts in a 195-seat main auditorium and 90-seat studio
space. The venue adds a vibrant and dynamic cultural
attraction to Notting Hill, and has just undergone a major
refurbishment of the roof and upper rooms.
13.13 The Gate Cinema is located close to the Coronet Theatre,
fronting Notting Hill Gate. The listed building first opened its
doors as a cinema in 1911, and during the Second World
War, the ornate exterior was severely damaged and
subsequently replaced with a plain façade and a flat
roof. The single-screen cinema became a Picturehouse in
2003, and in 2004 the building underwent renovation,
restoring the ornate Edwardian plasterwork in the
auditorium alongside general interior improvements.
13.14 The number and proportion of retail services in the district centre (6.3%) is below the national
average (15%), but the range and mix of offer is good. The centre has a selection of hairdressers,
beauty salons and natural therapy businesses, as well as a Post Office, photographic printing shop

Royal Borough of Kensington and Chelsea Retail and Leisure Needs Assessment and Town Centre Study, November 2021
www.urbanshape.co.uk 92
(Snappy Snaps), three dry cleaners and an opticians. The proportion of financial and business
services is in line with the national average offering 25 businesses, 13 of which are estate agents.
There are also four major banks represented including Natwest, Lloyds, HSBC and Barclays; two
bureau de change; and a number of businesses including photocopying/printing, tool and machine
hire, an accountant, and Mail Box business services.
13.15 Other uses driving footfall in the district centre include dentists on Pembridge Road and Notting
Hill Gate, a veterinary surgery on Kensington Church Street, the Embassy of the Czech Republic at
the eastern end of Notting Hill Gate, the Bethesda Baptist Church on Kensington Place just off
Kensington Church Street, and a number of large office buildings including United House, Ivy Lodge,
Campden Towers, and Newcombe House, for example. As set out earlier, most of these office sites
are allocated for redevelopment but will in many cases re-provide office space through new
planning permissions.
13.16 The Saturday Farmers Market is a popular attraction and addition to the diversity of the district
centre – particularly for local residents. Located on the car park behind Waterstones on
Kensington Church Street, the market opens at 9am and offers a broad range of good quality food
products from local farms, highlighting ‘in season’ fruit and vegetables, and also flowers, herbs,
milk and cream, and honey for example.
13.17 The data suggests that Notting Hill Gate has a high vacancy rate (17.1%) compared to the national
average (11.7%), comprising 43 units in total. The up-to-date on-site survey and analysis of the
centre demonstrates, however, that many of these have now been reoccupied, are under
alteration, or form part of current redevelopment sites and site allocations coming forwards for
redevelopment. On Kensington Church Street, previous vacant units have been re-occupied by an
artisan art shop, ‘Caviar Artisan Fine Foods’, and ‘The Fish Shop’ has opened in the large former
public house on the corner with Kensington Place. The vacancy rate on Kensington Church Street is
very low.
13.18 At the eastern and western end of Notting Hill Gate a small number of vacant units remain
unoccupied, but the main concentration is within Site No.6 (SPD) – the Book Warehouse site –
containing four vacant units. These are currently being redeveloped and will be re-let as new
modern spaces within the core of the district centre. The largest two units that remains vacant on
Notting Hill Gate include the vacant bank at the junction with Pembridge Gardens, adjacent to
Foxtons Estate Agents, and the vacant former restaurant immediately adjoining the Book
Warehouse site redevelopment.
13.19 Pembridge Road is performing well with no vacant units on the southern section closest to Notting
Hill Gate. Two former vacant units have recently been re-occupied by a café/restaurant and a
second hand clothing / jewellers. Up-to-date analysis demonstrates that vacancy rates on the main
shopping frontages – Notting Hill Gate, Kensington Church Street, Pembridge Road – are low, but
that there remain a few vacant units on the peripheral side streets that experience lower footfall;
these include Campden Hill Road, Hillgate Street, Kensington Mal and Palace Gardens Terrace.
Diversity of Uses: Town Centre Change 2008-2021
13.20 Table 13.4 below compares the town centre composition by number of units and proportion as a
percentage between 2008 and 2021. Whilst the proportion of convenience goods and retail
services has remained relatively static, the fall in the number and proportion of comparison goods

Royal Borough of Kensington and Chelsea Retail and Leisure Needs Assessment and Town Centre Study, November 2021
www.urbanshape.co.uk 93
and financial and business sectors has been significant. This is consistent with wider national town
centre trends over recent years.
13.21 The drop in those categories has been compensated to some extent by an increase in leisure
services, but in many cases the loss of businesses has led to vacant unoccupied premises, at one
point identifying 43 vacant units. The most up-to-date analysis above has demonstrated that
Notting Hill District Centre has bounced back to some extent, with vacancies having now fallen
again with the introduction of new and good quality businesses. Nevertheless, there remain
around 33 vacant units across the centre, compared to 19 in 2008.
Table 13.4: Notting Hill Gate District Centre Diversity of Uses by Number of Units 2008-2021
No.of Units 2008 % of Total 2008 No.of Units 2021 % of Total 2021
Convenience 21 8.0 20 8.0
Comparison 105 40.2 79 31.5
Leisure Service 58 22.2 64 25.5
Retail Service 23 8.8 20 8.0
Financial & Bus. 35 13.4 25 10.0
Vacant 19 7.3 43 17.1
Total 261 100 251 100
Convenience examples: bakers, butchers, supermarket, fishmongers, grocers, newsagent;
Comparison examples: clothing, footwear, chemist, charity, cycle shop, DIY/electrical, florist, mobile phone;
Leisure Service examples: café, bars, restaurants, hot food take-away, bars/wine bars;
Financial & Business examples: banks, building societies, estate agents, employment and careers;
Retail Service examples: dry cleaners, opticians, Post Office, health and beauty, hairdressers.
Accessibility
13.22 In terms of public transport accessibility levels, the centre is located in an area rated as having
“excellent” accessibility (a score of 6). Notting Hill Gate underground station is located centrally
within the centre and provides circle, district and central line services.
Customer Views and Behaviour
13.23 The household telephone survey asked a series of qualitative attitudinal questions probing
respondents about their usage of the town centres, their likes and dislikes, and how they think
Notting Hill District Centre could be improved in the future. A number of the questions are
multiple response, enabling the respondent to state more than one answer, and as a result some of
the percentage figures are greater than 100%. The key findings are summarised below:
i. When asked about frequency of visit, it is evident that Notting Hill Gate performs a local
shopping role for day-to-day requirements, alongside a more specialist role driving more
occasional and less frequent visits. This is likely a consequence of the interesting niche
sectors identified and discussed earlier in this section. High frequency of visit includes 43.8%

Royal Borough of Kensington and Chelsea Retail and Leisure Needs Assessment and Town Centre Study, November 2021
www.urbanshape.co.uk 94
of respondents who visit between once a week and every-day, whilst less frequent visits
include ‘every two week’ (24.2%), ‘monthly’ (12.5%), ‘once every two months’ (12.8%), and
3-4 times a year (3.9%).
ii. The highest responses for main purpose of visit included food shopping (42%), non-food
shopping (16%), day out / window shopping (16%), cafes/restaurants (15%), to visit the
market (4%), and other leisure activities (3%).
iii. When asked ‘what else’ they would be doing in Notting Hill District Centre, the highest
responses included non-food shopping (38%), cafes/restaurants (23%), food shopping (11%),
to meet friends (7%), bars/pubs (6%), the market (5%), the cinema (4%), to access public
transport (3%), and to visit a medical service/dentist (3%).
iv. When asked what they liked about the centre, 29% stated that it was ‘close to home’. Other
responses included the environment/nice place (19%), that it was vibrant/diverse (13%), the
good range of non-food shops (10%), the good range of supermarkets (9%), that the centre
is compact (8%), and the good leisure facilities – including the cinema (4%).
v. Dislikes focused on noise and parking, with 18% stating that it was too busy and noisy, and
13% adding that there is insufficient parking available. Others disliked the poorly maintained
and dirty streets (8%) and empty shops (2.4%), whilst others stated there was a need for
better / affordable shops (2.4%).
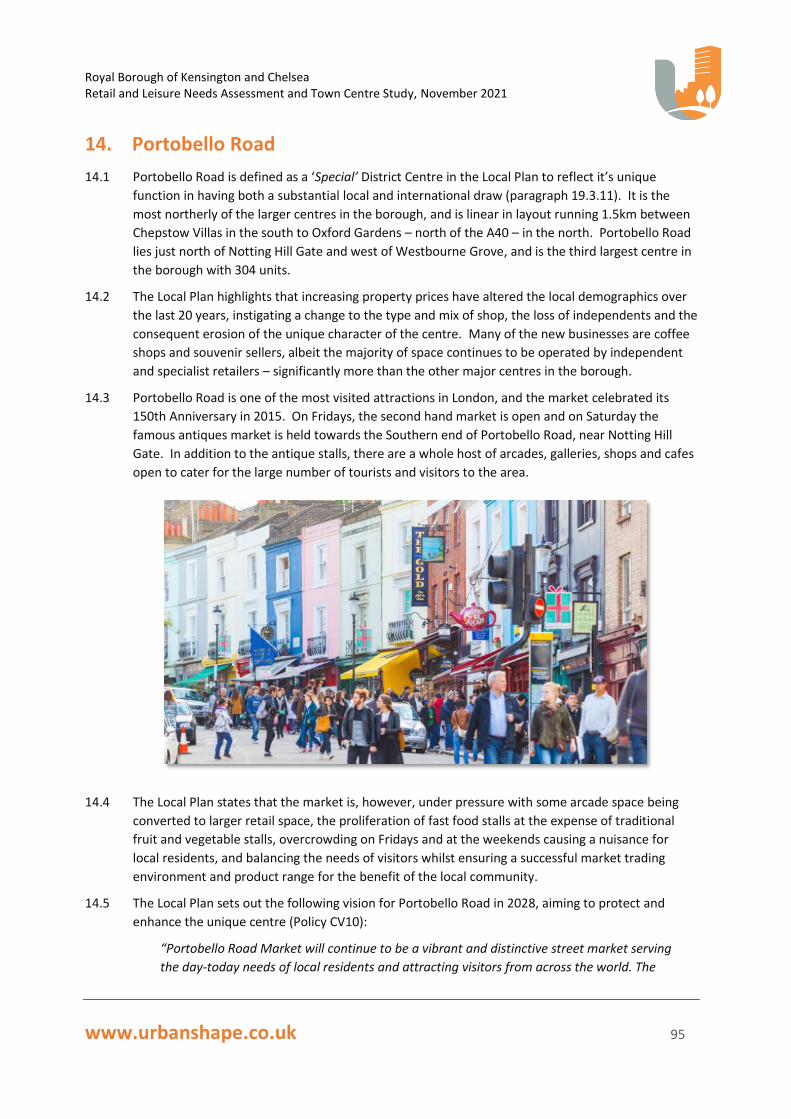
Royal Borough of Kensington and Chelsea Retail and Leisure Needs Assessment and Town Centre Study, November 2021
www.urbanshape.co.uk 95
14. Portobello Road
14.1 Portobello Road is defined as a ‘Special’ District Centre in the Local Plan to reflect it’s unique
function in having both a substantial local and international draw (paragraph 19.3.11). It is the
most northerly of the larger centres in the borough, and is linear in layout running 1.5km between
Chepstow Villas in the south to Oxford Gardens – north of the A40 – in the north. Portobello Road
lies just north of Notting Hill Gate and west of Westbourne Grove, and is the third largest centre in
the borough with 304 units.
14.2 The Local Plan highlights that increasing property prices have altered the local demographics over
the last 20 years, instigating a change to the type and mix of shop, the loss of independents and the
consequent erosion of the unique character of the centre. Many of the new businesses are coffee
shops and souvenir sellers, albeit the majority of space continues to be operated by independent
and specialist retailers – significantly more than the other major centres in the borough.
14.3 Portobello Road is one of the most visited attractions in London, and the market celebrated its
150th Anniversary in 2015. On Fridays, the second hand market is open and on Saturday the
famous antiques market is held towards the Southern end of Portobello Road, near Notting Hill
Gate. In addition to the antique stalls, there are a whole host of arcades, galleries, shops and cafes
open to cater for the large number of tourists and visitors to the area.
14.4 The Local Plan states that the market is, however, under pressure with some arcade space being
converted to larger retail space, the proliferation of fast food stalls at the expense of traditional
fruit and vegetable stalls, overcrowding on Fridays and at the weekends causing a nuisance for
local residents, and balancing the needs of visitors whilst ensuring a successful market trading
environment and product range for the benefit of the local community.
14.5 The Local Plan sets out the following vision for Portobello Road in 2028, aiming to protect and
enhance the unique centre (Policy CV10):
“Portobello Road Market will continue to be a vibrant and distinctive street market serving
the day-today needs of local residents and attracting visitors from across the world. The

Royal Borough of Kensington and Chelsea Retail and Leisure Needs Assessment and Town Centre Study, November 2021
www.urbanshape.co.uk 96
market will remain the UK’s principal wholesale antiques trade centre for the storage and
sale of antiques, an inspiration for designers and a seed-bed for new entrepreneurs. The
centre will maintain a rich variety of small independent shops offering ‘something
different’. The link between Portobello and Golborne markets will have been strengthened
and links between Ladbroke Grove and Portobello Market will also be improved. Kensal
Portobello Elizabeth Line station will provide a valuable new transport link to the area.”
14.6 The wider vision for the borough (Policy CV 1) aims to enhance the reputation of national and
international destinations – Knightsbridge, Portobello Road, South Kensington, the King’s Road,
Kensington High Street, – by supporting and encouraging retail and cultural activities in particular.
The vision adds that the unique character of Golborne and Portobello Road will have flourished,
including the antiques and street market, adding to the vitality of the area.
14.7 Just north of Golborne, the Wornington Green Estate (Site Allocation CA2) is being redeveloped to
“meet modern housing standards and providing new private housing alongside replacement of the
existing social rented housing”. This development will restore the northern connection between
Portobello Road and Ladbroke Grove (Figure 10.1, below).
Figure 10.1: Portobello Road, Golborne Road and Site Allocation CA2

Royal Borough of Kensington and Chelsea Retail and Leisure Needs Assessment and Town Centre Study, November 2021
www.urbanshape.co.uk 97
14.8 The London Plan does not identify any future reclassification of Portobello Road Special District
Centre in the town centre hierarchy, and records it as having ‘medium’ commercial growth
potential with the opportunity to provide some incremental housing intensification. The London
Plan concludes that the district centre should protect existing office functions, generally within
smaller units, but does not have the capacity, demand or viability to accommodate new office
development.
14.9 The London Plan identifies Portobello Road as falling within a wider Strategic Area for
Regeneration, i.e. where the impacts of inequality and causes of deprivation are particularly
concentrated. Policy SD10 states that Boroughs should identify Strategic Areas for Regeneration in
their Local Plans and develop policies that are based on a thorough understanding of the
demographics of communities and their needs.
Diversity of Uses / Retailer Representation
14.10 Table 14.1 and 14.2 below set out the diversity of uses in Portobello Road compared to the
national average in respect of town centre composition. In contrast to national trends and unlike
most other centres in the borough, the data demonstrates that the district centre has a particularly
strong representation of convenience and comparison goods retailers, and a below average
representation of all other categories. The analysis set out below demonstrates that Portobello
Road has retained it’s ‘special’ district centre allocation, meeting local needs whilst also performing
as a destination attraction from across London and beyond.
Table 14.1: Portobello Road Special District Centre Composition of Uses (Units) - 2021
No. of units % of Total UK Average (%) Variance
Convenience 39 12.8 9.2 3.6
Comparison 138 45.4 29.6 15.8
Leisure Service 57 18.8 24.4 -5.7
Retail Service 26 8.6 15.0 -6.4
Financial & Business Service
10 3.3 9.9 -6.6
Vacant 34 11.2 11.7 -0.5
Total 304 100 100 -
Table 14.2: Portobello Road Special District Centre Composition of Uses (Floorspace sq m gross) - 2021
Floorspace % of Total UK Average (%) Variance
Convenience 4,690 15.8 9.2 6.6
Comparison 12,360 41.6 29.6 12.0
Leisure Service 6,440 21.7 24.4 -2.7
Retail Service 1,760 5.9 15.0 -9.1
Financial and Business Service
1,360 4.6 9.9 -5.3
Vacant 3,070 10.3 11.7 -1.4
Total 29,680 100 100 -

Royal Borough of Kensington and Chelsea Retail and Leisure Needs Assessment and Town Centre Study, November 2021
www.urbanshape.co.uk 98
14.11 The proportion of convenience goods operators (12.8%) is above the national average of 9.2%,
comprising 39 retailers. The main foodstore operators include Sainsbury’s Local and Tesco Metro,
located on the central/north part of Portobello Road, and both open from 7am-11pm. There is also
a strong range of good quality independent convenience goods businesses, reflecting the ‘foodie’
role of Portobello Road linked to the market. Operators include a number of bakers, butchers,
fishmongers, deli’s, confectioners, tobacconists, off licences, tea and coffee merchants, health food
shops and newsagents. The mix of convenience retailing is strong, vibrant and diverse.
14.12 Similarly, the proportion of comparison goods operators (45.4%) is substantially above the national
average (29.6%), contrary to wider national trends. The mix and composition remains very much
consistent with the allocated role of Portobello Road as a Special District Centre, with a product
range serving the local community and also those across London and tourists beyond. There are
138 comparison goods businesses in total.
14.13 There are a large number of antique shops and art galleries, predominantly concentrated in the
southern part of the district centre. Businesses also include a large number of book shops,
jewellers, flooring, gift shops, interior decoration, furniture, hardware and household goods, and
clothing. Clothing retailers offer a mix of children’s, ladies and menswear largely offering vintage
and boutique styles, rather than the luxury high end brands seen in other centres such as
Westbourne Grove. National multiple operators are limited for a centre of this size, but includes
Kurt Geiger Shoes, Holland and Barrett health food, Whittard of Chelsea and Poundland. The focus
of the special district centre remains the independent businesses.
14.14 The proportion of leisure services is below the national average, but the 57 businesses do offer a
good mix and quality of operator. These include international cuisine restaurants, cafes, coffee
shops, juice bars, bar/restaurants, three public houses and an ice cream parlour. Starbucks and
Five Guy fast food are represented, but almost all businesses are independents. There is only one
health club/gym; the Westway Portobello Fitness Club in the north of the centre offers a gym,
exercise classes, squash courts and sauna/steam rooms.
14.15 The Electric Cinema is a longstanding institution on Portobello Road, located in the centre of the
district centre. It first opened in 1911, and today has been refurbished to a high standard offering
mainstream and art house films, bar and restaurant. The cinema is a well-known and important
destination attractor in the district centre. The proportion of retail services is also below the
national average, but like leisure services, the range of businesses is good, supporting the needs of
the local community. These include dry cleaners, beauty salons, hairdressers, tattooists, opticians,
natural therapy, and photographic film developing. There are only 10 financial business services,
the overall proportion (3.3%) being significantly below the national average (9.9%). These include a
builders merchants, locksmith, bureau de change, and a selection of estate agents.
14.16 A number of other town centre uses add the vibrancy, diversity and footfall in Portobello Road
Special District Centre. The Colville Health Centre is located on Kensington Park Road, The
Salvation Army is located on Portobello Road opposite Sainsbury’s Local, and the Notting Hill
Community Church is on Kensington Park Road. The proportion of vacant units is marginally below
the national average, with 34 units scattered throughout the district centre. A number of these are
on the peripheral side streets including Westbourne Grove and Kensington Park Road, and around
half are distributed along Portobello Road.

Royal Borough of Kensington and Chelsea Retail and Leisure Needs Assessment and Town Centre Study, November 2021
www.urbanshape.co.uk 99
Diversity of Uses: Town Centre Change 2008-2021
14.17 Table 10.3 below compares the town centre composition by number of units and proportion as a
percentage between 2008 and 2021. The trendline data highlights a substantial fall in the number
and proportion of comparison goods operators, and whilst the proportion of leisure services and
financial/business has remained unchanged, the level of convenience goods and retail services has
risen. The largest rise is in the representation of convenience goods operators, and the analysis
above identifies a number of quality new independents across the centre. The proportion of
vacant units has more than doubled since 2008.
Table 10.3: Portobello Road Special District Centre Diversity of Uses by Number of Units 2008-2021
No.of Units 2008 % of Total 2008 No.of Units 2021 % of Total 2021
Convenience 20 6.9 39 12.8
Comparison 181 62.2 138 45.4
Leisure Service 54 18.6 57 18.8
Retail Service 12 4.1 26 8.6
Financial & Bus. 9 3.1 10 3.3
Vacant 15 5.2 34 11.2
Total 291 100 304 100
Convenience examples: bakers, butchers, supermarket, fishmongers, grocers, newsagent;
Comparison examples: clothing, footwear, chemist, charity, cycle shop, DIY/electrical, florist, mobile phone;
Leisure Service examples: café, bars, restaurants, hot food take-away, bars/wine bars;
Financial & Business examples: banks, building societies, estate agents, employment and careers;
Retail Service examples: dry cleaners, opticians, Post Office, health and beauty, hairdressers.
Accessibility
14.18 In terms of public transport accessibility levels, the centre is located in an area rated as having
“good” accessibility (a score of 4), which along with Westbourne Grove and Fulham Road West is
the lowest score achieved by the main centres in the Borough. However, the centre still has
relatively good accessibility by public transport. Ladbroke Grove underground station, on the
Hammersmith and City Line, and Notting Hill Gate underground station, on the Central, Circle and
District Lines, are both short walks from Portobello Road.
Customer Views and Behaviour
14.19 The household telephone survey asked a series of qualitative attitudinal questions probing
respondents about their usage of the town centres, their likes and dislikes, and how they think
Portobello Road Special District Centre could be improved in the future. A number of the questions
are multiple response, enabling the respondent to state more than one answer, and as a result
some of the percentage figures are greater than 100%. The key findings are summarised below:

Royal Borough of Kensington and Chelsea Retail and Leisure Needs Assessment and Town Centre Study, November 2021
www.urbanshape.co.uk 100
i. The national and international role of the market, food orientated retailing and Portobello
Road’s identity as a special district centre is reflected in frequency of visit, with 25% visiting
infrequently between every 2 months and once a year. Portobello Road is clearly continuing
to perform a role wider than a local day-to-day shopping destination. Others visit monthly
(15%), every two weeks (13%), and at least once a week or more frequently (44%) by those
living locally and using the centre most days for the shopping and service requirements.
ii. Dwell time is relatively low compared to other centres in the borough, with 51% staying up
to 1 hour, whilst a further 26% stay for between 1 and 2 hours. Only 13% stay in the district
centre for 2-3 hours, and 7% stay for longer.
iii. The highest response when asked about the main purpose of their trip was ‘a day
out/browsing’ (30%), followed by food shopping (29%), non-food shopping (13%), to shop at
the market (15%), and to visit cafes/restaurants (4%).
iv. When asked ‘what else’ they would be doing in Portobello Road the responses included non-
food shopping (26%), visiting cafes/restaurants (23%), food shopping (22%), day
out/browsing (7%), the markets (5%), and other leisure activities (4%).
v. When asked what they liked about the centre, a range of views were recorded including the
good market (25%), nice atmosphere/friendly (20%), good range of independent shops
(18%), vibrant/diverse (15%), close to home (15%), good range of non-food shops (12%),
attractive environment (8%), familiar/they know where everything is (5%), good range of
bakers/butchers/greengrocers (5%), and good cafes/restaurants (5%).
vi. Respondents were then asked what they disliked about the centre with 67% saying ‘nothing’
– a strong vitality indicator for the district centre. A small selection stated that it was too
busy/noisy (15%), traffic congestion/insufficient parking (6%), and the poor market (4%).
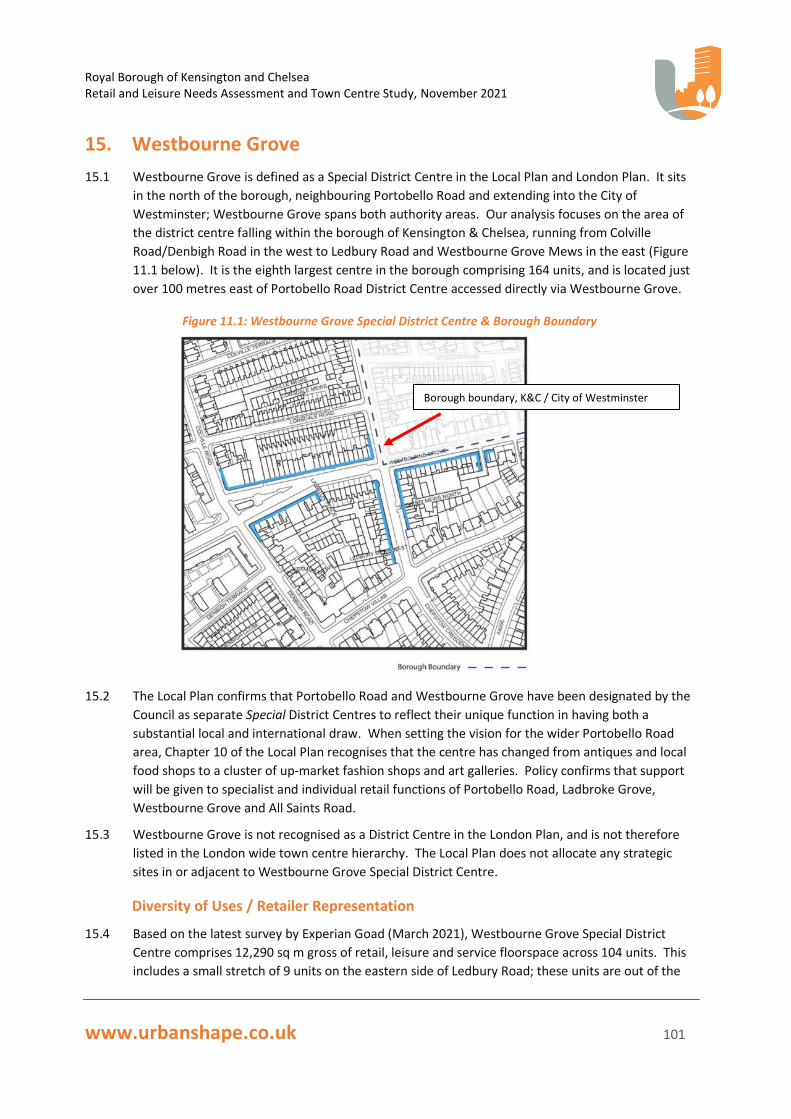
Royal Borough of Kensington and Chelsea Retail and Leisure Needs Assessment and Town Centre Study, November 2021
www.urbanshape.co.uk 101
15. Westbourne Grove
15.1 Westbourne Grove is defined as a Special District Centre in the Local Plan and London Plan. It sits
in the north of the borough, neighbouring Portobello Road and extending into the City of
Westminster; Westbourne Grove spans both authority areas. Our analysis focuses on the area of
the district centre falling within the borough of Kensington & Chelsea, running from Colville
Road/Denbigh Road in the west to Ledbury Road and Westbourne Grove Mews in the east (Figure
11.1 below). It is the eighth largest centre in the borough comprising 164 units, and is located just
over 100 metres east of Portobello Road District Centre accessed directly via Westbourne Grove.
Figure 11.1: Westbourne Grove Special District Centre & Borough Boundary
15.2 The Local Plan confirms that Portobello Road and Westbourne Grove have been designated by the
Council as separate Special District Centres to reflect their unique function in having both a
substantial local and international draw. When setting the vision for the wider Portobello Road
area, Chapter 10 of the Local Plan recognises that the centre has changed from antiques and local
food shops to a cluster of up-market fashion shops and art galleries. Policy confirms that support
will be given to specialist and individual retail functions of Portobello Road, Ladbroke Grove,
Westbourne Grove and All Saints Road.
15.3 Westbourne Grove is not recognised as a District Centre in the London Plan, and is not therefore
listed in the London wide town centre hierarchy. The Local Plan does not allocate any strategic
sites in or adjacent to Westbourne Grove Special District Centre.
Diversity of Uses / Retailer Representation
15.4 Based on the latest survey by Experian Goad (March 2021), Westbourne Grove Special District
Centre comprises 12,290 sq m gross of retail, leisure and service floorspace across 104 units. This
includes a small stretch of 9 units on the eastern side of Ledbury Road; these units are out of the
Borough boundary, K&C / City of Westminster

Royal Borough of Kensington and Chelsea Retail and Leisure Needs Assessment and Town Centre Study, November 2021
www.urbanshape.co.uk 102
borough in the City of Westminster, but are included in the health check as they remain an integral
part of the centre.
15.5 Table 15.1 and 15.2 below set out the diversity of uses in Westbourne Grove compared to the
national average in respect of town centre composition. In contrast to national trends and unlike
most other centres in the borough, the data demonstrates that the district centre has a particularly
strong representation of comparison goods retailers, and a below average representation of all
other categories. The analysis set out below demonstrates that Westbourne Grove has retained
it’s ‘special’ district centre allocation, performing as a destination attraction from across London
and beyond.
Table 15.1: Westbourne Grove Special District Centre Composition of Uses (Units) - 2021
No. of units % of Total UK Average (%) Variance
Convenience 4 3.8 9.2 -5.4%
Comparison 66 63.5 29.6 33.9%
Leisure Service 13 12.5 24.4 -11.9%
Retail Service 7 6.7 15.0 -8.3%
Financial & Business Service
5 4.8 9.9 -5.1
Vacant 9 8.7 11.7 -3.0%
Total 104 100 100 -
Table 15.2: Westbourne Grove Special District Centre Composition of Uses (Floorspace sq m gross) - 2021
Floorspace % of Total UK Average (%) Variance
Convenience 750 6.1 9.2 -3.1%%
Comparison 6,330 51.5 29.6 21.9%
Leisure Service 2,220 18.1 24.4 -6.3%
Retail Service 770 6.3 15.0 -8.7%
Financial and Business Service
600 4.9 9.9 -5.0%
Vacant 1,620 13.2 11.7 1.5%
Total 12,290 100 100 -
15.6 The proportion of convenience goods operators (3.8%) is significantly below the national average
of 9.2%, comprising just 4 businesses. These include organic, high end deli’s, confectioners and
food shops. A greater range of smaller foodstores are available further afield, including Waitrose
Notting Hill and Waitrose Bayswater. The household telephone survey results show that residents
in Zone 1 – the zone in which Westbourne Grove is located – are using Portobello Road local shops
and the large Sainsbury’s superstore at Ladbroke Grove for their food shopping.
15.7 The proportion of comparison goods operators is substantially above the national average,
demonstrating why the centre has been allocated as a ‘special’ district centre. Comprising 66 units,
the comparison goods category offers a range of high quality international fashion retailers and

Royal Borough of Kensington and Chelsea Retail and Leisure Needs Assessment and Town Centre Study, November 2021
www.urbanshape.co.uk 103
international designer boutiques complemented by several jewellers and antique shops. Men’s,
ladies and children’s clothing shops are represented along Westbourne Grove and Ledbury Road,
creating a concentration of 45 operators in total. These include the more well known high end
multiple retailers Jigsaw, Joseph and Max Mara, but predominantly comprise high end and luxury
independent businesses.
15.8 As a consequence of the particularly high number of comparison goods operators, the proportion
of retail and leisure services, and financial and business services are all below the national average.
The thirteen leisure services include four coffee shops, juice bar, public house, restaurants and two
health clubs. Retail services (7) include high end luxury beauty salons, hairdressers and an
opticians; and business services is comprised entirely of estate agents. The district centre does not
have a bank, post office or dry cleaners, for example, but local day-to-day facilities are located
close-by at Portobello Road and Notting Hill Gate.
15.9 The vacancy rate has remained relatively unchanged since the Experian Goad survey in March
2021, with some operators closing down and other opening new operations. Those new
businesses have retained the character of the area, offering high end luxury brands and products to
reinforce the special nature of this district centre.
Diversity of Uses: Town Centre Change 2008-2021
15.10 Table 15.3 below compares the town centre composition by number of units and proportion as a
percentage between 2008 and 2021. The trendline data highlights that whilst the number and
proportion of comparison goods remains strong, it has declined since 2008 now making up just
63.5% of total units compared to 83% in 2008. The decline of comparison goods operators has
been replaced by a mix of convenience, leisure service, retail service and financial and business
operators. The vacancy rate has also increased, but remains below the national average.

Royal Borough of Kensington and Chelsea Retail and Leisure Needs Assessment and Town Centre Study, November 2021
www.urbanshape.co.uk 104
Table 15.3: Westbourne Grove Special District Centre Diversity of Uses by Number of Units 2008-2021
No.of Units 2008 % of Total 2008 No.of Units 2021 % of Total 2021
Convenience 2 2.1 4 3.8
Comparison 78 83.0 66 63.5
Leisure Service 7 7.4 13 12.5
Retail Service 2 2.1 7 6.7
Financial & Bus. 2 2.1 5 4.8
Vacant 3 3.2 9 8.7
Total 94 100 104 100
Convenience examples: bakers, butchers, supermarket, fishmongers, grocers, newsagent;
Comparison examples: clothing, footwear, chemist, charity, cycle shop, DIY/electrical, florist, mobile phone;
Leisure Service examples: café, bars, restaurants, hot food take-away, bars/wine bars;
Financial & Business examples: banks, building societies, estate agents, employment and careers;
Retail Service examples: dry cleaners, opticians, Post Office, health and beauty, hairdressers.
Accessibility
15.11 In terms of public transport accessibility levels, the centre is located in an area rated as having
“good” accessibility (a score of 4), which along with Portobello Road and Fulham Road West is the
lowest score achieved by the main centres in the Borough. However, Westbourne Grove Special
District Centre still has relatively good accessibility by public transport. Ladbroke Grove
underground station, on the Hammersmith and City Line, and Notting Hill Gate underground
station, on the Central, Circle and District Lines, are both short walks from Westbourne Grove and
provide London underground links to destinations across London.
Customer Views and Behaviour
15.12 The household telephone survey asked a series of qualitative attitudinal questions probing
respondents about their usage of the town centres, their likes and dislikes, and how they think
Westbourne Grove Special District Centre could be improved in the future. A number of the
questions are multiple response, enabling the respondent to state more than one answer, and as a
result some of the percentage figures are greater than 100%. The key findings are summarised
below:
i. When asked about frequency of visit, 61.7% stated that they visited the centre between
once a week (33.5%) and every day (7.6%). Others visited less frequently, every two weeks
(12.8%), monthly (12.2%), once every two months (5.2%), and 3-4 times a year (6.1%).
Whilst a lot of people are regular visitors, the special district centre is clearly driving more
occasional trips driven by the high quality concentration of niche luxury retailers.
ii. The majority of visitors spend up to an hour in the district centre (68.5% of respondents),
whilst a further 28.3% spend 1-3 hours. This broadly reflects frequency of visit, with those

Royal Borough of Kensington and Chelsea Retail and Leisure Needs Assessment and Town Centre Study, November 2021
www.urbanshape.co.uk 105
visiting regularly likely to spend less time on each visit, and those visiting less regularly likely
to stay longer browsing and having lunch/coffee, for example.
iii. The highest response when asked about the main purpose of their trip was non-food
shopping (65.5%), followed by having day out/browsing (17%, and visiting cafes/restaurants
(8.6%).
iv. When asked ‘what else’ they would be doing in Westbourne Grove special district centre,
the highest response was to visit the cafes/restaurants (42%), followed by non-food
shopping (25%), having a day out/browsing (10%), meeting family and friends (11%), and
visiting the gym/health centre (6%).
v. When asked what they liked about the centre, 36.4% stated that it was ‘close to home’.
Other responses included the good range of independent shops (20.6%), the good range of
non-food shops (15%), the cafes/restaurants (15%), the attractive and pleasant environment
(13%), a nice village feel (5%), the vibrancy and diversity (11%), and the good quality
convenience stores (10%).
vi. Respondents were then asked what they disliked about the centre with 66% stating
‘nothing’. There were few other responses, with one or two people commenting on the
environment and traffic congestion/noise. Overall, shoppers and visitors are very satisfied
with the town centre mix and environment.

Royal Borough of Kensington and Chelsea Retail and Leisure Needs Assessment and Town Centre Study, November 2021
www.urbanshape.co.uk 106
16. Quantitative Need Forecasts
16.1 In this section we set out our assessment of the need for additional convenience and comparison
goods retail floorspace across RBKC. We set out the performance of existing floorspace as the
basis for forecasting the need for additional retail floorspace to the period 2040, incorporating
interim years of 2026, 2031, 2036, 2041 and 2043. The quantitative tabulations accompanying this
assessment are set out in Appendix 1 (convenience) and 2 (comparison).
16.2 In identifying need, it is important to note that forecasts become increasingly open to margins of
error over time, and accordingly will need to be refreshed over the course of the Council’s Local
Plan. This is particularly the case given the current Covid-19 health pandemic and unknown longer
term consequences for the economy.
16.3 We have used a conventional and widely accepted step by step methodology, drawing upon the
results of the household telephone survey of existing shopping patterns (2021) to model the
existing flows of available expenditure to the network of centres and edge/out-of-centre retail
provision. To develop the baseline, we have:
▪ Calculated the total amount of convenience and comparison goods expenditure which is
available within the postcode areas comprising the RBKC study area;
▪ Allocated the available projected expenditure to the convenience and comparison goods
shopping destinations, on the basis of the household telephone survey of shopping patterns so
as to provide estimates on current sales and forecasts of future sales;
▪ Compared the total expenditure attracted to each shopping destination with current retail
floorspace to assess sales densities/performance in each shopping destination.
16.4 Building on the baseline position, we have explored the need for further convenience and
comparison retail floorspace within each local authority, having regard to the identified
performance of existing floorspace and growth in residual expenditure.
Data Inputs
Survey Area and Household Telephone Survey
16.5 As introduced earlier in this study, a new household telephone interview survey was undertaken
covering 1,000 households across 10 survey zones (Figure 16.1 below). Urban Shape designed the
survey questionnaire in consultation with the Council and NEMS Market Research, who undertook
the interviewing and data processing in February 2021. The survey area is shown below.
16.6 The survey results (2021) identify shopping habits of households for both convenience and
comparison goods. Where necessary, survey results have been rebased to remove some responses
(such as ‘don’t shop for particular goods’ and ‘internet shopping’) to ensure consistency with
categories excluded in the expenditure projections.
16.7 For convenience goods, the household telephone survey included questions on main food and top-
up food shopping. The results of the two types of food expenditure were then merged through the
application of a weight which reflects the estimated proportion of expenditure accounted for by
each goods type (70% main food / 30% top-up food). This forms a composite pattern of

Royal Borough of Kensington and Chelsea Retail and Leisure Needs Assessment and Town Centre Study, November 2021
www.urbanshape.co.uk 107
convenience spending, expressed as a market share for each destination centre or foodstore for
each survey zone.
Figure 16.1: RBKC Household Telephone Survey Area, 2021
16.8 The household telephone survey also included seven questions on where respondents normally
undertake shopping for the following comparison goods types, which coincide with Experian
Business Strategies definitions of comparison goods expenditure:
▪ Clothing and footwear;
▪ Furniture, floor coverings and household textiles;
▪ DIY and decorating goods;
▪ Domestic appliances;
▪ Audio-visual equipment;
▪ Personal and medical goods; and
▪ Recreational and luxury goods.
16.9 In order to determine the composite market share for all comparison goods spending within the
survey area, we apply the weighted averages of the household telephone survey results for each
goods type based on the proportion of per capita spend on that goods type. This process
establishes the pattern of comparison spending for residents in each of the survey zones and is an
accepted approach which ensures that market shares for centres and stores are not skewed by any
particular goods category.
Royal Borough of Kensington and Chelsea Retail and Leisure Needs Assessment and Town Centre Study, November 2021
www.urbanshape.co.uk 108
Population
16.10 Population estimates and forecasts for each of the survey zones are derived using the Experian E-
Marketer in-house system. This provides estimates of population based on trend-line projections
and the 2011 census for small, localised areas. Overall, the population of the survey area in 2021 is
estimated to be 804,711, growing to 821,195 in 2026, 833,476 in 2031, 847,196 in 2036, 860,197 in
2041, and 865,397 in 2043.
16.11 Population growth across the full Zone 1-10 Survey Area represents an overall increase of 7.5%
over the course of the assessment period. Population growth within Zones 1-3, which broadly
reflects the borough boundary, is considerably more conservative at 2.1% over the same period.
Available Expenditure in the Survey Area
16.12 The Experian E-Marketer system provides estimates of per capita expenditure for convenience and
comparison goods expenditure in 2019 prices. We have made deductions for Special Forms of
Trading (SFT) which represent expenditure not available to spend in shops (for example internet or
catalogue shopping). The deductions we have applied for SFT for convenience and comparison
goods are derived from Experian Retail Planner Briefing Note 18 (October 2020).
16.13 As section 3 of this report set out, online shopping (SFT) is accounting for an increasingly significant
share of total available expenditure, particularly in respect of comparison goods shopping, and
Experian forecast that the ‘claim’ which online shopping makes on total available comparison and
convenience goods spend will increase considerably in future years. Retail capacity forecasts are
only concerned with identifying the need for new physical ‘bricks and mortar’ retail floorspace, and
it is necessary to deduct spending via Special Forms of Trading (SFT) from baseline expenditure
forecasts (Table 3, Appendix 2 and 3).
16.14 To estimate available expenditure in the survey area, we have applied growth rates based on
economic forecasts published by Experian Business Strategies, ensuring due consideration to the
consequences of Covid-19 (Retail Planner 18, October 2020).
16.15 There was a food shopping boom during 2020 as people when through a period of lockdown
‘panic-buying’ amid fears of food shortages, and restaurants and pubs closed removing the option
to ‘eat out’. This is forecast to substantially decline during 2021, thereby cancelling out this
fluctuation, with growth per head returning to pre-Covid levels. For convenience goods we have
applied growth rates of 0.2% per annum in 2022; 0% 2023-2027; and 0.1% for the period 2028-40.
16.16 Comparison goods are expected to benefit as an improvement in confidence and incomes have
helped stimulate discretionary spending. We have already seen retail spending bounce back
swiftly following the easing of lockdown during summer 2020. Volumes are expected to reach pre-
Covid levels in 2022, and whilst the growth outlook remains similar to before, in levels terms,
spending is likely to average 9% below levels expected before the pandemic. For comparison
goods, we have applied growth rates of -8.5% 2020; 6.5% 2021; 3.8% 2022; 3.0% 2023-2027; 2.9%
2028-2040.
16.17 Using the growth rates above and applying relevant deductions for SFT, total available expenditure
across the survey area has been grown in five-year intervals (including 2026, 2031, 2036, 2041) and
up to 2043. Total expenditure is forecast as follows:
Royal Borough of Kensington and Chelsea Retail and Leisure Needs Assessment and Town Centre Study, November 2021
www.urbanshape.co.uk 109
▪ Appendix 1, Table 3 applies per capita expenditure to the population forecasts, which
indicates that total available convenience goods expenditure within the survey area is
£1,988m (2021). This is forecast to grow to £2,046m by 2026, £2,074m by 2031, £2,105m by
2036, £2,141m by 2041 and to a total of £2,151m by 2043. This equates to an overall growth
of £163m between 2021 and 2043 (Appendix 1, Table 3).
Overall expenditure growth within the borough is more conservative, ranging from 1.7% to
3.5% between 2021 and 2043.
▪ Comparison goods expenditure within the survey area at 2021 is £2.54 billion. This is forecast
to grow to £2.92 billion by 2026, £3.33 billion by 2031, £3.86 billion by 2036, £4.49 billion by
2040, to a total of £4.78 billion by 2043. This equates to an overall growth for comparison
goods expenditure in the survey area of £2.24 billion between 2021 and 2043 (88% growth)
(Appendix 2, Table 3).
Overall expenditure growth within the borough is more conservative, ranging from 76% to
79% between 2021 and 2043.
16.18 Longer term projections should be treated with caution due to the potential for changing economic
circumstances and growing margins of error over the longer term. The projections are subject to
greater than usual uncertainty due to the unprecedented nature of the Covid-19 pandemic.
Sales Efficiency, Existing Floorspace
16.19 In forecasting quantitative need for future retail floorspace, we have drawn on economic
commentary published by Experian in February 2020 and October 2020. In particular, our analysis
and need assessment has regard to the implications of Covid-19 on floorspace efficiency; i.e. the
rate in which existing floorspace will absorb any growth in expenditure over the plan period. This
has a direct impact on the levels of floorspace need arising.
16.20 Consistent with growth in expenditure per head on convenience goods, the short term outlook in
respect of the sales efficiency of existing floorspace has been upgraded to reflect the boost to
spending on food during the Covid-19 pandemic. This is a consequence of social distancing
measures such as working from home and spending more time at home, and being unable to eat
out in restaurants and cafes.
16.21 Experian assume a substantial increase in sales efficiency rate for existing convenience goods
floorspace of 5.4% in 2020, followed by a sizeable drop of -4.8% in 2021; and a subsequent return
to ‘more normal’ levels of 0.7% 2022, and 0.3% 2023-40 (source: Experian Retail Planner 18,
October 2020.
16.22 To the period February 2020 (pre-Covid-19), Experian confirmed that sales densities for
comparison goods floorspace had risen at a strong pace, and were expected to continue to do so –
remaining between 3.2% and 3.6% to the period 2026. Budgetary challenges, rising costs and tight
margins were driving retailers to either close down or seek floorspace efficiencies.
16.23 At that point in time, Experian explained that lacklustre demand for retail property, stubborn levels
of vacant units and a lull in retail construction point to limited prospects for expansion in retail
floorspace over the next few years. In this context, it was expected that existing comparison goods
floorspace would continue to absorb a greater proportion of any growth in retail expenditure as

Royal Borough of Kensington and Chelsea Retail and Leisure Needs Assessment and Town Centre Study, November 2021
www.urbanshape.co.uk 110
businesses sought to improve the quality and interest of their shops for visitors. Experian
concluded that there would not therefore be a strong demand for additional comparison goods
retail space, with a growing proportion of expenditure growth being directed to the internet and
the consolidation and improvement of existing floorspace – particularly in stronger town and city
centres.
16.24 Subsequent to the publication of these trends in February 2020, the Covid-19 pandemic had far
reaching consequences for our high streets and town centres as all but essential shops and services
closed for long periods of time.
16.25 The Experian Retail Planner October 2020 revised sales efficiency forecasts in the context of Covid-
19, stating that sharp swings in retail spending due to the temporary closure of businesses as well
as ongoing social distancing restrictions have led to volatile sales densities in 2020. Whilst this is
expected to correct once the spending recovery becomes more established, the medium-term
forecast for sales densities has – following a period of instability – been revised lower in line with
the downgrade in the outlook for retail spending.
16.26 For comparison goods, Experian estimate that existing retail floorspace experienced a fall in retail
sales density by -14.1% as a consequence of store closures during lockdowns and short periods of
being ‘open for trading’. Experian forecast some correction to this, with an improved sales density
of 8.6% in 2021, 3.4% in 2022, 2.6% between 2023-2027, and 2.9% between 2028 and 2032.
16.27 Covid-19 has had a positive impact on the performance of existing foodstores and other
convenience goods floorspace in the short term, being retained in the medium to longer term; but
a negative impact on existing comparison goods floorspace over the short to medium term.
Convenience Goods Floorspace Performance
16.28 Table 16.1 below lists the most popular foodstores in RBKC by turnover derived from the survey
area (Zone 1-10). The data reaffirms that the most popular store is the Sainsbury’s Superstore at
Canal Way, Ladbroke Grove, located in the far north of the borough. Located in Zone 1, and with a
turnover of £102.8m, the foodstore draws a quarter of all expenditure from Zone 1 (£40m), and is
the only store in the borough to achieve a substantial inflow of trade, drawing £22.1m and £28.8m
from Zones 4 and 5 respectively. This foodstore falls within the Kensal Canalside Opportunity Area
and is currently the subject of pre-application discussions to include redevelopment.
16.29 The out-of-centre Tesco Superstore at Cromwell Road is the second most popular foodstore in the
borough. Located in Zone 2, and with a turnover of £53.2m, the store draws most trade from Zone
2 (£31.2m), but does attract people living in Zones 1, 3, 7, 9 and 10 also. The Waitrose foodstore
on King’s Road (Zone 3) is the most popular town centre store in the borough with a turnover of
£51.5m, closely followed by the Sainsbury’s Superstore on Cromwell Road (£44.5m), which is
located within the Air Terminal Neighbourhood Centre. Foodstores in Kensington High Street and
King’s Road (East) are amongst the most popular in the borough. The Portobello Road Market is
the 12th most popular food shopping destination in the borough, highlighting the importance to the
centres vitality and viability.
16.30 Within the survey area (Zones 1-10), the borough-wide network of foodstores combined (listed in
Table 6, Appendix 1) have a market share of 22.1% (£438.5m). This level of trade retention is not a
cause for concern given the extent of the survey area outer boundary and localised nature of

Royal Borough of Kensington and Chelsea Retail and Leisure Needs Assessment and Town Centre Study, November 2021
www.urbanshape.co.uk 111
convenience goods shopping. Zones 1, 2 and 3 most closely correlate to the RBKC boundary, within
which the network of foodstores have a market share of 51.6%, 70.3% and 57.4% respectively.
Table 16.1: Most Popular Foodstores in RBKC by Turnover (£m)
Turnover (£m) Sequential Location
1 Sainsbury’s Superstore, Canal Way, Ladbroke
Grove £102.8m Out-of-centre
2 Tesco Superstore, West Cromwell Road,
Kensington £53.2m Out-of-centre
3 Waitrose, King’s Road (East) £51.5m Major Centre
4 Sainsbury’s Superstore, Cromwell Road Air
Terminal £44.5m Neighbourhood Centre
5 Waitrose, Kensington High Street £26.6m Major Centre
6 M&S, King’s Road (East) £20.4m Major Centre
7 M&S, Kensington High Street £17.3m Major Centre
8 Tesco Metro, Portobello Road £16.5m Special District Centre
9 Whole Foods, Kensington High Street £15.4m Major Centre
10 Tesco Metro, Notting Hill Gate £13.8m District Centre
11 M&S, Notting Hill Gate £11.0m District Centre
12 Portobello Market, Portobello Road £8.6m Special District Centre
13 M&S, Fulham Road (West) £8.4m District Centre
14 Tesco Express, Fulham Road (West) £7.3m District Centre
15 Sainsbury’s Local, Fulham Road (West) £6.9m District Centre
16 Sainsbury’s Local, Portobello Road £6.6m Special District Centre
17 M&S, Earls Court Road £5.5m District Centre
18 Sainsbury’s Local, Earls Court Road £4.2m District Centre
19 Waitrose (Little), Notting Hill Gate £3.9m District Centre
20 Sainsbury’s Local, Kensington High Street £2.8m Major Centre
21 Waitrose (Little), Old Brompton Road, South
Kensington £2.3m District Centre
22 Tesco Express, Old Brompton Road, South
Kensington £1.8m District Centre
16.31 We identify the three most popular foodstores for those living within each of the central survey
zones (1-3) as follows:
▪ Zone 1: Sainsbury’s Superstore, Canal Way (25.2%)
Tesco Metro, Portobello Road (10.4%)

Royal Borough of Kensington and Chelsea Retail and Leisure Needs Assessment and Town Centre Study, November 2021
www.urbanshape.co.uk 112
▪ Zone 2: Tesco Superstore, West Cromwell Road (17.3%)
Sainsbury’s Superstore, Cromwell Road (15.0%)
Waitrose, Kensington High Street (10.5%)
▪ Zone 3: Waitrose, King’s Road (East) (27.5%)
M&S, King’s Road (East) (8.6%)
Tesco Superstore, West Cromwell Road (4.9%)
Sainsbury’s Superstore, Cromwell Road (4.5%)
16.32 Sainsbury’s superstore, Canal Way, Ladbroke Grove, is located within Zone 1 of the survey area,
accessed directly from the B450 Ladbroke Grove Road. It is the strongest performing foodstore in
RBKC, and has a convenience goods turnover of £102.8m – estimated to comprise around 75%
convenience goods net floorspace with the remainder occupied by comparison and other goods.
Based on this turnover, and with a net convenience goods sales area of 3,674 sq m net, we
estimate the sales density to be around £27,980 per sq m net – substantially higher than
Sainsbury’s company average of £12,191 per sq m net.
16.33 Tesco Superstore, West Cromwell Road, is the second most popular foodstore in RBKC, located in
Zone 2. We estimate that the store currently has a turnover of £53.2m. Based on this turnover,
and with a net convenience goods sales area of 3,060 sq m, we estimate the sales density to be
c.£17,386 per sq m net. This is higher than company average levels of £12,911 per sq m net.
16.34 The Sainsbury’s superstore on Cromwell Road is consistent with an out-of-centre store format, but
is allocated as the Air Terminal Neighbourhood Centre. Located in Zone 2, we estimate that the
store currently has a turnover of £44.5m. Based on this turnover, and with a net convenience
goods sales area of 2,731 sq m, we estimate the sales density to be c.£16,294 per sq m net. This is
higher than company average levels of £12,191 per sqm net. All main food superstores in RBKC are
performing particularly well.
Convenience Goods Floorspace Need
16.35 The convenience goods need assessment has assumed that RBKC will maintain existing market
share and the model has forecast the need for new convenience goods floorspace to the years
2026, 2031, 2036, 2041 and 2043.
16.36 Based on population and expenditure growth, and the detailed performance analysis of existing
floorspace, the analysis identifies a level of residual expenditure sufficient to support additional
convenience goods floorspace across RBKC. Consistent with growth in expenditure on convenience
goods, the short term outlook in respect of the sales efficiency of existing floorspace has been
upgraded to reflect the boost to spending on food. This is a consequence of social distancing
measures such as working from home and spending more time at home, and being unable to eat
out in restaurants and cafes.
16.37 In assessing capacity for future convenience goods floorspace, we have assumed that the efficiency
with which existing floorspace is being used will increase over time. Experian forecast an increase
in sales efficiency rate for existing floorspace of 0.7% in 2022 and 0.3% thereafter. Based on the
role and performance of the foodstores and comparisons with company average sales densities, we
would expect new quality floorspace to achieve at least £12,000 per sq m net over the plan period.

Royal Borough of Kensington and Chelsea Retail and Leisure Needs Assessment and Town Centre Study, November 2021
www.urbanshape.co.uk 113
16.38 The level of borough-wide need for additional convenience goods floorspace is set out in Table
16.2, by total borough and also in Table 16.3 by Central/North Sub-Area and South Sub-Area.
Table 16.2: RBKC Quantitative Need: Convenience Goods
2026
Sq m net
2031
Sq m net
2036
Sq m net
2041
Sq m net
2043
Sq m net
9,611
9,335 9,154 9,036
8,918
Source: Table 13a, Appendix 1
Table 16.3: RBKC Quantitative Need: Convenience Goods, by Sub-Area 2026
Sq m net
2031
Sq m net
2036
Sq m net
2041
Sq m net
2043
Sq m net
Central/North Sub-
Area
8,439
8,231 8,094 8,005 7,916
South Sub-Area 1,172 1104 1,061 1,031 1,002
Source: Table 13b and 13c, Appendix 1
Comparison Goods Inflow
16.39 In addition to generated expenditure from survey area residents, there will also be a level of trade
flowing into the borough from further afield. This will contribute to supporting additional/new
floorspace and needs to be quantified as part of this assessment. The contribution of visitor and
international expenditure to the RBKC is well documented, including in London First’s Report –
‘Tourist Information, Mapping the Local Value of International Visitors’. This puts RBKC in the
‘Central Tourism Core’ alongside Westminster and City of London, which – combined – are
responsible for more than three quarters of international tourist spending.
16.40 The London First Report collates robust data to demonstrate the contribution of international
tourism spend to individual borough economies. Gross Value Added (GVA) is a measure of
additional economic value arising from direct investment (in this case tourism spend).
Additional value is created because the spending by tourists supports considerable activity in
other sectors, i.e. a ‘chain of events’. RBKC has a significantly higher GVA £m (over £5b) than
any other London Borough, including Westminster. It is therefore crucial that ‘inflow’ of
expenditure is taken into account when forecasting floorspace need as part of this Study.
16.41 The 2008 Study commissioned in-centre surveys to define the extent of the catchment areas of the
eleven main town centres. The surveys enabled an estimate of the proportion of shoppers in the
centres travelling from beyond the survey area boundary (i.e. the inflow of trade from regional,
national or international visitors). In total, 1,400 interviews were undertaken and the following
levels of inflow were estimated:
▪ Total inflow to survey area Zones 1-10 – 55%;
▪ Total inflow to Central/North Sub-Area – 40%;
▪ Total inflow to South Sub-Area – 65%.

Royal Borough of Kensington and Chelsea Retail and Leisure Needs Assessment and Town Centre Study, November 2021
www.urbanshape.co.uk 114
16.42 The analysis of data and findings set out in this up-to-date report highlights the lower level of
market share beyond the borough boundary, with the RBKC town centres drawing less trade from
Zones 4-10 than identified previously in 2008. This assessment has drawn on the 2008 inflow data,
but reduced inflow in the context of current performance and wider national trends. The inflow
figures used in this up-to-date assessment are: 50% to the total survey area, 35% to the
Central/North Sub-Area, and 60% to the South Sub-Area.
Comparison Goods Floorspace Performance
16.43 For comparison goods, we have calculated the levels of comparison goods trade retention by the
RBKC town centres to inform the baseline understanding of floorspace performance. Section 3
discussed in detail the role of the RBKC town centres within the wider sub-region, and here we
explore the floorspace performance of the individual RBKC centres in greater depth.
16.44 Table 16.4 (below) sets out the market share and trade retention of each of the RBKC town centres
within the borough (Zones 1-3) and also the wider Zone 1-10 survey area. The data demonstrates
that King’s Road and Kensington High Street are by far the most popular and most visited town
centres in the borough drawing 24.1% and 21.9% of Zone 1-3 trade respectively. The data also
demonstrates the reliance of Knightsbridge on visitor and tourism trade consistent with its role as
an International Centre, and unique mix of town centre uses and operators, and also hotels.
16.45 The results of the survey demonstrate that the eleven higher order town centres in RBKC retain
£649.2m (25.5%) of comparison goods expenditure generated within the Zone 1-10 Survey Area;
but within the borough, trade retention is higher. Within Zone 1-3, the eleven higher order RBKC
town centres retain £357m (56.7%) of comparison goods expenditure generated.
Table 16.4: RBKC Comparison Goods Spending Destinations (2021)
Zone 1-3
£m
Zone 1-3
Market Share %
Zone 1-10
£m
Zone 1-10
Market Share %
King’s Road (East) £151.8m 24.1% £329.4m 13.1%
Kensington High Street £137.6m 21.9% £201.9m 8.0%
Notting Hill Gate £25.1m 4.0% £33.3m 1.3%
Knightsbridge £12.8m 2.0% £20.2m 0.8%
King’s Road (West) £8.4m 1.3% £15.7m 0.6%
Fulham Road (West) £4.5m 0.7% £14.6m 0.6%
Portobello Road £9.2m 1.5% £12.0m 0.5%
Westbourne Grove £1.6m 0.3% £6.2m 0.2%
South Kensington £2.7m 0.4% £3.3m 0.1%
Earls Court Road £2.7m 0.4% £3.0m 0.1%
Brompton Cross £0.5m 0.05% £0.5m 0.05%
16.46 Table 16.5 (below) sets out RBKC market share for comparison goods derived from the 2008 Retail
and Leisure Needs Assessment, and the most recent 2021 household telephone survey. This was
discussed in detail in Section 3, and highlights that RBKC has improved trade retention within the

Royal Borough of Kensington and Chelsea Retail and Leisure Needs Assessment and Town Centre Study, November 2021
www.urbanshape.co.uk 115
borough, but lost market share from beyond the borough. The up-to-date analysis identifies that
trade drawn from within the borough to RBKC town centres has been relatively robust to the
opening of Westfield White City, with impact being lower on borough trade diversion that initially
estimated in 2008 and 2016. The greatest level of impact has been in Zone 1, with a considerable
trade diversion from Kensington High Street. Zone 2 and 3 have experienced substantial market
share uplifts.
16.47 The localised increase in market share may also be a consequence of the post pandemic ‘shop
local’ trend. The fall in market share outside the borough demonstrates the need to support
diverse and multi-purpose town centres as it is becoming increasingly challenging to attract people
from further afield.
16.48 Market share decline beyond the borough is a consequence of a number of trends including post
pandemic ‘shop local’, online shopping preventing the need to travel longer distances for
goods/products, and the opening of Westfield White City in October 2008 which has had some
impact on the higher order town centres in RBKC. Despite distance, all outer zones (4/5/6/7/8/9
and 10) are well connected to Westfield White City on the Overground, Central and Circle lines,
linking east/west and north/south.
Table 16.5: Total RBKC Trade Retention/Market Share [Comparison Goods], 2008-2021
Study Year Zone 1-3, Market Share % Zone 1-10, Market Share %
2008 54.0% 30.9%
2021 56.7% 25.5%
NB: Zone 1-3 ‘best fit’ geographical area to RBKC.
16.49 Table 16.6 (below) focuses in more detail on the localised catchment of each of the RBKC town
centres, setting out their location zone and comparison goods market share within that zone. The
2008 Study presented ‘combined’ sub-area market shares, and it has not been possible to compare
historic trade retention rates over time by town centre, but this provides a baseline for monitoring
moving forwards over the plan period – particularly in light of Battersea Power Station opening in
2022.
16.50 The data again highlights the role of Knightsbridge as an International Centre and its reliance on
visitors and tourism from further afield. Few people living in RBKC look towards Knightsbridge as
their main or most visited town centre – in stark contrast to Kensington High Street and King’s
Road. The data indicates that the town centre hierarchy remains relevant and up-to-date with all
district centres achieving a considerably lower market share, reflecting more localised shopping
roles.
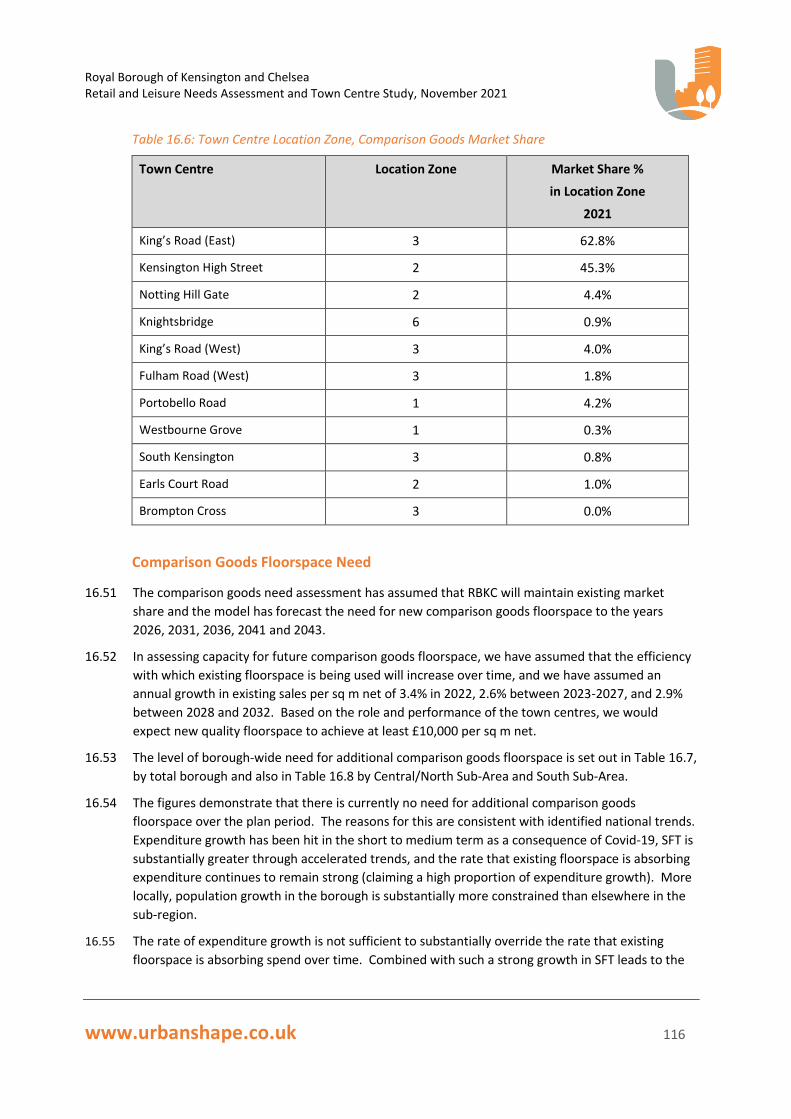
Royal Borough of Kensington and Chelsea Retail and Leisure Needs Assessment and Town Centre Study, November 2021
www.urbanshape.co.uk 116
Table 16.6: Town Centre Location Zone, Comparison Goods Market Share
Town Centre Location Zone Market Share %
in Location Zone
2021
King’s Road (East) 3 62.8%
Kensington High Street 2 45.3%
Notting Hill Gate 2 4.4%
Knightsbridge 6 0.9%
King’s Road (West) 3 4.0%
Fulham Road (West) 3 1.8%
Portobello Road 1 4.2%
Westbourne Grove 1 0.3%
South Kensington 3 0.8%
Earls Court Road 2 1.0%
Brompton Cross 3 0.0%
Comparison Goods Floorspace Need
16.51 The comparison goods need assessment has assumed that RBKC will maintain existing market
share and the model has forecast the need for new comparison goods floorspace to the years
2026, 2031, 2036, 2041 and 2043.
16.52 In assessing capacity for future comparison goods floorspace, we have assumed that the efficiency
with which existing floorspace is being used will increase over time, and we have assumed an
annual growth in existing sales per sq m net of 3.4% in 2022, 2.6% between 2023-2027, and 2.9%
between 2028 and 2032. Based on the role and performance of the town centres, we would
expect new quality floorspace to achieve at least £10,000 per sq m net.
16.53 The level of borough-wide need for additional comparison goods floorspace is set out in Table 16.7,
by total borough and also in Table 16.8 by Central/North Sub-Area and South Sub-Area.
16.54 The figures demonstrate that there is currently no need for additional comparison goods
floorspace over the plan period. The reasons for this are consistent with identified national trends.
Expenditure growth has been hit in the short to medium term as a consequence of Covid-19, SFT is
substantially greater through accelerated trends, and the rate that existing floorspace is absorbing
expenditure continues to remain strong (claiming a high proportion of expenditure growth). More
locally, population growth in the borough is substantially more constrained than elsewhere in the
sub-region.
16.55 The rate of expenditure growth is not sufficient to substantially override the rate that existing
floorspace is absorbing spend over time. Combined with such a strong growth in SFT leads to the

Royal Borough of Kensington and Chelsea Retail and Leisure Needs Assessment and Town Centre Study, November 2021
www.urbanshape.co.uk 117
current status quo, and only a small level of additional need over the plan period. The over-supply
is not currently substantial, so that doesn’t raise a huge concern in respect of the need to lose
space, but the strategy must protect existing provision to consolidate and support healthy town
centres over the plan period.
Table 16.7: RBKC Quantitative Need: Comparison Goods
2026
Sq m net
2031
Sq m net
2036
Sq m net
2041
Sq m net
2043
Sq m net
-413 -2,115 -2,265 -1,691 -1,095
Source: Table 13, Appendix 2
Table 16.8: RBKC Quantitative Need: Comparison Goods, by Sub-Area
2026
Sq m net
2031
Sq m net
2036
Sq m net
2041
Sq m net
2043
Sq m net
Central/North Sub-
Area -327 -940 -1,058 -940 -776
South Sub-Area 15 -1,115 -1,113 -586 -108
Source: Table 14 and 15, Appendix 2

Royal Borough of Kensington and Chelsea Retail and Leisure Needs Assessment and Town Centre Study, November 2021
www.urbanshape.co.uk 118
17. Leisure Assessment
17.1 Commercial leisure and cultural uses have played an increasingly important role in the vitality and
viability of town centres by providing complementary uses that strengthen both the daytime and
evening economies. This section of the report considers the current provision of commercial
leisure uses throughout the study area, including patterns of visits to restaurants, cafes, cinema,
nightclubs, museums, and cultural venues.
17.2 Drawing on the qualitative analysis of current provision, consumer choices, visitor patterns and
commercial trends, we provide commentary on the potential need for different leisure uses. For
the purposes of this leisure assessment we have analysed leisure travel patterns across the
individual survey zones 1-10 (See Fig.17.1).
Figure 17.1: RBKC Household Telephone Survey Area, 2021
17.3 The telephone survey achieved the target response of 1,000 interviews, and within that sample
90% stated that they took part in leisure or cultural activities. In respect of sampling, 32% were
male respondents and 68% were female; and the age classifications were as follows:
▪ 18-24 - 10.3%
▪ 25-34 - 22.5%
▪ 35-44 - 25.4%
▪ 45-54 - 14.2%
▪ 55-64 - 13.0%
▪ 65+ - 14.5%

Royal Borough of Kensington and Chelsea Retail and Leisure Needs Assessment and Town Centre Study, November 2021
www.urbanshape.co.uk 119
National Context
17.4 Trends in the commercial leisure sector have been discussed in earlier sections of this report,
documenting the need to inject life into our high streets and the continued evolution towards
multi-dimensional town centres. The town centre of the future should attract local people to take
part in a variety of activities – including dining, leisure and sport, culture and the arts,
entertainment and medical services alongside business premises, offices, and residential.
17.5 In recent years, the commercial leisure sector has played an increasingly important role in the
vitality and viability of town centres, as the nature of town centres continues to evolve. Leisure
uses will continue to be important attractors in town centres, but there are challenges. The casual
dining sector, for example, has reached a level of saturation and increased competition has led to
casualties in recent years. Analysts suggest that in addition to market saturation, the rise in food
costs, staff costs, rents and business rates have all impacted on operators’ profits; as well as
emerging on-line delivery companies such as Uber Eats, Deliveroo and Just Eat.
17.6 The consequences of Covid-19 and associated lockdown and social distancing since March 2020,
will have further far-reaching impacts on the leisure and casual dining sector, with on-line delivery
companies becoming firmly established in people’s homes. Competition for high street operators
has exacerbated and accelerated over a very short period of time.
17.7 Nevertheless, leisure uses will continue to form an important part of our town centres over the
forthcoming plan period. Section 16 of this report has discussed forecast growth in spend per head
for food an non-food goods, and in Table 17.1 below we compare this to spend per head on leisure
experiences. In summary, food shopping experienced strong growth during the pandemic in 2020
whilst non-food saw a strong fall in expenditure due to lockdown measures and shop closures for
long periods of time. Whilst not to pre-pandemic levels, both corrected themselves to some extent
during 2021 and future forecasts beyond 2021 reflect ‘more normal’ longer term trends.
17.8 The impacts of Covid-19 on leisure spend has been substantially greater, with a fall of 53.8% in
spend per head during 2020 as all leisure venues closed for long periods of time. The ‘pent up’
demand for leisure experiences and socialising is reflected in the particularly strong growth in
spend per head during 2021 (64.7%). Whilst this an anomaly within longer term trends, it is clear
that leisure spend will experience a stronger growth than retail throughout 2022 and remain at
strong levels from 2023 onwards (2.9%).
17.9 It is evident from the data that leisure uses will remain a valued and relevant part of our town
centres in the future. Despite ‘at home’ leisure experiences such as streaming services growing in
popularity, the pandemic has highlighted the need and desire for people to leave their homes and
socialise with friends and family across a range of leisure experiences.
Table 17.1: UK retail and leisure spend per head 2020-40
Vol Growth Per Head (%)
2020 2021 2022 2023-27 2028-40
Convenience Goods
8.4% -6.2% 0.2% 0.0% 0.1%
Comparison Goods
-8.5% 6.5% 3.8% 3.0% 2.9%
Leisure Spend -53.8% 64.7% 14.8% 2.9% 0.9%
Source: Experian Business Strategies, October 2020, [Figure 1a]

Royal Borough of Kensington and Chelsea Retail and Leisure Needs Assessment and Town Centre Study, November 2021
www.urbanshape.co.uk 120
17.10 When considering the need for new leisure floorspace and leisure uses over the plan period, recent
planning reform must be taken into consideration. This is discussed in detail in Section 2 of this
report, setting out the wide-reaching reforms to the Use Classes Order following the on-set of the
Covid-19 pandemic; the overall aim of government being to support the high street and respond to
high vacancy rates and consumer demands.
17.11 This was a specific and swift response to the economic impact of Coronavirus on high streets and
those premises in A1 and A3 in particular. In force from 1st September 2020, new planning
regulations revoked parts A and D of the existing use classes order and introduced a new
‘commercial, business and service’ Use Class E. Leisure uses are now split into Use Class E, Use
Class F and sui generis, as follows:
▪ Use Class E includes:
o sale of food and drink consumption on premises, ‘cafes and restaurants’ (former A3)
▪ Sui Generis includes:
o theatres
o night-clubs
o public houses, wine bars, or drinking establishments – from 1 September 2020,
previously Class A4
o drinking establishments with expanded food provision – from 1 September 2020,
previously Class A4
o hot food takeaways (for the sale of hot food where consumption of that food is mostly
undertaken off the premises) – from 1 September 2020, previously Class A5
o venues for live music performance – newly defined as ‘Sui Generis’ use from 1 September
2020
o cinemas – from 1 September 2020, previously Class D2(a)
o concert halls – from 1 September 2020, previously Class D2(b)
o bingo halls – from 1 September 2020, previously Class D2(c)
o dance halls – from 1 September 2020, previously Class D2(d)
▪ Use Class F1 includes:
o F1(b) Display of works of art (otherwise than for sale or hire) – from 1 September 2020,
previously Class D1
o F1(c) Museums – from 1 September 2020, previously Class D1
17.12 New Use Class E does not allow policy to control the mix and proportions of shops, cafes and
restaurants, but all other leisure uses fall within sui generis or Use Class F1 enabling a development
plan to promote or restrict uses as necessary.

Royal Borough of Kensington and Chelsea Retail and Leisure Needs Assessment and Town Centre Study, November 2021
www.urbanshape.co.uk 121
Commercial Leisure Choices
17.13 The household survey results enabled the identification of the most popular leisure activities across
the sub-region, the most frequent being ‘cinema’ and the least frequent being ‘nightclubs’:
▪ Cafes - 70.7%
▪ Evening Eating Out/Restaurants - 65.8%
▪ Museums - 63.9%
▪ Cinema - 63.0%
▪ Cultural/Arts Venues - 61.7%
▪ Daytime Eating Out/Restaurants - 59.3%
▪ Nightclubs - 13.4%
Cafes
17.14 Visiting cafes is the most popular choice of leisure activity amongst those living in the survey area
(Table 17.2). The most popular destinations within Zone 1 are Portobello Road and Notting Hill
Gate; Zone 2 is Kensington High Street; and in Zone 3 is King’s Road (East). Café visits are generally
undertaken ‘close to home’, and this is reflected in the survey results with RBKC having more
limited influence on those living in the outer survey zones (Zone 4-10).
Table 17.2: Preferred Café Choices of those living within Zones 1-10
Zone 1 Portobello Road (29%)
Notting Hill Gate (10%)
Ladbroke Grove (9%)
Central London (7%)
Zone 6 Central London (19%)
Pimlico (19%)
King’s Road (East) (13%)
Victoria (12%)
Zone 2 Kensington High Street (52%)
Notting Hill Gate (12%)
Portobello Road (6%)
Zone 7 King’s Road (East) (21%)
Battersea (19%)
Clapham Junction (19%)
Zone 3 King’s Road (East) (48%)
Central London (10%)
Fulham Road (West) (7%)
King’s Road (West) (7%)
Zone 8 Fulham Broadway (24%)
Fulham Road (West) (14%)
King’s Road (East) (11%)
Zone 4 Willesden Green (18%)
Central London (16%)
Zone 9 Kensington High Street (20%)
Hammersmith Town Centre (20%)
Zone 5 Central London (26%)
Maida Vale (12%)
Portobello Road (11%)
Zone
10
Westfield White City (18%)
Shepherd’s Bush Green (13%)
Chiswick Town Centre (11%)
Note: Highest responses only
17.15 Portobello Road does attract some residents from Zone 5 (11%), whilst King’s Road (East) is a
popular first choice for those living in Zones 6, 7 and 8; Kensington High Street attracts people
living in Zone 9; and Fulham Broadway draws from Zone 8. Westfield White City has a limited
influence on the survey area, and the new Battersea development may have an impact on King’s
Road (East) market share – particularly in Zone 7. This should be monitored.
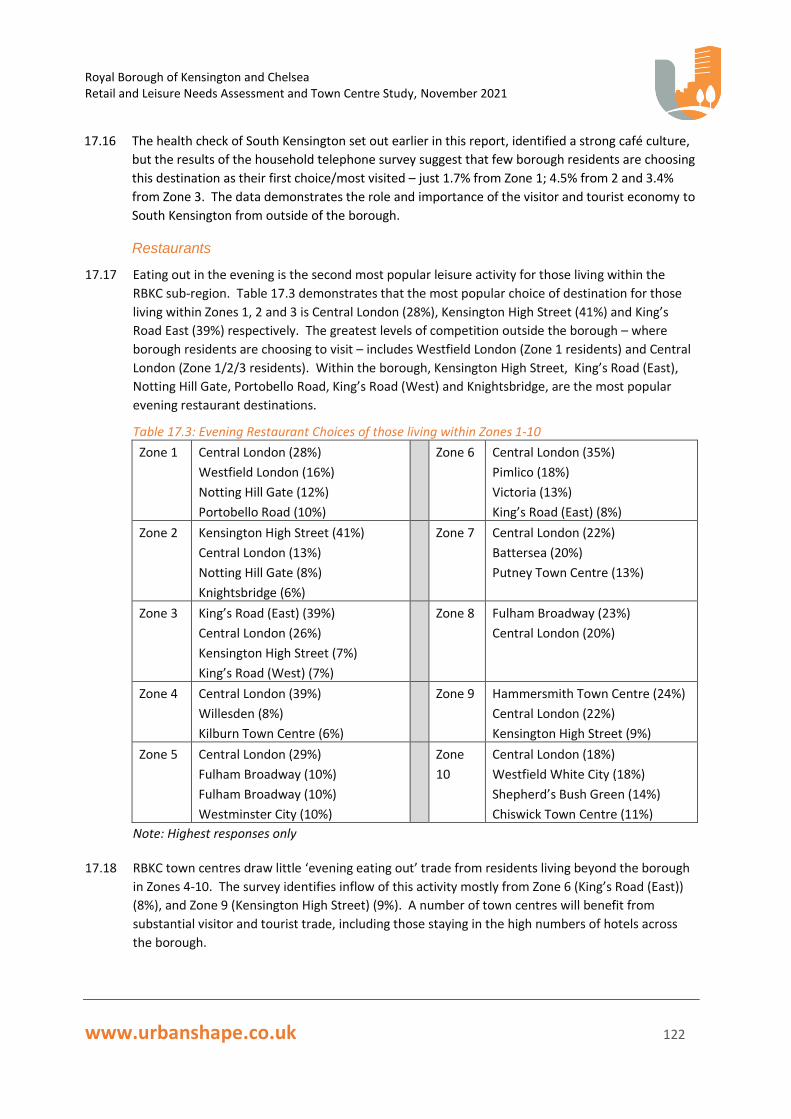
Royal Borough of Kensington and Chelsea Retail and Leisure Needs Assessment and Town Centre Study, November 2021
www.urbanshape.co.uk 122
17.16 The health check of South Kensington set out earlier in this report, identified a strong café culture,
but the results of the household telephone survey suggest that few borough residents are choosing
this destination as their first choice/most visited – just 1.7% from Zone 1; 4.5% from 2 and 3.4%
from Zone 3. The data demonstrates the role and importance of the visitor and tourist economy to
South Kensington from outside of the borough.
Restaurants
17.17 Eating out in the evening is the second most popular leisure activity for those living within the
RBKC sub-region. Table 17.3 demonstrates that the most popular choice of destination for those
living within Zones 1, 2 and 3 is Central London (28%), Kensington High Street (41%) and King’s
Road East (39%) respectively. The greatest levels of competition outside the borough – where
borough residents are choosing to visit – includes Westfield London (Zone 1 residents) and Central
London (Zone 1/2/3 residents). Within the borough, Kensington High Street, King’s Road (East),
Notting Hill Gate, Portobello Road, King’s Road (West) and Knightsbridge, are the most popular
evening restaurant destinations.
Table 17.3: Evening Restaurant Choices of those living within Zones 1-10
Zone 1 Central London (28%)
Westfield London (16%)
Notting Hill Gate (12%)
Portobello Road (10%)
Zone 6 Central London (35%)
Pimlico (18%)
Victoria (13%)
King’s Road (East) (8%)
Zone 2 Kensington High Street (41%)
Central London (13%)
Notting Hill Gate (8%)
Knightsbridge (6%)
Zone 7 Central London (22%)
Battersea (20%)
Putney Town Centre (13%)
Zone 3 King’s Road (East) (39%)
Central London (26%)
Kensington High Street (7%)
King’s Road (West) (7%)
Zone 8 Fulham Broadway (23%)
Central London (20%)
Zone 4 Central London (39%)
Willesden (8%)
Kilburn Town Centre (6%)
Zone 9 Hammersmith Town Centre (24%)
Central London (22%)
Kensington High Street (9%)
Zone 5 Central London (29%)
Fulham Broadway (10%)
Fulham Broadway (10%)
Westminster City (10%)
Zone
10
Central London (18%)
Westfield White City (18%)
Shepherd’s Bush Green (14%)
Chiswick Town Centre (11%)
Note: Highest responses only
17.18 RBKC town centres draw little ‘evening eating out’ trade from residents living beyond the borough
in Zones 4-10. The survey identifies inflow of this activity mostly from Zone 6 (King’s Road (East))
(8%), and Zone 9 (Kensington High Street) (9%). A number of town centres will benefit from
substantial visitor and tourist trade, including those staying in the high numbers of hotels across
the borough.
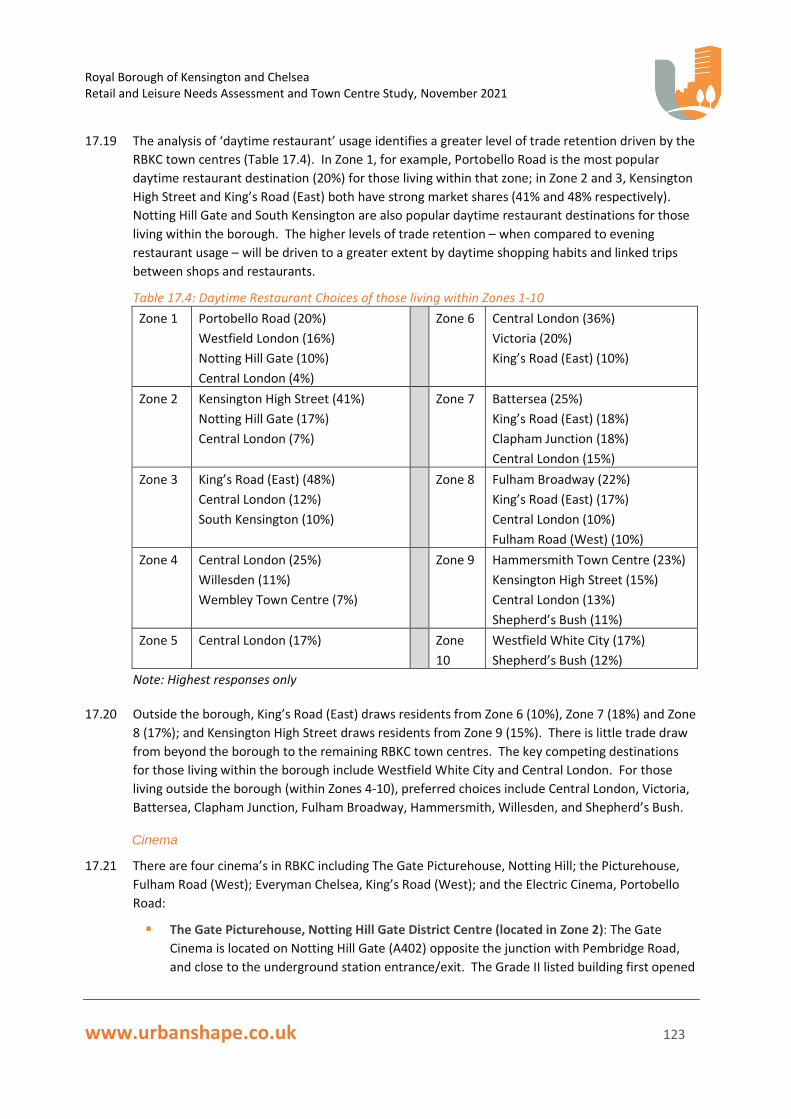
Royal Borough of Kensington and Chelsea Retail and Leisure Needs Assessment and Town Centre Study, November 2021
www.urbanshape.co.uk 123
17.19 The analysis of ‘daytime restaurant’ usage identifies a greater level of trade retention driven by the
RBKC town centres (Table 17.4). In Zone 1, for example, Portobello Road is the most popular
daytime restaurant destination (20%) for those living within that zone; in Zone 2 and 3, Kensington
High Street and King’s Road (East) both have strong market shares (41% and 48% respectively).
Notting Hill Gate and South Kensington are also popular daytime restaurant destinations for those
living within the borough. The higher levels of trade retention – when compared to evening
restaurant usage – will be driven to a greater extent by daytime shopping habits and linked trips
between shops and restaurants.
Table 17.4: Daytime Restaurant Choices of those living within Zones 1-10
Zone 1 Portobello Road (20%)
Westfield London (16%)
Notting Hill Gate (10%)
Central London (4%)
Zone 6 Central London (36%)
Victoria (20%)
King’s Road (East) (10%)
Zone 2 Kensington High Street (41%)
Notting Hill Gate (17%)
Central London (7%)
Zone 7 Battersea (25%)
King’s Road (East) (18%)
Clapham Junction (18%)
Central London (15%)
Zone 3 King’s Road (East) (48%)
Central London (12%)
South Kensington (10%)
Zone 8 Fulham Broadway (22%)
King’s Road (East) (17%)
Central London (10%)
Fulham Road (West) (10%)
Zone 4 Central London (25%)
Willesden (11%)
Wembley Town Centre (7%)
Zone 9 Hammersmith Town Centre (23%)
Kensington High Street (15%)
Central London (13%)
Shepherd’s Bush (11%)
Zone 5 Central London (17%) Zone
10
Westfield White City (17%)
Shepherd’s Bush (12%)
Note: Highest responses only
17.20 Outside the borough, King’s Road (East) draws residents from Zone 6 (10%), Zone 7 (18%) and Zone
8 (17%); and Kensington High Street draws residents from Zone 9 (15%). There is little trade draw
from beyond the borough to the remaining RBKC town centres. The key competing destinations
for those living within the borough include Westfield White City and Central London. For those
living outside the borough (within Zones 4-10), preferred choices include Central London, Victoria,
Battersea, Clapham Junction, Fulham Broadway, Hammersmith, Willesden, and Shepherd’s Bush.
Cinema
17.21 There are four cinema’s in RBKC including The Gate Picturehouse, Notting Hill; the Picturehouse,
Fulham Road (West); Everyman Chelsea, King’s Road (West); and the Electric Cinema, Portobello
Road:
▪ The Gate Picturehouse, Notting Hill Gate District Centre (located in Zone 2): The Gate
Cinema is located on Notting Hill Gate (A402) opposite the junction with Pembridge Road,
and close to the underground station entrance/exit. The Grade II listed building first opened

Royal Borough of Kensington and Chelsea Retail and Leisure Needs Assessment and Town Centre Study, November 2021
www.urbanshape.co.uk 124
its doors as a cinema in 1911; but during the Second World War, the ornate exterior was
severely damaged and subsequently replaced with a plain façade and a flat roof. The single-
screen cinema became a Picturehouse in 2003, and in 2004 the building underwent
renovation, restoring the ornate Edwardian plasterwork in the auditorium alongside general
interior improvements.
The Gate Picturehouse, Notting Hill Gate
▪ Picturehouse, Fulham Road (West) District Centre (located in Zone 3): The Fulham Road
Picturehouse is located on the corner of Fulham Road and Drayton Gardens. Formerly a
Cineworld cinema, the venue offers six cinema screens, over 1,000 seats, a café and
members bar. The 1930’s listed building was refurbished for opening on 8th December 2019,
incorporating an internal vintage theme to reflect the date of the building.
Picturehouse, Fulham Road (West) District Centre

Royal Borough of Kensington and Chelsea Retail and Leisure Needs Assessment and Town Centre Study, November 2021
www.urbanshape.co.uk 125
▪ Everyman Cinema – ‘Everyman Chelsea’ – King’s Road (West) District Centre (located in
Zone 3): The fully refurbished 3-screen boutique Everyman cinema opened in summer 2020
on the junction of Old Church Street and King’s Road. The cinema forms part of a new
mixed-use residential development. The three screens offer around 200 seats, with the
cinema also providing a bar with full foot and drinks licensed menu. This cinema opened
during the Covid-19 global pandemic and it is likely that the destination is still establishing a
full customer base and levels of influence across the survey area.
Everyman Chelsea, King’s Road (West) District Centre
▪ The Electric Cinema, Portobello Road Special District Centre (located in Zone 1): The
Electric Cinema is a longstanding institution on Portobello Road, located in the centre of the
district centre. It first opened in 1911, and today has been refurbished to a high standard
offering mainstream and art house films, bar and restaurant. The 83 seat capacity cinema is
a well-known and important destination attractor in the district centre.
The Electric Cinema, Portobello Road Special Distrt Centre
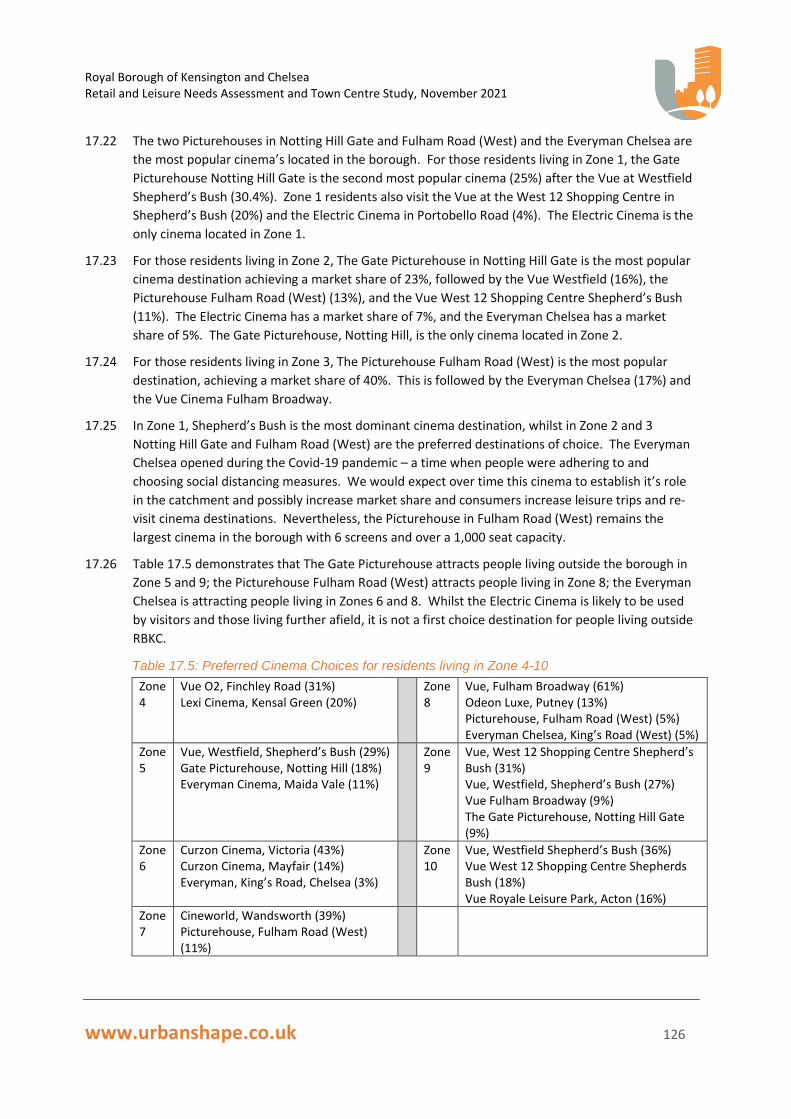
Royal Borough of Kensington and Chelsea Retail and Leisure Needs Assessment and Town Centre Study, November 2021
www.urbanshape.co.uk 126
17.22 The two Picturehouses in Notting Hill Gate and Fulham Road (West) and the Everyman Chelsea are
the most popular cinema’s located in the borough. For those residents living in Zone 1, the Gate
Picturehouse Notting Hill Gate is the second most popular cinema (25%) after the Vue at Westfield
Shepherd’s Bush (30.4%). Zone 1 residents also visit the Vue at the West 12 Shopping Centre in
Shepherd’s Bush (20%) and the Electric Cinema in Portobello Road (4%). The Electric Cinema is the
only cinema located in Zone 1.
17.23 For those residents living in Zone 2, The Gate Picturehouse in Notting Hill Gate is the most popular
cinema destination achieving a market share of 23%, followed by the Vue Westfield (16%), the
Picturehouse Fulham Road (West) (13%), and the Vue West 12 Shopping Centre Shepherd’s Bush
(11%). The Electric Cinema has a market share of 7%, and the Everyman Chelsea has a market
share of 5%. The Gate Picturehouse, Notting Hill, is the only cinema located in Zone 2.
17.24 For those residents living in Zone 3, The Picturehouse Fulham Road (West) is the most popular
destination, achieving a market share of 40%. This is followed by the Everyman Chelsea (17%) and
the Vue Cinema Fulham Broadway.
17.25 In Zone 1, Shepherd’s Bush is the most dominant cinema destination, whilst in Zone 2 and 3
Notting Hill Gate and Fulham Road (West) are the preferred destinations of choice. The Everyman
Chelsea opened during the Covid-19 pandemic – a time when people were adhering to and
choosing social distancing measures. We would expect over time this cinema to establish it’s role
in the catchment and possibly increase market share and consumers increase leisure trips and re-
visit cinema destinations. Nevertheless, the Picturehouse in Fulham Road (West) remains the
largest cinema in the borough with 6 screens and over a 1,000 seat capacity.
17.26 Table 17.5 demonstrates that The Gate Picturehouse attracts people living outside the borough in
Zone 5 and 9; the Picturehouse Fulham Road (West) attracts people living in Zone 8; the Everyman
Chelsea is attracting people living in Zones 6 and 8. Whilst the Electric Cinema is likely to be used
by visitors and those living further afield, it is not a first choice destination for people living outside
RBKC.
Table 17.5: Preferred Cinema Choices for residents living in Zone 4-10
Zone 4
Vue O2, Finchley Road (31%) Lexi Cinema, Kensal Green (20%)
Zone 8
Vue, Fulham Broadway (61%) Odeon Luxe, Putney (13%) Picturehouse, Fulham Road (West) (5%) Everyman Chelsea, King’s Road (West) (5%)
Zone 5
Vue, Westfield, Shepherd’s Bush (29%) Gate Picturehouse, Notting Hill (18%) Everyman Cinema, Maida Vale (11%)
Zone 9
Vue, West 12 Shopping Centre Shepherd’s Bush (31%) Vue, Westfield, Shepherd’s Bush (27%) Vue Fulham Broadway (9%) The Gate Picturehouse, Notting Hill Gate (9%)
Zone 6
Curzon Cinema, Victoria (43%) Curzon Cinema, Mayfair (14%) Everyman, King’s Road, Chelsea (3%)
Zone 10
Vue, Westfield Shepherd’s Bush (36%) Vue West 12 Shopping Centre Shepherds Bush (18%) Vue Royale Leisure Park, Acton (16%)
Zone 7
Cineworld, Wandsworth (39%) Picturehouse, Fulham Road (West) (11%)

Royal Borough of Kensington and Chelsea Retail and Leisure Needs Assessment and Town Centre Study, November 2021
www.urbanshape.co.uk 127
17.27 Traditional cinema venues are changing and adapting in response to wider TV, movie and
streaming trends, and whilst the presence of cinemas in the leisure sector appears secure at
present, the future is somewhat uncertain. From an historic high immediately post-war of 1.64
billion admissions during 1946, UK cinema admissions gradually declined to an all-time low of just
54 million in 1984. Since that time, the advent of the multiplex and record levels of investment in
improving the theatrical experience, has seen admissions recover and since 2000 they have
remained above 150 million.
17.28 There has been much uncertainty in the cinema market given the advent of on-demand streaming
services such as Netflix, a cheaper option in the comfort of your own home. Nevertheless, a
serious detrimental impact has not yet occurred, with cinemas experiencing their highest
admission figures in 2018 and 2019 since 1971.
17.29 Reasons for the market growth is varied. The industry has focused on the release of major
blockbuster movies drawing in the crowds, and – importantly – include a more diverse genre from
musicals to superhero and animated family films. Alongside films, cinemas have sought to diversify
to offer live theatre and opera screenings, providing an alternative entertainment experience, and
making West End productions affordable to a wider audience.
17.30 Alongside film release has been the significant investment in the actual cinema venues and the
creation of an attractive cinema-going experience. Consumer expectations have risen, and
cinemas have become places of comfy sofas, licensed bars, and good quality food and drink. Big
cinema chains have installed higher-quality screens, and are beginning to introduce monthly
subscription plans similar to the ‘streamers’. Notably, the industry has seen the rise of more
boutique operators such as Everyman; and chain that has tripled its number of venues and level of
attendance across the UK over the last 4 years by offering a high end, boutique, quality cinema
experience.
17.31 Crucially, as the younger generation question the need for cinema visits, preferring to stream more
cost effectively at home, the largest growth has been in the older age categories. These groups,
with a greater disposable income, often enjoy a pre-film dinner in the bar with friends, followed by
a drink in the comfy reclining chairs on offer.
17.32 A relatively new trend in the cinema market is the growth of the ‘pop-up’ cinema, estimated to be
worth around £10 million in 2019, and growing at between 20-25% per year. A pop-up cinema is a
mobile or temporary cinema, usually set-up in locations such as a park, beach, the grounds of a
visitor attraction, on a city centre roof-top or other distinctive indoor or outdoor venue.
Sometimes, for example, they are decorated seasonally, such as the Christmas themed secret
cinemas. They tend to screen timeless classics or popular modern films that consumers are very
familiar with, enjoying the experience of watching them again in a very different environment.
Operators include Luna, Rooftop Film Club, Sundown Cinema, Backyard Cinema and Secret Cinema,
for example.
17.33 In RBKC, these trends would suggest that the four existing cinemas will remain viable, but that
there is unlikely to be a need for any additional cinema facilities over the plan period. Each cinema
occupies an important town centre location and must be protected.
17.34 The newly opened Everyman Chelsea is a commercial response to market demand and is already
proving popular despite opening during a global health pandemic. It has been a good addition to

Royal Borough of Kensington and Chelsea Retail and Leisure Needs Assessment and Town Centre Study, November 2021
www.urbanshape.co.uk 128
the town centre mix. The smaller art house cinemas in Notting Hill and Portobello Road
supplement the larger commercial cinemas on the borough boundary at Shepherd’s Bush, and any
further competition within this catchment should be resisted. The Picturehouse and Everyman in
the southern part of RBKC are providing a good coverage with limited leakage to alternative
destinations outside the borough.
17.35 Cinemas were continuing to perform well throughout 2019, but a post Covid world and the
continued march of streaming services like Netflix and the Pop-Up Cinema trend, retain a level of
uncertainty over what the future for the cinema industry might look like and what direction it
might take. We conclude there is no need to plan for additional cinema provision over the plan
period.
Nightclubs
17.36 The nightclub industry has experienced a sharp decline in recent years, with over half of clubs
closing down within a decade. This was partly attributed to the change of pub licensing laws in
2005, when pubs and bars could obtain licences to stay open later. This discouraged ‘moving on’ to
the next venue once the pub had shut at 11am; with consumers able to stay in their pub and bar of
choice until 12am or later.
17.37 More recently, nightclubs have experienced a ‘stop / start’ trend following various periods of
‘lockdown’ as a consequence of the Covid-19 pandemic since March 2020. It is thought that for
many the financial burden of closure will lead to many never re-opening or having to close down
over the next few months. Aside from pub licenses and economic challenges, it is widely
documented that ‘Generation Z’ – the younger generation that has never known a life without
technology – are no longer frequenting nightclubs as a staple weekend activity. There have been a
number of growing trends in recent years:
▪ ‘Generation Z’ are more aware of healthy lifestyles, including lower alcohol consumption and
healthier drinking and eating habits;
▪ Nightclubs are no longer the way to meet people. Meeting through friends and family, and
online dating apps, is generally considered the preferred option;
▪ There is a lack of brand loyalty, with this generation not committing to visiting the same
nightclub time and again, week in week out. Technology has opened the doors to different
destinations and alternative leisure experiences;
▪ Millennials and Generation Z instead enjoy experiences from home, including take-aways,
online movie streaming services, and luxury/varied drink offerings such as wine clubs, gin
experiences and craft beer delivered straight to your door;
▪ The importance of ‘human connection’ has risen, with everyone so reliant on technology in
their lives. When people meet up it is reported that they want to do it properly over a nice
meal and conversation, with nightclubs not providing the right atmosphere or setting for
this.
17.38 It is thought that there will always be a place for nightclubs in their current form, but perhaps
fewer niche venues will specialise in becoming a ‘clubbing paradise’, whilst many others diversify
instead to meet wider consumer needs. Hybrid venues are likely to rise in popularity, signalling a
new era of nightclubs. Hybrid venues offer a daytime offering and nightlife scene too; from coffee
Royal Borough of Kensington and Chelsea Retail and Leisure Needs Assessment and Town Centre Study, November 2021
www.urbanshape.co.uk 129
and brunch in the morning through to cocktails and live music at night, extending the revenue
period.
17.39 The results of the household telephone survey demonstrates that nightclubs are the least popular
leisure activity for those living within the survey area, with only a very small proportion (13.4%)
stating that they visit this type of venue. This leisure activity is predominantly age specific and
limited in reach to the full catchment population. Two key nightclubs have been identified through
our analysis including ‘Dolce Club’ South Kensington and ‘151 King’s Road’. Nevertheless, residents
in the survey area – including within the borough –state that they predominantly visit Central
London for this leisure activity, with little reference made to these facilities in RBKC.
17.40 Societal trends and a deep commercial understanding of local markets will drive investment in any
new nightclub venues in RBKC. The composite analysis suggests that there is unlikely to be a need
to plan for new nightclub venues over the plan period, and that nightclubs are not crucial in
maintaining the vitality and viability of any particular RBKC town centre. A policy framework can
manage the introduction of new nightclub uses effectively – whether supporting or resisting – as
they continue to fall under the ‘Sui Generis’ Use Classes classification. This is more often the remit
of licensing as a consequence of potential noise and impact on residential amenity. Any
applications should consequently be considered robustly on a case by case basis.
Museums
17.41 Earlier sections have highlighted the world class museums helping give RBKC its international and
national reputation. The Local Plan highlights that these attract large numbers of visitors from
beyond the borough boundary, representing a significant ‘economic inflow’ substantially greater
than most London Boroughs.
17.42 In recognition of its outstanding universal value as a visitor destination, the Council and the London
Plan have designated the museums complex in Kensington as a Strategic Cultural Area; i.e.
comprising internationally important cultural institutions. South Kensington is home to three
international museums; the Victoria and Albert Museum (V&A), the Natural History Museum and
the Science Museum. These remain the most visited museums by those living within the survey
area, with the V&A being the most popular with a 52% market share; followed by the Natural
History Museum (35%) and the Science Museum (30%).
17.43 Beyond these three world famous museums, residents within the survey area are also choosing to
visit the British Museum in Bloomsbury, the National Gallery in Trafalgar Square, the Royal
Academy on Piccadilly and the Design Museum on Kensington High Street. Museums play a
particularly important role in RBKC, retaining the borough’s position on the world stage in respect
of these visitor attractions; and they should continue to be protected over the plan period.
Cultural/Arts Venues
17.44 The majority of respondents to this question cited ‘Central London’ as their preferred destination
for cultural and arts venues including theatres and art galleries, with a strong market share across
Zones 1-10 (59%). Specifically cited venues include Tate Modern Bankside (24% market share); The
National Gallery, Trafalgar Square (19%); Tate Britain, Millbank (18%); Saatchi Gallery, King’s Road
(5%); The Royal Academy, Piccadilly (4%); Royal Court Theatre, Sloane Square (2%).

Royal Borough of Kensington and Chelsea Retail and Leisure Needs Assessment and Town Centre Study, November 2021
www.urbanshape.co.uk 130
17.45 Theatres and Art Galleries are more limited in number in RBKC when compared to museums. The
main/larger venues include the Saatchi Gallery on King’s Road, the Royal Court Theatre at Sloane
Square, the Serpentine Gallery in Kensington Gardens. This venue type does not form a strong
visitor destination attraction in RBKC, with most located in Central London.
Summary
▪ It is evident from the data that leisure uses will remain a valued and relevant part of our multi-
dimensional town centres in the future. Despite ‘at home’ leisure experiences such as streaming
services growing in popularity, the pandemic has highlighted the need and desire for people to
leave their homes and socialise with friends and family across a range of leisure experiences.
Leisure spend growth forecasts demonstrate the importance of leisure venues and attractions, and
the continued trend to visit and use these facilities moving forwards.
▪ Cafes and evening eating out in restaurants are the two most popular leisure activities for those
living within the survey area. Whilst cafes do not draw people into the borough on their own, the
data demonstrates they perform a key role alongside retail through linked-trips. In every town
centre, aside from Earls Court, they are the second choice of activity after retail shopping,
highlighting their importance to the overall health and vitality of each town centre. There is an
identified need for additional cafes in Earls Court District Centre.
▪ Inflow to RBKC restaurants during the evening is limited, and there is identified leakage of trade to
Central London and to a lesser extent Westfield. Restaurant trade retention during the daytime is
higher due to the linked trip role with retail shops. The presence and performance of cafes and
restaurants throughout the RBKC town centres should be supported and protected given their
important role in contributing to longer dwell times and footfall. Town centre strategies should
continue to prioritise the role and dominance of retail in high streets, but acknowledge the
importance of associated leisure in the form of cafes and restaurants.
▪ All other leisure uses fall within sui generis or Use Class F and can be controlled in policy and
through development control decisions. The analysis concludes there is no need to plan for
additional cinema provision, and highlights the risk of additional competition – particularly in the
north of the borough and proximity to the Gate Picturehouse Notting Hill and Electric Cinema
Portobello Road.
▪ Nightclubs are the least used leisure activity in the borough and have faced numerous challenges in
recent years from evolving leisure habits, leading to their decline. There is no need to plan for
additional provision, and proposals will be market driven and considered against environmental
health and licensing. Museums and cultural arts venues are key to RBKC’s role on the world stage,
driving visitors and tourism at the international scale. These should continue to be protected,
promoted and invested in moving forwards.
Royal Borough of Kensington and Chelsea Retail and Leisure Needs Assessment and Town Centre Study, November 2021
www.urbanshape.co.uk 131
18. Conclusions and Recommendations
18.1 Drawing on previous sections, including both the qualitative and quantitative analysis, this section
sets out the key conclusions and recommendations to take forward into the new Local Plan. We
consider the scope to accommodate new retail and leisure development in the borough, and set
out opportunities for a pro-active development plan policy framework to facilitate sustained long-
term strength in town centre performance.
18.2 The NPPF advises Councils to plan positively to meet needs arising for town centre uses. Policies
should protect and support the vitality and viability of town centres, consider frontages and
boundaries, and allocate a range of suitable sites to meet the scale and type of retail development
needed. As set out in the introduction, this evidence base includes two separate reports which
should be read in conjunction with each other, including the Future Town Centres Report, prepared
by Hatch. This section draws on the Hatch report where relevant to inform the overall conclusions
and recommendations, highlighting potential opportunities for town centre diversification and
their evolution beyond ‘places to shop’.
Conclusions
Policy Framework
18.3 The NPPF advocates a ‘town centres first’ approach, and requires planning policies to positively
promote competitive town centre environments and manage the growth of centres over the plan
period. The NPPF encourages LPA’s to recognise that town centres are the heart of their
communities and to pursue policies which protect their health and vitality.
18.4 The London Plan (2021) aims to build strong and inclusive communities, and emphasises that
development must also promote the crucial role of town centres as places that provide important
opportunities for face-to-face contact and social interaction during the daytime, evening and night-
time. The London Plan encourages the strengthening of the role of town centres, and
acknowledges that the adaptation and diversification of town centres should be supported in
response to changes in technology and consumer behaviour.
18.5 The London Plan also promotes higher density mixed-use or residential development in and on the
edge of town centres – where suitable; and emphasises that tourist infrastructure should be
directed to town centre locations. There are two London Plan Opportunity Areas in RBKC including
Kensal Canalside and Earls Court/West Kensington, both located within the Central/North Sub-Area
defined as part of this assessment. Three town centres within the RBKC hierarchy fall within
Strategic Areas for Regeneration, including Earls Court Road, King’s Road (West) and Portobello
Road.
18.6 The London Plan endorses the application of the sequential and impact test, but – contrary to the
NPPF – also requires an impact assessment on proposals for new, or extensions to existing, edge or
out-of-centre office uses (that are not in accordance with the Development Plan) – in addition to
retail and leisure uses (Policy SD7).

Royal Borough of Kensington and Chelsea Retail and Leisure Needs Assessment and Town Centre Study, November 2021
www.urbanshape.co.uk 132
18.7 The Local Plan emphasises the key attributes and role of the wide variety of cultural, creative and
commercial uses significantly contributing to the capital’s role as a world city. Local plan policy
emphasises the town centres first approach to retail floorspace, and policies set out how the
Council will promote vital and viable town centres across the borough. Policy also aims to secure,
encourage and protect the diversity of uses within town centres. This is driven by the intention to
protect high proportions of Use Class A1 shop floorspace – a policy approach which is now out of
date in light of recent planning reform (see below).
18.8 There are four relevant RBKC SPD’s including the Shopfront Design Guidelines SPD (2011); the Earls
Court and West Kensington Opportunity Area SPD (2012); the Notting Hill SPD (2015); and the
Kensal Canalside Opportunity Area SPD (2021) (the largest brownfield site in RBKC).
Planning Reform
18.9 In force from 1st September 2020, new planning regulations revoked parts A and D of the existing
use classes order and introduced a new ‘commercial, business and service’ Use Class E,
incorporating former A1, A2 and A3 retail uses. Former A4 uses (drinking establishments, public
houses/wine bars) and A5 (hot food takeaway) and D2 cinemas, concert halls/live music venues,
bingo halls and dance halls are now defined as Sui Generis.
18.10 A new permitted development (PD) right to allow the change of use from any use, or mix of uses,
from the Commercial, Business and Service use class (Class E) to residential use (Class C3) came
into force on 1 August 2021. This applies to ‘unused’ buildings that have been vacant for 3 months,
are no larger than 1,500 sq m, and were previously used for at least 2 years for commercial,
business or service use as defined by Use Class E.
National Retail and Town Centre Trends
18.11 The role of town centres as a focus for retail remains relevant in today’s market to draw in
shoppers and footfall. Current thinking and research consistently reports, however, the need to
look beyond the role of retail in order to reinvent the high street, emphasising that the town centre
of the future must add an extra dimension to the retail experience. Covid-19 and new planning
legislation have and will continue to accelerate these trends.
18.12 Away from the high street, the composition and role of out-of-centre retail and retail parks will
almost certainly evolve towards more mixed uses spaces and places as owners seek opportunities
for higher density and mixed-use development – as supported in the London Plan.
18.13 It is apparent that these ‘extra layers/diversity of uses’ are in addition to the core retail role, but
should be closely connected to ensure a joined-up experience within a comprehensive town centre
strategy. Investment in a wider mix of land-uses and public realm/public space improvements will
benefit a consolidated retail offer, leading to improved town centre footfall activity. Short-term
investment projects alongside longer term investment for major projects can have far-reaching
positive benefits to the performance of a town centre.
18.14 Business rates are a challenge for most high street businesses. Retailers across the country argue
that business rates, which are based on the property rather than turnover, are disproportionately
high given the level of rent they pay and their profit margins. Online businesses tend to pay lower
business rates as they often have fewer premises and of those they do utilise, they tend to have
lower rateable values. Bricks and mortar retailers are also often locked into rents that increase

Royal Borough of Kensington and Chelsea Retail and Leisure Needs Assessment and Town Centre Study, November 2021
www.urbanshape.co.uk 133
annually (upwards only leases) and provide no flexibility during difficult trading conditions, though
this is starting to change.
18.15 Many struggling town centres also face a range of other challenges, related to issues like
accessibility, ownership, digital connectivity, diversity, air pollution, affordability, housing and
business support. Austerity and the loss of social infrastructure has also been a major issue over
the last two decades. Town centres have not only lost retailers, but have seen public sector and
third sector services retreat, consolidate or disappear impacting both footfall and vitality. Many
councils have had to cut non-statutory services and have sold buildings that deliver social value on
high streets.
18.16 In London, for example, library spending fell by 12% between 2014 and 2019. Libraries are
important civic buildings that provide shared and inclusive spaces that are free to access.
Investment in infrastructure and the public realm has fallen alongside this which has arguably
made many high streets less social and accessible than in the past.
Sub-Regional Context
18.17 The key sub-regional change since the previous 2008 Study has been the opening of Westfield
White City in October 2008. The data reveals that Central London/West End remains the most
popular shopping destination for those living within the survey area, followed by King’s Road (East),
Westfield White City and Kensington High Street. The absence of Knightsbridge from survey area
market share data demonstrates the centres unique role as an International Centre and
consequent reliance on tourist and visitor trade from further afield.
18.18 Consistent with the 2008 Study, King’s Road and Kensington remain by far the most popular town
centres in the borough, whilst the ranking of ‘other’ town centres beyond the borough has changed
very little since the 2008 Study with Hammersmith, Brent Cross, Kilburn and Clapham Junction
remaining popular choices. Within the borough (Zones 1-3), King’s Road and Kensington have the
strongest market shares – higher than London West End and Westfield.
18.19 An analysis of the Central/North Sub-Area and South Sub-Area town centres concluded that
Kensington High Street and King’s Road have consolidated and increased their market share in their
respective survey zones (2 and 3) since 2008. It is also evident that:
▪ the South Sub-Area town centres combined have been robust, showing a significant market
share increase in Zone 3, and relatively stable market shares across the remainder of the
survey area; and
▪ the Central/North Sub-Area town centres combined have been more vulnerable, and aside
from a significant market share increase in Zone 2, have lost market share in most other
survey zones. Westfield White City has had a significant impact on Zone 1, diverting trade
predominantly from Kensington High Street which has seen a significant market share
reduction in this survey zone.
18.20 RBKC town centres have increased their level of trade retention within Zones 1-3, and the impact
of Westfield White City on shopping patterns within the borough have been considerably less than
initially estimated. RBKC town centres have, however, lost market share in survey zones located
outside of the borough (4-10) with pre-development forecasts of impact concluded to be broadly
correct. The outer survey zones (4/5/6/7/8/9/10) are all well connected to Westfield by

Royal Borough of Kensington and Chelsea Retail and Leisure Needs Assessment and Town Centre Study, November 2021
www.urbanshape.co.uk 134
overground and underground rail routes. Losing market share in areas further afield is also likely to
be a consequence of the post-pandemic ‘shop local’ trend – partly benefitting the RBKC town
centres, but also demonstrating the need for diversity and multi-dimensional town centres to
continue to attract shoppers from further afield.
18.21 The opening of Battersea Power Station next year (2022) as a retail and leisure ‘destination’ has
potential impact implications for the borough, particularly King’s Road East and Knightsbridge. This
should be monitored moving forwards over the plan period and within evidence base updates and
annual monitoring reports where possible. Battersea Power Station is located in survey Zone 7,
just south of the river via Chelsea Bridge and connecting directly to Sloane Square nearby in Zone 3
– a 20 minute walk.
18.22 The objective over the plan period is to continue to enhance market share within the borough, and
to claw-back lost market share further afield from beyond the borough. This strategy should be
underpinned by promoting the diversification of town centres and a continued pro-active strategy
of investment, partnership working and a robust policy framework. This is discussed further
throughout this section within the recommendations.
Socio-Economic and Commercial Borough-Wide Trends
18.23 Hatch reports that over the last four years employment growth across RBKC has just exceeded
wider London averages (7% versus 6% respectively). Several of the boroughs town centres have
seen significantly greater proportional employment growth over the same period, with Brompton
Cross DC (+14%), Notting Hill Gate DC (+17%) and Kensington High Street MC (+43%) all exceeding
the borough and London averages.
18.24 Despite this, over half of RBKC’s centres have seen a fall in employment over the same period with
a further two experiencing static growth (0%). The four town centres that have seen the greatest
proportional decline are Portobello Road SDC (-11%), Earls Court DC (-17%), King’s Road West DC
(-22%) and Westbourne Grove SDC (-25%).
18.25 In terms of number of businesses, there are around 10,670 businesses in total across all of RBKC’s
town centres within a wide range of different uses. The largest in terms of the business number is
Kensington High Street MC (2,776) which accounts for 26% of all town centre businesses in the
borough. There are four town centres with noticeably fewer businesses than the other
comparators which are Earls Court DC (427), Kings Road West DC (360), Westbourne Grove SDC
(350) and Fulham Road West DC (311).
18.26 There is significant disparity in the business start-up rate in each town centre. The centre with the
highest number of start-up businesses in 2020 was Kensington High Street MC where there were
over three times as many new start-ups as the next highest in Portobello Road SDC (392 versus 119
respectively). At the other end of the spectrum, there were only 33 new start-ups in King’s Road
West DC, and Earl’s Court DC and Westbourne Grove SDC each saw only 40 new businesses form.
18.27 Since 2011 it is estimated that the overall population of RBKC has decreased by -2,122 people to
156,130 (-1.3%), which is the opposite of what has occurred across London as a whole which has
seen a population increase of +9.2%.
18.28 In terms of the town centres, just over half have experienced a population increase with South
Kensington DC seeing the greatest proportional increase (+5.6%) followed by Fulham Road West

Royal Borough of Kensington and Chelsea Retail and Leisure Needs Assessment and Town Centre Study, November 2021
www.urbanshape.co.uk 135
DC (+4.9%) and King’s Road West DC (+4.2%). The town centre which had the largest overall
population in 2011, Portobello Road SDC, has experienced a -7% decrease falling behind King’s
Road East MC which in 2019 had the largest overall population. Other centres which have
experienced a significant decline include Westbourne Grove SDC (-7%), Knightsbridge IC (-7%) and
Earls Court DC (-3.4%).
18.29 Occupational profile data illustrates that all RBKC town centres have a greater proportion of
residents employed in higher value occupations when compared to London averages (50.3%).
Fulham Road West DC and South Kensington DC both have over 80% of residents employed in
these occupations which matches with the low level of deprivation within these town centres.
Earls Court DC and Portobello Road SDC have the lowest percentage of residents employed in
these occupations (67% respectively), while also having the highest levels of deprivation.
18.30 The Hatch analysis reports that most of RBKC has low levels of deprivation. Nine of the eleven
centres have no areas that are classified as being within the 20% most deprived in the country.
Fulham Road West DC, Kensington High Street MC, Knightsbridge IC and South Kensington DC also
do not have any areas classified as being within the 50% most deprived in the country.
18.31 There are some significant concentrations of deprivation to the north, however, which
encompasses Portobello Road SDC and parts of the Westbourne Grove SDC; 54% of areas within
the Portobello Road SDC and Earl’s Court DC are classified as being within the 20% most deprived
in the UK. When extended to the top 50% most deprived areas in the UK, 100% of Earl’s Court DC
is classified at this level or below, followed closely by Portobello Road (86%) and Brompton Cross
DC (58%).
Quantitative Need
18.32 The level of borough-wide need for additional comparison goods floorspace is set out in Table 17.1
by total borough and also in Table 17.2 by Central/North Sub-Area and South Sub-Area.
18.33 The figures demonstrate that there is currently no need for additional comparison goods
floorspace over the plan period. The reasons for this are consistent with identified national trends.
Expenditure growth has been hit in the short to medium term as a consequence of Covid-19 and
wider economic uncertainty, SFT is substantially greater through accelerated trends, and the rate
that existing floorspace is absorbing expenditure continues to remain strong (claiming a high
proportion of expenditure growth). More locally, population growth in the borough is substantially
more constrained than elsewhere in the sub-region and London.
18.34 The rate of expenditure growth is not therefore sufficient to substantially override the rate that
existing floorspace is absorbing spend over time, leading to an oversupply of floorspace over the
plan period. The over-supply is not currently substantial, so that doesn’t raise a concern in respect
of the need to lose space, but the strategy must protect existing provision to consolidate and
support healthy town centres over the plan period.
18.35 The absence of ‘need’ does not preclude quality redevelopment coming forward in town centres in
order to enhance and consolidate, and also to replace unwanted vacant space, but it does mean
there is no need to allocate sites on the edge of, or outside town centres to accommodate
additional comparison goods floorspace.

Royal Borough of Kensington and Chelsea Retail and Leisure Needs Assessment and Town Centre Study, November 2021
www.urbanshape.co.uk 136
Table 17.1: RBKC Quantitative Need: Comparison Goods
2026
Sq m net
2031
Sq m net
2036
Sq m net
2041
Sq m net
2043
Sq m net
-413 -2,115 -2,265 -1,691 -1,095
Source: Table 13a, Appendix 2
Table 17.2: RBKC Quantitative Need: Comparison Goods, by Sub-Area
2026
Sq m net
2031
Sq m net
2036
Sq m net
2041
Sq m net
2043
Sq m net
Central/North Sub-
Area -327 -940 -1,058 -940 -776
South Sub-Area 15 -1,115 -1,113 -586 -108
Source: Table 13b and 13c, Appendix 2
18.36 The quantitative analysis does, however, identify a strong level of residual expenditure sufficient to
support additional convenience goods floorspace across the borough. The projections forecast
need for 9,611 sq m net by 2026, 9,335 sq m net by 2031, 9,154 sq m net by 2036, 9,036 sq m net
by 2041, falling marginally to 8,918 sq m net by 2043. It should be noted that projections beyond
2026 should be treated with caution given growing margins of error over longer time periods, and
an ongoing uncertain economy.
Table 17.3: RBKC Quantitative Need: Convenience Goods
2026
Sq m net
2031
Sq m net
2036
Sq m net
2041
Sq m net
2043
Sq m net
9,611
9,335 9,154 9,036
8,918
Source: Table 13a, Appendix 1
Table 17.4: RBKC Quantitative Need: Convenience Goods, by Sub-Area 2026
Sq m net
2031
Sq m net
2036
Sq m net
2041
Sq m net
2043
Sq m net
Central/North Sub-
Area
8,439
8,231 8,094 8,005 7,916
South Sub-Area 1,172 1104 1,061 1,031 1,002
Source: Table 13b and 13c, Appendix 1

Royal Borough of Kensington and Chelsea Retail and Leisure Needs Assessment and Town Centre Study, November 2021
www.urbanshape.co.uk 137
18.37 The high level of convenience goods need is driven almost entirely by the three major food
superstores - Sainsbury’s, Cromwell Road; Sainsbury’s, Canal Way, Ladbroke Grove; and Tesco,
West Cromwell Road. They have high trading levels, exceeding average company expectations.
Sainsbury’s, Cromwell Road and Tesco, West Cromwell Road both obtain most of their turnover
from within the borough despite being located near the boundary. Sainsbury’s, Canal Way, is
located close to the borough boundary in the north, and has a significant inflow of trade from
Zones 4 and 5, from outside the borough.
18.38 The strong performance of these three foodstores is leading to surplus residual expenditure that
could support additional convenience goods floorspace in the borough.
18.39 Our qualitative analysis of the three stores identifies strong performing businesses, but ones that
potentially have capacity to absorb a proportion of identified need within the existing physical
formats; i.e. observed available car parking and short check-out queues. An over-trading store in
quantitative terms does not necessarily lead to the need for additional foodstores when qualitative
factors are also taken into consideration. Nevertheless, the need identified is sufficiently strong to
advise the allocation of new sites to meet the need arising. This should be directed in the first
instance to the network of town centres and the two major growth/regeneration areas in the
borough – Earl’s Court and Kensal Canalside.
Leisure Assessment / Need
18.40 It is evident from the data that leisure uses will remain a valued and relevant part of our multi-
dimensional town centres in the future. Despite ‘at home’ leisure experiences such as streaming
services growing in popularity, the pandemic has highlighted the need and desire for people to
leave their homes and socialise with friends and family across a range of leisure experiences.
Leisure spend growth forecasts demonstrate the importance of leisure venues and attractions, and
the continued trend to visit and use these facilities moving forwards.
18.41 Cafes and evening eating out in restaurants are the two most popular leisure activities for those
living within the survey area. Whilst cafes do not draw people into the borough on their own, the
data demonstrates they perform a key role alongside retail through linked-trips. In every town
centre, aside from Earls Court, they are the second choice of activity after retail shopping,
highlighting their importance to the overall health and vitality of each town centre. There is an
identified need for additional cafes in Earls Court District Centre.
18.42 Inflow to RBKC restaurants (from beyond the borough boundary) during the evening is limited, and
there is identified leakage of trade to Central London and to a lesser extent Westfield. Restaurant
trade retention during the daytime is higher due to the linked trip role with retail shops. The
presence and performance of cafes and restaurants throughout the RBKC town centres should be
supported and protected given their important role in contributing to longer dwell times and
footfall. Town centre strategies should continue to prioritise the role and dominance of retail in
high streets, but acknowledge the importance of associated leisure in the form of cafes and
restaurants.
18.43 All other leisure uses fall within sui generis or Use Class F and can be controlled in policy and
through development control decisions. The analysis concludes there is no need to plan for
additional cinema provision, and highlights the risk of additional competition – particularly in the

Royal Borough of Kensington and Chelsea Retail and Leisure Needs Assessment and Town Centre Study, November 2021
www.urbanshape.co.uk 138
north of the borough and proximity to the Gate Picturehouse Notting Hill and Electric Cinema
Portobello Road.
18.44 Nightclubs are the least used leisure activity in the borough and have faced numerous challenges in
recent years from evolving leisure habits, leading to their decline. There is no need to plan for
additional provision, and proposals will be market driven and considered against environmental
health and licensing. Museums and cultural arts venues are key to RBKC’s role on the world stage,
driving visitors and tourism at the international scale. These should continue to be protected,
promoted and invested in moving forwards.
Recommendations
18.45 In this section, we set out a series of Borough-wide / strategic objectives which the Council may
wish to take forward in the development of policies for its new Local Plan and other future
development plan documents. These are structured around the following key topics:
▪ Borough-wide planning policy recommendations
▪ Accommodating growth
▪ Hierarchy of centres
▪ Town centre boundaries and frontages
▪ Review of existing development management policies
▪ Permitted development and the use of Article 4 Directions
18.46 The accompanying Future Town Centres Report (Hatch) identifies a range of soft, hard and
partnership interventions that could be taken forward into new and up-to-date town centre
strategies, and should be considered alongside planning and policy recommendations set out
below.
Borough-wide Planning Policy Recommendations
RBKC1: Policy and town centre strategies should aim to retain the core retail functions of the
International, Major and District Centres. In the context of the new Use Class E, the Council should
continue to monitor and review regularly the land use composition throughout each town centre.
To ensure an in-depth understanding of role and composition, the updates should go beyond Use
Class E and monitor and record by land use category including comparison goods, convenience
goods, retail service, leisure service, financial and professional uses and vacant units. Drawing on
Experian Goad definitions, the audits should provide a further finer-grained break-down within
each land use category at points in time; including for example cafes, restaurants, fast food
restaurant and public houses within the leisure services category.
This should include maintaining and regularly reviewing shopping frontages and primary shopping
areas and other key town centre uses, venues or facilities in each town centre which contribute to
footfall and overall character/identity. This approach will identify the extent and effectiveness of
each RBCK town centre to evolve and diversify in response to wider town centre trends. Later in

Royal Borough of Kensington and Chelsea Retail and Leisure Needs Assessment and Town Centre Study, November 2021
www.urbanshape.co.uk 139
this section, we review primary shopping area and frontage policies, suggesting amendments which
the Council may wish to consider.
RBKC2: The Council should seek to diversify the role of its town centres. The Council should look
to accommodate an increasing range of uses within the network of town centres, including
community space and facilities and new types of housing, to help improve the sustainability of
town centres in the long term. Policy should discourage the introduction of such uses at the
expense of retail frontage within the defined Primary Shopping Areas, and any applications should
be considered on a case by case basis, underpinned by a robust retail impact assessment.
The consistency of retail frontages should be retained and protected through policy. Sites could
instead include upper floors or well-connected edge-of-centre, for example. There may be
exceptional beneficial circumstances of locating other uses within the primary shopping area retail
frontage, if that use brings particular linked trip, footfall and vibrancy benefits to the town centre.
RBKC3: The Council should provide policy guidance on the upper floors of retail and town centre
shop units, encouraging residential space in vacant and under-used spaces. An Article 4 Direction
(discussed later in this section) should encompass upper floors thereby enabling the Council to
manage conversion to residential where appropriate whilst ensuring the protection of upper floors
for storage areas associated with the viability of ground floor retail/leisure businesses. Within the
framework of an Article 4 Direction, planning applications for change of use from Use Class E
commercial to residential should be accompanied with details of storage space and associated
viability of the retail unit at ground floor level.
RBKC4: The Council should support the delivery of redeveloped or refurbished space for
consolidation of the retail and leisure offer and wider diversification of town centre uses. The
Council should work with developers/landlords to bring forward sites and spaces that could be
used to intensify the economic function of town centres. This includes a wide range of space that
can be used to support the future economic evolution of RBCK’s town centres, including retail and
leisure; community, religious, health and education; and more general employment space and
workspace (including SME workspaces, artists spaces and maker spaces). Town centre strategies
should encourage diversification alongside support for ground floor shop frontages to underpin and
future proof the vitality and viability of town centres.
RBKC5: The identification of sites to meet the retail and commercial leisure floorspace ‘need’
should be subject to the sequential test. In accordance with the approach set out in the NPPF
(paragraphs 87-88), floorspace should be directed towards the Council’s network of International,
Major and District centres in the first instance, followed by proposed town centre/place-making
site allocations at Kensal Canalside and Earls Court, and then appropriate and well-connected edge-
of-centre sites.
Based on the evidence presented, there is no requirement to allocate sites outside of the network
of town centres for comparison or leisure floorspace, but the Council should allocate sites to meet
forecast convenience goods need over the plan period. This should be directed to the network of
town centres and the two major Opportunity Areas at Kensal Canalside and Earls Court in the first
instance. Any surplus need beyond this will be accommodated by vacant town centre floorspace
and the existing network of town centre and out-of-centre foodstores. These foodstores have
Royal Borough of Kensington and Chelsea Retail and Leisure Needs Assessment and Town Centre Study, November 2021
www.urbanshape.co.uk 140
been identified as economically over-trading, but are not ‘over-capacity’ in qualitative terms,
demonstrating the ability to absorb additional shoppers and spend.
RBKC6: The Council should explore options for the intensification of out-of-centre retail sites
including large format supermarkets. Reflecting the requirements of London Plan Policy SD7, Local
Plan policy, through the new Local Plan, should recognise the potential of these locations to deliver
housing intensification through redevelopment, ensuring these locations become more sustainable
in transport terms. The consideration of opportunity to realise the full potential of such sites
should be encouraged in policy.
The importance of the retail floorspace and its contribution to meeting shopping needs should be
fully considered as part of any redevelopment proposals. Given the need for convenience goods
floorspace, proposals which involve the redevelopment of sites containing existing supermarkets
should ensure that any site redevelopment incorporates replacement convenience goods
floorspace of a comparable size (in terms of net sales area) to that which is being lost. This is to
ensure the needs of existing and future residents are met.
RBKC7: Policy should endorse the sequential and impact test. Planning applications for the
development of retail, commercial leisure and other ‘main town centre uses’ (as defined by the
NPPF) which are not within a defined centre will need to demonstrate compliance with the
sequential and impact ‘tests’ set out at paragraphs 87-91 of the NPPF (2021).
Local authorities should be proactive in presenting sites to developers as potential town centre
development opportunities, which could include vacant units. The Council should work closely and
pro-actively with applicants to identify sequentially preferable sites which should be considered
through the sequential test. Where an application fails to satisfy the sequential test or is likely to
have significant adverse impact on one or more of the considerations in paragraph 90, it should be
refused.
RBKC8: The quantitative retail and commercial leisure needs identified in this study should be
subject to regular review throughout the Council’s Local Plan period. We advise that quantitative
forecasts beyond 2026 are considered indicative because key inputs into the quantitative need
assessment such as population, rates of online shopping and expenditure growth will invariably
change. Expenditure forecasts are particularly susceptible to change as the implications of Brexit
and the Covid-19 pandemic are realised over time. Alongside this, patterns of shopping will
continue to evolve, both as technologies change, and residents of the Borough respond to new
retail and leisure developments planned both inside outside the Borough, particularly at Battersea
Power Station (2022).
RBKC9: In response to London Plan Policy HC6, the Council should consider a Night-Time Economy
Strategy for the Borough. The night-time economy is becoming increasingly important to London’s
economy, with continued momentum to promote London as a 24-hour global city. However, it is
recognised that 24-hour activities are not suitable for every part of London, and boroughs should
balance the needs of local residents in all parts of London with the economic benefits of promoting
a night-time economy.
The nature of many night time economy uses (e.g. late night bars, clubs, and associated uses such
as takeaways and late night fast-food outlets) means that it is particularly important for a joined-up
approach to the development of a strategy, including planning, licencing, culture, regeneration,

Royal Borough of Kensington and Chelsea Retail and Leisure Needs Assessment and Town Centre Study, November 2021
www.urbanshape.co.uk 141
cleansing services and community safety. The borough is advised to work closely with stakeholders
such as neighbouring boroughs, the police, local businesses, patrons, workers and residents.
Applications for new Night Time Economy Uses (6pm-6am operational) should be directed to the
larger town centres of Knightsbridge, Kensington High Street, King’s Road (East) and South
Kensington in the first instance – in accordance with their current roles and London Plan
hierarchy/strategic areas of such activity. Applications for development elsewhere in the Borough
should be considered on individual merits, with particular consideration to amenity and safety.
Accommodating Future Growth
18.47 A review of potential development opportunity sites in RBKC has been undertaken throughout this
assessment. As concluded above, there is no need for additional comparison floorspace in the
borough over the plan period, but any such development within the existing network of town
centres should be supported and encouraged within the policy framework. This might be a
redevelopment of existing space – as currently evidenced throughout many of the RBKC town
centres – and lead to positive investment and an enhanced and consolidated retail and leisure
offer.
18.48 Town centre redevelopment proposals to include ground floor retail/leisure within the Primary
Shopping Area should be encouraged subject to the wider policy framework. There are a number
of good examples of high street frontage redevelopment sites currently under construction or
recently completed, which include retail at ground floor and residential/offices on the upper floors.
These are set out in the health check chapters and include K1 Knightsbridge, The Kensington
Building Kensington High Street, and 101-106 and 165-181 Kensington High Street.
RBKC10: There is no need to allocate sites outside town centres for comparison or leisure
floorspace over the plan period. This should be kept under review, particularly beyond the first 5
year period to 2026.
18.49 There is, however, an identified need for additional convenience goods floorspace over the plan
period, and this should be directed to the main town centres and the Earls Court/West Kensington
and Kensal Canalside Opportunity Areas in the first instance. Given the growth and place-making
policy aspirations, equal weight should be given to the town centres and these two major
Opportunity Areas when planning for additional convenience goods floorspace. Elsewhere in the
borough, any proposals for new convenience goods floorspace that meets the key policy tests and
supports stronger and inclusive communities, should be supported. Smaller scale foodstores are
recommended to ensure sustainable shopping patterns across the borough.
RBKC11: Set out preferred locations and sites to meet the convenience goods need arising focusing
on the network of town centres and Opportunity Areas in the first instance.
18.50 Development Opportunity Sites currently allocated in the RBKC development plan and RBKC
supplement planning documents are as follows:
▪ Strategic Site Allocation CA4 – Earls Court Exhibition Site, Opportunity Area;
▪ Strategic Site Allocation CA5 – South Kensington District Centre;
▪ Strategic Site Allocation CA9 – Chelsea Farmers Market, King’s Road (East) Major Centre;
▪ Site Opportunity 1, Notting Hill SPD – Newcombe House, Notting Hill District Centre;

Royal Borough of Kensington and Chelsea Retail and Leisure Needs Assessment and Town Centre Study, November 2021
www.urbanshape.co.uk 142
▪ Site Opportunity 2, Notting Hill SPD – Astley House, Notting Hill District Centre;
▪ Site Opportunity 3, Notting Hill SPD – The Gate Cinema Block, Notting Hill District Centre;
▪ Site Opportunity 4, Notting Hill SPD – West Block, Notting Hill District Centre.
18.51 Alongside Knightsbridge, Kensington High Street and King’s Road (East), Notting Hill Gate District
Centre has the greatest opportunity for commercial growth and development when considering
the network of town centres.
18.52 Kensal Canalside and Earls Court/West Kensington are the two major Opportunity Areas in RBKC
with policy supporting the creation of mixed-use sustainable development and supporting place-
making facilities and services. Despite there being no need for additional comparison floorspace
based on existing market shares and the current status quo, ancillary retail and leisure uses should
be supported in accordance with the London Plan ‘good growth’ concept. This will ensure socially
and economically inclusive growth, creating stronger communities and increasing active
participation.
RBKC12: Allocate strategic town and edge-of-centre sites for mixed-use and retail/leisure
development, and also the Kensal Canalside and Earls Court/West Kensington Opportunity Areas to
meet the forecast need for convenience goods.
18.53 The scale of retail and leisure floorspace within these two regeneration areas should be
appropriate to the scale of residential and commercial development on-site, meeting needs arising
rather than creating ‘destination’ retailing. Proposals for development must demonstrate that the
retail and leisure floorspace is necessary to support the wider development and ancillary to the
wider mix of uses and not rely on inflow or the diversion of trade from elsewhere – including
nearby town centres. A larger scale of comparison goods or leisure floorspace is not supported
within this evidence base.
RBKC13: Ensure scale of new development in Opportunity Areas are appropriate to the
communities they are intended to serve in accordance with the London Plan Good Growth
concept.
Hierarchy of Town Centres
18.54 The current hierarchy of town centres in the Borough, as set out in the Local Plan, is summarised
below. Knightsbridge and Westbourne Grove overlap with Westminster City Council, and the
respective health checks have focused of those areas falling within RBKC:
▪ International Centre: Knightsbridge;
▪ Major Centres: King’s Road (East) and Kensington High Street;
▪ District Centres: South Kensington, King’s Road (West), Notting Hill Gate, Fulham
Road (West), Brompton Cross and Earl’s Court Road;
▪ Special District Centres: Portobello Road and Westbourne Grove.
18.55 Based on our assessment, we do not consider there to be a policy case for any change to the
Borough’s hierarchy of town centres at the present time. They are all performing a role and
function in line with Development Plan definitions and aspirations. To inform this appraisal, the in-
depth health check analysis and quantitative assessment has considered the London Plan policy

Royal Borough of Kensington and Chelsea Retail and Leisure Needs Assessment and Town Centre Study, November 2021
www.urbanshape.co.uk 143
role, scale, number of operators, retailer representation and status of multiple retailers, evening
economy and cultural attractions, turnover and sales density, and sub-regional / national / and
international role.
18.56 There is also no evidence to suggest that any of the centres should be de-designated from the
Borough’s hierarchy of centres. The town centre hierarchy is appropriate and relevant for the new
Local Plan and town centre strategies should be developed according to their role.
RBCK14: Retain the existing hierarchy of town centres.
Town Centre Boundaries and Frontages
18.57 The NPPF directs local planning authorities to define the extent of town centres and primary
shopping areas, and make clear the range of uses permitted in such locations, as part of a
positive strategy for the future of each centre.
18.58 The Planning Practice Guidance (PPG) emphasises that whilst the NPPF has removed reference to
primary and secondary shopping ‘frontages’, authorities may, where appropriate, wish to define
primary and secondary retail frontages where their use can be justified in supporting the vitality
and viability of particular centres. These frontage allocations would, combined, form the Primary
Shopping Areas.
18.59 We draw attention to the following definitions set out at Annex 2 of the NPPF (2021), which now
excludes reference to primary and secondary shopping frontages:
Town centre – Area defined on the local authority’s policies map, including the primary shopping area and areas predominantly occupied by main town centre uses within or adjacent to the primary shopping area. References to town centres or centres apply to city centres, town centres, district centres and local centres but exclude small parades of shops of purely neighbourhood significance.
Primary Shopping Area – ‘Defined area where retail development is concentrated’. (The Primary Shopping Area is the relevant boundary when considering the retail sequential site and impact assessment. Edge and out-of-centre is measured from the boundary of the Primary Shopping Area).
Edge of centre: For retail purposes, a location that is well connected to, and up to 300 metres from, the primary shopping area. [For all other main town centre uses, a location within 300 metres of a town centre boundary. For office development, this includes locations outside the town centre but within 500 metres of a public transport interchange. In determining whether a site falls within the definition of edge of centre, account should be taken of local circumstances.]
18.60 Previous versions of the NPPF provided definitions of primary and secondary shopping frontages –
‘Primary frontages are likely to include a high proportion of retail uses which may include food,
drinks, clothing and household goods. Secondary frontages provide greater opportunities for a
diversity of uses such as restaurants, cinemas and businesses.’ As noted above, the PPG confirms
that local authorities may continue to use these frontage allocations if it is justified in supporting
the vitality and viability of particular centres. Previous versions of the NPPF confirm that Primary
and Secondary Shopping Frontages (combined) form a Primary Shopping Area.

Royal Borough of Kensington and Chelsea Retail and Leisure Needs Assessment and Town Centre Study, November 2021
www.urbanshape.co.uk 144
18.61 The Council’s current Policies Map allocates defined town centre boundaries for each of the
International, Major, District and Special District Centres. Chapter 30 of the Local Plan includes
maps illustrating Primary and Secondary Shopping Frontages, confirming the location and
boundary of each respective Primary Shopping Area. These reflect the defined town centre
boundaries on the proposals map. The proposals map or town centre inset maps should clearly
state ‘Primary Shopping Area’ in addition to ‘town centre boundary’ in order to ensure clarity for
the purposes of the retail sequential site and impact assessments. This is particularly the case for
‘other’ town centre uses.
RBKC15: Clarify and clearly illustrate the allocation and definition of Primary Shopping Areas and
Town Centre Boundaries – use both definitions if the boundary is the same. It is recommended
that policy wording is consistent with the NPPF to ensure clarity when agreeing the scope of an
impact and sequential site assessment for all town centre uses which have different distance
thresholds for testing.
18.62 In respect of each of the individual town centres, we make the following observations for town
centre boundary changes which the Council may wish to consider:
▪ Kensington High Street – incorporate the Design Museum into the town centre boundary as
a key town centre use and contributor to town centre footfall and vitality;
▪ Earls Court Road – extend to include units on south side of Earls Court Gardens,
and extend to include south side of Kenway Road to the junction with Cromwell
Road – both offering concentrations of retail frontage;
▪ Portobello Road – extend to include Portobello Green Arcade and Westway
Leisure Centre in the north of the town centre;
▪ Brompton Cross – extend to include Chelsea Cloisters and Sainsbury’s Local on
Sloane Avenue;
▪ South Kensington – extend to include north side of Harrington Road, including the
library, hotel, bank and social club.
RBKC16: Review and consider amending town centre boundaries in the context of the
recommendations above.
18.63 Chapter 30 of the Local Plan illustrates Primary Shopping Frontages and Secondary Shopping
Frontages using a series of town centre inset maps. We recommend these are retained to control
land uses as far as is possible within the newly revised Use Classes Order.
RBKC17: Retain existing Primary and Secondary Shopping Frontages.
Review of Existing Development Management Policies
18.64 The Council’s existing approach to protect and enhance the vitality and viability of town centres is
set out in Policies CF1, CF2, CF3 and CF4, detailed in Section 2 of this report.
18.65 Policy CF1 seeks to support the town centres first approach. The policy seeks to locate new shop
floorspace in town centres whilst also supporting new floorspace in areas of retail deficiency. This
approach should be endorsed in the new Local Plan, and the Council could consider further
borough wide analysis to set this within the 15 minute neighbourhoods concept. Part D of Policy

Royal Borough of Kensington and Chelsea Retail and Leisure Needs Assessment and Town Centre Study, November 2021
www.urbanshape.co.uk 145
CF1 – supporting the establishment of new centres in the two key Opportunity Areas – remains
relevant, and, based on the evidence presented, policy should retain the scale and day-to-day
needs requirements as set out in the current policy.
18.66 Land uses within Policy CF1 should be broadened to apply to the ‘Location of New Town Centre
Uses’, to ensure all such applications are compliant with the key policy tests. The NPPF Glossary
defines the full list of ‘Main Town Centre Uses’ as follows:
Main town centre uses: Retail development (including warehouse clubs and factory outlet centres); leisure, entertainment and more intensive sport and recreation uses (including cinemas, restaurants, drive-through restaurants, bars and pubs, nightclubs, casinos, health and fitness centres, indoor bowling centres and bingo halls); offices; and arts, culture and tourism development (including theatres, museums, galleries and concert halls, hotels and conference facilities).
18.67 Policy CF1 should be updated to ensure the correct policy tests (sequential and impact) are
correctly applied to the different town centre uses. Policy SD7 of the London Plan, for example,
now requires office proposals to comply with the impact test, and we recommend this is enforced
within a revised Policy CF1.

Royal Borough of Kensington and Chelsea Retail and Leisure Needs Assessment and Town Centre Study, November 2021
www.urbanshape.co.uk 146
18.68 Policy CF1 should confirm and enforce a retail impact threshold, ensuring that edge and out-of-
centre retail development proposals are required to undertake a full and detailed retail impact
assessment for schemes at or above 400 sq m gross.
18.69 Policy CF2 directs new retail development into town centres in order to reinforce and enhance
their vitality and viability, and prevents the amalgamation of units. Within the new Use Class E
category it is important to reinforce the continued importance of retail and leisure uses to the
overall vitality and viability of town centres. This should continue to underpin town centre
strategies and the roles within the borough-wide town centre and retail hierarchy.
18.70 Policy CF2 should be broadened to include leisure uses. New retail and leisure development should
continue to be encouraged across the network of town centres as a key driver of footfall. New
retail, leisure and mixed use town centre development can be controlled through conditions to
ensure ground floor occupancy is restricted to specific land uses within the retail and leisure
categories.
18.71 Policy CF3, Diversity of Uses within Town Centres, is now out-of-date in the context of planning
reform and the introduction of Use Class E. The overall objective to protect land uses and
encourage diversity remains relevant, but the specific approach and wording will require
amendment in the new Local Plan.
18.72 Part C protects shop uses at ground floor level. This policy position should be enforced in the new
Local Plan, ensuring new and redevelopment of space includes ground floor retail / leisure
floorspace within the retail frontage. New planning permissions should be conditioned accordingly
by land use category/description, not general Use Class.

Royal Borough of Kensington and Chelsea Retail and Leisure Needs Assessment and Town Centre Study, November 2021
www.urbanshape.co.uk 147
18.73 We recommend the Council retain the Primary Shopping Area, Primary Shopping Frontage and
Secondary Shopping Frontage as existing and referenced in Policy CF3. Whilst it is not possible to
enforce a specific land use within Use Class E, town centre strategies should make clear that retail
and leisure uses are encouraged and prioritised at ground floor level within Primary and Secondary
Shopping Frontages. Those uses should remain central to a town centre strategy and function of a
Primary Shopping Area. The Council should work closely with developers and landlords to retain
these land uses in ground floor frontages.
18.74 In terms of ‘change of use’, policy should prevent non Use Class E within the Primary Shopping
Frontage and prevent any change of use to alternative uses, including those in sui generis use. Use
Class E includes:
▪ Use Class E Shops (former A1)
▪ Provision of financial and professional services (former A2)
▪ Sale of food and drink consumption on premises, ‘cafes and restaurants’ (former A3)

Royal Borough of Kensington and Chelsea Retail and Leisure Needs Assessment and Town Centre Study, November 2021
www.urbanshape.co.uk 148
▪ Indoor sport, recreation, fitness (gyms) (former D2)
▪ Provision of medical or health services (former D1)
▪ Creche, day nursery or day centre (former D1)
▪ Offices, research and development, light industrial (former B1a, b and c)
18.75 Sui Generis uses that should be restricted in a Primary Shopping Frontage and considered on a case
by case basis include:
▪ Amusement arcades and casinos;
▪ Nightclubs;
▪ Betting offices/shops;
▪ Pay day loan shops;
▪ Public houses, wine bars or drinking establishments;
▪ Hot food take-aways.
18.76 Policy should prevent non Use Class E within the Secondary Shopping Frontage, but note that the
introduction of former Use Class A4 (public houses, wine bars or drinking establishments) might be
appropriate. Change of use to these former Use Class A4 (drinking establishments) should be
considered on a case by case basis and on the merits of each respective planning application. This
land use should form part of a wider Evening Economy Strategy - an over proliferation should be
avoided and other issues considered, such as noise and safety (see Recommendation RBKC9
above).
18.77 Part C of Policy CF3 should be widened to protect shop uses above or below ground floor level
within town centres unless it is successfully demonstrated that their loss will not adversely impact
required operational storage space, leading to an unviable or unlettable shop unit. It is crucial that
retail and leisure businesses can retain and secure the necessary storage areas to make their
businesses viable.
18.78 Policy CF3 should support flexibility and the temporary or ‘meanwhile’ uses of vacant properties.
The term ‘meanwhile use’ refers to the short-term use of temporarily empty buildings, including
shops until they can be brought back into commercial use. Such innovative action provides an
opportunity to help keep a town centre vibrant, whilst the landlord is able to continue to look for a
new commercial occupant for the space during the meanwhile use. Meanwhile uses are generally
for the benefit of the local community, for example; meeting spaces, informal training
and learning spaces, temporary rehearsal spaces, pop-up shops and exhibitions, and so on. They
can offer a breeding ground for innovative ideas and empower the local community, lasting just a
few days or several years. Policy should encourage this mechanism within the RBKC town centres.
18.79 The NPPF encourages local authorities to retain and enhance existing markets; and in this context
Policy CS4 should be retained. The policy wording remains relevant and should be retained. The
health checks and town centre analysis demonstrates the continued importance of markets to the
overall vitality and viability of town centres, attracting local customers through to international
visitors. RBKC have a number of famous and well known markets that continue to attract visitors
into the borough, and these should be supported and protected.

Royal Borough of Kensington and Chelsea Retail and Leisure Needs Assessment and Town Centre Study, November 2021
www.urbanshape.co.uk 149
Permitted Development and the Use of Article 4 Directions
18.80 Retail continues to remain a vitally important footfall driver in centres, and continues to be the
main reason that people are visiting the centres. A retail offer which mixes representation from
national multiple retailers which act as ‘anchors’ and specialist independents which provide
diversity is important to attracting footfall, and we expect this to continue over the course of the
Council’s new Local Plan period.
18.81 At the national level, whilst town centres are undoubtedly going through a period of transition,
successful centres continue to be supported by retail. The continued importance of retailing in
underpinning the vitality and viability of the Borough’s network of centres is also borne out by the
findings of the household telephone survey undertaken in support of the study. In total, RBKC’s
network of international, major and district centres attract £1.34 billion of comparison goods retail
expenditure into the borough – excluding any gross value. These figures confirm the vital role
which retail plays in supporting the overall health of the Borough’s town centres.
18.82 If there was a significant shift away from ‘shop’ retail in RBKC’s main town centres, the reasons for
visiting the centre would fall and potentially erode footfall, dwell time, frequency of visit, and
turnover, with potential implications for the wider vitality and viability of centres. Ground floor
retail and shops in town centres should therefore be protected.
Permitted Development Rights
18.83 A new permitted development (PD) right to allow the change of use from any use, or mix of uses,
from the Commercial, Business and Service use class (Class E) to residential use (Class C3) came
into force on 1 August 2021. In town centres, retail shops can change use to residential use
without the need for planning permission. This applies to ‘unused’ buildings that have been vacant
for 3 months, are not larger than 1,500 sq m, and were previously used for at least 2 years for
commercial, business or service use. This new permitted development could dilute retail frontages
and erode the overall vitality and viability of a town centre.
Article 4 Directions
18.84 Councils have the power to remove national permitted development rights under what is known as
an ‘Article 4 Direction’. Paragraph 53 of the NPPF confirms that, when related to change from non-
residential commercial use (Use Class E) to residential use (Use Class C3), the use of an Article 4
Direction should be limited to situations where it is necessary to avoid wholly unacceptable
adverse impacts; including the loss of the essential core of a primary shopping area which would
seriously undermine its vitality and viability.

Royal Borough of Kensington and Chelsea Retail and Leisure Needs Assessment and Town Centre Study, November 2021
www.urbanshape.co.uk 150
18.85 Whilst this study has demonstrated that the Borough’s network of centres are currently healthy,
there is a need to ensure they remain strong centres which meet a full range of local residents’
day-to-day shopping, and, in the case of the higher order town centres, more specialist shopping.
The vitality and viability of centres is dependent on providing a critical mass of quality, footfall-
generating retail and leisure uses, and the application of appropriate Article 4 directions will ensure
that the Borough’s network of centres continue to function as healthy centres over the new Plan
period.
RBKC18: Introduce an Article 4 Direction across all RBKC town centres to prevent permitted change
of use from Use Class E to Use Class C3 (dwelling-house), to protect the thriving core of the high
street.
Monitoring
18.86 As advised in the NPPF, it is recommended that the Council should update its retail evidence base
at frequent intervals throughout the Local Plan period to 2043, as new information on the
economy, population growth, expenditure growth and ‘special forms of trading’ becomes available.
The need to update should be reviewed every 5 years and implemented if needed at that point
(NPPF, para.33). Updates to retail capacity forecasts will also be required once new floorspace
comes forward at Battersea Power Station, in order to assess the implications that this
development might have on the network of town centres.

Appendix 1 Convenience Goods Need Forecasts

Kensington & Chelsea Retail and Leisure Needs Assessment 2021Convenience Goods Need Forecasts
Table 1: Survey Area Postcode Composition
Zone Postcode Sectors
Zone 1 NW10 5; W10 5/6; W11 1/2/4
Zone 2 SW5 0/9; SW7 4/5; W2 4; W8 4/5/6/7; W11 3; W14 8
Zone 3 SW7 2/3; SW10 0; SW3 1/2/3/4/5/6; SW10 9; SW1W 8; SW1X 0/9
Zone 4 NW2 4/5/6; NW6 7; NW10 1/2/3/9
Zone 5 NW6 5/6; W2 5/6; W9 1/2/3; W10 4
Zone 6SW7 1; SW1A 1; SW1E 5/6; SW1H 0/9; SW1P 1/2/4; SW1V 1/2/3/4/0; SW1W 9; SW1X 7/8; W2
2/3; W1H 5/7; W1J 6/7/8; W1K 1/2/6/7; W1S 4
Zone 7 SW8 3/4/5; SW18 1/2; SW11 1/2/3/4/5; SW15 2
Zone 8 SW6 1/2/3/4/5/6/7
Zone 9 W6 0/7/8/9; W12 8/9; W14 0/9
Zone 10 NW10 4/6/8; W3 7; W12 0/7

Kensington & Chelsea Retail and Leisure Needs Assessment 2021Convenience Goods Need Forecasts
Table 2: Survey Area Population Forecasts
Zone 1 Zone 2 Zone 3 Zone 4 Zone 5 Zone 6 Zone 7 Zone 8 Zone 9 Zone 10
2021 64,305 73,245 61,288 85,243 93,533 80,910 117,322 70,617 83,784 74,464
2026 64,383 73,236 61,600 86,465 97,123 84,210 120,267 72,497 85,734 75,680
2031 64,757 73,322 61,841 87,407 99,835 86,426 122,000 73,643 87,324 76,921
2036 65,417 73,722 62,282 88,473 102,548 88,319 124,455 74,986 88,717 78,277
2041 65,934 73,965 62,623 89,477 105,261 90,374 126,549 76,231 90,209 79,576
2043 66,141 74,062 62,759 89,879 106,346 91,195 127,387 76,728 90,805 80,095
Total 390,937 441,552 372,393 526,944 604,645 521,434 737,980 444,702 526,573 465,012
Change 2021-2026 78 -9 312 1,222 3,590 3,300 2,945 1,880 1,950 1,216
Change 2026-2031 374 86 241 942 2,712 2,216 1,733 1,146 1,590 1,241
Change 2031-2036 660 400 441 1,066 2,713 1,893 2,455 1,343 1,393 1,356
Change 2036-2041 517 243 341 1,004 2,713 2,055 2,094 1,245 1,492 1,299
TOTAL Change 2021-2043 1,836 817 1,471 4,636 12,813 10,285 10,065 6,111 7,021 5,631

Kensington & Chelsea Retail and Leisure Needs Assessment 2021Convenience Goods Need Forecasts
Table 3: Survey Area per Capita Expenditure Forecasts
Expenditure per
Capita (£)SFT (%) SFT (£)
Expenditure per
capita
less SFT
2021 2,637 6.3% 166 2,470
2026 2,642 5.7% 151 2,491
2031 2,652 6.2% 164 2,488
2036 2,666 6.8% 181 2,484
2041 2,679 7.1% 190 2,489
2043 2,684 7.4% 199 2,486
Expenditure growth rates: 2020: 8.4%; 2021: -6.2%; 2022: 0.2%; 2023-2027: 0.0%; 2028-2040: 0.1%
Source: Experian E-Marketer. Expenditure growth rates and allowance for SFT are sourced from Experian Retail Planner 18 (October 2020). Price Base: 2019

Kensington & Chelsea Retail and Leisure Needs Assessment 2021Convenience Goods Need Forecasts
Table 4 - Survey Area Convenience Goods Expenditure
Zone 1 Zone 2 Zone 3 Zone 4 Zone 5 Zone 6 Zone 7 Zone 8 Zone 9 Zone 10 Total
(£m) (£m) (£m) (£m) (£m) (£m) (£m) (£m) (£m) (£m) (£m)
2021 158.9 180.9 151.4 210.6 231.1 199.9 289.8 174.5 207.0 184.0 1,988.0
2026 160.4 182.4 153.5 215.4 242.0 209.8 299.6 180.6 213.6 188.5 2,045.8
2031 161.1 182.4 153.9 217.5 248.4 215.0 303.5 183.2 217.3 191.4 2,073.6
2036 162.5 183.2 154.7 219.8 254.8 219.4 309.2 186.3 220.4 194.5 2,104.8
2041 164.1 184.1 155.9 222.7 262.0 224.9 315.0 189.7 224.5 198.0 2,140.9
2043 164.4 184.1 156.0 223.4 264.3 226.7 316.7 190.7 225.7 199.1 2,151.2
Change 2021-43 (£m) 5.5 3.2 4.6 12.8 33.3 26.8 26.8 16.3 18.7 15.1 163.2
Change 2021-2043 (%) 3.5 1.7 3.0 6.1 14.4 13.4 9.3 9.3 9.1 8.2 8.2
Source: Tables 2 and 3

Kensington & Chelsea Retail and Leisure Needs Assessment 2021Convenience Goods Need Forecasts
Table 5 - Convenience Goods Allocation - % Market Share (2021)
Survey
Location
Zone
Zone 1
%
Zone 2
%
Zone 3
%
Zone 4
%
Zone 5
%
Zone 6
%
Zone 7
%
Zone 8
%
Zone 9
%
Zone 10
%
Destinations for Convenience Goods in Kensington & Chelsea Borough
South Sub-Area (See Note A)
Major Centres
3 M&S, King's Road (East) Major Centre 0.0% 0.0% 8.6% 0.0% 0.0% 0.3% 1.5% 0.3% 0.8% 0.0%
3 Waitrose, King's Road (East) Major Centre 0.0% 0.0% 27.5% 0.0% 0.0% 0.7% 2.6% 0.4% 0.0% 0.0%
3 Local Shops, King's Road (East) Major Centre 0.0% 0.0% 0.9% 0.0% 0.0% 0.0% 0.0% 0.0% 0.0% 0.0%
District Centres
3 Londis, King's Road (West) District Centre 0.0% 0.0% 0.3% 0.0% 0.0% 0.0% 0.0% 0.0% 0.0% 0.0%
3 M&S Simply Food, Fulham Road (West) District Centre 0.0% 0.0% 2.4% 0.0% 1.9% 0.0% 0.1% 0.1% 0.0% 0.0%
3 Sainsbury's Local, Fulham Road (West) District Centre 0.0% 0.0% 3.4% 0.0% 0.0% 0.0% 0.0% 1.0% 0.0% 0.0%
3 Tesco Express, Fulham Road (West) District Centre 0.0% 0.0% 0.5% 0.0% 0.0% 0.0% 0.2% 2.6% 0.7% 0.0%
3 Local Shops, Fulham Road (West) District Centre 0.0% 0.0% 0.9% 0.0% 0.0% 0.0% 0.0% 0.0% 0.0% 0.0%
3 Tesco Express, Old Brompton Road, South Kensington District Centre 0.0% 0.2% 1.0% 0.0% 0.0% 0.0% 0.0% 0.0% 0.0% 0.0%
3 Waitrose (Little), Old Brompton Road, South Kensington District Centre 0.0% 0.0% 0.8% 0.0% 0.1% 0.0% 0.0% 0.4% 0.0% 0.0%
Sub-Total 0.0% 0.2% 46.3% 0.0% 2.0% 1.0% 4.5% 4.8% 1.6% 0.0%
Central and North Sub Area (See Note A)
Major Centres
2 M&S, Kensington High Street Major Centre 0.5% 4.9% 0.3% 0.0% 1.2% 0.3% 0.0% 0.1% 1.9% 0.0%
2 Sainsbury's Local, Kensington High Street Major Centre 0.0% 1.6% 0.0% 0.0% 0.0% 0.0% 0.0% 0.0% 0.0% 0.0%
2 Waitrose, Kensington High Street Major Centre 0.3% 10.5% 0.1% 0.0% 0.0% 0.0% 0.0% 0.0% 3.4% 0.0%
2 Whole Foods, Kensington High Street Major Centre 1.7% 3.9% 0.2% 2.3% 0.2% 0.0% 0.0% 0.0% 0.1% 0.0%
2 Local Shops, Kensington High Street Major Centre 0.0% 1.1% 0.0% 0.0% 0.0% 0.0% 0.0% 0.0% 0.2% 0.0%
District Centres
2 M&S, Notting Hill Gate District Centre 0.7% 5.1% 0.0% 0.0% 0.3% 0.0% 0.0% 0.0% 0.0% 0.0%
2 Tesco Metro, Notting Hill Gate District Centre 2.5% 5.2% 0.0% 0.0% 0.0% 0.2% 0.0% 0.0% 0.0% 0.0%
2 Waitrose (Little), Notting Hill Gate District Centre 0.8% 0.5% 0.0% 0.0% 0.1% 0.7% 0.0% 0.0% 0.0% 0.0%
1 Sainsbury's Local, Portobello Road District Centre 3.8% 0.2% 0.0% 0.0% 0.1% 0.0% 0.0% 0.0% 0.0% 0.0%
1 Tesco Metro, Portobello Road District Centre 10.4% 0.0% 0.0% 0.0% 0.0% 0.0% 0.0% 0.0% 0.0% 0.0%
1 Portobello Market, Portobello Road District Centre 2.9% 0.3% 0.0% 0.1% 1.4% 0.0% 0.0% 0.0% 0.0% 0.0%
1 Local Shops, Portobello Road District Centre 0.3% 0.0% 0.0% 0.0% 0.0% 0.0% 0.0% 0.0% 0.0% 0.0%
2 M&S, Earls Court Road District Centre 0.0% 2.6% 0.5% 0.0% 0.0% 0.0% 0.0% 0.0% 0.0% 0.0%
2 Sainsbury's Local, Earls Court Road District Centre 0.0% 1.4% 0.2% 0.0% 0.0% 0.0% 0.0% 0.0% 0.7% 0.0%
1 Local Shops, Westbourne Grove District Centre 0.0% 0.3% 0.0% 0.0% 0.2% 0.0% 0.0% 0.0% 0.0% 0.0%
Other
2 Sainsbury's Superstore, Cromwell Road Air Terminal Neighbourhood Centre 0.2% 15.0% 4.5% 0.0% 0.1% 3.4% 0.6% 0.6% 0.2% 0.2%
Sub-Total - Town Centres Central and North Sub Area 24.1% 52.5% 5.7% 2.4% 3.5% 4.5% 0.6% 0.6% 6.4% 0.2%
Out of Centre
1 Sainsbury's Superstore, Canal Way, Ladbroke Grove, W10 5AA 25.2% 0.3% 0.5% 10.5% 12.4% 0.3% 0.0% 0.0% 2.4% 2.9%
2 Tesco Superstore, West Cromwell Road, Kensington, W14 8PB 2.3% 17.3% 4.9% 0.0% 0.0% 1.1% 0.0% 1.9% 2.6% 0.0%
Sub-Total - Out of Centre Central and North Sub Area 27.5% 17.5% 5.3% 10.5% 12.4% 1.3% 0.0% 1.9% 5.0% 2.9%
Total Kensington & Chelsea Borough 51.6% 70.3% 57.4% 12.9% 18.0% 6.9% 5.1% 7.4% 12.9% 3.1%
Destinations for Convenience Goods Outside Kensington & Chelsea Borough
3Sainsbury's Local, Brompton Road, Knightsbridge, SW3 1JJ
[In Knightsbridge International Centre, but outside K&C Borough ]0.0% 0.0% 0.8% 0.0% 0.0% 0.1% 0.0% 0.0% 0.0% 0.0%
3Waitrose (Little), Brompton Road, Knightsbridge, SW3 1JE
[In Knightsbridge International Centre, but outside K&C Borough ]0.0% 0.0% 2.4% 0.0% 0.0% 0.6% 0.0% 0.0% 0.0% 0.0%
5Co-Op, Westbourne Grove Special District Centre
[In Knightsbridge International Centre, but outside K&C Borough]0.1% 0.0% 0.0% 0.0% 0.2% 0.0% 0.0% 0.0% 0.0% 0.0%
5Sainsbury's Local, Westbourne Grove Special District Centre
[In Knightsbridge International Centre, but outside K&C Borough]0.2% 0.0% 0.0% 0.0% 3.7% 0.0% 0.0% 0.0% 0.0% 0.0%
4 Lidl, Edgware Road, Cricklewood, NW2 6ND 0.0% 0.0% 0.0% 6.1% 0.0% 0.0% 0.0% 0.0% 0.0% 0.1%
4 Sainsbury's Superstore, High Road, Willesden Green, NW10 2TD 0.0% 0.0% 0.0% 29.1% 0.0% 0.0% 0.0% 0.0% 0.0% 0.0%
5 Co-op, Harrow Road, Maida Hill, W9 3QA 1.9% 0.0% 0.0% 0.0% 7.2% 0.0% 0.0% 0.0% 0.0% 0.0%
5 Iceland, Harrow Road, Maida Hill, W9 3QA 0.0% 0.0% 0.0% 0.0% 11.0% 0.3% 0.0% 0.0% 0.0% 0.6%
6 Sainsbury's Superstore, Wilton Road, Pimlico, Victoria, SW1V 1DT 0.0% 0.0% 0.6% 1.2% 0.0% 24.3% 0.0% 0.0% 0.6% 0.0%
6 Waitrose, Motcomb Street, Belgravia, SW1X 8GG 0.0% 0.0% 7.0% 0.0% 0.0% 8.1% 0.0% 0.0% 0.0% 0.0%
7 Asda, Clapham Junction, Lavender Hill, SW11 1JG 0.0% 0.2% 0.6% 0.0% 0.0% 0.0% 22.6% 0.5% 0.6% 0.0%
7 Lidl, Falcon Lane, Battersea, SW11 2LG 0.0% 0.0% 2.1% 0.0% 0.0% 0.8% 6.6% 2.0% 0.0% 0.0%
7 M&S (Foodhall), St John's Road, Clapham Junction, SW11 1QP 0.0% 0.0% 0.0% 0.0% 0.0% 0.0% 5.2% 0.0% 0.0% 0.0%
8 Sainsbury's Superstore, Fulham Broadway, Fulham, SW6 1BW 0.0% 0.0% 0.0% 0.0% 0.0% 0.0% 0.0% 8.6% 0.0% 0.0%
8 Sainsbury's Superstore, Townmead Road, Fulham, SW6 2GH 0.0% 0.0% 1.3% 0.0% 0.0% 0.0% 2.6% 14.1% 0.6% 0.0%
8 Waitrose, North End Road, Fulham, SW6 1LU 0.0% 0.1% 1.5% 0.0% 0.4% 0.0% 0.0% 20.8% 2.5% 0.0%
9 Lidl, West 12 Shopping Centre, Shepherds Bush Green, W12 8PP 2.6% 1.7% 0.0% 0.6% 0.3% 0.0% 0.0% 0.2% 11.9% 1.1%
9 Tesco Superstore, Shepherds Bush Road, Hammersmith, W6 7NL 2.1% 1.3% 0.0% 0.0% 0.0% 0.0% 0.0% 2.5% 15.8% 5.9%
10 Iceland, Old Oak Common Lane, East Acton, W3 7DA 0.7% 0.0% 0.0% 0.0% 0.0% 0.0% 0.0% 0.0% 0.0% 5.1%
10 Tesco Metro, Harlesden Plaza, Harlesden, NW10 4NG 0.0% 0.0% 0.0% 2.4% 0.0% 0.0% 0.0% 0.0% 0.0% 5.2%
10 Tesco Metro, The Vale, Acton, W3 7XA 0.0% 0.0% 0.0% 0.0% 0.0% 0.0% 0.0% 0.0% 0.8% 9.0%
- Asda, Park Royal, Ealing, NW10 7LW 2.9% 0.0% 0.0% 4.0% 1.5% 0.0% 0.0% 0.0% 0.7% 14.6%
- Morrisons, High Street, Acton, W3 9LA 0.1% 0.0% 0.0% 0.0% 0.0% 0.0% 0.0% 0.0% 0.6% 6.5%
- Sainsbury's Superstore, Garratt Lane, Wandsworth, SW18 4AD 0.0% 0.0% 0.0% 0.0% 0.0% 0.1% 12.4% 0.6% 0.0% 0.0%
- Sainsbury's Superstore, Kilburn High Road, Kilburn, NW6 4HS 0.4% 0.0% 0.0% 1.7% 6.1% 0.0% 0.0% 0.0% 0.0% 0.0%
- Tesco Extra, Brent Park, Neasden, (Wembley Extra), NW10 0TL 1.6% 0.0% 0.0% 6.7% 0.5% 0.0% 0.0% 0.0% 0.0% 11.5%
Total Outside Cambridge City and South Cambridgeshire District Council 12.6% 3.2% 16.4% 51.9% 30.9% 34.2% 49.4% 49.4% 34.2% 59.6%
ALL DESTINATIONS 64.1% 73.5% 73.7% 64.7% 48.8% 41.1% 54.5% 56.9% 47.1% 62.6%
OTHER DESTINATIONS 35.9% 26.5% 26.3% 35.3% 51.2% 58.9% 45.5% 43.1% 52.9% 37.4%

Kensington & Chelsea Retail and Leisure Needs Assessment 2021Convenience Goods Need Forecasts
Table 6 - Convenience Goods Allocation - Spend (£) 2021
Survey
Location
Zone
Zone 1
£m
Zone 2
£m
Zone 3
£m
Zone 4
£m
Zone 5
£m
Zone 6
£m
Zone 7
£m
Zone 8
£m
Zone 9
£m
Zone 10
£m
Total
£m
Total
%
Total Available Convenience Goods Spend - 2021 (£m) 158.9 180.9 151.4 210.6 231.1 199.9 289.8 174.5 207.0 184.0 1,988.0 100.0
Destinations for Convenience Goods in Kensington & Chelsea Borough
South Sub-Area
Major Centres
3 M&S, King's Road (East) Major Centre 0.0 0.0 13.1 0.0 0.0 0.6 4.5 0.6 1.8 0.0 20.4 1.0
3 Waitrose, King's Road (East) Major Centre 0.0 0.0 41.6 0.0 0.0 1.5 7.7 0.7 0.0 0.0 51.5 2.6
3 Local Shops, King's Road (East) Major Centre 0.0 0.0 1.4 0.0 0.0 0.0 0.0 0.0 0.0 0.0 1.4 0.1
District Centres
3 Londis, King's Road (West) District Centre 0.0 0.0 0.5 0.0 0.0 0.0 0.0 0.0 0.0 0.0 0.5 0.0
3 M&S Simply Food, Fulham Road (West) District Centre 0.0 0.0 3.6 0.0 4.4 0.0 0.3 0.1 0.0 0.0 8.4 0.4
3 Sainsbury's Local, Fulham Road (West) District Centre 0.0 0.0 5.1 0.0 0.0 0.0 0.0 1.8 0.0 0.0 6.9 0.3
3 Tesco Express, Fulham Road (West) District Centre 0.0 0.0 0.7 0.0 0.0 0.0 0.5 4.5 1.5 0.0 7.3 0.4
3 Local Shops, Fulham Road (West) District Centre 0.0 0.0 1.3 0.0 0.0 0.0 0.0 0.0 0.0 0.0 1.3 0.1
3 Tesco Express, Old Brompton Road, South Kensington District Centre 0.0 0.3 1.6 0.0 0.0 0.0 0.0 0.0 0.0 0.0 1.8 0.1
3 Waitrose (Little), Old Brompton Road, South Kensington District Centre 0.0 0.1 1.2 0.0 0.2 0.0 0.0 0.8 0.0 0.0 2.3 0.1
Sub-Total - Town Centres South Sub-Area 0.0 0.4 70.1 0.0 4.6 2.1 13.0 8.5 3.3 0.0 101.8 5.1
Central and North Sub Area
Major Centres
2 M&S, Kensington High Street Major Centre 0.7 8.8 0.4 0.0 2.9 0.5 0.0 0.2 3.9 0.0 17.3 0.9
2 Sainsbury's Local, Kensington High Street Major Centre 0.0 2.8 0.0 0.0 0.0 0.0 0.0 0.0 0.0 0.0 2.8 0.1
2 Waitrose, Kensington High Street Major Centre 0.4 19.0 0.1 0.0 0.0 0.0 0.0 0.0 7.0 0.0 26.6 1.3
2 Whole Foods, Kensington High Street Major Centre 2.7 7.1 0.3 4.8 0.4 0.0 0.0 0.0 0.2 0.0 15.4 0.8
2 Local Shops, Kensington High Street Major Centre 0.0 2.1 0.0 0.0 0.0 0.0 0.0 0.0 0.4 0.0 2.5 0.1
District Centres
2 M&S, Notting Hill Gate District Centre 1.1 9.1 0.0 0.0 0.7 0.0 0.0 0.0 0.0 0.0 11.0 0.6
2 Tesco Metro, Notting Hill Gate District Centre 4.0 9.5 0.0 0.0 0.0 0.4 0.0 0.0 0.0 0.0 13.8 0.7
2 Waitrose (Little), Notting Hill Gate District Centre 1.2 1.0 0.0 0.0 0.2 1.5 0.0 0.0 0.0 0.0 3.9 0.2
1 Sainsbury's Local, Portobello Road District Centre 6.1 0.3 0.0 0.0 0.2 0.0 0.0 0.0 0.0 0.0 6.6 0.3
1 Tesco Metro, Portobello Road District Centre 16.5 0.0 0.0 0.0 0.0 0.0 0.0 0.0 0.0 0.0 16.5 0.8
1 Portobello Market, Portobello Road District Centre 4.6 0.5 0.0 0.2 3.1 0.0 0.0 0.0 0.0 0.1 8.6 0.4
1 Local Shops, Portobello Road District Centre 0.5 0.0 0.0 0.0 0.0 0.0 0.0 0.0 0.0 0.0 0.5 0.0
2 M&S, Earls Court Road District Centre 0.0 4.7 0.8 0.0 0.0 0.0 0.0 0.0 0.0 0.0 5.5 0.3
2 Sainsbury's Local, Earls Court Road District Centre 0.0 2.5 0.3 0.0 0.0 0.0 0.0 0.0 1.4 0.0 4.2 0.2
1 Local Shops, Westbourne Grove District Centre 0.0 0.6 0.0 0.0 0.5 0.0 0.0 0.0 0.0 0.0 1.1 0.1
Other
2 Sainsbury's Superstore, Cromwell Road Air Terminal Neighbourhood Centre 0.3 27.1 6.8 0.0 0.2 6.7 1.8 1.0 0.4 0.3 44.5 2.2
Sub-Total - Town Centres Central and North Sub Area 38.3 95.1 8.7 5.0 8.2 9.1 1.8 1.1 13.2 0.3 180.7 9.1
Out of Centre
1 Sainsbury's Superstore, Canal Way, Ladbroke Grove, W10 5AA 40.0 0.5 0.7 22.1 28.8 0.5 0.0 0.0 4.9 5.3 102.8 5.2
2 Tesco Superstore, West Cromwell Road, Kensington, W14 8PB 3.7 31.2 7.4 0.0 0.0 2.1 0.0 3.4 5.4 0.0 53.2 2.7
Sub-Total - Out of Centre Central and North Sub Area 43.6 31.8 8.1 22.1 28.8 2.6 0.0 3.4 10.3 5.3 156.0 7.8
Total Kensington & Chelsea Borough 81.9 127.2 86.9 27.1 41.5 13.8 14.8 13.0 26.8 5.7 438.5 22.1
3Sainsbury's Local, Brompton Road, Knightsbridge, SW3 1JJ
[In Knightsbridge International Centre, but outside K&C Borough ]0.0 0.0 1.2 0.0 0.0 0.1 0.0 0.0 0.0 0.0 1.4 0.1
3Waitrose (Little), Brompton Road, Knightsbridge, SW3 1JE
[In Knightsbridge International Centre, but outside K&C Borough ]0.0 0.0 3.6 0.0 0.0 1.2 0.0 0.0 0.0 0.0 4.8 0.2
5Co-Op, Westbourne Grove Special District Centre
[In Knightsbridge International Centre, but outside K&C Borough]0.1 0.0 0.0 0.0 0.5 0.0 0.0 0.0 0.0 0.0 0.6 0.0
5Sainsbury's Local, Westbourne Grove Special District Centre
[In Knightsbridge International Centre, but outside K&C Borough]0.2 0.0 0.0 0.0 8.6 0.0 0.0 0.0 0.0 0.0 8.8 0.4
4 Lidl, Edgware Road, Cricklewood, NW2 6ND 0.0 0.0 0.0 12.8 0.0 0.0 0.0 0.0 0.0 0.1 12.9 0.7
4 Sainsbury's Superstore, High Road, Willesden Green, NW10 2TD 0.0 0.0 0.0 61.2 0.0 0.0 0.0 0.0 0.0 0.0 61.2 3.1
5 Co-op, Harrow Road, Maida Hill, W9 3QA 3.1 0.0 0.0 0.0 16.7 0.0 0.0 0.0 0.0 0.0 19.8 1.0
5 Iceland, Harrow Road, Maida Hill, W9 3QA 0.0 0.0 0.0 0.0 25.3 0.6 0.0 0.0 0.0 1.1 27.0 1.4
6 Sainsbury's Superstore, Wilton Road, Pimlico, Victoria, SW1V 1DT 0.0 0.0 0.9 2.6 0.0 48.6 0.0 0.0 1.3 0.0 53.4 2.7
6 Waitrose, Motcomb Street, Belgravia, SW1X 8GG 0.0 0.0 10.7 0.0 0.0 16.1 0.0 0.0 0.0 0.0 26.8 1.3
7 Asda, Clapham Junction, Lavender Hill, SW11 1JG 0.0 0.3 0.9 0.0 0.0 0.0 65.4 1.0 1.3 0.0 68.9 3.5
7 Lidl, Falcon Lane, Battersea, SW11 2LG 0.0 0.0 3.2 0.0 0.0 1.5 19.1 3.6 0.0 0.0 27.4 1.4
7 M&S (Foodhall), St John's Road, Clapham Junction, SW11 1QP 0.0 0.0 0.0 0.0 0.0 0.0 14.9 0.0 0.0 0.0 14.9 0.8
8 Sainsbury's Superstore, Fulham Broadway, Fulham, SW6 1BW 0.0 0.0 0.0 0.0 0.0 0.0 0.0 15.0 0.0 0.0 15.0 0.8
8 Sainsbury's Superstore, Townmead Road, Fulham, SW6 2GH 0.0 0.0 2.0 0.0 0.0 0.0 7.6 24.5 1.2 0.0 35.3 1.8
8 Waitrose, North End Road, Fulham, SW6 1LU 0.0 0.2 2.3 0.0 0.9 0.0 0.0 36.4 5.2 0.0 44.9 2.3
9 Lidl, West 12 Shopping Centre, Shepherds Bush Green, W12 8PP 4.1 3.0 0.0 1.3 0.7 0.0 0.0 0.3 24.7 2.0 36.2 1.8
9 Tesco Superstore, Shepherds Bush Road, Hammersmith, W6 7NL 3.4 2.3 0.0 0.0 0.0 0.0 0.0 4.4 32.8 10.8 53.7 2.7
10 Iceland, Old Oak Common Lane, East Acton, W3 7DA 1.0 0.0 0.0 0.0 0.0 0.0 0.0 0.0 0.0 9.3 10.3 0.5
10 Tesco Metro, Harlesden Plaza, Harlesden, NW10 4NG 0.0 0.0 0.0 5.0 0.0 0.0 0.0 0.0 0.0 9.6 14.6 0.7
10 Tesco Metro, The Vale, Acton, W3 7XA 0.0 0.0 0.0 0.0 0.0 0.0 0.0 0.0 1.6 16.5 18.1 0.9
- Asda, Park Royal, Ealing, NW10 7LW 4.7 0.0 0.0 8.5 3.4 0.0 0.0 0.0 1.4 26.9 44.9 2.3
- Morrisons, High Street, Acton, W3 9LA 0.1 0.0 0.0 0.0 0.0 0.0 0.0 0.0 1.3 12.0 13.4 0.7
- Sainsbury's Superstore, Garratt Lane, Wandsworth, SW18 4AD 0.0 0.0 0.0 0.0 0.0 0.2 36.1 1.0 0.0 0.0 37.3 1.9
- Sainsbury's Superstore, Kilburn High Road, Kilburn, NW6 4HS 0.7 0.0 0.0 3.7 14.1 0.0 0.0 0.0 0.0 0.0 18.4 0.9
- Tesco Extra, Brent Park, Neasden, (Wembley Extra), NW10 0TL 2.5 0.0 0.0 14.1 1.2 0.0 0.0 0.0 0.0 21.2 39.0 2.0
Total Outside Kensington & Chelsea Borough 20.0 5.8 24.8 109.2 71.3 68.4 143.1 86.2 70.8 109.6 709.2 35.7
ALL DESTINATIONS 101.9 133.0 111.6 136.3 112.8 82.2 157.9 99.2 97.6 115.2 1,147.7 57.7
OTHER DESTINATIONS 57.0 48.0 39.8 74.3 118.2 117.7 132.0 75.3 109.4 68.7 840.3 42.3
Destinations for Convenience Goods Outside Kensington & Chelsea Borough

Kensington & Chelsea Retail and Leisure Needs Assessment 2021Convenience Goods Need Forecasts
Table 7 - Convenience Goods Allocation - Spend (£) 2026
Survey
Location
Zone
Zone 1
£m
Zone 2
£m
Zone 3
£m
Zone 4
£m
Zone 5
£m
Zone 6
£m
Zone 7
£m
Zone 8
£m
Zone 9
£m
Zone 10
£m
Total
£m
Total
%
Total Available Convenience Goods Spend - 2026 (£m) 160.4 182.4 153.5 215.4 242.0 209.8 299.6 180.6 213.6 188.5 2,045.8 100.0
Destinations for Convenience Goods in Kensington & Chelsea Borough
South Sub-Area
Major Centres
3 M&S, King's Road (East) Major Centre 0.0 0.0 13.2 0.0 0.0 0.6 4.6 0.6 1.8 0.0 20.9 1.0
3 Waitrose, King's Road (East) Major Centre 0.0 0.0 42.2 0.0 0.0 1.6 7.9 0.7 0.0 0.0 52.4 2.6
3 Local Shops, King's Road (East) Major Centre 0.0 0.0 1.4 0.0 0.0 0.0 0.0 0.0 0.0 0.0 1.4 0.1
District Centres
3 Londis, King's Road (West) District Centre 0.0 0.0 0.5 0.0 0.0 0.0 0.0 0.0 0.0 0.0 0.5 0.0
3 M&S Simply Food, Fulham Road (West) District Centre 0.0 0.0 3.6 0.0 4.6 0.0 0.3 0.1 0.0 0.0 8.7 0.4
3 Sainsbury's Local, Fulham Road (West) District Centre 0.0 0.0 5.2 0.0 0.0 0.0 0.0 1.9 0.0 0.0 7.0 0.3
3 Tesco Express, Fulham Road (West) District Centre 0.0 0.0 0.7 0.0 0.0 0.0 0.5 4.7 1.6 0.0 7.5 0.4
3 Local Shops, Fulham Road (West) District Centre 0.0 0.0 1.3 0.0 0.0 0.0 0.0 0.0 0.0 0.0 1.3 0.1
3 Tesco Express, Old Brompton Road, South Kensington District Centre 0.0 0.3 1.6 0.0 0.0 0.0 0.0 0.0 0.0 0.0 1.9 0.1
3 Waitrose (Little), Old Brompton Road, South Kensington District Centre 0.0 0.1 1.2 0.0 0.2 0.0 0.0 0.8 0.0 0.0 2.3 0.1
Sub-Total - Town Centres South Sub-Area 0.0 0.4 71.0 0.0 4.8 2.2 13.4 8.7 3.4 0.0 103.9 5.1
Central and North Sub Area
Major Centres
2 M&S, Kensington High Street Major Centre 0.7 8.9 0.4 0.0 3.0 0.5 0.0 0.2 4.0 0.0 17.7 0.9
2 Sainsbury's Local, Kensington High Street Major Centre 0.0 2.8 0.0 0.0 0.0 0.0 0.0 0.0 0.0 0.0 2.8 0.1
2 Waitrose, Kensington High Street Major Centre 0.4 19.1 0.1 0.0 0.0 0.0 0.0 0.0 7.2 0.0 27.0 1.3
2 Whole Foods, Kensington High Street Major Centre 2.7 7.1 0.3 4.9 0.4 0.0 0.0 0.0 0.2 0.0 15.6 0.8
2 Local Shops, Kensington High Street Major Centre 0.0 2.1 0.0 0.0 0.0 0.0 0.0 0.0 0.4 0.0 2.5 0.1
District Centres
2 M&S, Notting Hill Gate District Centre 1.1 9.2 0.0 0.0 0.8 0.0 0.0 0.0 0.0 0.0 11.1 0.5
2 Tesco Metro, Notting Hill Gate District Centre 4.0 9.6 0.0 0.0 0.0 0.4 0.0 0.0 0.0 0.0 14.0 0.7
2 Waitrose (Little), Notting Hill Gate District Centre 1.2 1.0 0.0 0.0 0.2 1.6 0.0 0.0 0.0 0.0 4.0 0.2
1 Sainsbury's Local, Portobello Road District Centre 6.2 0.3 0.0 0.0 0.2 0.0 0.0 0.0 0.0 0.0 6.7 0.3
1 Tesco Metro, Portobello Road District Centre 16.7 0.0 0.0 0.0 0.0 0.0 0.0 0.0 0.0 0.0 16.7 0.8
1 Portobello Market, Portobello Road District Centre 4.7 0.5 0.0 0.2 3.3 0.0 0.0 0.0 0.0 0.1 8.8 0.4
1 Local Shops, Portobello Road District Centre 0.5 0.0 0.0 0.0 0.0 0.0 0.0 0.0 0.0 0.0 0.5 0.0
2 M&S, Earls Court Road District Centre 0.0 4.8 0.8 0.0 0.0 0.0 0.0 0.0 0.0 0.0 5.6 0.3
2 Sainsbury's Local, Earls Court Road District Centre 0.0 2.5 0.3 0.0 0.0 0.0 0.0 0.0 1.4 0.0 4.3 0.2
1 Local Shops, Westbourne Grove District Centre 0.0 0.6 0.0 0.0 0.5 0.0 0.0 0.0 0.0 0.0 1.1 0.1
Other
2 Sainsbury's Superstore, Cromwell Road Air Terminal Neighbourhood Centre 0.4 27.3 6.8 0.0 0.2 7.0 1.9 1.0 0.4 0.3 45.3 2.2
Sub-Total - Town Centres Central and North Sub Area 38.7 95.9 8.8 5.1 8.6 9.5 1.9 1.2 13.6 0.4 183.5 9.0
Out of Centre
1 Sainsbury's Superstore, Canal Way, Ladbroke Grove, W10 5AA 40.4 0.5 0.7 22.6 30.1 0.5 0.0 0.0 5.1 5.4 105.4 5.2
2 Tesco Superstore, West Cromwell Road, Kensington, W14 8PB 3.7 31.5 7.5 0.0 0.0 2.2 0.0 3.5 5.5 0.0 54.0 2.6
Sub-Total - Out of Centre Central and North Sub Area 44.1 32.0 8.2 22.6 30.1 2.8 0.0 3.5 10.6 5.4 159.3 7.8
Total Kensington & Chelsea Borough 82.7 128.2 88.0 27.7 43.5 14.4 15.2 13.4 27.6 5.8 446.7 21.8
3Sainsbury's Local, Brompton Road, Knightsbridge, SW3 1JJ
[In Knightsbridge International Centre, but outside K&C Borough ]0.0 0.0 1.2 0.0 0.0 0.1 0.0 0.0 0.0 0.0 1.4 0.1
3Waitrose (Little), Brompton Road, Knightsbridge, SW3 1JE
[In Knightsbridge International Centre, but outside K&C Borough ]0.0 0.0 3.7 0.0 0.0 1.3 0.0 0.0 0.0 0.0 5.0 0.2
5Co-Op, Westbourne Grove Special District Centre
[In Knightsbridge International Centre, but outside K&C Borough]0.1 0.0 0.0 0.0 0.5 0.0 0.0 0.0 0.0 0.0 0.6 0.0
5Sainsbury's Local, Westbourne Grove Special District Centre
[In Knightsbridge International Centre, but outside K&C Borough]0.2 0.0 0.0 0.0 9.0 0.0 0.0 0.0 0.0 0.0 9.2 0.5
4 Lidl, Edgware Road, Cricklewood, NW2 6ND 0.0 0.0 0.0 13.1 0.0 0.0 0.0 0.0 0.0 0.1 13.2 0.6
4 Sainsbury's Superstore, High Road, Willesden Green, NW10 2TD 0.0 0.0 0.0 62.6 0.0 0.0 0.0 0.0 0.0 0.0 62.6 3.1
5 Co-op, Harrow Road, Maida Hill, W9 3QA 3.1 0.0 0.0 0.0 17.5 0.0 0.0 0.0 0.0 0.0 20.6 1.0
5 Iceland, Harrow Road, Maida Hill, W9 3QA 0.0 0.0 0.0 0.0 26.5 0.6 0.0 0.0 0.0 1.1 28.3 1.4
6 Sainsbury's Superstore, Wilton Road, Pimlico, Victoria, SW1V 1DT 0.0 0.0 0.9 2.7 0.0 51.0 0.0 0.0 1.4 0.0 55.9 2.7
6 Waitrose, Motcomb Street, Belgravia, SW1X 8GG 0.0 0.0 10.8 0.0 0.0 16.9 0.0 0.0 0.0 0.0 27.7 1.4
7 Asda, Clapham Junction, Lavender Hill, SW11 1JG 0.0 0.3 0.9 0.0 0.0 0.0 67.6 1.0 1.4 0.0 71.2 3.5
7 Lidl, Falcon Lane, Battersea, SW11 2LG 0.0 0.0 3.2 0.0 0.0 1.6 19.8 3.7 0.0 0.0 28.3 1.4
7 M&S (Foodhall), St John's Road, Clapham Junction, SW11 1QP 0.0 0.0 0.0 0.0 0.0 0.0 15.4 0.0 0.0 0.0 15.4 0.8
8 Sainsbury's Superstore, Fulham Broadway, Fulham, SW6 1BW 0.0 0.0 0.0 0.0 0.0 0.0 0.0 15.6 0.0 0.0 15.6 0.8
8 Sainsbury's Superstore, Townmead Road, Fulham, SW6 2GH 0.0 0.0 2.0 0.0 0.0 0.0 7.8 25.4 1.2 0.0 36.5 1.8
8 Waitrose, North End Road, Fulham, SW6 1LU 0.0 0.2 2.4 0.0 0.9 0.0 0.0 37.6 5.4 0.0 46.5 2.3
9 Lidl, West 12 Shopping Centre, Shepherds Bush Green, W12 8PP 4.2 3.0 0.0 1.4 0.7 0.0 0.0 0.3 25.5 2.0 37.1 1.8
9 Tesco Superstore, Shepherds Bush Road, Hammersmith, W6 7NL 3.4 2.3 0.0 0.0 0.0 0.0 0.0 4.6 33.8 11.1 55.2 2.7
10 Iceland, Old Oak Common Lane, East Acton, W3 7DA 1.1 0.0 0.0 0.0 0.0 0.0 0.0 0.0 0.0 9.5 10.6 0.5
10 Tesco Metro, Harlesden Plaza, Harlesden, NW10 4NG 0.0 0.0 0.0 5.1 0.0 0.0 0.0 0.0 0.0 9.8 14.9 0.7
10 Tesco Metro, The Vale, Acton, W3 7XA 0.0 0.0 0.0 0.0 0.0 0.0 0.0 0.0 1.6 17.0 18.6 0.9
- Asda, Park Royal, Ealing, NW10 7LW 4.7 0.0 0.0 8.7 3.5 0.0 0.0 0.0 1.4 27.6 46.0 2.2
- Morrisons, High Street, Acton, W3 9LA 0.1 0.0 0.0 0.0 0.0 0.0 0.0 0.0 1.4 12.3 13.8 0.7
- Sainsbury's Superstore, Garratt Lane, Wandsworth, SW18 4AD 0.0 0.0 0.0 0.0 0.0 0.2 37.3 1.0 0.0 0.0 38.6 1.9
- Sainsbury's Superstore, Kilburn High Road, Kilburn, NW6 4HS 0.7 0.0 0.0 3.7 14.7 0.0 0.0 0.0 0.0 0.0 19.2 0.9
- Tesco Extra, Brent Park, Neasden, (Wembley Extra), NW10 0TL 2.6 0.0 0.0 14.4 1.2 0.0 0.0 0.0 0.0 21.7 39.9 2.0
Total Outside Kensington & Chelsea Borough 20.2 5.9 25.1 111.7 74.7 71.8 147.9 89.2 73.0 112.3 731.9 35.8
ALL DESTINATIONS 102.9 134.1 113.1 139.4 118.1 86.2 163.2 102.7 100.7 118.1 1,178.6 57.6
OTHER DESTINATIONS 57.5 48.3 40.3 76.0 123.8 123.5 136.4 77.9 112.9 70.4 867.2 42.4
Destinations for Convenience Goods Outside Kensington & Chelsea Borough

Kensington & Chelsea Retail and Leisure Needs Assessment 2021Convenience Goods Need Forecasts
Table 8 - Convenience Goods Allocation - Spend (£) 2031
Survey
Location
Zone
Zone 1
£m
Zone 2
£m
Zone 3
£m
Zone 4
£m
Zone 5
£m
Zone 6
£m
Zone 7
£m
Zone 8
£m
Zone 9
£m
Zone 10
£m
Total
£m
Total
%
Total Available Convenience Goods Spend - 2031 (£m) 161.1 182.4 153.9 217.5 248.4 215.0 303.5 183.2 217.3 191.4 2,073.6 100.0
Destinations for Convenience Goods in Kensington & Chelsea Borough
South Sub-Area
Major Centres
3 M&S, King's Road (East) Major Centre 0.0 0.0 13.3 0.0 0.0 0.6 4.7 0.6 1.8 0.0 21.0 1.0
3 Waitrose, King's Road (East) Major Centre 0.0 0.0 42.3 0.0 0.0 1.6 8.0 0.7 0.0 0.0 52.6 2.5
3 Local Shops, King's Road (East) Major Centre 0.0 0.0 1.4 0.0 0.0 0.0 0.0 0.0 0.0 0.0 1.4 0.1
District Centres
3 Londis, King's Road (West) District Centre 0.0 0.0 0.5 0.0 0.0 0.0 0.0 0.0 0.0 0.0 0.5 0.0
3 M&S Simply Food, Fulham Road (West) District Centre 0.0 0.0 3.7 0.0 4.7 0.0 0.3 0.1 0.0 0.0 8.8 0.4
3 Sainsbury's Local, Fulham Road (West) District Centre 0.0 0.0 5.2 0.0 0.0 0.0 0.0 1.9 0.0 0.0 7.1 0.3
3 Tesco Express, Fulham Road (West) District Centre 0.0 0.0 0.7 0.0 0.0 0.0 0.6 4.8 1.6 0.0 7.6 0.4
3 Local Shops, Fulham Road (West) District Centre 0.0 0.0 1.3 0.0 0.0 0.0 0.0 0.0 0.0 0.0 1.3 0.1
3 Tesco Express, Old Brompton Road, South Kensington District Centre 0.0 0.3 1.6 0.0 0.0 0.0 0.0 0.0 0.0 0.0 1.9 0.1
3 Waitrose (Little), Old Brompton Road, South Kensington District Centre 0.0 0.1 1.3 0.0 0.2 0.0 0.0 0.8 0.0 0.0 2.4 0.1
Sub-Total - Town Centres South Sub-Area 0.0 0.4 71.2 0.0 4.9 2.2 13.6 8.9 3.4 0.0 104.6 5.0
Central and North Sub Area
Major Centres
2 M&S, Kensington High Street Major Centre 0.7 8.9 0.4 0.0 3.1 0.5 0.0 0.2 4.0 0.0 17.8 0.9
2 Sainsbury's Local, Kensington High Street Major Centre 0.0 2.8 0.0 0.0 0.0 0.0 0.0 0.0 0.0 0.0 2.8 0.1
2 Waitrose, Kensington High Street Major Centre 0.4 19.1 0.1 0.0 0.0 0.0 0.0 0.0 7.4 0.0 27.1 1.3
2 Whole Foods, Kensington High Street Major Centre 2.7 7.1 0.3 4.9 0.4 0.0 0.0 0.0 0.2 0.0 15.6 0.8
2 Local Shops, Kensington High Street Major Centre 0.0 2.1 0.0 0.0 0.0 0.0 0.0 0.0 0.4 0.0 2.5 0.1
District Centres
2 M&S, Notting Hill Gate District Centre 1.1 9.2 0.0 0.0 0.8 0.0 0.0 0.0 0.0 0.0 11.2 0.5
2 Tesco Metro, Notting Hill Gate District Centre 4.0 9.6 0.0 0.0 0.0 0.4 0.0 0.0 0.0 0.0 14.0 0.7
2 Waitrose (Little), Notting Hill Gate District Centre 1.2 1.0 0.0 0.0 0.2 1.6 0.0 0.0 0.0 0.0 4.0 0.2
1 Sainsbury's Local, Portobello Road District Centre 6.2 0.3 0.0 0.0 0.2 0.0 0.0 0.0 0.0 0.0 6.7 0.3
1 Tesco Metro, Portobello Road District Centre 16.7 0.0 0.0 0.0 0.0 0.0 0.0 0.0 0.0 0.0 16.7 0.8
1 Portobello Market, Portobello Road District Centre 4.7 0.5 0.0 0.2 3.4 0.0 0.0 0.0 0.0 0.1 8.9 0.4
1 Local Shops, Portobello Road District Centre 0.5 0.0 0.0 0.0 0.0 0.0 0.0 0.0 0.0 0.0 0.5 0.0
2 M&S, Earls Court Road District Centre 0.0 4.8 0.8 0.0 0.0 0.0 0.0 0.0 0.0 0.0 5.6 0.3
2 Sainsbury's Local, Earls Court Road District Centre 0.0 2.5 0.3 0.0 0.0 0.0 0.0 0.0 1.4 0.0 4.3 0.2
1 Local Shops, Westbourne Grove District Centre 0.0 0.6 0.0 0.0 0.5 0.0 0.0 0.0 0.0 0.0 1.1 0.1
Other
2 Sainsbury's Superstore, Cromwell Road Air Terminal Neighbourhood Centre 0.4 27.3 6.9 0.0 0.2 7.2 1.9 1.0 0.4 0.3 45.5 2.2
Sub-Total - Town Centres Central and North Sub Area 38.8 95.8 8.8 5.1 8.8 9.8 1.9 1.2 13.9 0.4 184.5 8.9
Out of Centre
1 Sainsbury's Superstore, Canal Way, Ladbroke Grove, W10 5AA 40.5 0.5 0.7 22.8 30.9 0.5 0.0 0.0 5.2 5.5 106.8 5.1
2 Tesco Superstore, West Cromwell Road, Kensington, W14 8PB 3.7 31.5 7.5 0.0 0.0 2.3 0.0 3.6 5.6 0.0 54.2 2.6
Sub-Total - Out of Centre Central and North Sub Area 44.3 32.0 8.2 22.8 30.9 2.8 0.0 3.6 10.8 5.5 161.0 7.8
Total Kensington & Chelsea Borough 83.1 128.2 88.3 27.9 44.6 14.8 15.4 13.6 28.1 5.9 450.0 21.7
3Sainsbury's Local, Brompton Road, Knightsbridge, SW3 1JJ
[In Knightsbridge International Centre, but outside K&C Borough ]0.0 0.0 1.2 0.0 0.0 0.1 0.0 0.0 0.0 0.0 1.4 0.1
3Waitrose (Little), Brompton Road, Knightsbridge, SW3 1JE
[In Knightsbridge International Centre, but outside K&C Borough ]0.0 0.0 3.7 0.0 0.0 1.3 0.0 0.0 0.0 0.0 5.0 0.2
5Co-Op, Westbourne Grove Special District Centre
[In Knightsbridge International Centre, but outside K&C Borough]0.1 0.0 0.0 0.0 0.5 0.0 0.0 0.0 0.0 0.0 0.6 0.0
5Sainsbury's Local, Westbourne Grove Special District Centre
[In Knightsbridge International Centre, but outside K&C Borough]0.2 0.0 0.0 0.0 9.2 0.0 0.0 0.0 0.0 0.0 9.5 0.5
4 Lidl, Edgware Road, Cricklewood, NW2 6ND 0.0 0.0 0.0 13.2 0.0 0.0 0.0 0.0 0.0 0.1 13.4 0.6
4 Sainsbury's Superstore, High Road, Willesden Green, NW10 2TD 0.0 0.0 0.0 63.2 0.0 0.0 0.0 0.0 0.0 0.0 63.2 3.0
5 Co-op, Harrow Road, Maida Hill, W9 3QA 3.1 0.0 0.0 0.0 18.0 0.0 0.0 0.0 0.0 0.0 21.1 1.0
5 Iceland, Harrow Road, Maida Hill, W9 3QA 0.0 0.0 0.0 0.0 27.2 0.6 0.0 0.0 0.0 1.1 29.0 1.4
6 Sainsbury's Superstore, Wilton Road, Pimlico, Victoria, SW1V 1DT 0.0 0.0 0.9 2.7 0.0 52.2 0.0 0.0 1.4 0.0 57.2 2.8
6 Waitrose, Motcomb Street, Belgravia, SW1X 8GG 0.0 0.0 10.8 0.0 0.0 17.3 0.0 0.0 0.0 0.0 28.2 1.4
7 Asda, Clapham Junction, Lavender Hill, SW11 1JG 0.0 0.3 0.9 0.0 0.0 0.0 68.5 1.0 1.4 0.0 72.1 3.5
7 Lidl, Falcon Lane, Battersea, SW11 2LG 0.0 0.0 3.3 0.0 0.0 1.6 20.0 3.7 0.0 0.0 28.7 1.4
7 M&S (Foodhall), St John's Road, Clapham Junction, SW11 1QP 0.0 0.0 0.0 0.0 0.0 0.0 15.6 0.0 0.0 0.0 15.6 0.8
8 Sainsbury's Superstore, Fulham Broadway, Fulham, SW6 1BW 0.0 0.0 0.0 0.0 0.0 0.0 0.0 15.8 0.0 0.0 15.8 0.8
8 Sainsbury's Superstore, Townmead Road, Fulham, SW6 2GH 0.0 0.0 2.1 0.0 0.0 0.0 7.9 25.8 1.2 0.0 37.0 1.8
8 Waitrose, North End Road, Fulham, SW6 1LU 0.0 0.2 2.4 0.0 0.9 0.0 0.0 38.2 5.5 0.0 47.1 2.3
9 Lidl, West 12 Shopping Centre, Shepherds Bush Green, W12 8PP 4.2 3.0 0.0 1.4 0.8 0.0 0.0 0.3 25.9 2.1 37.7 1.8
9 Tesco Superstore, Shepherds Bush Road, Hammersmith, W6 7NL 3.4 2.3 0.0 0.0 0.0 0.0 0.0 4.7 34.4 11.2 56.0 2.7
10 Iceland, Old Oak Common Lane, East Acton, W3 7DA 1.1 0.0 0.0 0.0 0.0 0.0 0.0 0.0 0.0 9.7 10.7 0.5
10 Tesco Metro, Harlesden Plaza, Harlesden, NW10 4NG 0.0 0.0 0.0 5.1 0.0 0.0 0.0 0.0 0.0 10.0 15.1 0.7
10 Tesco Metro, The Vale, Acton, W3 7XA 0.0 0.0 0.0 0.0 0.0 0.0 0.0 0.0 1.7 17.2 18.9 0.9
- Asda, Park Royal, Ealing, NW10 7LW 4.8 0.0 0.0 8.8 3.6 0.0 0.0 0.0 1.4 28.0 46.6 2.2
- Morrisons, High Street, Acton, W3 9LA 0.1 0.0 0.0 0.0 0.0 0.0 0.0 0.0 1.4 12.5 14.0 0.7
- Sainsbury's Superstore, Garratt Lane, Wandsworth, SW18 4AD 0.0 0.0 0.0 0.0 0.0 0.3 37.8 1.0 0.0 0.0 39.1 1.9
- Sainsbury's Superstore, Kilburn High Road, Kilburn, NW6 4HS 0.7 0.0 0.0 3.8 15.1 0.0 0.0 0.0 0.0 0.0 19.6 0.9
- Tesco Extra, Brent Park, Neasden, (Wembley Extra), NW10 0TL 2.6 0.0 0.0 14.6 1.3 0.0 0.0 0.0 0.0 22.1 40.5 2.0
Total Outside Kensington & Chelsea Borough 20.3 5.9 25.2 112.8 76.7 73.6 149.9 90.5 74.3 114.0 743.0 35.8
ALL DESTINATIONS 103.4 134.1 113.4 140.7 121.3 88.4 165.3 104.2 102.4 119.9 1,193.1 57.5
OTHER DESTINATIONS 57.8 48.3 40.4 76.7 127.1 126.6 138.2 79.1 114.8 71.5 880.6 42.5
Destinations for Convenience Goods Outside Kensington & Chelsea Borough

Kensington & Chelsea Retail and Leisure Needs Assessment 2021Convenience Goods Need Forecasts
Table 9 - Convenience Goods Allocation - Spend (£) 2036
Survey
Location
Zone
Zone 1
£m
Zone 2
£m
Zone 3
£m
Zone 4
£m
Zone 5
£m
Zone 6
£m
Zone 7
£m
Zone 8
£m
Zone 9
£m
Zone 10
£m
Total
£m
Total
%
Total Available Convenience Goods Spend - 2036 (£m) 162.5 183.2 154.7 219.8 254.8 219.4 309.2 186.3 220.4 194.5 2,104.8 100.0
Destinations for Convenience Goods in Kensington & Chelsea Borough
South Sub-Area
Major Centres
3 M&S, King's Road (East) Major Centre 0.0 0.0 13.4 0.0 0.0 0.6 4.8 0.6 1.9 0.0 21.2 1.0
3 Waitrose, King's Road (East) Major Centre 0.0 0.0 42.6 0.0 0.0 1.6 8.2 0.7 0.0 0.0 53.1 2.5
3 Local Shops, King's Road (East) Major Centre 0.0 0.0 1.4 0.0 0.0 0.0 0.0 0.0 0.0 0.0 1.4 0.1
District Centres
3 Londis, King's Road (West) District Centre 0.0 0.0 0.5 0.0 0.0 0.0 0.0 0.0 0.0 0.0 0.5 0.0
3 M&S Simply Food, Fulham Road (West) District Centre 0.0 0.0 3.7 0.0 4.8 0.0 0.3 0.1 0.0 0.0 8.9 0.4
3 Sainsbury's Local, Fulham Road (West) District Centre 0.0 0.0 5.2 0.0 0.0 0.0 0.0 1.9 0.0 0.0 7.1 0.3
3 Tesco Express, Fulham Road (West) District Centre 0.0 0.0 0.7 0.0 0.0 0.0 0.6 4.8 1.6 0.0 7.7 0.4
3 Local Shops, Fulham Road (West) District Centre 0.0 0.0 1.4 0.0 0.0 0.0 0.0 0.0 0.0 0.0 1.4 0.1
3 Tesco Express, Old Brompton Road, South Kensington District Centre 0.0 0.3 1.6 0.0 0.0 0.0 0.0 0.0 0.0 0.0 1.9 0.1
3 Waitrose (Little), Old Brompton Road, South Kensington District Centre 0.0 0.1 1.3 0.0 0.2 0.0 0.0 0.8 0.0 0.0 2.4 0.1
Sub-Total - Town Centres South Sub-Area 0.0 0.4 71.6 0.0 5.1 2.3 13.8 9.0 3.5 0.0 105.6 5.0
Central and North Sub Area
Major Centres
2 M&S, Kensington High Street Major Centre 0.8 8.9 0.4 0.0 3.2 0.6 0.0 0.2 4.1 0.0 18.0 0.9
2 Sainsbury's Local, Kensington High Street Major Centre 0.0 2.9 0.0 0.0 0.0 0.0 0.0 0.0 0.0 0.0 2.9 0.1
2 Waitrose, Kensington High Street Major Centre 0.4 19.2 0.1 0.0 0.0 0.0 0.0 0.0 7.5 0.0 27.3 1.3
2 Whole Foods, Kensington High Street Major Centre 2.8 7.2 0.3 5.0 0.4 0.0 0.0 0.0 0.2 0.0 15.8 0.7
2 Local Shops, Kensington High Street Major Centre 0.0 2.1 0.0 0.0 0.0 0.0 0.0 0.0 0.4 0.0 2.5 0.1
District Centres
2 M&S, Notting Hill Gate District Centre 1.2 9.3 0.0 0.0 0.8 0.0 0.0 0.0 0.0 0.0 11.2 0.5
2 Tesco Metro, Notting Hill Gate District Centre 4.1 9.6 0.0 0.0 0.0 0.4 0.0 0.0 0.0 0.0 14.1 0.7
2 Waitrose (Little), Notting Hill Gate District Centre 1.2 1.0 0.0 0.0 0.2 1.6 0.0 0.0 0.0 0.0 4.1 0.2
1 Sainsbury's Local, Portobello Road District Centre 6.2 0.3 0.0 0.0 0.2 0.0 0.0 0.0 0.0 0.0 6.8 0.3
1 Tesco Metro, Portobello Road District Centre 16.9 0.0 0.0 0.0 0.0 0.0 0.0 0.0 0.0 0.0 16.9 0.8
1 Portobello Market, Portobello Road District Centre 4.8 0.5 0.0 0.2 3.5 0.0 0.0 0.0 0.0 0.1 9.0 0.4
1 Local Shops, Portobello Road District Centre 0.5 0.0 0.0 0.0 0.0 0.0 0.0 0.0 0.0 0.0 0.5 0.0
2 M&S, Earls Court Road District Centre 0.0 4.8 0.8 0.0 0.0 0.0 0.0 0.0 0.0 0.0 5.6 0.3
2 Sainsbury's Local, Earls Court Road District Centre 0.0 2.5 0.3 0.0 0.0 0.0 0.0 0.0 1.5 0.0 4.3 0.2
1 Local Shops, Westbourne Grove District Centre 0.0 0.6 0.0 0.0 0.5 0.0 0.0 0.0 0.0 0.0 1.2 0.1
Other
2 Sainsbury's Superstore, Cromwell Road Air Terminal Neighbourhood Centre 0.4 27.4 6.9 0.0 0.2 7.4 1.9 1.0 0.4 0.3 45.9 2.2
Sub-Total - Town Centres Central and North Sub Area 39.2 96.2 8.9 5.2 9.0 10.0 1.9 1.2 14.1 0.4 186.0 8.8
Out of Centre
1 Sainsbury's Superstore, Canal Way, Ladbroke Grove, W10 5AA 40.9 0.5 0.7 23.1 31.7 0.6 0.0 0.0 5.3 5.6 108.3 5.1
2 Tesco Superstore, West Cromwell Road, Kensington, W14 8PB 3.8 31.6 7.6 0.0 0.0 2.3 0.0 3.6 5.7 0.0 54.6 2.6
Sub-Total - Out of Centre Central and North Sub Area 44.7 32.1 8.3 23.1 31.7 2.9 0.0 3.6 11.0 5.6 162.9 7.7
Total Kensington & Chelsea Borough 83.8 128.7 88.8 28.2 45.8 15.1 15.7 13.9 28.5 6.0 454.5 21.6
3Sainsbury's Local, Brompton Road, Knightsbridge, SW3 1JJ
[In Knightsbridge International Centre, but outside K&C Borough ]0.0 0.0 1.3 0.0 0.0 0.2 0.0 0.0 0.0 0.0 1.4 0.1
3Waitrose (Little), Brompton Road, Knightsbridge, SW3 1JE
[In Knightsbridge International Centre, but outside K&C Borough ]0.0 0.0 3.7 0.0 0.0 1.4 0.0 0.0 0.0 0.0 5.0 0.2
5Co-Op, Westbourne Grove Special District Centre
[In Knightsbridge International Centre, but outside K&C Borough]0.1 0.0 0.0 0.0 0.5 0.0 0.0 0.0 0.0 0.0 0.6 0.0
5Sainsbury's Local, Westbourne Grove Special District Centre
[In Knightsbridge International Centre, but outside K&C Borough]0.3 0.0 0.0 0.0 9.4 0.0 0.0 0.0 0.0 0.0 9.7 0.5
4 Lidl, Edgware Road, Cricklewood, NW2 6ND 0.0 0.0 0.0 13.4 0.0 0.0 0.0 0.0 0.0 0.1 13.5 0.6
4 Sainsbury's Superstore, High Road, Willesden Green, NW10 2TD 0.0 0.0 0.0 63.9 0.0 0.0 0.0 0.0 0.0 0.0 63.9 3.0
5 Co-op, Harrow Road, Maida Hill, W9 3QA 3.2 0.0 0.0 0.0 18.4 0.0 0.0 0.0 0.0 0.0 21.6 1.0
5 Iceland, Harrow Road, Maida Hill, W9 3QA 0.0 0.0 0.0 0.0 27.9 0.6 0.0 0.0 0.0 1.1 29.7 1.4
6 Sainsbury's Superstore, Wilton Road, Pimlico, Victoria, SW1V 1DT 0.0 0.0 0.9 2.7 0.0 53.3 0.0 0.0 1.4 0.0 58.3 2.8
6 Waitrose, Motcomb Street, Belgravia, SW1X 8GG 0.0 0.0 10.9 0.0 0.0 17.7 0.0 0.0 0.0 0.0 28.6 1.4
7 Asda, Clapham Junction, Lavender Hill, SW11 1JG 0.0 0.3 0.9 0.0 0.0 0.0 69.8 1.0 1.4 0.0 73.4 3.5
7 Lidl, Falcon Lane, Battersea, SW11 2LG 0.0 0.0 3.3 0.0 0.0 1.7 20.4 3.8 0.0 0.0 29.2 1.4
7 M&S (Foodhall), St John's Road, Clapham Junction, SW11 1QP 0.0 0.0 0.0 0.0 0.0 0.0 15.9 0.0 0.0 0.0 15.9 0.8
8 Sainsbury's Superstore, Fulham Broadway, Fulham, SW6 1BW 0.0 0.0 0.0 0.0 0.0 0.0 0.0 16.1 0.0 0.0 16.1 0.8
8 Sainsbury's Superstore, Townmead Road, Fulham, SW6 2GH 0.0 0.0 2.1 0.0 0.0 0.0 8.1 26.2 1.3 0.0 37.6 1.8
8 Waitrose, North End Road, Fulham, SW6 1LU 0.0 0.2 2.4 0.0 1.0 0.0 0.0 38.8 5.5 0.0 47.9 2.3
9 Lidl, West 12 Shopping Centre, Shepherds Bush Green, W12 8PP 4.2 3.1 0.0 1.4 0.8 0.0 0.0 0.3 26.3 2.1 38.2 1.8
9 Tesco Superstore, Shepherds Bush Road, Hammersmith, W6 7NL 3.4 2.3 0.0 0.0 0.0 0.0 0.0 4.7 34.9 11.4 56.8 2.7
10 Iceland, Old Oak Common Lane, East Acton, W3 7DA 1.1 0.0 0.0 0.0 0.0 0.0 0.0 0.0 0.0 9.8 10.9 0.5
10 Tesco Metro, Harlesden Plaza, Harlesden, NW10 4NG 0.0 0.0 0.0 5.2 0.0 0.0 0.0 0.0 0.0 10.1 15.3 0.7
10 Tesco Metro, The Vale, Acton, W3 7XA 0.0 0.0 0.0 0.0 0.0 0.0 0.0 0.0 1.7 17.5 19.2 0.9
- Asda, Park Royal, Ealing, NW10 7LW 4.8 0.0 0.0 8.9 3.7 0.0 0.0 0.0 1.5 28.5 47.3 2.2
- Morrisons, High Street, Acton, W3 9LA 0.1 0.0 0.0 0.0 0.0 0.0 0.0 0.0 1.4 12.7 14.2 0.7
- Sainsbury's Superstore, Garratt Lane, Wandsworth, SW18 4AD 0.0 0.0 0.0 0.0 0.0 0.3 38.5 1.1 0.0 0.0 39.8 1.9
- Sainsbury's Superstore, Kilburn High Road, Kilburn, NW6 4HS 0.7 0.0 0.0 3.8 15.5 0.0 0.0 0.0 0.0 0.0 20.0 1.0
- Tesco Extra, Brent Park, Neasden, (Wembley Extra), NW10 0TL 2.6 0.0 0.0 14.7 1.3 0.0 0.0 0.0 0.0 22.4 41.0 1.9
Total Outside Kensington & Chelsea Borough 20.4 5.9 25.3 114.0 78.6 75.1 152.7 92.1 75.4 115.9 755.3 35.9
ALL DESTINATIONS 104.3 134.6 114.1 142.3 124.4 90.2 168.4 105.9 103.9 121.8 1,209.9 57.5
OTHER DESTINATIONS 58.3 48.5 40.7 77.5 130.4 129.2 140.8 80.4 116.5 72.6 894.9 42.5
Destinations for Convenience Goods Outside Kensington & Chelsea Borough

Kensington & Chelsea Retail and Leisure Needs Assessment 2021Convenience Goods Need Forecasts
Table 10 - Convenience Goods Allocation - Spend (£) 2041
Survey
Location
Zone
Zone 1
£m
Zone 2
£m
Zone 3
£m
Zone 4
£m
Zone 5
£m
Zone 6
£m
Zone 7
£m
Zone 8
£m
Zone 9
£m
Zone 10
£m
Total
£m
Total
%
Total Available Convenience Goods Spend - 2041 (£m) 164.1 184.1 155.9 222.7 262.0 224.9 315.0 189.7 224.5 198.0 2,140.9 100.0
Destinations for Convenience Goods in Kensington & Chelsea Borough
South Sub-Area
Major Centres
3 M&S, King's Road (East) Major Centre 0.0 0.0 13.4 0.0 0.0 0.7 4.9 0.6 1.9 0.0 21.5 1.0
3 Waitrose, King's Road (East) Major Centre 0.0 0.0 42.9 0.0 0.0 1.7 8.3 0.7 0.0 0.0 53.6 2.5
3 Local Shops, King's Road (East) Major Centre 0.0 0.0 1.4 0.0 0.0 0.0 0.0 0.0 0.0 0.0 1.4 0.1
District Centres
3 Londis, King's Road (West) District Centre 0.0 0.0 0.5 0.0 0.0 0.0 0.0 0.0 0.0 0.0 0.5 0.0
3 M&S Simply Food, Fulham Road (West) District Centre 0.0 0.0 3.7 0.0 5.0 0.0 0.3 0.2 0.0 0.0 9.1 0.4
3 Sainsbury's Local, Fulham Road (West) District Centre 0.0 0.0 5.2 0.0 0.0 0.0 0.0 2.0 0.0 0.0 7.2 0.3
3 Tesco Express, Fulham Road (West) District Centre 0.0 0.0 0.7 0.0 0.0 0.0 0.6 4.9 1.6 0.0 7.8 0.4
3 Local Shops, Fulham Road (West) District Centre 0.0 0.0 1.4 0.0 0.0 0.0 0.0 0.0 0.0 0.0 1.4 0.1
3 Tesco Express, Old Brompton Road, South Kensington District Centre 0.0 0.3 1.6 0.0 0.0 0.0 0.0 0.0 0.0 0.0 1.9 0.1
3 Waitrose (Little), Old Brompton Road, South Kensington District Centre 0.0 0.1 1.3 0.0 0.2 0.0 0.0 0.8 0.0 0.0 2.4 0.1
Sub-Total - Town Centres South Sub-Area 0.0 0.4 72.1 0.0 5.2 2.3 14.1 9.2 3.5 0.0 106.8 5.0
Central and North Sub Area
Major Centres
2 M&S, Kensington High Street Major Centre 0.8 9.0 0.4 0.0 3.3 0.6 0.0 0.2 4.2 0.0 18.3 0.9
2 Sainsbury's Local, Kensington High Street Major Centre 0.0 2.9 0.0 0.0 0.0 0.0 0.0 0.0 0.0 0.0 2.9 0.1
2 Waitrose, Kensington High Street Major Centre 0.5 19.3 0.1 0.0 0.0 0.0 0.0 0.0 7.6 0.0 27.5 1.3
2 Whole Foods, Kensington High Street Major Centre 2.8 7.2 0.3 5.0 0.4 0.0 0.0 0.0 0.2 0.0 15.9 0.7
2 Local Shops, Kensington High Street Major Centre 0.0 2.1 0.0 0.0 0.0 0.0 0.0 0.0 0.4 0.0 2.5 0.1
District Centres
2 M&S, Notting Hill Gate District Centre 1.2 9.3 0.0 0.0 0.8 0.0 0.0 0.0 0.0 0.0 11.3 0.5
2 Tesco Metro, Notting Hill Gate District Centre 4.1 9.6 0.0 0.0 0.0 0.4 0.0 0.0 0.0 0.0 14.2 0.7
2 Waitrose (Little), Notting Hill Gate District Centre 1.2 1.0 0.0 0.0 0.2 1.7 0.0 0.0 0.0 0.0 4.2 0.2
1 Sainsbury's Local, Portobello Road District Centre 6.3 0.3 0.0 0.0 0.2 0.0 0.0 0.0 0.0 0.0 6.8 0.3
1 Tesco Metro, Portobello Road District Centre 17.0 0.0 0.0 0.0 0.0 0.0 0.0 0.0 0.0 0.0 17.0 0.8
1 Portobello Market, Portobello Road District Centre 4.8 0.5 0.0 0.2 3.6 0.0 0.0 0.0 0.0 0.1 9.2 0.4
1 Local Shops, Portobello Road District Centre 0.5 0.0 0.0 0.0 0.0 0.0 0.0 0.0 0.0 0.0 0.5 0.0
2 M&S, Earls Court Road District Centre 0.0 4.8 0.8 0.0 0.0 0.0 0.0 0.0 0.0 0.0 5.6 0.3
2 Sainsbury's Local, Earls Court Road District Centre 0.0 2.5 0.3 0.0 0.0 0.0 0.0 0.0 1.5 0.0 4.4 0.2
1 Local Shops, Westbourne Grove District Centre 0.0 0.6 0.0 0.0 0.5 0.0 0.0 0.0 0.0 0.0 1.2 0.1
Other
2 Sainsbury's Superstore, Cromwell Road Air Terminal Neighbourhood Centre 0.4 27.6 7.0 0.0 0.2 7.5 1.9 1.1 0.4 0.3 46.3 2.2
Sub-Total - Town Centres Central and North Sub Area 39.5 96.7 8.9 5.3 9.3 10.2 1.9 1.2 14.3 0.4 187.8 8.8
Out of Centre
1 Sainsbury's Superstore, Canal Way, Ladbroke Grove, W10 5AA 41.3 0.5 0.7 23.4 32.6 0.6 0.0 0.0 5.4 5.7 110.2 5.1
2 Tesco Superstore, West Cromwell Road, Kensington, W14 8PB 3.8 31.8 7.6 0.0 0.0 2.4 0.0 3.7 5.8 0.0 55.1 2.6
Sub-Total - Out of Centre Central and North Sub Area 45.1 32.3 8.3 23.4 32.6 3.0 0.0 3.7 11.2 5.7 165.2 7.7
Total Kensington & Chelsea Borough 84.6 129.4 89.4 28.6 47.1 15.5 16.0 14.1 29.1 6.1 459.9 21.5
3Sainsbury's Local, Brompton Road, Knightsbridge, SW3 1JJ
[In Knightsbridge International Centre, but outside K&C Borough ]0.0 0.0 1.3 0.0 0.0 0.2 0.0 0.0 0.0 0.0 1.4 0.1
3Waitrose (Little), Brompton Road, Knightsbridge, SW3 1JE
[In Knightsbridge International Centre, but outside K&C Borough ]0.0 0.0 3.7 0.0 0.0 1.4 0.0 0.0 0.0 0.0 5.1 0.2
5Co-Op, Westbourne Grove Special District Centre
[In Knightsbridge International Centre, but outside K&C Borough]0.1 0.0 0.0 0.0 0.5 0.0 0.0 0.0 0.0 0.0 0.7 0.0
5Sainsbury's Local, Westbourne Grove Special District Centre
[In Knightsbridge International Centre, but outside K&C Borough]0.3 0.0 0.0 0.0 9.7 0.0 0.0 0.0 0.0 0.0 10.0 0.5
4 Lidl, Edgware Road, Cricklewood, NW2 6ND 0.0 0.0 0.0 13.5 0.0 0.0 0.0 0.0 0.0 0.1 13.7 0.6
4 Sainsbury's Superstore, High Road, Willesden Green, NW10 2TD 0.0 0.0 0.0 64.7 0.0 0.0 0.0 0.0 0.0 0.0 64.7 3.0
5 Co-op, Harrow Road, Maida Hill, W9 3QA 3.2 0.0 0.0 0.0 19.0 0.0 0.0 0.0 0.0 0.0 22.2 1.0
5 Iceland, Harrow Road, Maida Hill, W9 3QA 0.0 0.0 0.0 0.0 28.7 0.7 0.0 0.0 0.0 1.2 30.6 1.4
6 Sainsbury's Superstore, Wilton Road, Pimlico, Victoria, SW1V 1DT 0.0 0.0 0.9 2.8 0.0 54.6 0.0 0.0 1.4 0.0 59.7 2.8
6 Waitrose, Motcomb Street, Belgravia, SW1X 8GG 0.0 0.0 11.0 0.0 0.0 18.1 0.0 0.0 0.0 0.0 29.1 1.4
7 Asda, Clapham Junction, Lavender Hill, SW11 1JG 0.0 0.3 0.9 0.0 0.0 0.0 71.1 1.0 1.4 0.0 74.8 3.5
7 Lidl, Falcon Lane, Battersea, SW11 2LG 0.0 0.0 3.3 0.0 0.0 1.7 20.8 3.9 0.0 0.0 29.7 1.4
7 M&S (Foodhall), St John's Road, Clapham Junction, SW11 1QP 0.0 0.0 0.0 0.0 0.0 0.0 16.2 0.0 0.0 0.0 16.2 0.8
8 Sainsbury's Superstore, Fulham Broadway, Fulham, SW6 1BW 0.0 0.0 0.0 0.0 0.0 0.0 0.0 16.4 0.0 0.0 16.4 0.8
8 Sainsbury's Superstore, Townmead Road, Fulham, SW6 2GH 0.0 0.0 2.1 0.0 0.0 0.0 8.2 26.7 1.3 0.0 38.3 1.8
8 Waitrose, North End Road, Fulham, SW6 1LU 0.0 0.2 2.4 0.0 1.0 0.0 0.0 39.6 5.6 0.0 48.7 2.3
9 Lidl, West 12 Shopping Centre, Shepherds Bush Green, W12 8PP 4.3 3.1 0.0 1.4 0.8 0.0 0.0 0.3 26.8 2.1 38.8 1.8
9 Tesco Superstore, Shepherds Bush Road, Hammersmith, W6 7NL 3.5 2.3 0.0 0.0 0.0 0.0 0.0 4.8 35.5 11.6 57.8 2.7
10 Iceland, Old Oak Common Lane, East Acton, W3 7DA 1.1 0.0 0.0 0.0 0.0 0.0 0.0 0.0 0.0 10.0 11.1 0.5
10 Tesco Metro, Harlesden Plaza, Harlesden, NW10 4NG 0.0 0.0 0.0 5.3 0.0 0.0 0.0 0.0 0.0 10.3 15.6 0.7
10 Tesco Metro, The Vale, Acton, W3 7XA 0.0 0.0 0.0 0.0 0.0 0.0 0.0 0.0 1.7 17.8 19.5 0.9
- Asda, Park Royal, Ealing, NW10 7LW 4.8 0.0 0.0 9.0 3.8 0.0 0.0 0.0 1.5 29.0 48.1 2.2
- Morrisons, High Street, Acton, W3 9LA 0.1 0.0 0.0 0.0 0.0 0.0 0.0 0.0 1.5 12.9 14.5 0.7
- Sainsbury's Superstore, Garratt Lane, Wandsworth, SW18 4AD 0.0 0.0 0.0 0.0 0.0 0.3 39.2 1.1 0.0 0.0 40.5 1.9
- Sainsbury's Superstore, Kilburn High Road, Kilburn, NW6 4HS 0.7 0.0 0.0 3.9 15.9 0.0 0.0 0.0 0.0 0.0 20.5 1.0
- Tesco Extra, Brent Park, Neasden, (Wembley Extra), NW10 0TL 2.6 0.0 0.0 14.9 1.3 0.0 0.0 0.0 0.0 22.8 41.7 1.9
Total Outside Kensington & Chelsea Borough 20.6 5.9 25.5 115.5 80.8 77.0 155.5 93.7 76.8 118.0 769.4 35.9
ALL DESTINATIONS 105.3 135.3 114.9 144.1 127.9 92.5 171.6 107.9 105.8 124.1 1,229.3 57.4
OTHER DESTINATIONS 58.8 48.8 41.0 78.6 134.1 132.5 143.4 81.9 118.7 74.0 911.6 42.6
Destinations for Convenience Goods Outside Kensington & Chelsea Borough

Kensington & Chelsea Retail and Leisure Needs Assessment 2021Convenience Goods Need Forecasts
Table 11 - Convenience Goods Allocation - Spend (£) 2043
Survey
Location
Zone
Zone 1
£m
Zone 2
£m
Zone 3
£m
Zone 4
£m
Zone 5
£m
Zone 6
£m
Zone 7
£m
Zone 8
£m
Zone 9
£m
Zone 10
£m
Total
£m
Total
%
Total Available Convenience Goods Spend - 2043 (£m) 164.4 184.1 156.0 223.4 264.3 226.7 316.7 190.7 225.7 199.1 2,151.2 100.0
Destinations for Convenience Goods in Kensington & Chelsea Borough
South Sub-Area
Major Centres
3 M&S, King's Road (East) Major Centre 0.0 0.0 13.5 0.0 0.0 0.7 4.9 0.6 1.9 0.0 21.5 1.0
3 Waitrose, King's Road (East) Major Centre 0.0 0.0 42.9 0.0 0.0 1.7 8.4 0.7 0.0 0.0 53.7 2.5
3 Local Shops, King's Road (East) Major Centre 0.0 0.0 1.4 0.0 0.0 0.0 0.0 0.0 0.0 0.0 1.4 0.1
District Centres
3 Londis, King's Road (West) District Centre 0.0 0.0 0.5 0.0 0.0 0.0 0.0 0.0 0.0 0.0 0.5 0.0
3 M&S Simply Food, Fulham Road (West) District Centre 0.0 0.0 3.7 0.0 5.0 0.0 0.3 0.2 0.0 0.0 9.2 0.4
3 Sainsbury's Local, Fulham Road (West) District Centre 0.0 0.0 5.3 0.0 0.0 0.0 0.0 2.0 0.0 0.0 7.2 0.3
3 Tesco Express, Fulham Road (West) District Centre 0.0 0.0 0.7 0.0 0.0 0.0 0.6 4.9 1.7 0.0 7.9 0.4
3 Local Shops, Fulham Road (West) District Centre 0.0 0.0 1.4 0.0 0.0 0.0 0.0 0.0 0.0 0.0 1.4 0.1
3 Tesco Express, Old Brompton Road, South Kensington District Centre 0.0 0.3 1.6 0.0 0.0 0.0 0.0 0.0 0.0 0.0 1.9 0.1
3 Waitrose (Little), Old Brompton Road, South Kensington District Centre 0.0 0.1 1.3 0.0 0.2 0.0 0.0 0.8 0.0 0.0 2.4 0.1
Sub-Total - Town Centres South Sub-Area 0.0 0.4 72.2 0.0 5.2 2.3 14.2 9.2 3.6 0.0 107.1 5.0
Central and North Sub Area
Major Centres
2 M&S, Kensington High Street Major Centre 0.8 9.0 0.4 0.0 3.3 0.6 0.0 0.2 4.2 0.0 18.3 0.9
2 Sainsbury's Local, Kensington High Street Major Centre 0.0 2.9 0.0 0.0 0.0 0.0 0.0 0.0 0.0 0.0 2.9 0.1
2 Waitrose, Kensington High Street Major Centre 0.5 19.3 0.1 0.0 0.0 0.0 0.0 0.0 7.7 0.0 27.5 1.3
2 Whole Foods, Kensington High Street Major Centre 2.8 7.2 0.3 5.1 0.4 0.0 0.0 0.0 0.2 0.0 15.9 0.7
2 Local Shops, Kensington High Street Major Centre 0.0 2.1 0.0 0.0 0.0 0.0 0.0 0.0 0.4 0.0 2.5 0.1
District Centres
2 M&S, Notting Hill Gate District Centre 1.2 9.3 0.0 0.0 0.8 0.0 0.0 0.0 0.0 0.0 11.3 0.5
2 Tesco Metro, Notting Hill Gate District Centre 4.1 9.6 0.0 0.0 0.0 0.4 0.0 0.0 0.0 0.0 14.2 0.7
2 Waitrose (Little), Notting Hill Gate District Centre 1.2 1.0 0.0 0.0 0.2 1.7 0.0 0.0 0.0 0.0 4.2 0.2
1 Sainsbury's Local, Portobello Road District Centre 6.3 0.3 0.0 0.0 0.2 0.0 0.0 0.0 0.0 0.0 6.9 0.3
1 Tesco Metro, Portobello Road District Centre 17.1 0.0 0.0 0.0 0.0 0.0 0.0 0.0 0.0 0.0 17.1 0.8
1 Portobello Market, Portobello Road District Centre 4.8 0.5 0.0 0.2 3.6 0.0 0.0 0.0 0.0 0.1 9.2 0.4
1 Local Shops, Portobello Road District Centre 0.5 0.0 0.0 0.0 0.0 0.0 0.0 0.0 0.0 0.0 0.5 0.0
2 M&S, Earls Court Road District Centre 0.0 4.8 0.8 0.0 0.0 0.0 0.0 0.0 0.0 0.0 5.6 0.3
2 Sainsbury's Local, Earls Court Road District Centre 0.0 2.5 0.3 0.0 0.0 0.0 0.0 0.0 1.5 0.0 4.4 0.2
1 Local Shops, Westbourne Grove District Centre 0.0 0.6 0.0 0.0 0.6 0.0 0.0 0.0 0.0 0.0 1.2 0.1
Other
2 Sainsbury's Superstore, Cromwell Road Air Terminal Neighbourhood Centre 0.4 27.6 7.0 0.0 0.2 7.6 2.0 1.1 0.4 0.3 46.4 2.2
Sub-Total - Town Centres Central and North Sub Area 39.6 96.7 9.0 5.3 9.3 10.3 2.0 1.2 14.4 0.4 188.2 8.7
Out of Centre
1 Sainsbury's Superstore, Canal Way, Ladbroke Grove, W10 5AA 41.4 0.5 0.7 23.4 32.9 0.6 0.0 0.0 5.4 5.7 110.7 5.1
2 Tesco Superstore, West Cromwell Road, Kensington, W14 8PB 3.8 31.8 7.6 0.0 0.0 2.4 0.0 3.7 5.8 0.0 55.2 2.6
Sub-Total - Out of Centre Central and North Sub Area 45.2 32.3 8.3 23.4 32.9 3.0 0.0 3.7 11.2 5.7 165.8 7.7
Total Kensington & Chelsea Borough 84.8 129.4 89.5 28.7 47.5 15.6 16.1 14.2 29.2 6.1 461.1 21.4
3Sainsbury's Local, Brompton Road, Knightsbridge, SW3 1JJ
[In Knightsbridge International Centre, but outside K&C Borough ]0.0 0.0 1.3 0.0 0.0 0.2 0.0 0.0 0.0 0.0 1.4 0.1
3Waitrose (Little), Brompton Road, Knightsbridge, SW3 1JE
[In Knightsbridge International Centre, but outside K&C Borough ]0.0 0.0 3.7 0.0 0.0 1.4 0.0 0.0 0.0 0.0 5.1 0.2
5Co-Op, Westbourne Grove Special District Centre
[In Knightsbridge International Centre, but outside K&C Borough]0.1 0.0 0.0 0.0 0.6 0.0 0.0 0.0 0.0 0.0 0.7 0.0
5Sainsbury's Local, Westbourne Grove Special District Centre
[In Knightsbridge International Centre, but outside K&C Borough]0.3 0.0 0.0 0.0 9.8 0.0 0.0 0.0 0.0 0.0 10.1 0.5
4 Lidl, Edgware Road, Cricklewood, NW2 6ND 0.0 0.0 0.0 13.6 0.0 0.0 0.0 0.0 0.0 0.1 13.7 0.6
4 Sainsbury's Superstore, High Road, Willesden Green, NW10 2TD 0.0 0.0 0.0 65.0 0.0 0.0 0.0 0.0 0.0 0.0 65.0 3.0
5 Co-op, Harrow Road, Maida Hill, W9 3QA 3.2 0.0 0.0 0.0 19.1 0.0 0.0 0.0 0.0 0.0 22.3 1.0
5 Iceland, Harrow Road, Maida Hill, W9 3QA 0.0 0.0 0.0 0.0 29.0 0.7 0.0 0.0 0.0 1.2 30.8 1.4
6 Sainsbury's Superstore, Wilton Road, Pimlico, Victoria, SW1V 1DT 0.0 0.0 0.9 2.8 0.0 55.1 0.0 0.0 1.4 0.0 60.2 2.8
6 Waitrose, Motcomb Street, Belgravia, SW1X 8GG 0.0 0.0 11.0 0.0 0.0 18.3 0.0 0.0 0.0 0.0 29.3 1.4
7 Asda, Clapham Junction, Lavender Hill, SW11 1JG 0.0 0.3 0.9 0.0 0.0 0.0 71.5 1.0 1.4 0.0 75.2 3.5
7 Lidl, Falcon Lane, Battersea, SW11 2LG 0.0 0.0 3.3 0.0 0.0 1.7 20.9 3.9 0.0 0.0 29.8 1.4
7 M&S (Foodhall), St John's Road, Clapham Junction, SW11 1QP 0.0 0.0 0.0 0.0 0.0 0.0 16.3 0.0 0.0 0.0 16.3 0.8
8 Sainsbury's Superstore, Fulham Broadway, Fulham, SW6 1BW 0.0 0.0 0.0 0.0 0.0 0.0 0.0 16.5 0.0 0.0 16.5 0.8
8 Sainsbury's Superstore, Townmead Road, Fulham, SW6 2GH 0.0 0.0 2.1 0.0 0.0 0.0 8.3 26.8 1.3 0.0 38.5 1.8
8 Waitrose, North End Road, Fulham, SW6 1LU 0.0 0.2 2.4 0.0 1.0 0.0 0.0 39.8 5.7 0.0 49.0 2.3
9 Lidl, West 12 Shopping Centre, Shepherds Bush Green, W12 8PP 4.3 3.1 0.0 1.4 0.8 0.0 0.0 0.3 27.0 2.1 39.0 1.8
9 Tesco Superstore, Shepherds Bush Road, Hammersmith, W6 7NL 3.5 2.3 0.0 0.0 0.0 0.0 0.0 4.9 35.7 11.7 58.1 2.7
10 Iceland, Old Oak Common Lane, East Acton, W3 7DA 1.1 0.0 0.0 0.0 0.0 0.0 0.0 0.0 0.0 10.1 11.1 0.5
10 Tesco Metro, Harlesden Plaza, Harlesden, NW10 4NG 0.0 0.0 0.0 5.3 0.0 0.0 0.0 0.0 0.0 10.4 15.7 0.7
10 Tesco Metro, The Vale, Acton, W3 7XA 0.0 0.0 0.0 0.0 0.0 0.0 0.0 0.0 1.7 17.9 19.6 0.9
- Asda, Park Royal, Ealing, NW10 7LW 4.8 0.0 0.0 9.0 3.9 0.0 0.0 0.0 1.5 29.2 48.4 2.2
- Morrisons, High Street, Acton, W3 9LA 0.1 0.0 0.0 0.0 0.0 0.0 0.0 0.0 1.5 13.0 14.6 0.7
- Sainsbury's Superstore, Garratt Lane, Wandsworth, SW18 4AD 0.0 0.0 0.0 0.0 0.0 0.3 39.4 1.1 0.0 0.0 40.7 1.9
- Sainsbury's Superstore, Kilburn High Road, Kilburn, NW6 4HS 0.7 0.0 0.0 3.9 16.1 0.0 0.0 0.0 0.0 0.0 20.7 1.0
- Tesco Extra, Brent Park, Neasden, (Wembley Extra), NW10 0TL 2.6 0.0 0.0 15.0 1.3 0.0 0.0 0.0 0.0 23.0 41.9 1.9
Total Outside Kensington & Chelsea Borough 20.7 5.9 25.5 115.9 81.6 77.6 156.4 94.2 77.2 118.6 773.5 36.0
ALL DESTINATIONS 105.5 135.3 115.0 144.6 129.1 93.2 172.5 108.4 106.4 124.7 1,234.7 57.4
OTHER DESTINATIONS 58.9 48.8 41.0 78.8 135.3 133.5 144.2 82.3 119.3 74.4 916.5 42.6
Destinations for Convenience Goods Outside Kensington & Chelsea Borough

Kensington & Chelsea Retail and Leisure Needs Assessment 2021
Convenience Goods Need Forecasts
Table 12 - Convenience Goods Floorspace 2021
Total net Net Conv Net Co Average Average
floorspace Ratio Convenience Sales Turnover 2021
(sq.m)* (%) (sqm) (£ per sqm net) (£m)
RBKC - South Sub-Area
International Centre
Local Shops, Knightsbridge 1337 95% 1,270 6000 7.6
Major Centres
M&S, King's Road (East) Major Centre 1,696 95% 1,611 10,965 17.7
Waitrose, King's Road (East) Major Centre 1,633 90% 1,470 13,431 19.7
Local Shops, King's Road (East) Major Centre 1,242 95% 1,180 6,000 7.1
District Centres
Londis, King's Road (West) District Centre 84 95% 80 6,000 0.5
Local Shops, King's Road (West) District Centre 294 95% 279 6,000 1.7
M&S Simply Food, Fulham Road (West) District Centre 144 95% 137 10,965 1.5
Sainsbury's Local, Fulham Road (West) District Centre 210 95% 200 12,191 2.4
Tesco Express, Fulham Road (West) District Centre 231 95% 219 12,911 2.8
Local Shops, Fulham Road (West) District Centre 1,302 95% 1,237 6,000 7.4
Tesco Express, Old Brompton Road, South Kensington District Centre 175 95% 166 12,911 2.1
Waitrose (Little), Old Brompton Road, South Kensington District Centre 308 95% 293 13,431 3.9
Local Shops, South Kensington District Centre 1,780 95% 1,691 6,000 10.1
Local Shops, Brompton Cross District Centre 560 95% 532 6,000 3.2
Sub-Total - Town Centres South Sub-Area 10,996 - 10,365 - 87.9
RBKC - Central and North Sub Area
Major Centres
M&S, Kensington High Street Major Centre 1,347 95% 1,280 10,965 14.0
Sainsbury's Local, Kensington High Street Major Centre 203 95% 193 12,191 2.4
Waitrose, Kensington High Street Major Centre 1,351 90% 1,216 13,431 16.3
Whole Foods, Kensington High Street Major Centre 1,827 90% 1,644 12,000 19.7
Local Shops, Kensington High Street Major Centre 1,568 95% 1,490 6,000 8.9
District Centres
M&S, Notting Hill Gate District Centre 231 95% 219 10,965 2.4
Tesco Metro, Notting Hill Gate District Centre 476 95% 452 12,911 5.8
Waitrose (Little), Notting Hill Gate District Centre 245 95% 233 13,431 3.1
Local Shops, Notting Hill Gate District Centre 861 95% 818 6,000 4.9
Sainsbury's Local, Portobello Road District Centre 315 95% 299 12,191 3.6
Tesco Metro, Portobello Road District Centre 532 95% 505 12,911 6.5
Portobello Market, Portobello Road District Centre 200 100% 200 3,000 0.6
Local Shops, Portobello Road District Centre 2,436 95% 2,314 6,000 13.9
M&S, Earls Court Road District Centre 350 95% 333 10,965 3.6
Sainsbury's Local, Earls Court Road District Centre 238 95% 226 12,191 2.8
Local Shops, Earls Court District Centre 1,022 95% 971 6,000 5.8
Local Shops, Westbourne Grove District Centre 525 95% 499 6,000 3.0
Neighbourhood Centre
Sainsbury's Superstore, Cromwell Road Air Terminal Neighbourhood Centre 3,641 75% 2,731 12,191 33.3
Sub-Total - Town Centres Central and North Sub Area 17,368 - 15,623 - 150.8
RBKC - Main Out-of-Centre
Sainsbury's Superstore, Canal Way, Ladbroke Grove, W10 5AA 4,899 75% 3,674 12,191 44.8
Tesco Superstore, West Cromwell Road, Kensington, W14 8PB 4,080 75% 3,060 12,911 39.5
Sub-Total - Out-of-Centre 8,979 - 6,734 - 84.3
TOTAL RBKC 37,343 - 32,721 9,871 323.0

Kensington & Chelsea Retail and Leisure Needs Assessment 2021Convenience Goods Need Forecasts
Table 13a - Global Convenience Goods Floorspace Need - Borough-wide
2021 2026 2031 2036 2041 2043
Total Available Expenditure (Zone 1-10) (£m) 1,988.0 2,045.8 2,073.6 2,104.8 2,140.9 2,151.2
Market Share from Survey Area (Zone 1-10) (%) 22.0 22.0 22.0 22.0 22.0 22.0
Survey Area Residents Spending (a) (£m) 438.5 446.7 450.0 454.5 459.9 461.1
Convenience goods spending in Study Area (£m) 438.5 446.7 450.0 454.5 459.9 461.1
Existing Retail Floorspace (sq m net) 32,721 32,721 32,721 32,721 32,721 32,721
Sales per sqm net (£) 13,400 10,060 10,212 10,366 10,522 10,586
Sales from Existing Floorspace (£m) 438.5 329.2 334.1 339.2 344.3 346.4
Residual Spending to support new floorspace (£000) 0.0 117.5 115.9 115.4 115.6 114.8
Sales per sq m net in new shops (£) 12,000 12,230 12,414 12,602 12,792 12,869
Capacity for new floorspace (sqm net) 0 9,611 9,335 9,154 9,036 8,918
(a) Spending in: Knightsbridge; Kings Road (East); Kensington High Street; Fulham Road (West); Kings Road (West); Brompton Cross; South Kensington; Earls Court
Road; Notting Hill Gate; Portobello Road; Westbourne Grove; and out-of-centre Sainsbury's Ladbroke Grove
Sales density of -2.0% 2019; 5.4% 2020; -4.8% 2021; 0.7% 2022; 0.3% 2023-40 (source: Experian Retail Planner 18, October 2020, Figure 3a)

Kensington & Chelsea Retail and Leisure Needs Assessment 2021Convenience Goods Need Forecasts
Table 13b - Central/North Sub-Area Convenience Goods Floorspace Need
2021 2026 2031 2036 2041 2043
Total Available Expenditure (Zone 1-10) (£m) 1,988.0 2,045.8 2,073.6 2,104.8 2,140.9 2,151.2
Market Share from Survey Area (Zone 1-10) (%) 22.0 22.0 22.0 22.0 22.0 22.0
Survey Area Residents Spending (a) (£m) 336.7 342.8 345.4 348.9 353.0 354.0
Convenience goods spending in Study Area (£m) 336.7 342.8 345.4 348.9 353.0 354.0
Existing Retail Floorspace (sq m net) 22,357 22,357 22,357 22,357 22,357 22,357
Sales per sqm net (£) (b) 15,061 10,718 10,880 11,044 11,211 11,278
Sales from Existing Floorspace (£m) 336.7 239.6 243.2 246.9 250.6 252.1
Residual Spending to support new floorspace (£000) 0.0 103.2 102.2 102.0 102.4 101.9
Sales per sq m net in new shops (£) (b) 12,000 12,230 12,414 12,602 12,792 12,869
Capacity for new floorspace (sqm net) 0 8,439 8,231 8,094 8,005 7,916
(a) Spending in: Knightsbridge; Kings Road (East); Kensington High Street; Fulham Road (West); Kings Road (West); Brompton Cross; South Kensington; Earls Court
Road; Notting Hill Gate; Portobello Road; Westbourne Grove; and out-of-centre Sainsbury's Ladbroke Grove
(b) Sales density of -2.0% 2019; 5.4% 2020; -4.8% 2021; 0.7% 2022; 0.3% 2023-40 (source: Experian Retail Planner 18, October 2020, Figure 3a)

Kensington & Chelsea Retail and Leisure Needs Assessment 2021Convenience Goods Need Forecasts
Table 13c - South Sub-Area Convenience Goods Floorspace Need
2021 2026 2031 2036 2041 2043
Total Available Expenditure (Zone 1-10) (£m) 1,988.0 2,045.8 2,073.6 2,104.8 2,140.9 2,151.2
Market Share from Survey Area (Zone 1-10) (%) 22.0 22.0 22.0 22.0 22.0 22.0
Survey Area Residents Spending (a) (£m) 101.8 103.9 104.6 105.6 106.8 107.1
Convenience goods spending in Study Area (£m) 101.8 103.9 104.6 105.6 106.8 107.1
Existing Retail Floorspace (sq m net) 10,365 10,365 10,365 10,365 10,365 10,365
Sales per sqm net (£) 9,819 8,639 8,770 8,902 9,036 9,091
Sales from Existing Floorspace (£m) 101.8 89.5 90.9 92.3 93.7 94.2
Residual Spending to support new floorspace (£000) 0.0 14.3 13.7 13.4 13.2 12.9
Sales per sq m net in new shops (£) 12,000 12,230 12,414 12,602 12,792 12,869
Capacity for new floorspace (sqm net) 0 1,172 1,104 1,061 1,031 1,002
(a) Spending in: Knightsbridge; Kings Road (East); Kensington High Street; Fulham Road (West); Kings Road (West); Brompton Cross; South Kensington; Earls Court
Road; Notting Hill Gate; Portobello Road; Westbourne Grove; and out-of-centre Sainsbury's Ladbroke Grove
Sales density of -2.0% 2019; 5.4% 2020; -4.8% 2021; 0.7% 2022; 0.3% 2023-40 (source: Experian Retail Planner 18, October 2020, Figure 3a)

Appendix 2 Comparison Goods Need Forecasts

Kensington & Chelsea Retail and Leisure Needs Assessment 2021Comparison Goods Need Forecasts
Table 1: Survey Area Postcode Composition
Zone Postcode Sectors
Zone 1 NW10 5; W10 5/6; W11 1/2/4
Zone 2 SW5 0/9; SW7 4/5; W2 4; W8 4/5/6/7; W11 3; W14 8
Zone 3 SW7 2/3; SW10 0; SW3 1/2/3/4/5/6; SW10 9; SW1W 8; SW1X 0/9
Zone 4 NW2 4/5/6; NW6 7; NW10 1/2/3/9
Zone 5 NW6 5/6; W2 5/6; W9 1/2/3; W10 4
Zone 6SW7 1; SW1A 1; SW1E 5/6; SW1H 0/9; SW1P 1/2/4; SW1V 1/2/3/4/0;
SW1W 9; SW1X 7/8; W2 2/3; W1H 5/7; W1J 6/7/8; W1K 1/2/6/7; W1S 4
Zone 7 SW8 3/4/5; SW18 1/2; SW11 1/2/3/4/5; SW15 2
Zone 8 SW6 1/2/3/4/5/6/7
Zone 9 W6 0/7/8/9; W12 8/9; W14 0/9
Zone 10 NW10 4/6/8; W3 7; W12 0/7

Kensington & Chelsea Retail and Leisure Needs Assessment 2021
Comparison Goods Need Forecasts
Table 2: Survey Area Population Forecasts
Zone 1 Zone 2 Zone 3 Zone 4 Zone 5 Zone 6 Zone 7 Zone 8 Zone 9 Zone 10 TOTAL
2021 64,305 73,245 61,288 85,243 93,533 80,910 117,322 70,617 83,784 74,464 804,711
2026 64,383 73,236 61,600 86,465 97,123 84,210 120,267 72,497 85,734 75,680 821,195
2031 64,757 73,322 61,841 87,407 99,835 86,426 122,000 73,643 87,324 76,921 833,476
2036 65,417 73,722 62,282 88,473 102,548 88,319 124,455 74,986 88,717 78,277 847,196
2041 65,934 73,965 62,623 89,477 105,261 90,374 126,549 76,231 90,209 79,576 860,197
2043 66,141 74,062 62,759 89,879 106,346 91,195 127,387 76,728 90,805 80,095 865,397
Total 390,937 441,552 372,393 526,944 604,645 521,434 737,980 444,702 526,573 465,012 5,032,171
Change 2021-2026 78 -9 312 1,222 3,590 3,300 2,945 1,880 1,950 1,216 16,484
Change 2026-2031 374 86 241 942 2,712 2,216 1,733 1,146 1,590 1,241 12,281
Change 2031-2036 660 400 441 1,066 2,713 1,893 2,455 1,343 1,393 1,356 13,720
Change 2036-2041 517 243 341 1,004 2,713 2,055 2,094 1,245 1,492 1,299 13,001
TOTAL Change 2021-2043 1,836 817 1,471 4,636 12,813 10,285 10,065 6,111 7,021 5,631 60,686
Source: Experian

Kensington & Chelsea Retail and Leisure Needs Assessment, 2021Comparison Goods Need Forecasts
Table 3: Survey Area per Capita Expenditure Forecasts
Expenditure per Capita (£) SFT (%) SFT (£)Expenditure per capita
less SFT
2021 4,047 21.8% 882 3,165
2026 4,765 25.2% 1,201 3,564
2031 5,502 27.2% 1,497 4,006
2036 6,348 28.2% 1,790 4,558
2041 7,323 28.7% 2,102 5,221
2043 7,754 28.7% 2,225 5,529
Expenditure growth rates: 2020: -8.5%; 2021: 6.5%; 2022: 3.8%; 2023-2027: 3.0%; 2028-2040: 2.9%
Source: Experian E-Marketer. Expenditure growth rates and allowance for SFT are sourced from Experian Retail Planner 18 (October 2020).
Price Base: 2019

Kensington & Chelsea Retail and Leisure Needs Assessment, 2021Comparison Goods Need Forecasts
Table 4 - Survey Area Comparison Goods Expenditure
Zone 1 Zone 2 Zone 3 Zone 4 Zone 5 Zone 6 Zone 7 Zone 8 Zone 9 Zone 10 Total
(£m) (£m) (£m) (£m) (£m) (£m) (£m) (£m) (£m) (£m) (£m)
2021 203.51 231.80 193.96 269.77 296.01 256.06 371.29 223.49 265.16 235.66 2,546.71
2026 229.46 261.01 219.54 308.16 346.15 300.13 428.63 258.38 305.56 269.73 2,926.76
2031 259.39 293.70 247.71 350.12 399.90 346.19 488.68 294.99 349.79 308.12 3,338.58
2036 298.15 336.00 283.86 403.23 467.38 402.53 567.22 341.76 404.34 356.76 3,861.21
2041 344.26 386.20 326.98 467.19 549.60 471.87 660.75 398.02 471.01 415.49 4,491.37
2043 365.66 409.46 346.97 496.90 587.94 504.18 704.26 424.20 502.02 442.81 4,784.39
Change 2021-43 (£m) 162.15 177.65 153.01 227.13 291.93 248.12 332.97 200.71 236.87 207.15 2,237.69
Change 2021-2043 (%) 79.68 76.64 78.89 84.19 98.62 96.90 89.68 89.81 89.33 87.90 87.87
Source: Tables 2 and 3

Kensington & Chelsea Retail and Leisure Needs Assessment 2021Comparison Goods Need Forecasts
Table 5 - Comparison Goods Allocation - % Market Share (2021)Survey
Locatio
n
Zone
Zone 1
%
Zone 2
%
Zone 3
%
Zone 4
%
Zone 5
%
Zone 6
%
Zone 7
%
Zone 8
%
Zone 9
%
Zone 10
%
Destinations for Comparison Goods in Kensington & Chelsea Council Area
South Sub-Area (See Note A)
International Centre
6 Knightsbridge International Centre 0.1% 3.6% 2.3% 0.1% 0.7% 0.9% 0.3% 0.0% 0.6% 0.1%
Major Centres
3 King's Road (East) Major Centre 3.3% 10.1% 62.8% 0.1% 0.6% 18.6% 19.6% 18.7% 6.6% 0.5%
District Centres
3 King's Road (West) District Centre 0.0% 0.2% 4.0% 0.0% 0.2% 0.9% 0.1% 2.0% 0.0% 0.0%
3 Fulham Road (West) District Centre 0.0% 0.4% 1.8% 0.0% 0.0% 0.0% 0.3% 4.0% 0.0% 0.0%
3 Brompton Cross District Centre 0.0% 0.2% 0.0% 0.0% 0.0% 0.0% 0.0% 0.0% 0.0% 0.0%
3 South Kensington District Centre 0.0% 0.5% 0.8% 0.0% 0.0% 0.0% 0.0% 0.0% 0.3% 0.0%
Sub-Total 3.3% 15.0% 71.7% 0.2% 1.5% 20.3% 20.3% 24.7% 7.4% 0.6%
Central and North Sub Area (See Note A)
Major Centres
2 Kensington High Street Major Centre 7.8% 45.3% 8.6% 1.7% 1.8% 0.6% 0.1% 2.9% 17.7% 0.7%
District Centres
2 Notting Hill Gate District Centre 7.3% 4.4% 0.0% 0.2% 1.3% 0.7% 0.0% 0.0% 0.1% 0.8%
1 Portobello Road District Centre 4.2% 0.3% 0.0% 0.0% 0.5% 0.0% 0.0% 0.0% 0.0% 0.7%
2 Earls Court Road District Centre 0.0% 1.0% 0.3% 0.0% 0.0% 0.0% 0.0% 0.0% 0.1% 0.0%
1 Westbourne Grove District Centre 0.3% 0.4% 0.0% 0.0% 1.0% 0.3% 0.0% 0.0% 0.3% 0.0%
Out of Centre
1 Sainsbury's, Ladbroke Grove 2.7% 0.0% 0.0% 0.8% 2.6% 0.0% 0.0% 0.0% 0.9% 1.0%
Sub-Total 22.3% 51.5% 8.8% 2.8% 7.3% 1.7% 0.1% 2.9% 19.1% 3.2%
Total Kensington & Chelsea Borough 25.6% 66.5% 80.5% 3.0% 8.8% 22.0% 20.5% 27.6% 26.6% 3.8%
Destinations for Comparison Goods outside Kensington & Chelsea Borough
Kilburn 6.2% 0.0% 0.0% 9.8% 16.6% 0.0% 0.0% 0.0% 0.0% 0.2%
Kensal Rise 2.7% 0.0% 0.0% 0.7% 0.3% 0.0% 0.0% 0.0% 0.0% 0.0%
Staples Corner Retail Park, Brent Cross 4.9% 0.0% 0.0% 10.6% 2.7% 0.0% 0.0% 0.0% 0.3% 2.8%
Willesden Green 0.2% 0.0% 0.0% 4.1% 0.7% 0.0% 0.0% 0.0% 0.0% 0.0%
Maida Vale 0.1% 0.0% 0.0% 0.0% 5.0% 0.0% 0.0% 0.0% 0.0% 0.0%
Pimlico 0.0% 0.0% 0.1% 0.0% 0.0% 7.0% 0.0% 0.0% 0.0% 0.0%
Victoria 0.0% 0.3% 0.1% 0.0% 0.0% 14.1% 0.1% 0.0% 0.0% 0.0%
Clapham Junction 0.0% 0.0% 0.2% 0.0% 0.0% 0.2% 17.6% 0.5% 0.0% 0.0%
Fulham Broadway 0.0% 0.3% 0.5% 0.0% 0.0% 0.1% 0.0% 7.1% 0.4% 0.0%
Shepherds Bush Green 3.2% 0.4% 0.1% 0.1% 0.0% 0.1% 1.4% 0.4% 3.8% 3.4%
Westfield White City 22.7% 9.5% 2.2% 8.8% 7.1% 0.4% 3.7% 9.1% 17.6% 36.9%
Brent Cross 1.3% 0.0% 0.1% 25.1% 3.2% 0.0% 0.0% 0.0% 0.2% 2.5%
Central London/West End 9.7% 6.3% 4.7% 13.0% 26.1% 36.8% 9.0% 10.2% 8.8% 5.4%
Hammersmith 1.1% 1.6% 0.8% 0.1% 0.8% 0.0% 0.0% 7.5% 12.1% 7.7%
Ikea, Wembley 3.1% 2.7% 1.4% 3.6% 3.3% 0.0% 0.0% 0.2% 1.8% 4.9%
Kingston-upon-Thames 0.0% 0.2% 0.3% 0.0% 0.0% 0.0% 2.9% 1.4% 0.3% 0.0%
Marylebone 0.0% 0.0% 0.0% 0.0% 2.4% 1.9% 0.0% 0.0% 0.0% 0.0%
Putney 0.0% 0.0% 0.0% 0.3% 0.0% 0.0% 1.1% 5.8% 0.0% 0.0%
Wandsworth 0.0% 0.0% 0.0% 0.0% 0.0% 0.0% 14.8% 1.4% 0.0% 0.0%
Total Outside Kensington & Chelsea Borough 55.2% 21.4% 10.5% 76.2% 68.3% 60.6% 50.7% 43.6% 45.5% 63.8%
Total All Destinations 80.8% 87.9% 91.0% 79.2% 77.1% 82.6% 71.2% 71.2% 72.0% 67.6%
Other Destinations 19.2% 12.1% 9.0% 20.8% 22.9% 17.4% 28.8% 28.8% 28.0% 32.4%

Kensington & Chelsea Retail and Leisure Needs Assessment 2021Comparison Goods Need Forecasts
Table 6 - Comparison Goods Allocation - Spend (£) 2021
Survey
Location
Zone
Zone 1
£m
Zone 2
£m
Zone 3
£m
Zone 4
£m
Zone 5
£m
Zone 6
£m
Zone 7
£m
Zone 8
£m
Zone 9
£m
Zone 10
£m
Total
£m
Total
%
Total Available Comparison Goods Spend - 2021 203.5 231.8 194.0 269.8 296.0 256.1 371.3 223.5 265.2 235.7 2,546.7 100.0
Destinations for Comparison Goods in Kensington & Chelsea Council Area
South Sub-Area (See Note A)
International Centre
6 Knightsbridge International Centre 0.1 8.3 4.4 0.3 2.1 2.2 1.2 0.0 1.6 0.3 20.5 0.8
Major Centres
3 King's Road (East) Major Centre 6.6 23.4 121.8 0.2 1.7 47.5 72.6 41.7 17.4 1.1 334.1 13.1
District Centres
3 King's Road (West) District Centre 0.0 0.6 7.8 0.0 0.5 2.3 0.4 4.4 0.0 0.0 16.0 0.6
3 Fulham Road (West) District Centre 0.0 1.0 3.5 0.0 0.0 0.0 1.3 9.0 0.0 0.0 14.8 0.6
3 Brompton Cross District Centre 0.0 0.5 0.0 0.0 0.0 0.0 0.0 0.0 0.0 0.0 0.5 0.0
3 South Kensington District Centre 0.0 1.1 1.6 0.0 0.0 0.0 0.0 0.0 0.7 0.0 3.4 0.1
Sub-Total 6.7 34.9 139.1 0.5 4.3 52.0 75.5 55.1 19.7 1.4 389.2 15.3
Central and North Sub Area (See Note A)
Major Centres
2 Kensington High Street Major Centre 15.9 105.1 16.6 4.7 5.4 1.6 0.5 6.4 46.8 1.7 204.8 8.0
District Centres
2 Notting Hill Gate District Centre 14.9 10.2 0.0 0.7 4.0 1.8 0.0 0.0 0.3 2.0 33.7 1.3
1 Portobello Road District Centre 8.5 0.7 0.0 0.0 1.4 0.0 0.0 0.0 0.0 1.5 12.2 0.5
2 Earls Court Road District Centre 0.0 2.3 0.5 0.0 0.0 0.0 0.0 0.0 0.3 0.0 3.1 0.1
1 Westbourne Grove District Centre 0.6 1.0 0.0 0.0 3.0 0.8 0.0 0.0 0.9 0.0 6.3 0.2
Out of Centre
1 Sainsbury's, Ladbroke Grove 5.5 0.0 0.0 2.3 7.8 0.0 0.0 0.0 2.5 2.3 20.4 0.8
Sub-Total 45.3 119.3 17.1 7.6 21.6 4.3 0.5 6.4 50.7 7.4 280.4 11.0
Total Kensington & Chelsea Borough (£m) 52.0 154.2 156.2 8.1 25.9 56.3 76.0 61.6 70.4 8.8 669.6 26.3
Destinations for Comparison Goods outside Kensington & Chelsea Borough
Kilburn 12.7 0.0 0.0 26.4 49.3 0.0 0.0 0.0 0.0 0.5 88.9 3.5
Kensal Rise 5.5 0.0 0.0 2.0 1.0 0.0 0.0 0.0 0.0 0.0 8.5 0.3
Staples Corner Retail Park, Brent Cross 10.0 0.0 0.0 28.6 8.1 0.0 0.0 0.0 0.9 6.5 54.1 2.1
Willesden Green 0.4 0.0 0.0 11.0 1.9 0.0 0.0 0.0 0.0 0.1 13.4 0.5
Maida Vale 0.2 0.0 0.0 0.0 14.8 0.0 0.0 0.0 0.0 0.0 15.0 0.6
Pimlico 0.0 0.0 0.1 0.0 0.0 17.9 0.0 0.0 0.0 0.0 18.0 0.7
Victoria 0.0 0.8 0.2 0.0 0.0 36.1 0.4 0.0 0.0 0.0 37.5 1.5
Clapham Junction 0.0 0.0 0.4 0.0 0.0 0.6 65.4 1.0 0.0 0.0 67.4 2.6
Fulham Broadway 0.0 0.8 1.0 0.0 0.0 0.3 0.0 15.8 1.0 0.0 18.9 0.7
Shepherds Bush Green 6.5 1.0 0.2 0.4 0.0 0.3 5.3 0.9 10.2 8.0 32.8 1.3
Westfield White City 46.1 22.0 4.2 23.6 21.0 0.9 13.7 20.4 46.8 86.9 285.9 11.2
Brent Cross 2.7 0.0 0.3 67.6 9.6 0.0 0.0 0.0 0.6 6.0 86.7 3.4
Central London/West End 19.7 14.6 9.0 35.2 77.4 94.1 33.5 22.8 23.4 12.7 342.5 13.4
Hammersmith 2.2 3.6 1.5 0.2 2.4 0.0 0.0 16.7 32.1 18.1 76.8 3.0
Ikea, Wembley 6.4 6.1 2.7 9.8 9.7 0.0 0.0 0.5 4.8 11.5 51.5 2.0
Kingston-upon-Thames 0.0 0.5 0.5 0.0 0.0 0.0 10.9 3.2 0.8 0.0 15.9 0.6
Marylebone 0.0 0.1 0.0 0.0 7.1 4.8 0.0 0.0 0.0 0.1 12.1 0.5
Putney 0.0 0.0 0.0 0.8 0.0 0.0 4.3 13.0 0.0 0.0 18.1 0.7
Wandsworth 0.0 0.0 0.0 0.0 0.0 0.0 54.8 3.1 0.0 0.0 57.8 2.3
Total Outside Kensington & Chelsea Borough (£m) 112.4 49.5 20.3 205.6 202.2 155.1 188.2 97.4 120.5 150.4 1,301.9 51.1
Total All Destinations (£m) 164.4 203.7 176.5 213.7 228.2 211.4 264.2 159.0 191.0 159.3 1,971.4 77.4
Other Destinations (£m) 39.1 28.1 17.4 56.0 67.9 44.7 107.1 64.5 74.2 76.4 575.3 22.6

Kensington & Chelsea Retail and Leisure Needs Assessment 2021Comparison Goods Need Forecasts
Table 7 - Comparison Goods Allocation - Spend (£) 2026Survey
Location
Zone
Zone 1
£m
Zone 2
£m
Zone 3
£m
Zone 4
£m
Zone 5
£m
Zone 6
£m
Zone 7
£m
Zone 8
£m
Zone 9
£m
Zone 10
£m
Total
£m
Total
%
Total Available Comparison Goods Spend - 2026 229.5 261.0 219.5 308.2 346.1 300.1 428.6 258.4 305.6 269.7 2,926.8 100.0
Destinations for Comparison Goods in Kensington & Chelsea Council Area
South Sub-Area (See Note A)
International Centre
6 Knightsbridge International Centre 0.1 9.3 5.0 0.3 2.5 2.6 1.4 0.0 1.8 0.4 23.3 0.8
Major Centres
3 King's Road (East) Major Centre 7.5 26.3 137.8 0.2 2.0 55.7 83.8 48.3 20.1 1.2 382.9 13.1
District Centres 0.0 0.0 0.0 0.0 0.0 0.0 0.0 0.0 0.0 0.0 0.0 0.0
3 King's Road (West) District Centre 0.0 0.6 8.9 0.0 0.6 2.7 0.5 5.1 0.0 0.0 18.3 0.6
3 Fulham Road (West) District Centre 0.0 1.1 4.0 0.0 0.0 0.0 1.5 10.4 0.0 0.0 17.0 0.6
3 Brompton Cross District Centre 0.0 0.6 0.0 0.0 0.0 0.0 0.0 0.0 0.0 0.0 0.6 0.0
3 South Kensington District Centre 0.0 1.2 1.8 0.0 0.0 0.0 0.0 0.0 0.8 0.0 3.8 0.1
Sub-Total 7.6 39.3 157.4 0.5 5.1 61.0 87.1 63.7 22.7 1.6 446.0 15.2
Central and North Sub Area (See Note A)
Major Centres
2 Kensington High Street Major Centre 17.9 118.3 18.8 5.3 6.3 1.9 0.6 7.4 53.9 1.9 232.5 7.9
District Centres
2 Notting Hill Gate District Centre 16.8 11.5 0.0 0.8 4.6 2.1 0.0 0.0 0.3 2.2 38.3 1.3
1 Portobello Road District Centre 9.6 0.8 0.0 0.0 1.6 0.0 0.0 0.0 0.0 1.8 13.8 0.5
2 Earls Court Road District Centre 0.0 2.5 0.6 0.0 0.0 0.0 0.0 0.0 0.4 0.0 3.4 0.1
1 Westbourne Grove District Centre 0.7 1.2 0.0 0.0 3.5 1.0 0.0 0.0 1.0 0.0 7.3 0.2
Out of Centre
1 Sainsbury's, Ladbroke Grove 6.2 0.0 0.0 2.6 9.2 0.0 0.0 0.0 2.9 2.6 23.4 0.8
Sub-Total 51.1 134.4 19.4 8.7 25.2 5.0 0.6 7.4 58.5 8.5 318.8 10.9
Total Kensington & Chelsea Borough (£m) 58.7 173.6 176.8 9.2 30.3 66.0 87.7 71.2 81.1 10.1 764.8 26.1
Destinations for Comparison Goods outside Kensington & Chelsea Borough
Kilburn 14.3 0.0 0.0 30.2 57.6 0.0 0.0 0.0 0.0 0.6 102.7 3.5
Kensal Rise 6.2 0.0 0.0 2.3 1.1 0.0 0.0 0.0 0.0 0.0 9.6 0.3
Staples Corner Retail Park, Brent Cross 11.3 0.0 0.0 32.7 9.5 0.0 0.0 0.0 1.0 7.5 61.9 2.1
Willesden Green 0.5 0.0 0.0 12.5 2.3 0.0 0.0 0.0 0.0 0.1 15.4 0.5
Maida Vale 0.2 0.0 0.0 0.0 17.3 0.0 0.0 0.0 0.0 0.0 17.5 0.6
Pimlico 0.0 0.0 0.1 0.0 0.0 21.0 0.0 0.0 0.0 0.0 21.1 0.7
Victoria 0.0 0.9 0.3 0.0 0.0 42.4 0.4 0.0 0.0 0.0 43.9 1.5
Clapham Junction 0.0 0.0 0.5 0.0 0.0 0.7 75.5 1.2 0.0 0.0 77.9 2.7
Fulham Broadway 0.0 0.9 1.1 0.0 0.0 0.3 0.0 18.3 1.2 0.0 21.8 0.7
Shepherds Bush Green 7.3 1.1 0.3 0.4 0.0 0.3 6.1 1.1 11.8 9.1 37.5 1.3
Westfield White City 52.0 24.8 4.8 27.0 24.6 1.1 15.9 23.6 53.9 99.5 327.2 11.2
Brent Cross 3.1 0.0 0.3 77.2 11.2 0.0 0.0 0.0 0.7 6.9 99.3 3.4
Central London/West End 22.3 16.4 10.2 40.2 90.5 110.3 38.7 26.4 27.0 14.5 396.5 13.5
Hammersmith 2.5 4.1 1.7 0.3 2.8 0.0 0.0 19.3 37.0 20.7 88.3 3.0
Ikea, Wembley 7.2 6.9 3.1 11.2 11.3 0.0 0.0 0.6 5.5 13.2 59.0 2.0
Kingston-upon-Thames 0.0 0.5 0.6 0.0 0.0 0.0 12.6 3.7 0.9 0.0 18.3 0.6
Marylebone 0.0 0.1 0.0 0.0 8.3 5.6 0.0 0.0 0.0 0.1 14.1 0.5
Putney 0.0 0.0 0.0 0.9 0.0 0.0 4.9 15.0 0.0 0.0 20.9 0.7
Wandsworth 0.0 0.0 0.0 0.0 0.0 0.0 63.2 3.5 0.0 0.0 66.8 2.3
Total Outside Kensington & Chelsea Borough (£m) 126.7 55.7 23.0 234.9 236.5 181.8 217.3 112.7 138.9 172.2 1,499.7 51.2
Total All Destinations (£m) 185.4 229.4 199.8 244.1 266.8 247.8 305.0 183.9 220.1 182.3 2,264.5 77.4
Other Destinations (£m) 44.1 31.6 19.7 64.0 79.4 52.4 123.6 74.5 85.5 87.4 662.2 22.6

Kensington & Chelsea Retail and Leisure Needs Assessment 2021Comparison Goods Need Forecasts
Table 8 - Comparison Goods Allocation - Spend (£) 2031
Survey
Location
Zone
Zone 1
£m
Zone 2
£m
Zone 3
£m
Zone 4
£m
Zone 5
£m
Zone 6
£m
Zone 7
£m
Zone 8
£m
Zone 9
£m
Zone 10
£m
Total
£m
Total
%
Total Available Comparison Goods Spend - 2031 259.4 293.7 247.7 350.1 399.9 346.2 488.7 295.0 349.8 308.1 3,338.6 100.0
Destinations for Comparison Goods in Kensington & Chelsea Council Area
South Sub-Area (See Note A)
International Centre
6 Knightsbridge International Centre 0.1 10.5 5.6 0.3 2.9 2.9 1.6 0.0 2.1 0.4 26.5 0.8
Major Centres
3 King's Road (East) Major Centre 8.4 29.6 155.5 0.3 2.3 64.3 95.5 55.1 23.0 1.4 435.5 13.0
District Centres 0.0 0.0 0.0 0.0 0.0 0.0 0.0 0.0 0.0 0.0 0.0 0.0
3 King's Road (West) District Centre 0.0 0.7 10.0 0.0 0.6 3.1 0.5 5.8 0.0 0.0 20.8 0.6
3 Fulham Road (West) District Centre 0.0 1.3 4.5 0.0 0.0 0.0 1.7 11.9 0.0 0.0 19.4 0.6
3 Brompton Cross District Centre 0.0 0.7 0.0 0.0 0.0 0.0 0.0 0.0 0.0 0.0 0.7 0.0
3 South Kensington District Centre 0.0 1.4 2.0 0.0 0.0 0.0 0.0 0.0 0.9 0.0 4.3 0.1
Sub-Total 8.6 44.2 177.6 0.6 5.9 70.3 99.4 72.8 25.9 1.8 507.1 15.2
Central and North Sub Area (See Note A)
Major Centres
2 Kensington High Street Major Centre 20.3 133.2 21.2 6.1 7.3 2.2 0.7 8.5 61.8 2.2 263.3 7.9
District Centres
2 Notting Hill Gate District Centre 18.9 12.9 0.0 0.9 5.3 2.5 0.0 0.0 0.3 2.6 43.5 1.3
1 Portobello Road District Centre 10.8 0.9 0.0 0.0 1.9 0.0 0.0 0.0 0.0 2.0 15.7 0.5
2 Earls Court Road District Centre 0.0 2.9 0.6 0.0 0.0 0.0 0.0 0.0 0.4 0.0 3.9 0.1
1 Westbourne Grove District Centre 0.7 1.3 0.0 0.0 4.0 1.1 0.0 0.0 1.1 0.0 8.3 0.2
Out of Centre
1 Sainsbury's, Ladbroke Grove 7.0 0.0 0.0 3.0 10.6 0.0 0.0 0.0 3.3 3.0 26.8 0.8
Sub-Total 57.7 151.2 21.9 9.9 29.1 5.8 0.7 8.5 66.9 9.7 361.5 10.8
Total Kensington & Chelsea Borough (£m) 66.3 195.4 199.5 10.5 35.0 76.1 100.0 81.3 92.9 11.6 868.5 26.0
Destinations for Comparison Goods outside Kensington & Chelsea Borough
Kilburn 16.2 0.0 0.0 34.3 66.6 0.0 0.0 0.0 0.0 0.7 117.7 3.5
Kensal Rise 7.0 0.0 0.0 2.6 1.3 0.0 0.0 0.0 0.0 0.0 10.9 0.3
Staples Corner Retail Park, Brent Cross 12.7 0.0 0.0 37.1 10.9 0.0 0.0 0.0 1.2 8.6 70.5 2.1
Willesden Green 0.5 0.0 0.0 14.2 2.6 0.0 0.0 0.0 0.0 0.1 17.5 0.5
Maida Vale 0.2 0.0 0.0 0.0 20.0 0.0 0.0 0.0 0.0 0.0 20.2 0.6
Pimlico 0.0 0.0 0.2 0.0 0.0 24.2 0.0 0.0 0.0 0.0 24.4 0.7
Victoria 0.0 1.0 0.3 0.0 0.0 48.9 0.5 0.0 0.0 0.0 50.6 1.5
Clapham Junction 0.0 0.0 0.6 0.0 0.0 0.8 86.0 1.4 0.0 0.0 88.8 2.7
Fulham Broadway 0.0 1.0 1.2 0.0 0.0 0.4 0.0 20.9 1.3 0.0 24.8 0.7
Shepherds Bush Green 8.2 1.2 0.3 0.5 0.0 0.4 7.0 1.2 13.5 10.4 42.8 1.3
Westfield White City 58.8 27.9 5.4 30.7 28.4 1.3 18.1 27.0 61.7 113.7 372.9 11.2
Brent Cross 3.5 0.0 0.3 87.7 13.0 0.0 0.0 0.0 0.8 7.8 113.1 3.4
Central London/West End 25.2 18.4 11.5 45.6 104.6 127.3 44.1 30.1 30.9 16.6 454.3 13.6
Hammersmith 2.8 4.6 2.0 0.3 3.2 0.0 0.0 22.0 42.3 23.7 100.9 3.0
Ikea, Wembley 8.1 7.8 3.5 12.8 13.1 0.0 0.0 0.6 6.3 15.1 67.2 2.0
Kingston-upon-Thames 0.0 0.6 0.7 0.0 0.0 0.0 14.3 4.3 1.0 0.0 20.9 0.6
Marylebone 0.0 0.1 0.0 0.0 9.6 6.5 0.0 0.0 0.0 0.1 16.3 0.5
Putney 0.0 0.0 0.0 1.1 0.0 0.0 5.6 17.1 0.0 0.0 23.8 0.7
Wandsworth 0.0 0.0 0.0 0.0 0.0 0.0 72.1 4.0 0.0 0.0 76.1 2.3
Total Outside Kensington & Chelsea Borough (£m) 143.3 62.7 26.0 266.9 273.2 209.7 247.7 128.6 159.0 196.7 1,713.8 51.3
Total All Destinations (£m) 209.6 258.1 225.5 277.4 308.2 285.8 347.8 209.9 251.9 208.2 2,582.3 77.3
Other Destinations (£m) 49.8 35.6 22.2 72.7 91.7 60.4 140.9 85.1 97.9 99.9 756.2 22.7

Kensington & Chelsea Retail and Leisure Needs Assessment 2021Comparison Goods Need Forecasts
Table 9 - Comparison Goods Allocation - Spend (£) 2036
Survey
Location
Zone
Zone 1
£m
Zone 2
£m
Zone 3
£m
Zone 4
£m
Zone 5
£m
Zone 6
£m
Zone 7
£m
Zone 8
£m
Zone 9
£m
Zone 10
£m
Total
£m
Total
%
Total Available Comparison Goods Spend - 2036 298.1 336.0 283.9 403.2 467.4 402.5 567.2 341.8 404.3 356.8 3,861.2 100.0
Destinations for Comparison Goods in Kensington & Chelsea Council Area
South Sub-Area (See Note A)
International Centre
6 Knightsbridge International Centre 0.1 12.0 6.5 0.4 3.4 3.4 1.8 0.0 2.4 0.5 30.5 0.8
Major Centres
3 King's Road (East) Major Centre 9.7 33.9 178.2 0.3 2.7 74.7 110.9 63.8 26.5 1.6 502.5 13.0
District Centres 0.0 0.0 0.0 0.0 0.0 0.0 0.0 0.0 0.0 0.0 0.0 0.0
3 King's Road (West) District Centre 0.0 0.8 11.5 0.0 0.8 3.6 0.6 6.7 0.0 0.0 24.0 0.6
3 Fulham Road (West) District Centre 0.0 1.5 5.1 0.0 0.0 0.0 2.0 13.8 0.0 0.0 22.4 0.6
3 Brompton Cross District Centre 0.0 0.8 0.0 0.0 0.0 0.0 0.0 0.0 0.0 0.0 0.8 0.0
3 South Kensington District Centre 0.0 1.6 2.3 0.0 0.0 0.0 0.0 0.0 1.1 0.0 4.9 0.1
Sub-Total 9.9 50.5 203.5 0.7 6.9 81.8 115.3 84.3 30.0 2.1 585.0 15.2
Central and North Sub Area (See Note A)
Major Centres
2 Kensington High Street Major Centre 23.3 152.3 24.3 7.0 8.6 2.6 0.8 9.8 71.4 2.5 302.6 7.8
District Centres
2 Notting Hill Gate District Centre 21.8 14.8 0.0 1.0 6.2 2.9 0.0 0.0 0.4 3.0 50.0 1.3
1 Portobello Road District Centre 12.5 1.1 0.0 0.0 2.2 0.0 0.0 0.0 0.0 2.3 18.0 0.5
2 Earls Court Road District Centre 0.0 3.3 0.7 0.0 0.0 0.0 0.0 0.0 0.5 0.0 4.5 0.1
1 Westbourne Grove District Centre 0.9 1.5 0.0 0.0 4.7 1.3 0.0 0.0 1.3 0.0 9.7 0.3
Out of Centre
1 Sainsbury's, Ladbroke Grove 8.0 0.0 0.0 3.4 12.4 0.0 0.0 0.0 3.8 3.4 31.0 0.8
Sub-Total 66.4 173.0 25.1 11.4 34.1 6.7 0.8 9.8 77.4 11.3 415.8 10.8
Total Kensington & Chelsea Borough (£m) 76.2 223.5 228.6 12.1 40.9 88.5 116.1 94.2 107.4 13.4 1,000.9 25.9
Destinations for Comparison Goods outside Kensington & Chelsea Borough
Kilburn 18.6 0.0 0.0 39.5 77.8 0.0 0.0 0.0 0.0 0.8 136.7 3.5
Kensal Rise 8.1 0.0 0.0 3.0 1.5 0.0 0.0 0.0 0.0 0.0 12.6 0.3
Staples Corner Retail Park, Brent Cross 14.6 0.0 0.0 42.7 12.8 0.0 0.0 0.0 1.3 9.9 81.4 2.1
Willesden Green 0.6 0.0 0.0 16.4 3.1 0.0 0.0 0.0 0.0 0.1 20.2 0.5
Maida Vale 0.2 0.0 0.0 0.0 23.4 0.0 0.0 0.0 0.0 0.0 23.7 0.6
Pimlico 0.0 0.0 0.2 0.0 0.0 28.1 0.0 0.0 0.0 0.0 28.3 0.7
Victoria 0.0 1.2 0.3 0.0 0.0 56.8 0.5 0.0 0.0 0.0 58.9 1.5
Clapham Junction 0.0 0.0 0.6 0.0 0.0 1.0 99.8 1.6 0.0 0.0 103.0 2.7
Fulham Broadway 0.0 1.2 1.4 0.0 0.0 0.5 0.0 24.2 1.5 0.0 28.7 0.7
Shepherds Bush Green 9.5 1.4 0.4 0.6 0.0 0.4 8.1 1.4 15.6 12.0 49.4 1.3
Westfield White City 67.6 32.0 6.2 35.3 33.2 1.5 21.0 31.2 71.4 131.6 430.9 11.2
Brent Cross 4.0 0.0 0.4 101.0 15.2 0.0 0.0 0.0 0.9 9.1 130.5 3.4
Central London/West End 28.9 21.1 13.2 52.5 122.2 148.0 51.2 34.9 35.7 19.2 527.0 13.6
Hammersmith 3.3 5.2 2.3 0.4 3.7 0.0 0.0 25.5 48.9 27.4 116.6 3.0
Ikea, Wembley 9.3 8.9 4.0 14.7 15.3 0.0 0.0 0.7 7.3 17.4 77.7 2.0
Kingston-upon-Thames 0.0 0.7 0.8 0.0 0.0 0.0 16.6 4.9 1.2 0.0 24.2 0.6
Marylebone 0.0 0.1 0.0 0.0 11.2 7.5 0.0 0.0 0.0 0.1 19.0 0.5
Putney 0.0 0.0 0.0 1.2 0.0 0.0 6.5 19.9 0.0 0.0 27.6 0.7
Wandsworth 0.0 0.0 0.0 0.0 0.0 0.0 83.7 4.7 0.0 0.0 88.4 2.3
Total Outside Kensington & Chelsea Borough (£m) 164.7 71.8 29.8 307.4 319.3 243.8 287.6 149.0 183.8 227.7 1,984.8 51.4
Total All Destinations (£m) 240.9 295.3 258.4 319.5 360.2 332.3 403.6 243.2 291.2 241.1 2,985.7 77.3
Other Destinations (£m) 57.2 40.7 25.5 83.8 107.1 70.2 163.6 98.6 113.1 115.6 875.6 22.7

Kensington & Chelsea Retail and Leisure Needs Assessment 2021Comparison Goods Need Forecasts
Table 10 - Comparison Goods Allocation - Spend (£) 2041
Survey
Location
Zone
Zone 1
£m
Zone 2
£m
Zone 3
£m
Zone 4
£m
Zone 5
£m
Zone 6
£m
Zone 7
£m
Zone 8
£m
Zone 9
£m
Zone 10
£m
Total
£m
Total
%
Total Available Comparison Goods Spend - 2041 344.3 386.2 327.0 467.2 549.6 471.9 660.8 398.0 471.0 415.5 4,491.4 100.0
Destinations for Comparison Goods in Kensington & Chelsea Council Area
South Sub-Area (See Note A)
International Centre
6 Knightsbridge International Centre 0.2 13.8 7.4 0.4 4.0 4.0 2.2 0.0 2.8 0.6 35.3 0.8
Major Centres
3 King's Road (East) Major Centre 11.2 39.0 205.3 0.4 3.2 87.6 129.2 74.3 30.9 1.9 582.9 13.0
District Centres 0.0 0.0 0.0 0.0 0.0 0.0 0.0 0.0 0.0 0.0 0.0 0.0
3 King's Road (West) District Centre 0.0 0.9 13.2 0.0 0.9 4.3 0.7 7.8 0.0 0.0 27.8 0.6
3 Fulham Road (West) District Centre 0.0 1.7 5.9 0.0 0.0 0.0 2.3 16.1 0.0 0.0 26.0 0.6
3 Brompton Cross District Centre 0.0 0.9 0.0 0.0 0.0 0.0 0.0 0.0 0.0 0.0 0.9 0.0
3 South Kensington District Centre 0.0 1.8 2.6 0.0 0.0 0.0 0.0 0.0 1.2 0.0 5.7 0.1
Sub-Total 11.4 58.1 234.5 0.8 8.1 95.9 134.3 98.2 34.9 2.5 678.6 15.1
Central and North Sub Area (See Note A)
Major Centres
2 Kensington High Street Major Centre 26.9 175.1 28.0 8.1 10.1 3.0 0.9 11.5 83.2 2.9 349.6 7.8
District Centres
2 Notting Hill Gate District Centre 25.1 17.0 0.0 1.2 7.3 3.3 0.0 0.0 0.5 3.4 57.9 1.3
1 Portobello Road District Centre 14.4 1.2 0.0 0.0 2.6 0.0 0.0 0.0 0.0 2.7 20.9 0.5
2 Earls Court Road District Centre 0.0 3.8 0.8 0.0 0.0 0.0 0.0 0.0 0.5 0.0 5.1 0.1
1 Westbourne Grove District Centre 1.0 1.7 0.0 0.0 5.5 1.5 0.0 0.0 1.5 0.0 11.3 0.3
Out of Centre
1 Sainsbury's, Ladbroke Grove 9.2 0.0 0.0 4.0 14.5 0.0 0.0 0.0 4.5 4.0 36.2 0.8
Sub-Total 76.6 198.8 28.9 13.2 40.0 7.9 0.9 11.5 90.1 13.1 481.1 10.7
Total Kensington & Chelsea Borough (£m) 88.0 256.9 263.3 14.0 48.1 103.8 135.2 109.7 125.1 15.6 1,159.7 25.8
Destinations for Comparison Goods outside Kensington & Chelsea Borough
Kilburn 21.5 0.0 0.0 45.8 91.5 0.0 0.0 0.0 0.0 1.0 159.7 3.6
Kensal Rise 9.3 0.0 0.0 3.5 1.8 0.0 0.0 0.0 0.0 0.0 14.6 0.3
Staples Corner Retail Park, Brent Cross 16.9 0.0 0.0 49.5 15.0 0.0 0.0 0.0 1.6 11.5 94.6 2.1
Willesden Green 0.7 0.0 0.0 19.0 3.6 0.0 0.0 0.0 0.0 0.1 23.4 0.5
Maida Vale 0.3 0.0 0.0 0.0 27.5 0.0 0.0 0.0 0.0 0.0 27.8 0.6
Pimlico 0.0 0.0 0.2 0.0 0.0 33.0 0.0 0.0 0.0 0.0 33.2 0.7
Victoria 0.0 1.3 0.4 0.0 0.0 66.6 0.6 0.0 0.0 0.0 69.0 1.5
Clapham Junction 0.0 0.0 0.7 0.0 0.0 1.1 116.3 1.8 0.0 0.0 120.0 2.7
Fulham Broadway 0.0 1.3 1.6 0.0 0.0 0.5 0.0 28.2 1.8 0.0 33.5 0.7
Shepherds Bush Green 10.9 1.6 0.4 0.7 0.0 0.5 9.5 1.7 18.1 14.0 57.5 1.3
Westfield White City 78.0 36.7 7.1 40.9 39.0 1.7 24.4 36.4 83.1 153.3 500.7 11.1
Brent Cross 4.6 0.0 0.4 117.0 17.8 0.0 0.0 0.0 1.1 10.6 151.5 3.4
Central London/West End 33.4 24.3 15.2 60.9 143.7 173.5 59.7 40.6 41.6 22.3 615.2 13.7
Hammersmith 3.8 6.0 2.6 0.4 4.4 0.0 0.0 29.7 57.0 31.9 135.7 3.0
Ikea, Wembley 10.8 10.2 4.6 17.0 17.9 0.0 0.0 0.9 8.5 20.3 90.3 2.0
Kingston-upon-Thames 0.0 0.8 0.9 0.0 0.0 0.0 19.4 5.8 1.4 0.0 28.2 0.6
Marylebone 0.0 0.2 0.0 0.0 13.2 8.8 0.0 0.0 0.0 0.2 22.4 0.5
Putney 0.0 0.0 0.0 1.4 0.0 0.0 7.6 23.1 0.0 0.0 32.1 0.7
Wandsworth 0.0 0.0 0.0 0.0 0.0 0.0 97.5 5.4 0.0 0.0 102.9 2.3
Total Outside Kensington & Chelsea Borough (£m) 190.1 82.5 34.3 356.1 375.5 285.8 335.0 173.6 214.1 265.2 2,312.2 51.5
Total All Destinations (£m) 278.2 339.4 297.6 370.1 423.6 389.5 470.2 283.2 339.2 280.8 3,471.9 77.3
Other Destinations (£m) 66.1 46.8 29.4 97.1 126.0 82.3 190.6 114.8 131.8 134.7 1,019.5 22.7

Kensington & Chelsea Retail and Leisure Needs Assessment 2021Comparison Goods Need Forecasts
Table 11 - Comparison Goods Allocation - Spend (£) 2043
Survey
Location
Zone
Zone 1
£m
Zone 2
£m
Zone 3
£m
Zone 4
£m
Zone 5
£m
Zone 6
£m
Zone 7
£m
Zone 8
£m
Zone 9
£m
Zone 10
£m
Total
£m
Total
%
Total Available Comparison Goods Spend - 2043 365.7 409.5 347.0 496.9 587.9 504.2 704.3 424.2 502.0 442.8 4,784.4 100.0
Destinations for Comparison Goods in Kensington & Chelsea Council Area
South Sub-Area (See Note A)
International Centre
6 Knightsbridge International Centre 0.2 14.6 7.9 0.5 4.3 4.3 2.3 0.0 3.0 0.6 37.6 0.8
Major Centres
3 King's Road (East) Major Centre 11.9 41.3 217.8 0.4 3.4 93.6 137.7 79.2 32.9 2.0 620.3 13.0
District Centres 0.0 0.0 0.0 0.0 0.0 0.0 0.0 0.0 0.0 0.0 0.0 0.0
3 King's Road (West) District Centre 0.0 1.0 14.0 0.0 1.0 4.6 0.7 8.3 0.0 0.0 29.6 0.6
3 Fulham Road (West) District Centre 0.0 1.8 6.3 0.0 0.0 0.0 2.5 17.1 0.0 0.0 27.6 0.6
3 Brompton Cross District Centre 0.0 1.0 0.0 0.0 0.0 0.0 0.0 0.0 0.0 0.0 1.0 0.0
3 South Kensington District Centre 0.0 1.9 2.8 0.0 0.0 0.0 0.0 0.0 1.3 0.0 6.0 0.1
Sub-Total 12.1 61.6 248.8 0.9 8.6 102.4 143.2 104.7 37.2 2.7 722.1 15.1
Central and North Sub Area (See Note A)
Major Centres
2 Kensington High Street Major Centre 28.6 185.6 29.8 8.6 10.8 3.2 0.9 12.2 88.6 3.1 371.5 7.8
District Centres
2 Notting Hill Gate District Centre 26.7 18.0 0.0 1.2 7.9 3.6 0.0 0.0 0.5 3.7 61.6 1.3
1 Portobello Road District Centre 15.3 1.3 0.0 0.0 2.8 0.0 0.0 0.0 0.0 2.9 22.2 0.5
2 Earls Court Road District Centre 0.0 4.0 0.9 0.0 0.0 0.0 0.0 0.0 0.6 0.0 5.4 0.1
1 Westbourne Grove District Centre 1.1 1.8 0.0 0.0 5.9 1.6 0.0 0.0 1.6 0.0 12.1 0.3
Out of Centre
1 Sainsbury's, Ladbroke Grove 9.8 0.0 0.0 4.2 15.6 0.0 0.0 0.0 4.7 4.3 38.6 0.8
Sub-Total 81.4 210.8 30.6 14.0 42.8 8.4 0.9 12.2 96.1 14.0 511.4 10.7
Total Kensington & Chelsea Borough (£m) 93.5 272.4 279.4 14.9 51.5 110.9 144.1 116.9 133.3 16.6 1,233.5 25.8
Destinations for Comparison Goods outside Kensington & Chelsea Borough
Kilburn 22.8 0.0 0.0 48.7 97.9 0.0 0.0 0.0 0.0 1.0 170.3 3.6
Kensal Rise 9.9 0.0 0.0 3.7 1.9 0.0 0.0 0.0 0.0 0.0 15.5 0.3
Staples Corner Retail Park, Brent Cross 18.0 0.0 0.0 52.7 16.1 0.0 0.0 0.0 1.7 12.3 100.7 2.1
Willesden Green 0.8 0.0 0.0 20.2 3.8 0.0 0.0 0.0 0.0 0.2 24.9 0.5
Maida Vale 0.3 0.0 0.0 0.0 29.5 0.0 0.0 0.0 0.0 0.0 29.8 0.6
Pimlico 0.0 0.0 0.2 0.0 0.0 35.2 0.0 0.0 0.0 0.0 35.5 0.7
Victoria 0.0 1.4 0.4 0.0 0.0 71.2 0.7 0.0 0.0 0.0 73.7 1.5
Clapham Junction 0.0 0.0 0.8 0.0 0.0 1.2 124.0 2.0 0.0 0.0 127.9 2.7
Fulham Broadway 0.0 1.4 1.7 0.0 0.0 0.6 0.0 30.0 1.9 0.0 35.6 0.7
Shepherds Bush Green 11.6 1.7 0.4 0.7 0.0 0.5 10.1 1.8 19.3 15.0 61.2 1.3
Westfield White City 82.9 38.9 7.6 43.6 41.7 1.8 26.0 38.8 88.6 163.3 533.2 11.1
Brent Cross 4.9 0.0 0.5 124.5 19.1 0.0 0.0 0.0 1.1 11.3 161.3 3.4
Central London/West End 35.5 25.7 16.2 64.8 153.7 185.3 63.6 43.3 44.3 23.8 656.2 13.7
Hammersmith 4.0 6.4 2.8 0.4 4.7 0.0 0.0 31.6 60.7 34.0 144.6 3.0
Ikea, Wembley 11.4 10.9 4.9 18.1 19.2 0.0 0.0 0.9 9.1 21.6 96.1 2.0
Kingston-upon-Thames 0.0 0.8 0.9 0.0 0.0 0.0 20.7 6.1 1.5 0.0 30.0 0.6
Marylebone 0.0 0.2 0.0 0.0 14.1 9.4 0.0 0.0 0.0 0.2 23.9 0.5
Putney 0.0 0.0 0.0 1.5 0.0 0.0 8.1 24.6 0.0 0.0 34.2 0.7
Wandsworth 0.0 0.0 0.0 0.0 0.0 0.0 103.9 5.8 0.0 0.0 109.7 2.3
Total Outside Kensington & Chelsea Borough (£m) 202.0 87.4 36.4 378.8 401.7 305.3 357.0 185.0 228.2 282.7 2,464.5 51.5
Total All Destinations (£m) 295.5 359.8 315.8 393.7 453.2 416.2 501.2 301.8 361.5 299.3 3,697.9 77.3
Other Destinations (£m) 70.2 49.6 31.2 103.2 134.8 88.0 203.1 122.3 140.5 143.5 1,086.5 22.7

Greater Cambridge Retail and Commercial Leisure Study 2021Comparison Goods Need Forecasts
Table 12 - Existing Comparison Goods Floorspace, 2021Survey
ZoneTown Centre Net Floorspace (sq m net)
South Sub-Area (See Note A)
International Centre
6 Knightsbridge International Centre 27,944
Major Centres
3 King's Road (East) Major Centre 21,812
District Centres
3 King's Road (West) District Centre 5,418
3 Fulham Road (West) District Centre 2,835
3 Brompton Cross District Centre 9,429
3 South Kensington District Centre 2,044
Sub-Total 69,482
Central and North Sub Area (See Note A)
Major Centres
2 Kensington High Street Major Centre 17,871
District Centres
2 Notting Hill Gate District Centre 5,180
1 Portobello Road District Centre 8,652
2 Earls Court Road District Centre 1,372
1 Westbourne Grove District Centre 6,531
Sainsbury's, Ladbroke Grove 2,844
Sub-Total 42,450
TOTAL FLOORSPACE 111,932

Kensington & Chelsea Retail and Leisure Needs Assessment 2021Comparison Goods Need Forecasts
Table 13a - Global Comparison Goods Floorspace Need - Borough-wide
2021 2026 2031 2036 2041 2043
Total Available Expenditure (Zone 1-10) (£m) 2,546.7 2,926.8 3,338.6 3,861.2 4,491.4 4,784.4
Market Share from Survey Area (Zone 1-10) (%) 26 26 26 26 26 26
Survey Area Residents Spending (a) (£m) 669.6 764.8 868.5 1,000.9 1,159.7 1,233.5
Inflow to K&C (50%) from Beyond Survey Area (b) (£m) 669.6 764.8 868.5 1,000.9 1,159.7 1,233.5
Comparison goods spending in Study Area (£m) 1,339.1 1,529.6 1,737.1 2,001.7 2,319.4 2,466.9
Existing Retail Floorspace (sq m net) 111,932 111,932 111,932 111,932 111,932 111,932
Sales per sqm net (£) 11,964 13,708 15,768 18,191 20,986 22,221
Sales from Existing Floorspace (£m) 1,339.1 1,534.4 1,765.0 2,036.2 2,349.0 2,487.2
Residual Spending to support new floorspace (£000) 0.0 -4.7 -27.9 -34.4 -29.7 -20.3
Sales per sq m net in new shops (£) 10,000 11,458 13,180 15,205 17,542 18,574
Capacity for new floorspace (sqm net) 0 -413 -2,115 -2,265 -1,691 -1,095
(a) Spending in: Knightsbridge; Kings Road (East); Kensington High Street; Fulham Road (West); Kings Road (West); Brompton Cross; South Kensington; Earls Court
Road; Notting Hill Gate; Portobello Road; Westbourne Grove; and out-of-centre Sainsbury's Ladbroke Grove
(b) 2008 Retail and Town Centre evidence base, in-centre shopper surveys, recorded 55% inflow from beyond the Study Area (para.19.35)/ Reduced to 50% in the
context of changing shopping habits, and evidence demonstrating lower market share outside Zones 1-3/the borough.

Kensington & Chelsea Retail and Leisure Needs Assessment 2021Comparison Goods Need Forecasts
Table 13b - Global Comparison Goods Floorspace Need - CENTRAL AND NORTH SUB-AREA
2021 2026 2031 2036 2041 2043
Total Available Expenditure (Zone 1-10) (£m) 2,546.7 2,926.8 3,338.6 3,861.2 4,491.4 4,784.4
Market Share from Survey Area (Zone 1-10) (%) 11 11 11 11 11 11
Survey Area Residents Spending (a) (£m) 280.4 318.8 361.5 415.8 481.1 511.4
Inflow to K&C (35%) from Beyond Survey Area (b) (£m) 151.0 171.7 194.6 223.9 259.0 275.3
Comparison goods spending in Study Area (£m) 431.3 490.5 556.1 639.7 740.1 786.7
Existing Retail Floorspace (sq m net) 42,450 42,450 42,450 42,450 42,450 42,450
Sales per sqm net (£) 10,161 11,642 13,392 15,449 17,823 18,872
Sales from Existing Floorspace (£m) 431.3 494.2 568.5 655.8 756.6 801.1
Residual Spending to support new floorspace (£000) 0.0 -3.7 -12.4 -16.1 -16.5 -14.4
Sales per sq m net in new shops (£) 10,000 11,458 13,180 15,205 17,542 18,574
Capacity for new floorspace (sqm net) 0 -327 -940 -1,058 -940 -776
(a) Spending in: Kensington High Street; Earls Court Road; Notting Hill Gate; Portobello Road; Westbourne Grove; and out-of-centre Sainsbury's Ladbroke Grove
(b) 2008 Retail and Town Centre evidence base, in-centre shopper surveys, recorded 40% inflow to Central and North Sub-Area from beyond the Study Area
(para.19.35)/ Reduced to 35% in the context of changing shopping habits, and evidence demonstrating lower market share outside Zones 1-3/the borough.

Kensington & Chelsea Retail and Leisure Needs Assessment 2021Comparison Goods Need Forecasts
Table 13c - Global Comparison Goods Floorspace Need - SOUTH SUB-AREA
2021 2026 2031 2036 2041 2043
Total Available Expenditure (Zone 1-10) (£m) 2,546.7 2,926.8 3,338.6 3,861.2 4,491.4 4,784.4
Market Share from Survey Area (Zone 1-10) (%) 15 15 15 15 15 15
Survey Area Residents Spending (a) (£m) 389.2 446.0 507.1 585.0 678.6 722.1
Inflow to K&C (60%) from Beyond Survey Area (b) (£m) 583.8 669.0 760.6 877.5 1,017.9 1,083.1
Comparison goods spending in Study Area (£m) 973.0 1,115.0 1,267.7 1,462.5 1,696.5 1,805.2
Existing Retail Floorspace (sq m net) 69,482 69,482 69,482 69,482 69,482 69,482
Sales per sqm net (£) 14,004 16,045 18,457 21,293 24,565 26,010
Sales from Existing Floorspace (£m) 973.0 1,114.9 1,282.4 1,479.5 1,706.8 1,807.2
Residual Spending to support new floorspace (£000) 0.0 0.2 -14.7 -16.9 -10.3 -2.0
Sales per sq m net in new shops (£) 10,000 11,458 13,180 15,205 17,542 18,574
Capacity for new floorspace (sqm net) 0 15 -1,115 -1,113 -586 -108
(a) Spending in: Knightsbridge; Kings Road (East); Fulham Road (West); Kings Road (West); Brompton Cross; South Kensington
(b) 2008 Retail and Town Centre evidence base, in-centre shopper surveys, recorded 65% inflow to south sub-area from beyond the Study Area (para.19.35)/ Reduced
to 60% in the context of changing shopping habits, and evidence demonstrating lower market share outside Zones 1-3/the borough.

Appendix 3 Convenience Goods Floorspace Performance

Kensington & Chelsea Retail and Leisure Needs Assessment 2021Convenience Goods Need Forecasts
Table 1 ‐ Convenience Goods Floorspace Performance 2021Total net Net Conv Net Co Average Average Est. Actual Difference from Avgfloorspace Ratio Convenience Sales Turnover 2021 Turnover 2021 Turnover 2021(sq.m)* (%) (sqm) (£ per sqm net) (£m) (£m) (£m)
(Table 6)RBKC ‐ South Sub‐Area
Major Centres
M&S, King's Road (East) Major Centre 1,696 95% 1,611 10,965 17.7 20.4 2.8
Waitrose, King's Road (East) Major Centre 1,633 90% 1,470 13,431 19.7 51.5 31.7
Local Shops, King's Road (East) Major Centre 1,242 95% 1,180 5,000 5.9 1.4 ‐4.5
District Centres
Londis, King's Road (West) District Centre 84 95% 80 6,000 0.5 0.5 0.0
M&S Simply Food, Fulham Road (West) District Centre 144 95% 137 10,965 1.5 8.4 6.9
Sainsbury's Local, Fulham Road (West) District Centre 210 95% 200 12,191 2.4 6.9 4.5
Tesco Express, Fulham Road (West) District Centre 231 95% 219 12,911 2.8 7.3 4.4
Local Shops, Fulham Road (West) District Centre 1,302 95% 1,237 5,000 6.2 1.3 ‐4.9
Tesco Express, Old Brompton Road, South Kensington District Centre 175 95% 166 12,911 2.1 1.8 ‐0.3
Waitrose (Little), Old Brompton Road, South Kensington District Centre 308 95% 293 13,431 3.9 2.3 ‐1.6
Sub‐Total ‐ Town Centres South Sub‐Area 7,025 ‐ 6,592 ‐ 62.8 101.8 30.0
RBKC ‐ Central and North Sub Area
Major Centres
M&S, Kensington High Street Major Centre 1,347 95% 1,280 10,965 14.0 17.3 3.3
Sainsbury's Local, Kensington High Street Major Centre 203 95% 193 12,191 2.4 2.8 0.5
Waitrose, Kensington High Street Major Centre 1,351 90% 1,216 13,431 16.3 26.6 10.2
Whole Foods, Kensington High Street Major Centre 1,827 90% 1,644 12,000 19.7 15.4 ‐4.4
Local Shops, Kensington High Street Major Centre 1,568 95% 1,490 5,000 7.4 2.5 ‐5.0
District Centres
M&S, Notting Hill Gate District Centre 231 95% 219 10,965 2.4 11.0 8.6
Tesco Metro, Notting Hill Gate District Centre 476 95% 452 12,911 5.8 13.8 8.0
Waitrose (Little), Notting Hill Gate District Centre 245 95% 233 13,431 3.1 3.9 0.8
Sainsbury's Local, Portobello Road District Centre 315 95% 299 12,191 3.6 6.6 3.0
Tesco Metro, Portobello Road District Centre 532 95% 505 12,911 6.5 16.5 10.0
Portobello Market, Portobello Road District Centre 200 100% 200 3,000 0.6 8.6 8.0
Local Shops, Portobello Road District Centre 2,436 95% 2,314 5,000 11.6 0.5 ‐11.1
M&S, Earls Court Road District Centre 350 95% 333 10,965 3.6 5.5 1.9
Sainsbury's Local, Earls Court Road District Centre 238 95% 226 12,191 2.8 4.2 1.4
Local Shops, Westbourne Grove District Centre 525 95% 499 5,000 2.5 1.1 ‐1.4
Neighbourhood Centre
Sainsbury's Superstore, Cromwell Road Air Terminal Neighbourhood Centre 3,641 75% 2,731 12,191 33.3 44.5 11.2
Sub‐Total ‐ Town Centres Central and North Sub Area 15,485 ‐ 13,834 ‐ 135.8 180.7 44.9
RBKC ‐ Main Out‐of‐Centre
Sainsbury's Superstore, Canal Way, Ladbroke Grove, W10 5AA 4,899 75% 3,674 12,191 44.8 102.8 58.0
Tesco Superstore, West Cromwell Road, Kensington, W14 8PB 4,080 75% 3,060 12,911 39.5 53.2 13.7
Sub‐Total ‐ Out‐of‐Centre 8,979 ‐ 6,734 ‐ 84.3 156.0 71.7
TOTAL RBKC 31,489 ‐ 27,160 10,416 282.9 438.5 146.6
Related Documents