Organ Donation and Transplantation data for Black, Asian and Minority Ethnic (BAME) communities Report for 2016/2017 (1 April 2011 – 31 March 2017)

Welcome message from author
This document is posted to help you gain knowledge. Please leave a comment to let me know what you think about it! Share it to your friends and learn new things together.
Transcript
Organ Donation and Transplantation data for Black, Asian and Minority Ethnic (BAME)
communities
Report for 2016/2017 (1 April 2011 – 31 March 2017)

II
CONTENTS
1 EXECUTIVE SUMMARY .................................................................................. 1
2 INTRODUCTION .............................................................................................. 3
3 ORGAN DONOR REGISTER (ODR) ............................................................... 3
4 DECEASED ORGAN DONORS, TRANSPLANT RECIPIENTS AND TRANSPLANT WAITING LIST PATIENTS ..................................................... 6
Kidney statistics ............................................................................................ 10 Pancreas and kidney/pancreas statistics ...................................................... 11 Cardiothoracic organ statistics ...................................................................... 12
Liver statistics ............................................................................................... 13 Waiting times to transplant ........................................................................... 14
5 LIVING DONORS AND RECIPIENTS ............................................................ 16
6 POTENTIAL ORGAN DONORS .................................................................... 19
APPENDIX ........................................................................................................... 25

1
1 EXECUTIVE SUMMARY
This report provides information related to organ donation and transplantation within the Black, Asian and Minority Ethnic (BAME) communities in the UK. It is published as a supplementary report of the Organ Donation and Transplantation Activity Report 2016/17. There has been a small increase in the proportion of BAME registrants added to the Organ Donor Register (ODR) over the past 5 years; 5.0% in 2012/13 and 6.8% 2016/17. Pakistani, Bangladeshi, Black Caribbean, Chinese and African ethnicities are most poorly represented on the ODR relative to the current UK population. Black, Asian and minority ethnic (BAME) groups represent 11% of the UK population (ONS mid-2011 estimates). Asians represent 5.1% of the UK population while 2.5% of the population are Black and 3.2% are from other minority ethnic groups. In contrast, at the end of the 2016/17 financial year, 34% of the total number of patients on the waiting list for a kidney transplant were BAME, reflecting a demand for kidney transplantation in excess of that for White patients. This is believed to be attributable to a higher burden of diabetes and kidney disease associated with the BAME communities. For other organs the demand is in line with that for the White population; however the proportion of BAME patients is 16% on the liver transplant list and only 7% of liver donors are of BAME ethnicity in 2016/17. Allied to the higher demand for kidney transplantation for BAME patients, 28% of kidney transplants in 2016/17 were in BAME recipients. This demonstrates a gap between the need for transplantation and the number of transplants taking place for BAME patients. This explains the longer waiting time to kidney transplant for BAME patients (approx. 2½ years, compared with 2 years for White patients). This disadvantage for BAME patients arises partly from the need to match kidney donors and recipients according to blood and tissue types. Blood and tissue types differ across ethnic groups and the fact that only 6% of organ donors in the UK are from minority ethnic groups makes it very difficult to find suitable matching kidneys for BAME patients on the transplant list. In response to this challenge, the UK Kidney Allocation Scheme that was introduced in 2006 included measures to help all disadvantaged patients who wait a long time for transplant. This made a difference for BAME patients and the subsequent increase in deceased donor numbers has also contributed to fewer BAME patients on the kidney transplant list and a fall in median waiting time for BAME patients from 4 years to 2½ years over the last seven years. White patients have seen a smaller fall in median waiting time (from 3 years to 2 years). The Kidney Allocation Scheme is currently being reviewed with a view to further changes to help achieve more equitable waiting times. For other organs there is a need to match blood groups, but less or no requirement to match tissue types and thus BAME patients can more readily be matched to suitable donors and the waiting times are not longer than for White patients. Transplant rates are also broadly in line with demand as reflected by the transplant waiting lists.

2
The question thus arises for kidney patients about how, in addition to changes in kidney allocation, donor rates from BAME communities can be increased so that BAME patients can achieve more equitable access to kidney transplantation. The data in this report show that the number of BAME deceased donors has increased, but numbers are still small: 90 (6%) BAME organ donors in 2016/17. The number of eligible BAME organ donors identified in the Potential Donor Audit indicates little increase in eligible DBD (13%) and only 1 additional eligible DCD donor. There has however been a 10% increase in the number of consented/authorised DBD donors, and an 8% increase in the number of consented/authorised DCD donors. The DBD consent/authorisation rate has remained fairly constant in recent years; the DCD consent/authorisation rate for BAME patients has increased by 5% since 2015/16. However despite this increase, only half as many families support organ donation relative to families of white potential donors. The same is true for DBD. In terms of living organ donation, the figures show a fall in both Asian and Black communities, both in terms of absolute numbers of donors and as a proportion of all living organ donors. The reasons for this trend are not clear but living kidney donor transplantation is an important option for those in need of a transplant, particularly as it can mean that months or years of dialysis may be avoided. While the increase in DCD BAME consent/authorisation rate is very positive for the many BAME patients on the transplant lists, more work needs to be done to further increase the possibilities for transplant for BAME patients. Importantly, the consent/authorisation rates for organ donation in BAME communities need further effort to increase, while the advantages of living kidney donation may also need to be the subject of awareness campaigns.

3
2 INTRODUCTION
This report provides information related to organ donation and transplantation within the Black, Asian and Minority Ethnic (BAME) communities in the UK. It is published as a supplementary report of the Organ Donation and Transplantation Activity Report 2016/17. Data analysed include registrants on the NHS Organ Donor Register (ODR), deceased and living organ donors, transplant recipients, patients on the transplant lists and waiting times to transplant. Trends in relation to potential organ donors, including donation consent/authorisation rates1, are also reported. The categories currently used to collect data on ethnicity are not consistent between these data sources, and the information is provided in as much detail as is available. The information reported is from the last 6 financial years, unless otherwise stated.
3 ORGAN DONOR REGISTER (ODR)
The primary sources of ODR registrations in 2016/17 were the Driver and Vehicle Licensing Agency (58%), online registrations (30%), GP registration2 (9%), Boots Advantage card (2%) and NHSBT leaflets (1%). Most sources of registration onto the ODR provided by NHSBT’s partners do not have an option to record or report ethnicity. Even when the option is available, it is not possible to tell how many people choose not to provide the information when registering via these routes. Consequently, 30% of registrants to the ODR in 2016/17 have their ethnicity recorded compared to 24% in 2012/13. This significant increase in reporting is largely due to increased online registrations where ethnicity can be recorded. Table 1 shows the number of registrations per year by ethnicity from 1 April 2012 to 31 March 2017. In 2016/17, 93.2% of registrations with ethnicity recorded were from White ethnic groups, 3.1% from Asian, 0.9% from Black, 0.3% from Chinese, 1.9% from Mixed, and 0.6% from other ethnic groups. Ethnicity was not reported for 70% of all registrations. While it is estimated that 10.8% of the current UK population is BAME (using the 2011 census data from the Office for National Statistics (ONS)), only 5.8% of ODR registrants of known ethnicity in 2010/11 were BAME with a slight increase to 6.8% in 2016/17.
1 The consent/authorisation rate is the percentage of eligible donor families or appointed /nominated
representatives approached for formal organ donation discussion where consent/authorisation was ascertained 2 Please note that a back-log of registration activity made via the UK GP Services is not accounted for
in these figures. These registrations will be uploaded in due course and reflected in future reports.

4
Table 1 Ethnicity of all ODR registrations by year of registration, 1 April 2011 - 31 March 2017
2011/12
2012/13
2013/14 2014/15
2015/16 2016/17
N %
N %
N %
N %
N % N %
White British 147,972 83.9 216,140 89.7 197,988 87.6 186,072 85.3 395,204 86.9 301,917 84.9
Irish 5,955 3.4 5,557 2.3 5,772 2.6 8,235 3.8 12,209 2.7 9,502 2.7
Other 7,454 4.2 7,269 3.0 8,573 3.8 10,241 4.7 20,923 4.6 20,140 5.7
Total 161,381 91.5 228,966 95.0 212,333 93.9 204,548 93.7 428,336 94.2 331,559 93.2
Asian Indian 6,814 3.9 4,050 1.7 4,897 2.2 4,775 2.2 7,150 1.6 6,443 1.8
Pakistani 629 0.4 516 0.2 696 0.3 638 0.3 1,242 0.3 1,362 0.4
Bangladeshi 128 <0.1 104 <0.1 126 <0.1 156 <0.1 339 <0.1 328 0.1
Other 991 0.6 894 0.4 1,057 0.5 1,195 0.5 2,898 0.6 2,992 0.8
Total 8,562 4.9 5,564 2.3 6,776 3.0 6,764 3.1 11,629 2.6 11,126 3.1
Black Caribbean 1,023 0.6 889 0.4 981 0.4 885 0.4 1,655 0.4 1,458 0.4
African 884 0.5 709 0.3 861 0.4 884 0.4 1,725 0.4 1,617 0.5
Other 115 <0.1 111 <0.1 96 <0.1 122 <0.1 246 <0.1 248 0.1
Total 2,022 1.1 1,709 0.7 1,938 0.9 1,891 0.9 3,626 0.8 3,323 0.9
Mixed White/Black Caribbean 455 0.3 439 0.2 425 0.2 403 0.2 853 0.2 2,041 0.6
White/Black African 987 0.6 1,185 0.5 1,212 0.5 1,128 0.5 2,339 0.5 707 0.2
White/Asian 1,028 0.6 1,187 0.5 1,178 0.5 1,157 0.5 2,429 0.5 2,086 0.6
Other 733 0.4 811 0.3 848 0.4 905 0.4 2,010 0.4 1,812 0.5
Total 3,203 1.8 3,622 1.5 3,663 1.6 3,593 1.6 7,631 1.7 6,646 1.9
Chinese 537 0.3 527 0.2 577 0.3 598 0.3 1,207 0.3 1,114 0.3
Other 607 0.3 678 0.3 792 0.4 860 0.4 2,142 0.5 1,985 0.6
Total reported 176,312 100.0 241,066 100.0 226,079 100.0 218,254 100.0 454,571 100.0 355,753 100.0
Not reported (% not reported) 911,556 (83.8) 755,920 (75.8) 820,224 (78.4) 763,476 (77.8) 921,336 (67.0) 822,149 (69.8)
TOTAL REGISTRATIONS
1,087,868 996,986 1,046,303 981,730 1,375,907 1,177,902

5
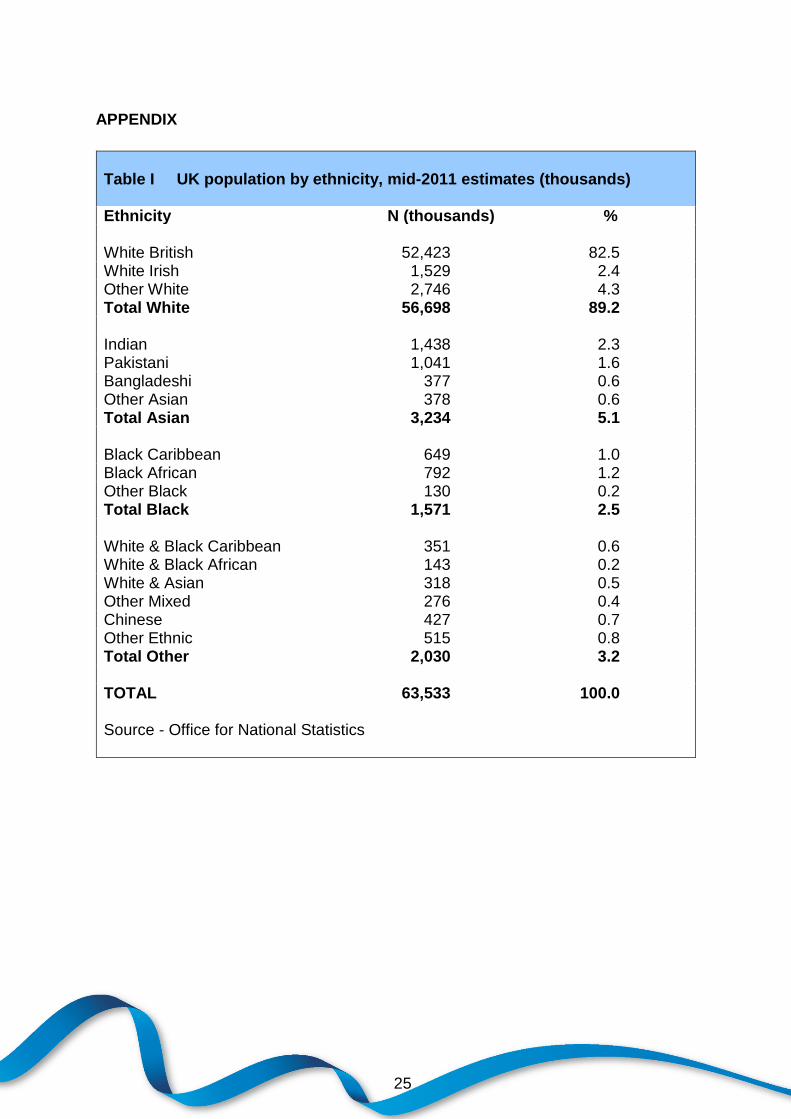
Given the increase in proportion of registrants for whom ethnicity is recorded, it is not meaningful to compare absolute numbers of people registering each year. However, looking at proportions of those with ethnicity reported is meaningful. If it is assumed that the proportions are representative of all ODR registrants, it is possible to see differences relative to the current population of the UK (Appendix, Table I). Table 2 shows data on percentage of the ODR registrations in 2010/11 and 2016/17 against the percentage of the general population. The data suggest that Pakistani, Bangladeshi, Black Caribbean, Chinese and African ethnicities are most poorly represented on the ODR relative to the current UK population.
Table 2 BAME registrants on the ODR vs the UK population
Ethnicity 2010/11
% of the ODR registrants
1
2016/17 % of the ODR registrants
1
2011 % of the
population2
Asian – Indian 1.9 1.8 2.3
Asian - Pakistani 0.3 0.4 1.6
Asian - Bangladeshi <0.1 0.1 0.6
Black African 0.4 0.5 1.2
Black Caribbean 0.4 0.4 1.0
Chinese 0.3 0.3 0.7
Mixed race 1.7 1.9 1.7
Other ethnicity 0.8 1.5 1.6
Total BAME 5.8 6.8 10.8
1 Where ethnicity reported
2 Source – Office for National Statistics

6
4 DECEASED ORGAN DONORS, TRANSPLANT RECIPIENTS AND TRANSPLANT WAITING LIST PATIENTS
In this section data capture does not allow for a more detailed breakdown of ethnicity and overall, <1% of recipients and donors did not have ethnicity recorded. Figure 1 and Table 3 demonstrate the proportion of all deceased donors and transplants made up by BAME donors and recipients, out of all deceased donors and transplants in the UK in the last 6 financial years. The proportion of deceased donor transplants with a BAME recipient has increased from 17.1% in 2011/12 to 22.0% in 2016/17. The proportion of BAME deceased donors in the UK is only 6.4% in 2016/17, however this proportion is the highest over the given time frame.
17.1
4.2
19.1
4.6
20.2
5.6
21.1
6.2
22.4
4.9
22.0
6.4
2011/12 2012/13 2013/14 2014/15 2015/16 2016/17
Year
0
5
10
15
20
25
30
Pe
rce
nta
ge
Deceased donorsDeceased donor transplant recipients
Figure 1 BAME donors and recipients as a percentage of all deceased donors and deceased
donor transplant recipients in the UK, 1 April 2011 - 31 March 2017

7
Table 3 BAME deceased donors and deceased donor transplants in the UK,1 April 2011 - 31 March 2017, by financial year
Number of BAME deceased donors
Financial year
Number of BAME recipient transplants
% of total transplants
1 DBD DCD Total
% of total donors
1
2011/12 499 17.1 35 11 46 4.2 2012/13 595 19.1 38 17 55 4.6 2013/14 706 20.2 54 17 71 5.6 2014/15 701 21.1 54 26 80 6.2 2015/16 782 22.4 49 18 67 4.9 2016/17 809 22.0 62 28 90 6.4
1 Where ethnicity reported
The ethnic minority groups of deceased organ donors and recipients in each year from 2011/12 to 2016/17 and patients on the transplant list at 31 March each year is shown in Figure 2. The information for all patients (including White donors and recipients) in this time frame is separated by organ in Figures 3 to 6. Overall there has been an increase in the number of deceased BAME organ donors over the last 6 years (Figure 2) with the largest increase in 2016/17: from 46 in 2011/12 to 90 in 2016/17 (96% increase). There has also been a notable increase in the number of transplant recipients from BAME background: an increase of 62% from 499 recipients in 2011/12 to 809 recipients in 2016/17. Alongside the increasing numbers of ethnic minority patients receiving a transplant is a fall in the number of patients on the transplant lists. In 2011/12 there were 2,047 BAME recipients on the waiting list and in 2016/17 the number had decreased to 1,865, showing a 9% decrease. Figure 2 also demonstrates that the make-up of the ethnic minority patients listed and transplanted has changed very little over the time period analysed. However, the ethnic-make up for BAME deceased donors has fluctuated within each ethnic group.

8
Asian 16 20 39 32 27 29 298 353 400 417 469 487 1186 1140 1123 1082 1026 1009
Black 12 20 17 20 20 22 136 169 215 197 216 232 651 643 637 668 614 634
Oriental 2 4 2 3 3 4 26 31 39 45 36 32 95 94 91 88 73 73
Mixed 7 6 8 10 6 14 8 12 9 7 14 12 17 20 21 25 25 33
Other 9 5 5 15 11 21 31 30 43 35 47 46 98 111 88 94 98 116
(exluding White people),1 April 2011 - 31 March 2017
Figure 2 Deceased donors, transplant recipients and patients on the waiting list
Other
Mixed
Oriental
Black
Asian
58
32
515
57
32
516
57
33
514
55
34
415
56
33
415
54
34
426
58 57 57 55 56 54
5 6 4 5 5 6
60
27
526
59
28
525
57
30
616
59
28
615
60
28
526
60
29
416
60 59 57 59 60 60
6 5 6 5 6 6
35
26
4
15
20
36
36
7
11
9
55
24
3
11
7
40
25
4
13
19
40
30
4
9
16
32
24
4
16
23
35 36
55
40 4032
20
9 7
19 1623
2011/12
2012/13
2013/14
2014/15
2015/16
2016/17
2011/12
2012/13
2013/14
2014/15
2015/16
2016/17
2011/12
2012/13
2013/14
2014/15
2015/16
2016/17
0
20
40
60
80
100
Pe
rce
nta
ge
Waiting list patientsTransplant recipientsDonors

9
Table 4 is a summary of all deceased donor transplants in 2016/17 by country of transplant, ethnicity of recipient and organ
transplanted. Patients in Wales, Scotland and Northern Ireland requiring transplants that are not undertaken in that country are referred
to another UK country (usually England) for transplantation.
Table 4 Deceased donor transplants, 1 April 2016 - 31 March 2017, by country of transplant and organ Country of transplant
Transplants (N)
Kidney Pancreas1
Kidney/ Pancreas
2 Heart Lung Liver Intestinal Multiorgan
3 Total
England White 1263 31 122 150 175 708 2 20 2471 Asian 358 1 9 17 1 76 1 7 470 Black 183 5 11 31 230 Chinese/Oriental 23 2 6 31 Mixed 9 1 2 12 Other 37 1 6 1 1 46
Wales White 45 1 4 50 Asian 4 4
Scotland White 153 17 19 14 97 1 301 Asian 8 1 4 13 Black 1 1 2 Chinese/Oriental 1 1
Northern Ireland White 45 45 1 Includes 33 islet transplants
2 Includes 1 simultaneous islet and kidney transplant
3 Includes 2 heart/lung transplants, 1 liver, bowel and pancreas transplant, 7 modified multivisceral transplants, 14 liver and kidney
transplants and 1 heart and kidney transplant.

10
White 988 1097 1174 1130 1232 1243 1425 1473 1592 1497 1589 1661 4673 4386 3942 3785 3487 3416
Asian 15 19 35 29 25 27 215 260 311 328 352 384 1114 1074 1039 990 944 923
Black 11 18 15 19 17 17 109 146 171 161 184 189 629 617 605 631 580 600
Other 17 13 18 26 18 34 43 46 59 64 71 70 183 198 182 176 178 204
Figure 3 Kidney statistics, 1 April 2011 - 31 March 2017
Other
Black
Asian
White
71
17
10
3
70
17
10
3
68
18
10
3
68
18
11
3
67
18
11
3
66
18
12
4
71 70 68 68 67 66
80
12
6
2
77
14
8
2
75
15
8
3
73
16
8
3
72
16
8
3
72
17
8
3
80 77 75 73 72 72
96
112
96
221
95
311
94
222
95
211
94
213
96 96 95 94 95 94
2011/12
2012/13
2013/14
2014/15
2015/16
2016/17
2011/12
2012/13
2013/14
2014/15
2015/16
2016/17
2011/12
2012/13
2013/14
2014/15
2015/16
2016/17
0
20
40
60
80
100
Per
cent
age
Waiting list patientsTransplant recipientsDonors
Kidney statistics
There has been an 81% increase in deceased BAME kidney donors from 43 to 78 donors over the last 6 years, thus representing
6% of all deceased kidney donors with known ethnicity in 2016/17. There has been an increase in the proportion of BAME patients
registered for a kidney transplant: 29% compared to 34% of all patients on the list at the end of 2011/12 and 2016/17 respectively.
There has also been an increase in the proportion of BAME patients receiving a kidney transplant: 20% of all kidney transplants in
2011/12 compared with 28% in 2016/17.

11
White 384 426 428 422 445 441 217 206 220 203 191 194 230 246 243 230 206 193
Asian 9 6 13 14 10 9 16 13 12 10 13 10 14 11 14 10 12 12
Black 5 12 5 12 6 7 4 12 9 4 7 5 7 9 6 8 8 13
Other 12 7 10 15 6 16 2 0 3 4 3 0 1 6 1 2 0 3
Figure 4 Pancreas and kidney/pancreas statistics, 1 April 2011 - 31 March 2017
Other
Black
Asian
White91
6
30
90
432
92
520
92
431
91
5
40
87
5
61
91 90 92 92 9187
91
7
21
89
6
50
90
5
41
92
522
89
6
31
93
520
91 89 90 92 899394
213
94
132
94
312
91
333
95
211
93
213
94 94 94 9195 93
2011/12
2012/13
2013/14
2014/15
2015/16
2016/17
2011/12
2012/13
2013/14
2014/15
2015/16
2016/17
2011/12
2012/13
2013/14
2014/15
2015/16
2016/17
0
20
40
60
80
100
Per
cent
age
Waiting list patientsTransplant recipientsDonors
Pancreas and kidney/pancreas statistics
Over the last 6 years the proportion of BAME pancreas donors has remained relatively stable at around 6-7% (22-41 donors per year). The number of BAME patients on the pancreas waiting list (including kidney/pancreas patients) has increased from 22 (9%) in 2011/12 to 28 (13%) in 2016/17. Conversely, the number of BAME pancreas or kidney/pancreas transplant recipients has decreased from 22 (9%) in 2011/12 to 15 (7%) in 2016/17. This decrease coincides with a fall in the number of pancreas transplants overall in 2016/17 and there was also a reduction in the total number of patients on the waiting list as at 31 March 2017.

12
White 241 279 320 287 303 281 299 311 377 337 329 340 371 403 473 534 517 560
Asian 5 5 8 9 12 8 15 17 19 21 34 21 15 23 28 35 34 37
Black 4 6 6 7 3 5 4 4 7 5 11 11 8 8 15 21 19 21
Other 8 3 8 10 6 11 3 4 6 0 6 4 7 8 9 11 7 7
Figure 5 Cardiothoracic statistics, 1 April 2011 - 31 March 2017
Other
Black
Asian
White93
422
91
522
90
5
32
89
6
32
90
6
31
90
6
31
93 91 90 89 90 9093
511
93
511
92
521
93
610
87
9
32
90
6
31
93 93 92 9387
9093
223
95
221
94
222
92
323
94
412
92
324
93 95 94 92 94 92
2011/12
2012/13
2013/14
2014/15
2015/16
2016/17
2011/12
2012/13
2013/14
2014/15
2015/16
2016/17
2011/12
2012/13
2013/14
2014/15
2015/16
2016/17
0
20
40
60
80
100
Per
cent
age
Waiting list patientsTransplant recipientsDonors
Cardiothoracic organ statistics
The proportion of cardiothoracic (heart and/or lung) BAME donors has fluctuated between 5% and 8% of all cardiothoracic organ donors (14-26 donors per year) between 2011/12 and 2016/17. The proportion of cardiothoracic organ transplants for BAME patients has increased from 7% to 10% in the given time frame. Alongside this the proportion of BAME recipients on the waiting list has also increased from 7% to 10%.

13
White 743 776 876 858 958 964 630 666 748 723 753 815 460 409 466 512 505 445
Asian 14 19 27 25 22 17 66 76 72 65 83 84 58 46 55 60 50 54
Black 11 17 13 16 15 18 23 17 34 30 22 32 15 19 19 20 18 18
Other 14 13 15 25 15 31 18 24 25 24 20 14 20 18 9 19 11 13
Figure 6 Liver statistics, 1 April 2011 - 31 March 2017
Other
Black
Asian
White
83
10
34
83
9
44
85
10
32
84
10
33
86
9
32
84
10
32
83 83 85 84 86 8485
9
32
85
10
23
85
8
43
86
8
43
86
9
32
86
9
31
85 85 85 86 86 86
95
212
94
222
94
312
93
323
95
211
94
223
95 94 94 93 95 94
2011/12
2012/13
2013/14
2014/15
2015/16
2016/17
2011/12
2012/13
2013/14
2014/15
2015/16
2016/17
2011/12
2012/13
2013/14
2014/15
2015/16
2016/17
0
20
40
60
80
100
Per
cent
age
Waiting list patientsTransplant recipientsDonors
Liver statistics
The number of BAME liver donors has increased from 39 in 2011/12 to 66 (69% increase) in 2016/17, while the proportion of BAME liver donors is largely unchanged at 5% to 7%. The proportion of liver transplants that are for BAME patients has remained stable ranging from 14% to 15%. The proportion of BAME patients on the liver transplant list has slightly decreased: from 17% in 2011/12 to 16% in 2016/17.

14
Waiting times to transplant
Median waiting times (in months) are provided for adult and paediatric patients for each organ where possible in Table 5.This shows longer waiting times for ethnic minority patients to receive a kidney transplant: adult White patients have an average (median) waiting time of 806 days (approximately 2 years), whereas adult Asian and Black patients have median waiting times of 2½ years (962 days) and just under 3 years (1074 days), respectively. These waiting times are shorter than reported six years ago (for patients registered 2005-2009): waiting times then were 3 years for White patients and 4 years for all minority ethnic groups. Minority paediatric kidney patients also wait longer for transplant, while minority pancreas patients wait a shorter time than white patients. For cardiothoracic organ transplants the small number of minority patients registered does not lead to meaningful estimates of waiting times. Finally, for liver transplantation, Black and White patients both wait approximately 5 months, while Asian patients wait an average of 4 months for transplant. It should be noted that none of these waiting times are risk-adjusted for other influential factors, and thus should be interpreted with some caution.

15
Table 5 Median waiting time to transplant in the UK
Ethnicity Number of patients Waiting time (days) registered Median 95% Confidence interval
Adult kidney1
White 6312 806 785 - 827 Asian 1447 962 917 - 1007 Black 789 1074 1025 - 1123 Other 259 929 863 - 995 TOTAL 8921 864 845 - 883
Paediatric kidney1
White 155 222 156 - 288 Asian 69 397 194 - 600 Black 20 323 0 - 669 Other 9 - - TOTAL 259 266 205 - 327
Adult pancreas2
White 881 355 334 - 376 Asian 53 279 196 - 362 Black 38 279 219 - 339 Other 12 320 107 - 533 TOTAL 998 346 329 - 363
Adult never urgent heart3
White
260 1283 590 - 1976 Asian 11 143 0 - 357 Black
6 12 - -
TOTAL 290 1280 703 - 1857
Adult ever urgent heart3,5
White 351 23 18 - 28 Asian 32 43 27 - 59 Black 11 71 65 - 77 Other 10 38 5 - 71 TOTAL 408 26 21 - 31
Paediatric never urgent heart3
24 463 0 - 1460
Paediatric ever urgent heart3,5
116 70 41 - 99
Adult lung3
White 756 239 202 - 276 Asian
24 1217 121 - 2313
Black 6 - - Other 3 - - TOTAL 793 255 216 - 294
Adult liver4
White 2388 142 130 - 154 Asian 185 118 85 - 151 Black 74 150 99 - 201 Other 56 92 53 - 131 TOTAL 2703 138 127 - 149
Paediatric liver4
203 92 68 - 116
Median waiting time not reported for fewer than 10 patients Totals do not add up where we do not have ethnicity reported for all patients 1 Patients registered 1 April 2010 - 31 March 2014
2 Patients registered 1 April 2011 - 31 March 2015
3 Patients registered 1 April 2011 - 31 March 2014
4 Patients registered 1 April 2012 - 31 March 2015
5 Urgent waiting time only
6 Median and/or 95% confidence interval cannot be estimated

16
5 LIVING DONORS AND RECIPIENTS
The ethnicities of living organ donors and recipients in each year from 2011/12 to 2016/17 are shown in Figures 7 and 8. The information for living donors is summarised below in Table 6. Kidneys represent the vast majority of living organs donated and transplanted. The figures show an overall fall in living donation in both Asian and Black communities, both in terms of absolute numbers of donors and as a proportion of all living organ donors. However in 2016/17 the number and proportion of Asian living donors has increased from 2015/16. The reasons for these trends are not clear. There have been a total of about 500 non-directed, altruistic kidney donors in the UK in the last 6 years. These living donors donate a kidney to someone not known to them to help transform or save a life. Five of these donors were Asian with a further one Black and two mixed race altruistic donors. In 2016/17, there were more living BAME donors (143) than deceased BAME donors (90). While for transplant recipients, in 2016/17 there were fewer BAME living donor transplant recipients (167, 16% of all living donor transplant recipients) compared to BAME deceased donor recipients (809, 22% of all deceased donor transplant recipients).
Table 6 BAME living donors as a percentage of total living donors in the UK, 1 April 2011 - 31 March 2017, by financial year
Asian Black Other
Financial year N
% of total living donors
1 N
% of total living donors
1 N
% of total living donors
1
2011/12 81 7.7 49 4.7 30 2.9 2012/13 88 8.0 43 3.9 38 3.5 2013/14 87 7.6 38 3.3 44 3.8 2014/15 76 7.0 38 3.5 45 4.1 2015/16 72 6.7 29 2.7 36 3.3 2016/17 79 7.6 17 1.6 47 4.5
1 Where ethnicity reported

17
White 889 931 977 929 939 897 876 894 904 878 892 866
Asian 81 88 87 76 72 79 84 107 118 99 87 83
Black 49 43 38 38 29 17 55 50 51 43 42 29
Other 30 38 44 45 36 47 32 27 38 48 39 55
Figure 7 Living donors and transplant recipients, 1 April 2011 - 31 March 2017
Other
Black
Asian
White
84
8
5
3
83
10
5
3
81
11
5
3
82
9
4
4
84
8
4
4
84
8
3
5
84 83 81 82 84 8485
8
5
3
85
8
4
3
85
8
3
4
85
7
3
4
87
7
33
86
8
25
85 85 85 85 87 86
2011/12
2012/13
2013/14
2014/15
2015/16
2016/17
2011/12
2012/13
2013/14
2014/15
2015/16
2016/17
0
20
40
60
80
100
Perc
enta
ge
Transplant recipientsDonors
Figure 7 shows all living donors and living donor transplant recipients and demonstrates that about 14% of living donors are BAME in 2016/17, with a higher proportion (16%) of living donor recipients from BAME groups.
18
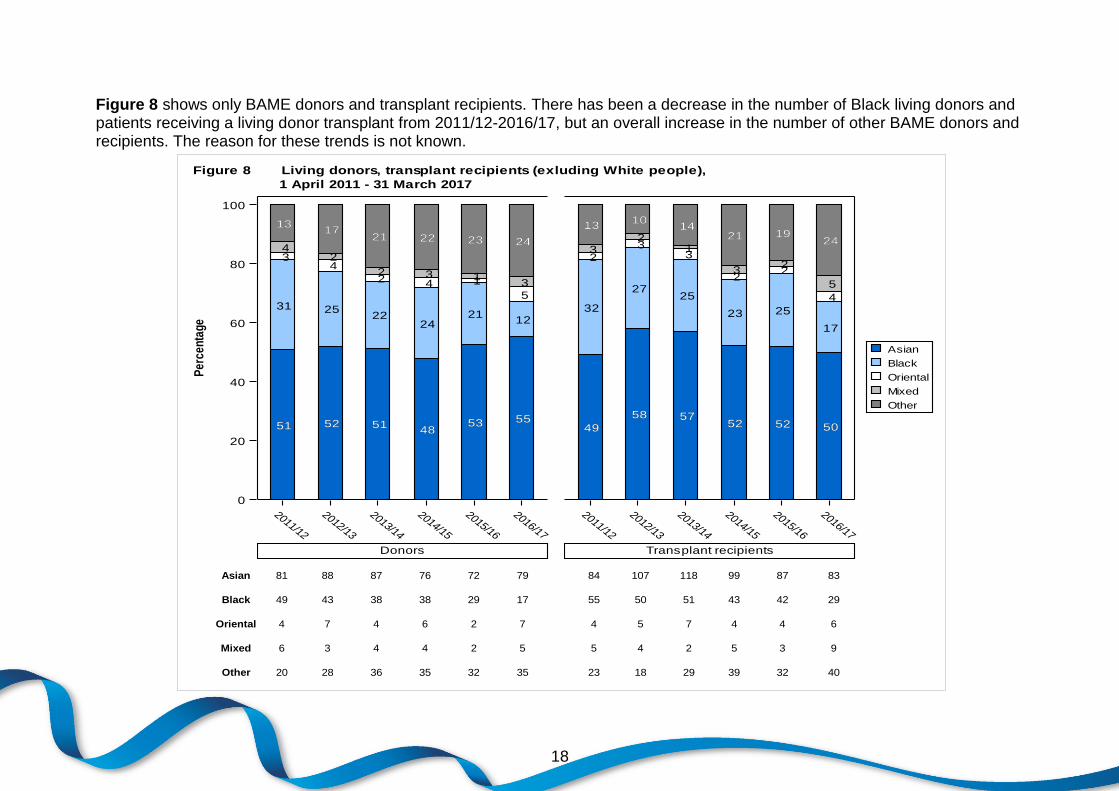
Asian 81 88 87 76 72 79 84 107 118 99 87 83
Black 49 43 38 38 29 17 55 50 51 43 42 29
Oriental 4 7 4 6 2 7 4 5 7 4 4 6
Mixed 6 3 4 4 2 5 5 4 2 5 3 9
Other 20 28 36 35 32 35 23 18 29 39 32 40
1 April 2011 - 31 March 2017
Figure 8 Living donors, transplant recipients (exluding White people),
Other
Mixed
Oriental
Black
Asian
49
32
23
13
58
27
32
10
57
25
31
14
52
23
23
21
52
25
22
19
50
17
4
5
24
49
58 5752 52 50
1310
1421 19
24
51
31
34
13
52
25
42
17
51
22
22
21
48
24
43
22
53
21
11
23
55
12
5
3
24
51 52 5148
53 55
1317
21 22 23 24
2011/12
2012/13
2013/14
2014/15
2015/16
2016/17
2011/12
2012/13
2013/14
2014/15
2015/16
2016/17
0
20
40
60
80
100P
erce
ntag
e
Transplant recipientsDonors
Figure 8 shows only BAME donors and transplant recipients. There has been a decrease in the number of Black living donors and patients receiving a living donor transplant from 2011/12-2016/17, but an overall increase in the number of other BAME donors and recipients. The reason for these trends is not known.

19
6 POTENTIAL ORGAN DONORS
NHS Blood and Transplant (NHSBT) capture information about potential organ donors through the Potential Donor Audit (PDA). This audit is of all patient deaths in UK Intensive Care Units and emergency departments, excluding deaths on wards and any patients over 80 years of age. The PDA provides information about the organ donation process and identifies potential barriers to organ donation. All data shown in this section use the following definitions:
Patients for whom neurological death is suspected meet all of the following criteria: Apnoea, coma from known aetiology and unresponsive, ventilated, fixed pupils. However, cases for which cardiac arrest occurred despite resuscitation, brainstem reflexes returned, and neonates - less than 2 months post term are excluded.
Eligible donors after brain death (DBD) are defined as patients for whom death was confirmed following neurological tests and who had no absolute medical contraindications to solid organ donation.
Eligible donors after circulatory death (DCD) are defined as patients who had treatment withdrawn and death was anticipated within 4 hours, with no absolute medical contraindications to solid organ donation.
The neurological death testing rate is the proportion of patients in whom neurological death was suspected who were tested (DBD donor process only).
The referral rate is the percentage of patients for whom neurological death was suspected, or imminent death was anticipated, that were discussed with the Specialist Nurse - Organ Donation (SN-OD).
The consent/authorisation rate is the percentage of eligible donor families or nominated/appointed representative approached for formal organ donation discussion where consent/authorisation was ascertained. Figures 9 and 10 show an overview of the number of eligible donors, and eligible donors with consent ascertained, over time for White and BAME groups for the DBD and DCD donation processes, respectively. Figure 9 shows an increase in the eligible pool of potential White DBD donors (and consequently in consented White donors), with a small such increase for BAME DBD donors. In eligible DCD donors, Figure 10 shows an increase for White eligible donors for whom consent/authorisation was ascertained but no change for BAME DCD donors. It should be noted that much of the increase in eligible donors seen in 2013 is a result of a change in PDA inclusion criteria: from 1 April 2013 the PDA included patients aged 76-80 years in addition to those aged 75 and under.

20
2011/12 2012/13 2013/14 2014/15 2015/16 2016/17
Financial year
0
200
400
600
800
1000
1200
Num
ber
BAMEWhiteBAMEWhite
Eligible donors Eligible consented\authoriseddonors
2011/12 2012/13 2013/14 2014/15 2015/16 2016/17
Financial year
0
500
1000
1500
2000
2500
3000
3500
4000
Num
ber
BAMEWhiteBAMEWhite
Eligible donors Eligible consented\authoriseddonors
Figure 9 Eligible DBD donors and eligible consented/authorised DBD donors by ethnic origin, 1 April 2011 – 31 March 2017¹
Figure 10 Eligible DCD donors and eligible consented/authorised DCD donors by ethnic origin, 1 April 2011 – 31 March 2017¹
1change in PDA inclusion criteria in 2013 contribute to increase seen in 2013/14
1change in PDA inclusion criteria in 2013 contribute to increase seen in 2013/14

21
Table 6 shows the consent/authorisation rates separately for White patients and patients from ethnic minority groups broken down by the Organ Donation Services Teams (ODSTs) in the UK.
Table 6 DBD and DCD consent/authorisation rates from the Potential Donor Audit, 1 April 2016 to 31 March 2017, by Organ Donation Services Team (ODST) and ethnicity
White eligible donors Eligible donors from ethnic minority groups All
ODST
Number of eligible DBD
donors whose family
were approached
DBD consent/
authorisation rate (%)
Number of eligible DCD
donors whose family
were approached
DCD consent/
authorisation rate (%)
Overall consent/
authorisation rate (%)
Number of eligible DBD
donors whose family
were approached
DBD consent/
authorisation rate (%)
Number of eligible DCD
donors whose family
were approached
DCD consent/
authorisation rate (%)
Overall consent/
authorisation rate (%)
Overall consent/
authorisation rate (%)
1
Eastern 73 83.6 177 62.7 68.8 6 6 16.7 64.8 London 135 71.9 122 59.0 65.8 70 32.9 40 47.5 38.2 57.0 Midlands 103 76.7 244 54.5 61.1 27 37.0 20 25.0 31.9 57.3 North West 148 73.6 226 60.6 65.8 22 36.4 5 37.0 63.7 Northern 88 62.5 89 64.0 63.3 3 3 61.9 Northern Ireland
47 70.2 37 56.8 64.3 0 1 64.4
Scotland 101 77.2 151 53.6 63.1 1 3 63.2 South Central 91 74.7 130 62.3 67.4 12 41.7 10 40.0 40.9 64.1 South East 119 73.1 153 73.9 73.5 32 40.6 13 30.8 37.8 69.2 South Wales 39 76.9 68 58.8 65.4 0 3 61.5 South West 77 80.5 105 61.0 69.2 2 1 68.0 Yorkshire 86 75.6 134 59.7 65.9 12 16.7 7 15.8 62.2
TOTAL 1107 74.4 1636 60.5 66.1 187 34.2 112 36.6 35.1 62.7 1 Includes 102 families approached where the ethnicity of the patient was not known or not reported Consent/authorisation rates not reported where N<10
22
2011/12 2012/13 2013/14 2014/15 2015/16 2016/17
Financial year
0
10
20
30
40
50
60
70
80
90
100
Neuro
logic
al d
eath
testin
g r
ate
(%
)
BAMEWhite
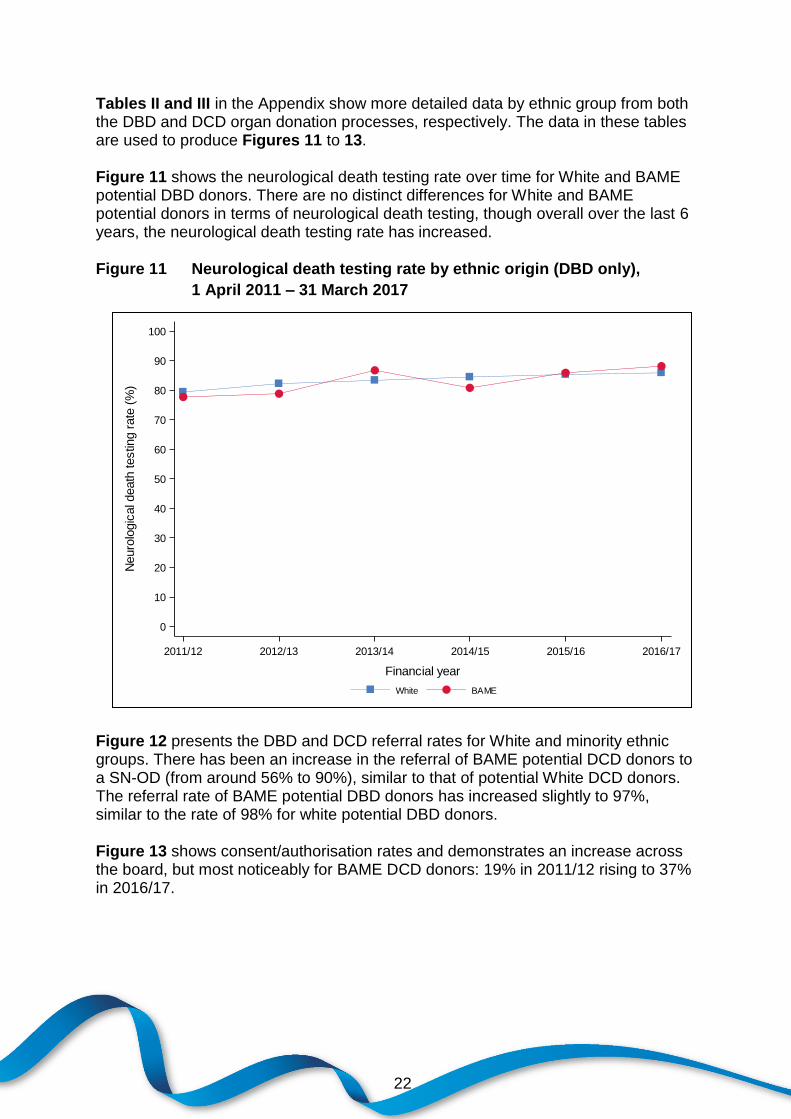
Tables II and III in the Appendix show more detailed data by ethnic group from both the DBD and DCD organ donation processes, respectively. The data in these tables are used to produce Figures 11 to 13. Figure 11 shows the neurological death testing rate over time for White and BAME potential DBD donors. There are no distinct differences for White and BAME potential donors in terms of neurological death testing, though overall over the last 6 years, the neurological death testing rate has increased. Figure 11 Neurological death testing rate by ethnic origin (DBD only),
1 April 2011 – 31 March 2017
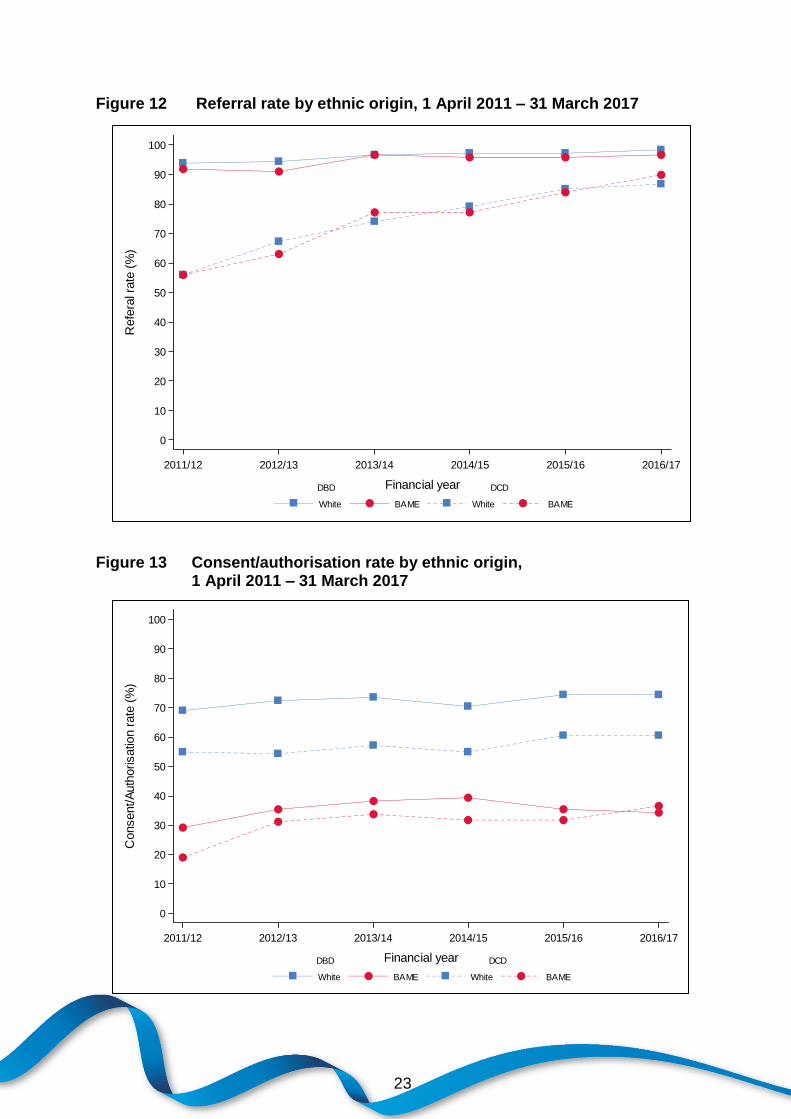
Figure 12 presents the DBD and DCD referral rates for White and minority ethnic groups. There has been an increase in the referral of BAME potential DCD donors to a SN-OD (from around 56% to 90%), similar to that of potential White DCD donors. The referral rate of BAME potential DBD donors has increased slightly to 97%, similar to the rate of 98% for white potential DBD donors. Figure 13 shows consent/authorisation rates and demonstrates an increase across the board, but most noticeably for BAME DCD donors: 19% in 2011/12 rising to 37% in 2016/17.
23
2011/12 2012/13 2013/14 2014/15 2015/16 2016/17
Financial year
0
10
20
30
40
50
60
70
80
90
100
Refe
ral r
ate
(%
)
BAMEWhiteBAMEWhite
DBD DCD
2011/12 2012/13 2013/14 2014/15 2015/16 2016/17
Financial year
0
10
20
30
40
50
60
70
80
90
100
Consent/A
uth
orisatio
n r
ate
(%
)
BAMEWhiteBAMEWhite
DBD DCD
Figure 12 Referral rate by ethnic origin, 1 April 2011 – 31 March 2017
Figure 13 Consent/authorisation rate by ethnic origin, 1 April 2011 – 31 March 2017

24
Overall, the data show that, in general, families of BAME eligible donors are much less likely to agree to organ donation. Only about half as many families of BAME eligible donors support organ donation compared with families of White eligible donors: DBD - 74% White vs 34% BAME and DCD - 61% White vs 37% BAME in 2016/17. Overall, there has been some increase in consent/authorisation rates for White and BAME eligible donors since the PDA began; this is particularly notable for DCD donors (19% to 37% over six years).
25
APPENDIX
Table I UK population by ethnicity, mid-2011 estimates (thousands) Ethnicity N (thousands) % White British 52,423 82.5 White Irish 1,529 2.4 Other White 2,746 4.3 Total White 56,698 89.2 Indian 1,438 2.3 Pakistani 1,041 1.6 Bangladeshi 377 0.6 Other Asian 378 0.6 Total Asian 3,234 5.1 Black Caribbean 649 1.0 Black African 792 1.2 Other Black 130 0.2 Total Black 1,571 2.5 White & Black Caribbean 351 0.6 White & Black African 143 0.2 White & Asian 318 0.5 Other Mixed 276 0.4 Chinese 427 0.7 Other Ethnic 515 0.8 Total Other 2,030 3.2 TOTAL 63,533 100.0 Source - Office for National Statistics

26
Table II National data from the NHSBT Potential Donor Audit for donation after brain death, 1 April 2011 – 31 March 20171
Financial year
Ethnic origin
Number of patients where neurological
death was suspected
Number of patients that
were neurological death tested
Neurological death
testing rate (%)
Number of patients where neurological
death was suspected that were referred to
the SN-OD
DBD referral rate (%)
Number of eligible DBD
donors whose family were approached
Number where consent/authorisation
ascertained
DBD consent/ authorisation
rate (%)
2011/12
White 1294 1028 79.4 1213 93.7 927 640 69
BAME 223 173 77.6 205 91.9 141 41 29.1
Unknown 69 33 47.8 47 68.1 23 13 56.5
2012/13
White 1309 1077 82.3 1234 94.3 954 691 72.4
BAME 202 159 78.7 184 91.1 124 44 35.5
Unknown 61 33 54.1 35 57.4 22 9 40.9
2013/14
White 1420 1182 83.2 1371 96.5 1068 786 73.6
BAME 242 210 86.8 234 96.7 168 64 38.1
Unknown 55 31 56.4 33 60 22 7 31.8
2014/15
White 1436 1214 84.5 1394 97.1 1100 775 70.5
BAME 236 191 80.9 226 95.8 155 61 39.4
Unknown 62 40 64.5 51 82.3 29 23 79.3
2015/16
White 1459 1244 85.3 1418 97.2 1108 822 74.2
BAME 233 200 85.8 223 95.7 164 58 35.4
Unknown 55 33 60 43 78.2 24 11 45.8
2016/17
White 1434 1233 86 1408 98.2 1107 824 74.4
BAME 272 240 88.2 263 96.7 187 64 34.2
Unknown 69 49 71 57 82.6 35 29 82.9
1Note that patients aged 81 years and over are not audited. Patients aged between 76 and 80 and cardiothoracic ICUs are only audited from 1 April 2013 onwards. All
data for neonatal ICUs has been excluded from this data.

27
Table III National data from the NHSBT Potential Donor Audit for donation after circulatory death, 1 April 2011 – 31 March 20171
Financial year
Ethnic origin
Number of patients for
whom imminent death was anticipated
Number of patients for whom imminent
death was anticipated that were
referred to the SN-OD
DCD referral rate (%)
Number of eligible DCD donors whose family
were approached
Number where consent/authorisation
ascertained
DCD consent/authorisation
rate (%)
2011/12
White 5878 2779 47.3 1210 660 54.5
BAME 404 195 48.3 75 23 30.7
Unknown 942 229 24.3 76 13 17.1
2012/13
White 5567 3737 67.1 1605 871 54.3
BAME 402 253 62.9 113 35 31
Unknown 989 358 36.2 99 25 25.3
2013/14
White 5859 4341 74.1 1763 1005 57
BAME 432 333 77.1 140 47 33.6
Unknown 910 435 47.8 89 21 23.6
2014/15
White 5539 4381 79.1 1806 988 54.7
BAME 481 371 77.1 123 39 31.7
Unknown 741 404 54.5 90 19 21.1
2015/16
White 5469 4644 84.9 1743 1055 60.5
BAME 413 347 84 120 38 31.7
Unknown 618 411 66.5 79 20 25.3
2016/17
White 5216 4517 86.6 1636 990 60.5
BAME 407 366 89.9 112 41 36.6
Unknown 581 425 73.1 67 24 35.8
1Note that patients aged 81 years and over are not audited. Patients aged between 76 and 80 and cardiothoracic ICUs are only audited from 1 April 2013
onwards. All data for neonatal ICUs has been excluded from this data.
Related Documents