RESEARCH PAPER Optimal sample preparation for nanoparticle metrology (statistical size measurements) using atomic force microscopy Christopher M. Hoo Trang Doan Natasha Starostin Paul E. West Martha L. Mecartney Received: 27 January 2009 / Accepted: 22 April 2009 / Published online: 18 May 2009 Ó Springer Science+Business Media B.V. 2009 Abstract Optimal deposition procedures are deter- mined for nanoparticle size characterization by atomic force microscopy (AFM). Accurate nanopar- ticle size distribution analysis with AFM requires non-agglomerated nanoparticles on a flat substrate. The deposition of polystyrene (100 nm), silica (300 and 100 nm), gold (100 nm), and CdSe quantum dot (2–5 nm) nanoparticles by spin coating was opti- mized for size distribution measurements by AFM. Factors influencing deposition include spin speed, concentration, solvent, and pH. A comparison using spin coating, static evaporation, and a new fluid cell deposition method for depositing nanoparticles is also made. The fluid cell allows for a more uniform and higher density deposition of nanoparticles on a substrate at laminar flow rates, making nanoparticle size analysis via AFM more efficient and also offers the potential for nanoparticle analysis in liquid environments. Keywords Atomic force microscope Á Instrumentation Á Nanoparticles Á Nanoscale metrology Á Size characterization Introduction Nanoparticles play a critical role in a wide range of applications including nano-optical devices (Taminiau et al. 2007), data storage devices (Thomson et al. 2004), nanoscale sensors (Brust and Kiely 2002), and pharmaceuticals (Juillerat et al. 2005). A number of methods exist for the deposition of nanoparticles on substrates for the study of nanoparticle properties. There is considerable interest in using nanoparticles to build complex structures using ‘‘bottom-up’’ self- assembly techniques, ‘‘top-down’’ lithographic tech- niques or combinations of both. For example, gold nanoparticles can be deposited in specific arrays by functionalizing a silicon wafer and immersing the substrate in a nanoparticle solution (Zheng et al. 2000). Nanowires and nanoparticle arrays can be made by depositing nanoparticles using applied AC voltages on patterned substrates (Xiong et al. 2006, 2007). Dip coating of colloidal suspensions (Ghosh et al. 2007) and extreme-ultraviolet interference lithography (EUV-IL) (Juillerat et al. 2005) has also C. M. Hoo Á T. Doan Á M. L. Mecartney (&) Department of Chemical Engineering and Materials Science, University of California, Irvine, 916 Engineering Tower, Irvine, CA 92697-2575, USA e-mail: [email protected] N. Starostin Á P. E. West Technology Center, Pacific Nanotechnology, Inc., 18468 Ward St., Fountain Valley, CA 92708, USA Present Address: N. Starostin Rosemount Analytical Inc., Emerson Process Management, 2400 Barranca Parkway, Irvine, CA 92602, USA 123 J Nanopart Res (2010) 12:939–949 DOI 10.1007/s11051-009-9644-8

Welcome message from author
This document is posted to help you gain knowledge. Please leave a comment to let me know what you think about it! Share it to your friends and learn new things together.
Transcript
RESEARCH PAPER
Optimal sample preparation for nanoparticle metrology(statistical size measurements) using atomic forcemicroscopy
Christopher M. Hoo Æ Trang Doan ÆNatasha Starostin Æ Paul E. West ÆMartha L. Mecartney
Received: 27 January 2009 / Accepted: 22 April 2009 / Published online: 18 May 2009
� Springer Science+Business Media B.V. 2009
Abstract Optimal deposition procedures are deter-
mined for nanoparticle size characterization by
atomic force microscopy (AFM). Accurate nanopar-
ticle size distribution analysis with AFM requires
non-agglomerated nanoparticles on a flat substrate.
The deposition of polystyrene (100 nm), silica (300
and 100 nm), gold (100 nm), and CdSe quantum dot
(2–5 nm) nanoparticles by spin coating was opti-
mized for size distribution measurements by AFM.
Factors influencing deposition include spin speed,
concentration, solvent, and pH. A comparison using
spin coating, static evaporation, and a new fluid cell
deposition method for depositing nanoparticles is also
made. The fluid cell allows for a more uniform and
higher density deposition of nanoparticles on a
substrate at laminar flow rates, making nanoparticle
size analysis via AFM more efficient and also offers
the potential for nanoparticle analysis in liquid
environments.
Keywords Atomic force microscope �Instrumentation � Nanoparticles �Nanoscale metrology � Size characterization
Introduction
Nanoparticles play a critical role in a wide range of
applications including nano-optical devices (Taminiau
et al. 2007), data storage devices (Thomson et al.
2004), nanoscale sensors (Brust and Kiely 2002), and
pharmaceuticals (Juillerat et al. 2005). A number of
methods exist for the deposition of nanoparticles on
substrates for the study of nanoparticle properties.
There is considerable interest in using nanoparticles
to build complex structures using ‘‘bottom-up’’ self-
assembly techniques, ‘‘top-down’’ lithographic tech-
niques or combinations of both. For example, gold
nanoparticles can be deposited in specific arrays by
functionalizing a silicon wafer and immersing the
substrate in a nanoparticle solution (Zheng et al.
2000). Nanowires and nanoparticle arrays can be
made by depositing nanoparticles using applied AC
voltages on patterned substrates (Xiong et al. 2006,
2007). Dip coating of colloidal suspensions (Ghosh
et al. 2007) and extreme-ultraviolet interference
lithography (EUV-IL) (Juillerat et al. 2005) has also
C. M. Hoo � T. Doan � M. L. Mecartney (&)
Department of Chemical Engineering and Materials
Science, University of California, Irvine, 916 Engineering
Tower, Irvine, CA 92697-2575, USA
e-mail: [email protected]
N. Starostin � P. E. West
Technology Center, Pacific Nanotechnology, Inc., 18468
Ward St., Fountain Valley, CA 92708, USA
Present Address:N. Starostin
Rosemount Analytical Inc., Emerson Process
Management, 2400 Barranca Parkway, Irvine,
CA 92602, USA
123
J Nanopart Res (2010) 12:939–949
DOI 10.1007/s11051-009-9644-8
been used to produce complex arrays of nanoparti-
cles. The spin coating technique (Bornside et al.
1987) has also been utilized to deposit nanoparticles
onto substrates. When used in conjunction with
substrates patterned using lithography, complex
structures and geometries can be fabricated (Xia
and Brueck 2004, Xia et al. 2004). Spin coating of
nanoparticles has also been used to create binary
colloidal crystals (Wang and Mohwald 2004), uni-
form thin films (Leite et al. 2006; Ogi et al. 2007),
and monodisperse nanoparticle depositions by con-
trolling nanoparticle concentration (Hong et al.
2002).
The development of uniform arrays of complex
nanostructures by the techniques described above
relies on a uniform and controlled size for studying
nanoparticles. The exact nanoparticle size is also
important since a number of properties such as the
melting temperature (Shi 1994) and diffusion rates
(Nakade et al. 2003) are influenced by the size of
nanoparticles. Thus, it is critical to be able to
characterize accurately the size of individual nano-
particles and to determine the size distribution.
Atomic force microscopy (AFM) is one technique
that has the required resolution to easily characterize
individual nanoparticles. Transmission electron
microscopy also can be used, but requires a high
vacuum and only gives a 2D silhouette. Dynamic
light scattering measures aggregate value with lim-
ited success for wide size distributions or anisotropic
particles (Hoo et al. 2008). One major challenge in
the AFM is that agglomeration of particles prevents
an accurate analysis. The aim of our study was to
develop methods to prevent nanoparticle agglomer-
ation and to provide a highly uniform and concen-
trated deposition of nanoparticles on atomically flat
substrates for AFM analysis.
In this article, it is demonstrated how spin coating
parameters (such as nanoparticle solvent, spin speed,
pH, concentration, and choice of substrate) influence
nanoparticle deposition for a wide rang of materials
(gold, polystyrene, silica, and CdSe quantum dots).
Flow deposition of nanoparticles deposited using a
fluid cell in the AFM was also evaluated. Optimal
fluid flow rates and deposition times for the fluid cell
were determined, and the results were compared to
optimal spin coating conditions and static evapora-
tion to evaluate the relative effectiveness of these
deposition techniques.
Experimental procedures
Materials
Aqueous suspensions of 300 and 100 nm silica
nanoparticles and 100 nm NIST traceable polysty-
rene nanoparticles were obtained from Duke Scien-
tific, Inc. An aqueous suspension of 100 nm gold
nanoparticles was obtained from Ted Pella, Inc., and
2–5 nm CdSe quantum dots were obtained from
American Dye, Inc. and Evident Technologies. V1
grade mica disks and poly-L-lysine were obtained
from Ted Pella, Inc., poly-D-lysine was obtained from
BD Bioscience, Inc., and intrinsic (111) silicon
wafers were obtained from Nitride Silicon Wafers.
Silicon wafers were cleaned in Piranha solution (7:3
H2SO4:H2O2) for 10 min and washed with de-ionized
water prior to nanoparticle deposition.
Substrate modification
Silicon wafers were modified by heat treating the
wafers at 300 �C for a duration of 1 h to grow an
oxide layer and increase the surface roughness of the
silicon wafer. Mica disks were cleaved to expose a
clean layer of mica and the surface was functional-
ized with poly-L-lysine or poly-D-lysine.
Spin coating procedure
Substrates were mounted to a 15-mm AFM disk prior
to spin coating in a Headway Research, Inc., EC 101
spin coater. Substrates were spin coated at speeds
ranging from 1,000 to 5,000 rpm in 500 rpm incre-
ments for durations of 30 s. Micropipettes were used
to deposit the solutions. Substrates were then ana-
lyzed using a Pacific Nanotechnology, Inc. Nano
RpTM
atomic force microscope in tapping mode and a
Philips XL-30 scanning electron microscope (SEM).
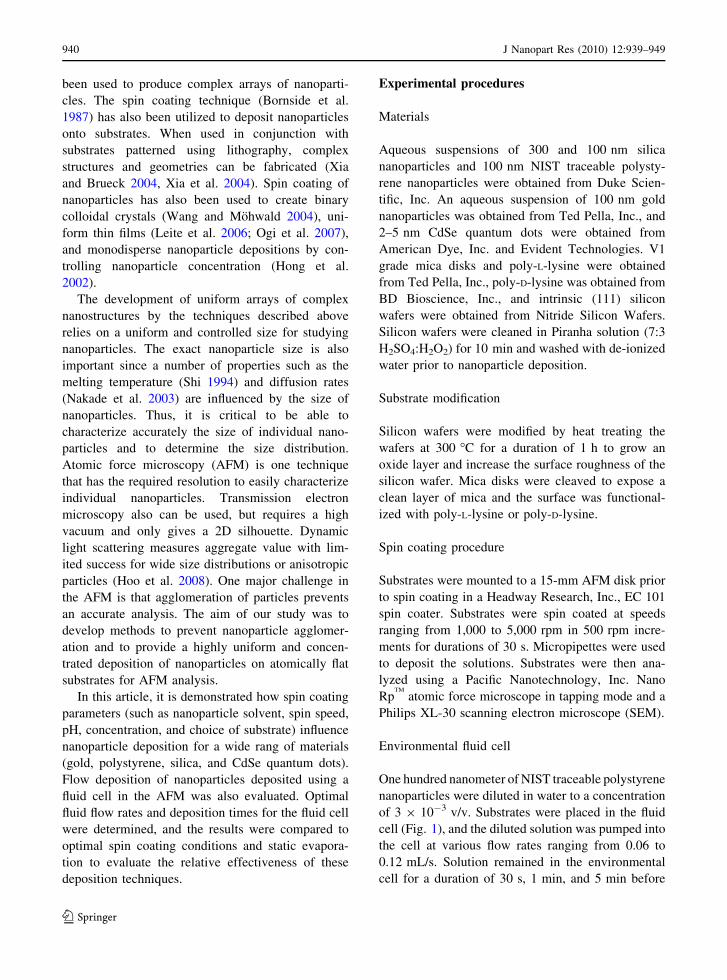
Environmental fluid cell
One hundred nanometer of NIST traceable polystyrene
nanoparticles were diluted in water to a concentration
of 3 9 10-3 v/v. Substrates were placed in the fluid
cell (Fig. 1), and the diluted solution was pumped into
the cell at various flow rates ranging from 0.06 to
0.12 mL/s. Solution remained in the environmental
cell for a duration of 30 s, 1 min, and 5 min before
940 J Nanopart Res (2010) 12:939–949
123
flushing the cell with de-ionized water. The water was
removed and the substrate was allowed to dry in air in
the AFM before taking AFM scans.
Results and discussion
Nanoparticle evaporation onto a substrate
One of the simplest methods of depositing nanopar-
ticles is to use a static substrate, deposit the solution
and allow for air evaporation. While the evaporation
technique can create nanoparticle thin films (Lin et al.
2001), this technique is not optimal for individual
nanoparticle analysis as it can lead to heavy agglom-
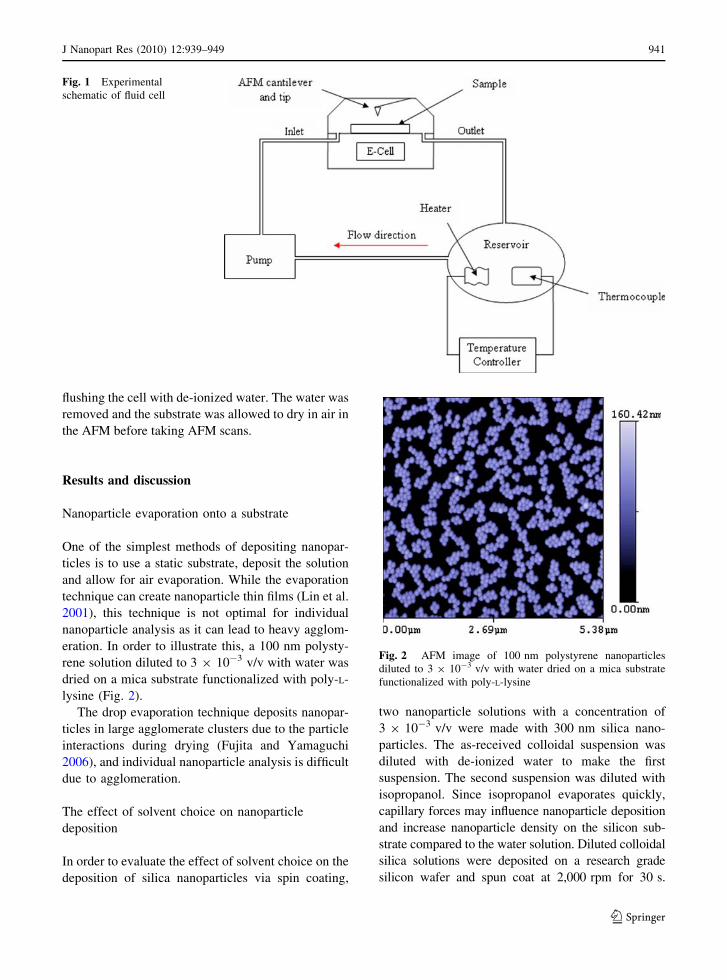
eration. In order to illustrate this, a 100 nm polysty-
rene solution diluted to 3 9 10-3 v/v with water was
dried on a mica substrate functionalized with poly-L-
lysine (Fig. 2).
The drop evaporation technique deposits nanopar-
ticles in large agglomerate clusters due to the particle
interactions during drying (Fujita and Yamaguchi
2006), and individual nanoparticle analysis is difficult
due to agglomeration.
The effect of solvent choice on nanoparticle
deposition
In order to evaluate the effect of solvent choice on the
deposition of silica nanoparticles via spin coating,
two nanoparticle solutions with a concentration of
3 9 10-3 v/v were made with 300 nm silica nano-
particles. The as-received colloidal suspension was
diluted with de-ionized water to make the first
suspension. The second suspension was diluted with
isopropanol. Since isopropanol evaporates quickly,
capillary forces may influence nanoparticle deposition
and increase nanoparticle density on the silicon sub-
strate compared to the water solution. Diluted colloidal
silica solutions were deposited on a research grade
silicon wafer and spun coat at 2,000 rpm for 30 s.
Fig. 1 Experimental
schematic of fluid cell
Fig. 2 AFM image of 100 nm polystyrene nanoparticles
diluted to 3 9 10-3 v/v with water dried on a mica substrate
functionalized with poly-L-lysine
J Nanopart Res (2010) 12:939–949 941
123
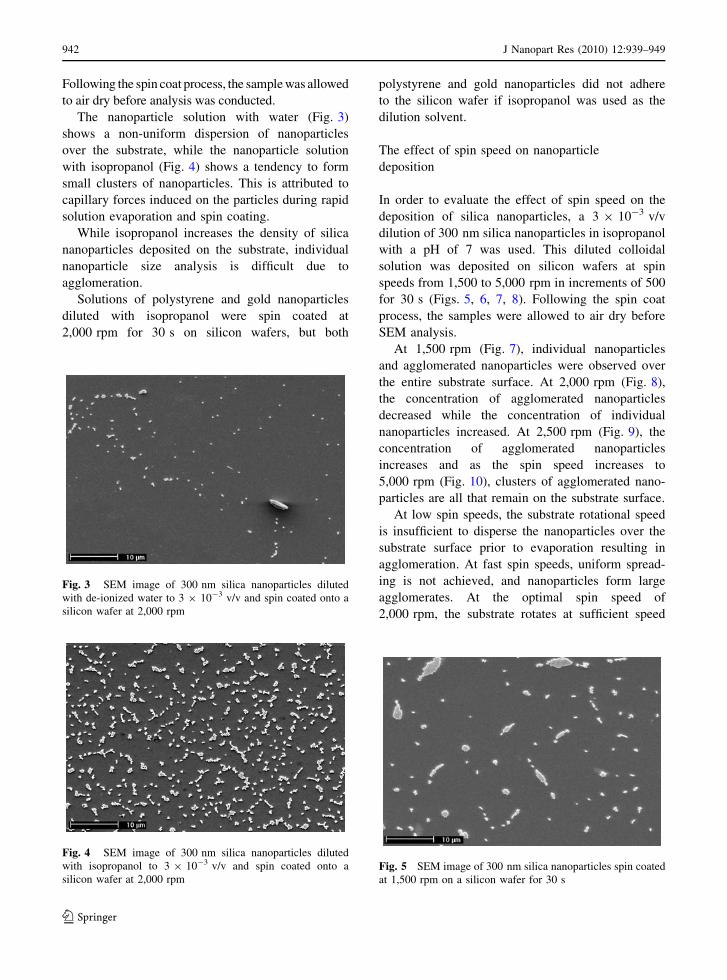
Following the spin coat process, the sample was allowed
to air dry before analysis was conducted.
The nanoparticle solution with water (Fig. 3)
shows a non-uniform dispersion of nanoparticles
over the substrate, while the nanoparticle solution
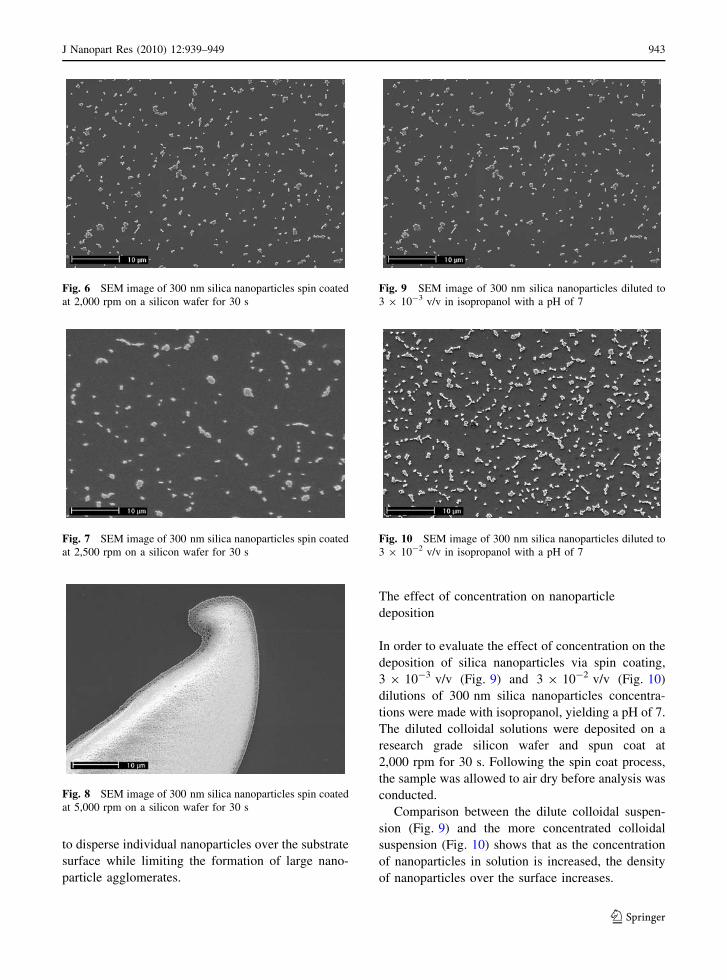
with isopropanol (Fig. 4) shows a tendency to form
small clusters of nanoparticles. This is attributed to
capillary forces induced on the particles during rapid
solution evaporation and spin coating.
While isopropanol increases the density of silica
nanoparticles deposited on the substrate, individual
nanoparticle size analysis is difficult due to
agglomeration.
Solutions of polystyrene and gold nanoparticles
diluted with isopropanol were spin coated at
2,000 rpm for 30 s on silicon wafers, but both
polystyrene and gold nanoparticles did not adhere
to the silicon wafer if isopropanol was used as the
dilution solvent.
The effect of spin speed on nanoparticle
deposition
In order to evaluate the effect of spin speed on the
deposition of silica nanoparticles, a 3 9 10-3 v/v
dilution of 300 nm silica nanoparticles in isopropanol
with a pH of 7 was used. This diluted colloidal
solution was deposited on silicon wafers at spin
speeds from 1,500 to 5,000 rpm in increments of 500
for 30 s (Figs. 5, 6, 7, 8). Following the spin coat
process, the samples were allowed to air dry before
SEM analysis.
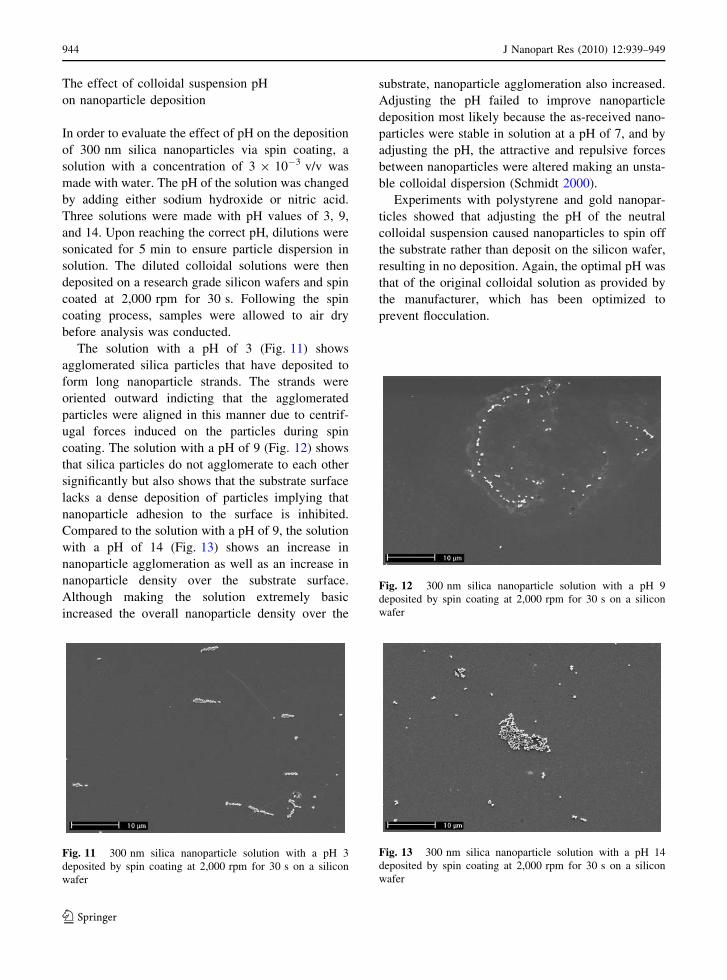
At 1,500 rpm (Fig. 7), individual nanoparticles
and agglomerated nanoparticles were observed over
the entire substrate surface. At 2,000 rpm (Fig. 8),
the concentration of agglomerated nanoparticles
decreased while the concentration of individual
nanoparticles increased. At 2,500 rpm (Fig. 9), the
concentration of agglomerated nanoparticles
increases and as the spin speed increases to
5,000 rpm (Fig. 10), clusters of agglomerated nano-
particles are all that remain on the substrate surface.
At low spin speeds, the substrate rotational speed
is insufficient to disperse the nanoparticles over the
substrate surface prior to evaporation resulting in
agglomeration. At fast spin speeds, uniform spread-
ing is not achieved, and nanoparticles form large
agglomerates. At the optimal spin speed of
2,000 rpm, the substrate rotates at sufficient speed
Fig. 3 SEM image of 300 nm silica nanoparticles diluted
with de-ionized water to 3 9 10-3 v/v and spin coated onto a
silicon wafer at 2,000 rpm
Fig. 4 SEM image of 300 nm silica nanoparticles diluted
with isopropanol to 3 9 10-3 v/v and spin coated onto a
silicon wafer at 2,000 rpmFig. 5 SEM image of 300 nm silica nanoparticles spin coated
at 1,500 rpm on a silicon wafer for 30 s
942 J Nanopart Res (2010) 12:939–949
123
to disperse individual nanoparticles over the substrate
surface while limiting the formation of large nano-
particle agglomerates.
The effect of concentration on nanoparticle
deposition
In order to evaluate the effect of concentration on the
deposition of silica nanoparticles via spin coating,
3 9 10-3 v/v (Fig. 9) and 3 9 10-2 v/v (Fig. 10)
dilutions of 300 nm silica nanoparticles concentra-
tions were made with isopropanol, yielding a pH of 7.
The diluted colloidal solutions were deposited on a
research grade silicon wafer and spun coat at
2,000 rpm for 30 s. Following the spin coat process,
the sample was allowed to air dry before analysis was
conducted.
Comparison between the dilute colloidal suspen-
sion (Fig. 9) and the more concentrated colloidal
suspension (Fig. 10) shows that as the concentration
of nanoparticles in solution is increased, the density
of nanoparticles over the surface increases.
Fig. 6 SEM image of 300 nm silica nanoparticles spin coated
at 2,000 rpm on a silicon wafer for 30 s
Fig. 7 SEM image of 300 nm silica nanoparticles spin coated
at 2,500 rpm on a silicon wafer for 30 s
Fig. 8 SEM image of 300 nm silica nanoparticles spin coated
at 5,000 rpm on a silicon wafer for 30 s
Fig. 9 SEM image of 300 nm silica nanoparticles diluted to
3 9 10-3 v/v in isopropanol with a pH of 7
Fig. 10 SEM image of 300 nm silica nanoparticles diluted to
3 9 10-2 v/v in isopropanol with a pH of 7
J Nanopart Res (2010) 12:939–949 943
123
The effect of colloidal suspension pH
on nanoparticle deposition
In order to evaluate the effect of pH on the deposition
of 300 nm silica nanoparticles via spin coating, a
solution with a concentration of 3 9 10-3 v/v was
made with water. The pH of the solution was changed
by adding either sodium hydroxide or nitric acid.
Three solutions were made with pH values of 3, 9,
and 14. Upon reaching the correct pH, dilutions were
sonicated for 5 min to ensure particle dispersion in
solution. The diluted colloidal solutions were then
deposited on a research grade silicon wafers and spin
coated at 2,000 rpm for 30 s. Following the spin
coating process, samples were allowed to air dry
before analysis was conducted.
The solution with a pH of 3 (Fig. 11) shows
agglomerated silica particles that have deposited to
form long nanoparticle strands. The strands were
oriented outward indicting that the agglomerated
particles were aligned in this manner due to centrif-
ugal forces induced on the particles during spin
coating. The solution with a pH of 9 (Fig. 12) shows
that silica particles do not agglomerate to each other
significantly but also shows that the substrate surface
lacks a dense deposition of particles implying that
nanoparticle adhesion to the surface is inhibited.
Compared to the solution with a pH of 9, the solution
with a pH of 14 (Fig. 13) shows an increase in
nanoparticle agglomeration as well as an increase in
nanoparticle density over the substrate surface.
Although making the solution extremely basic
increased the overall nanoparticle density over the
substrate, nanoparticle agglomeration also increased.
Adjusting the pH failed to improve nanoparticle
deposition most likely because the as-received nano-
particles were stable in solution at a pH of 7, and by
adjusting the pH, the attractive and repulsive forces
between nanoparticles were altered making an unsta-
ble colloidal dispersion (Schmidt 2000).
Experiments with polystyrene and gold nanopar-
ticles showed that adjusting the pH of the neutral
colloidal suspension caused nanoparticles to spin off
the substrate rather than deposit on the silicon wafer,
resulting in no deposition. Again, the optimal pH was
that of the original colloidal solution as provided by
the manufacturer, which has been optimized to
prevent flocculation.
Fig. 11 300 nm silica nanoparticle solution with a pH 3
deposited by spin coating at 2,000 rpm for 30 s on a silicon
wafer
Fig. 12 300 nm silica nanoparticle solution with a pH 9
deposited by spin coating at 2,000 rpm for 30 s on a silicon
wafer
Fig. 13 300 nm silica nanoparticle solution with a pH 14
deposited by spin coating at 2,000 rpm for 30 s on a silicon
wafer
944 J Nanopart Res (2010) 12:939–949
123
The effect of substrate choice on nanoparticle
deposition
In order to investigate how substrate selection can
influence nanoparticle deposition, mica substrates
were selected for comparison with silicon due to the
hydrophilic nature of freshly cleaved mica. On a
hydrophilic substrate, nanoparticles in solution are
expected to disperse evenly due to a low wetting
angle. A 3 9 10-3 v/v dilution of 300 nm silica in
water was spin coated at 2,000 rpm for 30 s and
allowed to dry in air before AFM analysis.
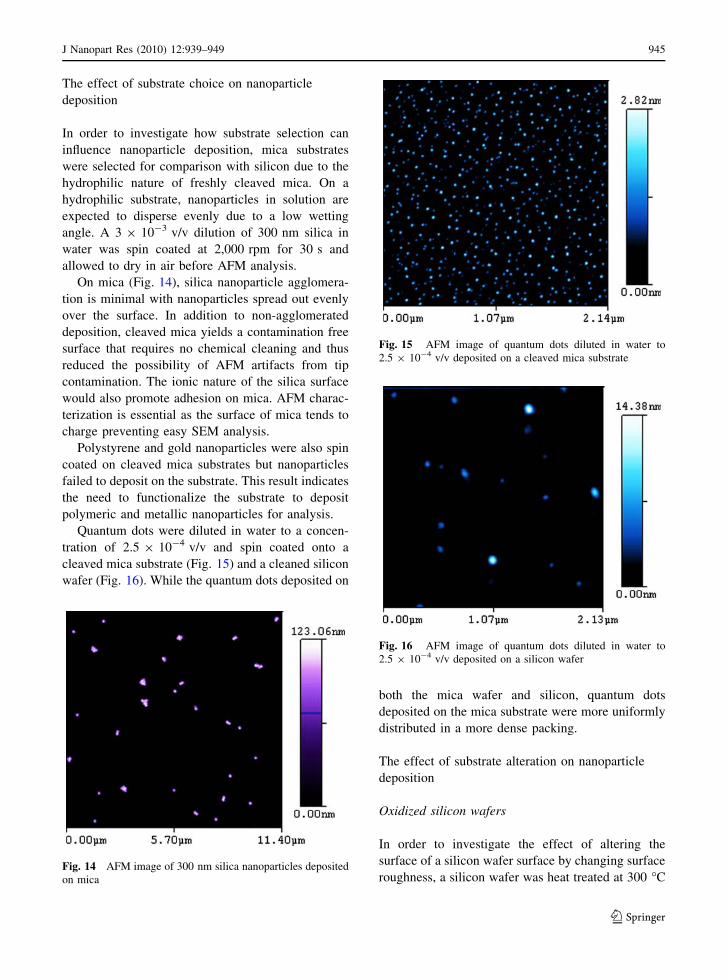
On mica (Fig. 14), silica nanoparticle agglomera-
tion is minimal with nanoparticles spread out evenly
over the surface. In addition to non-agglomerated
deposition, cleaved mica yields a contamination free
surface that requires no chemical cleaning and thus
reduced the possibility of AFM artifacts from tip
contamination. The ionic nature of the silica surface
would also promote adhesion on mica. AFM charac-
terization is essential as the surface of mica tends to
charge preventing easy SEM analysis.
Polystyrene and gold nanoparticles were also spin
coated on cleaved mica substrates but nanoparticles
failed to deposit on the substrate. This result indicates
the need to functionalize the substrate to deposit
polymeric and metallic nanoparticles for analysis.
Quantum dots were diluted in water to a concen-
tration of 2.5 9 10-4 v/v and spin coated onto a
cleaved mica substrate (Fig. 15) and a cleaned silicon
wafer (Fig. 16). While the quantum dots deposited on
both the mica wafer and silicon, quantum dots
deposited on the mica substrate were more uniformly
distributed in a more dense packing.
The effect of substrate alteration on nanoparticle
deposition
Oxidized silicon wafers
In order to investigate the effect of altering the
surface of a silicon wafer surface by changing surface
roughness, a silicon wafer was heat treated at 300 �CFig. 14 AFM image of 300 nm silica nanoparticles deposited
on mica
Fig. 15 AFM image of quantum dots diluted in water to
2.5 9 10-4 v/v deposited on a cleaved mica substrate
Fig. 16 AFM image of quantum dots diluted in water to
2.5 9 10-4 v/v deposited on a silicon wafer
J Nanopart Res (2010) 12:939–949 945
123
for 1 h to oxidize the surface. Following heat
treatment, the silicon wafer was allowed to air cool
to room temperature before deposition of silica
nanoparticles. A 3 9 10-3 v/v 300 nm silica nano-
particle dilution with a pH of 7 in water was then
spun coat at 2,000 rpm for 30 s onto the silicon
wafer.
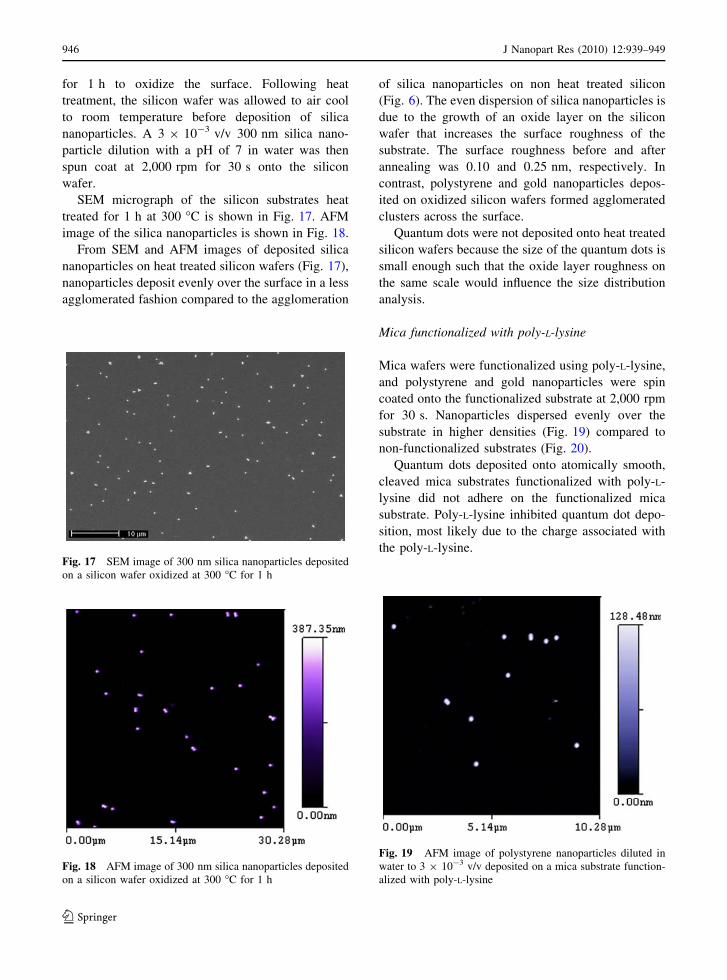
SEM micrograph of the silicon substrates heat
treated for 1 h at 300 �C is shown in Fig. 17. AFM
image of the silica nanoparticles is shown in Fig. 18.
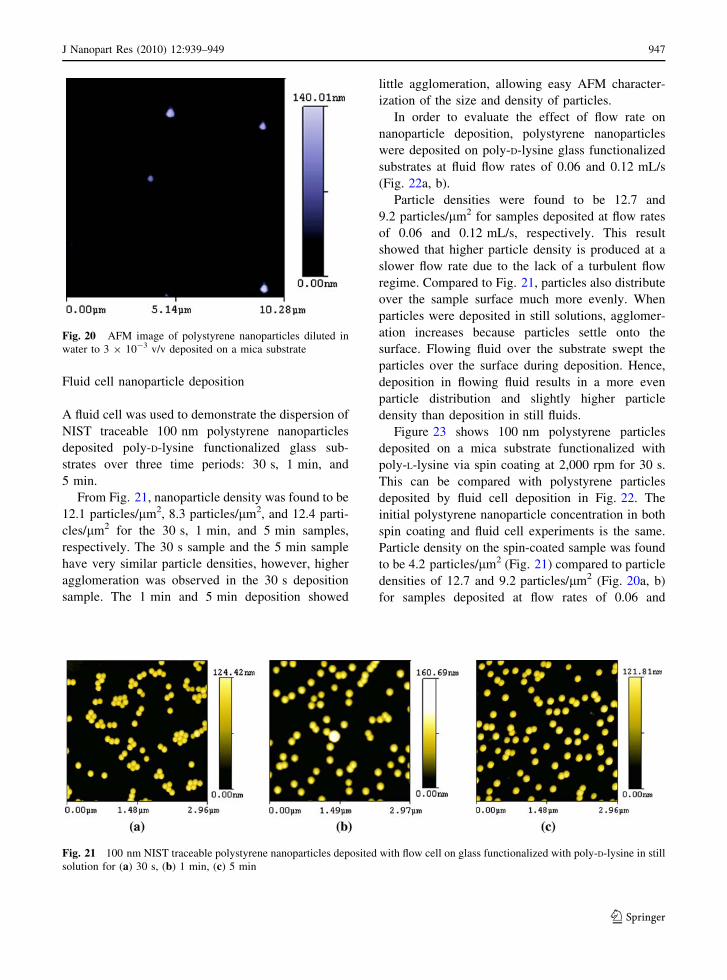
From SEM and AFM images of deposited silica
nanoparticles on heat treated silicon wafers (Fig. 17),
nanoparticles deposit evenly over the surface in a less
agglomerated fashion compared to the agglomeration
of silica nanoparticles on non heat treated silicon
(Fig. 6). The even dispersion of silica nanoparticles is
due to the growth of an oxide layer on the silicon
wafer that increases the surface roughness of the
substrate. The surface roughness before and after
annealing was 0.10 and 0.25 nm, respectively. In
contrast, polystyrene and gold nanoparticles depos-
ited on oxidized silicon wafers formed agglomerated
clusters across the surface.
Quantum dots were not deposited onto heat treated
silicon wafers because the size of the quantum dots is
small enough such that the oxide layer roughness on
the same scale would influence the size distribution
analysis.
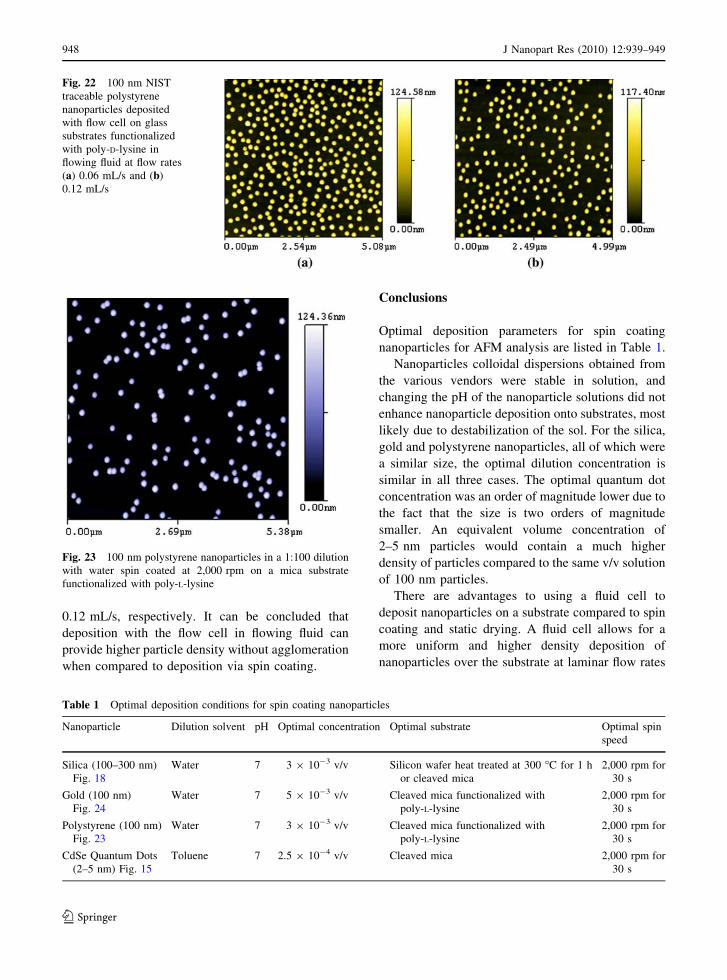
Mica functionalized with poly-L-lysine
Mica wafers were functionalized using poly-L-lysine,
and polystyrene and gold nanoparticles were spin
coated onto the functionalized substrate at 2,000 rpm
for 30 s. Nanoparticles dispersed evenly over the
substrate in higher densities (Fig. 19) compared to
non-functionalized substrates (Fig. 20).
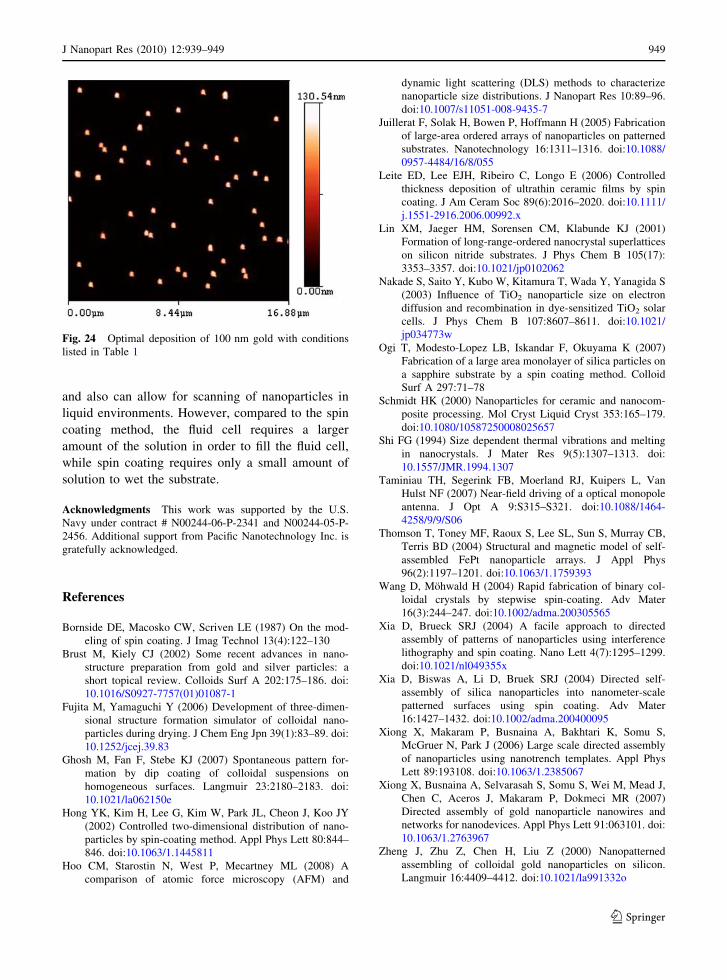
Quantum dots deposited onto atomically smooth,
cleaved mica substrates functionalized with poly-L-
lysine did not adhere on the functionalized mica
substrate. Poly-L-lysine inhibited quantum dot depo-
sition, most likely due to the charge associated with
the poly-L-lysine.Fig. 17 SEM image of 300 nm silica nanoparticles deposited
on a silicon wafer oxidized at 300 �C for 1 h
Fig. 18 AFM image of 300 nm silica nanoparticles deposited
on a silicon wafer oxidized at 300 �C for 1 h
Fig. 19 AFM image of polystyrene nanoparticles diluted in
water to 3 9 10-3 v/v deposited on a mica substrate function-
alized with poly-L-lysine
946 J Nanopart Res (2010) 12:939–949
123
Fluid cell nanoparticle deposition
A fluid cell was used to demonstrate the dispersion of
NIST traceable 100 nm polystyrene nanoparticles
deposited poly-D-lysine functionalized glass sub-
strates over three time periods: 30 s, 1 min, and
5 min.
From Fig. 21, nanoparticle density was found to be
12.1 particles/lm2, 8.3 particles/lm2, and 12.4 parti-
cles/lm2 for the 30 s, 1 min, and 5 min samples,
respectively. The 30 s sample and the 5 min sample
have very similar particle densities, however, higher
agglomeration was observed in the 30 s deposition
sample. The 1 min and 5 min deposition showed
little agglomeration, allowing easy AFM character-
ization of the size and density of particles.
In order to evaluate the effect of flow rate on
nanoparticle deposition, polystyrene nanoparticles
were deposited on poly-D-lysine glass functionalized
substrates at fluid flow rates of 0.06 and 0.12 mL/s
(Fig. 22a, b).
Particle densities were found to be 12.7 and
9.2 particles/lm2 for samples deposited at flow rates
of 0.06 and 0.12 mL/s, respectively. This result
showed that higher particle density is produced at a
slower flow rate due to the lack of a turbulent flow
regime. Compared to Fig. 21, particles also distribute
over the sample surface much more evenly. When
particles were deposited in still solutions, agglomer-
ation increases because particles settle onto the
surface. Flowing fluid over the substrate swept the
particles over the surface during deposition. Hence,
deposition in flowing fluid results in a more even
particle distribution and slightly higher particle
density than deposition in still fluids.
Figure 23 shows 100 nm polystyrene particles
deposited on a mica substrate functionalized with
poly-L-lysine via spin coating at 2,000 rpm for 30 s.
This can be compared with polystyrene particles
deposited by fluid cell deposition in Fig. 22. The
initial polystyrene nanoparticle concentration in both
spin coating and fluid cell experiments is the same.
Particle density on the spin-coated sample was found
to be 4.2 particles/lm2 (Fig. 21) compared to particle
densities of 12.7 and 9.2 particles/lm2 (Fig. 20a, b)
for samples deposited at flow rates of 0.06 and
Fig. 20 AFM image of polystyrene nanoparticles diluted in
water to 3 9 10-3 v/v deposited on a mica substrate
Fig. 21 100 nm NIST traceable polystyrene nanoparticles deposited with flow cell on glass functionalized with poly-D-lysine in still
solution for (a) 30 s, (b) 1 min, (c) 5 min
J Nanopart Res (2010) 12:939–949 947
123
0.12 mL/s, respectively. It can be concluded that
deposition with the flow cell in flowing fluid can
provide higher particle density without agglomeration
when compared to deposition via spin coating.
Conclusions
Optimal deposition parameters for spin coating
nanoparticles for AFM analysis are listed in Table 1.
Nanoparticles colloidal dispersions obtained from
the various vendors were stable in solution, and
changing the pH of the nanoparticle solutions did not
enhance nanoparticle deposition onto substrates, most
likely due to destabilization of the sol. For the silica,
gold and polystyrene nanoparticles, all of which were
a similar size, the optimal dilution concentration is
similar in all three cases. The optimal quantum dot
concentration was an order of magnitude lower due to
the fact that the size is two orders of magnitude
smaller. An equivalent volume concentration of
2–5 nm particles would contain a much higher
density of particles compared to the same v/v solution
of 100 nm particles.
There are advantages to using a fluid cell to
deposit nanoparticles on a substrate compared to spin
coating and static drying. A fluid cell allows for a
more uniform and higher density deposition of
nanoparticles over the substrate at laminar flow rates
Fig. 22 100 nm NIST
traceable polystyrene
nanoparticles deposited
with flow cell on glass
substrates functionalized
with poly-D-lysine in
flowing fluid at flow rates
(a) 0.06 mL/s and (b)
0.12 mL/s
Fig. 23 100 nm polystyrene nanoparticles in a 1:100 dilution
with water spin coated at 2,000 rpm on a mica substrate
functionalized with poly-L-lysine
Table 1 Optimal deposition conditions for spin coating nanoparticles
Nanoparticle Dilution solvent pH Optimal concentration Optimal substrate Optimal spin
speed
Silica (100–300 nm)
Fig. 18
Water 7 3 9 10-3 v/v Silicon wafer heat treated at 300 �C for 1 h
or cleaved mica
2,000 rpm for
30 s
Gold (100 nm)
Fig. 24
Water 7 5 9 10-3 v/v Cleaved mica functionalized with
poly-L-lysine
2,000 rpm for
30 s
Polystyrene (100 nm)
Fig. 23
Water 7 3 9 10-3 v/v Cleaved mica functionalized with
poly-L-lysine
2,000 rpm for
30 s
CdSe Quantum Dots
(2–5 nm) Fig. 15
Toluene 7 2.5 9 10-4 v/v Cleaved mica 2,000 rpm for
30 s
948 J Nanopart Res (2010) 12:939–949
123
and also can allow for scanning of nanoparticles in
liquid environments. However, compared to the spin
coating method, the fluid cell requires a larger
amount of the solution in order to fill the fluid cell,
while spin coating requires only a small amount of
solution to wet the substrate.
Acknowledgments This work was supported by the U.S.
Navy under contract # N00244-06-P-2341 and N00244-05-P-
2456. Additional support from Pacific Nanotechnology Inc. is
gratefully acknowledged.
References
Bornside DE, Macosko CW, Scriven LE (1987) On the mod-
eling of spin coating. J Imag Technol 13(4):122–130
Brust M, Kiely CJ (2002) Some recent advances in nano-
structure preparation from gold and silver particles: a
short topical review. Colloids Surf A 202:175–186. doi:
10.1016/S0927-7757(01)01087-1
Fujita M, Yamaguchi Y (2006) Development of three-dimen-
sional structure formation simulator of colloidal nano-
particles during drying. J Chem Eng Jpn 39(1):83–89. doi:
10.1252/jcej.39.83
Ghosh M, Fan F, Stebe KJ (2007) Spontaneous pattern for-
mation by dip coating of colloidal suspensions on
homogeneous surfaces. Langmuir 23:2180–2183. doi:
10.1021/la062150e
Hong YK, Kim H, Lee G, Kim W, Park JL, Cheon J, Koo JY
(2002) Controlled two-dimensional distribution of nano-
particles by spin-coating method. Appl Phys Lett 80:844–
846. doi:10.1063/1.1445811
Hoo CM, Starostin N, West P, Mecartney ML (2008) A
comparison of atomic force microscopy (AFM) and
dynamic light scattering (DLS) methods to characterize
nanoparticle size distributions. J Nanopart Res 10:89–96.
doi:10.1007/s11051-008-9435-7
Juillerat F, Solak H, Bowen P, Hoffmann H (2005) Fabrication
of large-area ordered arrays of nanoparticles on patterned
substrates. Nanotechnology 16:1311–1316. doi:10.1088/
0957-4484/16/8/055
Leite ED, Lee EJH, Ribeiro C, Longo E (2006) Controlled
thickness deposition of ultrathin ceramic films by spin
coating. J Am Ceram Soc 89(6):2016–2020. doi:10.1111/
j.1551-2916.2006.00992.x
Lin XM, Jaeger HM, Sorensen CM, Klabunde KJ (2001)
Formation of long-range-ordered nanocrystal superlattices
on silicon nitride substrates. J Phys Chem B 105(17):
3353–3357. doi:10.1021/jp0102062
Nakade S, Saito Y, Kubo W, Kitamura T, Wada Y, Yanagida S
(2003) Influence of TiO2 nanoparticle size on electron
diffusion and recombination in dye-sensitized TiO2 solar
cells. J Phys Chem B 107:8607–8611. doi:10.1021/
jp034773w
Ogi T, Modesto-Lopez LB, Iskandar F, Okuyama K (2007)
Fabrication of a large area monolayer of silica particles on
a sapphire substrate by a spin coating method. Colloid
Surf A 297:71–78
Schmidt HK (2000) Nanoparticles for ceramic and nanocom-
posite processing. Mol Cryst Liquid Cryst 353:165–179.
doi:10.1080/10587250008025657
Shi FG (1994) Size dependent thermal vibrations and melting
in nanocrystals. J Mater Res 9(5):1307–1313. doi:
10.1557/JMR.1994.1307
Taminiau TH, Segerink FB, Moerland RJ, Kuipers L, Van
Hulst NF (2007) Near-field driving of a optical monopole
antenna. J Opt A 9:S315–S321. doi:10.1088/1464-
4258/9/9/S06
Thomson T, Toney MF, Raoux S, Lee SL, Sun S, Murray CB,
Terris BD (2004) Structural and magnetic model of self-
assembled FePt nanoparticle arrays. J Appl Phys
96(2):1197–1201. doi:10.1063/1.1759393
Wang D, Mohwald H (2004) Rapid fabrication of binary col-
loidal crystals by stepwise spin-coating. Adv Mater
16(3):244–247. doi:10.1002/adma.200305565
Xia D, Brueck SRJ (2004) A facile approach to directed
assembly of patterns of nanoparticles using interference
lithography and spin coating. Nano Lett 4(7):1295–1299.
doi:10.1021/nl049355x
Xia D, Biswas A, Li D, Bruek SRJ (2004) Directed self-
assembly of silica nanoparticles into nanometer-scale
patterned surfaces using spin coating. Adv Mater
16:1427–1432. doi:10.1002/adma.200400095
Xiong X, Makaram P, Busnaina A, Bakhtari K, Somu S,
McGruer N, Park J (2006) Large scale directed assembly
of nanoparticles using nanotrench templates. Appl Phys
Lett 89:193108. doi:10.1063/1.2385067
Xiong X, Busnaina A, Selvarasah S, Somu S, Wei M, Mead J,
Chen C, Aceros J, Makaram P, Dokmeci MR (2007)
Directed assembly of gold nanoparticle nanowires and
networks for nanodevices. Appl Phys Lett 91:063101. doi:
10.1063/1.2763967
Zheng J, Zhu Z, Chen H, Liu Z (2000) Nanopatterned
assembling of colloidal gold nanoparticles on silicon.
Langmuir 16:4409–4412. doi:10.1021/la991332o
Fig. 24 Optimal deposition of 100 nm gold with conditions
listed in Table 1
J Nanopart Res (2010) 12:939–949 949
123
Related Documents