OPSM 301 Operations Management Class 16: Quality (All of Chapter 6 included) Koç University Zeynep Aksin [email protected]

OPSM 301 Operations Management Class 16: Quality (All of Chapter 6 included) Koç University Zeynep Aksin [email protected].
Dec 25, 2015
Welcome message from author
This document is posted to help you gain knowledge. Please leave a comment to let me know what you think about it! Share it to your friends and learn new things together.
Transcript
OPSM 301 Operations Management
Class 16:
Quality(All of Chapter 6 included)
Koç University
Zeynep [email protected]
Total Quality Management Defined Quality Specifications and Costs Six Sigma Quality and Tools External Benchmarking ISO 9000 Service Quality
Objectives Objectives
Total Quality Management (TQM)Defined
Total Quality Management (TQM)Defined
Total quality management is defined as
managing the entire organization so that it
excels on all dimensions of products and
services that are important to the customer
Quality ManagementQuality Management
What does the term quality mean?
– Product-based definition
– User-based definition
– Manufacturing based definition
Product-Based Definition
According to this view, differences in quality reflect differences in the quantity of some ingredient or attribute possessed by a product (Example: Fine rugs have a large number of knots per square centimeter)
This approach seems appropriate only if the attributes in question are considered preferable by virtually all buyers
Manufacturing-Based Definition
This approach identifies quality as “conformance to requirements”
This approach's primary focus is internal, however, the consumers’ interest in quality is implicitly recognized
According to the manufacturing-based approach, improvements in quality lead to lower costs
User-Based Definition
This approach starts from the opposite premise that quality “lies in the eyes of the beholder”
The goods that best satisfy consumers' preferences are those that they regard as having the highest quality
Shifting Definitions
The characteristics that connote quality must be
first identified through market research
These characteristics must then be translated
into identifiable product attributes
And finally, manufacturing process must be
organized to ensure that products are made
precisely to these specifications
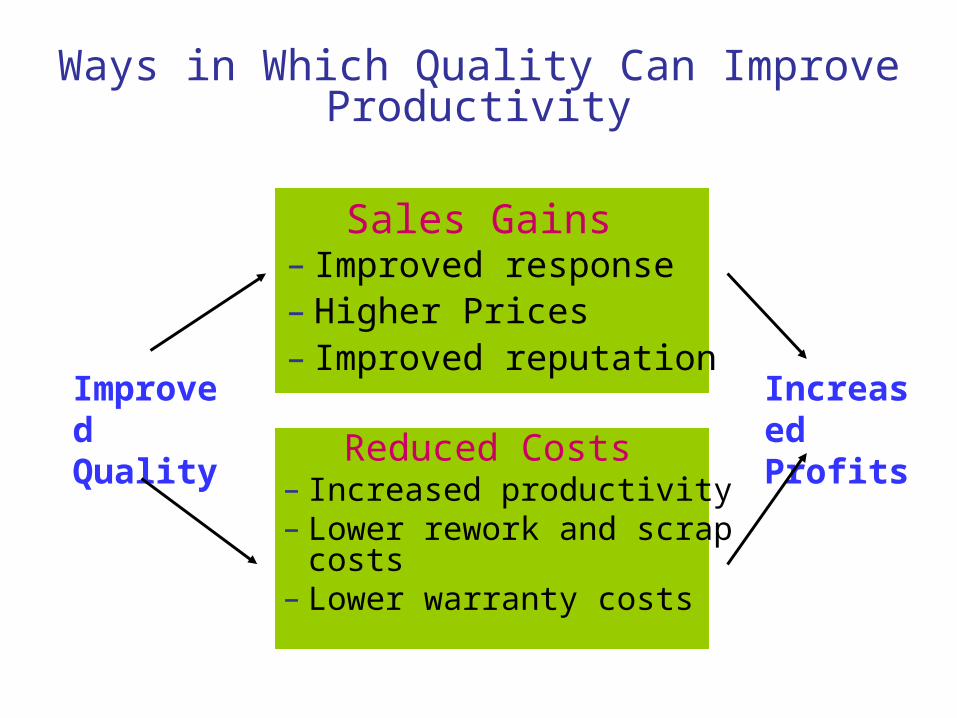
Ways in Which Quality Can Improve Productivity
Sales Gains– Improved response– Higher Prices– Improved reputation
Reduced Costs– Increased productivity– Lower rework and scrap
costs– Lower warranty costs
Increased Profits
Improved Quality
Quality SpecificationsQuality Specifications
Quality: Inherent value of the product in the
marketplace
– Dimensions include: Performance, Features,
Reliability, Conformance, Durability, Serviceability,
Aesthetics, and Perceived Quality (Reputation)
Eight Dimensions of QualityEight Dimensions of Quality
Performance Features Reliability Conformance Durability Serviceability Aesthetics Perceived quality
Performance
Performance refers to a product's primary operating characteristics (Acceleration of a car, brightness of a TV set)
Different brands can easily be ranked objectively on individual aspects of performance
Features
Features are the bells and whistles of products and services, they supplement their basic functioning (Push-button windows)
It is hard to draw the line separating primary performance characteristics from secondary features
Many customers may wish to customize or personalize their purchases, and availability of different features plays an important role in meeting these requirements
Reliability
Reliability reflects the probability of a product malfunctioning or failing within a specified time period (Mean time to first failure, mean time between failures)
These measures are most relevant to durable goods than to products and services that are consumed instantly
Reliability normally becomes more important to consumers as down time and maintenance become more expensive
Conformance
Conformance is the degree to which a product's design and operating characteristics meet established standards
These standards are normally expressed as a target or center, and deviance from the center is permitted within a specified range
Durability
Durability is a measure of product life and may be defined as the amount of use one gets from a product before it breaks down and replacement is preferable to continued repair
Serviceability, Aesthetics, and Perceived Quality
Serviceability is a measure of speed, courtesy, competence, and ease of repair
Aesthetics (how a product looks, feels, sounds, tastes or smells) is a very subjective quality dimension
Perceived quality is the set of inferences we make about quality rather than the reality of itself
Quality Strategies
Certain dimensions may be pushed to the forefront to gain market share
Some of the dimensions are mutually reinforcing, some are not
The challenge is to compete on selected dimensions
Quality CostsQuality Costs
Cost of Control (Quality, Conformance)– Prevention costs: reducing the potential for
defects– Appraisal costs: evaluating products
Cost of Failure of Control (Unquality, non-conformance)– Internal failure costs:of producing defective
parts or service– External failure costs: occur after delivery

Continuous Improvement
Represents continual improvement of process & customer satisfaction
Involves all operations & work units
Other names– Kaizen (Japanese)– Zero-defects– Six sigma
© 1984-1994 T/Maker Co.
Six Sigma Quality
A philosophy and set of methods companies use
to eliminate defects in their products and
processes
Seeks to reduce variation in the processes that
lead to product defects
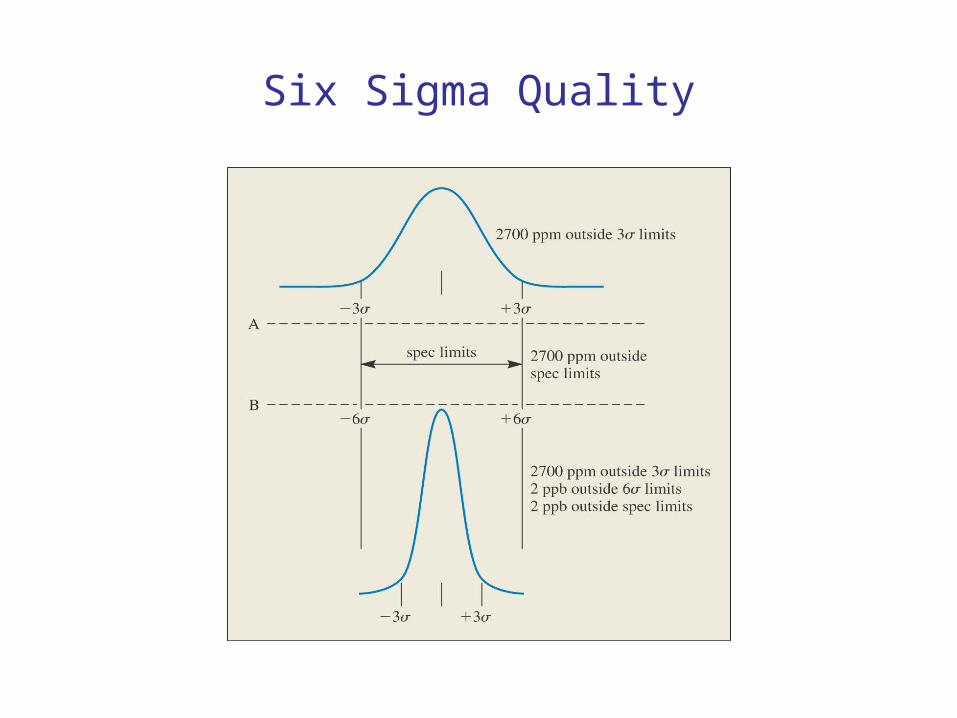
The name “six sigma” refers to the variation that
exists within plus or minus six standard
deviations of the process outputs 6
Six Sigma Quality
Six Sigma Quality (Continued)
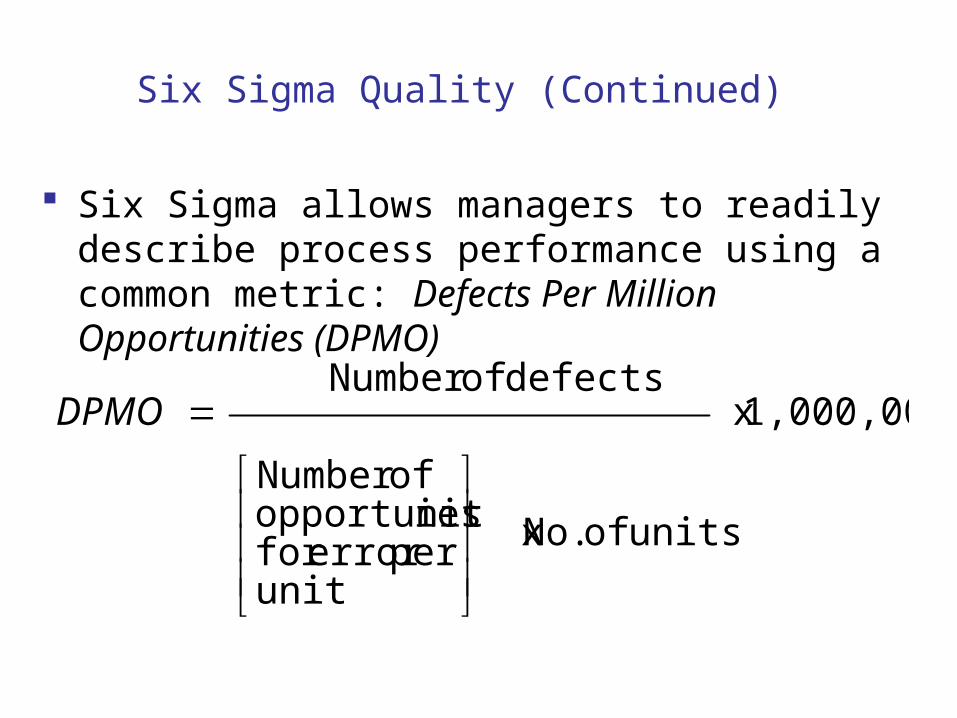
Six Sigma allows managers to readily describe process performance using a common metric: Defects Per Million Opportunities (DPMO)
1,000,000 x
units of No. x
unit per error for
iesopportunit ofNumber
defects ofNumber
DPMO
Six Sigma Quality (Continued)
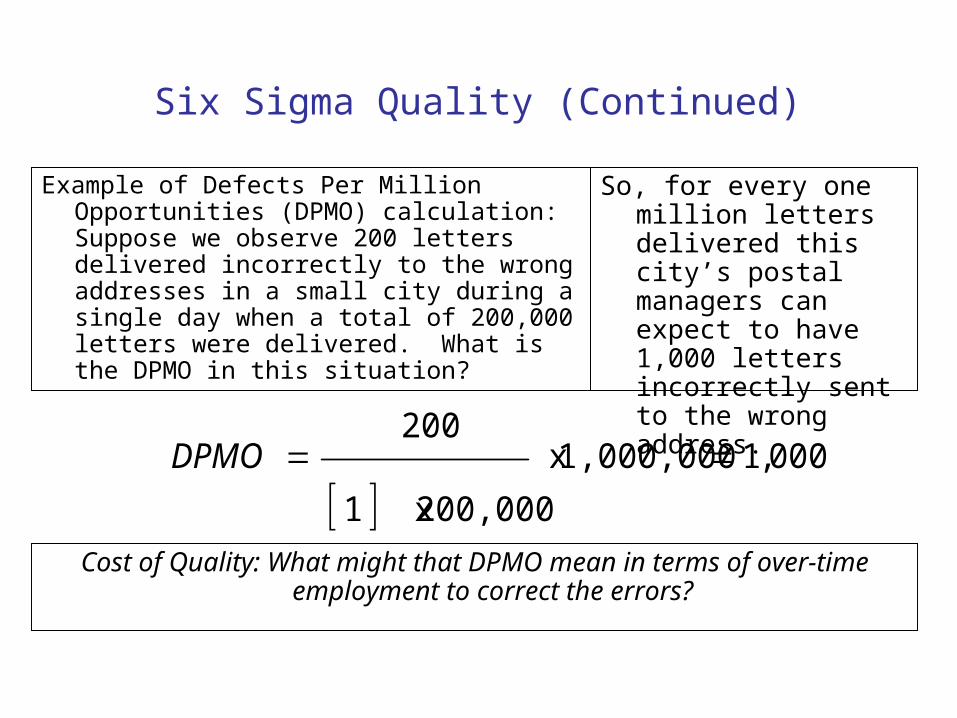
Example of Defects Per Million Opportunities (DPMO) calculation: Suppose we observe 200 letters delivered incorrectly to the wrong addresses in a small city during a single day when a total of 200,000 letters were delivered. What is the DPMO in this situation?
000,1 1,000,000 x
200,000 x 1
200DPMO
So, for every one million letters delivered this city’s postal managers can expect to have 1,000 letters incorrectly sent to the wrong address.
Cost of Quality: What might that DPMO mean in terms of over-time employment to correct the errors?
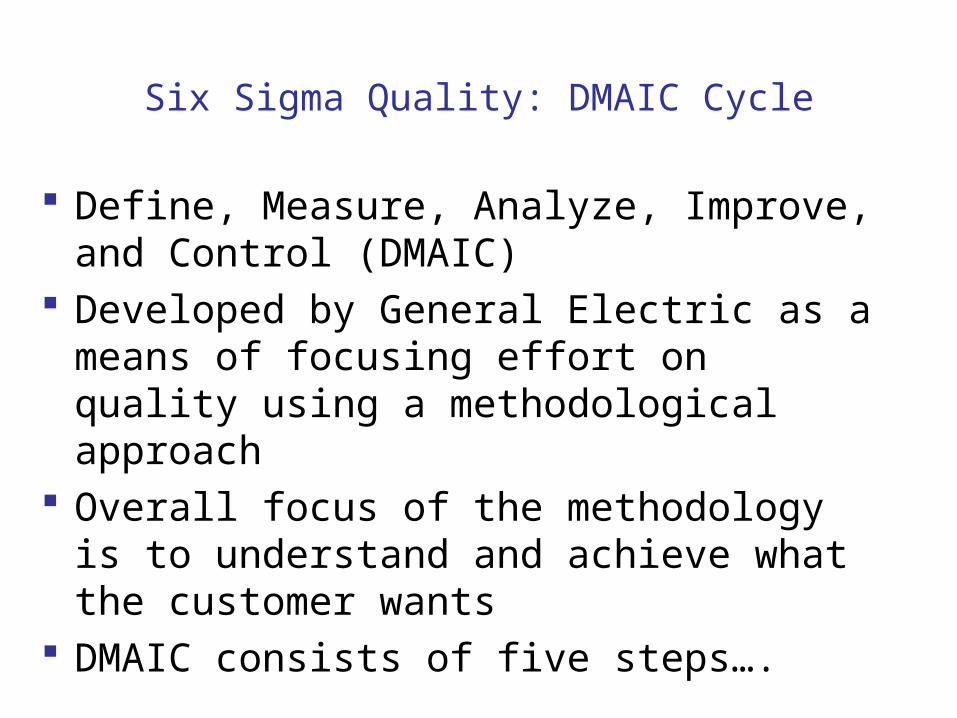
Six Sigma Quality: DMAIC Cycle
Define, Measure, Analyze, Improve, and Control (DMAIC)
Developed by General Electric as a means of focusing effort on quality using a methodological approach
Overall focus of the methodology is to understand and achieve what the customer wants
DMAIC consists of five steps….
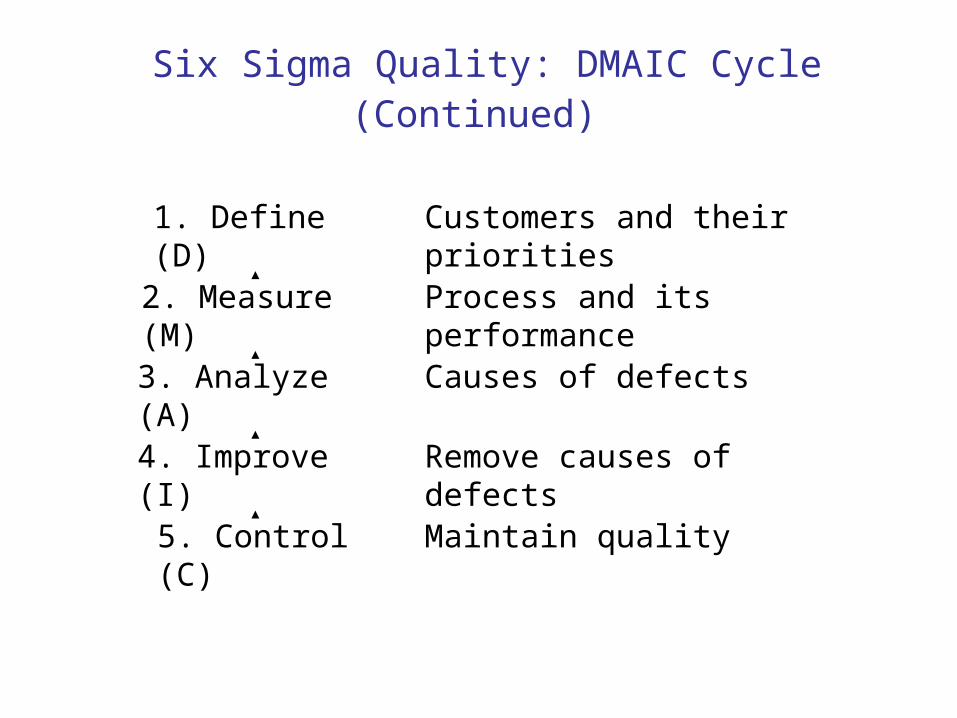
Six Sigma Quality: DMAIC Cycle (Continued)
5. Control (C)
Customers and their prioritiesProcess and its performanceCauses of defects
Remove causes of defectsMaintain quality
1. Define (D)
2. Measure (M)3. Analyze (A)
4. Improve (I)
DEFINEDEFINE
MEASUREMEASURE
ANALYZEANALYZE
IMPROVEIMPROVE
CONTROLCONTROL
MODIFY DESIGN?MODIFY
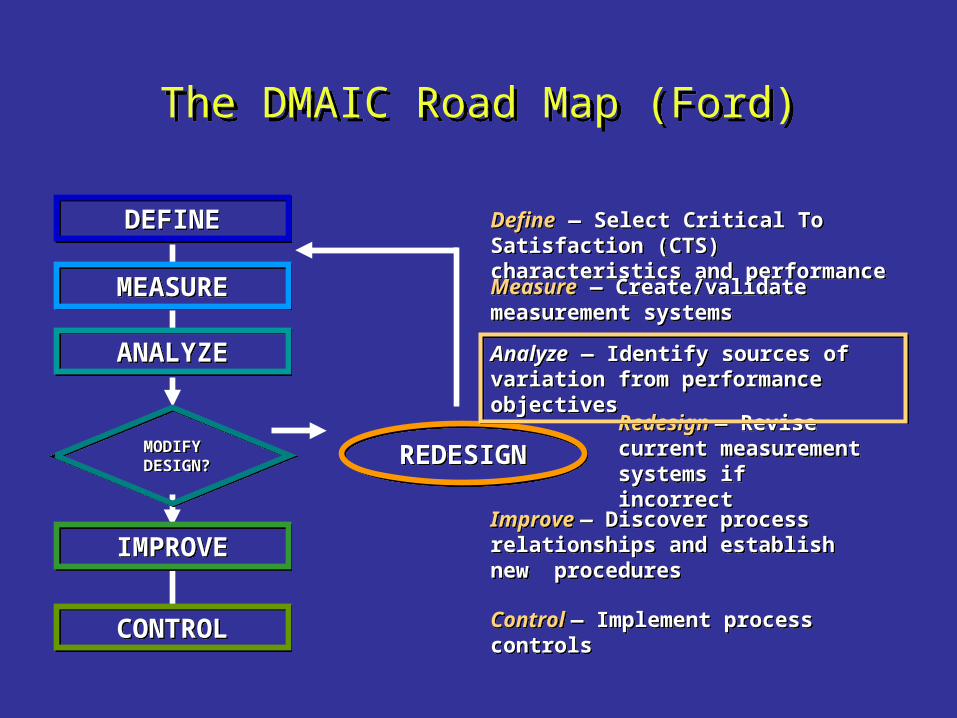
DESIGN? REDESIGNREDESIGNRedesign — Revise current measurement systems if incorrect
Redesign — Revise current measurement systems if incorrect
Define — Select Critical To Satisfaction (CTS) characteristics and performanceDefine — Select Critical To Satisfaction (CTS) characteristics and performance
Measure — Create/validate measurement systemsMeasure — Create/validate measurement systems
Analyze — Identify sources of variation from performance objectivesAnalyze — Identify sources of variation from performance objectives
Improve — Discover process relationships and establish new procedures
Improve — Discover process relationships and establish new procedures
Control — Implement process controlsControl — Implement process controls
The DMAIC Road Map (Ford)The DMAIC Road Map (Ford)
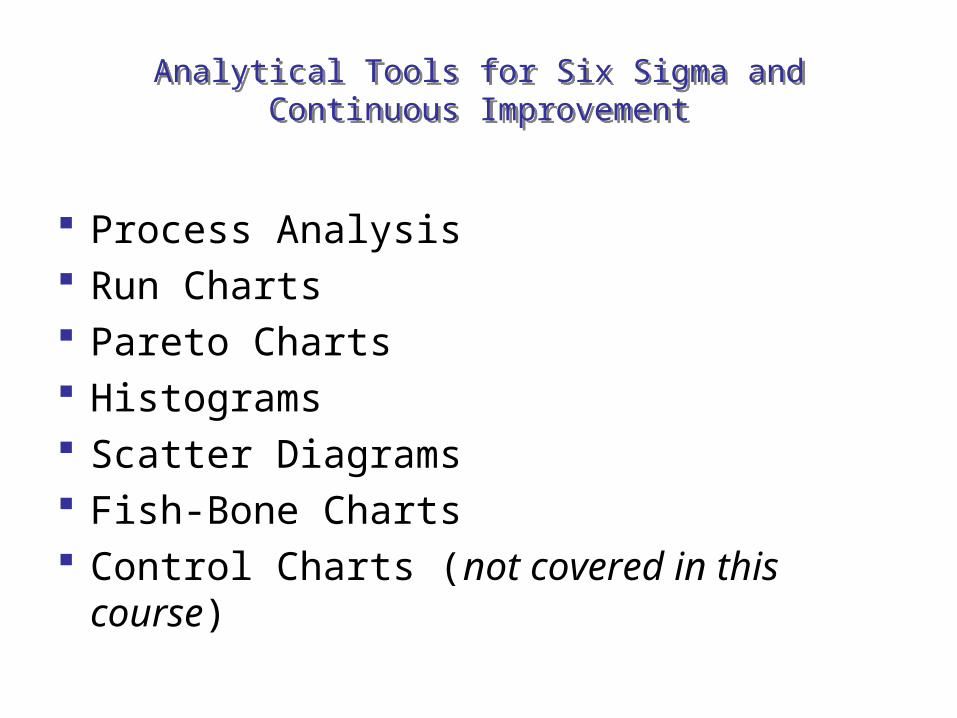
Analytical Tools for Six Sigma andContinuous Improvement
Analytical Tools for Six Sigma andContinuous Improvement
Process Analysis Run Charts Pareto Charts Histograms Scatter Diagrams Fish-Bone Charts Control Charts (not covered in this course)
Pareto Analysis
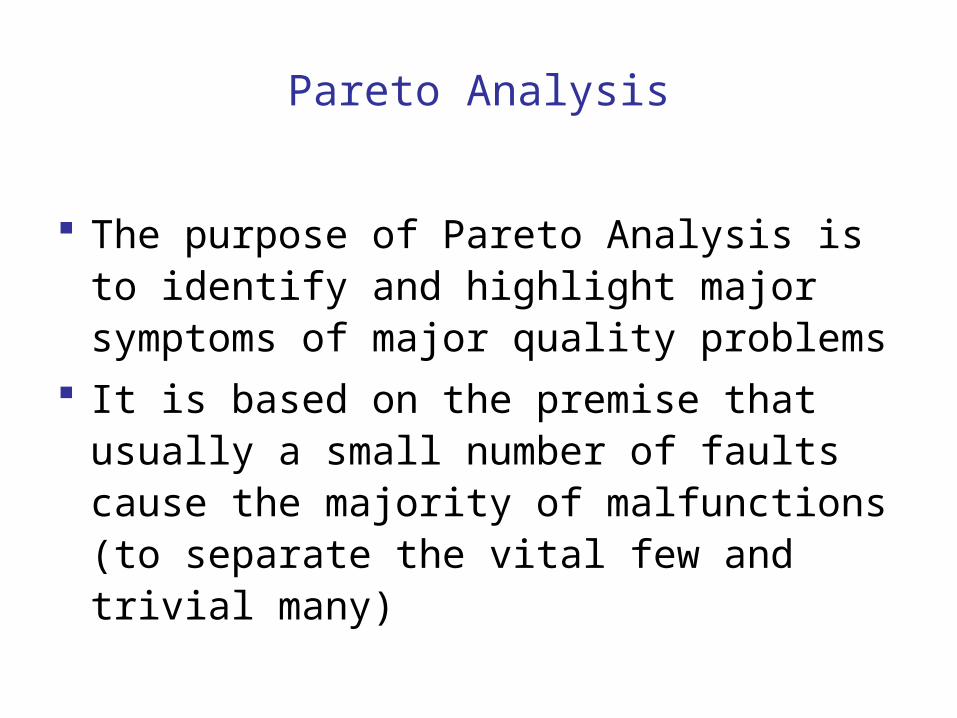
The purpose of Pareto Analysis is to identify and highlight major symptoms of major quality problems
It is based on the premise that usually a small number of faults cause the majority of malfunctions (to separate the vital few and trivial many)
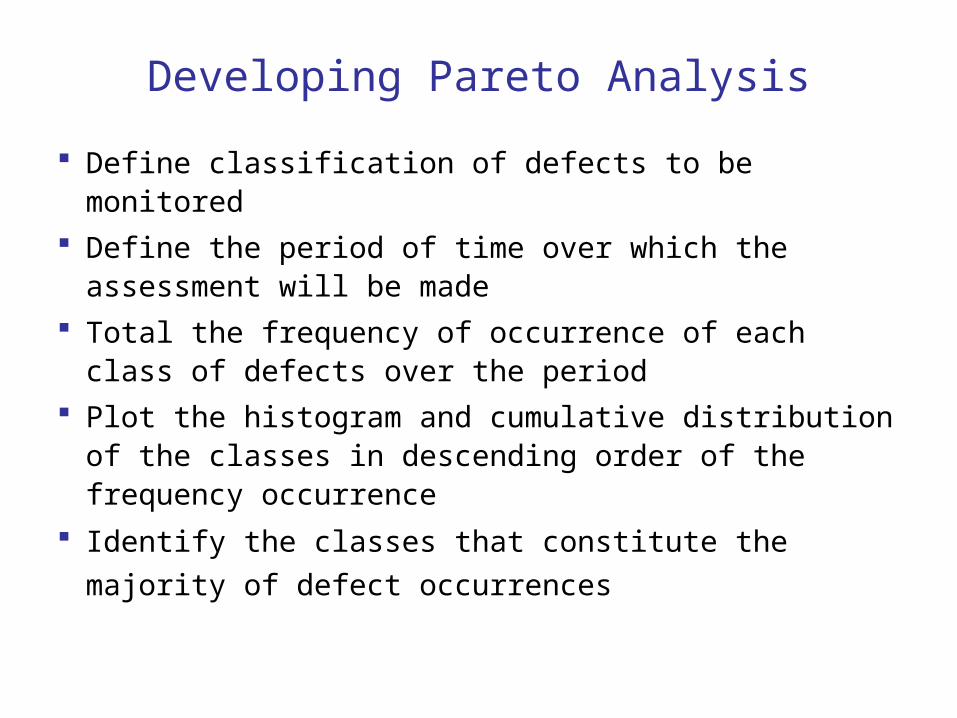
Developing Pareto Analysis
Define classification of defects to be monitored
Define the period of time over which the assessment will be made
Total the frequency of occurrence of each class of defects over the period
Plot the histogram and cumulative distribution of the classes in descending order of the frequency occurrence
Identify the classes that constitute the majority of
defect occurrences
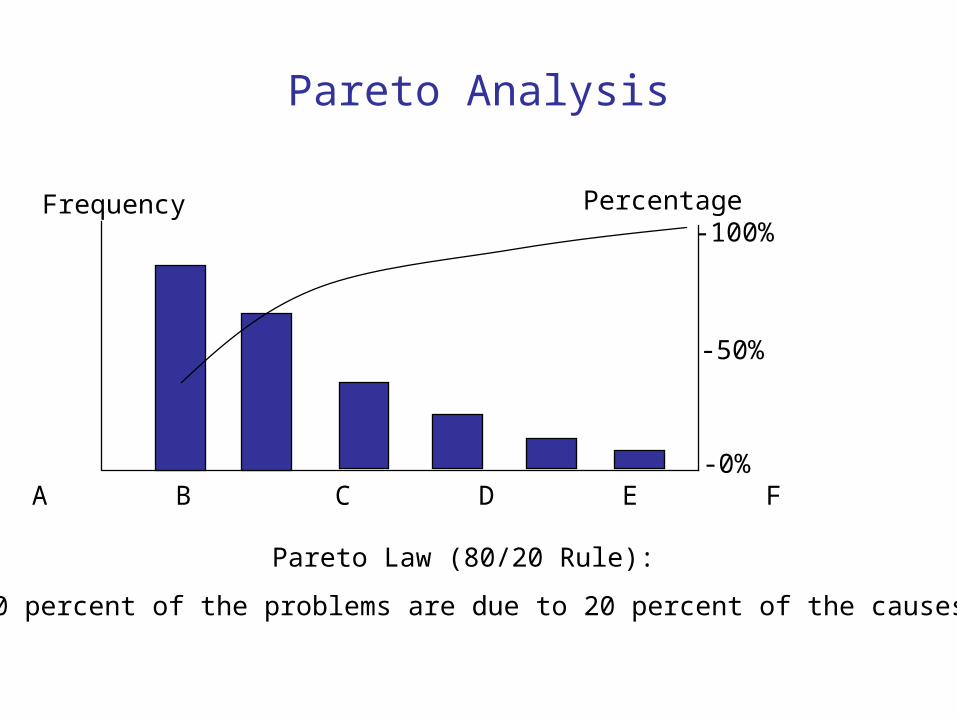
Pareto Analysis
Frequency Percentage-100%
-0%
-50%
A B C D E F
Pareto Law (80/20 Rule):
“80 percent of the problems are due to 20 percent of the causes”
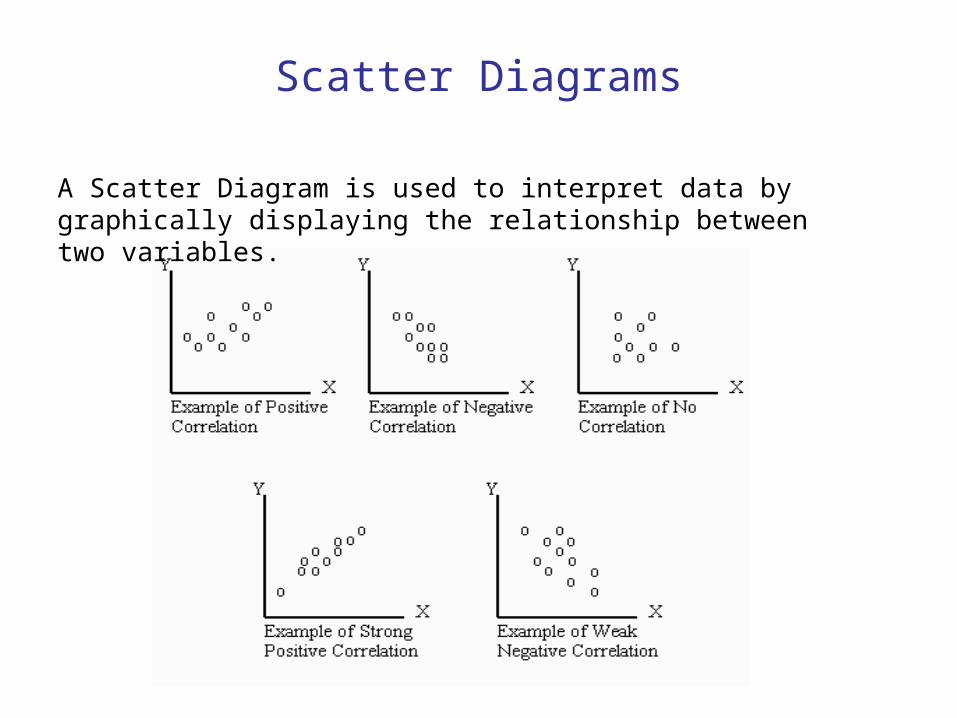
Scatter Diagrams
A Scatter Diagram is used to interpret data by graphically displaying the relationship between two variables.
Fish-Bone Diagram
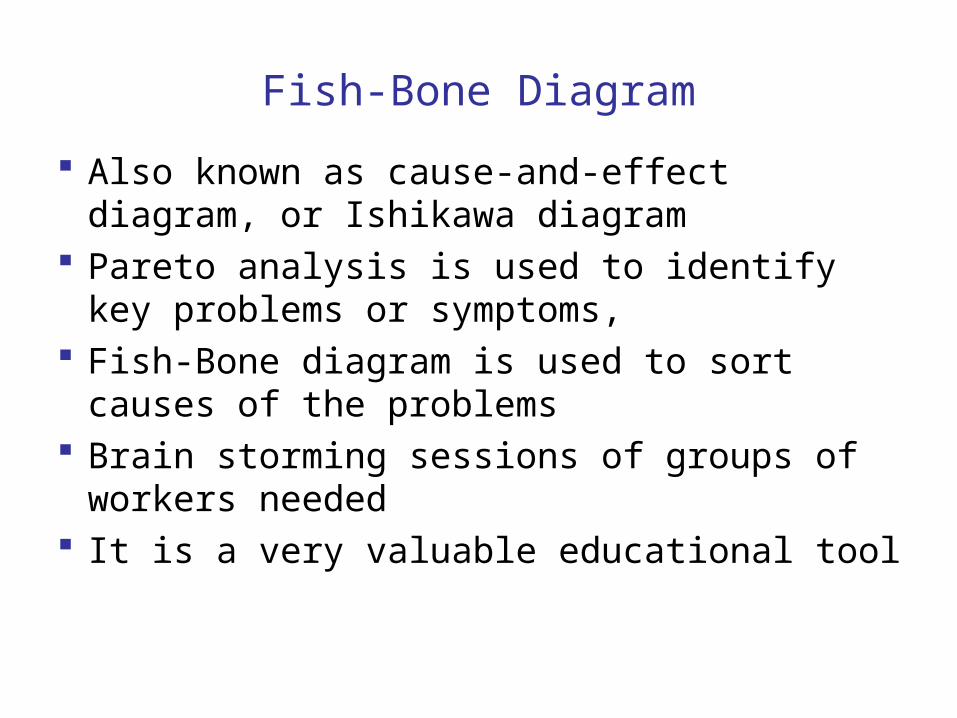
Also known as cause-and-effect diagram, or Ishikawa diagram
Pareto analysis is used to identify key problems or symptoms,
Fish-Bone diagram is used to sort causes of the problems
Brain storming sessions of groups of workers needed
It is a very valuable educational tool
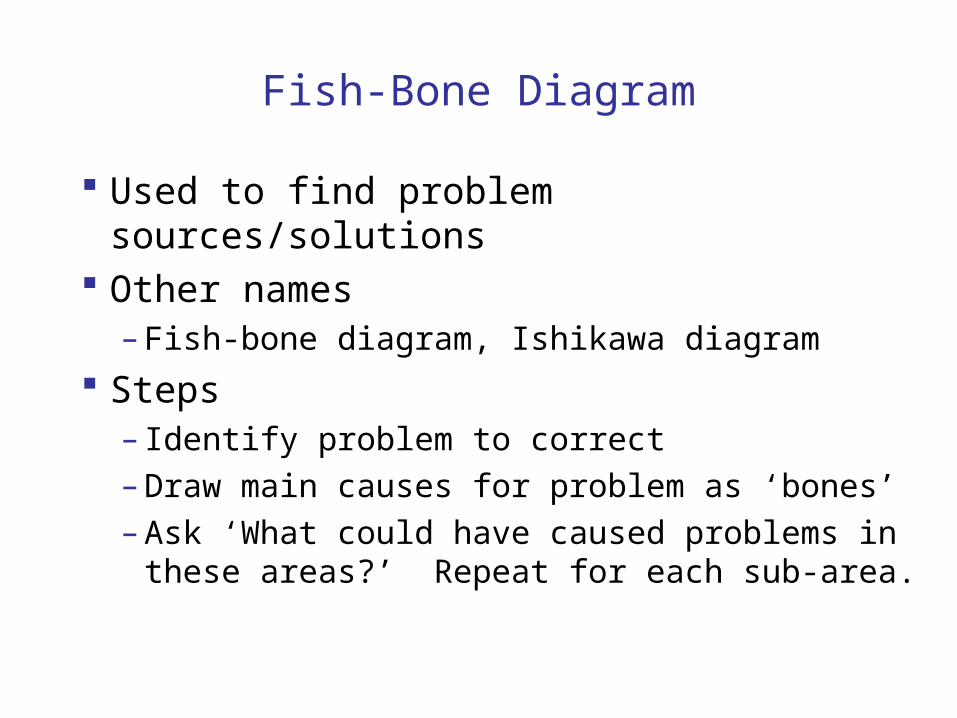
Used to find problem sources/solutions Other names
– Fish-bone diagram, Ishikawa diagram
Steps– Identify problem to correct– Draw main causes for problem as ‘bones’– Ask ‘What could have caused problems in
these areas?’ Repeat for each sub-area.
Fish-Bone Diagram
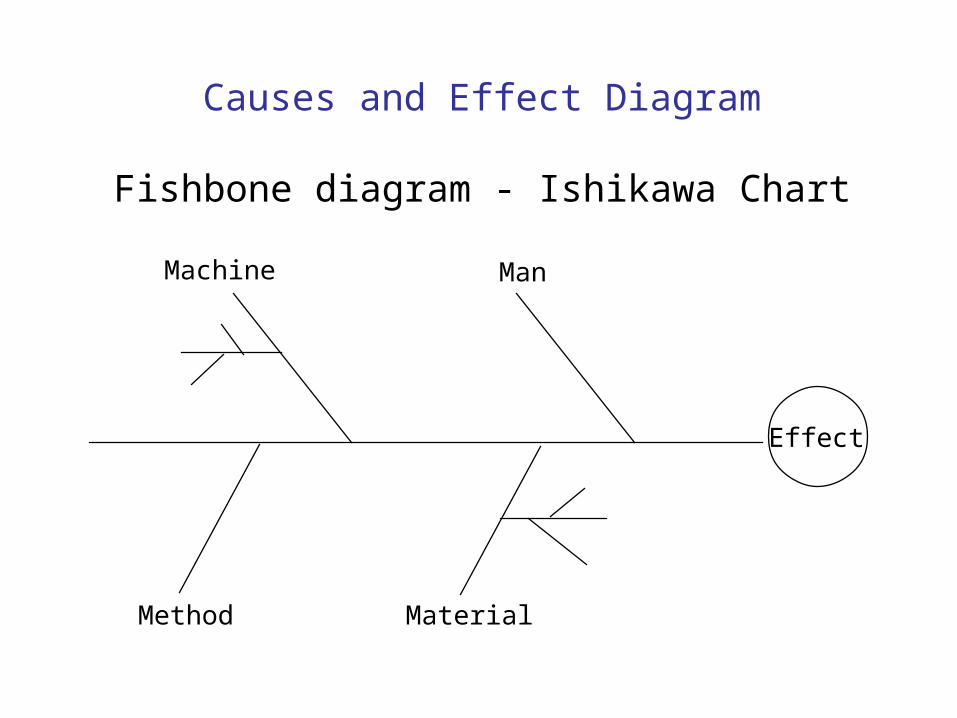
Causes and Effect Diagram
Fishbone diagram - Ishikawa Chart
Effect
Machine Man
MaterialMethod
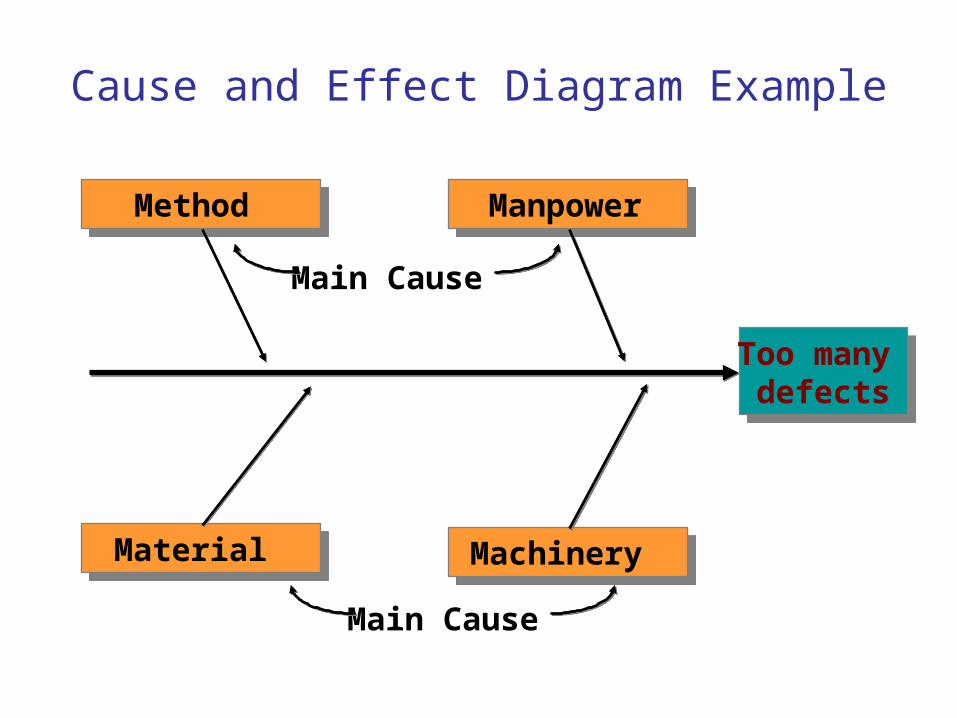
Method Manpower
Material Machinery
Too many defects
Too many defects
Main Cause
Main Cause
Cause and Effect Diagram Example
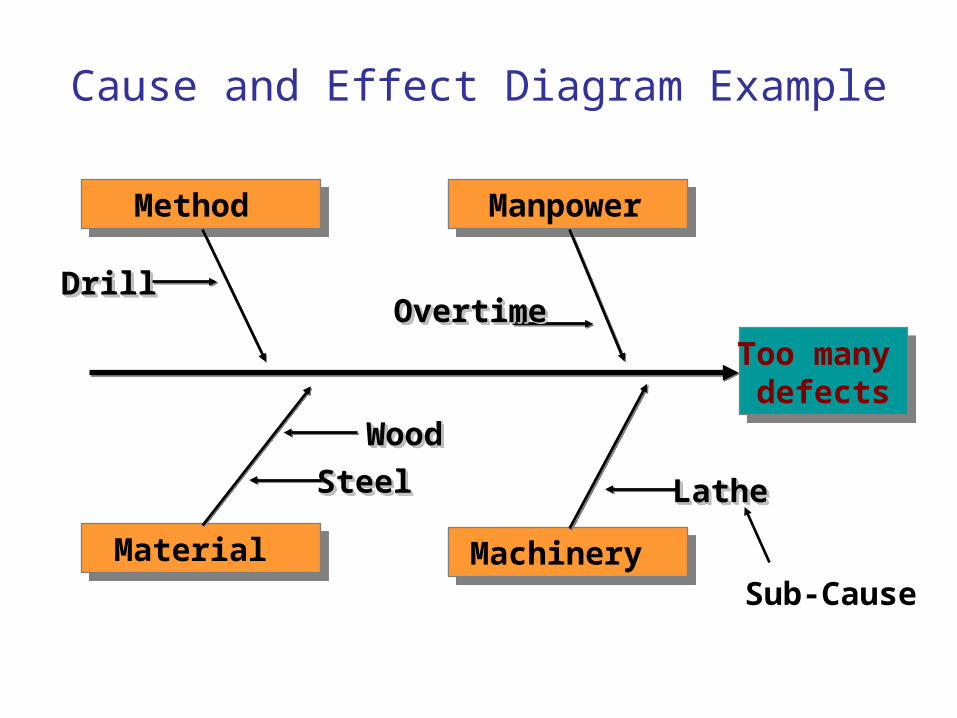
Method Manpower
Material Machinery
DrillDrillDrillDrillOvertimeOvertimeOvertimeOvertime
SteelSteelSteelSteelWoodWoodWoodWood
LatheLatheLatheLathe
Too many defects
Too many defects
Sub-Cause
Cause and Effect Diagram Example
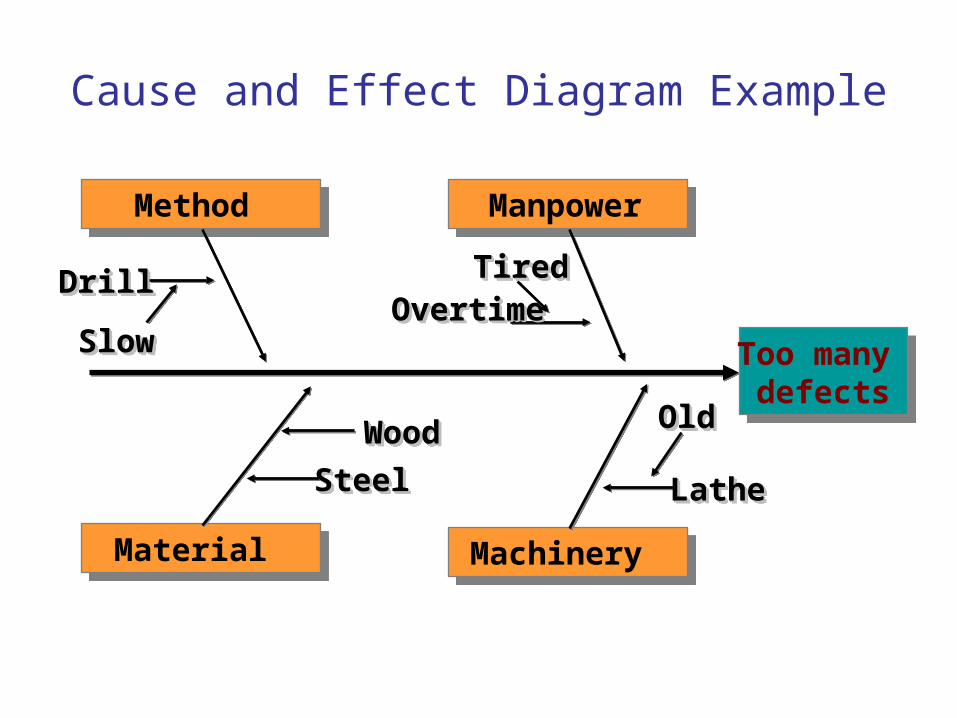
Method Manpower
Material Machinery
DrillDrillDrillDrillOvertimeOvertimeOvertimeOvertime
SteelSteelSteelSteelWoodWoodWoodWood
LatheLatheLatheLathe
Too many defects
Too many defects
TiredTiredTiredTired
OldOldOldOld
SlowSlowSlowSlow
Cause and Effect Diagram Example
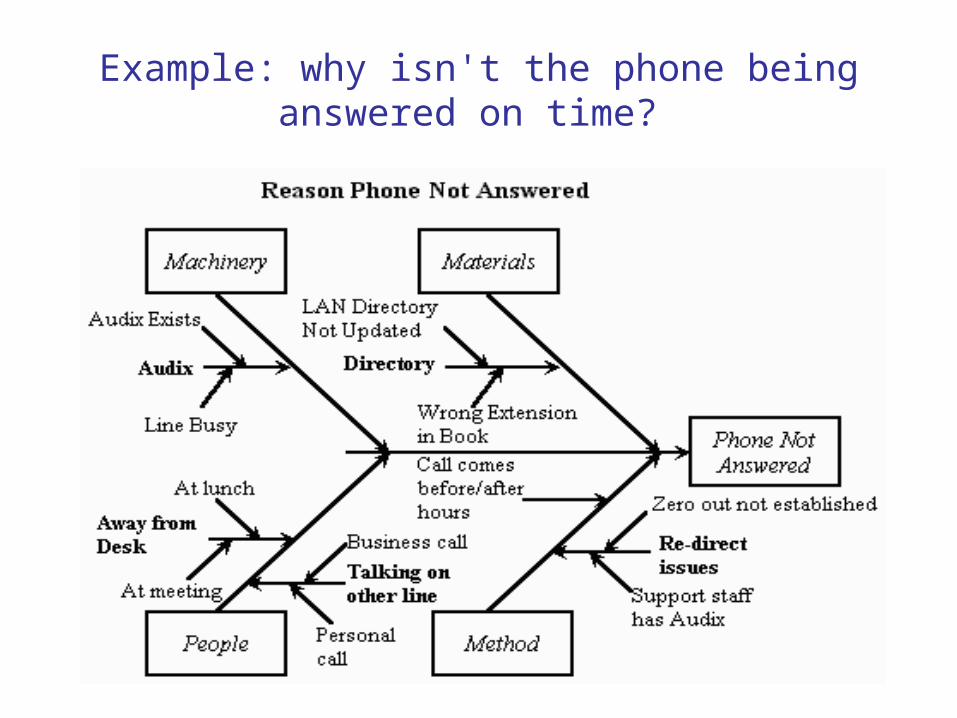
Example: why isn't the phone being answered on time?
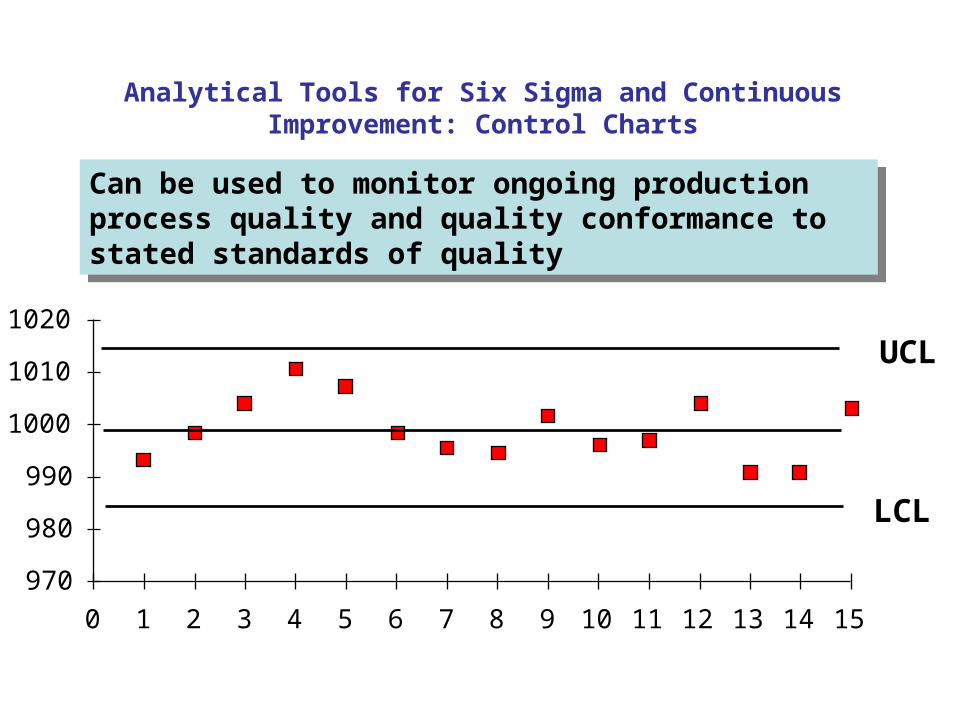
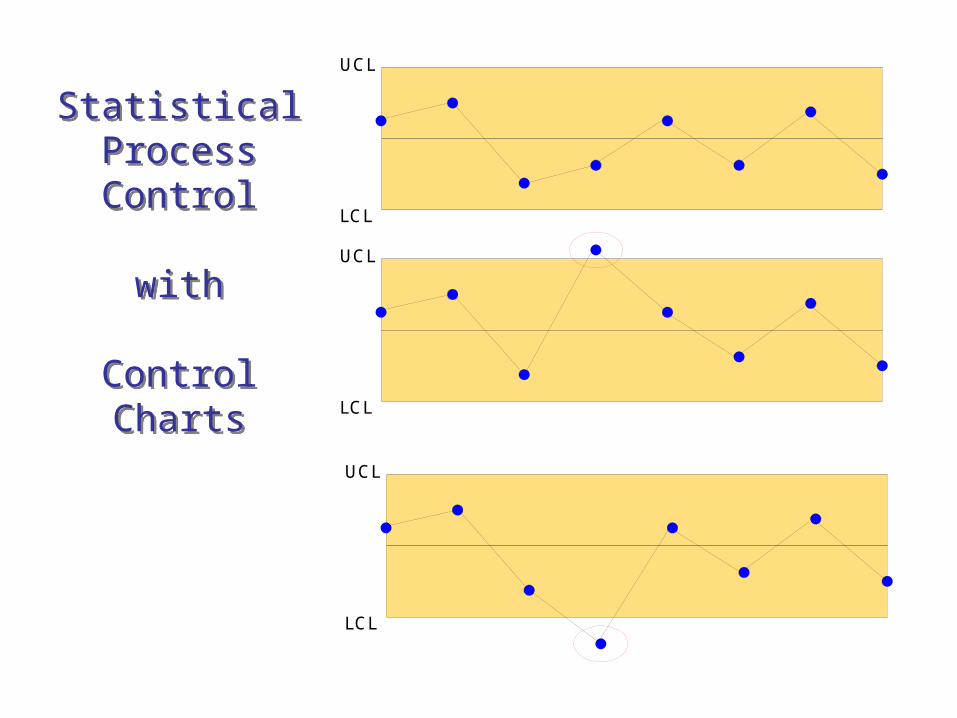
Analytical Tools for Six Sigma and Continuous Improvement: Control Charts
Can be used to monitor ongoing production process quality and quality conformance to stated standards of quality
Can be used to monitor ongoing production process quality and quality conformance to stated standards of quality
970
980
990
1000
1010
1020
0 1 2 3 4 5 6 7 8 9 10 11 12 13 14 15
LCL
UCL
UCL
LCL
UCL
LCL
UCL
LCL
StatisticalProcessControl
with
Control Charts
StatisticalProcessControl
with
Control Charts
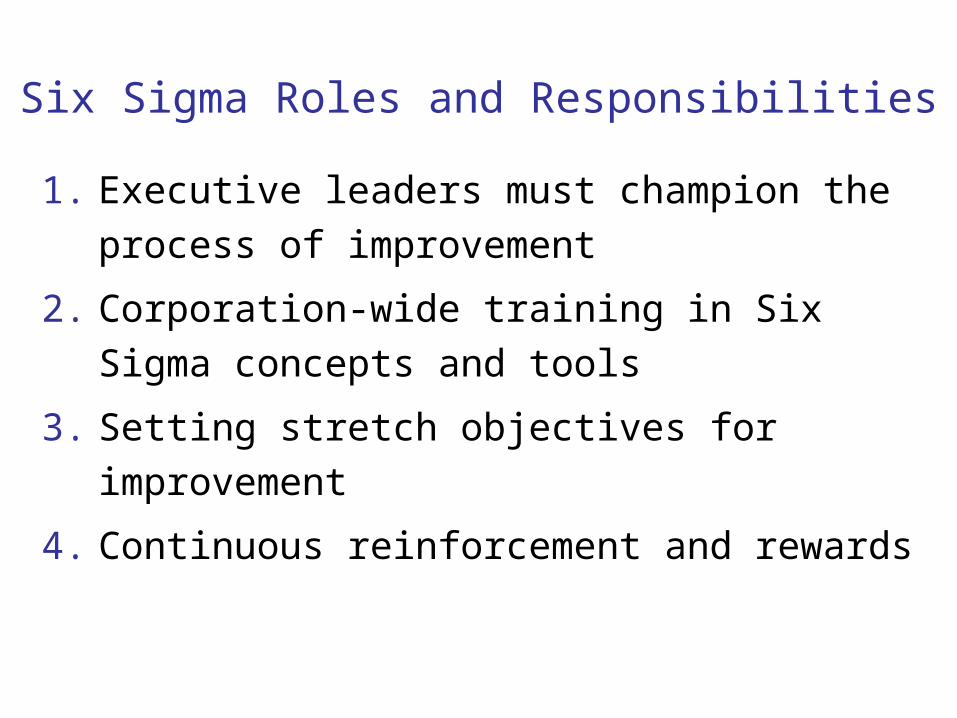
Six Sigma Roles and Responsibilities
1. Executive leaders must champion the
process of improvement
2. Corporation-wide training in Six Sigma
concepts and tools
3. Setting stretch objectives for improvement
4. Continuous reinforcement and rewards
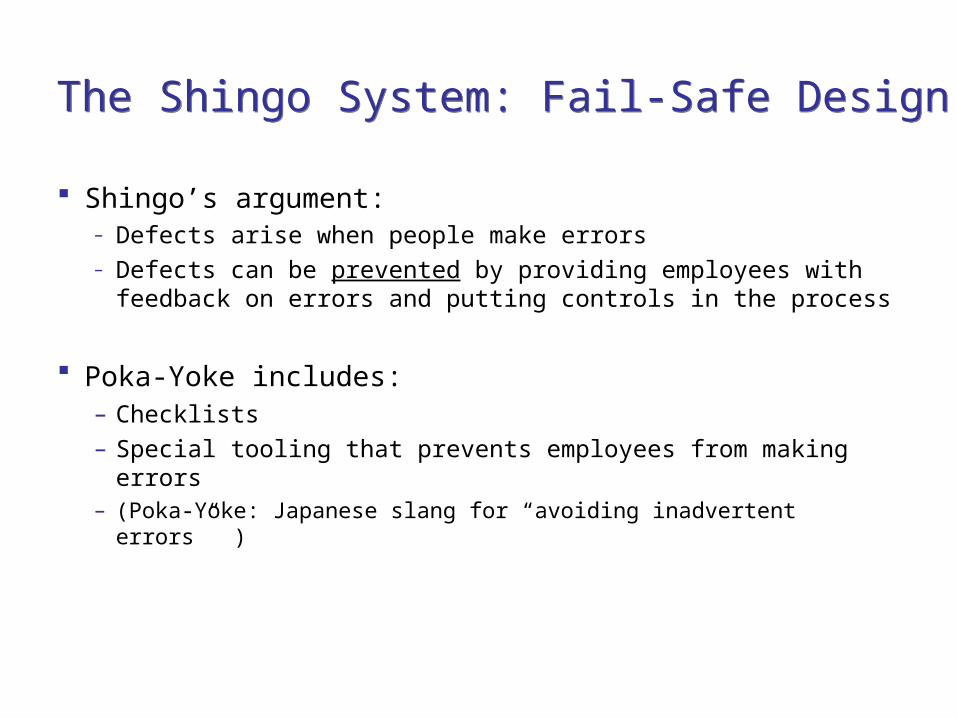
The Shingo System: Fail-Safe DesignThe Shingo System: Fail-Safe Design
Shingo’s argument:– Defects arise when people make errors– Defects can be prevented by providing employees with
feedback on errors and putting controls in the process
Poka-Yoke includes: – Checklists– Special tooling that prevents employees from making errors– (Poka-Yoke: Japanese slang for “avoiding inadvertent errors” )

Which dial turns on the burner?
Knowledge in the World:
Stove A
Stove B
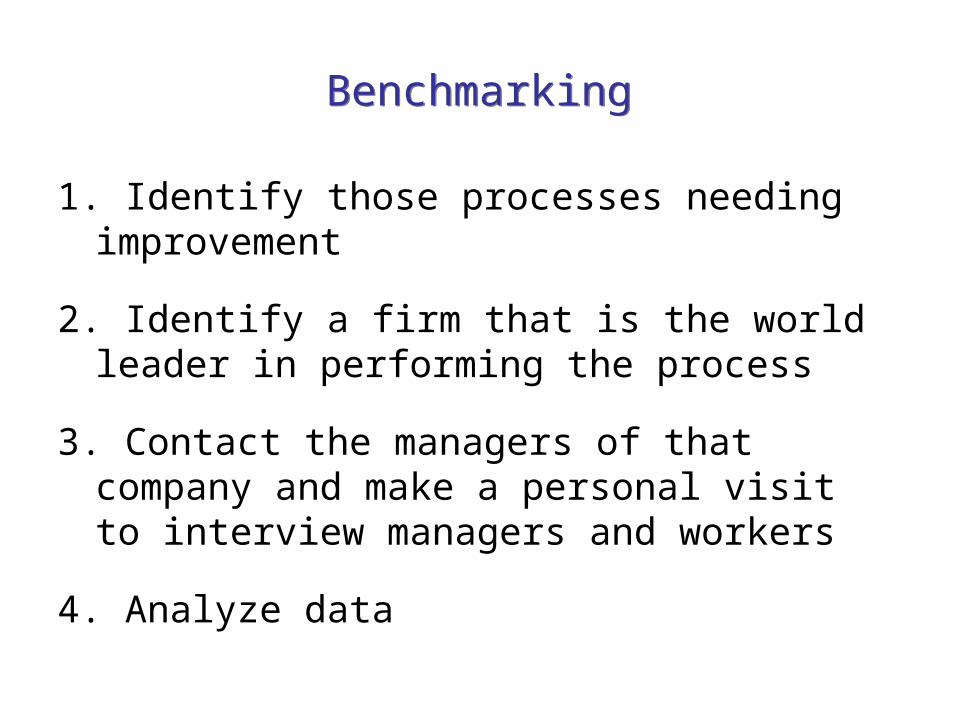
BenchmarkingBenchmarking
1. Identify those processes needing improvement
2. Identify a firm that is the world leader in performing the process
3. Contact the managers of that company and make a personal visit to interview managers and workers
4. Analyze data
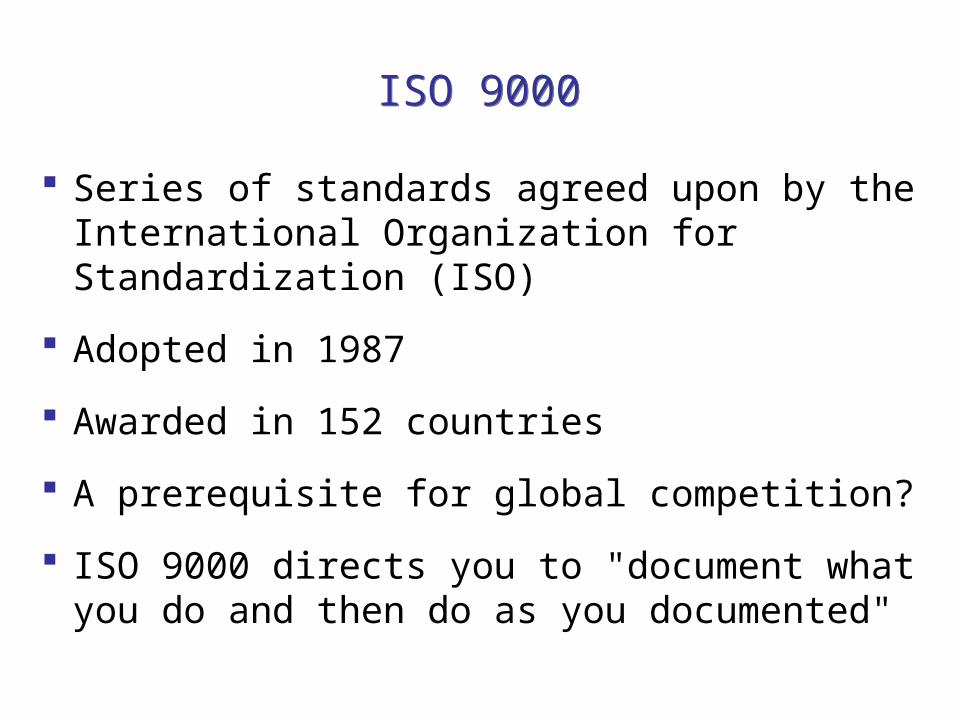
ISO 9000ISO 9000
Series of standards agreed upon by the International Organization for Standardization (ISO)
Adopted in 1987
Awarded in 152 countries
A prerequisite for global competition?
ISO 9000 directs you to "document what you do and then do as you documented"
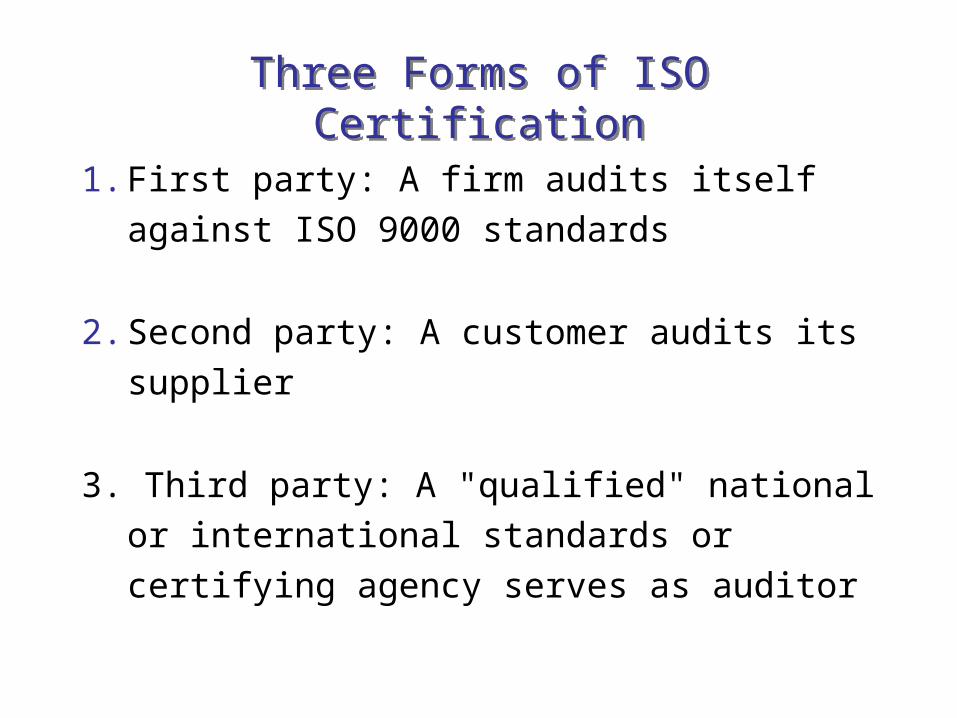
Three Forms of ISO CertificationThree Forms of ISO Certification
1. First party: A firm audits itself against ISO
9000 standards
2. Second party: A customer audits its supplier
3. Third party: A "qualified" national or
international standards or certifying agency
serves as auditor
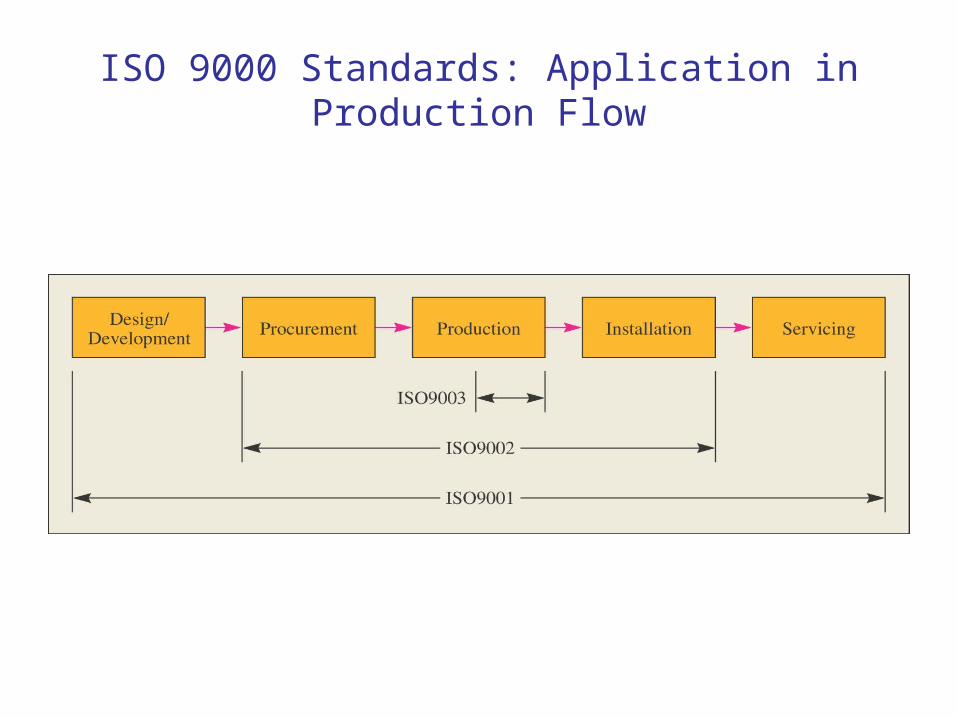
ISO 9000 Standards: Application in Production Flow
Related Documents