2019 Preliminary Budget Volume 2 OPERATING AND CAPITAL

Welcome message from author
This document is posted to help you gain knowledge. Please leave a comment to let me know what you think about it! Share it to your friends and learn new things together.
Transcript
2019 Preliminary Budget
Volume 2
OPERATING AND CAPITAL
WINNIPEG, MANITOBA, CANADA
City of Winnipeg
2019 Preliminary Budget
Operating and Capital Volume 2
The City of Winnipeg Winnipeg, Manitoba
R3B 1B9
Telephone Number: 311
Toll Free : 1-877-311-4WPG(4974)
www.winnipeg.ca
Government Finance Officers Association of the United States and Canada (GFOA) presented a Distinguished Budget Presentation Award to City of Winnipeg, Manitoba, for its Annual Budget for the fiscal year beginning January 1, 2018.
In order to receive this award, a governmental unit must publish a budget document that meets program criteria as a policy document, as a financial plan, as an operations guide and as a communications device.
This award is valid for a period of one year only. We believe our current budget continues to conform to program requirements, and we are submitting it to GFOA to determine its eligibility for another award.
i

ii
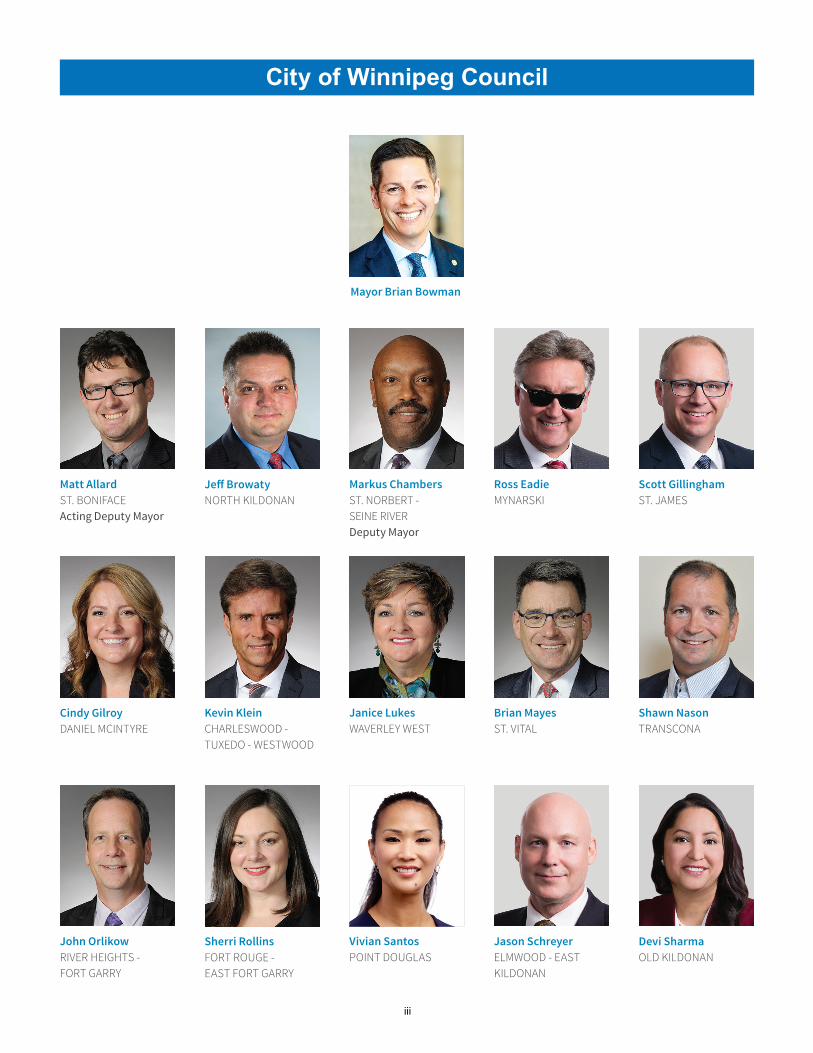
City of Winnipeg Council
Mayor Brian Bowman
Jeff BrowatyNORTH KILDONAN
Sherri RollinsFORT ROUGE - EAST FORT GARRY
Markus ChambersST. NORBERT - SEINE RIVERDeputy Mayor
Janice LukesWAVERLEY WEST
Vivian SantosPOINT DOUGLAS
Matt AllardST. BONIFACEActing Deputy Mayor
John OrlikowRIVER HEIGHTS - FORT GARRY
Ross EadieMYNARSKI
Brian MayesST. VITAL
Scott GillinghamST. JAMES
Shawn NasonTRANSCONA
Cindy GilroyDANIEL MCINTYRE
Kevin KleinCHARLESWOOD - TUXEDO - WESTWOOD
Jason SchreyerELMWOOD - EAST KILDONAN
Devi SharmaOLD KILDONAN
iii
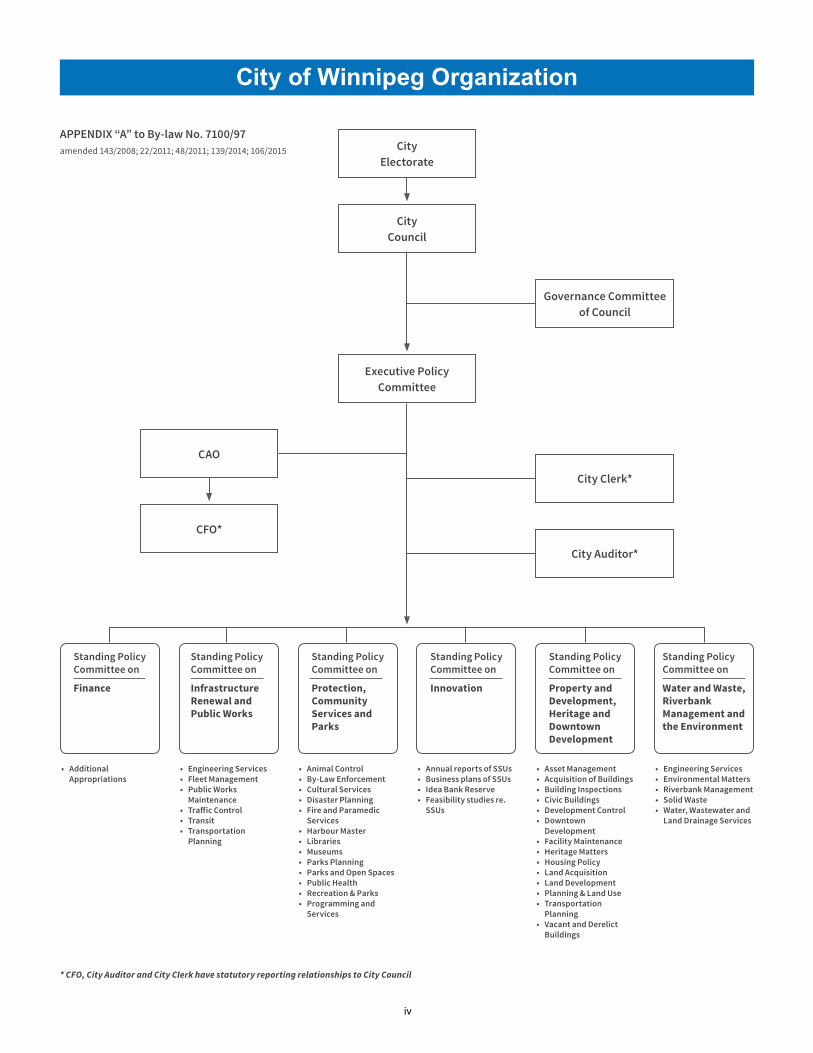
City of Winnipeg Organization
City Electorate
APPENDIX “A” to By-law No. 7100/97amended 143/2008; 22/2011; 48/2011; 139/2014; 106/2015
City Council
Executive Policy Committee
CAO
CFO*
* CFO, City Auditor and City Clerk have statutory reporting relationships to City Council
Governance Committee of Council
City Clerk*
City Auditor*
Standing Policy Committee on
Water and Waste, Riverbank Management and the Environment
Standing Policy Committee on
Finance
• Additional Appropriations
• Engineering Services• Fleet Management• Public Works
Maintenance• Traffic Control• Transit• Transportation
Planning
• Animal Control• By-Law Enforcement• Cultural Services• Disaster Planning• Fire and Paramedic
Services• Harbour Master• Libraries• Museums• Parks Planning• Parks and Open Spaces• Public Health• Recreation & Parks• Programming and
Services
• Annual reports of SSUs• Business plans of SSUs• Idea Bank Reserve• Feasibility studies re.
SSUs
• Asset Management• Acquisition of Buildings• Building Inspections• Civic Buildings• Development Control• Downtown
Development• Facility Maintenance• Heritage Matters• Housing Policy• Land Acquisition• Land Development• Planning & Land Use• Transportation
Planning• Vacant and Derelict
Buildings
• Engineering Services• Environmental Matters• Riverbank Management• Solid Waste• Water, Wastewater and
Land Drainage Services
Standing Policy Committee on
Infrastructure Renewal and Public Works
Standing Policy Committee on
Protection, Community Services and Parks
Standing Policy Committee on
Innovation
Standing Policy Committee on
Property and Development, Heritage and Downtown Development
iv
Table of Contents
2019 Letter from the Mayor and Chairperson of the Standing Policy Committee on Finance ...... 1
Budget Recommendations .......................................................................................................... 11
Overview ................................................................................................................... Section One
Reader’s Guide .................................................................................................................... 1-1
2019 Preliminary Budget at a Glance .................................................................................. 1-2
Basis of Budgeting ............................................................................................................... 1-3
Budget Process .................................................................................................................... 1-6
2019 Budget Presentation .................................................................................................... 1-9
Service Based Budget ............................................................................................. Section Two
Financial Summary .............................................................................................................. 2-1
Infrastructure Renewal and Public Works ............................................................................ 2-3
Water and Waste, Riverbank Management and the Environment ..................................... 2-19
Property and Development, Heritage and Downtown Development .................................. 2-37
Protection, Community Services and Parks / Winnipeg Police Board ............................... 2-59
Innovation........................................................................................................................... 2-97
Executive Policy ............................................................................................................... 2-109
Appendices ............................................................................................................ Section Three
Appendix 1 – Traditional View Financial Summary .............................................................. 3-1
Tax Supported ............................................................................................... 3-3
Utility Operations .......................................................................................... 3-12
Special Operating Agencies ......................................................................... 3-18
Appendix 2 – Listings of Grants/Payments ........................................................................ 3-23
Appendix 3 – Reserves Budget Summary ......................................................................... 3-31
Appendix 4 - Tax Supported Transfers from Other Funds ................................................. 3-33
Appendix 5 - Operating Budget Reconciliations
5A. Transfer to Capital Reconciliation ................................................................ 3-35
5B. Variances Net of Transfer to Capital / Regional and Local Street
Renewal Reserves/Frontage Levy ............................................................... 3-36
5C. Operating Budget Net of Transfer to Capital / Regional and Local Street
Renewal Reserves / Frontage Levy ............................................................. 3-37
5D. Cash to Capital Surpluses – 2018 Capital Closing Review ......................... 3-38
Appendix 6 – Summary of Building Communities II Surplus by Ward ............................... 3-41

Table of Contents (continued)
Appendix 7 – Fees & Charges Schedule ........................................................................... 3-43
Appendix 8 – Asset Management and Capital Recoveries ................................................ 3-45
Appendix 9 – 2018 Consolidated Budget ........................................................................... 3-47
Appendix 10 – Capital Projects Summary .......................................................................... 3-51
Appendix 11 – Services by Policy Area ............................................................................. 3-83
Appendix 12 – Glossary ..................................................................................................... 3-85
2019 LETfER FROM THE MAYOR AND CHAIRPERSON OF THE STANDING POLICY COMMITTEEON FINANCE
Introduction
We are very pleased to table the 2019 preliminary capital and operating budgets.
Key priorities of the 2019 preliminary budgets include investments in transit, roads, innovation,and combined sewer overflow mitigation, maintaining front line services, reducing the waterand sewer dividend rate while keeping taxes and fees affordable for Winnipeggers.
At the start of this year’s budget process, we were facing a deficit of almost $86 million in ourtax-supported operating budget.
In the short time since the municipal election in October, we have worked with residents,stakeholder groups, and members of our new Council to present for Council’s considerationpreliminary capital and operating budgets that are balanced from a fiscal and city buildingperspective.
Balancing this year’s budgets required many difficult choices and decisions.
Compounding the challenge this year was the ongoing uncertainty regarding the provincialgovernment’s funding support to the City for 2019 and beyond as well as provincial fundingcommitments from prior fiscal years that remain outstanding.
We fully support the provincial government’s efforts to eliminate its budget deficit, but we donot believe that this objective should be achieved on the backs of Winnipeg property taxpayers.
Therefore, we will continue to seek clarity from the provincial government on its fundingintentions for Winnipeg for prior years, the current year, and future fiscal years. The funding
clarity we seek for future fiscal years is no different than the advanced funding notice that the
provincial government provides school divisions or receives from the federal government prior
to tabling the annual provincial budget.
Notwithstanding these significant challenges, we believe that the 2019 preliminary budgets
present a balanced and responsible blueprint, a plan that keeps property taxes affordable while
maintaining and investing in key infrastructure, services, and technology that are important to
Winnipeggers and are essential to building our city for the future.
The preliminary budgets reflect the reality that Winnipeg is the economic engine of Manitoba
and its largest city. Winnipeg’s population is on track to grow steadily and strongly over the
next twenty-five years, and we need to manage and support this growth by investing in the
right infrastructure at the right time so critical infrastructure is in place when we need it.
This year’s budget planning process also included extensive public engagement conducted by
the Office of Public Engagement in the spring of 2018. Budget consultations were open to all
1
members of the public and community organizations, and provided opportunities to discuss thechallenges and opportunities facing Winnipeg. Residents also had the opportunity to provideinput and feedback through various on-line platforms. Individual meetings with each memberof Council were also conducted by the Finance Chair.
Overall, we believe the preliminary 2019 budgets strike the right balance between fiscaldiscipline, addressing immediate priorities, and continuing to invest in key services andinfrastructure that will build our city for the future.
Operating Revenues & Expenditures
This year’s tax supported operating budget proposes to increase operating expenditures by 3.9percent from last year’s budget, with the majority of this increase required to fund increasesrelated to existing collective agreements.
Property tax increases this year are limited to 2.33 percent, and the entire increase is dedicatedto addressing Winnipeg’s infrastructure requirements.
Two percent of the proposed 2.33 percent increase is dedicated to rebuilding and repairing ourregional and local roads, and 0.33 percent of the proposed increase is dedicated toward thecompletion of the Southwest Rapid Transitway. This means that the average homeowner willpay an additional $40.00 in municipal property taxes in 2019.
To continue powering the economy and reduce the burden on small businesses, the businesstax will be reduced from 5.14 percent to 4.97 percent and the business tax threshold will beincreased from $33,300 to $33,900 in 2019.
Over the last five years, the business tax rate has been reduced from 5.7 percent to 4.97percent and we have increased the business tax threshold from $23,880 to $33,900 which haseliminated the business tax for almost one-half of Winnipeg businesses.
Overall, Winnipeg continues to have among the lowest operating costs per capita and levels ofexpenditure growth as well as among the lowest property taxes of all major cities in Canada.According to KPMG’s most recent Competitive Alternatives Study, Winnipeg continues to be thelowest cost city among 27 cities in Canada and the U.S. mid -west to own and operate abusiness.
There is no rate increase proposed to the frontage levy in 2019.
The water and sewer dividend rate is proposed to decrease from 12 to 11 percent of budgetedwater and wastewater sales. This is the first time in the city’s history that the water and sewerdividend has been reduced. This measure will help fund significant upgrades to Winnipeg’swastewater treatment infrastructure mandated by the Province of Manitoba, while also helping
to keep water and sewer rates affordable for Winnipeggers.
2
There are no new fees or charges included in the 2019 preliminary budgets.
The waste diversion fee will increase to $63.00/year from the current level of $57.50/year toreflect the increased cost associated with the city’s new recycling contract that took effect lastyear.
Furthermore, the impact fee will increase at the rate of construction inflation which is 3.5% for2019, but this fee will not be used as a funding source in the 2019 budgets.
Increases to all remaining fees and charges in the budget will be limited to the rate of inflationof 1.6% in 2019 with the exception of transit fares and on-street parking rates which will befrozen in 2019 at 2018 levels.
Transit
Investments in transit are essential for a modern, growing city and this year’s preliminarybudgets propose significant new investments in transit, with a focus on safety, affordability,and enhanced service.
This will be a critical year for Winnipeg Transit, with the finalization of the Transit Master Plan
as well as construction concluding on the Stage 2 of the Southwest Rapid Transitway.
In 2019, the tax supported transfer to transit is proposed to be $70.6 million, an increase of
over six percent from last year’s tax supported transfer of $66.4 million.
Winnipeg continues to have among the lowest transit fares compared to other major Canadian
cities. The 2019 preliminary budgets will maintain the affordability of transit by providing the
financial resources necessary to freeze transit fares in 2019 at 2018 levels, as was previously
approved by Council. This is the first time that transit fares have been frozen since 2007.
This year’s preliminary budgets recommend implementation of Winnipeg’s first low-income bus
pass. To ensure successful implementation, our Public Service will continue to engage with key
stakeholders throughout the year.
The preliminary budgets include a recommendation for Council to approve implementation of a
low income bus pass starting on April 1, 2020, with eligible adults to qualify for a 30 percent
discount on the cost of a full fare adult monthly pass in 2020, a 40 percent discount in 2021,
and a 50 percent discount starting April 1, 2022. This will allow Winnipeg Transit to phase in
the cost of this initiative over three years and properly assess what additional resources will be
required within the broader context of the forthcoming Winnipeg Transit Master Plan.
A report will be brought forward to Council in 2019 providing more details on the
implementation and financing of the low income bus pass.
The preliminary budgets also propose significant investments in transit safety. To date,
Winnipeg Transit has implemented numerous safety enhancement initiatives. These
enhancements included establishing reporting procedures with the Winnipeg Police Service,
3
expanding the surveillance system on buses, providing safety training to transit inspectors andoperators, and adding new inspectors on transit buses.
Building on previous safety initiatives, the 2019 preliminary budgets propose an investment of$3.15 million to purchase and install bus operator safety shields for the entire bus fleet over thenext year. We believe this is a positive step towards increasing transit safety. It is alsoconsistent with best practices, and provides the most protection to bus operators.
The preliminary budgets also provide additional resources to equip transit inspectors withprotective vests, and $100,000 to develop a long-term transit security plan that may includeexpanding the powers of transit special constables.
The preliminary budgets propose an investment of $22.2 million to purchase 34 new busesincluding buses for the opening of Stage 2 of the Southwest Rapid Transitway.
The preliminary budgets propose an investment of $1 million to enable transit to take the nextstep towards electrifying the bus fleet. The budgets also propose investments to improve theridership experience by earmarking over $1 million for new heated bus shelters in 2019 and afurther $500,000 to improve bus stops for individuals with accessibility requirements.
Looking ahead, completion of the Winnipeg Transit Master Plan is expected to be a criticaldocument in helping guide the planning of investments over the next decade which willposition Winnipeg Transit for success in the future by better meeting the needs of passengersand prepare for the transportation requirements of a growing city.
Road Renewal
Investing in road renewal continues to be a top priority for Winnipeggers and the 2019 budgetspropose significant investments in this key area.
In 2019, Winnipeg’s investment in regional and local road renewal will increase by the full valueof the two percent increase in property taxes. This year also marks the first year of a five-yearaccelerated regional roads investment program jointly funded by Canada, the Province ofManitoba, and the City of Winnipeg.
However, the provincial government has recently made a unilateral decision to not fully fundthe final year of a five-year $250 million road funding commitment to the city that expired atthe end of 2018.
Given that the 2018 budget has now closed and projects have been completed with theexpectation of receiving this funding from the provincial government, the city is now faced witha very difficult choice in how to address a $40 million provincial roads funding shortfall from2018.
4
Council could choose to increase property taxes by approximately 7.1 percent in 2019 to coverthis provincial shortfall which would require the average household to pay approximately$122.00 more in property taxes this year.
Alternatively, Council could choose to cover the $40 million provincial shortfall with long termdebt which could have negative implications for the city’s current credit rating and/or reducethe city’s investment in other capital assets.
Instead, we propose a balanced and fiscally prudent approach in the 2019 preliminary budgets.This balanced approach proposes to cover $20 million of the $40 million provincial fundingshortfall from 2018 using resources from the Local Road Renewal Reserve in 2019, with theremainder of this provincial shortfall to be addressed in 2020.
Furthermore, given the provincial government’s decision to not fulfill the final year of its $250million road commitment in 2018, it would not be prudent for the city to budget for this level ofprovincial road support in 2019 and beyond.
In 2019, the city will budget to receive $17 million from the province in 2019 which reflectstheir commitments made to date under the accelerated regional roads program.
The city’s total investment in new regional and local road renewals in 2019 from all fundingsources will be $86.4 million. This represents a decrease of $42 million from the projected levelof $128.4 million approved by Council for 2019.
This $42 million decrease in road renewal investments in 2019 compared to forecast is due to areduced level of provincial funding on new road renewals in 2019 together with a decision topartially address the provincial road funding shortfall from 2018 out of the local road reservefunds in 2019.
The impact of this funding decrease will mean fewer local road projects will be undertaken in2019 compared to last year. It will also mean less local roadwork in the future.
Innovation, Transformation & Technology
Building a city whose population is on track to reach one million people requires smart andstrategic investments in services and as well as traditional infrastructure such as roads andcommunity centers. However, investments in technology and innovation capital are alsoimportant.
The 2019 preliminary budgets include additional investments in technology to address years ofdeferred improvements for critical services such as minimizing 311 downtime, improving the
public’s access to open data, as well as renewed investments in emergency servicescommunications by replacing Tait Radio technology.
5
The preliminary budgets also propose investments in the smart cities program which willinclude enhancements to our internationally recognized Transportation Management Centre,expanding efforts to alleviate traffic pressures at congested corridors like at-grade traincrossings, as well as beginning the process of providing priority traffic signals to emergencyvehicles in an effort to improve service levels.
Community Safety
The 2019 preliminary operating budget proposes to invest an historic amount of $301.4 millionin the police service, which reflects an increase of approximately $10 million or 3.4 percentfrom 2018.
This year’s increase in the police service operating budget will fund negotiated increasesassociated with the Winnipeg Police Service collective agreement as well as importantinvestments in safety as determined by the Winnipeg Police Board and the Chief of Police.
The 2019 investment in the police service operating budget exceeds the projected level for2019 and marks the first time that this budget will exceed $300 million.
The 2019 preliminary operating budget proposes to invest over $200 million in the fireparamedic service in 2019 which reflects an increase of 4.2 percent from 2018. The majority of
this increase is required to fund negotiated increases associated with existing collectiveagreements.
The 2019 preliminary capital budget proposes an investment of $16 million in the fire andparamedic service including over $10 million in a new computer aided dispatch (CAD) system to
modernize and improve communications within the fire paramedic service, conditional on
receiving cost shared support for this from Shared Health.
The 2019 preliminary budgets also include additional resources to purchase new firefighting
equipment and maintain existing fire halls. The preliminary budgets also reflect a full cost
recovery of ambulance services by the city from the Province of Manitoba, recognizing that
delivery of ambulance services is a provincial responsibility.
Six—year Capital Investment Plan
The city continues to face an immense infrastructure deficit of approximately $7 billion. About
half of this deficit is required to upgrade existing infrastructure and the other half required to
invest in new infrastructure to support a growing city.
The preliminary budgets propose a capital investment of $367.5 million which is a small
decrease from the 2018 budget of $380.1 million. We are able to maintain our capital
investment in 2019 at a reasonably comparable level to 2018 despite budgeting to receive a
significantly lower level of provincial road investment in 2019 compared to 2018.
6
External debt in 2019 for new capital investment is $38.2 million, a decrease from the projectedamount in the 2018 budget, and a decrease from the 2018 approved level of $48 million.Unlike the Province of Manitoba or Federal Government which do not have any debt limits, theCity of Winnipeg adheres to a self—imposed debt limit which is among the most stringent of allmajor cities in Canada. Winnipeg’s proposed debt levels for 2019 are well within its self-imposed debt limit.
The city’s current State of the Infrastructure Report completed in 2018 indicates that assetswithin the area of Community Services and Municipal Buildings required significantinvestments.
The preliminary 2019 capital budget proposes an investment of $30.6 million in communityservice assets which is an increase of $10 million from last year’s level and in line with lastyear’s projected investment in this area for 2019.
Included in the overall level of investment for community services in 2019 is a proposal to morethan double the funds available for the Community Centre Renovation Grant Program (CCRGP)from the previous level of just under $1 million to $2 million in 2019, and $2 million each yearuntil 2023. The 2019 budget also includes a recommendation to increase the maximumeligible grant under this program to $100,000 from $50,000. A report will be brought forwardfor Council’s consideration in 2019 with more details on this proposed increase to the grantlevels under the CCRGP.
Over $5 million is proposed to be invested in on going upgrades to infrastructure withinAssiniboine Park, and $1.75 million is proposed to be invested in the development of a newrecreation campus at Grant Park.
A capital investment of over $18 million is proposed in 2019 for municipal buildings including$10.4 million to demolish and ready the former public safety building and civic parkade for re
development. An investment of over $1.6 million is proposed to repair and renovate indoor
poois, and over $500,000 to repair arenas.
Over the next six years, the city’s total capital investment is projected to be $2.3 billion.
Individual strategic capital investments over this six-year period include:
• An investment of over $800 million to renew the city’s existing local and regional roads
• An investment of over $169 million to reduce the incidence of combined seweroverfl ows;
• An investment of over $23 million for in our urban forest enhancement program;
• An investment of over $22 million in pedestrian and cycling infrastructure and other
active transportation assets, and;
• An investment of over $11.8 million to build a new recreation facility in Waverley West.
7
In addition, the 2019 budget will include a recommendation for Council to refer an investment
of up to $3 million to the 2020 capital budget to renovate and renew Rainbow Stage, a city-
owned asset in Kildonan Park, subject to Rainbow Stage securing matching funds from
fundraising and/or other levels of government.
New and ongoing program investments
The 2019 preliminary budgets propose new and ongoing investments to build complete
neighbourhoods and strengthen communities including:
• $11.1 million of operating support for the Assiniboine Park Conservancy;
• $4.6 million for the Winnipeg Arts Council;
• Fourth year of a five year annual commitment of $1 million to the Winnipeg Art Gallery
Inuit Art Centre;
• $1.25 million to support the Indigenous Youth Strategy;
• Over $400,000 to enhance snow clearing on active transportation paths and sidewalks,
starting with the 2019 snow season;
• $150,000 to continue the Community Homeless Assistance Program (CHAT), and;
• Fifth year of a 5 year annual commitment of $150,000 towards the plan to end
homelessness.
Efficiencies & Multi-year Budgets in 2020
Identifying efficiencies and ensuring value for taxpayers continues to be a top priority for the
city in 2019. This will become even more critical as the city moves towards a multi-year budget
planning framework in 2020.
In 2019, a vacancy management target of $18 million is proposed to be shared by all
departments. This savings target will be achieved by holding existing vacant positions vacant
for a longer period of time and by deferring the filling of newly vacated positions as existing
employees leave employment. This exercise will not involve any layoffs of current city
employees.
The city’s Chief Administrative Officer will be given delegated authority to allocate this
additional vacancy management target among city departments in order to minimize the
impact of this measure on front line service delivery.
In addition, the 2019 preliminary budgets include a total of just under $12 million of efficiency
savings to be held corporately as well as $1.6 million of expenditure management savings to be
allocated among all departments on a pro rata basis.
Finally, in preparation for the 2020 budgets which are expected to be the first capital and
operating budgets to be balanced on a multi-year basis, this year’s budget will include
recommendations for the public service to report back in 2019 with the following information:
8
• An analysis of the city’s core service responsibilities under The City of Winnipeg Charterand any other relevant legislation;
• A plan to introduce an evaluation framework to review current and future city grants;
• A review of the city’s current fees and charges; and
• A review of the city’s unfunded capital projects.
These reports, along with significant planning documents such as the Transit Master Plan and
the OurWinnipeg review and Asset Management Plan will be used to make the difficult
planning decisions required to balance the city’s capital and operating budgets on a multi-year
basis starting in 2020.
Conclusion
Over the next 25 years, Winnipeg’s population is expected to chart strong and steady increases.
On average, population growth over the next 25 years in Winnipeg is estimated to increase by
8,200 people per year. This means Winnipeg is expected to add the equivalent population to
the City of Morden each year over the next 25 years.
We can achieve this by working closely with the federal government to maximize Winnipeg’s
share of infrastructure funding. We will work with our provincial government to ensure
Winnipeg receives not only a fair say in how provincial grants are spent, but also access to
stable and predictable funding. And, we must continue to review and scrutinize expenditures
to ensure we are investing tax dollars in ways that provide maximum benefit and value to
taxpayers.
We now invite all residents and members of Council to continue the discussion to finalize the
preliminary 2019 operating and capital budgets.
Respectfully submitted,
nBowJZ
MAYOR
Policy Committee on Finance
9

10
OPERATING BUDGET RECOMMENDATIONS
1. That the following recommendations with respect to the 2019 - 2021 Preliminary Operating Budget be approved: A. i. That the 2019 Preliminary Operating Budget, including the budgets
for reserves (Appendix 3), be reviewed and submitted to Council for approval; and
ii. That the 2020 and 2021 projections be received and submitted to Council as information on the preliminary financial plans for those years.
B. That the City’s mill rate be increased from 12.987 to 13.290 in 2019,
for the purpose of raising revenue as required for the annual operating budget.
Note: This mill rate of 13.290 in 2019 includes a 1% property tax increase dedicated to the renewal of local streets, lanes and sidewalks; a 1% property tax increase dedicated to the renewal of regional streets and sidewalks, and; a .33% property tax increase dedicated for payments for the Southwest Rapid Transitway (Stage 2) and Pembina Highway Underpass project, for a total property tax increase of 2.33%.
C. i. That the City’s business tax rate be decreased from 5.14% to
4.97% in 2019; and
ii. That Council enact the attached Small Business Tax Credit by-law under subsection 219(2) of the City of Winnipeg Charter, which will provide a full rebate of municipal business taxes for businesses with an annual rental value of $33,900 or less in 2019 ($33,300 in 2018).
D. That the fees (Appendix 7), levies and transfers between funds
outlined in the 2019 Operating Budget be approved.
E. That Council approve the amended (attached) Water and Sewer Utility Dividend Policy, which reduces the dividend payment to the City from 12% to 11% of budgeted gross sales effective January 1, 2019, which will be transferred to the City each year.
F. That a transfer of $10,303,733 from the Financial Stabilization Reserve
Fund to the General Revenue Fund be made in 2019.
11
G. That a transfer of $70 million from the Sewage Disposal System Fund to the Environmental Projects Reserve be made in 2019 to support the North End Treatment Plant (NEWPCC) Upgrade projects.
H. That $2,524,798 in prior years’ tax supported cash to capital surplus,
identified in Appendix 5D due to capital projects coming under budget, be utilized to reduce the transfer to the General Capital Fund in the 2019 tax supported operating budget.
I. That a transfer of $220,690 from Building Communities Initiative capital
project surplus (project now closed and completed) to the Land Dedication Reserve be made in 2019, with the funds allocated to respective Council wards as set out in Appendix 6.
J. That Council approve a transfer of $100,000 annually for each of the
next 4 years starting in 2019 from the Civic Initiatives, Promotional and Protocol grant program to the General Purpose Reserve Fund to support the establishment of a Community Safety and Crime Prevention program.
K. That on-street parking meter rates for 2019 be kept at the same levels
as 2018. L. That the Winnipeg Parking Authority be directed to return to the
appropriate committee of Council in 2019 with an analysis of current parking rates, including consultation with stakeholders to determine any recommendations for future changes to these rates.
M. That consistent with prior direction provided by the Executive Policy
Committee, the Public Service continue to pursue a new agreement with Shared Health Services for the provision of Emergency Medical Services by the City that reflects full cost recovery from Shared Health.
N. That in accordance with the December 12, 2017 Council decision to
remove any restrictions regarding the use of the net proceeds from the sale of the Winnipeg Square Parkade (as set aside in the November 25, 2009 Council report and any subsequent related reports) in the Winnipeg Parking Authority Special Operating Agency (WPA), a transfer of $4.405 million of such net proceeds currently held in the Land Operating Reserve be made to the General Capital Fund for the Public Safety Building and Civic Centre Parkade capital project as contained in the 2019 capital budget.
O. i. That prior to payment of any monies approved in the 2019
operating budget, the City enter into, execute and deliver a grant agreement with each grant recipient, and the Chief Financial Officer be authorized to negotiate and approve the terms and conditions of each grant agreement in accordance with the budgetary approval and such other terms and conditions deemed
12
necessary by the City Solicitor/Director of Legal Services to protect the interests of the City;
ii. That Council approve grant delegations as indicated in Appendix
2; and
iii. That the Chief Operating Officer of the Winnipeg Parking Authority Special Operating Agency (WPA) be delegated authority to approve in-kind requests from charitable organizations for the donation of “use of paid parking” (such as on-street parking permits, WPA parking closure fees, etc.) up to an aggregate total of $260,000 in 2019 only. These must be provided to those organizations who have received this support in the past. These in-kind grants would be included in the review as noted in recommendation V.i.b) below and be addressed as part of the 2020 budget process.
P. That, as a result of 2019 grant monies for the Indigenous Youth
Strategy program being provided by the City and expended by third party organizations over a two year period (2019/2020), the City enter into multi-year grant agreements with respect to such grants.
Q. That the Computer Replacement Reserve be terminated effective
January 1, 2019 and replaced with a new Computer, Critical Systems and Support Reserve in accordance with section 289 of the City of Winnipeg Charter;
i. That the purpose of the reserve be to provide funding for the upgrade and replacement of hardware and/or software of both personal computers and city-wide critical systems and support resources. Critical system hardware elements include shared enterprise storage, servers and other hardware components. Critical system software elements include server operating systems, server virtualization, database, e-mail and other supporting software. Support resources are for salaries and benefits of additional staff hours or contractors required to support city-wide systems;
ii. That this reserve continue to be funded through annual
contributions from departments for computer related hardware and software based upon the projected purchase cost of the replacement;
iii. That the Fund Manager of the reserve be the Chief Innovation
Officer; and
iv. That the balance of funds in the Computer Replacement Reserve be transferred to the new Computer, Critical Systems and Support Reserve, effective January 1, 2019.
13
R. That Council approve effective January 1, 2019, the transfer of the
property management function from the Municipal Accommodations Fund, inclusive of related budgeted positions, to the newly created Real Estate and Land Development Division within the General Revenue Fund on a budget and FTE complement neutral basis.
S. That Council close the Library Trust and Portage and Main Concourse
Funds effective January 1, 2019 with any remaining surplus balance to be transferred to an appropriate deferred revenue account in the General Revenue Fund.
T. i. That Council approve the establishment of a Low Income Bus
Pass Program effective April 1, 2020 reflecting discounted fares commencing at 30% at date of implementation, 40% in 2021 and 50% in 2022, and that Transit Department report back to Council within 180 days setting out program funding and implementation details; and
ii. That Council approve the 2019 capital budget of $236,000 and
approve in principle the 2021 capital forecast of $139,000 for the technical and administrative set-up of the program. These will be funded by Transit Retained Earnings.
U. i. That the Chief Administrative Officer or designate be delegated the
authority to manage vacancies within City departments and administrative units within the scope of the 2019 operating budget without affecting the general level of public services as identified in the operating budget or overall civic staff establishment; and
ii. That Special Operating Agencies include a budget for vacancy management, as is the practice for other City departments, to be transferred to the tax-supported fund and managed in a similar manner as set out in recommendation 1.U.i. above.
V. i. That the Chief Administrative Officer be directed to report back to
the appropriate committee of Council on the following items in 2019, in preparation of the multi-year budget planning process for 2020: a) A review of the City’s core service delivery responsibilities
under The City of Winnipeg Charter and any other relevant legislation;
b) An evaluation framework to review all current and any future City grants. This framework shall include, but not necessarily be limited to, a review of each the respective grants’ alignment with the core service responsibilities of the City as well as an assessment of the outcomes that are or will be achieved from each of the grants;
14
c) Recommendations on any changes to the City’s current fees and charges based on an assessment of best practices in other jurisdictions and the cost of service delivery; and
d) Prioritization list of unfunded major capital projects.
ii. That the Public Service ensure that the updated OurWinnipeg, the Transit Operational Review, the City’s Asset Management Plan and any other significant City planning documents be used as guiding documents in the 2020 multi-year budget process.
S. That the Chief Financial Officer be delegated the authority to restate the budget subsequent to adoption to reallocate amounts to departments to reflect Council’s ratification of collective agreements, Council’s approval of decisions with budget implications, as well as Corporate cost reduction measures, including efficiency savings and the impact of any decisions made in recommendation 1.U. if required, on a budget neutral basis.
T. That the City Solicitor/ Director of Legal Services be requested to submit
the necessary by-laws and policy amendments to implement the above recommendations.
CAPITAL BUDGET RECOMMENDATIONS
2. That the following recommendations with respect to the 2019 Preliminary Capital Budget and 2020 to 2024 Five Year Forecast be approved:
A. i. That the 2019 Preliminary Capital Budget, totaling $367.515 million
be reviewed and submitted to Council for approval;
ii. That new capital borrowing authority be approved as follows: a) $38.187 million external borrowing for 2019 tax-supported
operations, including Transit and Municipal Accommodations; and
b) $34.900 million external borrowing for 2019 tax-supported internal financing including Municipal Accommodations.
Note: The borrowing authority for Winnipeg Fleet Management Special Operating Agency (SOA) is approved as part of the SOA’s 2019 to 2021 business plan report.
iii. That the 2020 to 2024 Five Year Capital Forecast be reviewed and submitted to Council for adoption in principle.
15
B. That the cash to capital contribution be as follows:
Year $ Millions 2019 21.010 2020 65.141 2021 66.565 2022 71.178 2023 65.136 2024 71.178
Note: For 2020 to 2024 cash to capital balances, see “Financial Sustainability” slide in Volume 2, Overview section and t Volume 3, Capital Projects Summary section, page 1-i, note 2.
C. That all other transfers from prior years’ surplus, to/from reserves and other funds outlined in the capital budget be approved.
D. That Council authorize expenditures on the following projects in 2019 or
prior to the adoption of the 2020 capital budget as a first charge against the General Capital Fund, in accordance with Subsection 288(2) of the City of Winnipeg Charter, to facilitate timely work on the projects:
i. Up to $6.7 million for preliminary engineering design for various
Accelerated Regional Street Renewal projects;
ii. Up to $12.186 million for the Fermor Avenue – Lagimodiere to Plessis Accelerated Regional Street Renewal project;
iii. Up to $6.7 million for the Dublin Avenue – Notre Dame to St.
James Accelerated Regional Street Renewal project; iv. Up to $2.7 million for the St. James Street – Dublin to
Saskatchewan Accelerated Regional Street Renewal project;
v. Up to $3.3 million for the Dublin Avenue Bridge (Omand’s Creek) project.
E. That Council refer for consideration in the 2020 budget an investment of
up to $3 million for the repairs and upgrades to Rainbow Stage in Kildonan Park, subject to the Board of Rainbow Stage securing matching funds for this project from other levels of government and/or private fundraising.
F. That Transit Department be directed to report back to the appropriate
committee of Council with a funding strategy and implementation plan for additional heated bus shelters concurrent with the result of Transit’s Master Plan.
16
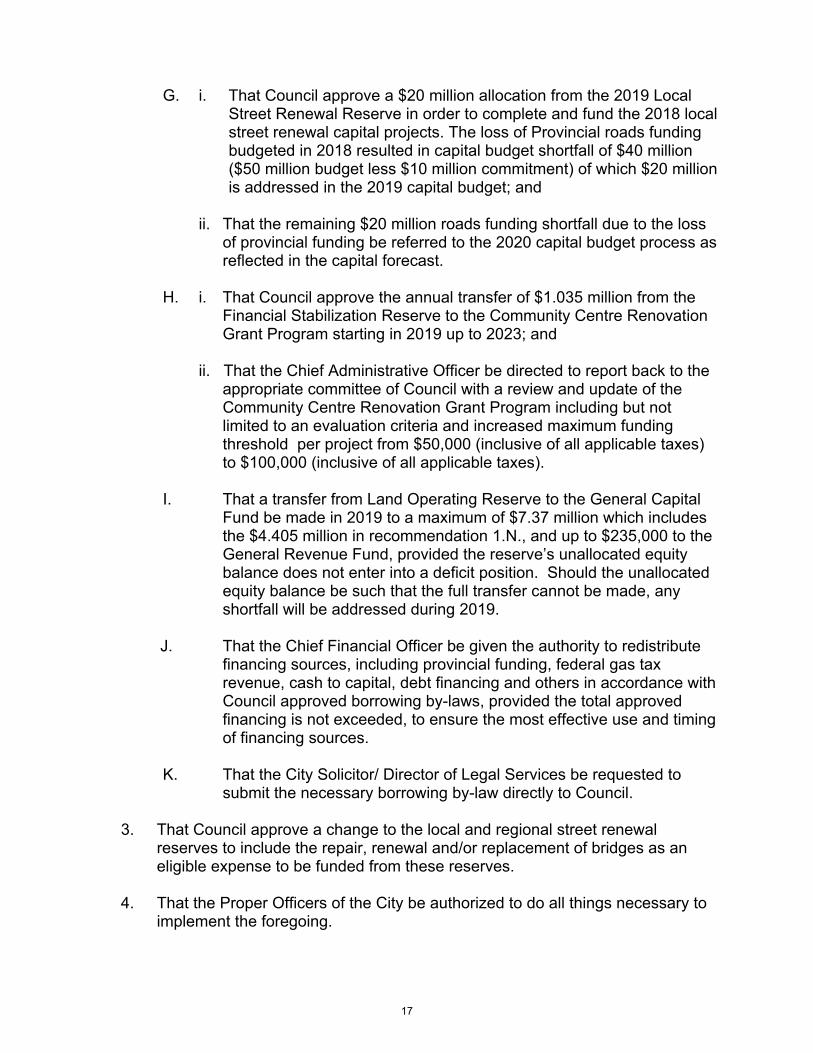
G. i. That Council approve a $20 million allocation from the 2019 Local Street Renewal Reserve in order to complete and fund the 2018 local street renewal capital projects. The loss of Provincial roads funding budgeted in 2018 resulted in capital budget shortfall of $40 million ($50 million budget less $10 million commitment) of which $20 million is addressed in the 2019 capital budget; and
ii. That the remaining $20 million roads funding shortfall due to the loss
of provincial funding be referred to the 2020 capital budget process as reflected in the capital forecast.
H. i. That Council approve the annual transfer of $1.035 million from the
Financial Stabilization Reserve to the Community Centre Renovation Grant Program starting in 2019 up to 2023; and
ii. That the Chief Administrative Officer be directed to report back to the appropriate committee of Council with a review and update of the Community Centre Renovation Grant Program including but not limited to an evaluation criteria and increased maximum funding threshold per project from $50,000 (inclusive of all applicable taxes) to $100,000 (inclusive of all applicable taxes).
I. That a transfer from Land Operating Reserve to the General Capital
Fund be made in 2019 to a maximum of $7.37 million which includes the $4.405 million in recommendation 1.N., and up to $235,000 to the General Revenue Fund, provided the reserve’s unallocated equity balance does not enter into a deficit position. Should the unallocated equity balance be such that the full transfer cannot be made, any shortfall will be addressed during 2019.
J. That the Chief Financial Officer be given the authority to redistribute financing sources, including provincial funding, federal gas tax revenue, cash to capital, debt financing and others in accordance with Council approved borrowing by-laws, provided the total approved financing is not exceeded, to ensure the most effective use and timing of financing sources.
K. That the City Solicitor/ Director of Legal Services be requested to
submit the necessary borrowing by-law directly to Council.
3. That Council approve a change to the local and regional street renewal reserves to include the repair, renewal and/or replacement of bridges as an eligible expense to be funded from these reserves.
4. That the Proper Officers of the City be authorized to do all things necessary to implement the foregoing.
17
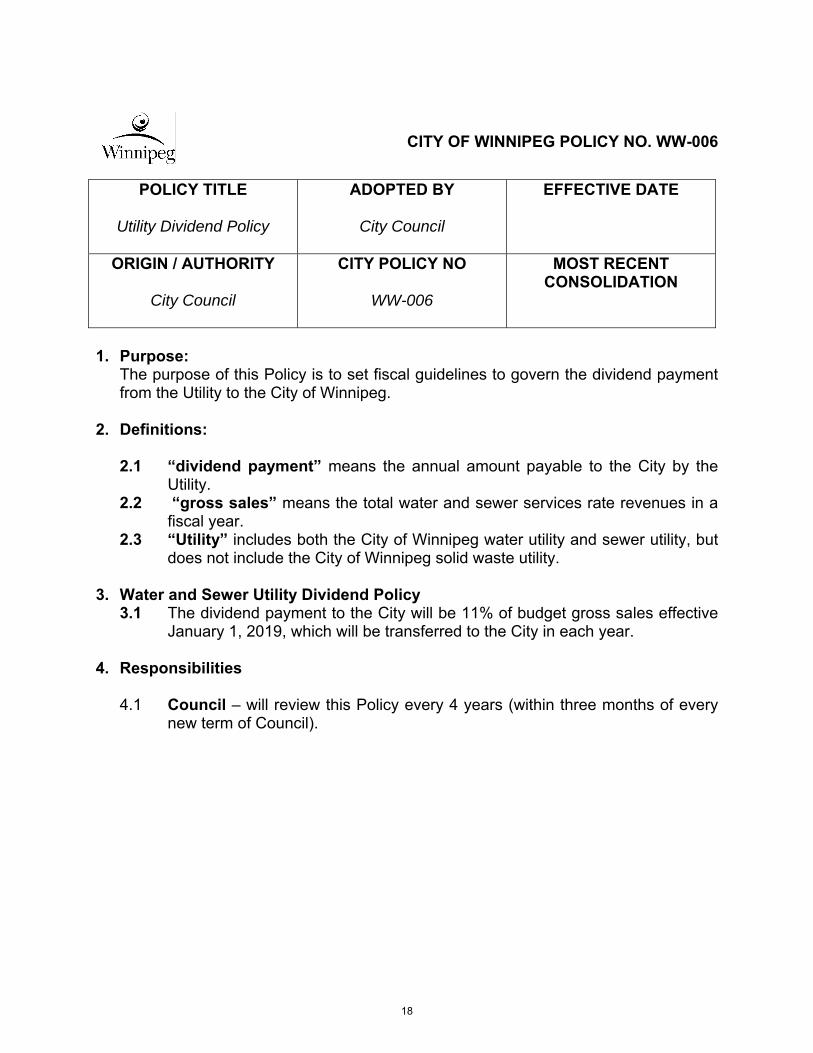
CITY OF WINNIPEG POLICY NO. WW-006
1. Purpose:The purpose of this Policy is to set fiscal guidelines to govern the dividend paymentfrom the Utility to the City of Winnipeg.
2. Definitions:
2.1 “dividend payment” means the annual amount payable to the City by the Utility.
2.2 “gross sales” means the total water and sewer services rate revenues in a fiscal year.
2.3 “Utility” includes both the City of Winnipeg water utility and sewer utility, but does not include the City of Winnipeg solid waste utility.
3. Water and Sewer Utility Dividend Policy3.1 The dividend payment to the City will be 11% of budget gross sales effective
January 1, 2019, which will be transferred to the City in each year.
4. Responsibilities
4.1 Council – will review this Policy every 4 years (within three months of every new term of Council).
POLICY TITLE
Utility Dividend Policy
ADOPTED BY
City Council
EFFECTIVE DATE
ORIGIN / AUTHORITY
City Council
CITY POLICY NO
WW-006
MOST RECENT CONSOLIDATION
18
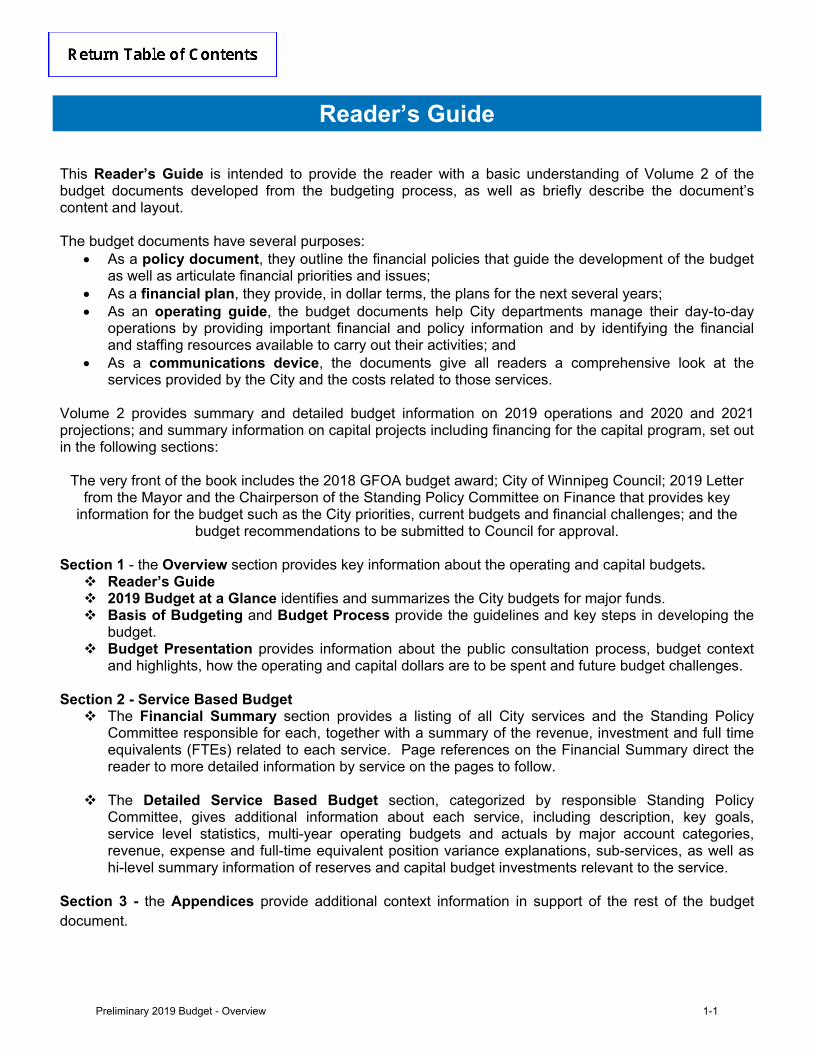
Reader’s Guide
This Reader’s Guide is intended to provide the reader with a basic understanding of Volume 2 of the budget documents developed from the budgeting process, as well as briefly describe the document’s content and layout.
The budget documents have several purposes: As a policy document, they outline the financial policies that guide the development of the budget
as well as articulate financial priorities and issues; As a financial plan, they provide, in dollar terms, the plans for the next several years; As an operating guide, the budget documents help City departments manage their day-to-day
operations by providing important financial and policy information and by identifying the financialand staffing resources available to carry out their activities; and
As a communications device, the documents give all readers a comprehensive look at theservices provided by the City and the costs related to those services.
Volume 2 provides summary and detailed budget information on 2019 operations and 2020 and 2021 projections; and summary information on capital projects including financing for the capital program, set out in the following sections:
The very front of the book includes the 2018 GFOA budget award; City of Winnipeg Council; 2019 Letter from the Mayor and the Chairperson of the Standing Policy Committee on Finance that provides key
information for the budget such as the City priorities, current budgets and financial challenges; and the budget recommendations to be submitted to Council for approval.
Section 1 - the Overview section provides key information about the operating and capital budgets. Reader’s Guide 2019 Budget at a Glance identifies and summarizes the City budgets for major funds. Basis of Budgeting and Budget Process provide the guidelines and key steps in developing the
budget. Budget Presentation provides information about the public consultation process, budget context
and highlights, how the operating and capital dollars are to be spent and future budget challenges.
Section 2 - Service Based Budget The Financial Summary section provides a listing of all City services and the Standing Policy
Committee responsible for each, together with a summary of the revenue, investment and full timeequivalents (FTEs) related to each service. Page references on the Financial Summary direct thereader to more detailed information by service on the pages to follow.
The Detailed Service Based Budget section, categorized by responsible Standing PolicyCommittee, gives additional information about each service, including description, key goals,service level statistics, multi-year operating budgets and actuals by major account categories,revenue, expense and full-time equivalent position variance explanations, sub-services, as well ashi-level summary information of reserves and capital budget investments relevant to the service.
Section 3 - the Appendices provide additional context information in support of the rest of the budget document.
Preliminary 2019 Budget - Overview 1-1
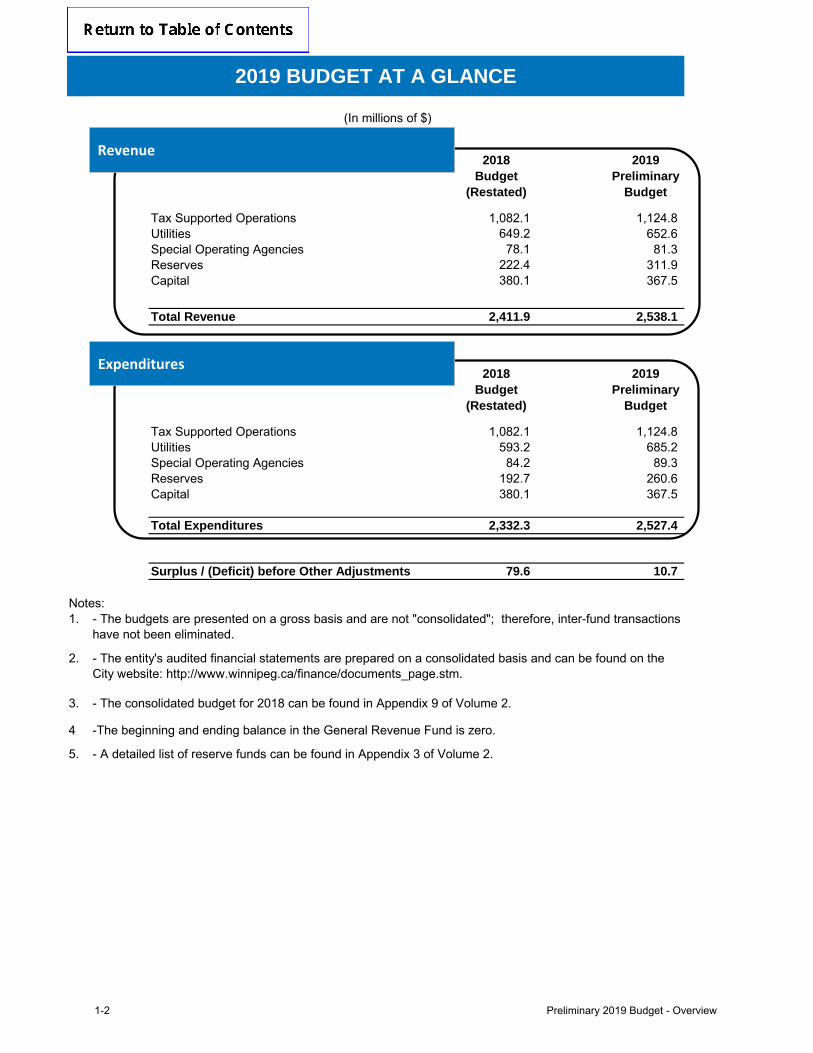
2018 Budget
(Restated)
2019 Preliminary
Budget
Tax Supported Operations 1,082.1 1,124.8 Utilities 649.2 652.6 Special Operating Agencies 78.1 81.3 Reserves 222.4 311.9 Capital 380.1 367.5
Total Revenue 2,411.9 2,538.1
2018 Budget
(Restated)
2019 Preliminary
Budget
Tax Supported Operations 1,082.1 1,124.8 Utilities 593.2 685.2 Special Operating Agencies 84.2 89.3 Reserves 192.7 260.6 Capital 380.1 367.5
Total Expenditures 2,332.3 2,527.4
Surplus / (Deficit) before Other Adjustments 79.6 10.7
Notes: 1.
2.
3.
4 -The beginning and ending balance in the General Revenue Fund is zero.
5. - A detailed list of reserve funds can be found in Appendix 3 of Volume 2.
2019 BUDGET AT A GLANCE
(In millions of $)
- The budgets are presented on a gross basis and are not "consolidated"; therefore, inter-fund transactions have not been eliminated.
- The entity's audited financial statements are prepared on a consolidated basis and can be found on the City website: http://www.winnipeg.ca/finance/documents_page.stm.
- The consolidated budget for 2018 can be found in Appendix 9 of Volume 2.
Revenue
Expenditures
1-2 Preliminary 2019 Budget - Overview
Basis of Budgeting
The 2019 to 2021 Tax Supported Operating Budget is balanced in 2019 with the 2020 and 2021 projections not yet complete, requiring further work in those years to balance revenues and expenditures. The 2019 Preliminary Operating Budget will go to Council for adoption in March 2019 and 2020 and 2021 projections will be received as information.
The City prepares a six-year capital investment plan, including related funding sources. The first year is adopted by Council and the five-year forecast is adopted in principle. The six-year capital view is required by legislation (The City of Winnipeg Charter). The preliminary capital budget for 2019 and five-year forecast will go to Council for adoption and adoption in principle, respectively in March 2019.
The City budgets for several funds – the capital fund; the general revenue or tax-supported fund; utility operations (Transit, Waterworks, Sewage Disposal, Solid Waste Disposal, Land Drainage, Municipal Accommodations); and Special Operating Agencies (Animal Services, Golf Services, Parking Authority and Fleet Management). Transfers to or from the General Revenue Fund and between funds are included in the budget. In addition, revenues and expenses for capital and special purpose reserves are included in the budget (see Appendix 3).
The basis of budgeting for the City is described in more detail in the following sections:
Expense and Revenue Recognition
The City of Winnipeg develops its operating budget for tax supported and utility operations on a modified accrual basis. The modified accrual basis of accounting records revenue when it is earned, measurable and available. Expenditures are recognized when the liability is incurred, except for certain expenses, for example, those associated with retirement allowances, accrued vacation, worker’s compensation, compensated absences, and landfill liabilities which are budgeted on a cash basis. Debt servicing payments are budgeted for when due (depreciation of assets is not budgeted). Revenue from land sales is recorded in accordance with accounting principles used within the real estate industry.
The City uses the full accrual basis of accounting. Revenue is recorded as it is earned and measurable. Expenses are recognized as they are incurred and measurable based on receipt of goods and/or the legal obligation to pay. The City’s financial statements are developed in accordance with generally accepted accounting principles for local governments, as recommended by Public Sector Accounting Board (PSAB).
Capital Assets
Capital assets are generally defined as those with a cost exceeding $100,000 (non-recurring capital projects and recurring/ongoing capital programs) with a minimum 10-year life. These assets are budgeted for in the capital budget and the financing costs are expensed in the operating budgets. Major equipment or automated systems development projects are also included in the capital budget although their useful life may be less than 10 years. Land acquisition and local improvements are considered capital works regardless of expected cost. Smaller asset purchases are expensed in the operating budgets.
Preliminary 2019 Budget - Overview 1-3
A multi-criteria approach to prioritize capital investment based on a triple bottom line approach, which includes assessing projects based on social, economic and environmental factors, has been developed as part of the City’s asset management initiative. This annual prioritization tool is available to all departments and facilitates the development of their capital budgtet submission.
Service-Based Budget
The City reports budget information on a service-based basis (how much the service will cost and how the service is to be funded), regardless of which area or department delivers the service. The service-based budget is intended to provide more transparent reporting and a more direct link between budgets provided and the services delivered. As part of the budget document a more traditional, by department view is also provided (see Appendix 1, volume 2).
Capital Leases
Leases are classified as capital or operating leases. Leases which transfer substantially all of the benefits and risks incidental to ownership of property are accounted for as capital leases. All other leases are accounted for as operating leases and the related lease payments are charged to expense as incurred.
Debt and Debt Payments
The City may only incur debt for the purposes of capital expenditures. With the approval of the Provincial Minister of Finance, a borrowing by-law is passed by Council which authorizes borrowing for the capital budget.
Annual payments of principal and interest are budgeted in the City’s operating budget as debt and finance charges.
Consolidation
The annual operating budget adopted by Council provides the spending authorization for each fund, and therefore the current year budget is adopted on a non-consolidated basis. That is, inter-fund transactions have not been eliminated in order to ensure full spending authority is provided. However, each year in the budget document, a consolidated budget is prepared for the current year which eliminates inter-fund transactions. This consolidated budget is then available each year-end to allow comparison and variance reporting to the annual financial statements, also prepared on a consolidated basis.
Balanced Operating Budgets
The City of Winnipeg Charter requires that the City adopt a balanced operating budget for the current year (estimated expenditures for a fiscal year do not exceed the estimated revenues for the year). Council policy provides that year-end surplus be transferred to the Financial Stabilization Reserve. Any operating deficits arising in-year must be addressed in the next year’s budget.
1-4 Preliminary 2019 Budget - Overview
Reserves Reserves are established by Council, as required for future financial commitments and are operated under the regulations and policies prescribed by provincial legislation or City by-laws as applicable. Budgets are prepared for reserve expenditures and revenues, and transfers to and from reserves are included in the tax-supported, utility, and capital budgets. Fees and Charges A Fees and Charges Schedule is published annually in accordance with the Fees and Charges By-Law (196/2008) to identify the current fees and charges administered by the City of Winnipeg and the authority under which they are administered. The Chief Financial Officer is authorized to increase annually any fee imposed by the City by an amount equal to or less than the rate of inflation. New fees or fee increases greater than inflation must be approved by Council unless specifically otherwise delegated. Normally new fees or fee increases greater than inflation would be included as part of the annual budget process. Long-Term Capital Forecasting Asset Management Policy F1-001 (adopted by Council on January 28, 2015), states that the Public Service will implement a comprehensive approach to managing the City’s assets, to meet established levels of service at the lowest overall cost of ownership, at an acceptable level of risk. Winnipeg’s City Asset Management Plan (CAMP) and the State of the Infrastructure Report (SOIR) were released in 2018. The CAMP summarizes the inventory, overall replacement value, age and condition of the City’s major asset groups. It also outlines the funding deficit and strategies associated with meeting assumed levels of service for existing and new infrastructure. In addition, this report serves as an action plan for continual improvement initiatives across the entire organization. Winnipeg’s CAMP and the annual capital budget process are the tools to implement the city’s long-term capital planning process.
Preliminary 2019 Budget - Overview 1-5
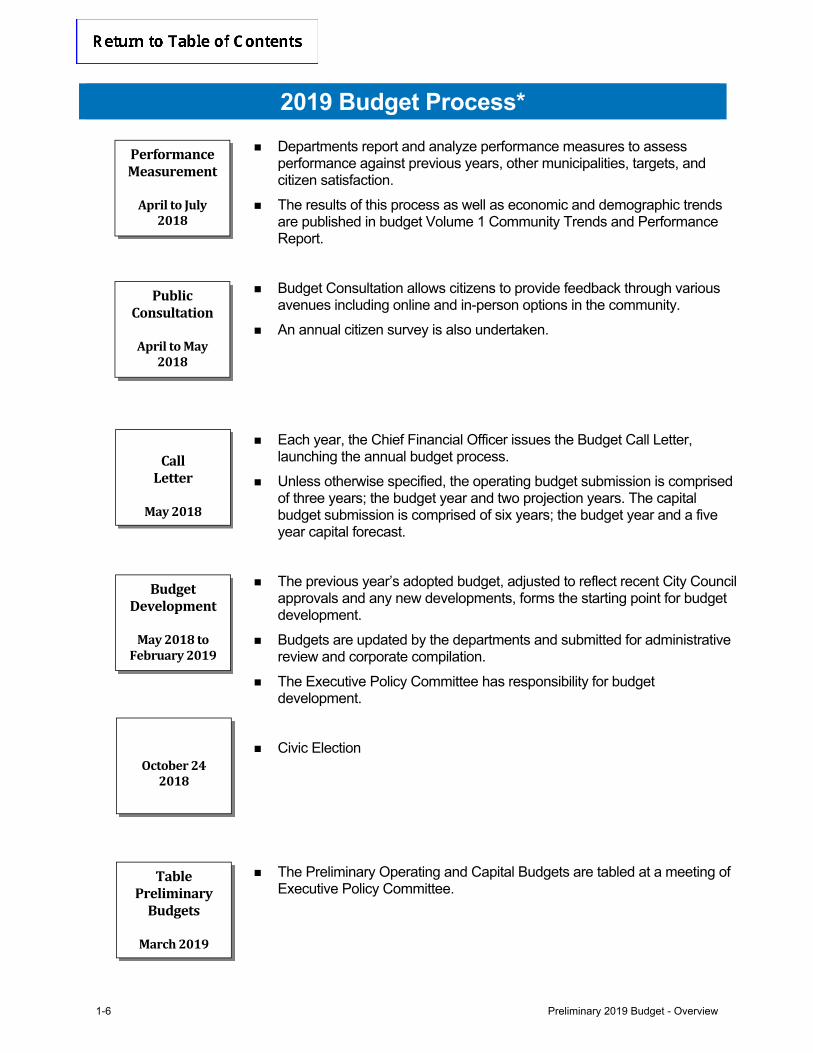
2019 Budget Process*
Departments report and analyze performance measures to assess performance against previous years, other municipalities, targets, and citizen satisfaction.
The results of this process as well as economic and demographic trends are published in budget Volume 1 Community Trends and Performance Report.
Budget Consultation allows citizens to provide feedback through various avenues including online and in-person options in the community.
An annual citizen survey is also undertaken.
Each year, the Chief Financial Officer issues the Budget Call Letter,
launching the annual budget process.
Unless otherwise specified, the operating budget submission is comprised of three years; the budget year and two projection years. The capital budget submission is comprised of six years; the budget year and a five year capital forecast.
The previous year’s adopted budget, adjusted to reflect recent City Council approvals and any new developments, forms the starting point for budget development.
Budgets are updated by the departments and submitted for administrative review and corporate compilation.
The Executive Policy Committee has responsibility for budget development.
Civic Election
The Preliminary Operating and Capital Budgets are tabled at a meeting of Executive Policy Committee.
PublicConsultation
ApriltoMay
2018
BudgetDevelopment
May2018toFebruary2019
TablePreliminaryBudgets
March2019
PerformanceMeasurement
ApriltoJuly
2018
CallLetter
May2018
October242018
1-6 Preliminary 2019 Budget - Overview
The Executive Policy Committee refers the preliminary operating andcapital budget to the City’s Standing Policy Committees for review andrecommendations. Each Committee reviews the part of the budget relatedto its jurisdiction:
– Infrastructure Renewal and Public Works,
– Water and Waste, Riverbank Management and the Environment,
– Property and Development, Heritage and Downtown Development,
– Protection, Community Services and Parks
– Innovation, and
– The Winnipeg Police Board.
The Committees hear presentations by departments. Members of thepublic and interest groups may also make presentations at thesemeetings.
The Executive Policy Committee provides for delegations from the publicand reviews the recommendations from the Standing Policy Committees.Recommendations are finalized by the Executive Policy Committee andforwarded to Council.
See the last page of the budget presentation (Overview tab) for listing ofCommittee review dates.
Council debates, amends, and adopts the operating and capital budgetforwarded from the Executive Policy Committee.
Council then passes a by-law to set the mill rate for the operating tax-supported budget.
Council also gives first reading of a borrowing by-law to externally financethe capital program, if required. In accordance with legislation, approval ofthe borrowing is then requested of the Provincial Minister of Finance.Once authorization is received from the Minister, Council gives secondand third readings of the by-law before it is passed.
Council must adopt the operating budget no later than March 31 eachyear, and the capital budget and five-year forecast by December 31 eachyear, as required by “The City of Winnipeg Charter”.
*Dates noted above vary for each budget process.
CommitteeReview
March2019
CouncilApproval
March20,2019
Preliminary 2019 Budget - Overview 1-7

1-8 Preliminary 2019 Budget - Overview
2019 PRELIMINARY OPERATING AND CAPITAL BUDGETS
March 1, 2019
Preliminary 2109 Budget - O
verview1-9
Overview
• Budget Consultation – Public Engagement
• Budget Context and Highlights
– Context
– Preliminary Operating and Capital Budgets
– Highlights
o Revenue
o Expenditure
o Capital
o Departmental
• Debt Strategy and Net Debt per Capita
• Future Budget Challenges
• Schedule of Budget Review Meetings
1-10Prelim
inary 2109 Budget - Overview
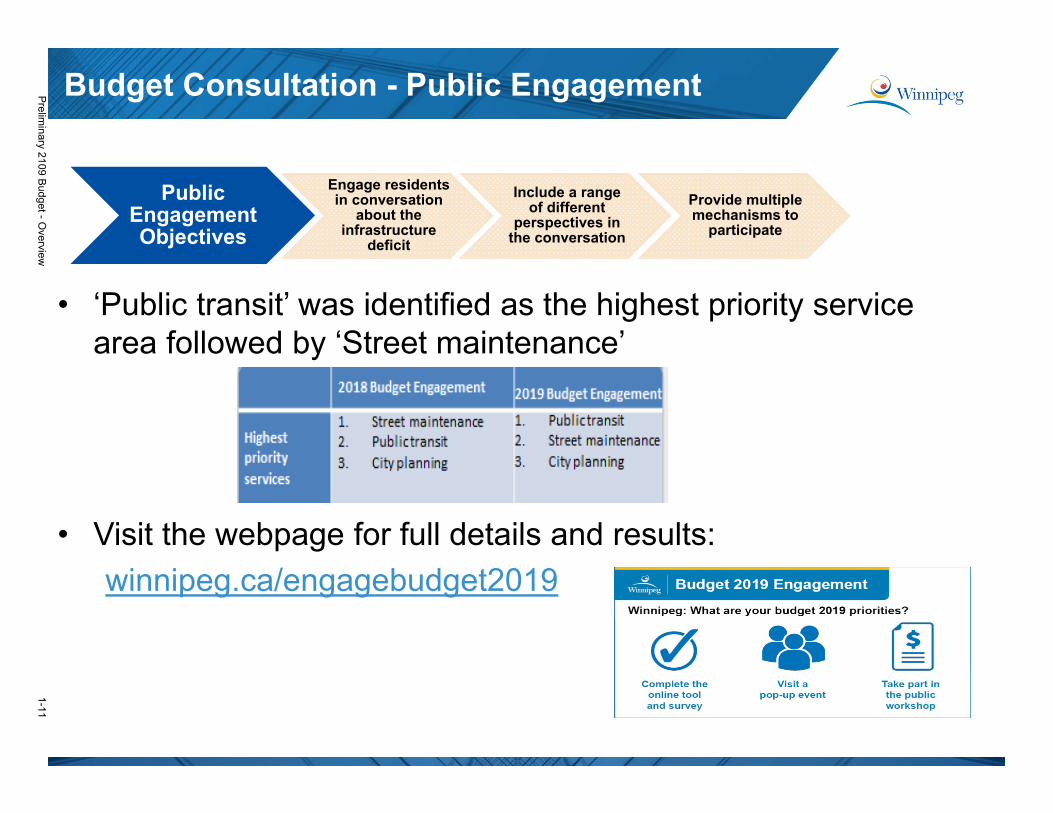
Budget Consultation - Public Engagement
• ‘Public transit’ was identified as the highest priority servicearea followed by ‘Street maintenance’
• Visit the webpage for full details and results:
winnipeg.ca/engagebudget2019
Public Engagement Objectives
Engage residents in conversation
about the infrastructure
deficit
Include a range of different
perspectives in the conversation
Provide multiple mechanisms to
participate
Preliminary 2109 Budget - O
verview1-11
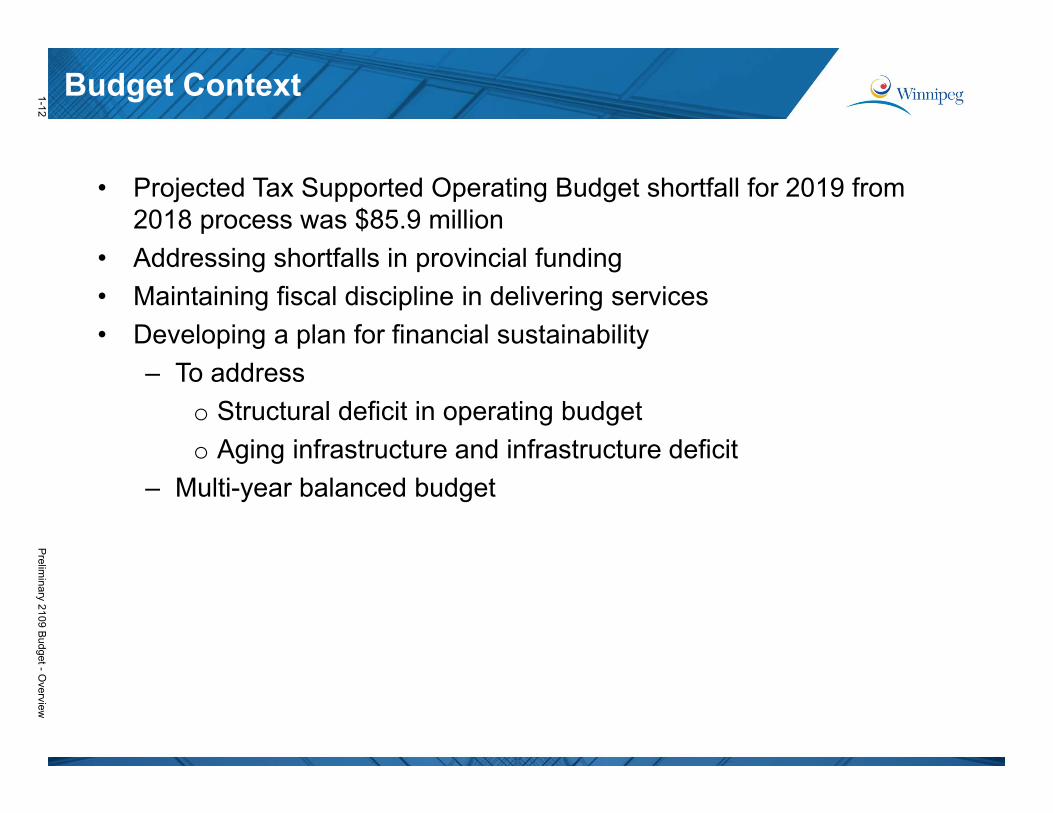
Budget Context
• Projected Tax Supported Operating Budget shortfall for 2019 from 2018 process was $85.9 million
• Addressing shortfalls in provincial funding
• Maintaining fiscal discipline in delivering services
• Developing a plan for financial sustainability
– To address
o Structural deficit in operating budget
o Aging infrastructure and infrastructure deficit
– Multi-year balanced budget
1-12Prelim
inary 2109 Budget - Overview
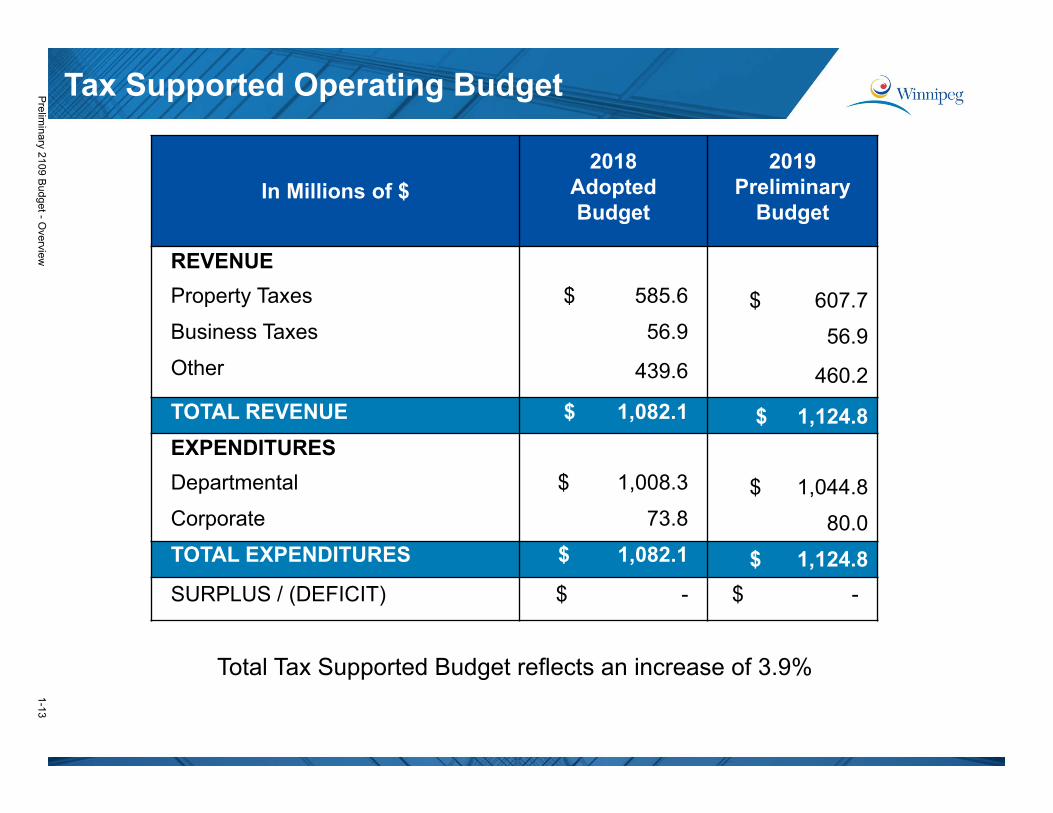
Tax Supported Operating Budget
In Millions of $
2018AdoptedBudget
2019Preliminary
Budget
REVENUE
Property Taxes $ 585.6 $ 607.7
Business Taxes 56.9 56.9
Other 439.6 460.2
TOTAL REVENUE $ 1,082.1 $ 1,124.8
EXPENDITURES
Departmental $ 1,008.3 $ 1,044.8
Corporate 73.8 80.0
TOTAL EXPENDITURES $ 1,082.1 $ 1,124.8
SURPLUS / (DEFICIT) $ - $ -
Total Tax Supported Budget reflects an increase of 3.9%
Preliminary 2109 Budget - O
verview1-13
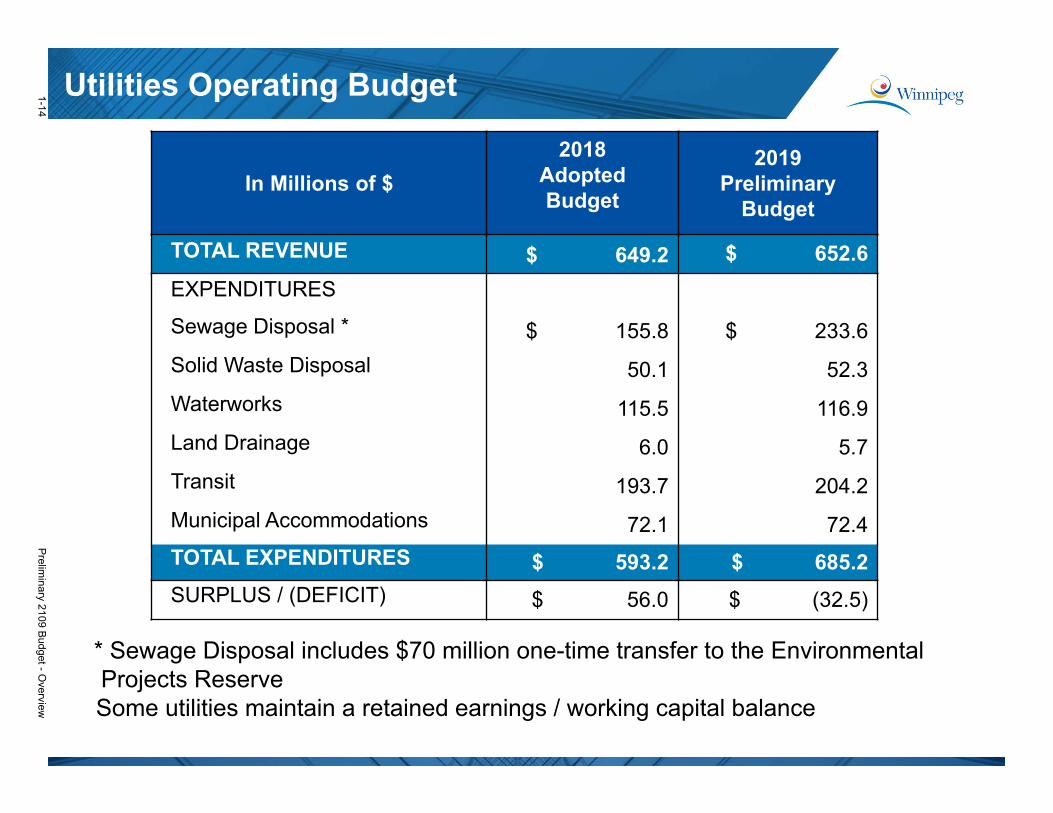
Utilities Operating Budget
* Sewage Disposal includes $70 million one-time transfer to the Environmental Projects ReserveSome utilities maintain a retained earnings / working capital balance
In Millions of $
2018Adopted Budget
2019Preliminary
Budget
TOTAL REVENUE $ 649.2 $ 652.6
EXPENDITURES
Sewage Disposal * $ 155.8 $ 233.6
Solid Waste Disposal 50.1 52.3
Waterworks 115.5 116.9
Land Drainage 6.0 5.7
Transit 193.7 204.2
Municipal Accommodations 72.1 72.4
TOTAL EXPENDITURES $ 593.2 $ 685.2
SURPLUS / (DEFICIT) $ 56.0 $ (32.5)
1-14Prelim
inary 2109 Budget - Overview
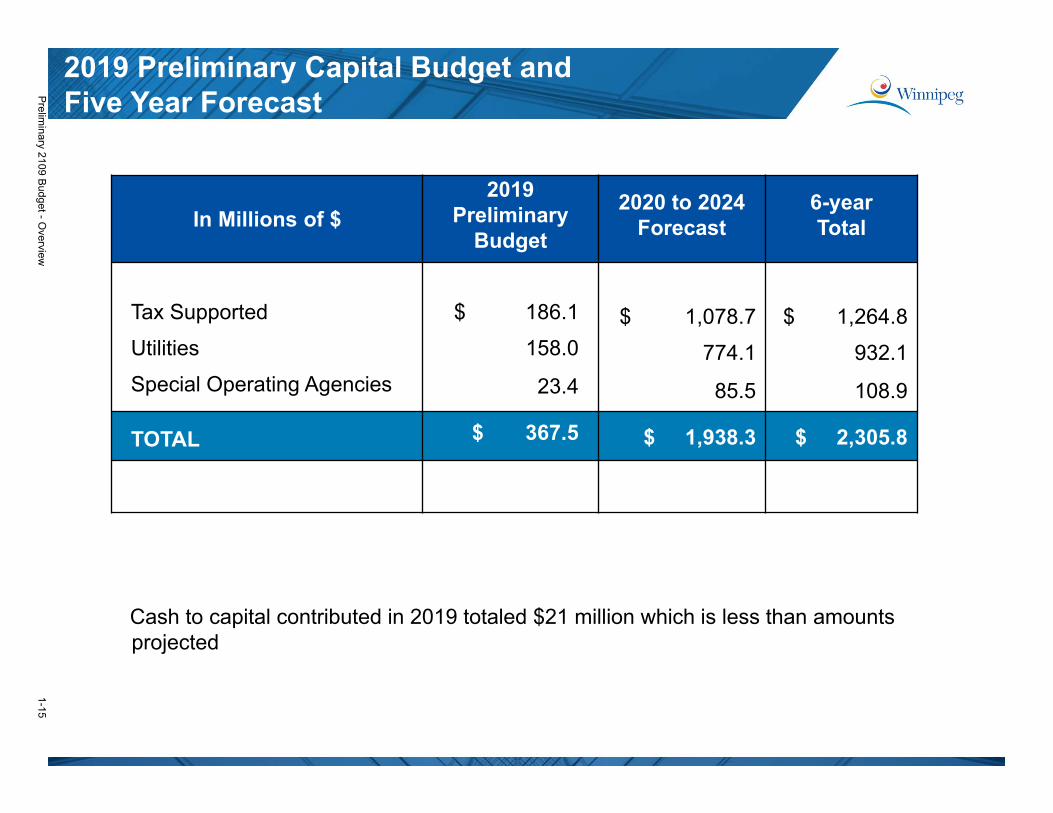
2019 Preliminary Capital Budget and Five Year Forecast
In Millions of $
2019Preliminary
Budget
2020 to 2024 Forecast
6-yearTotal
Tax Supported $ 186.1 $ 1,078.7 $ 1,264.8
Utilities 158.0 774.1 932.1
Special Operating Agencies 23.4 85.5 108.9
TOTAL $ 367.5 $ 1,938.3 $ 2,305.8
Cash to capital contributed in 2019 totaled $21 million which is less than amounts projected
Preliminary 2109 Budget - O
verview1-15
Property and Business Taxes• Combined 2.33% property tax increase
– 2% property tax increase dedicated to capital (1% to each of Regional and Local Street Renewal Programs)
– 0.33% property tax increase dedicated for future payments for the Southwest Rapid Transitway (Stage 2)
• Business Tax rate reduced from 5.14% to 4.97%
– Full rebate of municipal business taxes for businesses that have a rental value of $33,900 or less in 2019 ($33,300 in 2018)
– Impacts 48% of all businesses
– Approximately 5,842 businesses will benefit
2019 Revenue Highlights1-16Prelim
inary 2109 Budget - Overview
Fees
• Waste diversion fee to increase from $57.50 to $63.00 per property
• No impact fee as a funding source, increased by construction inflation (3.5%)
• Remaining fees and charges to increase by inflation (1.6%)
• No increase in water and sewer rates in 2019
• No frontage levy rate increases
• No new fees
2019 Revenue HighlightsPreliminary 2109 Budget - O
verview1-17
Other Revenue
• Reduced water and sewer dividend from 12% to 11%. Reduced revenue of $4.0 million due to dividend rate and water and sewer sales volume changes (2019 - $34.2 million; 2018 - $38.2 million). Savings to fund water and sewer projects
• Provincial operating and public safety grants from levels set in 2017 at $139 million
• Provincial capital funding
– 2019/2020 - $84.7 million ($83.6 million in 2018/2019)
– 2020/2021 - $40.2 million
– Amounts to be confirmed from the Province’s annual budget
• One time transfers from reserves and other sources $28.9 million
– Including transfer from Financial stabilization reserve $10.3 million
2019 Revenue Highlights1-18Prelim
inary 2109 Budget - Overview
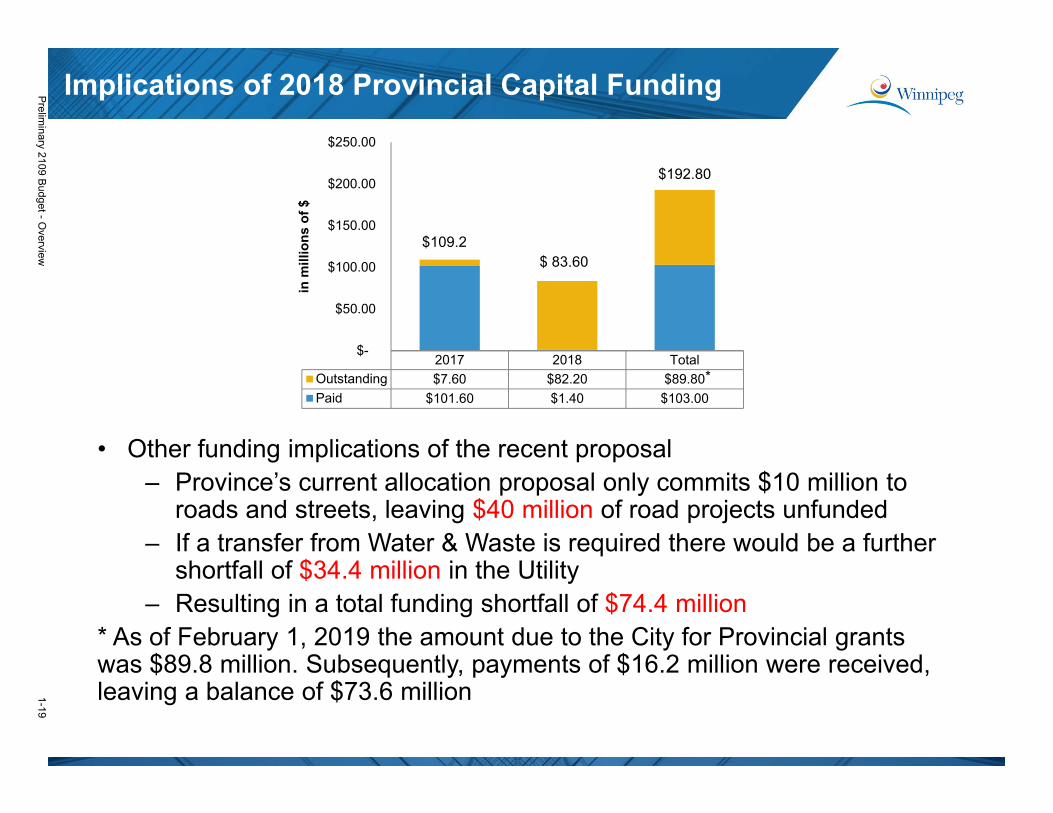
• Other funding implications of the recent proposal– Province’s current allocation proposal only commits $10 million to
roads and streets, leaving $40 million of road projects unfunded– If a transfer from Water & Waste is required there would be a further
shortfall of $34.4 million in the Utility– Resulting in a total funding shortfall of $74.4 million
* As of February 1, 2019 the amount due to the City for Provincial grants was $89.8 million. Subsequently, payments of $16.2 million were received, leaving a balance of $73.6 million
Implications of 2018 Provincial Capital Funding
2017 2018 Total
Outstanding $7.60 $82.20 $89.80
Paid $101.60 $1.40 $103.00
$-
$50.00
$100.00
$150.00
$200.00
$250.00
in m
illio
ns
of
$
$109.2
$192.80
$ 83.60
*
Preliminary 2109 Budget - O
verview1-19
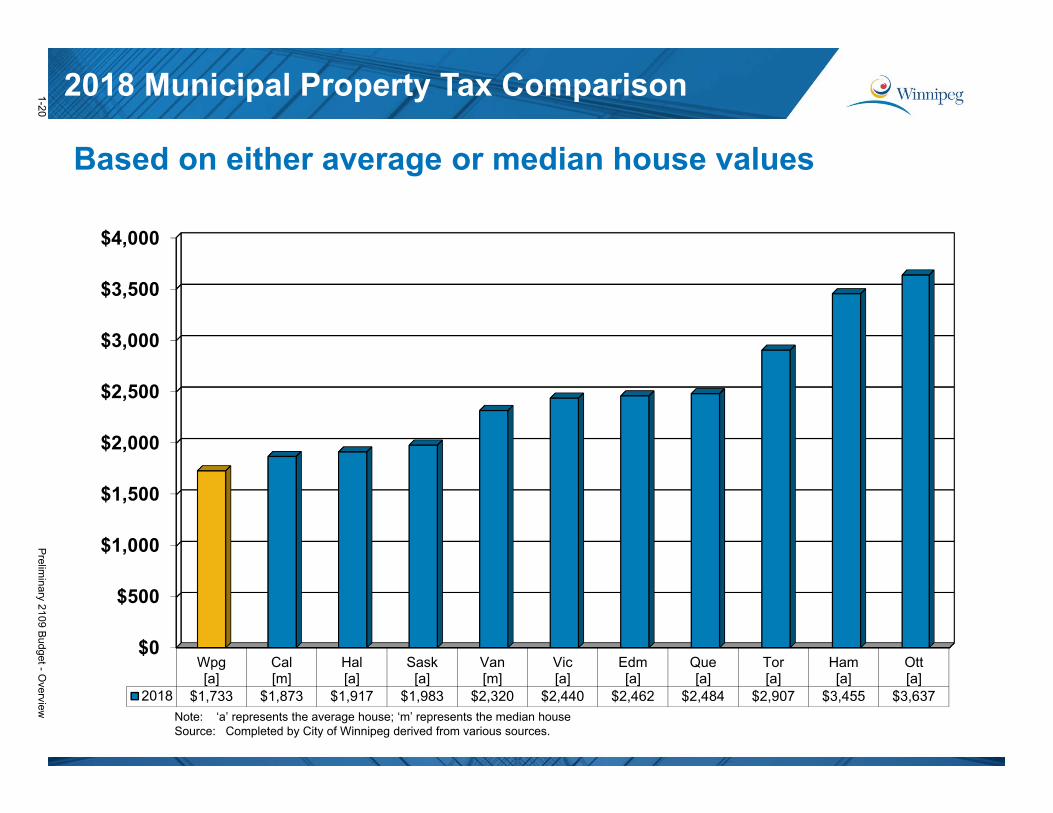
2018 Municipal Property Tax Comparison
Based on either average or median house values
$0
$500
$1,000
$1,500
$2,000
$2,500
$3,000
$3,500
$4,000
Wpg[a]
Cal[m]
Hal[a]
Sask[a]
Van[m]
Vic[a]
Edm[a]
Que[a]
Tor[a]
Ham[a]
Ott[a]
2018 $1,733 $1,873 $1,917 $1,983 $2,320 $2,440 $2,462 $2,484 $2,907 $3,455 $3,637
Note: ‘a’ represents the average house; ‘m’ represents the median house Source: Completed by City of Winnipeg derived from various sources.
1-20Prelim
inary 2109 Budget - Overview
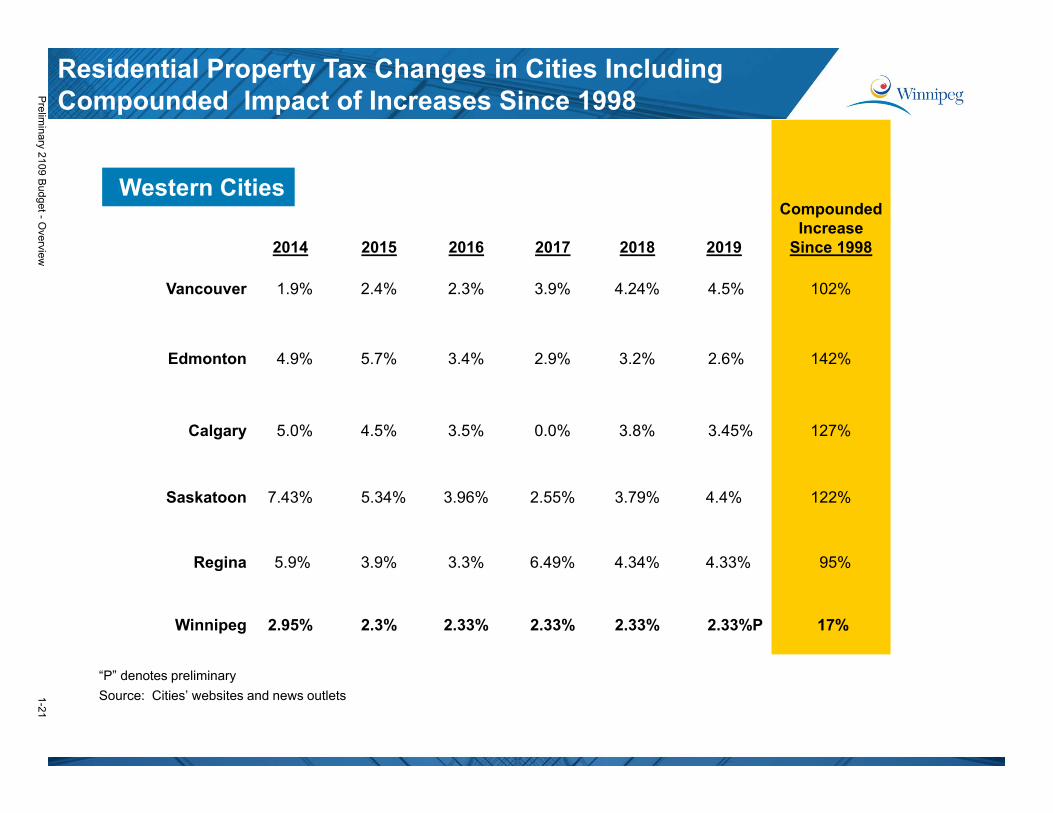
Residential Property Tax Changes in Cities Including Compounded Impact of Increases Since 1998
2014 2015 2016 2017 2018 2019
Compounded Increase
Since 1998
Vancouver 1.9% 2.4% 2.3% 3.9% 4.24% 4.5% 102%
Edmonton 4.9% 5.7% 3.4% 2.9% 3.2% 2.6% 142%
Calgary 5.0% 4.5% 3.5% 0.0% 3.8% 3.45% 127%
Saskatoon 7.43% 5.34% 3.96% 2.55% 3.79% 4.4% 122%
Regina 5.9% 3.9% 3.3% 6.49% 4.34% 4.33% 95%
Winnipeg 2.95% 2.3% 2.33% 2.33% 2.33% 2.33%P 17%
Western Cities
“P” denotes preliminary
Source: Cities’ websites and news outlets
Preliminary 2109 Budget - O
verview1-21
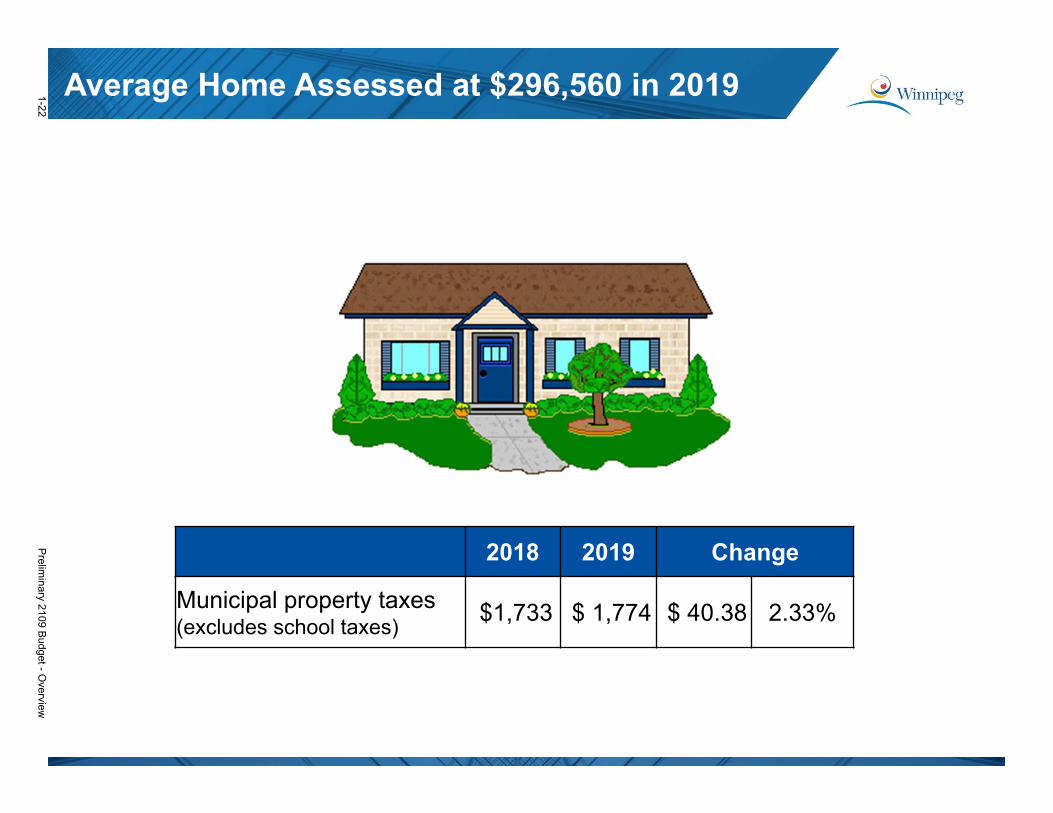
2018 2019 Change
Municipal property taxes (excludes school taxes)
$1,733 $ 1,774 $ 40.38 2.33%
Average Home Assessed at $296,560 in 20191-22Prelim
inary 2109 Budget - Overview
• Increase from 1.3% to 3.9% primarily because of collective agreement obligations. Salaries and benefits comprise 57% of tax-supported budgets
• Increased efficiency savings from $4.7 million to $11.6 million
• Vacancy management maintained at $18.4 million but expenditure management assigned to tax-supported departments totals $1.6 million
2019 Expenditure Highlights
Preliminary 2109 Budget - O
verview1-23
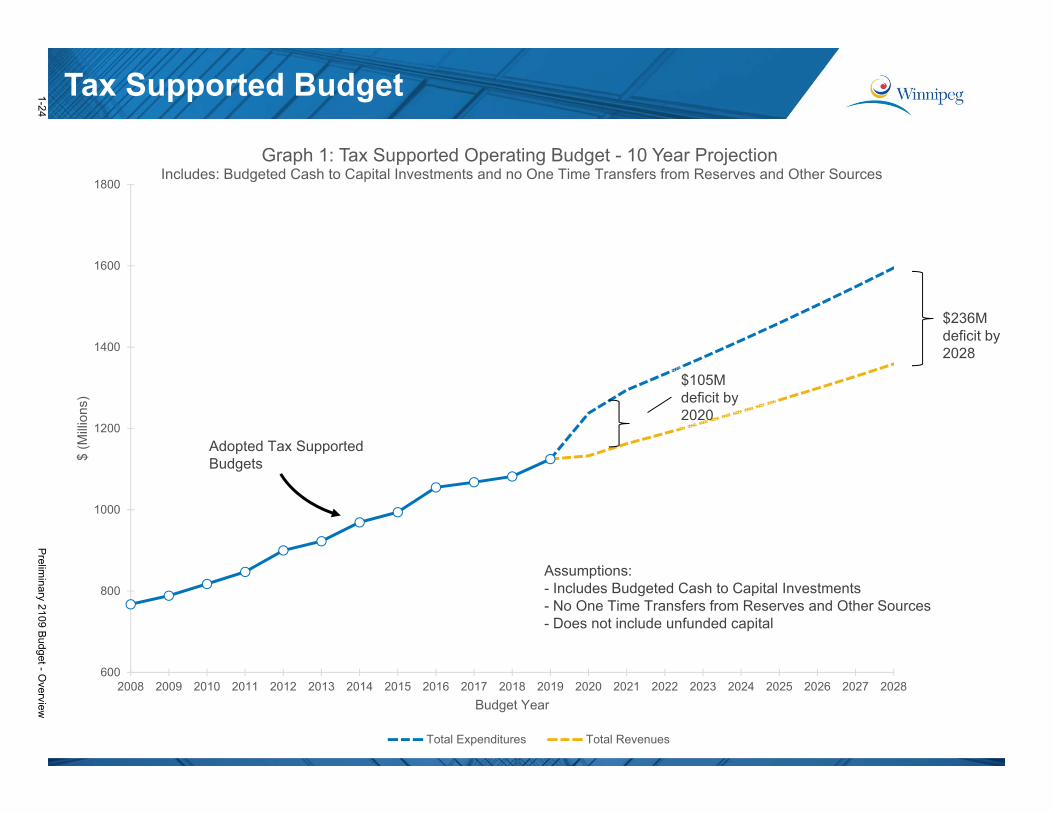
Tax Supported Budget
600
800
1000
1200
1400
1600
1800
2008 2009 2010 2011 2012 2013 2014 2015 2016 2017 2018 2019 2020 2021 2022 2023 2024 2025 2026 2027 2028
$ (M
illio
ns)
Budget Year
Graph 1: Tax Supported Operating Budget - 10 Year Projection Includes: Budgeted Cash to Capital Investments and no One Time Transfers from Reserves and Other Sources
Total Expenditures Total Revenues
$236M deficit by 2028
Adopted Tax Supported Budgets
Assumptions:- Includes Budgeted Cash to Capital Investments- No One Time Transfers from Reserves and Other Sources- Does not include unfunded capital
$105M deficit by 2020
1-24Prelim
inary 2109 Budget - Overview
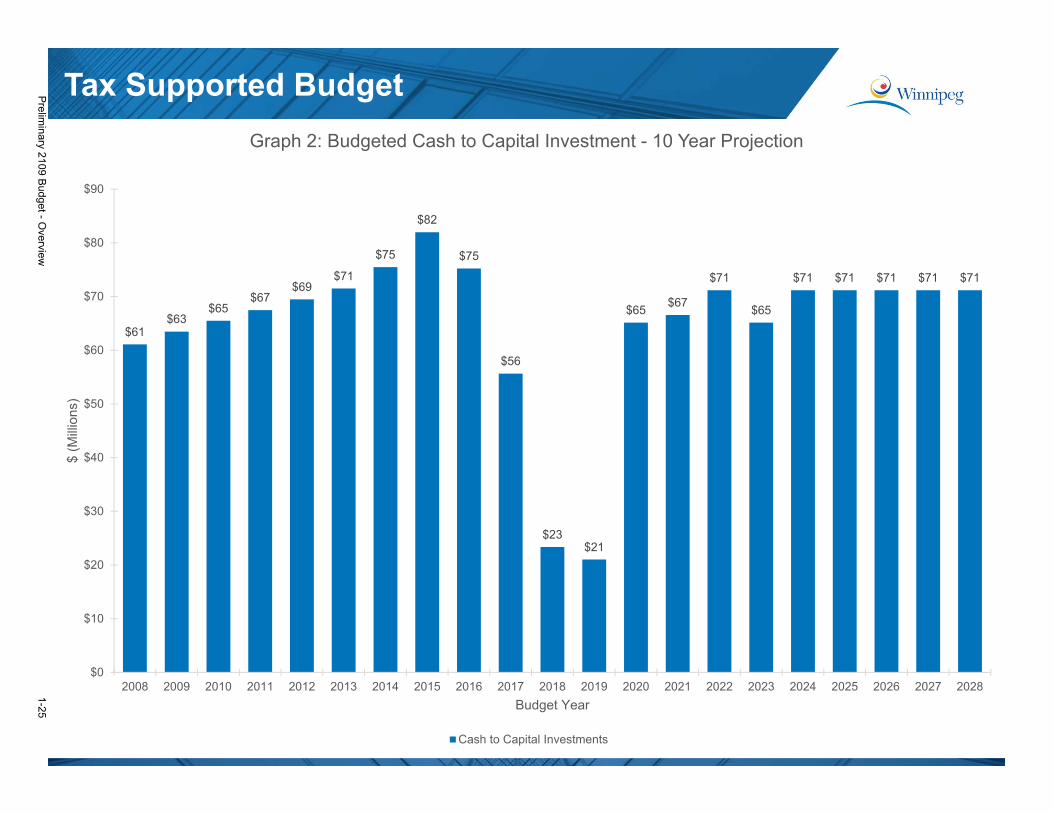
Tax Supported Budget
$61$63
$65$67
$69$71
$75
$82
$75
$56
$23$21
$65$67
$71
$65
$71 $71 $71 $71 $71
$0
$10
$20
$30
$40
$50
$60
$70
$80
$90
2008 2009 2010 2011 2012 2013 2014 2015 2016 2017 2018 2019 2020 2021 2022 2023 2024 2025 2026 2027 2028
$ (M
illio
ns)
Budget Year
Graph 2: Budgeted Cash to Capital Investment - 10 Year Projection
Cash to Capital Investments
Preliminary 2109 Budget - O
verview1-25
2019 Capital Budget Highlights
• The City is challenged by aging infrastructure and the infrastructure deficit
• Provincial capital funding for 2019 and beyond has not been confirmed
• Structural deficit in the operating budget
• The capital budget therefore includes the following measures:
– Total external debt financing is $38.2 million in 2019 ($48.2 million in 2018)
– The City will use internal financing of $34.9 million ($22.1 million in 2018) from its cash balances to invest in certain capital assets. Internal financing will be repaid through future operating budgets
– Fleet debt borrowing is $22.3 million, combination of external and internal sources ($21.2 million in 2018)
– Partnerships with other levels of government to fund priority projects (Public Transit Infrastructure Fund (PTIF), New Building Canada Fund program)
– Reduced cash to capital in 2019 to $21.0 million ($23.3 million in 2018) in maintaining services in the operating budget
1-26Prelim
inary 2109 Budget - Overview
Continued Dedicated Funding Plan for Street Renewal
• 2% property tax increase funds reserves dedicated to the renewal of regional and local streets, back lanes and sidewalks in the capital program
• Tri-level government funding for regional roads
– Enhance driver and pedestrian safety
– Improve transportation routes for businesses
– Total 5-year program from 2019 to 2023 - $318.5 million
o Additional $100 million Federal funding from New Building Canada Fund
o Provincial funding $100 million
o City share $118.5 million
2019 Departmental HighlightsPreliminary 2109 Budget - O
verview1-27
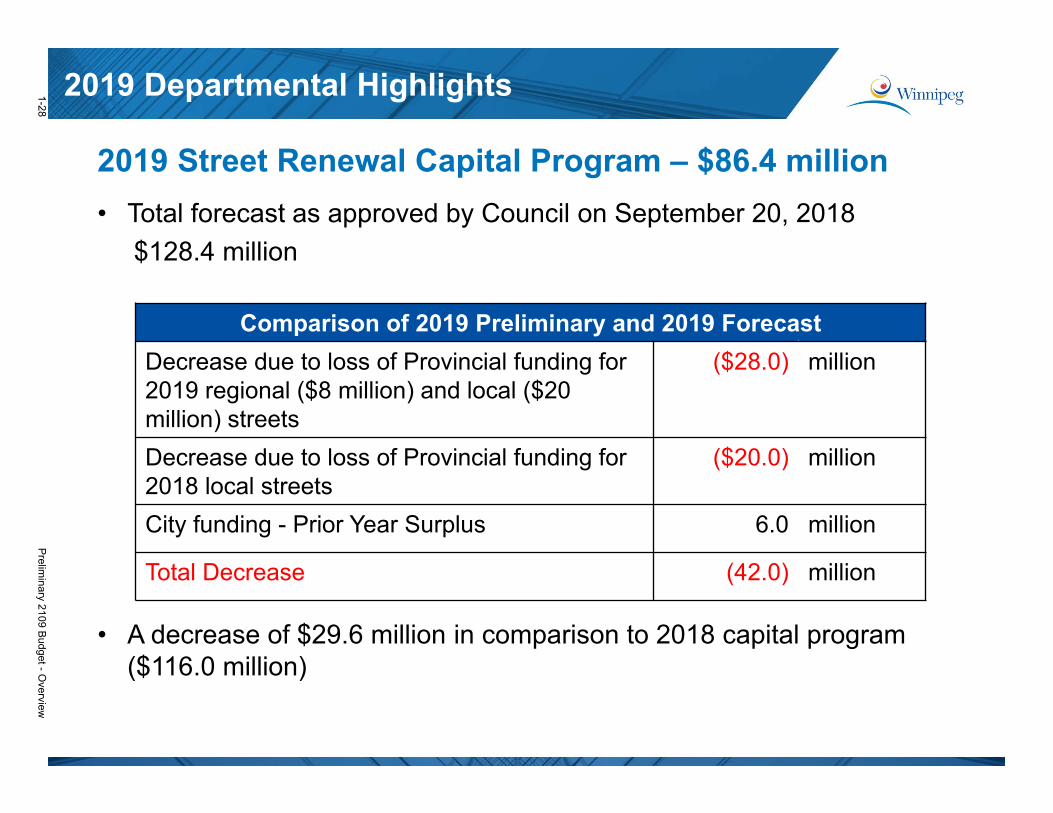
2019 Street Renewal Capital Program – $86.4 million
• Total forecast as approved by Council on September 20, 2018
$128.4 million
• A decrease of $29.6 million in comparison to 2018 capital program ($116.0 million)
2019 Departmental Highlights
Comparison of 2019 Preliminary and 2019 Forecast
Decrease due to loss of Provincial funding for 2019 regional ($8 million) and local ($20million) streets
($28.0) million
Decrease due to loss of Provincial funding for 2018 local streets
($20.0) million
City funding - Prior Year Surplus 6.0 million
Total Decrease (42.0) million
1-28Prelim
inary 2109 Budget - Overview
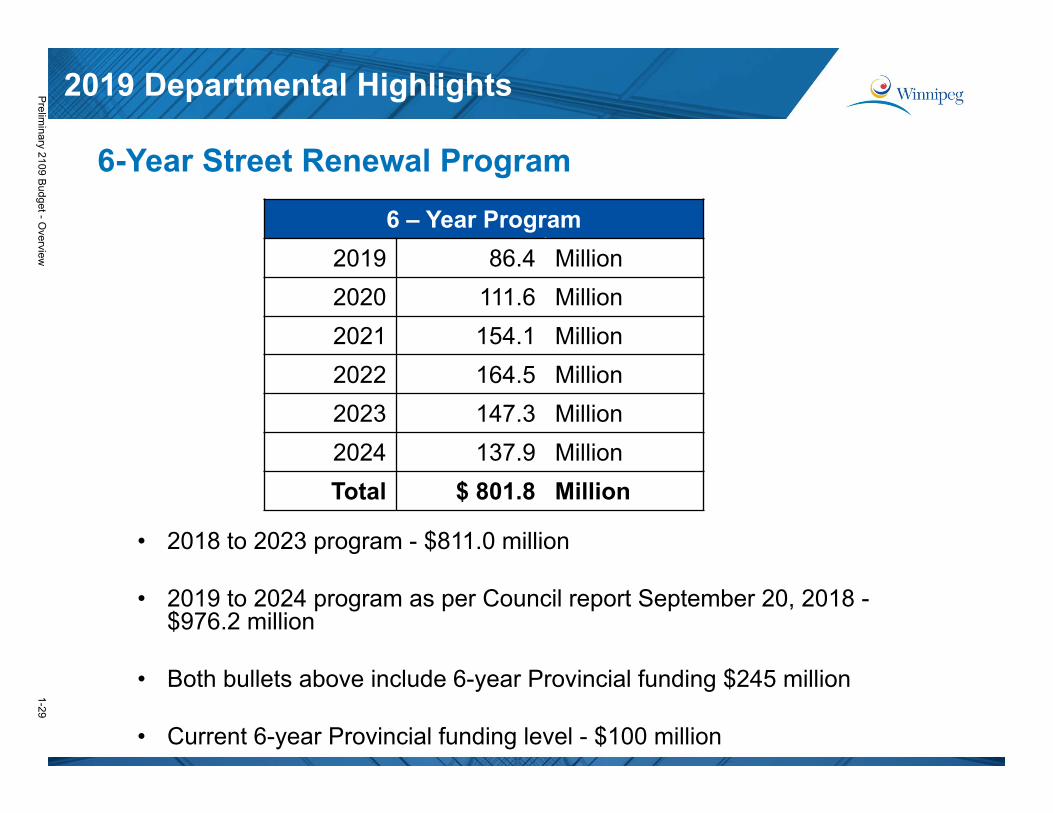
6-Year Street Renewal Program
2019 Departmental Highlights
6 – Year Program
2019 86.4 Million
2020 111.6 Million
2021 154.1 Million
2022 164.5 Million
2023 147.3 Million
2024 137.9 Million
Total $ 801.8 Million
• 2018 to 2023 program - $811.0 million
• 2019 to 2024 program as per Council report September 20, 2018 -$976.2 million
• Both bullets above include 6-year Provincial funding $245 million
• Current 6-year Provincial funding level - $100 million
Preliminary 2109 Budget - O
verview1-29
Transit Investments
• A freeze on transit fares at 2018 levels
• Southwest Rapid Transitway (Stage 2) and Pembina Highway Underpass Project – Ongoing
– Continued multi-year funding plan, including a tax increase of 0.33% for ten years beginning in 2016
• Federal / City partnership for Transit Infrastructure - $2.5 million / $2.8 million
• Transit Buses - $22.2 million, 34 buses
• Transit operating expenditures of $204.2 million ($193.7 million in 2018)
• Tax Supported transit subsidy $70.6 million ($66.4 million in 2018)
2019 Departmental Highlights1-30Prelim
inary 2109 Budget - Overview
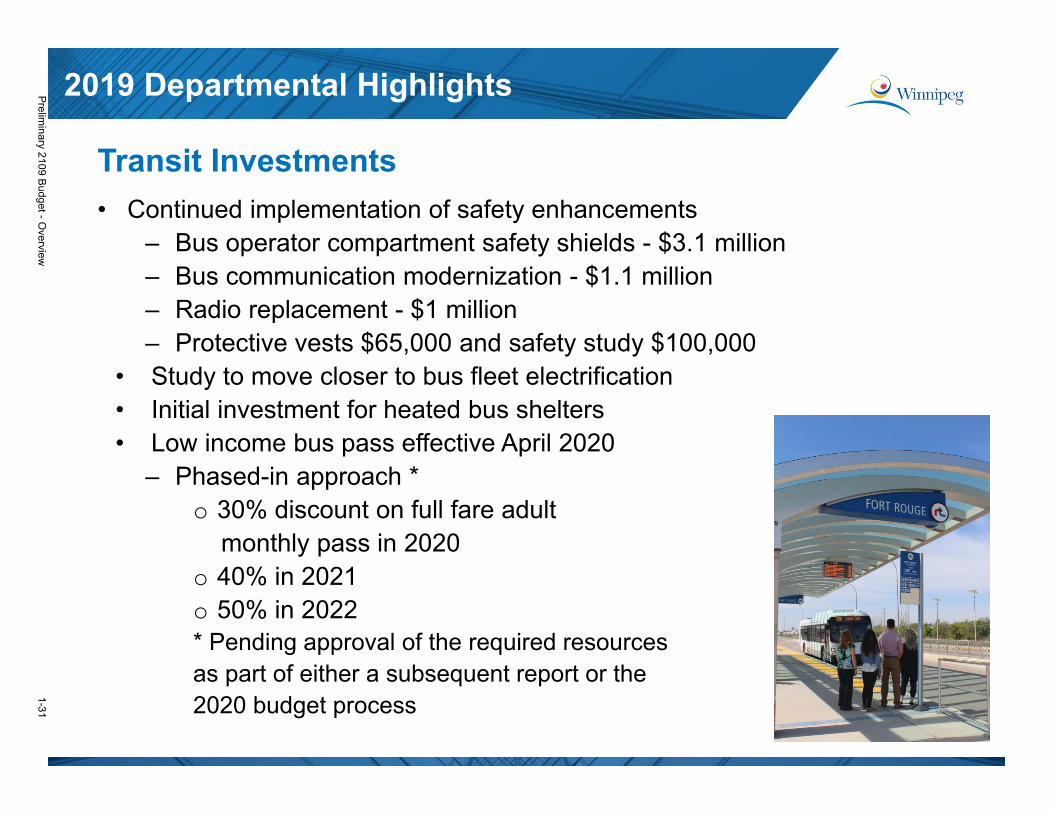
Transit Investments
• Continued implementation of safety enhancements– Bus operator compartment safety shields - $3.1 million – Bus communication modernization - $1.1 million– Radio replacement - $1 million– Protective vests $65,000 and safety study $100,000
• Study to move closer to bus fleet electrification• Initial investment for heated bus shelters• Low income bus pass effective April 2020
– Phased-in approach *o 30% discount on full fare adult
monthly pass in 2020o 40% in 2021o 50% in 2022* Pending approval of the required resources as part of either a subsequent report or the 2020 budget process
2019 Departmental HighlightsPreliminary 2109 Budget - O
verview1-31
Safe and Secure Communities – Public Safety
2019 Departmental Highlights
Winnipeg Police Service• Operating expenditures $301.4 million
• Increase 3.4%• 6-year capital program $25.5 million
Winnipeg Fire Paramedic Service• Operating expenditures $201.5 million
• Increase 4.2%• Includes full cost recovery of ambulance
services• 6-year capital program $47.5 million
Public Safety comprises 45% of total tax supported operating budget
1-32Prelim
inary 2109 Budget - Overview
Safe and Secure Communities
2019 Departmental Highlights
Public Works• Operating expenditures $244.7 million
• Includes winter maintenance for active transportation network
• 6-year capital program $990.2 million
Community Services• Operating expenditures $113.8 million• 6-year capital program $112.8 million
• Increase of 50% in 2019 budget over 2018
Planning, Property and Development• Operating expenditures $43.9 million• 6-year capital program $65.8 million
Preliminary 2109 Budget - O
verview1-33
Environmental Investments in Water and Waste
2019 Departmental Highlights
• Meeting regulatory compliance requirements and protecting public health and safety
• Maintaining infrastructure to ensure ongoing, reliable and sustainable customer levels of service
– 6-year program for Water Main Renewals $113.0 million and Sewer Renewals $117.0 million
– 6-year capital budget for Water and Waste - $648.2 million
• Combined Sewer Overflow and Basement Flooding Strategy
– 2015 – 2018 budgets $78.1 million
– 2019 budget and 2020 to 2022 forecasts total $116.9 million
– Cumulative 4-year increase of 50%
• Utility Dividend
– Waterworks - $13.9 million ($15.5 million in 2018)
– Sewage Disposal - $20.3 million ($22.7 million in 2018)
1-34Prelim
inary 2109 Budget - Overview
Innovation, Transformation and Technology • Technology investments the city relies upon must be maintained:
– Radio communication for non-public safety staff– Microsoft Office product mandatory upgrades – Replacement of technology that is outdated and no longer reliable
• Innovation opportunities must be pursued across all service areas. Some initiatives to achieve improved service are:
– Expanded use of Transportation Management Centre (TMC) to maximize value of road renewal investments, and leverage its communication network to introduce other sensors and monitoring opportunities (e.g. water level sensors, train movements, snow covering sensors)
– Streamlining of business processes, targeting under-performing services to improve resident impact (e.g. PEGGO, permit process, inspections)
– Implementing Smart Cities approaches with enhanced data sharing across services and with citizens
– Undertaking innovation pilots to validate high value opportunities quickly and with low risk (e.g. automated customer agents, increased citizen access to city information)
2019 Departmental HighlightsPreliminary 2109 Budget - O
verview1-35
Innovation, Transformation and Technology
• $9.4 million in Core Information Technology capital projects to maintain existing information technology and deliver high value enhancements
– Core investments – city wide licensing, unreliable equipment replacement, minimize service downtime
– Security – improvement to extensive deferred data and system security investments
– PeopleSoft Enhancements – required for mandatory updates to city wide Human Resources and Finance systems
– Enterprise Content Management – investments to business processes supporting the Decision Making Information System, and to drive efficiency and enhanced service delivery across the City
• $1.0 million Innovation capital project in 2019 to establish innovation capability and execute highest value innovation opportunities
– Building upon the Innovation Strategy Program initiated in 2018• $1.0 million Smart Cities capital funding to improve the City through
innovation, data and connected technology
2019 Departmental Highlights1-36Prelim
inary 2109 Budget - Overview
Strategic Investments
• Community Centre Renovation Grant program increasing from $965,000 to $2.0 million annually for five years (2019 to 2023)
• Active Transportation (AT) Facilities - $3.0 million – AT budget in other projects $6.7 million
• Bill and Helen Norrie Library - $3.6 million in 2019, total project $9.3 million
• GoLibrary automated kiosk system in the Old Kildonan community -$242,000
• St. James Civic Centre – Facility Expansion and Renewal – Facility renewal - $9.7 million– Facility expansion - budgeted $7.8 million (City and Provincial
share $3.9 million each)o Estimated cost for expansion of $14.0 million subject to
Federal government and other funding • Computer Aided Dispatch for fire and emergency services - $11.2
million subject to confirmation of Provincial funding
2019 Departmental HighlightsPreliminary 2109 Budget - O
verview1-37
Strategic Investments
• New Recreation Facility – South Winnipeg - $1.75 million, 6-year total $11.8 million
• Public Safety Building and Civic Centre Parkade - $10.5 million
• Fleet Asset Acquisitions - $22.3 million ($21.2 million in 2018)
• Indigenous Youth Strategy funding at $1.25 million, consistent with City share in 2017 and 2018
• Operating and capital support to Assiniboine Park Conservancy
– $11.1 million operating grant
– $4.7 million in 2019 to provide funding for Canada’s Diversity Gardens and Phase 2 of the Kids Discovery Zone
– Completes the City’s commitment of $50.0 million for capital development improvements at Assiniboine Park
– $5.1 million for ongoing infrastructure renewal
2019 Departmental Highlights1-38Prelim
inary 2109 Budget - Overview
Investing in Communities
• $150,000 for the Community Homeless Assistance Team (CHAT program)
• Last year of 5-year annual grant of $150,000 to the End Homelessness Winnipeg
• Winnipeg Arts Council operating funding of $4,645,319 plus museum grant administration of $266,000
• Further $1 million toward $5 million commitment to support the Winnipeg Art Gallery - Inuit Art Centre (4th year)
2019 Departmental HighlightsPreliminary 2109 Budget - O
verview1-39
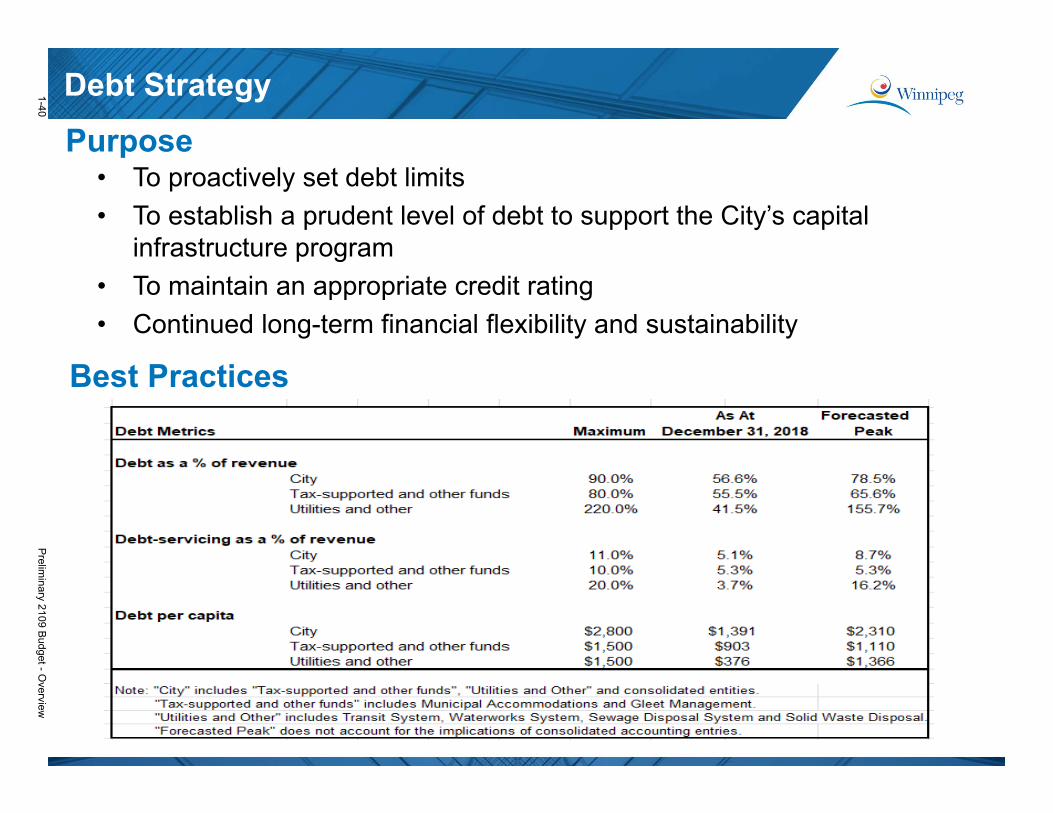
Debt Strategy
• To proactively set debt limits
• To establish a prudent level of debt to support the City’s capital infrastructure program
• To maintain an appropriate credit rating
• Continued long-term financial flexibility and sustainability
Purpose
Best Practices
1-40Prelim
inary 2109 Budget - Overview
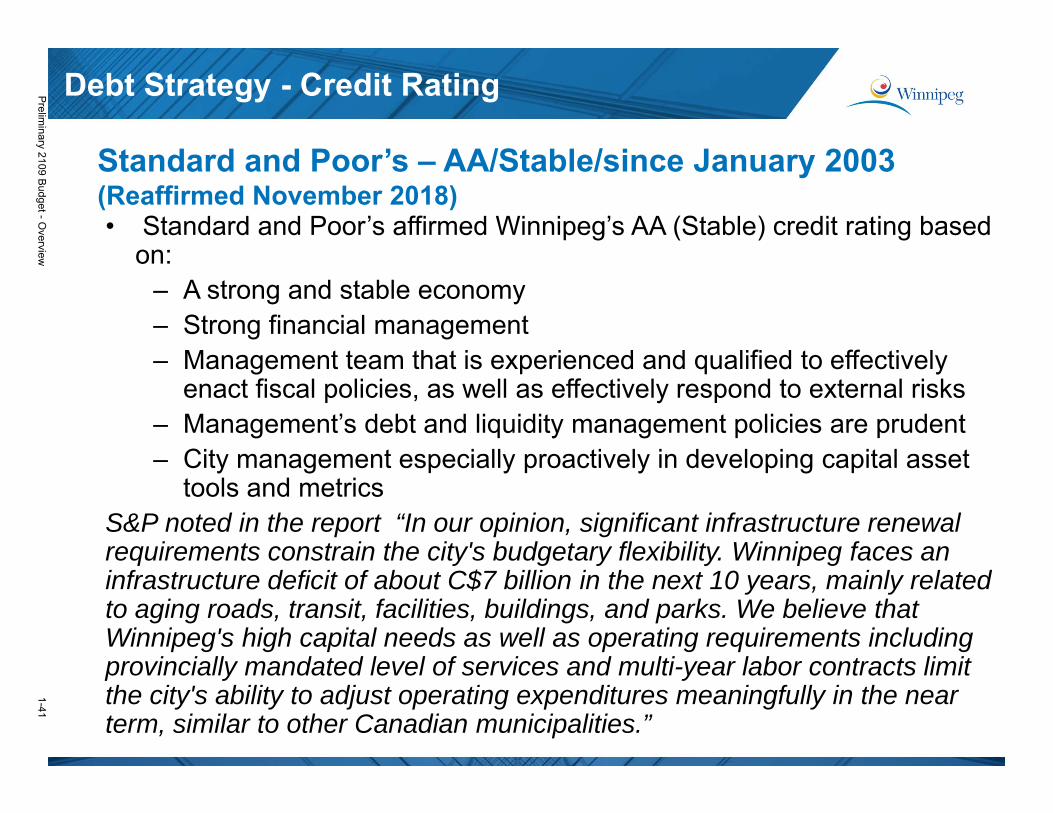
Standard and Poor’s – AA/Stable/since January 2003 (Reaffirmed November 2018)• Standard and Poor’s affirmed Winnipeg’s AA (Stable) credit rating based
on: – A strong and stable economy– Strong financial management– Management team that is experienced and qualified to effectively
enact fiscal policies, as well as effectively respond to external risks– Management’s debt and liquidity management policies are prudent – City management especially proactively in developing capital asset
tools and metricsS&P noted in the report “In our opinion, significant infrastructure renewal requirements constrain the city's budgetary flexibility. Winnipeg faces an infrastructure deficit of about C$7 billion in the next 10 years, mainly related to aging roads, transit, facilities, buildings, and parks. We believe that Winnipeg's high capital needs as well as operating requirements including provincially mandated level of services and multi-year labor contracts limit the city's ability to adjust operating expenditures meaningfully in the near term, similar to other Canadian municipalities.”
Debt Strategy - Credit RatingPreliminary 2109 Budget - O
verview1-41
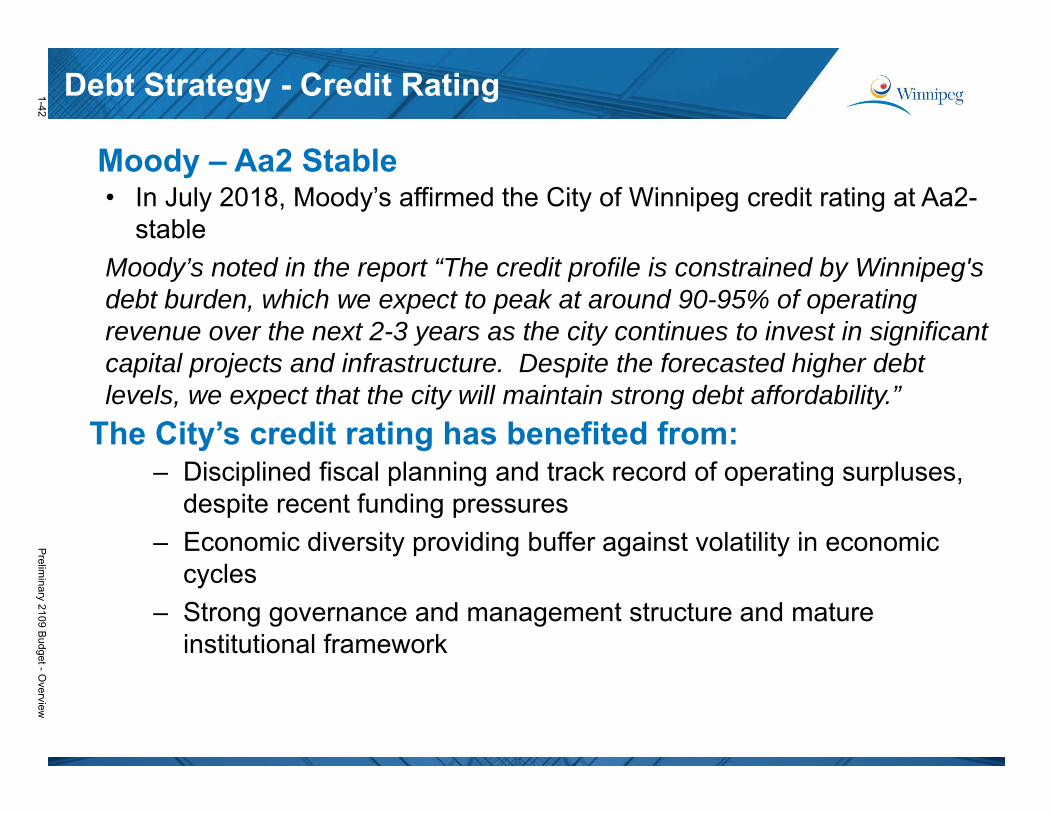
Moody – Aa2 Stable• In July 2018, Moody’s affirmed the City of Winnipeg credit rating at Aa2-
stable
Moody’s noted in the report “The credit profile is constrained by Winnipeg's debt burden, which we expect to peak at around 90-95% of operating revenue over the next 2-3 years as the city continues to invest in significant capital projects and infrastructure. Despite the forecasted higher debt levels, we expect that the city will maintain strong debt affordability.”
– Disciplined fiscal planning and track record of operating surpluses, despite recent funding pressures
– Economic diversity providing buffer against volatility in economic cycles
– Strong governance and management structure and mature institutional framework
Debt Strategy - Credit Rating
The City’s credit rating has benefited from:
1-42Prelim
inary 2109 Budget - Overview
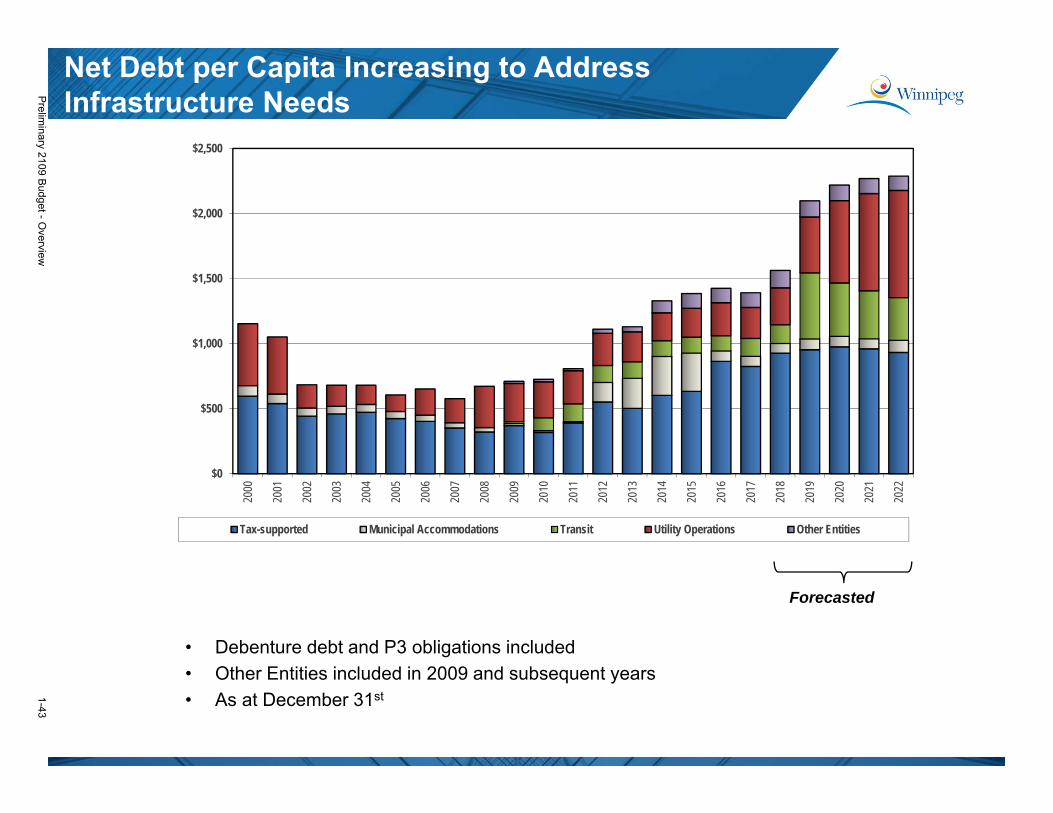
Net Debt per Capita Increasing to Address Infrastructure Needs
• Debenture debt and P3 obligations included
• Other Entities included in 2009 and subsequent years
• As at December 31st
Forecasted
$0
$500
$1,000
$1,500
$2,000
$2,500
2000
2001
2002
2003
2004
2005
2006
2007
2008
2009
2010
2011
2012
2013
2014
2015
2016
2017
2018
2019
2020
2021
2022
Tax-supported Municipal Accommodations Transit Utility Operations Other Entities
Preliminary 2109 Budget - O
verview1-43
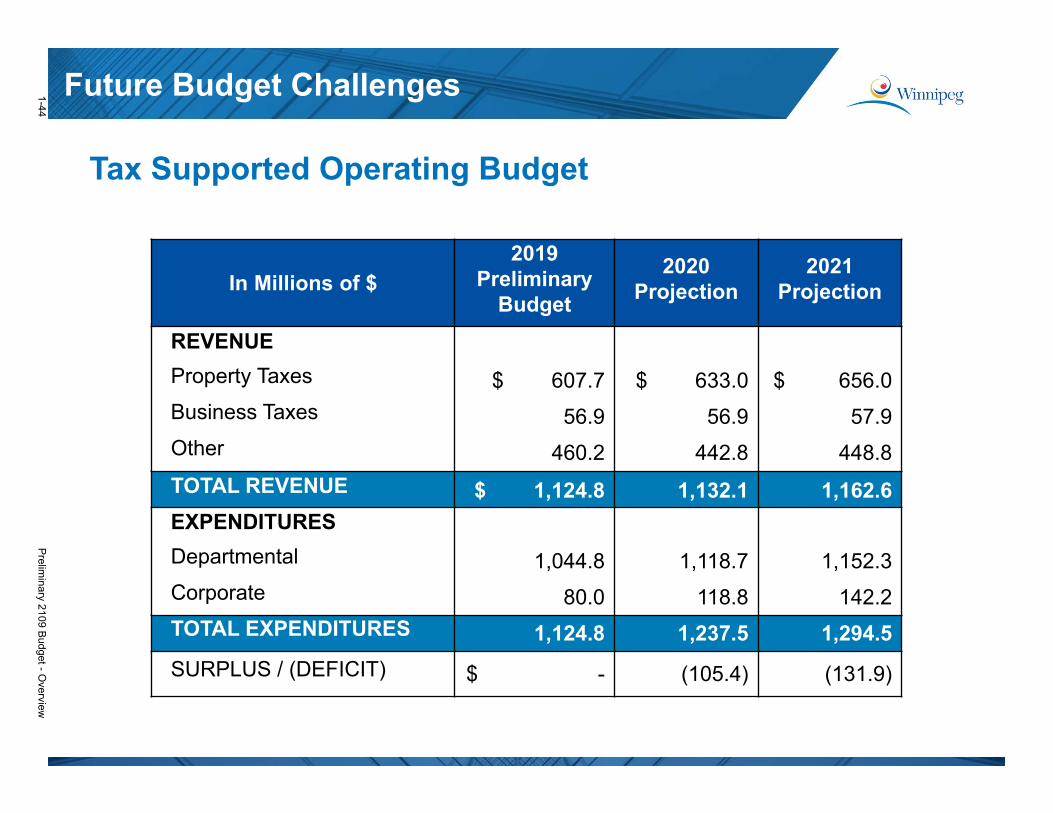
Future Budget Challenges
Tax Supported Operating Budget
In Millions of $
2019 Preliminary
Budget
2020Projection
2021Projection
REVENUE
Property Taxes $ 607.7 $ 633.0 $ 656.0
Business Taxes 56.9 56.9 57.9
Other 460.2 442.8 448.8
TOTAL REVENUE $ 1,124.8 1,132.1 1,162.6
EXPENDITURES
Departmental 1,044.8 1,118.7 1,152.3
Corporate 80.0 118.8 142.2
TOTAL EXPENDITURES 1,124.8 1,237.5 1,294.5
SURPLUS / (DEFICIT) $ - (105.4) (131.9)
1-44Prelim
inary 2109 Budget - Overview
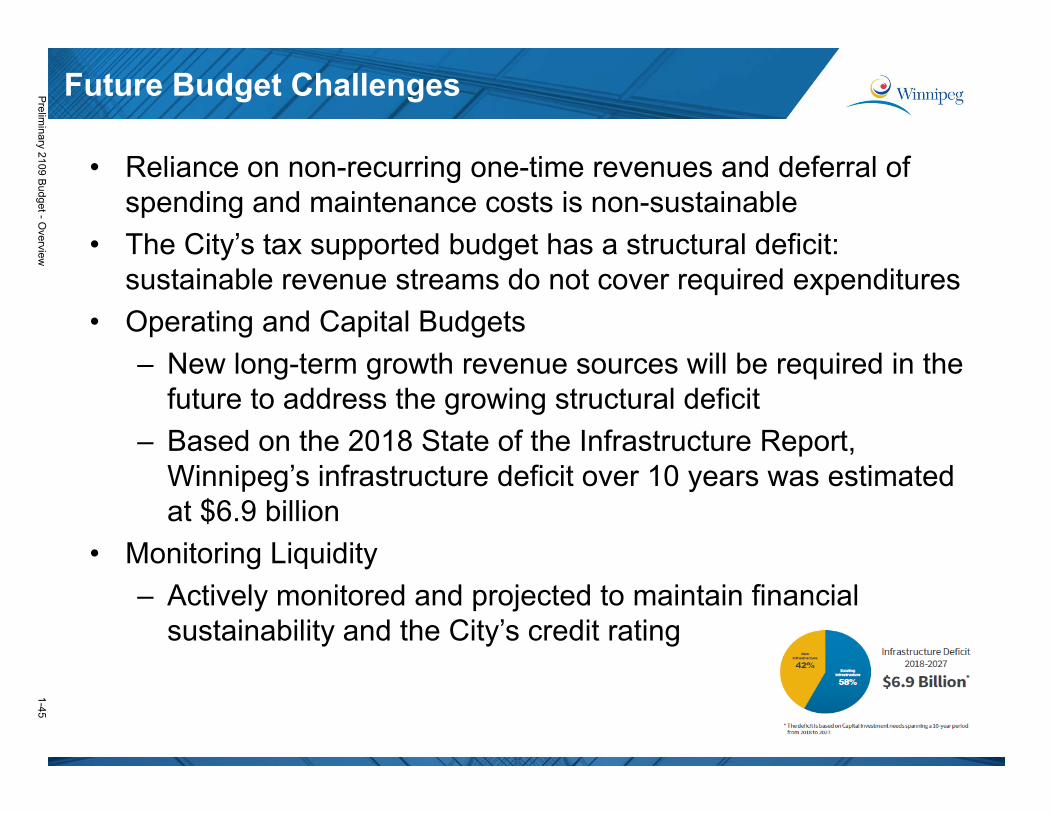
Future Budget Challenges
• Reliance on non-recurring one-time revenues and deferral of spending and maintenance costs is non-sustainable
• The City’s tax supported budget has a structural deficit: sustainable revenue streams do not cover required expenditures
• Operating and Capital Budgets
– New long-term growth revenue sources will be required in the future to address the growing structural deficit
– Based on the 2018 State of the Infrastructure Report, Winnipeg’s infrastructure deficit over 10 years was estimated at $6.9 billion
• Monitoring Liquidity
– Actively monitored and projected to maintain financial sustainability and the City’s credit rating
Preliminary 2109 Budget - O
verview1-45
Future Budget Challenges
Over the past several years, the City has prepared Volume 1 – “Community Trends and Performance Report”. Included in Appendix 1 of the report is a Financial Trends section setting out details concerning the City’s structural deficit which has been described as financially unsustainable. The City has been contributing cash from its operating budget to the capital budget for many years which at times has averaged over $60 million. This cash has been used to pay for capital projects which otherwise would require debt financing or further support from federal and provincial partners. However the City reduced its contribution to the capital budget by $23.2 million ($78.8 million to $55.6 million) commencing in 2017, $57 million ($80.3 million to $23.3 million) in 2018 and $44.9 million ($65.9 million to $21.0 million) in 2019. In 2020 onwards cash to capital planned contributions remain at values over $60 million even though the City’s contribution levels have fallen to $21 million. In turn Volume 2 Appendix 1 reflects higher value cash to capital contributions leading to growing structural deficits of $105.4 million in 2020 and $131.9 million in 2021. If the City is unable to contribute cash to capital in excess of $60 million in 2020 onwards, it will need to consider increased debt to maintain the capital program at its planned levels included in this budget book, significantly reduce the capital program, reduce expenses or increase revenues.
On June 21, 2018, Council approved a report directing the Public Service to initiate a process to implement a multi-year budget approach effective for the 2020 budget year, with a particular focus on addressing the structural deficit in tax-supported City operations. Significant financial decisions will need to be considered to balance future operating budgets with a view to maintaining levels of service both in tax-supported operations and capital.
Financial Sustainability
1-46Prelim
inary 2109 Budget - Overview

Future Budget Challenges
• 4-year balanced operating budget (2020 to 2023) and 6-year capital program
• Next steps:
– Review of core services
– Corporate business and strategic plan
– Evaluation framework for grants (cash and in-kind)
– Review of fees and charges based on best practices
– Prioritization list for unfunded major capital projects
– Growth oriented revenue source
Multi-year Budget
Preliminary 2109 Budget - O
verview1-47
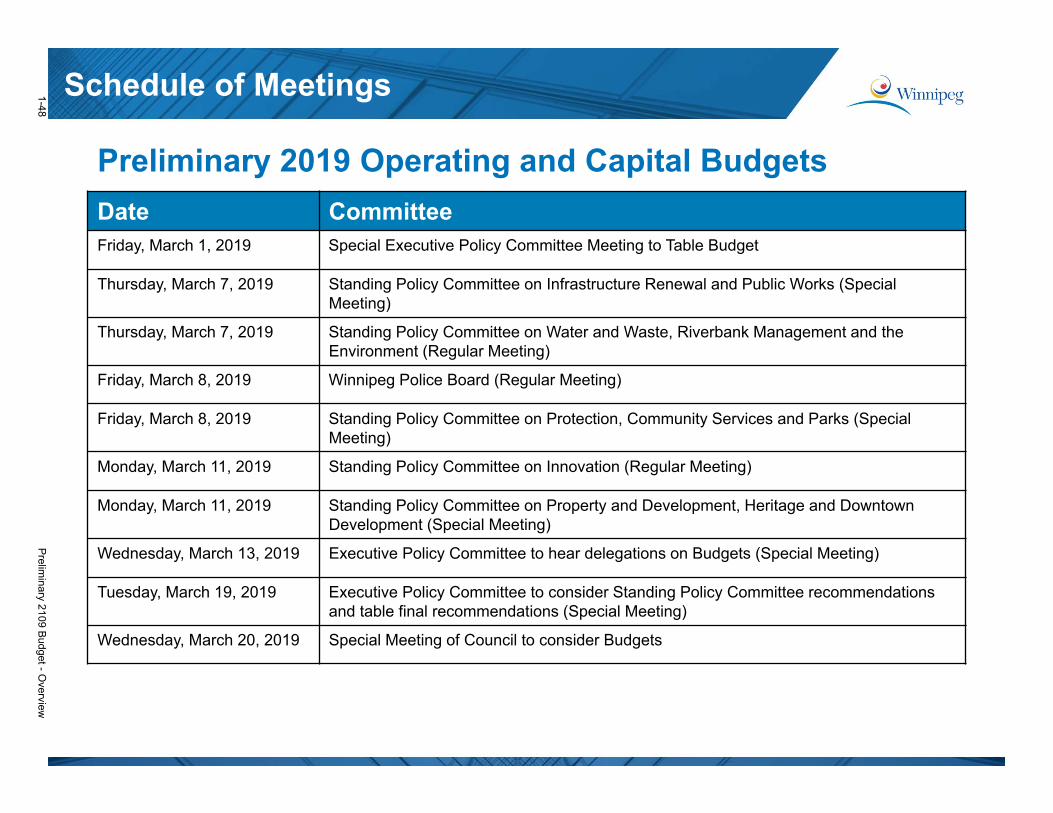
Preliminary 2019 Operating and Capital Budgets
Schedule of Meetings
Date CommitteeFriday, March 1, 2019 Special Executive Policy Committee Meeting to Table Budget
Thursday, March 7, 2019 Standing Policy Committee on Infrastructure Renewal and Public Works (Special Meeting)
Thursday, March 7, 2019 Standing Policy Committee on Water and Waste, Riverbank Management and the Environment (Regular Meeting)
Friday, March 8, 2019 Winnipeg Police Board (Regular Meeting)
Friday, March 8, 2019 Standing Policy Committee on Protection, Community Services and Parks (Special Meeting)
Monday, March 11, 2019 Standing Policy Committee on Innovation (Regular Meeting)
Monday, March 11, 2019 Standing Policy Committee on Property and Development, Heritage and Downtown Development (Special Meeting)
Wednesday, March 13, 2019 Executive Policy Committee to hear delegations on Budgets (Special Meeting)
Tuesday, March 19, 2019 Executive Policy Committee to consider Standing Policy Committee recommendations and table final recommendations (Special Meeting)
Wednesday, March 20, 2019 Special Meeting of Council to consider Budgets
1-48Prelim
inary 2109 Budget - Overview
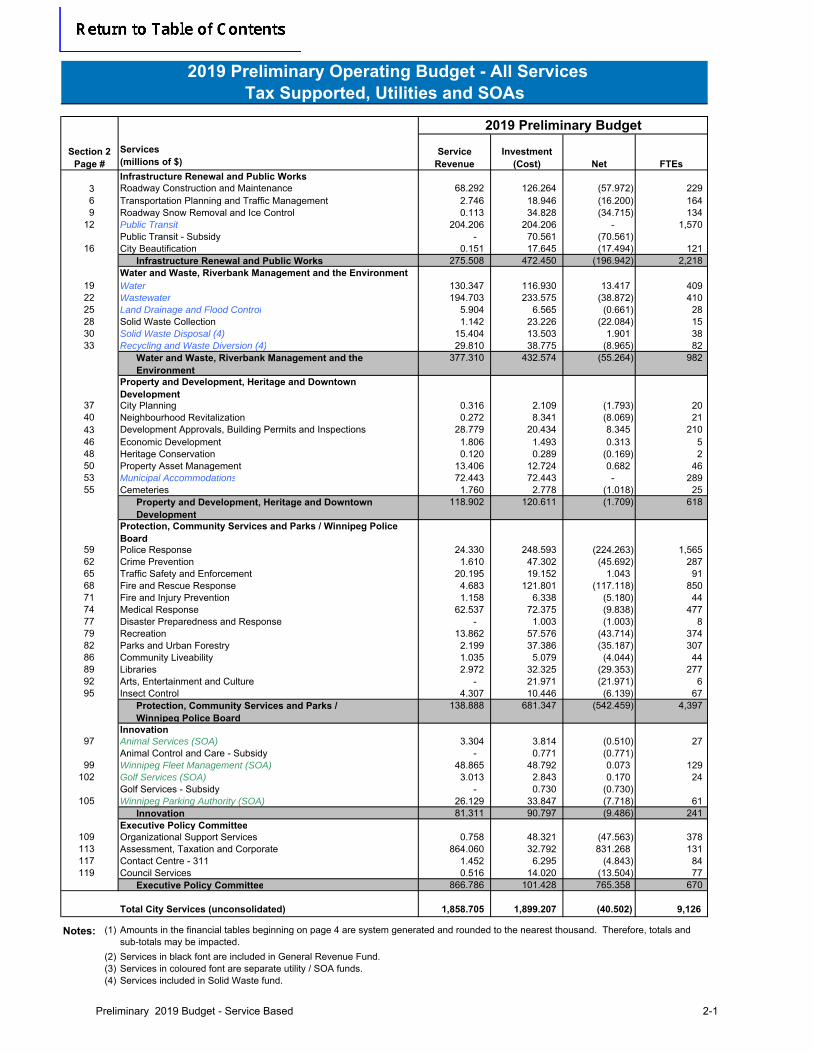
ServiceRevenue
Investment(Cost) Net FTEs
Infrastructure Renewal and Public Works3 Roadway Construction and Maintenance 68.292 126.264 (57.972) 229 6 Transportation Planning and Traffic Management 2.746 18.946 (16.200) 164 9 Roadway Snow Removal and Ice Control 0.113 34.828 (34.715) 134
12 Public Transit 204.206 204.206 - 1,570 Public Transit - Subsidy - 70.561 (70.561)
16 City Beautification 0.151 17.645 (17.494) 121 Infrastructure Renewal and Public Works 275.508 472.450 (196.942) 2,218
Water and Waste, Riverbank Management and the Environment19 Water 130.347 116.930 13.417 409 22 Wastewater 194.703 233.575 (38.872) 410 25 Land Drainage and Flood Control 5.904 6.565 (0.661) 28 28 Solid Waste Collection 1.142 23.226 (22.084) 15 30 Solid Waste Disposal (4) 15.404 13.503 1.901 38 33 Recycling and Waste Diversion (4) 29.810 38.775 (8.965) 82
Water and Waste, Riverbank Management and the Environment
377.310 432.574 (55.264) 982
Property and Development, Heritage and Downtown Development
37 City Planning 0.316 2.109 (1.793) 20 40 Neighbourhood Revitalization 0.272 8.341 (8.069) 21 43 Development Approvals, Building Permits and Inspections 28.779 20.434 8.345 210 46 Economic Development 1.806 1.493 0.313 5 48 Heritage Conservation 0.120 0.289 (0.169) 2 50 Property Asset Management 13.406 12.724 0.682 46 53 Municipal Accommodations 72.443 72.443 - 289 55 Cemeteries 1.760 2.778 (1.018) 25
Property and Development, Heritage and Downtown Development
118.902 120.611 (1.709) 618
Protection, Community Services and Parks / Winnipeg Police Board
59 Police Response 24.330 248.593 (224.263) 1,565 62 Crime Prevention 1.610 47.302 (45.692) 287 65 Traffic Safety and Enforcement 20.195 19.152 1.043 91 68 Fire and Rescue Response 4.683 121.801 (117.118) 850 71 Fire and Injury Prevention 1.158 6.338 (5.180) 44 74 Medical Response 62.537 72.375 (9.838) 477 77 Disaster Preparedness and Response - 1.003 (1.003) 8 79 Recreation 13.862 57.576 (43.714) 374 82 Parks and Urban Forestry 2.199 37.386 (35.187) 307 86 Community Liveability 1.035 5.079 (4.044) 44 89 Libraries 2.972 32.325 (29.353) 277 92 Arts, Entertainment and Culture - 21.971 (21.971) 6 95 Insect Control 4.307 10.446 (6.139) 67
Protection, Community Services and Parks / Winnipeg Police Board
138.888 681.347 (542.459) 4,397
Innovation97 Animal Services (SOA) 3.304 3.814 (0.510) 27
Animal Control and Care - Subsidy - 0.771 (0.771) 99 Winnipeg Fleet Management (SOA) 48.865 48.792 0.073 129
102 Golf Services (SOA) 3.013 2.843 0.170 24 Golf Services - Subsidy - 0.730 (0.730)
105 Winnipeg Parking Authority (SOA) 26.129 33.847 (7.718) 61 Innovation 81.311 90.797 (9.486) 241
Executive Policy Committee109 Organizational Support Services 0.758 48.321 (47.563) 378 113 Assessment, Taxation and Corporate 864.060 32.792 831.268 131 117 Contact Centre - 311 1.452 6.295 (4.843) 84 119 Council Services 0.516 14.020 (13.504) 77
Executive Policy Committee 866.786 101.428 765.358 670
Total City Services (unconsolidated) 1,858.705 1,899.207 (40.502) 9,126
Notes: (1)
(2) Services in black font are included in General Revenue Fund.(3) Services in coloured font are separate utility / SOA funds.(4) Services included in Solid Waste fund.
Amounts in the financial tables beginning on page 4 are system generated and rounded to the nearest thousand. Therefore, totals and sub-totals may be impacted.
Services(millions of $)
2019 Preliminary Budget
2019 Preliminary Operating Budget - All ServicesTax Supported, Utilities and SOAs
Section 2Page #
Preliminary 2019 Budget - Service Based 2-1
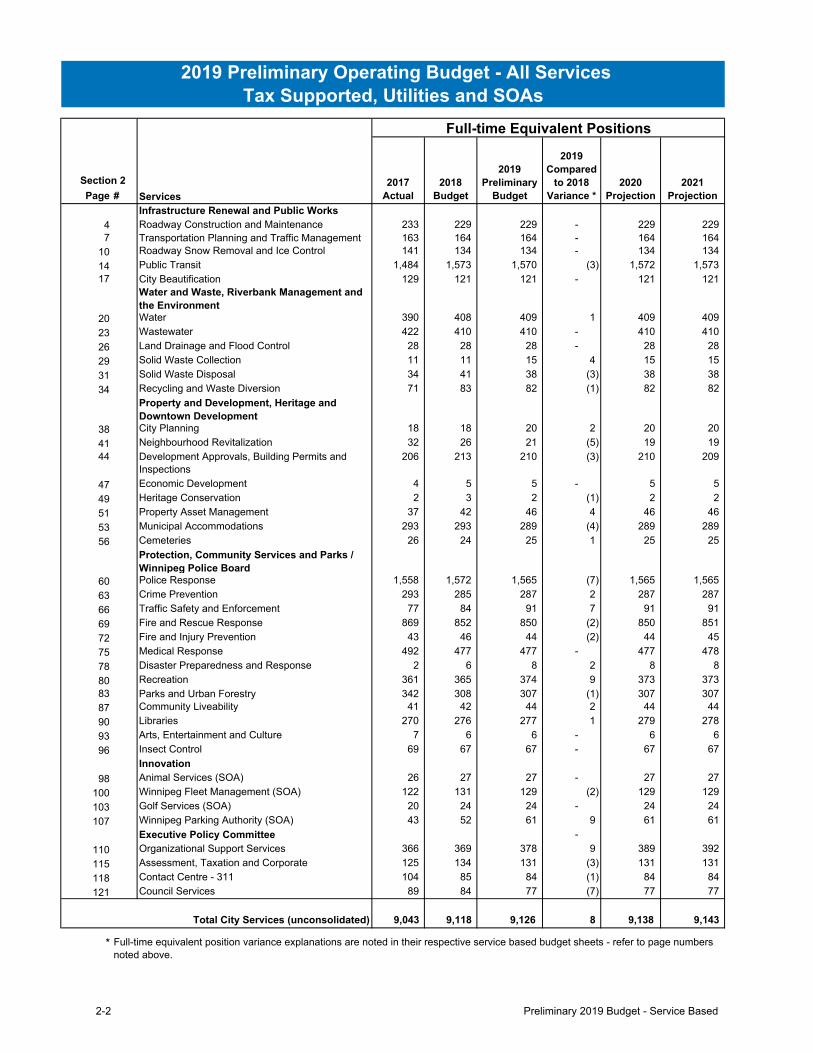
Page #2017
Actual2018
Budget
2019 Preliminary
Budget
2019 Compared
to 2018 Variance *
2020 Projection
2021 Projection
Infrastructure Renewal and Public Works
4 Roadway Construction and Maintenance 233 229 229 - 229 229 7 Transportation Planning and Traffic Management 163 164 164 - 164 164
10 Roadway Snow Removal and Ice Control 141 134 134 - 134 134
14 Public Transit 1,484 1,573 1,570 (3) 1,572 1,573 17 City Beautification 129 121 121 - 121 121
Water and Waste, Riverbank Management and the Environment
20 Water 390 408 409 1 409 409
23 Wastewater 422 410 410 - 410 410
26 Land Drainage and Flood Control 28 28 28 - 28 28
29 Solid Waste Collection 11 11 15 4 15 15
31 Solid Waste Disposal 34 41 38 (3) 38 38
34 Recycling and Waste Diversion 71 83 82 (1) 82 82
Property and Development, Heritage and Downtown Development
38 City Planning 18 18 20 2 20 20
41 Neighbourhood Revitalization 32 26 21 (5) 19 19 44 Development Approvals, Building Permits and
Inspections206 213 210 (3) 210 209
47 Economic Development 4 5 5 - 5 5
49 Heritage Conservation 2 3 2 (1) 2 2
51 Property Asset Management 37 42 46 4 46 46
53 Municipal Accommodations 293 293 289 (4) 289 289
56 Cemeteries 26 24 25 1 25 25
Protection, Community Services and Parks / Winnipeg Police Board
60 Police Response 1,558 1,572 1,565 (7) 1,565 1,565
63 Crime Prevention 293 285 287 2 287 287
66 Traffic Safety and Enforcement 77 84 91 7 91 91
69 Fire and Rescue Response 869 852 850 (2) 850 851
72 Fire and Injury Prevention 43 46 44 (2) 44 45
75 Medical Response 492 477 477 - 477 478
78 Disaster Preparedness and Response 2 6 8 2 8 8
80 Recreation 361 365 374 9 373 373 83 Parks and Urban Forestry 342 308 307 (1) 307 307 87 Community Liveability 41 42 44 2 44 44
90 Libraries 270 276 277 1 279 278
93 Arts, Entertainment and Culture 7 6 6 - 6 6
96 Insect Control 69 67 67 - 67 67
Innovation
98 Animal Services (SOA) 26 27 27 - 27 27
100 Winnipeg Fleet Management (SOA) 122 131 129 (2) 129 129
103 Golf Services (SOA) 20 24 24 - 24 24
107 Winnipeg Parking Authority (SOA) 43 52 61 9 61 61
Executive Policy Committee -
110 Organizational Support Services 366 369 378 9 389 392
115 Assessment, Taxation and Corporate 125 134 131 (3) 131 131
118 Contact Centre - 311 104 85 84 (1) 84 84
121 Council Services 89 84 77 (7) 77 77
Total City Services (unconsolidated) 9,043 9,118 9,126 8 9,138 9,143
*
Services
Full-time Equivalent Positions
Full-time equivalent position variance explanations are noted in their respective service based budget sheets - refer to page numbers noted above.
2019 Preliminary Operating Budget - All ServicesTax Supported, Utilities and SOAs
2-2 Preliminary 2019 Budget - Service Based
Section 2
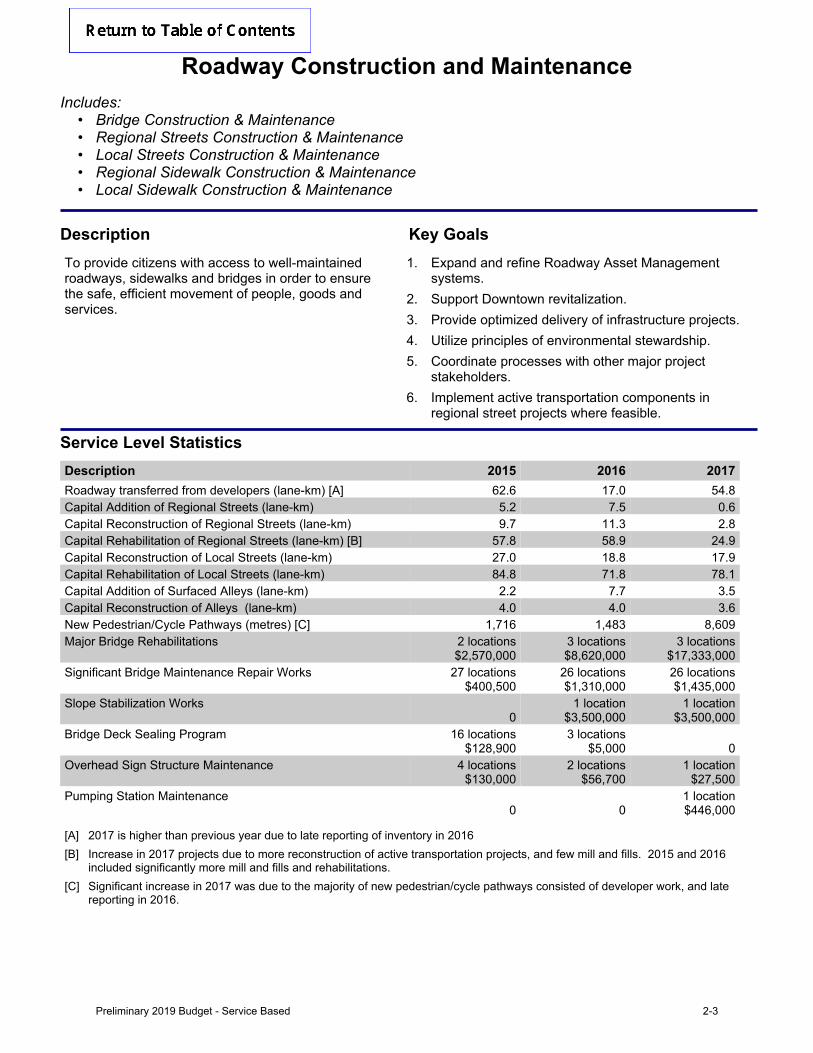
Roadway Construction and MaintenanceIncludes:
• Bridge Construction & Maintenance• Regional Streets Construction & Maintenance• Local Streets Construction & Maintenance• Regional Sidewalk Construction & Maintenance• Local Sidewalk Construction & Maintenance
Description Key GoalsTo provide citizens with access to well-maintained roadways, sidewalks and bridges in order to ensure the safe, efficient movement of people, goods and services.
1. Expand and refine Roadway Asset Management systems.
2. Support Downtown revitalization.3. Provide optimized delivery of infrastructure projects.4. Utilize principles of environmental stewardship.5. Coordinate processes with other major project
stakeholders.6. Implement active transportation components in
regional street projects where feasible.
Service Level Statistics Description 2015 2016 2017Roadway transferred from developers (lane-km) [A] 62.6 17.0 54.8Capital Addition of Regional Streets (lane-km) 5.2 7.5 0.6Capital Reconstruction of Regional Streets (lane-km) 9.7 11.3 2.8Capital Rehabilitation of Regional Streets (lane-km) [B] 57.8 58.9 24.9Capital Reconstruction of Local Streets (lane-km) 27.0 18.8 17.9Capital Rehabilitation of Local Streets (lane-km) 84.8 71.8 78.1Capital Addition of Surfaced Alleys (lane-km) 2.2 7.7 3.5Capital Reconstruction of Alleys (lane-km) 4.0 4.0 3.6New Pedestrian/Cycle Pathways (metres) [C] 1,716 1,483 8,609Major Bridge Rehabilitations 2 locations
$2,570,0003 locations $8,620,000
3 locations $17,333,000
Significant Bridge Maintenance Repair Works 27 locations $400,500
26 locations $1,310,000
26 locations $1,435,000
Slope Stabilization Works 0
1 location $3,500,000
1 location $3,500,000
Bridge Deck Sealing Program 16 locations $128,900
3 locations $5,000 0
Overhead Sign Structure Maintenance 4 locations $130,000
2 locations $56,700
1 location $27,500
Pumping Station Maintenance0 0
1 location $446,000
[A] 2017 is higher than previous year due to late reporting of inventory in 2016[B] Increase in 2017 projects due to more reconstruction of active transportation projects, and few mill and fills. 2015 and 2016
included significantly more mill and fills and rehabilitations.[C] Significant increase in 2017 was due to the majority of new pedestrian/cycle pathways consisted of developer work, and late
reporting in 2016.
Preliminary 2019 Budget - Service Based 2-3
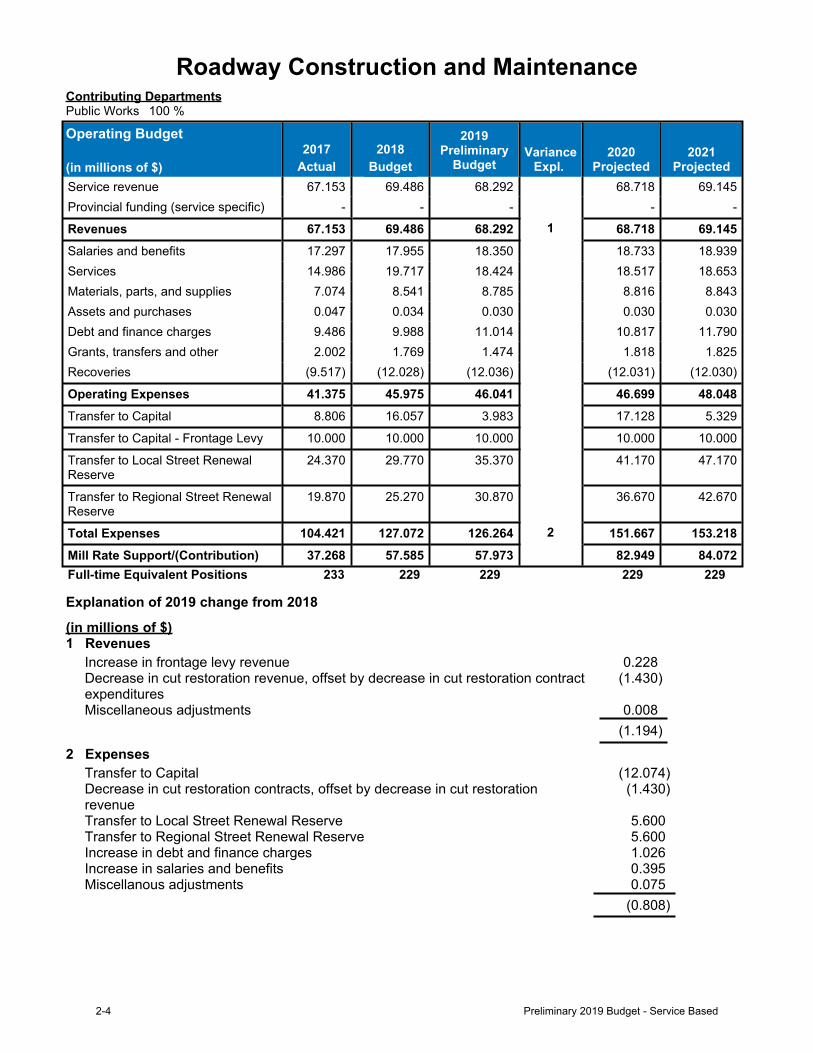
Roadway Construction and MaintenanceContributing DepartmentsPublic Works 100 %
Operating Budget
(in millions of $)2017
Actual2018
Budget
2019Preliminary
BudgetVariance
Expl. 2020
Projected2021
ProjectedService revenue 67.153 69.486 68.292 68.718 69.145Provincial funding (service specific) - - - - -
Revenues 67.153 69.486 68.292 1 68.718 69.145Salaries and benefits 17.297 17.955 18.350 18.733 18.939Services 14.986 19.717 18.424 18.517 18.653Materials, parts, and supplies 7.074 8.541 8.785 8.816 8.843Assets and purchases 0.047 0.034 0.030 0.030 0.030Debt and finance charges 9.486 9.988 11.014 10.817 11.790Grants, transfers and other 2.002 1.769 1.474 1.818 1.825Recoveries (9.517) (12.028) (12.036) (12.031) (12.030)
Operating Expenses 41.375 45.975 46.041 46.699 48.048Transfer to Capital 8.806 16.057 3.983 17.128 5.329
Transfer to Capital - Frontage Levy 10.000 10.000 10.000 10.000 10.000
Transfer to Local Street Renewal Reserve
24.370 29.770 35.370 41.170 47.170
Transfer to Regional Street Renewal Reserve
19.870 25.270 30.870 36.670 42.670
Total Expenses 104.421 127.072 126.264 2 151.667 153.218Mill Rate Support/(Contribution) 37.268 57.585 57.973 82.949 84.072Full-time Equivalent Positions 233 229 229 229 229
Explanation of 2019 change from 2018
(in millions of $)1 Revenues
Increase in frontage levy revenue 0.228Decrease in cut restoration revenue, offset by decrease in cut restoration contract expenditures
(1.430)
Miscellaneous adjustments 0.008(1.194)
2 ExpensesTransfer to Capital (12.074)Decrease in cut restoration contracts, offset by decrease in cut restoration revenue
(1.430)
Transfer to Local Street Renewal Reserve 5.600Transfer to Regional Street Renewal Reserve 5.600Increase in debt and finance charges 1.026Increase in salaries and benefits 0.395Miscellanous adjustments 0.075
(0.808)
2-4 Preliminary 2019 Budget - Service Based
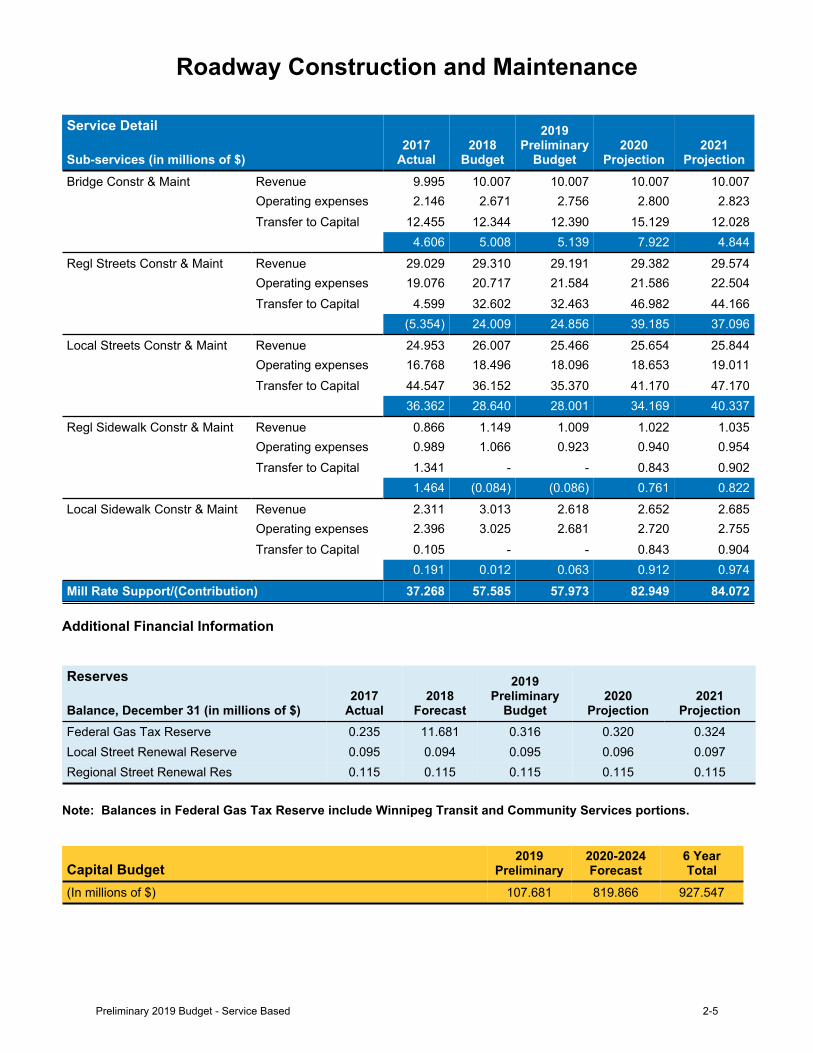
Roadway Construction and Maintenance
Service Detail
Sub-services (in millions of $)2017
Actual2018
Budget
2019Preliminary
Budget2020
Projection2021
ProjectionBridge Constr & Maint Revenue 9.995 10.007 10.007 10.007 10.007
Operating expenses 2.146 2.671 2.756 2.800 2.823Transfer to Capital 12.455 12.344 12.390 15.129 12.028
4.606 5.008 5.139 7.922 4.844Regl Streets Constr & Maint Revenue 29.029 29.310 29.191 29.382 29.574
Operating expenses 19.076 20.717 21.584 21.586 22.504Transfer to Capital 4.599 32.602 32.463 46.982 44.166
(5.354) 24.009 24.856 39.185 37.096Local Streets Constr & Maint Revenue 24.953 26.007 25.466 25.654 25.844
Operating expenses 16.768 18.496 18.096 18.653 19.011Transfer to Capital 44.547 36.152 35.370 41.170 47.170
36.362 28.640 28.001 34.169 40.337Regl Sidewalk Constr & Maint Revenue 0.866 1.149 1.009 1.022 1.035
Operating expenses 0.989 1.066 0.923 0.940 0.954Transfer to Capital 1.341 - - 0.843 0.902
1.464 (0.084) (0.086) 0.761 0.822Local Sidewalk Constr & Maint Revenue 2.311 3.013 2.618 2.652 2.685
Operating expenses 2.396 3.025 2.681 2.720 2.755Transfer to Capital 0.105 - - 0.843 0.904
0.191 0.012 0.063 0.912 0.974Mill Rate Support/(Contribution) 37.268 57.585 57.973 82.949 84.072
Additional Financial Information
Reserves
Balance, December 31 (in millions of $)2017
Actual2018
Forecast
2019Preliminary
Budget2020
Projection2021
ProjectionFederal Gas Tax Reserve 0.235 11.681 0.316 0.320 0.324Local Street Renewal Reserve 0.095 0.094 0.095 0.096 0.097Regional Street Renewal Res 0.115 0.115 0.115 0.115 0.115
Note: Balances in Federal Gas Tax Reserve include Winnipeg Transit and Community Services portions.
Capital Budget2019
Preliminary2020-2024Forecast
6 YearTotal
(In millions of $) 107.681 819.866 927.547
Preliminary 2019 Budget - Service Based 2-5
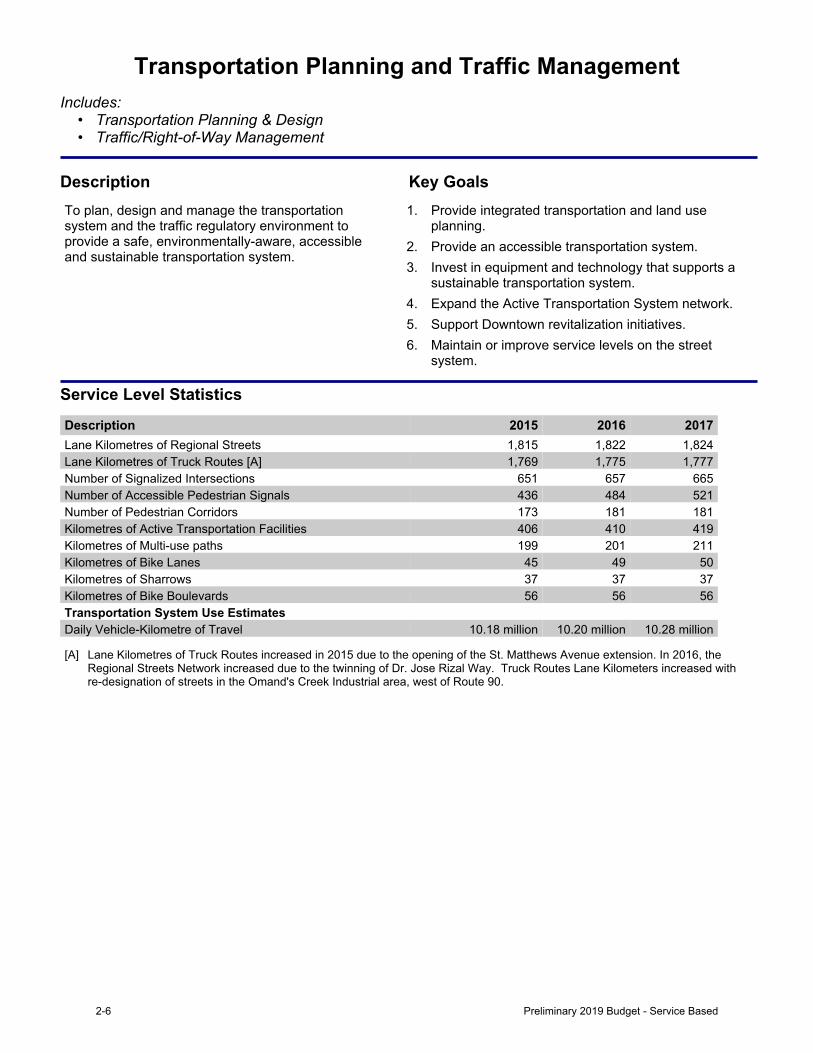
Transportation Planning and Traffic ManagementIncludes:
• Transportation Planning & Design• Traffic/Right-of-Way Management
Description Key GoalsTo plan, design and manage the transportation system and the traffic regulatory environment to provide a safe, environmentally-aware, accessible and sustainable transportation system.
1. Provide integrated transportation and land use planning.
2. Provide an accessible transportation system.3. Invest in equipment and technology that supports a
sustainable transportation system.4. Expand the Active Transportation System network.5. Support Downtown revitalization initiatives.6. Maintain or improve service levels on the street
system.
Service Level Statistics
Description 2015 2016 2017Lane Kilometres of Regional Streets 1,815 1,822 1,824Lane Kilometres of Truck Routes [A] 1,769 1,775 1,777Number of Signalized Intersections 651 657 665Number of Accessible Pedestrian Signals 436 484 521Number of Pedestrian Corridors 173 181 181Kilometres of Active Transportation Facilities 406 410 419Kilometres of Multi-use paths 199 201 211Kilometres of Bike Lanes 45 49 50Kilometres of Sharrows 37 37 37Kilometres of Bike Boulevards 56 56 56Transportation System Use Estimates Daily Vehicle-Kilometre of Travel 10.18 million 10.20 million 10.28 million
[A] Lane Kilometres of Truck Routes increased in 2015 due to the opening of the St. Matthews Avenue extension. In 2016, the Regional Streets Network increased due to the twinning of Dr. Jose Rizal Way. Truck Routes Lane Kilometers increased with re-designation of streets in the Omand's Creek Industrial area, west of Route 90.
2-6 Preliminary 2019 Budget - Service Based
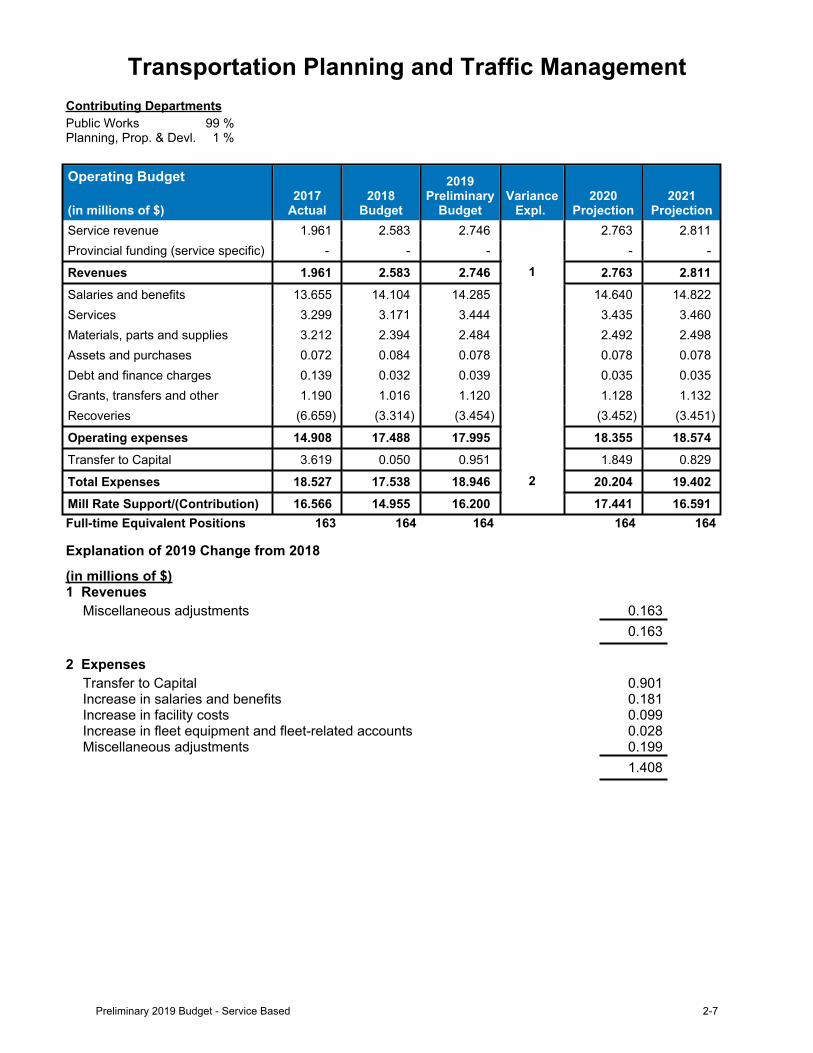
Transportation Planning and Traffic ManagementContributing DepartmentsPublic Works 99 %Planning, Prop. & Devl. 1 %
Operating Budget
(in millions of $)2017
Actual2018
Budget
2019Preliminary
BudgetVariance
Expl. 2020
Projection2021
ProjectionService revenue 1.961 2.583 2.746 2.763 2.811Provincial funding (service specific) - - - - -
Revenues 1.961 2.583 2.746 1 2.763 2.811Salaries and benefits 13.655 14.104 14.285 14.640 14.822Services 3.299 3.171 3.444 3.435 3.460Materials, parts and supplies 3.212 2.394 2.484 2.492 2.498Assets and purchases 0.072 0.084 0.078 0.078 0.078Debt and finance charges 0.139 0.032 0.039 0.035 0.035Grants, transfers and other 1.190 1.016 1.120 1.128 1.132Recoveries (6.659) (3.314) (3.454) (3.452) (3.451)
Operating expenses 14.908 17.488 17.995 18.355 18.574Transfer to Capital 3.619 0.050 0.951 1.849 0.829
Total Expenses 18.527 17.538 18.946 2 20.204 19.402Mill Rate Support/(Contribution) 16.566 14.955 16.200 17.441 16.591Full-time Equivalent Positions 163 164 164 164 164
Explanation of 2019 Change from 2018
(in millions of $)1 Revenues
Miscellaneous adjustments 0.1630.163
2 ExpensesTransfer to Capital 0.901Increase in salaries and benefits 0.181Increase in facility costs 0.099Increase in fleet equipment and fleet-related accounts 0.028Miscellaneous adjustments 0.199
1.408
Preliminary 2019 Budget - Service Based 2-7
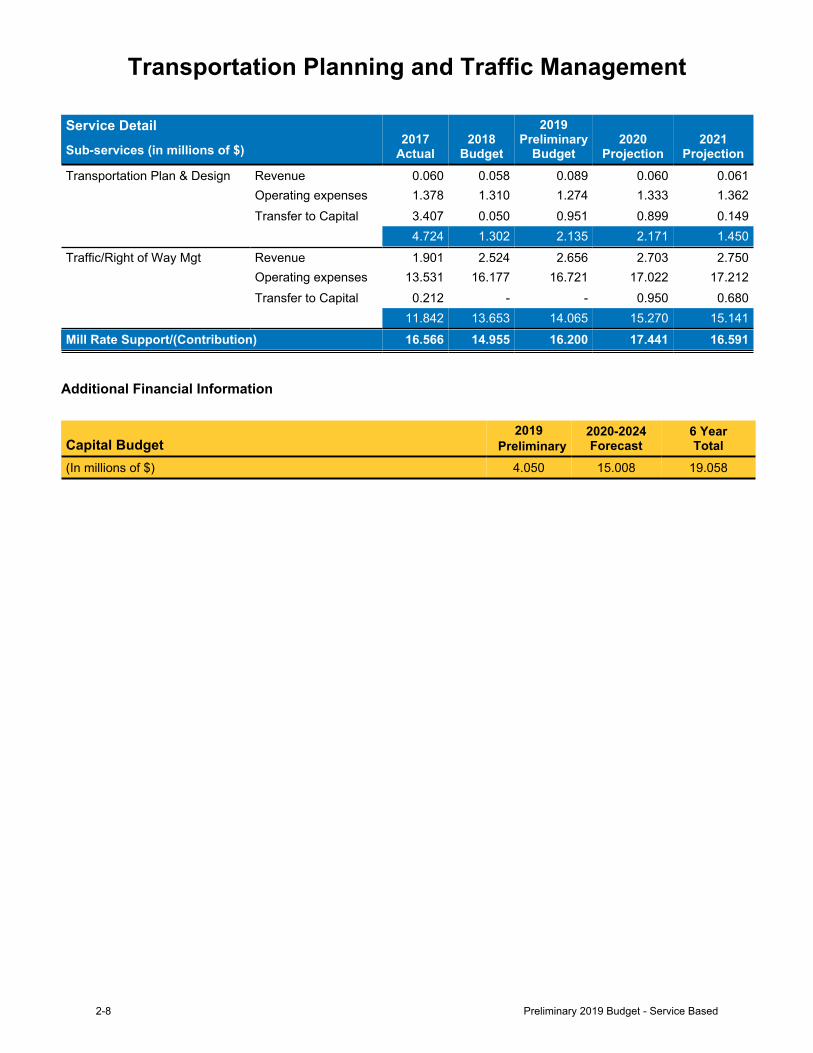
Transportation Planning and Traffic Management
Service Detail Sub-services (in millions of $)
2017 Actual
2018 Budget
2019Preliminary
Budget2020
Projection2021
ProjectionTransportation Plan & Design Revenue 0.060 0.058 0.089 0.060 0.061
Operating expenses 1.378 1.310 1.274 1.333 1.362Transfer to Capital 3.407 0.050 0.951 0.899 0.149
4.724 1.302 2.135 2.171 1.450Traffic/Right of Way Mgt Revenue 1.901 2.524 2.656 2.703 2.750
Operating expenses 13.531 16.177 16.721 17.022 17.212Transfer to Capital 0.212 - - 0.950 0.680
11.842 13.653 14.065 15.270 15.141Mill Rate Support/(Contribution) 16.566 14.955 16.200 17.441 16.591
Additional Financial Information
Capital Budget2019
Preliminary2020-2024Forecast
6 YearTotal
(In millions of $) 4.050 15.008 19.058
2-8 Preliminary 2019 Budget - Service Based
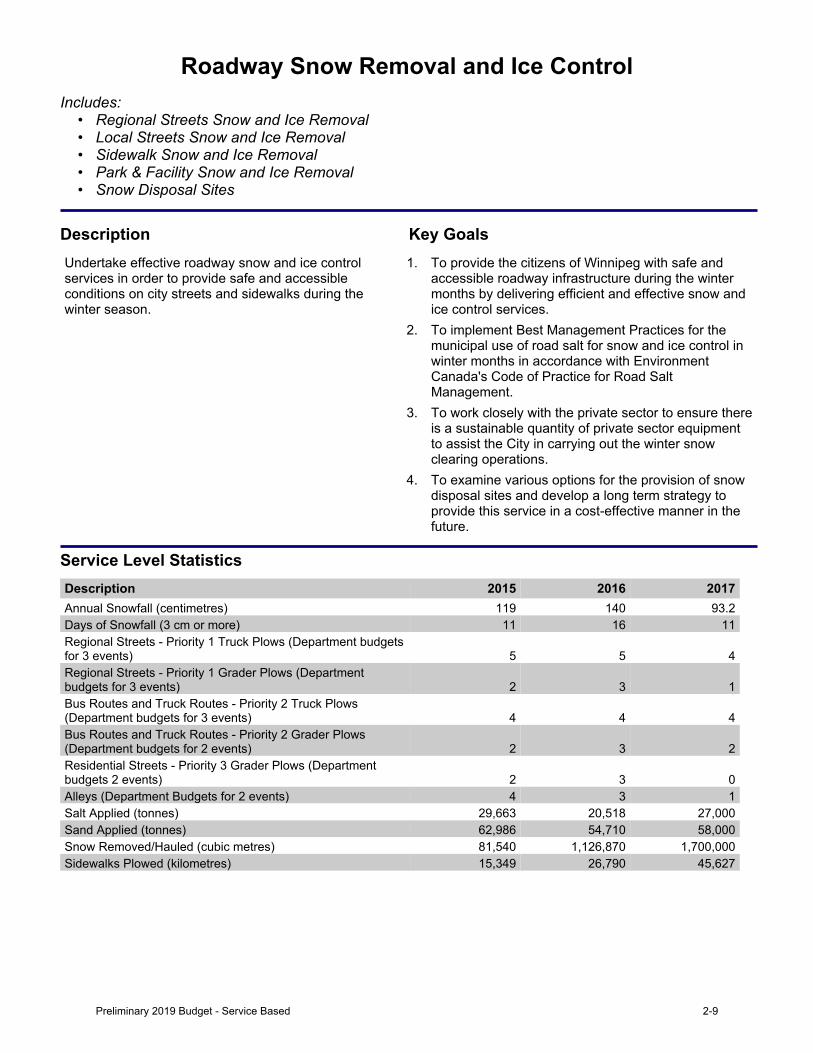
Roadway Snow Removal and Ice ControlIncludes:
• Regional Streets Snow and Ice Removal• Local Streets Snow and Ice Removal• Sidewalk Snow and Ice Removal• Park & Facility Snow and Ice Removal• Snow Disposal Sites
Description Key GoalsUndertake effective roadway snow and ice control services in order to provide safe and accessible conditions on city streets and sidewalks during the winter season.
1. To provide the citizens of Winnipeg with safe andaccessible roadway infrastructure during the wintermonths by delivering efficient and effective snow andice control services.
2. To implement Best Management Practices for themunicipal use of road salt for snow and ice control inwinter months in accordance with EnvironmentCanada's Code of Practice for Road SaltManagement.
3. To work closely with the private sector to ensure thereis a sustainable quantity of private sector equipmentto assist the City in carrying out the winter snowclearing operations.
4. To examine various options for the provision of snowdisposal sites and develop a long term strategy toprovide this service in a cost-effective manner in thefuture.
Service Level StatisticsDescription 2015 2016 2017Annual Snowfall (centimetres) 119 140 93.2Days of Snowfall (3 cm or more) 11 16 11Regional Streets - Priority 1 Truck Plows (Department budgets for 3 events) 5 5 4Regional Streets - Priority 1 Grader Plows (Department budgets for 3 events) 2 3 1Bus Routes and Truck Routes - Priority 2 Truck Plows (Department budgets for 3 events) 4 4 4Bus Routes and Truck Routes - Priority 2 Grader Plows (Department budgets for 2 events) 2 3 2Residential Streets - Priority 3 Grader Plows (Department budgets 2 events) 2 3 0Alleys (Department Budgets for 2 events) 4 3 1Salt Applied (tonnes) 29,663 20,518 27,000Sand Applied (tonnes) 62,986 54,710 58,000Snow Removed/Hauled (cubic metres) 81,540 1,126,870 1,700,000Sidewalks Plowed (kilometres) 15,349 26,790 45,627
Preliminary 2019 Budget - Service Based 2-9
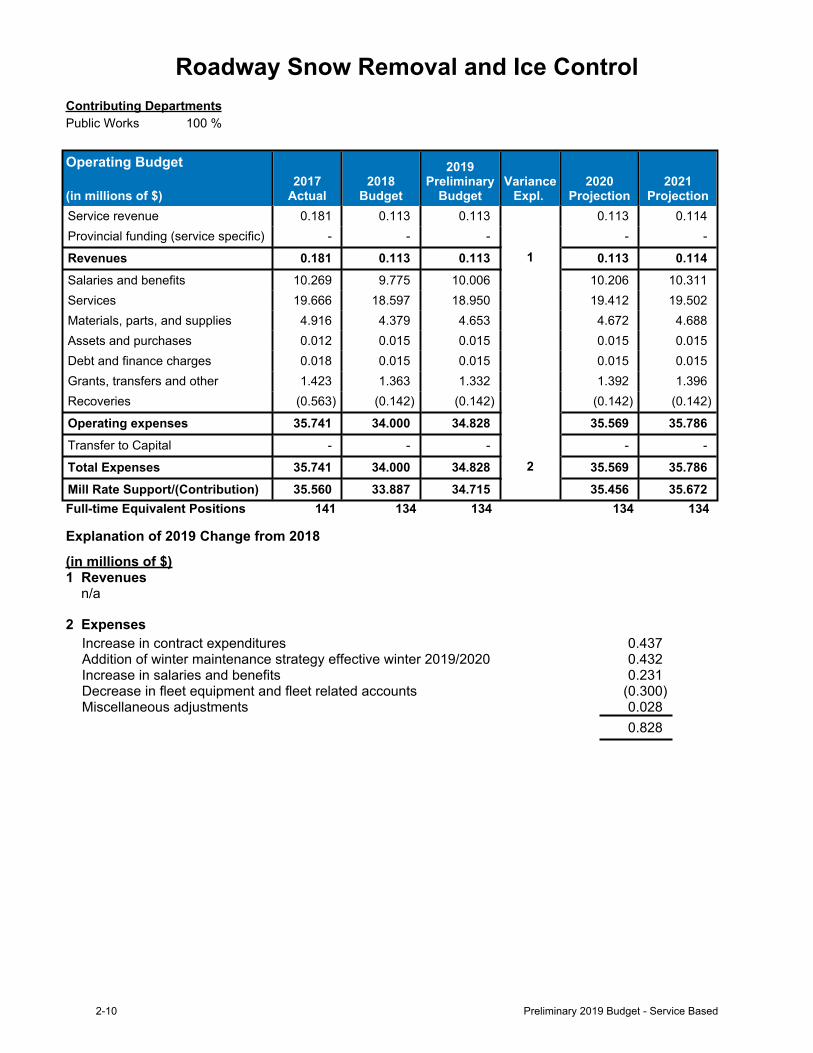
Roadway Snow Removal and Ice ControlContributing DepartmentsPublic Works 100 %
Operating Budget
(in millions of $)2017
Actual2018
Budget
2019Preliminary
BudgetVariance
Expl. 2020
Projection2021
ProjectionService revenue 0.181 0.113 0.113 0.113 0.114Provincial funding (service specific) - - - - -
Revenues 0.181 0.113 0.113 1 0.113 0.114Salaries and benefits 10.269 9.775 10.006 10.206 10.311Services 19.666 18.597 18.950 19.412 19.502Materials, parts, and supplies 4.916 4.379 4.653 4.672 4.688Assets and purchases 0.012 0.015 0.015 0.015 0.015Debt and finance charges 0.018 0.015 0.015 0.015 0.015Grants, transfers and other 1.423 1.363 1.332 1.392 1.396Recoveries (0.563) (0.142) (0.142) (0.142) (0.142)
Operating expenses 35.741 34.000 34.828 35.569 35.786Transfer to Capital - - - - -
Total Expenses 35.741 34.000 34.828 2 35.569 35.786Mill Rate Support/(Contribution) 35.560 33.887 34.715 35.456 35.672Full-time Equivalent Positions 141 134 134 134 134
Explanation of 2019 Change from 2018
(in millions of $)1 Revenues n/a
2 ExpensesIncrease in contract expenditures 0.437Addition of winter maintenance strategy effective winter 2019/2020 0.432Increase in salaries and benefits 0.231Decrease in fleet equipment and fleet related accounts (0.300)Miscellaneous adjustments 0.028
0.828
2-10 Preliminary 2019 Budget - Service Based
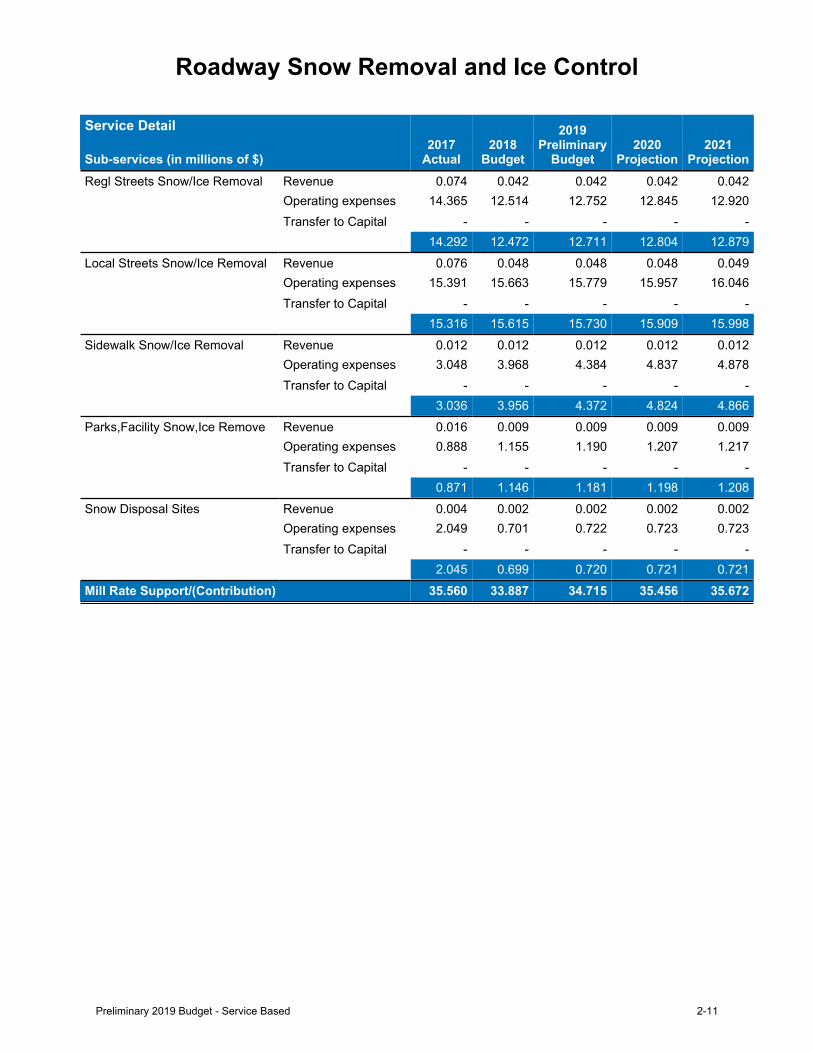
Roadway Snow Removal and Ice Control
Service Detail
Sub-services (in millions of $)2017
Actual2018
Budget
2019Preliminary
Budget2020
Projection2021
ProjectionRegl Streets Snow/Ice Removal Revenue 0.074 0.042 0.042 0.042 0.042
Operating expenses 14.365 12.514 12.752 12.845 12.920Transfer to Capital - - - - -
14.292 12.472 12.711 12.804 12.879Local Streets Snow/Ice Removal Revenue 0.076 0.048 0.048 0.048 0.049
Operating expenses 15.391 15.663 15.779 15.957 16.046Transfer to Capital - - - - -
15.316 15.615 15.730 15.909 15.998Sidewalk Snow/Ice Removal Revenue 0.012 0.012 0.012 0.012 0.012
Operating expenses 3.048 3.968 4.384 4.837 4.878Transfer to Capital - - - - -
3.036 3.956 4.372 4.824 4.866Parks,Facility Snow,Ice Remove Revenue 0.016 0.009 0.009 0.009 0.009
Operating expenses 0.888 1.155 1.190 1.207 1.217Transfer to Capital - - - - -
0.871 1.146 1.181 1.198 1.208Snow Disposal Sites Revenue 0.004 0.002 0.002 0.002 0.002
Operating expenses 2.049 0.701 0.722 0.723 0.723Transfer to Capital - - - - -
2.045 0.699 0.720 0.721 0.721Mill Rate Support/(Contribution) 35.560 33.887 34.715 35.456 35.672
Preliminary 2019 Budget - Service Based 2-11
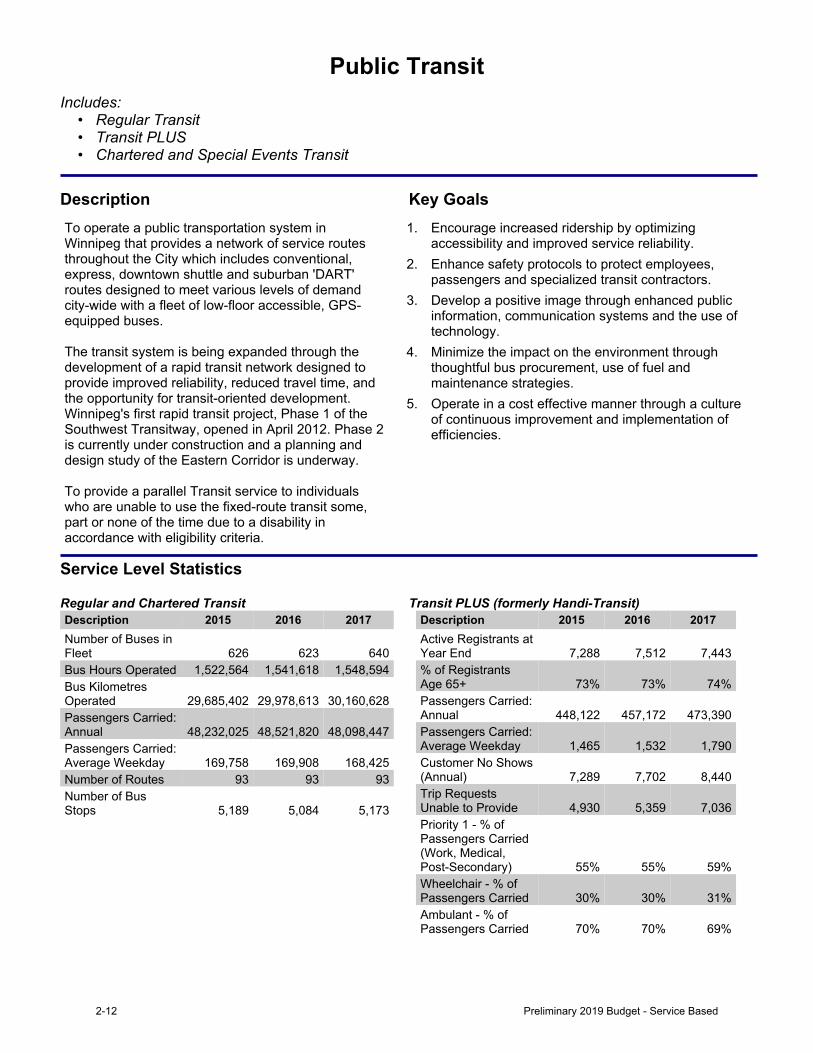
Public TransitIncludes:
• Regular Transit• Transit PLUS• Chartered and Special Events Transit
Description Key GoalsTo operate a public transportation system in Winnipeg that provides a network of service routes throughout the City which includes conventional, express, downtown shuttle and suburban 'DART' routes designed to meet various levels of demand city-wide with a fleet of low-floor accessible, GPS- equippedbuses.
The transit system is being expanded through the development of a rapid transit network designed to provide improved reliability, reduced travel time, and the opportunity for transit-oriented development. Winnipeg's first rapid transit project, Phase 1 of the Southwest Transitway, opened in April 2012. Phase 2 is currently under construction and a planning and designstudyoftheEasternCorridorisunderway.
To provide a parallel Transit service to individuals who are unable to use the fixed-route transit some, part or none of the time due to a disability in accordance with eligibility criteria.
1. Encourage increased ridership by optimizingaccessibility and improved service reliability.
2. Enhance safety protocols to protect employees,passengers and specialized transit contractors.
3. Develop a positive image through enhanced publicinformation, communication systems and the use oftechnology.
4. Minimize the impact on the environment throughthoughtful bus procurement, use of fuel andmaintenance strategies.
5. Operate in a cost effective manner through a cultureof continuous improvement and implementation ofefficiencies.
Service Level Statistics
Regular and Chartered Transit Transit PLUS (formerly Handi-Transit)Description 2015 2016 2017Number of Buses in Fleet 626 623 640Bus Hours Operated 1,522,564 1,541,618 1,548,594Bus Kilometres Operated 29,685,402 29,978,613 30,160,628Passengers Carried: Annual 48,232,025 48,521,820 48,098,447Passengers Carried: Average Weekday 169,758 169,908 168,425Number of Routes 93 93 93Number of Bus Stops 5,189 5,084 5,173
Description 2015 2016 2017Active Registrants at Year End 7,288 7,512 7,443% of Registrants Age 65+ 73% 73% 74%Passengers Carried: Annual 448,122 457,172 473,390Passengers Carried: Average Weekday 1,465 1,532 1,790Customer No Shows (Annual) 7,289 7,702 8,440Trip Requests Unable to Provide 4,930 5,359 7,036Priority 1 - % of Passengers Carried (Work, Medical, Post-Secondary) 55% 55% 59%Wheelchair - % of Passengers Carried 30% 30% 31%Ambulant - % of Passengers Carried 70% 70% 69%
2-12 Preliminary 2019 Budget - Service Based
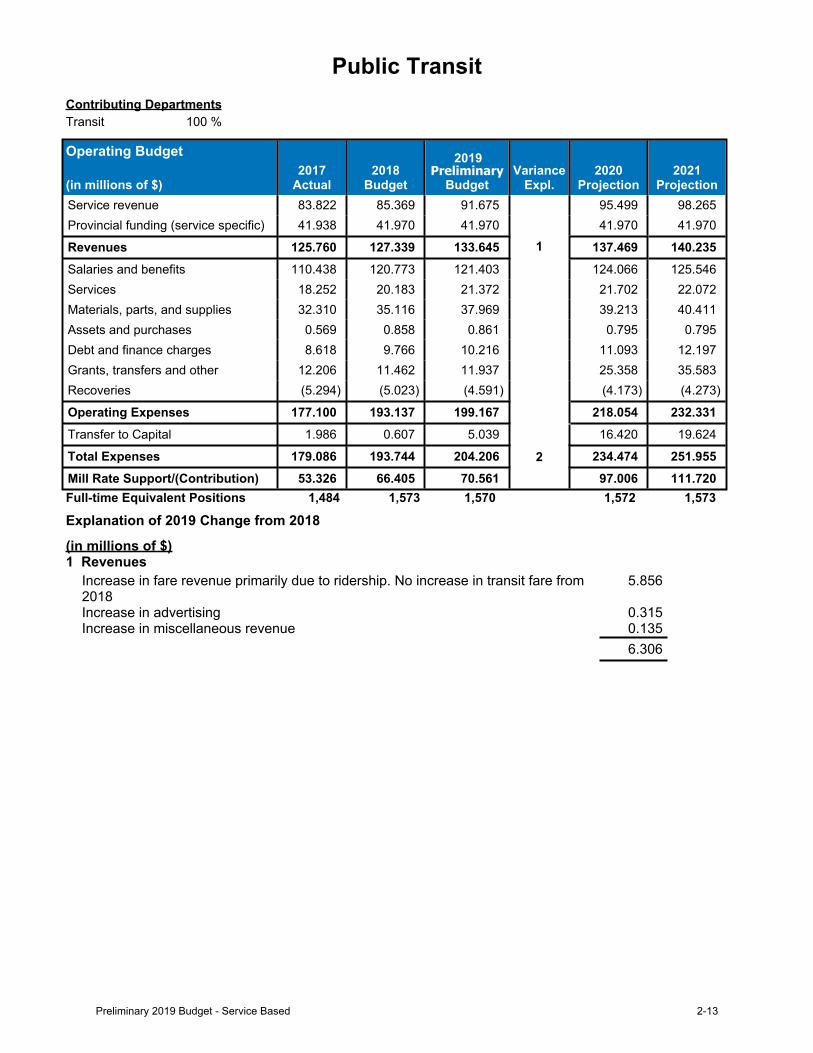
Public TransitContributing DepartmentsTransit 100 %
Operating Budget
(in millions of $)2017
Actual2018
Budget
2019Preliminary
BudgetVariance
Expl.2020
Projection2021
ProjectionService revenue 83.822 85.369 91.675 95.499 98.265Provincial funding (service specific) 41.938 41.970 41.970 41.970 41.970
Revenues 125.760 127.339 133.645 1 137.469 140.235Salaries and benefits 110.438 120.773 121.403 124.066 125.546Services 18.252 20.183 21.372 21.702 22.072Materials, parts, and supplies 32.310 35.116 37.969 39.213 40.411Assets and purchases 0.569 0.858 0.861 0.795 0.795Debt and finance charges 8.618 9.766 10.216 11.093 12.197Grants, transfers and other 12.206 11.462 11.937 25.358 35.583Recoveries (5.294) (5.023) (4.591) (4.173) (4.273)
Operating Expenses 177.100 193.137 199.167 218.054 232.331Transfer to Capital 1.986 0.607 5.039 16.420 19.624
Total Expenses 179.086 193.744 204.206 2 234.474 251.955Mill Rate Support/(Contribution) 53.326 66.405 70.561 97.006 111.720Full-time Equivalent Positions 1,484 1,573 1,570 1,572 1,573
Explanation of 2019 Change from 2018
(in millions of $)1 Revenues
Increase in fare revenue primarily due to ridership. No increase in transit fare from 2018
5.856
Increase in advertising 0.315Increase in miscellaneous revenue 0.135
6.306
Preliminary 2019 Budget - Service Based 2-13
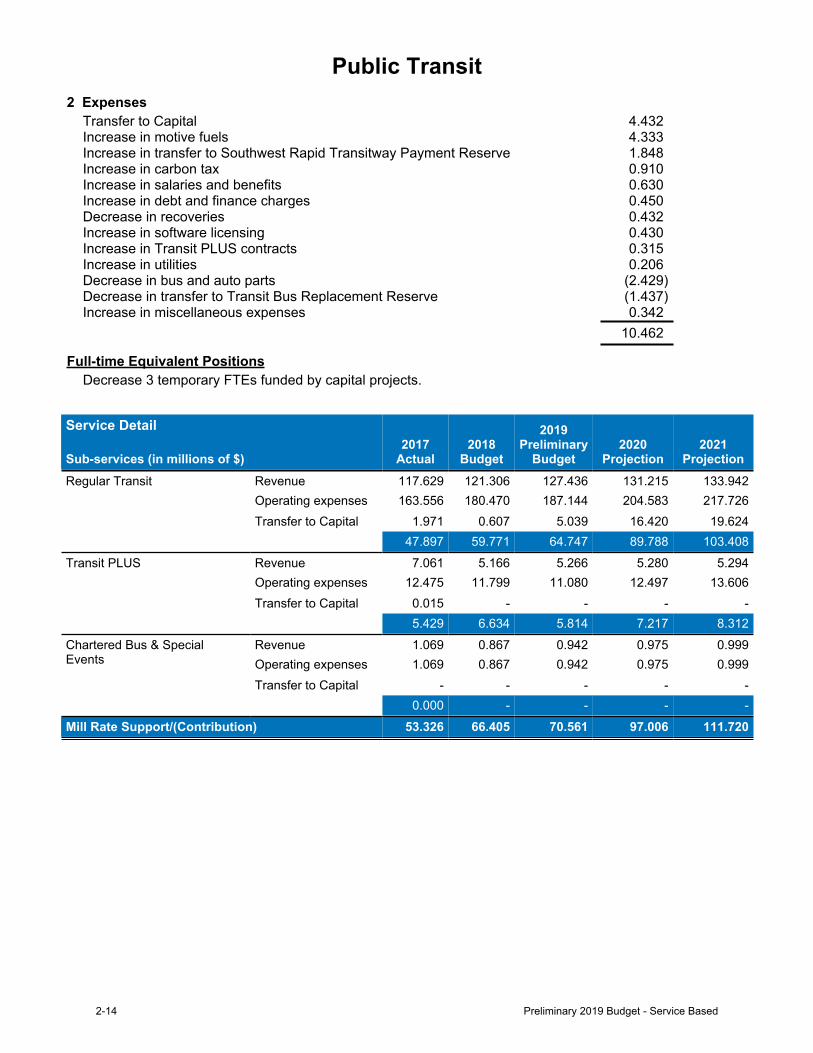
Public Transit2 Expenses
Transfer to Capital 4.432Increase in motive fuels 4.333Increase in transfer to Southwest Rapid Transitway Payment Reserve 1.848Increase in carbon tax 0.910Increase in salaries and benefits 0.630Increase in debt and finance charges 0.450Decrease in recoveries 0.432Increase in software licensing 0.430Increase in Transit PLUS contracts 0.315Increase in utilities 0.206Decrease in bus and auto parts (2.429)Decrease in transfer to Transit Bus Replacement Reserve (1.437)Increase in miscellaneous expenses 0.342
10.462
Full-time Equivalent PositionsDecrease 3 temporary FTEs funded by capital projects.
Service Detail
Sub-services (in millions of $)2017
Actual2018
Budget
2019Preliminary
Budget2020
Projection2021
ProjectionRegular Transit Revenue 117.629 121.306 127.436 131.215 133.942
Operating expenses 163.556 180.470 187.144 204.583 217.726Transfer to Capital 1.971 0.607 5.039 16.420 19.624
47.897 59.771 64.747 89.788 103.408Transit PLUS Revenue 7.061 5.166 5.266 5.280 5.294
Operating expenses 12.475 11.799 11.080 12.497 13.606Transfer to Capital 0.015 - - - -
5.429 6.634 5.814 7.217 8.312Chartered Bus & Special Events
Revenue 1.069 0.867 0.942 0.975 0.999Operating expenses 1.069 0.867 0.942 0.975 0.999Transfer to Capital - - - - -
0.000 - - - -Mill Rate Support/(Contribution) 53.326 66.405 70.561 97.006 111.720
2-14 Preliminary 2019 Budget - Service Based
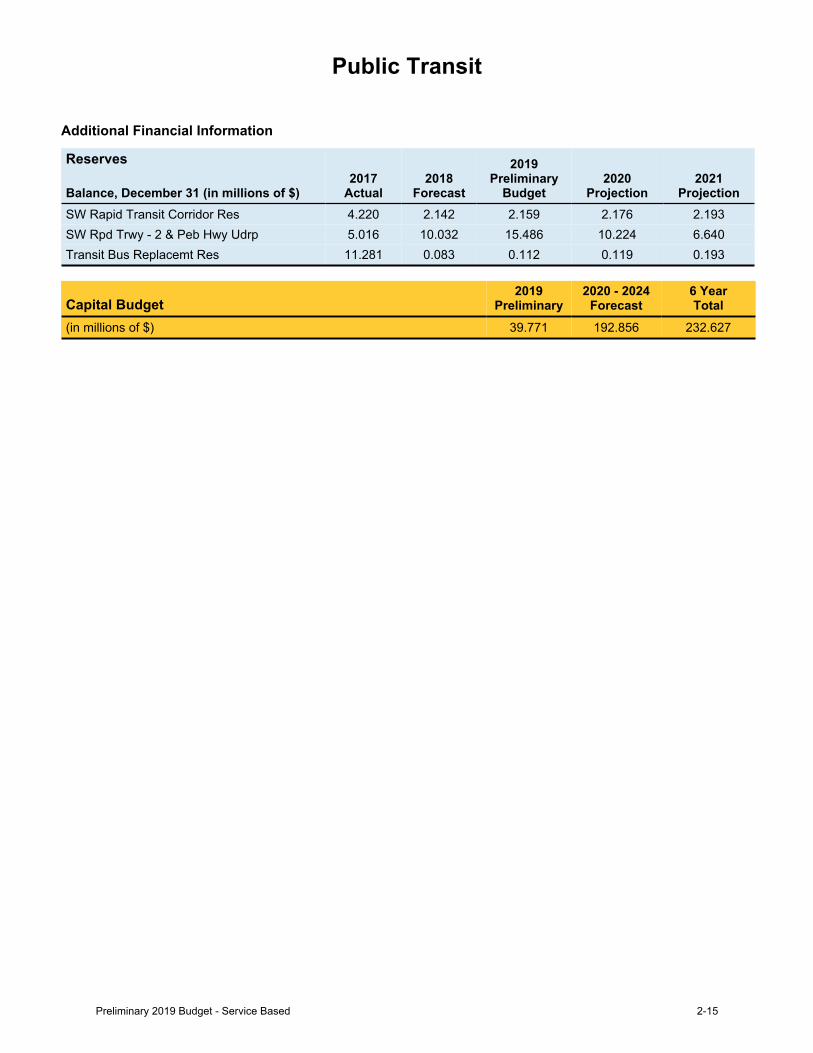
Public Transit
Additional Financial Information
Reserves
Balance, December 31 (in millions of $)2017
Actual2018
Forecast
2019Preliminary
Budget2020
Projection2021
ProjectionSW Rapid Transit Corridor Res 4.220 2.142 2.159 2.176 2.193SW Rpd Trwy - 2 & Peb Hwy Udrp 5.016 10.032 15.486 10.224 6.640Transit Bus Replacemt Res 11.281 0.083 0.112 0.119 0.193
Capital Budget2019
Preliminary2020 - 2024
Forecast6 YearTotal
(in millions of $) 39.771 192.856 232.627
Preliminary 2019 Budget - Service Based 2-15

City BeautificationIncludes:
• Litter Collection• Public Gardens / Landscaping• Ornamental Lighting / Flags & Banners / Public Art• Graffiti Control• Regional Street Cleaning• Local Street Cleaning
Description Key GoalsTo provide citizens and visitors with flower gardens, streetscaping, cleanliness, graffiti control and public art in order to promote the aesthetic appeal of the City of Winnipeg.
1. Maintain and continuously improve image route streetscaping to contribute to the beautification of our city.
2. Continue to beautify the city through enhanced floral displays, streetscaping, street cleaning and other clean and green initiatives.
3. Reduce graffiti occurrences through ongoing education and awareness while improving the level of service for graffiti removal through partnerships with volunteer community groups and maintaining a database for tracking graffiti incidents.
Service Level StatisticsDescription 2015 2016 2017Number of litter containers in park sites [A] 2,960 2,976 3,561Number of street litter containers 1,588 1,588 1,588Tonnes of boulevard abrasives removed (streets only) 24,250 22,305 29,500Flower Beds (raised/fixed/in-ground - not including shrubs) m2 [A] [B]
26,658 21,291 23,442
Number of Flower planters [A] [C] 1,604 m2 1,202 1,257Number of Hanging baskets [A] [C] 10 m2 20 20Number of park lighting units [A] 3,828 3,601 3,588Number of community clean-up & Adopt-A-Park projects 28 40 43Number of graffiti tags removed 17,531 21,859 17,374Square metres of graffiti removed 44,314 45,589 38,331Number of graffiti sites treated 7,347 7,222 5,577Number of public art projects completed [D] 4 6 5
[A] Source: 2016 and 2017 Parks and Open Spaces Asset Management (audited data). Inventory excludes Assiniboine Park.[B] In 2015, flower beds were reported separately as raised/fixed and in-ground.[C] 2015 was reported in square metres.[D] Source: Winnipeg Arts Council.
2-16 Preliminary 2019 Budget - Service Based
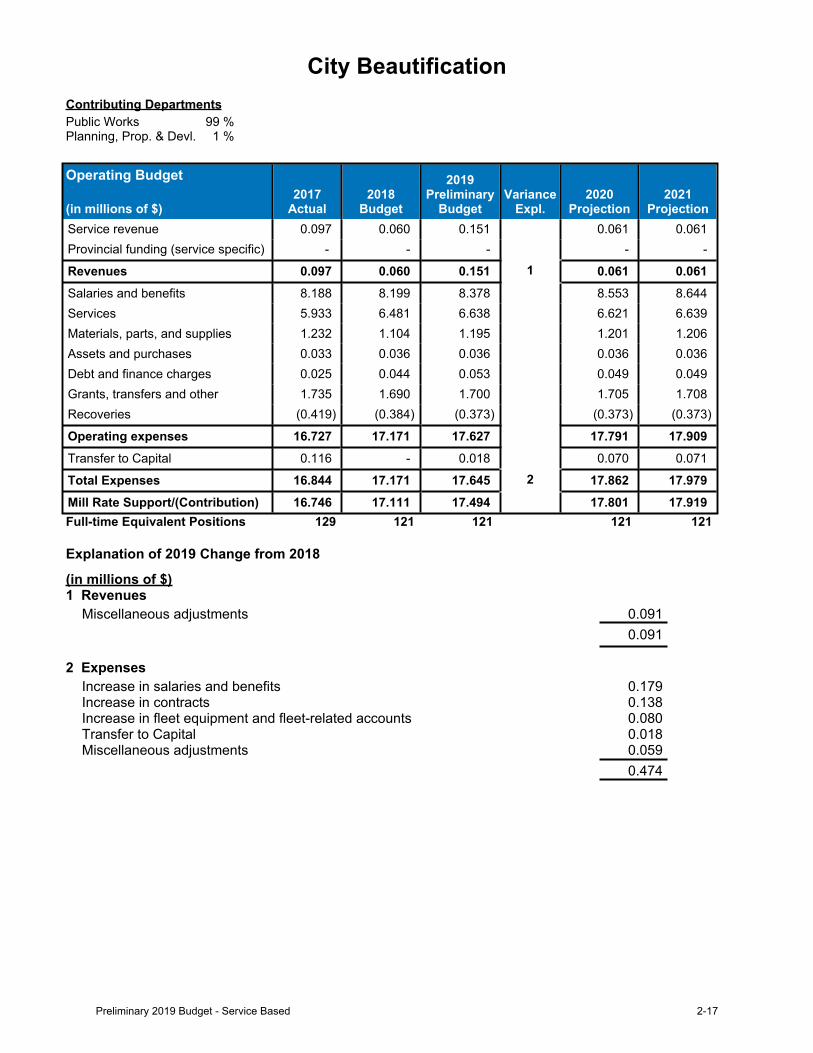
City BeautificationContributing DepartmentsPublic Works 99 %Planning, Prop. & Devl. 1 %
Operating Budget
(in millions of $)2017
Actual2018
Budget
2019Preliminary
BudgetVariance
Expl.2020
Projection2021
ProjectionService revenue 0.097 0.060 0.151 0.061 0.061Provincial funding (service specific) - - - - -
Revenues 0.097 0.060 0.151 1 0.061 0.061Salaries and benefits 8.188 8.199 8.378 8.553 8.644Services 5.933 6.481 6.638 6.621 6.639Materials, parts, and supplies 1.232 1.104 1.195 1.201 1.206Assets and purchases 0.033 0.036 0.036 0.036 0.036Debt and finance charges 0.025 0.044 0.053 0.049 0.049Grants, transfers and other 1.735 1.690 1.700 1.705 1.708Recoveries (0.419) (0.384) (0.373) (0.373) (0.373)
Operating expenses 16.727 17.171 17.627 17.791 17.909Transfer to Capital 0.116 - 0.018 0.070 0.071
Total Expenses 16.844 17.171 17.645 2 17.862 17.979Mill Rate Support/(Contribution) 16.746 17.111 17.494 17.801 17.919Full-time Equivalent Positions 129 121 121 121 121
Explanation of 2019 Change from 2018
(in millions of $)1 Revenues
Miscellaneous adjustments 0.0910.091
2 ExpensesIncrease in salaries and benefits 0.179Increase in contracts 0.138Increase in fleet equipment and fleet-related accounts 0.080Transfer to Capital 0.018Miscellaneous adjustments 0.059
0.474
Preliminary 2019 Budget - Service Based 2-17
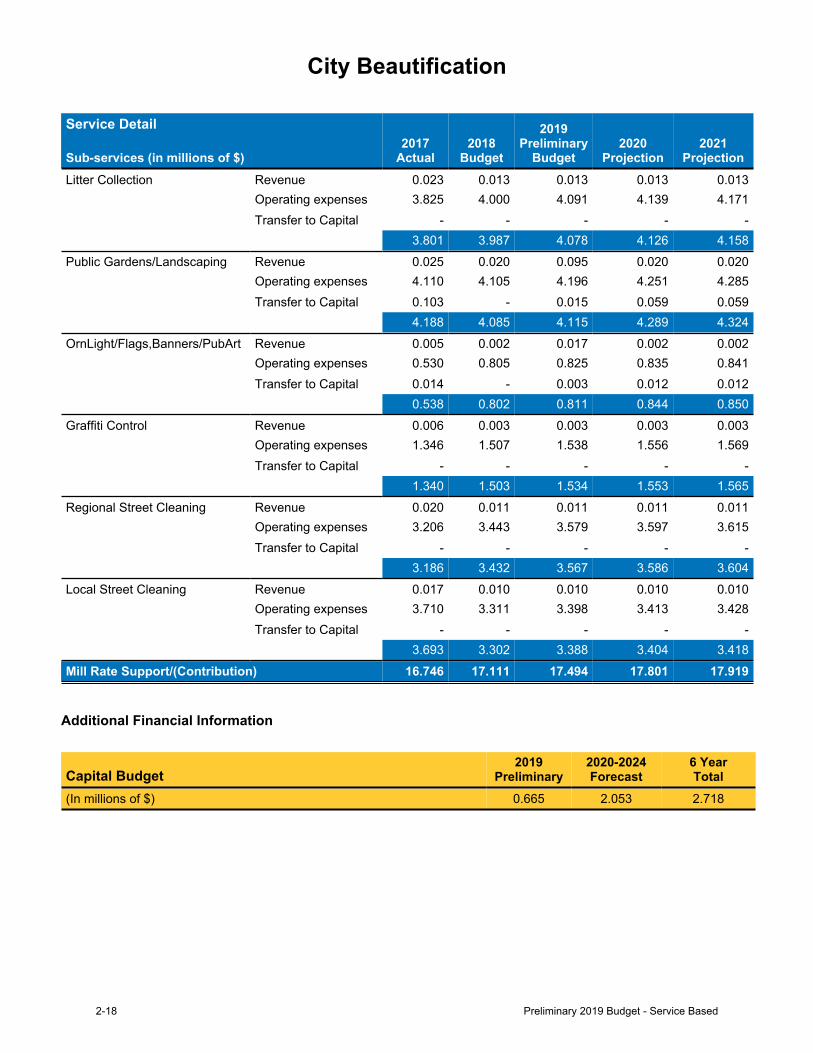
City Beautification
Service Detail
Sub-services (in millions of $)2017
Actual2018
Budget
2019Preliminary
Budget2020
Projection2021
ProjectionLitter Collection Revenue 0.023 0.013 0.013 0.013 0.013
Operating expenses 3.825 4.000 4.091 4.139 4.171Transfer to Capital - - - - -
3.801 3.987 4.078 4.126 4.158Public Gardens/Landscaping Revenue 0.025 0.020 0.095 0.020 0.020
Operating expenses 4.110 4.105 4.196 4.251 4.285Transfer to Capital 0.103 - 0.015 0.059 0.059
4.188 4.085 4.115 4.289 4.324OrnLight/Flags,Banners/PubArt Revenue 0.005 0.002 0.017 0.002 0.002
Operating expenses 0.530 0.805 0.825 0.835 0.841Transfer to Capital 0.014 - 0.003 0.012 0.012
0.538 0.802 0.811 0.844 0.850Graffiti Control Revenue 0.006 0.003 0.003 0.003 0.003
Operating expenses 1.346 1.507 1.538 1.556 1.569Transfer to Capital - - - - -
1.340 1.503 1.534 1.553 1.565Regional Street Cleaning Revenue 0.020 0.011 0.011 0.011 0.011
Operating expenses 3.206 3.443 3.579 3.597 3.615Transfer to Capital - - - - -
3.186 3.432 3.567 3.586 3.604Local Street Cleaning Revenue 0.017 0.010 0.010 0.010 0.010
Operating expenses 3.710 3.311 3.398 3.413 3.428Transfer to Capital - - - - -
3.693 3.302 3.388 3.404 3.418Mill Rate Support/(Contribution) 16.746 17.111 17.494 17.801 17.919
Additional Financial Information
Capital Budget2019
Preliminary2020-2024Forecast
6 YearTotal
(In millions of $) 0.665 2.053 2.718
2-18 Preliminary 2019 Budget - Service Based
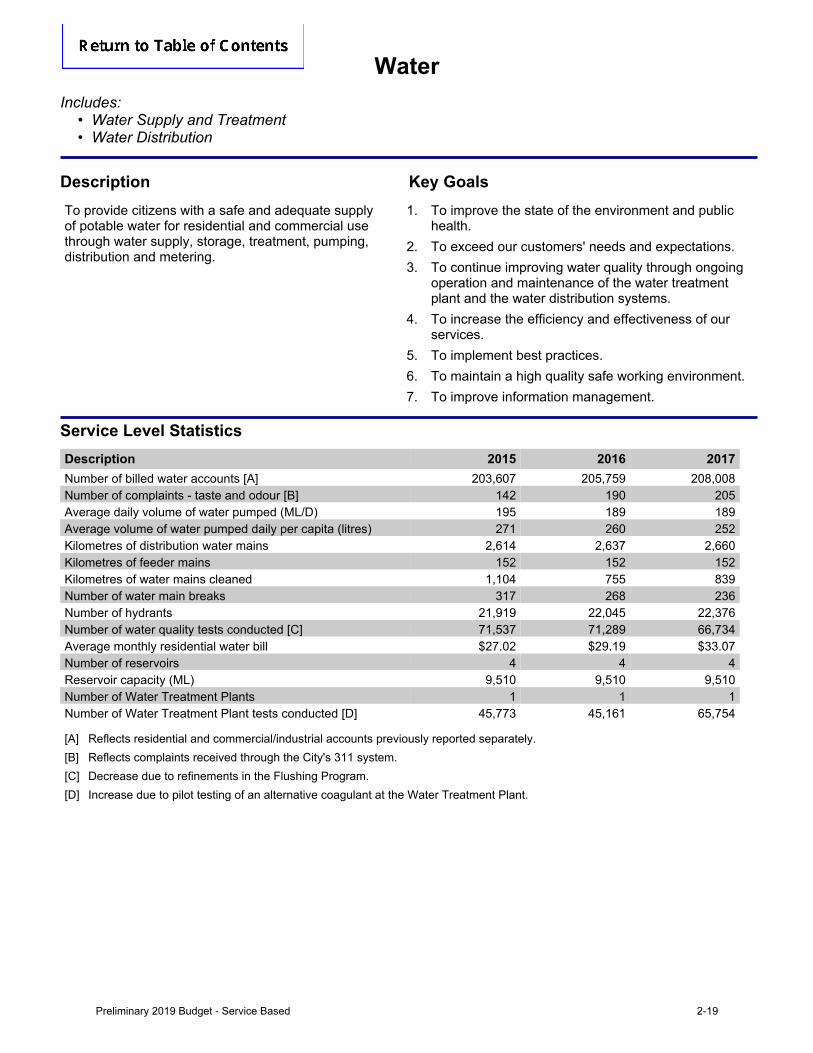
WaterIncludes:
• Water Supply and Treatment• Water Distribution
Description Key GoalsTo provide citizens with a safe and adequate supply of potable water for residential and commercial use through water supply, storage, treatment, pumping, distribution and metering.
1. To improve the state of the environment and public health.
2. To exceed our customers' needs and expectations.3. To continue improving water quality through ongoing
operation and maintenance of the water treatment plant and the water distribution systems.
4. To increase the efficiency and effectiveness of our services.
5. To implement best practices.6. To maintain a high quality safe working environment.7. To improve information management.
Service Level StatisticsDescription 2015 2016 2017Number of billed water accounts [A] 203,607 205,759 208,008Number of complaints - taste and odour [B] 142 190 205Average daily volume of water pumped (ML/D) 195 189 189Average volume of water pumped daily per capita (litres) 271 260 252Kilometres of distribution water mains 2,614 2,637 2,660Kilometres of feeder mains 152 152 152Kilometres of water mains cleaned 1,104 755 839Number of water main breaks 317 268 236Number of hydrants 21,919 22,045 22,376Number of water quality tests conducted [C] 71,537 71,289 66,734Average monthly residential water bill $27.02 $29.19 $33.07Number of reservoirs 4 4 4Reservoir capacity (ML) 9,510 9,510 9,510Number of Water Treatment Plants 1 1 1Number of Water Treatment Plant tests conducted [D] 45,773 45,161 65,754
[A] Reflects residential and commercial/industrial accounts previously reported separately.[B] Reflects complaints received through the City's 311 system.[C] Decrease due to refinements in the Flushing Program.[D] Increase due to pilot testing of an alternative coagulant at the Water Treatment Plant.
Preliminary 2019 Budget - Service Based 2-19
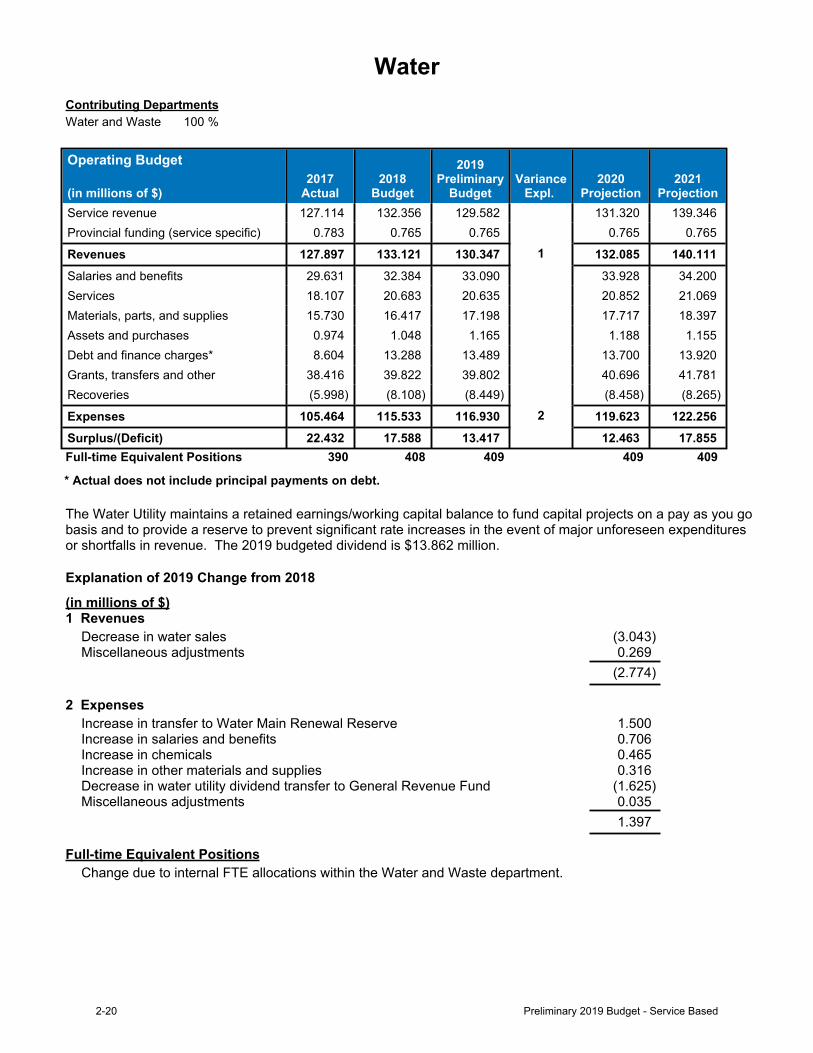
WaterContributing DepartmentsWater and Waste 100 %
Operating Budget
(in millions of $)2017
Actual2018
Budget
2019Preliminary
BudgetVariance
Expl. 2020
Projection2021
ProjectionService revenue 127.114 132.356 129.582 131.320 139.346Provincial funding (service specific) 0.783 0.765 0.765 0.765 0.765
Revenues 127.897 133.121 130.347 1 132.085 140.111Salaries and benefits 29.631 32.384 33.090 33.928 34.200Services 18.107 20.683 20.635 20.852 21.069Materials, parts, and supplies 15.730 16.417 17.198 17.717 18.397Assets and purchases 0.974 1.048 1.165 1.188 1.155Debt and finance charges* 8.604 13.288 13.489 13.700 13.920Grants, transfers and other 38.416 39.822 39.802 40.696 41.781Recoveries (5.998) (8.108) (8.449) (8.458) (8.265)
Expenses 105.464 115.533 116.930 2 119.623 122.256Surplus/(Deficit) 22.432 17.588 13.417 12.463 17.855Full-time Equivalent Positions 390 408 409 409 409
* Actual does not include principal payments on debt.
The Water Utility maintains a retained earnings/working capital balance to fund capital projects on a pay as you go basis and to provide a reserve to prevent significant rate increases in the event of major unforeseen expenditures or shortfalls in revenue. The 2019 budgeted dividend is $13.862 million.
Explanation of 2019 Change from 2018
(in millions of $)1 Revenues
Decrease in water sales (3.043)Miscellaneous adjustments 0.269
(2.774)
2 ExpensesIncrease in transfer to Water Main Renewal Reserve 1.500Increase in salaries and benefits 0.706Increase in chemicals 0.465Increase in other materials and supplies 0.316Decrease in water utility dividend transfer to General Revenue Fund (1.625)Miscellaneous adjustments 0.035
1.397
Full-time Equivalent PositionsChange due to internal FTE allocations within the Water and Waste department.
2-20 Preliminary 2019 Budget - Service Based
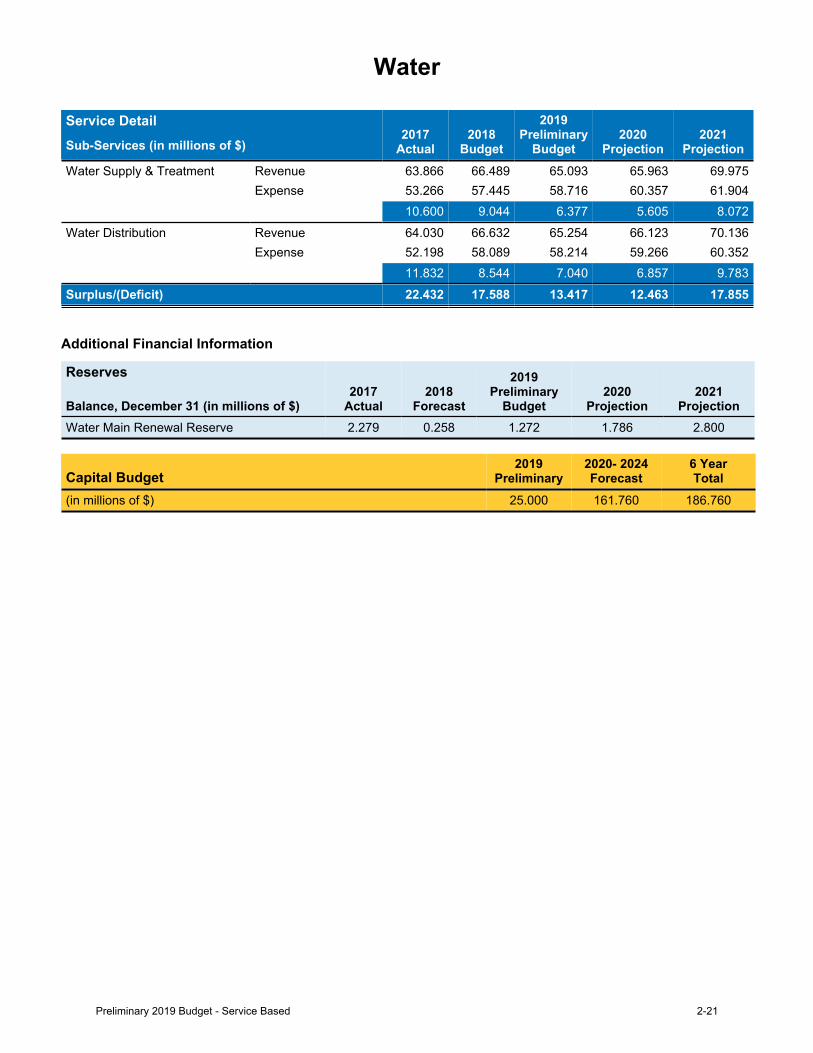
Water
Service DetailSub-Services (in millions of $)
2017 Actual
2018 Budget
2019Preliminary
Budget2020
Projection2021
ProjectionWater Supply & Treatment Revenue 63.866 66.489 65.093 65.963 69.975
Expense 53.266 57.445 58.716 60.357 61.90410.600 9.044 6.377 5.605 8.072
Water Distribution Revenue 64.030 66.632 65.254 66.123 70.136Expense 52.198 58.089 58.214 59.266 60.352
11.832 8.544 7.040 6.857 9.783Surplus/(Deficit) 22.432 17.588 13.417 12.463 17.855
Additional Financial Information
Reserves
Balance, December 31 (in millions of $)2017
Actual2018
Forecast
2019Preliminary
Budget2020
Projection2021
ProjectionWater Main Renewal Reserve 2.279 0.258 1.272 1.786 2.800
Capital Budget2019
Preliminary2020- 2024Forecast
6 YearTotal
(in millions of $) 25.000 161.760 186.760
Preliminary 2019 Budget - Service Based 2-21
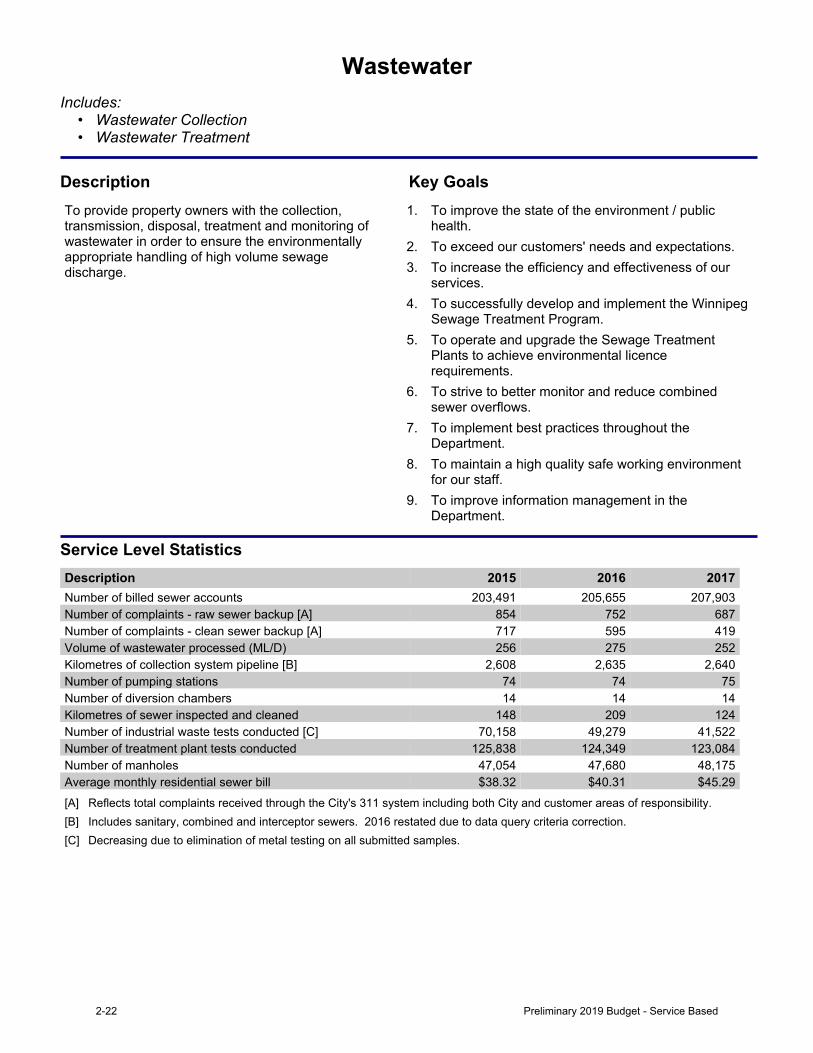
WastewaterIncludes:
• Wastewater Collection• Wastewater Treatment
Description Key GoalsTo provide property owners with the collection, transmission, disposal, treatment and monitoring of wastewater in order to ensure the environmentally appropriate handling of high volume sewage discharge.
1. To improve the state of the environment / public health.
2. To exceed our customers' needs and expectations.3. To increase the efficiency and effectiveness of our
services.4. To successfully develop and implement the Winnipeg
Sewage Treatment Program.5. To operate and upgrade the Sewage Treatment
Plants to achieve environmental licence requirements.
6. To strive to better monitor and reduce combined sewer overflows.
7. To implement best practices throughout the Department.
8. To maintain a high quality safe working environment for our staff.
9. To improve information management in the Department.
Service Level StatisticsDescription 2015 2016 2017Number of billed sewer accounts 203,491 205,655 207,903Number of complaints - raw sewer backup [A] 854 752 687Number of complaints - clean sewer backup [A] 717 595 419Volume of wastewater processed (ML/D) 256 275 252Kilometres of collection system pipeline [B] 2,608 2,635 2,640Number of pumping stations 74 74 75Number of diversion chambers 14 14 14Kilometres of sewer inspected and cleaned 148 209 124Number of industrial waste tests conducted [C] 70,158 49,279 41,522Number of treatment plant tests conducted 125,838 124,349 123,084Number of manholes 47,054 47,680 48,175Average monthly residential sewer bill $38.32 $40.31 $45.29[A] Reflects total complaints received through the City's 311 system including both City and customer areas of responsibility.[B] Includes sanitary, combined and interceptor sewers. 2016 restated due to data query criteria correction.[C] Decreasing due to elimination of metal testing on all submitted samples.
2-22 Preliminary 2019 Budget - Service Based
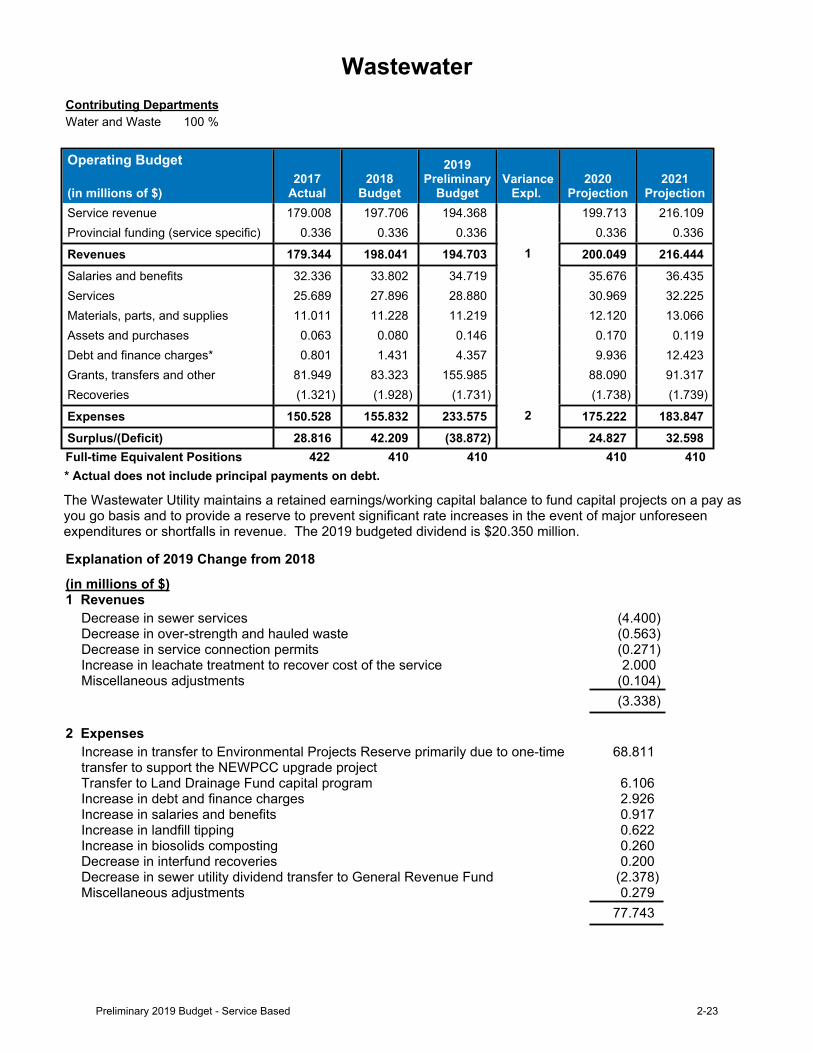
WastewaterContributing DepartmentsWater and Waste 100 %
Operating Budget
(in millions of $)2017
Actual2018
Budget
2019Preliminary
BudgetVariance
Expl. 2020
Projection2021
ProjectionService revenue 179.008 197.706 194.368 199.713 216.109Provincial funding (service specific) 0.336 0.336 0.336 0.336 0.336
Revenues 179.344 198.041 194.703 1 200.049 216.444Salaries and benefits 32.336 33.802 34.719 35.676 36.435Services 25.689 27.896 28.880 30.969 32.225Materials, parts, and supplies 11.011 11.228 11.219 12.120 13.066Assets and purchases 0.063 0.080 0.146 0.170 0.119Debt and finance charges* 0.801 1.431 4.357 9.936 12.423Grants, transfers and other 81.949 83.323 155.985 88.090 91.317Recoveries (1.321) (1.928) (1.731) (1.738) (1.739)
Expenses 150.528 155.832 233.575 2 175.222 183.847Surplus/(Deficit) 28.816 42.209 (38.872) 24.827 32.598Full-time Equivalent Positions 422 410 410 410 410
* Actual does not include principal payments on debt.
The Wastewater Utility maintains a retained earnings/working capital balance to fund capital projects on a pay as you go basis and to provide a reserve to prevent significant rate increases in the event of major unforeseen expenditures or shortfalls in revenue. The 2019 budgeted dividend is $20.350 million.
Explanation of 2019 Change from 2018
(in millions of $)1 Revenues
Decrease in sewer services (4.400)Decrease in over-strength and hauled waste (0.563)Decrease in service connection permits (0.271)Increase in leachate treatment to recover cost of the service 2.000Miscellaneous adjustments (0.104)
(3.338)
2 ExpensesIncrease in transfer to Environmental Projects Reserve primarily due to one-time transfer to support the NEWPCC upgrade project
68.811
Transfer to Land Drainage Fund capital program 6.106Increase in debt and finance charges 2.926Increase in salaries and benefits 0.917Increase in landfill tipping 0.622Increase in biosolids composting 0.260Decrease in interfund recoveries 0.200Decrease in sewer utility dividend transfer to General Revenue Fund (2.378)Miscellaneous adjustments 0.279
77.743
Preliminary 2019 Budget - Service Based 2-23
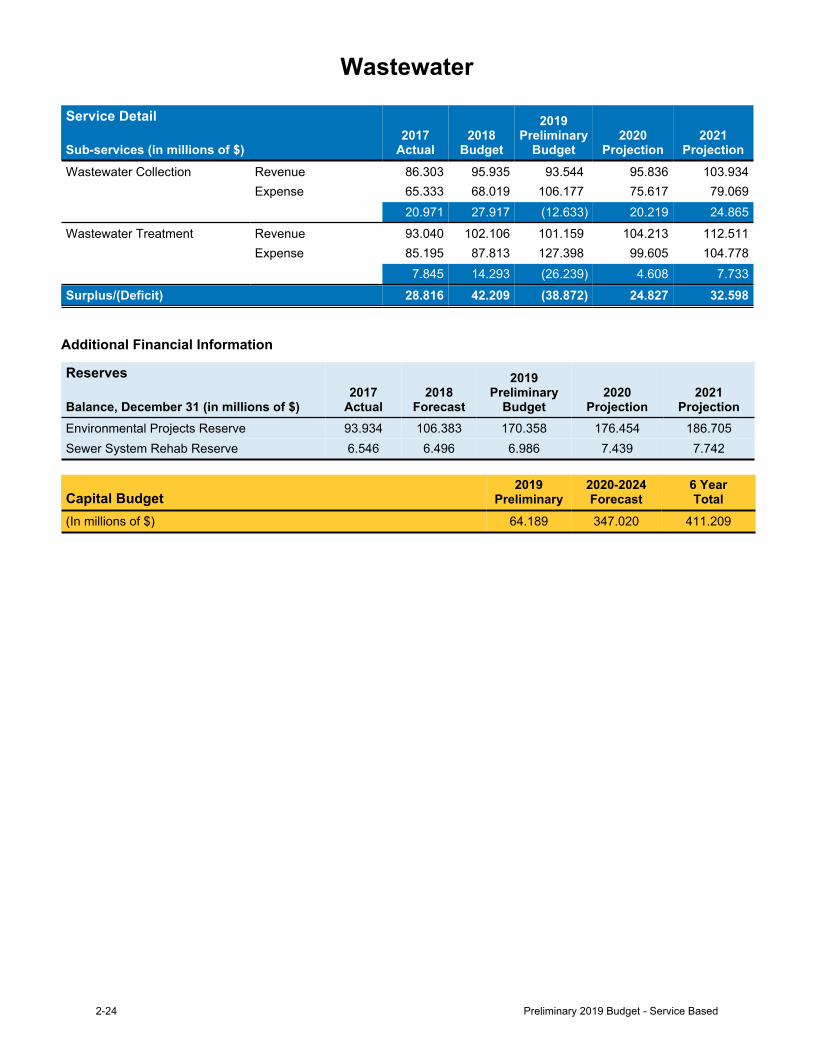
Wastewater
Service Detail
Sub-services (in millions of $)2017
Actual2018
Budget
2019Preliminary
Budget2020
Projection2021
ProjectionWastewater Collection Revenue 86.303 95.935 93.544 95.836 103.934
Expense 65.333 68.019 106.177 75.617 79.06920.971 27.917 (12.633) 20.219 24.865
Wastewater Treatment Revenue 93.040 102.106 101.159 104.213 112.511Expense 85.195 87.813 127.398 99.605 104.778
7.845 14.293 (26.239) 4.608 7.733Surplus/(Deficit) 28.816 42.209 (38.872) 24.827 32.598
Additional Financial Information
Reserves
Balance, December 31 (in millions of $)2017
Actual2018
Forecast
2019Preliminary
Budget2020
Projection2021
ProjectionEnvironmental Projects Reserve 93.934 106.383 170.358 176.454 186.705Sewer System Rehab Reserve 6.546 6.496 6.986 7.439 7.742
Capital Budget2019
Preliminary2020-2024Forecast
6 YearTotal
(In millions of $) 64.189 347.020 411.209
2-24 Preliminary 2019 Budget - Service Based
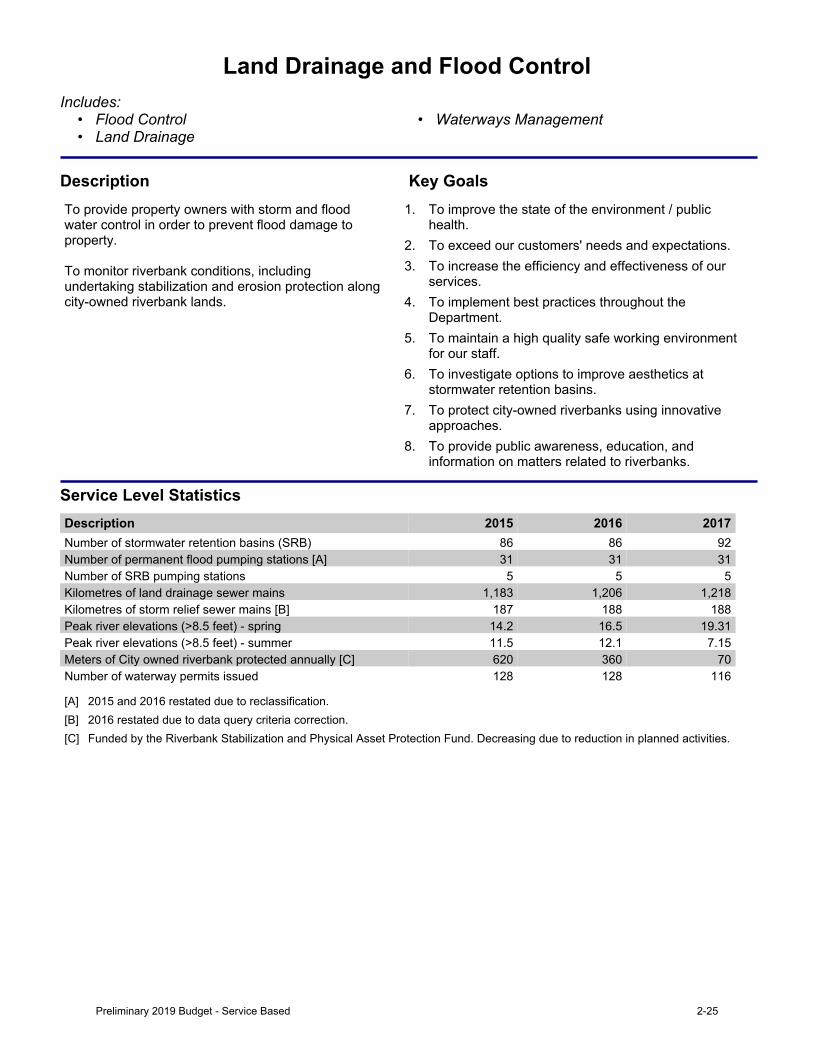
Land Drainage and Flood ControlIncludes:
• Flood Control • Waterways Management• Land Drainage
Description Key GoalsTo provide property owners with storm and flood water control in order to prevent flood damage to property.To monitor riverbank conditions, including undertaking stabilization and erosion protection along city-owned riverbank lands.
1. To improve the state of the environment / public health.
2. To exceed our customers' needs and expectations.3. To increase the efficiency and effectiveness of our
services.4. To implement best practices throughout the
Department.5. To maintain a high quality safe working environment
for our staff.6. To investigate options to improve aesthetics at
stormwater retention basins.7. To protect city-owned riverbanks using innovative
approaches.8. To provide public awareness, education, and
information on matters related to riverbanks.
Service Level StatisticsDescription 2015 2016 2017Number of stormwater retention basins (SRB) 86 86 92Number of permanent flood pumping stations [A] 31 31 31Number of SRB pumping stations 5 5 5Kilometres of land drainage sewer mains 1,183 1,206 1,218Kilometres of storm relief sewer mains [B] 187 188 188Peak river elevations (>8.5 feet) - spring 14.2 16.5 19.31Peak river elevations (>8.5 feet) - summer 11.5 12.1 7.15Meters of City owned riverbank protected annually [C] 620 360 70Number of waterway permits issued 128 128 116
[A] 2015 and 2016 restated due to reclassification.[B] 2016 restated due to data query criteria correction.[C] Funded by the Riverbank Stabilization and Physical Asset Protection Fund. Decreasing due to reduction in planned activities.
Preliminary 2019 Budget - Service Based 2-25
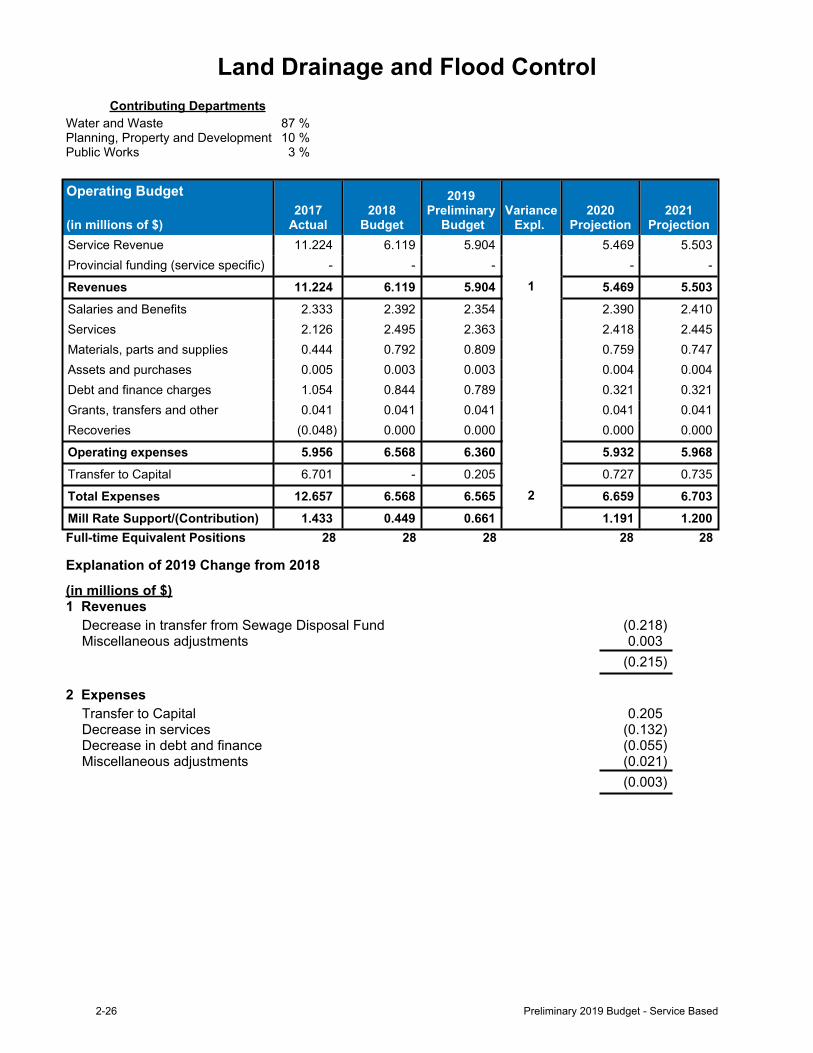
Land Drainage and Flood ControlContributing Departments
Water and Waste 87 %Planning, Property and Development 10 %Public Works 3 %
Operating Budget
(in millions of $)2017
Actual2018
Budget
2019Preliminary
BudgetVariance
Expl. 2020
Projection2021
ProjectionService Revenue 11.224 6.119 5.904 5.469 5.503Provincial funding (service specific) - - - - -
Revenues 11.224 6.119 5.904 1 5.469 5.503Salaries and Benefits 2.333 2.392 2.354 2.390 2.410Services 2.126 2.495 2.363 2.418 2.445Materials, parts and supplies 0.444 0.792 0.809 0.759 0.747Assets and purchases 0.005 0.003 0.003 0.004 0.004Debt and finance charges 1.054 0.844 0.789 0.321 0.321Grants, transfers and other 0.041 0.041 0.041 0.041 0.041Recoveries (0.048) 0.000 0.000 0.000 0.000
Operating expenses 5.956 6.568 6.360 5.932 5.968Transfer to Capital 6.701 - 0.205 0.727 0.735
Total Expenses 12.657 6.568 6.565 2 6.659 6.703Mill Rate Support/(Contribution) 1.433 0.449 0.661 1.191 1.200Full-time Equivalent Positions 28 28 28 28 28
Explanation of 2019 Change from 2018
(in millions of $)1 Revenues
Decrease in transfer from Sewage Disposal Fund (0.218)Miscellaneous adjustments 0.003
(0.215)
2 ExpensesTransfer to Capital 0.205Decrease in services (0.132)Decrease in debt and finance (0.055)Miscellaneous adjustments (0.021)
(0.003)
2-26 Preliminary 2019 Budget - Service Based
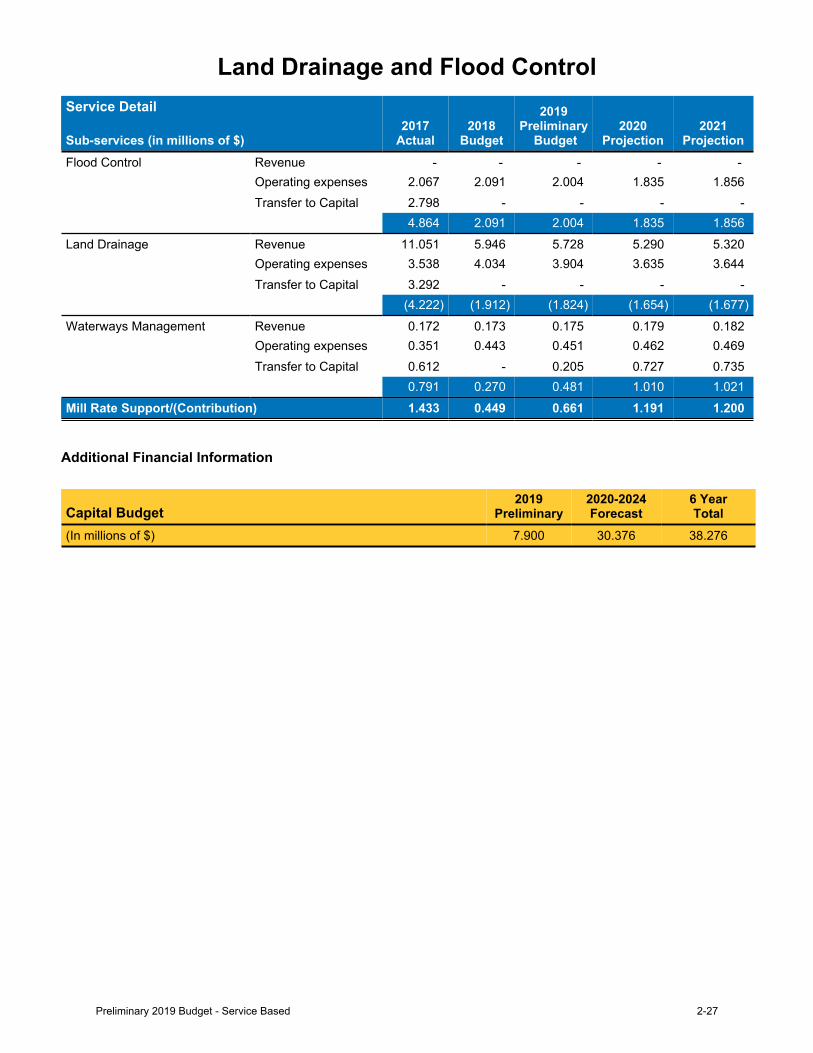
Land Drainage and Flood ControlService Detail
Sub-services (in millions of $)2017
Actual2018
Budget
2019Preliminary
Budget2020
Projection2021
ProjectionFlood Control Revenue - - - - -
Operating expenses 2.067 2.091 2.004 1.835 1.856Transfer to Capital 2.798 - - - -
4.864 2.091 2.004 1.835 1.856Land Drainage Revenue 11.051 5.946 5.728 5.290 5.320
Operating expenses 3.538 4.034 3.904 3.635 3.644Transfer to Capital 3.292 - - - -
(4.222) (1.912) (1.824) (1.654) (1.677)Waterways Management Revenue 0.172 0.173 0.175 0.179 0.182
Operating expenses 0.351 0.443 0.451 0.462 0.469Transfer to Capital 0.612 - 0.205 0.727 0.735
0.791 0.270 0.481 1.010 1.021Mill Rate Support/(Contribution) 1.433 0.449 0.661 1.191 1.200
Additional Financial Information
Capital Budget2019
Preliminary2020-2024Forecast
6 YearTotal
(In millions of $) 7.900 30.376 38.276
Preliminary 2019 Budget - Service Based 2-27
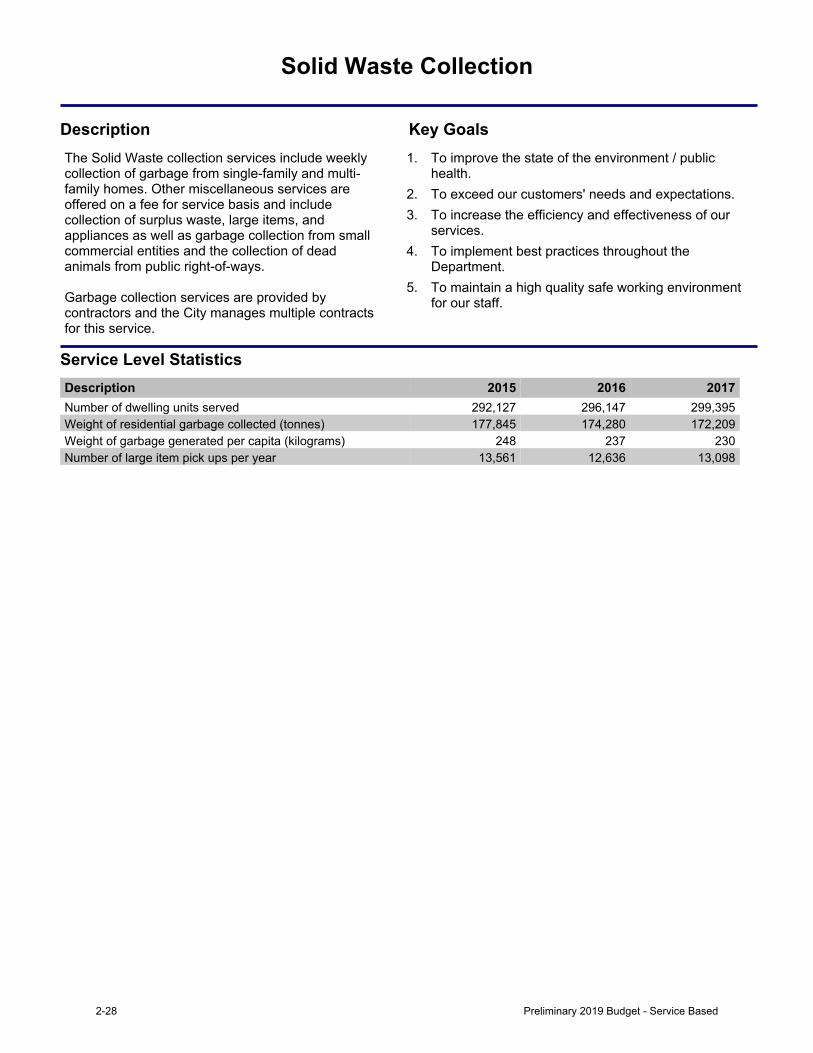
Solid Waste Collection
Description Key GoalsThe Solid Waste collection services include weekly collection of garbage from single-family and multi-family homes. Other miscellaneous services are offered on a fee for service basis and include collection of surplus waste, large items, and appliances as well as garbage collection from small commercial entities and the collection of dead animalsfrompublicright-of-ways.
Garbage collection services are provided by contractors and the City manages multiple contracts for this service.
1. To improve the state of the environment / publichealth.
2. To exceed our customers' needs and expectations.3. To increase the efficiency and effectiveness of our
services.4. To implement best practices throughout the
Department.5. To maintain a high quality safe working environment
for our staff.
Service Level StatisticsDescription 2015 2016 2017Number of dwelling units served 292,127 296,147 299,395Weight of residential garbage collected (tonnes) 177,845 174,280 172,209Weight of garbage generated per capita (kilograms) 248 237 230Number of large item pick ups per year 13,561 12,636 13,098
2-28 Preliminary 2019 Budget - Service Based
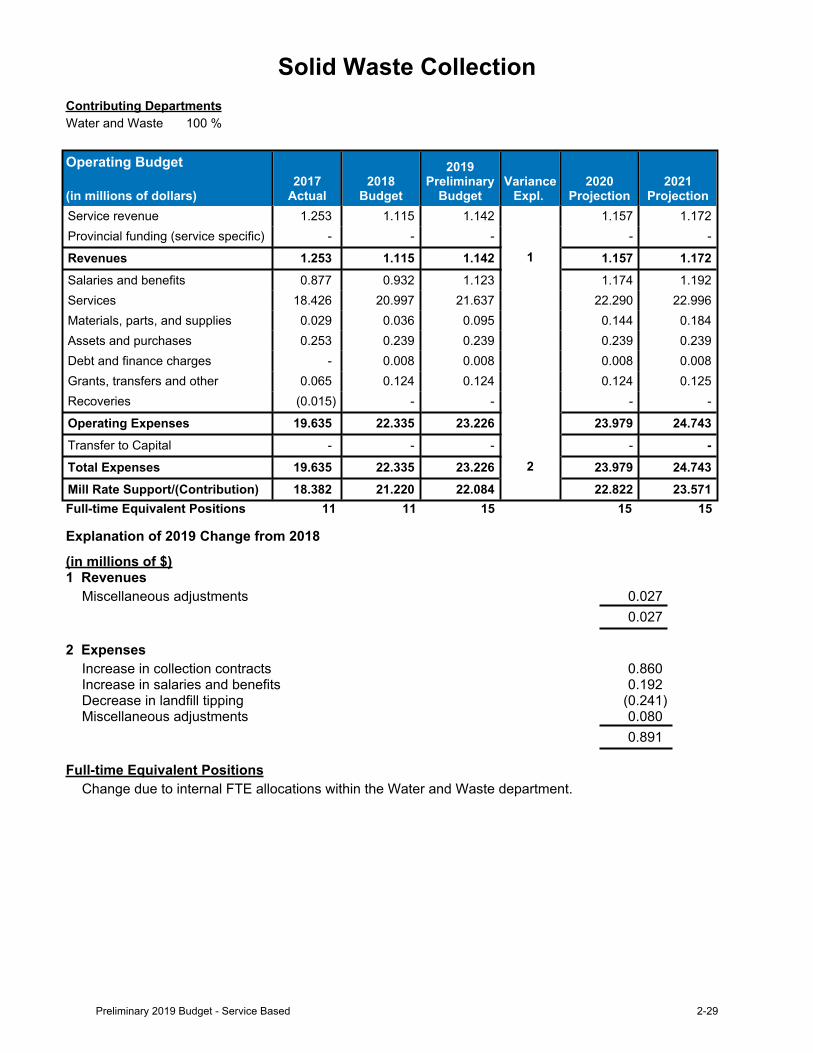
Solid Waste CollectionContributing DepartmentsWater and Waste 100 %
Operating Budget
(in millions of dollars)2017
Actual2018
Budget
2019Preliminary
BudgetVariance
Expl. 2020
Projection2021
ProjectionService revenue 1.253 1.115 1.142 1.157 1.172Provincial funding (service specific) - - - - -
Revenues 1.253 1.115 1.142 1 1.157 1.172Salaries and benefits 0.877 0.932 1.123 1.174 1.192Services 18.426 20.997 21.637 22.290 22.996Materials, parts, and supplies 0.029 0.036 0.095 0.144 0.184Assets and purchases 0.253 0.239 0.239 0.239 0.239Debt and finance charges - 0.008 0.008 0.008 0.008Grants, transfers and other 0.065 0.124 0.124 0.124 0.125Recoveries (0.015) - - - -
Operating Expenses 19.635 22.335 23.226 23.979 24.743Transfer to Capital - - - - -Total Expenses 19.635 22.335 23.226 2 23.979 24.743Mill Rate Support/(Contribution) 18.382 21.220 22.084 22.822 23.571Full-time Equivalent Positions 11 11 15 15 15
Explanation of 2019 Change from 2018
(in millions of $)1 Revenues
Miscellaneous adjustments 0.0270.027
2 ExpensesIncrease in collection contracts 0.860Increase in salaries and benefits 0.192Decrease in landfill tipping (0.241)Miscellaneous adjustments 0.080
0.891
Full-time Equivalent PositionsChange due to internal FTE allocations within the Water and Waste department.
Preliminary 2019 Budget - Service Based 2-29
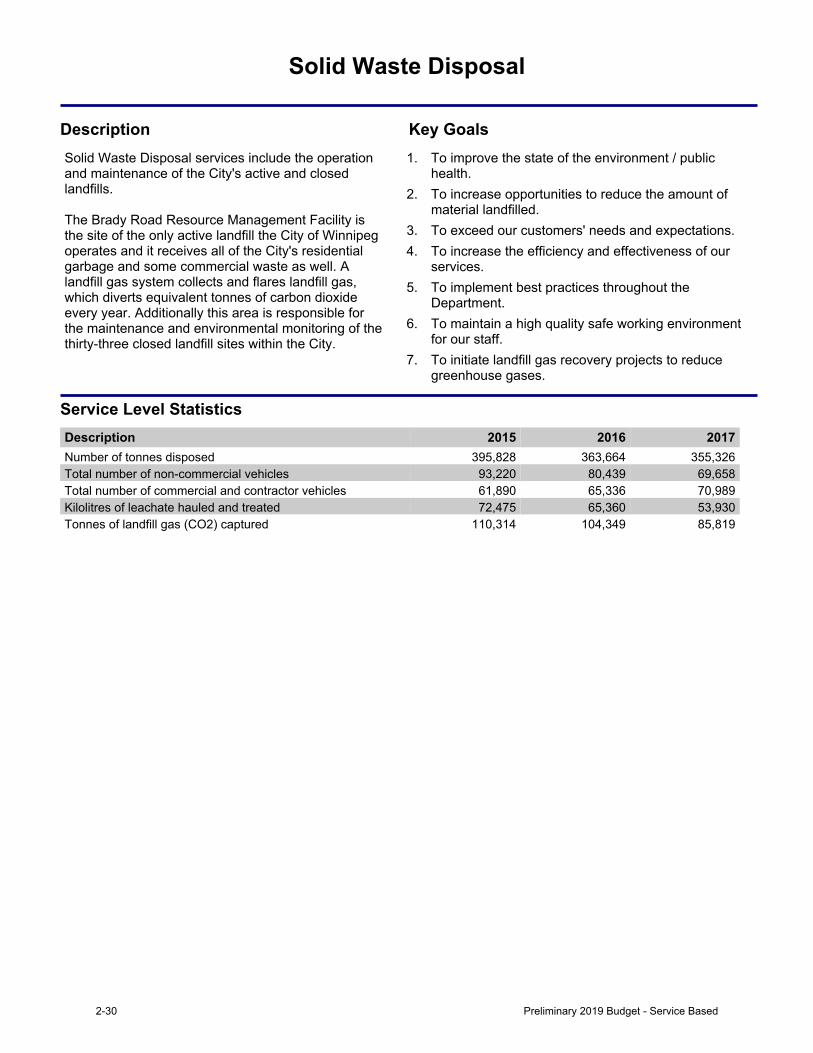
Solid Waste Disposal
Description Key GoalsSolid Waste Disposal services include the operation and maintenance of the City's active and closed landfills.The Brady Road Resource Management Facility is the site of the only active landfill the City of Winnipeg operates and it receives all of the City's residential garbage and some commercial waste as well. A landfill gas system collects and flares landfill gas, which diverts equivalent tonnes of carbon dioxide every year. Additionally this area is responsible for the maintenance and environmental monitoring of the thirty-three closed landfill sites within the City.
1. To improve the state of the environment / public health.
2. To increase opportunities to reduce the amount of material landfilled.
3. To exceed our customers' needs and expectations.4. To increase the efficiency and effectiveness of our
services.5. To implement best practices throughout the
Department.6. To maintain a high quality safe working environment
for our staff.7. To initiate landfill gas recovery projects to reduce
greenhouse gases.
Service Level StatisticsDescription 2015 2016 2017Number of tonnes disposed 395,828 363,664 355,326Total number of non-commercial vehicles 93,220 80,439 69,658Total number of commercial and contractor vehicles 61,890 65,336 70,989Kilolitres of leachate hauled and treated 72,475 65,360 53,930Tonnes of landfill gas (CO2) captured 110,314 104,349 85,819
2-30 Preliminary 2019 Budget - Service Based
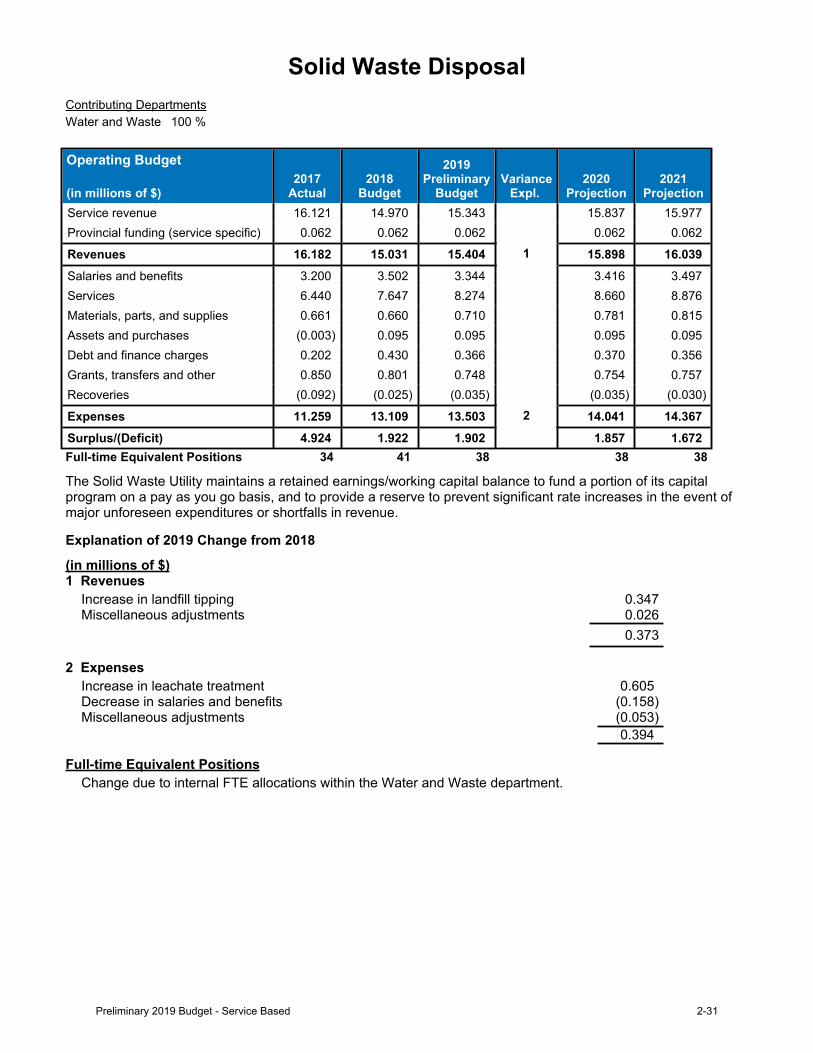
Solid Waste DisposalContributing DepartmentsWater and Waste 100 %
Operating Budget
(in millions of $)2017
Actual2018
Budget
2019Preliminary
BudgetVariance
Expl. 2020
Projection2021
ProjectionService revenue 16.121 14.970 15.343 15.837 15.977Provincial funding (service specific) 0.062 0.062 0.062 0.062 0.062
Revenues 16.182 15.031 15.404 1 15.898 16.039Salaries and benefits 3.200 3.502 3.344 3.416 3.497Services 6.440 7.647 8.274 8.660 8.876Materials, parts, and supplies 0.661 0.660 0.710 0.781 0.815Assets and purchases (0.003) 0.095 0.095 0.095 0.095Debt and finance charges 0.202 0.430 0.366 0.370 0.356Grants, transfers and other 0.850 0.801 0.748 0.754 0.757Recoveries (0.092) (0.025) (0.035) (0.035) (0.030)
Expenses 11.259 13.109 13.503 2 14.041 14.367Surplus/(Deficit) 4.924 1.922 1.902 1.857 1.672Full-time Equivalent Positions 34 41 38 38 38
The Solid Waste Utility maintains a retained earnings/working capital balance to fund a portion of its capital program on a pay as you go basis, and to provide a reserve to prevent significant rate increases in the event of major unforeseen expenditures or shortfalls in revenue.
Explanation of 2019 Change from 2018
(in millions of $)1 Revenues
Increase in landfill tipping 0.347Miscellaneous adjustments 0.026
0.373
2 ExpensesIncrease in leachate treatment 0.605Decrease in salaries and benefits (0.158)Miscellaneous adjustments (0.053)
0.394
Full-time Equivalent PositionsChange due to internal FTE allocations within the Water and Waste department.
Preliminary 2019 Budget - Service Based 2-31
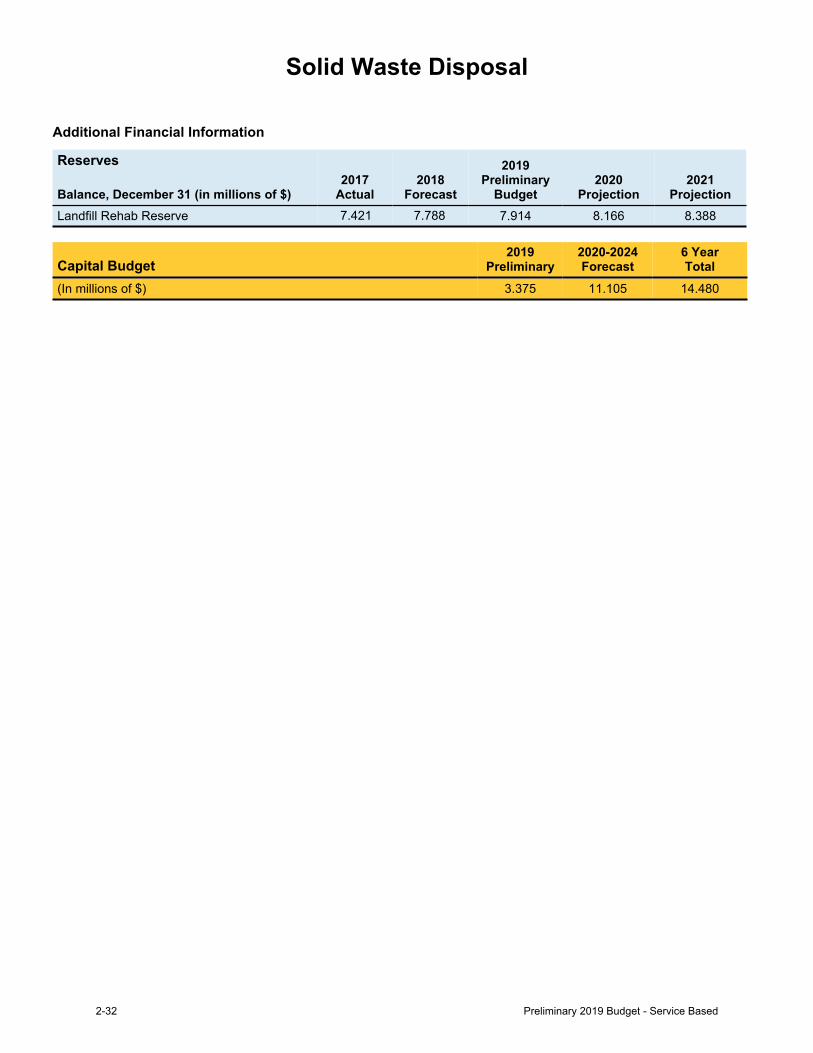
Solid Waste Disposal
Additional Financial Information
Reserves
Balance, December 31 (in millions of $)2017
Actual2018
Forecast
2019Preliminary
Budget2020
Projection2021
ProjectionLandfill Rehab Reserve 7.421 7.788 7.914 8.166 8.388
Capital Budget2019
Preliminary2020-2024Forecast
6 YearTotal
(In millions of $) 3.375 11.105 14.480
2-32 Preliminary 2019 Budget - Service Based
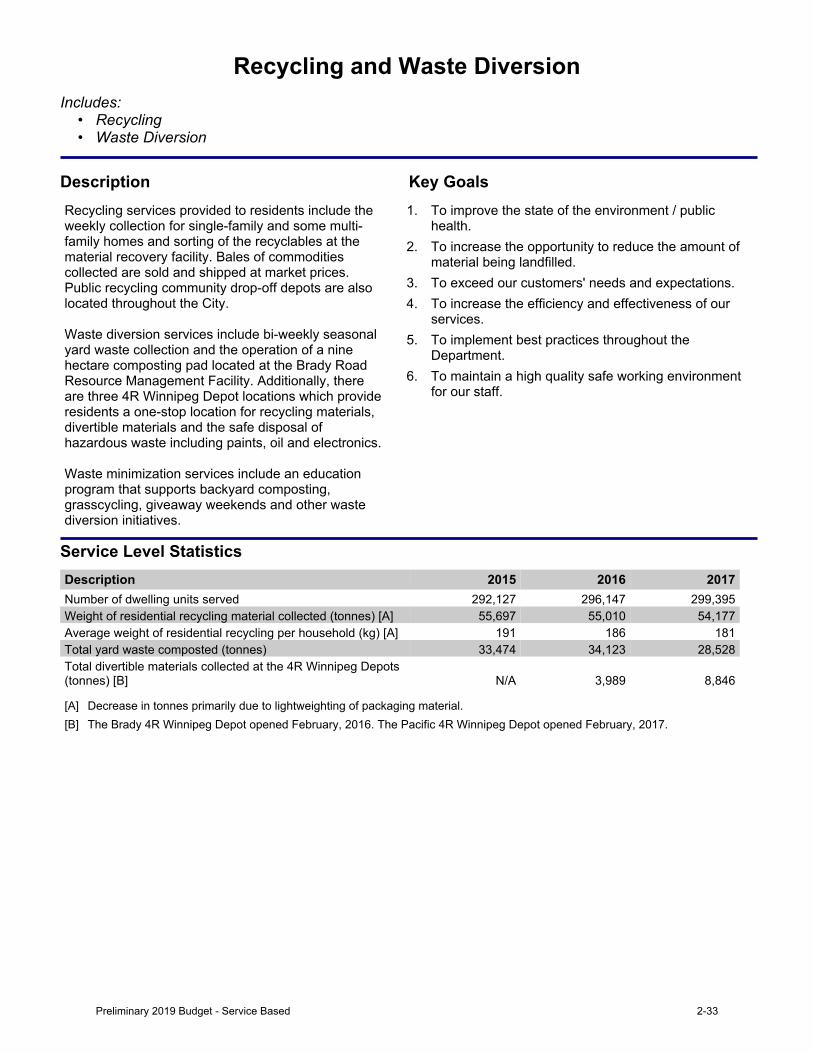
Recycling and Waste DiversionIncludes:
• Recycling• Waste Diversion
Description Key GoalsRecycling services provided to residents include the weekly collection for single-family and some multi-family homes and sorting of the recyclables at the material recovery facility. Bales of commodities collected are sold and shipped at market prices. Public recycling community drop-off depots are also locatedthroughouttheCity.
Waste diversion services include bi-weekly seasonal yard waste collection and the operation of a nine hectare composting pad located at the Brady Road Resource Management Facility. Additionally, there are three 4R Winnipeg Depot locations which provide residents a one-stop location for recycling materials, divertible materials and the safe disposal of hazardouswasteincludingpaints,oilandelectronics.
Waste minimization services include an education program that supports backyard composting, grasscycling, giveaway weekends and other waste diversion initiatives.
1. To improve the state of the environment / publichealth.
2. To increase the opportunity to reduce the amount ofmaterial being landfilled.
3. To exceed our customers' needs and expectations.4. To increase the efficiency and effectiveness of our
services.5. To implement best practices throughout the
Department.6. To maintain a high quality safe working environment
for our staff.
Service Level StatisticsDescription 2015 2016 2017Number of dwelling units served 292,127 296,147 299,395Weight of residential recycling material collected (tonnes) [A] 55,697 55,010 54,177Average weight of residential recycling per household (kg) [A] 191 186 181Total yard waste composted (tonnes) 33,474 34,123 28,528Total divertible materials collected at the 4R Winnipeg Depots (tonnes) [B] N/A 3,989 8,846
[A] Decrease in tonnes primarily due to lightweighting of packaging material.[B] The Brady 4R Winnipeg Depot opened February, 2016. The Pacific 4R Winnipeg Depot opened February, 2017.
Preliminary 2019 Budget - Service Based 2-33
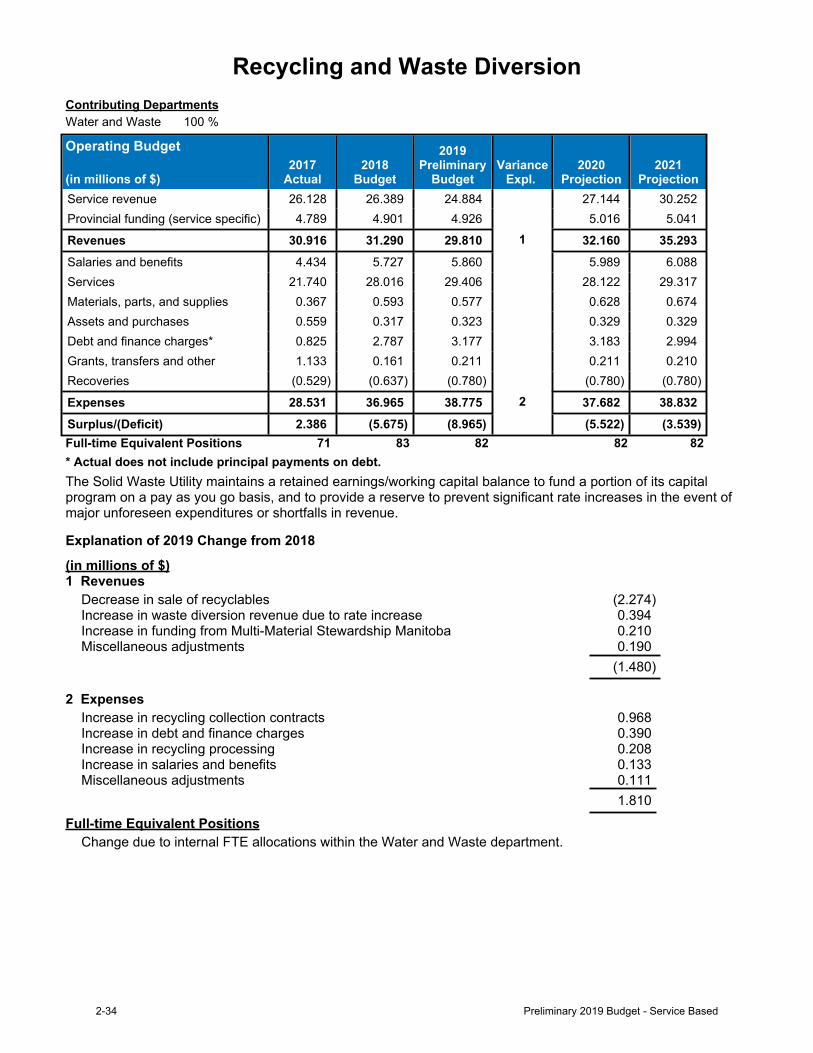
Recycling and Waste DiversionContributing DepartmentsWater and Waste 100 %
Operating Budget
(in millions of $)2017
Actual2018
Budget
2019Preliminary
BudgetVariance
Expl. 2020
Projection2021
ProjectionService revenue 26.128 26.389 24.884 27.144 30.252Provincial funding (service specific) 4.789 4.901 4.926 5.016 5.041
Revenues 30.916 31.290 29.810 1 32.160 35.293Salaries and benefits 4.434 5.727 5.860 5.989 6.088Services 21.740 28.016 29.406 28.122 29.317Materials, parts, and supplies 0.367 0.593 0.577 0.628 0.674Assets and purchases 0.559 0.317 0.323 0.329 0.329Debt and finance charges* 0.825 2.787 3.177 3.183 2.994Grants, transfers and other 1.133 0.161 0.211 0.211 0.210Recoveries (0.529) (0.637) (0.780) (0.780) (0.780)
Expenses 28.531 36.965 38.775 2 37.682 38.832Surplus/(Deficit) 2.386 (5.675) (8.965) (5.522) (3.539)Full-time Equivalent Positions 71 83 82 82 82* Actual does not include principal payments on debt.The Solid Waste Utility maintains a retained earnings/working capital balance to fund a portion of its capital program on a pay as you go basis, and to provide a reserve to prevent significant rate increases in the event of major unforeseen expenditures or shortfalls in revenue.
Explanation of 2019 Change from 2018
(in millions of $)1 Revenues
Decrease in sale of recyclables (2.274)Increase in waste diversion revenue due to rate increase 0.394Increase in funding from Multi-Material Stewardship Manitoba 0.210Miscellaneous adjustments 0.190
(1.480)
2 ExpensesIncrease in recycling collection contracts 0.968Increase in debt and finance charges 0.390Increase in recycling processing 0.208Increase in salaries and benefits 0.133Miscellaneous adjustments 0.111
1.810Full-time Equivalent Positions
Change due to internal FTE allocations within the Water and Waste department.
2-34 Preliminary 2019 Budget - Service Based
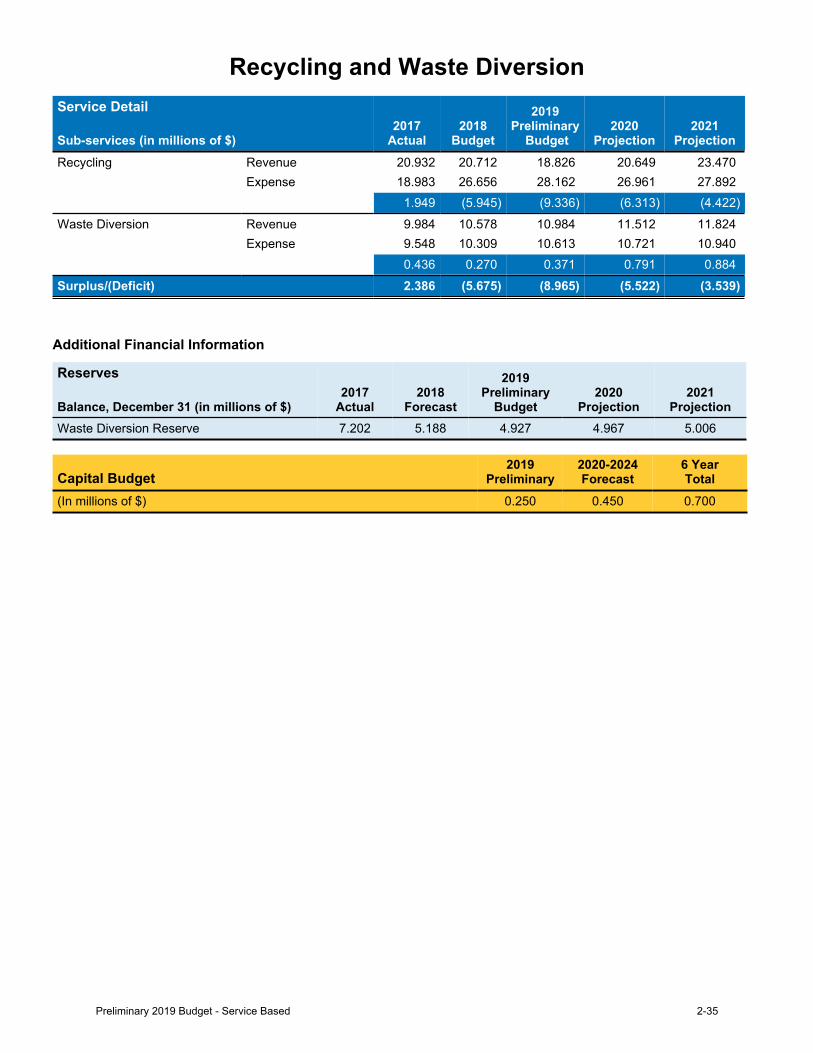
Recycling and Waste DiversionService Detail
Sub-services (in millions of $)2017
Actual2018
Budget
2019Preliminary
Budget2020
Projection2021
ProjectionRecycling Revenue 20.932 20.712 18.826 20.649 23.470
Expense 18.983 26.656 28.162 26.961 27.8921.949 (5.945) (9.336) (6.313) (4.422)
Waste Diversion Revenue 9.984 10.578 10.984 11.512 11.824Expense 9.548 10.309 10.613 10.721 10.940
0.436 0.270 0.371 0.791 0.884Surplus/(Deficit) 2.386 (5.675) (8.965) (5.522) (3.539)
Additional Financial Information
Reserves
Balance, December 31 (in millions of $)2017
Actual2018
Forecast
2019Preliminary
Budget2020
Projection2021
ProjectionWaste Diversion Reserve 7.202 5.188 4.927 4.967 5.006
Capital Budget2019
Preliminary2020-2024Forecast
6 YearTotal
(In millions of $) 0.250 0.450 0.700
Preliminary 2019 Budget - Service Based 2-35

2-36 Preliminary 2019 Budget - Service Based
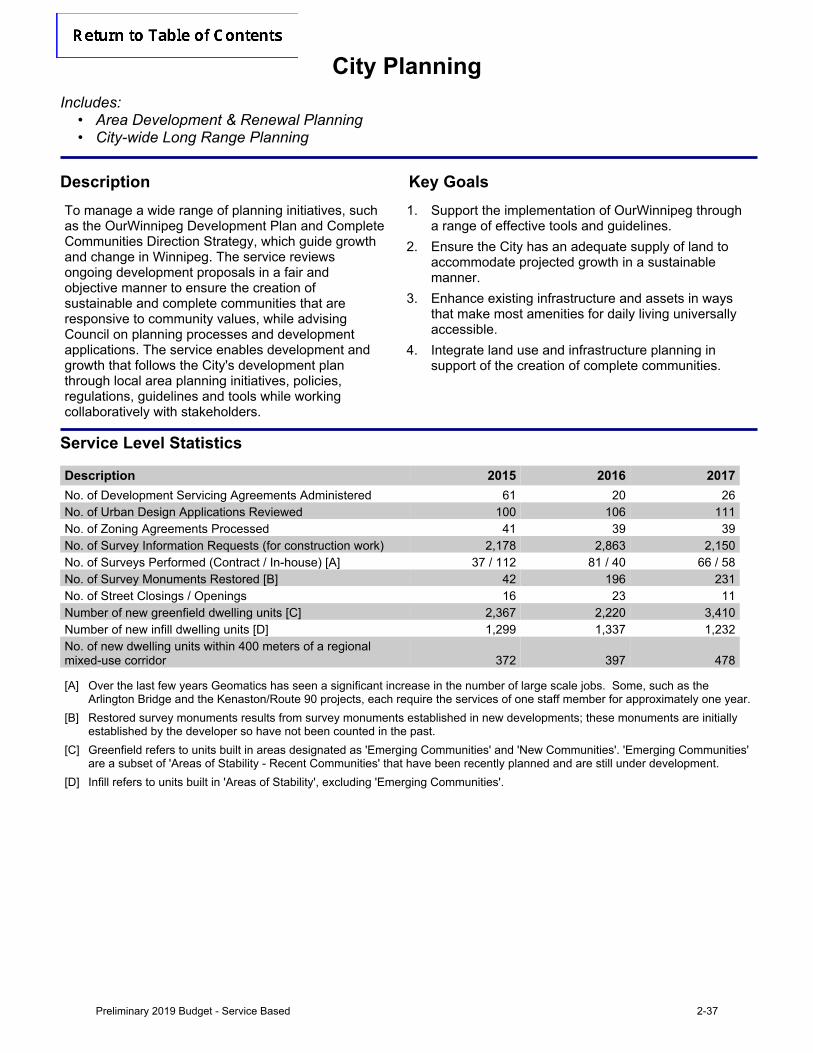
City PlanningIncludes:
• Area Development & Renewal Planning• City-wide Long Range Planning
Description Key GoalsTo manage a wide range of planning initiatives, such as the OurWinnipeg Development Plan and Complete Communities Direction Strategy, which guide growth and change in Winnipeg. The service reviews ongoing development proposals in a fair and objective manner to ensure the creation of sustainable and complete communities that are responsive to community values, while advising Council on planning processes and development applications. The service enables development and growth that follows the City's development plan through local area planning initiatives, policies, regulations, guidelines and tools while working collaboratively with stakeholders.
1. Support the implementation of OurWinnipeg through a range of effective tools and guidelines.
2. Ensure the City has an adequate supply of land to accommodate projected growth in a sustainable manner.
3. Enhance existing infrastructure and assets in ways that make most amenities for daily living universally accessible.
4. Integrate land use and infrastructure planning in support of the creation of complete communities.
Service Level Statistics
Description 2015 2016 2017No. of Development Servicing Agreements Administered 61 20 26No. of Urban Design Applications Reviewed 100 106 111No. of Zoning Agreements Processed 41 39 39No. of Survey Information Requests (for construction work) 2,178 2,863 2,150No. of Surveys Performed (Contract / In-house) [A] 37 / 112 81 / 40 66 / 58No. of Survey Monuments Restored [B] 42 196 231No. of Street Closings / Openings 16 23 11Number of new greenfield dwelling units [C] 2,367 2,220 3,410Number of new infill dwelling units [D] 1,299 1,337 1,232No. of new dwelling units within 400 meters of a regional mixed-use corridor 372 397 478
[A] Over the last few years Geomatics has seen a significant increase in the number of large scale jobs. Some, such as the Arlington Bridge and the Kenaston/Route 90 projects, each require the services of one staff member for approximately one year.
[B] Restored survey monuments results from survey monuments established in new developments; these monuments are initially established by the developer so have not been counted in the past.
[C] Greenfield refers to units built in areas designated as 'Emerging Communities' and 'New Communities'. 'Emerging Communities' are a subset of 'Areas of Stability - Recent Communities' that have been recently planned and are still under development.
[D] Infill refers to units built in 'Areas of Stability', excluding 'Emerging Communities'.
Preliminary 2019 Budget - Service Based 2-37
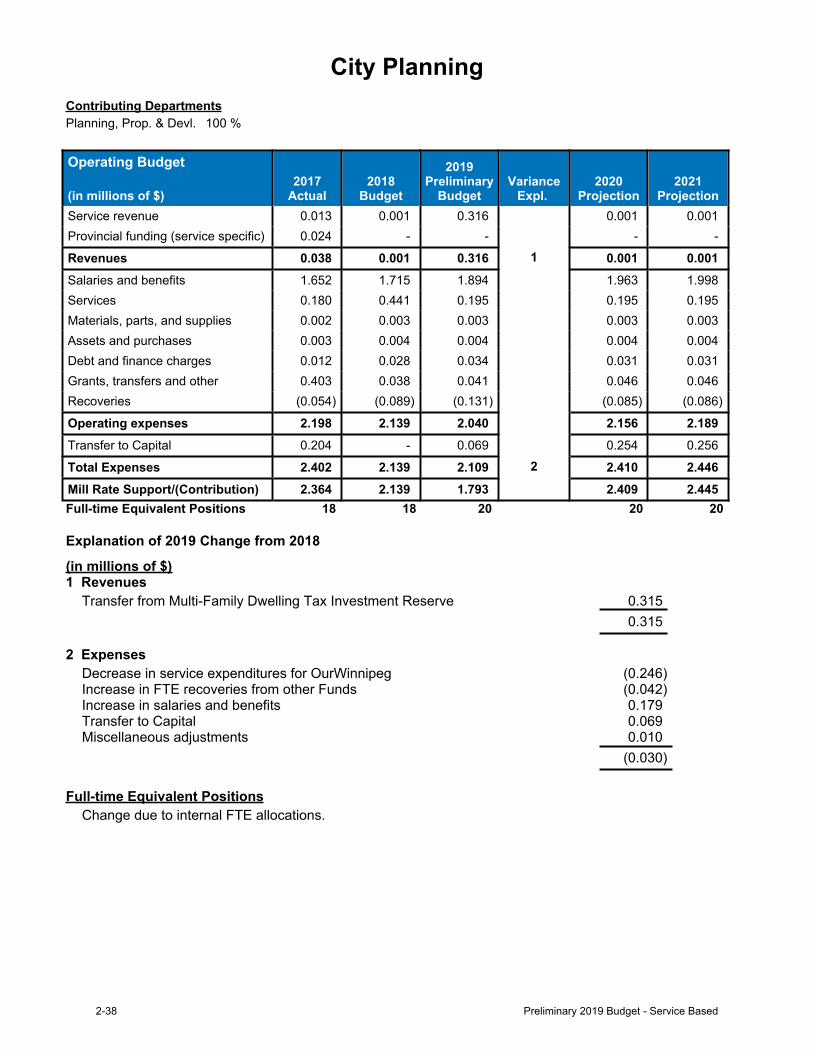
City PlanningContributing DepartmentsPlanning, Prop. & Devl. 100 %
Operating Budget
(in millions of $)2017
Actual2018
Budget
2019Preliminary
BudgetVariance
Expl. 2020
Projection2021
ProjectionService revenue 0.013 0.001 0.316 0.001 0.001Provincial funding (service specific) 0.024 - - - -
Revenues 0.038 0.001 0.316 1 0.001 0.001Salaries and benefits 1.652 1.715 1.894 1.963 1.998Services 0.180 0.441 0.195 0.195 0.195Materials, parts, and supplies 0.002 0.003 0.003 0.003 0.003Assets and purchases 0.003 0.004 0.004 0.004 0.004Debt and finance charges 0.012 0.028 0.034 0.031 0.031Grants, transfers and other 0.403 0.038 0.041 0.046 0.046Recoveries (0.054) (0.089) (0.131) (0.085) (0.086)
Operating expenses 2.198 2.139 2.040 2.156 2.189Transfer to Capital 0.204 - 0.069 0.254 0.256
Total Expenses 2.402 2.139 2.109 2 2.410 2.446Mill Rate Support/(Contribution) 2.364 2.139 1.793 2.409 2.445Full-time Equivalent Positions 18 18 20 20 20
Explanation of 2019 Change from 2018
(in millions of $)1 Revenues
Transfer from Multi-Family Dwelling Tax Investment Reserve 0.3150.315
2 ExpensesDecrease in service expenditures for OurWinnipeg (0.246)Increase in FTE recoveries from other Funds (0.042)Increase in salaries and benefits 0.179Transfer to Capital 0.069Miscellaneous adjustments 0.010
(0.030)
Full-time Equivalent PositionsChange due to internal FTE allocations.
2-38 Preliminary 2019 Budget - Service Based
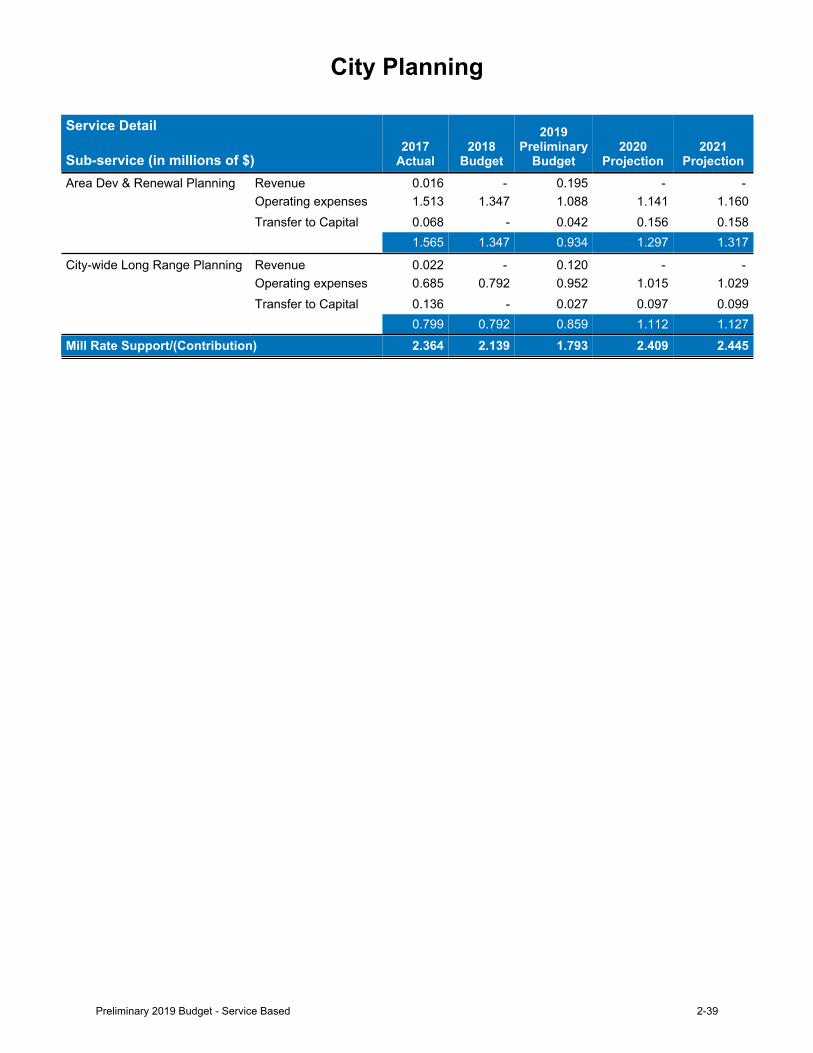
City Planning
Service Detail
Sub-service (in millions of $)2017
Actual2018
Budget
2019Preliminary
Budget2020
Projection2021
ProjectionArea Dev & Renewal Planning Revenue 0.016 - 0.195 - -
Operating expenses 1.513 1.347 1.088 1.141 1.160Transfer to Capital 0.068 - 0.042 0.156 0.158
1.565 1.347 0.934 1.297 1.317
City-wide Long Range Planning Revenue 0.022 - 0.120 - -
Operating expenses 0.685 0.792 0.952 1.015 1.029Transfer to Capital 0.136 - 0.027 0.097 0.099
0.799 0.792 0.859 1.112 1.127Mill Rate Support/(Contribution) 2.364 2.139 1.793 2.409 2.445
Preliminary 2019 Budget - Service Based 2-39
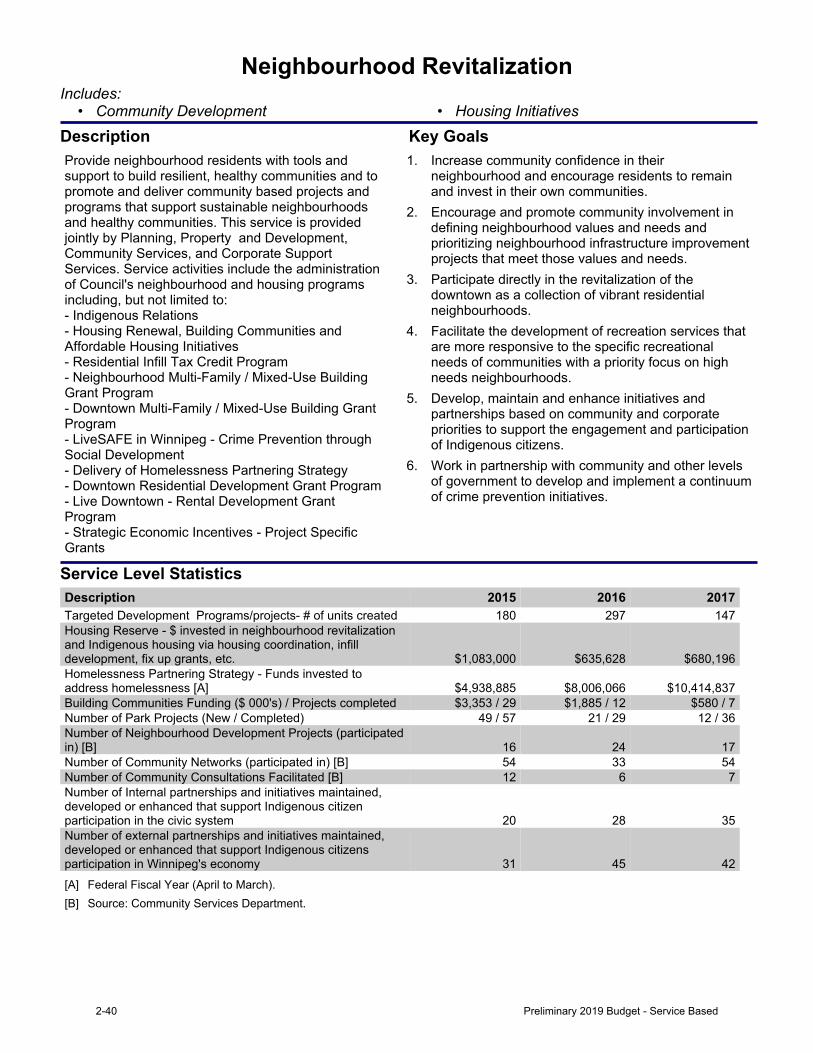
Neighbourhood RevitalizationIncludes:
• Community Development • Housing Initiatives
Description Key GoalsProvide neighbourhood residents with tools and support to build resilient, healthy communities and to promote and deliver community based projects and programs that support sustainable neighbourhoods and healthy communities. This service is provided jointly by Planning, Property and Development, Community Services, and Corporate Support Services. Service activities include the administration of Council's neighbourhood and housing programs including,butnotlimitedto:-IndigenousRelations-HousingRenewal,BuildingCommunitiesandAffordableHousingInitiatives-ResidentialInfillTaxCreditProgram-NeighbourhoodMulti-Family/Mixed-UseBuildingGrantProgram-DowntownMulti-Family/Mixed-UseBuildingGrantProgram-LiveSAFEinWinnipeg-CrimePreventionthroughSocialDevelopment-DeliveryofHomelessnessPartneringStrategy-DowntownResidentialDevelopmentGrantProgram- Live Downtown - Rental Development Grant Program- Strategic Economic Incentives - Project Specific Grants
1. Increase community confidence in their neighbourhood and encourage residents to remain and invest in their own communities.
2. Encourage and promote community involvement in defining neighbourhood values and needs and prioritizing neighbourhood infrastructure improvement projects that meet those values and needs.
3. Participate directly in the revitalization of the downtown as a collection of vibrant residential neighbourhoods.
4. Facilitate the development of recreation services that are more responsive to the specific recreational needs of communities with a priority focus on high needs neighbourhoods.
5. Develop, maintain and enhance initiatives and partnerships based on community and corporate priorities to support the engagement and participation of Indigenous citizens.
6. Work in partnership with community and other levels of government to develop and implement a continuum of crime prevention initiatives.
Service Level StatisticsDescription 2015 2016 2017Targeted Development Programs/projects- # of units created 180 297 147Housing Reserve - $ invested in neighbourhood revitalization and Indigenous housing via housing coordination, infill development, fix up grants, etc. $1,083,000 $635,628 $680,196Homelessness Partnering Strategy - Funds invested to address homelessness [A] $4,938,885 $8,006,066 $10,414,837Building Communities Funding ($ 000's) / Projects completed $3,353 / 29 $1,885 / 12 $580 / 7Number of Park Projects (New / Completed) 49 / 57 21 / 29 12 / 36Number of Neighbourhood Development Projects (participated in) [B] 16 24 17Number of Community Networks (participated in) [B] 54 33 54Number of Community Consultations Facilitated [B] 12 6 7Number of Internal partnerships and initiatives maintained, developed or enhanced that support Indigenous citizen participation in the civic system 20 28 35Number of external partnerships and initiatives maintained, developed or enhanced that support Indigenous citizens participation in Winnipeg's economy 31 45 42[A] Federal Fiscal Year (April to March).[B] Source: Community Services Department.
2-40 Preliminary 2019 Budget - Service Based
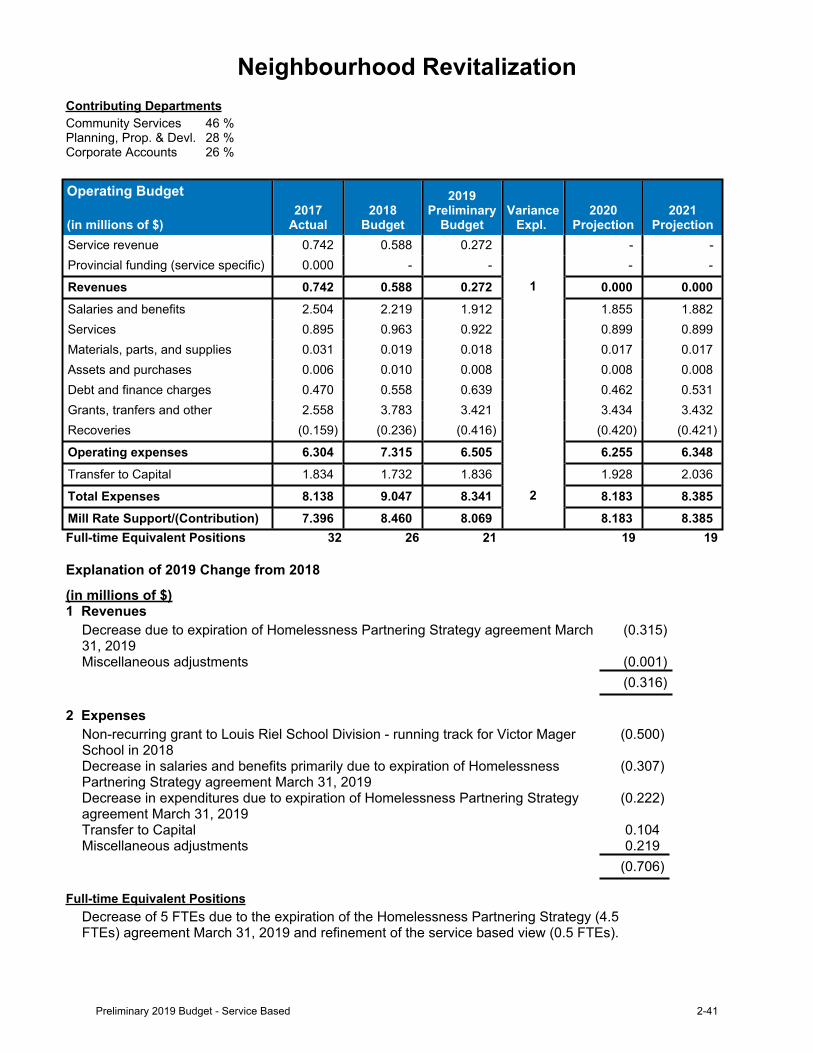
Neighbourhood RevitalizationContributing DepartmentsCommunity Services 46 %Planning, Prop. & Devl. 28 %Corporate Accounts 26 %
Operating Budget
(in millions of $)2017
Actual2018
Budget
2019Preliminary
BudgetVariance
Expl. 2020
Projection2021
ProjectionService revenue 0.742 0.588 0.272 - -
Provincial funding (service specific) 0.000 - - - -
Revenues 0.742 0.588 0.272 1 0.000 0.000Salaries and benefits 2.504 2.219 1.912 1.855 1.882Services 0.895 0.963 0.922 0.899 0.899Materials, parts, and supplies 0.031 0.019 0.018 0.017 0.017Assets and purchases 0.006 0.010 0.008 0.008 0.008Debt and finance charges 0.470 0.558 0.639 0.462 0.531Grants, tranfers and other 2.558 3.783 3.421 3.434 3.432Recoveries (0.159) (0.236) (0.416) (0.420) (0.421)
Operating expenses 6.304 7.315 6.505 6.255 6.348Transfer to Capital 1.834 1.732 1.836 1.928 2.036
Total Expenses 8.138 9.047 8.341 2 8.183 8.385Mill Rate Support/(Contribution) 7.396 8.460 8.069 8.183 8.385Full-time Equivalent Positions 32 26 21 19 19
Explanation of 2019 Change from 2018
(in millions of $)1 Revenues
Decrease due to expiration of Homelessness Partnering Strategy agreement March 31, 2019
(0.315)
Miscellaneous adjustments (0.001)(0.316)
2 ExpensesNon-recurring grant to Louis Riel School Division - running track for Victor Mager School in 2018
(0.500)
Decrease in salaries and benefits primarily due to expiration of Homelessness Partnering Strategy agreement March 31, 2019
(0.307)
Decrease in expenditures due to expiration of Homelessness Partnering Strategy agreement March 31, 2019
(0.222)
Transfer to Capital 0.104Miscellaneous adjustments 0.219
(0.706)
Full-time Equivalent PositionsDecrease of 5 FTEs due to the expiration of the Homelessness Partnering Strategy (4.5 FTEs) agreement March 31, 2019 and refinement of the service based view (0.5 FTEs).
Preliminary 2019 Budget - Service Based 2-41
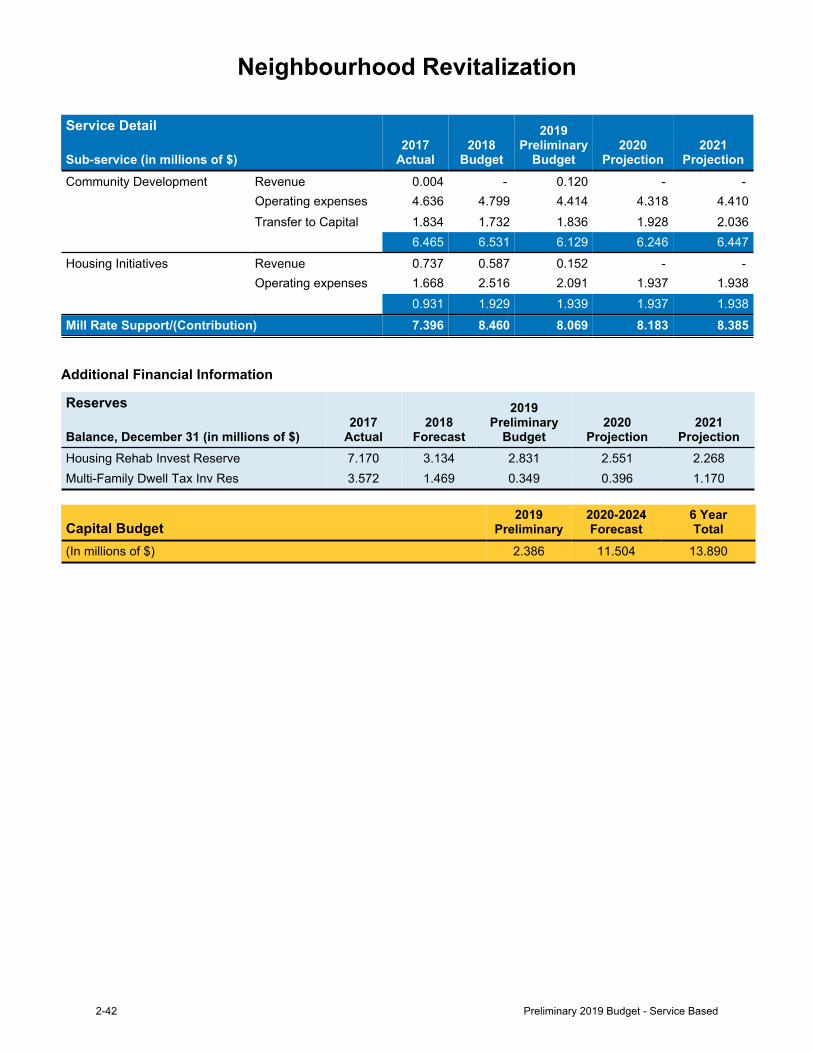
Neighbourhood Revitalization
Service Detail
Sub-service (in millions of $)2017
Actual2018
Budget
2019Preliminary
Budget2020
Projection2021
ProjectionCommunity Development Revenue 0.004 - 0.120 - -
Operating expenses 4.636 4.799 4.414 4.318 4.410Transfer to Capital 1.834 1.732 1.836 1.928 2.036
6.465 6.531 6.129 6.246 6.447Housing Initiatives Revenue 0.737 0.587 0.152 - -
Operating expenses 1.668 2.516 2.091 1.937 1.9380.931 1.929 1.939 1.937 1.938
Mill Rate Support/(Contribution) 7.396 8.460 8.069 8.183 8.385
Additional Financial Information
Reserves
Balance, December 31 (in millions of $)2017
Actual2018
Forecast
2019Preliminary
Budget2020
Projection2021
ProjectionHousing Rehab Invest Reserve 7.170 3.134 2.831 2.551 2.268Multi-Family Dwell Tax Inv Res 3.572 1.469 0.349 0.396 1.170
Capital Budget2019
Preliminary2020-2024Forecast
6 YearTotal
(In millions of $) 2.386 11.504 13.890
2-42 Preliminary 2019 Budget - Service Based
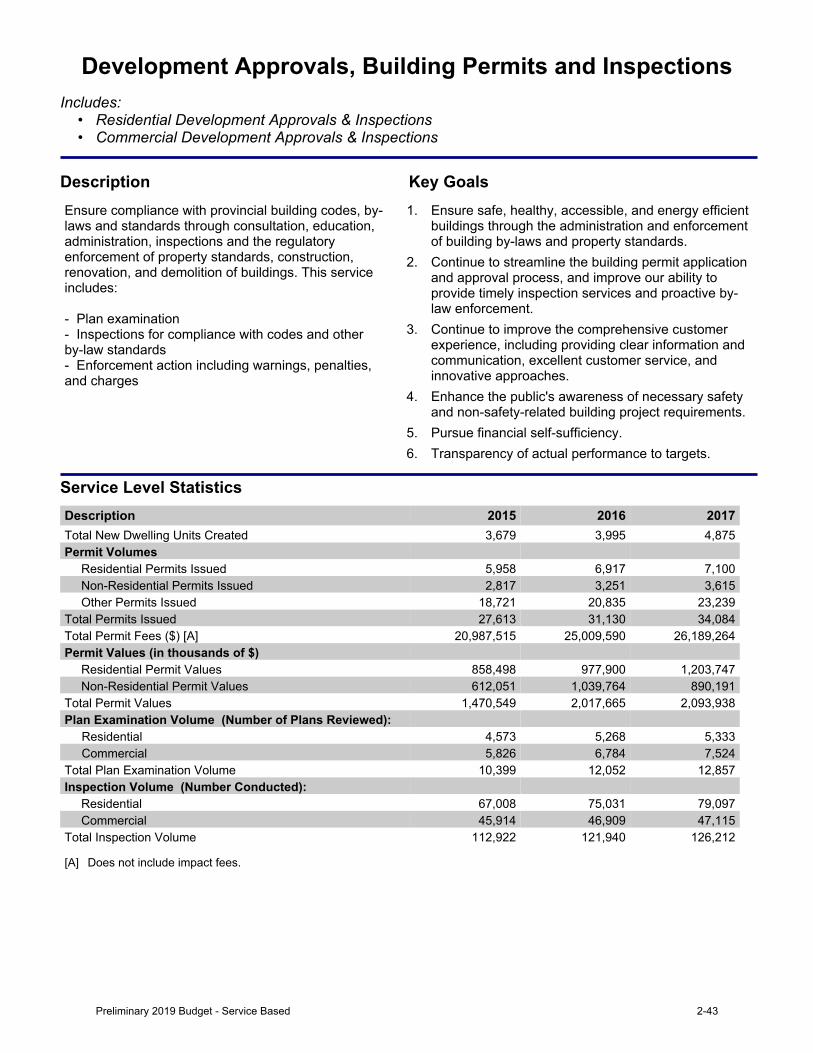
Development Approvals, Building Permits and InspectionsIncludes:
• Residential Development Approvals & Inspections• Commercial Development Approvals & Inspections
Description Key GoalsEnsure compliance with provincial building codes, by-laws and standards through consultation, education, administration, inspections and the regulatory enforcement of property standards, construction, renovation, and demolition of buildings. This service includes:-Planexamination- Inspections for compliance with codes and other by-lawstandards- Enforcement action including warnings, penalties, and charges
1. Ensure safe, healthy, accessible, and energy efficient buildings through the administration and enforcement of building by-laws and property standards.
2. Continue to streamline the building permit application and approval process, and improve our ability to provide timely inspection services and proactive by-law enforcement.
3. Continue to improve the comprehensive customer experience, including providing clear information and communication, excellent customer service, and innovative approaches.
4. Enhance the public's awareness of necessary safety and non-safety-related building project requirements.
5. Pursue financial self-sufficiency.6. Transparency of actual performance to targets.
Service Level StatisticsDescription 2015 2016 2017Total New Dwelling Units Created 3,679 3,995 4,875Permit Volumes
Residential Permits Issued 5,958 6,917 7,100Non-Residential Permits Issued 2,817 3,251 3,615Other Permits Issued 18,721 20,835 23,239
Total Permits Issued 27,613 31,130 34,084Total Permit Fees ($) [A] 20,987,515 25,009,590 26,189,264Permit Values (in thousands of $)
Residential Permit Values 858,498 977,900 1,203,747Non-Residential Permit Values 612,051 1,039,764 890,191
Total Permit Values 1,470,549 2,017,665 2,093,938Plan Examination Volume (Number of Plans Reviewed): Residential 4,573 5,268 5,333 Commercial 5,826 6,784 7,524Total Plan Examination Volume 10,399 12,052 12,857Inspection Volume (Number Conducted):
Residential 67,008 75,031 79,097Commercial 45,914 46,909 47,115
Total Inspection Volume 112,922 121,940 126,212
[A] Does not include impact fees.
Preliminary 2019 Budget - Service Based 2-43
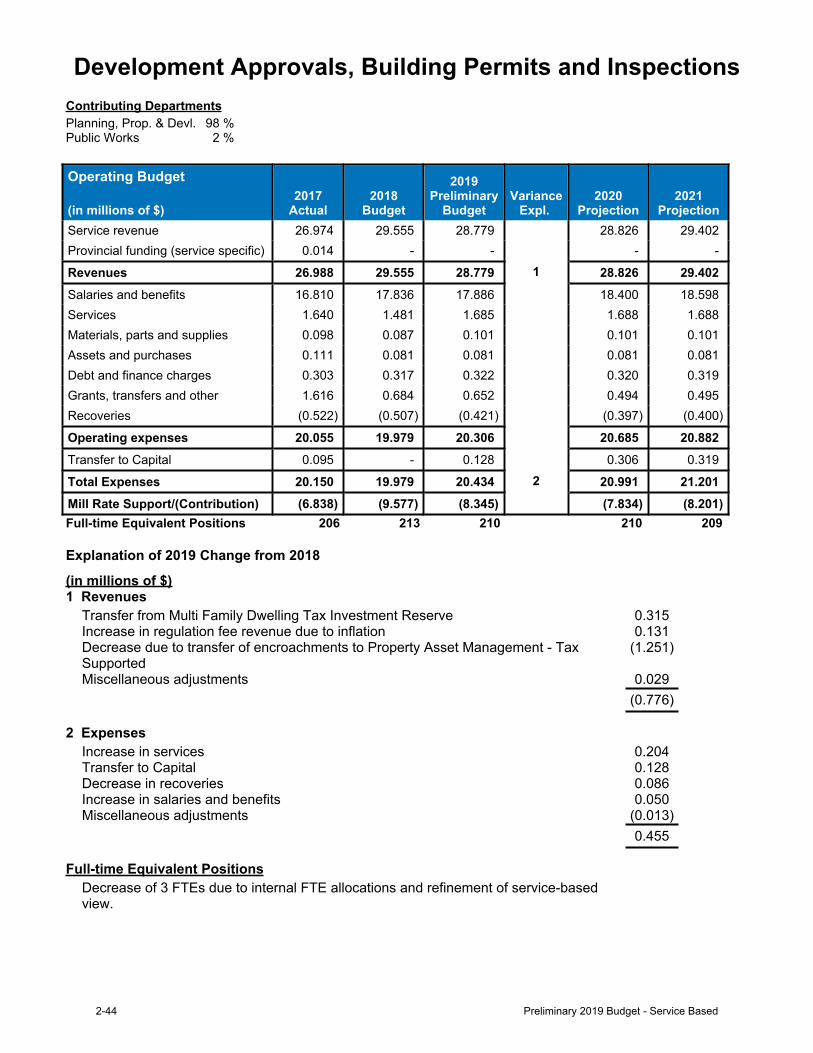
Development Approvals, Building Permits and InspectionsContributing DepartmentsPlanning, Prop. & Devl. 98 %Public Works 2 %
Operating Budget
(in millions of $)2017
Actual2018
Budget
2019Preliminary
BudgetVariance
Expl. 2020
Projection2021
ProjectionService revenue 26.974 29.555 28.779 28.826 29.402Provincial funding (service specific) 0.014 - - - -
Revenues 26.988 29.555 28.779 1 28.826 29.402Salaries and benefits 16.810 17.836 17.886 18.400 18.598Services 1.640 1.481 1.685 1.688 1.688Materials, parts and supplies 0.098 0.087 0.101 0.101 0.101Assets and purchases 0.111 0.081 0.081 0.081 0.081Debt and finance charges 0.303 0.317 0.322 0.320 0.319Grants, transfers and other 1.616 0.684 0.652 0.494 0.495Recoveries (0.522) (0.507) (0.421) (0.397) (0.400)
Operating expenses 20.055 19.979 20.306 20.685 20.882Transfer to Capital 0.095 - 0.128 0.306 0.319
Total Expenses 20.150 19.979 20.434 2 20.991 21.201Mill Rate Support/(Contribution) (6.838) (9.577) (8.345) (7.834) (8.201)Full-time Equivalent Positions 206 213 210 210 209
Explanation of 2019 Change from 2018
(in millions of $)1 Revenues
Transfer from Multi Family Dwelling Tax Investment Reserve 0.315Increase in regulation fee revenue due to inflation 0.131Decrease due to transfer of encroachments to Property Asset Management - Tax Supported
(1.251)
Miscellaneous adjustments 0.029(0.776)
2 ExpensesIncrease in services 0.204Transfer to Capital 0.128Decrease in recoveries 0.086Increase in salaries and benefits 0.050Miscellaneous adjustments (0.013)
0.455
Full-time Equivalent PositionsDecrease of 3 FTEs due to internal FTE allocations and refinement of service-based view.
2-44 Preliminary 2019 Budget - Service Based
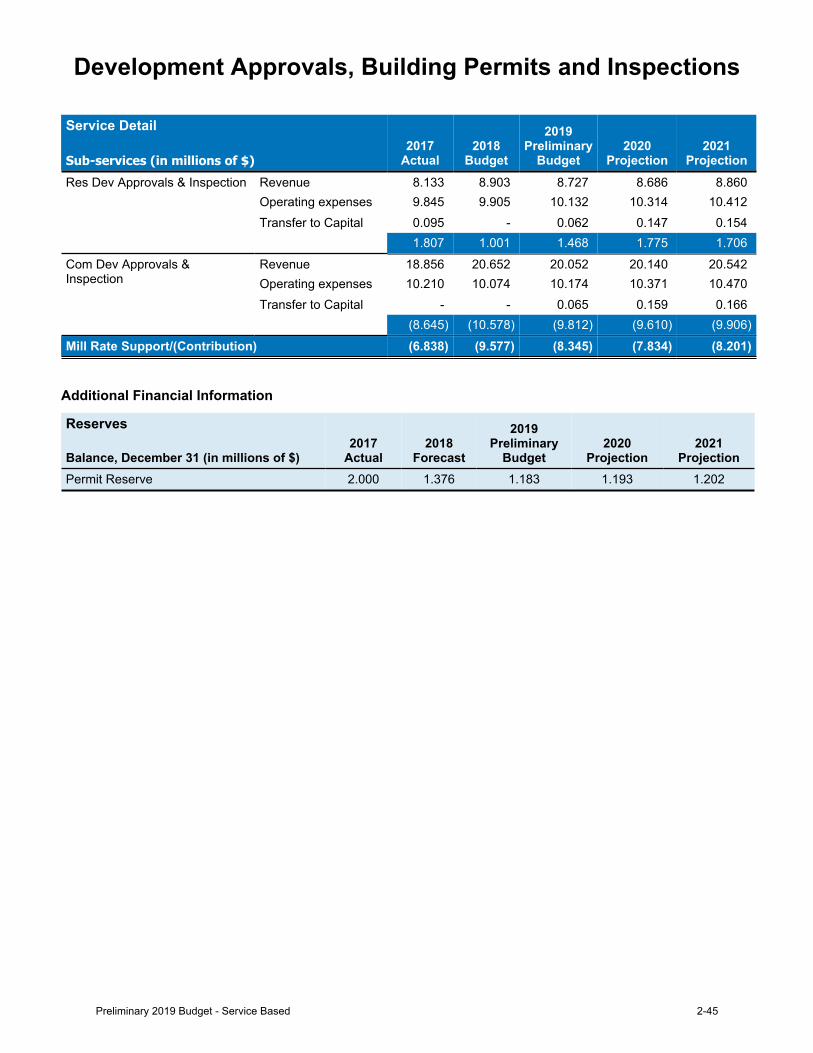
Development Approvals, Building Permits and Inspections
Service Detail
Sub-services (in millions of $)2017
Actual2018
Budget
2019Preliminary
Budget2020
Projection2021
ProjectionRes Dev Approvals & Inspection Revenue 8.133 8.903 8.727 8.686 8.860
Operating expenses 9.845 9.905 10.132 10.314 10.412Transfer to Capital 0.095 - 0.062 0.147 0.154
1.807 1.001 1.468 1.775 1.706Com Dev Approvals & Inspection
Revenue 18.856 20.652 20.052 20.140 20.542Operating expenses 10.210 10.074 10.174 10.371 10.470Transfer to Capital - - 0.065 0.159 0.166
(8.645) (10.578) (9.812) (9.610) (9.906)Mill Rate Support/(Contribution) (6.838) (9.577) (8.345) (7.834) (8.201)
Additional Financial Information
Reserves
Balance, December 31 (in millions of $)2017
Actual2018
Forecast
2019Preliminary
Budget2020
Projection2021
ProjectionPermit Reserve 2.000 1.376 1.183 1.193 1.202
Preliminary 2019 Budget - Service Based 2-45
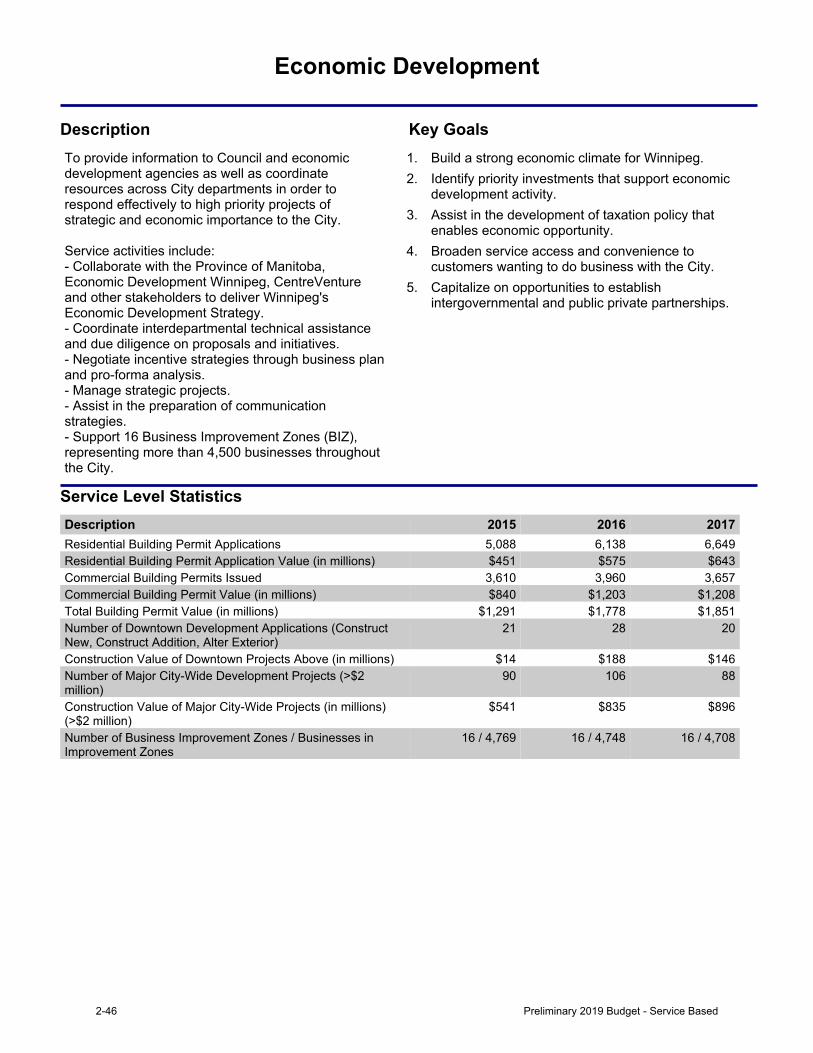
Economic Development
Description Key GoalsTo provide information to Council and economic development agencies as well as coordinate resources across City departments in order to respond effectively to high priority projects of strategicandeconomicimportancetotheCity.Serviceactivitiesinclude:- Collaborate with the Province of Manitoba, Economic Development Winnipeg, CentreVenture and other stakeholders to deliver Winnipeg's EconomicDevelopmentStrategy.- Coordinate interdepartmental technical assistance andduediligenceonproposalsandinitiatives.- Negotiate incentive strategies through business plan andpro-formaanalysis.-Managestrategicprojects.- Assist in the preparation of communication strategies.- Support 16 Business Improvement Zones (BIZ), representing more than 4,500 businesses throughout the City.
1. Build a strong economic climate for Winnipeg.2. Identify priority investments that support economic
development activity.3. Assist in the development of taxation policy that
enables economic opportunity.4. Broaden service access and convenience to
customers wanting to do business with the City.5. Capitalize on opportunities to establish
intergovernmental and public private partnerships.
Service Level StatisticsDescription 2015 2016 2017Residential Building Permit Applications 5,088 6,138 6,649Residential Building Permit Application Value (in millions) $451 $575 $643Commercial Building Permits Issued 3,610 3,960 3,657Commercial Building Permit Value (in millions) $840 $1,203 $1,208Total Building Permit Value (in millions) $1,291 $1,778 $1,851Number of Downtown Development Applications (Construct New, Construct Addition, Alter Exterior)
21 28 20
Construction Value of Downtown Projects Above (in millions) $14 $188 $146Number of Major City-Wide Development Projects (>$2 million)
90 106 88
Construction Value of Major City-Wide Projects (in millions) (>$2 million)
$541 $835 $896
Number of Business Improvement Zones / Businesses in Improvement Zones
16 / 4,769 16 / 4,748 16 / 4,708
2-46 Preliminary 2019 Budget - Service Based
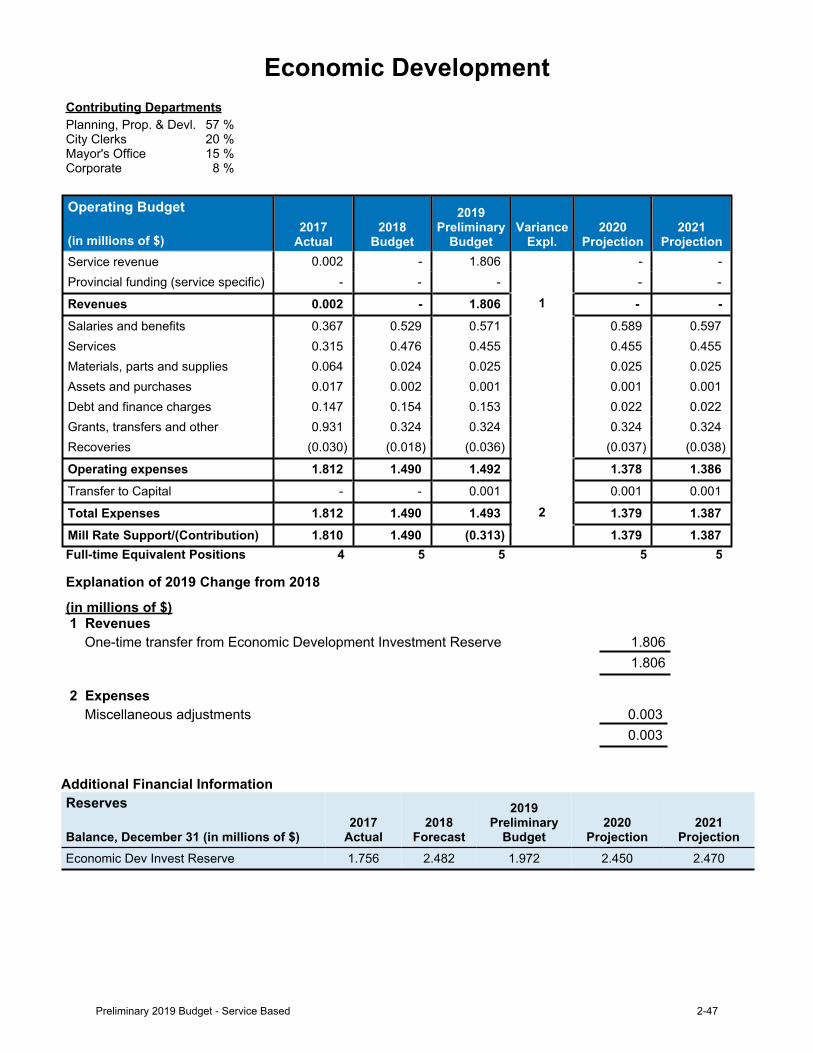
Economic DevelopmentContributing DepartmentsPlanning, Prop. & Devl. 57 %City Clerks 20 %Mayor's Office 15 %Corporate 8 %
Operating Budget
(in millions of $)2017
Actual2018
Budget
2019Preliminary
BudgetVariance
Expl.2020
Projection2021
ProjectionService revenue 0.002 - 1.806 - -
Provincial funding (service specific) - - - - -
Revenues 0.002 - 1.806 1 - -Salaries and benefits 0.367 0.529 0.571 0.589 0.597Services 0.315 0.476 0.455 0.455 0.455Materials, parts and supplies 0.064 0.024 0.025 0.025 0.025Assets and purchases 0.017 0.002 0.001 0.001 0.001Debt and finance charges 0.147 0.154 0.153 0.022 0.022Grants, transfers and other 0.931 0.324 0.324 0.324 0.324Recoveries (0.030) (0.018) (0.036) (0.037) (0.038)
Operating expenses 1.812 1.490 1.492 1.378 1.386Transfer to Capital - - 0.001 0.001 0.001
Total Expenses 1.812 1.490 1.493 2 1.379 1.387Mill Rate Support/(Contribution) 1.810 1.490 (0.313) 1.379 1.387Full-time Equivalent Positions 4 5 5 5 5
Explanation of 2019 Change from 2018
(in millions of $) 1 Revenues
One-time transfer from Economic Development Investment Reserve 1.8061.806
2 ExpensesMiscellaneous adjustments 0.003
0.003
Additional Financial InformationReserves
Balance, December 31 (in millions of $)2017
Actual2018
Forecast
2019Preliminary
Budget2020
Projection2021
ProjectionEconomic Dev Invest Reserve 1.756 2.482 1.972 2.450 2.470
Preliminary 2019 Budget - Service Based 2-47
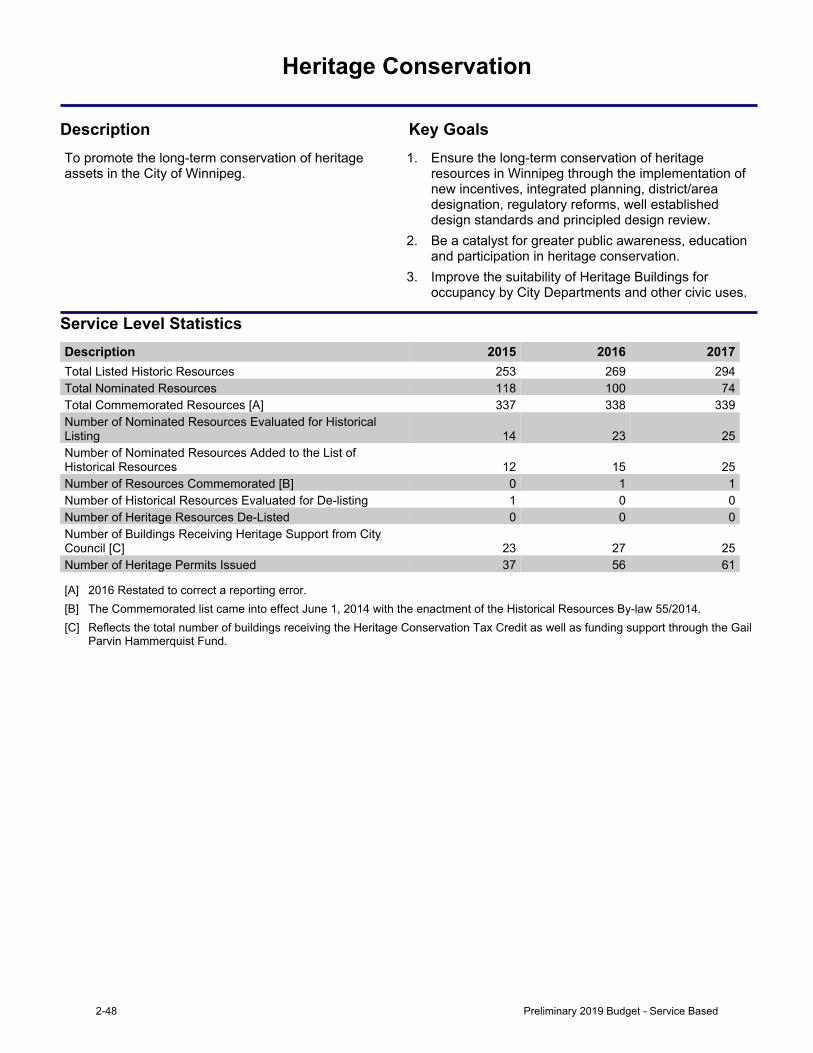
Heritage Conservation
Description Key GoalsTo promote the long-term conservation of heritage assets in the City of Winnipeg.
1. Ensure the long-term conservation of heritageresources in Winnipeg through the implementation ofnew incentives, integrated planning, district/areadesignation, regulatory reforms, well establisheddesign standards and principled design review.
2. Be a catalyst for greater public awareness, educationand participation in heritage conservation.
3. Improve the suitability of Heritage Buildings foroccupancy by City Departments and other civic uses.
Service Level StatisticsDescription 2015 2016 2017Total Listed Historic Resources 253 269 294Total Nominated Resources 118 100 74Total Commemorated Resources [A] 337 338 339Number of Nominated Resources Evaluated for Historical Listing 14 23 25Number of Nominated Resources Added to the List of Historical Resources 12 15 25Number of Resources Commemorated [B] 0 1 1Number of Historical Resources Evaluated for De-listing 1 0 0Number of Heritage Resources De-Listed 0 0 0Number of Buildings Receiving Heritage Support from City Council [C] 23 27 25Number of Heritage Permits Issued 37 56 61
[A] 2016 Restated to correct a reporting error.[B] The Commemorated list came into effect June 1, 2014 with the enactment of the Historical Resources By-law 55/2014.[C] Reflects the total number of buildings receiving the Heritage Conservation Tax Credit as well as funding support through the Gail
Parvin Hammerquist Fund.
2-48 Preliminary 2019 Budget - Service Based
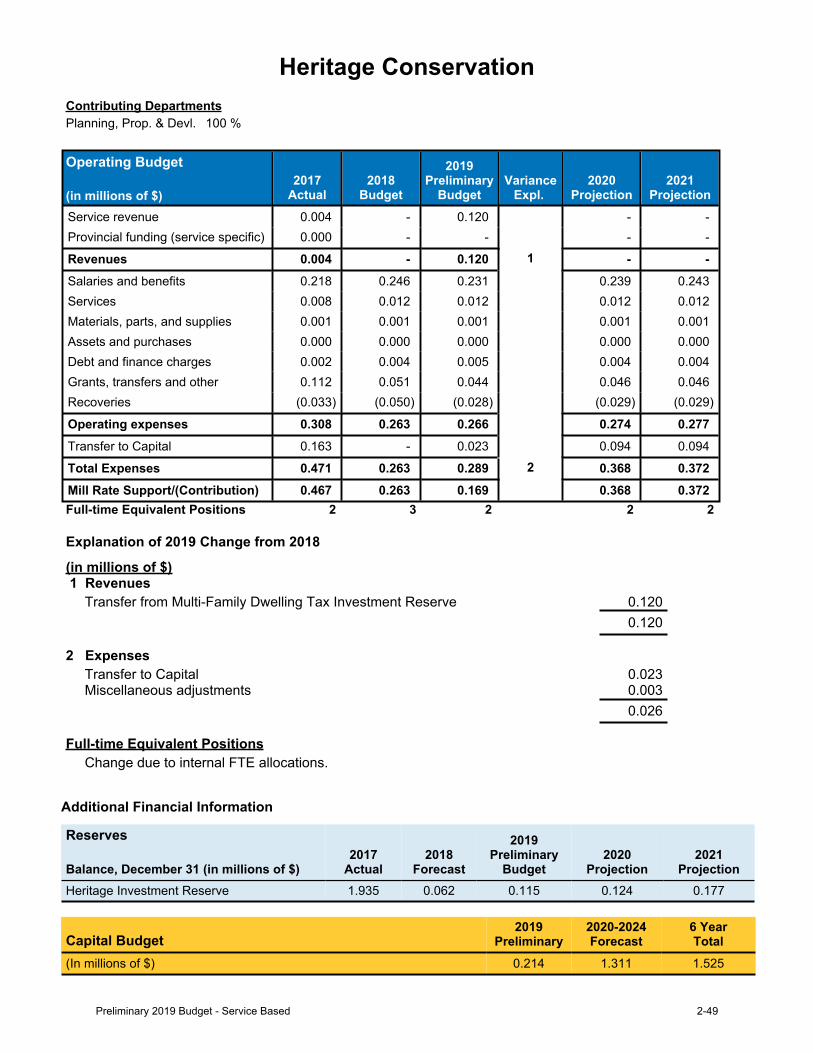
Heritage ConservationContributing DepartmentsPlanning, Prop. & Devl. 100 %
Operating Budget
(in millions of $)2017
Actual2018
Budget
2019Preliminary
BudgetVariance
Expl. 2020
Projection2021
ProjectionService revenue 0.004 - 0.120 - -Provincial funding (service specific) 0.000 - - - -
Revenues 0.004 - 0.120 1 - -Salaries and benefits 0.218 0.246 0.231 0.239 0.243Services 0.008 0.012 0.012 0.012 0.012Materials, parts, and supplies 0.001 0.001 0.001 0.001 0.001Assets and purchases 0.000 0.000 0.000 0.000 0.000Debt and finance charges 0.002 0.004 0.005 0.004 0.004Grants, transfers and other 0.112 0.051 0.044 0.046 0.046Recoveries (0.033) (0.050) (0.028) (0.029) (0.029)
Operating expenses 0.308 0.263 0.266 0.274 0.277Transfer to Capital 0.163 - 0.023 0.094 0.094
Total Expenses 0.471 0.263 0.289 2 0.368 0.372Mill Rate Support/(Contribution) 0.467 0.263 0.169 0.368 0.372Full-time Equivalent Positions 2 3 2 2 2
Explanation of 2019 Change from 2018
(in millions of $) 1 Revenues
Transfer from Multi-Family Dwelling Tax Investment Reserve 0.1200.120
2 ExpensesTransfer to Capital 0.023Miscellaneous adjustments 0.003
0.026
Full-time Equivalent PositionsChange due to internal FTE allocations.
Additional Financial Information
Reserves
Balance, December 31 (in millions of $)2017
Actual2018
Forecast
2019Preliminary
Budget2020
Projection2021
ProjectionHeritage Investment Reserve 1.935 0.062 0.115 0.124 0.177
Capital Budget2019
Preliminary2020-2024Forecast
6 YearTotal
(In millions of $) 0.214 1.311 1.525
Preliminary 2019 Budget - Service Based 2-49
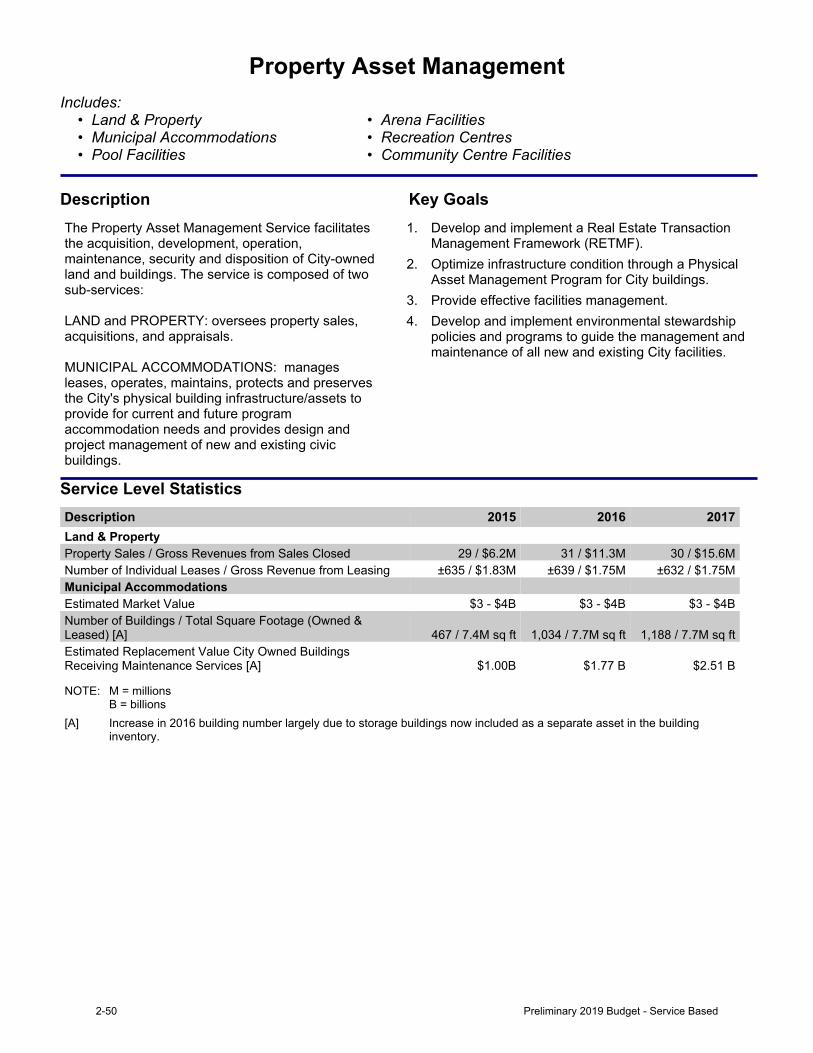
Property Asset ManagementIncludes:
• Land & Property • Arena Facilities• Municipal Accommodations • Recreation Centres• Pool Facilities • Community Centre Facilities
Description Key GoalsThe Property Asset Management Service facilitates the acquisition, development, operation, maintenance, security and disposition of City-owned land and buildings. The service is composed of two sub-services:LAND and PROPERTY: oversees property sales, acquisitions,andappraisals.MUNICIPAL ACCOMMODATIONS: manages leases, operates, maintains, protects and preserves the City's physical building infrastructure/assets to provide for current and future program accommodation needs and provides design and project management of new and existing civic buildings.
1. Develop and implement a Real Estate Transaction Management Framework (RETMF).
2. Optimize infrastructure condition through a Physical Asset Management Program for City buildings.
3. Provide effective facilities management.4. Develop and implement environmental stewardship
policies and programs to guide the management and maintenance of all new and existing City facilities.
Service Level StatisticsDescription 2015 2016 2017Land & Property Property Sales / Gross Revenues from Sales Closed 29 / $6.2M 31 / $11.3M 30 / $15.6MNumber of Individual Leases / Gross Revenue from Leasing ±635 / $1.83M ±639 / $1.75M ±632 / $1.75MMunicipal Accommodations Estimated Market Value $3 - $4B $3 - $4B $3 - $4BNumber of Buildings / Total Square Footage (Owned & Leased) [A] 467 / 7.4M sq ft 1,034 / 7.7M sq ft 1,188 / 7.7M sq ftEstimated Replacement Value City Owned Buildings Receiving Maintenance Services [A] $1.00B $1.77 B $2.51 B
NOTE: M=millionsB = billions
[A] Increase in 2016 building number largely due to storage buildings now included as a separate asset in the building inventory.
2-50 Preliminary 2019 Budget - Service Based
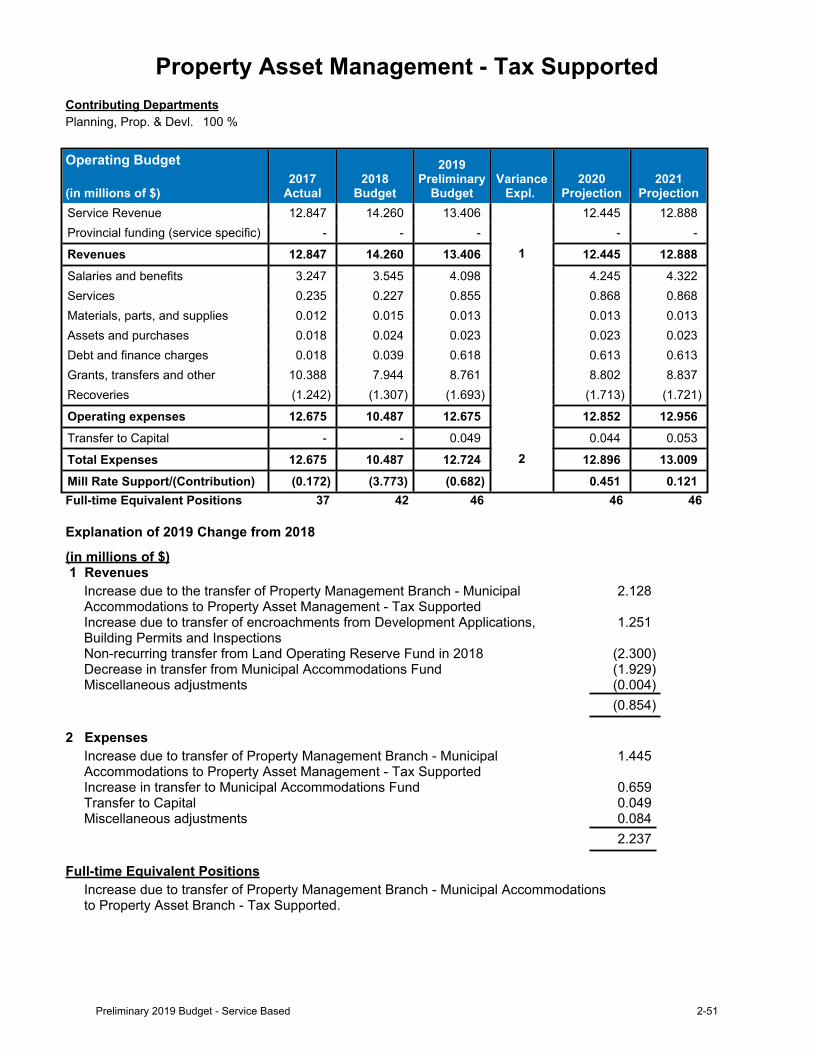
Property Asset Management - Tax SupportedContributing DepartmentsPlanning, Prop. & Devl. 100 %
Operating Budget
(in millions of $)2017
Actual2018
Budget
2019Preliminary
BudgetVariance
Expl. 2020
Projection2021
ProjectionService Revenue 12.847 14.260 13.406 12.445 12.888Provincial funding (service specific) - - - - -
Revenues 12.847 14.260 13.406 1 12.445 12.888Salaries and benefits 3.247 3.545 4.098 4.245 4.322Services 0.235 0.227 0.855 0.868 0.868Materials, parts, and supplies 0.012 0.015 0.013 0.013 0.013Assets and purchases 0.018 0.024 0.023 0.023 0.023Debt and finance charges 0.018 0.039 0.618 0.613 0.613Grants, transfers and other 10.388 7.944 8.761 8.802 8.837Recoveries (1.242) (1.307) (1.693) (1.713) (1.721)
Operating expenses 12.675 10.487 12.675 12.852 12.956Transfer to Capital - - 0.049 0.044 0.053
Total Expenses 12.675 10.487 12.724 2 12.896 13.009Mill Rate Support/(Contribution) (0.172) (3.773) (0.682) 0.451 0.121Full-time Equivalent Positions 37 42 46 46 46
Explanation of 2019 Change from 2018
(in millions of $) 1 Revenues
Increase due to the transfer of Property Management Branch - Municipal Accommodations to Property Asset Management - Tax Supported
2.128
Increase due to transfer of encroachments from Development Applications, Building Permits and Inspections
1.251
Non-recurring transfer from Land Operating Reserve Fund in 2018 (2.300)Decrease in transfer from Municipal Accommodations Fund (1.929)Miscellaneous adjustments (0.004)
(0.854)
2 ExpensesIncrease due to transfer of Property Management Branch - Municipal Accommodations to Property Asset Management - Tax Supported
1.445
Increase in transfer to Municipal Accommodations Fund 0.659Transfer to Capital 0.049Miscellaneous adjustments 0.084
2.237
Full-time Equivalent PositionsIncrease due to transfer of Property Management Branch - Municipal Accommodations to Property Asset Branch - Tax Supported.
Preliminary 2019 Budget - Service Based 2-51
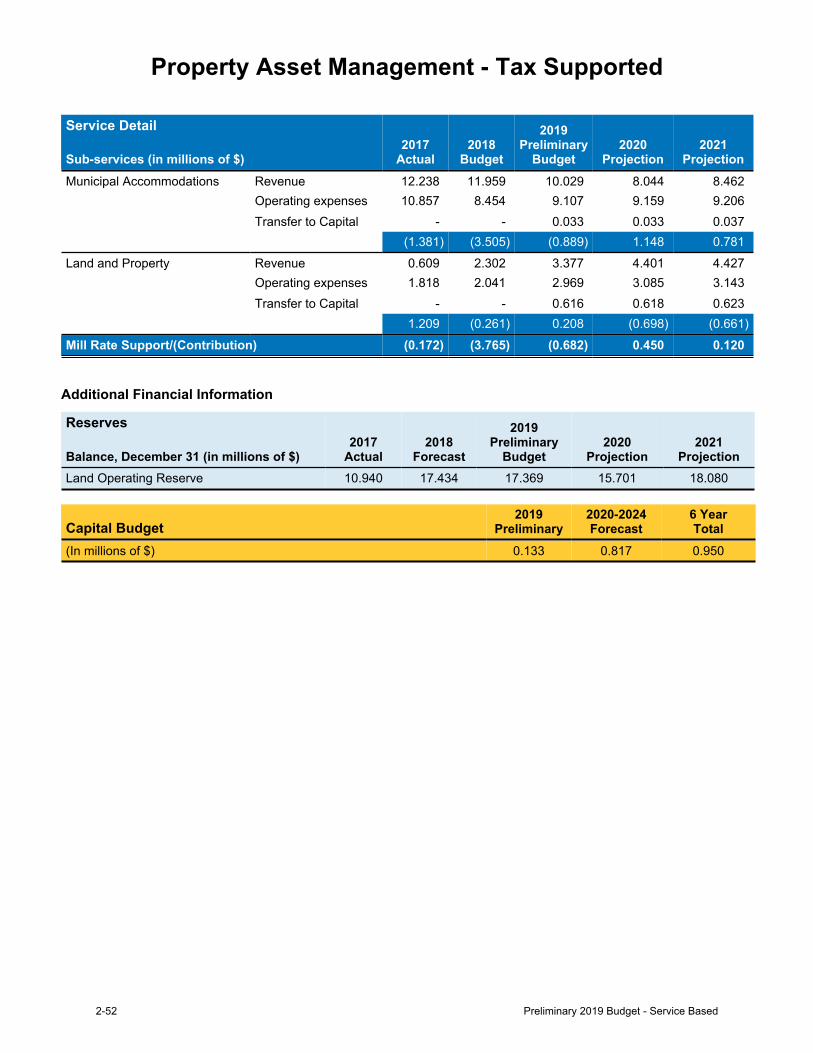
Property Asset Management - Tax Supported
Service Detail
Sub-services (in millions of $)2017
Actual2018
Budget
2019Preliminary
Budget2020
Projection2021
ProjectionMunicipal Accommodations Revenue 12.238 11.959 10.029 8.044 8.462
Operating expenses 10.857 8.454 9.107 9.159 9.206Transfer to Capital - - 0.033 0.033 0.037
(1.381) (3.505) (0.889) 1.148 0.781Land and Property Revenue 0.609 2.302 3.377 4.401 4.427
Operating expenses 1.818 2.041 2.969 3.085 3.143Transfer to Capital - - 0.616 0.618 0.623
1.209 (0.261) 0.208 (0.698) (0.661)Mill Rate Support/(Contribution) (0.172) (3.765) (0.682) 0.450 0.120
Additional Financial Information
Reserves
Balance, December 31 (in millions of $)2017
Actual2018
Forecast
2019Preliminary
Budget2020
Projection2021
ProjectionLand Operating Reserve 10.940 17.434 17.369 15.701 18.080
Capital Budget2019
Preliminary2020-2024Forecast
6 YearTotal
(In millions of $) 0.133 0.817 0.950
2-52 Preliminary 2019 Budget - Service Based
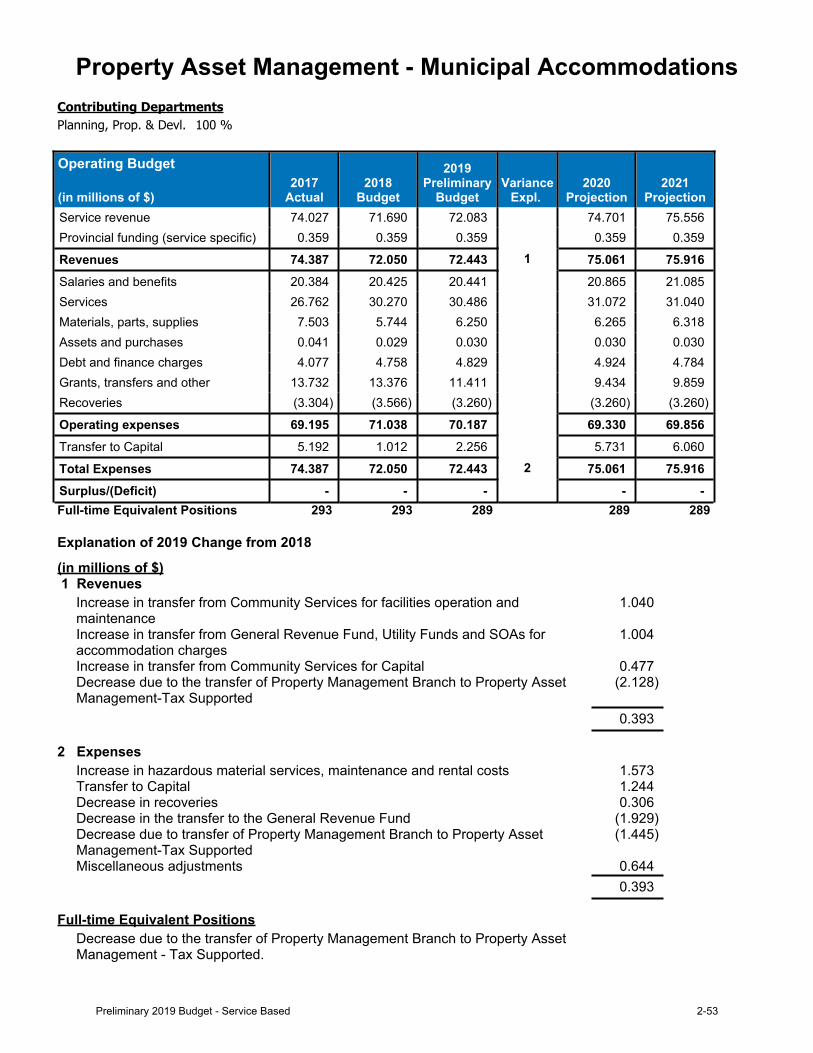
Property Asset Management - Municipal AccommodationsContributing DepartmentsPlanning, Prop. & Devl. 100 %
Operating Budget
(in millions of $)2017
Actual2018
Budget
2019Preliminary
BudgetVariance
Expl. 2020
Projection2021
ProjectionService revenue 74.027 71.690 72.083 74.701 75.556Provincial funding (service specific) 0.359 0.359 0.359 0.359 0.359
Revenues 74.387 72.050 72.443 1 75.061 75.916Salaries and benefits 20.384 20.425 20.441 20.865 21.085Services 26.762 30.270 30.486 31.072 31.040Materials, parts, supplies 7.503 5.744 6.250 6.265 6.318Assets and purchases 0.041 0.029 0.030 0.030 0.030Debt and finance charges 4.077 4.758 4.829 4.924 4.784Grants, transfers and other 13.732 13.376 11.411 9.434 9.859Recoveries (3.304) (3.566) (3.260) (3.260) (3.260)
Operating expenses 69.195 71.038 70.187 69.330 69.856Transfer to Capital 5.192 1.012 2.256 5.731 6.060
Total Expenses 74.387 72.050 72.443 2 75.061 75.916Surplus/(Deficit) - - - - -Full-time Equivalent Positions 293 293 289 289 289
Explanation of 2019 Change from 2018
(in millions of $) 1 Revenues
Increase in transfer from Community Services for facilities operation and maintenance
1.040
Increase in transfer from General Revenue Fund, Utility Funds and SOAs for accommodation charges
1.004
Increase in transfer from Community Services for Capital 0.477Decrease due to the transfer of Property Management Branch to Property Asset Management-Tax Supported
(2.128)
0.393
2 ExpensesIncrease in hazardous material services, maintenance and rental costs 1.573Transfer to Capital 1.244Decrease in recoveries 0.306Decrease in the transfer to the General Revenue Fund (1.929)Decrease due to transfer of Property Management Branch to Property Asset Management-Tax Supported
(1.445)
Miscellaneous adjustments 0.6440.393
Full-time Equivalent PositionsDecrease due to the transfer of Property Management Branch to Property Asset Management - Tax Supported.
Preliminary 2019 Budget - Service Based 2-53
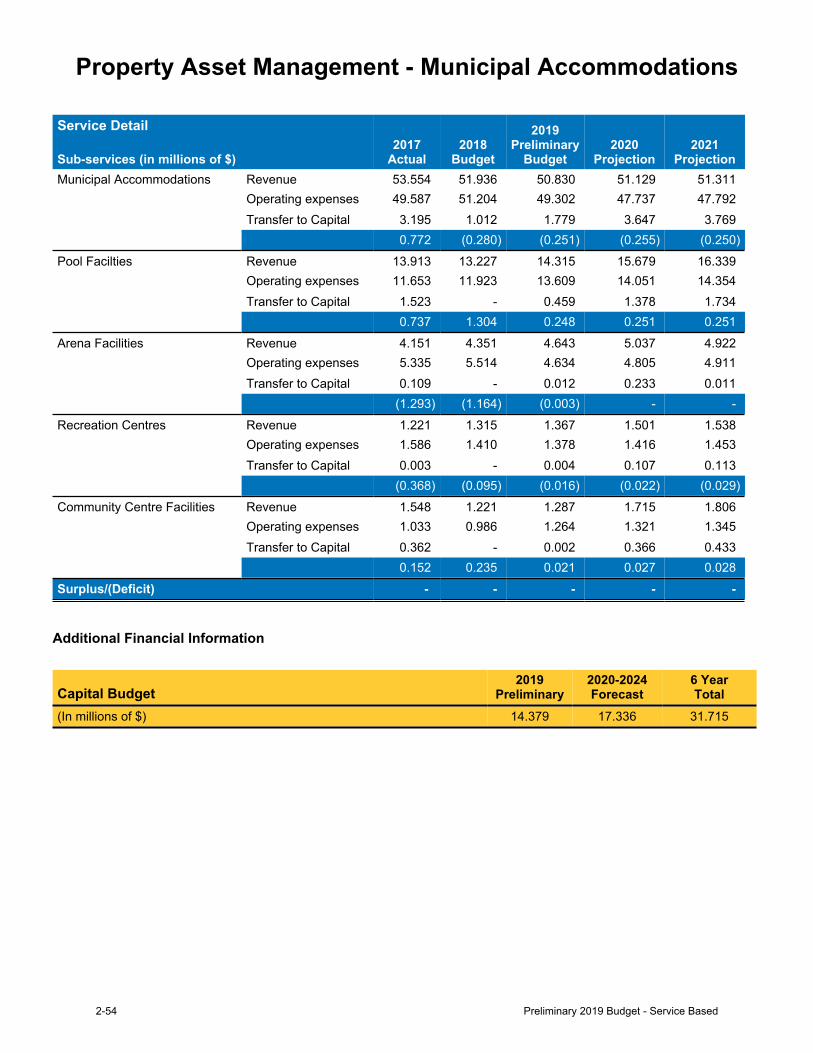
Property Asset Management - Municipal Accommodations
Service Detail
Sub-services (in millions of $)2017
Actual2018
Budget
2019Preliminary
Budget2020
Projection2021
ProjectionMunicipal Accommodations Revenue 53.554 51.936 50.830 51.129 51.311
Operating expenses 49.587 51.204 49.302 47.737 47.792Transfer to Capital 3.195 1.012 1.779 3.647 3.769
0.772 (0.280) (0.251) (0.255) (0.250)Pool Facilties Revenue 13.913 13.227 14.315 15.679 16.339
Operating expenses 11.653 11.923 13.609 14.051 14.354Transfer to Capital 1.523 - 0.459 1.378 1.734
0.737 1.304 0.248 0.251 0.251Arena Facilities Revenue 4.151 4.351 4.643 5.037 4.922
Operating expenses 5.335 5.514 4.634 4.805 4.911Transfer to Capital 0.109 - 0.012 0.233 0.011
(1.293) (1.164) (0.003) - -Recreation Centres Revenue 1.221 1.315 1.367 1.501 1.538
Operating expenses 1.586 1.410 1.378 1.416 1.453Transfer to Capital 0.003 - 0.004 0.107 0.113
(0.368) (0.095) (0.016) (0.022) (0.029)Community Centre Facilities Revenue 1.548 1.221 1.287 1.715 1.806
Operating expenses 1.033 0.986 1.264 1.321 1.345Transfer to Capital 0.362 - 0.002 0.366 0.433
0.152 0.235 0.021 0.027 0.028Surplus/(Deficit) - - - - -
Additional Financial Information
Capital Budget2019
Preliminary2020-2024Forecast
6 YearTotal
(In millions of $) 14.379 17.336 31.715
2-54 Preliminary 2019 Budget - Service Based
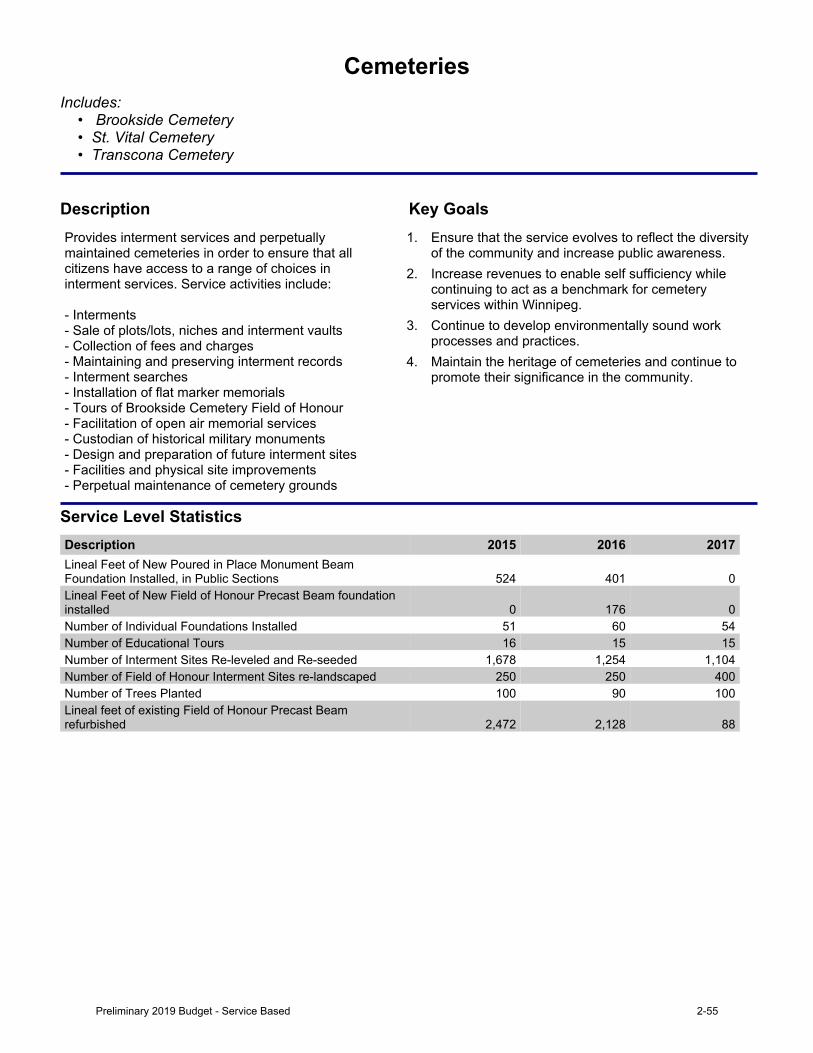
CemeteriesIncludes:
• Brookside Cemetery• St. Vital Cemetery• Transcona Cemetery
Description Key GoalsProvides interment services and perpetually maintained cemeteries in order to ensure that all citizens have access to a range of choices in intermentservices.Serviceactivitiesinclude:-Interments-Saleofplots/lots,nichesandintermentvaults-Collectionoffeesandcharges-Maintainingandpreservingintermentrecords-Intermentsearches-Installationofflatmarkermemorials-ToursofBrooksideCemeteryFieldofHonour-Facilitationofopenairmemorialservices-Custodianofhistoricalmilitarymonuments-Designandpreparationoffutureintermentsites-Facilitiesandphysicalsiteimprovements- Perpetual maintenance of cemetery grounds
1. Ensure that the service evolves to reflect the diversity of the community and increase public awareness.
2. Increase revenues to enable self sufficiency while continuing to act as a benchmark for cemetery services within Winnipeg.
3. Continue to develop environmentally sound work processes and practices.
4. Maintain the heritage of cemeteries and continue to promote their significance in the community.
Service Level StatisticsDescription 2015 2016 2017Lineal Feet of New Poured in Place Monument Beam Foundation Installed, in Public Sections 524 401 0Lineal Feet of New Field of Honour Precast Beam foundation installed 0 176 0Number of Individual Foundations Installed 51 60 54Number of Educational Tours 16 15 15Number of Interment Sites Re-leveled and Re-seeded 1,678 1,254 1,104Number of Field of Honour Interment Sites re-landscaped 250 250 400Number of Trees Planted 100 90 100Lineal feet of existing Field of Honour Precast Beam refurbished 2,472 2,128 88
Preliminary 2019 Budget - Service Based 2-55
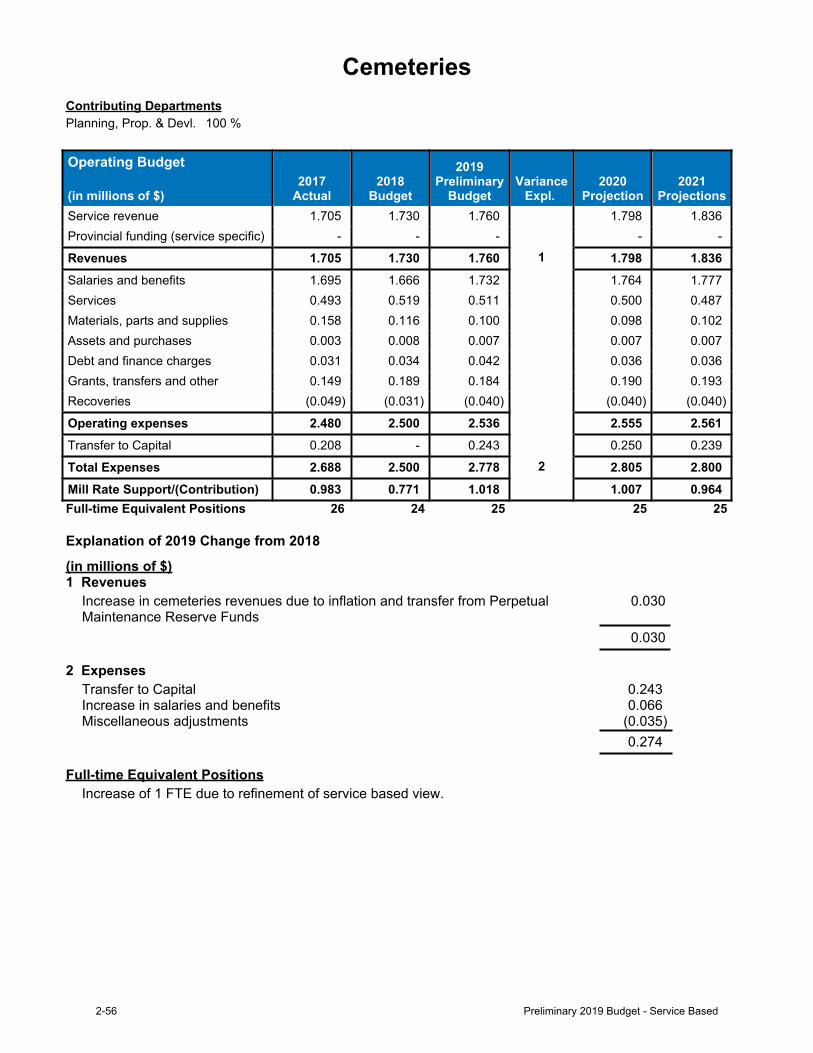
CemeteriesContributing DepartmentsPlanning, Prop. & Devl. 100 %
Operating Budget
(in millions of $)2017
Actual2018
Budget
2019Preliminary
BudgetVariance
Expl. 2020
Projection2021
ProjectionsService revenue 1.705 1.730 1.760 1.798 1.836Provincial funding (service specific) - - - - -
Revenues 1.705 1.730 1.760 1 1.798 1.836Salaries and benefits 1.695 1.666 1.732 1.764 1.777Services 0.493 0.519 0.511 0.500 0.487Materials, parts and supplies 0.158 0.116 0.100 0.098 0.102Assets and purchases 0.003 0.008 0.007 0.007 0.007Debt and finance charges 0.031 0.034 0.042 0.036 0.036Grants, transfers and other 0.149 0.189 0.184 0.190 0.193Recoveries (0.049) (0.031) (0.040) (0.040) (0.040)
Operating expenses 2.480 2.500 2.536 2.555 2.561Transfer to Capital 0.208 - 0.243 0.250 0.239
Total Expenses 2.688 2.500 2.778 2 2.805 2.800Mill Rate Support/(Contribution) 0.983 0.771 1.018 1.007 0.964Full-time Equivalent Positions 26 24 25 25 25
Explanation of 2019 Change from 2018
(in millions of $)1 Revenues
Increase in cemeteries revenues due to inflation and transfer from Perpetual Maintenance Reserve Funds
0.030
0.030
2 ExpensesTransfer to Capital 0.243Increase in salaries and benefits 0.066Miscellaneous adjustments (0.035)
0.274
Full-time Equivalent PositionsIncrease of 1 FTE due to refinement of service based view.
2-56 Preliminary 2019 Budget - Service Based
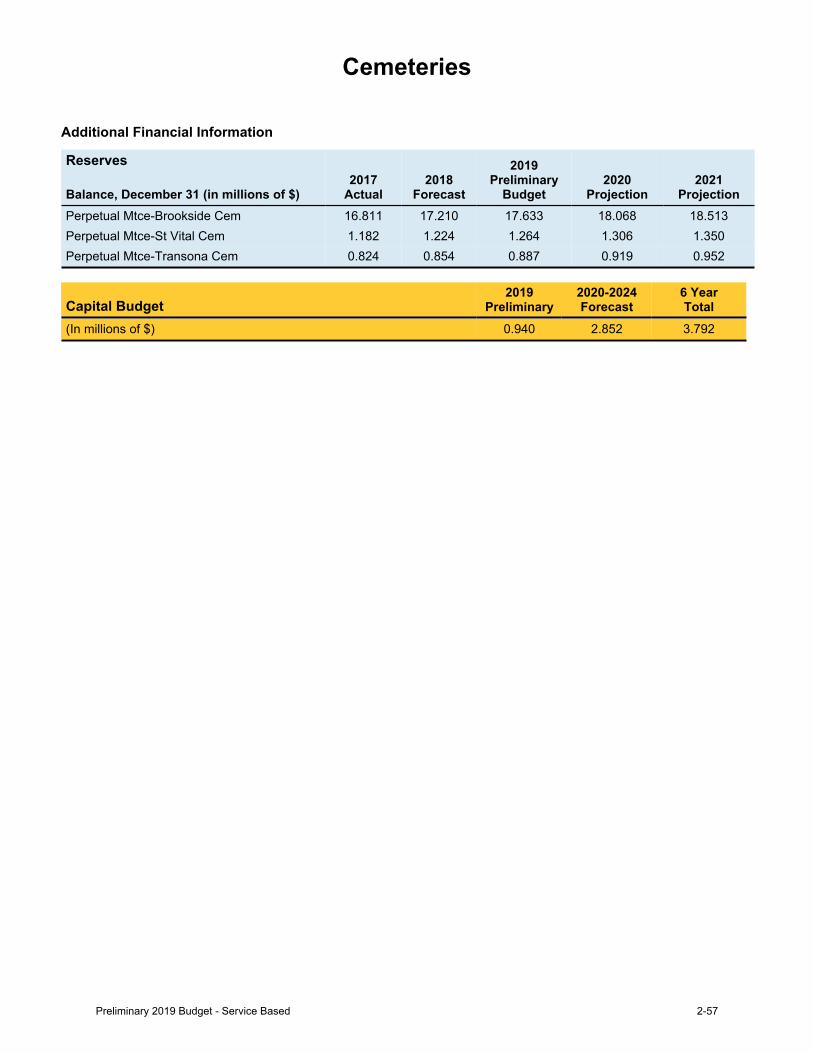
Cemeteries
Additional Financial Information
Reserves
Balance, December 31 (in millions of $)2017
Actual2018
Forecast
2019Preliminary
Budget2020
Projection2021
ProjectionPerpetual Mtce-Brookside Cem 16.811 17.210 17.633 18.068 18.513Perpetual Mtce-St Vital Cem 1.182 1.224 1.264 1.306 1.350Perpetual Mtce-Transona Cem 0.824 0.854 0.887 0.919 0.952
Capital Budget2019
Preliminary2020-2024Forecast
6 YearTotal
(In millions of $) 0.940 2.852 3.792
Preliminary 2019 Budget - Service Based 2-57

2-58 Preliminary 2019 Budget - Service Based
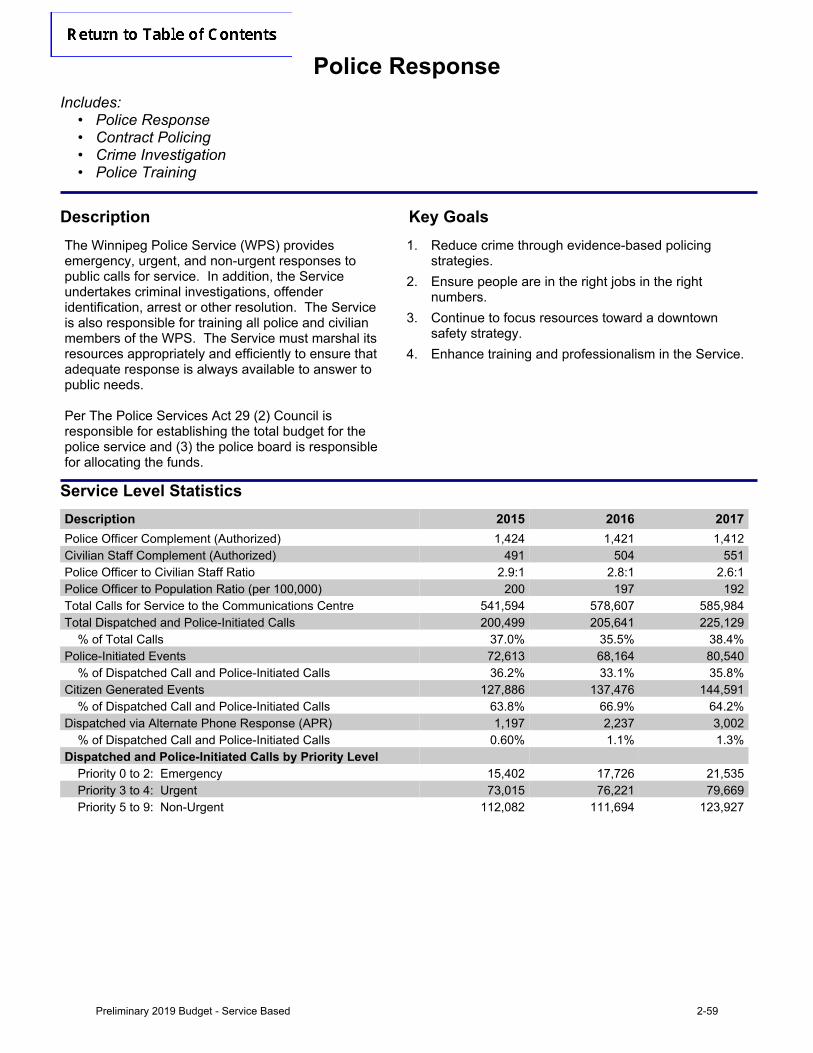
Police ResponseIncludes:
• Police Response• Contract Policing• Crime Investigation• Police Training
Description Key GoalsThe Winnipeg Police Service (WPS) provides emergency, urgent, and non-urgent responses to public calls for service. In addition, the Service undertakes criminal investigations, offender identification, arrest or other resolution. The Service is also responsible for training all police and civilian members of the WPS. The Service must marshal its resources appropriately and efficiently to ensure that adequate response is always available to answer to publicneeds.Per The Police Services Act 29 (2) Council is responsible for establishing the total budget for the police service and (3) the police board is responsible for allocating the funds.
1. Reduce crime through evidence-based policing strategies.
2. Ensure people are in the right jobs in the right numbers.
3. Continue to focus resources toward a downtown safety strategy.
4. Enhance training and professionalism in the Service.
Service Level StatisticsDescription 2015 2016 2017Police Officer Complement (Authorized) 1,424 1,421 1,412Civilian Staff Complement (Authorized) 491 504 551Police Officer to Civilian Staff Ratio 2.9:1 2.8:1 2.6:1Police Officer to Population Ratio (per 100,000) 200 197 192Total Calls for Service to the Communications Centre 541,594 578,607 585,984Total Dispatched and Police-Initiated Calls 200,499 205,641 225,129
% of Total Calls 37.0% 35.5% 38.4%Police-Initiated Events 72,613 68,164 80,540
% of Dispatched Call and Police-Initiated Calls 36.2% 33.1% 35.8%Citizen Generated Events 127,886 137,476 144,591
% of Dispatched Call and Police-Initiated Calls 63.8% 66.9% 64.2%Dispatched via Alternate Phone Response (APR) 1,197 2,237 3,002
% of Dispatched Call and Police-Initiated Calls 0.60% 1.1% 1.3%Dispatched and Police-Initiated Calls by Priority Level
Priority 0 to 2: Emergency 15,402 17,726 21,535Priority 3 to 4: Urgent 73,015 76,221 79,669Priority 5 to 9: Non-Urgent 112,082 111,694 123,927
Preliminary 2019 Budget - Service Based 2-59
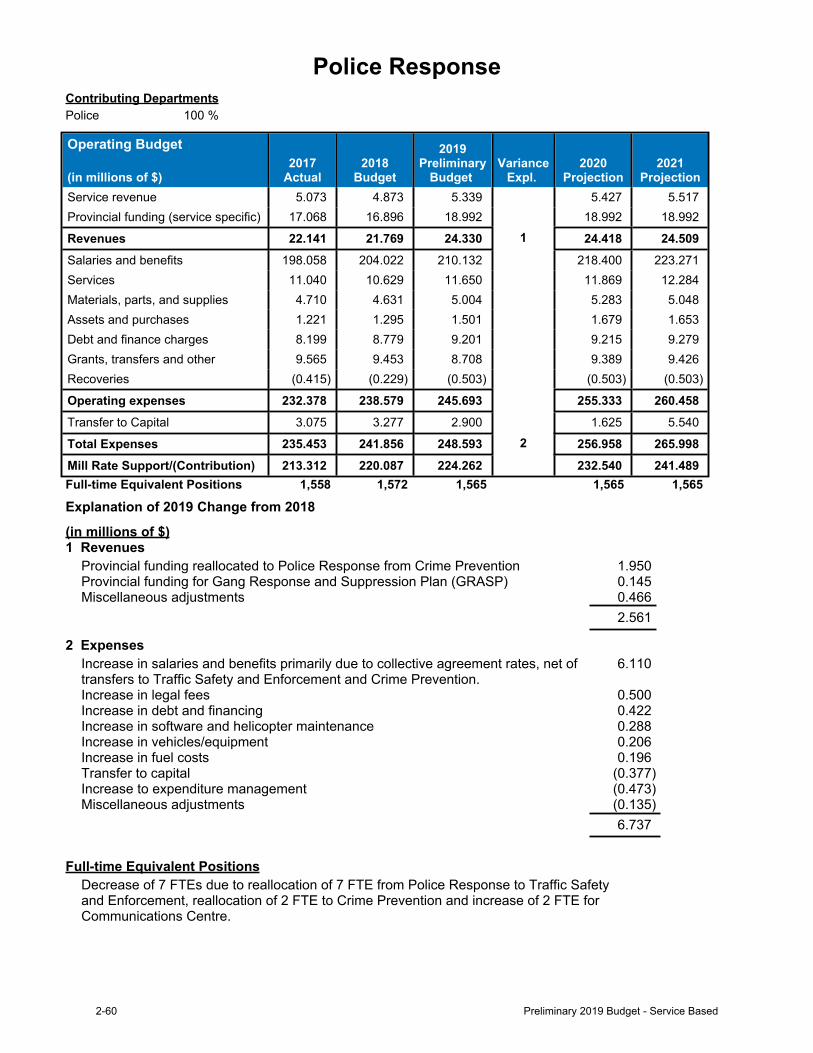
Police ResponseContributing DepartmentsPolice 100 %
Operating Budget
(in millions of $)2017
Actual2018
Budget
2019Preliminary
Budget Variance
Expl. 2020
Projection2021
ProjectionService revenue 5.073 4.873 5.339 5.427 5.517Provincial funding (service specific) 17.068 16.896 18.992 18.992 18.992
Revenues 22.141 21.769 24.330 1 24.418 24.509Salaries and benefits 198.058 204.022 210.132 218.400 223.271Services 11.040 10.629 11.650 11.869 12.284Materials, parts, and supplies 4.710 4.631 5.004 5.283 5.048Assets and purchases 1.221 1.295 1.501 1.679 1.653Debt and finance charges 8.199 8.779 9.201 9.215 9.279Grants, transfers and other 9.565 9.453 8.708 9.389 9.426Recoveries (0.415) (0.229) (0.503) (0.503) (0.503)
Operating expenses 232.378 238.579 245.693 255.333 260.458Transfer to Capital 3.075 3.277 2.900 1.625 5.540
Total Expenses 235.453 241.856 248.593 2 256.958 265.998Mill Rate Support/(Contribution) 213.312 220.087 224.262 232.540 241.489Full-time Equivalent Positions 1,558 1,572 1,565 1,565 1,565
Explanation of 2019 Change from 2018
(in millions of $)1 Revenues
Provincial funding reallocated to Police Response from Crime Prevention 1.950Provincial funding for Gang Response and Suppression Plan (GRASP) 0.145Miscellaneous adjustments 0.466
2.561
2 ExpensesIncrease in salaries and benefits primarily due to collective agreement rates, net of transfers to Traffic Safety and Enforcement and Crime Prevention.
6.110
Increase in legal fees 0.500Increase in debt and financing 0.422Increase in software and helicopter maintenance 0.288Increase in vehicles/equipment 0.206Increase in fuel costs 0.196Transfer to capital (0.377)Increase to expenditure management (0.473)Miscellaneous adjustments (0.135)
6.737
Full-time Equivalent PositionsDecrease of 7 FTEs due to reallocation of 7 FTE from Police Response to Traffic Safety and Enforcement, reallocation of 2 FTE to Crime Prevention and increase of 2 FTE for Communications Centre.
2-60 Preliminary 2019 Budget - Service Based
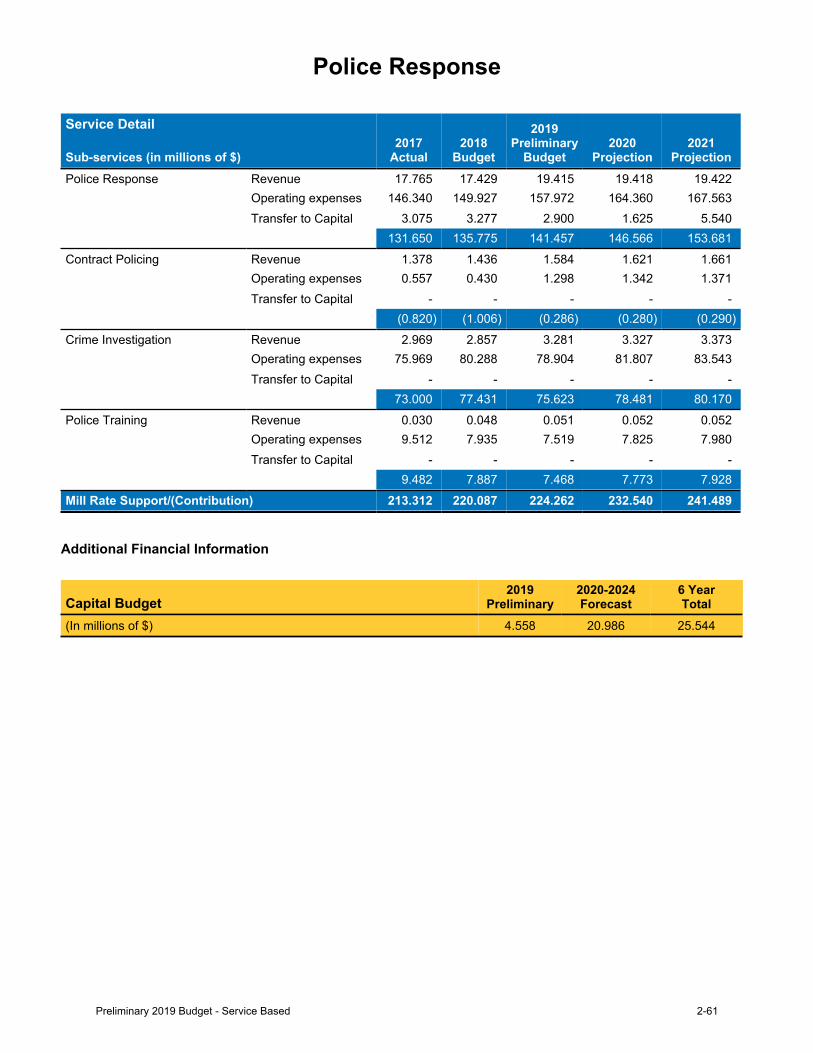
Police Response
Service Detail
Sub-services (in millions of $)2017
Actual2018
Budget
2019Preliminary
Budget2020
Projection2021
ProjectionPolice Response Revenue 17.765 17.429 19.415 19.418 19.422
Operating expenses 146.340 149.927 157.972 164.360 167.563Transfer to Capital 3.075 3.277 2.900 1.625 5.540
131.650 135.775 141.457 146.566 153.681Contract Policing Revenue 1.378 1.436 1.584 1.621 1.661
Operating expenses 0.557 0.430 1.298 1.342 1.371Transfer to Capital - - - - -
(0.820) (1.006) (0.286) (0.280) (0.290)Crime Investigation Revenue 2.969 2.857 3.281 3.327 3.373
Operating expenses 75.969 80.288 78.904 81.807 83.543Transfer to Capital - - - - -
73.000 77.431 75.623 78.481 80.170Police Training Revenue 0.030 0.048 0.051 0.052 0.052
Operating expenses 9.512 7.935 7.519 7.825 7.980Transfer to Capital - - - - -
9.482 7.887 7.468 7.773 7.928Mill Rate Support/(Contribution) 213.312 220.087 224.262 232.540 241.489
Additional Financial Information
Capital Budget2019
Preliminary2020-2024Forecast
6 YearTotal
(In millions of $) 4.558 20.986 25.544
Preliminary 2019 Budget - Service Based 2-61
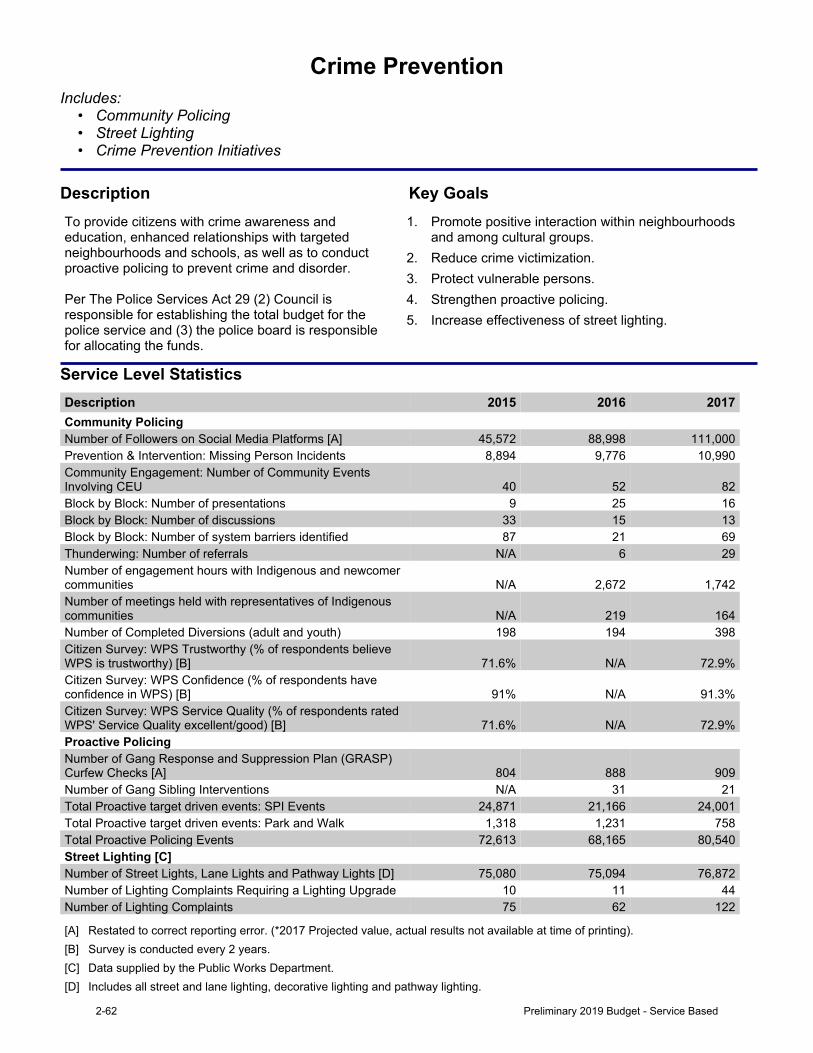
Crime PreventionIncludes:
• Community Policing• Street Lighting • Crime Prevention Initiatives
Description Key GoalsTo provide citizens with crime awareness and education, enhanced relationships with targeted neighbourhoods and schools, as well as to conduct proactivepolicingtopreventcrimeanddisorder.Per The Police Services Act 29 (2) Council is responsible for establishing the total budget for the police service and (3) the police board is responsible for allocating the funds.
1. Promote positive interaction within neighbourhoods and among cultural groups.
2. Reduce crime victimization.3. Protect vulnerable persons.4. Strengthen proactive policing.5. Increase effectiveness of street lighting.
Service Level StatisticsDescription 2015 2016 2017Community Policing Number of Followers on Social Media Platforms [A] 45,572 88,998 111,000Prevention & Intervention: Missing Person Incidents 8,894 9,776 10,990Community Engagement: Number of Community Events Involving CEU 40 52 82Block by Block: Number of presentations 9 25 16Block by Block: Number of discussions 33 15 13Block by Block: Number of system barriers identified 87 21 69Thunderwing: Number of referrals N/A 6 29Number of engagement hours with Indigenous and newcomer communities N/A 2,672 1,742Number of meetings held with representatives of Indigenous communities N/A 219 164Number of Completed Diversions (adult and youth) 198 194 398Citizen Survey: WPS Trustworthy (% of respondents believe WPS is trustworthy) [B] 71.6% N/A 72.9%Citizen Survey: WPS Confidence (% of respondents have confidence in WPS) [B] 91% N/A 91.3%Citizen Survey: WPS Service Quality (% of respondents rated WPS' Service Quality excellent/good) [B] 71.6% N/A 72.9%Proactive Policing Number of Gang Response and Suppression Plan (GRASP) Curfew Checks [A] 804 888 909Number of Gang Sibling Interventions N/A 31 21Total Proactive target driven events: SPI Events 24,871 21,166 24,001Total Proactive target driven events: Park and Walk 1,318 1,231 758Total Proactive Policing Events 72,613 68,165 80,540Street Lighting [C] Number of Street Lights, Lane Lights and Pathway Lights [D] 75,080 75,094 76,872Number of Lighting Complaints Requiring a Lighting Upgrade 10 11 44Number of Lighting Complaints 75 62 122
[A] Restated to correct reporting error. (*2017 Projected value, actual results not available at time of printing).[B] Survey is conducted every 2 years.[C] Data supplied by the Public Works Department.[D] Includes all street and lane lighting, decorative lighting and pathway lighting.
2-62 Preliminary 2019 Budget - Service Based
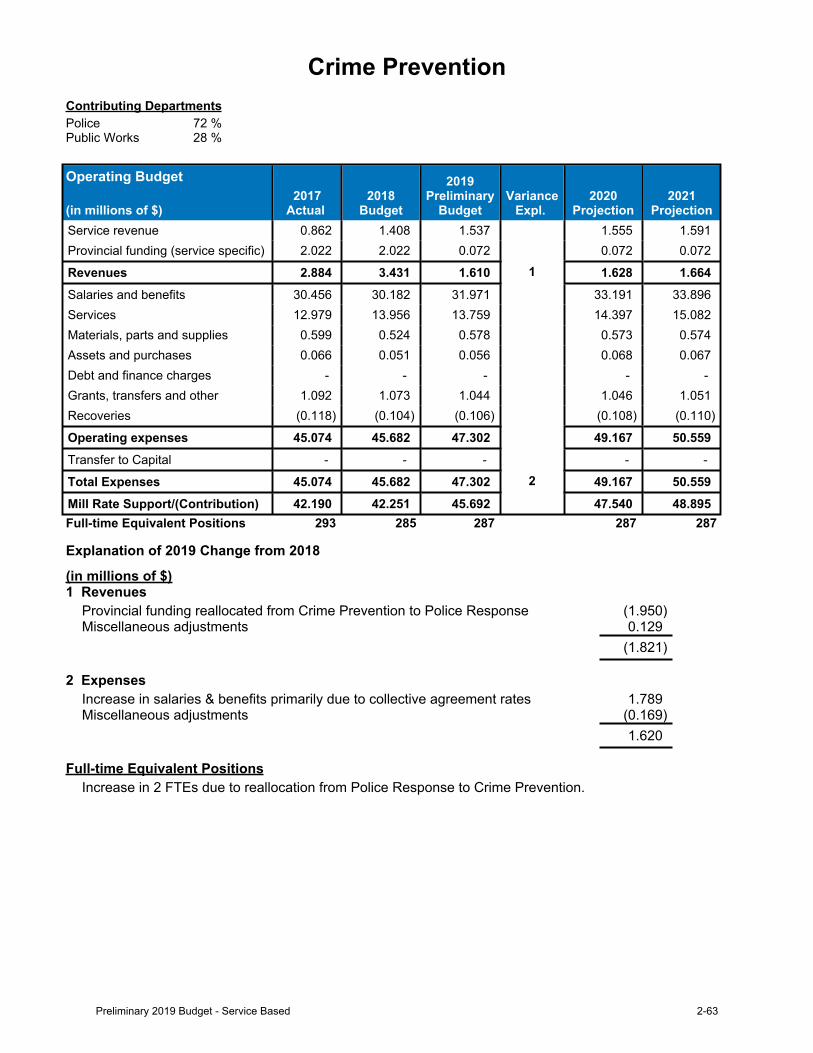
Crime PreventionContributing DepartmentsPolice 72 %Public Works 28 %
Operating Budget
(in millions of $)2017
Actual 2018
Budget
2019Preliminary
BudgetVariance
Expl. 2020
Projection2021
ProjectionService revenue 0.862 1.408 1.537 1.555 1.591Provincial funding (service specific) 2.022 2.022 0.072 0.072 0.072
Revenues 2.884 3.431 1.610 1 1.628 1.664Salaries and benefits 30.456 30.182 31.971 33.191 33.896Services 12.979 13.956 13.759 14.397 15.082Materials, parts and supplies 0.599 0.524 0.578 0.573 0.574Assets and purchases 0.066 0.051 0.056 0.068 0.067Debt and finance charges - - - - -
Grants, transfers and other 1.092 1.073 1.044 1.046 1.051Recoveries (0.118) (0.104) (0.106) (0.108) (0.110)
Operating expenses 45.074 45.682 47.302 49.167 50.559Transfer to Capital - - - - -
Total Expenses 45.074 45.682 47.302 2 49.167 50.559Mill Rate Support/(Contribution) 42.190 42.251 45.692 47.540 48.895Full-time Equivalent Positions 293 285 287 287 287
Explanation of 2019 Change from 2018
(in millions of $)1 Revenues
Provincial funding reallocated from Crime Prevention to Police Response (1.950)Miscellaneous adjustments 0.129
(1.821)
2 ExpensesIncrease in salaries & benefits primarily due to collective agreement rates 1.789Miscellaneous adjustments (0.169)
1.620
Full-time Equivalent PositionsIncrease in 2 FTEs due to reallocation from Police Response to Crime Prevention.
Preliminary 2019 Budget - Service Based 2-63
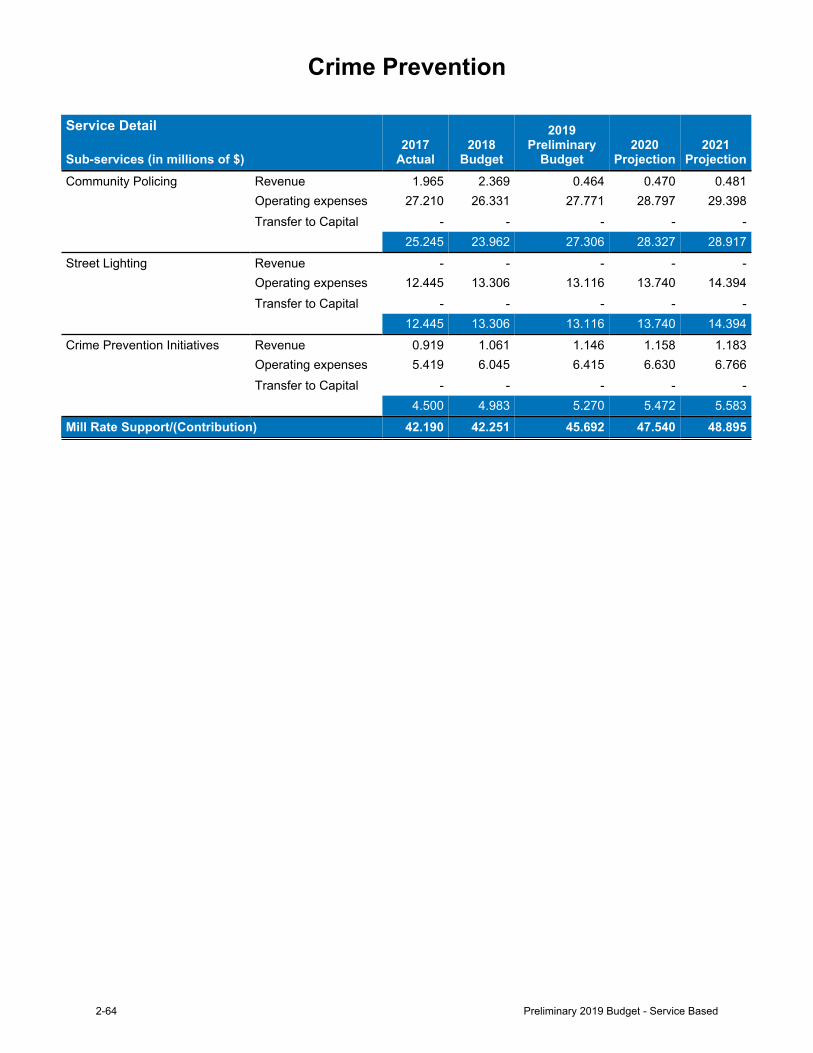
Crime Prevention
Service Detail
Sub-services (in millions of $)2017
Actual2018
Budget
2019Preliminary
Budget2020
Projection2021
ProjectionCommunity Policing Revenue 1.965 2.369 0.464 0.470 0.481
Operating expenses 27.210 26.331 27.771 28.797 29.398Transfer to Capital - - - - -
25.245 23.962 27.306 28.327 28.917Street Lighting Revenue - - - - -
Operating expenses 12.445 13.306 13.116 13.740 14.394Transfer to Capital - - - - -
12.445 13.306 13.116 13.740 14.394Crime Prevention Initiatives Revenue 0.919 1.061 1.146 1.158 1.183
Operating expenses 5.419 6.045 6.415 6.630 6.766Transfer to Capital - - - - -
4.500 4.983 5.270 5.472 5.583Mill Rate Support/(Contribution) 42.190 42.251 45.692 47.540 48.895
2-64 Preliminary 2019 Budget - Service Based
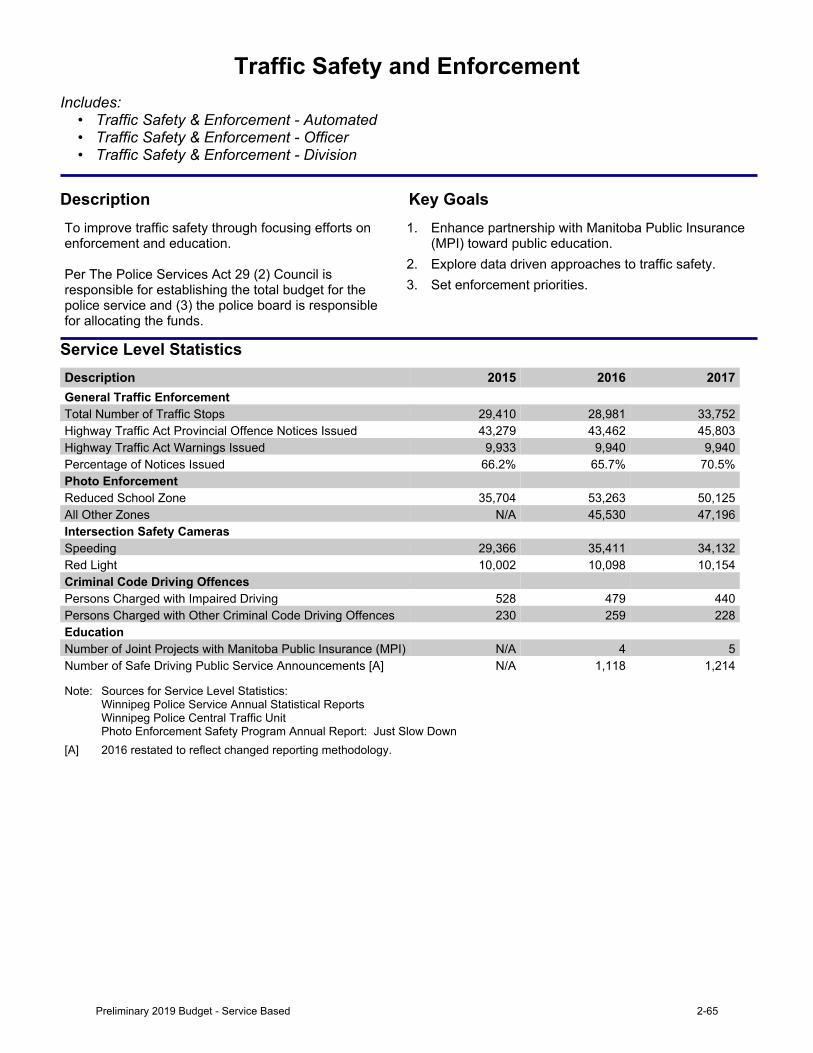
Traffic Safety and EnforcementIncludes:
• Traffic Safety & Enforcement - Automated• Traffic Safety & Enforcement - Officer• Traffic Safety & Enforcement - Division
Description Key GoalsTo improve traffic safety through focusing efforts on enforcementandeducation.Per The Police Services Act 29 (2) Council is responsible for establishing the total budget for the police service and (3) the police board is responsible for allocating the funds.
1. Enhance partnership with Manitoba Public Insurance (MPI) toward public education.
2. Explore data driven approaches to traffic safety.3. Set enforcement priorities.
Service Level StatisticsDescription 2015 2016 2017General Traffic Enforcement Total Number of Traffic Stops 29,410 28,981 33,752Highway Traffic Act Provincial Offence Notices Issued 43,279 43,462 45,803Highway Traffic Act Warnings Issued 9,933 9,940 9,940Percentage of Notices Issued 66.2% 65.7% 70.5%Photo Enforcement Reduced School Zone 35,704 53,263 50,125All Other Zones N/A 45,530 47,196Intersection Safety Cameras Speeding 29,366 35,411 34,132Red Light 10,002 10,098 10,154Criminal Code Driving Offences Persons Charged with Impaired Driving 528 479 440Persons Charged with Other Criminal Code Driving Offences 230 259 228Education Number of Joint Projects with Manitoba Public Insurance (MPI) N/A 4 5Number of Safe Driving Public Service Announcements [A] N/A 1,118 1,214
Note: SourcesforServiceLevelStatistics:WinnipegPoliceServiceAnnualStatisticalReportsWinnipegPoliceCentralTrafficUnitPhoto Enforcement Safety Program Annual Report: Just Slow Down
[A] 2016 restated to reflect changed reporting methodology.
Preliminary 2019 Budget - Service Based 2-65
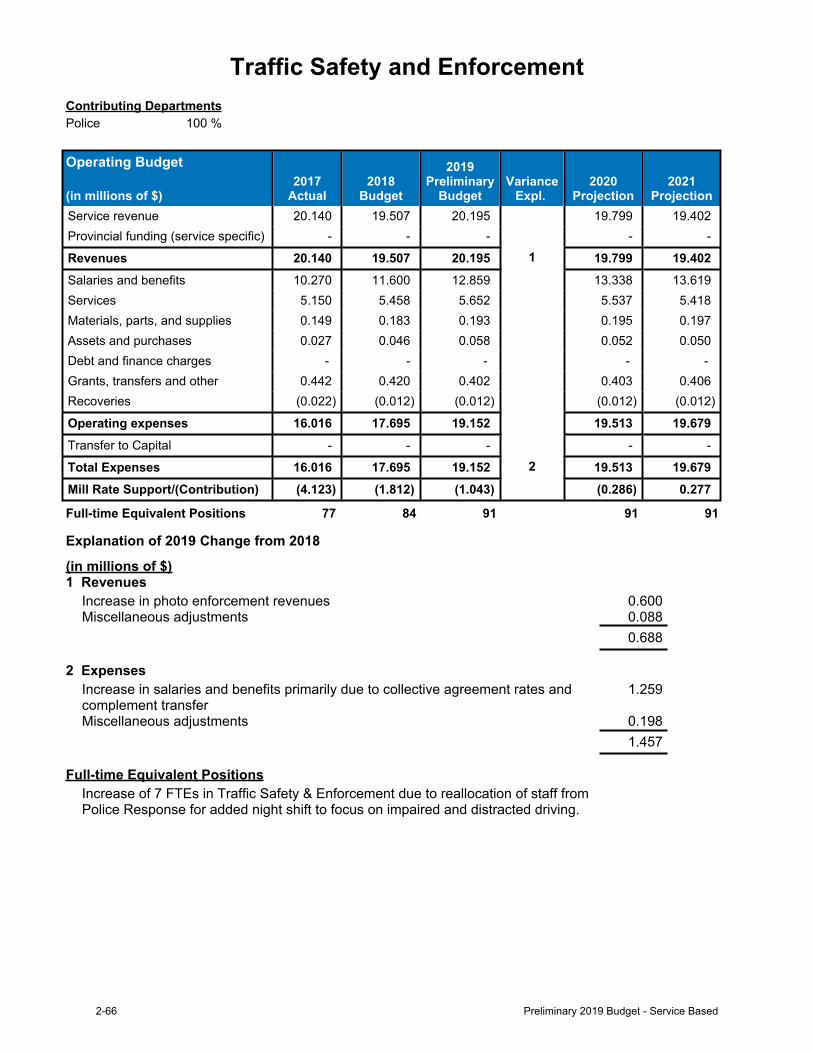
Traffic Safety and EnforcementContributing DepartmentsPolice 100 %
Operating Budget
(in millions of $)2017
Actual2018
Budget
2019Preliminary
BudgetVariance
Expl. 2020
Projection2021
ProjectionService revenue 20.140 19.507 20.195 19.799 19.402Provincial funding (service specific) - - - - -
Revenues 20.140 19.507 20.195 1 19.799 19.402Salaries and benefits 10.270 11.600 12.859 13.338 13.619Services 5.150 5.458 5.652 5.537 5.418Materials, parts, and supplies 0.149 0.183 0.193 0.195 0.197Assets and purchases 0.027 0.046 0.058 0.052 0.050Debt and finance charges - - - - -
Grants, transfers and other 0.442 0.420 0.402 0.403 0.406Recoveries (0.022) (0.012) (0.012) (0.012) (0.012)
Operating expenses 16.016 17.695 19.152 19.513 19.679Transfer to Capital - - - - -
Total Expenses 16.016 17.695 19.152 2 19.513 19.679Mill Rate Support/(Contribution) (4.123) (1.812) (1.043) (0.286) 0.277
Full-time Equivalent Positions 77 84 91 91 91
Explanation of 2019 Change from 2018
(in millions of $)1 Revenues
Increase in photo enforcement revenues 0.600Miscellaneous adjustments 0.088
0.688
2 ExpensesIncrease in salaries and benefits primarily due to collective agreement rates and complement transfer
1.259
Miscellaneous adjustments 0.1981.457
Full-time Equivalent PositionsIncrease of 7 FTEs in Traffic Safety & Enforcement due to reallocation of staff from Police Response for added night shift to focus on impaired and distracted driving.
2-66 Preliminary 2019 Budget - Service Based
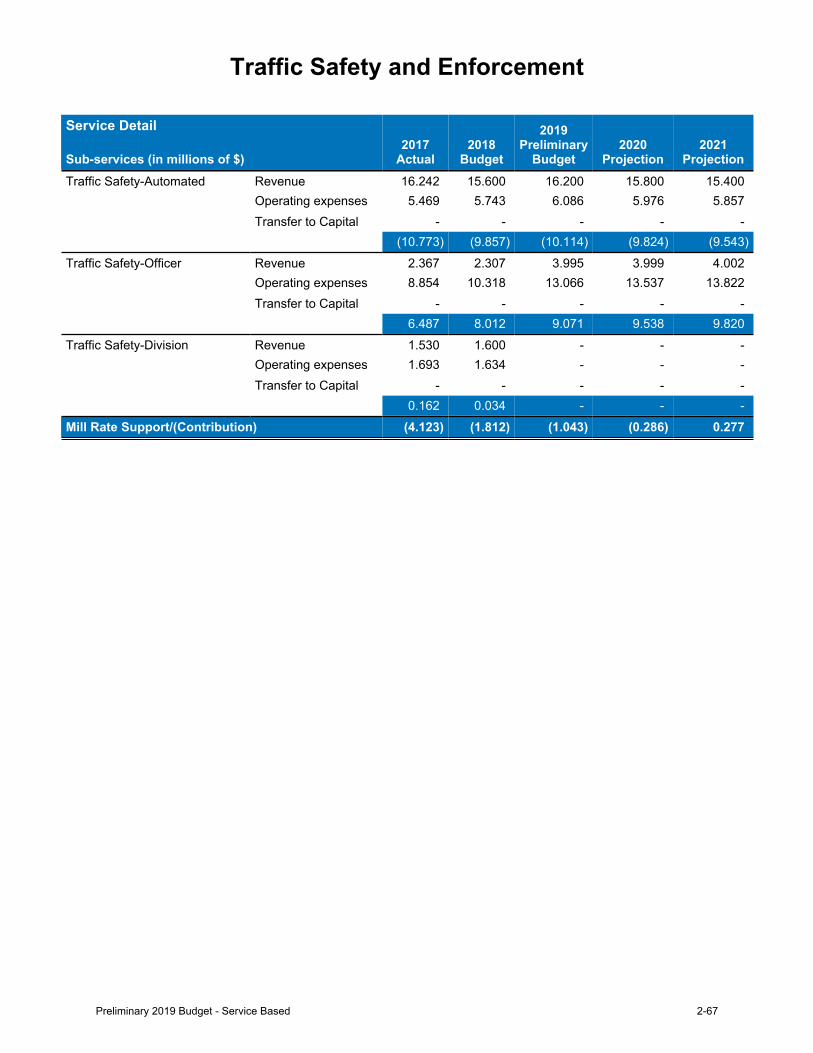
Traffic Safety and Enforcement
Service Detail
Sub-services (in millions of $)2017
Actual2018
Budget
2019Preliminary
Budget2020
Projection2021
ProjectionTraffic Safety-Automated Revenue 16.242 15.600 16.200 15.800 15.400
Operating expenses 5.469 5.743 6.086 5.976 5.857Transfer to Capital - - - - -
(10.773) (9.857) (10.114) (9.824) (9.543)Traffic Safety-Officer Revenue 2.367 2.307 3.995 3.999 4.002
Operating expenses 8.854 10.318 13.066 13.537 13.822Transfer to Capital - - - - -
6.487 8.012 9.071 9.538 9.820Traffic Safety-Division Revenue 1.530 1.600 - - -
Operating expenses 1.693 1.634 - - -Transfer to Capital - - - - -
0.162 0.034 - - -Mill Rate Support/(Contribution) (4.123) (1.812) (1.043) (0.286) 0.277
Preliminary 2019 Budget - Service Based 2-67
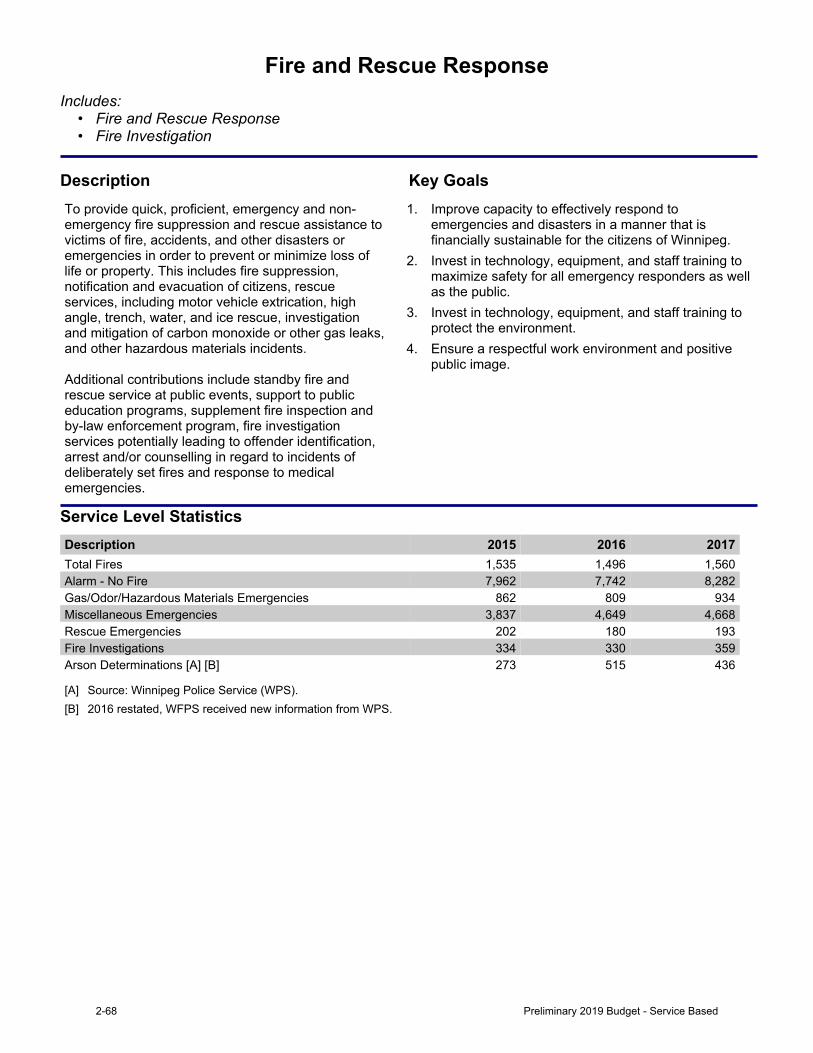
Fire and Rescue ResponseIncludes:
• Fire and Rescue Response• Fire Investigation
Description Key GoalsTo provide quick, proficient, emergency and non-emergency fire suppression and rescue assistance to victims of fire, accidents, and other disasters or emergencies in order to prevent or minimize loss of life or property. This includes fire suppression, notification and evacuation of citizens, rescue services, including motor vehicle extrication, high angle, trench, water, and ice rescue, investigation and mitigation of carbon monoxide or other gas leaks, andotherhazardousmaterialsincidents.Additional contributions include standby fire and rescue service at public events, support to public education programs, supplement fire inspection and by-law enforcement program, fire investigation services potentially leading to offender identification, arrest and/or counselling in regard to incidents of deliberately set fires and response to medical emergencies.
1. Improve capacity to effectively respond to emergencies and disasters in a manner that is financially sustainable for the citizens of Winnipeg.
2. Invest in technology, equipment, and staff training to maximize safety for all emergency responders as well as the public.
3. Invest in technology, equipment, and staff training to protect the environment.
4. Ensure a respectful work environment and positive public image.
Service Level StatisticsDescription 2015 2016 2017Total Fires 1,535 1,496 1,560Alarm - No Fire 7,962 7,742 8,282Gas/Odor/Hazardous Materials Emergencies 862 809 934Miscellaneous Emergencies 3,837 4,649 4,668Rescue Emergencies 202 180 193Fire Investigations 334 330 359Arson Determinations [A] [B] 273 515 436
[A] Source: Winnipeg Police Service (WPS).[B] 2016 restated, WFPS received new information from WPS.
2-68 Preliminary 2019 Budget - Service Based
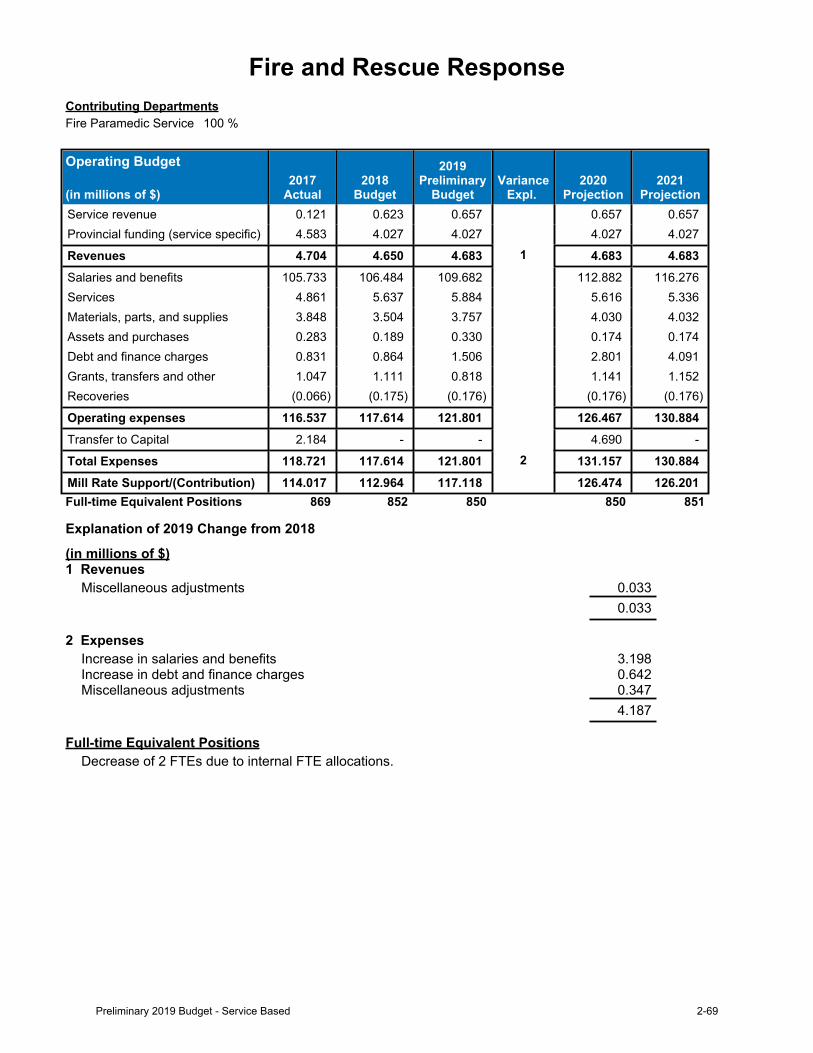
Fire and Rescue ResponseContributing DepartmentsFire Paramedic Service 100 %
Operating Budget
(in millions of $)2017
Actual2018
Budget
2019Preliminary
BudgetVariance
Expl. 2020
Projection2021
ProjectionService revenue 0.121 0.623 0.657 0.657 0.657Provincial funding (service specific) 4.583 4.027 4.027 4.027 4.027
Revenues 4.704 4.650 4.683 1 4.683 4.683Salaries and benefits 105.733 106.484 109.682 112.882 116.276Services 4.861 5.637 5.884 5.616 5.336Materials, parts, and supplies 3.848 3.504 3.757 4.030 4.032Assets and purchases 0.283 0.189 0.330 0.174 0.174Debt and finance charges 0.831 0.864 1.506 2.801 4.091Grants, transfers and other 1.047 1.111 0.818 1.141 1.152Recoveries (0.066) (0.175) (0.176) (0.176) (0.176)
Operating expenses 116.537 117.614 121.801 126.467 130.884Transfer to Capital 2.184 - - 4.690 -
Total Expenses 118.721 117.614 121.801 2 131.157 130.884Mill Rate Support/(Contribution) 114.017 112.964 117.118 126.474 126.201Full-time Equivalent Positions 869 852 850 850 851
Explanation of 2019 Change from 2018
(in millions of $)1 Revenues
Miscellaneous adjustments 0.0330.033
2 ExpensesIncrease in salaries and benefits 3.198Increase in debt and finance charges 0.642Miscellaneous adjustments 0.347
4.187
Full-time Equivalent PositionsDecrease of 2 FTEs due to internal FTE allocations.
Preliminary 2019 Budget - Service Based 2-69
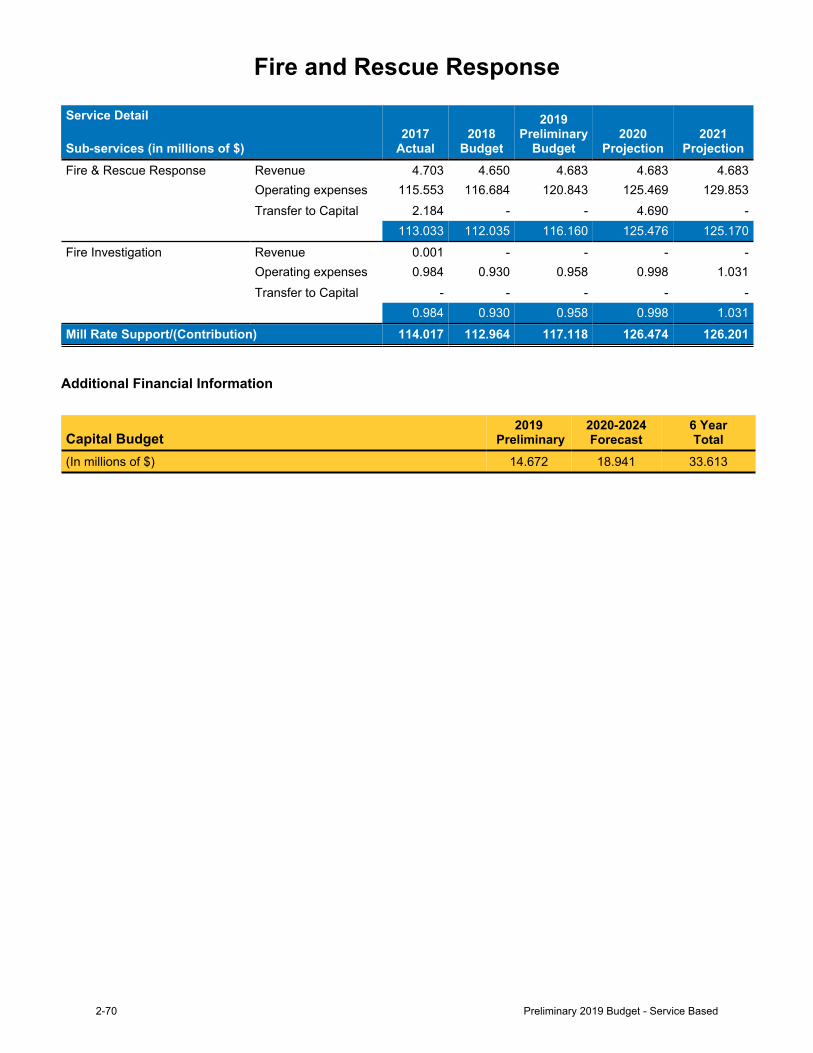
Fire and Rescue Response
Service Detail
Sub-services (in millions of $)2017
Actual2018
Budget
2019Preliminary
Budget2020
Projection2021
ProjectionFire & Rescue Response Revenue 4.703 4.650 4.683 4.683 4.683
Operating expenses 115.553 116.684 120.843 125.469 129.853Transfer to Capital 2.184 - - 4.690 -
113.033 112.035 116.160 125.476 125.170Fire Investigation Revenue 0.001 - - - -
Operating expenses 0.984 0.930 0.958 0.998 1.031Transfer to Capital - - - - -
0.984 0.930 0.958 0.998 1.031Mill Rate Support/(Contribution) 114.017 112.964 117.118 126.474 126.201
Additional Financial Information
Capital Budget2019
Preliminary2020-2024Forecast
6 YearTotal
(In millions of $) 14.672 18.941 33.613
2-70 Preliminary 2019 Budget - Service Based
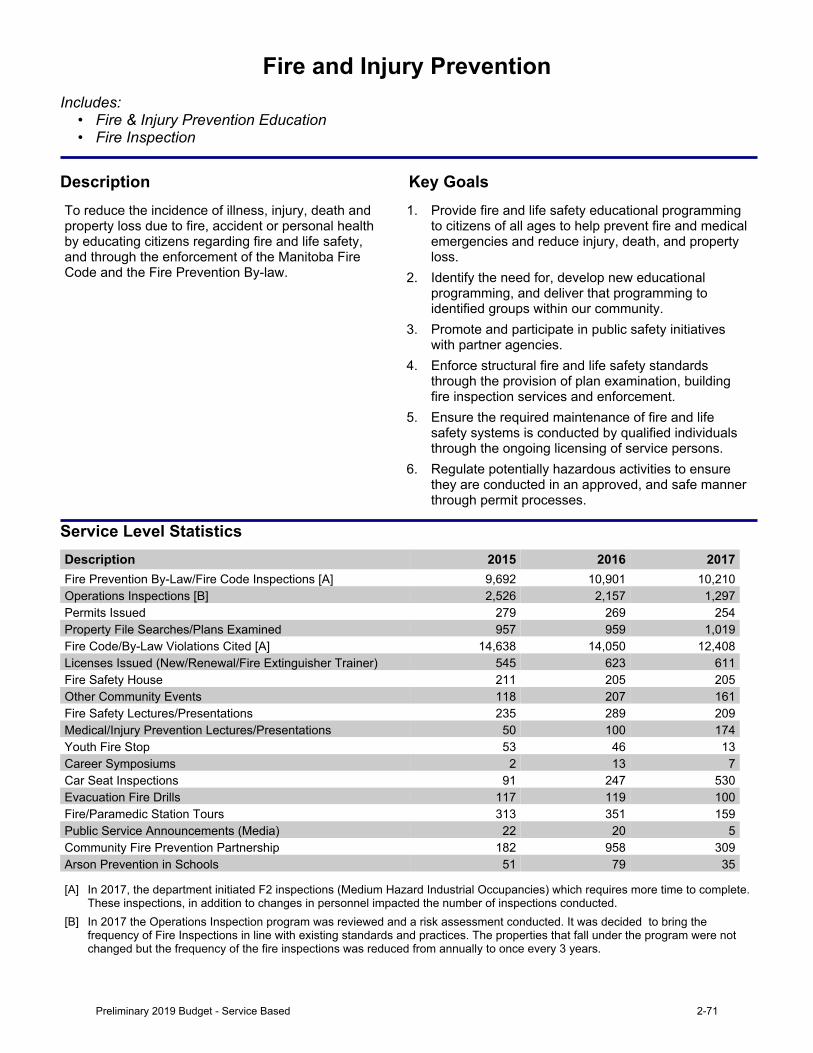
Fire and Injury PreventionIncludes:
• Fire & Injury Prevention Education• Fire Inspection
Description Key GoalsTo reduce the incidence of illness, injury, death and property loss due to fire, accident or personal health by educating citizens regarding fire and life safety, and through the enforcement of the Manitoba Fire Code and the Fire Prevention By-law.
1. Provide fire and life safety educational programming to citizens of all ages to help prevent fire and medical emergencies and reduce injury, death, and property loss.
2. Identify the need for, develop new educational programming, and deliver that programming to identified groups within our community.
3. Promote and participate in public safety initiatives with partner agencies.
4. Enforce structural fire and life safety standards through the provision of plan examination, building fire inspection services and enforcement.
5. Ensure the required maintenance of fire and life safety systems is conducted by qualified individuals through the ongoing licensing of service persons.
6. Regulate potentially hazardous activities to ensure they are conducted in an approved, and safe manner through permit processes.
Service Level StatisticsDescription 2015 2016 2017Fire Prevention By-Law/Fire Code Inspections [A] 9,692 10,901 10,210Operations Inspections [B] 2,526 2,157 1,297Permits Issued 279 269 254Property File Searches/Plans Examined 957 959 1,019Fire Code/By-Law Violations Cited [A] 14,638 14,050 12,408Licenses Issued (New/Renewal/Fire Extinguisher Trainer) 545 623 611Fire Safety House 211 205 205Other Community Events 118 207 161Fire Safety Lectures/Presentations 235 289 209Medical/Injury Prevention Lectures/Presentations 50 100 174Youth Fire Stop 53 46 13Career Symposiums 2 13 7Car Seat Inspections 91 247 530Evacuation Fire Drills 117 119 100Fire/Paramedic Station Tours 313 351 159Public Service Announcements (Media) 22 20 5Community Fire Prevention Partnership 182 958 309Arson Prevention in Schools 51 79 35
[A] In 2017, the department initiated F2 inspections (Medium Hazard Industrial Occupancies) which requires more time to complete. These inspections, in addition to changes in personnel impacted the number of inspections conducted.
[B] In 2017 the Operations Inspection program was reviewed and a risk assessment conducted. It was decided to bring the frequency of Fire Inspections in line with existing standards and practices. The properties that fall under the program were not changed but the frequency of the fire inspections was reduced from annually to once every 3 years.
Preliminary 2019 Budget - Service Based 2-71
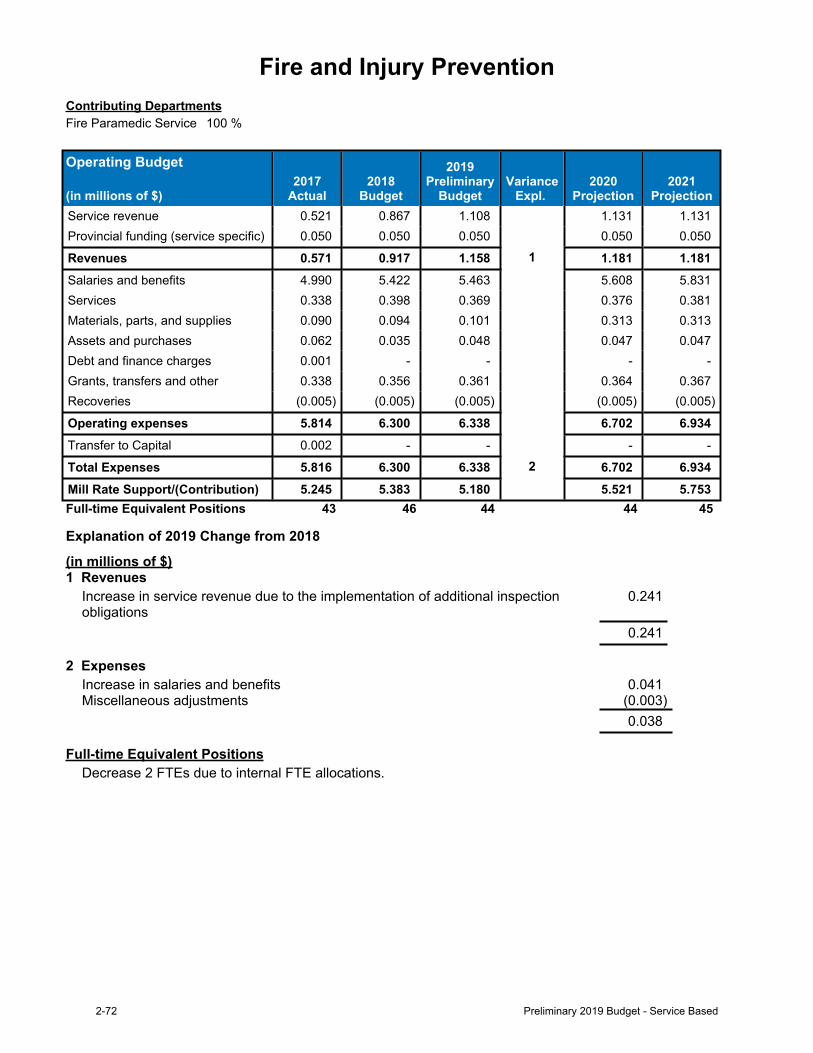
Fire and Injury PreventionContributing DepartmentsFire Paramedic Service 100 %
Operating Budget
(in millions of $)2017
Actual2018
Budget
2019Preliminary
BudgetVariance
Expl. 2020
Projection2021
ProjectionService revenue 0.521 0.867 1.108 1.131 1.131Provincial funding (service specific) 0.050 0.050 0.050 0.050 0.050
Revenues 0.571 0.917 1.158 1 1.181 1.181Salaries and benefits 4.990 5.422 5.463 5.608 5.831Services 0.338 0.398 0.369 0.376 0.381Materials, parts, and supplies 0.090 0.094 0.101 0.313 0.313Assets and purchases 0.062 0.035 0.048 0.047 0.047Debt and finance charges 0.001 - - - -Grants, transfers and other 0.338 0.356 0.361 0.364 0.367Recoveries (0.005) (0.005) (0.005) (0.005) (0.005)
Operating expenses 5.814 6.300 6.338 6.702 6.934Transfer to Capital 0.002 - - - -
Total Expenses 5.816 6.300 6.338 2 6.702 6.934Mill Rate Support/(Contribution) 5.245 5.383 5.180 5.521 5.753Full-time Equivalent Positions 43 46 44 44 45
Explanation of 2019 Change from 2018
(in millions of $)1 Revenues
Increase in service revenue due to the implementation of additional inspection obligations
0.241
0.241
2 ExpensesIncrease in salaries and benefits 0.041Miscellaneous adjustments (0.003)
0.038
Full-time Equivalent PositionsDecrease 2 FTEs due to internal FTE allocations.
2-72 Preliminary 2019 Budget - Service Based

Fire and Injury Prevention
Service Detail
Sub-services (in millions of $)2017
Actual2018
Budget
2019Preliminary
Budget2020
Projection2021
ProjectionFire & Injury Prev Education Revenue 0.003 - - - -
Operating expenses 1.101 1.141 0.970 1.077 1.124Transfer to Capital 0.001 - - - -
1.099 1.141 0.970 1.077 1.124Fire Inspection Revenue 0.568 0.917 1.158 1.181 1.181
Operating expenses 4.713 5.159 5.368 5.625 5.810Transfer to Capital 0.001 - - - -
4.146 4.242 4.210 4.444 4.629Mill Rate Support/(Contribution) 5.245 5.383 5.180 5.521 5.753
Preliminary 2019 Budget - Service Based 2-73
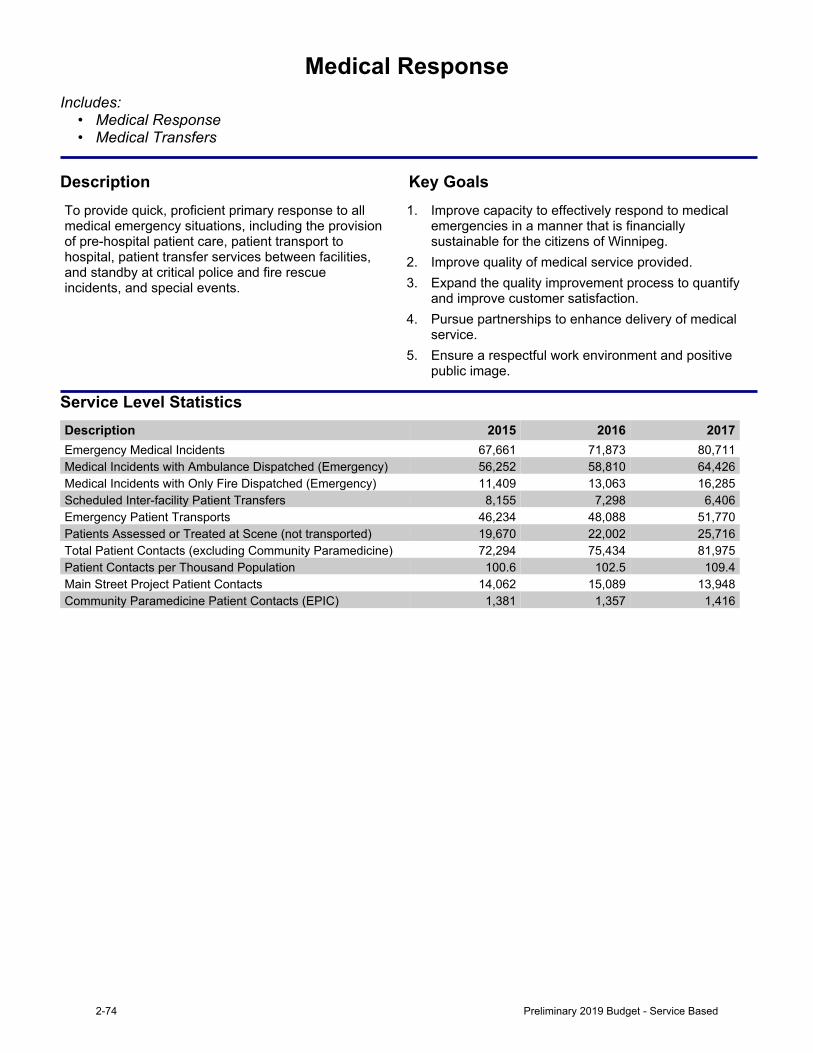
Medical ResponseIncludes:
• Medical Response• Medical Transfers
Description Key GoalsTo provide quick, proficient primary response to all medical emergency situations, including the provision of pre-hospital patient care, patient transport to hospital, patient transfer services between facilities, and standby at critical police and fire rescue incidents, and special events.
1. Improve capacity to effectively respond to medical emergencies in a manner that is financially sustainable for the citizens of Winnipeg.
2. Improve quality of medical service provided.3. Expand the quality improvement process to quantify
and improve customer satisfaction.4. Pursue partnerships to enhance delivery of medical
service.5. Ensure a respectful work environment and positive
public image.
Service Level StatisticsDescription 2015 2016 2017Emergency Medical Incidents 67,661 71,873 80,711Medical Incidents with Ambulance Dispatched (Emergency) 56,252 58,810 64,426Medical Incidents with Only Fire Dispatched (Emergency) 11,409 13,063 16,285Scheduled Inter-facility Patient Transfers 8,155 7,298 6,406Emergency Patient Transports 46,234 48,088 51,770Patients Assessed or Treated at Scene (not transported) 19,670 22,002 25,716Total Patient Contacts (excluding Community Paramedicine) 72,294 75,434 81,975Patient Contacts per Thousand Population 100.6 102.5 109.4Main Street Project Patient Contacts 14,062 15,089 13,948Community Paramedicine Patient Contacts (EPIC) 1,381 1,357 1,416
2-74 Preliminary 2019 Budget - Service Based
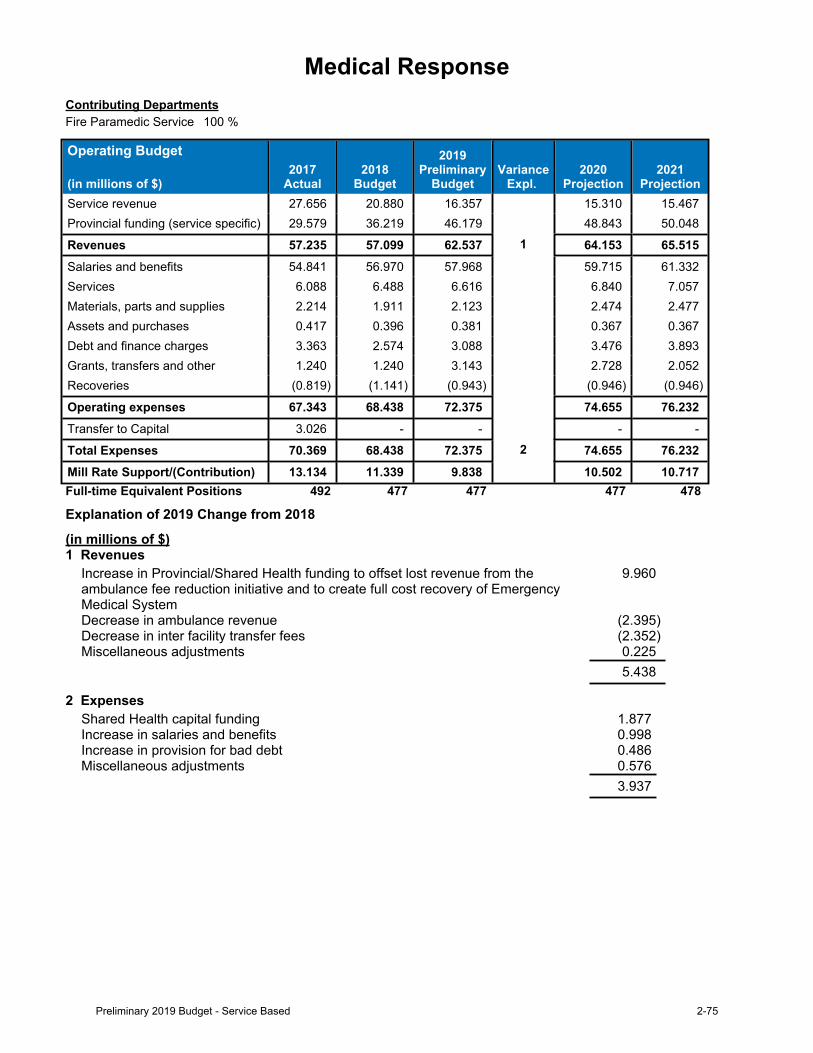
Medical ResponseContributing DepartmentsFire Paramedic Service 100 %
Operating Budget
(in millions of $)2017
Actual2018
Budget
2019Preliminary
BudgetVariance
Expl. 2020
Projection2021
ProjectionService revenue 27.656 20.880 16.357 15.310 15.467Provincial funding (service specific) 29.579 36.219 46.179 48.843 50.048
Revenues 57.235 57.099 62.537 1 64.153 65.515Salaries and benefits 54.841 56.970 57.968 59.715 61.332Services 6.088 6.488 6.616 6.840 7.057Materials, parts and supplies 2.214 1.911 2.123 2.474 2.477Assets and purchases 0.417 0.396 0.381 0.367 0.367Debt and finance charges 3.363 2.574 3.088 3.476 3.893Grants, transfers and other 1.240 1.240 3.143 2.728 2.052Recoveries (0.819) (1.141) (0.943) (0.946) (0.946)
Operating expenses 67.343 68.438 72.375 74.655 76.232Transfer to Capital 3.026 - - - -
Total Expenses 70.369 68.438 72.375 2 74.655 76.232Mill Rate Support/(Contribution) 13.134 11.339 9.838 10.502 10.717Full-time Equivalent Positions 492 477 477 477 478
Explanation of 2019 Change from 2018
(in millions of $)1 Revenues
Increase in Provincial/Shared Health funding to offset lost revenue from the ambulance fee reduction initiative and to create full cost recovery of Emergency Medical System
9.960
Decrease in ambulance revenue (2.395)Decrease in inter facility transfer fees (2.352)Miscellaneous adjustments 0.225
5.438
2 ExpensesShared Health capital funding 1.877Increase in salaries and benefits 0.998Increase in provision for bad debt 0.486Miscellaneous adjustments 0.576
3.937
Preliminary 2019 Budget - Service Based 2-75
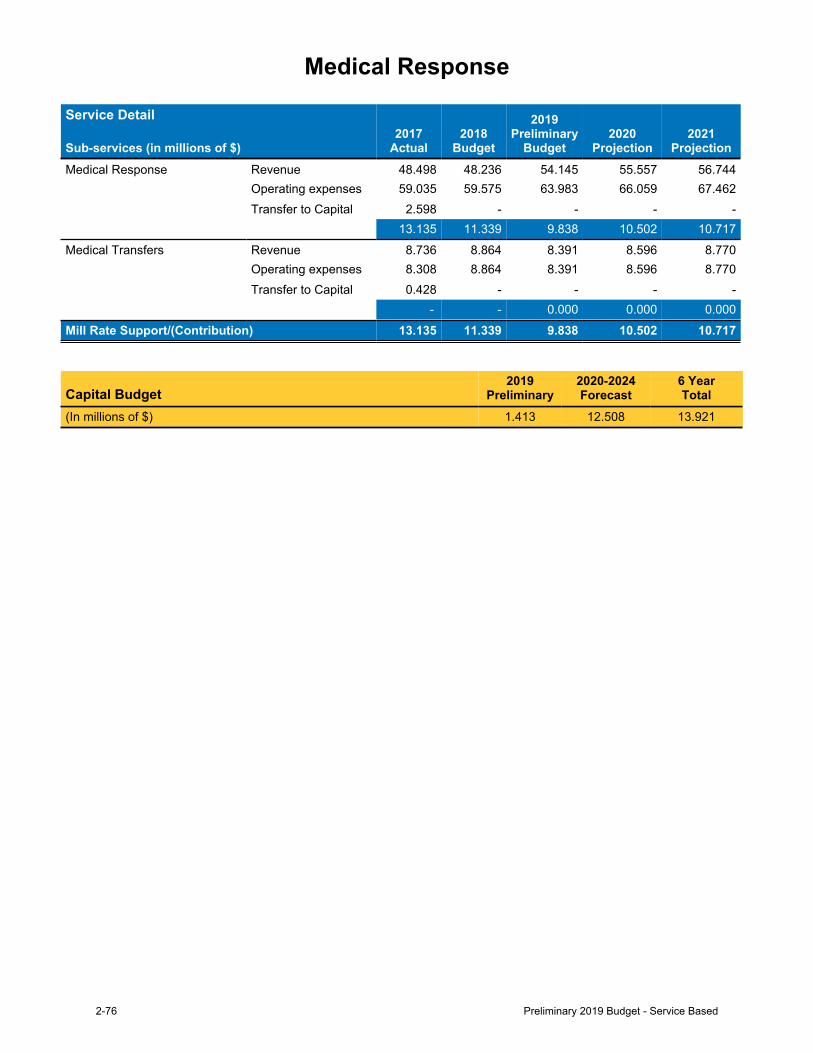
Medical Response
Service Detail
Sub-services (in millions of $)2017
Actual2018
Budget
2019Preliminary
Budget2020
Projection2021
ProjectionMedical Response Revenue 48.498 48.236 54.145 55.557 56.744
Operating expenses 59.035 59.575 63.983 66.059 67.462Transfer to Capital 2.598 - - - -
13.135 11.339 9.838 10.502 10.717Medical Transfers Revenue 8.736 8.864 8.391 8.596 8.770
Operating expenses 8.308 8.864 8.391 8.596 8.770Transfer to Capital 0.428 - - - -
- - 0.000 0.000 0.000Mill Rate Support/(Contribution) 13.135 11.339 9.838 10.502 10.717
Capital Budget2019
Preliminary2020-2024Forecast
6 YearTotal
(In millions of $) 1.413 12.508 13.921
2-76 Preliminary 2019 Budget - Service Based
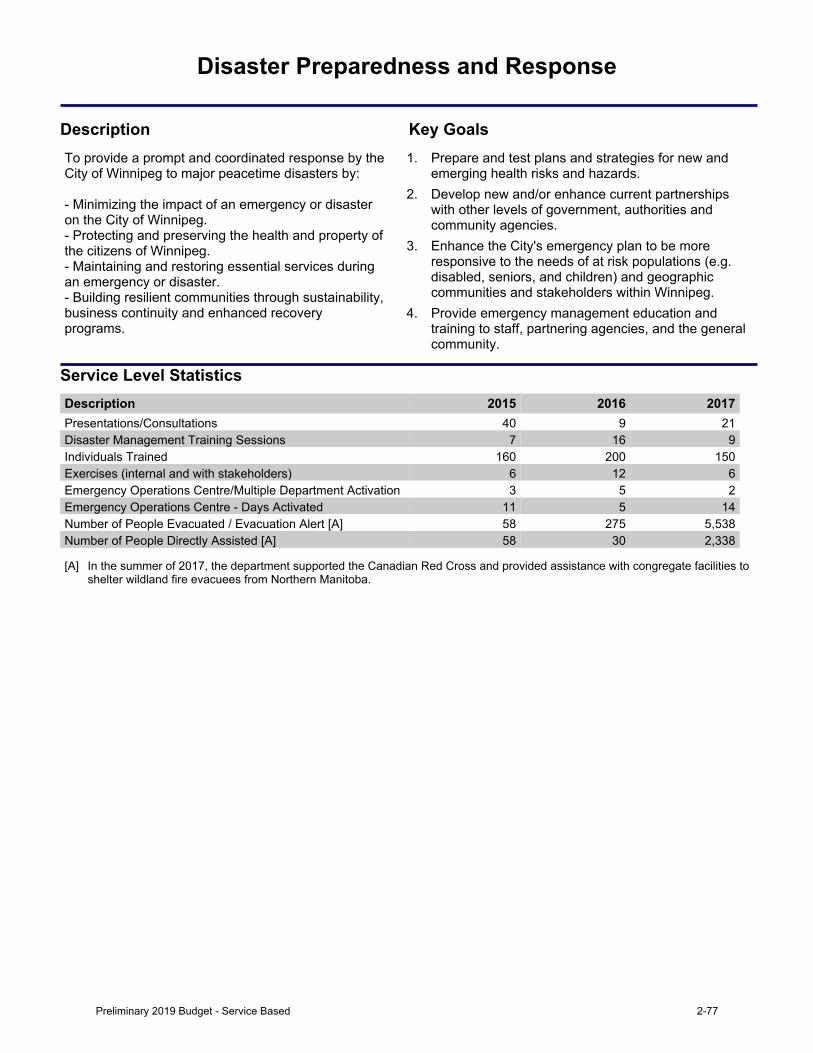
Disaster Preparedness and Response
Description Key GoalsTo provide a prompt and coordinated response by the CityofWinnipegtomajorpeacetimedisastersby:- Minimizing the impact of an emergency or disaster ontheCityofWinnipeg.- Protecting and preserving the health and property of thecitizensofWinnipeg.- Maintaining and restoring essential services during anemergencyordisaster.- Building resilient communities through sustainability, business continuity and enhanced recovery programs.
1. Prepare and test plans and strategies for new and emerging health risks and hazards.
2. Develop new and/or enhance current partnerships with other levels of government, authorities and community agencies.
3. Enhance the City's emergency plan to be more responsive to the needs of at risk populations (e.g. disabled, seniors, and children) and geographic communities and stakeholders within Winnipeg.
4. Provide emergency management education and training to staff, partnering agencies, and the general community.
Service Level StatisticsDescription 2015 2016 2017Presentations/Consultations 40 9 21Disaster Management Training Sessions 7 16 9Individuals Trained 160 200 150Exercises (internal and with stakeholders) 6 12 6Emergency Operations Centre/Multiple Department Activation 3 5 2Emergency Operations Centre - Days Activated 11 5 14Number of People Evacuated / Evacuation Alert [A] 58 275 5,538Number of People Directly Assisted [A] 58 30 2,338
[A] In the summer of 2017, the department supported the Canadian Red Cross and provided assistance with congregate facilities to shelter wildland fire evacuees from Northern Manitoba.
Preliminary 2019 Budget - Service Based 2-77
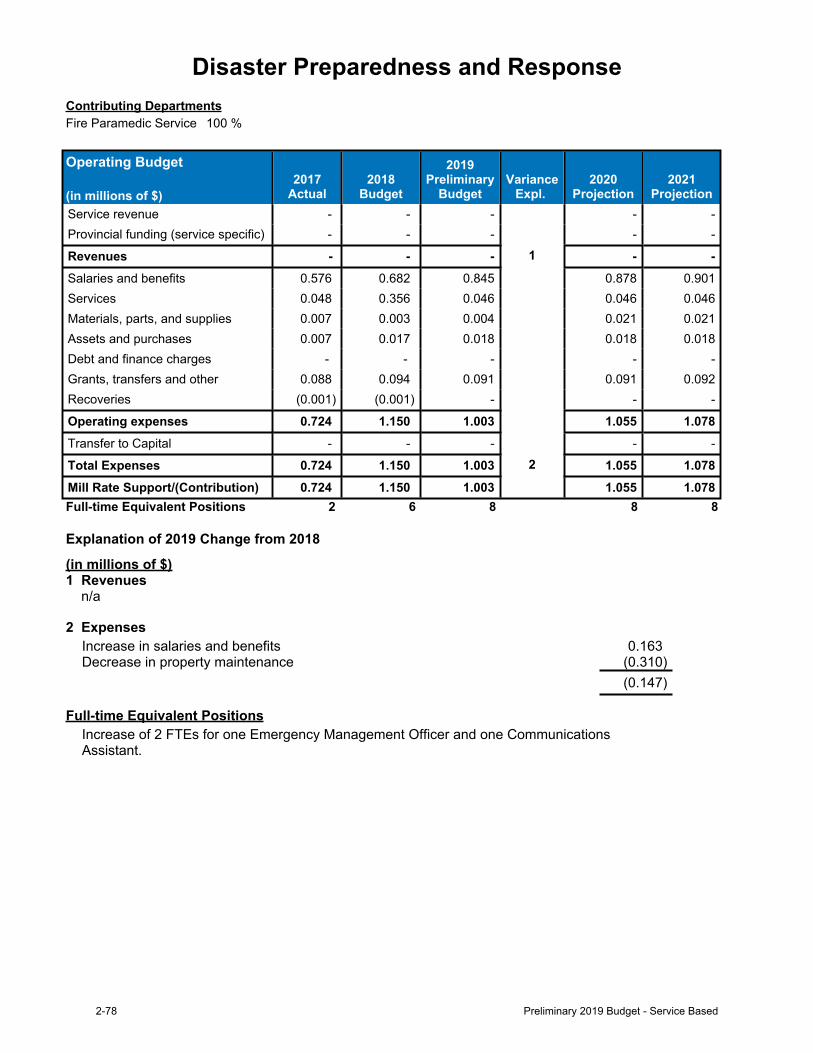
Disaster Preparedness and ResponseContributing DepartmentsFire Paramedic Service 100 %
Operating Budget
(in millions of $)2017
Actual2018
Budget
2019Preliminary
BudgetVariance
Expl. 2020
Projection2021
ProjectionService revenue - - - - -Provincial funding (service specific) - - - - -
Revenues - - - 1 - -Salaries and benefits 0.576 0.682 0.845 0.878 0.901Services 0.048 0.356 0.046 0.046 0.046Materials, parts, and supplies 0.007 0.003 0.004 0.021 0.021Assets and purchases 0.007 0.017 0.018 0.018 0.018Debt and finance charges - - - - -Grants, transfers and other 0.088 0.094 0.091 0.091 0.092Recoveries (0.001) (0.001) - - -
Operating expenses 0.724 1.150 1.003 1.055 1.078Transfer to Capital - - - - -
Total Expenses 0.724 1.150 1.003 2 1.055 1.078Mill Rate Support/(Contribution) 0.724 1.150 1.003 1.055 1.078Full-time Equivalent Positions 2 6 8 8 8
Explanation of 2019 Change from 2018
(in millions of $)1 Revenues n/a
2 ExpensesIncrease in salaries and benefits 0.163Decrease in property maintenance (0.310)
(0.147)
Full-time Equivalent PositionsIncrease of 2 FTEs for one Emergency Management Officer and one Communications Assistant.
2-78 Preliminary 2019 Budget - Service Based
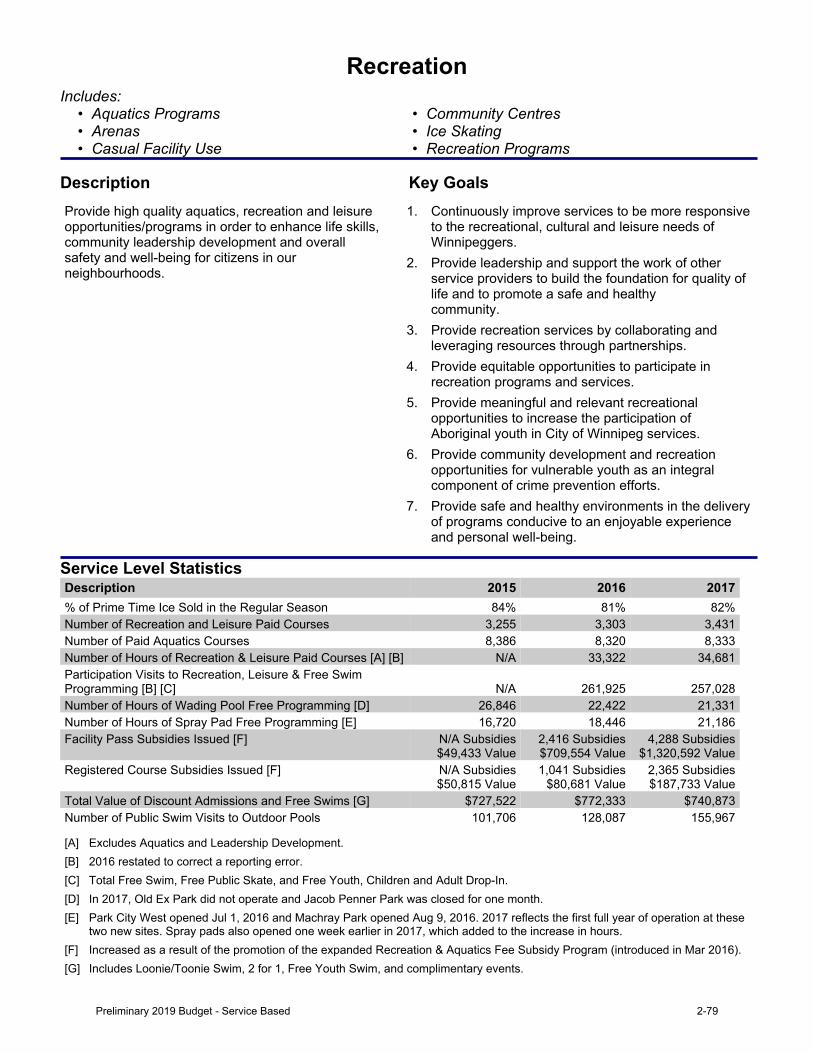
RecreationIncludes:
• Aquatics Programs • Community Centres• Arenas • Ice Skating • Casual Facility Use • Recreation Programs
Description Key GoalsProvide high quality aquatics, recreation and leisure opportunities/programs in order to enhance life skills, community leadership development and overall safety and well-being for citizens in our neighbourhoods.
1. Continuously improve services to be more responsive to the recreational, cultural and leisure needs of Winnipeggers.
2. Provide leadership and support the work of other service providers to build the foundation for quality of lifeandtopromoteasafeandhealthycommunity.
3. Provide recreation services by collaborating and leveraging resources through partnerships.
4. Provide equitable opportunities to participate in recreation programs and services.
5. Provide meaningful and relevant recreational opportunities to increase the participation of Aboriginal youth in City of Winnipeg services.
6. Provide community development and recreation opportunities for vulnerable youth as an integral component of crime prevention efforts.
7. Provide safe and healthy environments in the delivery of programs conducive to an enjoyable experience and personal well-being.
Service Level StatisticsDescription 2015 2016 2017% of Prime Time Ice Sold in the Regular Season 84% 81% 82%Number of Recreation and Leisure Paid Courses 3,255 3,303 3,431Number of Paid Aquatics Courses 8,386 8,320 8,333Number of Hours of Recreation & Leisure Paid Courses [A] [B] N/A 33,322 34,681Participation Visits to Recreation, Leisure & Free Swim Programming [B] [C] N/A 261,925 257,028Number of Hours of Wading Pool Free Programming [D] 26,846 22,422 21,331Number of Hours of Spray Pad Free Programming [E] 16,720 18,446 21,186Facility Pass Subsidies Issued [F] N/A Subsidies
$49,433 Value2,416 Subsidies $709,554 Value
4,288 Subsidies $1,320,592 Value
Registered Course Subsidies Issued [F] N/A Subsidies $50,815 Value
1,041 Subsidies $80,681 Value
2,365 Subsidies $187,733 Value
Total Value of Discount Admissions and Free Swims [G] $727,522 $772,333 $740,873Number of Public Swim Visits to Outdoor Pools 101,706 128,087 155,967
[A] Excludes Aquatics and Leadership Development.[B] 2016 restated to correct a reporting error.[C] Total Free Swim, Free Public Skate, and Free Youth, Children and Adult Drop-In.[D] In 2017, Old Ex Park did not operate and Jacob Penner Park was closed for one month.[E] Park City West opened Jul 1, 2016 and Machray Park opened Aug 9, 2016. 2017 reflects the first full year of operation at these
two new sites. Spray pads also opened one week earlier in 2017, which added to the increase in hours.[F] Increased as a result of the promotion of the expanded Recreation & Aquatics Fee Subsidy Program (introduced in Mar 2016).[G] Includes Loonie/Toonie Swim, 2 for 1, Free Youth Swim, and complimentary events.
Preliminary 2019 Budget - Service Based 2-79
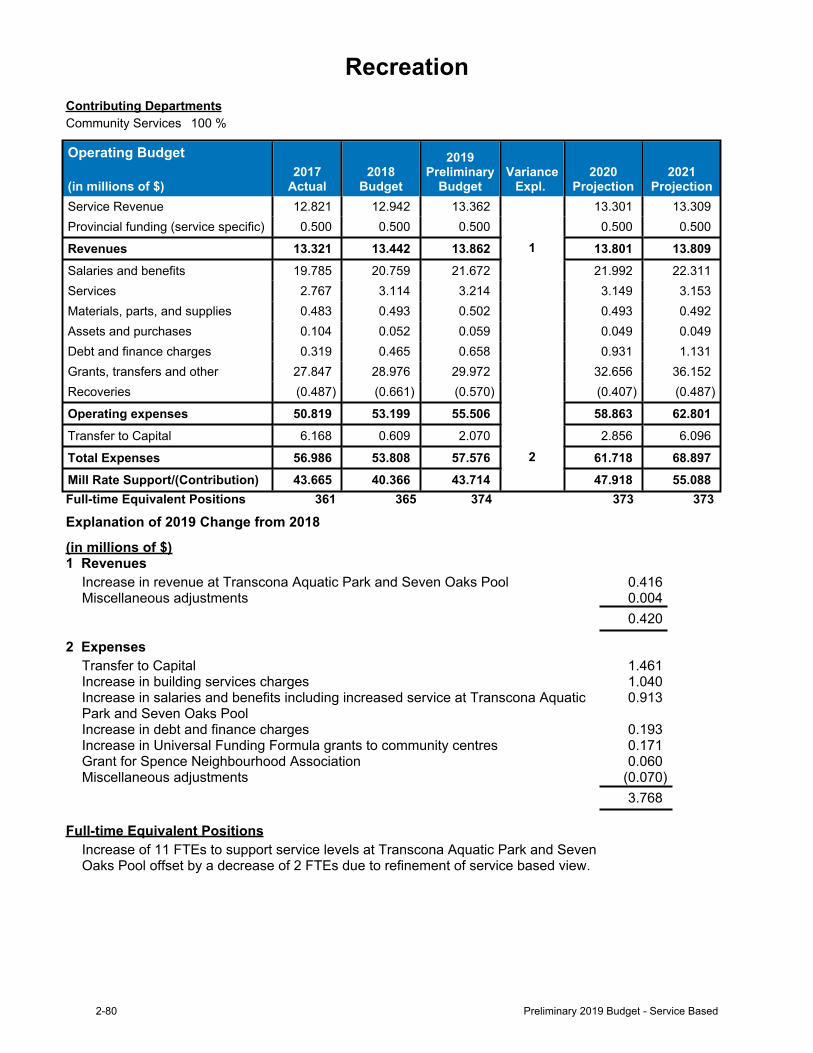
RecreationContributing DepartmentsCommunity Services 100 %
Operating Budget
(in millions of $)2017
Actual2018
Budget
2019Preliminary
BudgetVariance
Expl. 2020
Projection2021
ProjectionService Revenue 12.821 12.942 13.362 13.301 13.309Provincial funding (service specific) 0.500 0.500 0.500 0.500 0.500
Revenues 13.321 13.442 13.862 1 13.801 13.809Salaries and benefits 19.785 20.759 21.672 21.992 22.311Services 2.767 3.114 3.214 3.149 3.153Materials, parts, and supplies 0.483 0.493 0.502 0.493 0.492Assets and purchases 0.104 0.052 0.059 0.049 0.049Debt and finance charges 0.319 0.465 0.658 0.931 1.131Grants, transfers and other 27.847 28.976 29.972 32.656 36.152Recoveries (0.487) (0.661) (0.570) (0.407) (0.487)
Operating expenses 50.819 53.199 55.506 58.863 62.801Transfer to Capital 6.168 0.609 2.070 2.856 6.096
Total Expenses 56.986 53.808 57.576 2 61.718 68.897Mill Rate Support/(Contribution) 43.665 40.366 43.714 47.918 55.088Full-time Equivalent Positions 361 365 374 373 373
Explanation of 2019 Change from 2018
(in millions of $)1 Revenues
Increase in revenue at Transcona Aquatic Park and Seven Oaks Pool 0.416Miscellaneous adjustments 0.004
0.420
2 ExpensesTransfer to Capital 1.461Increase in building services charges 1.040Increase in salaries and benefits including increased service at Transcona Aquatic Park and Seven Oaks Pool
0.913
Increase in debt and finance charges 0.193Increase in Universal Funding Formula grants to community centres 0.171Grant for Spence Neighbourhood Association 0.060Miscellaneous adjustments (0.070)
3.768
Full-time Equivalent PositionsIncrease of 11 FTEs to support service levels at Transcona Aquatic Park and Seven Oaks Pool offset by a decrease of 2 FTEs due to refinement of service based view.
2-80 Preliminary 2019 Budget - Service Based
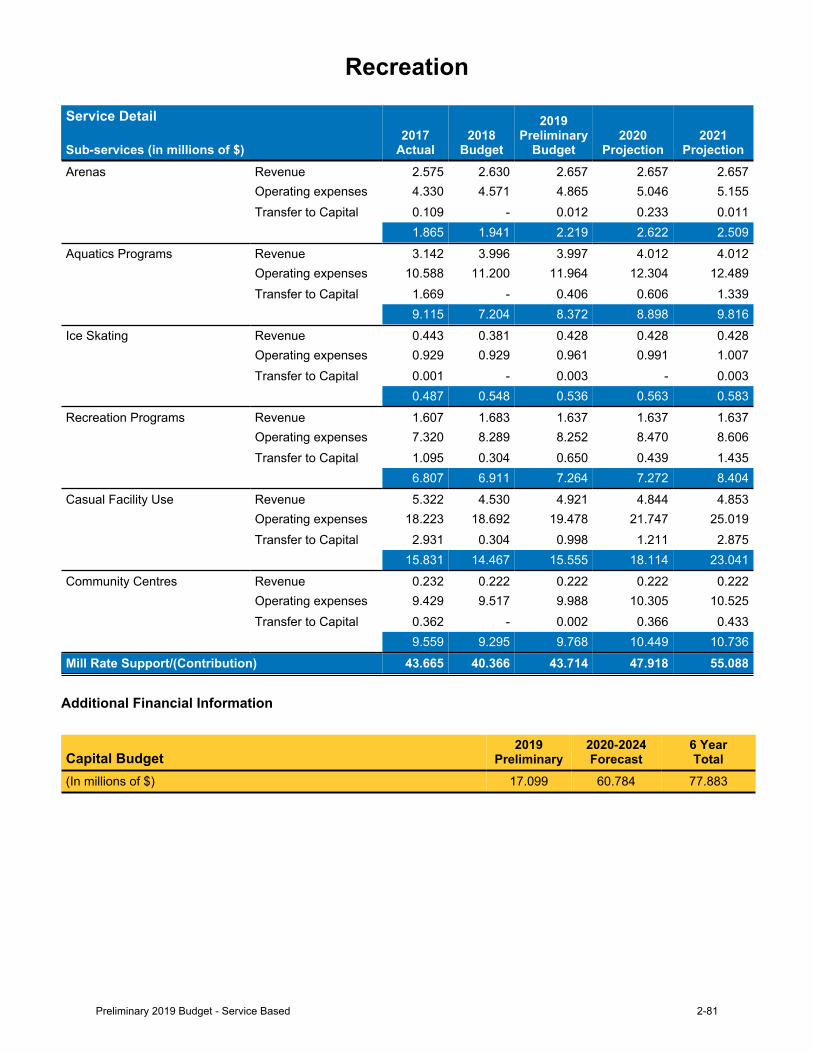
Recreation
Service Detail
Sub-services (in millions of $)2017
Actual2018
Budget
2019Preliminary
Budget2020
Projection2021
ProjectionArenas Revenue 2.575 2.630 2.657 2.657 2.657
Operating expenses 4.330 4.571 4.865 5.046 5.155Transfer to Capital 0.109 - 0.012 0.233 0.011
1.865 1.941 2.219 2.622 2.509Aquatics Programs Revenue 3.142 3.996 3.997 4.012 4.012
Operating expenses 10.588 11.200 11.964 12.304 12.489Transfer to Capital 1.669 - 0.406 0.606 1.339
9.115 7.204 8.372 8.898 9.816Ice Skating Revenue 0.443 0.381 0.428 0.428 0.428
Operating expenses 0.929 0.929 0.961 0.991 1.007Transfer to Capital 0.001 - 0.003 - 0.003
0.487 0.548 0.536 0.563 0.583Recreation Programs Revenue 1.607 1.683 1.637 1.637 1.637
Operating expenses 7.320 8.289 8.252 8.470 8.606Transfer to Capital 1.095 0.304 0.650 0.439 1.435
6.807 6.911 7.264 7.272 8.404Casual Facility Use Revenue 5.322 4.530 4.921 4.844 4.853
Operating expenses 18.223 18.692 19.478 21.747 25.019Transfer to Capital 2.931 0.304 0.998 1.211 2.875
15.831 14.467 15.555 18.114 23.041Community Centres Revenue 0.232 0.222 0.222 0.222 0.222
Operating expenses 9.429 9.517 9.988 10.305 10.525Transfer to Capital 0.362 - 0.002 0.366 0.433
9.559 9.295 9.768 10.449 10.736Mill Rate Support/(Contribution) 43.665 40.366 43.714 47.918 55.088
Additional Financial Information
Capital Budget2019
Preliminary2020-2024Forecast
6 YearTotal
(In millions of $) 17.099 60.784 77.883
Preliminary 2019 Budget - Service Based 2-81
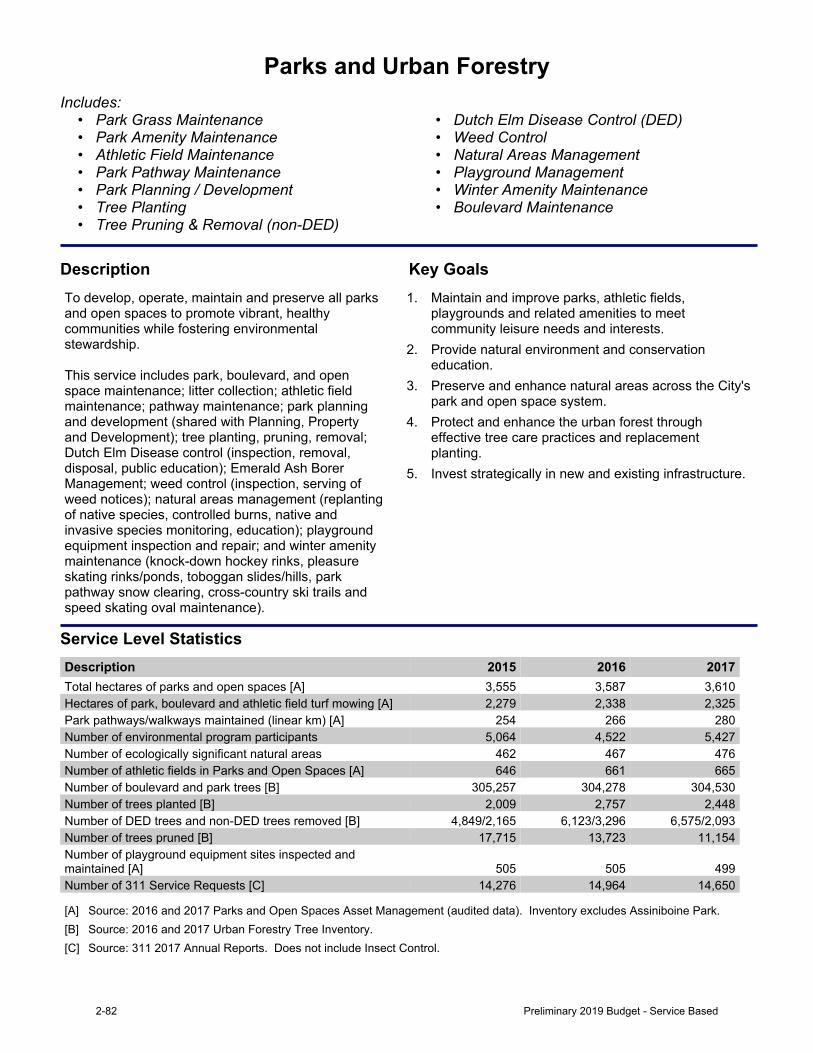
Parks and Urban ForestryIncludes:
• Park Grass Maintenance • Dutch Elm Disease Control (DED)• Park Amenity Maintenance • Weed Control• Athletic Field Maintenance • Natural Areas Management• Park Pathway Maintenance • Playground Management• Park Planning / Development • Winter Amenity Maintenance• Tree Planting • Boulevard Maintenance• Tree Pruning & Removal (non-DED)
Description Key GoalsTo develop, operate, maintain and preserve all parks and open spaces to promote vibrant, healthy communities while fostering environmental stewardship.This service includes park, boulevard, and open space maintenance; litter collection; athletic field maintenance; pathway maintenance; park planning and development (shared with Planning, Property and Development); tree planting, pruning, removal; Dutch Elm Disease control (inspection, removal, disposal, public education); Emerald Ash Borer Management; weed control (inspection, serving of weed notices); natural areas management (replanting of native species, controlled burns, native and invasive species monitoring, education); playground equipment inspection and repair; and winter amenity maintenance (knock-down hockey rinks, pleasure skating rinks/ponds, toboggan slides/hills, park pathway snow clearing, cross-country ski trails and speed skating oval maintenance).
1. Maintain and improve parks, athletic fields, playgrounds and related amenities to meet community leisure needs and interests.
2. Provide natural environment and conservation education.
3. Preserve and enhance natural areas across the City's park and open space system.
4. Protect and enhance the urban forest through effective tree care practices and replacement planting.
5. Invest strategically in new and existing infrastructure.
Service Level StatisticsDescription 2015 2016 2017Total hectares of parks and open spaces [A] 3,555 3,587 3,610Hectares of park, boulevard and athletic field turf mowing [A] 2,279 2,338 2,325Park pathways/walkways maintained (linear km) [A] 254 266 280Number of environmental program participants 5,064 4,522 5,427Number of ecologically significant natural areas 462 467 476Number of athletic fields in Parks and Open Spaces [A] 646 661 665Number of boulevard and park trees [B] 305,257 304,278 304,530Number of trees planted [B] 2,009 2,757 2,448Number of DED trees and non-DED trees removed [B] 4,849/2,165 6,123/3,296 6,575/2,093Number of trees pruned [B] 17,715 13,723 11,154Number of playground equipment sites inspected and maintained [A] 505 505 499Number of 311 Service Requests [C] 14,276 14,964 14,650
[A] Source: 2016 and 2017 Parks and Open Spaces Asset Management (audited data). Inventory excludes Assiniboine Park.[B] Source: 2016 and 2017 Urban Forestry Tree Inventory.[C] Source: 311 2017 Annual Reports. Does not include Insect Control.
2-82 Preliminary 2019 Budget - Service Based
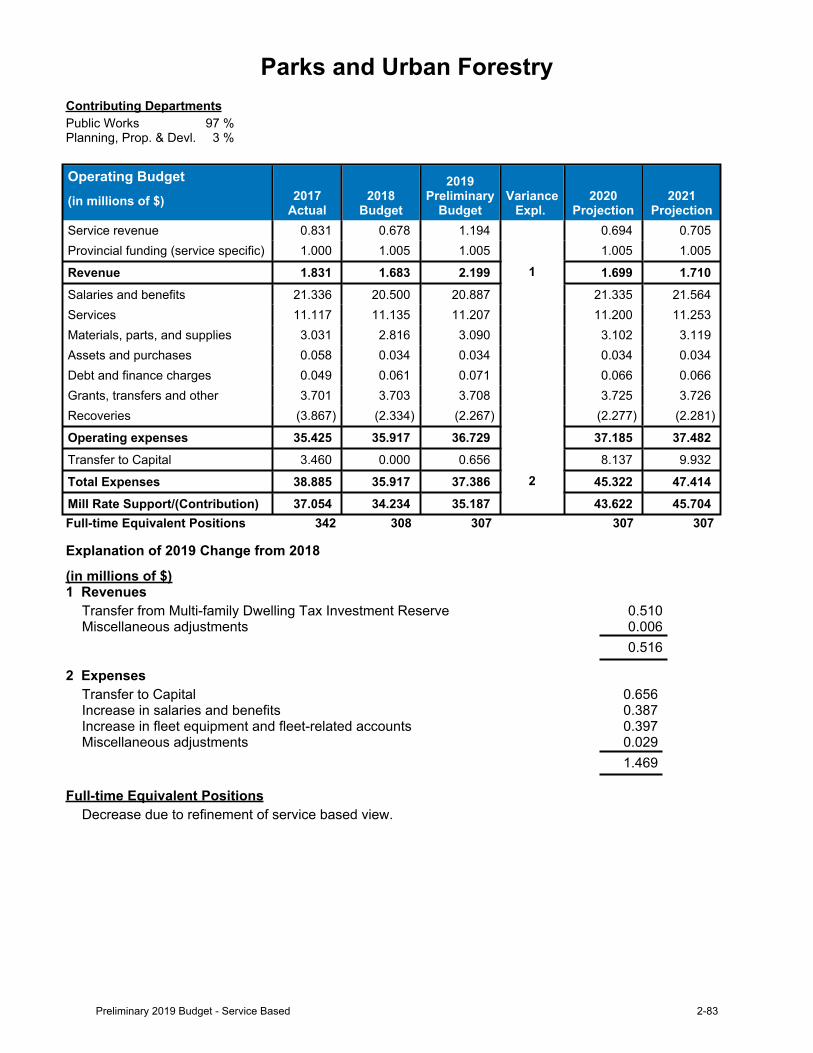
Parks and Urban ForestryContributing DepartmentsPublic Works 97 %Planning, Prop. & Devl. 3 %
Operating Budget(in millions of $) 2017
Actual2018
Budget
2019Preliminary
BudgetVariance
Expl. 2020
Projection2021
ProjectionService revenue 0.831 0.678 1.194 0.694 0.705Provincial funding (service specific) 1.000 1.005 1.005 1.005 1.005
Revenue 1.831 1.683 2.199 1 1.699 1.710Salaries and benefits 21.336 20.500 20.887 21.335 21.564Services 11.117 11.135 11.207 11.200 11.253Materials, parts, and supplies 3.031 2.816 3.090 3.102 3.119Assets and purchases 0.058 0.034 0.034 0.034 0.034Debt and finance charges 0.049 0.061 0.071 0.066 0.066Grants, transfers and other 3.701 3.703 3.708 3.725 3.726Recoveries (3.867) (2.334) (2.267) (2.277) (2.281)
Operating expenses 35.425 35.917 36.729 37.185 37.482Transfer to Capital 3.460 0.000 0.656 8.137 9.932
Total Expenses 38.885 35.917 37.386 2 45.322 47.414Mill Rate Support/(Contribution) 37.054 34.234 35.187 43.622 45.704Full-time Equivalent Positions 342 308 307 307 307
Explanation of 2019 Change from 2018
(in millions of $)1 Revenues
Transfer from Multi-family Dwelling Tax Investment Reserve 0.510Miscellaneous adjustments 0.006
0.516
2 ExpensesTransfer to Capital 0.656Increase in salaries and benefits 0.387Increase in fleet equipment and fleet-related accounts 0.397Miscellaneous adjustments 0.029
1.469
Full-time Equivalent PositionsDecrease due to refinement of service based view.
Preliminary 2019 Budget - Service Based 2-83
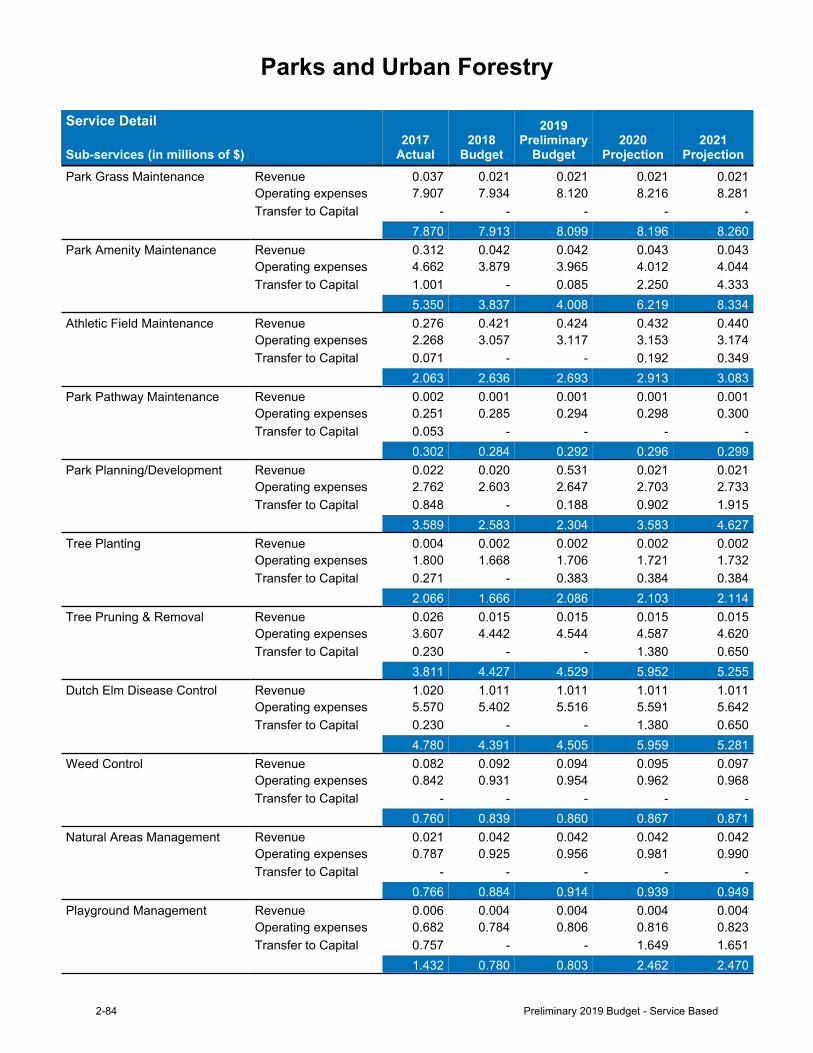
Parks and Urban Forestry
Service Detail
Sub-services (in millions of $)2017
Actual2018
Budget
2019Preliminary
Budget2020
Projection2021
ProjectionPark Grass Maintenance Revenue 0.037 0.021 0.021 0.021 0.021
Operating expenses 7.907 7.934 8.120 8.216 8.281Transfer to Capital - - - - -
7.870 7.913 8.099 8.196 8.260Park Amenity Maintenance Revenue 0.312 0.042 0.042 0.043 0.043
Operating expenses 4.662 3.879 3.965 4.012 4.044Transfer to Capital 1.001 - 0.085 2.250 4.333
5.350 3.837 4.008 6.219 8.334Athletic Field Maintenance Revenue 0.276 0.421 0.424 0.432 0.440
Operating expenses 2.268 3.057 3.117 3.153 3.174Transfer to Capital 0.071 - - 0.192 0.349
2.063 2.636 2.693 2.913 3.083Park Pathway Maintenance Revenue 0.002 0.001 0.001 0.001 0.001
Operating expenses 0.251 0.285 0.294 0.298 0.300Transfer to Capital 0.053 - - - -
0.302 0.284 0.292 0.296 0.299Park Planning/Development Revenue 0.022 0.020 0.531 0.021 0.021
Operating expenses 2.762 2.603 2.647 2.703 2.733Transfer to Capital 0.848 - 0.188 0.902 1.915
3.589 2.583 2.304 3.583 4.627Tree Planting Revenue 0.004 0.002 0.002 0.002 0.002
Operating expenses 1.800 1.668 1.706 1.721 1.732Transfer to Capital 0.271 - 0.383 0.384 0.384
2.066 1.666 2.086 2.103 2.114Tree Pruning & Removal Revenue 0.026 0.015 0.015 0.015 0.015
Operating expenses 3.607 4.442 4.544 4.587 4.620Transfer to Capital 0.230 - - 1.380 0.650
3.811 4.427 4.529 5.952 5.255Dutch Elm Disease Control Revenue 1.020 1.011 1.011 1.011 1.011
Operating expenses 5.570 5.402 5.516 5.591 5.642Transfer to Capital 0.230 - - 1.380 0.650
4.780 4.391 4.505 5.959 5.281Weed Control Revenue 0.082 0.092 0.094 0.095 0.097
Operating expenses 0.842 0.931 0.954 0.962 0.968Transfer to Capital - - - - -
0.760 0.839 0.860 0.867 0.871Natural Areas Management Revenue 0.021 0.042 0.042 0.042 0.042
Operating expenses 0.787 0.925 0.956 0.981 0.990Transfer to Capital - - - - -
0.766 0.884 0.914 0.939 0.949Playground Management Revenue 0.006 0.004 0.004 0.004 0.004
Operating expenses 0.682 0.784 0.806 0.816 0.823Transfer to Capital 0.757 - - 1.649 1.651
1.432 0.780 0.803 2.462 2.470
2-84 Preliminary 2019 Budget - Service Based
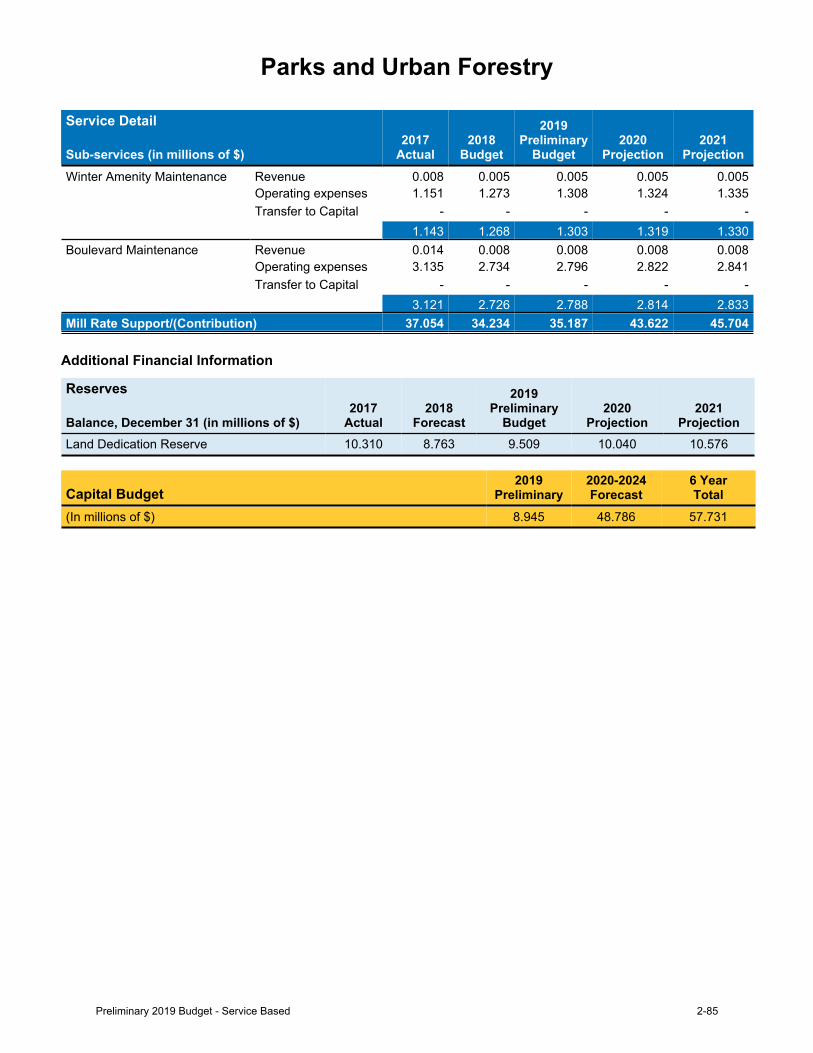
Parks and Urban Forestry
Service Detail
Sub-services (in millions of $)2017
Actual2018
Budget
2019Preliminary
Budget2020
Projection2021
ProjectionWinter Amenity Maintenance Revenue 0.008 0.005 0.005 0.005 0.005
Operating expenses 1.151 1.273 1.308 1.324 1.335Transfer to Capital - - - - -
1.143 1.268 1.303 1.319 1.330Boulevard Maintenance Revenue 0.014 0.008 0.008 0.008 0.008
Operating expenses 3.135 2.734 2.796 2.822 2.841Transfer to Capital - - - - -
3.121 2.726 2.788 2.814 2.833Mill Rate Support/(Contribution) 37.054 34.234 35.187 43.622 45.704
Additional Financial Information
Reserves
Balance, December 31 (in millions of $)2017
Actual2018
Forecast
2019Preliminary
Budget2020
Projection2021
ProjectionLand Dedication Reserve 10.310 8.763 9.509 10.040 10.576
Capital Budget2019
Preliminary2020-2024Forecast
6 YearTotal
(In millions of $) 8.945 48.786 57.731
Preliminary 2019 Budget - Service Based 2-85
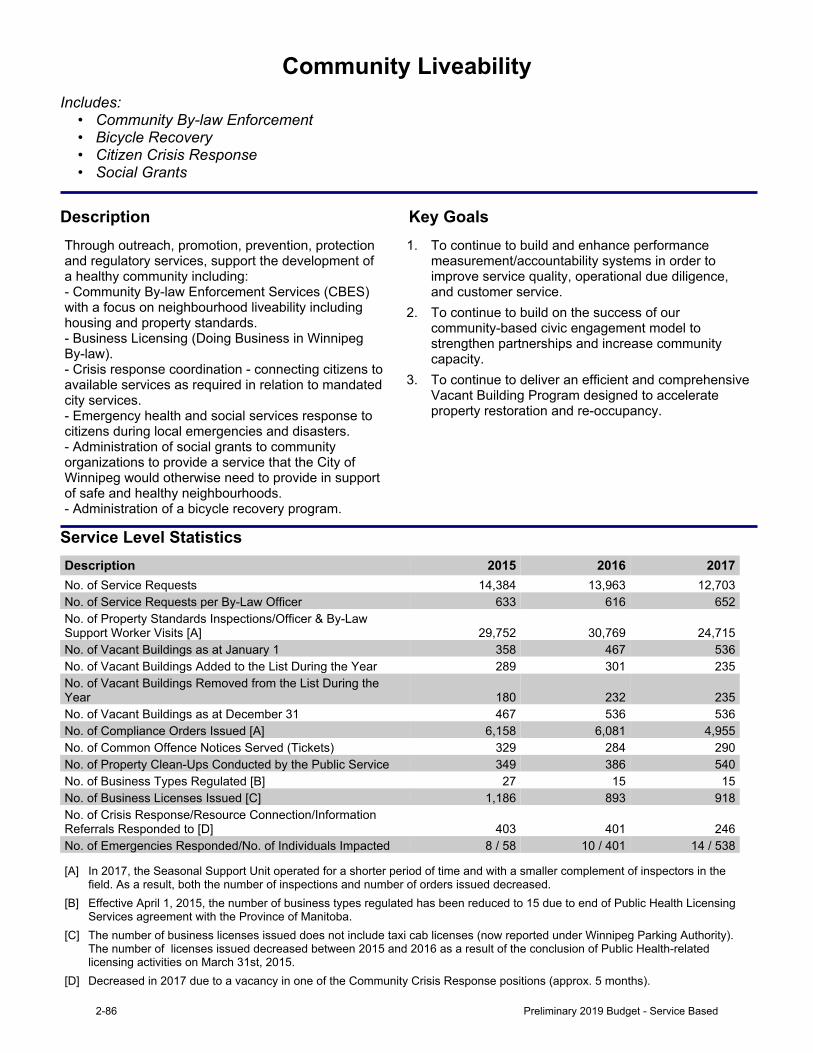
Community LiveabilityIncludes:
• Community By-law Enforcement• Bicycle Recovery• Citizen Crisis Response• Social Grants
Description Key GoalsThrough outreach, promotion, prevention, protection and regulatory services, support the development of ahealthycommunityincluding:- Community By-law Enforcement Services (CBES) with a focus on neighbourhood liveability including housingandpropertystandards.- Business Licensing (Doing Business in Winnipeg By-law).- Crisis response coordination - connecting citizens to available services as required in relation to mandated cityservices.- Emergency health and social services response to citizensduringlocalemergenciesanddisasters.- Administration of social grants to community organizations to provide a service that the City of Winnipeg would otherwise need to provide in support ofsafeandhealthyneighbourhoods.- Administration of a bicycle recovery program.
1. To continue to build and enhance performance measurement/accountability systems in order to improve service quality, operational due diligence, and customer service.
2. To continue to build on the success of our community-based civic engagement model to strengthen partnerships and increase community capacity.
3. To continue to deliver an efficient and comprehensive Vacant Building Program designed to accelerate property restoration and re-occupancy.
Service Level StatisticsDescription 2015 2016 2017No. of Service Requests 14,384 13,963 12,703No. of Service Requests per By-Law Officer 633 616 652No. of Property Standards Inspections/Officer & By-Law Support Worker Visits [A] 29,752 30,769 24,715No. of Vacant Buildings as at January 1 358 467 536No. of Vacant Buildings Added to the List During the Year 289 301 235No. of Vacant Buildings Removed from the List During the Year 180 232 235No. of Vacant Buildings as at December 31 467 536 536No. of Compliance Orders Issued [A] 6,158 6,081 4,955No. of Common Offence Notices Served (Tickets) 329 284 290No. of Property Clean-Ups Conducted by the Public Service 349 386 540No. of Business Types Regulated [B] 27 15 15No. of Business Licenses Issued [C] 1,186 893 918No. of Crisis Response/Resource Connection/Information Referrals Responded to [D] 403 401 246No. of Emergencies Responded/No. of Individuals Impacted 8 / 58 10 / 401 14 / 538
[A] In 2017, the Seasonal Support Unit operated for a shorter period of time and with a smaller complement of inspectors in the field. As a result, both the number of inspections and number of orders issued decreased.
[B] Effective April 1, 2015, the number of business types regulated has been reduced to 15 due to end of Public Health Licensing Services agreement with the Province of Manitoba.
[C] The number of business licenses issued does not include taxi cab licenses (now reported under Winnipeg Parking Authority). The number of licenses issued decreased between 2015 and 2016 as a result of the conclusion of Public Health-related licensing activities on March 31st, 2015.
[D] Decreased in 2017 due to a vacancy in one of the Community Crisis Response positions (approx. 5 months).
2-86 Preliminary 2019 Budget - Service Based
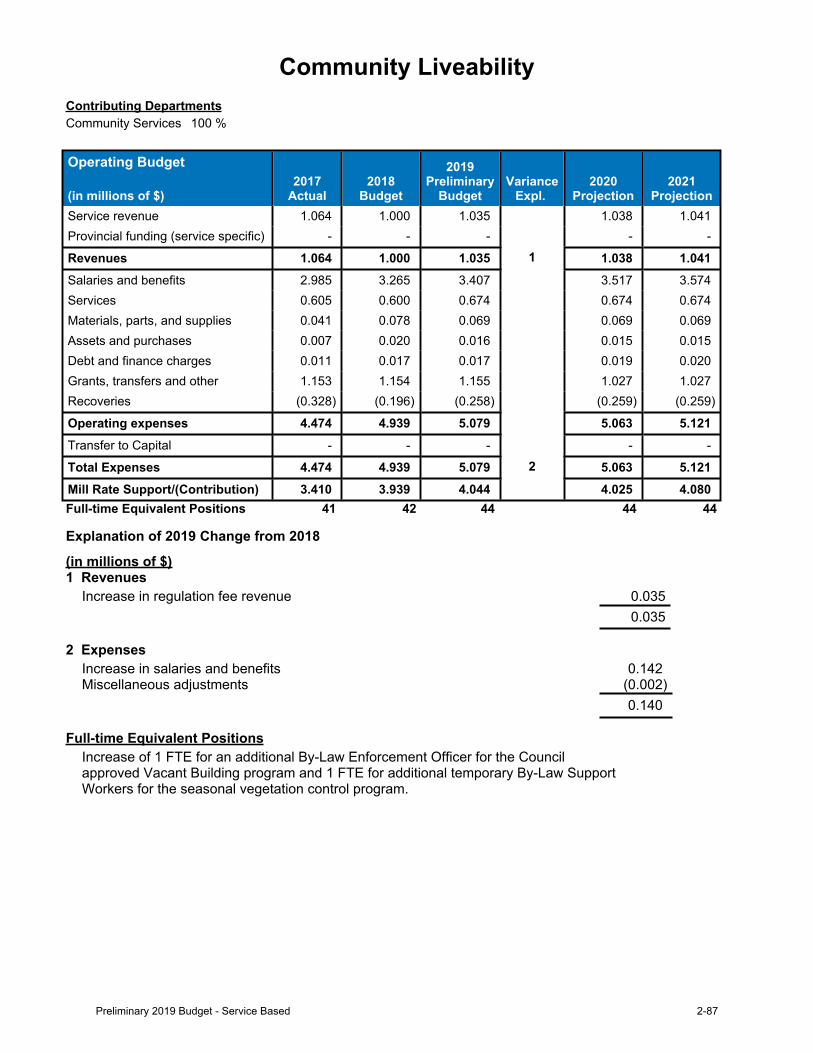
Community LiveabilityContributing DepartmentsCommunity Services 100 %
Operating Budget
(in millions of $)2017
Actual2018
Budget
2019Preliminary
BudgetVariance
Expl. 2020
Projection2021
ProjectionService revenue 1.064 1.000 1.035 1.038 1.041Provincial funding (service specific) - - - - -
Revenues 1.064 1.000 1.035 1 1.038 1.041Salaries and benefits 2.985 3.265 3.407 3.517 3.574Services 0.605 0.600 0.674 0.674 0.674Materials, parts, and supplies 0.041 0.078 0.069 0.069 0.069Assets and purchases 0.007 0.020 0.016 0.015 0.015Debt and finance charges 0.011 0.017 0.017 0.019 0.020Grants, transfers and other 1.153 1.154 1.155 1.027 1.027Recoveries (0.328) (0.196) (0.258) (0.259) (0.259)
Operating expenses 4.474 4.939 5.079 5.063 5.121Transfer to Capital - - - - -
Total Expenses 4.474 4.939 5.079 2 5.063 5.121Mill Rate Support/(Contribution) 3.410 3.939 4.044 4.025 4.080Full-time Equivalent Positions 41 42 44 44 44
Explanation of 2019 Change from 2018
(in millions of $)1 Revenues
Increase in regulation fee revenue 0.0350.035
2 ExpensesIncrease in salaries and benefits 0.142Miscellaneous adjustments (0.002)
0.140
Full-time Equivalent PositionsIncrease of 1 FTE for an additional By-Law Enforcement Officer for the Council approved Vacant Building program and 1 FTE for additional temporary By-Law Support Workers for the seasonal vegetation control program.
Preliminary 2019 Budget - Service Based 2-87
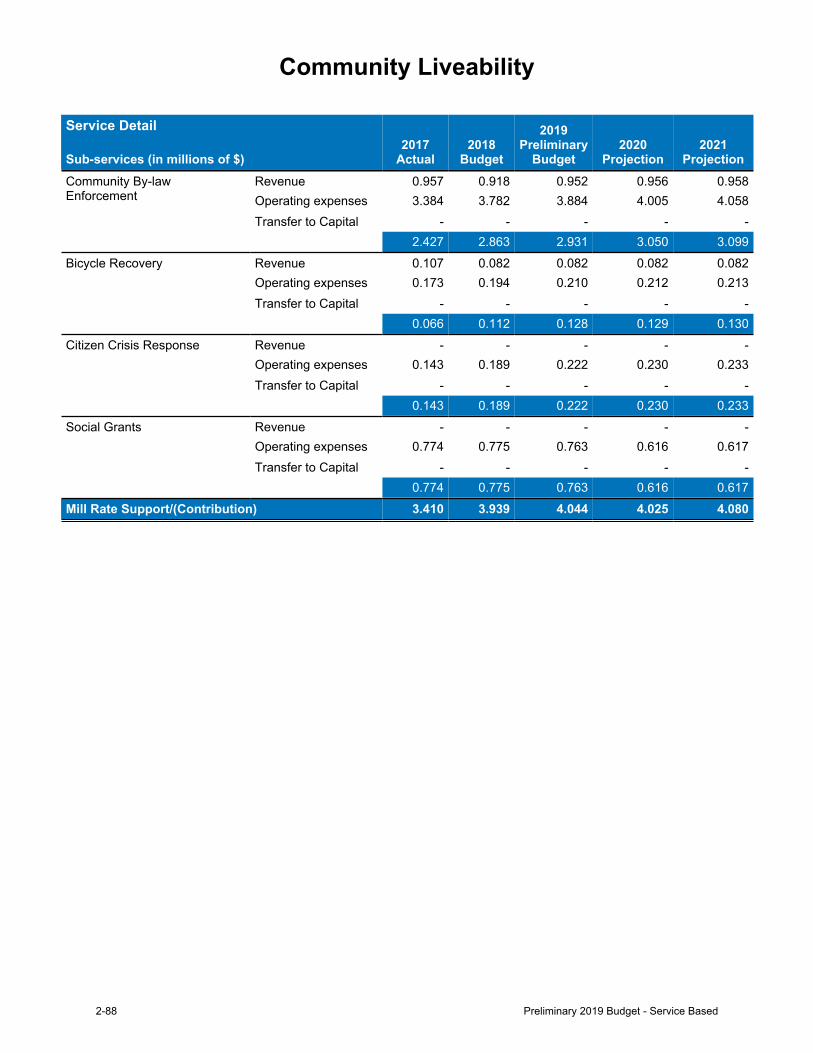
Community Liveability
Service Detail
Sub-services (in millions of $)2017
Actual2018
Budget
2019Preliminary
Budget2020
Projection2021
ProjectionCommunity By-law Enforcement
Revenue 0.957 0.918 0.952 0.956 0.958Operating expenses 3.384 3.782 3.884 4.005 4.058Transfer to Capital - - - - -
2.427 2.863 2.931 3.050 3.099Bicycle Recovery Revenue 0.107 0.082 0.082 0.082 0.082
Operating expenses 0.173 0.194 0.210 0.212 0.213Transfer to Capital - - - - -
0.066 0.112 0.128 0.129 0.130Citizen Crisis Response Revenue - - - - -
Operating expenses 0.143 0.189 0.222 0.230 0.233Transfer to Capital - - - - -
0.143 0.189 0.222 0.230 0.233Social Grants Revenue - - - - -
Operating expenses 0.774 0.775 0.763 0.616 0.617Transfer to Capital - - - - -
0.774 0.775 0.763 0.616 0.617Mill Rate Support/(Contribution) 3.410 3.939 4.044 4.025 4.080
2-88 Preliminary 2019 Budget - Service Based
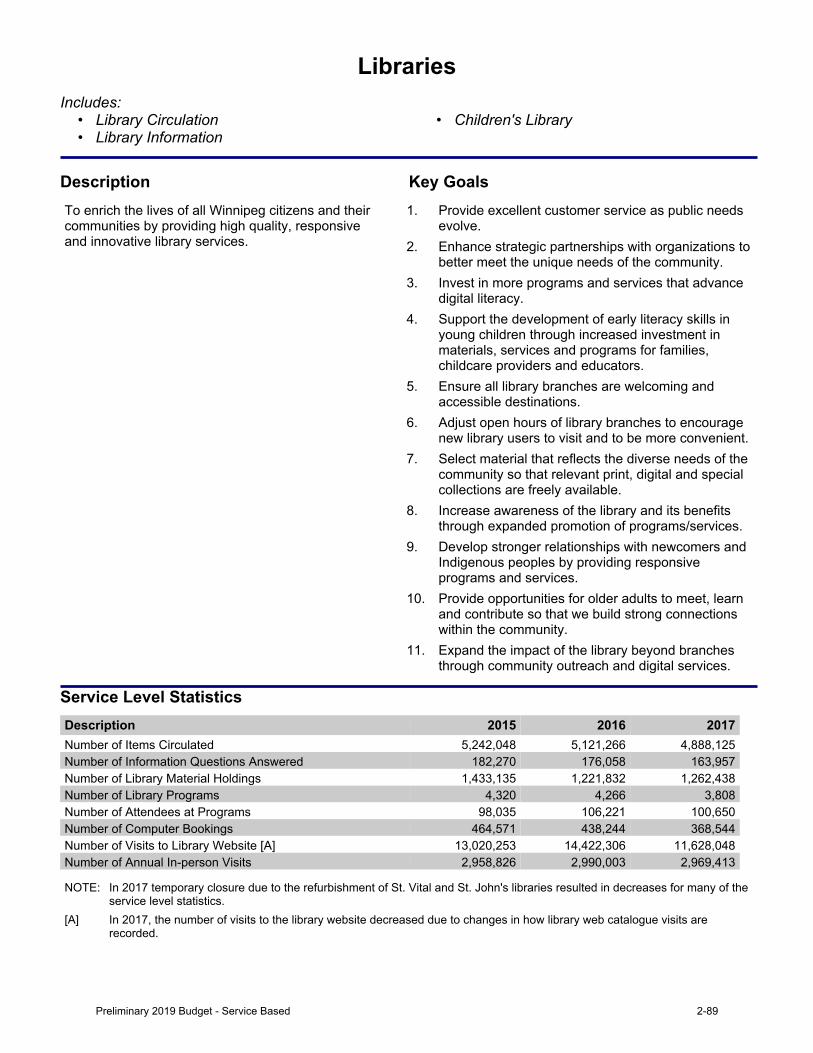
LibrariesIncludes:
• Library Circulation • Children's Library• Library Information
Description Key GoalsTo enrich the lives of all Winnipeg citizens and their communities by providing high quality, responsive and innovative library services.
1. Provide excellent customer service as public needs evolve.
2. Enhance strategic partnerships with organizations to better meet the unique needs of the community.
3. Invest in more programs and services that advance digital literacy.
4. Support the development of early literacy skills in young children through increased investment in materials, services and programs for families, childcare providers and educators.
5. Ensure all library branches are welcoming and accessible destinations.
6. Adjust open hours of library branches to encourage new library users to visit and to be more convenient.
7. Select material that reflects the diverse needs of the community so that relevant print, digital and special collections are freely available.
8. Increase awareness of the library and its benefits through expanded promotion of programs/services.
9. Develop stronger relationships with newcomers and Indigenous peoples by providing responsive programs and services.
10. Provide opportunities for older adults to meet, learn and contribute so that we build strong connections within the community.
11. Expand the impact of the library beyond branches through community outreach and digital services.
Service Level StatisticsDescription 2015 2016 2017Number of Items Circulated 5,242,048 5,121,266 4,888,125Number of Information Questions Answered 182,270 176,058 163,957Number of Library Material Holdings 1,433,135 1,221,832 1,262,438Number of Library Programs 4,320 4,266 3,808Number of Attendees at Programs 98,035 106,221 100,650Number of Computer Bookings 464,571 438,244 368,544Number of Visits to Library Website [A] 13,020,253 14,422,306 11,628,048Number of Annual In-person Visits 2,958,826 2,990,003 2,969,413
NOTE: In 2017 temporary closure due to the refurbishment of St. Vital and St. John's libraries resulted in decreases for many of the service level statistics.
[A] In 2017, the number of visits to the library website decreased due to changes in how library web catalogue visits are recorded.
Preliminary 2019 Budget - Service Based 2-89
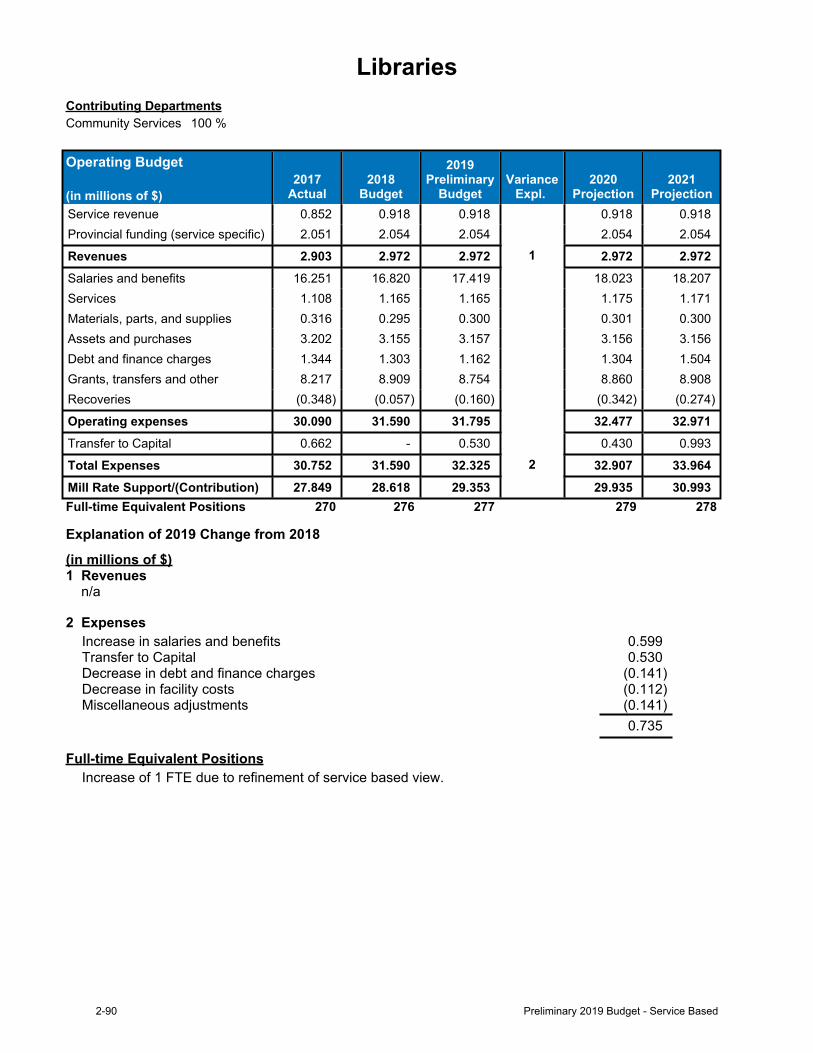
LibrariesContributing DepartmentsCommunity Services 100 %
Operating Budget
(in millions of $)2017
Actual2018
Budget
2019Preliminary
BudgetVariance
Expl. 2020
Projection2021
ProjectionService revenue 0.852 0.918 0.918 0.918 0.918Provincial funding (service specific) 2.051 2.054 2.054 2.054 2.054
Revenues 2.903 2.972 2.972 1 2.972 2.972Salaries and benefits 16.251 16.820 17.419 18.023 18.207Services 1.108 1.165 1.165 1.175 1.171Materials, parts, and supplies 0.316 0.295 0.300 0.301 0.300Assets and purchases 3.202 3.155 3.157 3.156 3.156Debt and finance charges 1.344 1.303 1.162 1.304 1.504Grants, transfers and other 8.217 8.909 8.754 8.860 8.908Recoveries (0.348) (0.057) (0.160) (0.342) (0.274)
Operating expenses 30.090 31.590 31.795 32.477 32.971Transfer to Capital 0.662 - 0.530 0.430 0.993
Total Expenses 30.752 31.590 32.325 2 32.907 33.964Mill Rate Support/(Contribution) 27.849 28.618 29.353 29.935 30.993Full-time Equivalent Positions 270 276 277 279 278
Explanation of 2019 Change from 2018
(in millions of $)1 Revenues n/a
2 ExpensesIncrease in salaries and benefits 0.599Transfer to Capital 0.530Decrease in debt and finance charges (0.141)Decrease in facility costs (0.112)Miscellaneous adjustments (0.141)
0.735
Full-time Equivalent PositionsIncrease of 1 FTE due to refinement of service based view.
2-90 Preliminary 2019 Budget - Service Based
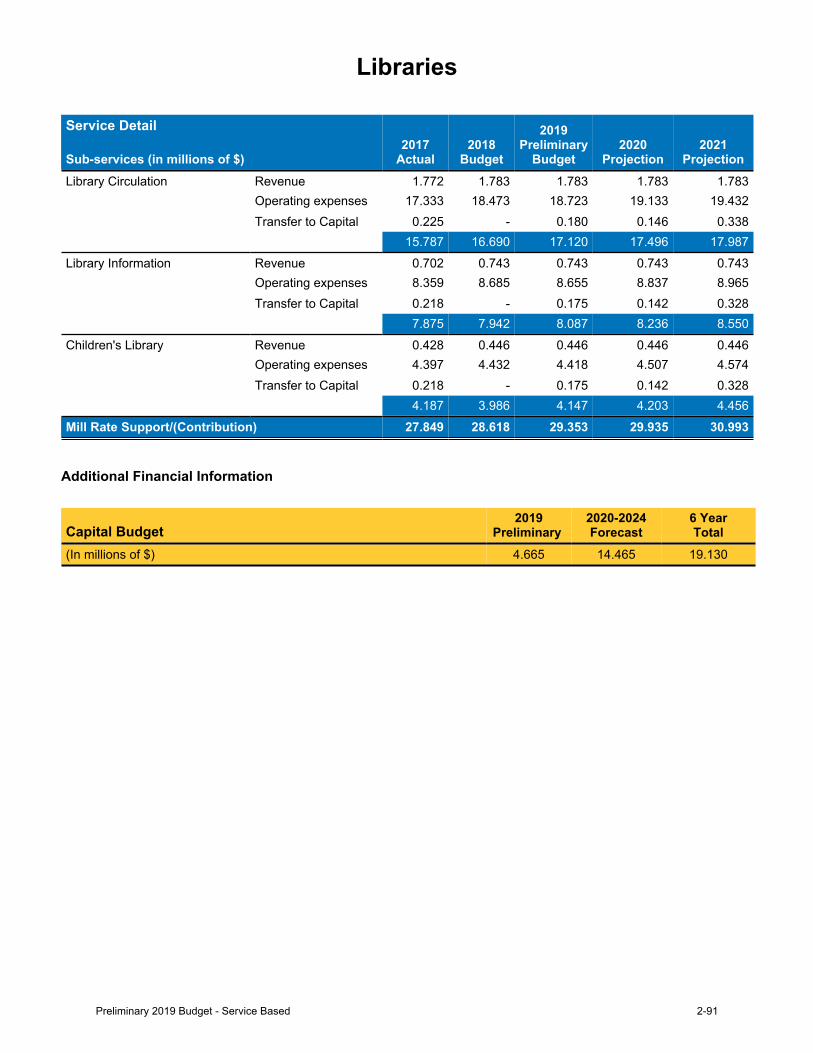
Libraries
Service Detail
Sub-services (in millions of $)2017
Actual2018
Budget
2019Preliminary
Budget2020
Projection2021
ProjectionLibrary Circulation Revenue 1.772 1.783 1.783 1.783 1.783
Operating expenses 17.333 18.473 18.723 19.133 19.432Transfer to Capital 0.225 - 0.180 0.146 0.338
15.787 16.690 17.120 17.496 17.987Library Information Revenue 0.702 0.743 0.743 0.743 0.743
Operating expenses 8.359 8.685 8.655 8.837 8.965Transfer to Capital 0.218 - 0.175 0.142 0.328
7.875 7.942 8.087 8.236 8.550Children's Library Revenue 0.428 0.446 0.446 0.446 0.446
Operating expenses 4.397 4.432 4.418 4.507 4.574Transfer to Capital 0.218 - 0.175 0.142 0.328
4.187 3.986 4.147 4.203 4.456Mill Rate Support/(Contribution) 27.849 28.618 29.353 29.935 30.993
Additional Financial Information
Capital Budget2019
Preliminary2020-2024Forecast
6 YearTotal
(In millions of $) 4.665 14.465 19.130
Preliminary 2019 Budget - Service Based 2-91
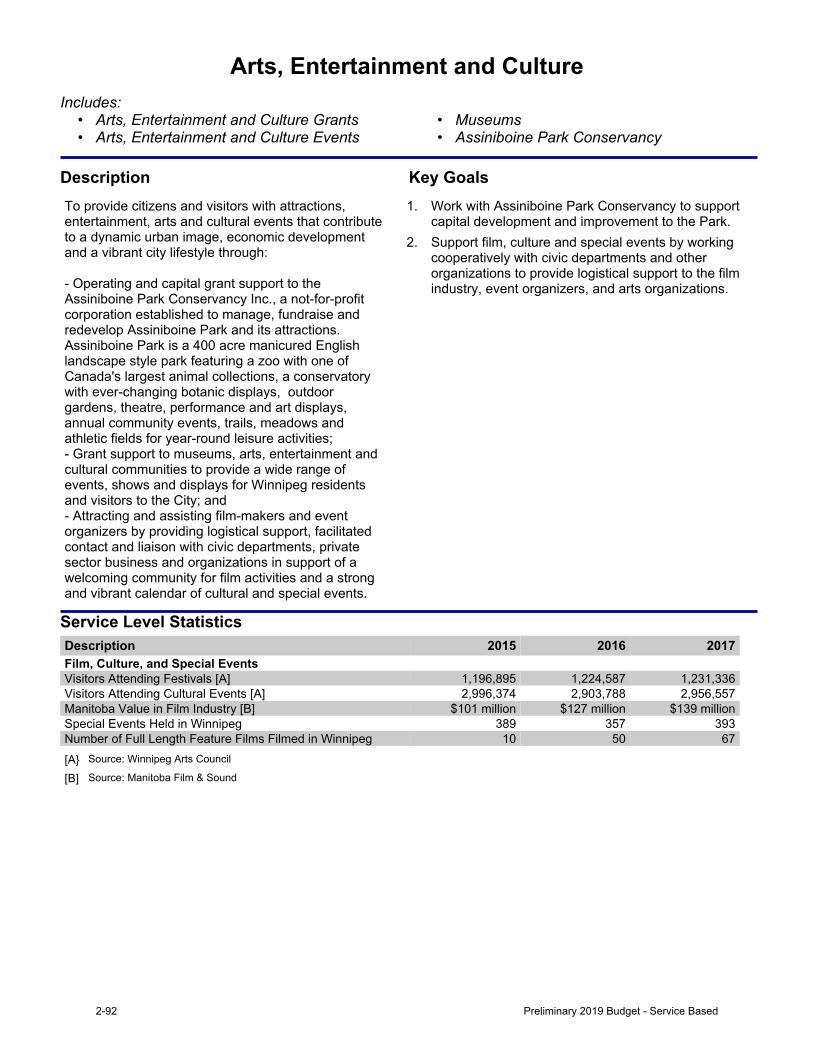
Arts, Entertainment and CultureIncludes:
• Arts, Entertainment and Culture Grants • Museums• Arts, Entertainment and Culture Events • Assiniboine Park Conservancy
Description Key GoalsTo provide citizens and visitors with attractions, entertainment, arts and cultural events that contribute to a dynamic urban image, economic development andavibrantcitylifestylethrough:- Operating and capital grant support to the Assiniboine Park Conservancy Inc., a not-for-profit corporation established to manage, fundraise and redevelop Assiniboine Park and its attractions. Assiniboine Park is a 400 acre manicured English landscape style park featuring a zoo with one of Canada's largest animal collections, a conservatory with ever-changing botanic displays, outdoor gardens, theatre, performance and art displays, annual community events, trails, meadows and athleticfieldsforyear-roundleisureactivities;- Grant support to museums, arts, entertainment and cultural communities to provide a wide range of events, shows and displays for Winnipeg residents andvisitorstotheCity;and- Attracting and assisting film-makers and event organizers by providing logistical support, facilitated contact and liaison with civic departments, private sector business and organizations in support of a welcoming community for film activities and a strong and vibrant calendar of cultural and special events.
1. Work with Assiniboine Park Conservancy to support capital development and improvement to the Park.
2. Support film, culture and special events by working cooperatively with civic departments and other organizations to provide logistical support to the film industry, event organizers, and arts organizations.
Service Level StatisticsDescription 2015 2016 2017Film, Culture, and Special Events Visitors Attending Festivals [A] 1,196,895 1,224,587 1,231,336Visitors Attending Cultural Events [A] 2,996,374 2,903,788 2,956,557Manitoba Value in Film Industry [B] $101 million $127 million $139 millionSpecial Events Held in Winnipeg 389 357 393Number of Full Length Feature Films Filmed in Winnipeg 10 50 67[A} Source: Winnipeg Arts Council
[B] Source: Manitoba Film & Sound
2-92 Preliminary 2019 Budget - Service Based
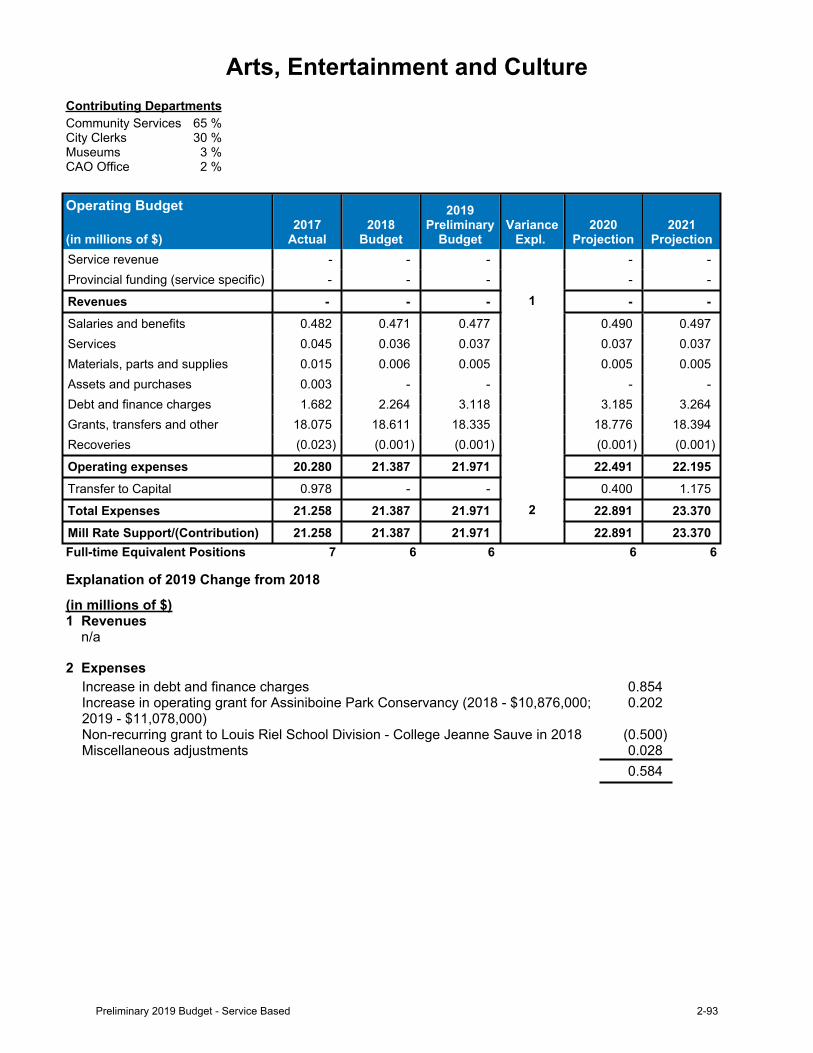
Arts, Entertainment and CultureContributing DepartmentsCommunity Services 65 %City Clerks 30 %Museums 3 %CAO Office 2 %
Operating Budget
(in millions of $)2017
Actual2018
Budget
2019Preliminary
BudgetVariance
Expl. 2020
Projection2021
ProjectionService revenue - - - - -Provincial funding (service specific) - - - - -
Revenues - - - 1 - -Salaries and benefits 0.482 0.471 0.477 0.490 0.497Services 0.045 0.036 0.037 0.037 0.037Materials, parts and supplies 0.015 0.006 0.005 0.005 0.005Assets and purchases 0.003 - - - -Debt and finance charges 1.682 2.264 3.118 3.185 3.264Grants, transfers and other 18.075 18.611 18.335 18.776 18.394Recoveries (0.023) (0.001) (0.001) (0.001) (0.001)
Operating expenses 20.280 21.387 21.971 22.491 22.195Transfer to Capital 0.978 - - 0.400 1.175
Total Expenses 21.258 21.387 21.971 2 22.891 23.370Mill Rate Support/(Contribution) 21.258 21.387 21.971 22.891 23.370Full-time Equivalent Positions 7 6 6 6 6
Explanation of 2019 Change from 2018
(in millions of $)1 Revenues n/a
2 ExpensesIncrease in debt and finance charges 0.854Increase in operating grant for Assiniboine Park Conservancy (2018 - $10,876,000; 2019 - $11,078,000)
0.202
Non-recurring grant to Louis Riel School Division - College Jeanne Sauve in 2018 (0.500)Miscellaneous adjustments 0.028
0.584
Preliminary 2019 Budget - Service Based 2-93
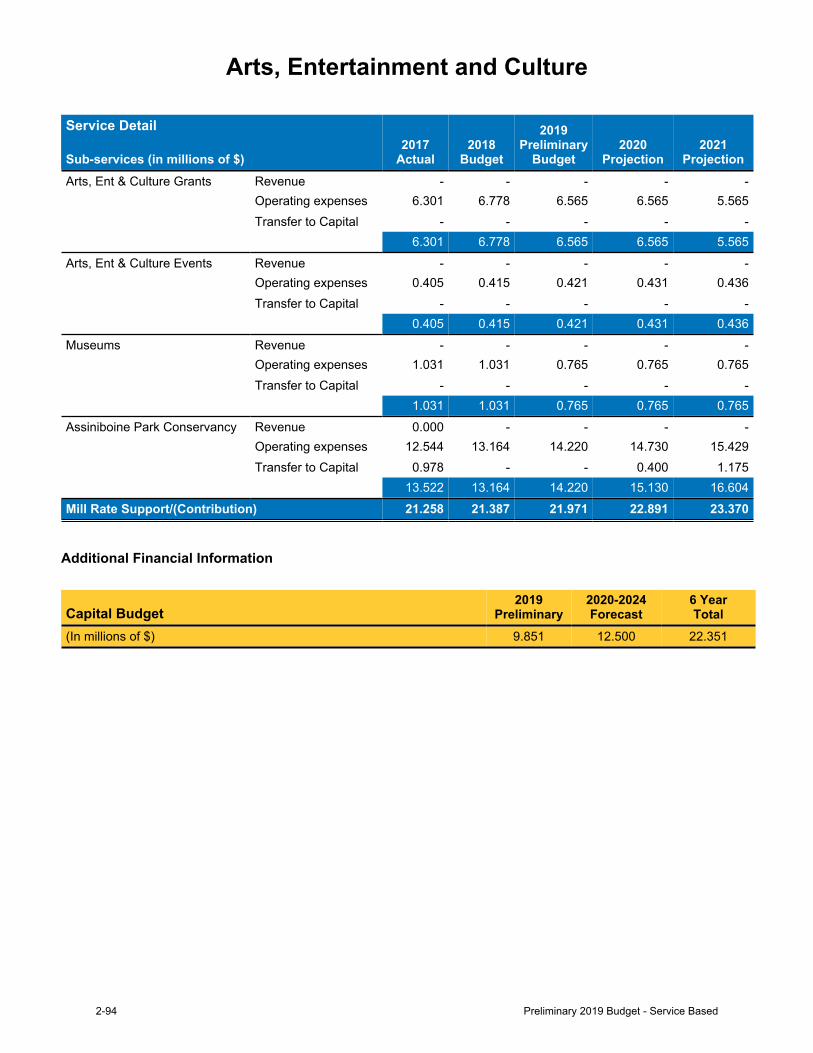
Arts, Entertainment and Culture
Service Detail
Sub-services (in millions of $)2017
Actual2018
Budget
2019Preliminary
Budget2020
Projection2021
ProjectionArts, Ent & Culture Grants Revenue - - - - -
Operating expenses 6.301 6.778 6.565 6.565 5.565Transfer to Capital - - - - -
6.301 6.778 6.565 6.565 5.565Arts, Ent & Culture Events Revenue - - - - -
Operating expenses 0.405 0.415 0.421 0.431 0.436Transfer to Capital - - - - -
0.405 0.415 0.421 0.431 0.436Museums Revenue - - - - -
Operating expenses 1.031 1.031 0.765 0.765 0.765Transfer to Capital - - - - -
1.031 1.031 0.765 0.765 0.765Assiniboine Park Conservancy Revenue 0.000 - - - -
Operating expenses 12.544 13.164 14.220 14.730 15.429Transfer to Capital 0.978 - - 0.400 1.175
13.522 13.164 14.220 15.130 16.604Mill Rate Support/(Contribution) 21.258 21.387 21.971 22.891 23.370
Additional Financial Information
Capital Budget2019
Preliminary2020-2024Forecast
6 YearTotal
(In millions of $) 9.851 12.500 22.351
2-94 Preliminary 2019 Budget - Service Based
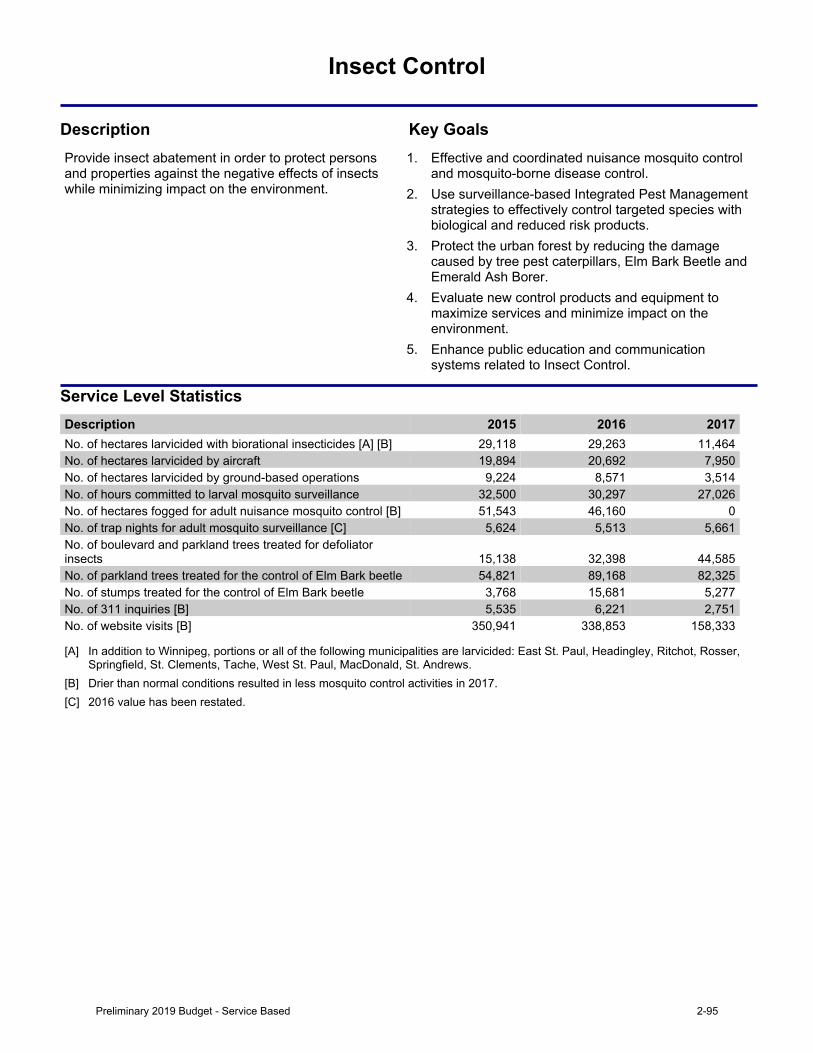
Insect Control
Description Key GoalsProvide insect abatement in order to protect persons and properties against the negative effects of insects while minimizing impact on the environment.
1. Effective and coordinated nuisance mosquito control and mosquito-borne disease control.
2. Use surveillance-based Integrated Pest Management strategies to effectively control targeted species with biological and reduced risk products.
3. Protect the urban forest by reducing the damage caused by tree pest caterpillars, Elm Bark Beetle and Emerald Ash Borer.
4. Evaluate new control products and equipment to maximize services and minimize impact on the environment.
5. Enhance public education and communication systems related to Insect Control.
Service Level StatisticsDescription 2015 2016 2017No. of hectares larvicided with biorational insecticides [A] [B] 29,118 29,263 11,464No. of hectares larvicided by aircraft 19,894 20,692 7,950No. of hectares larvicided by ground-based operations 9,224 8,571 3,514No. of hours committed to larval mosquito surveillance 32,500 30,297 27,026No. of hectares fogged for adult nuisance mosquito control [B] 51,543 46,160 0No. of trap nights for adult mosquito surveillance [C] 5,624 5,513 5,661No. of boulevard and parkland trees treated for defoliator insects 15,138 32,398 44,585No. of parkland trees treated for the control of Elm Bark beetle 54,821 89,168 82,325No. of stumps treated for the control of Elm Bark beetle 3,768 15,681 5,277No. of 311 inquiries [B] 5,535 6,221 2,751No. of website visits [B] 350,941 338,853 158,333
[A] In addition to Winnipeg, portions or all of the following municipalities are larvicided: East St. Paul, Headingley, Ritchot, Rosser, Springfield, St. Clements, Tache, West St. Paul, MacDonald, St. Andrews.
[B] Drier than normal conditions resulted in less mosquito control activities in 2017.[C] 2016 value has been restated.
Preliminary 2019 Budget - Service Based 2-95
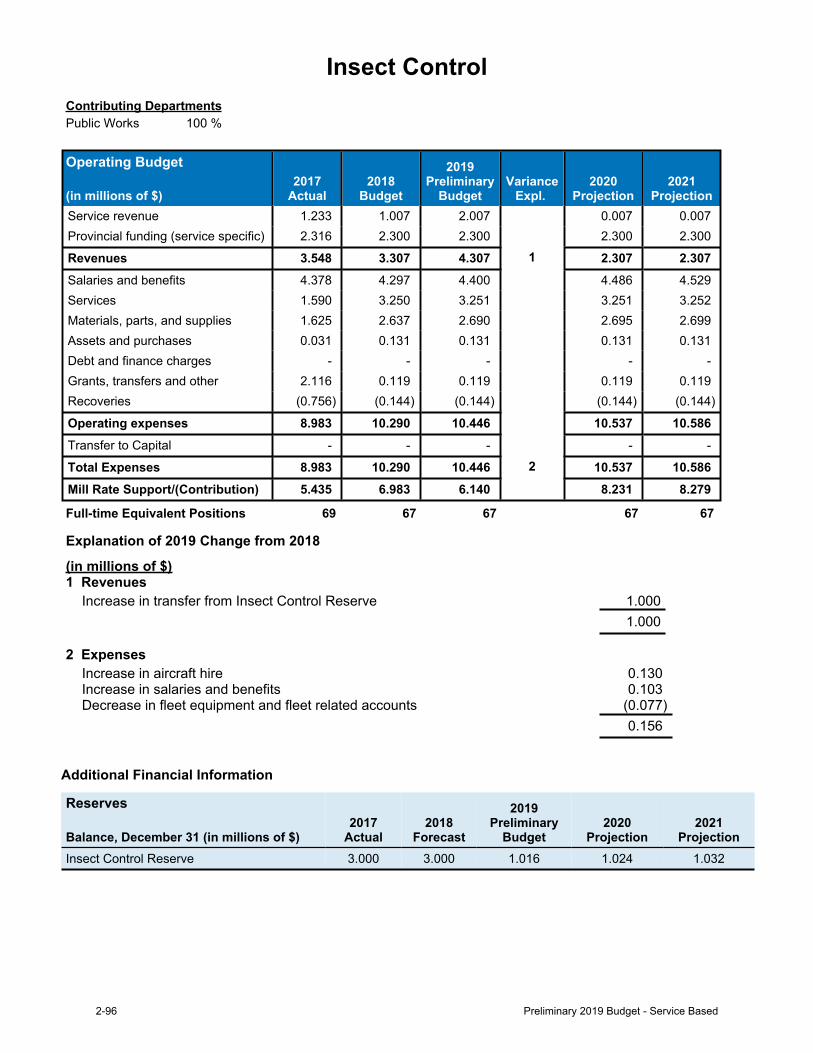
Insect ControlContributing DepartmentsPublic Works 100 %
Operating Budget
(in millions of $)2017
Actual2018
Budget
2019Preliminary
BudgetVariance
Expl. 2020
Projection2021
ProjectionService revenue 1.233 1.007 2.007 0.007 0.007Provincial funding (service specific) 2.316 2.300 2.300 2.300 2.300
Revenues 3.548 3.307 4.307 1 2.307 2.307Salaries and benefits 4.378 4.297 4.400 4.486 4.529Services 1.590 3.250 3.251 3.251 3.252Materials, parts, and supplies 1.625 2.637 2.690 2.695 2.699Assets and purchases 0.031 0.131 0.131 0.131 0.131Debt and finance charges - - - - -Grants, transfers and other 2.116 0.119 0.119 0.119 0.119Recoveries (0.756) (0.144) (0.144) (0.144) (0.144)
Operating expenses 8.983 10.290 10.446 10.537 10.586Transfer to Capital - - - - -
Total Expenses 8.983 10.290 10.446 2 10.537 10.586Mill Rate Support/(Contribution) 5.435 6.983 6.140 8.231 8.279
Full-time Equivalent Positions 69 67 67 67 67
Explanation of 2019 Change from 2018
(in millions of $)1 Revenues
Increase in transfer from Insect Control Reserve 1.0001.000
2 ExpensesIncrease in aircraft hire 0.130Increase in salaries and benefits 0.103Decrease in fleet equipment and fleet related accounts (0.077)
0.156
Additional Financial Information
Reserves
Balance, December 31 (in millions of $)2017
Actual2018
Forecast
2019Preliminary
Budget2020
Projection2021
ProjectionInsect Control Reserve 3.000 3.000 1.016 1.024 1.032
2-96 Preliminary 2019 Budget - Service Based
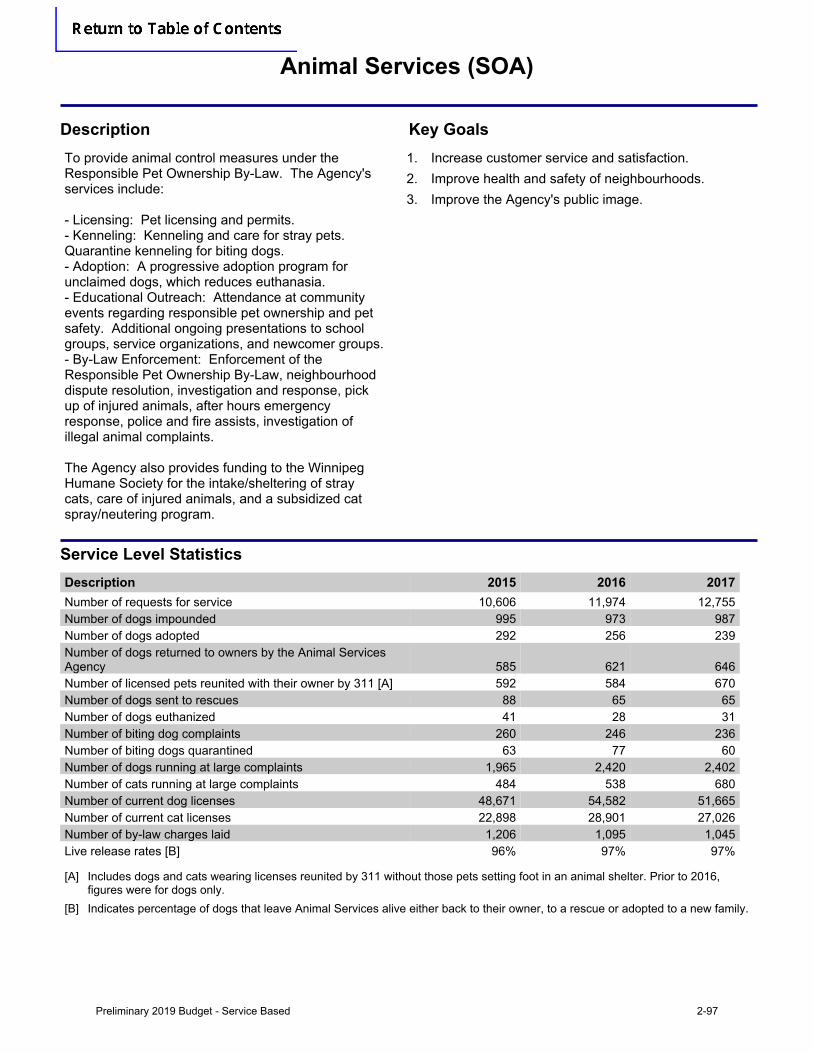
Animal Services (SOA)
Description Key GoalsTo provide animal control measures under the Responsible Pet Ownership By-Law. The Agency's servicesinclude:-Licensing:Petlicensingandpermits.- Kenneling: Kenneling and care for stray pets. Quarantinekennelingforbitingdogs.- Adoption: A progressive adoption program for unclaimeddogs,whichreduceseuthanasia.- Educational Outreach: Attendance at community events regarding responsible pet ownership and pet safety. Additional ongoing presentations to school groups,serviceorganizations,andnewcomergroups.- By-Law Enforcement: Enforcement of the Responsible Pet Ownership By-Law, neighbourhood dispute resolution, investigation and response, pick up of injured animals, after hours emergency response, police and fire assists, investigation of illegalanimalcomplaints.The Agency also provides funding to the Winnipeg Humane Society for the intake/sheltering of stray cats, care of injured animals, and a subsidized cat spray/neutering program.
1. Increase customer service and satisfaction.2. Improve health and safety of neighbourhoods.3. Improve the Agency's public image.
Service Level StatisticsDescription 2015 2016 2017Number of requests for service 10,606 11,974 12,755Number of dogs impounded 995 973 987Number of dogs adopted 292 256 239Number of dogs returned to owners by the Animal Services Agency 585 621 646Number of licensed pets reunited with their owner by 311 [A] 592 584 670Number of dogs sent to rescues 88 65 65Number of dogs euthanized 41 28 31Number of biting dog complaints 260 246 236Number of biting dogs quarantined 63 77 60Number of dogs running at large complaints 1,965 2,420 2,402Number of cats running at large complaints 484 538 680Number of current dog licenses 48,671 54,582 51,665Number of current cat licenses 22,898 28,901 27,026Number of by-law charges laid 1,206 1,095 1,045Live release rates [B] 96% 97% 97%
[A] Includes dogs and cats wearing licenses reunited by 311 without those pets setting foot in an animal shelter. Prior to 2016, figures were for dogs only.
[B] Indicates percentage of dogs that leave Animal Services alive either back to their owner, to a rescue or adopted to a new family.
Preliminary 2019 Budget - Service Based 2-97
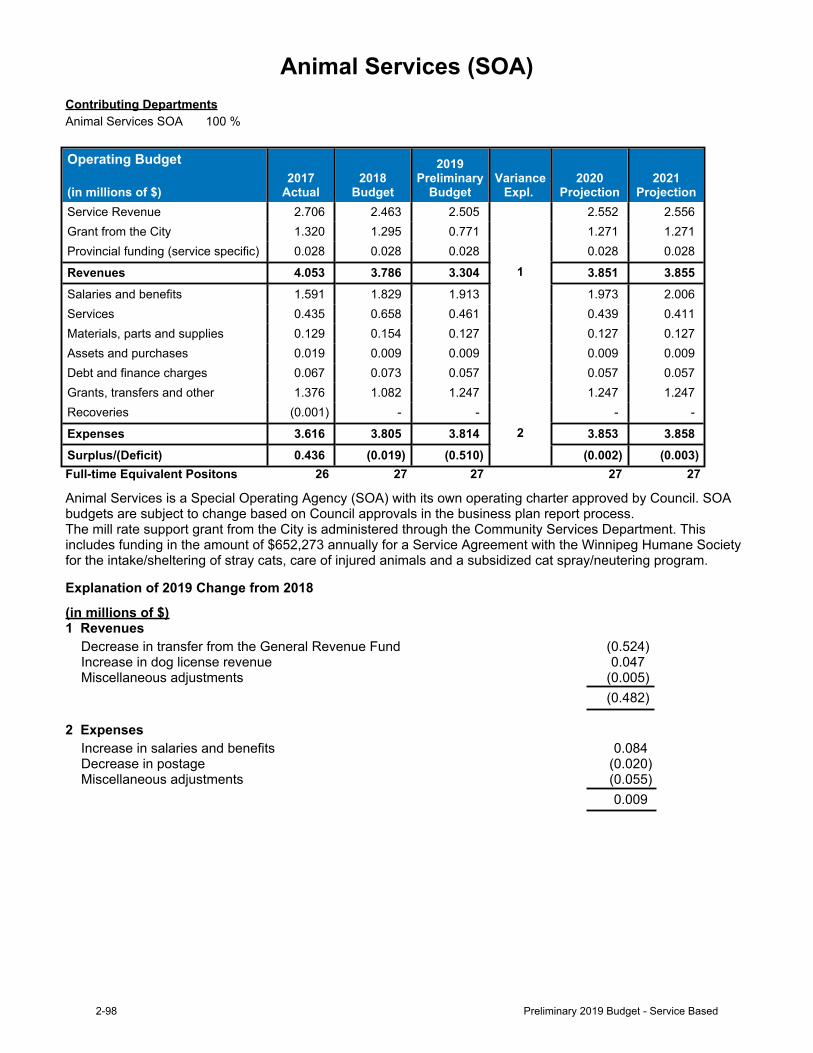
Animal Services (SOA)Contributing DepartmentsAnimal Services SOA 100 %
Operating Budget
(in millions of $)2017
Actual2018
Budget
2019Preliminary
BudgetVariance
Expl. 2020
Projection2021
ProjectionService Revenue 2.706 2.463 2.505 2.552 2.556Grant from the City 1.320 1.295 0.771 1.271 1.271Provincial funding (service specific) 0.028 0.028 0.028 0.028 0.028
Revenues 4.053 3.786 3.304 1 3.851 3.855Salaries and benefits 1.591 1.829 1.913 1.973 2.006Services 0.435 0.658 0.461 0.439 0.411Materials, parts and supplies 0.129 0.154 0.127 0.127 0.127Assets and purchases 0.019 0.009 0.009 0.009 0.009Debt and finance charges 0.067 0.073 0.057 0.057 0.057Grants, transfers and other 1.376 1.082 1.247 1.247 1.247Recoveries (0.001) - - - -
Expenses 3.616 3.805 3.814 2 3.853 3.858Surplus/(Deficit) 0.436 (0.019) (0.510) (0.002) (0.003)Full-time Equivalent Positons 26 27 27 27 27
Animal Services is a Special Operating Agency (SOA) with its own operating charter approved by Council. SOA budgets are subject to change based on Council approvals in the business plan report process. The mill rate support grant from the City is administered through the Community Services Department. This includes funding in the amount of $652,273 annually for a Service Agreement with the Winnipeg Humane Society for the intake/sheltering of stray cats, care of injured animals and a subsidized cat spray/neutering program.
Explanation of 2019 Change from 2018
(in millions of $)1 Revenues
Decrease in transfer from the General Revenue Fund (0.524)Increase in dog license revenue 0.047Miscellaneous adjustments (0.005)
(0.482)
2 ExpensesIncrease in salaries and benefits 0.084Decrease in postage (0.020)Miscellaneous adjustments (0.055)
0.009
2-98 Preliminary 2019 Budget - Service Based
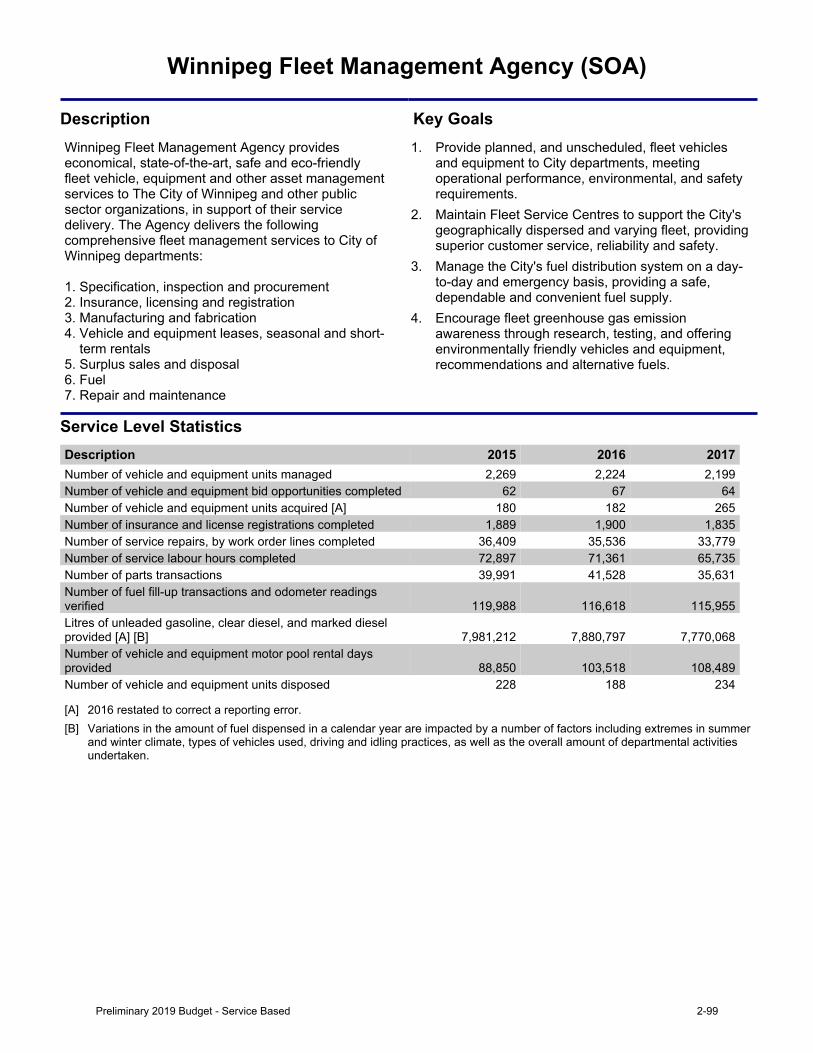
Winnipeg Fleet Management Agency (SOA)
Description Key GoalsWinnipeg Fleet Management Agency provides economical, state-of-the-art, safe and eco-friendly fleet vehicle, equipment and other asset management services to The City of Winnipeg and other public sector organizations, in support of their service delivery. The Agency delivers the following comprehensive fleet management services to City of Winnipegdepartments:1.Specification,inspectionandprocurement2.Insurance,licensingandregistration3.Manufacturingandfabrication4.Vehicleandequipmentleases,seasonalandshort-termrentals5.Surplussalesanddisposal6.Fuel7. Repair and maintenance
1. Provide planned, and unscheduled, fleet vehicles and equipment to City departments, meeting operational performance, environmental, and safety requirements.
2. Maintain Fleet Service Centres to support the City's geographically dispersed and varying fleet, providing superior customer service, reliability and safety.
3. Manage the City's fuel distribution system on a day-to-day and emergency basis, providing a safe, dependable and convenient fuel supply.
4. Encourage fleet greenhouse gas emission awareness through research, testing, and offering environmentally friendly vehicles and equipment, recommendations and alternative fuels.
Service Level StatisticsDescription 2015 2016 2017Number of vehicle and equipment units managed 2,269 2,224 2,199Number of vehicle and equipment bid opportunities completed 62 67 64Number of vehicle and equipment units acquired [A] 180 182 265Number of insurance and license registrations completed 1,889 1,900 1,835Number of service repairs, by work order lines completed 36,409 35,536 33,779Number of service labour hours completed 72,897 71,361 65,735Number of parts transactions 39,991 41,528 35,631Number of fuel fill-up transactions and odometer readings verified 119,988 116,618 115,955Litres of unleaded gasoline, clear diesel, and marked diesel provided [A] [B] 7,981,212 7,880,797 7,770,068Number of vehicle and equipment motor pool rental days provided 88,850 103,518 108,489Number of vehicle and equipment units disposed 228 188 234
[A] 2016 restated to correct a reporting error.[B] Variations in the amount of fuel dispensed in a calendar year are impacted by a number of factors including extremes in summer
and winter climate, types of vehicles used, driving and idling practices, as well as the overall amount of departmental activities undertaken.
Preliminary 2019 Budget - Service Based 2-99
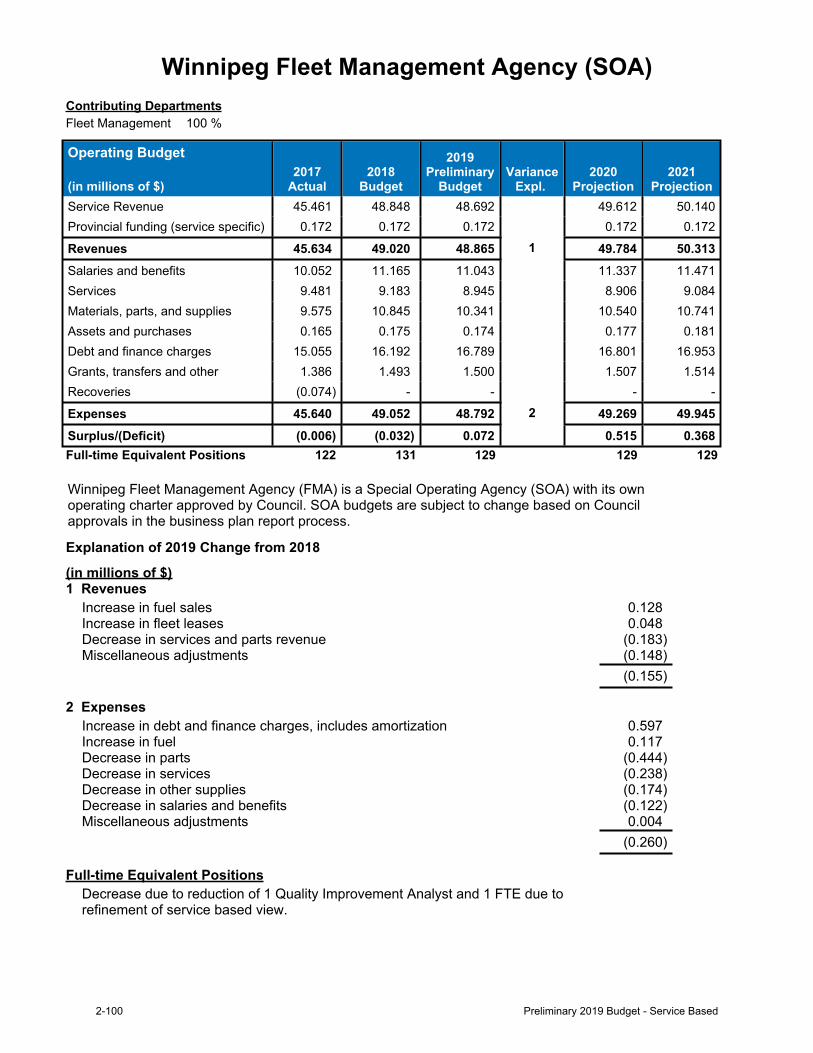
Winnipeg Fleet Management Agency (SOA)Contributing DepartmentsFleet Management 100 %
Operating Budget
(in millions of $)2017
Actual2018
Budget
2019Preliminary
BudgetVariance
Expl. 2020
Projection2021
ProjectionService Revenue 45.461 48.848 48.692 49.612 50.140Provincial funding (service specific) 0.172 0.172 0.172 0.172 0.172
Revenues 45.634 49.020 48.865 1 49.784 50.313Salaries and benefits 10.052 11.165 11.043 11.337 11.471Services 9.481 9.183 8.945 8.906 9.084Materials, parts, and supplies 9.575 10.845 10.341 10.540 10.741Assets and purchases 0.165 0.175 0.174 0.177 0.181Debt and finance charges 15.055 16.192 16.789 16.801 16.953Grants, transfers and other 1.386 1.493 1.500 1.507 1.514Recoveries (0.074) - - - -
Expenses 45.640 49.052 48.792 2 49.269 49.945Surplus/(Deficit) (0.006) (0.032) 0.072 0.515 0.368Full-time Equivalent Positions 122 131 129 129 129
Winnipeg Fleet Management Agency (FMA) is a Special Operating Agency (SOA) with its own operating charter approved by Council. SOA budgets are subject to change based on Council approvals in the business plan report process.
Explanation of 2019 Change from 2018
(in millions of $)1 Revenues
Increase in fuel sales 0.128Increase in fleet leases 0.048Decrease in services and parts revenue (0.183)Miscellaneous adjustments (0.148)
(0.155)
2 ExpensesIncrease in debt and finance charges, includes amortization 0.597Increase in fuel 0.117Decrease in parts (0.444)Decrease in services (0.238)Decrease in other supplies (0.174)Decrease in salaries and benefits (0.122)Miscellaneous adjustments 0.004
(0.260)
Full-time Equivalent PositionsDecrease due to reduction of 1 Quality Improvement Analyst and 1 FTE due to refinement of service based view.
2-100 Preliminary 2019 Budget - Service Based
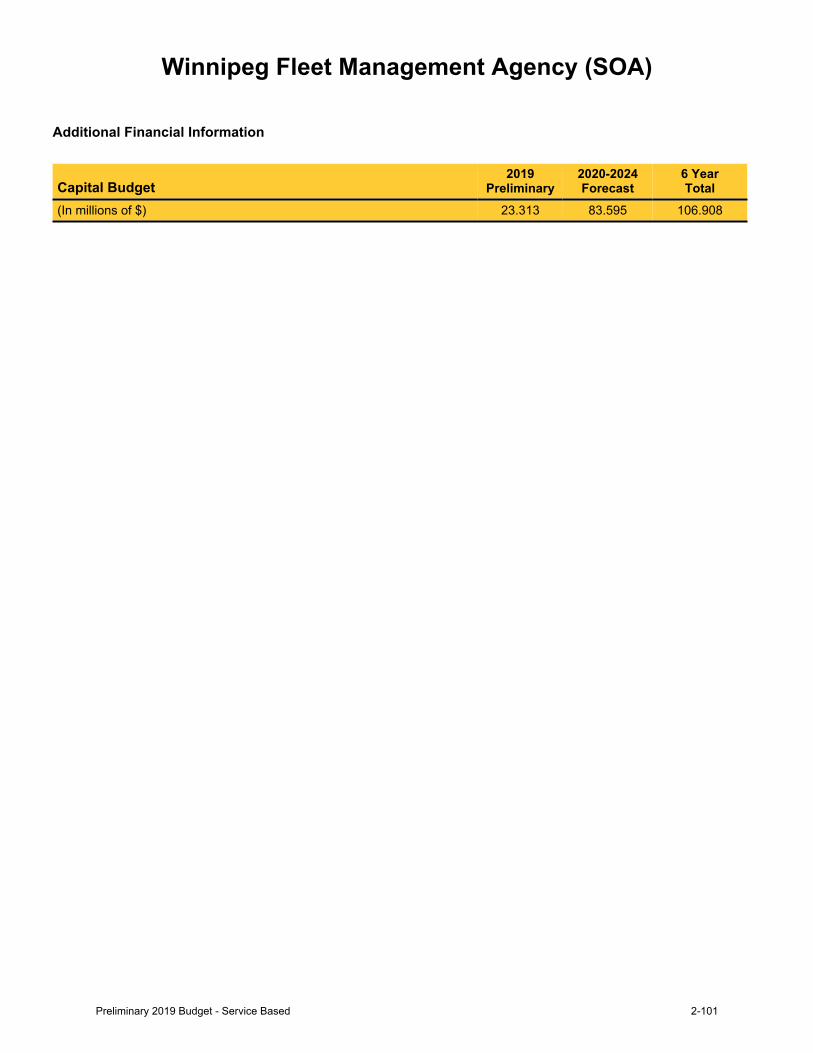
Winnipeg Fleet Management Agency (SOA)
Additional Financial Information
Capital Budget2019
Preliminary2020-2024Forecast
6 YearTotal
(In millions of $) 23.313 83.595 106.908
Preliminary 2019 Budget - Service Based 2-101
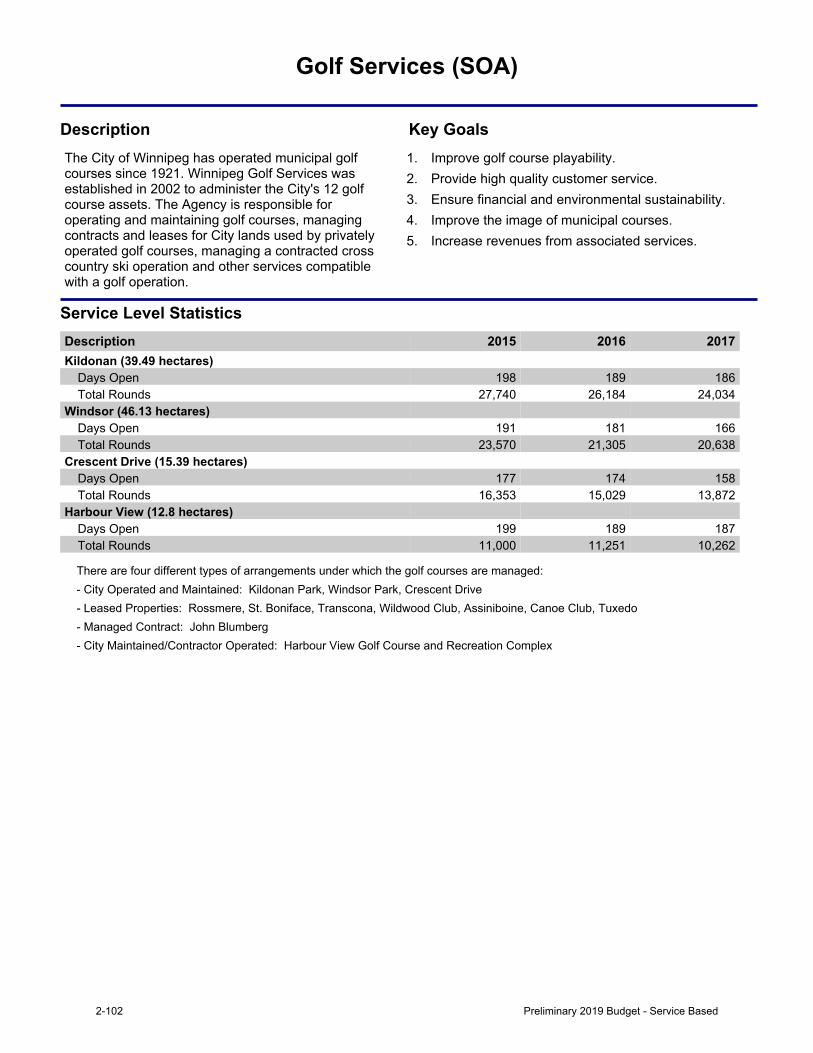
Golf Services (SOA)
Description Key GoalsThe City of Winnipeg has operated municipal golf courses since 1921. Winnipeg Golf Services was established in 2002 to administer the City's 12 golf course assets. The Agency is responsible for operating and maintaining golf courses, managing contracts and leases for City lands used by privately operated golf courses, managing a contracted cross country ski operation and other services compatible with a golf operation.
1. Improve golf course playability.2. Provide high quality customer service.3. Ensure financial and environmental sustainability.4. Improve the image of municipal courses.5. Increase revenues from associated services.
Service Level StatisticsDescription 2015 2016 2017Kildonan (39.49 hectares)
Days Open 198 189 186Total Rounds 27,740 26,184 24,034
Windsor (46.13 hectares) Days Open 191 181 166Total Rounds 23,570 21,305 20,638
Crescent Drive (15.39 hectares) Days Open 177 174 158Total Rounds 16,353 15,029 13,872
Harbour View (12.8 hectares) Days Open 199 189 187Total Rounds 11,000 11,251 10,262
There are four different types of arrangements under which the golf courses are managed: - City Operated and Maintained: Kildonan Park, Windsor Park, Crescent Drive - Leased Properties: Rossmere, St. Boniface, Transcona, Wildwood Club, Assiniboine, Canoe Club, Tuxedo - Managed Contract: John Blumberg - City Maintained/Contractor Operated: Harbour View Golf Course and Recreation Complex
2-102 Preliminary 2019 Budget - Service Based
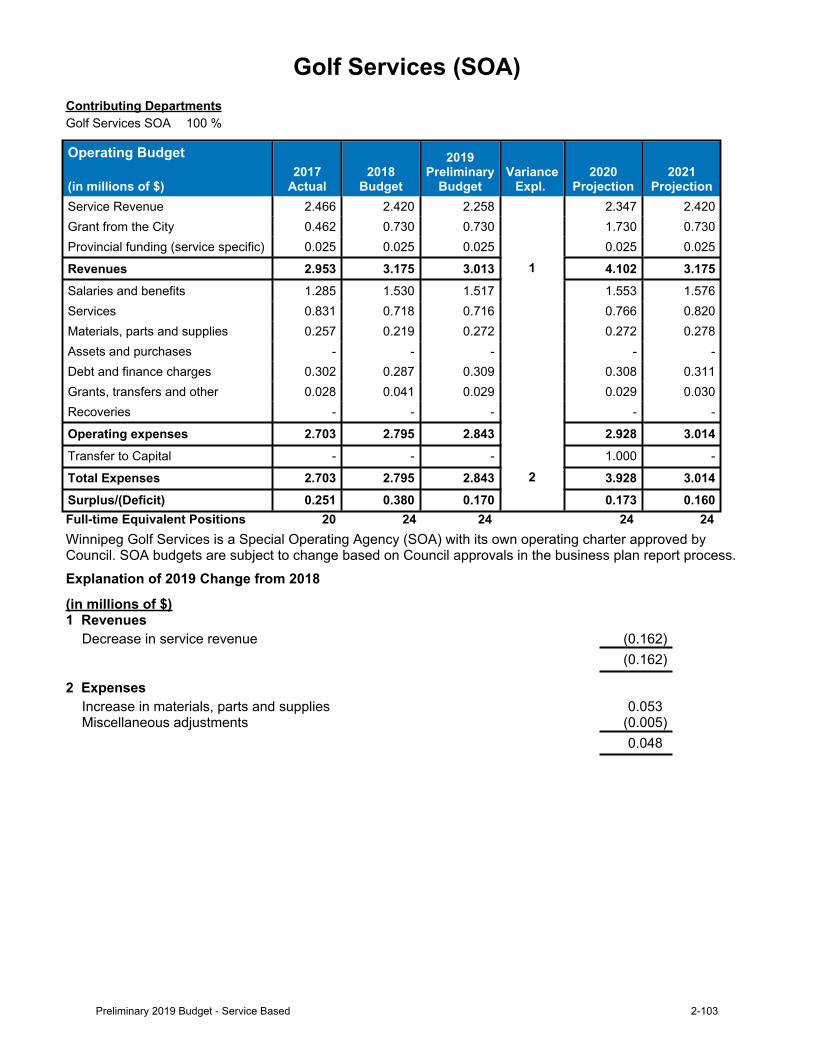
Golf Services (SOA)Contributing DepartmentsGolf Services SOA 100 %
Operating Budget
(in millions of $)2017
Actual2018
Budget
2019Preliminary
BudgetVariance
Expl. 2020
Projection2021
ProjectionService Revenue 2.466 2.420 2.258 2.347 2.420Grant from the City 0.462 0.730 0.730 1.730 0.730Provincial funding (service specific) 0.025 0.025 0.025 0.025 0.025
Revenues 2.953 3.175 3.013 1 4.102 3.175Salaries and benefits 1.285 1.530 1.517 1.553 1.576Services 0.831 0.718 0.716 0.766 0.820Materials, parts and supplies 0.257 0.219 0.272 0.272 0.278Assets and purchases - - - - -Debt and finance charges 0.302 0.287 0.309 0.308 0.311Grants, transfers and other 0.028 0.041 0.029 0.029 0.030Recoveries - - - - -
Operating expenses 2.703 2.795 2.843 2.928 3.014Transfer to Capital - - - 1.000 -
Total Expenses 2.703 2.795 2.843 2 3.928 3.014Surplus/(Deficit) 0.251 0.380 0.170 0.173 0.160Full-time Equivalent Positions 20 24 24 24 24Winnipeg Golf Services is a Special Operating Agency (SOA) with its own operating charter approved by Council. SOA budgets are subject to change based on Council approvals in the business plan report process. Explanation of 2019 Change from 2018
(in millions of $)1 Revenues
Decrease in service revenue (0.162)(0.162)
2 ExpensesIncrease in materials, parts and supplies 0.053Miscellaneous adjustments (0.005)
0.048
Preliminary 2019 Budget - Service Based 2-103
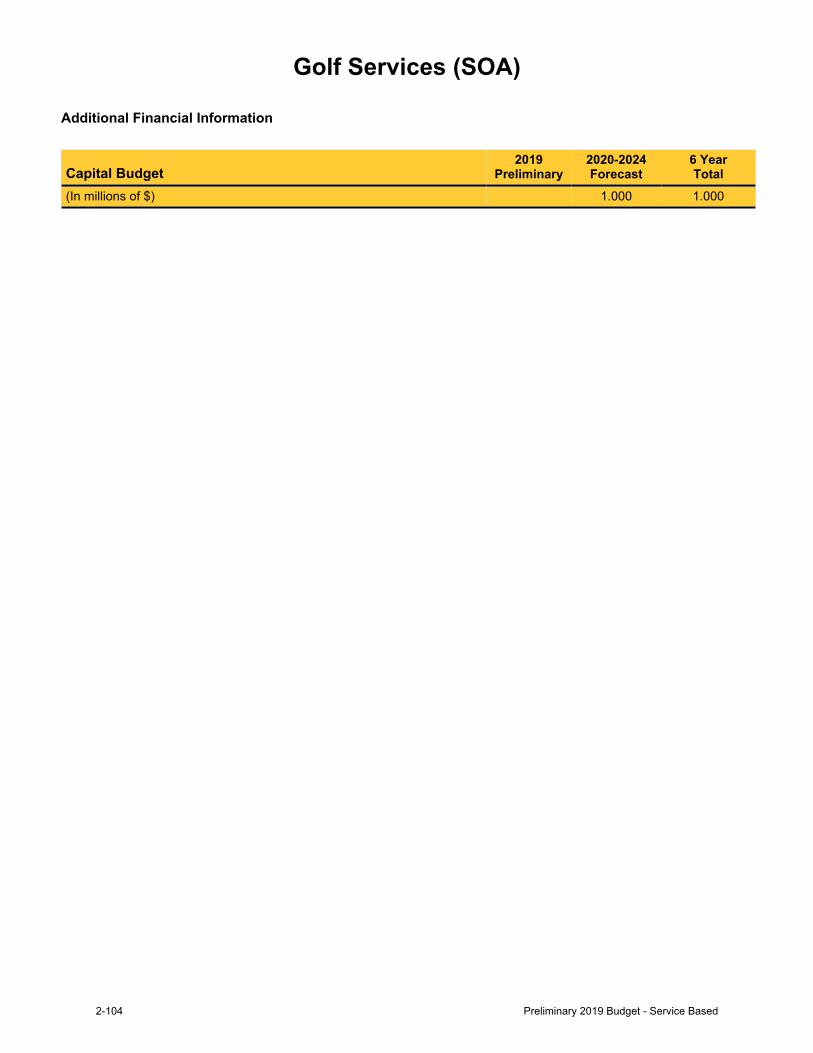
Golf Services (SOA)
Additional Financial Information
Capital Budget2019
Preliminary2020-2024Forecast
6 YearTotal
(In millions of $) 1.000 1.000
2-104 Preliminary 2019 Budget - Service Based
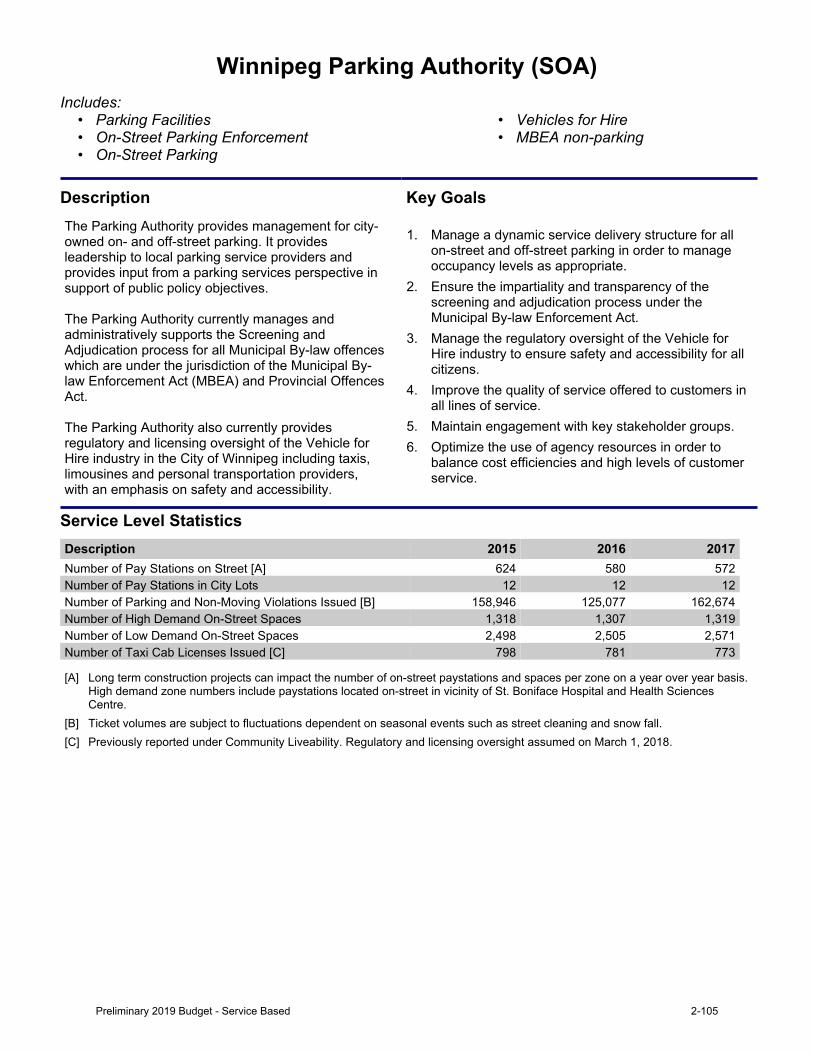
Winnipeg Parking Authority (SOA)Includes:
• Parking Facilities • Vehicles for Hire• On-Street Parking Enforcement • MBEA non-parking• On-Street Parking
Description Key GoalsThe Parking Authority provides management for city-owned on- and off-street parking. It provides leadership to local parking service providers and provides input from a parking services perspective in supportofpublicpolicyobjectives.The Parking Authority currently manages and administratively supports the Screening and Adjudication process for all Municipal By-law offences which are under the jurisdiction of the Municipal By-law Enforcement Act (MBEA) and Provincial Offences Act.The Parking Authority also currently provides regulatory and licensing oversight of the Vehicle for Hire industry in the City of Winnipeg including taxis, limousines and personal transportation providers, with an emphasis on safety and accessibility.
1. Manage a dynamic service delivery structure for all on-street and off-street parking in order to manage occupancy levels as appropriate.
2. Ensure the impartiality and transparency of the screening and adjudication process under the Municipal By-law Enforcement Act.
3. Manage the regulatory oversight of the Vehicle for Hire industry to ensure safety and accessibility for all citizens.
4. Improve the quality of service offered to customers in all lines of service.
5. Maintain engagement with key stakeholder groups.6. Optimize the use of agency resources in order to
balance cost efficiencies and high levels of customer service.
Service Level StatisticsDescription 2015 2016 2017Number of Pay Stations on Street [A] 624 580 572Number of Pay Stations in City Lots 12 12 12Number of Parking and Non-Moving Violations Issued [B] 158,946 125,077 162,674Number of High Demand On-Street Spaces 1,318 1,307 1,319Number of Low Demand On-Street Spaces 2,498 2,505 2,571Number of Taxi Cab Licenses Issued [C] 798 781 773
[A] Long term construction projects can impact the number of on-street paystations and spaces per zone on a year over year basis. High demand zone numbers include paystations located on-street in vicinity of St. Boniface Hospital and Health Sciences Centre.
[B] Ticket volumes are subject to fluctuations dependent on seasonal events such as street cleaning and snow fall.[C] Previously reported under Community Liveability. Regulatory and licensing oversight assumed on March 1, 2018.
Preliminary 2019 Budget - Service Based 2-105
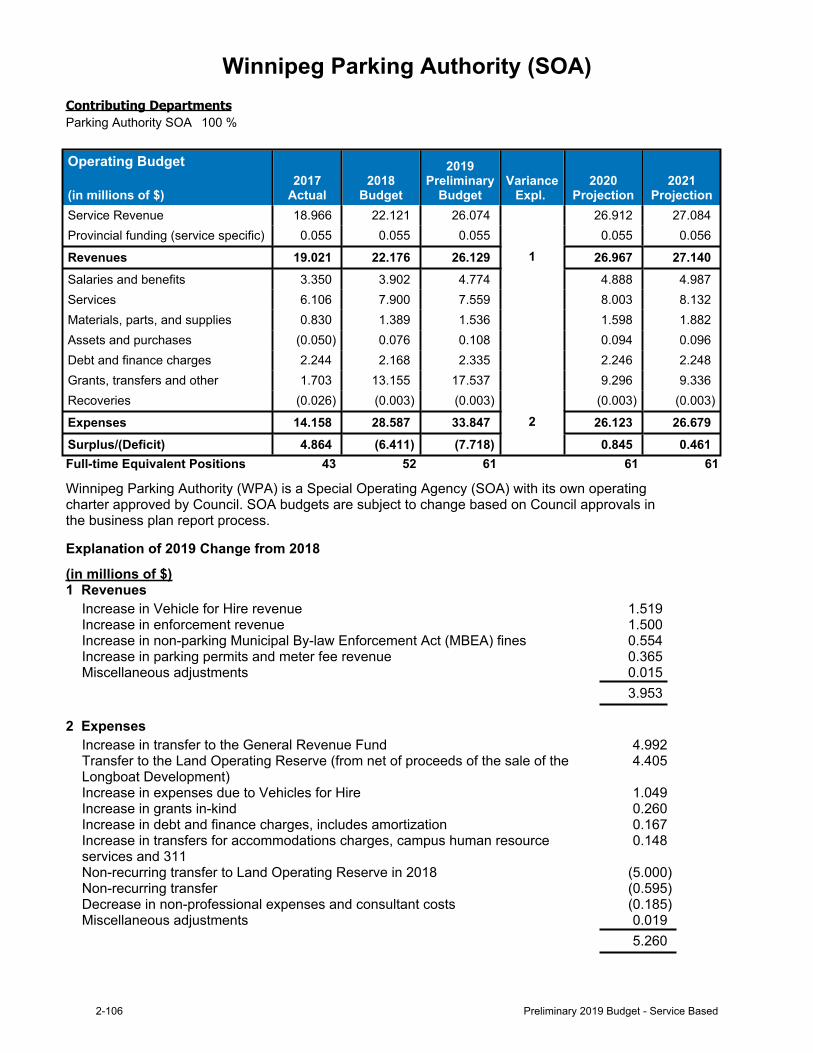
Winnipeg Parking Authority (SOA)Contributing DepartmentsParking Authority SOA 100 %
Operating Budget
(in millions of $)2017
Actual2018
Budget
2019Preliminary
BudgetVariance
Expl. 2020
Projection2021
ProjectionService Revenue 18.966 22.121 26.074 26.912 27.084Provincial funding (service specific) 0.055 0.055 0.055 0.055 0.056
Revenues 19.021 22.176 26.129 1 26.967 27.140Salaries and benefits 3.350 3.902 4.774 4.888 4.987Services 6.106 7.900 7.559 8.003 8.132Materials, parts, and supplies 0.830 1.389 1.536 1.598 1.882Assets and purchases (0.050) 0.076 0.108 0.094 0.096Debt and finance charges 2.244 2.168 2.335 2.246 2.248Grants, transfers and other 1.703 13.155 17.537 9.296 9.336Recoveries (0.026) (0.003) (0.003) (0.003) (0.003)
Expenses 14.158 28.587 33.847 2 26.123 26.679Surplus/(Deficit) 4.864 (6.411) (7.718) 0.845 0.461Full-time Equivalent Positions 43 52 61 61 61
Winnipeg Parking Authority (WPA) is a Special Operating Agency (SOA) with its own operating charter approved by Council. SOA budgets are subject to change based on Council approvals in the business plan report process.
Explanation of 2019 Change from 2018
(in millions of $)1 Revenues
Increase in Vehicle for Hire revenue 1.519Increase in enforcement revenue 1.500Increase in non-parking Municipal By-law Enforcement Act (MBEA) fines 0.554Increase in parking permits and meter fee revenue 0.365Miscellaneous adjustments 0.015
3.953
2 ExpensesIncrease in transfer to the General Revenue Fund 4.992Transfer to the Land Operating Reserve (from net of proceeds of the sale of the Longboat Development)
4.405
Increase in expenses due to Vehicles for Hire 1.049Increase in grants in-kind 0.260Increase in debt and finance charges, includes amortization 0.167Increase in transfers for accommodations charges, campus human resource services and 311
0.148
Non-recurring transfer to Land Operating Reserve in 2018 (5.000)Non-recurring transfer (0.595)Decrease in non-professional expenses and consultant costs (0.185)Miscellaneous adjustments 0.019
5.260
2-106 Preliminary 2019 Budget - Service Based
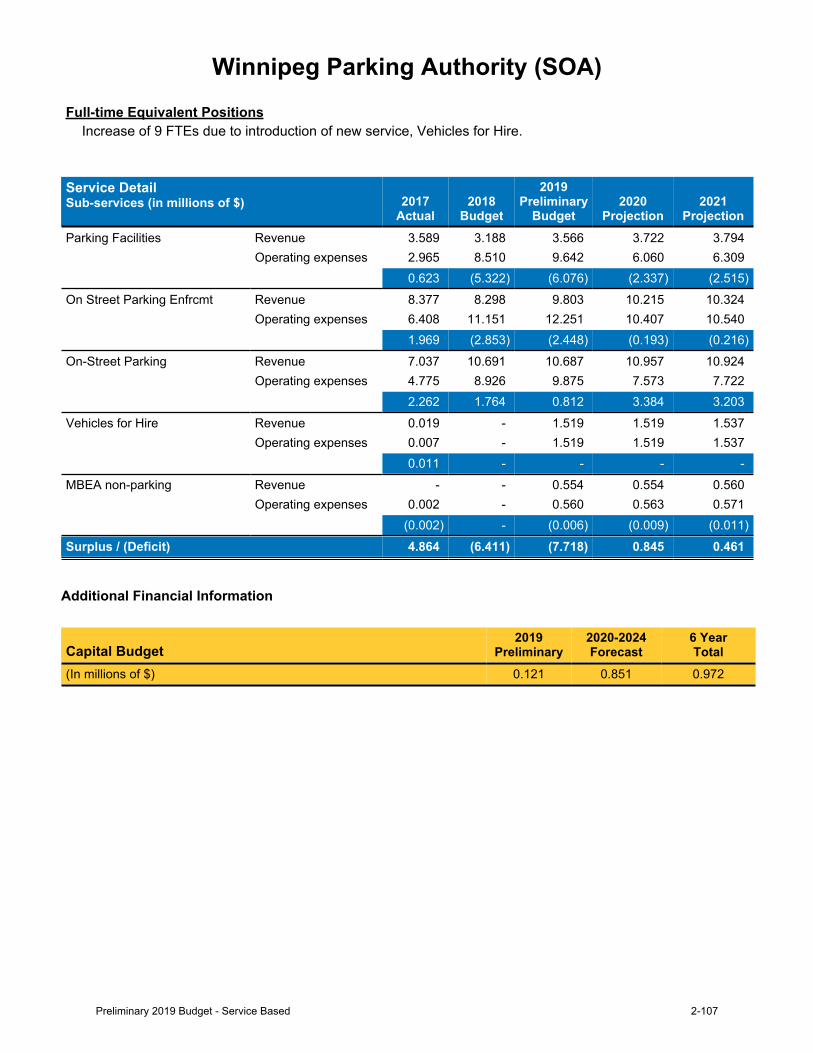
Winnipeg Parking Authority (SOA)Full-time Equivalent Positions
Increase of 9 FTEs due to introduction of new service, Vehicles for Hire.
Service DetailSub-services (in millions of $) 2017
Actual2018
Budget
2019Preliminary
Budget2020
Projection2021
ProjectionParking Facilities Revenue 3.589 3.188 3.566 3.722 3.794
Operating expenses 2.965 8.510 9.642 6.060 6.3090.623 (5.322) (6.076) (2.337) (2.515)
On Street Parking Enfrcmt Revenue 8.377 8.298 9.803 10.215 10.324Operating expenses 6.408 11.151 12.251 10.407 10.540
1.969 (2.853) (2.448) (0.193) (0.216)On-Street Parking Revenue 7.037 10.691 10.687 10.957 10.924
Operating expenses 4.775 8.926 9.875 7.573 7.7222.262 1.764 0.812 3.384 3.203
Vehicles for Hire Revenue 0.019 - 1.519 1.519 1.537Operating expenses 0.007 - 1.519 1.519 1.537
0.011 - - - -MBEA non-parking Revenue - - 0.554 0.554 0.560
Operating expenses 0.002 - 0.560 0.563 0.571(0.002) - (0.006) (0.009) (0.011)
Surplus / (Deficit) 4.864 (6.411) (7.718) 0.845 0.461
Additional Financial Information
Capital Budget2019
Preliminary2020-2024Forecast
6 YearTotal
(In millions of $) 0.121 0.851 0.972
Preliminary 2019 Budget - Service Based 2-107

2-108 Preliminary 2019 Budget - Service Based
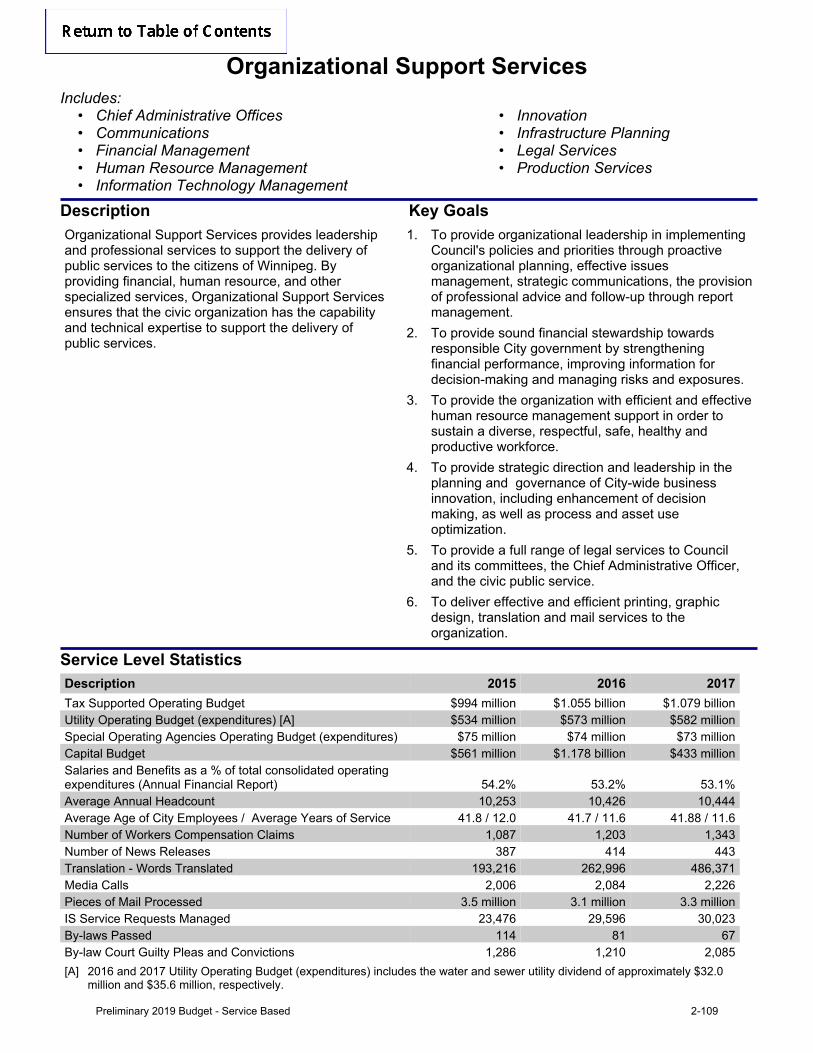
Organizational Support ServicesIncludes:
• Chief Administrative Offices • Innovation• Communications • Infrastructure Planning• Financial Management • Legal Services• Human Resource Management • Production Services• Information Technology Management
Description Key GoalsOrganizational Support Services provides leadership and professional services to support the delivery of public services to the citizens of Winnipeg. By providing financial, human resource, and other specialized services, Organizational Support Services ensures that the civic organization has the capability and technical expertise to support the delivery of public services.
1. To provide organizational leadership in implementing Council's policies and priorities through proactive organizational planning, effective issues management, strategic communications, the provision of professional advice and follow-up through report management.
2. To provide sound financial stewardship towards responsible City government by strengthening financial performance, improving information for decision-making and managing risks and exposures.
3. To provide the organization with efficient and effective human resource management support in order to sustain a diverse, respectful, safe, healthy and productive workforce.
4. To provide strategic direction and leadership in the planning and governance of City-wide business innovation, including enhancement of decision making, as well as process and asset use optimization.
5. To provide a full range of legal services to Council and its committees, the Chief Administrative Officer, and the civic public service.
6. To deliver effective and efficient printing, graphic design, translation and mail services to the organization.
Service Level StatisticsDescription 2015 2016 2017Tax Supported Operating Budget $994 million $1.055 billion $1.079 billionUtility Operating Budget (expenditures) [A] $534 million $573 million $582 millionSpecial Operating Agencies Operating Budget (expenditures) $75 million $74 million $73 millionCapital Budget $561 million $1.178 billion $433 millionSalaries and Benefits as a % of total consolidated operating expenditures (Annual Financial Report) 54.2% 53.2% 53.1%Average Annual Headcount 10,253 10,426 10,444Average Age of City Employees / Average Years of Service 41.8 / 12.0 41.7 / 11.6 41.88 / 11.6Number of Workers Compensation Claims 1,087 1,203 1,343Number of News Releases 387 414 443Translation - Words Translated 193,216 262,996 486,371Media Calls 2,006 2,084 2,226Pieces of Mail Processed 3.5 million 3.1 million 3.3 millionIS Service Requests Managed 23,476 29,596 30,023By-laws Passed 114 81 67By-law Court Guilty Pleas and Convictions 1,286 1,210 2,085[A] 2016 and 2017 Utility Operating Budget (expenditures) includes the water and sewer utility dividend of approximately $32.0
million and $35.6 million, respectively.
Preliminary 2019 Budget - Service Based 2-109
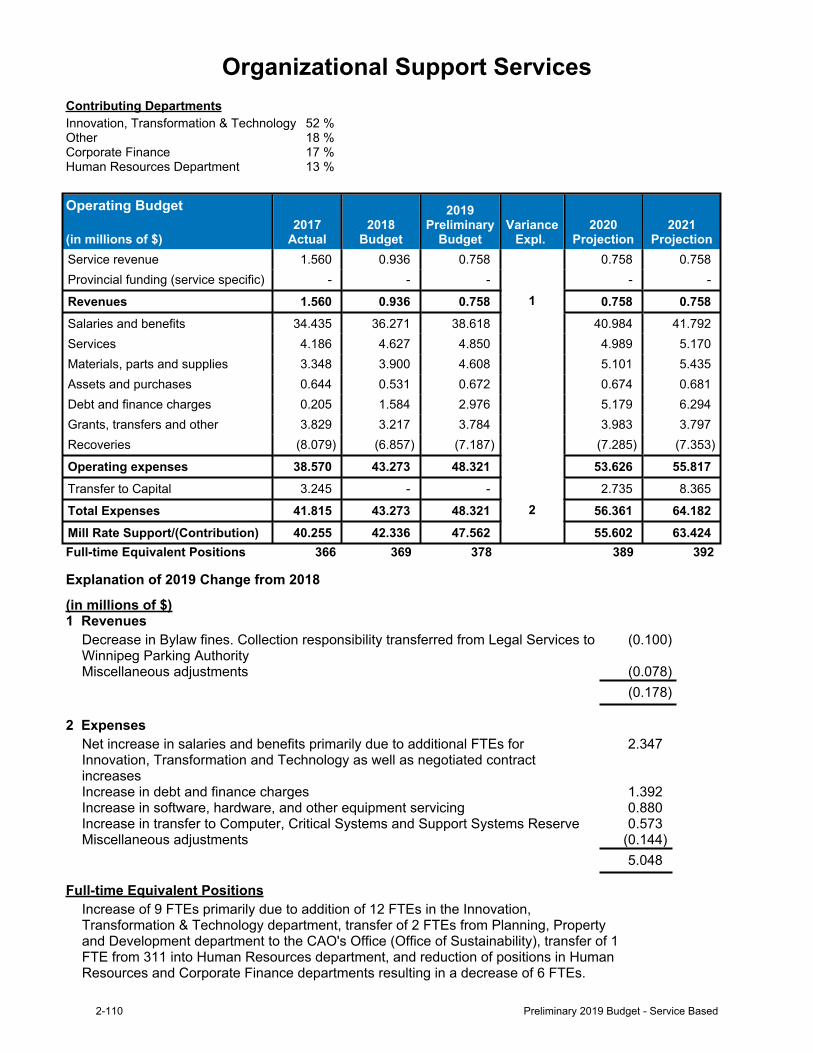
Organizational Support ServicesContributing DepartmentsInnovation, Transformation & Technology 52 %Other 18 %Corporate Finance 17 %Human Resources Department 13 %
Operating Budget
(in millions of $)2017
Actual2018
Budget
2019Preliminary
BudgetVariance
Expl. 2020
Projection2021
ProjectionService revenue 1.560 0.936 0.758 0.758 0.758Provincial funding (service specific) - - - - -
Revenues 1.560 0.936 0.758 1 0.758 0.758Salaries and benefits 34.435 36.271 38.618 40.984 41.792Services 4.186 4.627 4.850 4.989 5.170Materials, parts and supplies 3.348 3.900 4.608 5.101 5.435Assets and purchases 0.644 0.531 0.672 0.674 0.681Debt and finance charges 0.205 1.584 2.976 5.179 6.294Grants, transfers and other 3.829 3.217 3.784 3.983 3.797Recoveries (8.079) (6.857) (7.187) (7.285) (7.353)
Operating expenses 38.570 43.273 48.321 53.626 55.817Transfer to Capital 3.245 - - 2.735 8.365
Total Expenses 41.815 43.273 48.321 2 56.361 64.182Mill Rate Support/(Contribution) 40.255 42.336 47.562 55.602 63.424Full-time Equivalent Positions 366 369 378 389 392
Explanation of 2019 Change from 2018
(in millions of $)1 Revenues
Decrease in Bylaw fines. Collection responsibility transferred from Legal Services to Winnipeg Parking Authority
(0.100)
Miscellaneous adjustments (0.078)(0.178)
2 ExpensesNet increase in salaries and benefits primarily due to additional FTEs for Innovation, Transformation and Technology as well as negotiated contract increases
2.347
Increase in debt and finance charges 1.392Increase in software, hardware, and other equipment servicing 0.880Increase in transfer to Computer, Critical Systems and Support Systems Reserve 0.573Miscellaneous adjustments (0.144)
5.048
Full-time Equivalent PositionsIncrease of 9 FTEs primarily due to addition of 12 FTEs in the Innovation, Transformation & Technology department, transfer of 2 FTEs from Planning, Property and Development department to the CAO's Office (Office of Sustainability), transfer of 1 FTE from 311 into Human Resources department, and reduction of positions in Human Resources and Corporate Finance departments resulting in a decrease of 6 FTEs.
2-110 Preliminary 2019 Budget - Service Based
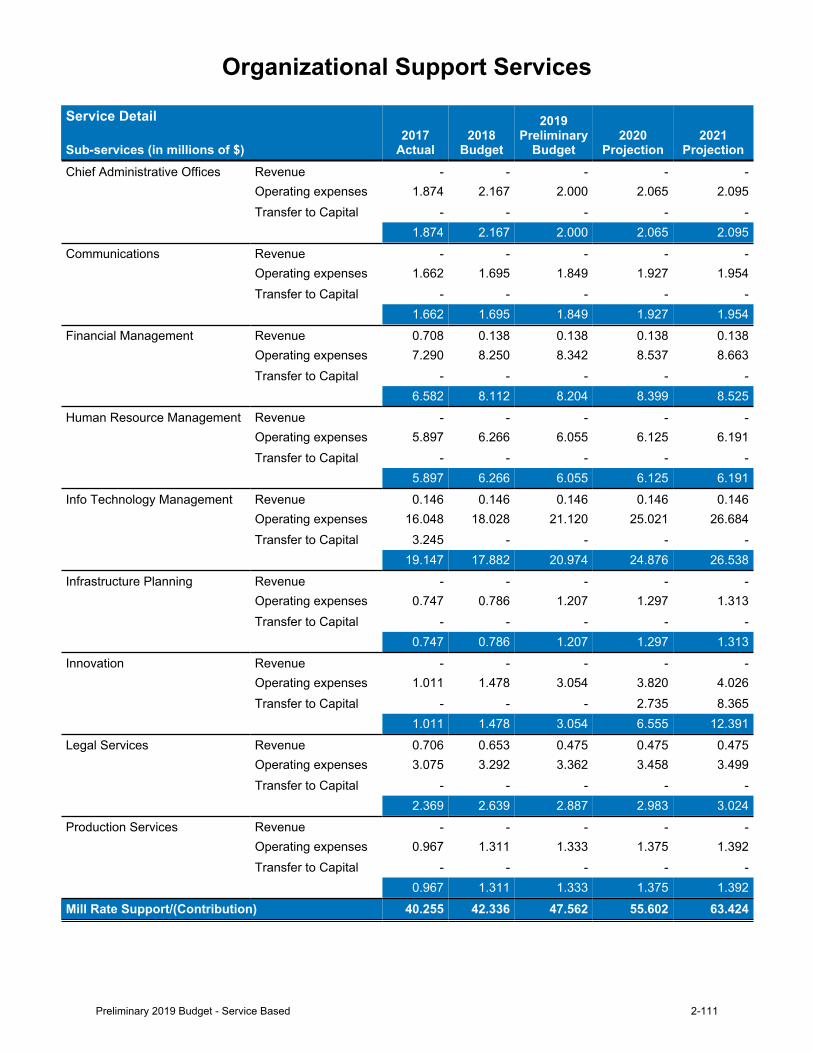
Organizational Support Services
Service Detail
Sub-services (in millions of $)2017
Actual2018
Budget
2019Preliminary
Budget2020
Projection2021
ProjectionChief Administrative Offices Revenue - - - - -
Operating expenses 1.874 2.167 2.000 2.065 2.095Transfer to Capital - - - - -
1.874 2.167 2.000 2.065 2.095Communications Revenue - - - - -
Operating expenses 1.662 1.695 1.849 1.927 1.954Transfer to Capital - - - - -
1.662 1.695 1.849 1.927 1.954Financial Management Revenue 0.708 0.138 0.138 0.138 0.138
Operating expenses 7.290 8.250 8.342 8.537 8.663Transfer to Capital - - - - -
6.582 8.112 8.204 8.399 8.525Human Resource Management Revenue - - - - -
Operating expenses 5.897 6.266 6.055 6.125 6.191Transfer to Capital - - - - -
5.897 6.266 6.055 6.125 6.191Info Technology Management Revenue 0.146 0.146 0.146 0.146 0.146
Operating expenses 16.048 18.028 21.120 25.021 26.684Transfer to Capital 3.245 - - - -
19.147 17.882 20.974 24.876 26.538Infrastructure Planning Revenue - - - - -
Operating expenses 0.747 0.786 1.207 1.297 1.313Transfer to Capital - - - - -
0.747 0.786 1.207 1.297 1.313Innovation Revenue - - - - -
Operating expenses 1.011 1.478 3.054 3.820 4.026Transfer to Capital - - - 2.735 8.365
1.011 1.478 3.054 6.555 12.391Legal Services Revenue 0.706 0.653 0.475 0.475 0.475
Operating expenses 3.075 3.292 3.362 3.458 3.499Transfer to Capital - - - - -
2.369 2.639 2.887 2.983 3.024Production Services Revenue - - - - -
Operating expenses 0.967 1.311 1.333 1.375 1.392Transfer to Capital - - - - -
0.967 1.311 1.333 1.375 1.392Mill Rate Support/(Contribution) 40.255 42.336 47.562 55.602 63.424
Preliminary 2019 Budget - Service Based 2-111
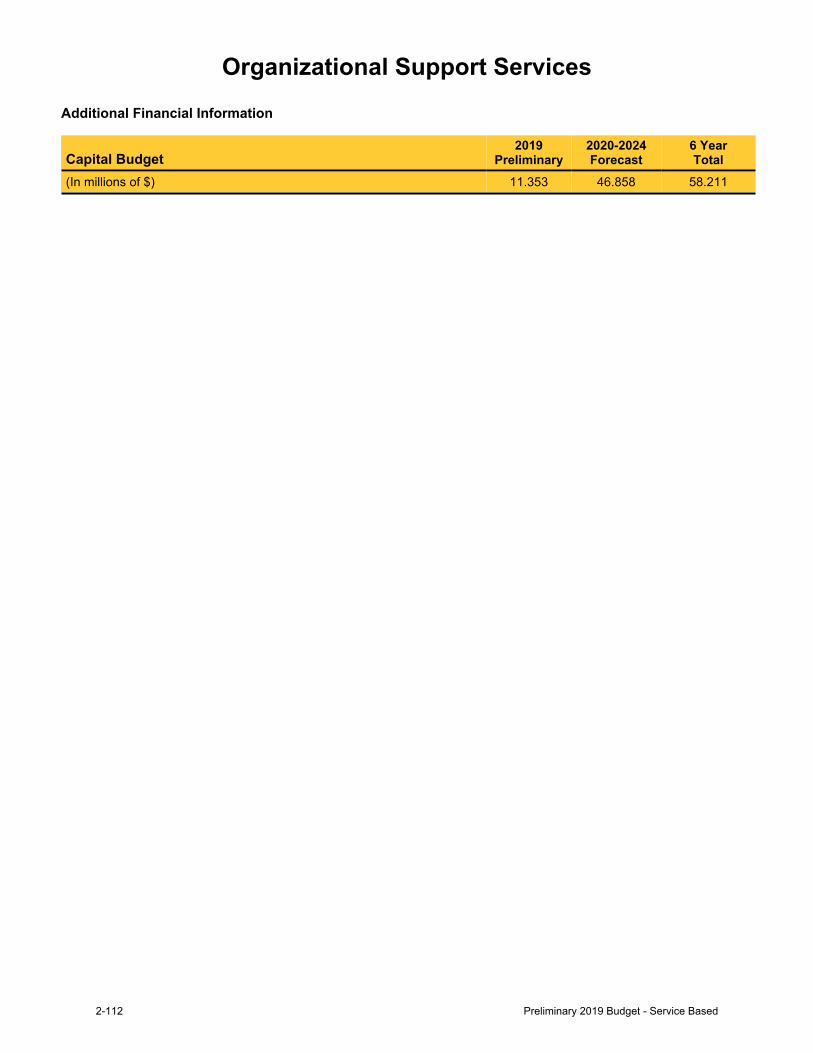
Organizational Support Services
Additional Financial Information
Capital Budget2019
Preliminary2020-2024Forecast
6 YearTotal
(In millions of $) 11.353 46.858 58.211
2-112 Preliminary 2019 Budget - Service Based
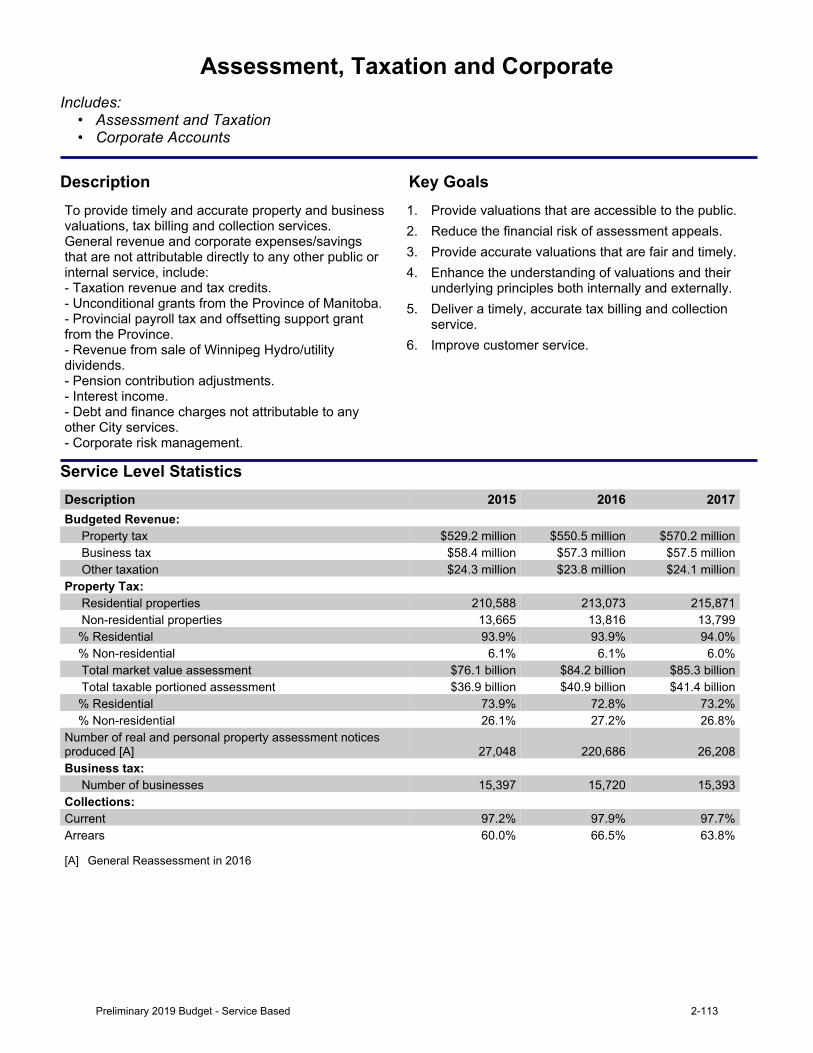
Assessment, Taxation and CorporateIncludes:
• Assessment and Taxation• Corporate Accounts
Description Key GoalsTo provide timely and accurate property and business valuations, tax billing and collection services. General revenue and corporate expenses/savings that are not attributable directly to any other public or internalservice,include:-Taxationrevenueandtaxcredits.-UnconditionalgrantsfromtheProvinceofManitoba.- Provincial payroll tax and offsetting support grant fromtheProvince.- Revenue from sale of Winnipeg Hydro/utility dividends.-Pensioncontributionadjustments.-Interestincome.- Debt and finance charges not attributable to any otherCityservices.- Corporate risk management.
1. Provide valuations that are accessible to the public.2. Reduce the financial risk of assessment appeals.3. Provide accurate valuations that are fair and timely.4. Enhance the understanding of valuations and their
underlying principles both internally and externally.5. Deliver a timely, accurate tax billing and collection
service.6. Improve customer service.
Service Level StatisticsDescription 2015 2016 2017Budgeted Revenue: Property tax $529.2 million $550.5 million $570.2 million Business tax $58.4 million $57.3 million $57.5 million Other taxation $24.3 million $23.8 million $24.1 millionProperty Tax: Residential properties 210,588 213,073 215,871 Non-residential properties 13,665 13,816 13,799 % Residential 93.9% 93.9% 94.0% % Non-residential 6.1% 6.1% 6.0% Total market value assessment $76.1 billion $84.2 billion $85.3 billion Total taxable portioned assessment $36.9 billion $40.9 billion $41.4 billion % Residential 73.9% 72.8% 73.2% % Non-residential 26.1% 27.2% 26.8%Number of real and personal property assessment notices produced [A] 27,048 220,686 26,208Business tax: Number of businesses 15,397 15,720 15,393Collections: Current 97.2% 97.9% 97.7%Arrears 60.0% 66.5% 63.8%
[A] General Reassessment in 2016
Preliminary 2019 Budget - Service Based 2-113
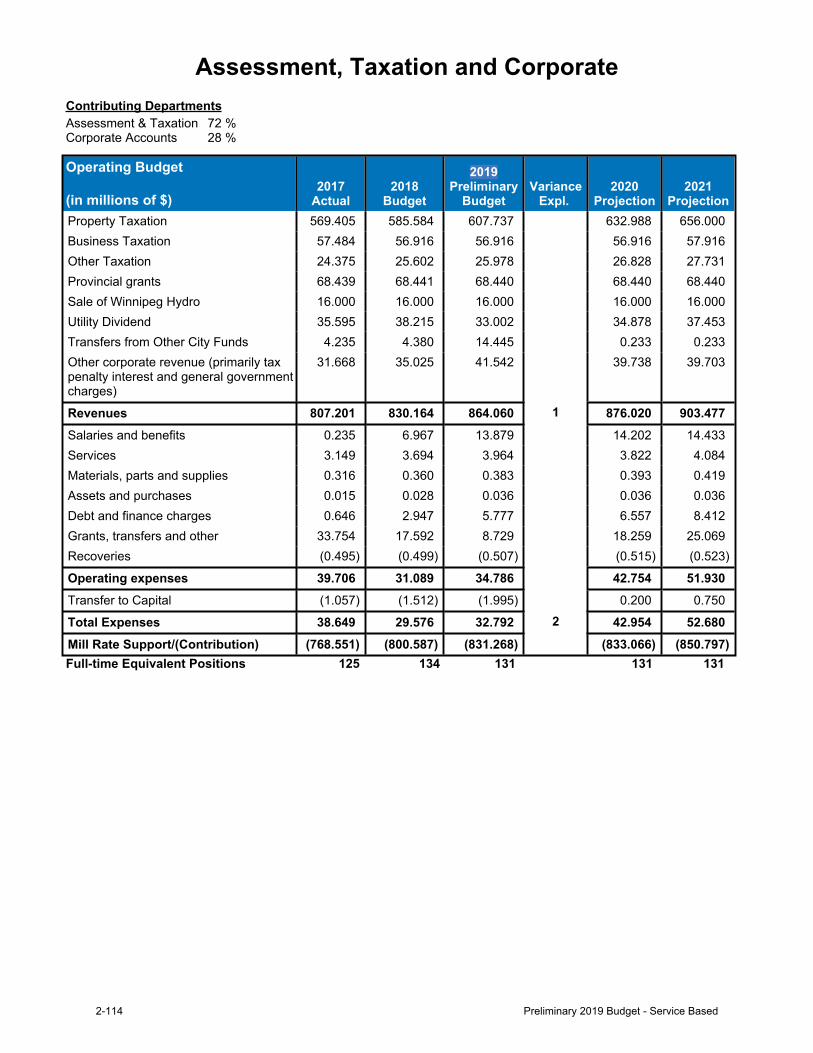
Assessment, Taxation and CorporateContributing DepartmentsAssessment & Taxation 72 %Corporate Accounts 28 %
Operating Budget
(in millions of $)2017
Actual2018
Budget
2019Preliminary
BudgetVariance
Expl. 2020
Projection2021
ProjectionProperty Taxation 569.405 585.584 607.737 632.988 656.000Business Taxation 57.484 56.916 56.916 56.916 57.916Other Taxation 24.375 25.602 25.978 26.828 27.731Provincial grants 68.439 68.441 68.440 68.440 68.440Sale of Winnipeg Hydro 16.000 16.000 16.000 16.000 16.000Utility Dividend 35.595 38.215 33.002 34.878 37.453Transfers from Other City Funds 4.235 4.380 14.445 0.233 0.233Other corporate revenue (primarily tax penalty interest and general government charges)
31.668 35.025 41.542 39.738 39.703
Revenues 807.201 830.164 864.060 1 876.020 903.477Salaries and benefits 0.235 6.967 13.879 14.202 14.433Services 3.149 3.694 3.964 3.822 4.084Materials, parts and supplies 0.316 0.360 0.383 0.393 0.419Assets and purchases 0.015 0.028 0.036 0.036 0.036Debt and finance charges 0.646 2.947 5.777 6.557 8.412Grants, transfers and other 33.754 17.592 8.729 18.259 25.069Recoveries (0.495) (0.499) (0.507) (0.515) (0.523)
Operating expenses 39.706 31.089 34.786 42.754 51.930Transfer to Capital (1.057) (1.512) (1.995) 0.200 0.750
Total Expenses 38.649 29.576 32.792 2 42.954 52.680Mill Rate Support/(Contribution) (768.551) (800.587) (831.268) (833.066) (850.797)Full-time Equivalent Positions 125 134 131 131 131
2-114 Preliminary 2019 Budget - Service Based
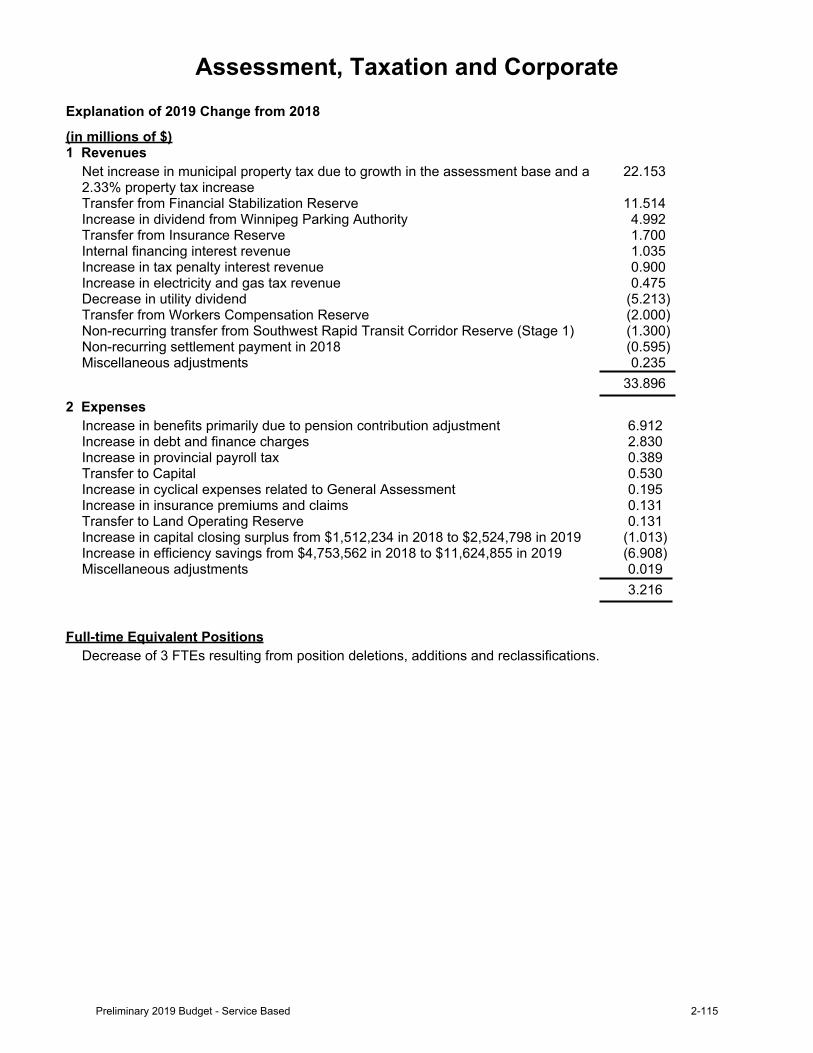
Assessment, Taxation and CorporateExplanation of 2019 Change from 2018
(in millions of $)1 Revenues
Net increase in municipal property tax due to growth in the assessment base and a 2.33% property tax increase
22.153
Transfer from Financial Stabilization Reserve 11.514Increase in dividend from Winnipeg Parking Authority 4.992Transfer from Insurance Reserve 1.700Internal financing interest revenue 1.035Increase in tax penalty interest revenue 0.900Increase in electricity and gas tax revenue 0.475Decrease in utility dividend (5.213)Transfer from Workers Compensation Reserve (2.000)Non-recurring transfer from Southwest Rapid Transit Corridor Reserve (Stage 1) (1.300)Non-recurring settlement payment in 2018 (0.595)Miscellaneous adjustments 0.235
33.8962 Expenses
Increase in benefits primarily due to pension contribution adjustment 6.912Increase in debt and finance charges 2.830Increase in provincial payroll tax 0.389Transfer to Capital 0.530Increase in cyclical expenses related to General Assessment 0.195Increase in insurance premiums and claims 0.131Transfer to Land Operating Reserve 0.131Increase in capital closing surplus from $1,512,234 in 2018 to $2,524,798 in 2019 (1.013)Increase in efficiency savings from $4,753,562 in 2018 to $11,624,855 in 2019 (6.908)Miscellaneous adjustments 0.019
3.216
Full-time Equivalent PositionsDecrease of 3 FTEs resulting from position deletions, additions and reclassifications.
Preliminary 2019 Budget - Service Based 2-115
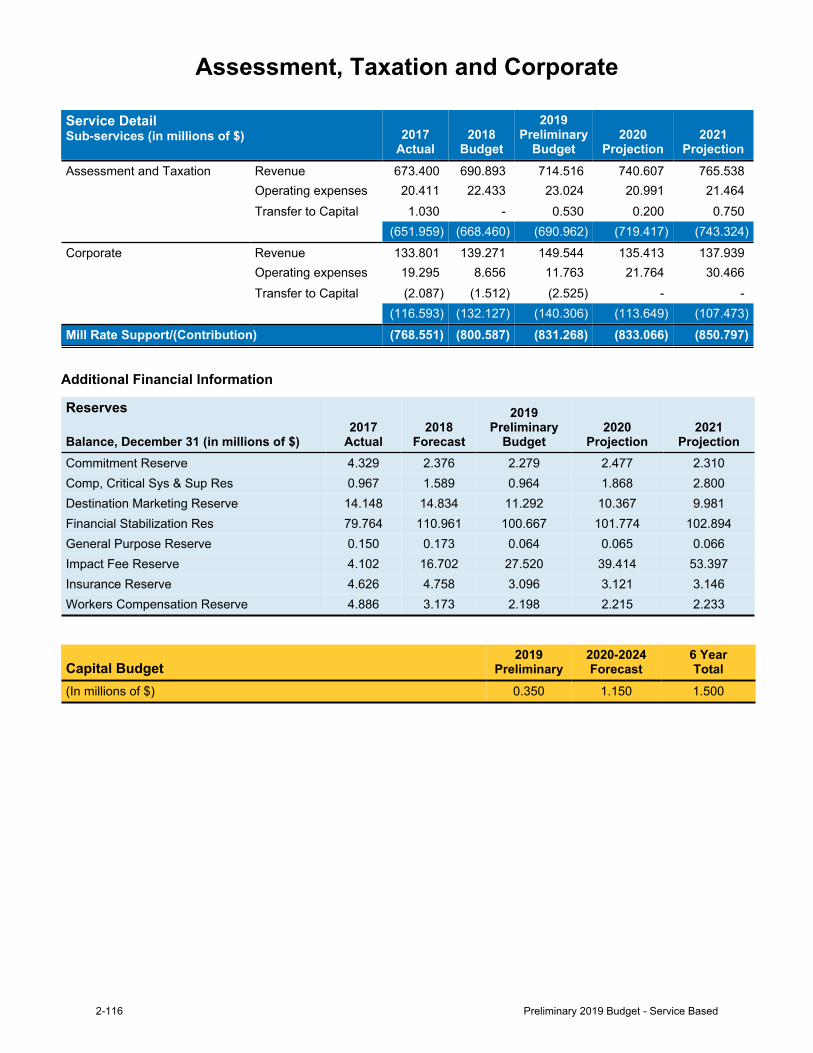
Assessment, Taxation and Corporate
Service DetailSub-services (in millions of $) 2017
Actual2018
Budget
2019Preliminary
Budget2020
Projection2021
ProjectionAssessment and Taxation Revenue 673.400 690.893 714.516 740.607 765.538
Operating expenses 20.411 22.433 23.024 20.991 21.464Transfer to Capital 1.030 - 0.530 0.200 0.750
(651.959) (668.460) (690.962) (719.417) (743.324)Corporate Revenue 133.801 139.271 149.544 135.413 137.939
Operating expenses 19.295 8.656 11.763 21.764 30.466Transfer to Capital (2.087) (1.512) (2.525) - -
(116.593) (132.127) (140.306) (113.649) (107.473)Mill Rate Support/(Contribution) (768.551) (800.587) (831.268) (833.066) (850.797)
Additional Financial Information
Reserves
Balance, December 31 (in millions of $)2017
Actual2018
Forecast
2019Preliminary
Budget2020
Projection2021
ProjectionCommitment Reserve 4.329 2.376 2.279 2.477 2.310Comp, Critical Sys & Sup Res 0.967 1.589 0.964 1.868 2.800Destination Marketing Reserve 14.148 14.834 11.292 10.367 9.981Financial Stabilization Res 79.764 110.961 100.667 101.774 102.894General Purpose Reserve 0.150 0.173 0.064 0.065 0.066Impact Fee Reserve 4.102 16.702 27.520 39.414 53.397Insurance Reserve 4.626 4.758 3.096 3.121 3.146Workers Compensation Reserve 4.886 3.173 2.198 2.215 2.233
Capital Budget2019
Preliminary2020-2024Forecast
6 YearTotal
(In millions of $) 0.350 1.150 1.500
2-116 Preliminary 2019 Budget - Service Based
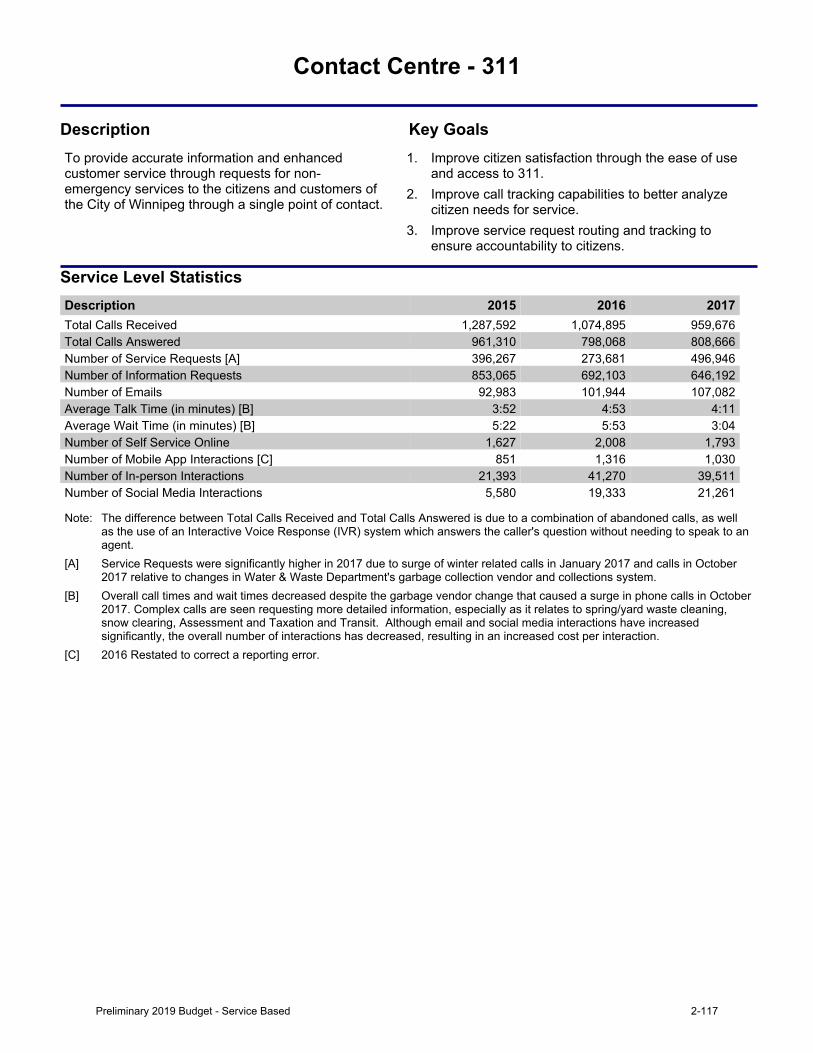
Contact Centre - 311
Description Key GoalsTo provide accurate information and enhanced customer service through requests for non-emergency services to the citizens and customers of the City of Winnipeg through a single point of contact.
1. Improve citizen satisfaction through the ease of use and access to 311.
2. Improve call tracking capabilities to better analyze citizen needs for service.
3. Improve service request routing and tracking to ensure accountability to citizens.
Service Level StatisticsDescription 2015 2016 2017Total Calls Received 1,287,592 1,074,895 959,676Total Calls Answered 961,310 798,068 808,666Number of Service Requests [A] 396,267 273,681 496,946Number of Information Requests 853,065 692,103 646,192Number of Emails 92,983 101,944 107,082Average Talk Time (in minutes) [B] 3:52 4:53 4:11Average Wait Time (in minutes) [B] 5:22 5:53 3:04Number of Self Service Online 1,627 2,008 1,793Number of Mobile App Interactions [C] 851 1,316 1,030Number of In-person Interactions 21,393 41,270 39,511Number of Social Media Interactions 5,580 19,333 21,261
Note: The difference between Total Calls Received and Total Calls Answered is due to a combination of abandoned calls, as well as the use of an Interactive Voice Response (IVR) system which answers the caller's question without needing to speak to an agent.
[A] Service Requests were significantly higher in 2017 due to surge of winter related calls in January 2017 and calls in October 2017 relative to changes in Water & Waste Department's garbage collection vendor and collections system.
[B] Overall call times and wait times decreased despite the garbage vendor change that caused a surge in phone calls in October 2017. Complex calls are seen requesting more detailed information, especially as it relates to spring/yard waste cleaning, snow clearing, Assessment and Taxation and Transit. Although email and social media interactions have increased significantly, the overall number of interactions has decreased, resulting in an increased cost per interaction.
[C] 2016 Restated to correct a reporting error.
Preliminary 2019 Budget - Service Based 2-117
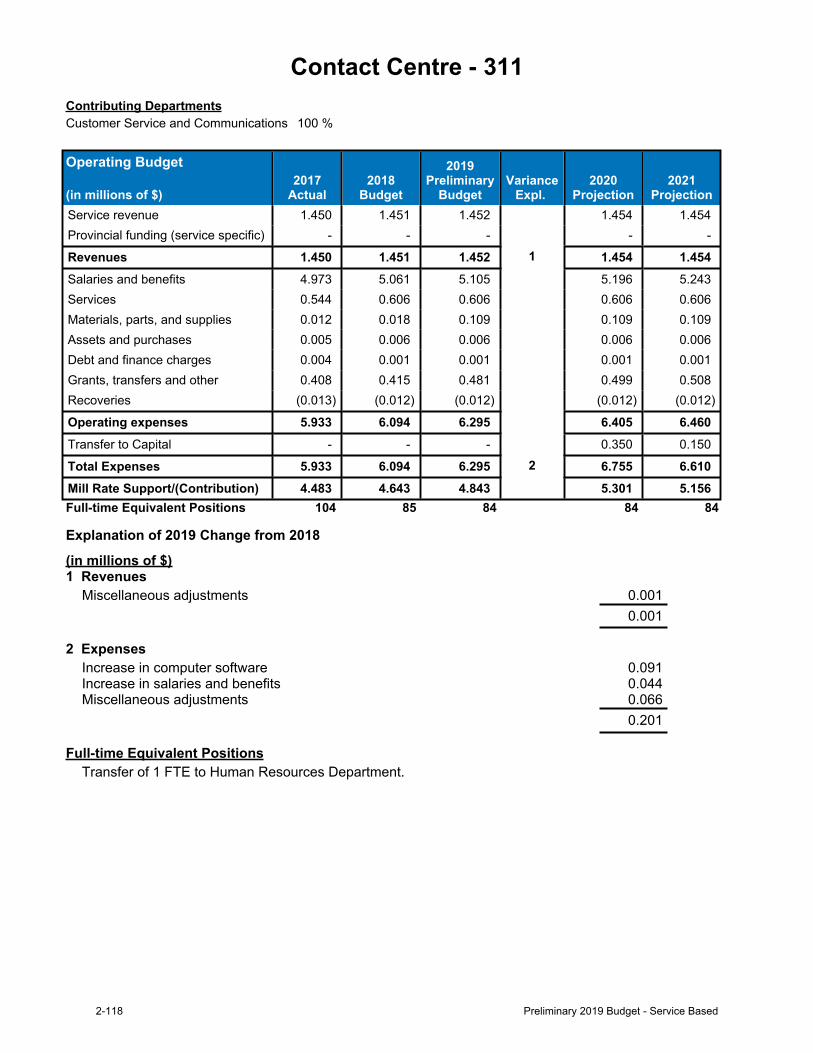
Contact Centre - 311Contributing DepartmentsCustomer Service and Communications 100 %
Operating Budget
(in millions of $)2017
Actual2018
Budget
2019Preliminary
BudgetVariance
Expl. 2020
Projection2021
ProjectionService revenue 1.450 1.451 1.452 1.454 1.454Provincial funding (service specific) - - - - -
Revenues 1.450 1.451 1.452 1 1.454 1.454Salaries and benefits 4.973 5.061 5.105 5.196 5.243Services 0.544 0.606 0.606 0.606 0.606Materials, parts, and supplies 0.012 0.018 0.109 0.109 0.109Assets and purchases 0.005 0.006 0.006 0.006 0.006Debt and finance charges 0.004 0.001 0.001 0.001 0.001Grants, transfers and other 0.408 0.415 0.481 0.499 0.508Recoveries (0.013) (0.012) (0.012) (0.012) (0.012)
Operating expenses 5.933 6.094 6.295 6.405 6.460Transfer to Capital - - - 0.350 0.150
Total Expenses 5.933 6.094 6.295 2 6.755 6.610Mill Rate Support/(Contribution) 4.483 4.643 4.843 5.301 5.156Full-time Equivalent Positions 104 85 84 84 84
Explanation of 2019 Change from 2018
(in millions of $)1 Revenues
Miscellaneous adjustments 0.0010.001
2 ExpensesIncrease in computer software 0.091Increase in salaries and benefits 0.044Miscellaneous adjustments 0.066
0.201
Full-time Equivalent PositionsTransfer of 1 FTE to Human Resources Department.
2-118 Preliminary 2019 Budget - Service Based
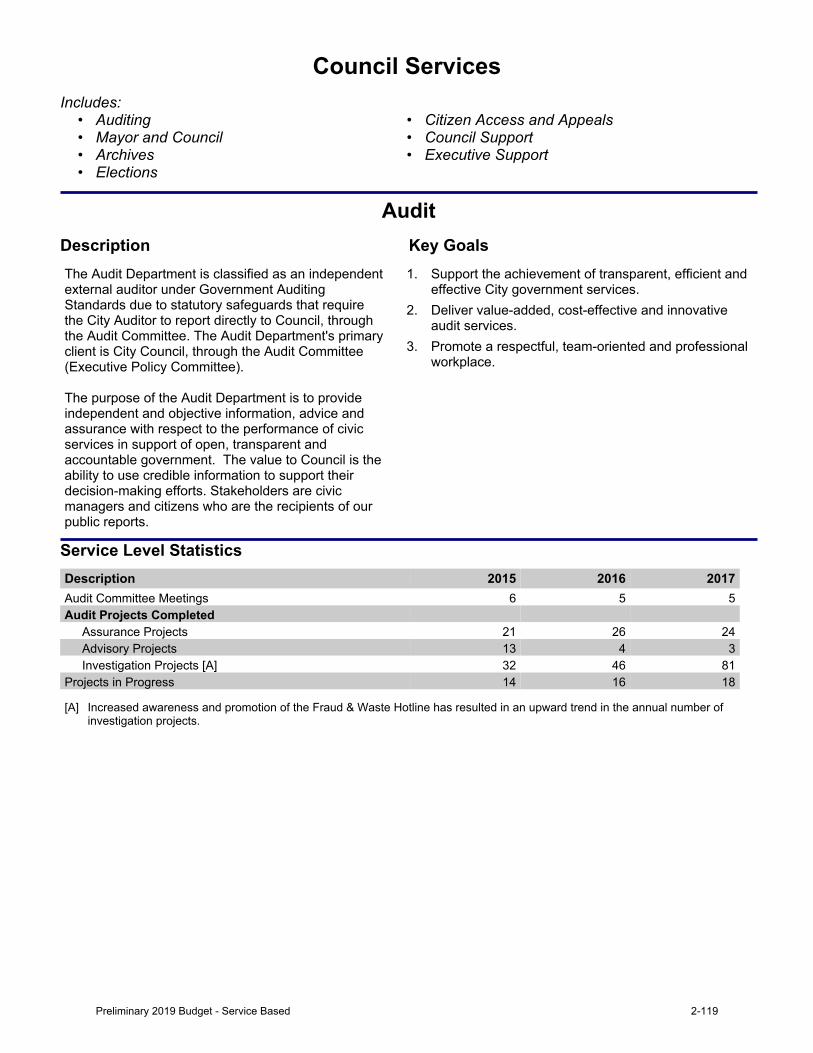
Council ServicesIncludes:
• Auditing • Citizen Access and Appeals• Mayor and Council • Council Support• Archives • Executive Support• Elections
AuditDescription Key GoalsThe Audit Department is classified as an independent external auditor under Government Auditing Standards due to statutory safeguards that require the City Auditor to report directly to Council, through the Audit Committee. The Audit Department's primary client is City Council, through the Audit Committee (ExecutivePolicyCommittee).The purpose of the Audit Department is to provide independent and objective information, advice and assurance with respect to the performance of civic services in support of open, transparent and accountable government. The value to Council is the ability to use credible information to support their decision-making efforts. Stakeholders are civic managers and citizens who are the recipients of our public reports.
1. Support the achievement of transparent, efficient and effective City government services.
2. Deliver value-added, cost-effective and innovative audit services.
3. Promote a respectful, team-oriented and professional workplace.
Service Level StatisticsDescription 2015 2016 2017Audit Committee Meetings 6 5 5Audit Projects Completed
Assurance Projects 21 26 24Advisory Projects 13 4 3Investigation Projects [A] 32 46 81
Projects in Progress 14 16 18
[A] Increased awareness and promotion of the Fraud & Waste Hotline has resulted in an upward trend in the annual number of investigation projects.
Preliminary 2019 Budget - Service Based 2-119
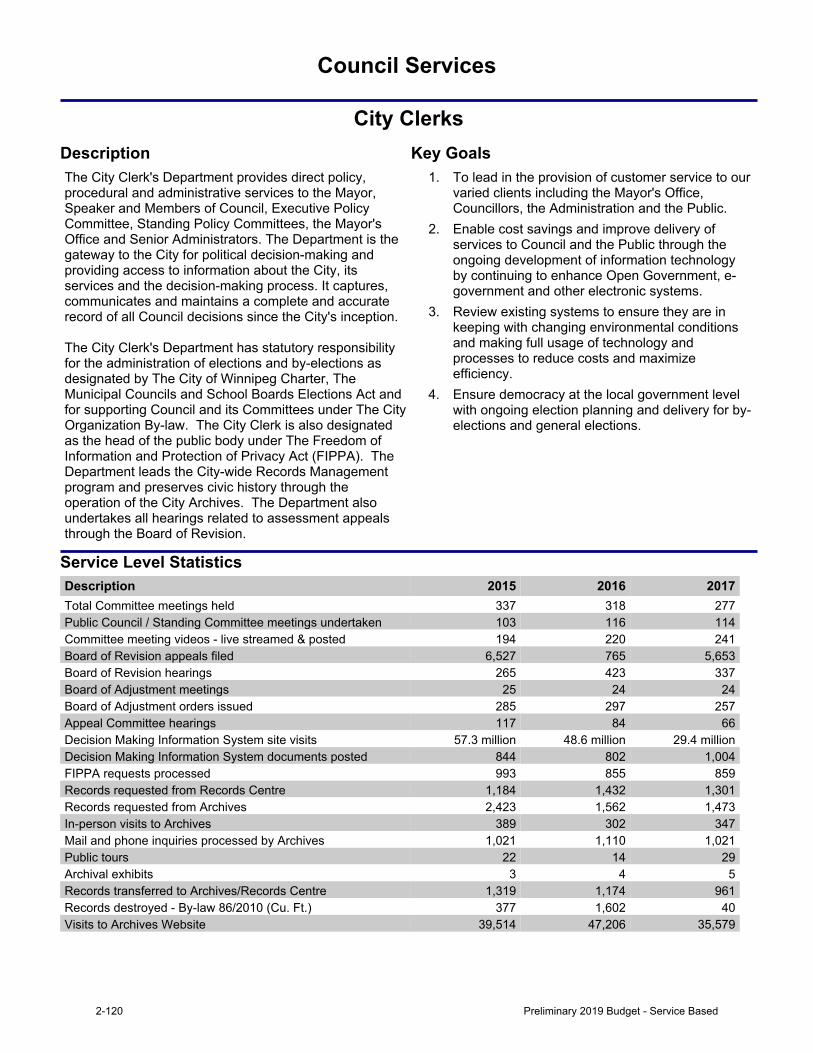
Council Services
City ClerksDescription Key GoalsThe City Clerk's Department provides direct policy, procedural and administrative services to the Mayor, Speaker and Members of Council, Executive Policy Committee, Standing Policy Committees, the Mayor's Office and Senior Administrators. The Department is the gateway to the City for political decision-making and providing access to information about the City, its services and the decision-making process. It captures, communicates and maintains a complete and accurate recordofallCouncildecisionssincetheCity'sinception.The City Clerk's Department has statutory responsibility for the administration of elections and by-elections as designated by The City of Winnipeg Charter, The Municipal Councils and School Boards Elections Act and for supporting Council and its Committees under The City Organization By-law. The City Clerk is also designated as the head of the public body under The Freedom of Information and Protection of Privacy Act (FIPPA). The Department leads the City-wide Records Management program and preserves civic history through the operation of the City Archives. The Department also undertakes all hearings related to assessment appeals through the Board of Revision.
1. To lead in the provision of customer service to our varied clients including the Mayor's Office, Councillors, the Administration and the Public.
2. Enable cost savings and improve delivery of services to Council and the Public through the ongoing development of information technology by continuing to enhance Open Government, e-government and other electronic systems.
3. Review existing systems to ensure they are in keeping with changing environmental conditions and making full usage of technology and processes to reduce costs and maximize efficiency.
4. Ensure democracy at the local government level with ongoing election planning and delivery for by-elections and general elections.
Service Level StatisticsDescription 2015 2016 2017Total Committee meetings held 337 318 277Public Council / Standing Committee meetings undertaken 103 116 114Committee meeting videos - live streamed & posted 194 220 241Board of Revision appeals filed 6,527 765 5,653Board of Revision hearings 265 423 337Board of Adjustment meetings 25 24 24Board of Adjustment orders issued 285 297 257Appeal Committee hearings 117 84 66Decision Making Information System site visits 57.3 million 48.6 million 29.4 millionDecision Making Information System documents posted 844 802 1,004FIPPA requests processed 993 855 859Records requested from Records Centre 1,184 1,432 1,301Records requested from Archives 2,423 1,562 1,473In-person visits to Archives 389 302 347Mail and phone inquiries processed by Archives 1,021 1,110 1,021Public tours 22 14 29Archival exhibits 3 4 5Records transferred to Archives/Records Centre 1,319 1,174 961Records destroyed - By-law 86/2010 (Cu. Ft.) 377 1,602 40Visits to Archives Website 39,514 47,206 35,579
2-120 Preliminary 2019 Budget - Service Based
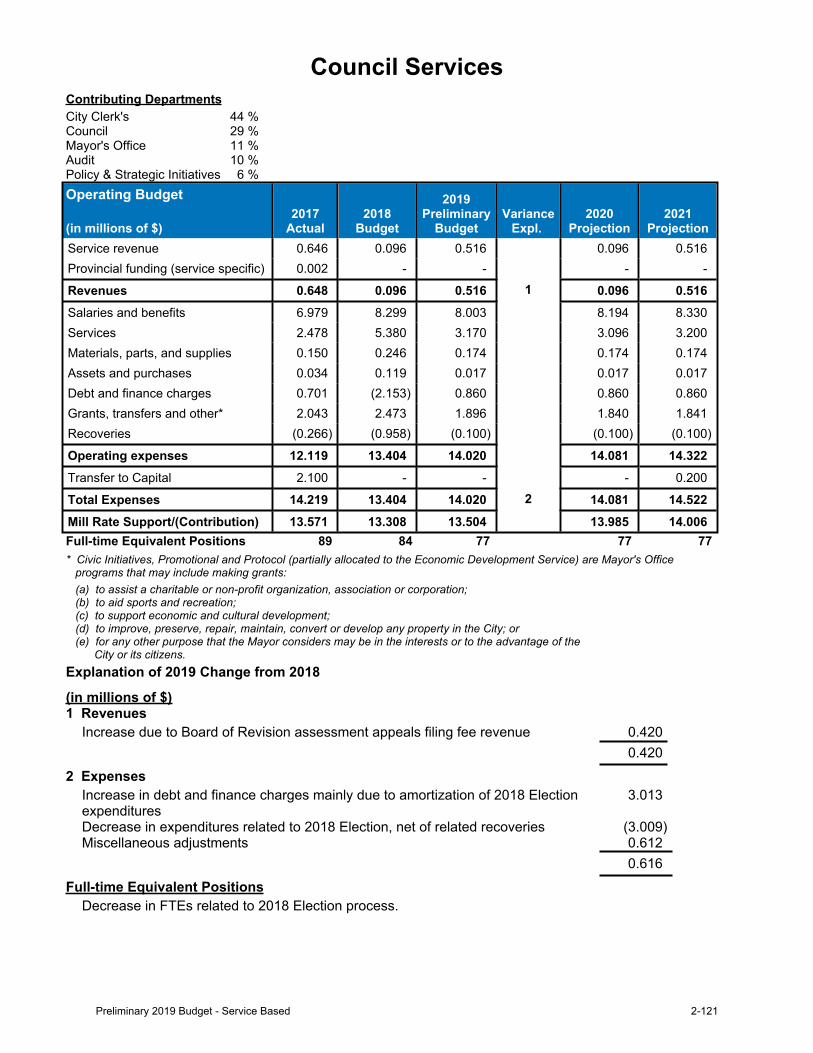
Council ServicesContributing DepartmentsCity Clerk's 44 %Council 29 %Mayor's Office 11 %Audit 10 %Policy & Strategic Initiatives 6 %Operating Budget
(in millions of $)2017
Actual2018
Budget
2019Preliminary
BudgetVariance
Expl. 2020
Projection2021
ProjectionService revenue 0.646 0.096 0.516 0.096 0.516Provincial funding (service specific) 0.002 - - - -
Revenues 0.648 0.096 0.516 1 0.096 0.516Salaries and benefits 6.979 8.299 8.003 8.194 8.330Services 2.478 5.380 3.170 3.096 3.200Materials, parts, and supplies 0.150 0.246 0.174 0.174 0.174Assets and purchases 0.034 0.119 0.017 0.017 0.017Debt and finance charges 0.701 (2.153) 0.860 0.860 0.860Grants, transfers and other* 2.043 2.473 1.896 1.840 1.841Recoveries (0.266) (0.958) (0.100) (0.100) (0.100)
Operating expenses 12.119 13.404 14.020 14.081 14.322Transfer to Capital 2.100 - - - 0.200
Total Expenses 14.219 13.404 14.020 2 14.081 14.522Mill Rate Support/(Contribution) 13.571 13.308 13.504 13.985 14.006Full-time Equivalent Positions 89 84 77 77 77* Civic Initiatives, Promotional and Protocol (partially allocated to the Economic Development Service) are Mayor's Office programs that may include making grants: (a) to assist a charitable or non-profit organization, association or corporation; (b) to aid sports and recreation; (c) to support economic and cultural development; (d) to improve, preserve, repair, maintain, convert or develop any property in the City; or (e) for any other purpose that the Mayor considers may be in the interests or to the advantage of the City or its citizens.Explanation of 2019 Change from 2018
(in millions of $)1 Revenues
Increase due to Board of Revision assessment appeals filing fee revenue 0.4200.420
2 ExpensesIncrease in debt and finance charges mainly due to amortization of 2018 Election expenditures
3.013
Decrease in expenditures related to 2018 Election, net of related recoveries (3.009)Miscellaneous adjustments 0.612
0.616Full-time Equivalent Positions
Decrease in FTEs related to 2018 Election process.
Preliminary 2019 Budget - Service Based 2-121
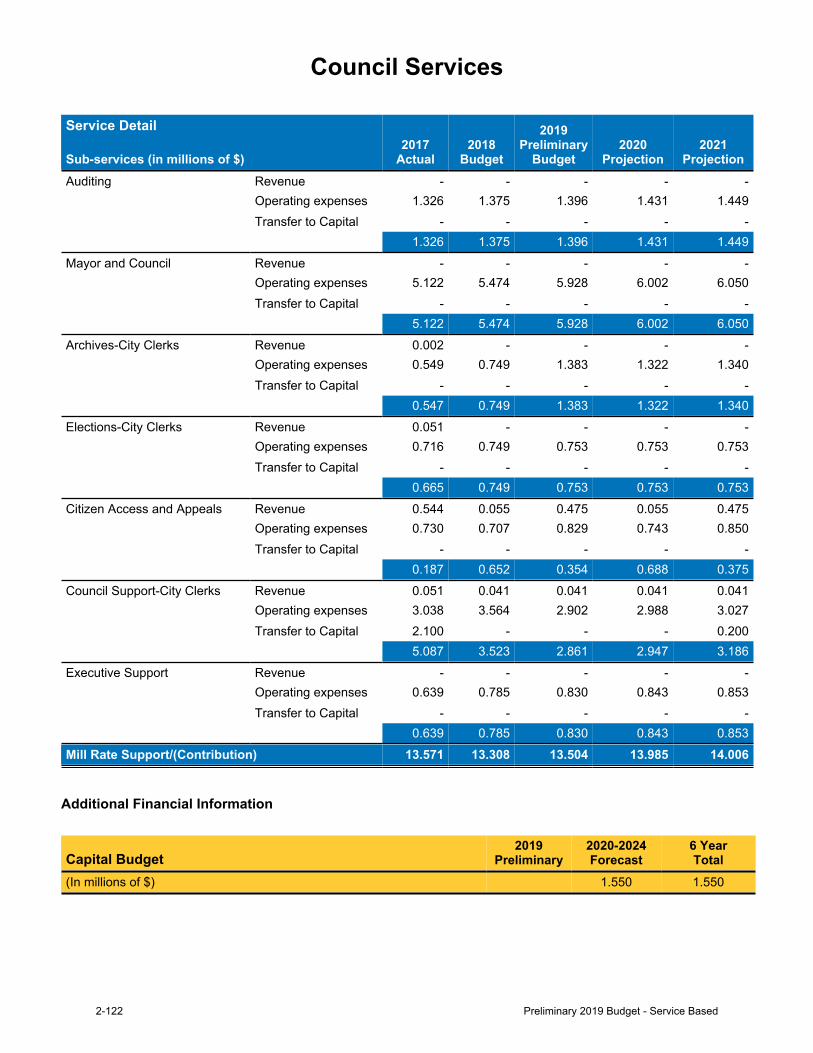
Council Services
Service Detail
Sub-services (in millions of $)2017
Actual2018
Budget
2019Preliminary
Budget2020
Projection2021
ProjectionAuditing Revenue - - - - -
Operating expenses 1.326 1.375 1.396 1.431 1.449Transfer to Capital - - - - -
1.326 1.375 1.396 1.431 1.449Mayor and Council Revenue - - - - -
Operating expenses 5.122 5.474 5.928 6.002 6.050Transfer to Capital - - - - -
5.122 5.474 5.928 6.002 6.050Archives-City Clerks Revenue 0.002 - - - -
Operating expenses 0.549 0.749 1.383 1.322 1.340Transfer to Capital - - - - -
0.547 0.749 1.383 1.322 1.340Elections-City Clerks Revenue 0.051 - - - -
Operating expenses 0.716 0.749 0.753 0.753 0.753Transfer to Capital - - - - -
0.665 0.749 0.753 0.753 0.753Citizen Access and Appeals Revenue 0.544 0.055 0.475 0.055 0.475
Operating expenses 0.730 0.707 0.829 0.743 0.850Transfer to Capital - - - - -
0.187 0.652 0.354 0.688 0.375Council Support-City Clerks Revenue 0.051 0.041 0.041 0.041 0.041
Operating expenses 3.038 3.564 2.902 2.988 3.027Transfer to Capital 2.100 - - - 0.200
5.087 3.523 2.861 2.947 3.186Executive Support Revenue - - - - -
Operating expenses 0.639 0.785 0.830 0.843 0.853Transfer to Capital - - - - -
0.639 0.785 0.830 0.843 0.853Mill Rate Support/(Contribution) 13.571 13.308 13.504 13.985 14.006
Additional Financial Information
Capital Budget2019
Preliminary2020-2024Forecast
6 YearTotal
(In millions of $) 1.550 1.550
2-122 Preliminary 2019 Budget - Service Based
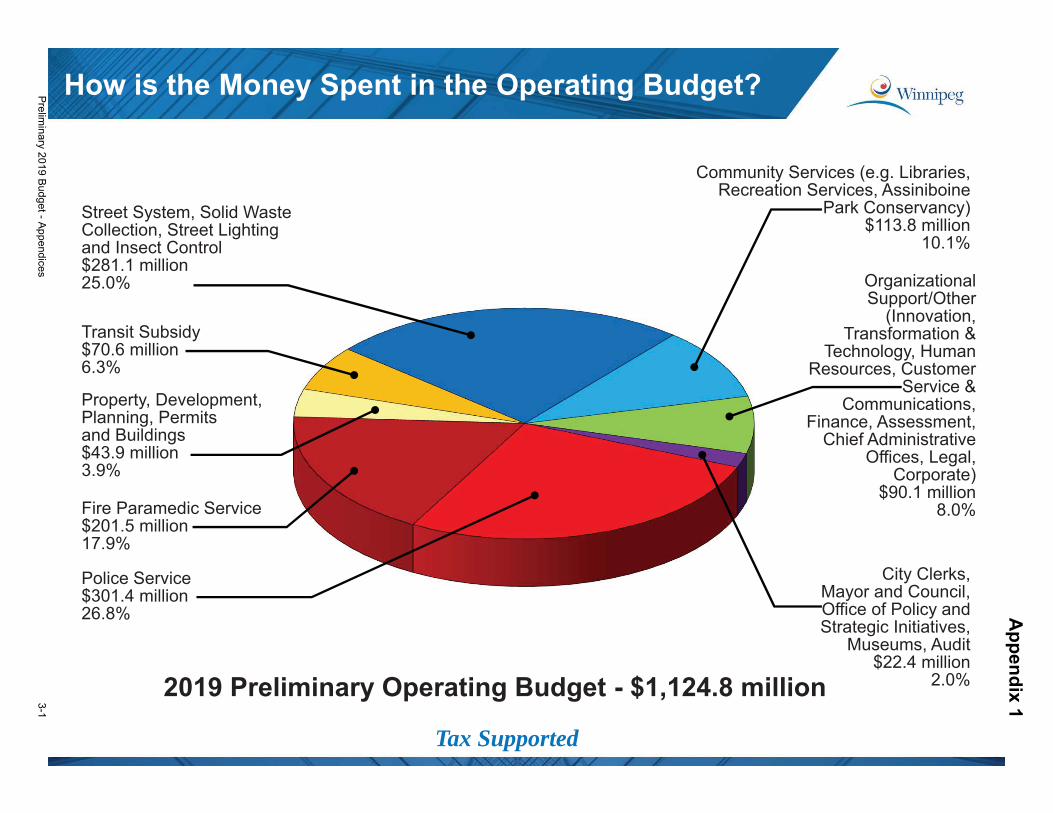
Tax Supported
Preliminary 2019 Budget - Appendices
3-1
Appendix 1
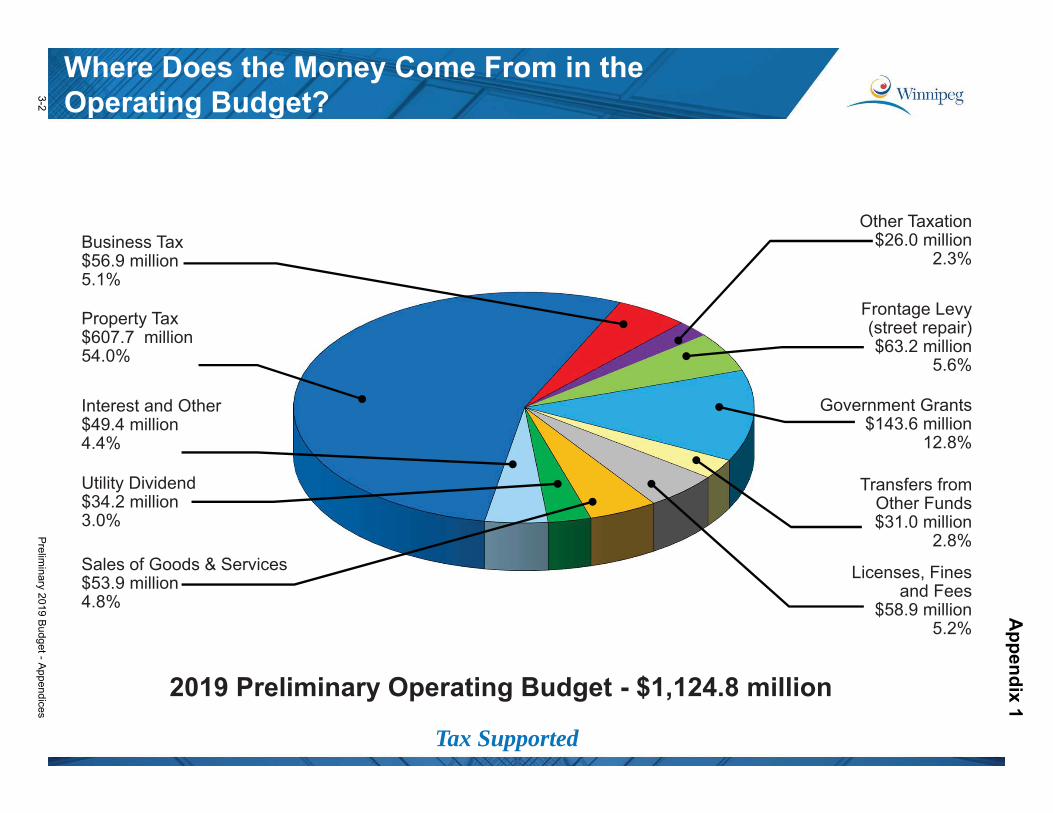
Tax Supported
3-2Prelim
inary 2019 Budget - Appendices
Appendix 1
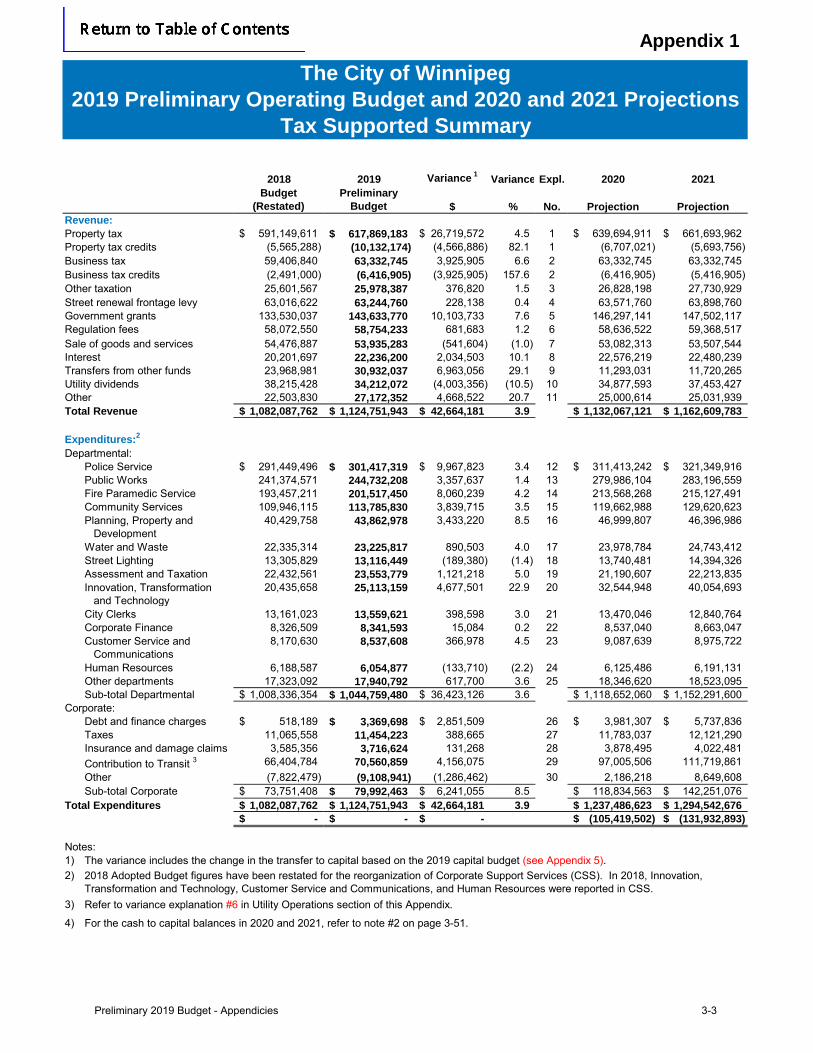
Appendix 1
2018 2019 Variance 1 Variance Expl. 2020 2021Budget
(Restated)Preliminary
Budget $ % No. Projection ProjectionRevenue:
591,149,611$ 617,869,183$ 26,719,572$ 4.5 1 639,694,911$ 661,693,962$ (5,565,288) (10,132,174) (4,566,886) 82.1 1 (6,707,021) (5,693,756) 59,406,840 63,332,745 3,925,905 6.6 2 63,332,745 63,332,745 (2,491,000) (6,416,905) (3,925,905) 157.6 2 (6,416,905) (5,416,905)
Other taxation 25,601,567 25,978,387 376,820 1.5 3 26,828,198 27,730,929 Street renewal frontage levy 63,016,622 63,244,760 228,138 0.4 4 63,571,760 63,898,760 Government grants 133,530,037 143,633,770 10,103,733 7.6 5 146,297,141 147,502,117 Regulation fees 58,072,550 58,754,233 681,683 1.2 6 58,636,522 59,368,517 Sale of goods and services 54,476,887 53,935,283 (541,604) (1.0) 7 53,082,313 53,507,544 Interest 20,201,697 22,236,200 2,034,503 10.1 8 22,576,219 22,480,239 Transfers from other funds 23,968,981 30,932,037 6,963,056 29.1 9 11,293,031 11,720,265 Utility dividends 38,215,428 34,212,072 (4,003,356) (10.5) 10 34,877,593 37,453,427 Other 22,503,830 27,172,352 4,668,522 20.7 11 25,000,614 25,031,939 Total Revenue 1,082,087,762$ 1,124,751,943$ 42,664,181$ 3.9 1,132,067,121$ 1,162,609,783$
Expenditures:2
Departmental:Police Service 291,449,496$ 301,417,319$ 9,967,823$ 3.4 12 311,413,242$ 321,349,916$ Public Works 241,374,571 244,732,208 3,357,637 1.4 13 279,986,104 283,196,559 Fire Paramedic Service 193,457,211 201,517,450 8,060,239 4.2 14 213,568,268 215,127,491 Community Services 109,946,115 113,785,830 3,839,715 3.5 15 119,662,988 129,620,623 Planning, Property and Development
40,429,758 43,862,978 3,433,220 8.5 16 46,999,807 46,396,986
Water and Waste 22,335,314 23,225,817 890,503 4.0 17 23,978,784 24,743,412 Street Lighting 13,305,829 13,116,449 (189,380) (1.4) 18 13,740,481 14,394,326 Assessment and Taxation 22,432,561 23,553,779 1,121,218 5.0 19 21,190,607 22,213,835 Innovation, Transformation and Technology
20,435,658 25,113,159 4,677,501 22.9 20 32,544,948 40,054,693
City Clerks 13,161,023 13,559,621 398,598 3.0 21 13,470,046 12,840,764 Corporate Finance 8,326,509 8,341,593 15,084 0.2 22 8,537,040 8,663,047 Customer Service and Communications
8,170,630 8,537,608 366,978 4.5 23 9,087,639 8,975,722
Human Resources 6,188,587 6,054,877 (133,710) (2.2) 24 6,125,486 6,191,131 Other departments 17,323,092 17,940,792 617,700 3.6 25 18,346,620 18,523,095 Sub-total Departmental 1,008,336,354$ 1,044,759,480$ 36,423,126$ 3.6 1,118,652,060$ 1,152,291,600$
Corporate:Debt and finance charges 518,189$ 3,369,698$ 2,851,509$ 26 3,981,307$ 5,737,836$ Taxes 11,065,558 11,454,223 388,665 27 11,783,037 12,121,290 Insurance and damage claims 3,585,356 3,716,624 131,268 28 3,878,495 4,022,481 Contribution to Transit 3 66,404,784 70,560,859 4,156,075 29 97,005,506 111,719,861 Other (7,822,479) (9,108,941) (1,286,462) 30 2,186,218 8,649,608 Sub-total Corporate 73,751,408$ 79,992,463$ 6,241,055$ 8.5 118,834,563$ 142,251,076$
Total Expenditures 1,082,087,762$ 1,124,751,943$ 42,664,181$ 3.9 1,237,486,623$ 1,294,542,676$ -$ -$ -$ (105,419,502)$ (131,932,893)$
Notes:1)2)
3)
4)
Business tax
Property tax
Refer to variance explanation #6 in Utility Operations section of this Appendix.
The variance includes the change in the transfer to capital based on the 2019 capital budget (see Appendix 5).2018 Adopted Budget figures have been restated for the reorganization of Corporate Support Services (CSS). In 2018, Innovation, Transformation and Technology, Customer Service and Communications, and Human Resources were reported in CSS.
For the cash to capital balances in 2020 and 2021, refer to note #2 on page 3-51.
Property tax credits
The City of Winnipeg2019 Preliminary Operating Budget and 2020 and 2021 Projections
Tax Supported Summary
Business tax credits
Preliminary 2019 Budget - Appendicies 3-3
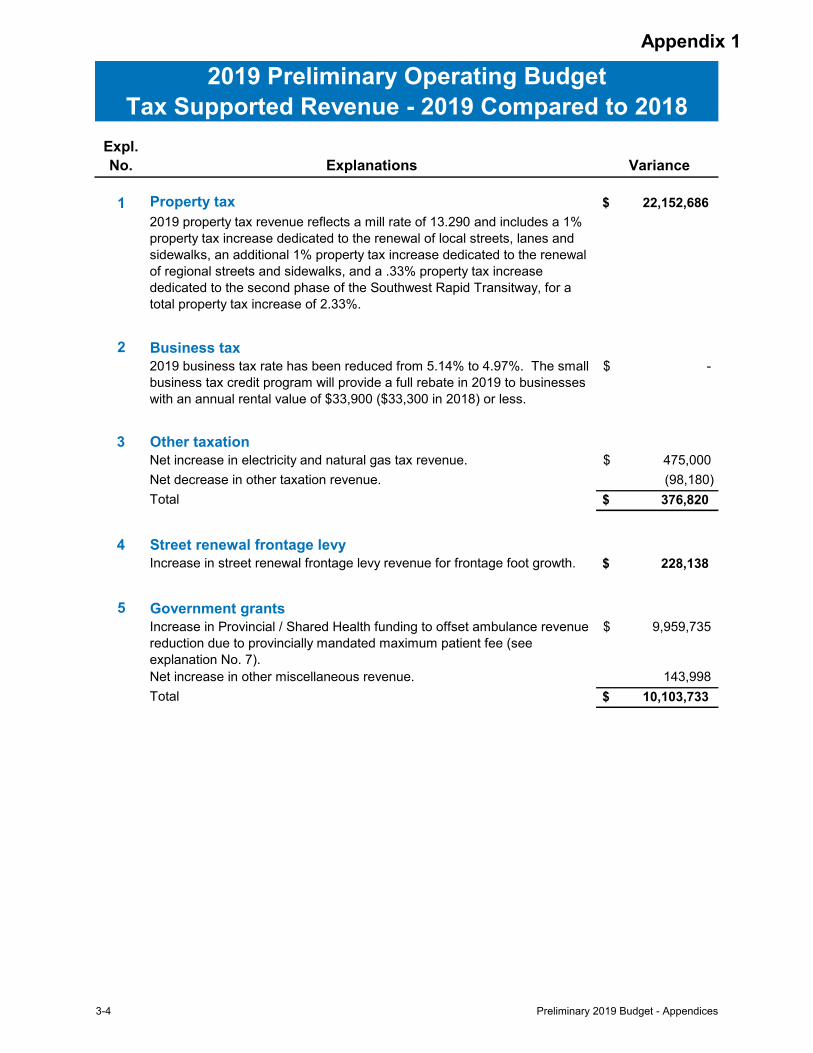
Appendix 1
Expl.No. Explanations Variance
1 Property tax $ 22,152,686 2019 property tax revenue reflects a mill rate of 13.290 and includes a 1% property tax increase dedicated to the renewal of local streets, lanes and sidewalks, an additional 1% property tax increase dedicated to the renewal of regional streets and sidewalks, and a .33% property tax increase dedicated to the second phase of the Southwest Rapid Transitway, for a total property tax increase of 2.33%.
2 Business tax 2019 business tax rate has been reduced from 5.14% to 4.97%. The small business tax credit program will provide a full rebate in 2019 to businesses with an annual rental value of $33,900 ($33,300 in 2018) or less.
-$
3 Other taxationNet increase in electricity and natural gas tax revenue. 475,000$ Net decrease in other taxation revenue. (98,180)Total $ 376,820
4 Street renewal frontage levyIncrease in street renewal frontage levy revenue for frontage foot growth. $ 228,138
5 Government grantsIncrease in Provincial / Shared Health funding to offset ambulance revenue reduction due to provincially mandated maximum patient fee (see explanation No. 7).
9,959,735$
Net increase in other miscellaneous revenue. 143,998 Total $ 10,103,733
2019 Preliminary Operating BudgetTax Supported Revenue - 2019 Compared to 2018
3-4 Preliminary 2019 Budget - Appendices
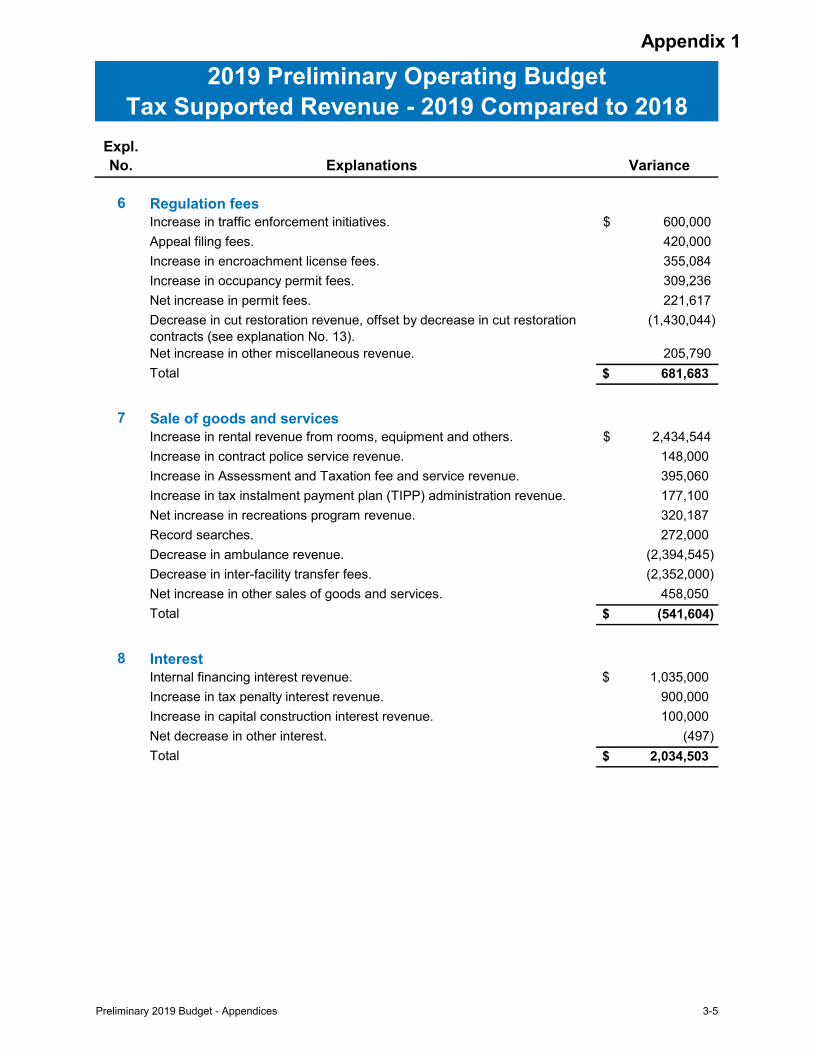
Appendix 1
Expl.No. Explanations Variance
2019 Preliminary Operating BudgetTax Supported Revenue - 2019 Compared to 2018
6 Regulation feesIncrease in traffic enforcement initiatives. 600,000$ Appeal filing fees. 420,000 Increase in encroachment license fees. 355,084 Increase in occupancy permit fees. 309,236 Net increase in permit fees. 221,617 Decrease in cut restoration revenue, offset by decrease in cut restoration contracts (see explanation No. 13).
(1,430,044)
Net increase in other miscellaneous revenue. 205,790 Total $ 681,683
7 Sale of goods and servicesIncrease in rental revenue from rooms, equipment and others. 2,434,544$ Increase in contract police service revenue. 148,000 Increase in Assessment and Taxation fee and service revenue. 395,060 Increase in tax instalment payment plan (TIPP) administration revenue. 177,100 Net increase in recreations program revenue. 320,187 Record searches. 272,000 Decrease in ambulance revenue. (2,394,545)Decrease in inter-facility transfer fees. (2,352,000)Net increase in other sales of goods and services. 458,050 Total $ (541,604)
8 InterestInternal financing interest revenue. $ 1,035,000 Increase in tax penalty interest revenue. 900,000 Increase in capital construction interest revenue. 100,000 Net decrease in other interest. (497)Total $ 2,034,503
Preliminary 2019 Budget - Appendices 3-5
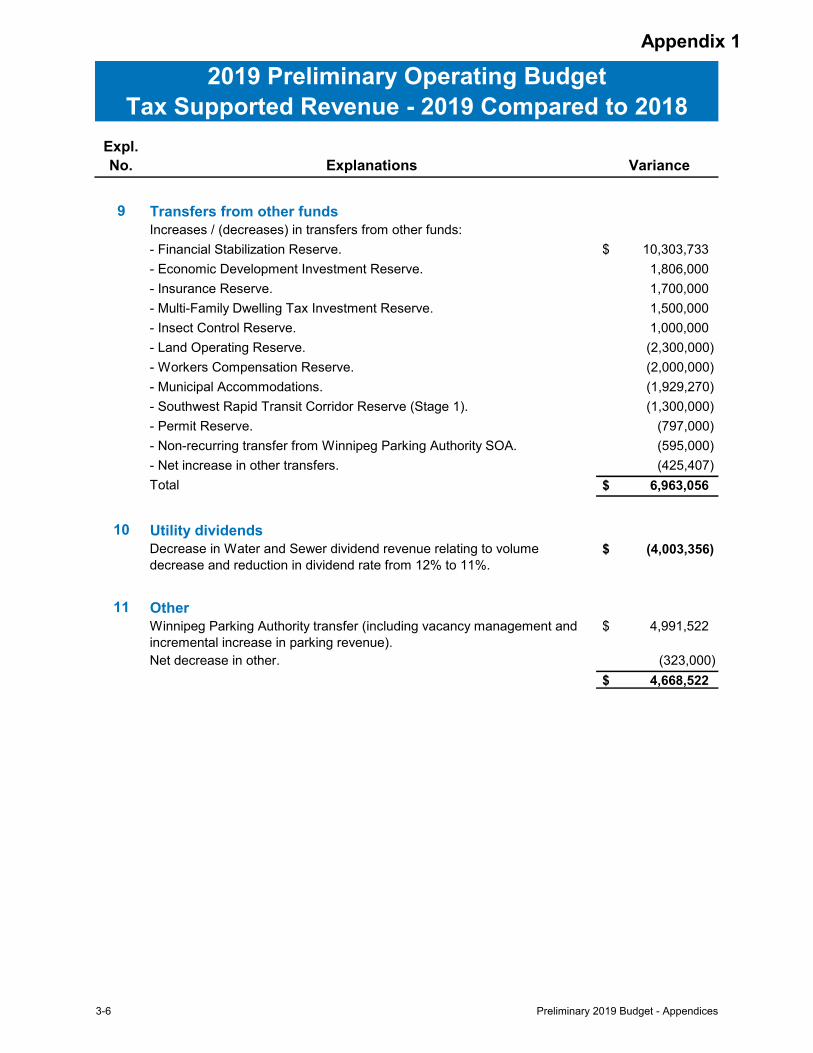
Appendix 1
Expl.No. Explanations Variance
2019 Preliminary Operating BudgetTax Supported Revenue - 2019 Compared to 2018
9 Transfers from other fundsIncreases / (decreases) in transfers from other funds:- Financial Stabilization Reserve. $ 10,303,733 - Economic Development Investment Reserve. 1,806,000 - Insurance Reserve. 1,700,000 - Multi-Family Dwelling Tax Investment Reserve. 1,500,000 - Insect Control Reserve. 1,000,000 - Land Operating Reserve. (2,300,000)- Workers Compensation Reserve. (2,000,000)- Municipal Accommodations. (1,929,270)- Southwest Rapid Transit Corridor Reserve (Stage 1). (1,300,000)- Permit Reserve. (797,000)- Non-recurring transfer from Winnipeg Parking Authority SOA. (595,000)- Net increase in other transfers. (425,407)Total $ 6,963,056
10 Utility dividendsDecrease in Water and Sewer dividend revenue relating to volume decrease and reduction in dividend rate from 12% to 11%.
$ (4,003,356)
11 OtherWinnipeg Parking Authority transfer (including vacancy management and incremental increase in parking revenue).
$ 4,991,522
Net decrease in other. (323,000) $ 4,668,522
3-6 Preliminary 2019 Budget - Appendices
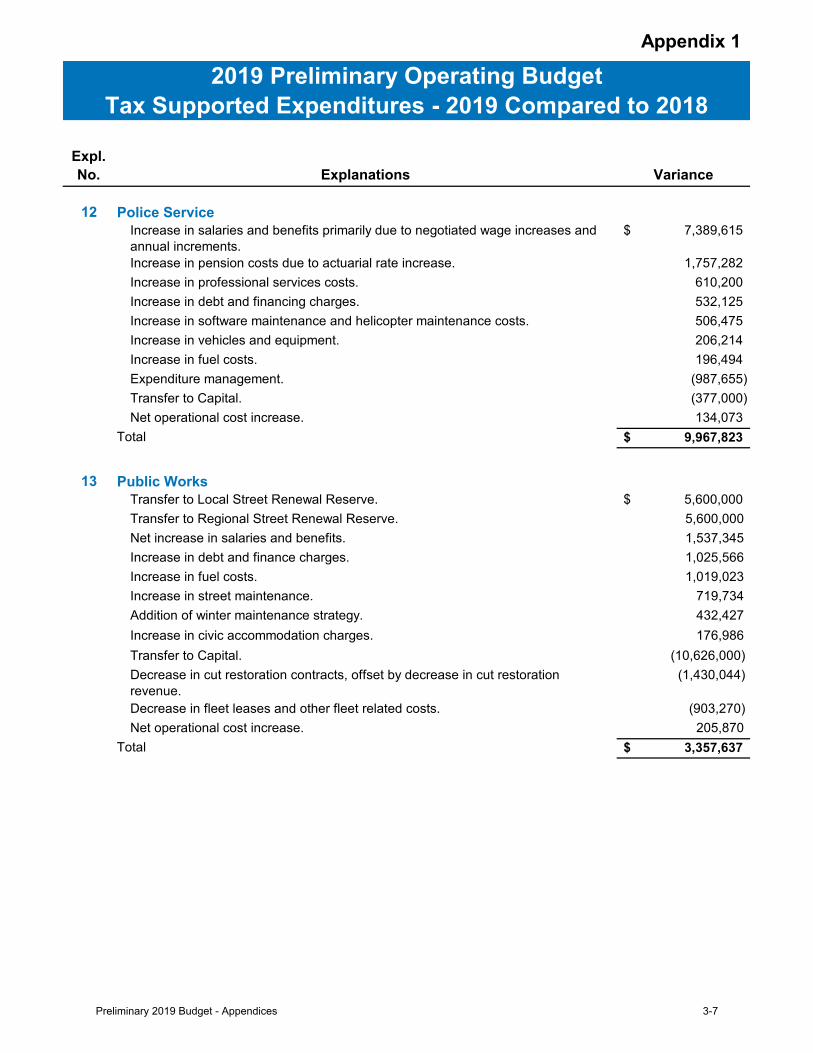
Appendix 1
Expl.No. Explanations Variance
12 Police ServiceIncrease in salaries and benefits primarily due to negotiated wage increases and annual increments.
7,389,615$
Increase in pension costs due to actuarial rate increase. 1,757,282 Increase in professional services costs. 610,200 Increase in debt and financing charges. 532,125 Increase in software maintenance and helicopter maintenance costs. 506,475 Increase in vehicles and equipment. 206,214 Increase in fuel costs. 196,494 Expenditure management. (987,655) Transfer to Capital. (377,000) Net operational cost increase. 134,073
Total 9,967,823$
13 Public WorksTransfer to Local Street Renewal Reserve. 5,600,000$ Transfer to Regional Street Renewal Reserve. 5,600,000 Net increase in salaries and benefits. 1,537,345 Increase in debt and finance charges. 1,025,566 Increase in fuel costs. 1,019,023 Increase in street maintenance. 719,734 Addition of winter maintenance strategy. 432,427 Increase in civic accommodation charges. 176,986 Transfer to Capital. (10,626,000)Decrease in cut restoration contracts, offset by decrease in cut restoration revenue.
(1,430,044)
Decrease in fleet leases and other fleet related costs. (903,270)Net operational cost increase. 205,870
Total 3,357,637$
2019 Preliminary Operating BudgetTax Supported Expenditures - 2019 Compared to 2018
Preliminary 2019 Budget - Appendices 3-7
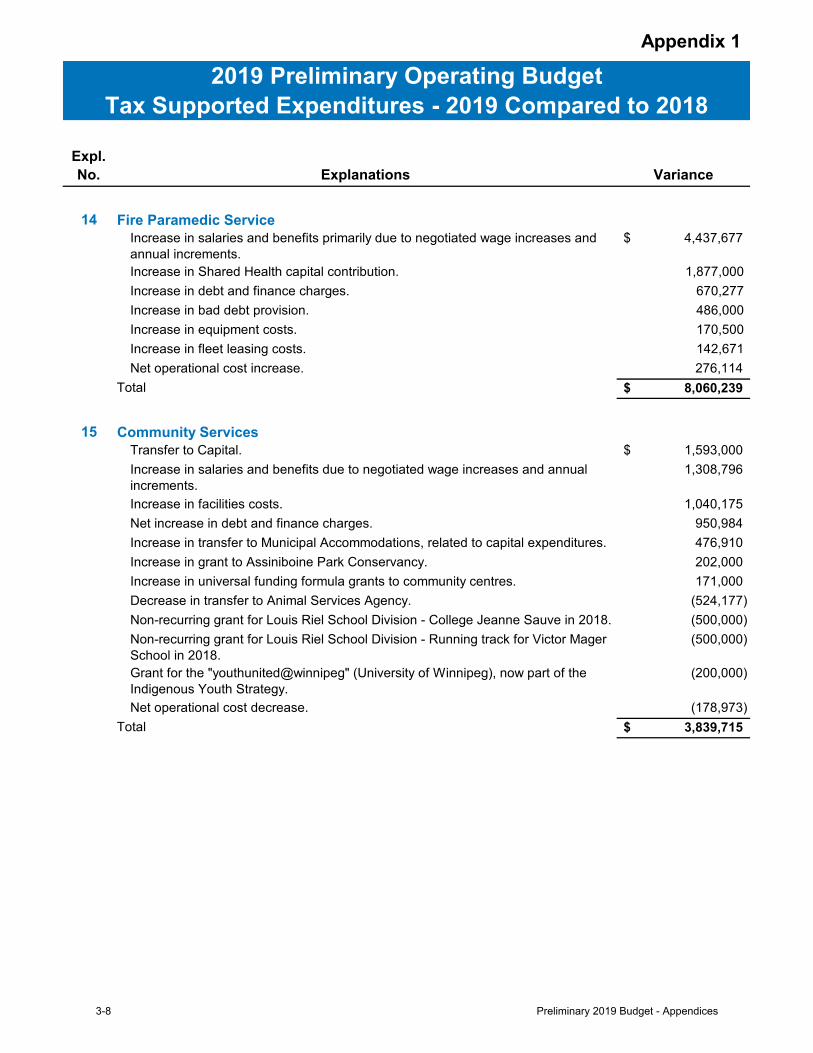
Appendix 1
Expl.No. Explanations Variance
2019 Preliminary Operating BudgetTax Supported Expenditures - 2019 Compared to 2018
14 Fire Paramedic ServiceIncrease in salaries and benefits primarily due to negotiated wage increases and annual increments.
4,437,677$
Increase in Shared Health capital contribution. 1,877,000 Increase in debt and finance charges. 670,277 Increase in bad debt provision. 486,000 Increase in equipment costs. 170,500 Increase in fleet leasing costs. 142,671 Net operational cost increase. 276,114
Total 8,060,239$
15 Community ServicesTransfer to Capital. 1,593,000$ Increase in salaries and benefits due to negotiated wage increases and annual increments.
1,308,796
Increase in facilities costs. 1,040,175 Net increase in debt and finance charges. 950,984 Increase in transfer to Municipal Accommodations, related to capital expenditures. 476,910 Increase in grant to Assiniboine Park Conservancy. 202,000 Increase in universal funding formula grants to community centres. 171,000 Decrease in transfer to Animal Services Agency. (524,177) Non-recurring grant for Louis Riel School Division - College Jeanne Sauve in 2018. (500,000) Non-recurring grant for Louis Riel School Division - Running track for Victor Mager School in 2018.
(500,000)
Grant for the "youthunited@winnipeg" (University of Winnipeg), now part of the Indigenous Youth Strategy.
(200,000)
Net operational cost decrease. (178,973) Total 3,839,715$
3-8 Preliminary 2019 Budget - Appendices
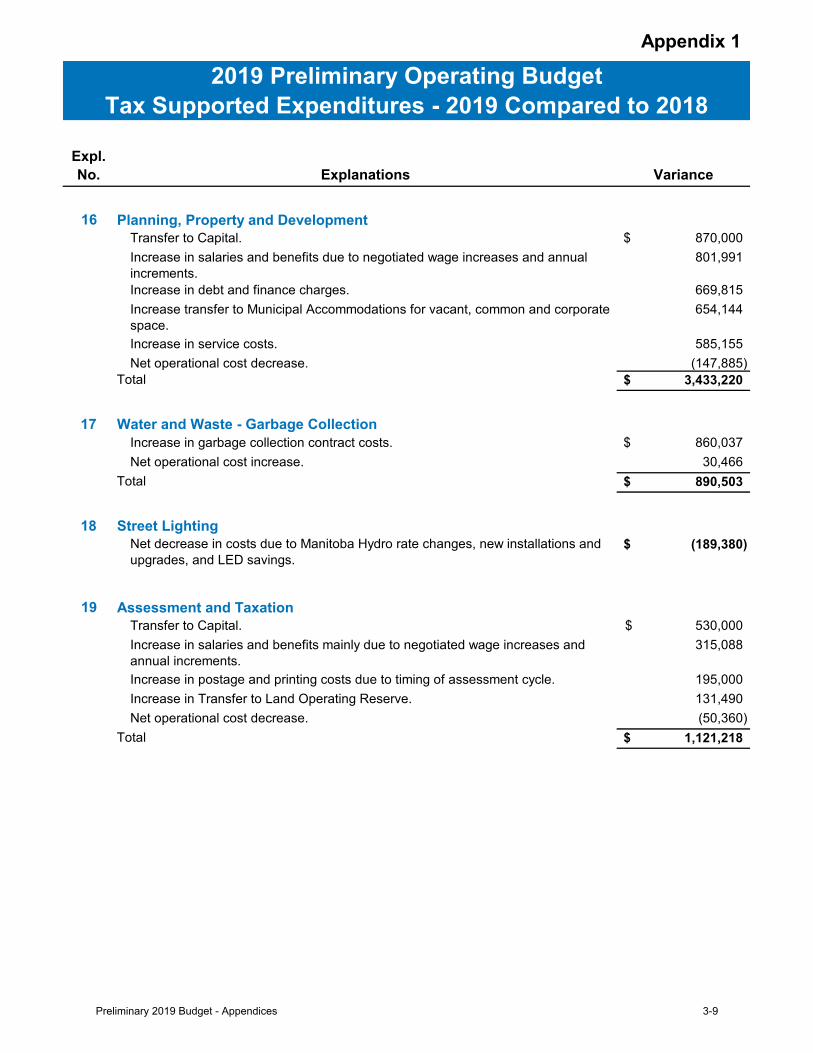
Appendix 1
Expl.No. Explanations Variance
2019 Preliminary Operating BudgetTax Supported Expenditures - 2019 Compared to 2018
16 Planning, Property and DevelopmentTransfer to Capital. 870,000$ Increase in salaries and benefits due to negotiated wage increases and annual increments.
801,991
Increase in debt and finance charges. 669,815 Increase transfer to Municipal Accommodations for vacant, common and corporate space.
654,144
Increase in service costs. 585,155 Net operational cost decrease. (147,885)
Total 3,433,220$
17 Water and Waste - Garbage CollectionIncrease in garbage collection contract costs. 860,037$ Net operational cost increase. 30,466
Total 890,503$
18 Street LightingNet decrease in costs due to Manitoba Hydro rate changes, new installations and upgrades, and LED savings.
(189,380)$
19 Assessment and TaxationTransfer to Capital. 530,000$ Increase in salaries and benefits mainly due to negotiated wage increases and annual increments.
315,088
Increase in postage and printing costs due to timing of assessment cycle. 195,000 Increase in Transfer to Land Operating Reserve. 131,490 Net operational cost decrease. (50,360)
Total 1,121,218$
Preliminary 2019 Budget - Appendices 3-9
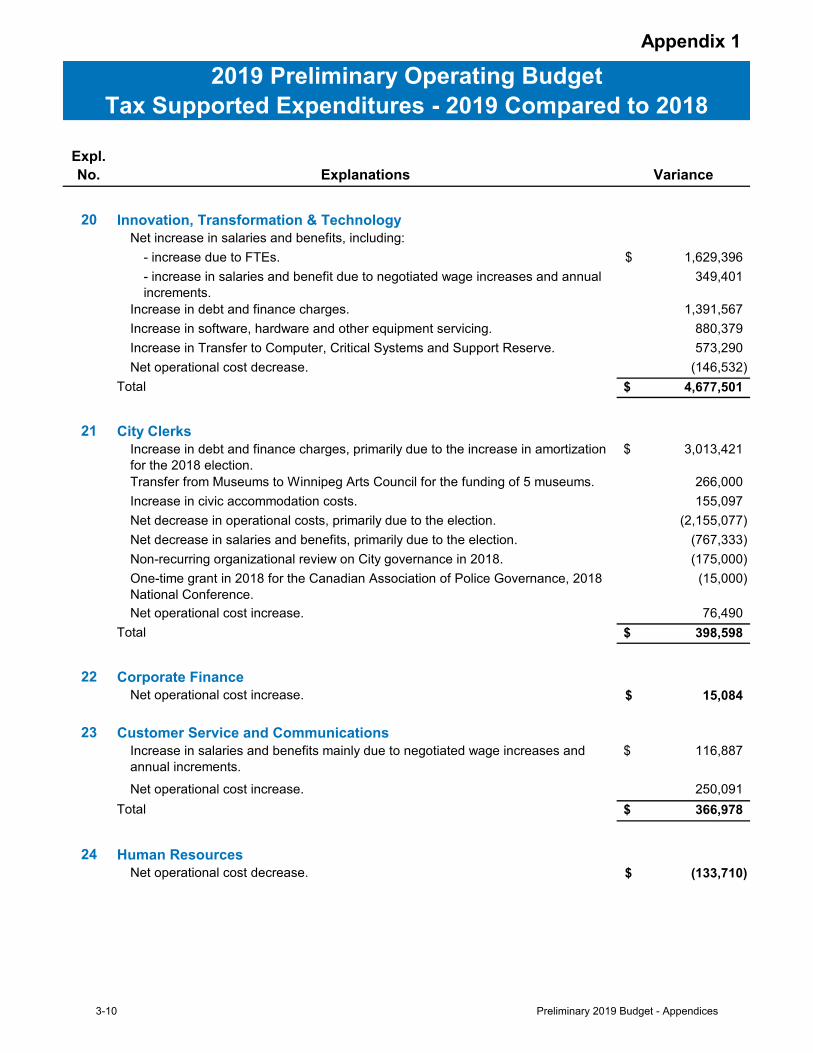
Appendix 1
Expl.No. Explanations Variance
2019 Preliminary Operating BudgetTax Supported Expenditures - 2019 Compared to 2018
20 Innovation, Transformation & TechnologyNet increase in salaries and benefits, including:
- increase due to FTEs. 1,629,396$ - increase in salaries and benefit due to negotiated wage increases and annual increments.
349,401
Increase in debt and finance charges. 1,391,567 Increase in software, hardware and other equipment servicing. 880,379 Increase in Transfer to Computer, Critical Systems and Support Reserve. 573,290 Net operational cost decrease. (146,532)
Total 4,677,501$
21 City ClerksIncrease in debt and finance charges, primarily due to the increase in amortization for the 2018 election.
3,013,421$
Transfer from Museums to Winnipeg Arts Council for the funding of 5 museums. 266,000 Increase in civic accommodation costs. 155,097 Net decrease in operational costs, primarily due to the election. (2,155,077) Net decrease in salaries and benefits, primarily due to the election. (767,333) Non-recurring organizational review on City governance in 2018. (175,000) One-time grant in 2018 for the Canadian Association of Police Governance, 2018 National Conference.
(15,000)
Net operational cost increase. 76,490 Total 398,598$
22 Corporate FinanceNet operational cost increase. 15,084$
23 Customer Service and CommunicationsIncrease in salaries and benefits mainly due to negotiated wage increases and annual increments.
116,887$
Net operational cost increase. 250,091 Total 366,978$
24 Human ResourcesNet operational cost decrease. (133,710)$
3-10 Preliminary 2019 Budget - Appendices
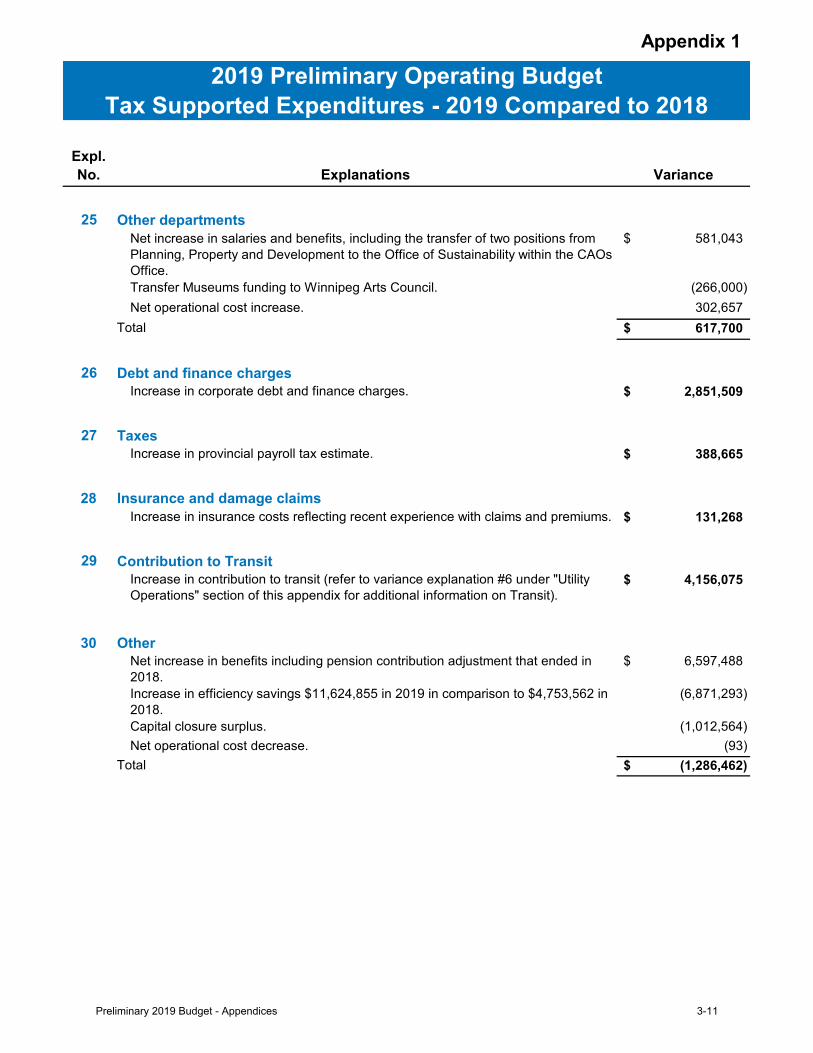
Appendix 1
Expl.No. Explanations Variance
2019 Preliminary Operating BudgetTax Supported Expenditures - 2019 Compared to 2018
25 Other departmentsNet increase in salaries and benefits, including the transfer of two positions from Planning, Property and Development to the Office of Sustainability within the CAOs Office.
581,043$
Transfer Museums funding to Winnipeg Arts Council. (266,000) Net operational cost increase. 302,657
Total 617,700$
26 Debt and finance chargesIncrease in corporate debt and finance charges. 2,851,509$
27 TaxesIncrease in provincial payroll tax estimate. 388,665$
28 Insurance and damage claimsIncrease in insurance costs reflecting recent experience with claims and premiums. 131,268$
29 Contribution to TransitIncrease in contribution to transit (refer to variance explanation #6 under "Utility Operations" section of this appendix for additional information on Transit).
4,156,075$
30 OtherNet increase in benefits including pension contribution adjustment that ended in 2018.
6,597,488$
Increase in efficiency savings $11,624,855 in 2019 in comparison to $4,753,562 in 2018.
(6,871,293)
Capital closure surplus. (1,012,564) Net operational cost decrease. (93)
Total (1,286,462)$
Preliminary 2019 Budget - Appendices 3-11
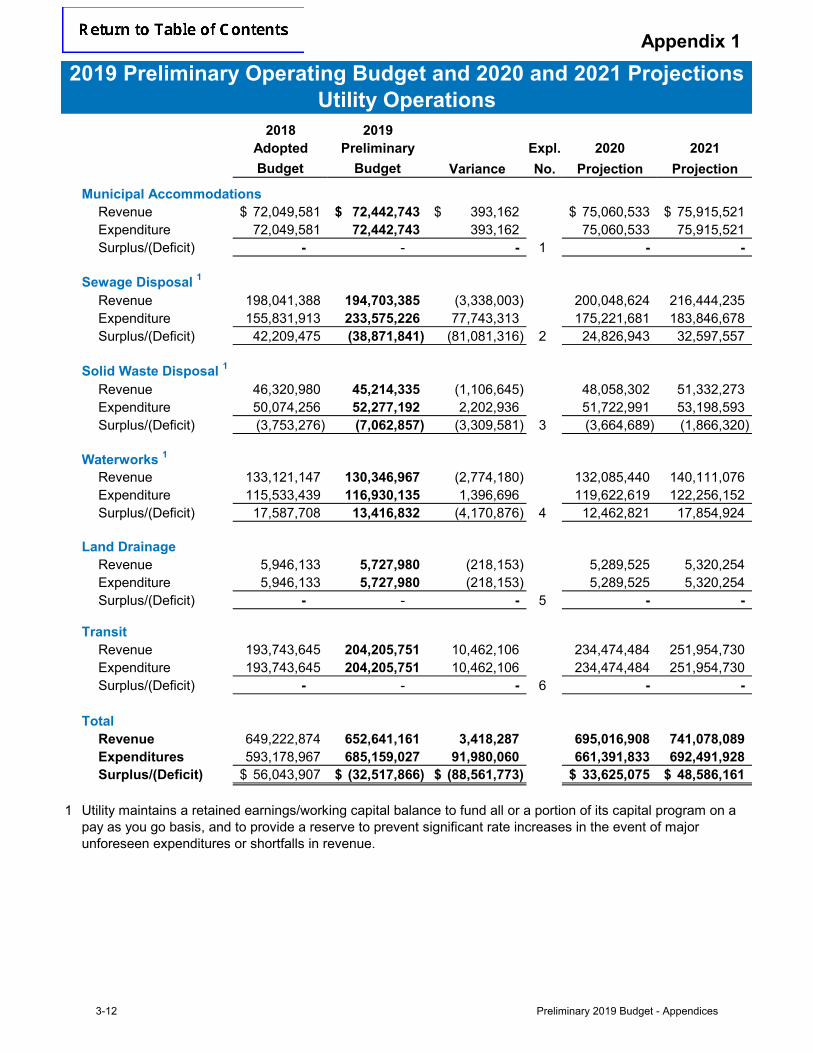
Appendix 1
2018 2019Adopted Preliminary Expl. 2020 2021Budget Budget Variance No. Projection Projection
Municipal AccommodationsRevenue 72,049,581$ 72,442,743$ 393,162$ 75,060,533$ 75,915,521$ Expenditure 72,049,581 72,442,743 393,162 75,060,533 75,915,521 Surplus/(Deficit) - - - 1 - -
Sewage Disposal 1
Revenue 198,041,388 194,703,385 (3,338,003) 200,048,624 216,444,235 Expenditure 155,831,913 233,575,226 77,743,313 175,221,681 183,846,678 Surplus/(Deficit) 42,209,475 (38,871,841) (81,081,316) 2 24,826,943 32,597,557
Solid Waste Disposal 1
Revenue 46,320,980 45,214,335 (1,106,645) 48,058,302 51,332,273 Expenditure 50,074,256 52,277,192 2,202,936 51,722,991 53,198,593 Surplus/(Deficit) (3,753,276) (7,062,857) (3,309,581) 3 (3,664,689) (1,866,320)
Waterworks 1Revenue 133,121,147 130,346,967 (2,774,180) 132,085,440 140,111,076 Expenditure 115,533,439 116,930,135 1,396,696 119,622,619 122,256,152 Surplus/(Deficit) 17,587,708 13,416,832 (4,170,876) 4 12,462,821 17,854,924
Land DrainageRevenue 5,946,133 5,727,980 (218,153) 5,289,525 5,320,254 Expenditure 5,946,133 5,727,980 (218,153) 5,289,525 5,320,254 Surplus/(Deficit) - - - 5 - -
TransitRevenue 193,743,645 204,205,751 10,462,106 234,474,484 251,954,730 Expenditure 193,743,645 204,205,751 10,462,106 234,474,484 251,954,730 Surplus/(Deficit) - - - 6 - -
TotalRevenue 649,222,874 652,641,161 3,418,287 695,016,908 741,078,089 Expenditures 593,178,967 685,159,027 91,980,060 661,391,833 692,491,928 Surplus/(Deficit) 56,043,907$ (32,517,866)$ (88,561,773)$ 33,625,075$ 48,586,161$
1 Utility maintains a retained earnings/working capital balance to fund all or a portion of its capital program on a pay as you go basis, and to provide a reserve to prevent significant rate increases in the event of major unforeseen expenditures or shortfalls in revenue.
Utility Operations2019 Preliminary Operating Budget and 2020 and 2021 Projections
3-12 Preliminary 2019 Budget - Appendices
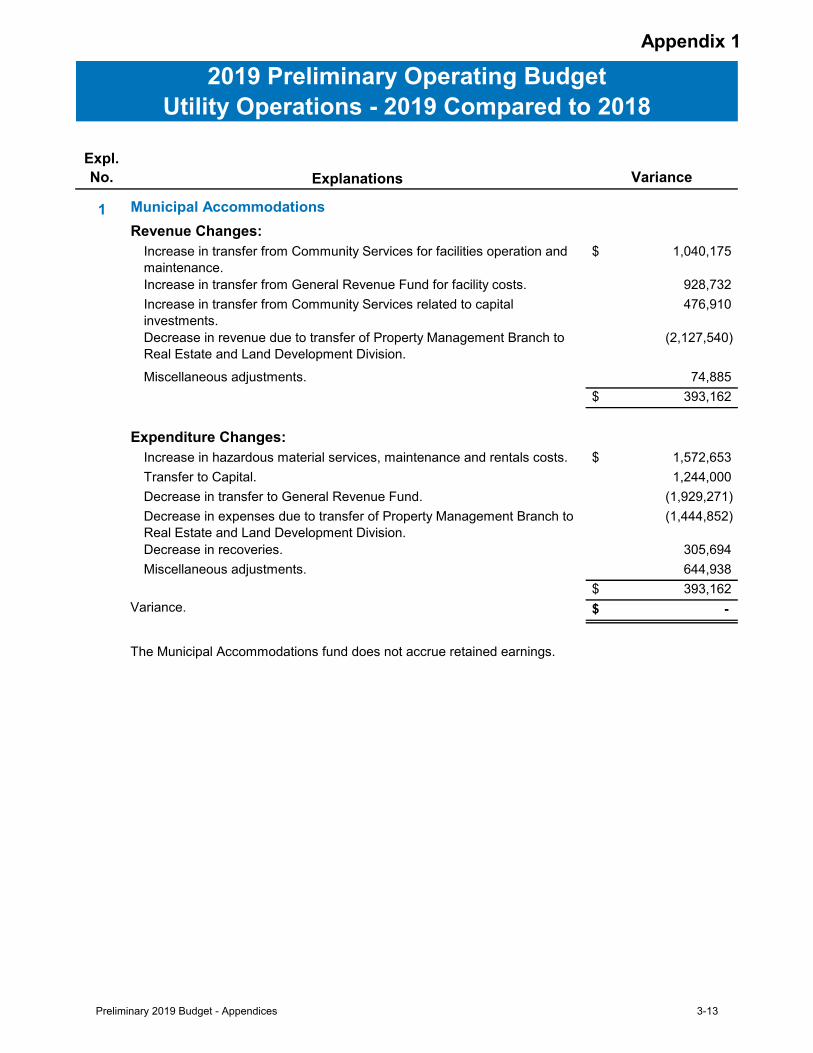
Appendix 1
Expl.No. Explanations Variance
1 Municipal AccommodationsRevenue Changes:
Increase in transfer from Community Services for facilities operation and maintenance.
$ 1,040,175
Increase in transfer from General Revenue Fund for facility costs. 928,732 Increase in transfer from Community Services related to capital investments.
476,910
Decrease in revenue due to transfer of Property Management Branch to Real Estate and Land Development Division.
(2,127,540)
Miscellaneous adjustments. 74,885 $ 393,162
Expenditure Changes:Increase in hazardous material services, maintenance and rentals costs. $ 1,572,653 Transfer to Capital. 1,244,000 Decrease in transfer to General Revenue Fund. (1,929,271)Decrease in expenses due to transfer of Property Management Branch to Real Estate and Land Development Division.
(1,444,852)
Decrease in recoveries. 305,694 Miscellaneous adjustments. 644,938
$ 393,162 Variance. $ -
2019 Preliminary Operating BudgetUtility Operations - 2019 Compared to 2018
The Municipal Accommodations fund does not accrue retained earnings.
Preliminary 2019 Budget - Appendices 3-13
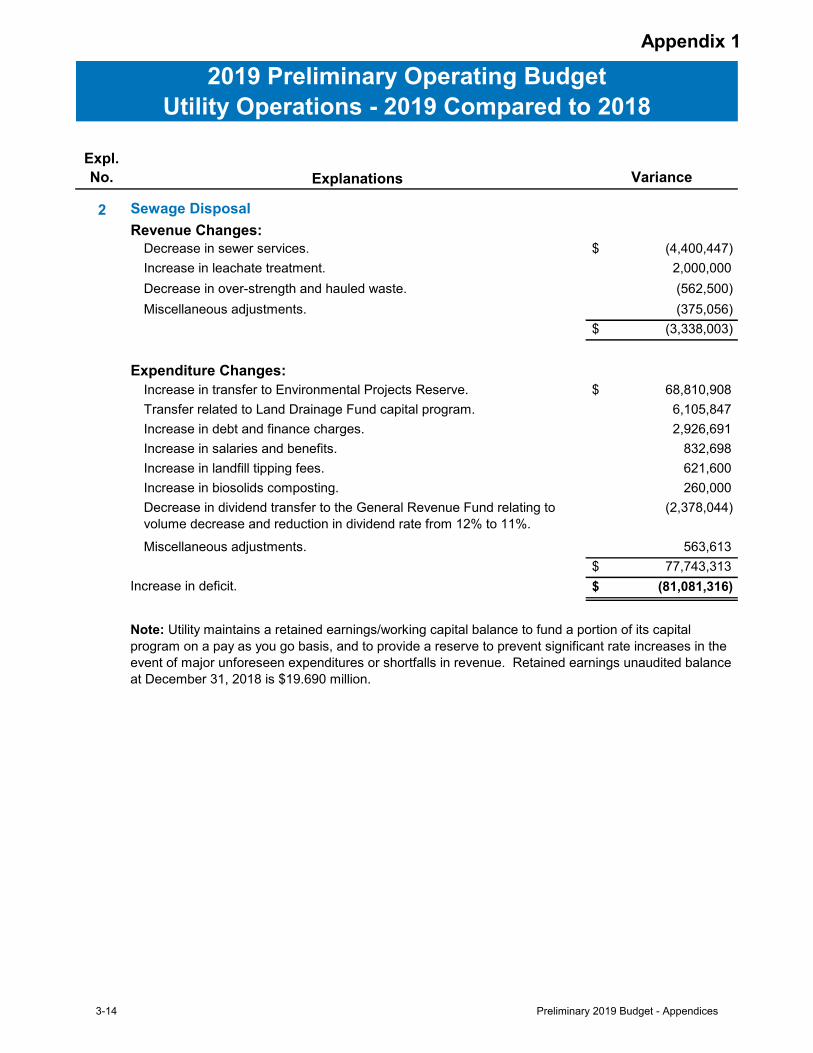
Appendix 1
Expl.No. Explanations Variance
2019 Preliminary Operating BudgetUtility Operations - 2019 Compared to 2018
2 Sewage Disposal Revenue Changes:
Decrease in sewer services. $ (4,400,447)Increase in leachate treatment. 2,000,000 Decrease in over-strength and hauled waste. (562,500)Miscellaneous adjustments. (375,056)
$ (3,338,003)
Expenditure Changes:Increase in transfer to Environmental Projects Reserve. $ 68,810,908 Transfer related to Land Drainage Fund capital program. 6,105,847 Increase in debt and finance charges. 2,926,691 Increase in salaries and benefits. 832,698 Increase in landfill tipping fees. 621,600 Increase in biosolids composting. 260,000 Decrease in dividend transfer to the General Revenue Fund relating to volume decrease and reduction in dividend rate from 12% to 11%.
(2,378,044)
Miscellaneous adjustments. 563,613 $ 77,743,313
Increase in deficit. $ (81,081,316)
Note: Utility maintains a retained earnings/working capital balance to fund a portion of its capital program on a pay as you go basis, and to provide a reserve to prevent significant rate increases in the event of major unforeseen expenditures or shortfalls in revenue. Retained earnings unaudited balance at December 31, 2018 is $19.690 million.
3-14 Preliminary 2019 Budget - Appendices
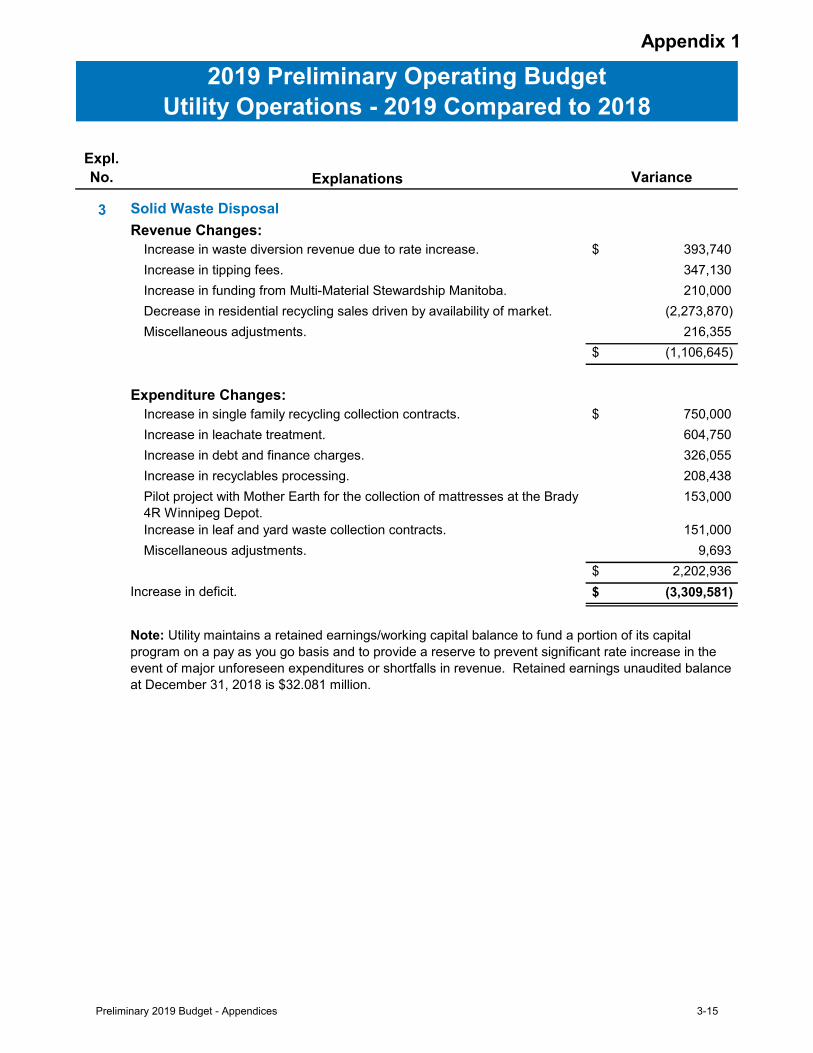
Appendix 1
Expl.No. Explanations Variance
2019 Preliminary Operating BudgetUtility Operations - 2019 Compared to 2018
3 Solid Waste Disposal Revenue Changes:
Increase in waste diversion revenue due to rate increase. $ 393,740 Increase in tipping fees. 347,130 Increase in funding from Multi-Material Stewardship Manitoba. 210,000 Decrease in residential recycling sales driven by availability of market. (2,273,870)Miscellaneous adjustments. 216,355
$ (1,106,645)
Expenditure Changes:Increase in single family recycling collection contracts. $ 750,000 Increase in leachate treatment. 604,750 Increase in debt and finance charges. 326,055 Increase in recyclables processing. 208,438 Pilot project with Mother Earth for the collection of mattresses at the Brady 4R Winnipeg Depot.
153,000
Increase in leaf and yard waste collection contracts. 151,000 Miscellaneous adjustments. 9,693
$ 2,202,936 Increase in deficit. $ (3,309,581)
Note: Utility maintains a retained earnings/working capital balance to fund a portion of its capital program on a pay as you go basis and to provide a reserve to prevent significant rate increase in the event of major unforeseen expenditures or shortfalls in revenue. Retained earnings unaudited balance at December 31, 2018 is $32.081 million.
Preliminary 2019 Budget - Appendices 3-15
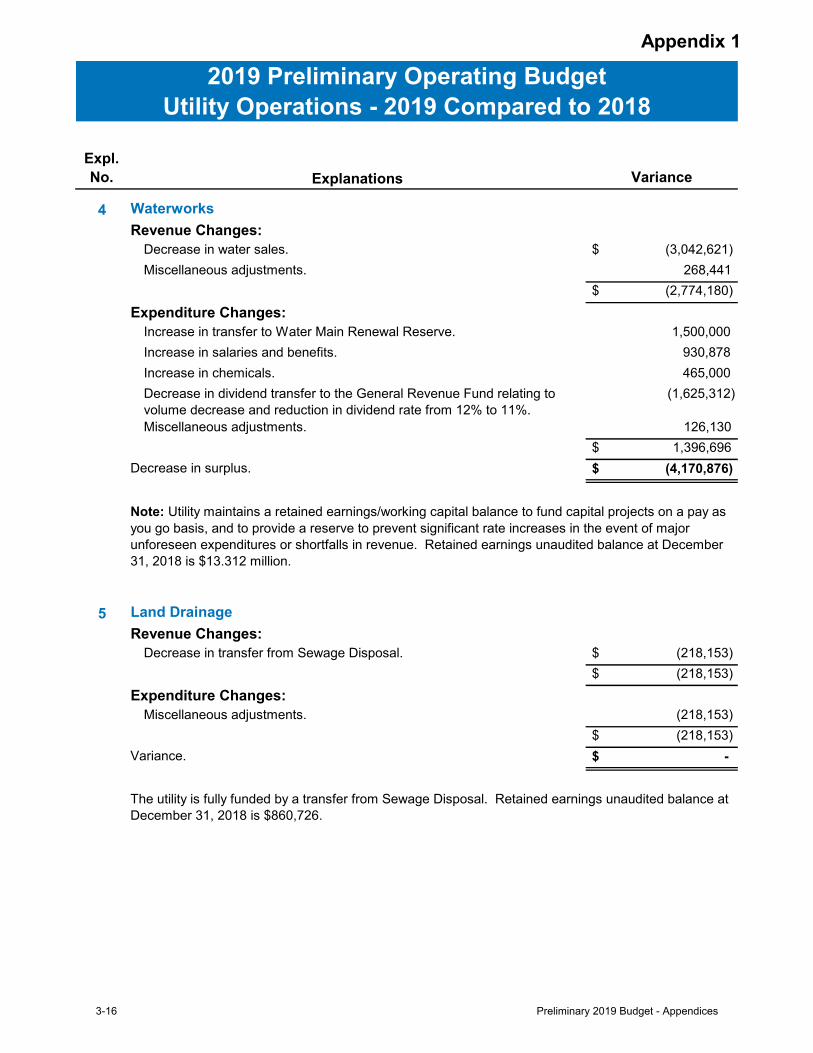
Appendix 1
Expl.No. Explanations Variance
2019 Preliminary Operating BudgetUtility Operations - 2019 Compared to 2018
4 Waterworks Revenue Changes:
Decrease in water sales. $ (3,042,621)Miscellaneous adjustments. 268,441
$ (2,774,180)Expenditure Changes:
Increase in transfer to Water Main Renewal Reserve. 1,500,000 Increase in salaries and benefits. 930,878 Increase in chemicals. 465,000 Decrease in dividend transfer to the General Revenue Fund relating to volume decrease and reduction in dividend rate from 12% to 11%.
(1,625,312)
Miscellaneous adjustments. 126,130 $ 1,396,696
Decrease in surplus. $ (4,170,876)
5 Land DrainageRevenue Changes:
Decrease in transfer from Sewage Disposal. $ (218,153) $ (218,153)
Expenditure Changes:Miscellaneous adjustments. (218,153)
$ (218,153)Variance. $ -
The utility is fully funded by a transfer from Sewage Disposal. Retained earnings unaudited balance at December 31, 2018 is $860,726.
Note: Utility maintains a retained earnings/working capital balance to fund capital projects on a pay as you go basis, and to provide a reserve to prevent significant rate increases in the event of major unforeseen expenditures or shortfalls in revenue. Retained earnings unaudited balance at December 31, 2018 is $13.312 million.
3-16 Preliminary 2019 Budget - Appendices
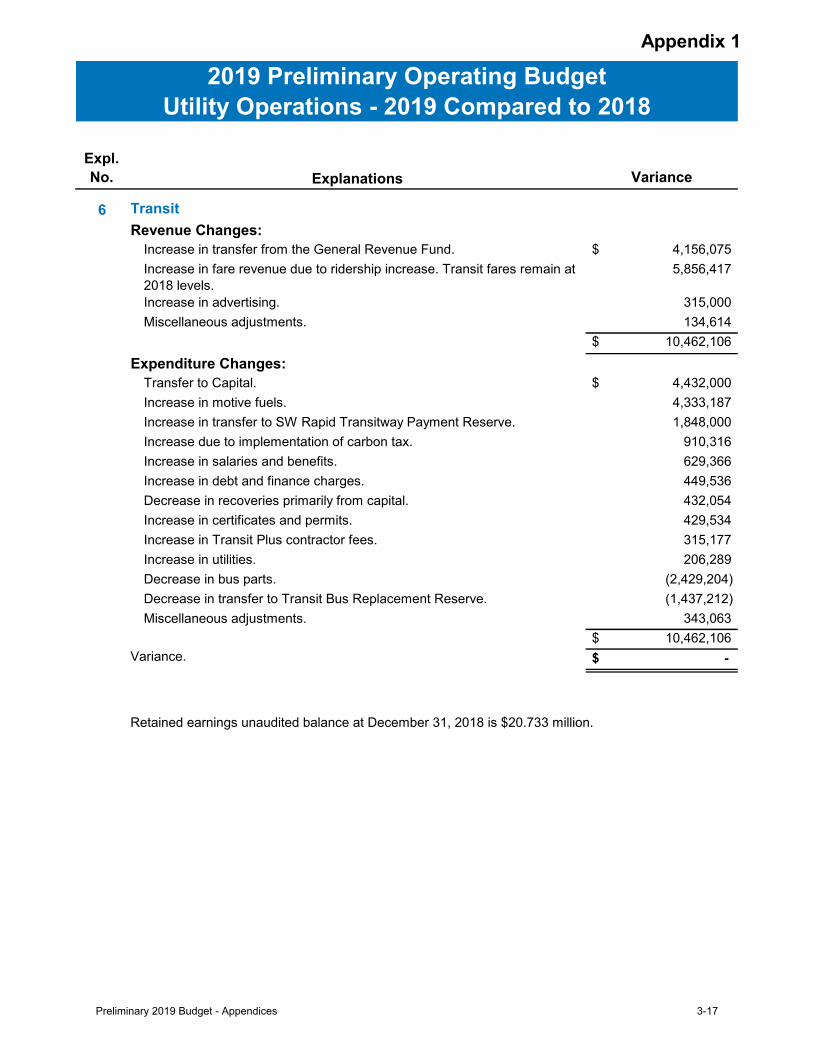
Appendix 1
Expl.No. Explanations Variance
2019 Preliminary Operating BudgetUtility Operations - 2019 Compared to 2018
6 Transit Revenue Changes:
Increase in transfer from the General Revenue Fund. $ 4,156,075 Increase in fare revenue due to ridership increase. Transit fares remain at 2018 levels.
5,856,417
Increase in advertising. 315,000 Miscellaneous adjustments. 134,614
$ 10,462,106 Expenditure Changes:
Transfer to Capital. $ 4,432,000 Increase in motive fuels. 4,333,187 Increase in transfer to SW Rapid Transitway Payment Reserve. 1,848,000 Increase due to implementation of carbon tax. 910,316 Increase in salaries and benefits. 629,366 Increase in debt and finance charges. 449,536 Decrease in recoveries primarily from capital. 432,054 Increase in certificates and permits. 429,534 Increase in Transit Plus contractor fees. 315,177 Increase in utilities. 206,289 Decrease in bus parts. (2,429,204)Decrease in transfer to Transit Bus Replacement Reserve. (1,437,212)Miscellaneous adjustments. 343,063
$ 10,462,106 Variance. $ -
Retained earnings unaudited balance at December 31, 2018 is $20.733 million.
Preliminary 2019 Budget - Appendices 3-17
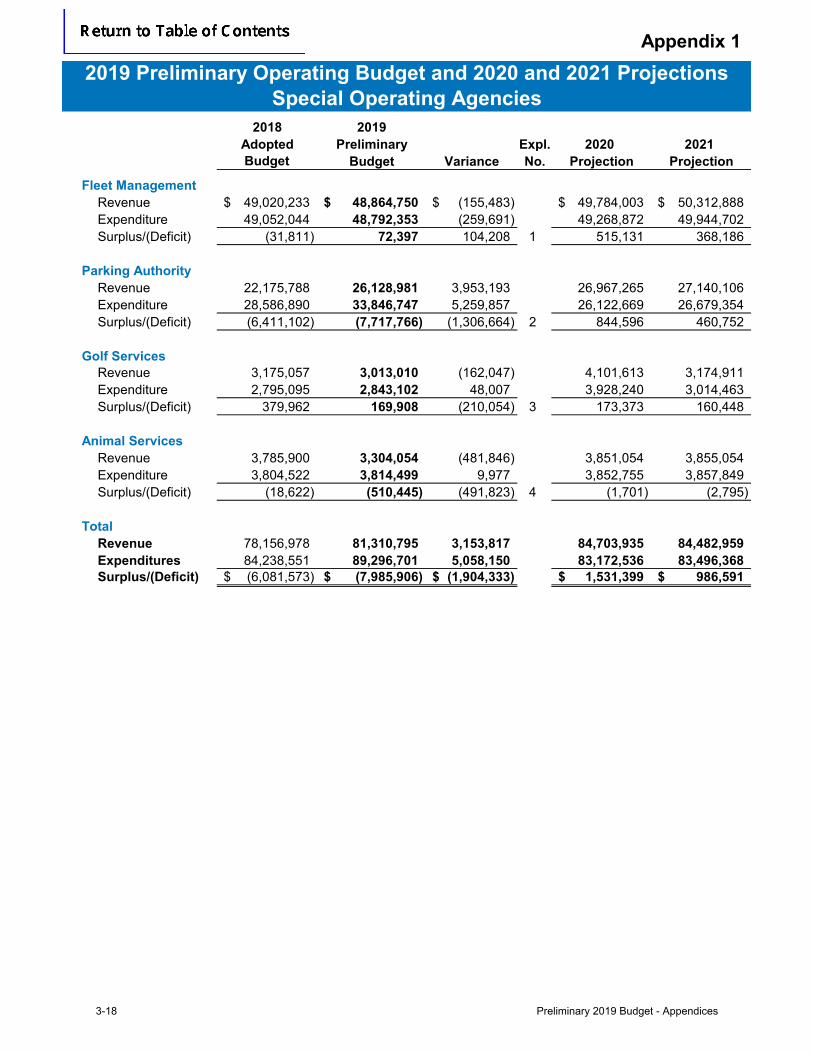
Appendix 1
2018 2019Adopted Preliminary Expl. 2020 2021Budget Budget Variance No. Projection Projection
Fleet ManagementRevenue 49,020,233$ 48,864,750$ (155,483)$ 49,784,003$ 50,312,888$ Expenditure 49,052,044 48,792,353 (259,691) 49,268,872 49,944,702 Surplus/(Deficit) (31,811) 72,397 104,208 1 515,131 368,186
Parking AuthorityRevenue 22,175,788 26,128,981 3,953,193 26,967,265 27,140,106 Expenditure 28,586,890 33,846,747 5,259,857 26,122,669 26,679,354 Surplus/(Deficit) (6,411,102) (7,717,766) (1,306,664) 2 844,596 460,752
Golf ServicesRevenue 3,175,057 3,013,010 (162,047) 4,101,613 3,174,911 Expenditure 2,795,095 2,843,102 48,007 3,928,240 3,014,463 Surplus/(Deficit) 379,962 169,908 (210,054) 3 173,373 160,448
Animal ServicesRevenue 3,785,900 3,304,054 (481,846) 3,851,054 3,855,054 Expenditure 3,804,522 3,814,499 9,977 3,852,755 3,857,849 Surplus/(Deficit) (18,622) (510,445) (491,823) 4 (1,701) (2,795)
TotalRevenue 78,156,978 81,310,795 3,153,817 84,703,935 84,482,959 Expenditures 84,238,551 89,296,701 5,058,150 83,172,536 83,496,368 Surplus/(Deficit) (6,081,573)$ (7,985,906)$ (1,904,333)$ 1,531,399$ 986,591$
Special Operating Agencies2019 Preliminary Operating Budget and 2020 and 2021 Projections
3-18 Preliminary 2019 Budget - Appendices
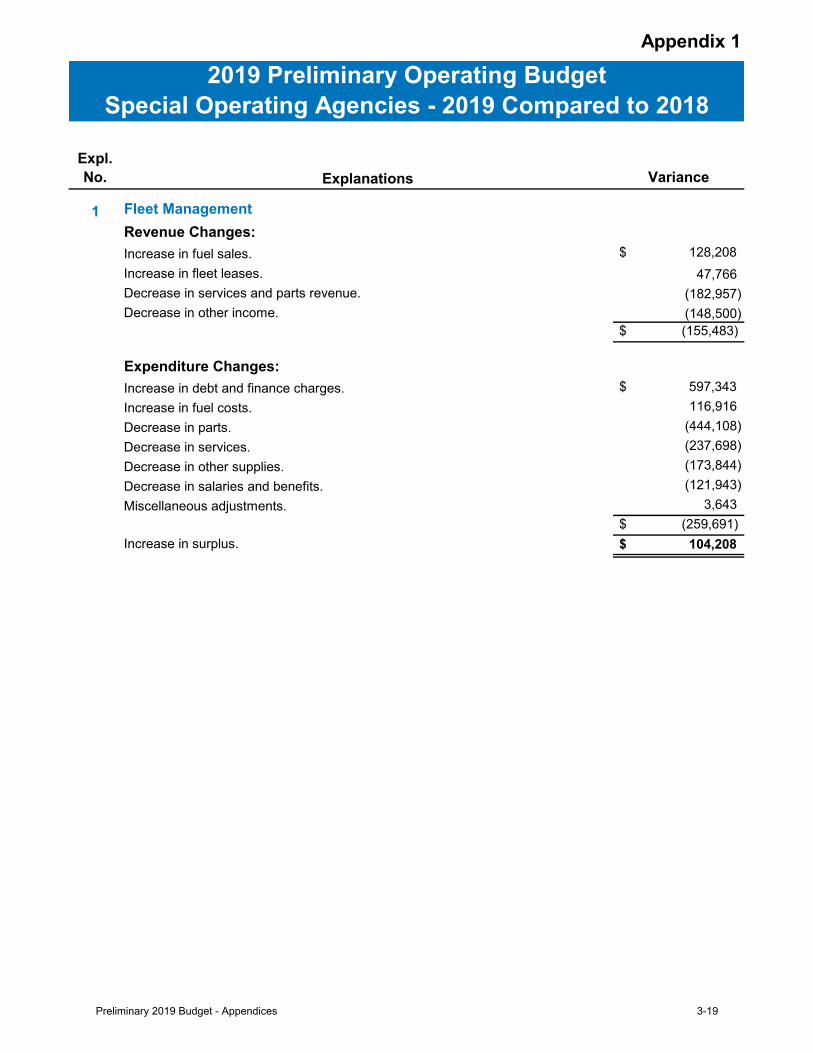
Appendix 1
Expl.No. Explanations Variance
1 Fleet ManagementRevenue Changes:Increase in fuel sales. $ 128,208 Increase in fleet leases. 47,766Decrease in services and parts revenue. (182,957)Decrease in other income. (148,500)
$ (155,483)
Expenditure Changes:Increase in debt and finance charges. $ 597,343 Increase in fuel costs. 116,916Decrease in parts. (444,108)Decrease in services. (237,698)Decrease in other supplies. (173,844)Decrease in salaries and benefits. (121,943)Miscellaneous adjustments. 3,643
$ (259,691)Increase in surplus. $ 104,208
2019 Preliminary Operating BudgetSpecial Operating Agencies - 2019 Compared to 2018
Preliminary 2019 Budget - Appendices 3-19
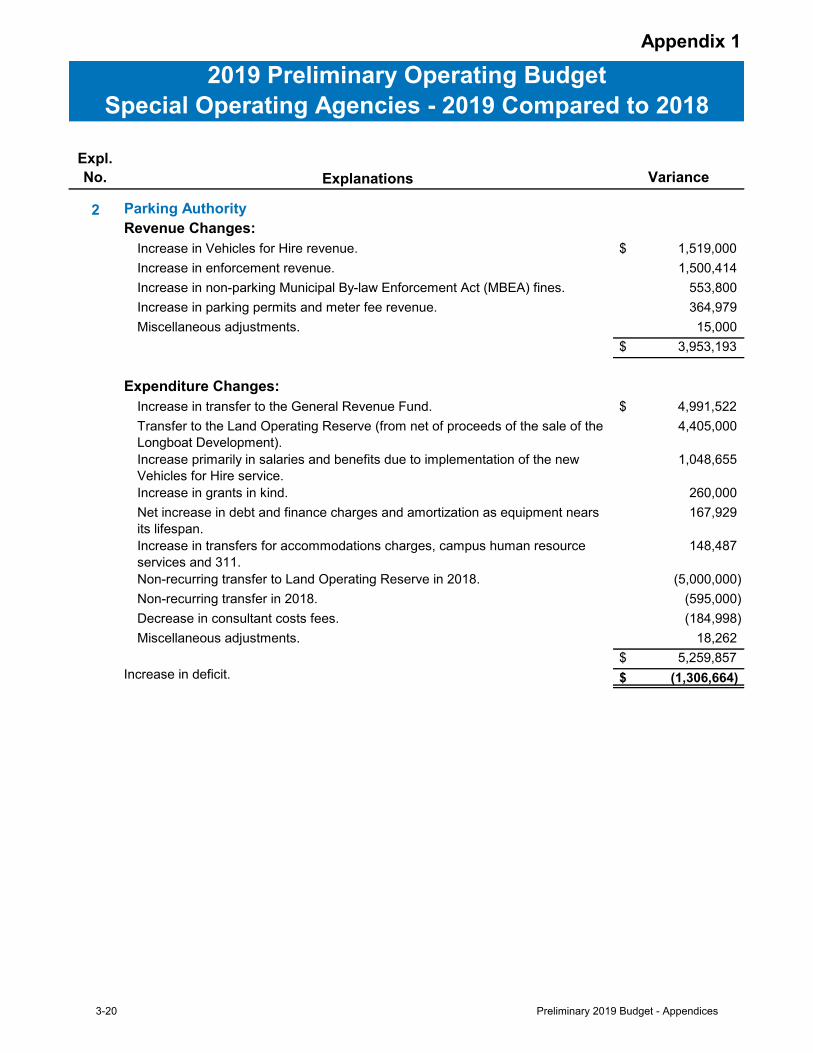
Appendix 1
Expl.No. Explanations Variance
2019 Preliminary Operating BudgetSpecial Operating Agencies - 2019 Compared to 2018
2 Parking AuthorityRevenue Changes:
Increase in Vehicles for Hire revenue. $ 1,519,000 Increase in enforcement revenue. 1,500,414Increase in non-parking Municipal By-law Enforcement Act (MBEA) fines. 553,800Increase in parking permits and meter fee revenue. 364,979Miscellaneous adjustments. 15,000
$ 3,953,193
Expenditure Changes:Increase in transfer to the General Revenue Fund. $ 4,991,522 Transfer to the Land Operating Reserve (from net of proceeds of the sale of the Longboat Development).
4,405,000
Increase primarily in salaries and benefits due to implementation of the new Vehicles for Hire service.
1,048,655
Increase in grants in kind. 260,000Net increase in debt and finance charges and amortization as equipment nears its lifespan.
167,929
Increase in transfers for accommodations charges, campus human resource services and 311.
148,487
Non-recurring transfer to Land Operating Reserve in 2018. (5,000,000)Non-recurring transfer in 2018. (595,000)Decrease in consultant costs fees. (184,998)Miscellaneous adjustments. 18,262
$ 5,259,857 Increase in deficit. $ (1,306,664)
3-20 Preliminary 2019 Budget - Appendices

Appendix 1
Expl.No. Explanations Variance
2019 Preliminary Operating BudgetSpecial Operating Agencies - 2019 Compared to 2018
3 Golf ServicesRevenue Changes:
Decrease in green fee revenue. $ (127,561)Miscellaneous adjustments. (34,486)
$ (162,047)
Expenditure Changes:Increase in materials, parts and supplies. $ 53,289 Miscellaneous adjustments. (5,282)
$ 48,007 Decrease in surplus. $ (210,054)
4 Animal ServicesRevenue Changes:
Increase in regulation revenue. $ 36,881 Decrease in transfer from General Revenue Fund. (524,177)Miscellaneous adjustments. 5,450
$ (481,846)
Expenditure Changes:Net operational cost increases. $ 9,977
Increase in deficit. $ (491,823)
Preliminary 2019 Budget - Appendices 3-21

3-22 Preliminary 2019 Budget - Appendices
Appendix 2
Are grants / payments to organizations which provide demonstrable cultural, social or economic benefit to the community and where the City does not receive any goods or services directly in return for the funds (with the exception of community partnerships) nor do they expect repayment or any other financial return. Eligibility and entitlement requirements are reviewed annually.
Are grants / payments to entities where the City of Winnipeg has long-term contractual arrangements in place or the nature of the arrangement is long-term.
Are primarily grant programs where recipients are determined throughout the course of the year. With the exception of the per capita grants, the Director of the department responsible for each such grant program is delegated the authority to determine grant recipients.
Other Programs:
The listing of Grants / Payments is not inclusive of all City of Winnipeg grants (e.g. grants from reserves authorized through separate reports, various value-in-kind grants, etc).
2019 Preliminary Operating BudgetListing of Grants/Payments
Grants included in this appendix are broken into three categories, as follows:
Annual Grant Agreements:
Multi-Year Arrangements:
Preliminary 2019 Budget - Appendices 3-23
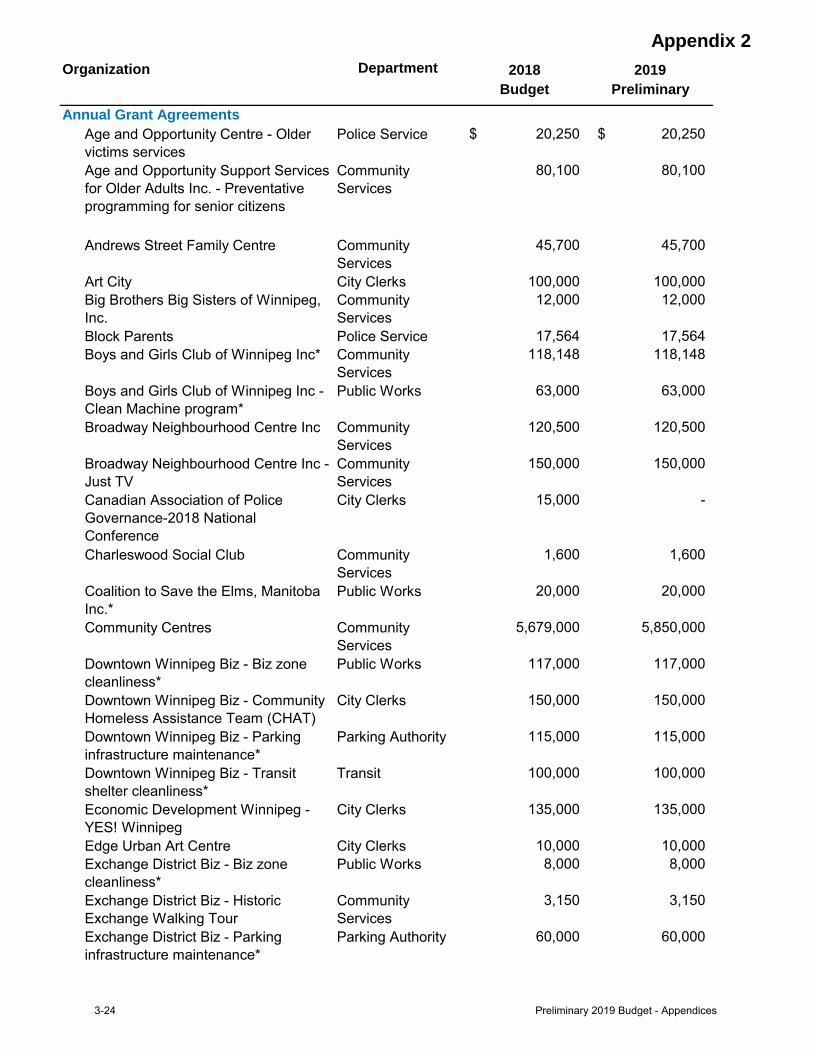
Appendix 2Department 2018 2019
Budget PreliminaryAnnual Grant Agreements
Age and Opportunity Centre - Older victims services
Police Service 20,250$ 20,250$
Age and Opportunity Support Services for Older Adults Inc. - Preventative programming for senior citizens
Community Services
80,100 80,100
Andrews Street Family Centre Community Services
45,700 45,700
Art City City Clerks 100,000 100,000 Big Brothers Big Sisters of Winnipeg, Inc.
Community Services
12,000 12,000
Block Parents Police Service 17,564 17,564 Boys and Girls Club of Winnipeg Inc* Community
Services 118,148 118,148
Boys and Girls Club of Winnipeg Inc - Clean Machine program*
Public Works 63,000 63,000
Broadway Neighbourhood Centre Inc Community Services
120,500 120,500
Broadway Neighbourhood Centre Inc - Just TV
Community Services
150,000 150,000
Canadian Association of Police Governance-2018 National Conference
City Clerks 15,000 -
Charleswood Social Club Community Services
1,600 1,600
Coalition to Save the Elms, Manitoba Inc.*
Public Works 20,000 20,000
Community Centres Community Services
5,679,000 5,850,000
Downtown Winnipeg Biz - Biz zone cleanliness*
Public Works 117,000 117,000
Downtown Winnipeg Biz - Community Homeless Assistance Team (CHAT)
City Clerks 150,000 150,000
Downtown Winnipeg Biz - Parking infrastructure maintenance*
Parking Authority 115,000 115,000
Downtown Winnipeg Biz - Transit shelter cleanliness*
Transit 100,000 100,000
Economic Development Winnipeg - YES! Winnipeg
City Clerks 135,000 135,000
Edge Urban Art Centre City Clerks 10,000 10,000 Exchange District Biz - Biz zone cleanliness*
Public Works 8,000 8,000
Exchange District Biz - Historic Exchange Walking Tour
Community Services
3,150 3,150
Exchange District Biz - Parking infrastructure maintenance*
Parking Authority 60,000 60,000
Organization
3-24 Preliminary 2019 Budget - Appendices
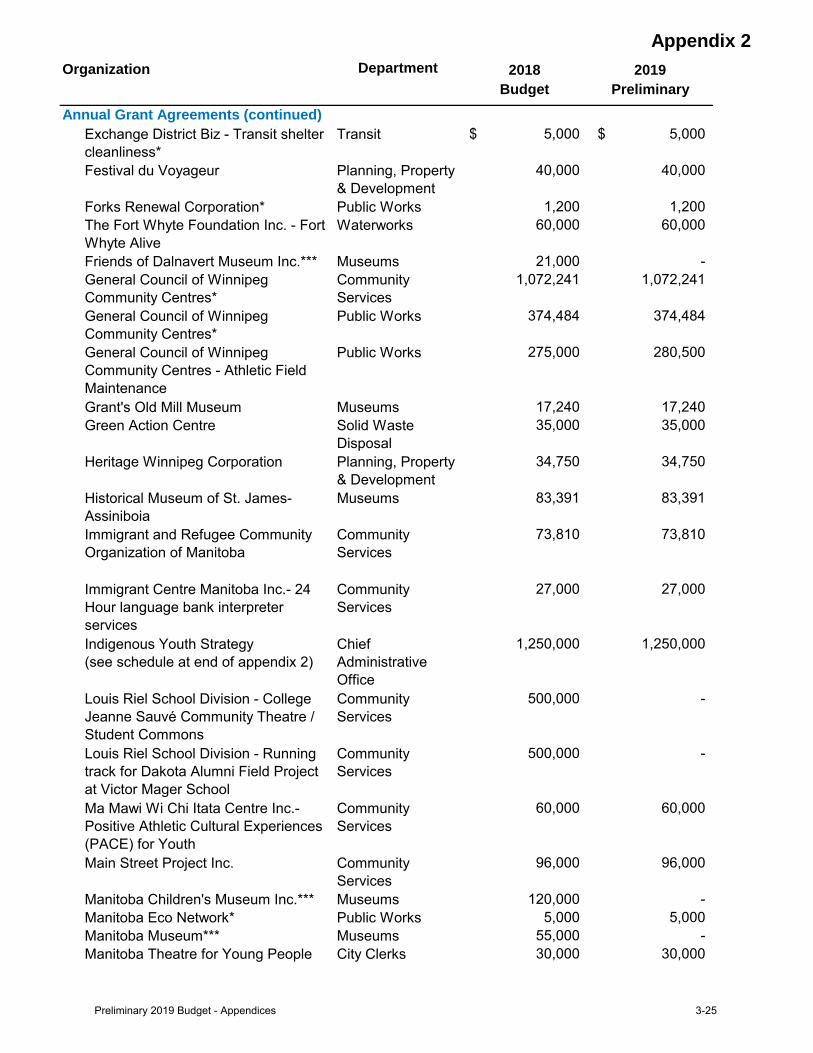
Appendix 2Department 2018 2019
Budget PreliminaryOrganization
Annual Grant Agreements (continued)Exchange District Biz - Transit shelter cleanliness*
Transit 5,000$ 5,000$
Festival du Voyageur Planning, Property & Development
40,000 40,000
Forks Renewal Corporation* Public Works 1,200 1,200 The Fort Whyte Foundation Inc. - Fort Whyte Alive
Waterworks 60,000 60,000
Friends of Dalnavert Museum Inc.*** Museums 21,000 - General Council of Winnipeg Community Centres*
Community Services
1,072,241 1,072,241
General Council of Winnipeg Community Centres*
Public Works 374,484 374,484
General Council of Winnipeg Community Centres - Athletic Field Maintenance
Public Works 275,000 280,500
Grant's Old Mill Museum Museums 17,240 17,240 Green Action Centre Solid Waste
Disposal35,000 35,000
Heritage Winnipeg Corporation Planning, Property & Development
34,750 34,750
Historical Museum of St. James-Assiniboia
Museums 83,391 83,391
Immigrant and Refugee Community Organization of Manitoba
Community Services
73,810 73,810
Immigrant Centre Manitoba Inc.- 24 Hour language bank interpreter services
Community Services
27,000 27,000
Indigenous Youth Strategy(see schedule at end of appendix 2)
Chief Administrative Office
1,250,000 1,250,000
Louis Riel School Division - College Jeanne Sauvé Community Theatre / Student Commons
Community Services
500,000 -
Louis Riel School Division - Running track for Dakota Alumni Field Project at Victor Mager School
Community Services
500,000 -
Ma Mawi Wi Chi Itata Centre Inc.-Positive Athletic Cultural Experiences (PACE) for Youth
Community Services
60,000 60,000
Main Street Project Inc. Community Services
96,000 96,000
Manitoba Children's Museum Inc.*** Museums 120,000 - Manitoba Eco Network* Public Works 5,000 5,000 Manitoba Museum*** Museums 55,000 - Manitoba Theatre for Young People City Clerks 30,000 30,000
Preliminary 2019 Budget - Appendices 3-25
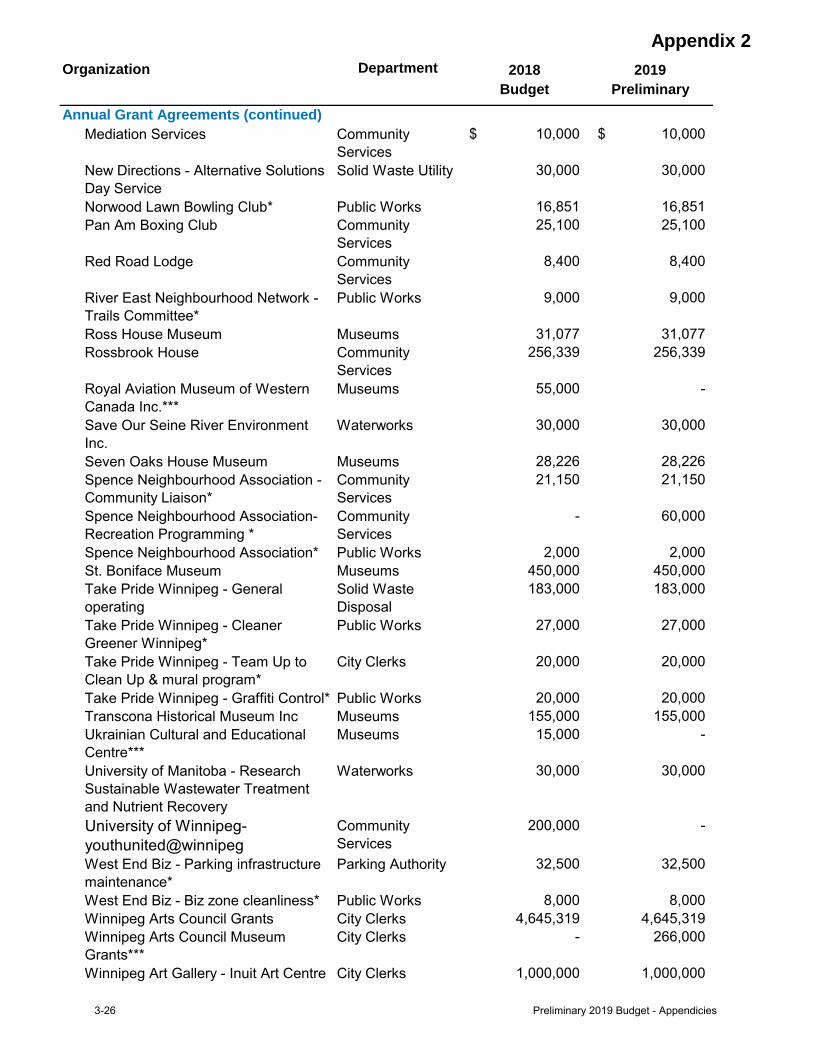
Appendix 2Department 2018 2019
Budget PreliminaryOrganization
Annual Grant Agreements (continued)Mediation Services Community
Services10,000$ 10,000$
New Directions - Alternative Solutions Day Service
Solid Waste Utility 30,000 30,000
Norwood Lawn Bowling Club* Public Works 16,851 16,851 Pan Am Boxing Club Community
Services25,100 25,100
Red Road Lodge Community Services
8,400 8,400
River East Neighbourhood Network - Trails Committee*
Public Works 9,000 9,000
Ross House Museum Museums 31,077 31,077 Rossbrook House Community
Services256,339 256,339
Royal Aviation Museum of Western Canada Inc.***
Museums 55,000 -
Save Our Seine River Environment Inc.
Waterworks 30,000 30,000
Seven Oaks House Museum Museums 28,226 28,226 Spence Neighbourhood Association - Community Liaison*
Community Services
21,150 21,150
Spence Neighbourhood Association- Recreation Programming *
Community Services
- 60,000
Spence Neighbourhood Association* Public Works 2,000 2,000 St. Boniface Museum Museums 450,000 450,000 Take Pride Winnipeg - General operating
Solid Waste Disposal
183,000 183,000
Take Pride Winnipeg - Cleaner Greener Winnipeg*
Public Works 27,000 27,000
Take Pride Winnipeg - Team Up to Clean Up & mural program*
City Clerks 20,000 20,000
Take Pride Winnipeg - Graffiti Control* Public Works 20,000 20,000 Transcona Historical Museum Inc Museums 155,000 155,000 Ukrainian Cultural and Educational Centre***
Museums 15,000 -
University of Manitoba - Research Sustainable Wastewater Treatment and Nutrient Recovery
Waterworks 30,000 30,000
University of Winnipeg- youthunited@winnipeg
Community Services
200,000 -
West End Biz - Parking infrastructure maintenance*
Parking Authority 32,500 32,500
West End Biz - Biz zone cleanliness* Public Works 8,000 8,000 Winnipeg Arts Council Grants City Clerks 4,645,319 4,645,319 Winnipeg Arts Council Museum Grants***
City Clerks - 266,000
Winnipeg Art Gallery - Inuit Art Centre City Clerks 1,000,000 1,000,000
3-26 Preliminary 2019 Budget - Appendicies
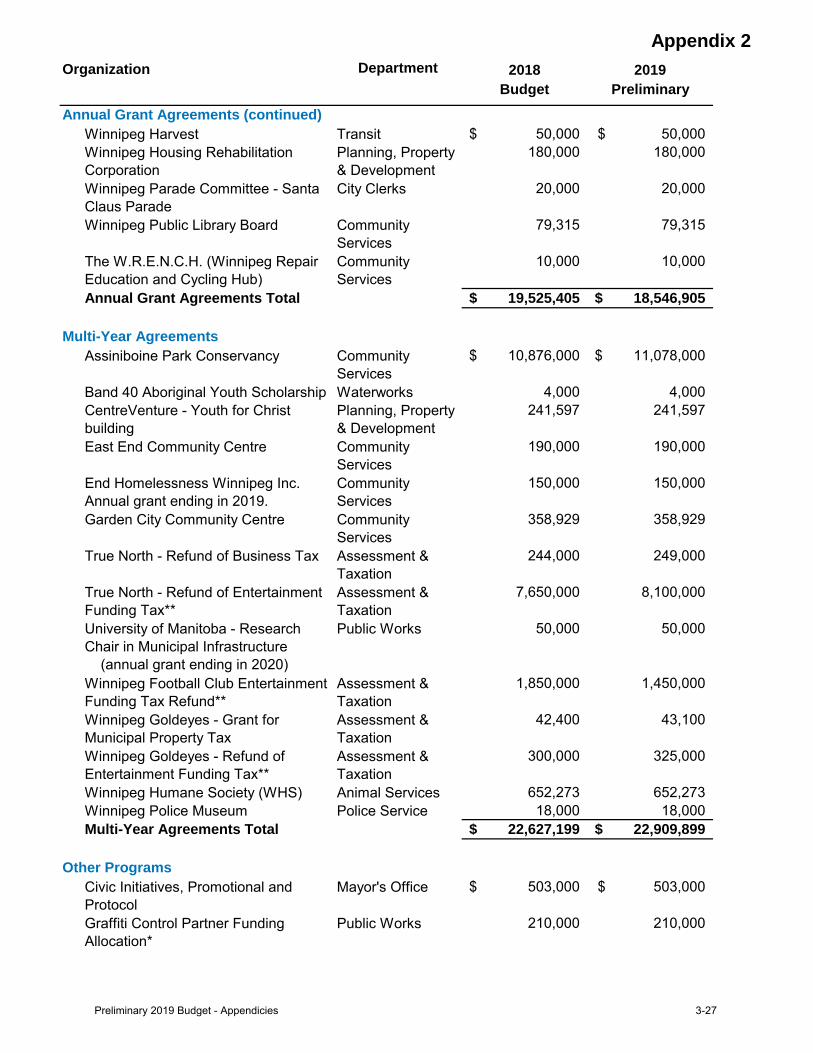
Appendix 2Department 2018 2019
Budget PreliminaryOrganization
Annual Grant Agreements (continued)Winnipeg Harvest Transit 50,000$ 50,000$ Winnipeg Housing Rehabilitation Corporation
Planning, Property & Development
180,000 180,000
Winnipeg Parade Committee - Santa Claus Parade
City Clerks 20,000 20,000
Winnipeg Public Library Board Community Services
79,315 79,315
The W.R.E.N.C.H. (Winnipeg Repair Education and Cycling Hub)
Community Services
10,000 10,000
Annual Grant Agreements Total 19,525,405$ 18,546,905$
Multi-Year AgreementsAssiniboine Park Conservancy Community
Services10,876,000$ 11,078,000$
Band 40 Aboriginal Youth Scholarship Waterworks 4,000 4,000 CentreVenture - Youth for Christ building
Planning, Property & Development
241,597 241,597
East End Community Centre Community Services
190,000 190,000
End Homelessness Winnipeg Inc. Annual grant ending in 2019.
Community Services
150,000 150,000
Garden City Community Centre Community Services
358,929 358,929
True North - Refund of Business Tax Assessment & Taxation
244,000 249,000
True North - Refund of Entertainment Funding Tax**
Assessment & Taxation
7,650,000 8,100,000
University of Manitoba - Research Chair in Municipal Infrastructure (annual grant ending in 2020)
Public Works 50,000 50,000
Winnipeg Football Club Entertainment Funding Tax Refund**
Assessment & Taxation
1,850,000 1,450,000
Winnipeg Goldeyes - Grant for Municipal Property Tax
Assessment & Taxation
42,400 43,100
Winnipeg Goldeyes - Refund of Entertainment Funding Tax**
Assessment & Taxation
300,000 325,000
Winnipeg Humane Society (WHS) Animal Services 652,273 652,273 Winnipeg Police Museum Police Service 18,000 18,000 Multi-Year Agreements Total 22,627,199$ 22,909,899$
Other ProgramsCivic Initiatives, Promotional and Protocol
Mayor's Office 503,000$ 503,000$
Graffiti Control Partner Funding Allocation*
Public Works 210,000 210,000
Preliminary 2019 Budget - Appendicies 3-27
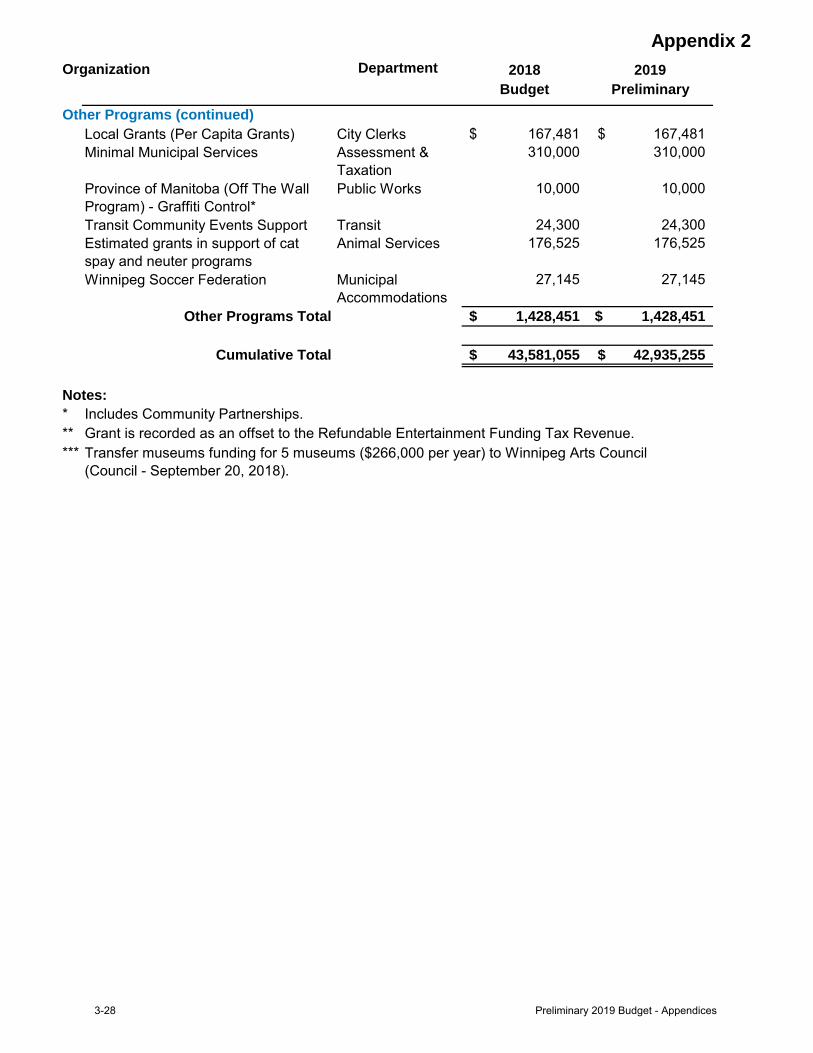
Appendix 2Department 2018 2019
Budget PreliminaryOrganization
Other Programs (continued)Local Grants (Per Capita Grants) City Clerks 167,481$ 167,481$ Minimal Municipal Services Assessment &
Taxation310,000 310,000
Province of Manitoba (Off The Wall Program) - Graffiti Control*
Public Works 10,000 10,000
Transit Community Events Support Transit 24,300 24,300 Estimated grants in support of cat spay and neuter programs
Animal Services 176,525 176,525
Winnipeg Soccer Federation Municipal Accommodations
27,145 27,145
Other Programs Total 1,428,451$ 1,428,451$
Cumulative Total 43,581,055$ 42,935,255$
Notes:* Includes Community Partnerships.** Grant is recorded as an offset to the Refundable Entertainment Funding Tax Revenue.*** Transfer museums funding for 5 museums ($266,000 per year) to Winnipeg Arts Council
(Council - September 20, 2018).
3-28 Preliminary 2019 Budget - Appendices
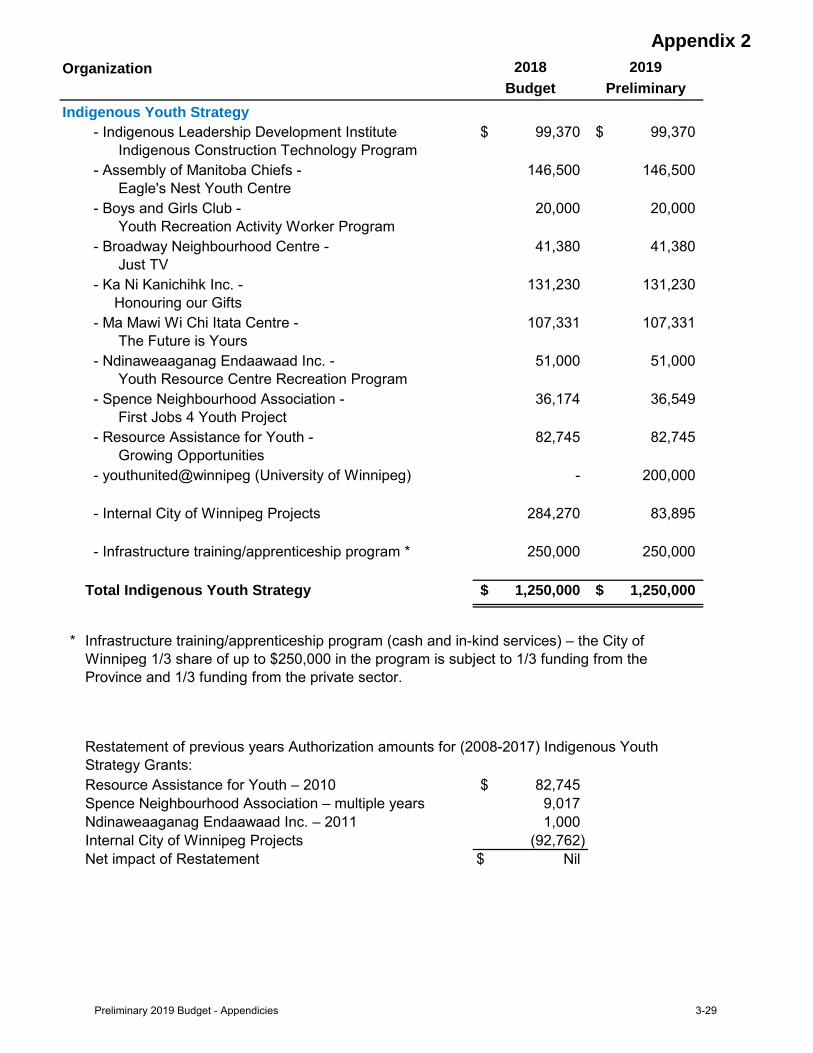
Appendix 22018 2019
Budget PreliminaryIndigenous Youth Strategy
- Indigenous Leadership Development Institute Indigenous Construction Technology Program
99,370$ 99,370$
- Assembly of Manitoba Chiefs - Eagle's Nest Youth Centre
146,500 146,500
- Boys and Girls Club - Youth Recreation Activity Worker Program
20,000 20,000
- Broadway Neighbourhood Centre - Just TV
41,380 41,380
- Ka Ni Kanichihk Inc. - Honouring our Gifts
131,230 131,230
- Ma Mawi Wi Chi Itata Centre - The Future is Yours
107,331 107,331
- Ndinaweaaganag Endaawaad Inc. - Youth Resource Centre Recreation Program
51,000 51,000
- Spence Neighbourhood Association - First Jobs 4 Youth Project
36,174 36,549
- Resource Assistance for Youth - Growing Opportunities
82,745 82,745
- youthunited@winnipeg (University of Winnipeg) - 200,000
- Internal City of Winnipeg Projects 284,270 83,895
- Infrastructure training/apprenticeship program * 250,000 250,000
Total Indigenous Youth Strategy 1,250,000$ 1,250,000$
*
82,745$ 9,017 1,000
(92,762) $ NilNet impact of Restatement
Organization
Infrastructure training/apprenticeship program (cash and in-kind services) – the City of Winnipeg 1/3 share of up to $250,000 in the program is subject to 1/3 funding from the Province and 1/3 funding from the private sector.
Restatement of previous years Authorization amounts for (2008-2017) Indigenous Youth Strategy Grants:Resource Assistance for Youth – 2010Spence Neighbourhood Association – multiple yearsNdinaweaaganag Endaawaad Inc. – 2011Internal City of Winnipeg Projects
Preliminary 2019 Budget - Appendicies 3-29

3-30 Preliminary 2019 Budget - Appendices
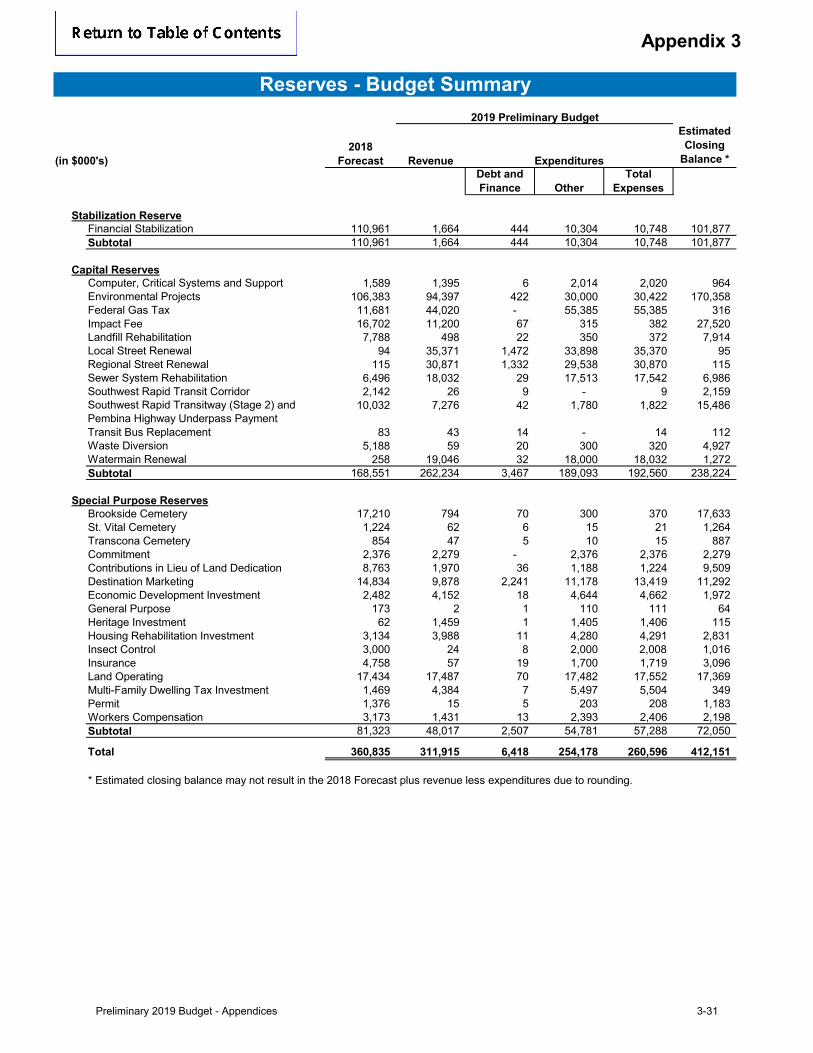
Appendix 3
2019 Preliminary Budget
(in $000's)2018
Forecast Revenue
EstimatedClosing
Balance *Debt and Finance Other
Total Expenses
Stabilization ReserveFinancial Stabilization 110,961 1,664 444 10,304 10,748 101,877 Subtotal 110,961 1,664 444 10,304 10,748 101,877
Capital ReservesComputer, Critical Systems and Support 1,589 1,395 6 2,014 2,020 964 Environmental Projects 106,383 94,397 422 30,000 30,422 170,358 Federal Gas Tax 11,681 44,020 - 55,385 55,385 316 Impact Fee 16,702 11,200 67 315 382 27,520 Landfill Rehabilitation 7,788 498 22 350 372 7,914 Local Street Renewal 94 35,371 1,472 33,898 35,370 95 Regional Street Renewal 115 30,871 1,332 29,538 30,870 115 Sewer System Rehabilitation 6,496 18,032 29 17,513 17,542 6,986 Southwest Rapid Transit Corridor 2,142 26 9 - 9 2,159 Southwest Rapid Transitway (Stage 2) and Pembina Highway Underpass Payment
10,032 7,276 42 1,780 1,822 15,486
Transit Bus Replacement 83 43 14 - 14 112 Waste Diversion 5,188 59 20 300 320 4,927 Watermain Renewal 258 19,046 32 18,000 18,032 1,272 Subtotal 168,551 262,234 3,467 189,093 192,560 238,224
Special Purpose ReservesBrookside Cemetery 17,210 794 70 300 370 17,633 St. Vital Cemetery 1,224 62 6 15 21 1,264 Transcona Cemetery 854 47 5 10 15 887 Commitment 2,376 2,279 - 2,376 2,376 2,279 Contributions in Lieu of Land Dedication 8,763 1,970 36 1,188 1,224 9,509 Destination Marketing 14,834 9,878 2,241 11,178 13,419 11,292 Economic Development Investment 2,482 4,152 18 4,644 4,662 1,972 General Purpose 173 2 1 110 111 64 Heritage Investment 62 1,459 1 1,405 1,406 115 Housing Rehabilitation Investment 3,134 3,988 11 4,280 4,291 2,831 Insect Control 3,000 24 8 2,000 2,008 1,016Insurance 4,758 57 19 1,700 1,719 3,096 Land Operating 17,434 17,487 70 17,482 17,552 17,369 Multi-Family Dwelling Tax Investment 1,469 4,384 7 5,497 5,504 349 Permit 1,376 15 5 203 208 1,183 Workers Compensation 3,173 1,431 13 2,393 2,406 2,198 Subtotal 81,323 48,017 2,507 54,781 57,288 72,050
Total 360,835 311,915 6,418 254,178 260,596 412,151
* Estimated closing balance may not result in the 2018 Forecast plus revenue less expenditures due to rounding.
Expenditures
Reserves - Budget Summary
Preliminary 2019 Budget - Appendices 3-31

3-32 Preliminary 2019 Budget - Appendices
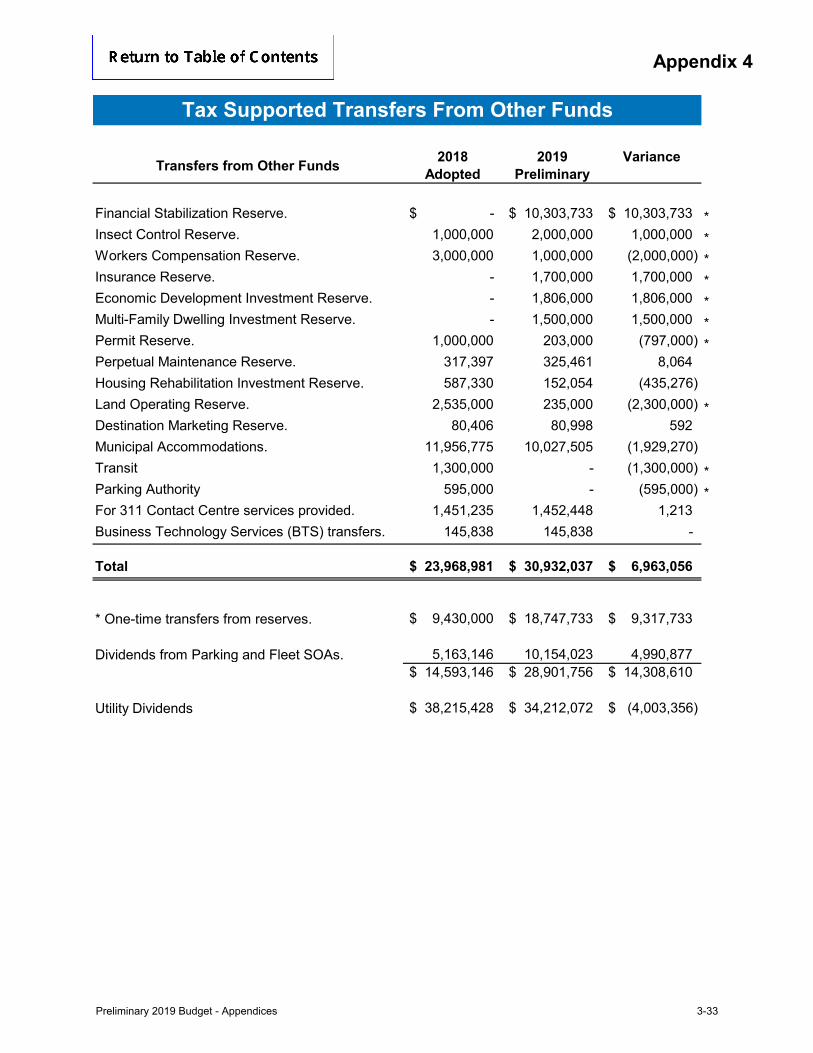
Appendix 4
Transfers from Other Funds 2018 Adopted
2019 Preliminary
Variance
Financial Stabilization Reserve. $ - $ 10,303,733 $ 10,303,733 *Insect Control Reserve. 1,000,000 2,000,000 1,000,000 *Workers Compensation Reserve. 3,000,000 1,000,000 (2,000,000) *Insurance Reserve. - 1,700,000 1,700,000 *Economic Development Investment Reserve. - 1,806,000 1,806,000 *Multi-Family Dwelling Investment Reserve. - 1,500,000 1,500,000 *Permit Reserve. 1,000,000 203,000 (797,000) *Perpetual Maintenance Reserve. 317,397 325,461 8,064 Housing Rehabilitation Investment Reserve. 587,330 152,054 (435,276)Land Operating Reserve. 2,535,000 235,000 (2,300,000) *Destination Marketing Reserve. 80,406 80,998 592 Municipal Accommodations. 11,956,775 10,027,505 (1,929,270)Transit 1,300,000 - (1,300,000) *Parking Authority 595,000 - (595,000) *For 311 Contact Centre services provided. 1,451,235 1,452,448 1,213 Business Technology Services (BTS) transfers. 145,838 145,838 -
Total $ 23,968,981 $ 30,932,037 $ 6,963,056
* One-time transfers from reserves. $ 9,430,000 $ 18,747,733 $ 9,317,733
Dividends from Parking and Fleet SOAs. 5,163,146 10,154,023 4,990,877 $ 14,593,146 $ 28,901,756 $ 14,308,610
Utility Dividends $ 38,215,428 $ 34,212,072 $ (4,003,356)
Tax Supported Transfers From Other Funds
Preliminary 2019 Budget - Appendices 3-33

3-34 Preliminary 2019 Budget - Appendices
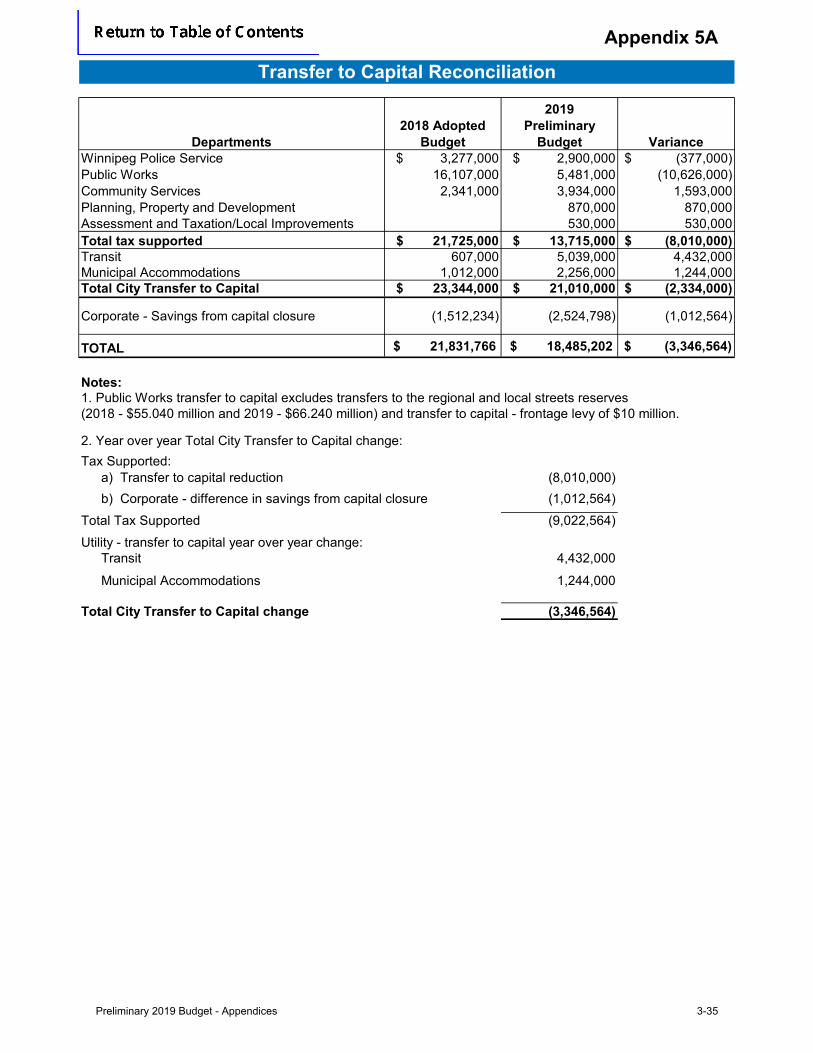
Departments2018 Adopted
Budget
2019Preliminary
Budget VarianceWinnipeg Police Service $ 3,277,000 $ 2,900,000 $ (377,000)Public Works 16,107,000 5,481,000 (10,626,000)Community Services 2,341,000 3,934,000 1,593,000 Planning, Property and Development 870,000 870,000 Assessment and Taxation/Local Improvements 530,000 530,000 Total tax supported $ 21,725,000 $ 13,715,000 $ (8,010,000)Transit 607,000 5,039,000 4,432,000 Municipal Accommodations 1,012,000 2,256,000 1,244,000 Total City Transfer to Capital $ 23,344,000 $ 21,010,000 $ (2,334,000)
Corporate - Savings from capital closure (1,512,234) (2,524,798) (1,012,564)
TOTAL $ 21,831,766 $ 18,485,202 $ (3,346,564)
Notes:
Tax Supported:a) Transfer to capital reduction (8,010,000)
(1,012,564)
Total Tax Supported (9,022,564)
Utility - transfer to capital year over year change:Transit 4,432,000
Municipal Accommodations 1,244,000
(3,346,564)Total City Transfer to Capital change
2. Year over year Total City Transfer to Capital change:
Transfer to Capital Reconciliation
1. Public Works transfer to capital excludes transfers to the regional and local streets reserves (2018 - $55.040 million and 2019 - $66.240 million) and transfer to capital - frontage levy of $10 million.
b) Corporate - difference in savings from capital closure
Appendix 5A
Preliminary 2019 Budget - Appendices 3-35
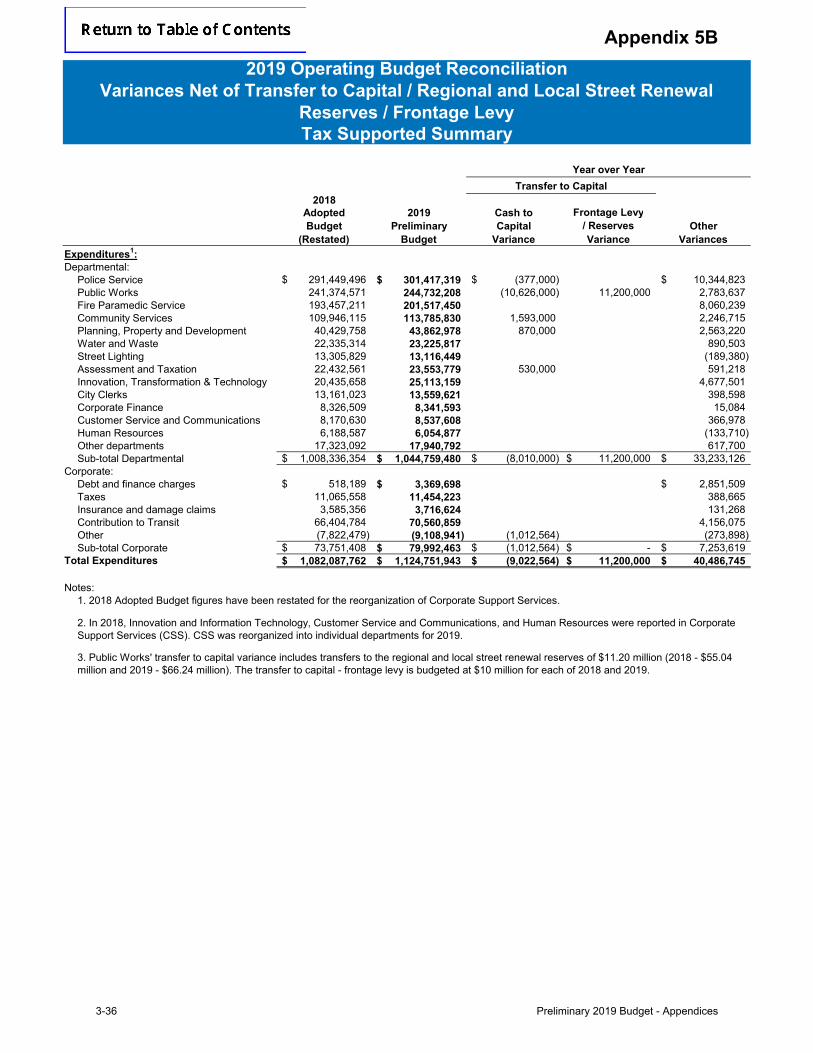
2018Adopted 2019 Cash to Frontage LevyBudget Preliminary Capital / Reserves Other
(Restated) Budget Variance Variance Variances
Expenditures1:Departmental:
Police Service 291,449,496$ 301,417,319$ (377,000)$ 10,344,823$ Public Works 241,374,571 244,732,208 (10,626,000) 11,200,000 2,783,637 Fire Paramedic Service 193,457,211 201,517,450 - 8,060,239 Community Services 109,946,115 113,785,830 1,593,000 2,246,715 Planning, Property and Development 40,429,758 43,862,978 870,000 2,563,220 Water and Waste 22,335,314 23,225,817 890,503 Street Lighting 13,305,829 13,116,449 (189,380) Assessment and Taxation 22,432,561 23,553,779 530,000 591,218 Innovation, Transformation & Technology 20,435,658 25,113,159 4,677,501 City Clerks 13,161,023 13,559,621 - 398,598 Corporate Finance 8,326,509 8,341,593 15,084 Customer Service and Communications 8,170,630 8,537,608 366,978 Human Resources 6,188,587 6,054,877 (133,710) Other departments 17,323,092 17,940,792 617,700 Sub-total Departmental 1,008,336,354$ 1,044,759,480$ (8,010,000)$ 11,200,000$ 33,233,126$
Corporate:Debt and finance charges 518,189$ 3,369,698$ 2,851,509$ Taxes 11,065,558 11,454,223 388,665 Insurance and damage claims 3,585,356 3,716,624 131,268 Contribution to Transit 66,404,784 70,560,859 4,156,075 Other (7,822,479) (9,108,941) (1,012,564) (273,898) Sub-total Corporate 73,751,408$ 79,992,463$ (1,012,564)$ -$ 7,253,619$
Total Expenditures 1,082,087,762$ 1,124,751,943$ (9,022,564)$ 11,200,000$ 40,486,745$
2. In 2018, Innovation and Information Technology, Customer Service and Communications, and Human Resources were reported in Corporate Support Services (CSS). CSS was reorganized into individual departments for 2019.
3. Public Works' transfer to capital variance includes transfers to the regional and local street renewal reserves of $11.20 million (2018 - $55.04 million and 2019 - $66.24 million). The transfer to capital - frontage levy is budgeted at $10 million for each of 2018 and 2019.
2019 Operating Budget ReconciliationVariances Net of Transfer to Capital / Regional and Local Street Renewal
Reserves / Frontage LevyTax Supported Summary
Notes:
Transfer to Capital
Year over Year
1. 2018 Adopted Budget figures have been restated for the reorganization of Corporate Support Services.
Appendix 5B
3-36 Preliminary 2019 Budget - Appendices
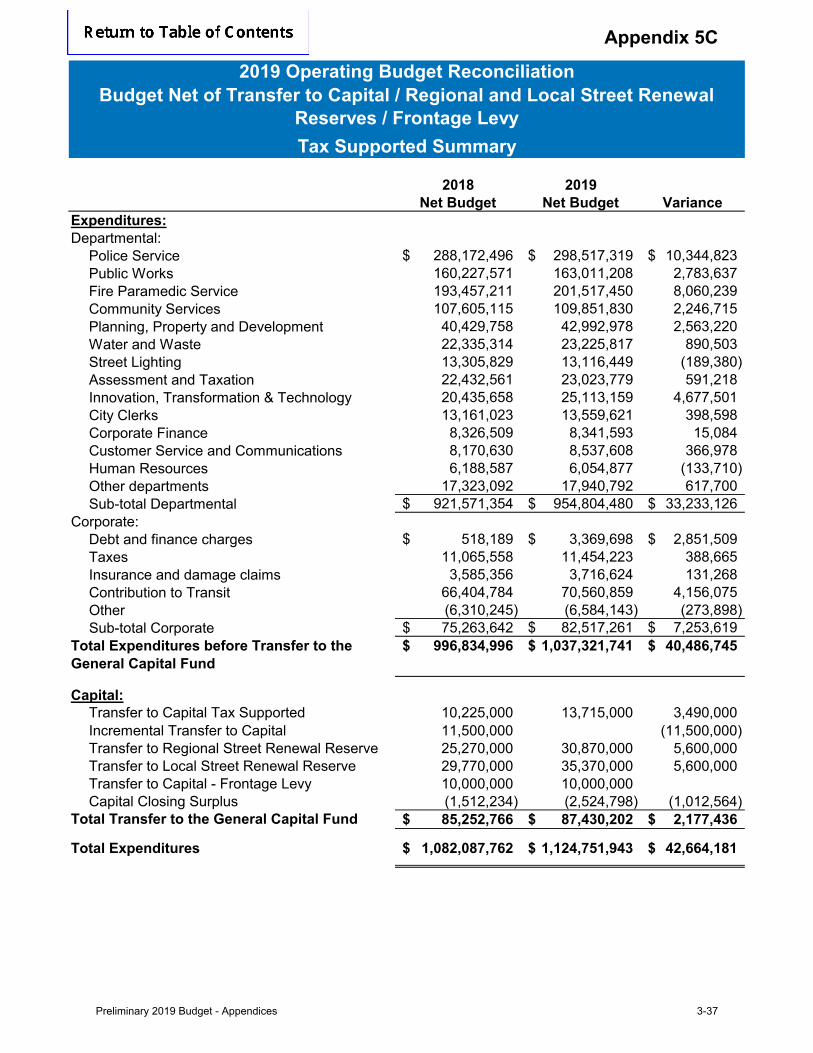
2018 2019Net Budget Net Budget Variance
Expenditures:Departmental:
Police Service 288,172,496$ 298,517,319$ 10,344,823$ Public Works 160,227,571 163,011,208 2,783,637 Fire Paramedic Service 193,457,211 201,517,450 8,060,239 Community Services 107,605,115 109,851,830 2,246,715 Planning, Property and Development 40,429,758 42,992,978 2,563,220 Water and Waste 22,335,314 23,225,817 890,503 Street Lighting 13,305,829 13,116,449 (189,380) Assessment and Taxation 22,432,561 23,023,779 591,218 Innovation, Transformation & Technology 20,435,658 25,113,159 4,677,501 City Clerks 13,161,023 13,559,621 398,598 Corporate Finance 8,326,509 8,341,593 15,084 Customer Service and Communications 8,170,630 8,537,608 366,978 Human Resources 6,188,587 6,054,877 (133,710) Other departments 17,323,092 17,940,792 617,700 Sub-total Departmental 921,571,354$ 954,804,480$ 33,233,126$
Corporate:Debt and finance charges 518,189$ 3,369,698$ 2,851,509$ Taxes 11,065,558 11,454,223 388,665 Insurance and damage claims 3,585,356 3,716,624 131,268 Contribution to Transit 66,404,784 70,560,859 4,156,075 Other (6,310,245) (6,584,143) (273,898) Sub-total Corporate 75,263,642$ 82,517,261$ 7,253,619$
996,834,996$ 1,037,321,741$ 40,486,745$
Capital:Transfer to Capital Tax Supported 10,225,000 13,715,000 3,490,000Incremental Transfer to Capital 11,500,000 (11,500,000) Transfer to Regional Street Renewal Reserve 25,270,000 30,870,000 5,600,000Transfer to Local Street Renewal Reserve 29,770,000 35,370,000 5,600,000Transfer to Capital - Frontage Levy 10,000,000 10,000,000 Capital Closing Surplus (1,512,234) (2,524,798) (1,012,564)
Total Transfer to the General Capital Fund 85,252,766$ 87,430,202$ 2,177,436$
1,082,087,762$ 1,124,751,943$ 42,664,181$ Total Expenditures
2019 Operating Budget Reconciliation
Tax Supported Summary
Budget Net of Transfer to Capital / Regional and Local Street Renewal Reserves / Frontage Levy
Total Expenditures before Transfer to the General Capital Fund
Appendix 5C
Preliminary 2019 Budget - Appendices 3-37
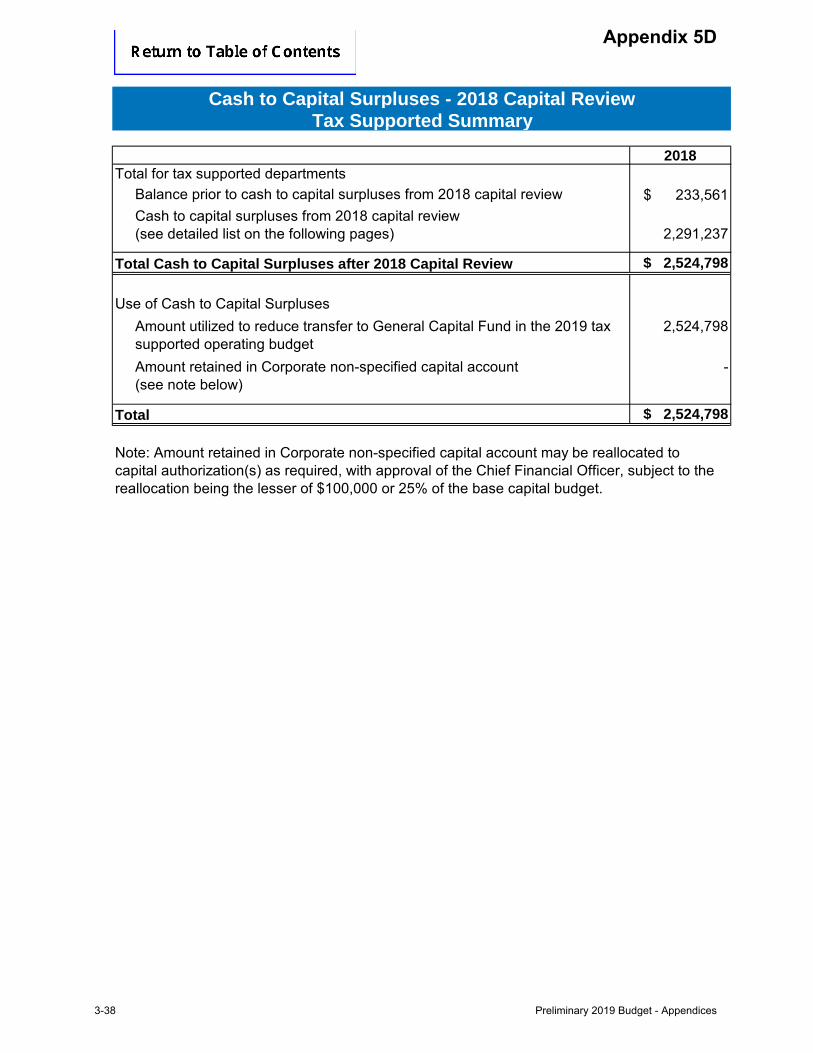
2018Total for tax supported departments
$ 233,561
2,291,237
$ 2,524,798
2,524,798
-
$ 2,524,798 Total
Note: Amount retained in Corporate non-specified capital account may be reallocated to capital authorization(s) as required, with approval of the Chief Financial Officer, subject to the reallocation being the lesser of $100,000 or 25% of the base capital budget.
Amount retained in Corporate non-specified capital account(see note below)
Amount utilized to reduce transfer to General Capital Fund in the 2019 tax supported operating budget
Use of Cash to Capital Surpluses
Cash to Capital Surpluses - 2018 Capital ReviewTax Supported Summary
Balance prior to cash to capital surpluses from 2018 capital reviewCash to capital surpluses from 2018 capital review (see detailed list on the following pages)
Total Cash to Capital Surpluses after 2018 Capital Review
Appendix 5D
3-38 Preliminary 2019 Budget - Appendices
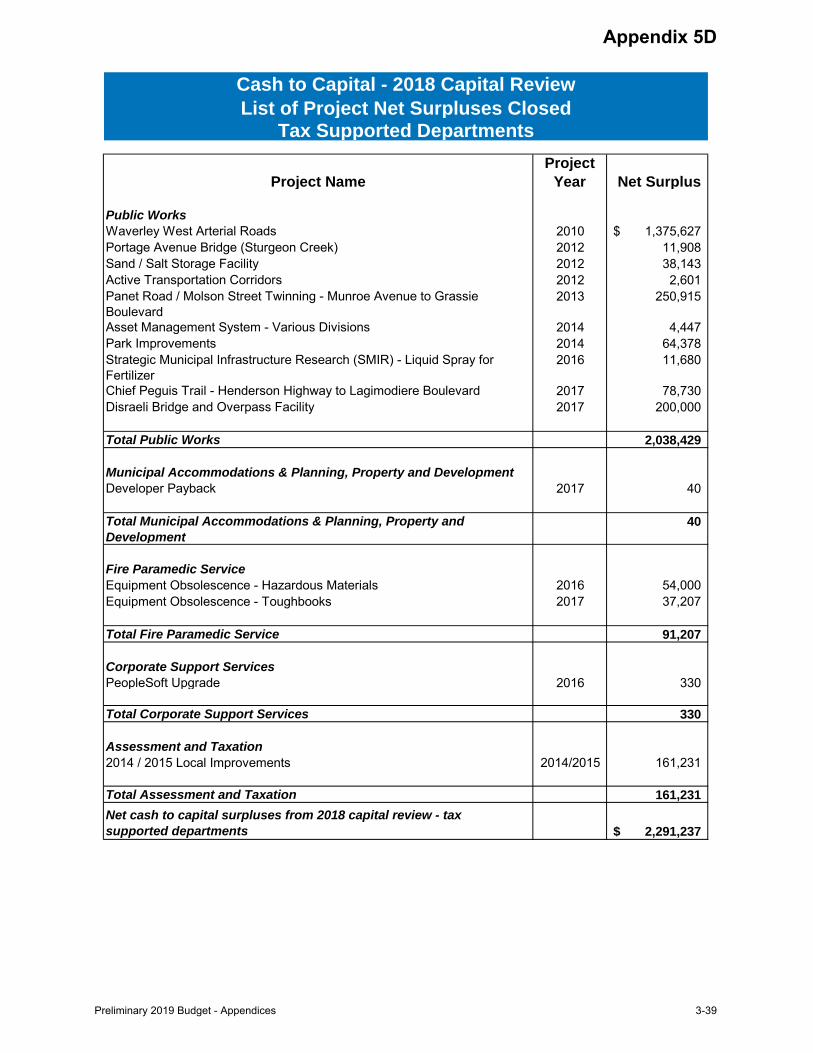
Project NameProject
Year Net Surplus
Public WorksWaverley West Arterial Roads 2010 1,375,627$ Portage Avenue Bridge (Sturgeon Creek) 2012 11,908 Sand / Salt Storage Facility 2012 38,143 Active Transportation Corridors 2012 2,601 Panet Road / Molson Street Twinning - Munroe Avenue to Grassie Boulevard
2013 250,915
Asset Management System - Various Divisions 2014 4,447 Park Improvements 2014 64,378 Strategic Municipal Infrastructure Research (SMIR) - Liquid Spray for Fertilizer
2016 11,680
Chief Peguis Trail - Henderson Highway to Lagimodiere Boulevard 2017 78,730 Disraeli Bridge and Overpass Facility 2017 200,000
Total Public Works 2,038,429
Municipal Accommodations & Planning, Property and DevelopmentDeveloper Payback 2017 40
Total Municipal Accommodations & Planning, Property and Development
40
Fire Paramedic ServiceEquipment Obsolescence - Hazardous Materials 2016 54,000 Equipment Obsolescence - Toughbooks 2017 37,207
Total Fire Paramedic Service 91,207
Corporate Support ServicesPeopleSoft Upgrade 2016 330
Total Corporate Support Services 330
Assessment and Taxation 2014 / 2015 Local Improvements 2014/2015 161,231
Total Assessment and Taxation 161,231 Net cash to capital surpluses from 2018 capital review - tax supported departments 2,291,237$
Cash to Capital - 2018 Capital ReviewList of Project Net Surpluses Closed
Tax Supported Departments
Appendix 5D
Preliminary 2019 Budget - Appendices 3-39

3-40 Preliminary 2019 Budget - Appendices
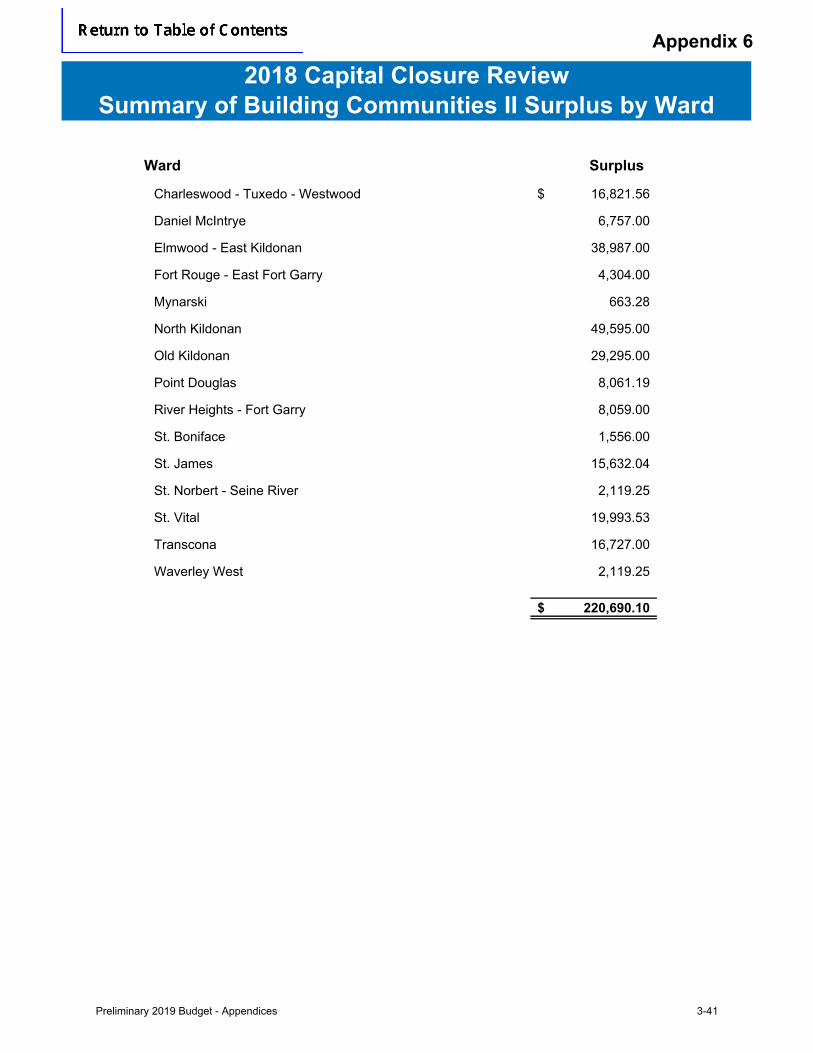
Appendix 6
Ward Surplus
Charleswood - Tuxedo - Westwood 16,821.56$
Daniel McIntrye 6,757.00
Elmwood - East Kildonan 38,987.00
Fort Rouge - East Fort Garry 4,304.00
Mynarski 663.28
North Kildonan 49,595.00
Old Kildonan 29,295.00
Point Douglas 8,061.19
River Heights - Fort Garry 8,059.00
St. Boniface 1,556.00
St. James 15,632.04
St. Norbert - Seine River 2,119.25
St. Vital 19,993.53
Transcona 16,727.00
Waverley West 2,119.25
220,690.10$
2018 Capital Closure ReviewSummary of Building Communities II Surplus by Ward
Preliminary 2019 Budget - Appendices 3-41

3-42 Preliminary 2019 Budget - Appendices
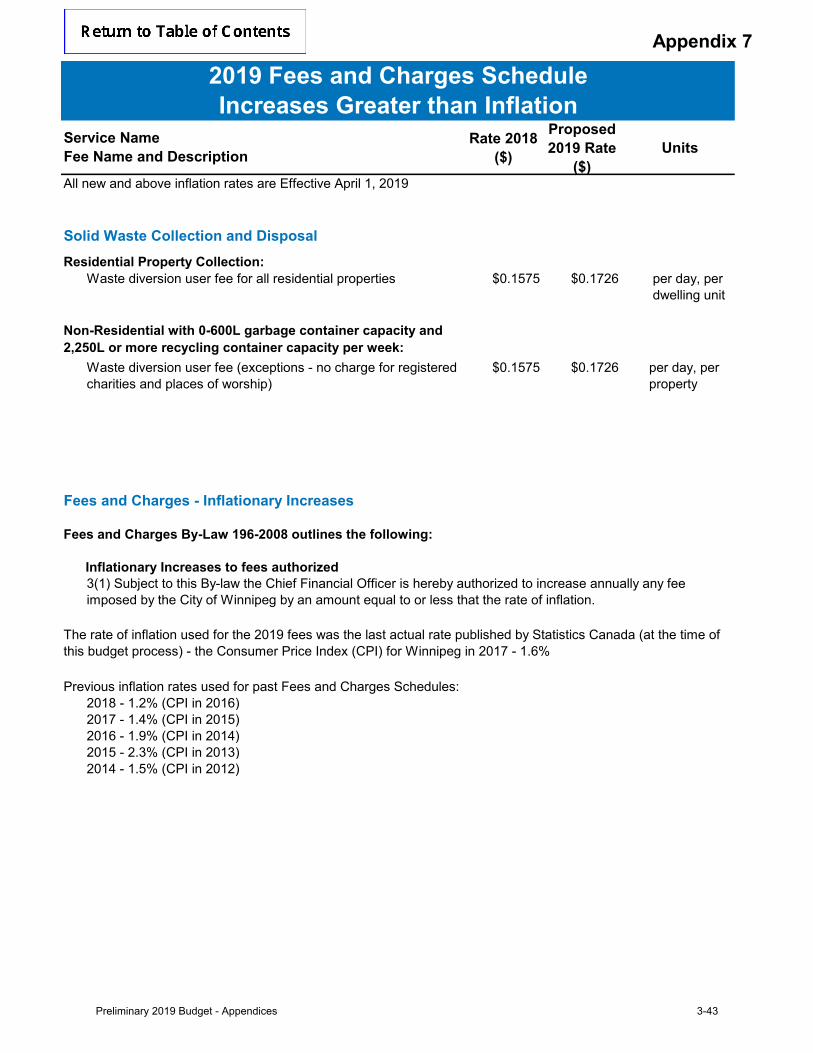
Appendix 7
Rate 2018($)
Proposed2019 Rate
($) Units
All new and above inflation rates are Effective April 1, 2019
Solid Waste Collection and DisposalResidential Property Collection:
Waste diversion user fee for all residential properties $0.1575 $0.1726 per day, per dwelling unit
Waste diversion user fee (exceptions - no charge for registered charities and places of worship)
$0.1575 $0.1726 per day, per property
Fees and Charges - Inflationary Increases
Previous inflation rates used for past Fees and Charges Schedules:2018 - 1.2% (CPI in 2016)2017 - 1.4% (CPI in 2015)2016 - 1.9% (CPI in 2014)2015 - 2.3% (CPI in 2013)2014 - 1.5% (CPI in 2012)
Fees and Charges By-Law 196-2008 outlines the following:
Inflationary Increases to fees authorized3(1) Subject to this By-law the Chief Financial Officer is hereby authorized to increase annually any fee imposed by the City of Winnipeg by an amount equal to or less that the rate of inflation.
The rate of inflation used for the 2019 fees was the last actual rate published by Statistics Canada (at the time of this budget process) - the Consumer Price Index (CPI) for Winnipeg in 2017 - 1.6%
Non-Residential with 0-600L garbage container capacity and 2,250L or more recycling container capacity per week:
2019 Fees and Charges ScheduleIncreases Greater than Inflation
Service NameFee Name and Description
Preliminary 2019 Budget - Appendices 3-43

3-44 Preliminary 2019 Budget - Appendices
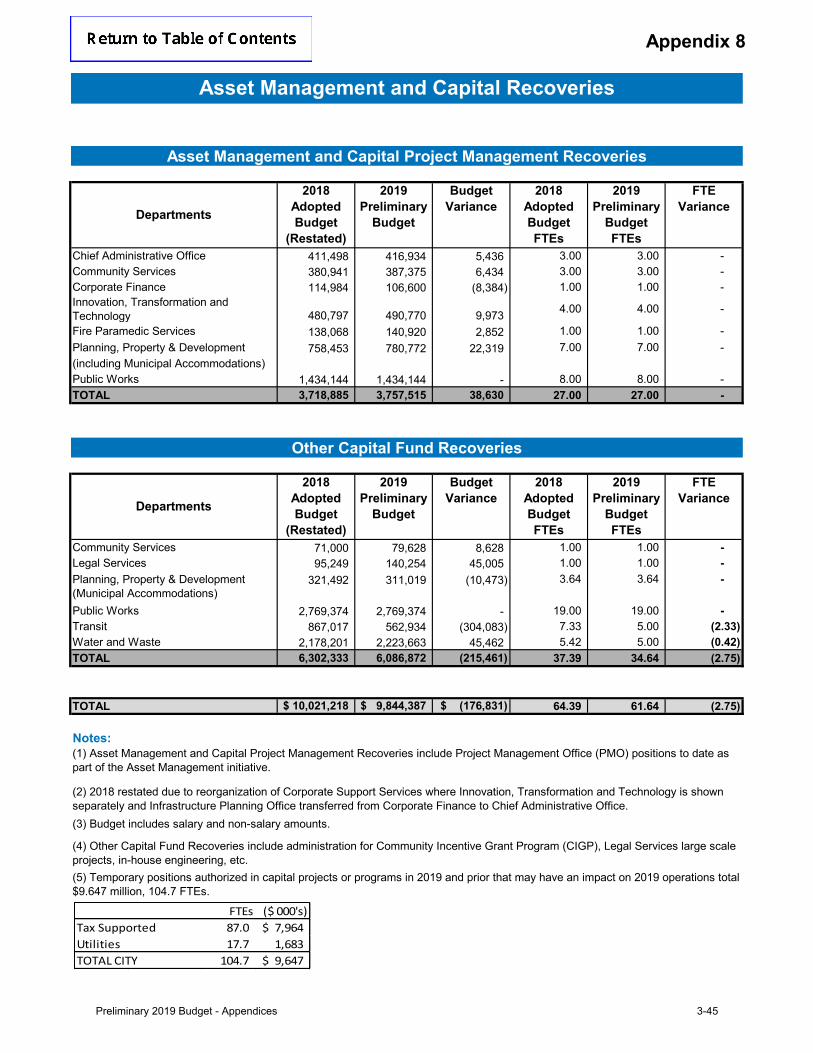
Appendix 8
2018 Adopted Budget
(Restated)
2019 Preliminary
Budget
Budget Variance
2018 Adopted Budget FTEs
2019 Preliminary
Budget FTEs
FTE Variance
Chief Administrative Office 411,498 416,934 5,436 3.00 3.00 - Community Services 380,941 387,375 6,434 3.00 3.00 - Corporate Finance 114,984 106,600 (8,384) 1.00 1.00 - Innovation, Transformation and Technology 480,797 490,770 9,973 4.00 4.00 -
Fire Paramedic Services 138,068 140,920 2,852 1.00 1.00 - Planning, Property & Development 758,453 780,772 22,319 7.00 7.00 - (including Municipal Accommodations)Public Works 1,434,144 1,434,144 - 8.00 8.00 - TOTAL 3,718,885 3,757,515 38,630 27.00 27.00 -
2018 Adopted Budget
(Restated)
2019 Preliminary
Budget
Budget Variance
2018 Adopted Budget FTEs
2019 Preliminary
Budget FTEs
FTE Variance
Community Services 71,000 79,628 8,628 1.00 1.00 - Legal Services 95,249 140,254 45,005 1.00 1.00 -
321,492 311,019 (10,473) 3.64 3.64 -
Public Works 2,769,374 2,769,374 - 19.00 19.00 - Transit 867,017 562,934 (304,083) 7.33 5.00 (2.33) Water and Waste 2,178,201 2,223,663 45,462 5.42 5.00 (0.42) TOTAL 6,302,333 6,086,872 (215,461) 37.39 34.64 (2.75)
TOTAL 10,021,218$ 9,844,387$ (176,831)$ 64.39 61.64 (2.75)
Notes:
(3) Budget includes salary and non-salary amounts.
Asset Management and Capital Recoveries
Asset Management and Capital Project Management Recoveries
Departments
(1) Asset Management and Capital Project Management Recoveries include Project Management Office (PMO) positions to date as part of the Asset Management initiative.
(2) 2018 restated due to reorganization of Corporate Support Services where Innovation, Transformation and Technology is shown separately and Infrastructure Planning Office transferred from Corporate Finance to Chief Administrative Office.
(4) Other Capital Fund Recoveries include administration for Community Incentive Grant Program (CIGP), Legal Services large scale projects, in-house engineering, etc.(5) Temporary positions authorized in capital projects or programs in 2019 and prior that may have an impact on 2019 operations total $9.647 million, 104.7 FTEs.
Other Capital Fund Recoveries
Departments
Planning, Property & Development (Municipal Accommodations)
FTEs ($ 000's)
Tax Supported 87.0 7,964$
Utilities 17.7 1,683
TOTAL CITY 104.7 9,647$
Preliminary 2019 Budget - Appendices 3-45

3-46 Preliminary 2019 Budget - Appendices
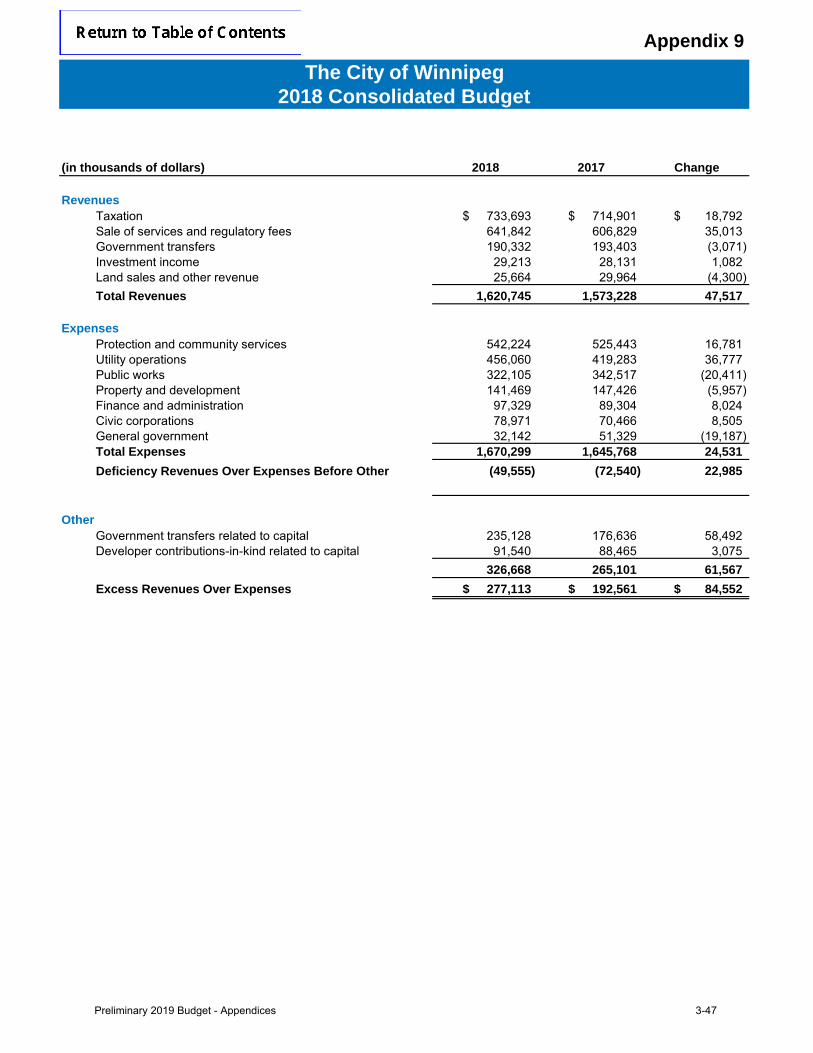
Appendix 9
(in thousands of dollars) 2018 2017 Change
RevenuesTaxation 733,693$ 714,901$ 18,792$ Sale of services and regulatory fees 641,842 606,829 35,013 Government transfers 190,332 193,403 (3,071) Investment income 29,213 28,131 1,082 Land sales and other revenue 25,664 29,964 (4,300) Total Revenues 1,620,745 1,573,228 47,517
ExpensesProtection and community services 542,224 525,443 16,781 Utility operations 456,060 419,283 36,777 Public works 322,105 342,517 (20,411) Property and development 141,469 147,426 (5,957) Finance and administration 97,329 89,304 8,024 Civic corporations 78,971 70,466 8,505 General government 32,142 51,329 (19,187) Total Expenses 1,670,299 1,645,768 24,531
(49,555) (72,540) 22,985
OtherGovernment transfers related to capital 235,128 176,636 58,492 Developer contributions-in-kind related to capital 91,540 88,465 3,075
326,668 265,101 61,567 Excess Revenues Over Expenses 277,113$ 192,561$ 84,552$
The City of Winnipeg2018 Consolidated Budget
Deficiency Revenues Over Expenses Before Other
Preliminary 2019 Budget - Appendices 3-47
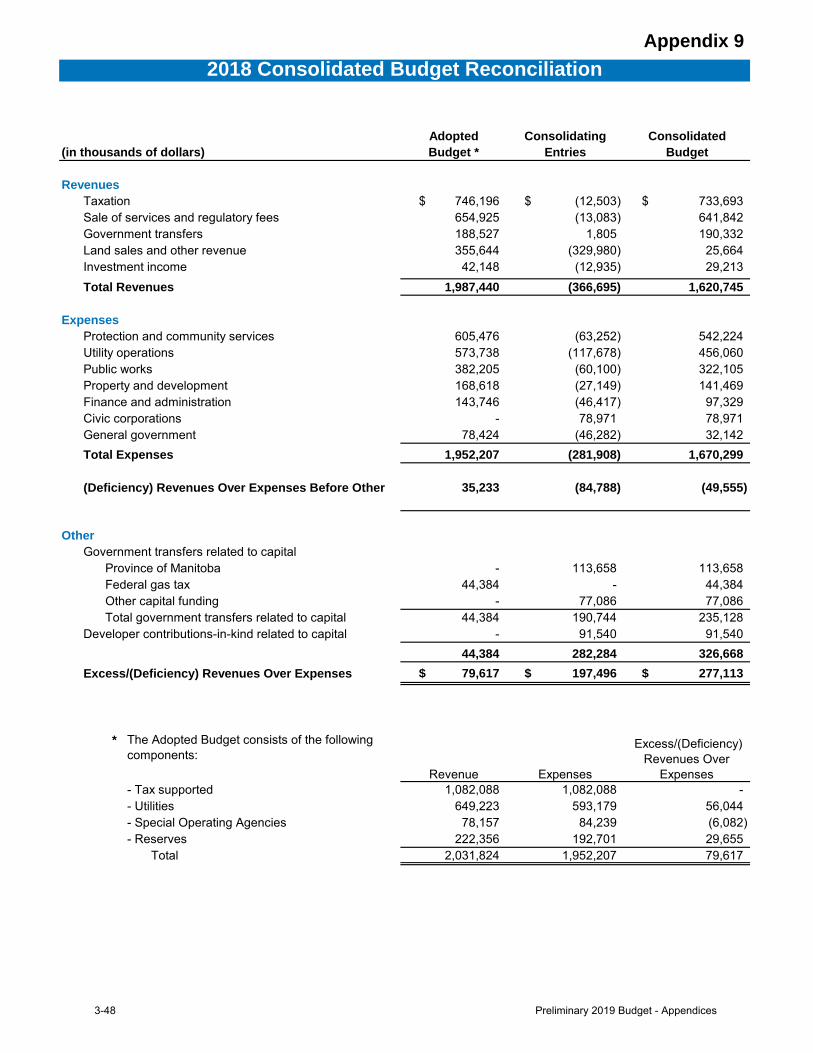
Appendix 9
Adopted Consolidating Consolidated(in thousands of dollars) Budget * Entries Budget
RevenuesTaxation 746,196$ (12,503)$ 733,693$ Sale of services and regulatory fees 654,925 (13,083) 641,842 Government transfers 188,527 1,805 190,332 Land sales and other revenue 355,644 (329,980) 25,664 Investment income 42,148 (12,935) 29,213 Total Revenues 1,987,440 (366,695) 1,620,745
ExpensesProtection and community services 605,476 (63,252) 542,224 Utility operations 573,738 (117,678) 456,060 Public works 382,205 (60,100) 322,105 Property and development 168,618 (27,149) 141,469 Finance and administration 143,746 (46,417) 97,329 Civic corporations - 78,971 78,971 General government 78,424 (46,282) 32,142 Total Expenses 1,952,207 (281,908) 1,670,299
35,233 (84,788) (49,555)
OtherGovernment transfers related to capital
Province of Manitoba - 113,658 113,658 Federal gas tax 44,384 - 44,384 Other capital funding - 77,086 77,086 Total government transfers related to capital 44,384 190,744 235,128
Developer contributions-in-kind related to capital - 91,540 91,540 44,384 282,284 326,668 79,617$ 197,496$ 277,113$
* The Adopted Budget consists of the followingcomponents:
Revenue Expenses
Excess/(Deficiency) Revenues Over
Expenses - Tax supported 1,082,088 1,082,088 - - Utilities 649,223 593,179 56,044 - Special Operating Agencies 78,157 84,239 (6,082) - Reserves 222,356 192,701 29,655
Total 2,031,824 1,952,207 79,617
2018 Consolidated Budget Reconciliation
(Deficiency) Revenues Over Expenses Before Other
Excess/(Deficiency) Revenues Over Expenses
3-48 Preliminary 2019 Budget - Appendices
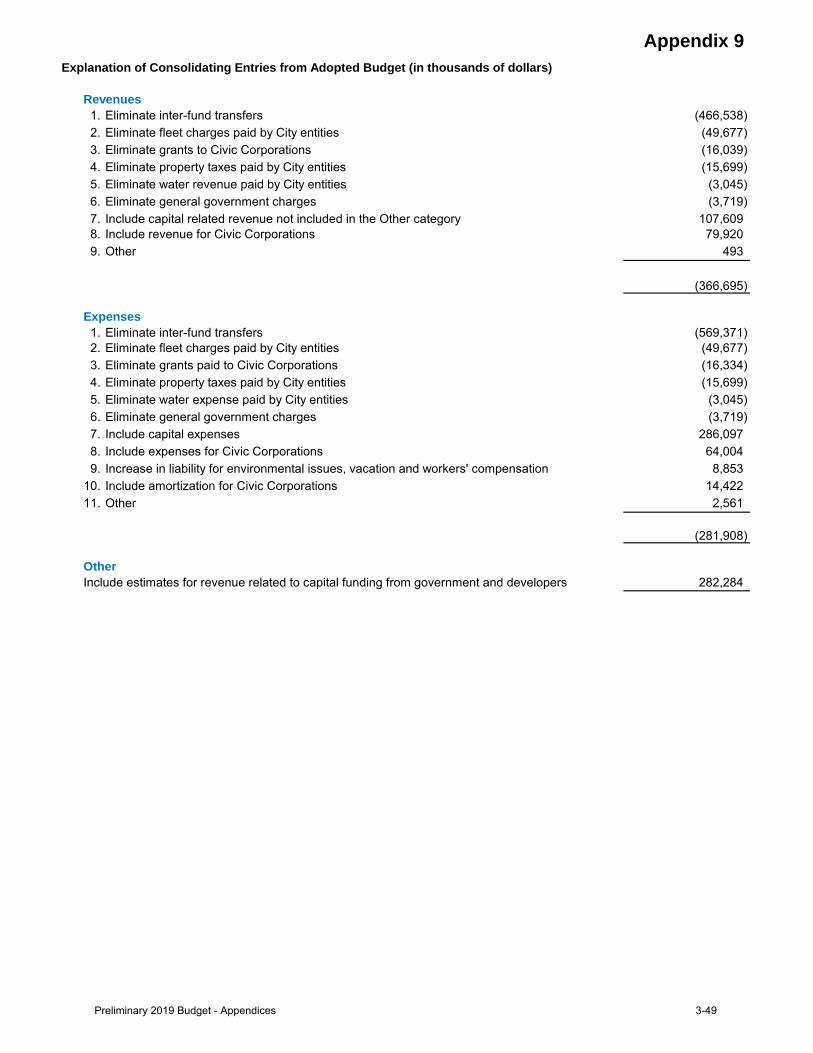
Appendix 9
Revenues1. Eliminate inter-fund transfers (466,538) 2. Eliminate fleet charges paid by City entities (49,677) 3. Eliminate grants to Civic Corporations (16,039) 4. Eliminate property taxes paid by City entities (15,699) 5. Eliminate water revenue paid by City entities (3,045) 6. Eliminate general government charges (3,719) 7. Include capital related revenue not included in the Other category 107,609 8. Include revenue for Civic Corporations 79,920 9. Other 493
(366,695)
Expenses1. Eliminate inter-fund transfers (569,371) 2. Eliminate fleet charges paid by City entities (49,677) 3. Eliminate grants paid to Civic Corporations (16,334) 4. Eliminate property taxes paid by City entities (15,699) 5. Eliminate water expense paid by City entities (3,045) 6. Eliminate general government charges (3,719) 7. Include capital expenses 286,097 8. Include expenses for Civic Corporations 64,004 9. Increase in liability for environmental issues, vacation and workers' compensation 8,853
10. Include amortization for Civic Corporations 14,422 11. Other 2,561
(281,908)
OtherInclude estimates for revenue related to capital funding from government and developers 282,284
Explanation of Consolidating Entries from Adopted Budget (in thousands of dollars)
Preliminary 2019 Budget - Appendices 3-49
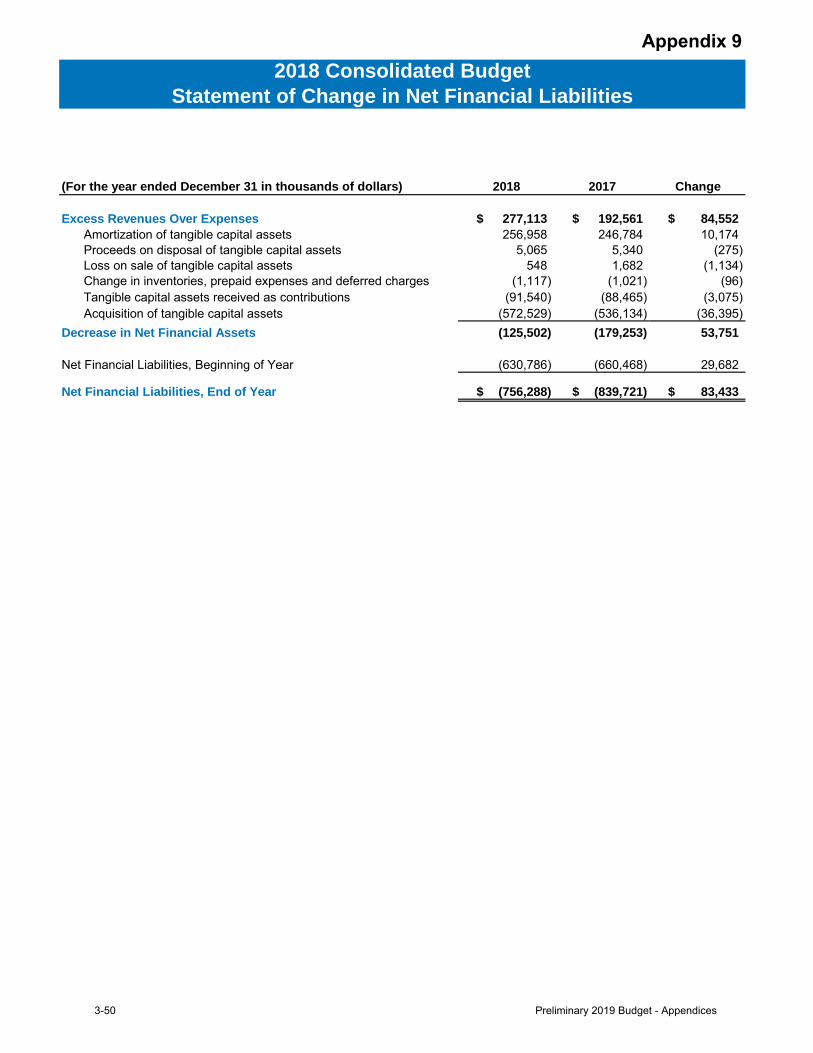
Appendix 9
(For the year ended December 31 in thousands of dollars) 2018 2017 Change
Excess Revenues Over Expenses 277,113$ 192,561$ 84,552$ Amortization of tangible capital assets 256,958 246,784 10,174 Proceeds on disposal of tangible capital assets 5,065 5,340 (275) Loss on sale of tangible capital assets 548 1,682 (1,134)
(1,117) (1,021) (96) Tangible capital assets received as contributions (91,540) (88,465) (3,075) Acquisition of tangible capital assets (572,529) (536,134) (36,395)
Decrease in Net Financial Assets (125,502) (179,253) 53,751
Net Financial Liabilities, Beginning of Year (630,786) (660,468) 29,682
Net Financial Liabilities, End of Year (756,288)$ (839,721)$ 83,433$
2018 Consolidated BudgetStatement of Change in Net Financial Liabilities
Change in inventories, prepaid expenses and deferred charges
3-50 Preliminary 2019 Budget - Appendices
tcarrier
Typewritten Text
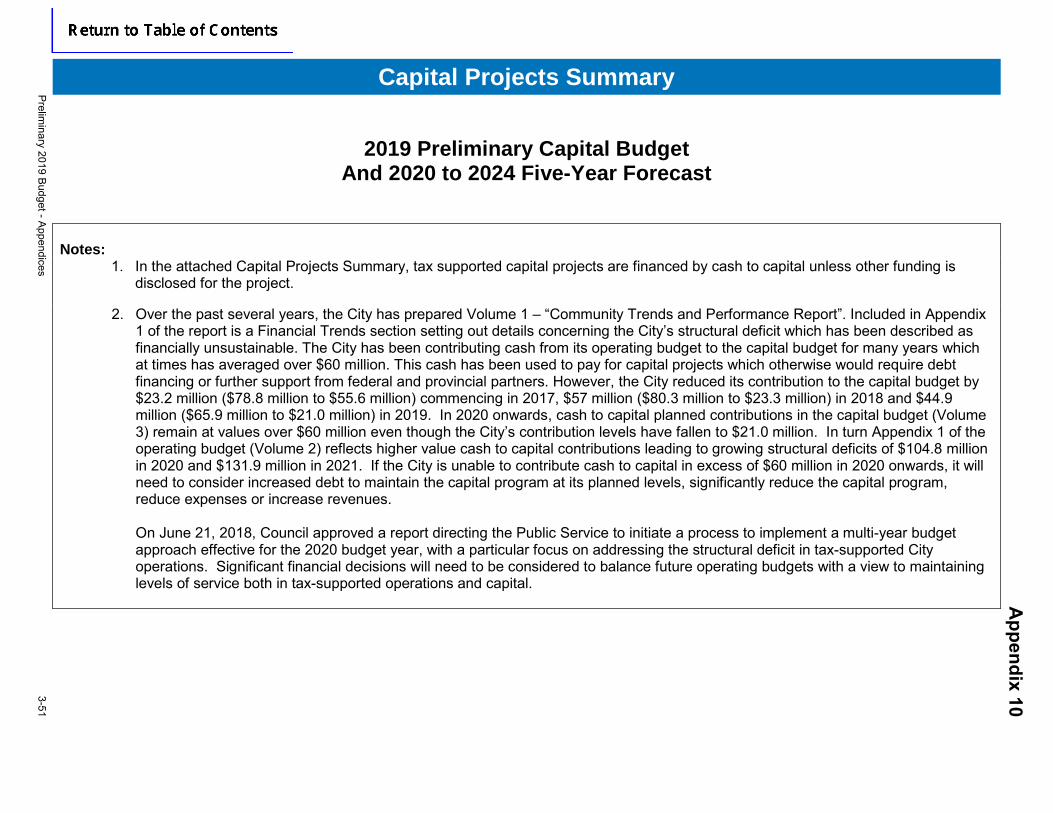
Capital Projects Summary
2019 Preliminary Capital Budget And 2020 to 2024 Five-Year Forecast
Notes: 1. In the attached Capital Projects Summary, tax supported capital projects are financed by cash to capital unless other funding is
disclosed for the project.
2. Over the past several years, the City has prepared Volume 1 – “Community Trends and Performance Report”. Included in Appendix1 of the report is a Financial Trends section setting out details concerning the City’s structural deficit which has been described asfinancially unsustainable. The City has been contributing cash from its operating budget to the capital budget for many years whichat times has averaged over $60 million. This cash has been used to pay for capital projects which otherwise would require debtfinancing or further support from federal and provincial partners. However, the City reduced its contribution to the capital budget by$23.2 million ($78.8 million to $55.6 million) commencing in 2017, $57 million ($80.3 million to $23.3 million) in 2018 and $44.9million ($65.9 million to $21.0 million) in 2019. In 2020 onwards, cash to capital planned contributions in the capital budget (Volume3) remain at values over $60 million even though the City’s contribution levels have fallen to $21.0 million. In turn Appendix 1 of theoperating budget (Volume 2) reflects higher value cash to capital contributions leading to growing structural deficits of $104.8 millionin 2020 and $131.9 million in 2021. If the City is unable to contribute cash to capital in excess of $60 million in 2020 onwards, it willneed to consider increased debt to maintain the capital program at its planned levels, significantly reduce the capital program,reduce expenses or increase revenues.
On June 21, 2018, Council approved a report directing the Public Service to initiate a process to implement a multi-year budget approach effective for the 2020 budget year, with a particular focus on addressing the structural deficit in tax-supported City operations. Significant financial decisions will need to be considered to balance future operating budgets with a view to maintaining levels of service both in tax-supported operations and capital.
Ap
pen
dix
10
Preliminary 2019 Budget - Appendices
3-51
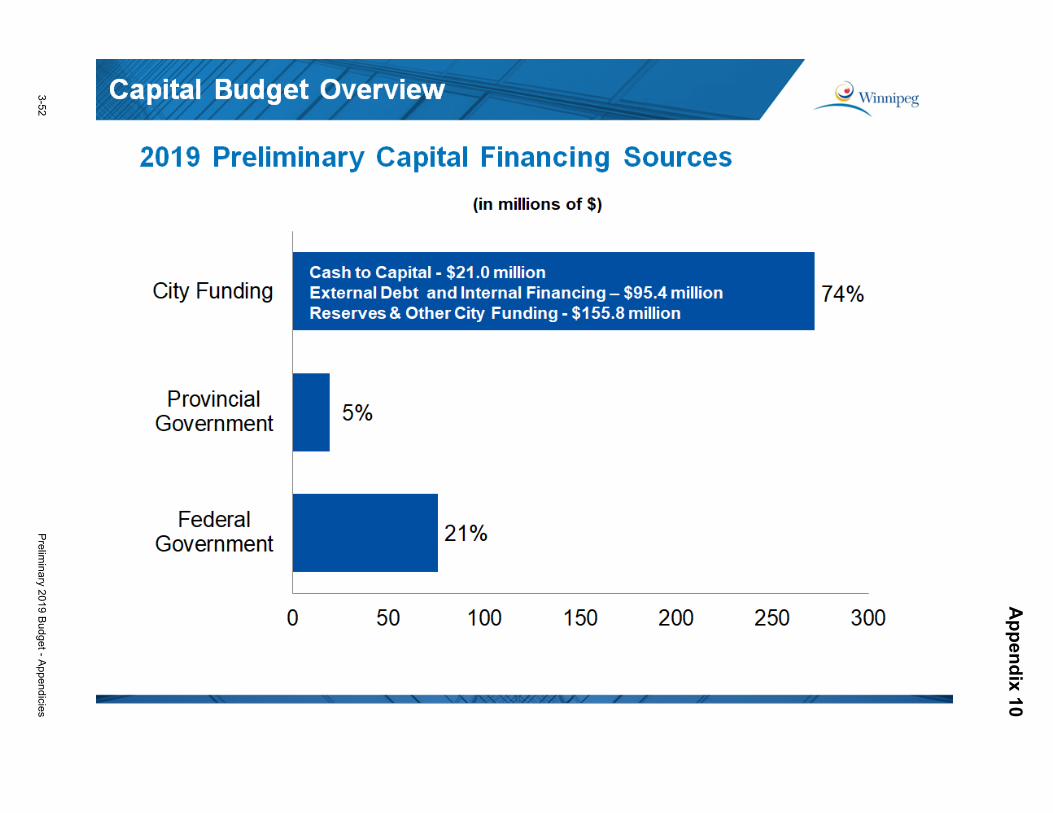
Ap
pen
dix
10
3-52Prelim
inary 2019 Budget - Appendicies
Summary of Capital Program ........................................................................................................................................................................ 3-54
Summary of Financing Sources .................................................................................................................................................................... 3-55
Tax Supported, Transit, and Municipal Accommodations
Public Works ......................................................................................................................................................................................... 3-59
Community Services ............................................................................................................................................................................. 3-64
Winnipeg Police Services ..................................................................................................................................................................... 3-67
Fire Paramedic Service ......................................................................................................................................................................... 3-68
Planning, Property and Development ................................................................................................................................................... 3-69
Municipal Accommodations .................................................................................................................................................................. 3-70
City Clerks ............................................................................................................................................................................................. 3-71
Innovation, Transformation and Technology ......................................................................................................................................... 3-71
Customer Service and Communications ............................................................................................................................................... 3-74
Assessment and Taxation ..................................................................................................................................................................... 3-74
Transit ................................................................................................................................................................................................... 3-75
Self-Supporting Utilities
Waterworks System .............................................................................................................................................................................. 3-77
Sewage Disposal System ..................................................................................................................................................................... 3-78
Solid Waste Disposal System ............................................................................................................................................................... 3-80
Land Drainage Utility ............................................................................................................................................................................. 3-81
Special Operating Agencies
Winnipeg Fleet Management Agency ................................................................................................................................................... 3-82
Winnipeg Golf Services ......................................................................................................................................................................... 3-82
Winnipeg Parking Authority ................................................................................................................................................................... 3-82
Table of Contents Preliminary 2019 Budget - Appendices
3-53
Appendix 10
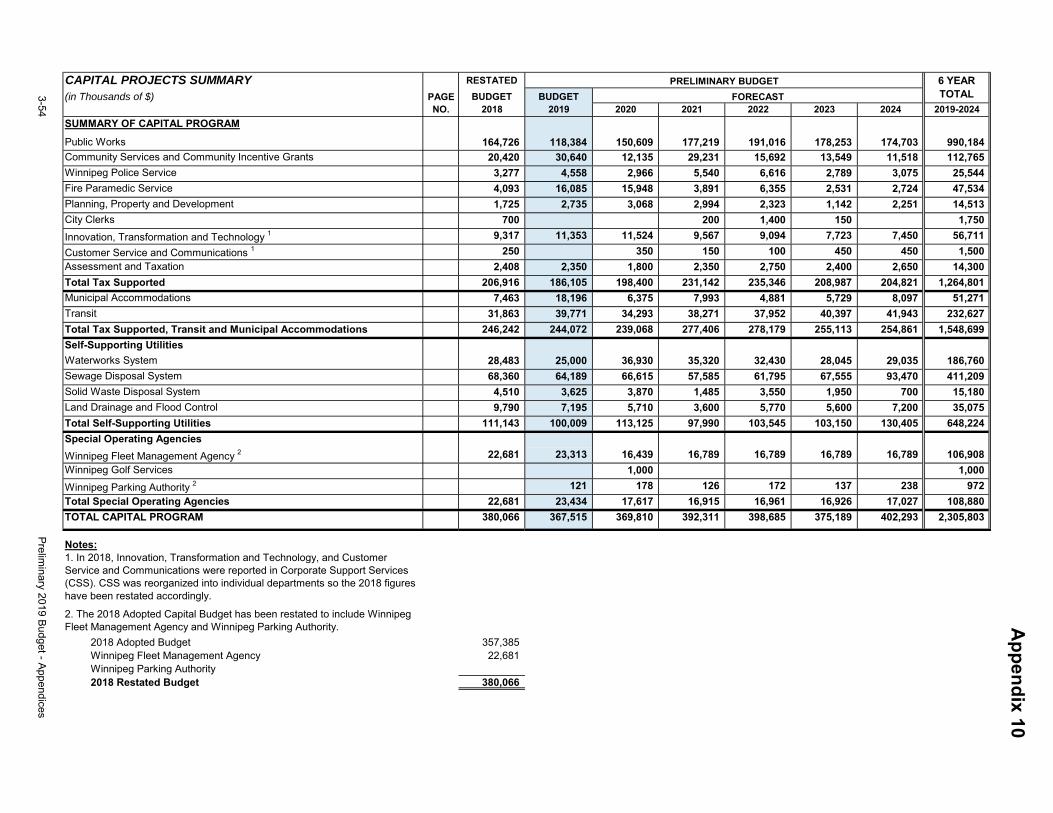
CAPITAL PROJECTS SUMMARY RESTATED
(in Thousands of $) PAGE BUDGET BUDGETNO. 2018 2019 2020 2021 2022 2023 2024 2019-2024
SUMMARY OF CAPITAL PROGRAM
Public Works 164,726 118,384 150,609 177,219 191,016 178,253 174,703 990,184
Community Services and Community Incentive Grants 20,420 30,640 12,135 29,231 15,692 13,549 11,518 112,765
Winnipeg Police Service 3,277 4,558 2,966 5,540 6,616 2,789 3,075 25,544
Fire Paramedic Service 4,093 16,085 15,948 3,891 6,355 2,531 2,724 47,534
Planning, Property and Development 1,725 2,735 3,068 2,994 2,323 1,142 2,251 14,513
City Clerks 700 200 1,400 150 1,750
Innovation, Transformation and Technology 1 9,317 11,353 11,524 9,567 9,094 7,723 7,450 56,711
Customer Service and Communications 1 250 350 150 100 450 450 1,500
Assessment and Taxation 2,408 2,350 1,800 2,350 2,750 2,400 2,650 14,300
Total Tax Supported 206,916 186,105 198,400 231,142 235,346 208,987 204,821 1,264,801
Municipal Accommodations 7,463 18,196 6,375 7,993 4,881 5,729 8,097 51,271
Transit 31,863 39,771 34,293 38,271 37,952 40,397 41,943 232,627
Total Tax Supported, Transit and Municipal Accommodations 246,242 244,072 239,068 277,406 278,179 255,113 254,861 1,548,699
Self-Supporting Utilities
Waterworks System 28,483 25,000 36,930 35,320 32,430 28,045 29,035 186,760
Sewage Disposal System 68,360 64,189 66,615 57,585 61,795 67,555 93,470 411,209
Solid Waste Disposal System 4,510 3,625 3,870 1,485 3,550 1,950 700 15,180
Land Drainage and Flood Control 9,790 7,195 5,710 3,600 5,770 5,600 7,200 35,075
Total Self-Supporting Utilities 111,143 100,009 113,125 97,990 103,545 103,150 130,405 648,224
Special Operating Agencies
Winnipeg Fleet Management Agency 2 22,681 23,313 16,439 16,789 16,789 16,789 16,789 106,908
Winnipeg Golf Services 1,000 1,000
Winnipeg Parking Authority 2 121 178 126 172 137 238 972
Total Special Operating Agencies 22,681 23,434 17,617 16,915 16,961 16,926 17,027 108,880
TOTAL CAPITAL PROGRAM 380,066 367,515 369,810 392,311 398,685 375,189 402,293 2,305,803
1. In 2018, Innovation, Transformation and Technology, and CustomerService and Communications were reported in Corporate Support Services(CSS). CSS was reorganized into individual departments so the 2018 figureshave been restated accordingly.
2. The 2018 Adopted Capital Budget has been restated to include WinnipegFleet Management Agency and Winnipeg Parking Authority.
2018 Adopted Budget 357,385Winnipeg Fleet Management Agency 22,681Winnipeg Parking Authority2018 Restated Budget 380,066
PRELIMINARY BUDGET
FORECAST
Notes:
6 YEAR TOTAL3-54
Preliminary 2019 Budget - Appendices
Appendix 10
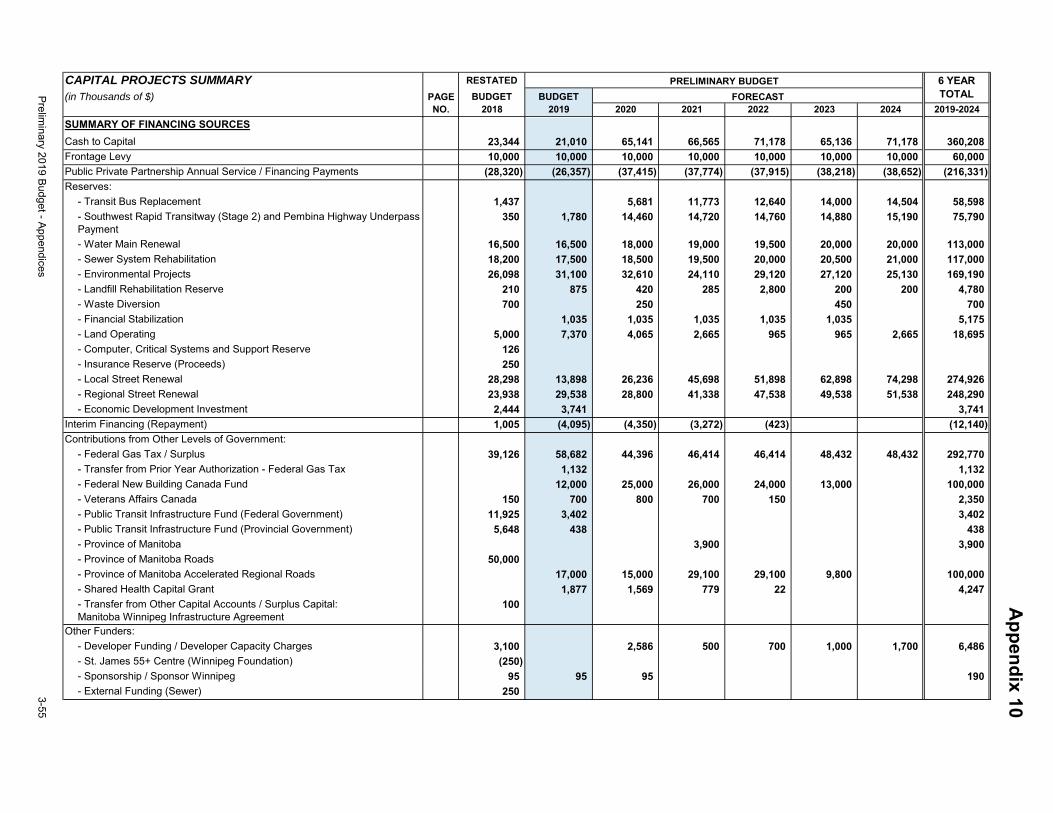
CAPITAL PROJECTS SUMMARY RESTATED
(in Thousands of $) PAGE BUDGET BUDGETNO. 2018 2019 2020 2021 2022 2023 2024 2019-2024
PRELIMINARY BUDGET
FORECAST
6 YEAR TOTAL
SUMMARY OF FINANCING SOURCES
Cash to Capital 23,344 21,010 65,141 66,565 71,178 65,136 71,178 360,208
Frontage Levy 10,000 10,000 10,000 10,000 10,000 10,000 10,000 60,000
Public Private Partnership Annual Service / Financing Payments (28,320) (26,357) (37,415) (37,774) (37,915) (38,218) (38,652) (216,331)
Reserves:
- Transit Bus Replacement 1,437 5,681 11,773 12,640 14,000 14,504 58,598
- Southwest Rapid Transitway (Stage 2) and Pembina Highway Underpass Payment
350 1,780 14,460 14,720 14,760 14,880 15,190 75,790
- Water Main Renewal 16,500 16,500 18,000 19,000 19,500 20,000 20,000 113,000
- Sewer System Rehabilitation 18,200 17,500 18,500 19,500 20,000 20,500 21,000 117,000
- Environmental Projects 26,098 31,100 32,610 24,110 29,120 27,120 25,130 169,190
- Landfill Rehabilitation Reserve 210 875 420 285 2,800 200 200 4,780
- Waste Diversion 700 250 450 700
- Financial Stabilization 1,035 1,035 1,035 1,035 1,035 5,175
- Land Operating 5,000 7,370 4,065 2,665 965 965 2,665 18,695
- Computer, Critical Systems and Support Reserve 126
- Insurance Reserve (Proceeds) 250
- Local Street Renewal 28,298 13,898 26,236 45,698 51,898 62,898 74,298 274,926
- Regional Street Renewal 23,938 29,538 28,800 41,338 47,538 49,538 51,538 248,290
- Economic Development Investment 2,444 3,741 3,741
Interim Financing (Repayment) 1,005 (4,095) (4,350) (3,272) (423) (12,140)
Contributions from Other Levels of Government:
- Federal Gas Tax / Surplus 39,126 58,682 44,396 46,414 46,414 48,432 48,432 292,770
- Transfer from Prior Year Authorization - Federal Gas Tax 1,132 1,132
- Federal New Building Canada Fund 12,000 25,000 26,000 24,000 13,000 100,000
- Veterans Affairs Canada 150 700 800 700 150 2,350
- Public Transit Infrastructure Fund (Federal Government) 11,925 3,402 3,402
- Public Transit Infrastructure Fund (Provincial Government) 5,648 438 438
- Province of Manitoba 3,900 3,900
- Province of Manitoba Roads 50,000
- Province of Manitoba Accelerated Regional Roads 17,000 15,000 29,100 29,100 9,800 100,000
- Shared Health Capital Grant 1,877 1,569 779 22 4,247
- Transfer from Other Capital Accounts / Surplus Capital:Manitoba Winnipeg Infrastructure Agreement
100
Other Funders:
- Developer Funding / Developer Capacity Charges 3,100 2,586 500 700 1,000 1,700 6,486
- St. James 55+ Centre (Winnipeg Foundation) (250)
- Sponsorship / Sponsor Winnipeg 95 95 95 190
- External Funding (Sewer) 250
Appendix 10
Preliminary 2019 Budget - Appendices
3-55
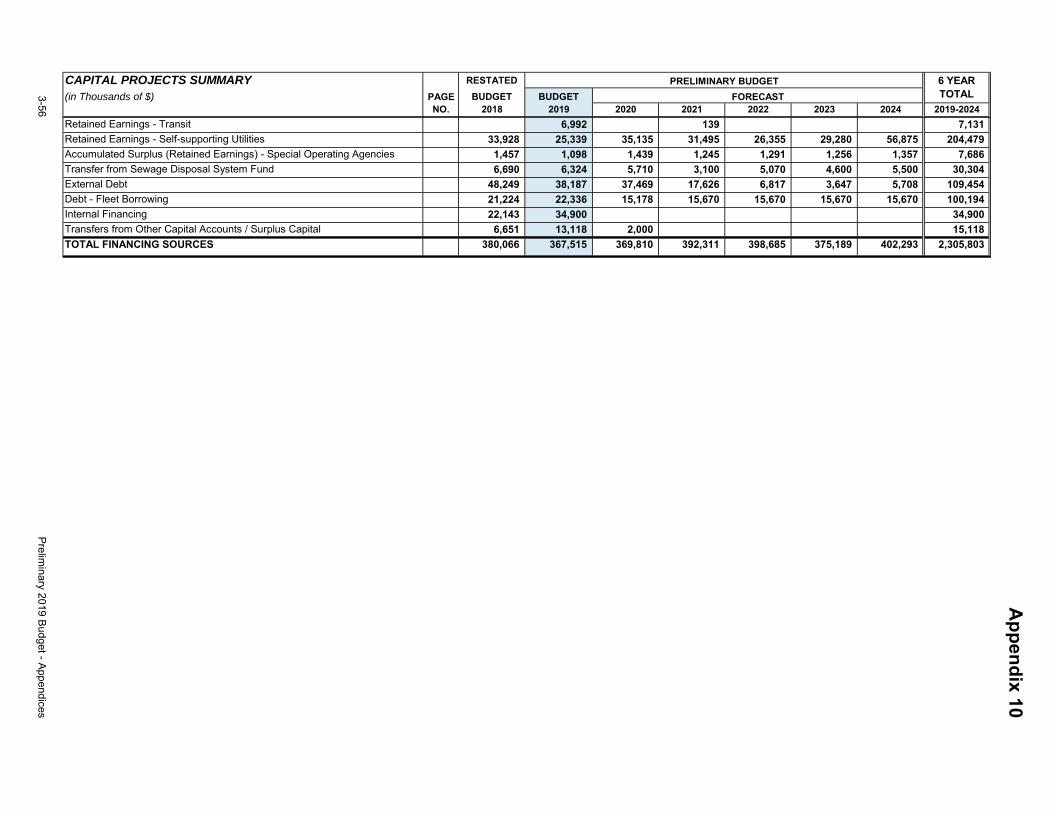
CAPITAL PROJECTS SUMMARY RESTATED
(in Thousands of $) PAGE BUDGET BUDGETNO. 2018 2019 2020 2021 2022 2023 2024 2019-2024
PRELIMINARY BUDGET
FORECAST
6 YEAR TOTAL
Retained Earnings - Transit 6,992 139 7,131
Retained Earnings - Self-supporting Utilities 33,928 25,339 35,135 31,495 26,355 29,280 56,875 204,479
Accumulated Surplus (Retained Earnings) - Special Operating Agencies 1,457 1,098 1,439 1,245 1,291 1,256 1,357 7,686
Transfer from Sewage Disposal System Fund 6,690 6,324 5,710 3,100 5,070 4,600 5,500 30,304
External Debt 48,249 38,187 37,469 17,626 6,817 3,647 5,708 109,454
Debt - Fleet Borrowing 21,224 22,336 15,178 15,670 15,670 15,670 15,670 100,194
Internal Financing 22,143 34,900 34,900
Transfers from Other Capital Accounts / Surplus Capital 6,651 13,118 2,000 15,118
TOTAL FINANCING SOURCES 380,066 367,515 369,810 392,311 398,685 375,189 402,293 2,305,803
Appendix 10
3-56Prelim
inary 2019 Budget - Appendices
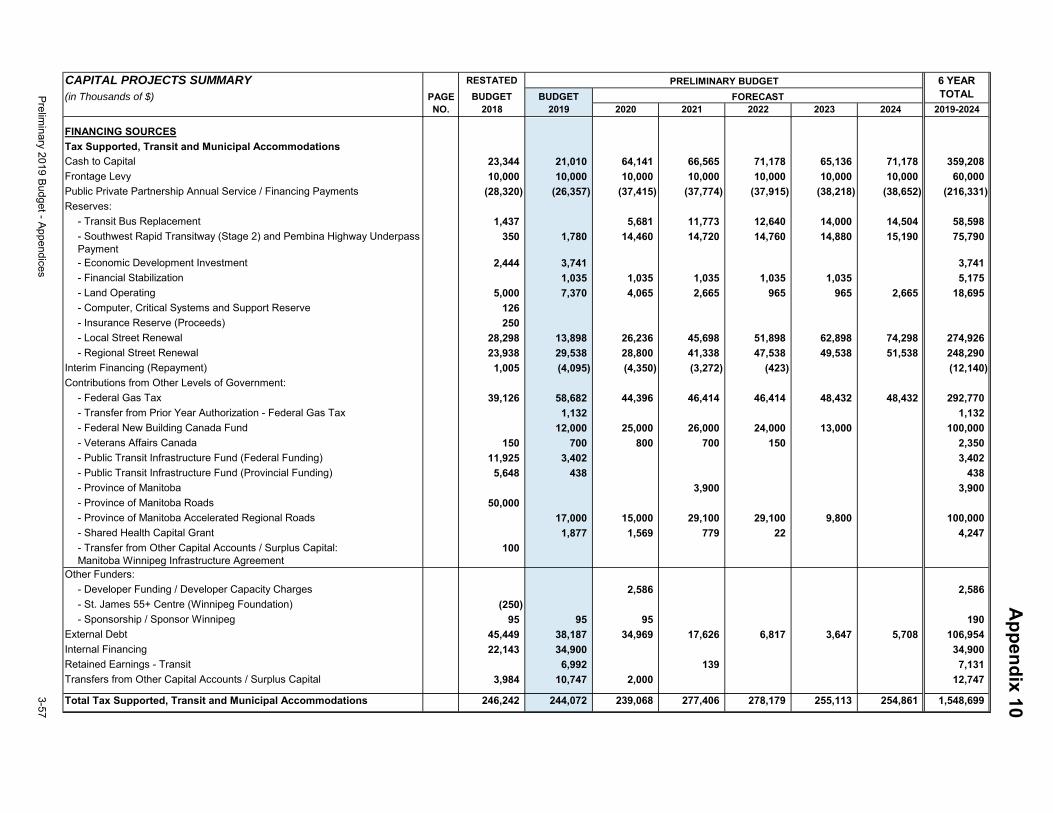
CAPITAL PROJECTS SUMMARY RESTATED
(in Thousands of $) PAGE BUDGET BUDGETNO. 2018 2019 2020 2021 2022 2023 2024 2019-2024
PRELIMINARY BUDGET
FORECAST
6 YEAR TOTAL
FINANCING SOURCES
Tax Supported, Transit and Municipal Accommodations
Cash to Capital 23,344 21,010 64,141 66,565 71,178 65,136 71,178 359,208
Frontage Levy 10,000 10,000 10,000 10,000 10,000 10,000 10,000 60,000
Public Private Partnership Annual Service / Financing Payments (28,320) (26,357) (37,415) (37,774) (37,915) (38,218) (38,652) (216,331)
Reserves:
- Transit Bus Replacement 1,437 5,681 11,773 12,640 14,000 14,504 58,598
- Southwest Rapid Transitway (Stage 2) and Pembina Highway UnderpassPayment
350 1,780 14,460 14,720 14,760 14,880 15,190 75,790
- Economic Development Investment 2,444 3,741 3,741
- Financial Stabilization 1,035 1,035 1,035 1,035 1,035 5,175
- Land Operating 5,000 7,370 4,065 2,665 965 965 2,665 18,695
- Computer, Critical Systems and Support Reserve 126
- Insurance Reserve (Proceeds) 250
- Local Street Renewal 28,298 13,898 26,236 45,698 51,898 62,898 74,298 274,926
- Regional Street Renewal 23,938 29,538 28,800 41,338 47,538 49,538 51,538 248,290
Interim Financing (Repayment) 1,005 (4,095) (4,350) (3,272) (423) (12,140)
Contributions from Other Levels of Government:
- Federal Gas Tax 39,126 58,682 44,396 46,414 46,414 48,432 48,432 292,770
- Transfer from Prior Year Authorization - Federal Gas Tax 1,132 1,132
- Federal New Building Canada Fund 12,000 25,000 26,000 24,000 13,000 100,000
- Veterans Affairs Canada 150 700 800 700 150 2,350
- Public Transit Infrastructure Fund (Federal Funding) 11,925 3,402 3,402
- Public Transit Infrastructure Fund (Provincial Funding) 5,648 438 438
- Province of Manitoba 3,900 3,900
- Province of Manitoba Roads 50,000
- Province of Manitoba Accelerated Regional Roads 17,000 15,000 29,100 29,100 9,800 100,000
- Shared Health Capital Grant 1,877 1,569 779 22 4,247
- Transfer from Other Capital Accounts / Surplus Capital:Manitoba Winnipeg Infrastructure Agreement
100
Other Funders:
- Developer Funding / Developer Capacity Charges 2,586 2,586
- St. James 55+ Centre (Winnipeg Foundation) (250)
- Sponsorship / Sponsor Winnipeg 95 95 95 190
External Debt 45,449 38,187 34,969 17,626 6,817 3,647 5,708 106,954
Internal Financing 22,143 34,900 34,900
Retained Earnings - Transit 6,992 139 7,131
Transfers from Other Capital Accounts / Surplus Capital 3,984 10,747 2,000 12,747
Total Tax Supported, Transit and Municipal Accommodations 246,242 244,072 239,068 277,406 278,179 255,113 254,861 1,548,699
Appendix 10
Preliminary 2019 Budget - Appendices
3-57
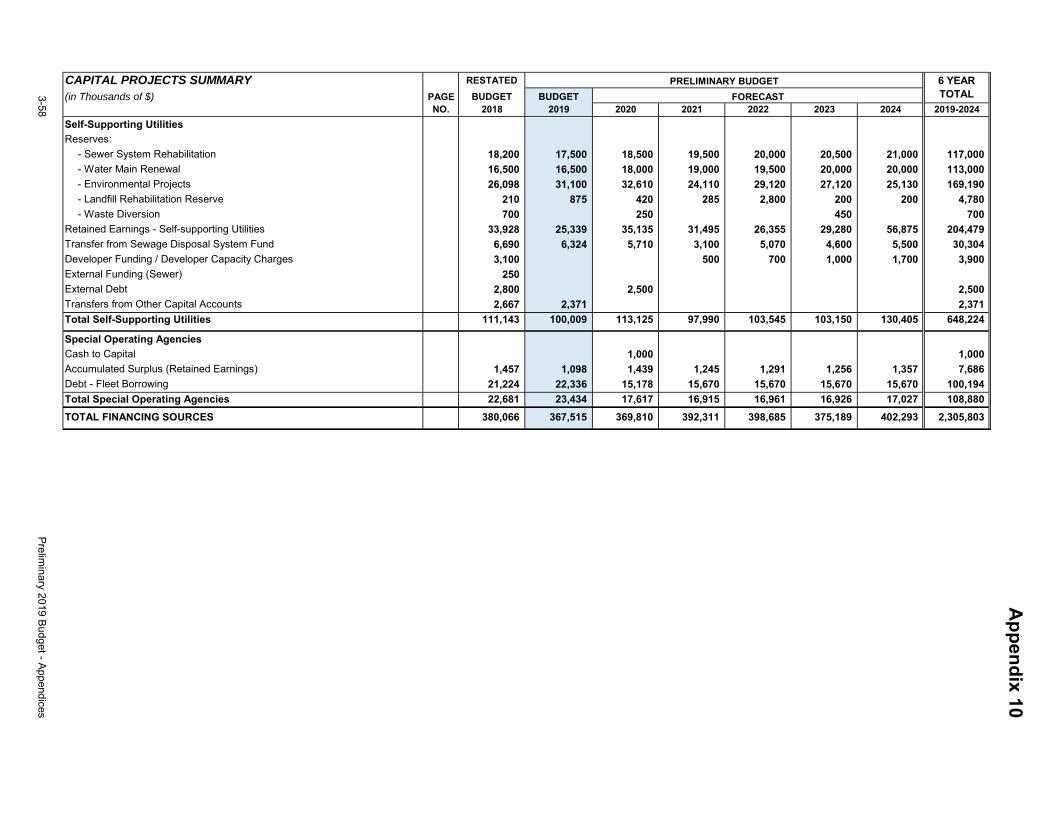
CAPITAL PROJECTS SUMMARY RESTATED
(in Thousands of $) PAGE BUDGET BUDGETNO. 2018 2019 2020 2021 2022 2023 2024 2019-2024
PRELIMINARY BUDGET
FORECAST
6 YEAR TOTAL
Self-Supporting Utilities
Reserves:
- Sewer System Rehabilitation 18,200 17,500 18,500 19,500 20,000 20,500 21,000 117,000
- Water Main Renewal 16,500 16,500 18,000 19,000 19,500 20,000 20,000 113,000
- Environmental Projects 26,098 31,100 32,610 24,110 29,120 27,120 25,130 169,190
- Landfill Rehabilitation Reserve 210 875 420 285 2,800 200 200 4,780
- Waste Diversion 700 250 450 700
Retained Earnings - Self-supporting Utilities 33,928 25,339 35,135 31,495 26,355 29,280 56,875 204,479
Transfer from Sewage Disposal System Fund 6,690 6,324 5,710 3,100 5,070 4,600 5,500 30,304
Developer Funding / Developer Capacity Charges 3,100 500 700 1,000 1,700 3,900
External Funding (Sewer) 250
External Debt 2,800 2,500 2,500
Transfers from Other Capital Accounts 2,667 2,371 2,371
Total Self-Supporting Utilities 111,143 100,009 113,125 97,990 103,545 103,150 130,405 648,224
Special Operating Agencies
Cash to Capital 1,000 1,000
Accumulated Surplus (Retained Earnings) 1,457 1,098 1,439 1,245 1,291 1,256 1,357 7,686
Debt - Fleet Borrowing 21,224 22,336 15,178 15,670 15,670 15,670 15,670 100,194
Total Special Operating Agencies 22,681 23,434 17,617 16,915 16,961 16,926 17,027 108,880
TOTAL FINANCING SOURCES 380,066 367,515 369,810 392,311 398,685 375,189 402,293 2,305,803
Appendix 10
3-58Prelim
inary 2019 Budget - Appendices
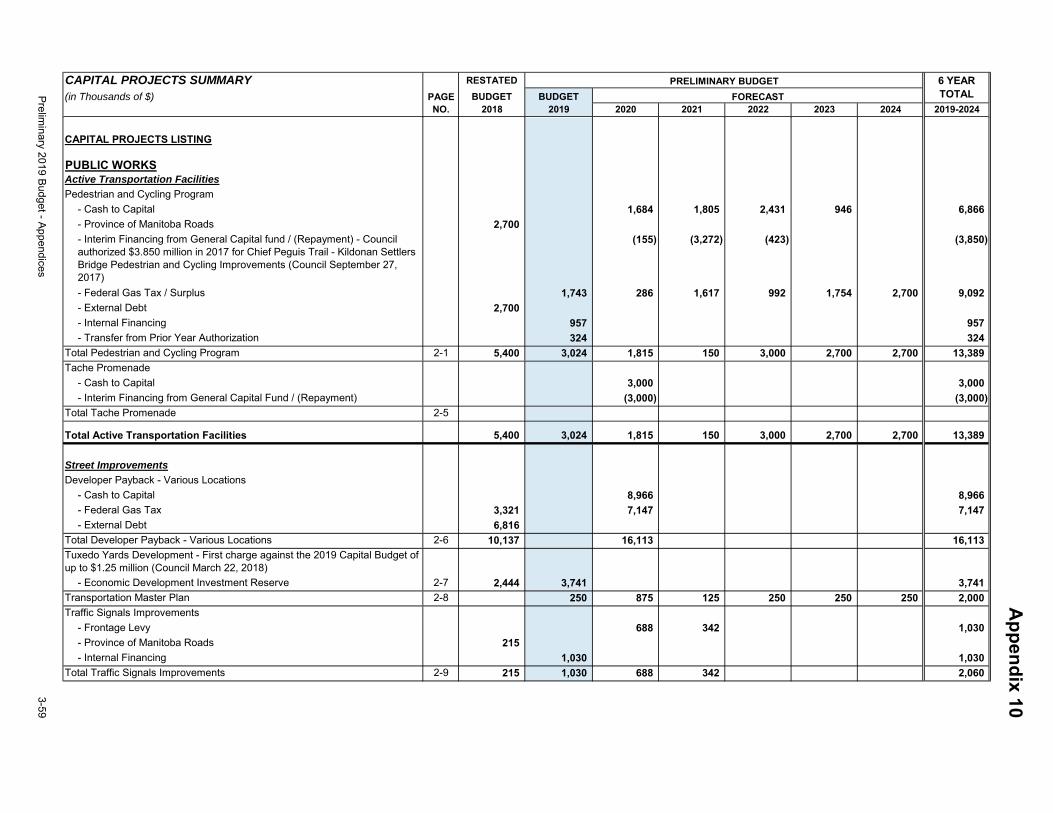
CAPITAL PROJECTS SUMMARY RESTATED
(in Thousands of $) PAGE BUDGET BUDGETNO. 2018 2019 2020 2021 2022 2023 2024 2019-2024
PRELIMINARY BUDGET
FORECAST
6 YEAR TOTAL
CAPITAL PROJECTS LISTING
PUBLIC WORKSActive Transportation Facilities
Pedestrian and Cycling Program
- Cash to Capital 1,684 1,805 2,431 946 6,866
- Province of Manitoba Roads 2,700
- Interim Financing from General Capital fund / (Repayment) - Council authorized $3.850 million in 2017 for Chief Peguis Trail - Kildonan Settlers Bridge Pedestrian and Cycling Improvements (Council September 27, 2017)
(155) (3,272) (423) (3,850)
- Federal Gas Tax / Surplus 1,743 286 1,617 992 1,754 2,700 9,092
- External Debt 2,700
- Internal Financing 957 957
- Transfer from Prior Year Authorization 324 324
Total Pedestrian and Cycling Program 2-1 5,400 3,024 1,815 150 3,000 2,700 2,700 13,389
Tache Promenade
- Cash to Capital 3,000 3,000
- Interim Financing from General Capital Fund / (Repayment) (3,000) (3,000)
Total Tache Promenade 2-5
Total Active Transportation Facilities 5,400 3,024 1,815 150 3,000 2,700 2,700 13,389
Street Improvements
Developer Payback - Various Locations
- Cash to Capital 8,966 8,966
- Federal Gas Tax 3,321 7,147 7,147
- External Debt 6,816
Total Developer Payback - Various Locations 2-6 10,137 16,113 16,113
Tuxedo Yards Development - First charge against the 2019 Capital Budget of up to $1.25 million (Council March 22, 2018)
- Economic Development Investment Reserve 2-7 2,444 3,741 3,741
Transportation Master Plan 2-8 250 875 125 250 250 250 2,000
Traffic Signals Improvements
- Frontage Levy 688 342 1,030
- Province of Manitoba Roads 215
- Internal Financing 1,030 1,030
Total Traffic Signals Improvements 2-9 215 1,030 688 342 2,060
Appendix 10
Preliminary 2019 Budget - Appendices
3-59
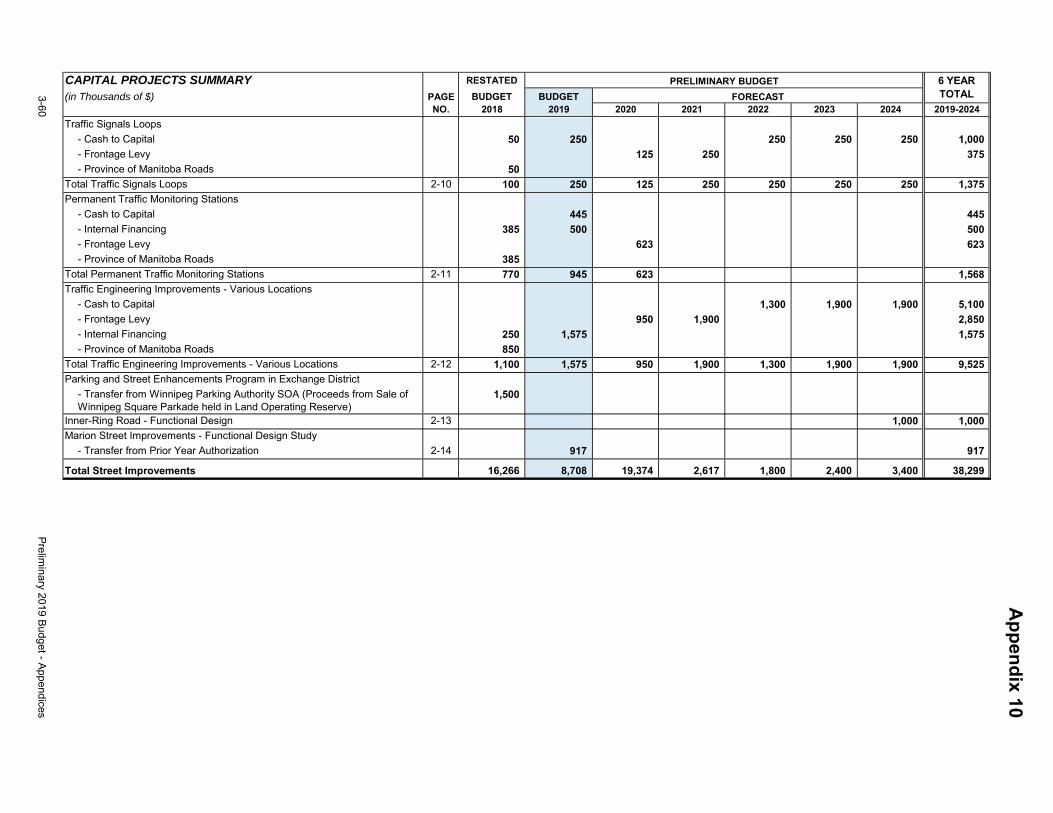
CAPITAL PROJECTS SUMMARY RESTATED
(in Thousands of $) PAGE BUDGET BUDGETNO. 2018 2019 2020 2021 2022 2023 2024 2019-2024
PRELIMINARY BUDGET
FORECAST
6 YEAR TOTAL
Traffic Signals Loops
- Cash to Capital 50 250 250 250 250 1,000
- Frontage Levy 125 250 375
- Province of Manitoba Roads 50
Total Traffic Signals Loops 2-10 100 250 125 250 250 250 250 1,375
Permanent Traffic Monitoring Stations
- Cash to Capital 445 445
- Internal Financing 385 500 500
- Frontage Levy 623 623
- Province of Manitoba Roads 385
Total Permanent Traffic Monitoring Stations 2-11 770 945 623 1,568
Traffic Engineering Improvements - Various Locations
- Cash to Capital 1,300 1,900 1,900 5,100
- Frontage Levy 950 1,900 2,850
- Internal Financing 250 1,575 1,575
- Province of Manitoba Roads 850
Total Traffic Engineering Improvements - Various Locations 2-12 1,100 1,575 950 1,900 1,300 1,900 1,900 9,525
Parking and Street Enhancements Program in Exchange District
- Transfer from Winnipeg Parking Authority SOA (Proceeds from Sale of Winnipeg Square Parkade held in Land Operating Reserve)
1,500
Inner-Ring Road - Functional Design 2-13 1,000 1,000
Marion Street Improvements - Functional Design Study
- Transfer from Prior Year Authorization 2-14 917 917
Total Street Improvements 16,266 8,708 19,374 2,617 1,800 2,400 3,400 38,299
Appendix 10
3-60Prelim
inary 2019 Budget - Appendices
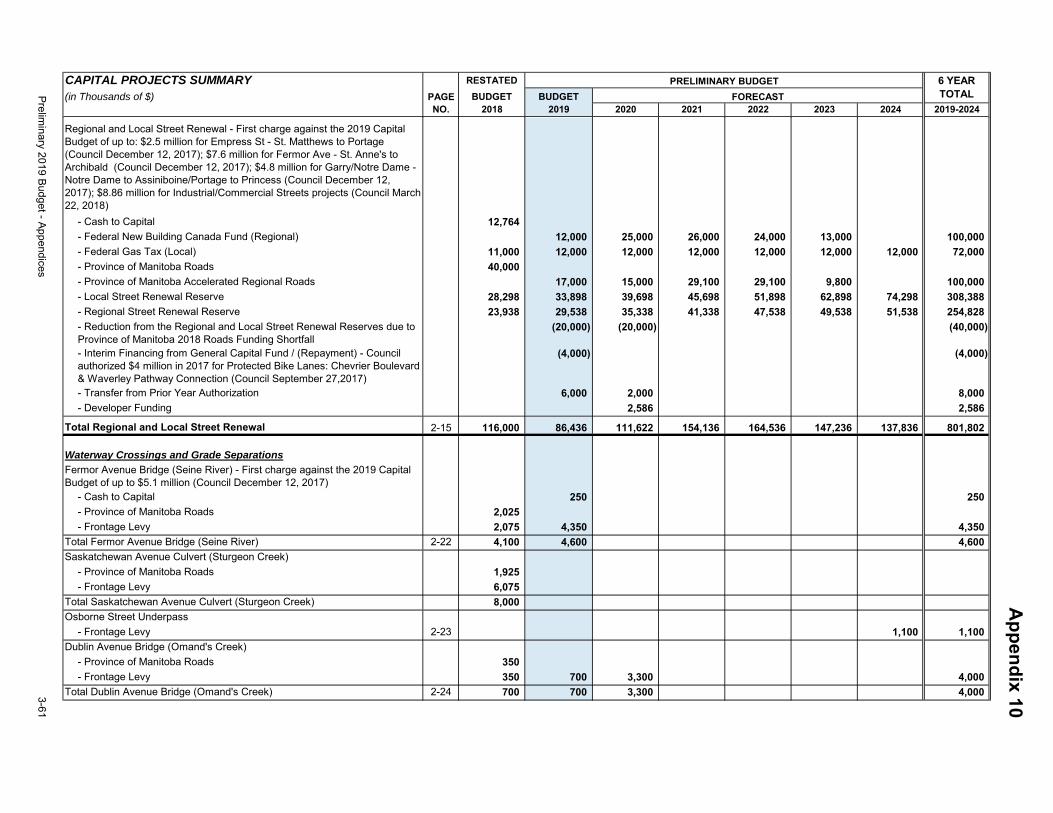
CAPITAL PROJECTS SUMMARY RESTATED
(in Thousands of $) PAGE BUDGET BUDGETNO. 2018 2019 2020 2021 2022 2023 2024 2019-2024
PRELIMINARY BUDGET
FORECAST
6 YEAR TOTAL
Regional and Local Street Renewal - First charge against the 2019 Capital Budget of up to: $2.5 million for Empress St - St. Matthews to Portage (Council December 12, 2017); $7.6 million for Fermor Ave - St. Anne's to Archibald (Council December 12, 2017); $4.8 million for Garry/Notre Dame - Notre Dame to Assiniboine/Portage to Princess (Council December 12, 2017); $8.86 million for Industrial/Commercial Streets projects (Council March 22, 2018)
- Cash to Capital 12,764
- Federal New Building Canada Fund (Regional) 12,000 25,000 26,000 24,000 13,000 100,000
- Federal Gas Tax (Local) 11,000 12,000 12,000 12,000 12,000 12,000 12,000 72,000
- Province of Manitoba Roads 40,000
- Province of Manitoba Accelerated Regional Roads 17,000 15,000 29,100 29,100 9,800 100,000
- Local Street Renewal Reserve 28,298 33,898 39,698 45,698 51,898 62,898 74,298 308,388
- Regional Street Renewal Reserve 23,938 29,538 35,338 41,338 47,538 49,538 51,538 254,828
- Reduction from the Regional and Local Street Renewal Reserves due to Province of Manitoba 2018 Roads Funding Shortfall
(20,000) (20,000) (40,000)
- Interim Financing from General Capital Fund / (Repayment) - Council authorized $4 million in 2017 for Protected Bike Lanes: Chevrier Boulevard & Waverley Pathway Connection (Council September 27,2017)
(4,000) (4,000)
- Transfer from Prior Year Authorization 6,000 2,000 8,000
- Developer Funding 2,586 2,586
Total Regional and Local Street Renewal 2-15 116,000 86,436 111,622 154,136 164,536 147,236 137,836 801,802
Waterway Crossings and Grade Separations
Fermor Avenue Bridge (Seine River) - First charge against the 2019 Capital Budget of up to $5.1 million (Council December 12, 2017)
- Cash to Capital 250 250
- Province of Manitoba Roads 2,025
- Frontage Levy 2,075 4,350 4,350
Total Fermor Avenue Bridge (Seine River) 2-22 4,100 4,600 4,600
Saskatchewan Avenue Culvert (Sturgeon Creek)
- Province of Manitoba Roads 1,925
- Frontage Levy 6,075
Total Saskatchewan Avenue Culvert (Sturgeon Creek) 8,000
Osborne Street Underpass
- Frontage Levy 2-23 1,100 1,100
Dublin Avenue Bridge (Omand's Creek)
- Province of Manitoba Roads 350
- Frontage Levy 350 700 3,300 4,000
Total Dublin Avenue Bridge (Omand's Creek) 2-24 700 700 3,300 4,000
Appendix 10
Preliminary 2019 Budget - Appendices
3-61
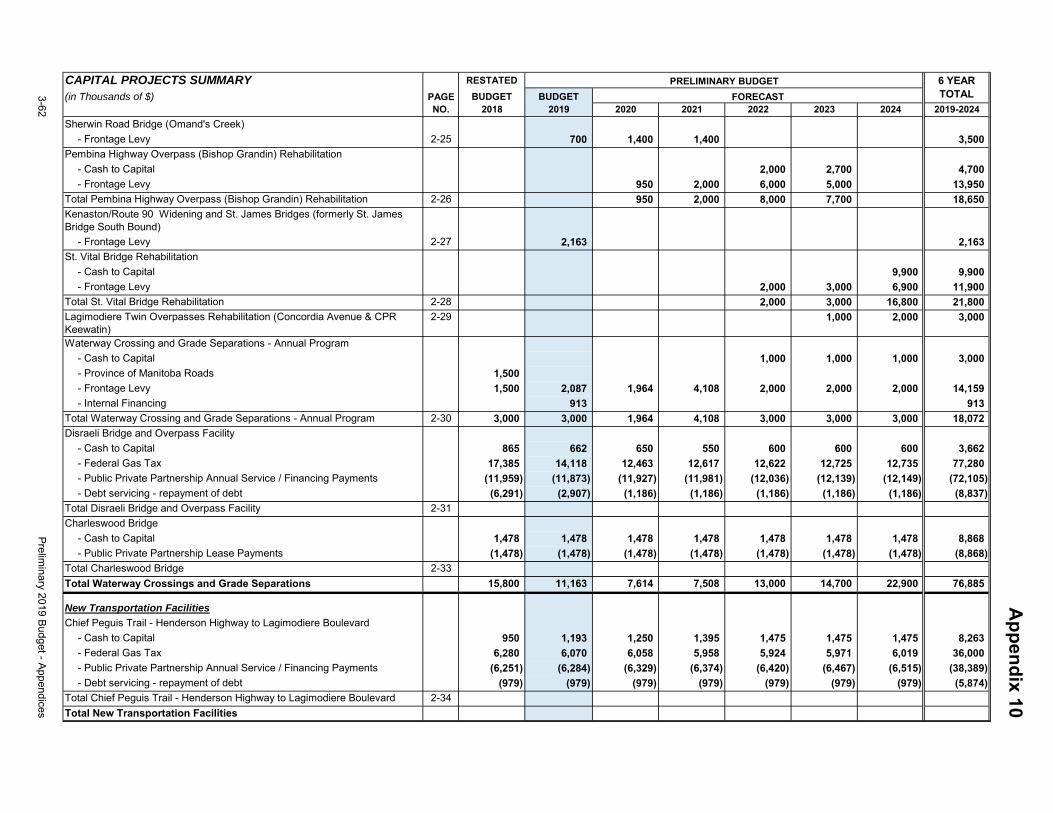
CAPITAL PROJECTS SUMMARY RESTATED
(in Thousands of $) PAGE BUDGET BUDGETNO. 2018 2019 2020 2021 2022 2023 2024 2019-2024
PRELIMINARY BUDGET
FORECAST
6 YEAR TOTAL
Sherwin Road Bridge (Omand's Creek)
- Frontage Levy 2-25 700 1,400 1,400 3,500
Pembina Highway Overpass (Bishop Grandin) Rehabilitation
- Cash to Capital 2,000 2,700 4,700
- Frontage Levy 950 2,000 6,000 5,000 13,950
Total Pembina Highway Overpass (Bishop Grandin) Rehabilitation 2-26 950 2,000 8,000 7,700 18,650
Kenaston/Route 90 Widening and St. James Bridges (formerly St. James Bridge South Bound)
- Frontage Levy 2-27 2,163 2,163
St. Vital Bridge Rehabilitation
- Cash to Capital 9,900 9,900
- Frontage Levy 2,000 3,000 6,900 11,900
Total St. Vital Bridge Rehabilitation 2-28 2,000 3,000 16,800 21,800
Lagimodiere Twin Overpasses Rehabilitation (Concordia Avenue & CPR Keewatin)
2-29 1,000 2,000 3,000
Waterway Crossing and Grade Separations - Annual Program
- Cash to Capital 1,000 1,000 1,000 3,000
- Province of Manitoba Roads 1,500
- Frontage Levy 1,500 2,087 1,964 4,108 2,000 2,000 2,000 14,159
- Internal Financing 913 913
Total Waterway Crossing and Grade Separations - Annual Program 2-30 3,000 3,000 1,964 4,108 3,000 3,000 3,000 18,072
Disraeli Bridge and Overpass Facility
- Cash to Capital 865 662 650 550 600 600 600 3,662
- Federal Gas Tax 17,385 14,118 12,463 12,617 12,622 12,725 12,735 77,280
- Public Private Partnership Annual Service / Financing Payments (11,959) (11,873) (11,927) (11,981) (12,036) (12,139) (12,149) (72,105)
- Debt servicing - repayment of debt (6,291) (2,907) (1,186) (1,186) (1,186) (1,186) (1,186) (8,837)
Total Disraeli Bridge and Overpass Facility 2-31
Charleswood Bridge
- Cash to Capital 1,478 1,478 1,478 1,478 1,478 1,478 1,478 8,868
- Public Private Partnership Lease Payments (1,478) (1,478) (1,478) (1,478) (1,478) (1,478) (1,478) (8,868)
Total Charleswood Bridge 2-33
Total Waterway Crossings and Grade Separations 15,800 11,163 7,614 7,508 13,000 14,700 22,900 76,885
New Transportation Facilities
Chief Peguis Trail - Henderson Highway to Lagimodiere Boulevard
- Cash to Capital 950 1,193 1,250 1,395 1,475 1,475 1,475 8,263
- Federal Gas Tax 6,280 6,070 6,058 5,958 5,924 5,971 6,019 36,000
- Public Private Partnership Annual Service / Financing Payments (6,251) (6,284) (6,329) (6,374) (6,420) (6,467) (6,515) (38,389)
- Debt servicing - repayment of debt (979) (979) (979) (979) (979) (979) (979) (5,874)
Total Chief Peguis Trail - Henderson Highway to Lagimodiere Boulevard 2-34
Total New Transportation Facilities
Appendix 10
3-62Prelim
inary 2019 Budget - Appendices
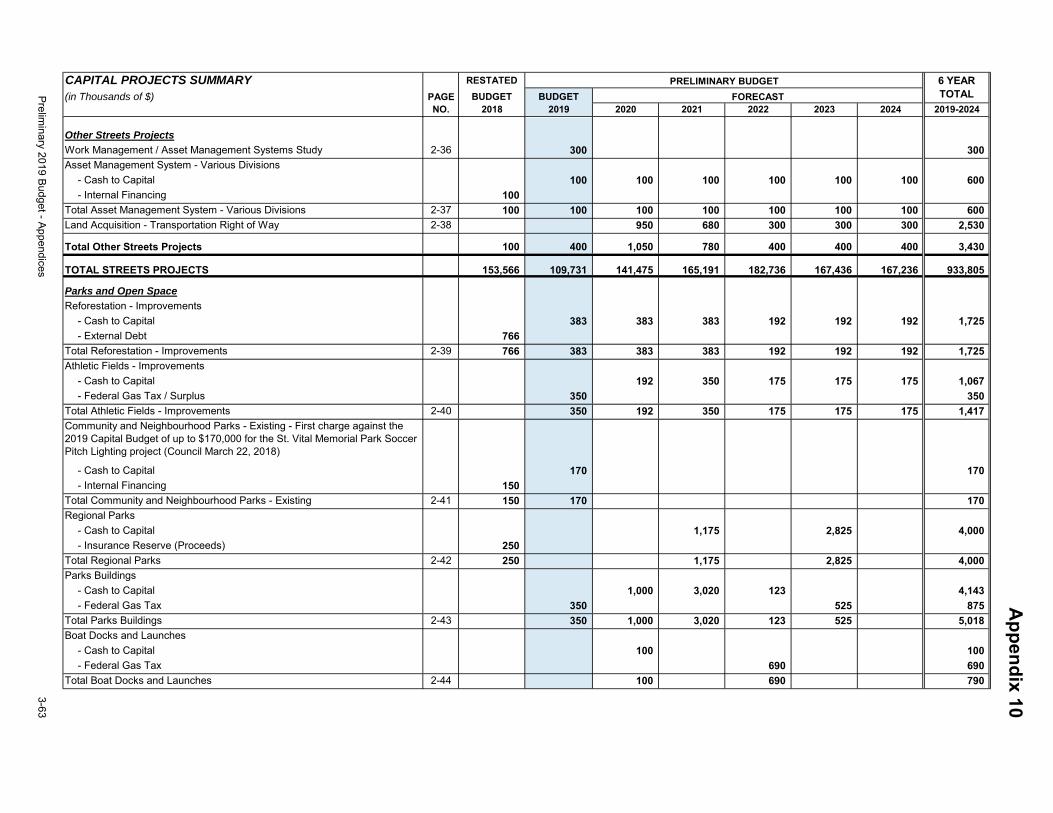
CAPITAL PROJECTS SUMMARY RESTATED
(in Thousands of $) PAGE BUDGET BUDGETNO. 2018 2019 2020 2021 2022 2023 2024 2019-2024
PRELIMINARY BUDGET
FORECAST
6 YEAR TOTAL
Other Streets Projects
Work Management / Asset Management Systems Study 2-36 300 300
Asset Management System - Various Divisions
- Cash to Capital 100 100 100 100 100 100 600
- Internal Financing 100
Total Asset Management System - Various Divisions 2-37 100 100 100 100 100 100 100 600
Land Acquisition - Transportation Right of Way 2-38 950 680 300 300 300 2,530
Total Other Streets Projects 100 400 1,050 780 400 400 400 3,430
TOTAL STREETS PROJECTS 153,566 109,731 141,475 165,191 182,736 167,436 167,236 933,805
Parks and Open Space
Reforestation - Improvements
- Cash to Capital 383 383 383 192 192 192 1,725
- External Debt 766
Total Reforestation - Improvements 2-39 766 383 383 383 192 192 192 1,725
Athletic Fields - Improvements
- Cash to Capital 192 350 175 175 175 1,067
- Federal Gas Tax / Surplus 350 350
Total Athletic Fields - Improvements 2-40 350 192 350 175 175 175 1,417
Community and Neighbourhood Parks - Existing - First charge against the 2019 Capital Budget of up to $170,000 for the St. Vital Memorial Park Soccer Pitch Lighting project (Council March 22, 2018)
- Cash to Capital 170 170
- Internal Financing 150
Total Community and Neighbourhood Parks - Existing 2-41 150 170 170
Regional Parks
- Cash to Capital 1,175 2,825 4,000
- Insurance Reserve (Proceeds) 250
Total Regional Parks 2-42 250 1,175 2,825 4,000
Parks Buildings
- Cash to Capital 1,000 3,020 123 4,143
- Federal Gas Tax 350 525 875
Total Parks Buildings 2-43 350 1,000 3,020 123 525 5,018
Boat Docks and Launches
- Cash to Capital 100 100
- Federal Gas Tax 690 690
Total Boat Docks and Launches 2-44 100 690 790
Appendix 10
Preliminary 2019 Budget - Appendices
3-63
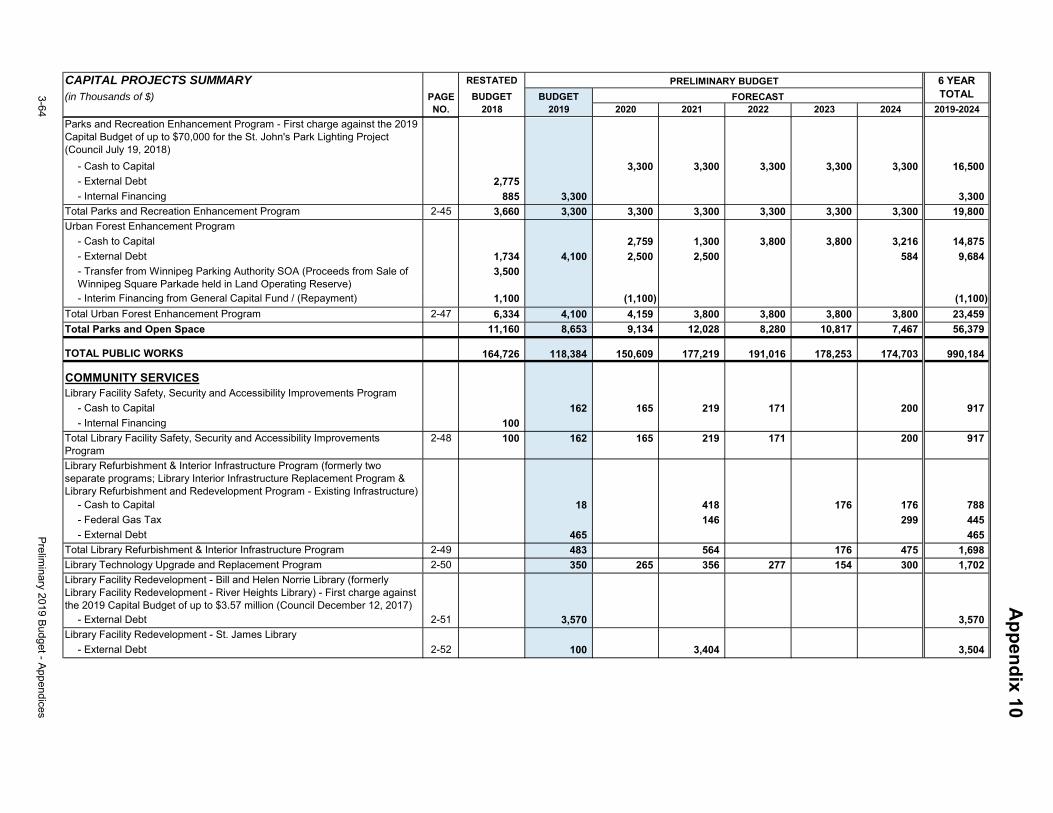
CAPITAL PROJECTS SUMMARY RESTATED
(in Thousands of $) PAGE BUDGET BUDGETNO. 2018 2019 2020 2021 2022 2023 2024 2019-2024
PRELIMINARY BUDGET
FORECAST
6 YEAR TOTAL
Parks and Recreation Enhancement Program - First charge against the 2019 Capital Budget of up to $70,000 for the St. John's Park Lighting Project (Council July 19, 2018)
- Cash to Capital 3,300 3,300 3,300 3,300 3,300 16,500
- External Debt 2,775
- Internal Financing 885 3,300 3,300
Total Parks and Recreation Enhancement Program 2-45 3,660 3,300 3,300 3,300 3,300 3,300 3,300 19,800
Urban Forest Enhancement Program
- Cash to Capital 2,759 1,300 3,800 3,800 3,216 14,875
- External Debt 1,734 4,100 2,500 2,500 584 9,684
- Transfer from Winnipeg Parking Authority SOA (Proceeds from Sale of Winnipeg Square Parkade held in Land Operating Reserve)
3,500
- Interim Financing from General Capital Fund / (Repayment) 1,100 (1,100) (1,100)
Total Urban Forest Enhancement Program 2-47 6,334 4,100 4,159 3,800 3,800 3,800 3,800 23,459
Total Parks and Open Space 11,160 8,653 9,134 12,028 8,280 10,817 7,467 56,379
TOTAL PUBLIC WORKS 164,726 118,384 150,609 177,219 191,016 178,253 174,703 990,184
COMMUNITY SERVICESLibrary Facility Safety, Security and Accessibility Improvements Program
- Cash to Capital 162 165 219 171 200 917
- Internal Financing 100
Total Library Facility Safety, Security and Accessibility Improvements Program
2-48 100 162 165 219 171 200 917
Library Refurbishment & Interior Infrastructure Program (formerly two separate programs; Library Interior Infrastructure Replacement Program & Library Refurbishment and Redevelopment Program - Existing Infrastructure)
- Cash to Capital 18 418 176 176 788
- Federal Gas Tax 146 299 445
- External Debt 465 465
Total Library Refurbishment & Interior Infrastructure Program 2-49 483 564 176 475 1,698
Library Technology Upgrade and Replacement Program 2-50 350 265 356 277 154 300 1,702
Library Facility Redevelopment - Bill and Helen Norrie Library (formerly Library Facility Redevelopment - River Heights Library) - First charge against the 2019 Capital Budget of up to $3.57 million (Council December 12, 2017)
- External Debt 2-51 3,570 3,570
Library Facility Redevelopment - St. James Library
- External Debt 2-52 100 3,404 3,504
Appendix 10
3-64Prelim
inary 2019 Budget - Appendices
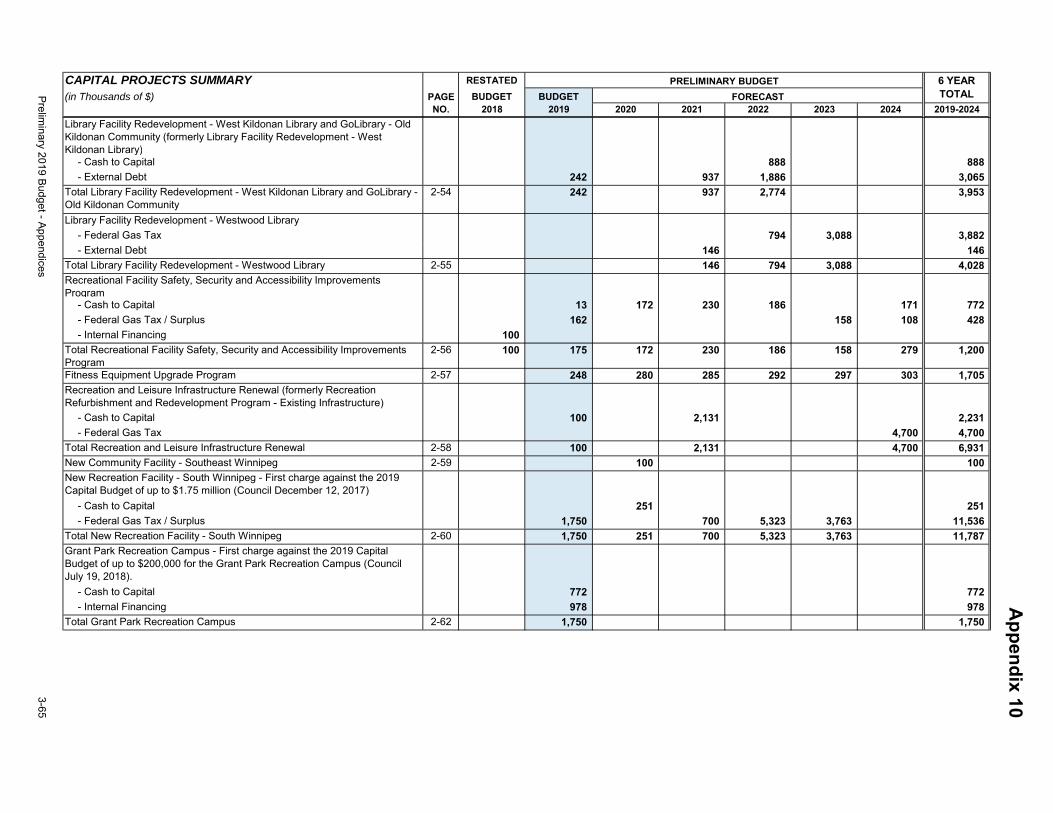
CAPITAL PROJECTS SUMMARY RESTATED
(in Thousands of $) PAGE BUDGET BUDGETNO. 2018 2019 2020 2021 2022 2023 2024 2019-2024
PRELIMINARY BUDGET
FORECAST
6 YEAR TOTAL
Library Facility Redevelopment - West Kildonan Library and GoLibrary - Old Kildonan Community (formerly Library Facility Redevelopment - West Kildonan Library)
- Cash to Capital 888 888
- External Debt 242 937 1,886 3,065
Total Library Facility Redevelopment - West Kildonan Library and GoLibrary - Old Kildonan Community
2-54 242 937 2,774 3,953
Library Facility Redevelopment - Westwood Library
- Federal Gas Tax 794 3,088 3,882
- External Debt 146 146
Total Library Facility Redevelopment - Westwood Library 2-55 146 794 3,088 4,028
Recreational Facility Safety, Security and Accessibility Improvements Program
- Cash to Capital 13 172 230 186 171 772
- Federal Gas Tax / Surplus 162 158 108 428
- Internal Financing 100
Total Recreational Facility Safety, Security and Accessibility Improvements Program
2-56 100 175 172 230 186 158 279 1,200
Fitness Equipment Upgrade Program 2-57 248 280 285 292 297 303 1,705
Recreation and Leisure Infrastructure Renewal (formerly Recreation Refurbishment and Redevelopment Program - Existing Infrastructure)
- Cash to Capital 100 2,131 2,231
- Federal Gas Tax 4,700 4,700
Total Recreation and Leisure Infrastructure Renewal 2-58 100 2,131 4,700 6,931
New Community Facility - Southeast Winnipeg 2-59 100 100
New Recreation Facility - South Winnipeg - First charge against the 2019 Capital Budget of up to $1.75 million (Council December 12, 2017)
- Cash to Capital 251 251
- Federal Gas Tax / Surplus 1,750 700 5,323 3,763 11,536
Total New Recreation Facility - South Winnipeg 2-60 1,750 251 700 5,323 3,763 11,787
Grant Park Recreation Campus - First charge against the 2019 Capital Budget of up to $200,000 for the Grant Park Recreation Campus (Council July 19, 2018).
- Cash to Capital 772 772
- Internal Financing 978 978
Total Grant Park Recreation Campus 2-62 1,750 1,750
Appendix 10
Preliminary 2019 Budget - Appendices
3-65
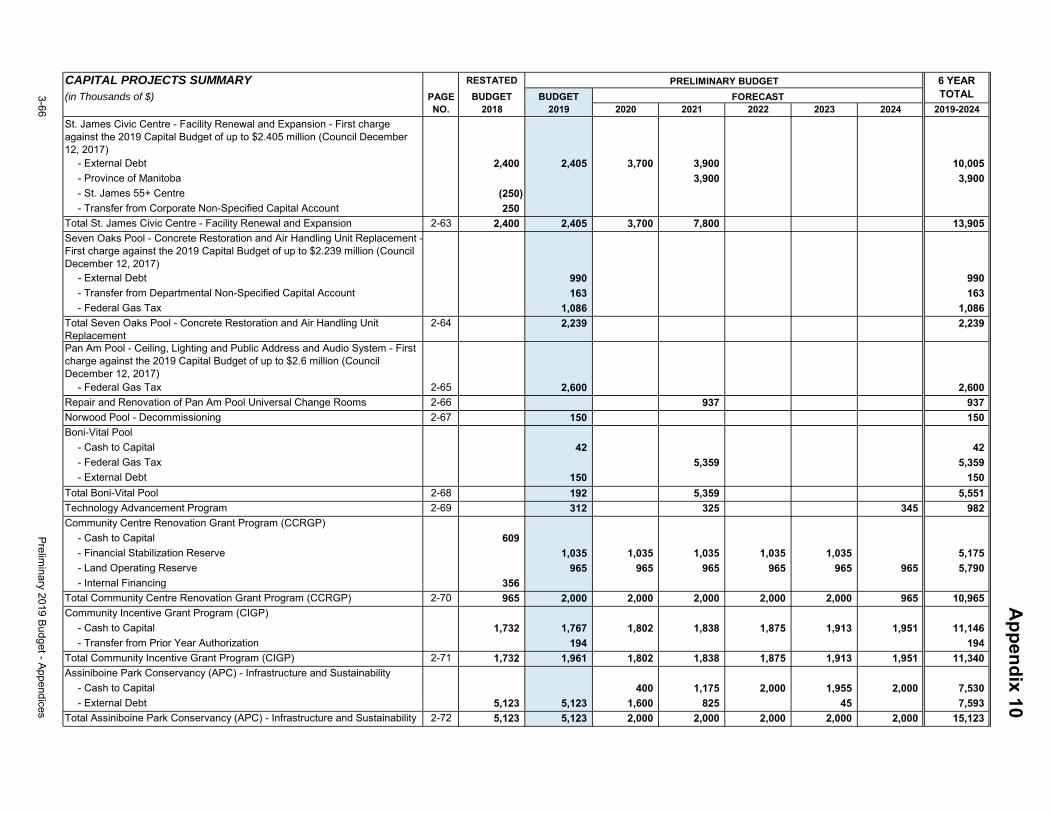
CAPITAL PROJECTS SUMMARY RESTATED
(in Thousands of $) PAGE BUDGET BUDGETNO. 2018 2019 2020 2021 2022 2023 2024 2019-2024
PRELIMINARY BUDGET
FORECAST
6 YEAR TOTAL
St. James Civic Centre - Facility Renewal and Expansion - First charge against the 2019 Capital Budget of up to $2.405 million (Council December 12, 2017)
- External Debt 2,400 2,405 3,700 3,900 10,005
- Province of Manitoba 3,900 3,900
- St. James 55+ Centre (250)
- Transfer from Corporate Non-Specified Capital Account 250
Total St. James Civic Centre - Facility Renewal and Expansion 2-63 2,400 2,405 3,700 7,800 13,905
Seven Oaks Pool - Concrete Restoration and Air Handling Unit Replacement -First charge against the 2019 Capital Budget of up to $2.239 million (Council December 12, 2017)
- External Debt 990 990
- Transfer from Departmental Non-Specified Capital Account 163 163
- Federal Gas Tax 1,086 1,086
Total Seven Oaks Pool - Concrete Restoration and Air Handling Unit Replacement
2-64 2,239 2,239
Pan Am Pool - Ceiling, Lighting and Public Address and Audio System - First charge against the 2019 Capital Budget of up to $2.6 million (Council December 12, 2017)
- Federal Gas Tax 2-65 2,600 2,600
Repair and Renovation of Pan Am Pool Universal Change Rooms 2-66 937 937
Norwood Pool - Decommissioning 2-67 150 150
Boni-Vital Pool
- Cash to Capital 42 42
- Federal Gas Tax 5,359 5,359
- External Debt 150 150
Total Boni-Vital Pool 2-68 192 5,359 5,551
Technology Advancement Program 2-69 312 325 345 982
Community Centre Renovation Grant Program (CCRGP)
- Cash to Capital 609
- Financial Stabilization Reserve 1,035 1,035 1,035 1,035 1,035 5,175
- Land Operating Reserve 965 965 965 965 965 965 5,790
- Internal Financing 356
Total Community Centre Renovation Grant Program (CCRGP) 2-70 965 2,000 2,000 2,000 2,000 2,000 965 10,965
Community Incentive Grant Program (CIGP)
- Cash to Capital 1,732 1,767 1,802 1,838 1,875 1,913 1,951 11,146
- Transfer from Prior Year Authorization 194 194
Total Community Incentive Grant Program (CIGP) 2-71 1,732 1,961 1,802 1,838 1,875 1,913 1,951 11,340
Assiniboine Park Conservancy (APC) - Infrastructure and Sustainability
- Cash to Capital 400 1,175 2,000 1,955 2,000 7,530
- External Debt 5,123 5,123 1,600 825 45 7,593
Total Assiniboine Park Conservancy (APC) - Infrastructure and Sustainability 2-72 5,123 5,123 2,000 2,000 2,000 2,000 2,000 15,123
Appendix 10
3-66Prelim
inary 2019 Budget - Appendices
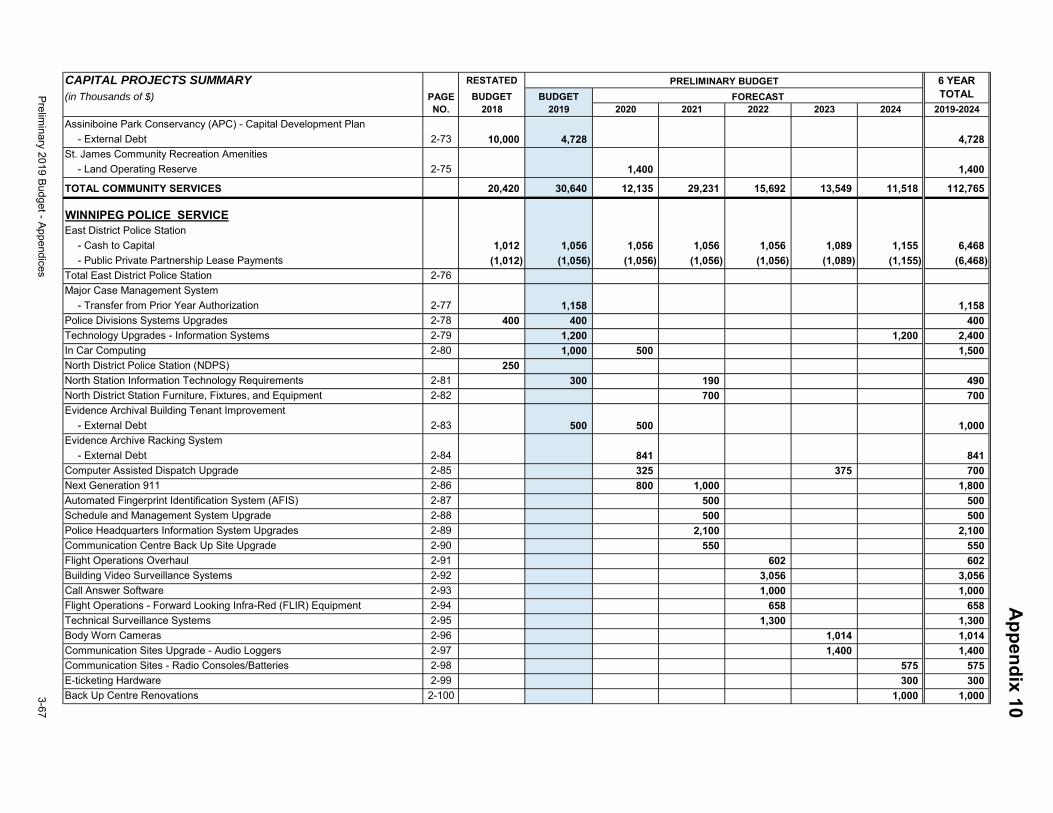
CAPITAL PROJECTS SUMMARY RESTATED
(in Thousands of $) PAGE BUDGET BUDGETNO. 2018 2019 2020 2021 2022 2023 2024 2019-2024
PRELIMINARY BUDGET
FORECAST
6 YEAR TOTAL
Assiniboine Park Conservancy (APC) - Capital Development Plan
- External Debt 2-73 10,000 4,728 4,728
St. James Community Recreation Amenities
- Land Operating Reserve 2-75 1,400 1,400
TOTAL COMMUNITY SERVICES 20,420 30,640 12,135 29,231 15,692 13,549 11,518 112,765
WINNIPEG POLICE SERVICEEast District Police Station
- Cash to Capital 1,012 1,056 1,056 1,056 1,056 1,089 1,155 6,468
- Public Private Partnership Lease Payments (1,012) (1,056) (1,056) (1,056) (1,056) (1,089) (1,155) (6,468)
Total East District Police Station 2-76
Major Case Management System
- Transfer from Prior Year Authorization 2-77 1,158 1,158
Police Divisions Systems Upgrades 2-78 400 400 400
Technology Upgrades - Information Systems 2-79 1,200 1,200 2,400
In Car Computing 2-80 1,000 500 1,500
North District Police Station (NDPS) 250
North Station Information Technology Requirements 2-81 300 190 490
North District Station Furniture, Fixtures, and Equipment 2-82 700 700
Evidence Archival Building Tenant Improvement
- External Debt 2-83 500 500 1,000
Evidence Archive Racking System
- External Debt 2-84 841 841
Computer Assisted Dispatch Upgrade 2-85 325 375 700
Next Generation 911 2-86 800 1,000 1,800
Automated Fingerprint Identification System (AFIS) 2-87 500 500
Schedule and Management System Upgrade 2-88 500 500
Police Headquarters Information System Upgrades 2-89 2,100 2,100
Communication Centre Back Up Site Upgrade 2-90 550 550
Flight Operations Overhaul 2-91 602 602
Building Video Surveillance Systems 2-92 3,056 3,056
Call Answer Software 2-93 1,000 1,000
Flight Operations - Forward Looking Infra-Red (FLIR) Equipment 2-94 658 658
Technical Surveillance Systems 2-95 1,300 1,300
Body Worn Cameras 2-96 1,014 1,014
Communication Sites Upgrade - Audio Loggers 2-97 1,400 1,400
Communication Sites - Radio Consoles/Batteries 2-98 575 575
E-ticketing Hardware 2-99 300 300
Back Up Centre Renovations 2-100 1,000 1,000
Appendix 10
Preliminary 2019 Budget - Appendices
3-67
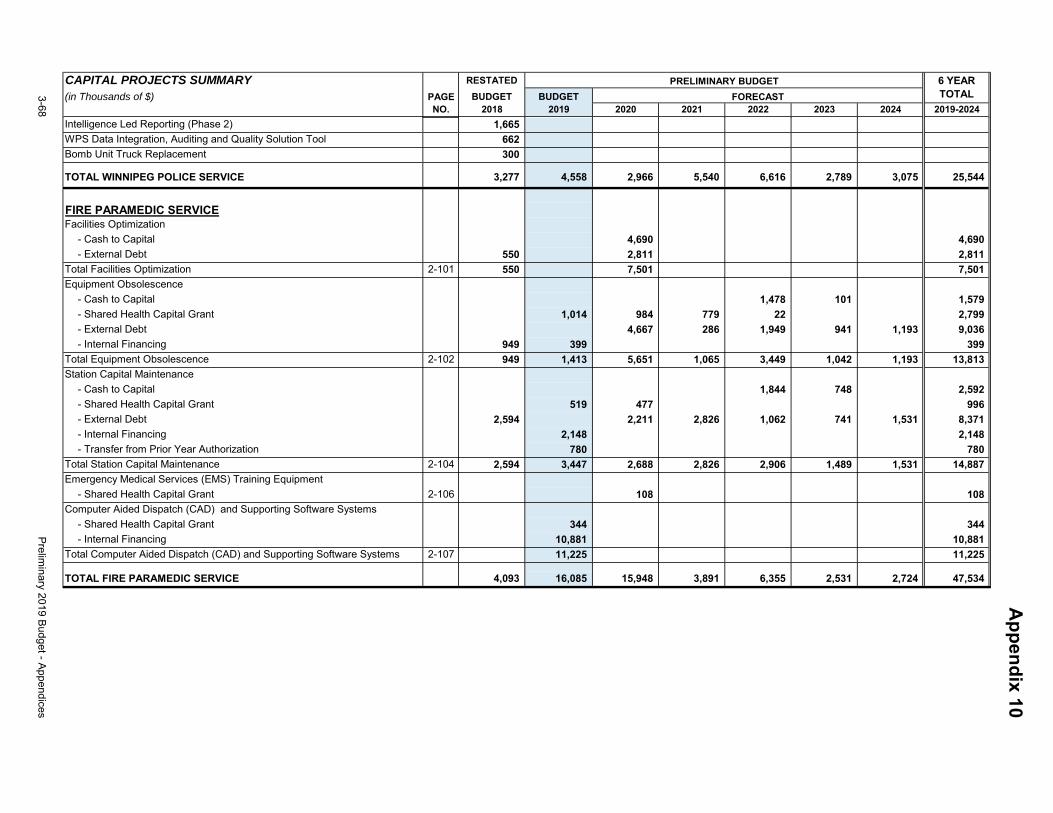
CAPITAL PROJECTS SUMMARY RESTATED
(in Thousands of $) PAGE BUDGET BUDGETNO. 2018 2019 2020 2021 2022 2023 2024 2019-2024
PRELIMINARY BUDGET
FORECAST
6 YEAR TOTAL
Intelligence Led Reporting (Phase 2) 1,665
WPS Data Integration, Auditing and Quality Solution Tool 662
Bomb Unit Truck Replacement 300
TOTAL WINNIPEG POLICE SERVICE 3,277 4,558 2,966 5,540 6,616 2,789 3,075 25,544
FIRE PARAMEDIC SERVICEFacilities Optimization
- Cash to Capital 4,690 4,690
- External Debt 550 2,811 2,811
Total Facilities Optimization 2-101 550 7,501 7,501
Equipment Obsolescence
- Cash to Capital 1,478 101 1,579
- Shared Health Capital Grant 1,014 984 779 22 2,799
- External Debt 4,667 286 1,949 941 1,193 9,036
- Internal Financing 949 399 399
Total Equipment Obsolescence 2-102 949 1,413 5,651 1,065 3,449 1,042 1,193 13,813
Station Capital Maintenance
- Cash to Capital 1,844 748 2,592
- Shared Health Capital Grant 519 477 996
- External Debt 2,594 2,211 2,826 1,062 741 1,531 8,371
- Internal Financing 2,148 2,148
- Transfer from Prior Year Authorization 780 780
Total Station Capital Maintenance 2-104 2,594 3,447 2,688 2,826 2,906 1,489 1,531 14,887
Emergency Medical Services (EMS) Training Equipment
- Shared Health Capital Grant 2-106 108 108
Computer Aided Dispatch (CAD) and Supporting Software Systems
- Shared Health Capital Grant 344 344
- Internal Financing 10,881 10,881
Total Computer Aided Dispatch (CAD) and Supporting Software Systems 2-107 11,225 11,225
TOTAL FIRE PARAMEDIC SERVICE 4,093 16,085 15,948 3,891 6,355 2,531 2,724 47,534
Appendix 10
3-68Prelim
inary 2019 Budget - Appendices
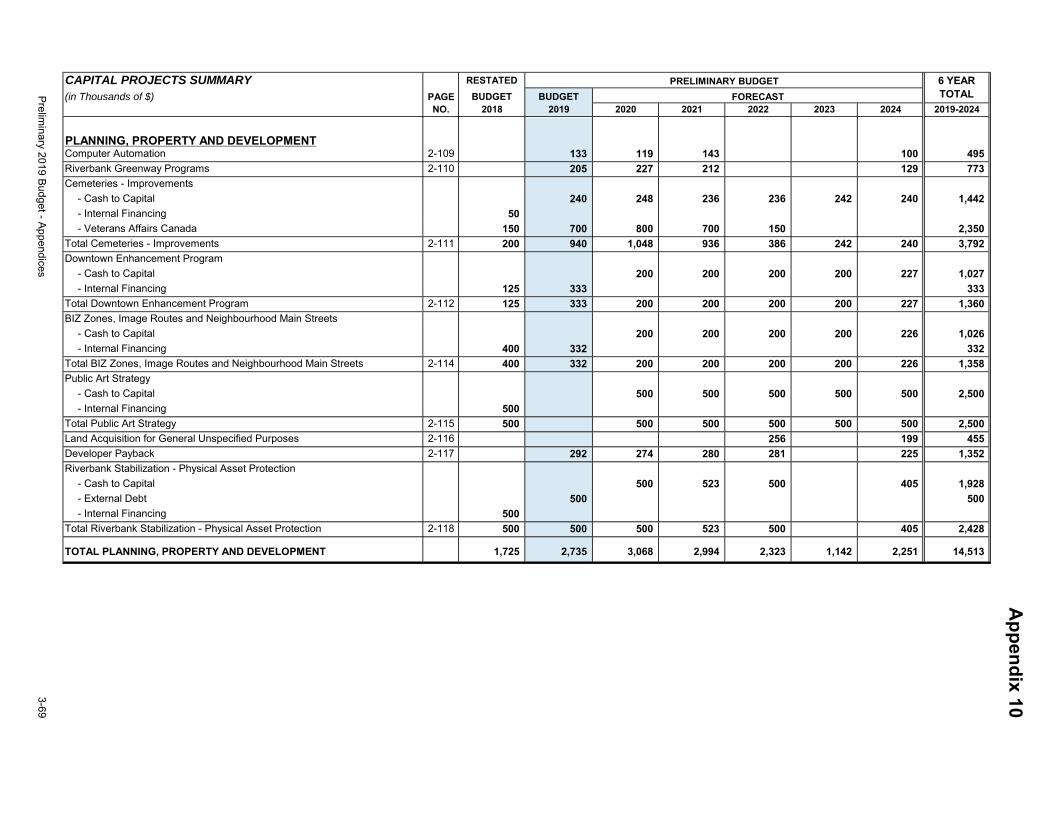
CAPITAL PROJECTS SUMMARY RESTATED
(in Thousands of $) PAGE BUDGET BUDGETNO. 2018 2019 2020 2021 2022 2023 2024 2019-2024
PRELIMINARY BUDGET
FORECAST
6 YEAR TOTAL
PLANNING, PROPERTY AND DEVELOPMENTComputer Automation 2-109 133 119 143 100 495
Riverbank Greenway Programs 2-110 205 227 212 129 773
Cemeteries - Improvements
- Cash to Capital 240 248 236 236 242 240 1,442
- Internal Financing 50
- Veterans Affairs Canada 150 700 800 700 150 2,350
Total Cemeteries - Improvements 2-111 200 940 1,048 936 386 242 240 3,792
Downtown Enhancement Program
- Cash to Capital 200 200 200 200 227 1,027
- Internal Financing 125 333 333
Total Downtown Enhancement Program 2-112 125 333 200 200 200 200 227 1,360
BIZ Zones, Image Routes and Neighbourhood Main Streets
- Cash to Capital 200 200 200 200 226 1,026
- Internal Financing 400 332 332
Total BIZ Zones, Image Routes and Neighbourhood Main Streets 2-114 400 332 200 200 200 200 226 1,358
Public Art Strategy
- Cash to Capital 500 500 500 500 500 2,500
- Internal Financing 500
Total Public Art Strategy 2-115 500 500 500 500 500 500 2,500
Land Acquisition for General Unspecified Purposes 2-116 256 199 455
Developer Payback 2-117 292 274 280 281 225 1,352
Riverbank Stabilization - Physical Asset Protection
- Cash to Capital 500 523 500 405 1,928
- External Debt 500 500
- Internal Financing 500
Total Riverbank Stabilization - Physical Asset Protection 2-118 500 500 500 523 500 405 2,428
TOTAL PLANNING, PROPERTY AND DEVELOPMENT 1,725 2,735 3,068 2,994 2,323 1,142 2,251 14,513
Appendix 10
Preliminary 2019 Budget - Appendices
3-69
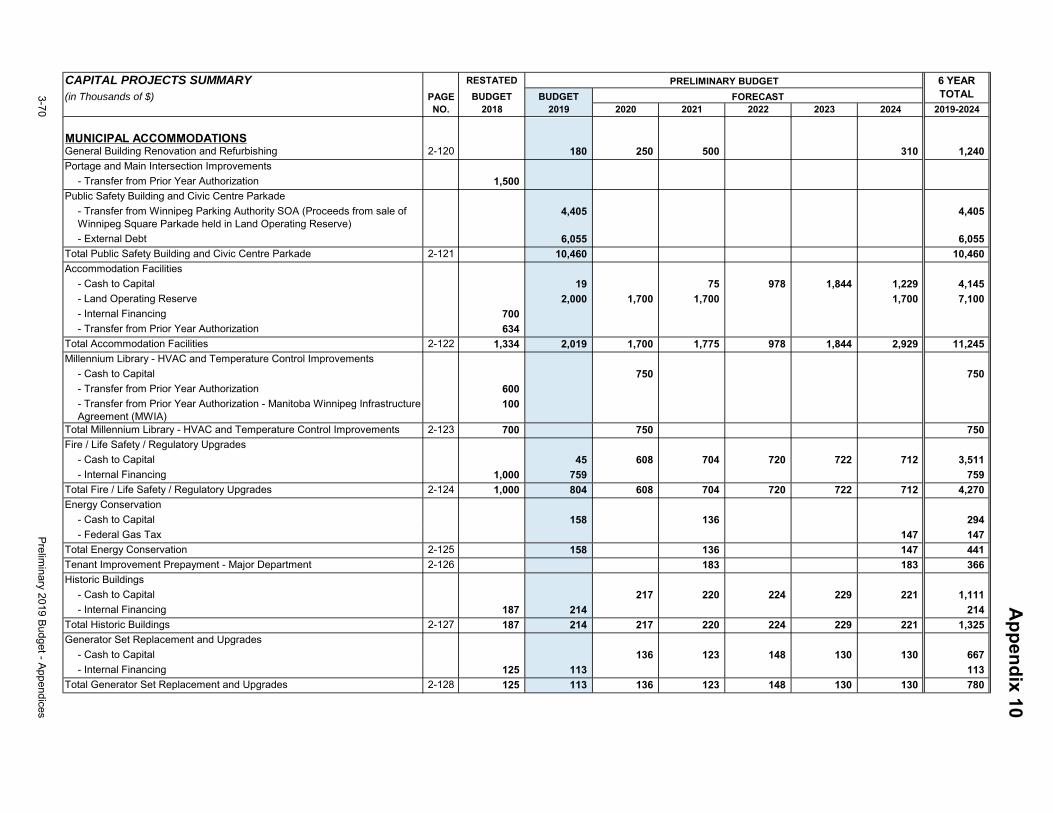
CAPITAL PROJECTS SUMMARY RESTATED
(in Thousands of $) PAGE BUDGET BUDGETNO. 2018 2019 2020 2021 2022 2023 2024 2019-2024
PRELIMINARY BUDGET
FORECAST
6 YEAR TOTAL
MUNICIPAL ACCOMMODATIONSGeneral Building Renovation and Refurbishing 2-120 180 250 500 310 1,240
Portage and Main Intersection Improvements
- Transfer from Prior Year Authorization 1,500
Public Safety Building and Civic Centre Parkade
- Transfer from Winnipeg Parking Authority SOA (Proceeds from sale of Winnipeg Square Parkade held in Land Operating Reserve)
4,405 4,405
- External Debt 6,055 6,055
Total Public Safety Building and Civic Centre Parkade 2-121 10,460 10,460
Accommodation Facilities
- Cash to Capital 19 75 978 1,844 1,229 4,145
- Land Operating Reserve 2,000 1,700 1,700 1,700 7,100
- Internal Financing 700
- Transfer from Prior Year Authorization 634
Total Accommodation Facilities 2-122 1,334 2,019 1,700 1,775 978 1,844 2,929 11,245
Millennium Library - HVAC and Temperature Control Improvements
- Cash to Capital 750 750
- Transfer from Prior Year Authorization 600
- Transfer from Prior Year Authorization - Manitoba Winnipeg Infrastructure Agreement (MWIA)
100
Total Millennium Library - HVAC and Temperature Control Improvements 2-123 700 750 750
Fire / Life Safety / Regulatory Upgrades
- Cash to Capital 45 608 704 720 722 712 3,511
- Internal Financing 1,000 759 759
Total Fire / Life Safety / Regulatory Upgrades 2-124 1,000 804 608 704 720 722 712 4,270
Energy Conservation
- Cash to Capital 158 136 294
- Federal Gas Tax 147 147
Total Energy Conservation 2-125 158 136 147 441
Tenant Improvement Prepayment - Major Department 2-126 183 183 366
Historic Buildings
- Cash to Capital 217 220 224 229 221 1,111
- Internal Financing 187 214 214
Total Historic Buildings 2-127 187 214 217 220 224 229 221 1,325
Generator Set Replacement and Upgrades
- Cash to Capital 136 123 148 130 130 667
- Internal Financing 125 113 113
Total Generator Set Replacement and Upgrades 2-128 125 113 136 123 148 130 130 780
Appendix 10
3-70Prelim
inary 2019 Budget - Appendices
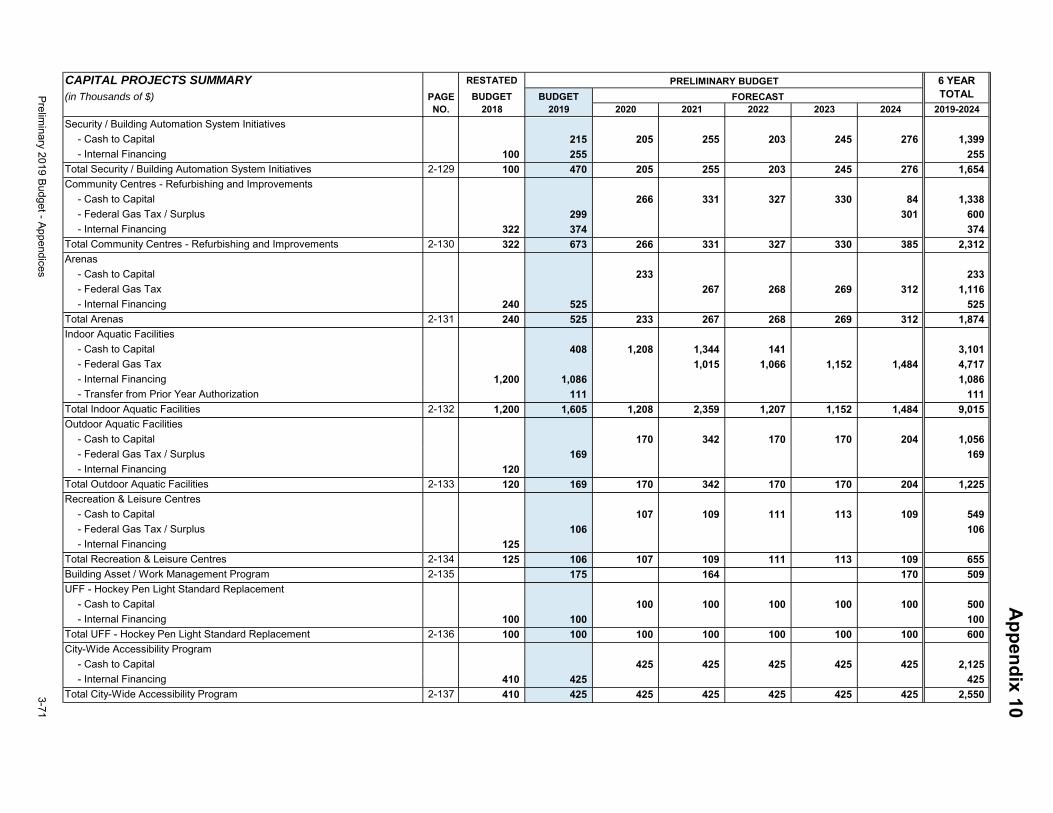
CAPITAL PROJECTS SUMMARY RESTATED
(in Thousands of $) PAGE BUDGET BUDGETNO. 2018 2019 2020 2021 2022 2023 2024 2019-2024
PRELIMINARY BUDGET
FORECAST
6 YEAR TOTAL
Security / Building Automation System Initiatives
- Cash to Capital 215 205 255 203 245 276 1,399
- Internal Financing 100 255 255
Total Security / Building Automation System Initiatives 2-129 100 470 205 255 203 245 276 1,654
Community Centres - Refurbishing and Improvements
- Cash to Capital 266 331 327 330 84 1,338
- Federal Gas Tax / Surplus 299 301 600
- Internal Financing 322 374 374
Total Community Centres - Refurbishing and Improvements 2-130 322 673 266 331 327 330 385 2,312
Arenas
- Cash to Capital 233 233
- Federal Gas Tax 267 268 269 312 1,116
- Internal Financing 240 525 525
Total Arenas 2-131 240 525 233 267 268 269 312 1,874
Indoor Aquatic Facilities
- Cash to Capital 408 1,208 1,344 141 3,101
- Federal Gas Tax 1,015 1,066 1,152 1,484 4,717
- Internal Financing 1,200 1,086 1,086
- Transfer from Prior Year Authorization 111 111
Total Indoor Aquatic Facilities 2-132 1,200 1,605 1,208 2,359 1,207 1,152 1,484 9,015
Outdoor Aquatic Facilities
- Cash to Capital 170 342 170 170 204 1,056
- Federal Gas Tax / Surplus 169 169
- Internal Financing 120
Total Outdoor Aquatic Facilities 2-133 120 169 170 342 170 170 204 1,225
Recreation & Leisure Centres
- Cash to Capital 107 109 111 113 109 549
- Federal Gas Tax / Surplus 106 106
- Internal Financing 125
Total Recreation & Leisure Centres 2-134 125 106 107 109 111 113 109 655
Building Asset / Work Management Program 2-135 175 164 170 509
UFF - Hockey Pen Light Standard Replacement
- Cash to Capital 100 100 100 100 100 500
- Internal Financing 100 100 100
Total UFF - Hockey Pen Light Standard Replacement 2-136 100 100 100 100 100 100 100 600
City-Wide Accessibility Program
- Cash to Capital 425 425 425 425 425 2,125
- Internal Financing 410 425 425
Total City-Wide Accessibility Program 2-137 410 425 425 425 425 425 425 2,550
Appendix 10
Preliminary 2019 Budget - Appendices
3-71
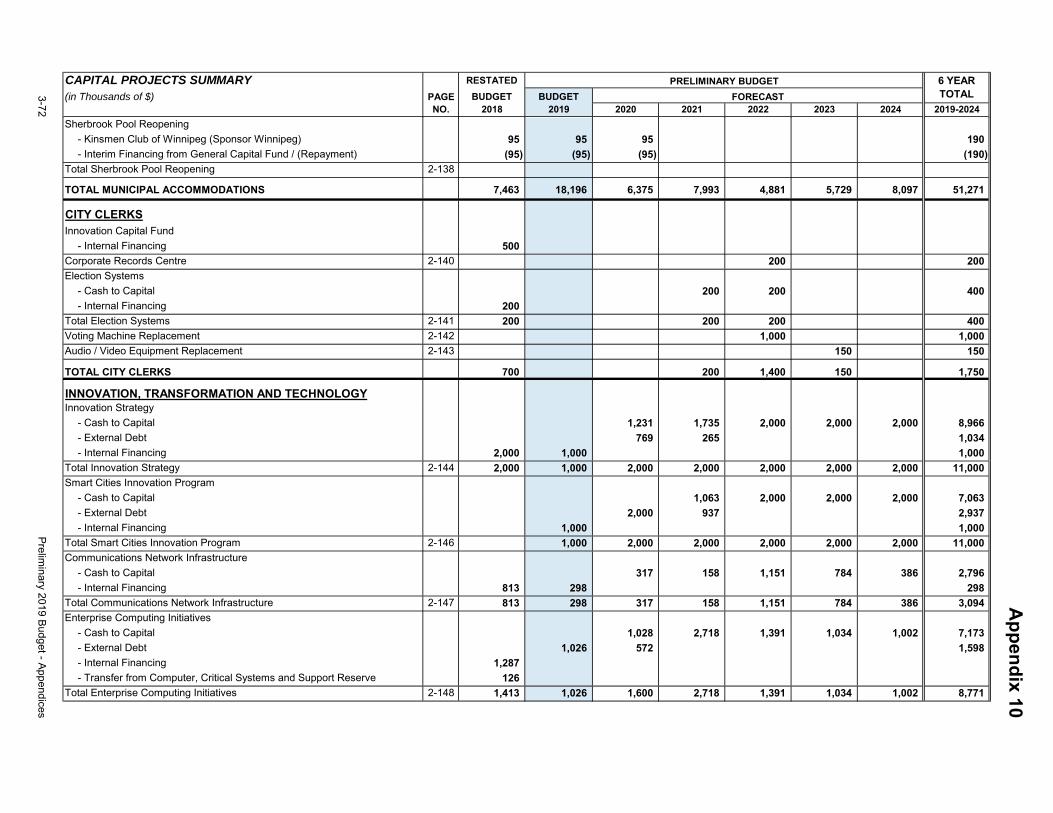
CAPITAL PROJECTS SUMMARY RESTATED
(in Thousands of $) PAGE BUDGET BUDGETNO. 2018 2019 2020 2021 2022 2023 2024 2019-2024
PRELIMINARY BUDGET
FORECAST
6 YEAR TOTAL
Sherbrook Pool Reopening
- Kinsmen Club of Winnipeg (Sponsor Winnipeg) 95 95 95 190
- Interim Financing from General Capital Fund / (Repayment) (95) (95) (95) (190)
Total Sherbrook Pool Reopening 2-138
TOTAL MUNICIPAL ACCOMMODATIONS 7,463 18,196 6,375 7,993 4,881 5,729 8,097 51,271
CITY CLERKSInnovation Capital Fund
- Internal Financing 500
Corporate Records Centre 2-140 200 200
Election Systems
- Cash to Capital 200 200 400
- Internal Financing 200
Total Election Systems 2-141 200 200 200 400
Voting Machine Replacement 2-142 1,000 1,000
Audio / Video Equipment Replacement 2-143 150 150
TOTAL CITY CLERKS 700 200 1,400 150 1,750
INNOVATION, TRANSFORMATION AND TECHNOLOGYInnovation Strategy
- Cash to Capital 1,231 1,735 2,000 2,000 2,000 8,966
- External Debt 769 265 1,034
- Internal Financing 2,000 1,000 1,000
Total Innovation Strategy 2-144 2,000 1,000 2,000 2,000 2,000 2,000 2,000 11,000
Smart Cities Innovation Program
- Cash to Capital 1,063 2,000 2,000 2,000 7,063
- External Debt 2,000 937 2,937
- Internal Financing 1,000 1,000
Total Smart Cities Innovation Program 2-146 1,000 2,000 2,000 2,000 2,000 2,000 11,000
Communications Network Infrastructure
- Cash to Capital 317 158 1,151 784 386 2,796
- Internal Financing 813 298 298
Total Communications Network Infrastructure 2-147 813 298 317 158 1,151 784 386 3,094
Enterprise Computing Initiatives
- Cash to Capital 1,028 2,718 1,391 1,034 1,002 7,173
- External Debt 1,026 572 1,598
- Internal Financing 1,287
- Transfer from Computer, Critical Systems and Support Reserve 126
Total Enterprise Computing Initiatives 2-148 1,413 1,026 1,600 2,718 1,391 1,034 1,002 8,771
Appendix 10
3-72Prelim
inary 2019 Budget - Appendices
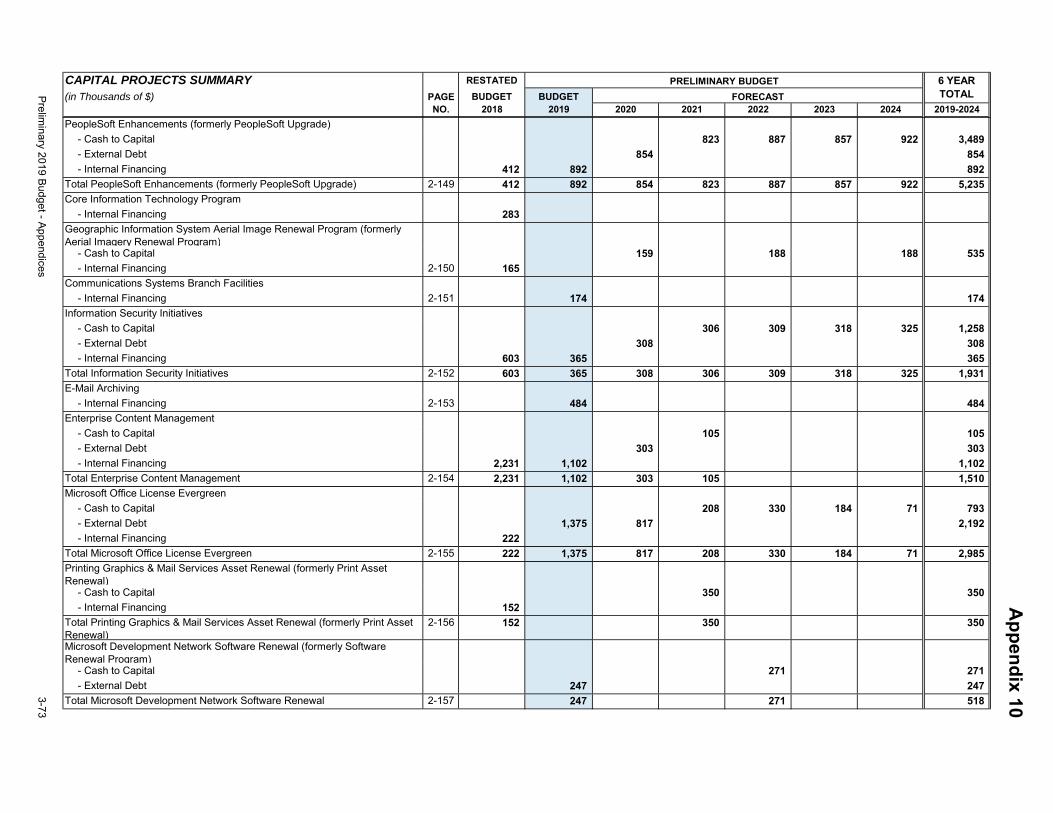
CAPITAL PROJECTS SUMMARY RESTATED
(in Thousands of $) PAGE BUDGET BUDGETNO. 2018 2019 2020 2021 2022 2023 2024 2019-2024
PRELIMINARY BUDGET
FORECAST
6 YEAR TOTAL
PeopleSoft Enhancements (formerly PeopleSoft Upgrade)
- Cash to Capital 823 887 857 922 3,489
- External Debt 854 854
- Internal Financing 412 892 892
Total PeopleSoft Enhancements (formerly PeopleSoft Upgrade) 2-149 412 892 854 823 887 857 922 5,235
Core Information Technology Program
- Internal Financing 283
Geographic Information System Aerial Image Renewal Program (formerly Aerial Imagery Renewal Program)
- Cash to Capital 159 188 188 535
- Internal Financing 2-150 165
Communications Systems Branch Facilities
- Internal Financing 2-151 174 174
Information Security Initiatives
- Cash to Capital 306 309 318 325 1,258
- External Debt 308 308
- Internal Financing 603 365 365
Total Information Security Initiatives 2-152 603 365 308 306 309 318 325 1,931
E-Mail Archiving
- Internal Financing 2-153 484 484
Enterprise Content Management
- Cash to Capital 105 105
- External Debt 303 303
- Internal Financing 2,231 1,102 1,102
Total Enterprise Content Management 2-154 2,231 1,102 303 105 1,510
Microsoft Office License Evergreen
- Cash to Capital 208 330 184 71 793
- External Debt 1,375 817 2,192
- Internal Financing 222
Total Microsoft Office License Evergreen 2-155 222 1,375 817 208 330 184 71 2,985
Printing Graphics & Mail Services Asset Renewal (formerly Print Asset Renewal)
- Cash to Capital 350 350
- Internal Financing 152
Total Printing Graphics & Mail Services Asset Renewal (formerly Print Asset Renewal)
2-156 152 350 350
Microsoft Development Network Software Renewal (formerly Software Renewal Program)
- Cash to Capital 271 271
- External Debt 247 247
Total Microsoft Development Network Software Renewal 2-157 247 271 518
Appendix 10
Preliminary 2019 Budget - Appendices
3-73
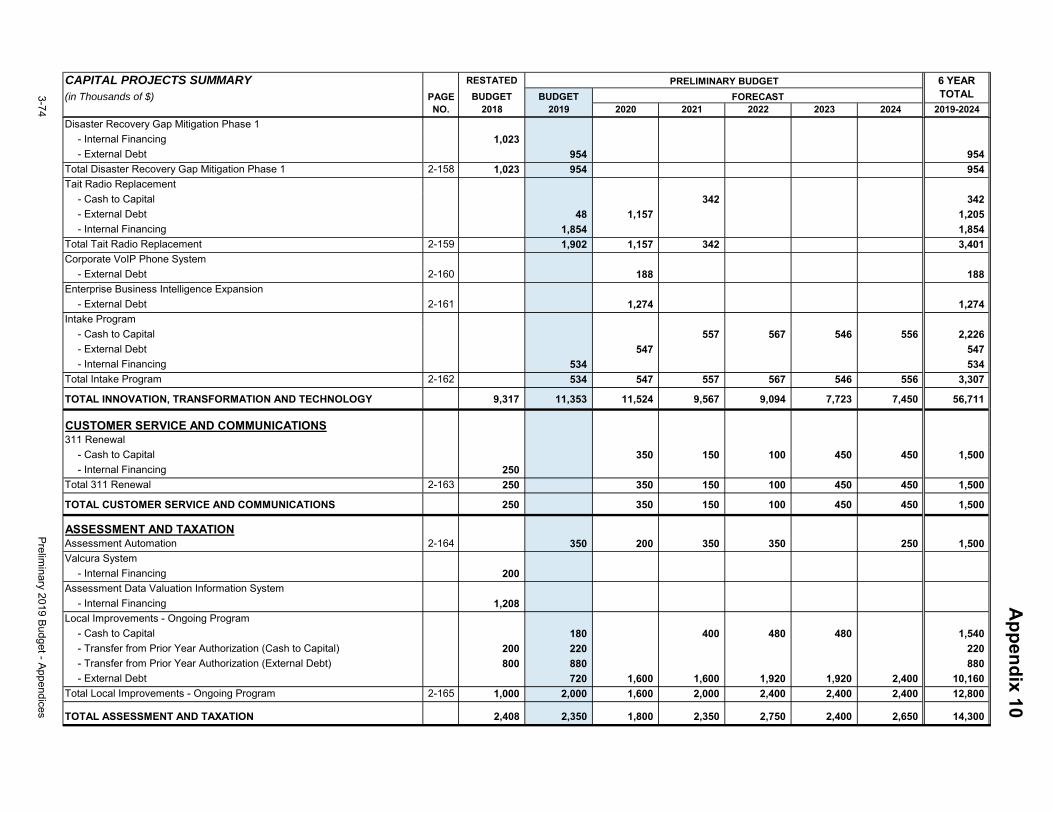
CAPITAL PROJECTS SUMMARY RESTATED
(in Thousands of $) PAGE BUDGET BUDGETNO. 2018 2019 2020 2021 2022 2023 2024 2019-2024
PRELIMINARY BUDGET
FORECAST
6 YEAR TOTAL
Disaster Recovery Gap Mitigation Phase 1
- Internal Financing 1,023
- External Debt 954 954
Total Disaster Recovery Gap Mitigation Phase 1 2-158 1,023 954 954
Tait Radio Replacement
- Cash to Capital 342 342
- External Debt 48 1,157 1,205
- Internal Financing 1,854 1,854
Total Tait Radio Replacement 2-159 1,902 1,157 342 3,401
Corporate VoIP Phone System
- External Debt 2-160 188 188
Enterprise Business Intelligence Expansion
- External Debt 2-161 1,274 1,274
Intake Program
- Cash to Capital 557 567 546 556 2,226
- External Debt 547 547
- Internal Financing 534 534
Total Intake Program 2-162 534 547 557 567 546 556 3,307
TOTAL INNOVATION, TRANSFORMATION AND TECHNOLOGY 9,317 11,353 11,524 9,567 9,094 7,723 7,450 56,711
CUSTOMER SERVICE AND COMMUNICATIONS311 Renewal
- Cash to Capital 350 150 100 450 450 1,500
- Internal Financing 250
Total 311 Renewal 2-163 250 350 150 100 450 450 1,500
TOTAL CUSTOMER SERVICE AND COMMUNICATIONS 250 350 150 100 450 450 1,500
ASSESSMENT AND TAXATIONAssessment Automation 2-164 350 200 350 350 250 1,500
Valcura System
- Internal Financing 200
Assessment Data Valuation Information System
- Internal Financing 1,208
Local Improvements - Ongoing Program
- Cash to Capital 180 400 480 480 1,540
- Transfer from Prior Year Authorization (Cash to Capital) 200 220 220
- Transfer from Prior Year Authorization (External Debt) 800 880 880
- External Debt 720 1,600 1,600 1,920 1,920 2,400 10,160
Total Local Improvements - Ongoing Program 2-165 1,000 2,000 1,600 2,000 2,400 2,400 2,400 12,800
TOTAL ASSESSMENT AND TAXATION 2,408 2,350 1,800 2,350 2,750 2,400 2,650 14,300
Appendix 10
3-74Prelim
inary 2019 Budget - Appendices
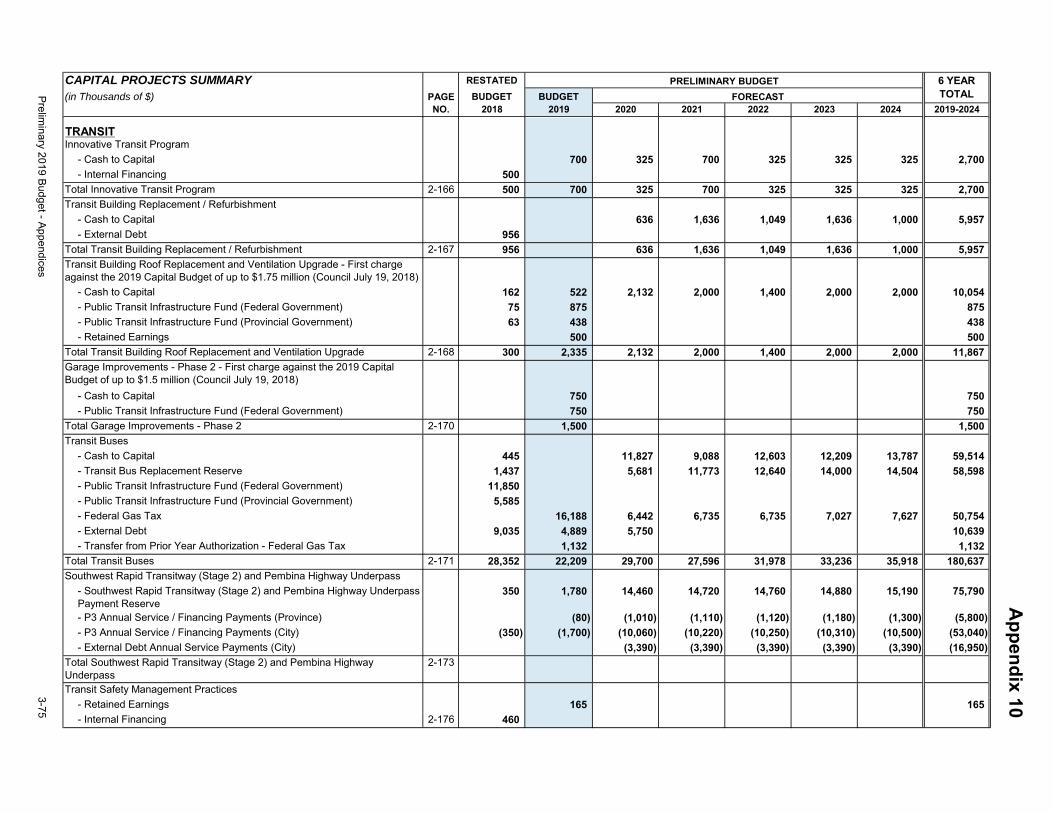
CAPITAL PROJECTS SUMMARY RESTATED
(in Thousands of $) PAGE BUDGET BUDGETNO. 2018 2019 2020 2021 2022 2023 2024 2019-2024
PRELIMINARY BUDGET
FORECAST
6 YEAR TOTAL
TRANSITInnovative Transit Program
- Cash to Capital 700 325 700 325 325 325 2,700
- Internal Financing 500
Total Innovative Transit Program 2-166 500 700 325 700 325 325 325 2,700
Transit Building Replacement / Refurbishment
- Cash to Capital 636 1,636 1,049 1,636 1,000 5,957
- External Debt 956
Total Transit Building Replacement / Refurbishment 2-167 956 636 1,636 1,049 1,636 1,000 5,957
Transit Building Roof Replacement and Ventilation Upgrade - First charge against the 2019 Capital Budget of up to $1.75 million (Council July 19, 2018)
- Cash to Capital 162 522 2,132 2,000 1,400 2,000 2,000 10,054
- Public Transit Infrastructure Fund (Federal Government) 75 875 875
- Public Transit Infrastructure Fund (Provincial Government) 63 438 438
- Retained Earnings 500 500
Total Transit Building Roof Replacement and Ventilation Upgrade 2-168 300 2,335 2,132 2,000 1,400 2,000 2,000 11,867
Garage Improvements - Phase 2 - First charge against the 2019 Capital Budget of up to $1.5 million (Council July 19, 2018)
- Cash to Capital 750 750
- Public Transit Infrastructure Fund (Federal Government) 750 750
Total Garage Improvements - Phase 2 2-170 1,500 1,500
Transit Buses
- Cash to Capital 445 11,827 9,088 12,603 12,209 13,787 59,514
- Transit Bus Replacement Reserve 1,437 5,681 11,773 12,640 14,000 14,504 58,598
- Public Transit Infrastructure Fund (Federal Government) 11,850
- Public Transit Infrastructure Fund (Provincial Government) 5,585
- Federal Gas Tax 16,188 6,442 6,735 6,735 7,027 7,627 50,754
- External Debt 9,035 4,889 5,750 10,639
- Transfer from Prior Year Authorization - Federal Gas Tax 1,132 1,132
Total Transit Buses 2-171 28,352 22,209 29,700 27,596 31,978 33,236 35,918 180,637
Southwest Rapid Transitway (Stage 2) and Pembina Highway Underpass
- Southwest Rapid Transitway (Stage 2) and Pembina Highway Underpass Payment Reserve
350 1,780 14,460 14,720 14,760 14,880 15,190 75,790
- P3 Annual Service / Financing Payments (Province) (80) (1,010) (1,110) (1,120) (1,180) (1,300) (5,800)
- P3 Annual Service / Financing Payments (City) (350) (1,700) (10,060) (10,220) (10,250) (10,310) (10,500) (53,040)
- External Debt Annual Service Payments (City) (3,390) (3,390) (3,390) (3,390) (3,390) (16,950)
Total Southwest Rapid Transitway (Stage 2) and Pembina Highway Underpass
2-173
Transit Safety Management Practices
- Retained Earnings 165 165
- Internal Financing 2-176 460
Appendix 10
Preliminary 2019 Budget - Appendices
3-75
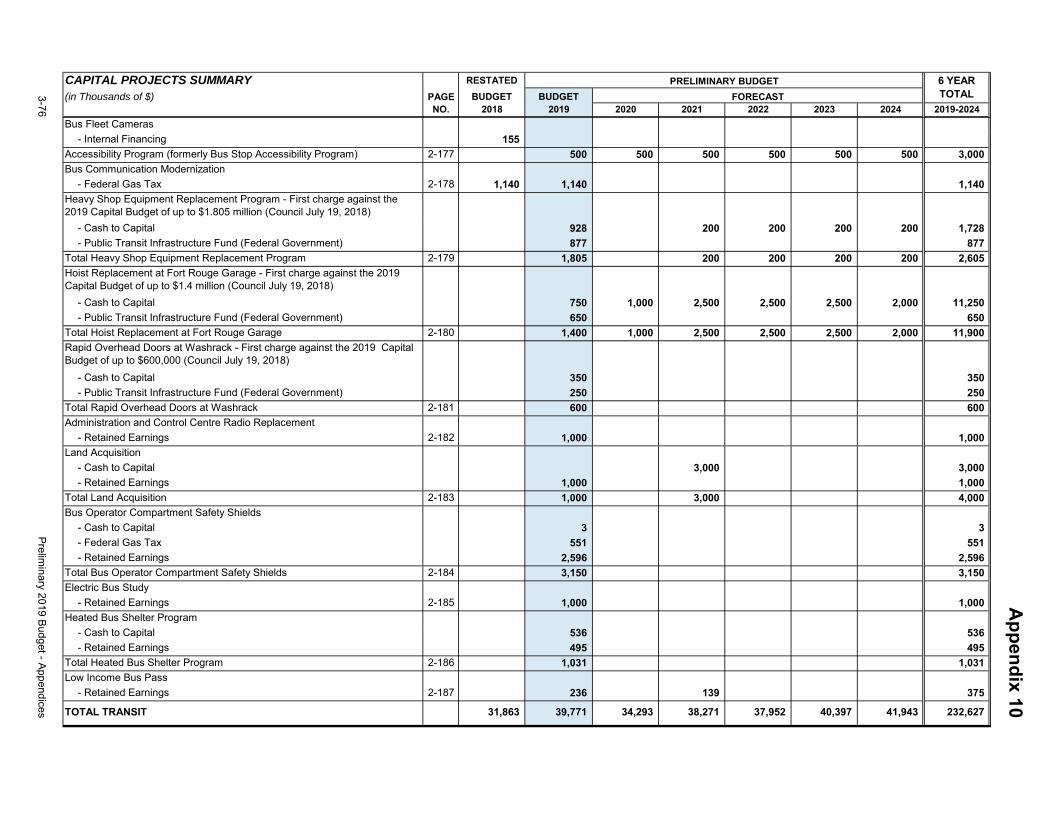
CAPITAL PROJECTS SUMMARY RESTATED
(in Thousands of $) PAGE BUDGET BUDGETNO. 2018 2019 2020 2021 2022 2023 2024 2019-2024
PRELIMINARY BUDGET
FORECAST
6 YEAR TOTAL
Bus Fleet Cameras
- Internal Financing 155
Accessibility Program (formerly Bus Stop Accessibility Program) 2-177 500 500 500 500 500 500 3,000
Bus Communication Modernization
- Federal Gas Tax 2-178 1,140 1,140 1,140
Heavy Shop Equipment Replacement Program - First charge against the 2019 Capital Budget of up to $1.805 million (Council July 19, 2018)
- Cash to Capital 928 200 200 200 200 1,728
- Public Transit Infrastructure Fund (Federal Government) 877 877
Total Heavy Shop Equipment Replacement Program 2-179 1,805 200 200 200 200 2,605
Hoist Replacement at Fort Rouge Garage - First charge against the 2019 Capital Budget of up to $1.4 million (Council July 19, 2018)
- Cash to Capital 750 1,000 2,500 2,500 2,500 2,000 11,250
- Public Transit Infrastructure Fund (Federal Government) 650 650
Total Hoist Replacement at Fort Rouge Garage 2-180 1,400 1,000 2,500 2,500 2,500 2,000 11,900
Rapid Overhead Doors at Washrack - First charge against the 2019 Capital Budget of up to $600,000 (Council July 19, 2018)
- Cash to Capital 350 350
- Public Transit Infrastructure Fund (Federal Government) 250 250
Total Rapid Overhead Doors at Washrack 2-181 600 600
Administration and Control Centre Radio Replacement
- Retained Earnings 2-182 1,000 1,000
Land Acquisition
- Cash to Capital 3,000 3,000
- Retained Earnings 1,000 1,000
Total Land Acquisition 2-183 1,000 3,000 4,000
Bus Operator Compartment Safety Shields
- Cash to Capital 3 3
- Federal Gas Tax 551 551
- Retained Earnings 2,596 2,596
Total Bus Operator Compartment Safety Shields 2-184 3,150 3,150
Electric Bus Study
- Retained Earnings 2-185 1,000 1,000
Heated Bus Shelter Program
- Cash to Capital 536 536
- Retained Earnings 495 495
Total Heated Bus Shelter Program 2-186 1,031 1,031
Low Income Bus Pass
- Retained Earnings 2-187 236 139 375
TOTAL TRANSIT 31,863 39,771 34,293 38,271 37,952 40,397 41,943 232,627
Appendix 10
3-76Prelim
inary 2019 Budget - Appendices
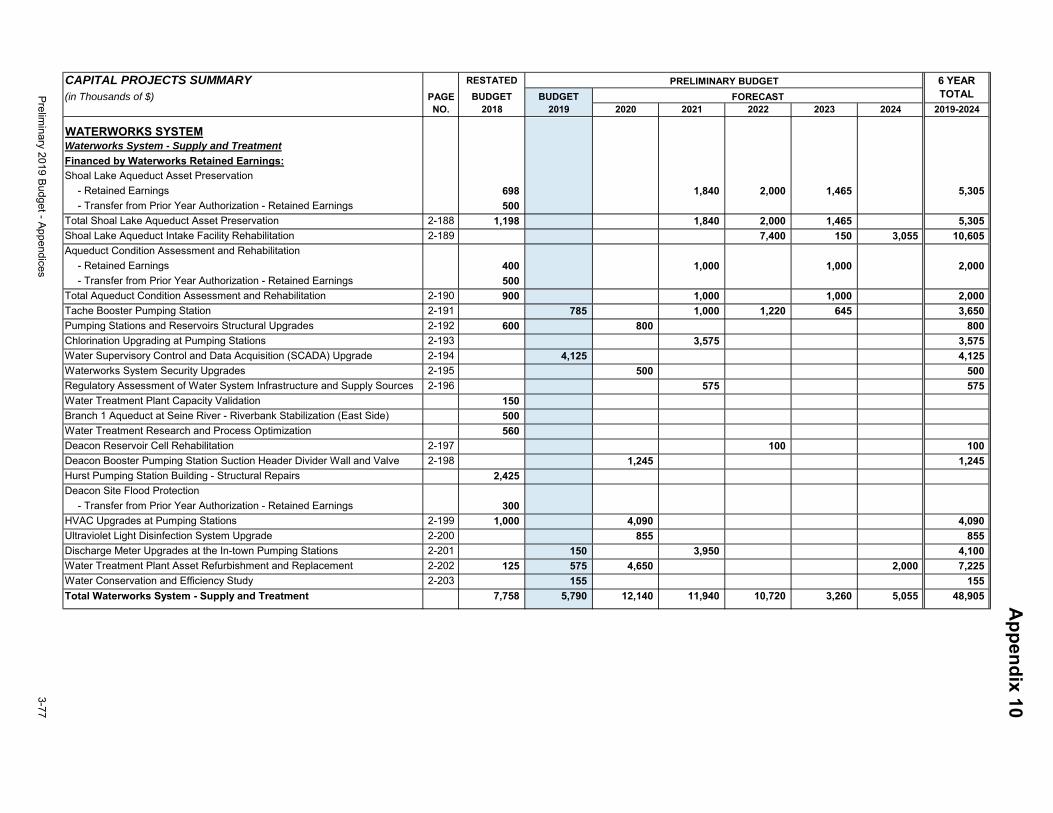
CAPITAL PROJECTS SUMMARY RESTATED
(in Thousands of $) PAGE BUDGET BUDGETNO. 2018 2019 2020 2021 2022 2023 2024 2019-2024
PRELIMINARY BUDGET
FORECAST
6 YEAR TOTAL
WATERWORKS SYSTEMWaterworks System - Supply and Treatment
Financed by Waterworks Retained Earnings:
Shoal Lake Aqueduct Asset Preservation
- Retained Earnings 698 1,840 2,000 1,465 5,305
- Transfer from Prior Year Authorization - Retained Earnings 500
Total Shoal Lake Aqueduct Asset Preservation 2-188 1,198 1,840 2,000 1,465 5,305
Shoal Lake Aqueduct Intake Facility Rehabilitation 2-189 7,400 150 3,055 10,605
Aqueduct Condition Assessment and Rehabilitation
- Retained Earnings 400 1,000 1,000 2,000
- Transfer from Prior Year Authorization - Retained Earnings 500
Total Aqueduct Condition Assessment and Rehabilitation 2-190 900 1,000 1,000 2,000
Tache Booster Pumping Station 2-191 785 1,000 1,220 645 3,650
Pumping Stations and Reservoirs Structural Upgrades 2-192 600 800 800
Chlorination Upgrading at Pumping Stations 2-193 3,575 3,575
Water Supervisory Control and Data Acquisition (SCADA) Upgrade 2-194 4,125 4,125
Waterworks System Security Upgrades 2-195 500 500
Regulatory Assessment of Water System Infrastructure and Supply Sources 2-196 575 575
Water Treatment Plant Capacity Validation 150
Branch 1 Aqueduct at Seine River - Riverbank Stabilization (East Side) 500
Water Treatment Research and Process Optimization 560
Deacon Reservoir Cell Rehabilitation 2-197 100 100
Deacon Booster Pumping Station Suction Header Divider Wall and Valve 2-198 1,245 1,245
Hurst Pumping Station Building - Structural Repairs 2,425
Deacon Site Flood Protection
- Transfer from Prior Year Authorization - Retained Earnings 300
HVAC Upgrades at Pumping Stations 2-199 1,000 4,090 4,090
Ultraviolet Light Disinfection System Upgrade 2-200 855 855
Discharge Meter Upgrades at the In-town Pumping Stations 2-201 150 3,950 4,100
Water Treatment Plant Asset Refurbishment and Replacement 2-202 125 575 4,650 2,000 7,225
Water Conservation and Efficiency Study 2-203 155 155
Total Waterworks System - Supply and Treatment 7,758 5,790 12,140 11,940 10,720 3,260 5,055 48,905 Appendix 10
Preliminary 2019 Budget - Appendices
3-77
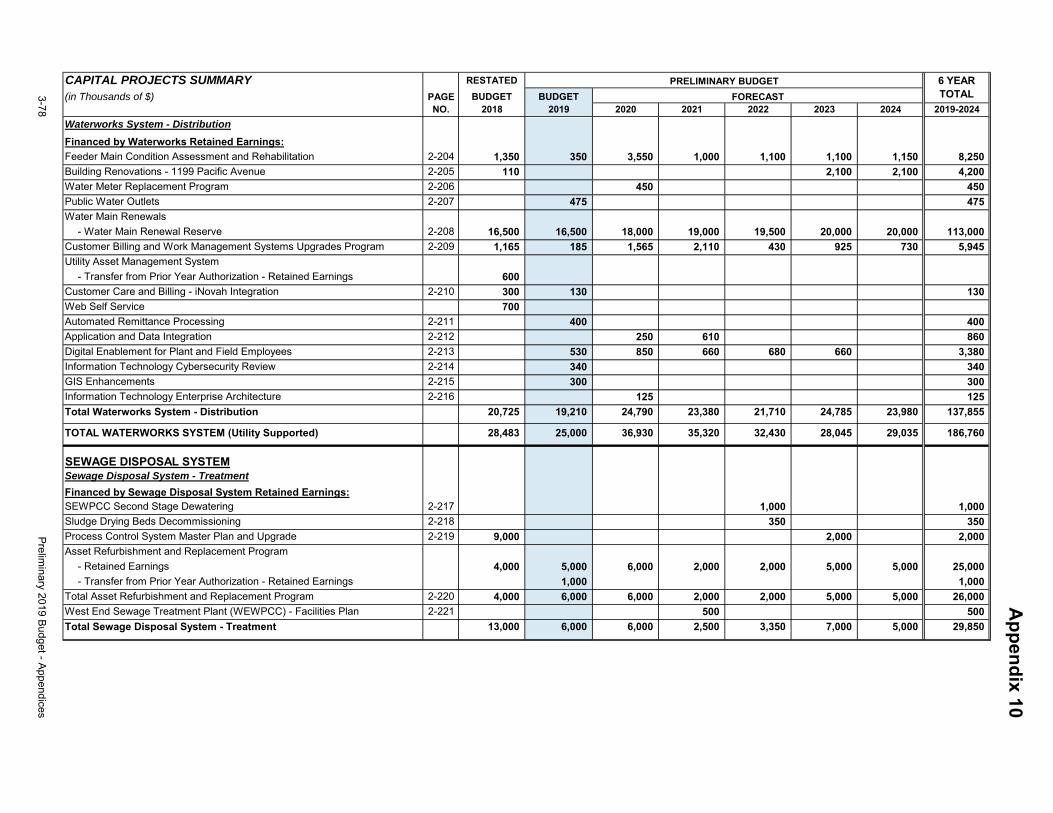
CAPITAL PROJECTS SUMMARY RESTATED
(in Thousands of $) PAGE BUDGET BUDGETNO. 2018 2019 2020 2021 2022 2023 2024 2019-2024
PRELIMINARY BUDGET
FORECAST
6 YEAR TOTAL
Waterworks System - Distribution
Financed by Waterworks Retained Earnings:
Feeder Main Condition Assessment and Rehabilitation 2-204 1,350 350 3,550 1,000 1,100 1,100 1,150 8,250
Building Renovations - 1199 Pacific Avenue 2-205 110 2,100 2,100 4,200
Water Meter Replacement Program 2-206 450 450
Public Water Outlets 2-207 475 475
Water Main Renewals
- Water Main Renewal Reserve 2-208 16,500 16,500 18,000 19,000 19,500 20,000 20,000 113,000
Customer Billing and Work Management Systems Upgrades Program 2-209 1,165 185 1,565 2,110 430 925 730 5,945
Utility Asset Management System
- Transfer from Prior Year Authorization - Retained Earnings 600
Customer Care and Billing - iNovah Integration 2-210 300 130 130
Web Self Service 700
Automated Remittance Processing 2-211 400 400
Application and Data Integration 2-212 250 610 860
Digital Enablement for Plant and Field Employees 2-213 530 850 660 680 660 3,380
Information Technology Cybersecurity Review 2-214 340 340
GIS Enhancements 2-215 300 300
Information Technology Enterprise Architecture 2-216 125 125
Total Waterworks System - Distribution 20,725 19,210 24,790 23,380 21,710 24,785 23,980 137,855
TOTAL WATERWORKS SYSTEM (Utility Supported) 28,483 25,000 36,930 35,320 32,430 28,045 29,035 186,760
SEWAGE DISPOSAL SYSTEMSewage Disposal System - Treatment
Financed by Sewage Disposal System Retained Earnings:SEWPCC Second Stage Dewatering 2-217 1,000 1,000
Sludge Drying Beds Decommissioning 2-218 350 350
Process Control System Master Plan and Upgrade 2-219 9,000 2,000 2,000
Asset Refurbishment and Replacement Program
- Retained Earnings 4,000 5,000 6,000 2,000 2,000 5,000 5,000 25,000
- Transfer from Prior Year Authorization - Retained Earnings 1,000 1,000
Total Asset Refurbishment and Replacement Program 2-220 4,000 6,000 6,000 2,000 2,000 5,000 5,000 26,000
West End Sewage Treatment Plant (WEWPCC) - Facilities Plan 2-221 500 500
Total Sewage Disposal System - Treatment 13,000 6,000 6,000 2,500 3,350 7,000 5,000 29,850
Appendix 10
3-78Prelim
inary 2019 Budget - Appendices
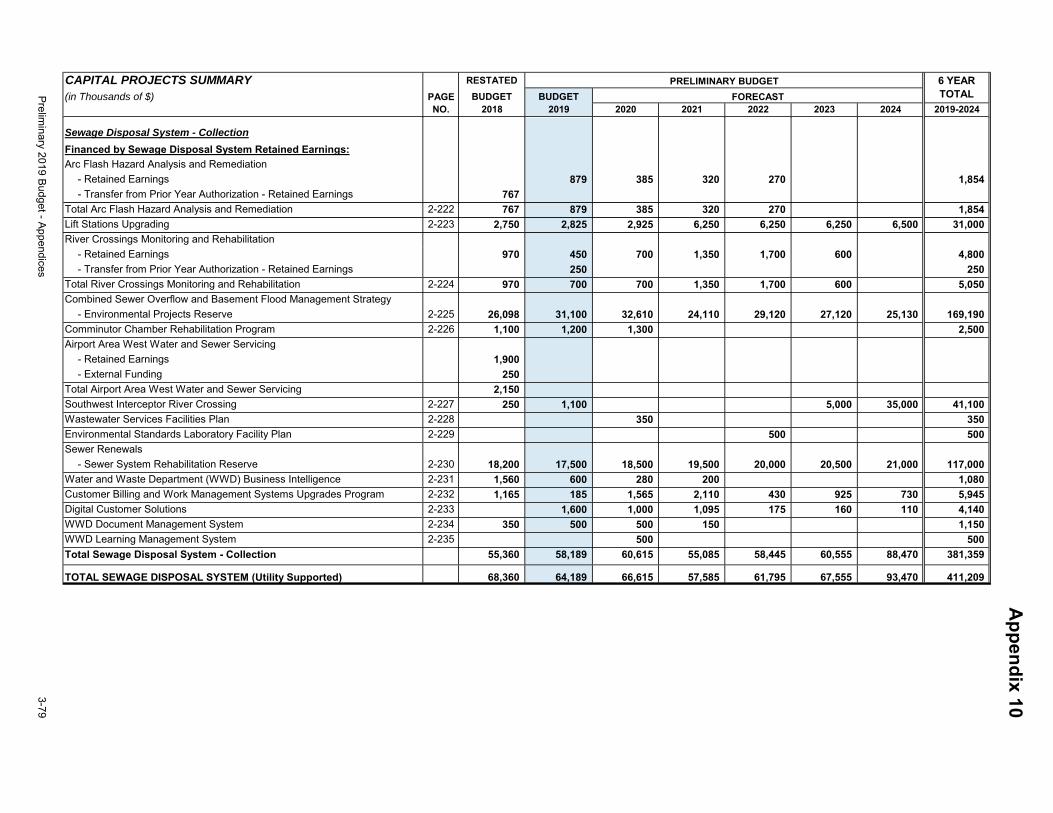
CAPITAL PROJECTS SUMMARY RESTATED
(in Thousands of $) PAGE BUDGET BUDGETNO. 2018 2019 2020 2021 2022 2023 2024 2019-2024
PRELIMINARY BUDGET
FORECAST
6 YEAR TOTAL
Sewage Disposal System - Collection
Financed by Sewage Disposal System Retained Earnings:
Arc Flash Hazard Analysis and Remediation
- Retained Earnings 879 385 320 270 1,854
- Transfer from Prior Year Authorization - Retained Earnings 767
Total Arc Flash Hazard Analysis and Remediation 2-222 767 879 385 320 270 1,854
Lift Stations Upgrading 2-223 2,750 2,825 2,925 6,250 6,250 6,250 6,500 31,000
River Crossings Monitoring and Rehabilitation
- Retained Earnings 970 450 700 1,350 1,700 600 4,800
- Transfer from Prior Year Authorization - Retained Earnings 250 250
Total River Crossings Monitoring and Rehabilitation 2-224 970 700 700 1,350 1,700 600 5,050
Combined Sewer Overflow and Basement Flood Management Strategy
- Environmental Projects Reserve 2-225 26,098 31,100 32,610 24,110 29,120 27,120 25,130 169,190
Comminutor Chamber Rehabilitation Program 2-226 1,100 1,200 1,300 2,500
Airport Area West Water and Sewer Servicing
- Retained Earnings 1,900
- External Funding 250
Total Airport Area West Water and Sewer Servicing 2,150
Southwest Interceptor River Crossing 2-227 250 1,100 5,000 35,000 41,100
Wastewater Services Facilities Plan 2-228 350 350
Environmental Standards Laboratory Facility Plan 2-229 500 500
Sewer Renewals
- Sewer System Rehabilitation Reserve 2-230 18,200 17,500 18,500 19,500 20,000 20,500 21,000 117,000
Water and Waste Department (WWD) Business Intelligence 2-231 1,560 600 280 200 1,080
Customer Billing and Work Management Systems Upgrades Program 2-232 1,165 185 1,565 2,110 430 925 730 5,945
Digital Customer Solutions 2-233 1,600 1,000 1,095 175 160 110 4,140
WWD Document Management System 2-234 350 500 500 150 1,150
WWD Learning Management System 2-235 500 500
Total Sewage Disposal System - Collection 55,360 58,189 60,615 55,085 58,445 60,555 88,470 381,359
TOTAL SEWAGE DISPOSAL SYSTEM (Utility Supported) 68,360 64,189 66,615 57,585 61,795 67,555 93,470 411,209
Appendix 10
Preliminary 2019 Budget - Appendices
3-79
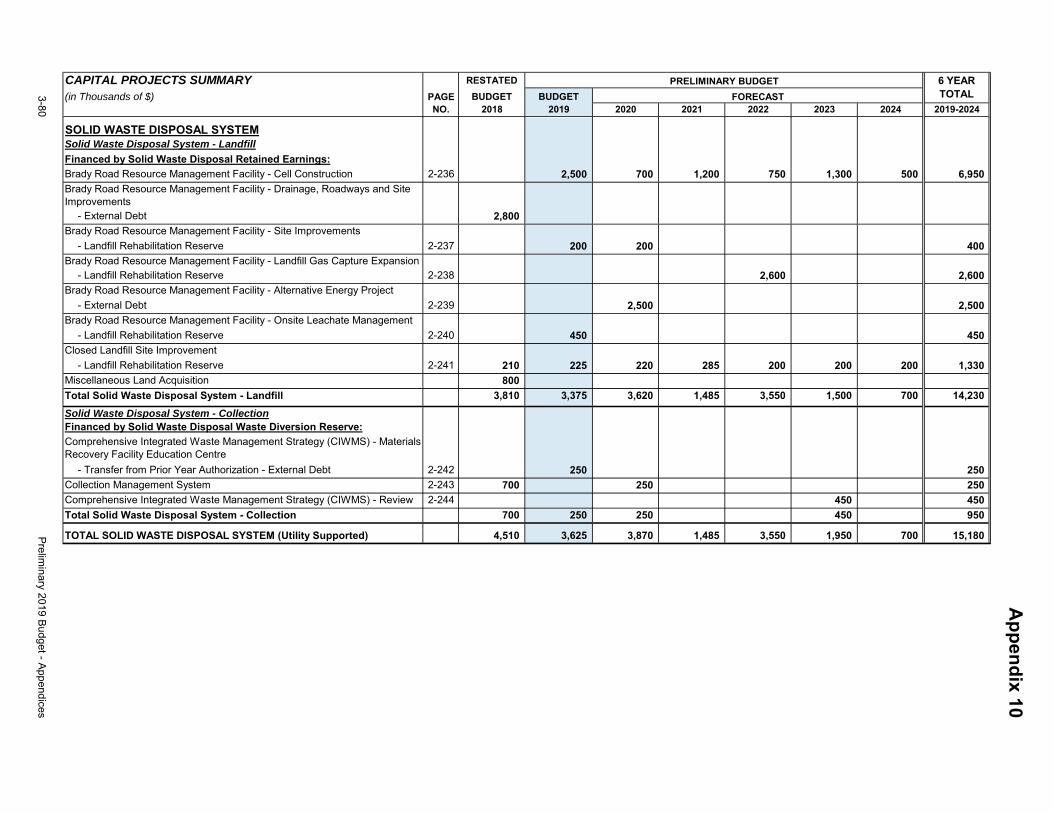
CAPITAL PROJECTS SUMMARY RESTATED
(in Thousands of $) PAGE BUDGET BUDGETNO. 2018 2019 2020 2021 2022 2023 2024 2019-2024
PRELIMINARY BUDGET
FORECAST
6 YEAR TOTAL
SOLID WASTE DISPOSAL SYSTEMSolid Waste Disposal System - Landfill
Financed by Solid Waste Disposal Retained Earnings:
Brady Road Resource Management Facility - Cell Construction 2-236 2,500 700 1,200 750 1,300 500 6,950
Brady Road Resource Management Facility - Drainage, Roadways and Site Improvements
- External Debt 2,800
Brady Road Resource Management Facility - Site Improvements
- Landfill Rehabilitation Reserve 2-237 200 200 400
Brady Road Resource Management Facility - Landfill Gas Capture Expansion - Landfill Rehabilitation Reserve 2-238 2,600 2,600
Brady Road Resource Management Facility - Alternative Energy Project
- External Debt 2-239 2,500 2,500
Brady Road Resource Management Facility - Onsite Leachate Management
- Landfill Rehabilitation Reserve 2-240 450 450
Closed Landfill Site Improvement
- Landfill Rehabilitation Reserve 2-241 210 225 220 285 200 200 200 1,330
Miscellaneous Land Acquisition 800
Total Solid Waste Disposal System - Landfill 3,810 3,375 3,620 1,485 3,550 1,500 700 14,230
Solid Waste Disposal System - CollectionFinanced by Solid Waste Disposal Waste Diversion Reserve:
Comprehensive Integrated Waste Management Strategy (CIWMS) - Materials Recovery Facility Education Centre
- Transfer from Prior Year Authorization - External Debt 2-242 250 250
Collection Management System 2-243 700 250 250
Comprehensive Integrated Waste Management Strategy (CIWMS) - Review 2-244 450 450
Total Solid Waste Disposal System - Collection 700 250 250 450 950
TOTAL SOLID WASTE DISPOSAL SYSTEM (Utility Supported) 4,510 3,625 3,870 1,485 3,550 1,950 700 15,180
Appendix 10
3-80Prelim
inary 2019 Budget - Appendices
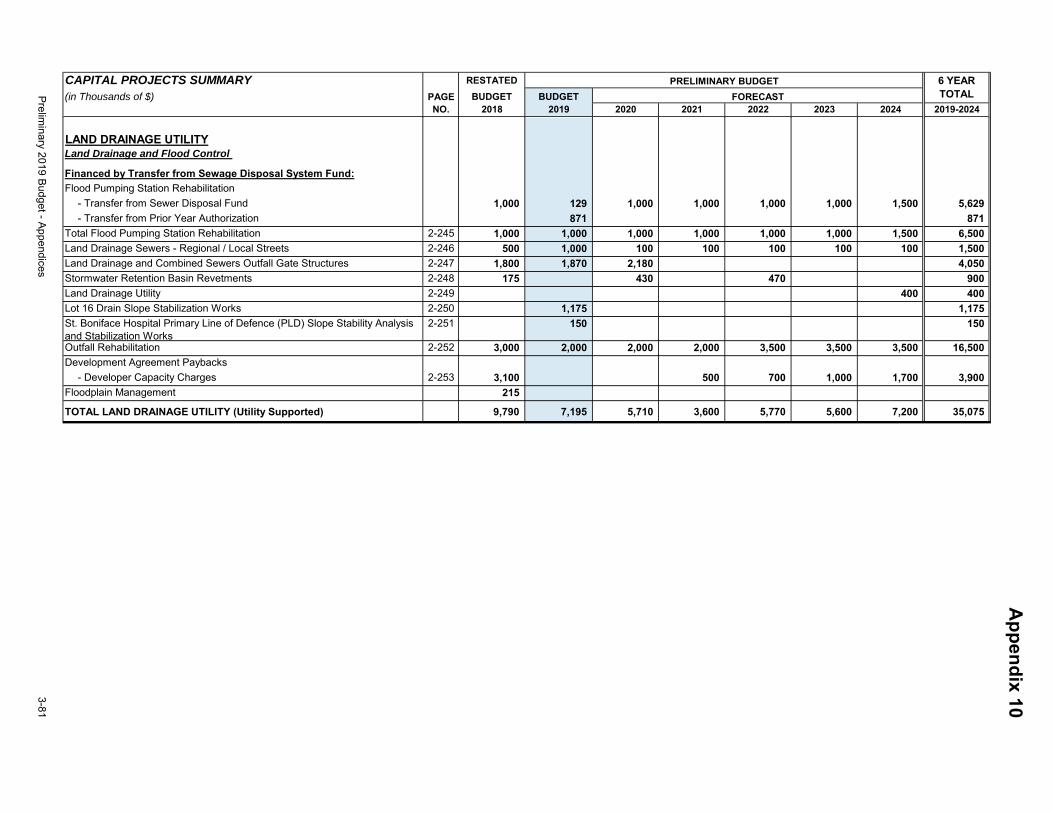
CAPITAL PROJECTS SUMMARY RESTATED
(in Thousands of $) PAGE BUDGET BUDGETNO. 2018 2019 2020 2021 2022 2023 2024 2019-2024
PRELIMINARY BUDGET
FORECAST
6 YEAR TOTAL
LAND DRAINAGE UTILITYLand Drainage and Flood Control
Financed by Transfer from Sewage Disposal System Fund:
Flood Pumping Station Rehabilitation
- Transfer from Sewer Disposal Fund 1,000 129 1,000 1,000 1,000 1,000 1,500 5,629
- Transfer from Prior Year Authorization 871 871
Total Flood Pumping Station Rehabilitation 2-245 1,000 1,000 1,000 1,000 1,000 1,000 1,500 6,500
Land Drainage Sewers - Regional / Local Streets 2-246 500 1,000 100 100 100 100 100 1,500
Land Drainage and Combined Sewers Outfall Gate Structures 2-247 1,800 1,870 2,180 4,050
Stormwater Retention Basin Revetments 2-248 175 430 470 900
Land Drainage Utility 2-249 400 400
Lot 16 Drain Slope Stabilization Works 2-250 1,175 1,175
St. Boniface Hospital Primary Line of Defence (PLD) Slope Stability Analysis and Stabilization Works
2-251 150 150
Outfall Rehabilitation 2-252 3,000 2,000 2,000 2,000 3,500 3,500 3,500 16,500
Development Agreement Paybacks
- Developer Capacity Charges 2-253 3,100 500 700 1,000 1,700 3,900
Floodplain Management 215
TOTAL LAND DRAINAGE UTILITY (Utility Supported) 9,790 7,195 5,710 3,600 5,770 5,600 7,200 35,075
Appendix 10
Preliminary 2019 Budget - Appendices
3-81
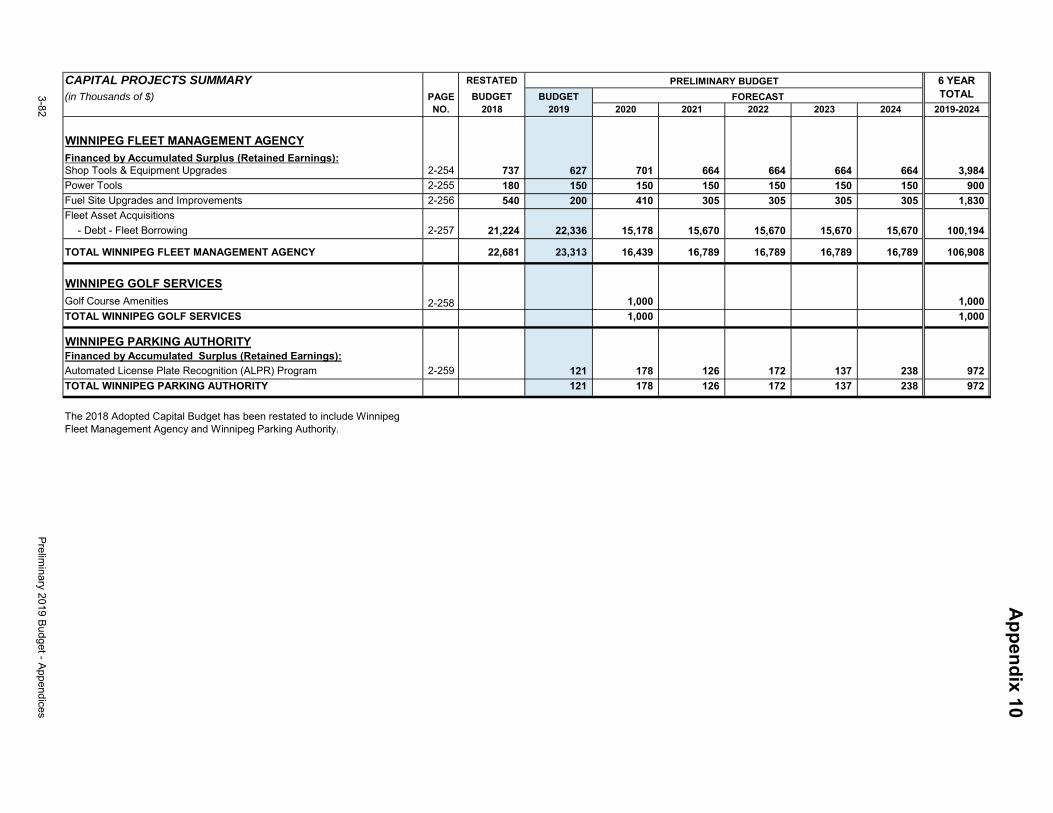
CAPITAL PROJECTS SUMMARY RESTATED
(in Thousands of $) PAGE BUDGET BUDGETNO. 2018 2019 2020 2021 2022 2023 2024 2019-2024
PRELIMINARY BUDGET
FORECAST
6 YEAR TOTAL
WINNIPEG FLEET MANAGEMENT AGENCY
Financed by Accumulated Surplus (Retained Earnings):Shop Tools & Equipment Upgrades 2-254 737 627 701 664 664 664 664 3,984
Power Tools 2-255 180 150 150 150 150 150 150 900
Fuel Site Upgrades and Improvements 2-256 540 200 410 305 305 305 305 1,830
Fleet Asset Acquisitions
- Debt - Fleet Borrowing 2-257 21,224 22,336 15,178 15,670 15,670 15,670 15,670 100,194
TOTAL WINNIPEG FLEET MANAGEMENT AGENCY 22,681 23,313 16,439 16,789 16,789 16,789 16,789 106,908
WINNIPEG GOLF SERVICES
Golf Course Amenities 2-258 1,000 1,000
TOTAL WINNIPEG GOLF SERVICES 1,000 1,000
WINNIPEG PARKING AUTHORITYFinanced by Accumulated Surplus (Retained Earnings):
Automated License Plate Recognition (ALPR) Program 2-259 121 178 126 172 137 238 972
TOTAL WINNIPEG PARKING AUTHORITY 121 178 126 172 137 238 972
The 2018 Adopted Capital Budget has been restated to include Winnipeg Fleet Management Agency and Winnipeg Parking Authority.
Appendix 10
3-82Prelim
inary 2019 Budget - Appendices
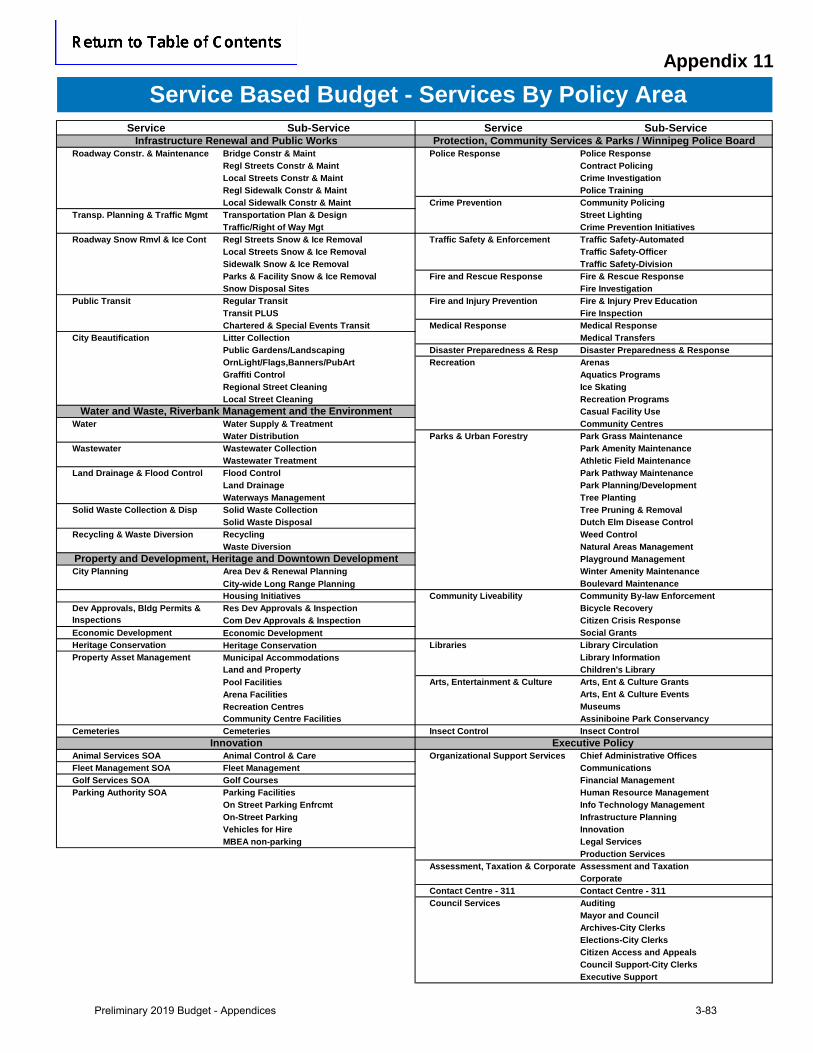
Appendix 11
Service Sub-Service Service Sub-Service
Roadway Constr. & Maintenance Bridge Constr & Maint Police Response Police ResponseRegl Streets Constr & Maint Contract PolicingLocal Streets Constr & Maint Crime InvestigationRegl Sidewalk Constr & Maint Police TrainingLocal Sidewalk Constr & Maint Crime Prevention Community Policing
Transp. Planning & Traffic Mgmt Transportation Plan & Design Street LightingTraffic/Right of Way Mgt Crime Prevention Initiatives
Roadway Snow Rmvl & Ice Cont Regl Streets Snow & Ice Removal Traffic Safety & Enforcement Traffic Safety-AutomatedLocal Streets Snow & Ice Removal Traffic Safety-OfficerSidewalk Snow & Ice Removal Traffic Safety-DivisionParks & Facility Snow & Ice Removal Fire and Rescue Response Fire & Rescue ResponseSnow Disposal Sites Fire Investigation
Public Transit Regular Transit Fire and Injury Prevention Fire & Injury Prev EducationTransit PLUS Fire InspectionChartered & Special Events Transit Medical Response Medical Response
City Beautification Litter Collection Medical TransfersPublic Gardens/Landscaping Disaster Preparedness & Resp Disaster Preparedness & ResponseOrnLight/Flags,Banners/PubArt Recreation ArenasGraffiti Control Aquatics ProgramsRegional Street Cleaning Ice Skating Local Street Cleaning Recreation Programs
Casual Facility UseWater Water Supply & Treatment Community Centres
Water Distribution Parks & Urban Forestry Park Grass MaintenanceWastewater Wastewater Collection Park Amenity Maintenance
Wastewater Treatment Athletic Field MaintenanceLand Drainage & Flood Control Flood Control Park Pathway Maintenance
Land Drainage Park Planning/DevelopmentWaterways Management Tree Planting
Solid Waste Collection & Disp Solid Waste Collection Tree Pruning & RemovalSolid Waste Disposal Dutch Elm Disease Control
Recycling & Waste Diversion Recycling Weed ControlWaste Diversion Natural Areas Management
Playground ManagementCity Planning Area Dev & Renewal Planning Winter Amenity Maintenance
City-wide Long Range Planning Boulevard MaintenanceHousing Initiatives Community Liveability Community By-law EnforcementRes Dev Approvals & Inspection Bicycle RecoveryCom Dev Approvals & Inspection Citizen Crisis Response
Economic Development Economic Development Social GrantsHeritage Conservation Heritage Conservation Libraries Library CirculationProperty Asset Management Municipal Accommodations Library Information
Land and Property Children's LibraryPool Facilities Arts, Entertainment & Culture Arts, Ent & Culture GrantsArena Facilities Arts, Ent & Culture EventsRecreation Centres MuseumsCommunity Centre Facilities Assiniboine Park Conservancy
Cemeteries Cemeteries Insect Control Insect Control
Animal Services SOA Animal Control & Care Organizational Support Services Chief Administrative OfficesFleet Management SOA Fleet Management CommunicationsGolf Services SOA Golf Courses Financial ManagementParking Authority SOA Parking Facilities Human Resource Management
On Street Parking Enfrcmt Info Technology ManagementOn-Street Parking Infrastructure PlanningVehicles for Hire InnovationMBEA non-parking Legal Services
Production ServicesAssessment and TaxationCorporate
Contact Centre - 311 Contact Centre - 311Council Services Auditing
Mayor and CouncilArchives-City ClerksElections-City ClerksCitizen Access and AppealsCouncil Support-City ClerksExecutive Support
Assessment, Taxation & Corporate
Executive Policy
Service Based Budget - Services By Policy Area
Water and Waste, Riverbank Management and the Environment
Property and Development, Heritage and Downtown Development
Dev Approvals, Bldg Permits & Inspections
Infrastructure Renewal and Public Works Protection, Community Services & Parks / Winnipeg Police Board
Innovation
Preliminary 2019 Budget - Appendices 3-83

3-84 Preliminary 2019 Budget - Appendices
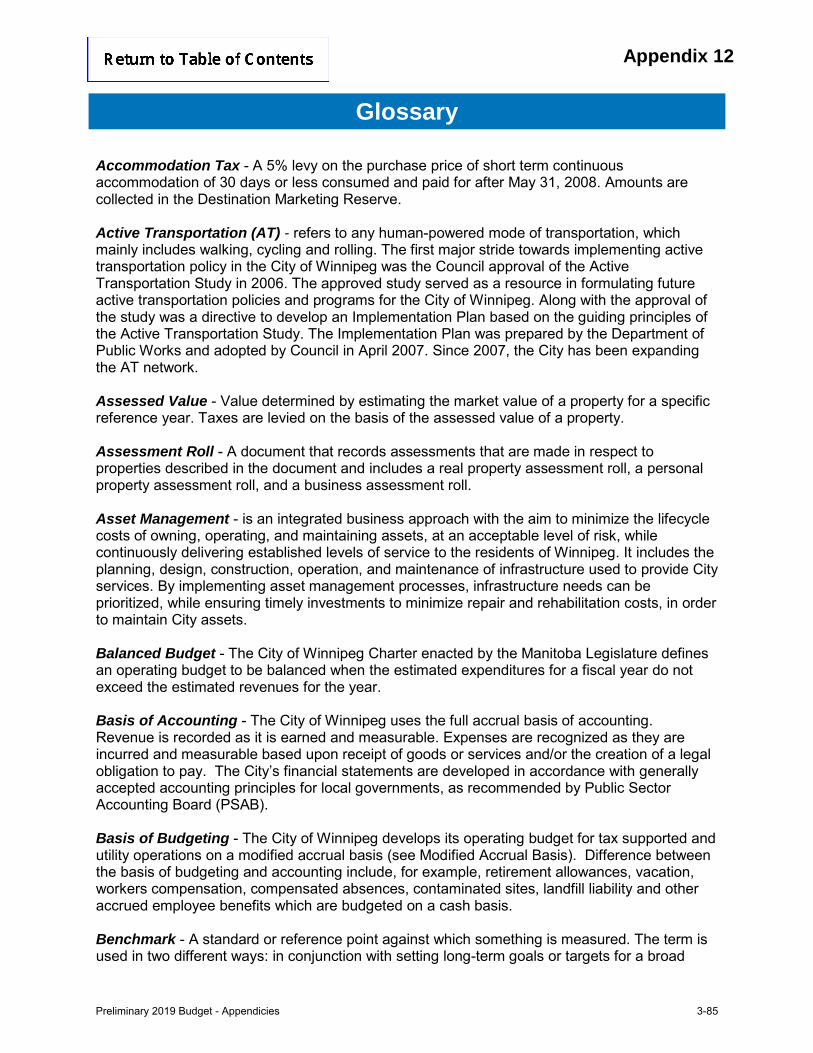
Appendix 12
Glossary
Accommodation Tax - A 5% levy on the purchase price of short term continuous accommodation of 30 days or less consumed and paid for after May 31, 2008. Amounts are collected in the Destination Marketing Reserve. Active Transportation (AT) - refers to any human-powered mode of transportation, which mainly includes walking, cycling and rolling. The first major stride towards implementing active transportation policy in the City of Winnipeg was the Council approval of the Active Transportation Study in 2006. The approved study served as a resource in formulating future active transportation policies and programs for the City of Winnipeg. Along with the approval of the study was a directive to develop an Implementation Plan based on the guiding principles of the Active Transportation Study. The Implementation Plan was prepared by the Department of Public Works and adopted by Council in April 2007. Since 2007, the City has been expanding the AT network. Assessed Value - Value determined by estimating the market value of a property for a specific reference year. Taxes are levied on the basis of the assessed value of a property. Assessment Roll - A document that records assessments that are made in respect to properties described in the document and includes a real property assessment roll, a personal property assessment roll, and a business assessment roll. Asset Management - is an integrated business approach with the aim to minimize the lifecycle costs of owning, operating, and maintaining assets, at an acceptable level of risk, while continuously delivering established levels of service to the residents of Winnipeg. It includes the planning, design, construction, operation, and maintenance of infrastructure used to provide City services. By implementing asset management processes, infrastructure needs can be prioritized, while ensuring timely investments to minimize repair and rehabilitation costs, in order to maintain City assets. Balanced Budget - The City of Winnipeg Charter enacted by the Manitoba Legislature defines an operating budget to be balanced when the estimated expenditures for a fiscal year do not exceed the estimated revenues for the year. Basis of Accounting - The City of Winnipeg uses the full accrual basis of accounting. Revenue is recorded as it is earned and measurable. Expenses are recognized as they are incurred and measurable based upon receipt of goods or services and/or the creation of a legal obligation to pay. The City’s financial statements are developed in accordance with generally accepted accounting principles for local governments, as recommended by Public Sector Accounting Board (PSAB). Basis of Budgeting - The City of Winnipeg develops its operating budget for tax supported and utility operations on a modified accrual basis (see Modified Accrual Basis). Difference between the basis of budgeting and accounting include, for example, retirement allowances, vacation, workers compensation, compensated absences, contaminated sites, landfill liability and other accrued employee benefits which are budgeted on a cash basis. Benchmark - A standard or reference point against which something is measured. The term is used in two different ways: in conjunction with setting long-term goals or targets for a broad
Preliminary 2019 Budget - Appendicies 3-85
Appendix 12
Glossary
range of societal and economic policies; and as a measure of effectiveness in comparing key aspects of an organization’s performance with that of similar organizations. Budget Process - Executive Policy Committee (EPC) of City Council, is responsible for budget development. The budget is presented to City Council for consideration and adoption. Each year, both an operating and a capital budget are approved by City Council. Both budgets contain multi-year views. The capital budget includes six years of budget information, including the current-year adopted budget and five forecast years. The operating budget contains three years of budget information, including the current-year adopted budget and two projection years. Business Tax - This is a tax on businesses that occupy space within the City of Winnipeg. Taxes are calculated by applying the annual business tax rate as a percentage of the annual rental value (ARV) of the business premise. The annual rental value is determined by taking into account the rents paid by premises similar in size and location and includes the cost of services necessary for the comfortable use or occupancy of the premise. Business Tax Adjustments / New Additions - Are taxes added to the taxation roll after tax bill update (TBU). These supplemental taxes are billed based on the change in the ARV for a given business. The Assessment and Taxation Department is allowed to issue supplemental tax bills for the current tax year and to January 1st of the prior year. For businesses, supplemental tax bills are normally prepared when businesses close, move or newly start up. By-laws - Legislation enacted by City Council under the provisions of The City of Winnipeg Charter. Capital - Expenditures are considered capital whey they have a cost of $100,000 or more and a useful life of 10 years or longer. This includes individual non-recurring capital projects or ongoing programs investing in various capital assets. Minor maintenance projects should not be included in the capital budget even though the costs may exceed the dollar limit for capital works. Major equipment replacements with very large dollar values such as computer upgrades should be included in the capital budget even though their useful life may be less than 10 years. Capital Budget - An annual plan of the capital projects to be undertaken by the City, together with the method of financing. The capital budget is prepared for the current year and the subsequent five years. Only the current year’s budget is adopted and the remaining five years are approved as a forecast. The Capital Budget is adopted on a project authorization basis, although cash flow estimates are provided for all projects. (See also Five-Year Capital Forecast) Capital Projects / Capital Works - Capital improvements and other works are generally considered to be projects of a fixed nature and long life which provide new, additional or replacement of public facilities such as streets, water mains, sewers, public buildings, parks, playgrounds, recreational centres, land, etc. Major replacements such as asphalt resurfacing of streets, water main renewals, and waste water sewer renewals could also be considered as capital works. Land acquisition and local improvements are considered to be capital works
3-86 Preliminary 2019 Budget - Appendices
Appendix 12
Glossary
regardless of expected cost. Capital expenditures are typically acquisition, development or major renovations to assets where the benefit of the expenditure extends into the future. Cash to Capital - is the cash value that the City invests into its Capital projects. City (The) - Refers to the City of Winnipeg.
City of Winnipeg Charter (The) - Provincial legislation setting out the powers and responsibilities of the City of Winnipeg. Class Estimates - The cost estimate classification system was developed in 2015 based on the AACE International Recommended Practices and is included in an appendix in the annual capital budget book. The established benchmark is that a project should have a Class 3 estimate for budget authorization. Projects that are not at a Class 3 should indicate in the detail sheet that a Class 3 estimate or better will be achieved prior to the start of construction. For programs, those projects identified in the year of budget approval should also be at a class 3 and the narrative should indicate that. The Class 3 estimate should set the authorization budget. Commitment Reserve - On March 12, 1998, City Council approved the establishment of the Commitment Reserve Fund. The purpose of the fund is to allow departments to carry forward committed budget dollars to the succeeding year thereby eliminating the need to re-budget. Contributions to the Reserve must be spent in the year following the transfer. However, contributions can be retained in the Reserve beyond the following year only if approved by the Fund Manager; otherwise the unspent amount must be transferred to the Financial Stabilization Reserve Fund. The Chief Financial Officer is the Fund Manager. Community Trends and Performance Report - The City of Winnipeg regularly produces community and demographic information as well as performance measurement information, which has been included as part of the budget since 2010. The ‘Community Trends and Performance Report’ combines this information and publishes it as budget ‘Volume 1’. This budget Volume 1 is produced early in the budget process to provide context and timely information for the City of Winnipeg Council and the public in support of the upcoming budget decision-making process. The volume includes an outline of the City of Winnipeg organization, governance and administrative structure; Community Trends related to socio-economic information such as population, demographics, housing, etc.; an overview of the City of Winnipeg’s budget process and strategic framework, with highlights from OurWinnipeg and the City’s Financial Management Plan; and Performance Measures for City of Winnipeg services grouped by Standing Policy Committee, and organization-wide information. The information is intended to provide relevant current context, and facilitate discussion for the upcoming Budget process.
Preliminary 2019 Budget - Appendices 3-87
Appendix 12
Glossary
Computer, Critical Systems and Support Reserve (formerly Computer Replacement Reserve) - On March 22, 1995, City Council approved the establishment of the Computer Replacement Reserve Fund. Subject to Council approval of the 2019 Budget, the Reserve will be renamed to Computer, Critical Systems, and Support Reserve. The purpose of the Reserve is to provide financing for the replacement, refurbishing, modifying, or upgrading of personal computer hardware and/or software and to stabilize expenditures, therefore smoothing the effect on the annual budget. Through direct contributions, users contribute an amount to the Reserve for computer equipment based upon the latest actual purchase cost for that type of unit. Other contributions to the Reserve would include investment income. The Chief Innovation Officer is the Fund Manager. Consolidated Budget – includes the City of Winnipeg’s operating budgets for tax supported, utility, special operating agency and reserve operations as well as a capital budget and governmental functions or entities, which have been determined to comprise a part of the aggregate City operations. The consolidated budget considers inter-fund transaction eliminations, tangible capital asset based revenues and amortization, controlled entity operations and the accrual of unfunded expenses. Consolidated Entities - The organizations included in the consolidated financial statements are as follows: • Assiniboine Park Conservancy Inc. • CentreVenture Development Corporation • The Convention Centre Corporation • Winnipeg Arts Council Inc. • Winnipeg Public Library Board Consumer Price Index (CPI) - A statistical description of annual price levels provided by Statistics Canada (Government of Canada). The index is used as a measure of the increase in the cost of living (i.e. economic inflation). Contribution in Lieu of Land Dedication Reserve - On January 10, 1973, City Council adopted the policy that cash payments received by the City in lieu of land dedication for open space be deposited in a fund to the credit of each community. On January 17, 1979, City Council amended that policy to permit proceeds from the sale of surplus Parks and Recreation lands to be deposited to the Contributions in Lieu of Land Dedication Reserve Fund account of the respective community. On September 19, 1990, City Council adopted the recommendation that revenue would be apportioned amongst the communities on the basis of 75% to the account of the community in which the revenue was collected and 25% to be divided equally amongst all communities. This change was phased in over three years commencing in 1991. Expenses are limited to the acquisition or improvement of land for parks, recreation facilities, or open space. The Director of Planning, Property and Development is the Fund Manager. Debt Charges - The annual amount of principal and interest which must be paid each year through the operating budget. There are two forms of debenture structure. The Sinking Fund
3-88 Preliminary 2019 Budget - Appendicies
Appendix 12
Glossary
Debenture issue requires annual payments to be made to the Sinking Fund. These funds are then invested by the Sinking Fund for the retirement of the debenture issue on its maturity date. A serial issue requires annual payments of principal and interest in order that the debt is paid off in regular installments throughout the life of the issue. Department - The basic organizational unit of the City which is functionally unique in its delivery of services. In general, Departments are managed by a Director. Destination Marketing Reserve - On October 22, 2008, City Council approved the creation of the Destination Marketing Reserve Fund with an effective date of January 1, 2009. The purpose of the Reserve is to support Economic Development Winnipeg Inc., The Convention Centre Corporation and special events including other organizations, projects and events that will encourage tourists to visit Winnipeg. The source of revenue for the Reserve is a 5% accommodation tax, which was adopted by City Council on April 23, 2008. The Chief Financial Officer is the Fund Manager. Director - The head of a City department. Dividend - A dividend is an interfund transfer from a City Utility or a Special Operating Agency (SOA) to the City tax-supported fund (Fund 001) based on available uncommitted funds or operational surplus. Economic Development Investment Reserve - The Economic Development Investment Reserve Fund was created by City Council on June 21, 2000. It is intended to fund City economic development incentives and investment projects. This Reserve invests directly in particular projects rather than being a funding mechanism for programs. The incremental portion of realty and business taxes generated by projects in which the fund has invested will be returned to the Reserve until the original investment has been repaid. The Director of Planning, Property and Development is the Fund Manager. Effectiveness Measure - a performance measure intended to evaluate service delivery relative to service standards or the customer's needs and expectations. Efficiency Measure - a performance measure comparing the resources used to the number of units of service provided or delivered (typically cost for a service or unit of service). Electricity Tax - The electricity tax is legislated by Section 441 of the City of Winnipeg Charter. The rate charged is 2.5% for domestic consumption and 5% for commercial consumption, beyond the electricity used for space heating purposes, which is conclusively deemed to be 80% of the total consumption. If a “primarily electric heat” dwelling unit, 20% is taxable, 80% is exempt. If a dwelling unit is “primarily gas heat”, then there is no exempt portion on the electrical side. The tax is calculated and levied by Manitoba Hydro and is remitted to the City of Winnipeg on a monthly basis. Entertainment Funding Tax - The tax is 10% on cinema ticket prices of $5.00 or more.
Preliminary 2019 Budget - Appendices 3-89
Appendix 12
Glossary
Entertainment Funding Tax Refundable - Goldeyes - The Winnipeg Goldeyes has a long term arrangement with respect to entertainment tax approved by Council. The full amount of entertainment tax remitted during the year is refunded back at the end of the season - conditional upon all aspects of an amateur access/community use agreement with the City being honored. Entertainment Funding Tax Refundable - True North - True North Inc. has a long term arrangement with respect to entertainment tax approved by Council. The full amount of entertainment tax remitted during the year is refunded back at the end of the season. Entertainment Funding Tax Refundable - Winnipeg Football Club (WFC) - In a long term agreement approved by Council, the entertainment tax revenue from the Winnipeg Football Club’s one pre-season game and nine regular season games will be refunded back to the Winnipeg Football Club in order to pay off its debt with BBB Stadium Inc. Entertainment tax revenue for any playoff games or other events held at the stadium will be refunded back to the WFC. Environmental Projects Reserve - On December 17, 1993, City Council authorized the establishment of a River Quality Environmental Studies Reserve Fund for the purpose of providing funding for environmental projects to improve river quality. On January 24, 1996, City Council changed the name of this Reserve to the Environmental Projects Reserve Fund to more accurately reflect the nature of the projects reported in this Reserve. The Reserve is financed through a monthly transfer from the Sewage Disposal System Fund based on the amount of water consumption billed. The Reserve has funded ammonia, nitrification and combined sewer overflow ("CSO") studies. It now funds a portion of the wastewater collection and treatment system improvements as directed by the Province of Manitoba ("the Province"). This includes effluent disinfection, centrate treatment, biological nutrient removal, CSO mitigation infrastructure and biosolids. River quality is under the jurisdiction of the Province and in 2003 the Clean Environment Commission ("CEC"), at the request of the Minister of Conservation, conducted public hearings to review and receive comments on the City's 50-year wastewater collection and treatment improvement program. At the conclusion, the CEC recommended that the City implement these improvements over a 25-year period, which was subsequently ordered by the Minister of Conservation on September 26, 2003. On September 3, 2004, the Province issued Environment Act License No. 2669 for the West End Water. Pollution Control Centre, which provided for the plan as directed by the Minister of Conservation. Certain provisions of this license were appealed by the City. Revised License No. 2669 E R R and No. 2684 R R R, for the North End Water Pollution Control Center, were issued on June 19, 2009, incorporating the City's requested changes. On March 3, 2006, a similar license (No. 2716) was issued for the South End Water Pollution Control Centre. Effective April 18, 2012, the South End Water Pollution Control Centre license
3-90 Preliminary 2019 Budget - Appendices
Appendix 12
Glossary
(No. 2716RR) was revised in response to the Save Lake Winnipeg Act requirement. This Reserve partially funds capital projects to bring the City in compliance with the license requirements. The Director of Water and Waste is the Fund Manager. External Debt - Obligation resulting from the borrowing of money from sources other than City funds, primarily by the sale of debentures in public capital markets. Federal Gas Tax Revenue Reserve - City Council, on January 25, 2006, authorized the establishment of the Federal Gas Tax Revenue Reserve Fund. The purpose of the Reserve is to account for funds received from the Province under the Federal Gas Tax Funding Agreement. On November 18, 2005, the Government of Canada and the Province entered into an agreement on the Transfer of Federal Gas Tax Revenue under the New Deal for Cities and Communities. Under this deal, the Province agreed to administer the funds on behalf of the Federal Government and to conditionally provide the funds to the City, subject to receipt of funding from the Federal Government. The funds are intended specifically for eligible projects such as: Public Transit; Water; Wastewater; Solid Waste; Community Energy Systems; and Active Transportation Infrastructure. On March 24, 2006, the Province and the City signed the Gas Tax Funding Agreement. The agreement was effective as of April 1, 2005 and continues until March 31, 2015 or unless terminated earlier in accordance with section 10 of the agreement. On January 12, 2007, City Council authorized that Infrastructure Levies (Gas Tax) be allocated to the Public Works Department for road and bridge projects through the 2007 capital budget process. On July 16, 2014 City Council authorized that the purpose of the Federal Gas Tax Revenue Reserve be amended to include 18 project categories as listed in Schedule 1 of the most recent Manitoba-City of Winnipeg Municipal Gas Tax Agreement to administer the Canada-Manitoba Administrative Agreement on the Transfer of Federal Gas Tax Revenue. The list of eligible project categories includes local roads and bridges, broadband connectivity, public transit, drinking water, wastewater, solid waste, brownfield redevelopment, sport infrastructure, recreational infrastructure and cultural infrastructure. The Director of Public Works is the Fund Manager. Fees and Charges Schedule - published annually in accordance with the Fees and Charges By-Law (196/2008) to identify the current fees and charges administered by the City of Winnipeg and the authority under which they are administered. http://www.winnipeg.ca/finance/documents_page.stm Financial Management Plan (FMP) - The City’s official public strategy for guiding the financial decision-making process. This document, adopted by Council on March 23, 2011, outlines the City’s top financial goals to strengthen and maintain its financial position. http://www.winnipeg.ca/finance/files/fmp.pdf
Preliminary 2019 Budget - Appendices 3-91
Appendix 12
Glossary
Financial Stabilization Reserve - The purpose of the Financial Stabilization Reserve Fund is to counteract the budgetary effect of fluctuations from year to year in property and business taxes and/or to fund deficits in the General Revenue Fund, which assist in the stabilization of the City's mill rate and/or property tax requirements. Various structural changes have occurred over the years in this reserve. On September 28, 2011, City Council adopted the combining of the Fiscal Stabilization Reserve and the Mill Rate Stabilization Reserve Funds into the Financial Stabilization Reserve Fund. All previous regulations for the two Stabilization Reserves were replaced with the following: - Sources of funding for the Reserve are: the excess of actual total taxes billed compared to budget; surpluses in the General Revenue Fund; unspent amounts in the Commitment Reserve Fund; and interest revenue. - The Reserve can be used to fund any shortfall of actual total taxes billed compared to budget; major unforeseen expenditures once the target level is exceeded and subject to rules noted below; General Revenue Fund year-end deficits and subject to rules noted below; and one-time expenditures once the target level has been reached. - No transfers can be made to the General Revenue Fund to fund ongoing current operations. - Funds above the 8% target may be used for major unforeseen expenditures and General Revenue Fund deficits. Accessing funding in any given year requires City Council approval if the required amount would reduce the Reserve's balance below the 8% target. - A replenishment plan shall be adopted by City Council if the Financial Stabilization Reserve Fund's equity is reduced below the 8% target of tax-supported expenditures. On March 23, 2015, City Council adopted the 2015 Operating Budget which included a change in the target balance for the Financial Stabilization Reserve from 8% to a minimum of 6% of tax-supported expenditures. The Chief Financial Officer is the Fund Manager. Fiscal Year - The fiscal year of the City is the 12 months ending on December 31 each year. Five-Year Capital Forecast - The long-term plan for capital expenditures to be incurred for the five years following the budget year. Section 284(2) of “The City of Winnipeg Charter” requires Council, in addition to the capital budget for the budget year, to include a capital program for five years. Only the current year’s budget is adopted, and the five year capital forecast is approved as a forecast. Frontage Levy - A charge to property owners through the property tax bill. Calculation of the frontage levy is based on the length of the boundaries (frontage) of the property that fronts or abuts any portion of a sewer main or water main. As set out in the City of Winnipeg Charter, these funds can be used for the upgrading, repair, replacement and maintenance of water and sewer mains, streets and sidewalks; installation, upgrading, repair, replacement and maintenance of lighting in streets and back lanes.
3-92 Preliminary 2019 Budget - Appendices
Appendix 12
Glossary
Fund Balance - Measures the net financial resources available to finance expenditures of future periods and is the difference between governmental fund assets and liabilities, also referred to as fund equity. General Capital Fund - The accounting fund created to account for tax-supported capital transactions of The City of Winnipeg. Full-Time Equivalent (FTE) - The total number of hours worked converted to the equivalent of full-time staff persons working a whole year. General Purpose Reserve - On March 15, 2000, City Council approved the establishment of the Pension Surplus Reserve Fund. The Reserve was funded by the retroactive refund of pension contributions for 1998 and 1999. City Council also approved that the purpose of the Reserve and further details including the use of these funds be subsequently determined by City Council. On May 23, 2001, City Council approved the amalgamation of the Pension Stabilization Reserve and Pension Surplus Reserve Funds and the new Fund be renamed the General Purpose Reserve Fund. On June 25, 2014, City Council approved an amendment to the Councillors' Ward Allowance (CWA) Policy year end section 3.10, to include the following: “Unexpended funds from Councillor Ward Allowances may be carried over to the following year, at the discretion of the Ward Councillor, up to a maximum of 10% of the total ward allocation, and on October 28, 2015 added that the CWA carry over funds be established as a permitted use in the General Purpose Reserve.” The Chief Financial Officer is the Fund Manager. Golf Course Reserve - The Golf Course Reserve Fund was created by City Council on April 28, 1994, to provide funding for enhancements to the Municipal Golf Courses in order to keep them competitive with those in the private sector. The Director or Planning, Property and Development is the Fund Manager. Government Grants - Payments from other levels of government for specific programming or payments made unconditionally for City purposes. Grant Payments - The City of Winnipeg accepts operating grant applications each year and the applications are considered during the annual budget process, with the final decision being made by City Council. Annual grants are payments to organizations which provide demonstrable cultural, social or economic benefit to the community and where the City does not receive any goods or services directly in return for the funds (with the exception of community partnerships) nor do they expect repayment or any other financial return. Eligibility and entitlement requirements are reviewed annually.
Preliminary 2019 Budget - Appendices 3-93
Appendix 12
Glossary
Multi-year grant agreements are payments to entities where the City of Winnipeg has long-term contractual arrangements in place or the nature of the arrangement is long-term. Other programs are primarily grant programs where recipients are determined throughout the course of the year. With the exception of the per capita grants, the Director of the department responsible for each such grant program is delegated the authority to determine grant recipients. A listing of grant payments is included in the annual operating budget. Heritage / Economic Development Property Tax Credit - The Program’s objective is to facilitate the conservation and continued use/viability of heritage buildings in Winnipeg by incenting the restoration or rehabilitation of existing buildings as well as projects that have economic benefit to the City. Heritage Investment Reserve - The Heritage Investment Reserve Fund was created by City Council on June 21, 2000. It funds all City and City-sponsored heritage programs and acts as a revolving fund so that future funding of heritage programs can be sustained and thereby reduces the need to obtain additional funding. An important source of ongoing funding for the Reserve will be incremental tax revenues from projects financed by the Fund. The Director of Planning, Property and Development is the Fund Manager. Housing Rehabilitation Investment Reserve - The Housing Rehabilitation Investment Reserve Fund was created by City Council on June 21, 2000. It funds City housing programs not provided for in operating budgets. It was intended that this Reserve act as a revolving fund so that incremental tax revenues resulting from housing programs in which the Reserve invested would be returned to the Reserve to finance future projects. The Reserve continues to support housing programs in Housing Improvement Zones as well as the Indigenous Housing Program and is funded by an annual transfer from the General Revenue Fund. Since 2012, the City has acted as the ‘Community Entity’ for the delivery of the federal government’s Homelessness Partnering Strategy (“HPS”), the related revenues and expenditures being recorded in the Reserve. Funding received covers the cost of grants provided under two HPS program streams ("Designated Community” and “Indigenous Homelessness”) as well as administrative expenditures. The Director of Planning, Property and Development is the Fund Manager. Impact Fee - A fee imposed on new development to assist with the costs associated with accommodating and managing growth and development. On October 26, 2016, Council passed the Impact Fee By-Law (127/2016) which phases in the implementation of an Impact Fee over a three-year period. The Impact Fee, which was established by Council on October 26, 2016 and which took effect on May 1, 2017, shall be increased by an amount equal to the rate of construction inflation for the previous year, to a maximum of 5% per year.
3-94 Preliminary 2019 Budget - Appendices
Appendix 12
Glossary
Impact Fee Reserve - On October 26, 2016, Council approved the establishment of the Impact Fee Reserve to fund growth-related capital projects approved by the Chief Financial Officer with consideration to the input provided by the Impact Fee Working Group, as well as to pay the costs of administering the Impact Fee By-law and Reserve Fund. All funds generated by the impact fee are to be deposited into the Reserve. Use of the Impact Fee Reserve for purposes other than those set out in Council's October 26, 2016 resolution require a 2/3 vote of Council. The Chief Financial Officer is the Fund Manager. Insect Control Urgent Expenditures Reserve - On March 23, 2005, City Council approved the establishment of the Insect Control Urgent Expenditures Reserve Fund. The purpose of the fund is to absorb unexpected costs for mosquito control in years where the City of Winnipeg experiences above average response levels. The Reserve balance should never exceed $3.0 million and the Chief Administrative Officer has the authority to over-expend to a maximum of $3.0 million in the event of insufficient funds. The Director of Public Works is the Fund Manager. Insurance Reserve - In 1960, the Insurance Reserve Fund was established. The reserve was to be used for the purpose of replacing or repairing City properties and/or contents that had been damaged by fire or any other cause. In 1973, the use of the Insurance Reserve Fund also included the purpose of paying for any other losses that the City might incur in any part of its self-insurance program. Such uses would include third party liability claims, or property damage claims, including motor vehicles. The Corporate Controller is the Fund Manager. Internal Financing - An interim funding source from the available, short-term cash flow surpluses from various City sources such as the general capital fund and capital and special purpose reserves that can be used to fund capital projects. Council also approves an external borrowing authority for the internal financing amount in the capital budget to ensure that funds are available for the projects to proceed if short term cash surpluses become unavailable. Key Goals - Key Goals are provided for each service in the service-based budget, and represent the desired high-level outcomes for that service area. Land Operating Reserve - City Council, on May 16, 1973, authorized the establishment of a Land Operating Reserve Fund to reduce the need for the issuance and sale of debentures in connection with the acquisition cost of properties for resale. Disbursements from this Reserve are limited to the acquisition cost of properties for resale, and any other expenses directly related to the acquisition, sale and improvement of disposable City properties. Use of the Reserve's funds for any other purpose requires the authorization of City Council. This Reserve is maintained by the proceeds from the sale of City-owned properties and interest earned.
Preliminary 2019 Budget - Appendices 3-95
Appendix 12
Glossary
In accordance with City Council directives, 5% of the gross sales revenue is allocated to the Historical Building Program, another 5% of gross sales revenue is allocated to the Enhanced Land Marketing Program to finance those activities necessary to facilitate the sale of surplus lands and 15% is allocated to the Community Centre Renovation Grant Program annually, subject to Council approval.
City Council, on July 19, 1999, adopted a policy that in order to sustain the business operations supported by the Reserve, equity be allowed to accumulate within the Reserve sufficient to eliminate the inter-fund debt owing to the General Revenue Fund created in past years. Any surplus funds greater than the amount required for the purposes of the Land Operating Reserve Fund and meeting the annual budgeted transfer to the General Revenue Fund is to be transferred to the Commitment Reserve Fund. The Director of Planning, Property and Development is the Fund Manager. Landfill Rehabilitation Reserve - On December 17, 1993, City Council authorized the establishment of a Brady Landfill Site Rehabilitation Reserve Fund for the purpose of providing funding for the future development of the Brady Landfill Site. The Reserve is financed through a monthly transfer from the Solid Waste Disposal Fund based on tonnages processed at the landfill. Effective January 1, 2018 the Brady Landfill Site Rehabilitation Reserve was terminated and replaced with a new Landfill Rehabilitation Reserve in accordance with Section 289 of the City of Winnipeg Charter. The purpose of the new reserve is to provide funding, over time, for closure and post-closure landfill needs including leachate management, environmental monitoring and site restoration costs for all active and closed landfills maintained under the responsibility of the City. This reserve will continue to be funded through annual deposits from tipping fee revenue accounts of the Solid Waste Disposal Fund based on a portion of the tipping fee per tonne charged on garbage disposal, the current rate is $1.00 per tonne of material landfilled. The Director of Water and Waste is the Fund Manager. Local Improvements - Local Improvement capital projects are those which are financed partly by a direct levy on the properties benefited (Property Owner's Share) and partly by a mill rate levy over the city-at-large (City's Share). The program is governed by Local Improvement By-Law No. 98/72 and is subject to advertising and subsequent approval by the majority of ratepayers involved. The type of expenditures generally falling within this category are: paving of local streets and lanes; sidewalk and boulevard construction; installation of new water mains and sewers; ornamental street lighting and lane lighting. Local Street Renewal Reserve - The Local Street Renewal Reserve was established in 2013 to increase investment in local streets, lanes and sidewalks. Subject to annual Council approval, a separate property tax increase will fund this reserve each year to ensure a dedicated funding system for local streets. Use of the Local Street Renewal Reserve for
3-96 Preliminary 2019 Budget - Appendices
Appendix 12
Glossary
purposes other than local streets, lanes, or sidewalk renewals requires approval of 2/3 of City Council. The Director of Public Works is the Fund Manager. Major Capital Projects - are projects that reach a specific minimum dollar threshold and above. In 2019 the threshold was $23 million. This threshold increases annually by construction inflation. A listing of major capital projects is included in the annual capital budget. Mill Rate - A mill rate is a term used to decide how taxes are set. A "mill" is equivalent to a one thousandth part. For the purposes of calculating property taxes, one mill represents $1.00 of taxes for every $1,000 of portioned assessment. The portioned assessment is the part of the total assessed value of a property that is subject to taxation. Modified Accrual Basis - A hybrid of cash and accrual methods of accounting in which revenues are recognized when earned, measurable and available. Expenses are recognized when liability is incurred, except for certain expenses such as those associated with retirement allowances, vacation, workers compensation, compensated absences, contaminated sites, landfill liability and other accrued employee benefits which are budgeted on a cash basis. As well, debt servicing payments are budgeted for when due and depreciation of assets is not budgeted. Multi-Family Dwelling Tax Investment Reserve - On May 22, 2002, City Council approved the establishment of the Multiple-Family Dwelling Tax Investment Reserve Fund. The Reserve is designed to act as a bank that accumulates incremental taxes generated by approved multi-family dwelling construction/rehabilitation projects. When the incremental taxes for each project accumulates to the pre-approved amount, the balance is paid back to the applicant developer as a "Tax Incentive Grant". The Director of Planning, Property and Development is the Fund Manager. Municipal Benchmarking Network Canada (MBNC) - is a national benchmarking organization comprised of partner municipalities who identify, collect, analyze and report consistent and comparable data in municipal service areas. The information reported, and the partner network, promote sharing of best practices and strategies to support continuous improvement in the delivery of municipal services. http://mbncanada.ca/ Municipal General Services Fee - The General Services Fees is revenue related to municipal services that are billed for Urban Reserves and these fees are in lieu of property taxes. Natural Gas Tax - The natural gas tax is legislated in Section 441 of The City of Winnipeg Charter. The rate charged is 2.5% for domestic consumption and 5% for commercial consumption, beyond the natural gas used for space heating purposes. If the dwelling unit is “primarily gas heating”, a baseload is calculated based on consumption in June, July, and August. Gas tax is then applied to the lesser of actual consumption or baseload. If the dwelling unit is “primarily electric heat” then this tax is applied to the full consumption. The tax is
Preliminary 2019 Budget - Appendices 3-97
Appendix 12
Glossary
calculated and levied by Manitoba Hydro and is remitted to the City of Winnipeg on a monthly basis. Net Taxes Added - Are taxes added to the taxation roll after tax bill update (TBU). These supplemental taxes are billed based on the change in the assessed value for a given property. The Assessment and Taxation Department is allowed to issue supplemental tax bills for the current tax year and to January 1st of the prior year. Operating Expenditures - The ongoing cost to provide a product or service. This includes the cost for personnel, materials, equipment and other consumables required for a department to function and provide services. OurWinnipeg - The City’s strategic long-term planning document, adopted by Council on July 20, 2011, which establishes direction for the City and the steps that need to be taken along the way. Other documents, budgets, public capital works, programs, or developments initiated or approved by the City of Winnipeg will align with OurWinnipeg. Pay-As-You-Go - A means of financing capital projects whereby the City pays for the projects from direct contributions from the current budget, from retained earnings, or from reserves established for capital purposes, rather than issuing external debt. Payments in Lieu of Taxes - The federal and provincial governments, Crown Corporations, universities and City utilities do not have a legal obligation to pay property taxes; however an amount equivalent to the taxes is paid to the General Revenue Fund for City services by way of a payment in lieu of taxes. Pedestrian and Cycling Program - provides recommendations for infrastructure projects, programs and studies identified in the Pedestrian and Cycling Strategies. Projects may include: new sidewalks on Regional and non-Regional streets, new multi-use paths, new bicycle routes, crossing control improvements, public education, awareness and promotion and partnership grants. All recommended projects support the key directions of the Pedestrian and Cycling Strategies (PCS). Performance Measurement - Performance measurement is the process of collecting, analyzing and/or reporting information regarding the performance of an organization, service, system or component. Permit Reserve - On March 20, 2007, City Council approved the establishment of the Permit Reserve Fund. The purpose of the Reserve is to mitigate revenue shortfalls and fund temporary staffing needs during busy periods through economic boom/bust cycles. The Reserve is also meant to provide a source of funds for service and system improvements. The Reserve is funded by the excess of permit revenue in the General Revenue Fund compared to budget in any given year. The balance in the Reserve is capped at $3.0 million and any surplus funds over and above the cap are to be transferred to the General Revenue Fund. On March 22, 2011, City Council approved the cap be revised to $2.0 million and any surplus funds above the cap be transferred to the General Revenue Fund, reported in the Planning, Property and Development Department.
3-98 Preliminary 2019 Budget - Appendices
Appendix 12
Glossary
The Director of Planning, Property and Development is the Fund Manager. Perpetual Maintenance Funds - (Brookside, St. Vital and Transcona Cemeteries) The terms of By-law No. 14725 of the former City of Winnipeg, passed on April 8, 1935, created a fund for the perpetual care and maintenance of Brookside Cemetery. Later on By-law No. 1996/78, also created funds for the perpetual care and maintenance of St. Vital and Transcona Cemeteries. Section 29 of By-law No. 5720/91 amending and restating By-law 1996/78, relating to Cemeteries, sets forth the purpose and use of the Perpetual Maintenance Funds. These funds are for the purpose of creating, building up, and maintaining a perpetual maintenance fund for the care and maintenance of Brookside, St. Vital, and Transcona Cemeteries. Section 12 of By-law No. 130/2007 includes: “Each cemetery will have a separate Perpetual Maintenance Reserve Fund created with a sum equal to 25% of the purchase price of a lot, plot or cremated remains lot/plot, or a sum equal to 15% of a cremorial or niche purchase, or a sum equal to 10% of a scattering of cremated remains, set aside in the reserve, invested and applied to and for the perpetual care of the lot or plot or cremated remains lot/plot, cremorial, niche, scattering bed or ossuary area. Perpetual care includes general maintenance of lots, plots, cremated remains lots/plots, columbarium niches or the cemetery enclosure. The City may, annually, utilize up to 50% of the yearly earnings from the relevant Perpetual Maintenance Reserve to undertake improvements or maintenance on the cemetery.” The Director of Planning, Property and Development is the Funds Manager. Property Tax Revenue - This is the money that the City bills the property owners in the City of Winnipeg to fund tax-supported expenditures. Property taxes are calculated by applying the municipal mill rate against the portioned assessment of your property. By definition, a mill is a one-thousandth part. For calculating taxes, one mill represents $1.00 of taxes for every $1,000.00 of portioned assessment. Provision for Cost Variability (“Provision”) - is an inter-fund transfer from the Municipal Accommodations Fund (Fund 554) to the City tax-supported fund (Fund 001). It represents a portion of market rents charged by Municipal Accommodations to its accommodation customers; that portion being the variance between market rent rates charged and the cost to provide and reinvest in the accommodations.
Public-Private Partnership (PPP or P3) - is a contract between a public sector entity and a private sector entity that outlines the provision of assets and the delivery of services. Although this can include almost any type of infrastructure or service, some of the more common P3 projects include hospitals, bridges, highways, new types of technology and new government buildings. Across Canada, P3s have become an increasingly prominent procurement vehicle for governments. Residential Recycling - Revenue received from Multi Material Stewardship Manitoba (MMSM) on a percentage of cost basis to help fund the waste diversion program for the City.
Preliminary 2019 Budget - Appendices 3-99
Appendix 12
Glossary
Regional Street Renewal Reserve - The Regional Street Renewal Reserve was established in 2014 to increase investment in regional streets and sidewalks. A separate property tax increase will fund this new reserve each year to ensure a dedicated funding system for local streets. Use of the Regional Street Renewal Reserve for purposes other than regional streets or sidewalk renewals requires approval of 2/3 of City Council. The Director of Public Works is the Fund Manager. Regulation Fees - Fees charged to users for regulated/controlled services typically where licenses and permits are required. Fines and penalties are also included in this revenue category for summary purposes. Reserves - Represent amounts appropriated for designated requirements as established by Council. Part of best practices for fund accumulation to replace capital assets and to provide financial flexibility in times of budget shortfall. A listing of the reserve funds is noted below and a description for each one can be found in this glossary.
- Commitment Reserve - Computer and Critical Systems and Support Reserve - Contribution in Lieu of Land Dedication Reserve - Destination Marketing Reserve - Economic Development Investment Reserve - Environmental Projects Reserve - Federal Gas Tax Revenue Reserve - Financial Stabilization Reserve - General Purpose Reserve - Golf Course Reserve - Heritage Investment Reserve - Housing Rehabilitation Investment Reserve - Impact Fee Reserve - Insect Control Urgent Expenditures Reserve - Insurance Reserve - Land Operating Reserve - Landfill Rehabilitation Reserve - Local Street Renewal Reserve - Multi-Family Dwelling Tax Investment Reserve - Permit Reserve - Perpetual Maintenance Funds - Regional Street Renewal Reserve - Sewer System Rehabilitation Reserve - Southwest Rapid Transit Corridor Reserve - Southwest Rapid Transitway (Stage 2) and Pembina Highway Underpass Payment
Reserve - Transit Bus Replacement Reserve - Waste Diversion Reserve - Watermain Renewal Reserve - Workers Compensation Reserve
3-100 Preliminary 2019 Budget - Appendices
Appendix 12
Glossary
Retained Earnings - Equity accounts that represent the accumulated surpluses from operations that are not for general distribution, but rather are used to fund capital projects, leverage debt, or are reinvested in service delivery. Revenue - Sources of income to The City of Winnipeg recorded in the General Revenue Fund. A listing of major sources of revenue is noted below and a description for each one can be found in this glossary.
- Accommodation Tax - Business Tax - Business Tax Adjustments / New Additions - Electricity Tax - Entertainment Funding Tax - Entertainment Funding Tax Refundable – Goldeyes - Entertainment Funding Tax Refundable – True North - Entertainment Funding Tax Refundable – Winnipeg Football Club (WFC) - Frontage Levy - Government Grants - Natural Gas Tax - Net Taxes Added - Payments in Lieu of Taxes - Property Tax Revenue - Regulation Fees - Sales of Goods and Services - Sewer Services - Solid Waste Disposal Services - Tax Penalty Interest - Transfers - Transit Service Fare Revenue - Water Services Sales
Sales of Goods and Services - Revenue category of fees charged to users for services provided on a fee for service basis by the City for the convenience and quality of life for residents. Generally the consumer can exercise choice on whether or not to consume the service. Examples include recreation and ambulance fees. Self-Supporting Utility - The Water and Waste Utilities do not receive subsidies from the mill rate or tax supported budget. Service (Internal) - Those services which are offered internally to one or more organizational units within the corporation in support of public service delivery. Service (Public) - An operational concept where something of value is provided to individual members of the public, or defined members of the public (client set) or the public collectively. Service-Based Budget (SBB) - Displays budget information (how much the service will cost and how the service is to be funded) and performance measures for services provided, including all components regardless of which unit or department delivers the service. The
Preliminary 2019 Budget - Appendices 3-101
Appendix 12
Glossary
service-based budget is intended to provide more transparent reporting and a more direct link between the budgets provided and the services delivered. Service Level Statistics - Are service-related metrics intended to reflect the amount of activity or services provided with the resources approved by City Council, as well as changing circumstances in the community or service industry that may impact the service. Sewer Services Revenue - This revenue is generated when the sewer rate is applied to the amount of water used as measured by the water meter, since most of it ends up as sewage. This money is used to collect, transport and treat sewage so that it meets environmental requirements before it is released to the Red and Assiniboine Rivers. Sewer System Rehabilitation Reserve - On May 27, 1992, City Council authorized the establishment of the Combined Sewer Renewal Reserve and the Wastewater Sewer Renewal Reserve Funds. These Reserves were established for the renewal and rehabilitation of combined sewers and wastewater sewers, respectively, with funding provided from the frontage levy identified for this purpose in By-law 549/73 (amended by By-law 7138/97). The purpose of the Reserves was to provide a consistent approach to financing infrastructure renewal and rehabilitate combined sewers and to renew and rehabilitate wastewater sewers (as defined by the Sewer Utility By-law 5058/88). The annual frontage levy funding was allocated by City Council between the Combined Sewer Renewal Reserve and the Wastewater Sewer Renewal Reserve in accordance with the capital program requirements. On January 30, 2002, City Council passed By-law No. 7958/2002 "Frontage Levy By-law" to include the repair and replacement of streets and sidewalks in residential areas. On September 27, 2006, City Council approved the consolidation of the Combined Sewer Renewal Reserve and the Wastewater Sewer Renewal Reserve Funds into the Sewer System Rehabilitation Reserve Fund, which was effective on October 1, 2006. On December 15, 2009, City Council authorized, by way of approval of the Capital Budget, that effective 2009, frontage levy revenue collected on property taxes would no longer fund the Sewer System Rehabilitation Reserve as of 2011. Therefore, the Sewer System Rehabilitation Reserve is fully funded through sewer rates transferred from the Sewer Disposal System Fund as well as interest earned on the reserve fund balance. The Director of Water and Waste is the Fund Manager. Shared Health - Shared Health leads the planning and coordinates the integration of patient-centered clinical and preventive health services across Manitoba. The organization also delivers specific province-wide health services and supports centralized administrative and business functions for Manitoba health organizations. Sinking Fund - A fund established by setting aside annual contributions or levies over a period of time to fund the repayment of long-term debt at maturity. The city administration manages the sinking fund contributions on sinking fund debentures.
3-102 Preliminary 2019 Budget - Appendices
Appendix 12
Glossary
Solid Waste Disposal Services Revenue - The service consists of several primary sources of revenue including tipping fees, waste diversion user fees and residential recycling revenue (a definition of each can be found in this glossary). Southwest Rapid Transit Corridor Reserve - On March 26, 2008, City Council approved that a Rapid Transit Infrastructure Reserve Fund be established, and that the purpose of the Reserve be to accumulate funds and subsequently to expend on future costs incurred on account of public transit infrastructure, including the construction of rapid transit corridors contemplated in the future. On October 22, 2008, City Council approved that the purpose of the Rapid Transit Infrastructure Reserve be revised to accumulate funds and subsequently expend on costs incurred on account of public transit infrastructure, including the operation and construction of the rapid transit infrastructure, structures and facilities, development, and other related costs including bus purchases, technology, personnel, and land acquisition. On January 29, 2013, City Council approved that effective January 1, 2014 the reserve be renamed the Southwest Rapid Transit Corridor - Stage 2 Reserve. In addition the purpose has been revised to: a) accumulate capital funds and subsequently expend such funds on future costs incurred on account of public transit infrastructure, and more specifically, the construction of the Southwest Rapid Transit Corridor - Stage 2, and the purchase of vehicles associated with Stage 2, contemplated in the future; b) contribute to the proposed Jubilee Rapid Transit Station if net proceeds of the disposition of the subject City property are insufficient to cover the City's share, as approved by City Council on October 24, 2012; c) pay for any residual land acquisition settlements for the Southwest Rapid Transit Corridor - Stage 1 project; and d) pay for the ongoing replacement of the 10 buses purchased for the Southwest Rapid Transit Corridor Stage 1 project. On March 23, 2015 City Council approved that the Reserve be renamed the Southwest Rapid Transit Corridor Reserve. The Director of Transit is the Fund Manager. Southwest Rapid Transitway (Stage 2) and Pembina Highway Underpass Payment Reserve - On March 23, 2015 City Council approved the establishment of the Southwest Rapid Transitway (Stage 2) and Pembina Highway Underpass Payment Reserve. The purpose of the Reserve is to set aside funding for the P3 annual service/financing payment commencing in 2020 for the Southwest Rapid Transitway (Stage 2) and Pembina Highway Underpass capital project. On March 22, 2016 City Council approved an amendment to the funding source to be a combination of the dedicated property tax revenue transferred from the General Revenue fund, an annual transfer of $1.7 million per year from the Transit System Fund starting in 2016 and an annual grant from the Province starting in 2020. The Director of Transit is the Fund Manager. Special Operating Agency (SOA) - A special unit of an organization which can operate within or outside the existing city department structure in the delivery of its service(s). It is granted more direct responsibility for results and increased management flexibility needed to attain new
Preliminary 2019 Budget - Appendices 3-103
Appendix 12
Glossary
levels of service delivery. The authority for SOAs is provided by the City of Winnipeg Charter Section 215. Standing Committees - Sub-committees of City Council delegated certain powers and duties to facilitate the administration of their assigned City departments which report through them to the Executive Policy Committee and City Council. They also provide a forum for public input and receive recommendations from Community Committees related to their respective responsibilities. Areas of responsibility are Finance; Infrastructure Renewal and Public Works; Innovation; Property and Development, Heritage and Downtown Development; Protection, Community Services and Parks; and Water and Waste, Riverbank Management and the Environment. Strategy - Those steps taken in support of public and internal service goals. Tax Penalty Interest - This revenue is generated from property and business tax accounts that are in arrears. Tax penalties are applied to tax accounts in arrears in accordance with the Tax Penalty By-law 5796/91 and the Tax Sale Penalty By-law 8157/2002. Tax-Supported Services - Goods and services supplied by the City whose costs are supported, in whole or in part, by funds received through property tax revenues. Tipping Fees - This revenue is generated from charging a per tonne rate to residential and commercial garbage delivered to the City landfills. Transfers - Refers to transfers to and from reserves, departments, and/or funds. Transfer to Capital - The mill rate supported funding source for capital projects. The transfer to capital amount is sourced from the general revenue (mill rate supported) fund and moved to the general capital fund to finance the City’s capital priorities. Transit Bus Replacement Reserve - On December 15, 1994, City Council approved the establishment of the Transit Bus Replacement Reserve Fund. The purpose of the Reserve is to provide financing for the replacement or refurbishment of transit buses in a scheduled and pragmatic manner. Contributions to this Reserve will be based on a budgeted appropriation from the Transit Department plus proceeds from the disposal of bus equipment and insurance claims on bus equipment written off. Upon the Transit Department making the outlay to replace or refurbish buses, this Reserve will contribute towards that purchase. The Director of Transit is the Fund Manager. TransitPLUS - (formerly Handi-Transit) - a service of Winnipeg’s public transit system that provides door-to-door transportation for people who are unable to regularly use the City’s fixed route transit system because they are legally blind or have significantly impaired mobility. Winnipeg Transit Plus registrants use a variety of mobility aides including scooters, canes, walkers, and both manual and motorized wheelchairs. Transit Service Fare Revenue - The revenue generated when the type or class of fare is applied to the applicable rider. There are different rates based on time period (i.e. single ride,
3-104 Preliminary 2019 Budget - Appendices
Appendix 12
Glossary
weekly, monthly, etc), method (i.e. cash or e-card) and whether rider qualifies for a student, reduced or regular fare. User Fees/Charges - The payment of a fee for direct receipt of a public service by the party who benefits from the service. Utility - A utility or public utility provides funding and maintains the infrastructure for and provides a rate based service that is consumed by the public such as water, wastewater, waste disposal, and public transportation. Waste Diversion User Fee - This revenue is generated to fund new programs that provide residents with more ways to reduce, reuse and recycle. The fee is charged on a daily basis according to dwelling units and appears on the water bill. Waste Diversion Reserve - On October 19, 2011, City Council approved the establishment of the Waste Diversion Reserve Fund for the purpose of funding waste diversion programs and projects. The reserve is to be funded by surplus monies collected through the waste diversion services user fee. The first transfer to the reserve occurred in 2013. The Director of Water and Waste is the Fund Manager. Water Service Sales Revenue - This revenue is generated when the water rate is applied to the amount of water used, as measured by the water meter. This covers the cost of bringing water from Shoal Lake to the consumer, including operating and maintaining the aqueduct, pumping stations, reservoirs, and distribution system. Watermain Renewal Reserve - On February 18, 1981, City Council established this reserve fund for the purpose of financing the renewal of watermains. It was initially created by the transfer from the Waterworks System and funded through a frontage levy. Since 2009, the source of funding for the Watermain Renewal Reserve is water rates. The Director of Water and Waste is the Fund Manager. Winnipeg Police Board - The Winnipeg Police Board provides civilian governance and oversight of the Winnipeg Police Service to improve transparency and accountability in policing. It is made up of seven civilian members. Five members are appointed by Winnipeg City Council and two are appointed by the Province of Manitoba. It receives its authority from Manitoba’s Police Services Act (2009) and a City of Winnipeg By-Law (148/2012). Workers Compensation Reserve - Under the terms of By-law No. 9802 of the former City of Winnipeg, provision was made for the establishment of a Workers Compensation Reserve Fund. On January 1, 1972, as a result of the amalgamation of the City of Winnipeg with former area municipalities, The Workers Compensation Reserve Fund was established in accordance with Section 338 of the former City of Winnipeg Act. The City administers its workers compensation program on a self-insured basis. In lieu of paying premiums to the Workers Compensation Board of Manitoba, the City pays actual costs incurred plus an administration charge. Departments are charged actual costs as well as surcharges related to financing fatality pensions and upgrades of benefits. The net result is that
Preliminary 2019 Budget - Appendices 3-105
Appendix 12
Glossary
costs and surcharges are transferred to/from the Workers Compensation Reserve Fund. The Workers Compensation Reserve Fund serves to counteract any budgetary fluctuation from year to year that would result from a work related incident of major proportions. On April 29, 2015, Council approved an amendment to the purpose of the Workers Compensation Reserve 1) to include Permanent Partial Impairment awards for occupational disease claims and 2) that pension surplus/deficit from Workers Compensation Board be accounted for in the Workers Compensation Reserve. The Corporate Controller is the Fund Manager.
3-106 Preliminary 2019 Budget - Appendices
Related Documents