UW MEDICINE PATIENTS ARE FIRST VALLEY MEDICAL CENTER FY 14 OPERATING AND CAPITAL BUDGETS FF&A COMMITTEE MAY 15, 2013

Welcome message from author
This document is posted to help you gain knowledge. Please leave a comment to let me know what you think about it! Share it to your friends and learn new things together.
Transcript
UW MEDICINE PATIENTS ARE FIRST
VALLEY MEDICAL CENTER
FY 14 OPERATING AND CAPITAL BUDGETS
FF&A COMMITTEE
MAY 15, 2013

TABLE OF CONTENTS
• FY13 Results
• Challenges in Economic Environment Moving into FY14
• FY14 – Investing in the future
• FY14 Operating Budget Assumptions
• Financial Plan Comparison
• Volumes, Revenues and Payer Mix
• Salary & Non-Salary Expenses
• Allocations
• Performance Improvement Initiatives
• FY14 Budget Results
• Risks
• FY14 Capital Budget
• Approvals
2

FY13 RESULTS
• Net income from operations projected to be ($17.9 million) at end of fiscal year.
• $10 million of the budget variance is attributed to the EPIC implementation
• Projection assumes break-even net income from operations for April-June, 2013.
• Operating margin loss projected at (4.1%).
• Volumes were stronger in first half of fiscal year 2013.
• Third quarter, in particular, experienced less than budgeted volumes in nearly all inpatient and outpatient areas.
3
CHALLENGES IN ECONOMIC ENVIRONMENT MOVING INTO FY14
• Operating performance in FY2013 set the baseline for the FY14 Budget
• Federal Issues
• Continued economic weakness
• Sequestration, or its replacement as future budgets are proposed
• State Issues
• Continued economic weakness
• Budget shortfall for FY14-16 biennium
• Commercial Payor issues
• Downward pressure on payment rates
• Interest in risk sharing
• Health Care Exchanges – January 1, 2014
4

Strategically, FY14 will be a year of positioning the medical center and the entire UW Medicine system for the future. Included in those plans are: • ACO readiness planning including organizational focus on the IHI
“triple aim”
• Leveraging Patients are First structure – patient experience, quality and fiscal responsibility
• IT Services investments including a common IT front-end, maximizing meaningful use incentive dollars and ICD-10
• Strategic clinical access investments such as Covington Clinic South, Maple Valley Clinic, the expansion of specialty physician practices in oncology, urology, women’s surgical specialties, and neurology; and other strategic investments in key service lines.
• Emphasis on Performance Improvement
FY14 – INVESTING IN OUR FUTURE
5

Desirable Characteristics of an ACO:
• Sufficient size.
• Geographic distribution to meet the needs of the population served.
• Robust information technology platform
• Supports the coordination of evidence-based healthcare
• Provides sophisticated clinical, operational, and financial decision-making
6
FY 14 - INVESTING IN OUR FUTURE - ACO
Source: Ramsey, Paul “The ABC’s of Accountable Care” PSBJ, July 27, 2012

Desirable Characteristics of an ACO:
• Standardization of care protocols based on evidence-based research.
• Financial ability to enter into risk arrangements.
• Capability to manage financial risk proactively.
• Governance arrangements to align hospital and physician interests.
• Management systems to coordinate care across a continuum of healthcare settings.
• A “medical home” model that supports patients with chronic conditions on a routine and individualized basis to ensure high-quality, efficient and cost-effective care.
7
FY14 – INVESTING IN OUR FUTURE
Source: Ramsey, Paul “The ABC’s of Accountable Care” PSBJ, July 27, 2012
The FY14 budget includes significant investments for IT Services that will better position UW Medicine for Meaningful Use requirements, including: • Clinical Applications in preparation of ICD-10 • EPIC e-Connect, offering EPIC to external physician practices • Upgrading EPIC • Infrastructure
FY14 - INVESTMENTS IN OUR FUTURE - IT
8

Significant work has been done to work across the system and at the medical center to ensure the right services are being developed and provided at the right site. At VMC, strategic focus in FY14 will be around building volumes related to oncology, urology, neurology, surgery, and primary care. Investments in facilities, infrastructure, information technology, and equipment are budgeted within the capital budget for $18.9 million (including $1.0 million for carryover for Covington South).
FY14 – INVESTING IN THE FUTURE - ACCESS
9

FY14 BUDGET ASSUMPTIONS
FY14 BUDGET
11
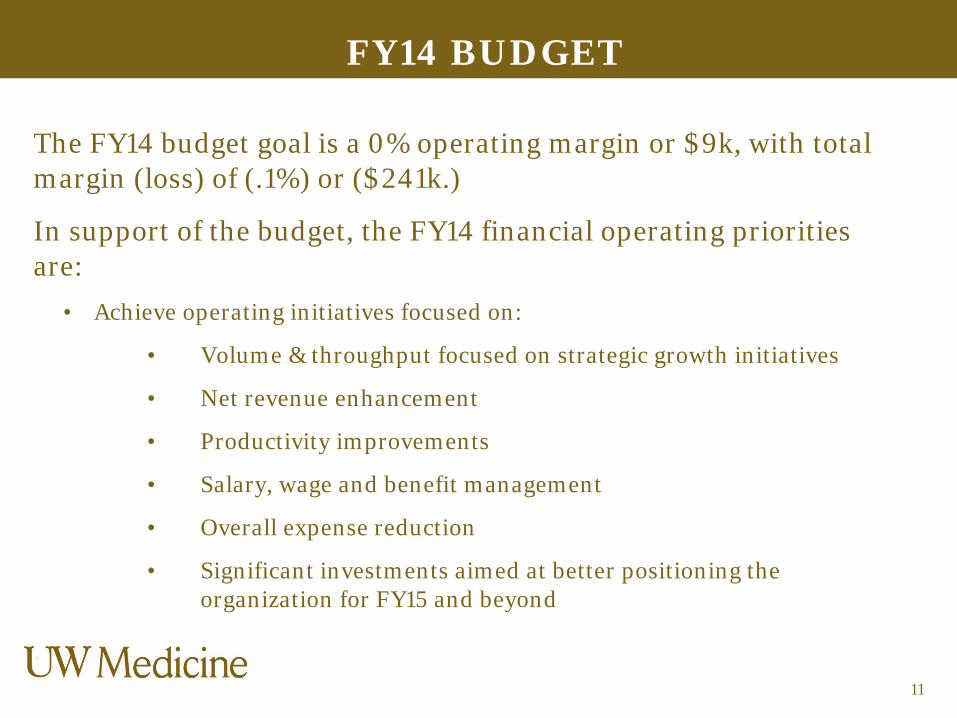
The FY14 budget goal is a 0% operating margin or $9k, with total margin (loss) of (.1%) or ($241k.)
In support of the budget, the FY14 financial operating priorities are:
• Achieve operating initiatives focused on:
• Volume & throughput focused on strategic growth initiatives
• Net revenue enhancement
• Productivity improvements
• Salary, wage and benefit management
• Overall expense reduction
• Significant investments aimed at better positioning the organization for FY15 and beyond
FINANCIAL PLAN COMPARISON
12
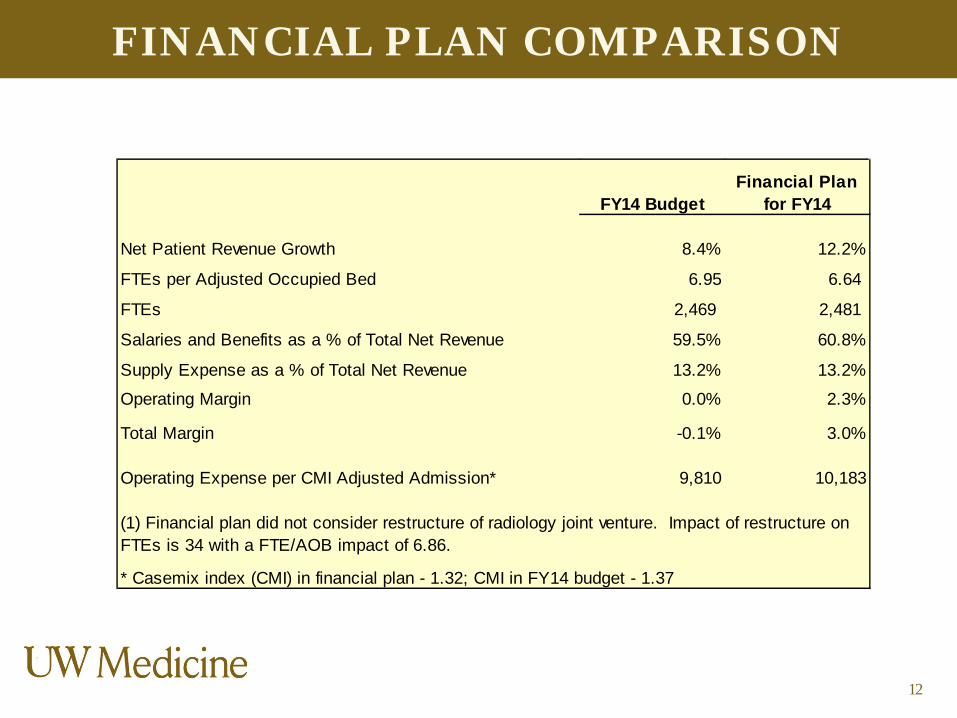
FY14 BudgetFinancial Plan
for FY14
Net Patient Revenue Growth 8.4% 12.2%
FTEs per Adjusted Occupied Bed 6.95 6.64
FTEs 2,469 2,481
Salaries and Benefits as a % of Total Net Revenue 59.5% 60.8%
Supply Expense as a % of Total Net Revenue 13.2% 13.2%
Operating Margin 0.0% 2.3%
Total Margin -0.1% 3.0%
Operating Expense per CMI Adjusted Admission* 9,810 10,183
(1) Financial plan did not consider restructure of radiology joint venture. Impact of restructure on FTEs is 34 with a FTE/AOB impact of 6.86.
* Casemix index (CMI) in financial plan - 1.32; CMI in FY14 budget - 1.37

PROJECTED VOLUME GROWTH
• Existing baseline inpatient admissions are projected to decrease 3% in FY14 and then increase 1% per year annually thereafter. Outpatient visits are projected to grow at 1% annually.
• Surgical case volumes are projected to grow at 2% based on work done to project volumes by surgeon.
• The slight volume decrease in inpatient admissions is assumed due to several external physician groups moving their births and related surgeries to another facility.
• Incremental outpatient volume is assumed to increase due primarily to expansion of the specialty clinics within the clinic network.
13
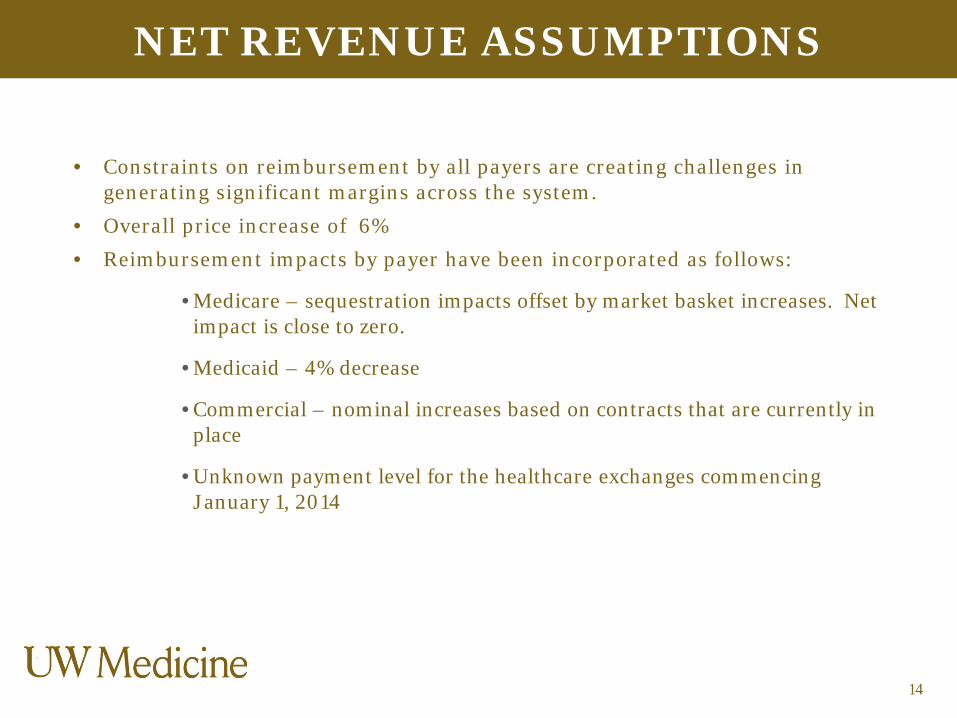
• Constraints on reimbursement by all payers are creating challenges in generating significant margins across the system.
• Overall price increase of 6%
• Reimbursement impacts by payer have been incorporated as follows:
• Medicare – sequestration impacts offset by market basket increases. Net impact is close to zero.
• Medicaid – 4% decrease
• Commercial – nominal increases based on contracts that are currently in place
• Unknown payment level for the healthcare exchanges commencing January 1, 2014
NET REVENUE ASSUMPTIONS
14

Inflation factors for all expenses are below.
After inflation factors were applied, concentrated work on reducing costs was done. A number of areas came up with innovative ideas in cost reductions and improved efficiencies.
EXPENSE ASSUMPTIONS
15
Salary Increase %Budget
2014Classified Staff 3.0%Professional Staff 2.5%Management 2.0%Hourly Staff/Premium Pay 4.0%
Supply Expense Increase %Medical Supplies 2% - 4%Pharmaceuticals 5.0%Other Supplies 2.0%

LABOR EXPENSE TRENDING
16
• The FY14 budget assumes FTE reductions in ongoing hospital operational areas, while providing for FTE increases in radiology and cardiology expansion and increases due to new physician programs and growth in specialty care (physicians not previously employed by VMC).
• Average salary inflation of 3% was included beginning July 1, 2013

SUPPLY EXPENSE
17
• While inpatient hospital services are predicted to remain fairly flat, new outpatient hospital services, along with expansion in the clinic network dictate increased supply needs for FY 2014;
• Scheduled lease buyouts are necessary to retain existing equipment; and • With house-wide expense reduction initiatives in place over the last couple
of years, minor equipment replacements have been put on hold. FY 2014 departmental budgets reflect true replacement needs in order to maintain basic levels of operation.

ALLOCATIONS AND OTHER EXPENSES
18
There are a number of allocations and system related expenses that have been included in the budget. Total allocations total $2.2 million for FY14.
• UW Medicine Central Budgets
• Compliance, Advancement, Patients Are First, Financial Services, ICD-10, Risk Management, Administration, Contracting, Internal Audit, Select Dues
PERFORMANCE IMPROVEMENT INITIATIVES
19
Included in the FY14 Operating Budget are the following performance improvement initiatives:
• Net Revenue initiatives of $10.7 million for continued revenue enhancements due to improved charge capture, denials management, contract management and point of service cash collections.
• Other initiatives of $9.2 million focusing on supply chain, transformation of care, and modification of benefits.
• These initiatives will be tracked, measured and reported out on a monthly basis throughout FY14.
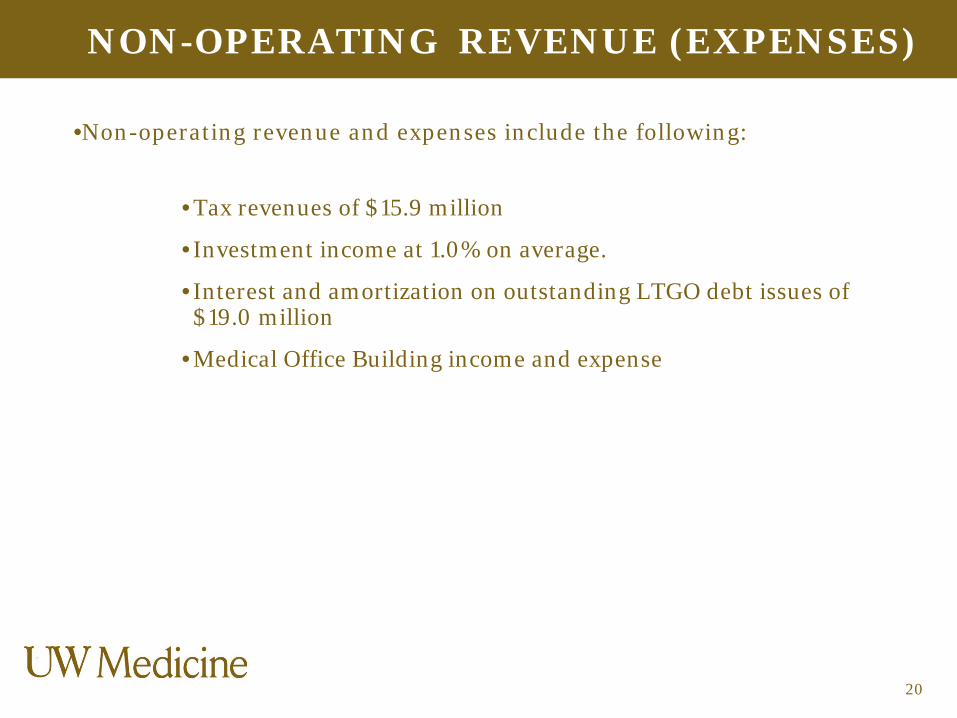
NON-OPERATING REVENUE (EXPENSES)
•Non-operating revenue and expenses include the following:
• Tax revenues of $15.9 million
• Investment income at 1.0% on average.
• Interest and amortization on outstanding LTGO debt issues of $19.0 million
• Medical Office Building income and expense
20

FY13 YTD MARCH VS. FY14 BUDGET
21
March 2013 Projected Operating Income (Dollars in 000s) (17,858)$
RevenueVolume Increases (Net Revenue Impact) 12,086 Commercial Contract Changes & Price Increases (Net Revenue Impact) 5,893 Net Revenue Performance Improvements 12,184 Other Revenue Changes (6,986) Payor Mix Degradation - Total Revenue 23,177
Salary & Benefits Benefit and Salary Inflation (8,028) Increase and/or Changes in FTEs 1,575 Performance Improvements 5,400 Total Salary & Benefits (6,453)
Non-Salary ExpenseMedical Supplies and Drug Expenses (1,579) Purchased Services and Other 1,357 Performance Improvements 2,298 Total Non-Salary Expense 2,076
Capital Expenses
Depreciation (933) Total Capital Expenses (933)
2014 Budgeted Operating Margin 9$
FY14 OPERATING BUDGET SUMMARY
22
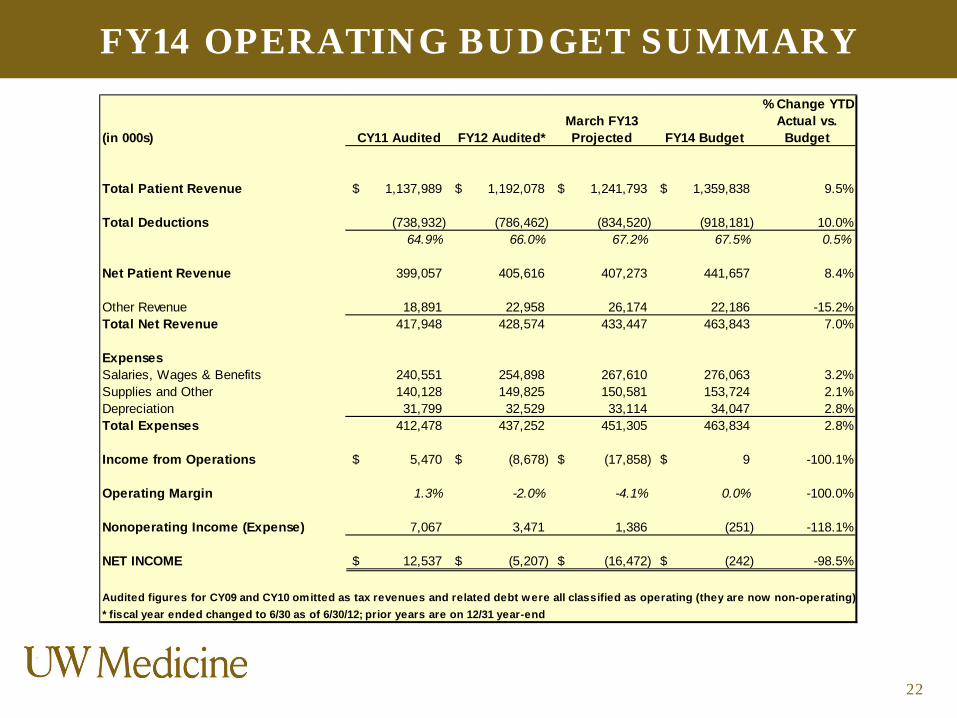
(in 000s) CY11 Audited FY12 Audited* March FY13 Projected FY14 Budget
% Change YTD Actual vs.
Budget
Total Patient Revenue 1,137,989$ 1,192,078$ 1,241,793$ 1,359,838$ 9.5%
Total Deductions (738,932) (786,462) (834,520) (918,181) 10.0%64.9% 66.0% 67.2% 67.5% 0.5%
Net Patient Revenue 399,057 405,616 407,273 441,657 8.4%
Other Revenue 18,891 22,958 26,174 22,186 -15.2%Total Net Revenue 417,948 428,574 433,447 463,843 7.0%
ExpensesSalaries, Wages & Benefits 240,551 254,898 267,610 276,063 3.2%Supplies and Other 140,128 149,825 150,581 153,724 2.1%Depreciation 31,799 32,529 33,114 34,047 2.8%Total Expenses 412,478 437,252 451,305 463,834 2.8%
Income from Operations 5,470$ (8,678)$ (17,858)$ 9$ -100.1%
Operating Margin 1.3% -2.0% -4.1% 0.0% -100.0%
Nonoperating Income (Expense) 7,067 3,471 1,386 (251) -118.1%
NET INCOME 12,537$ (5,207)$ (16,472)$ (242)$ -98.5%
Audited figures for CY09 and CY10 omitted as tax revenues and related debt were all classified as operating (they are now non-operating)* fiscal year ended changed to 6/30 as of 6/30/12; prior years are on 12/31 year-end
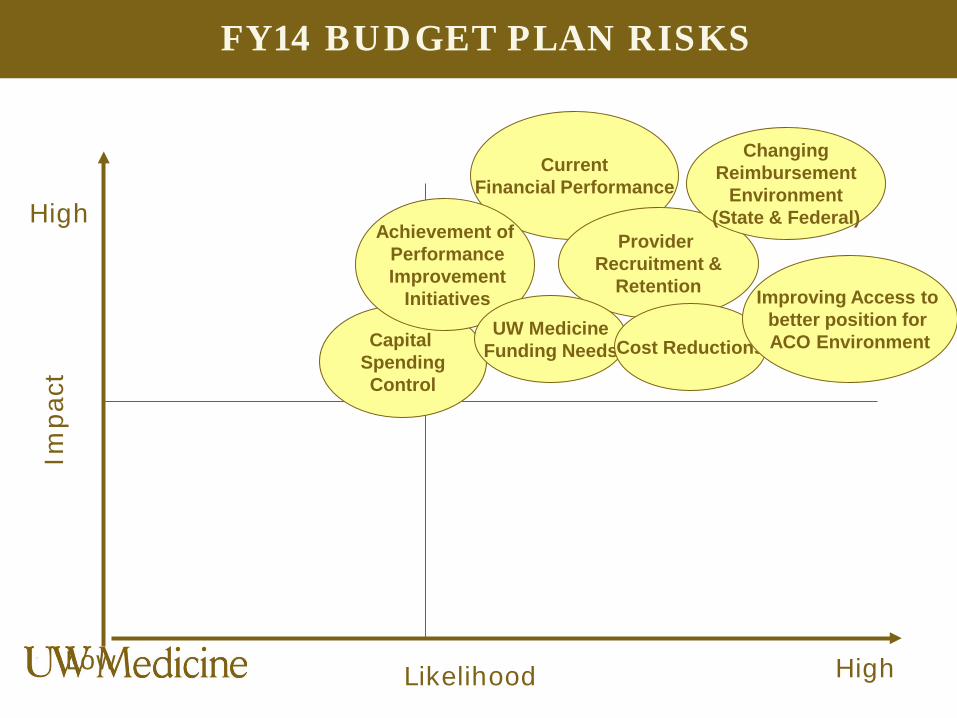
FY14 BUDGET PLAN RISKS
Low High
High
Impac
t
Likelihood
Capital Spending Control
Current Financial Performance
Provider Recruitment &
Retention
Achievement of Performance Improvement
Initiatives UW Medicine
Funding Needs
Changing Reimbursement
Environment (State & Federal)
Cost Reductions
Improving Access to better position for ACO Environment

FY14 CAPITAL BUDGET
24

• Capital investment levels are evaluated based on comparison to key industry ratios and benchmarks, as well as margin targets
• Historical values for key ratios and benchmarks are as shown:
KEY CAPITAL RATIOS
25
Ratio of Capital Expenditures to Depreciation Expense Days Cash = Cash / (Operating Expense – Depreciation) / 365
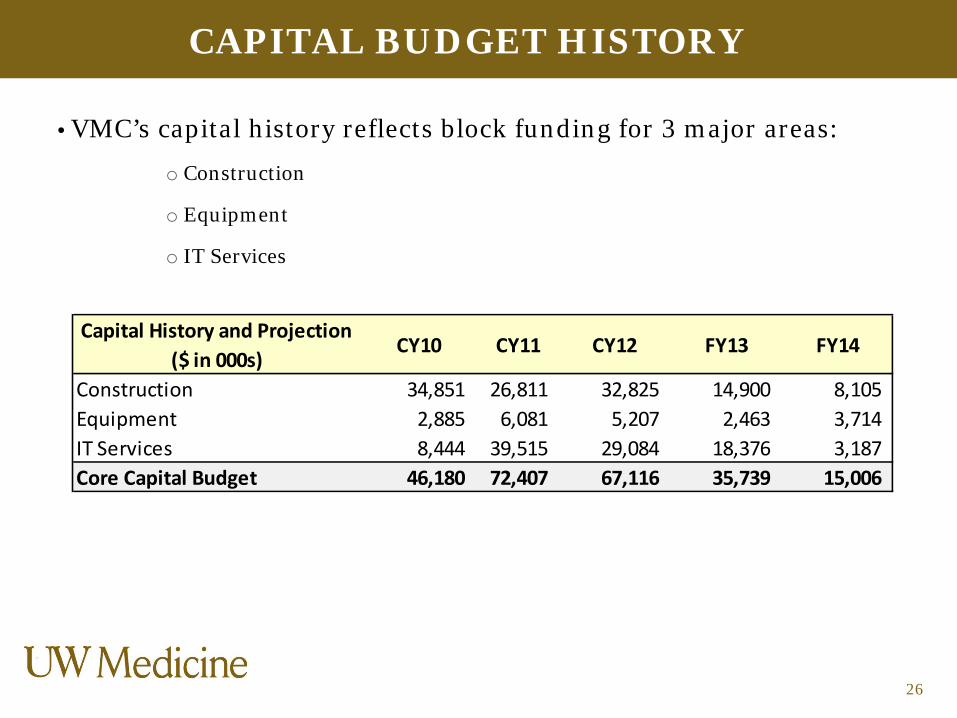
CAPITAL BUDGET HISTORY
• VMC’s capital history reflects block funding for 3 major areas:
o Construction
o Equipment
o IT Services
26
Capital History and Projection($ in 000s)
CY10 CY11 CY12 FY13 FY14
Construction 34,851 26,811 32,825 14,900 8,105 Equipment 2,885 6,081 5,207 2,463 3,714 IT Services 8,444 39,515 29,084 18,376 3,187 Core Capital Budget 46,180 72,407 67,116 35,739 15,006

FY2014 CAPITAL BUDGET OVERVIEW
27
• VMC proposes a $14.0 million core capital budget for FY14 with $1.0 million carryover for Covington South (total $15.0 million).
• Significant projects include o Maple Valley clinic o Infrastructure upgrades o IT ICD-10 initiatives and upgrades to ancillary systems o Equipment for new programs/growth oEquipment purchases on expiring leases
FY14 VMC CAPITAL BUDGET DETAIL
28
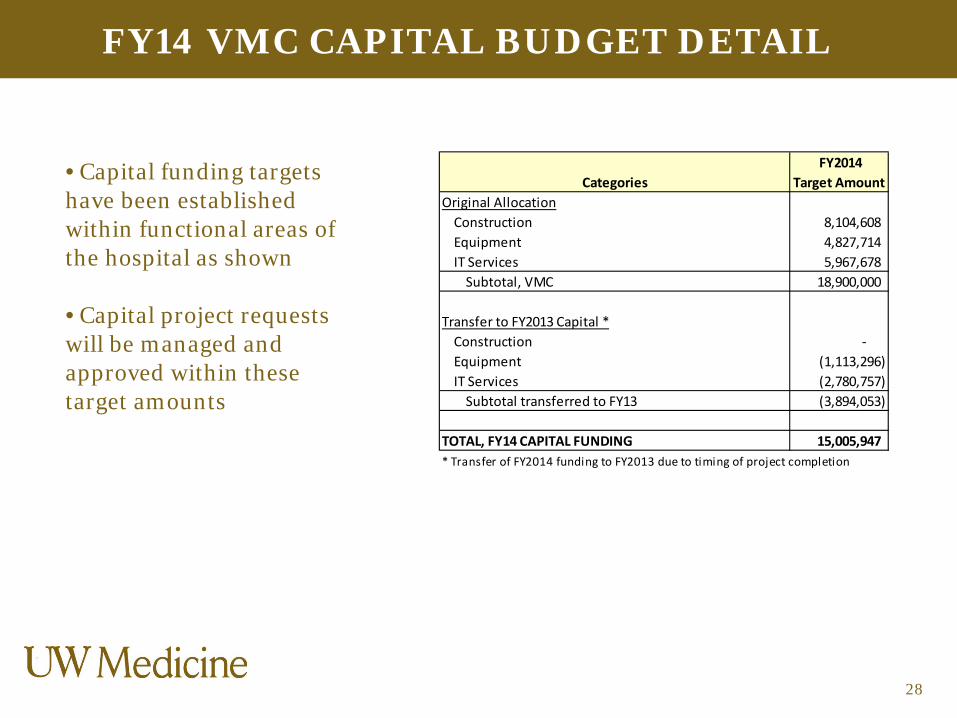
• Capital funding targets have been established within functional areas of the hospital as shown
• Capital project requests will be managed and approved within these target amounts
Categories FY2014
Target Amount Original Allocation
Construction 8,104,608 Equipment 4,827,714 IT Services 5,967,678
Subtotal, VMC 18,900,000
Transfer to FY2013 Capital *Construction - Equipment (1,113,296) IT Services (2,780,757)
Subtotal transferred to FY13 (3,894,053)
TOTAL, FY14 CAPITAL FUNDING 15,005,947 * Transfer of FY2014 funding to FY2013 due to timing of project completion
REQUEST FOR APPROVALS
29
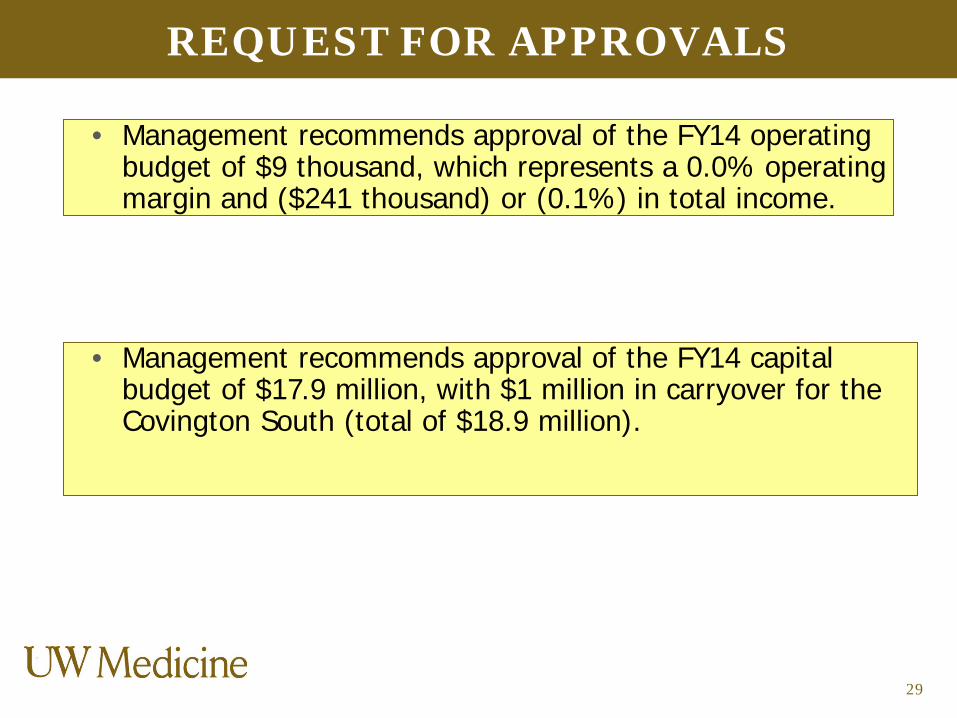
• Management recommends approval of the FY14 operating budget of $9 thousand, which represents a 0.0% operating margin and ($241 thousand) or (0.1%) in total income.
• Management recommends approval of the FY14 capital budget of $17.9 million, with $1 million in carryover for the Covington South (total of $18.9 million).
Related Documents