Revised FY 2007 & Proposed FY 2008 Operating & Capital Budgets Retail Rates Committee January 4, 2007

Revised FY 2007 & Proposed FY 2008 Operating & Capital Budgets Retail Rates Committee January 4, 2007.
Dec 15, 2015
Welcome message from author
This document is posted to help you gain knowledge. Please leave a comment to let me know what you think about it! Share it to your friends and learn new things together.
Transcript
Revised FY 2007 & Proposed FY 2008 Operating & Capital
Budgets
Retail Rates Committee
January 4, 2007

2
Budget Calendar
(Revised)Month Event
May 2May 31June
Distribute budget preparation materials FY 2007 – FY 2015 Final Capital Budget Submission due to Budget Office Update on capital
program from DETSRevised FY 2007 & Proposed FY 2008 Operating Budget Submission due to Budget OfficeDepartmental meetings with Budget & Finance Staff
June – AugustAugust 28 – August 31
Business Planning 10-year plan update based on new capital numbersGeneral Manager’s Budget Reviews• Departmental and CIP meetings with General Manager• Final meetings and General Manager’s budget decisions
October 19 FY 2008 Budget Decision Process Completed
Week of October 26 Budget due to printer
October 26 Submit & Review Revised FY 2007 & Proposed FY 2008 Budgets with• Finance and Budget Committee
October 30 Meet with Wholesale Customers
November 16 (Review Session I)Review Revised FY 2007 & Proposed FY 2008 Budgets with:• Finance and Budget Committee• Environmental Quality and Operations Committee
December 7 (Review Session II)Follow up Budget Review Session• Finance and Budget Committee
December 21 (Review Session II) Environmental Quality & Operations Committees - Capital Budget Review Session
January 4 Retail Rates Committee Meeting
January 18 Environmental Quality & Operations Committees - Budget Review Session / Action
January 25Budget & Finance Committee - Review / ActionRetail Rates Committee - Review / Action
February Board Adoption
February Submission to District
June District Submission to Congress
3
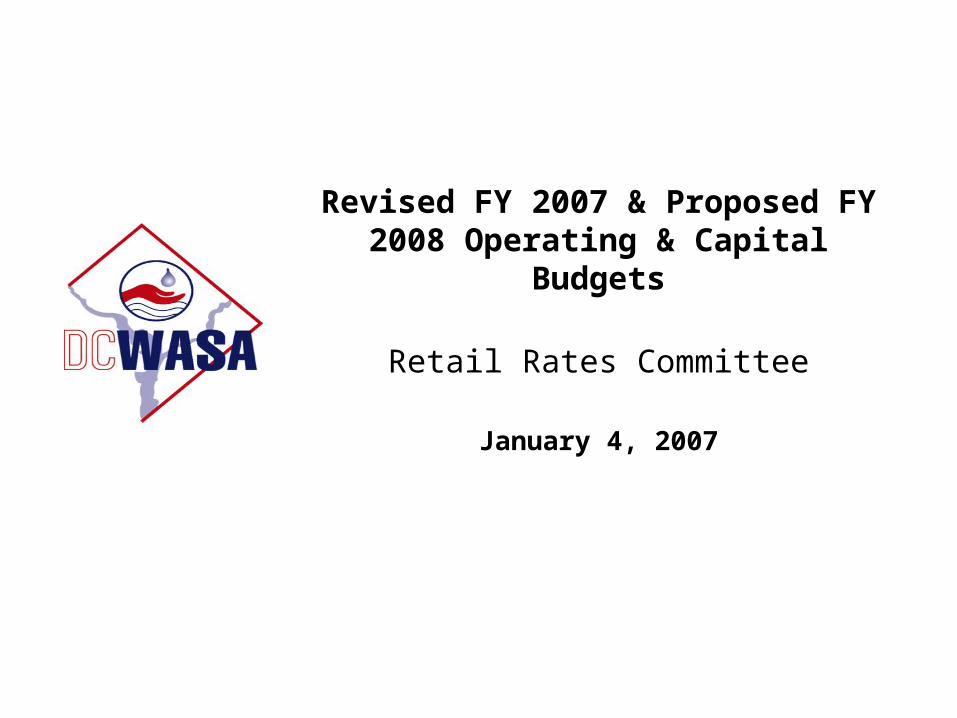
Budget Request Summary • Revised FY 2007 operating budget totals $311.2 million
• Proposed FY 2008 operating budget totals $341.2 million
• Proposed FY 2008 water and sewer rate increase of 7.5 percent
• Proposed 2008 PILOT/ROW fee increase of approximately 6.8 percent, or $0.03 per Ccf
• Capital Budget– Lifetime Budget totals $5.1 billion1
– Disbursements Budget totals $2.2 billion (FY 2006 – 2015)2
– Authority Request totals $446.6 million3
1Lifetime budget includes total budgeted costs for all activities planned from the inception of the project until its completion; this includes all activities whether they pre-date, or extend beyond the current 10-year CIP.
2Capital Improvement Program (CIP) Disbursements Budget projects disbursements for various projects by fiscal year. Contingencies are not included when calculating disbursement budgets
3Appropriations Authority – As part of WASA’s enabling legislation, Congressional appropriations authority is required before any capital design or construction contract can be entered into.

4
FY 2007 & FY 2008 Operating Budget Request
($000’s)
FY 2007 FY 2007 Increase / Percentage FY 2008 Increase / PercentageApproved Revised (Decrease) Change Proposed (Decrease) Change
Operations & Maintenance Expenditures 220,801$ 232,433$ 11,632$ 5.3% 240,679$ 8,246$ 3.5%Payment in Lieu of Taxes / Right of Way Fee 17,751 17,514 (237) -1.3% 18,569 1,055 6.0%Debt Service 73,090 61,203 (11,887) -16.3% 81,938 20,735 33.9%Total Operating Budget 311,642$ 311,150$ (492)$ -0.2% 341,186$ 30,036$ 9.7%
Personnel Services 85,233 83,516 (1,717) -2.0% 88,304 4,788 5.7% Authorized Positions 1,114 1,128 14 1.3% 1,124 (4) -0.4%

5
Operations & Maintenance by Category($000’s)
FY 2007 Revised$232,433
Lead Abatement
$1,7000.7%
SmallEquipment
$9810.4%
Water Purchases
$23,60110.2%
Bio-Solids$17,136
7.4%
Personnel Services$83,51635.9%
Supplies$4,5412.0%
Chemicals$18,774
8.1%
Utilities $34,98815.1%
Contractual Services$47,19520.3%
Personnel Services Supplies Chemicals
Utilities Contractual Services Bio-Solids
Water Purchases Small Equipment Lead Abatement
FY 2008 Proposed$240,679
Water Purchases$23,601
9.8%
Small Equipment$1,1570.5%
Personnel Services$88,30436.7%
Chemicals$19,709
8.2%
Supplies$4,7892.0%Utilities
$36,32215.1%
Contractual Services$48,64120.2%
Bio-Solids$17,155
7.1%
Lead Abatement$1,0000.4%
Personnel Services Supplies Chemicals
Utilities Contractual Services Bio-Solids
Water Purchases Small Equipment Lead Abatement

6
Operating Budget Comparisons ($000’s)
FY 2007 FY 2007 PERCENT FY 2008 PERCENTAPPROVED REVISED CHANGE PROPOSED CHANGE
Personnel Services 85,233 83,516 -2.0% 88,304 5.7%
Contractual Services 63,400 64,330 1.5% 65,796 2.3%
Water Purchases 19,995 23,601 18.0% 23,601 0.0%
Chemicals and Supplies 20,688 23,316 12.7% 24,499 5.1%
Utilities 30,383 34,988 15.2% 36,322 3.8%
Small Equipment 1,102 981 -10.9% 1,157 17.8%
Lead Abatement - 1,700 100.0% 1,000 -41.2%
Subtotal Operations & Maintenance 220,802 232,433 5.3% 240,679 3.5%
Debt Service 73,090 61,203 -16.3% 81,938 33.9%
PILOT / ROW 17,751 17,514 -1.3% 18,569 6.0%
Subtotal Debt Service & PILOT / ROW 311,643 311,150 -13.3% 341,186 27.7%
TOTAL OPERATING 311,642 311,150 -0.2% 341,186 9.7%
Less Personnel Service Charged to Capital Projects (9,816) (8,000) 18.5% (8,400) 5.0%
TOTAL NET OPERATING 301,826 303,150 0.4% 332,786 9.8%
7
FY 2006 – 2015 Capital DisbursementsFY 2006Actuals
FY 2007 Revised
FY 2008Proposed FY 2009 FY 2010 FY 2011 FY 2012 FY 2013 FY 2014 FY 2015
Total FY '06 -'15
Wastewater Treatment
Liquid Processing Projects 41,254 28,028 39,221 41,981 26,318 10,748 1,579 1,860 2,816 5,686 199,491
Plantwide Projects 12,440 13,189 17,949 11,585 16,567 6,442 1,095 681 1,801 1,878 83,627
Solids Processing Projects 11,083 9,761 6,702 13,748 17,508 35,352 61,426 69,631 45,869 31,326 302,406 Sub-total 64,777 50,978 63,872 67,314 60,393 52,542 64,100 72,172 50,486 38,890 585,524
Sanitary Sewer
Sanitary Collection Sewers 391 561 629 - - - - - - - 1,581
Sanitary On-Going Projects 3,123 4,073 3,527 3,155 3,155 3,896 3,500 3,796 4,059 4,193 36,477
Sanitary Pumping Facilities 1,436 1,081 3,948 2,099 - - - - - - 8,564
Sanitary Sewer Projects Program Management 2,607 2,142 2,668 3,078 3,427 3,050 2,668 1,458 1,454 1,449 24,001 Sanitary Interceptor/Trunk Force Sewers 2,703 3,180 11,163 18,286 7,215 2,588 1,623 1,612 1,608 1,194 51,172
Sub-total 10,260 11,037 21,935 26,618 13,797 9,534 7,791 6,866 7,121 6,836 121,795
Combined Sewer Overflow / Long Term Control Plan
CSO Program Management 1,257 779 113 139 93 89 - - - - 2,470
Combined Sewer Projects 29,808 22,524 28,458 34,414 6,467 27 - - - - 121,698
Long-Term Control Plan-
Blue Plains 316 324 414 570 982 1,021 2,080 6,894 12,192 7,098 31,891 Anacostia Tunnel 2,864 16,611 16,147 12,733 20,705 21,125 39,099 54,577 89,566 126,396 399,823 Potomac Tunnel - - - - - - - - - 2,064 2,064 Rock Creek Tunnel - - - - - - - - - - -
34,245 40,238 45,132 47,856 28,247 22,262 41,179 61,471 101,758 135,558 557,946
Stormwater
Stormwater Extensions/Local Drainage 532 80 172 - - - - - - - 784
Stormwater On-Going Program 606 286 311 224 248 281 287 291 302 312 3,148
Stormwater Pumping Facilities 52 5 - - - - - - - 57
DDOT Stormwater Program 17 23 11 83 87 90 92 94 96 99 692
Stormwater Projects Program Management 499 548 713 729 808 653 455 113 - - 4,518
Stormwater Trunk/Force Sewers 281 2,335 3,333 17 - - 1,082 908 880 5 8,841
Sub-total 1,987 3,277 4,540 1,053 1,143 1,024 1,916 1,406 1,278 416 18,040
Water
Water Distribution Systems 12,152 15,508 25,339 23,728 10,983 13,334 17,737 11,361 11,632 10,316 152,090
Water On-Going Projects 4,431 6,364 6,218 3,661 3,375 3,268 3,336 3,555 3,606 3,719 41,533
Water Pumping Facilities 7,219 13,440 16,499 4,696 - - - - - - 41,854
DDOT Water Projects 698 1,571 1,772 1,041 1,012 1,208 1,228 1,220 1,267 1,308 12,325
Water Storage Facilities 11 45 155 272 2,810 1,778 939 6,563 2,519 675 15,767
Water Projects Program Management 2,325 2,343 2,322 2,320 2,349 2,423 2,522 2,499 2,493 2,499 24,095
Water Lead Program 28,378 32,537 37,619 34,571 39,775 42,604 44,132 45,454 42,908 12,371 360,349
Meter Replacement /AMR Installation 2,666 3,423 3,223 1,914 423 573 423 423 1,007 957 15,032
Sub-total 57,880 75,231 93,147 72,203 60,727 65,188 70,317 71,075 65,432 31,845 663,045
Washington Aqueduct 11,096 24,509 76,762 6,557 5,265 6,953 7,635 7,020 6,683 6,548 159,027
Capital Equipment 11,038 18,659 14,163 10,751 7,913 6,348 6,378 6,240 8,168 6,188 95,846
Total FY 2008 WASA Capital Improvement Program 191,283 223,929 319,551 232,352 177,485 163,851 199,316 226,250 240,926 226,281 2,201,222
($000’)

8
FY 2006 – 2015 CIP by Project Service Area (Cash Disbursements)
Capital Equipment$95,846
4.4%
Washington Aqueduct$159,027
7.2%
Water $663,045
30.1%
Stormwater $18,040
0.8%
Combined Sewer Overflow / Long Term Control Plan
$557,94625.4%
Sanitary Sewer $121,795
5.5%
Blue Plains Wastewater Treatment$585,524
26.6%
Total $2.2 billion (Cash Disbursements)

9
FY 2007 & FY 2008 Financial Highlights
Historical and Projected Capital Spending FY 2001 - FY 2015
($ in 000's)
163,851
199,316
226,250240,926
226,281
140,023
204,421
103,094
238,268
202,719191,283
223,929
319,551
177,485
232,352
0
50,000
100,000
150,000
200,000
250,000
300,000
350,000

10
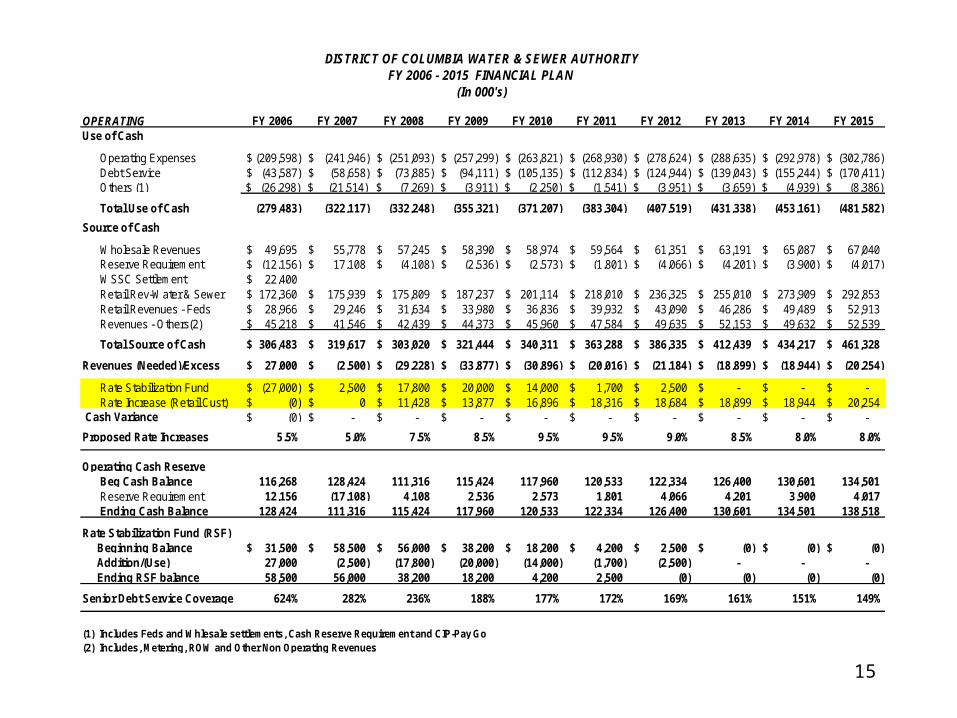
FY 2006 – FY 2015 Financial Plan

11
Major Assumptions (Reference Section III, Operating Budget Book, for comprehensive
discussion of budget assumptions)
Board Financial Policies ̶BRate setting ̶BDebt coverage̶BReserves
Revenue Increases– 5 percent increase in retail revenues for remaining large
commercial & federal meter installations– 1 to 3 percent increase in wholesale customers revenues from FY
2008 – 2015 in line with increasing cost of operations
Reduced consumption due to conservation of 1 percent annually in all classes
12
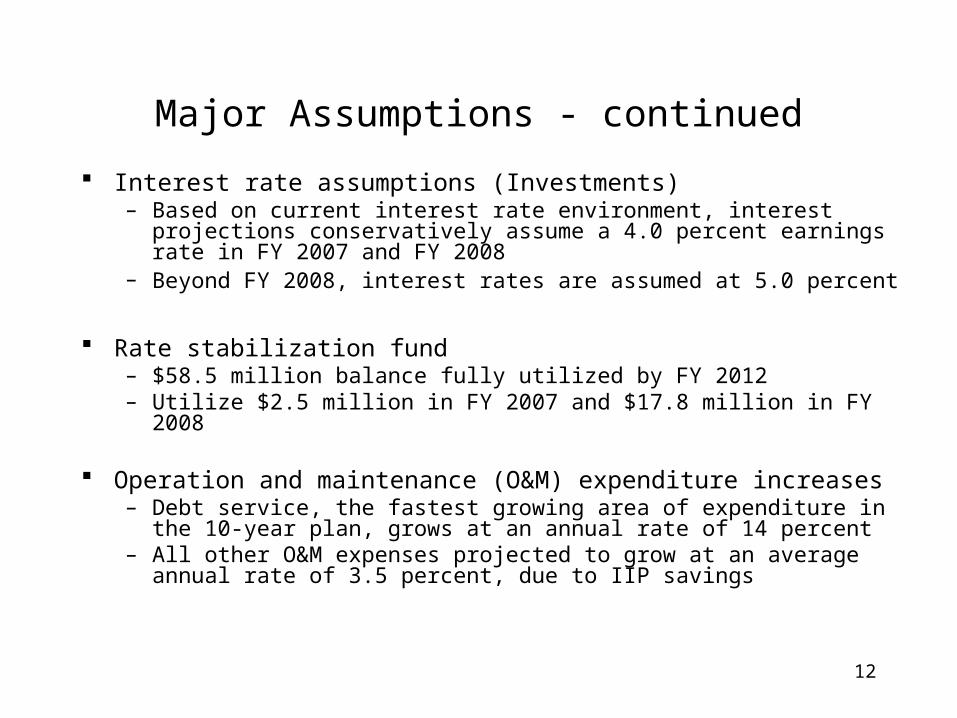
Major Assumptions - continued
Interest rate assumptions (Investments)– Based on current interest rate environment, interest
projections conservatively assume a 4.0 percent earnings rate in FY 2007 and FY 2008
– Beyond FY 2008, interest rates are assumed at 5.0 percent
Rate stabilization fund – $58.5 million balance fully utilized by FY 2012– Utilize $2.5 million in FY 2007 and $17.8 million in FY 2008
Operation and maintenance (O&M) expenditure increases– Debt service, the fastest growing area of expenditure in the
10-year plan, grows at an annual rate of 14 percent– All other O&M expenses projected to grow at an average
annual rate of 3.5 percent, due to IIP savings
13
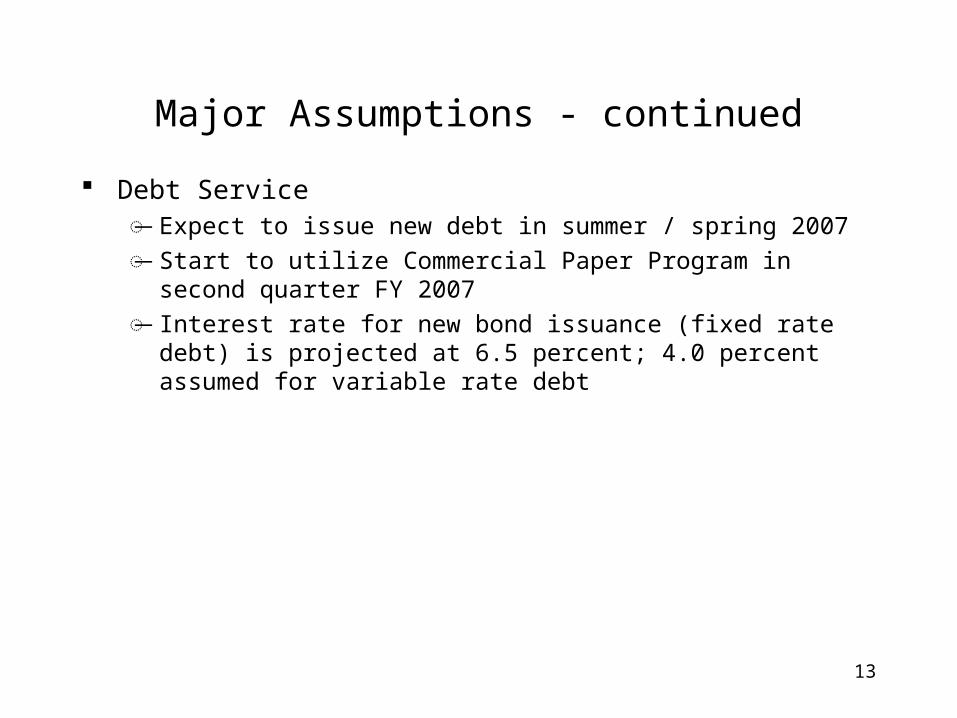
Major Assumptions - continued
Debt Service̶B Expect to issue new debt in summer / spring 2007̶B Start to utilize Commercial Paper Program in second quarter FY
2007̶B Interest rate for new bond issuance (fixed rate debt) is projected at
6.5 percent; 4.0 percent assumed for variable rate debt
14
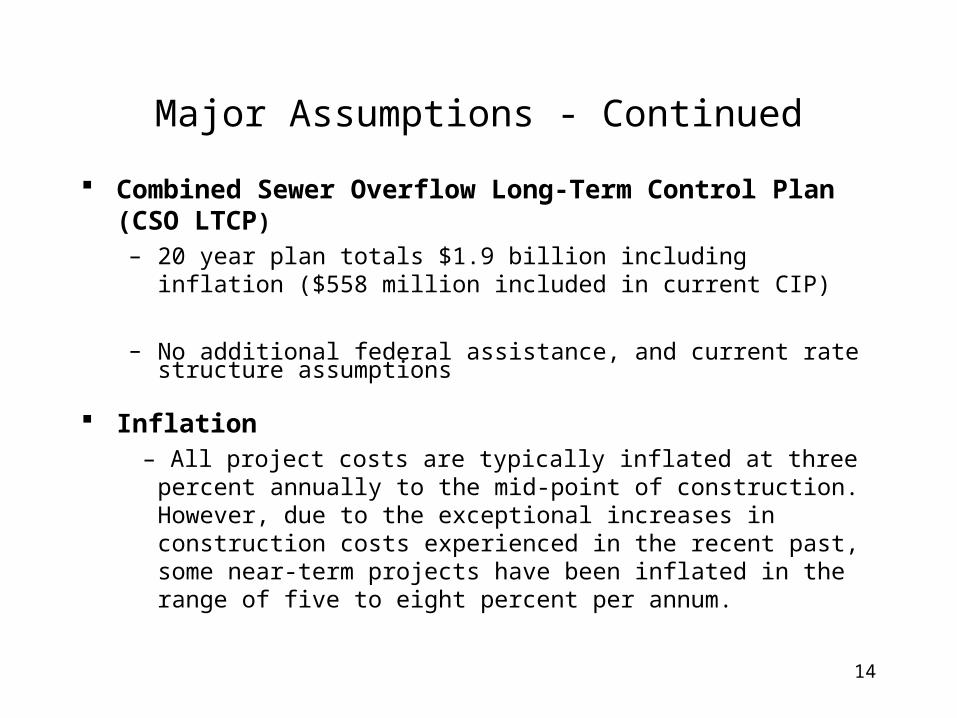
Major Assumptions - Continued
Combined Sewer Overflow Long-Term Control Plan (CSO LTCP)
– 20 year plan totals $1.9 billion including inflation ($558 million included in current CIP)
– No additional federal assistance, and current rate structure assumptions
Inflation – All project costs are typically inflated at three percent annually to the
mid-point of construction. However, due to the exceptional increases in construction costs experienced in the recent past, some near-term projects have been inflated in the range of five to eight percent per annum.
15
OPERATING FY 2006 FY 2007 FY 2008 FY 2009 FY 2010 FY 2011 FY 2012 FY 2013 FY 2014 FY 2015Use of Cash
Operating Expenses (209,598)$ (241,946)$ (251,093)$ (257,299)$ (263,821)$ (268,930)$ (278,624)$ (288,635)$ (292,978)$ (302,786)$ Debt Service (43,587)$ (58,658)$ (73,885)$ (94,111)$ (105,135)$ (112,834)$ (124,944)$ (139,043)$ (155,244)$ (170,411)$ Others (1) $ (26,298) $ (21,514) $ (7,269) $ (3,911) $ (2,250) $ (1,541) $ (3,951) $ (3,659) $ (4,939) $ (8,386)
Total Use of Cash (279,483) (322,117) (332,248) (355,321) (371,207) (383,304) (407,519) (431,338) (453,161) (481,582)
Source of Cash
Wholesale Revenues 49,695$ 55,778$ 57,245$ 58,390$ 58,974$ 59,564$ 61,351$ 63,191$ 65,087$ 67,040$ Reserve Requirement (12,156)$ 17,108$ (4,108)$ (2,536)$ (2,573)$ (1,801)$ (4,066)$ (4,201)$ (3,900)$ (4,017)$ WSSC Settlement 22,400$ Retail Rev-Water & Sewer 172,360$ 175,939$ 175,809$ 187,237$ 201,114$ 218,010$ 236,325$ 255,010$ 273,909$ 292,853$ Retail Revenues - Feds 28,966$ 29,246$ 31,634$ 33,980$ 36,836$ 39,932$ 43,090$ 46,286$ 49,489$ 52,913$ Revenues - Others(2) 45,218$ 41,546$ 42,439$ 44,373$ 45,960$ 47,584$ 49,635$ 52,153$ 49,632$ 52,539$
Total Source of Cash 306,483$ 319,617$ 303,020$ 321,444$ 340,311$ 363,288$ 386,335$ 412,439$ 434,217$ 461,328$
Revenues (Needed)/Excess 27,000$ (2,500)$ (29,228)$ (33,877)$ (30,896)$ (20,016)$ (21,184)$ (18,899)$ (18,944)$ (20,254)$
Rate Stabilization Fund (27,000)$ 2,500$ 17,800$ 20,000$ 14,000$ 1,700$ 2,500$ -$ -$ -$ Rate Increase (Retail Cust) (0)$ 0$ 11,428$ 13,877$ 16,896$ 18,316$ 18,684$ 18,899$ 18,944$ 20,254$ Cash Variance (0)$ -$ -$ -$ -$ -$ -$ -$ -$ -$
Proposed Rate Increases 5.5% 5.0% 7.5% 8.5% 9.5% 9.5% 9.0% 8.5% 8.0% 8.0%
Operating Cash Reserve Beg Cash Balance 116,268 128,424 111,316 115,424 117,960 120,533 122,334 126,400 130,601 134,501 Reserve Requirement 12,156 (17,108) 4,108 2,536 2,573 1,801 4,066 4,201 3,900 4,017 Ending Cash Balance 128,424 111,316 115,424 117,960 120,533 122,334 126,400 130,601 134,501 138,518
Rate Stabilization Fund (RSF) Beginning Balance 31,500$ 58,500$ 56,000$ 38,200$ 18,200$ 4,200$ 2,500$ (0)$ (0)$ (0)$ Addition/(Use) 27,000 (2,500) (17,800) (20,000) (14,000) (1,700) (2,500) - - - Ending RSF balance 58,500 56,000 38,200 18,200 4,200 2,500 (0) (0) (0) (0)
Senior Debt Service Coverage 624% 282% 236% 188% 177% 172% 169% 161% 151% 149%
(1) Includes Feds and Whlesale settlements, Cash Reserve Requirement and CIP-Pay Go(2) Includes, Metering, ROW and Other Non Operating Revenues
DISTRICT OF COLUMBIA WATER & SEWER AUTHORITY
(In 000's)FY 2006 - 2015 FINANCIAL PLAN

16
Revenues, Retail Rates & Fees
5.5%
8.0% 8.0%
5.5%
5.0%
7.5%
8.0% 8.0%
7.0%
8.0%
8.0%
8.5%8.0%8.0%
7.5%
8.5%
9.5% 9.5%
9.0%8.5%
0.0%
1.0%
2.0%
3.0%
4.0%
5.0%
6.0%
7.0%
8.0%
9.0%
10.0%
FY 2006 FY 2007 FY 2008 FY 2009 FY 2010 FY 2011 FY 2012 FY 2013 FY 2014 FY 2015
Last Year's Board Adopted Plan Proposed Plan
Proposed Retail Rate & Fee Changes
• Rate increases are primarily required to fund increasing debt service costs• Proposed 7.5 percent rate increase in FY 2008, or a 0.5 decrease from last years’ plan
with rate increases ranging from 8.0 to 9.5 percent thereafter. • Proposed FY 2008 rate increase of approximately 6.8 percent, or $0.03 Ccfs in ROW /
PILOT fees to ensure the Authority fully recovers the costs of this District of Columbia fee

17
Why Rate Increases Are Needed
OPERATING & DEBT SERVICE EXPENDITURESFY 2006 – 2015
($000’s)
Over the ten-year period, total expenditures increase on average by 6.1 percent annually.
WASA’s proposed rate increases are primarily required to fund increasing debt service costs.
Operations and maintenance expenditures (excluding the payment in lieu of taxes and right of way fee) increase on average by only 3.5 percent annually
Debt service expenditures grow at an annual average rate of 14.3 percent.
$0
$100,000
$200,000
$300,000
$400,000
$500,000
$600,000
FY 2006 FY 2007 FY 2008 FY 2009 FY 2010 FY 2011 FY 2012 FY 2013 FY 2014 FY 2015
Operating Expenditures Debt Service

18
Rate Stabilization Fund Usage
$2,500
$17,800
$20,000
$14,000
$1,700$2,500
$- $- $-$-
$5,000
$10,000
$15,000
$20,000
$25,000
FY 2007 FY 2008 FY 2009 FY 2010 FY 2011 FY 2012 FY 2013 FY 2014 FY 2015
Current Rate Stabilization Fund Balance = $58,500,000
Fully Utilized by FY 2012

19
Retail Rate ProjectionsWith and Without Additional Federal Funding for the CSO
LTCP
5.0%
8.5%
9.5% 9.5%9.0%
8.5%8.0% 8.0%
5.5%
7.5%
8.5%
7.0%6.5%
8.0%
0.0%
1.0%
2.0%
3.0%
4.0%
5.0%
6.0%
7.0%
8.0%
9.0%
10.0%
FY 2006 FY 2007 FY 2008 FY 2009 FY 2010 FY 2011 FY 2012 FY 2013 FY 2014 FY 2015
No Additional Federal Funding for CSO LTCP With 50% Federal Funding for CSO LTCP
Cumulative Rate IncreasesNo Additional Federal Funding For CSO LTCP = 79.0%
50% Federal Funding For CSO LTCP = 75.0%
9.0%

20
Proposed FY 2008 Changes
Water and sewer rate increase of 7.5 percent
– Water ($0.15 per Ccf increase)• Current rate - $2.03 per
Ccf• Proposed rate - $2.18 per
Ccf
– Sewer ($0.23 per Ccf increase)• Current rate - $3.06 per
Ccf• Proposed rate - $3.29 per
Ccf
Right of way / PILOT fee – increase of 6.8 percent to recover full cost of District charge
$52.08 $48.66
$46.41 $43.83
-
10.00
20.00
30.00
40.00
50.00
60.00
FY 2005 FY 2006 FY 2007 FY 2008
WASA Retail Rates WASA Metering Fee District Right of Way / PILOT Fee District Stormwater Rate
AVERAGE RESIDENTIAL MONTHLY BILL
FY 2005 - 2008
FY 2005 FY 2006 FY 2007 FY 2008WASA Retail Rates (1) 38.23 40.32 42.40 45.57 WASA Metering Fee 2.01 2.01 2.01 2.01 Subtotal WASA Rates & Charges 40.24$ 42.33$ 44.41$ 47.58$ Increase / Decrease 1.83$ 2.08$ 2.08$ 3.17$
District of Columbia Right of Way / PILOT Fee (1) 3.00$ 3.50$ 3.67$ 3.92$ District of Columbia Stormwater Fee 0.58 0.58 0.58 0.58 Subtotal District of Columbia Charges 3.58$ 4.08$ 4.25$ 4.50$
Total Amount Appearing on WASA Bill 43.83$ 46.41$ 48.66$ 52.08$ Increase / Decrease Over Prior Year 1.83$ 2.58$ 2.25$ 3.42$ Percent Increase in Total Bill 4.4% 5.9% 4.8% 7.0%
(1) Assumes average monthly consumption of 8.33 Ccf, or 6,231 gallons.

21
WASA’s Retail Rates Are Comparable to Other UtilitiesAverage Monthly Residential Bill Comparison
(Based on Fall 2006 Rates)
$0.00
$10.00
$20.00
$30.00
$40.00
$50.00
$60.00
$70.00
$80.00
Fairfa
x Cou
nty,
VA
New Y
ork C
ity, N
Y
Baltim
ore,
MD
Charlo
tte, N
C
Loud
oun
Count
y, V
A
Nashv
ille, T
N
Provid
ence
, RI
WSSC
WASA C
urre
nt
Detro
it, M
I
Henric
o Cou
nty,
VA
Arlingt
on C
ount
y, V
A
Pittsbu
rgh,
PA
WASA P
ropo
sed
Philad
elphia
, PA
Newpo
rt New
s, V
A
Falls C
hurc
h, V
A
Virgini
a Bea
ch, V
A
Alexan
dria,
VA
Bosto
n, M
A
Atlant
a, G
A (in
City)
Norfo
lk, V
A
Richm
ond,
VA
Portla
nd, M
E
Atlant
a, G
A (Out
side
City)
(1) Assumes average residential consumption of 8.33 Ccfs, or 6,231 gallons per month. Ccf= hundred cubic feet, or 748 gallons.(2) Reflects WASA’s proposed rate and fee changes in FY 2008 while other utilities’ rates are as of summer/fall 2006. However, during this
period, it is anticipated that many utilities will take rate actions. The green area indicates the pass-through of the District’s right-of-way/PILOT fee, totaling $3.92 per month (projected FY 2008) and the residential stormwater rate of $0.58 per month.

22
Emerging Issues – Potential Rate Impact
• Ongoing CIP Implementation• CSO Long-Term Control Plan• Blue Plains Internal Improvement Program Review• Governance Study - Implementation• Blue Plains Issues
₋ Chesapeake Bay Agreement changes (TN)₋ Biosolids hauling and disposal issues₋ Digesters construction
• Sewer System Assessment₋ Maintenance Requirements (CMOM)₋ Inclusion of Study Finding in Capital Program
• Water Quality • Security and Emergency Preparedness• New baseball stadium• Main and O Site relocation• M Street corridor improvements• New WASA headquarters building
Related Documents