Moho, crustal architecture and deep deformation under the North Marmara Trough, from the SEISMARMARA Leg 1 offshore–onshore reflection–refraction survey Anne Bécel a, ⁎ , 1 , Mireille Laigle a , Béatrice de Voogd b , Alfred Hirn a , Tuncay Taymaz c , Audrey Galvé a,2 , Hideki Shimamura d , Yoshio Murai d , Jean-Claude Lépine a , Martine Sapin a , Serdar Özalaybey e a Departement of Seismology, UMR 7154, Institut de Physique du Globe de Paris, Case 89, Tour 24-14, 4ème étage, 4, Place Jussieu, 75252 Paris cedex 05-France b Imagerie Géophysique, Université de Pau, France c Seismological Laboratory ITU, Istanbul, Turkey d Institute of Seismology and Volcanology, Sapporo, Hokkaïdo, Japan e TUBITAK-MAM, Marmara Research Center, Gebze, Turkey abstract article info Article history: Received 29 November 2007 Received in revised form 25 September 2008 Accepted 16 October 2008 Available online 29 October 2008 Keywords: Seismic refraction Seismic reflection North Anatolian Fault Sea of Marmara Deep deformation Crustal thinning Understanding further the nature and evolution at lithospheric scale of the Sea of Marmara on the North Anatolian Fault needs constraints on the deep crustal and Moho spatial variation. This has been probed here with offshore–onshore and OBS, Ocean Bottom Seismometer refraction seismics, in addition to coincident MCS, marine multichannel reflection seismic profiles over the whole North Marmara Trough. The diverse strikes of MCS profiles in a dense grid allow to avoid misinterpretation of late echoes in the deep basin as Moho reflections and attribute them to sidesweeps. Moho is instead positively identified from reversed observations of first-arrival head and refracted waves at the top of the mantle obtained at large offset by land stations. A significant and sharp reduction in its depth, on the order of 5 km occurs beneath both the eastern and western rims of the North Marmara Trough, with a more progressive crustal thinning from the south. The wide-angle reflections on OBS and land stations document in addition to Moho the top of a lower crustal reflective layer, which is also sampled by MCS profiles, and appears to follow Moho topography. The dense grid of MCS profiles along the southwestern margin of the North Marmara Trough reveals a dipping reflector through the upper crust with tilted basement blocks on top. This low-angle fault is suggested as a normal sense detachment extending in depth towards the reflective lower crust. The upwarp of the Moho and lower crustal layer towards the North Marmara Trough suggests that crustal thinning occurs mostly in the upper crustal part, with lateral transport of the material towards WSW in the footwall of the detachment, and possibly other features to the south, in the motion of Anatolia with respect to stable Eurasia oblique to the North Marmara Trough. Thinning can be accommodated in an asymmetric partitioning of the displacement on several branching faults at lithospheric scale. © 2008 Elsevier B.V. All rights reserved. 1. Introduction 1.1. Study area and methods The North Anatolian Fault (NAF) is a continental transform boundary, which cuts across Turkey over more than 1500 km. It is accommodating about 25 mm/yr (McClusky et al., 2000) of right-lateral motion between the Anatolian and the Eurasian Plates (Fig. 1a inset). The surface ex- pression of the North Anatolian Fault is a relatively narrow and simple fault zone over its entire morphological trace except in its western part as it becomes more complex before entering the Marmara Sea, where it is partitioned into several branches. The Sea of Marmara has been interpreted as a large-scale transtensive region above an extensional jog on a right-lateral step-over (Armijo et al., 1999) or a releasing bend (Flerit et al., 2006) between the two North Anatolian strike-slip fault segments marked by recent large strike-slip earthquakes, the Izmit segment in the east and the Ganos one in the west. At a larger scale, it connects to the west with the Aegean region of extensional deformation. Offshore and onshore scientific investigations have been recently conducted in the Marmara Sea region, including geological and GPS studies (Reilinger et al., 1997; Straub et al., 1997; McClusky et al., 2000; Flerit et al., 2003), high-resolution bathymetry (Armijo et al., 2002, Tectonophysics 467 (2009) 1–21 ⁎ Corresponding author. Institut de Physique du Globe-UMR 7154, Sismologie 4, Place Jussieu, Case 89, 4ème étage, T24-14 75252 Paris cedex 05, France. Tel.: +33 1 44 2747 81, +33 1 44 27 39 14; fax: +33 1 44 27 38 94. E-mail addresses: [email protected], [email protected] (A. Bécel), [email protected] (M. Laigle), [email protected] (A. Hirn). 1 Now at CSIC-Instituto de Ciencias de la Tierra ‘Jaume Almera’, Dep. Estructura y Dinamica de la Tierra, Calle Lluis Sole i Sabaris s/n, 08028 Barcelona, Spain. 2 Now at Géosciences Azur, Nice, France. 0040-1951/$ – see front matter © 2008 Elsevier B.V. All rights reserved. doi:10.1016/j.tecto.2008.10.022 Contents lists available at ScienceDirect Tectonophysics journal homepage: www.elsevier.com/locate/tecto

Welcome message from author
This document is posted to help you gain knowledge. Please leave a comment to let me know what you think about it! Share it to your friends and learn new things together.
Transcript
Tectonophysics 467 (2009) 1–21
Contents lists available at ScienceDirect
Tectonophysics
j ourna l homepage: www.e lsev ie r.com/ locate / tecto
Moho, crustal architecture and deep deformation under the North Marmara Trough,from the SEISMARMARA Leg 1 offshore–onshore reflection–refraction survey
Anne Bécel a,⁎,1, Mireille Laigle a, Béatrice de Voogd b, Alfred Hirn a, Tuncay Taymaz c, Audrey Galvé a,2,Hideki Shimamura d, Yoshio Murai d, Jean-Claude Lépine a, Martine Sapin a, Serdar Özalaybey e
a Departement of Seismology, UMR 7154, Institut de Physique du Globe de Paris, Case 89, Tour 24-14, 4ème étage, 4, Place Jussieu, 75252 Paris cedex 05-Franceb Imagerie Géophysique, Université de Pau, Francec Seismological Laboratory ITU, Istanbul, Turkeyd Institute of Seismology and Volcanology, Sapporo, Hokkaïdo, Japane TUBITAK-MAM, Marmara Research Center, Gebze, Turkey
⁎ Corresponding author. Institut de Physique du GlobeJussieu, Case 89, 4ème étage, T24-14 75252 Paris cedex81, +33 1 44 27 39 14; fax: +33 1 44 27 38 94.
E-mail addresses: [email protected], [email protected]@ipgp.jussieu.fr (M. Laigle), [email protected] (A
1 Now at CSIC-Instituto de Ciencias de la Tierra ‘JauDinamica de la Tierra, Calle Lluis Sole i Sabaris s/n, 0802
2 Now at Géosciences Azur, Nice, France.
0040-1951/$ – see front matter © 2008 Elsevier B.V. Aldoi:10.1016/j.tecto.2008.10.022
a b s t r a c t
a r t i c l e i n f oArticle history:
Understanding further the Received 29 November 2007Received in revised form 25 September 2008Accepted 16 October 2008Available online 29 October 2008Keywords:Seismic refractionSeismic reflectionNorth Anatolian FaultSea of MarmaraDeep deformationCrustal thinning
nature and evolution at lithospheric scale of the Sea of Marmara on the NorthAnatolian Fault needs constraints on the deep crustal and Moho spatial variation. This has been probed herewith offshore–onshore and OBS, Ocean Bottom Seismometer refraction seismics, in addition to coincidentMCS, marine multichannel reflection seismic profiles over the whole North Marmara Trough.The diverse strikes of MCS profiles in a dense grid allow to avoid misinterpretation of late echoes in the deepbasin as Moho reflections and attribute them to sidesweeps. Moho is instead positively identified fromreversed observations of first-arrival head and refracted waves at the top of the mantle obtained at largeoffset by land stations. A significant and sharp reduction in its depth, on the order of 5 km occurs beneathboth the eastern and western rims of the North Marmara Trough, with a more progressive crustal thinningfrom the south.The wide-angle reflections on OBS and land stations document in addition to Moho the top of a lower crustalreflective layer, which is also sampled by MCS profiles, and appears to follow Moho topography. The densegrid of MCS profiles along the southwestern margin of the North Marmara Trough reveals a dipping reflectorthrough the upper crust with tilted basement blocks on top. This low-angle fault is suggested as a normalsense detachment extending in depth towards the reflective lower crust.The upwarp of the Moho and lower crustal layer towards the North Marmara Trough suggests that crustalthinning occurs mostly in the upper crustal part, with lateral transport of the material towards WSW in thefootwall of the detachment, and possibly other features to the south, in the motion of Anatolia with respect tostable Eurasia oblique to the North Marmara Trough. Thinning can be accommodated in an asymmetricpartitioning of the displacement on several branching faults at lithospheric scale.
© 2008 Elsevier B.V. All rights reserved.
1. Introduction
1.1. Study area and methods
TheNorthAnatolian Fault (NAF) is a continental transformboundary,which cuts across Turkey overmore than 1500 km. It is accommodatingabout 25mm/yr (McClusky et al., 2000) of right-lateralmotion between
-UMR 7154, Sismologie 4, Place05, France. Tel.: +33 1 44 27 47
sic.es (A. Bécel),. Hirn).me Almera’, Dep. Estructura y8 Barcelona, Spain.
l rights reserved.
the Anatolian and the Eurasian Plates (Fig. 1a inset). The surface ex-pression of the North Anatolian Fault is a relatively narrow and simplefault zone over its entire morphological trace except in its western partas it becomes more complex before entering the Marmara Sea, where itis partitioned into several branches.
The Sea ofMarmara hasbeen interpreted as a large-scale transtensiveregion above an extensional jog on a right-lateral step-over (Armijo et al.,1999) or a releasing bend (Flerit et al., 2006) between the two NorthAnatolian strike-slip fault segments marked by recent large strike-slipearthquakes, the Izmit segment in theeast and theGanos one in thewest.At a larger scale, it connects to the west with the Aegean region ofextensional deformation.
Offshore and onshore scientific investigations have been recentlyconducted in the Marmara Sea region, including geological and GPSstudies (Reilinger et al., 1997; Straub et al., 1997; McClusky et al., 2000;Flerit et al., 2003), high-resolution bathymetry (Armijo et al., 2002,
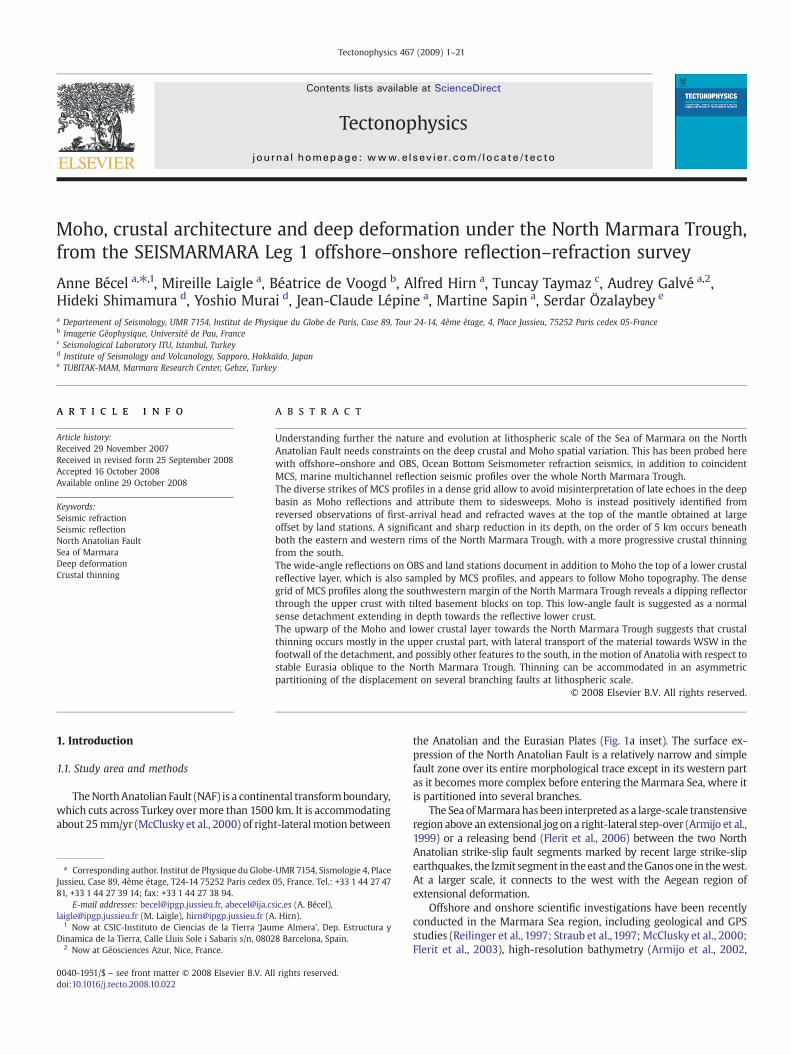
Fig. 1. a) The North Anatolian Fault (NAF) in the Marmara Sea region. Multi-beam bathymetric image of the northern Sea of Marmara collected in 2000 with R/V Le Suroît withobserved and interpreted faults superimposed fromArmijo et al. (2002). Elements of the SEISMARMARA-Leg1 survey: Black lines indicate theMCS profiles acquiredwith the 8100 cu.in. source, dashed black lines indicate the MCS profiles acquired with the 2900 cu. in source. Black circles show the land station locations and the black squares show those of theocean bottom seismometers (OBS). Dashed grey line indicates the Intra-Pontide suture zone and the part in light-grey the limits of the Thrace Basin (after Görur and Okay, 1996). Boxindicates area enlarged in b. Inset shows tectonic framework (faults from Armijo et al., 2002). b) Location map showing the interconnected profiles in the southwestern part of theNorth Marmara Trough with identification of profile discussed in black dash-lines.
2 A. Bécel et al. / Tectonophysics 467 (2009) 1–21
2003; Le Pichon et al., 2001), coring and high-resolution seismicprofiles (Ergun and Ozel, 1995; Smith et al., 1995; Wong et al., 1995;Aksu et al., 1999; Okay et al., 1999, 2000; Imren et al., 2001; Le Pichonet al., 2001; Parke et al., 2002; Demirbag et al., 2003).
The French–Turkish seismic survey, “SEISMARMARA-Leg1” wascarried out after the 1999 earthquakes of Izmit and Düzce from July toOctober 2001, as a multi-method approach to investigate the seismicstructure and activity of the northern Sea of Marmara, the NorthMarmara Trough, NMT (Hirn et al., 2002, 2003; Bécel et al., 2004)(Fig. 1). The aims of the programme were to shed light on the regionaltectonics and recent evolution at crustal scale. The crustal-scalearchitecture of the NMT is revealed by its dense grid of Multi-ChannelMarine Seismic (MCS) profiles that have an unprecedented depth of
penetration. Before this survey, MCS data had been collected but onlywith a short recording streamer and a modest strength of the source,limiting the penetration to the sea bottom multiple.
Selected MCS profiles outlining the general architecture andlateral heterogeneity in the North Marmara Trough have beenpresented in Laigle et al. (2008). They revealed the supra-crustalstructure of the deep Cinarcik and Central Basins as well as elementsof the intra-crustal and deep structure on the southern shelf of thetrough.
The present paper has a specific focus on the deep structure, withthe different and additional dataset of wide-angle reflection andrefraction (WARR) on both OBS and land stations. TheWARRmodelingreveals the deep structure under the North Marmara Trough itself,
3A. Bécel et al. / Tectonophysics 467 (2009) 1–21
which can not be approached by the MCS data. It thus allows us toextend the discussion on crustal thinning under the central NMT andquantify the crustal deformation in space. We illustrate on severalMCS profiles diverse aspects of the intra-crustal structure, alsodocumenting further those suggested in Laigle et al. (2008), whichgive us a clue to the mechanism of deformation. We also deal herewith the problem of reflection response of the Moho under thedeepest marine basins with an evaluation and interpretation of a tightgrid of MCS profiles.
1.2. Seismic data
1.2.1. Data acquisitionThe SEISMARMARA-Leg1 program consisted of marine multi-
channel reflection seismic (MCS), ocean bottom seismometers (OBS)and land stations recording of wide-angle reflection–refraction fromthe same source. It was the first time that marine wide angle-reflection refraction seismic data were recorded by OBS in the Sea ofMarmara, thus allowing coincident reflection and refraction recordingand joint modeling.
The French N/O Le Nadir acquired about 2000 km of MCS profiles(Fig. 1) in the northern Sea of Marmara during the first leg. The MCSprofiles have an unprecedented depth penetration due to the 4.5 kmlength of the 360 channel digital streamer and also to the strength ofthe sources of 8100 or 2900 cu. in. (Laigle et al., 2008) provided by a12-airgun array in single-bubble mode (Avedik et al., 1995, 1996).Navigation safety was provided by a vessel of the Turkish Coast Guards(Sahil Güvenlik).
At sea-bottom, 37 OBS with 3-component sensors and continuousrecording over 1 to 2-month, were deployed and collected by theTurkish ship MTA Sismik-1. On land, a similar number of temporarystations, with 3-component 2 Hz sensors were installed.
During this Leg 1, 4 E–W lines and 30 N–S lines crossing the wholeMarmara Trough have been acquired. The survey was designed to havecrossing profiles in diverse azimuths (Fig. 1) with OBS at nodes and landstations in the continuity of profiles. This geometry has been designed inorder to estimate the dip of reflectors. This proved essential to dis-criminate between primary reflections and signal-generated noise suchasmultiples and also point- or line-diffractions in the sectionplane frombeneath or broadside. This marine survey took place in a narrow, deepbathymetric trough, with complex shallow structures, a rather adverselocation for seismic data acquisition. A key point in this paper is to showhow a grid of coincident OBS and MCS data can be exploited to suc-cessfully resolve the main structures of the whole crust.
1.2.2. Data processingAll MCS reflection profiles have been processed up to the brute stack
time-sections with the following processing stream adapted to thediverse sources and shot intervals used: band-pass filter, velocityanalysis, normal move-out correction, external mute, stack, and watervelocitymigration.Most profiles have been reprocessed in diverseways,including pre-stack deconvolution, multiple removal, two-dimensional(2D) depth transformation or migration. The advanced processing stepshave been chosen dependingon the specific objectives and structures tobe revealed (Bécel, 2006; Laigle et al., 2008).
In order to identify the nature and origins of dipping events onsections, here we firstly consider unmigrated stacked time-sections.This is in order to have access to the whole wave field recorded, whichenables us to check which energy could be due to diffraction sourcesby comparing the well-expressed hyperbolas on profiles fromdifferent azimuths in the grid of profiles.
Indeed, it iswell known that time-migration can collapse the dippingenergy due to a diffraction hyperbola of a point source in the plane ofsection, or a line-source orthogonal to it. But this is only effective on dip-lines, not on strike-lines or oblique ones. In this latter case, the signalresulting from diffractions, called a side-echo event, is not a hyperbola
anymore. Thus this signal does not collapse by migration and mayremain in the section and be taken as a real event at depth below theline. Without a control by a crossing profile, this may lead easily tomisinterpretation that an event is real because it still appears after thetime migration processing, whereas it can be a side-echo.
In the following, all the mentioned echo-times in seconds for anevent on the stack-time sections will refer to total times betweensource and receiver, usually called TWT for two-way travel time,which it is for a horizontal reflector at depth.
The basic processing for records of OBS and land stations has beena 5–15 Hz bandpass filter and for some of them a spectral normal-ization of the traces to keep the same level of amplitude with respectto the distance.
2. MCS truth and pitfalls of late energy seen on the MCS profilesunder the basins
2.1. First order results: Moho or side-echoes?
Examples of a crustal reflectivity associated to the lower crust, withthe crust–mantle boundaryat its base, have beenalready shown forMCSprofiles of SEISMARMARA Leg 1 that are located on the margins of thedeep sedimentary basins (Hirn et al., 2002, 2003; Bécel et al., 2004;Laigle et al., 2008). Concerning the deep sedimentary basins themselves,we could observe a flat seismic event with a strong energy at about 9 sright on the on-board processed brute MCS stack section of the firstprofile shot. This was the regional E–W MCS profile SM-1, also labeledSM-23 in the location map of Fig. 2. This line has been shot succes-sively with the 8100 cu.in. source and 15-fold coverage as profile SM-1,and as profile SM-23 with the 2900 cu. in. source which has a smallershot interval distance and a higher coverage-fold of 45.
Profile SM-1/23 is a strike-linewith respect to the known structures,which form the North Marmara Trough, i.e. parallel to the NMTmargin,and is thus prone to record side-swipes. The seismic acquisition system,with receiver groups along the streamer, as well at the stackingprocessing is designed to enhance vertical reflection from horizontalinterfaces at depth. Indeed what is enhanced is the signal coming inorthogonally to the streamer, hence as well the signal returned byobjects located broadside to the streamer direction. Thus we did notinterpret this event as a deep reflector like theMoho. This late energy onthe western part of profile SM-1/23 of our Leg 1 survey has beenhowever proposed as corresponding to the Moho, crust–mantleboundary (Carton, 2004).
This is contradicted by the crossing profiles as discussed in detail inthe following sections which establish by modelling that the energycorresponds to echoes fromout of the plane of the vertical section of theE–Wprofile. In short, this is because on those crossingprofileswhich areN–S transects of the NMT, the correspondingwave “move-out” on shot-gathers, that is the travel-time difference of the wave between the twoends of the streamer, is very much larger than the NMO, normal move-out for aMoho reflection thatwould be less thana tenth of a second. Thisindicates that the corresponding raypath difference is about the lengthof the streamer and also that velocity is low, documenting thus that thebouncing point fromwhich the wave is returned is shallow and alignedwith the streamer. This being true for several N–S transects, indicates aline-diffractor along the southern edge of the NMT as the object givingrise to this late amplitude, and not the Moho. As shown later, the Mohounder thebasinsof theNMTcan only be identifiedby theWARRP-wavesarrivals recorded far away onshore, since its response remains hiddenbehind side-echoes in MCS profiles in the basins.
2.2. Observational evidence provided by crossing profiles
On this regional E–W profile SM 1/23 in the basins rather flatseismic energy at about 9–10 s is observed also in its higher-fold stacksection profile SM-23 (Fig. 2b and c). This flat late energy on this E–W
4 A. Bécel et al. / Tectonophysics 467 (2009) 1–21
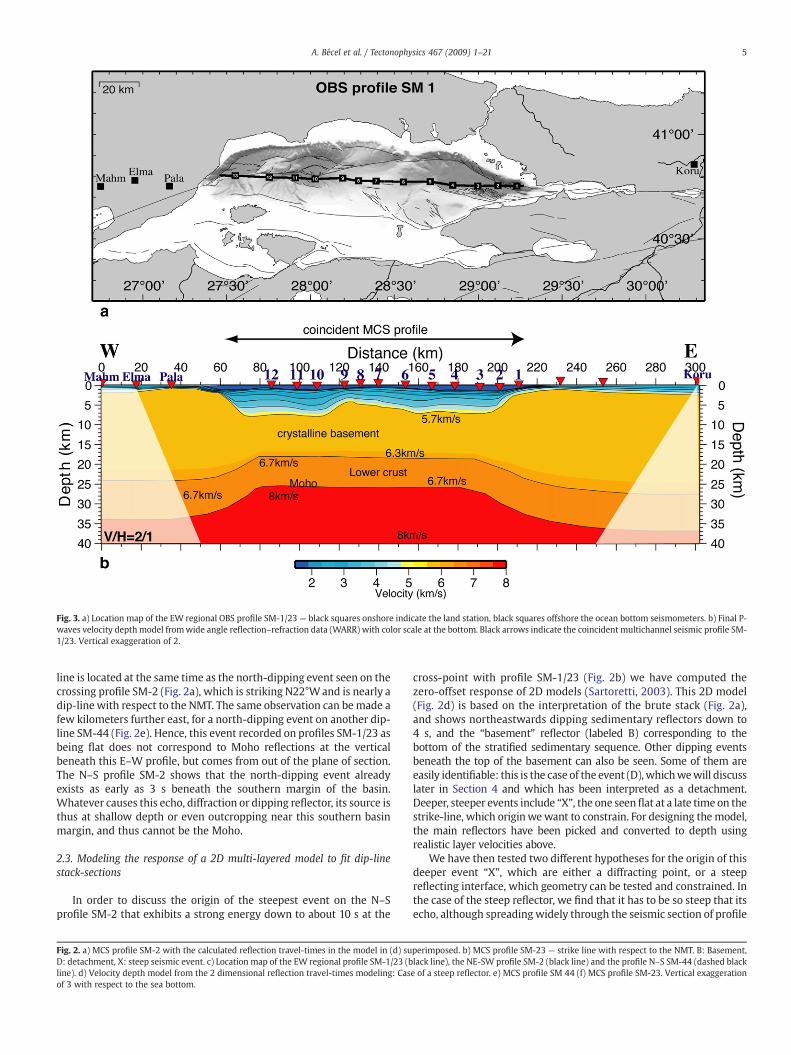
Fig. 3. a) Location map of the EW regional OBS profile SM-1/23 — black squares onshore indicate the land station, black squares offshore the ocean bottom seismometers. b) Final P-waves velocity depthmodel fromwide angle reflection–refraction data (WARR) with color scale at the bottom. Black arrows indicate the coincident multichannel seismic profile SM-1/23. Vertical exaggeration of 2.
5A. Bécel et al. / Tectonophysics 467 (2009) 1–21
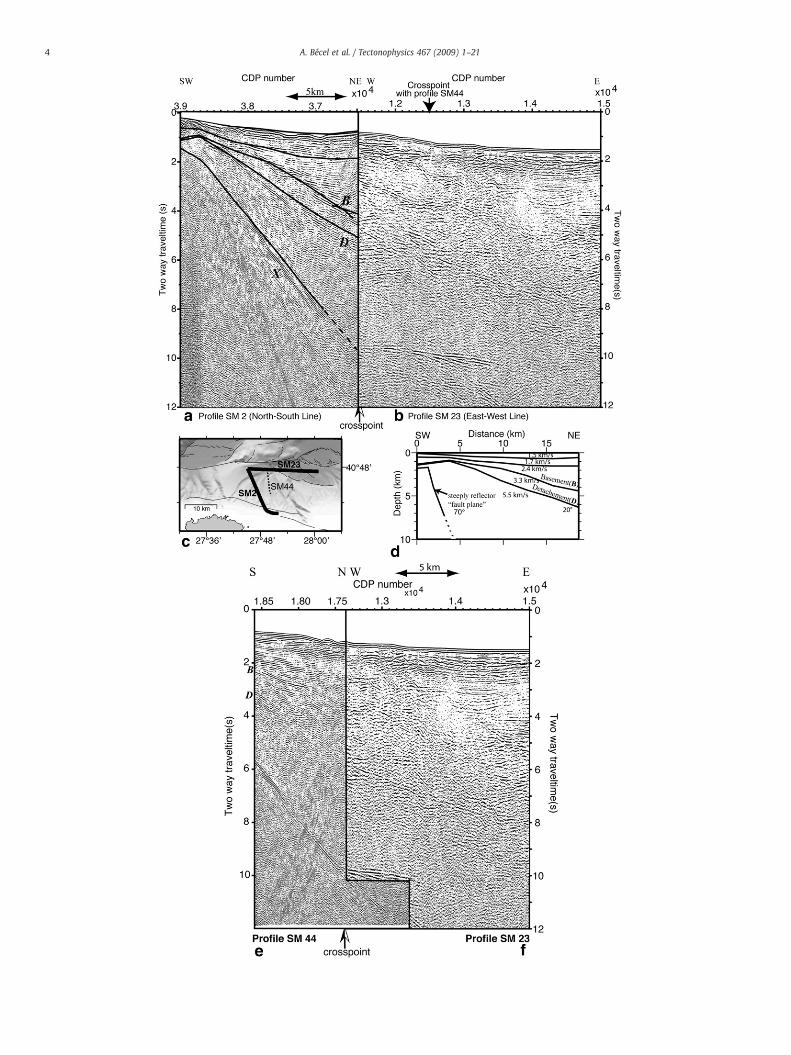
line is located at the same time as the north-dipping event seen on thecrossing profile SM-2 (Fig. 2a), which is striking N22°Wand is nearly adip-linewith respect to the NMT. The same observation can bemade afew kilometers further east, for a north-dipping event on another dip-line SM-44 (Fig. 2e). Hence, this event recorded on profiles SM-1/23 asbeing flat does not correspond to Moho reflections at the verticalbeneath this E–W profile, but comes from out of the plane of section.The N–S profile SM-2 shows that the north-dipping event alreadyexists as early as 3 s beneath the southern margin of the basin.Whatever causes this echo, diffraction or dipping reflector, its source isthus at shallow depth or even outcropping near this southern basinmargin, and thus cannot be the Moho.
2.3. Modeling the response of a 2D multi-layered model to fit dip-linestack-sections
In order to discuss the origin of the steepest event on the N–Sprofile SM-2 that exhibits a strong energy down to about 10 s at the
Fig. 2. a) MCS profile SM-2 with the calculated reflection travel-times in the model in (d) suD: detachment, X: steep seismic event. c) Location map of the EW regional profile SM-1/23 (bline). d) Velocity depth model from the 2 dimensional reflection travel-times modeling: Casof 3 with respect to the sea bottom.
cross-point with profile SM-1/23 (Fig. 2b) we have computed thezero-offset response of 2D models (Sartoretti, 2003). This 2D model(Fig. 2d) is based on the interpretation of the brute stack (Fig. 2a),and shows northeastwards dipping sedimentary reflectors down to4 s, and the “basement” reflector (labeled B) corresponding to thebottom of the stratified sedimentary sequence. Other dipping eventsbeneath the top of the basement can also be seen. Some of them areeasily identifiable: this is the case of the event (D), whichwewill discusslater in Section 4 and which has been interpreted as a detachment.Deeper, steeper events include “X”, the one seenflat at a late time on thestrike-line, which originwewant to constrain. For designing the model,the main reflectors have been picked and converted to depth usingrealistic layer velocities above.
We have then tested two different hypotheses for the origin of thisdeeper event “X”, which are either a diffracting point, or a steepreflecting interface, which geometry can be tested and constrained. Inthe case of the steep reflector, we find that it has to be so steep that itsecho, although spreadingwidely through the seismic section of profile
perimposed. b) MCS profile SM-23 — strike line with respect to the NMT. B: Basement,lack line), the NE-SW profile SM-2 (black line) and the profile N–S SM-44 (dashed blacke of a steep reflector. e) MCS profile SM 44 (f) MCS profile SM-23. Vertical exaggeration
6 A. Bécel et al. / Tectonophysics 467 (2009) 1–21
SM-2 (Fig. 2d) only documents it as a short segment from 2 to 7 kmdepth near the southern rim of the marine basin. Calculated reflectiontimes through the model are superimposed to the stack section of theprofile SM-2. For this steep reflector, a 70° dip is found in the plane ofsection, which is a lower bound to the true dip. The latter could beeven steeper if the profile SM-2 were not exactly a dip-line as it islikely. The top of this steep reflector would be located around thesouthern rim of the NMT, NE of Marmara Island. We explored theother type of models, of diffracting points rather than a reflector andfound an alternative one, where the observed steepest energy can alsobe associated to diffraction points, localized at about 2 km depthunder the southern rim of the trough.
It thus appears from the existence of dipping events on the two N–Stransects SM-2 and SM-44 and the flat attitude of the event on the E–Wprofile that there is an alignment of sources of reflection or diffractionalong the southern edge of the NMT. Both hypotheses for the source, asbeing a line-diffractor or a steep shallow segment of a reflector along thesouthern rim of the NMT have similar geological meanings. The line-diffractor can be regarded as the linear edge of an interface or layer thatis interrupted by a fault and the steep reflector as the outcropping orburied fault-scarp itself. The later dipping event “X” on the dip-line, canthus bemodeled to have a shallow fewkilometers depth origin, at 15 kmsouth of the strike-line: diffractions from a buried shallow edge of theNMTor reflections from edge fault itself, that they define atmost from 2to 7 km depth. In the following, this dipping event “X” will be labeled“LE”, for lateral echo, on the strike-lines.
The imaging of theMoho boundary under narrowmarine basins byreflection seismic appears thus to be plagued by echoes of lateralbasin-bounding features. This inability to image deep is not due to thesource strength and penetration. With a stronger source the energy ofthe lateral echoes will be stronger too. On strike-lines lateral echoesare recorded with an enhanced energy that may lead to their mis-interpretation. In any case a significant number of crossing profileswith different azimuth is required to avoid pitfalls.
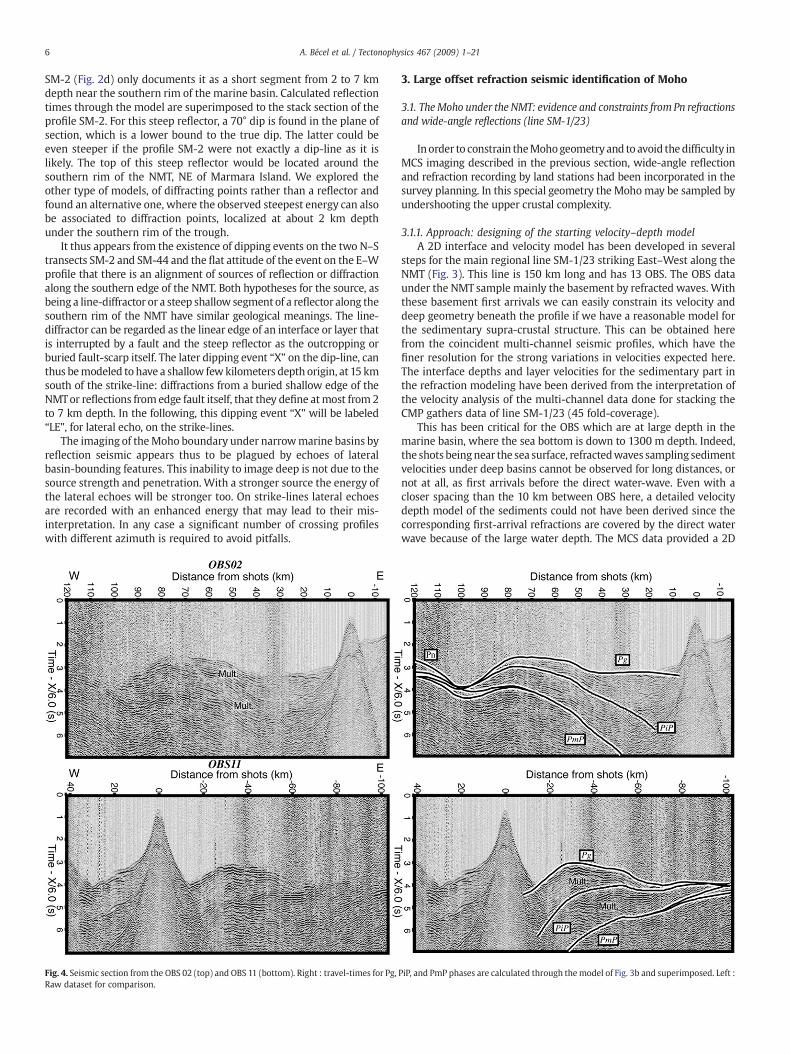
Fig. 4. Seismic section from the OBS 02 (top) and OBS 11 (bottom). Right : travel-times for Pg,Raw dataset for comparison.
3. Large offset refraction seismic identification of Moho
3.1. TheMoho under the NMT: evidence and constraints from Pn refractionsand wide-angle reflections (line SM-1/23)
Inorder to constrain theMohogeometryand to avoid thedifficulty inMCS imaging described in the previous section, wide-angle reflectionand refraction recording by land stations had been incorporated in thesurvey planning. In this special geometry the Mohomay be sampled byundershooting the upper crustal complexity.
3.1.1. Approach: designing of the starting velocity–depth modelA 2D interface and velocity model has been developed in several
steps for the main regional line SM-1/23 striking East–West along theNMT (Fig. 3). This line is 150 km long and has 13 OBS. The OBS dataunder the NMT sample mainly the basement by refracted waves. Withthese basement first arrivals we can easily constrain its velocity anddeep geometry beneath the profile if we have a reasonable model forthe sedimentary supra-crustal structure. This can be obtained herefrom the coincident multi-channel seismic profiles, which have thefiner resolution for the strong variations in velocities expected here.The interface depths and layer velocities for the sedimentary part inthe refraction modeling have been derived from the interpretation ofthe velocity analysis of the multi-channel data done for stacking theCMP gathers data of line SM-1/23 (45 fold-coverage).
This has been critical for the OBS which are at large depth in themarine basin, where the sea bottom is down to 1300 m depth. Indeed,the shots beingnear the sea surface, refractedwaves sampling sedimentvelocities under deep basins cannot be observed for long distances, ornot at all, as first arrivals before the direct water-wave. Even with acloser spacing than the 10 km between OBS here, a detailed velocitydepth model of the sediments could not have been derived since thecorresponding first-arrival refractions are covered by the direct waterwave because of the large water depth. The MCS data provided a 2D
PiP, and PmP phases are calculated through themodel of Fig. 3b and superimposed. Left :
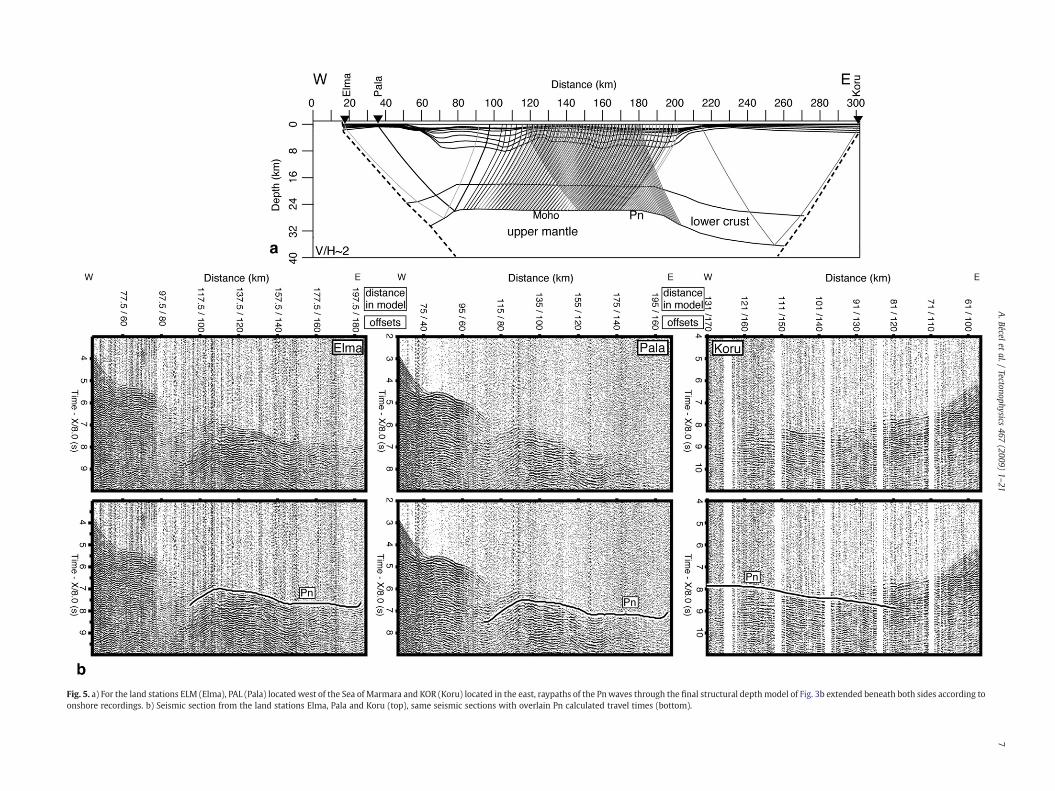
Fig. 5. a) For the land stations ELM (Elma), PAL (Pala) located west of the Sea of Marmara and KOR (Koru) located in the east, raypaths of the Pnwaves through the final structural depthmodel of Fig. 3b extended beneath both sides according toonshore recordings. b) Seismic section from the land stations Elma, Pala and Koru (top), same seismic sections with overlain Pn calculated travel times (bottom).
7A.Bécel
etal./
Tectonophysics467
(2009)1–21
8 A. Bécel et al. / Tectonophysics 467 (2009) 1–21
velocity model down to the basement which topography has beentuned to fit with thewide-angle reflection arrivals observed on the OBSsections. All the calculated travel times have been computed with theRayinvr code of Zelt and Smith (1992). Clear arrivals from the lowercrust andMoho interfaces are unambiguously identified on 2 OBS onlyfrom among near surface multiples that are generally dominant, andwill be discussed later.
3.1.2. Evidence for a crystalline basement constrained by OBS refractionseismics beneath the pre-kinematic basement imaged by MCS data
Modeling the OBS first arrivals recorded from 5 km to about 80 kmestablish that there is a crystalline basementof velocityclose to 5.7km/sat some depth beneath the basement of the sedimentary basin infill asthis is defined and imaged fromMCS (Bécel, 2006). This refractor is forinstance at 8 km depth right below the OBS 10, whereas the deepestreflector distinguished by MCS as forming the base of the finely-stratified basin infill sediments and that is thus considered as their pre-kinematic basement is at 6 kmdepth. The crystalline basement top seenby OBS refraction appears unreflective on the MCS profiles, probablydue to a rather small impedance contrast between the two basements.OBS first arrivals allow to follow its strong topographical variation thatfollows the bottom to the sedimentary infill imaged on MCS profiles.
3.1.3. Depth variations constrained from Pn and PmP travel-timescompensated from shallow structure by MCS and OBS-refraction
Even to offsets greater than 80 kmwhere onsets are clear, there is nosignificant change of waveform or velocity that would indicate firstarrivals of refracted waves from a layer deeper than the crystallinebasement interface. At all offsets, the OBS in the basins record a long
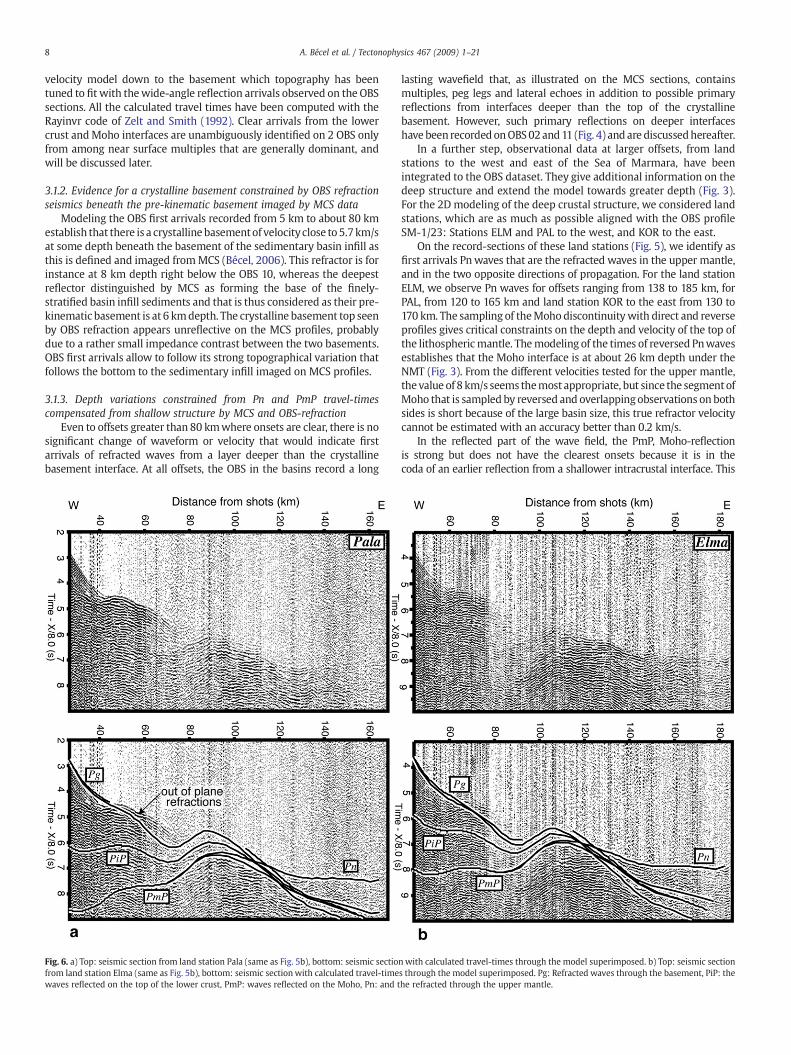
Fig. 6. a) Top: seismic section from land station Pala (same as Fig. 5b), bottom: seismic sectiofrom land station Elma (same as Fig. 5b), bottom: seismic sectionwith calculated travel-timewaves reflected on the top of the lower crust, PmP: waves reflected on the Moho, Pn: and t
lasting wavefield that, as illustrated on the MCS sections, containsmultiples, peg legs and lateral echoes in addition to possible primaryreflections from interfaces deeper than the top of the crystallinebasement. However, such primary reflections on deeper interfaceshave been recordedonOBS02and11 (Fig. 4) and are discussedhereafter.
In a further step, observational data at larger offsets, from landstations to the west and east of the Sea of Marmara, have beenintegrated to the OBS dataset. They give additional information on thedeep structure and extend the model towards greater depth (Fig. 3).For the 2D modeling of the deep crustal structure, we considered landstations, which are as much as possible aligned with the OBS profileSM-1/23: Stations ELM and PAL to the west, and KOR to the east.
On the record-sections of these land stations (Fig. 5), we identify asfirst arrivals Pnwaves that are the refracted waves in the upper mantle,and in the two opposite directions of propagation. For the land stationELM, we observe Pn waves for offsets ranging from 138 to 185 km, forPAL, from 120 to 165 km and land station KOR to the east from 130 to170 km. The sampling of theMoho discontinuitywith direct and reverseprofiles gives critical constraints on the depth and velocity of the top ofthe lithosphericmantle. Themodeling of the times of reversed Pnwavesestablishes that the Moho interface is at about 26 km depth under theNMT (Fig. 3). From the different velocities tested for the upper mantle,the value of 8 km/s seems themost appropriate, but since the segmentofMoho that is sampled by reversed and overlappingobservations on bothsides is short because of the large basin size, this true refractor velocitycannot be estimated with an accuracy better than 0.2 km/s.
In the reflected part of the wave field, the PmP, Moho-reflectionis strong but does not have the clearest onsets because it is in thecoda of an earlier reflection from a shallower intracrustal interface. This
nwith calculated travel-times through the model superimposed. b) Top: seismic sections through the model superimposed. Pg: Refracted waves through the basement, PiP: thehe refracted through the upper mantle.
9A. Bécel et al. / Tectonophysics 467 (2009) 1–21
intracrustal phase, PiP has the clearest arrivals (Fig. 6). PiP waves areobserved clearly on the land station ELM ranging from offsets 70 to110 kmandon the land station PAL fromoffsets 90 to 120 km. This has theusual character of a reflection at the top of a reflective lower crust.Modeling of the two reflected waves (PiP and PmP) defines the top andbottomof the lower crust. Thesewide-angle data establish hence that thereflective lower crustal unit is present under the NMT itself, whereas theMCS vertical reflection does not clearly image it in the complex side-echowavefield generated by the basin rims. If it is clearly identified, however,its thickness cannot bewell constraineddue to the trade-offwith velocity.
Among the late arriving waves on the OBS record-sections, only OBS02 and OBS 11 clearly exhibit identifiable waves reflected at great depthamong well-identified sea-bottom multiples in the late response of thestructure. The reflector of the last one that is observed can be identifiedas the Moho consistently with the depth derived from Pn wavesrecorded by land stations and they can then be modeled (Fig. 4). Mohoreflections PmP and reflections at the top of lower crust reflections, PiP,have been observed and considered in themodeling. However, the PmPdo generally not provide clear onsets on land-stations records, wherethe energy is difficult to separate from the response of the lower crustconvolved with the ringing in the water layer and sediment under shotpoints. The top of the lower crust is thus constrainedmainly by the OBSdata, being less clear on land station data.
In the MCS time-domain stack-section, the top of the lower crustfrom the WARR model would be more or less at the same time as thelateral echoes. Even on a dip-line, we have very little chances to removethe dipping eventwithout altering the signal thatmay be reflected fromthe lower crust.
3.2. The deep crust and Moho under the southern flank of the NMT (lineSM-3a-19-15)
Reflection seismic evidence of the reflective lower crust, with theMoho at its base as commonly considered is only imaged on theprofiles located on the margin where the sediment cover is thin. Suchan image has been shown locally on line SM-36, on the southern flankof the Cinarcik basin (Laigle et al., 2008). Unequivocal identification ofthis base of the reflectivity as the top of the mantle can only beachieved by mantle velocity measurement by refracted waves atdistant stations, as it has been achieved for the NMT. There is no deepreflectivity image that comes out clearly through the side-echoes andmultiples on the coincident MCS profiles.
However, both the reflection and refraction data are clear in thecase of the East–West profile along the southern margin. This line ismade of several pieces of MCS profiles, SM-15-19-3a, that were tie-lines between transects and comprises 5 OBS (Fig. 7a). The MCS datashowconspicuous late energy thatwe interpret as lower crustal reflec-tivity, an interpretation that can here be checked by the coincidentwide-angle reflection–refraction from OBS and land stations. Thesame approach as for the main regional line discussed above has beenused to build the velocity–depth model.
In a first step, an initial supracrustal velocitymodel has been derivedfrom the layered sediments and their basement as imaged by thecoincident MCS profiles displayed in the subsequent Section 4. Then,arrival-times at OBS with mainly basement refracted waves have beenmodeled. Third, wide-angle reflection–refraction data, from landstations ELM, PAL, MAH to the west and land station FEV to the east(Fig. 7a) have been added to reveal the deep structure on the southernmargin of the NMT. Fig. 7 displayed the seismic profile from land stationELM, where three distinct arrivals are observed. The first arrivals, up tothe offset 125 km, are attributed to Pgwaveswhereas the first arrivals atgreater offsets ranging from 138 to 162 km are attributed to refractedwaves in the upper mantle. This land station exhibits also late arrivalscorresponding to waves reflected on the top of the layered lower crust(PiP) with possibly refractions as first-arrivals between 125 and 138 km,and on the top of the upper-mantle (PmP).
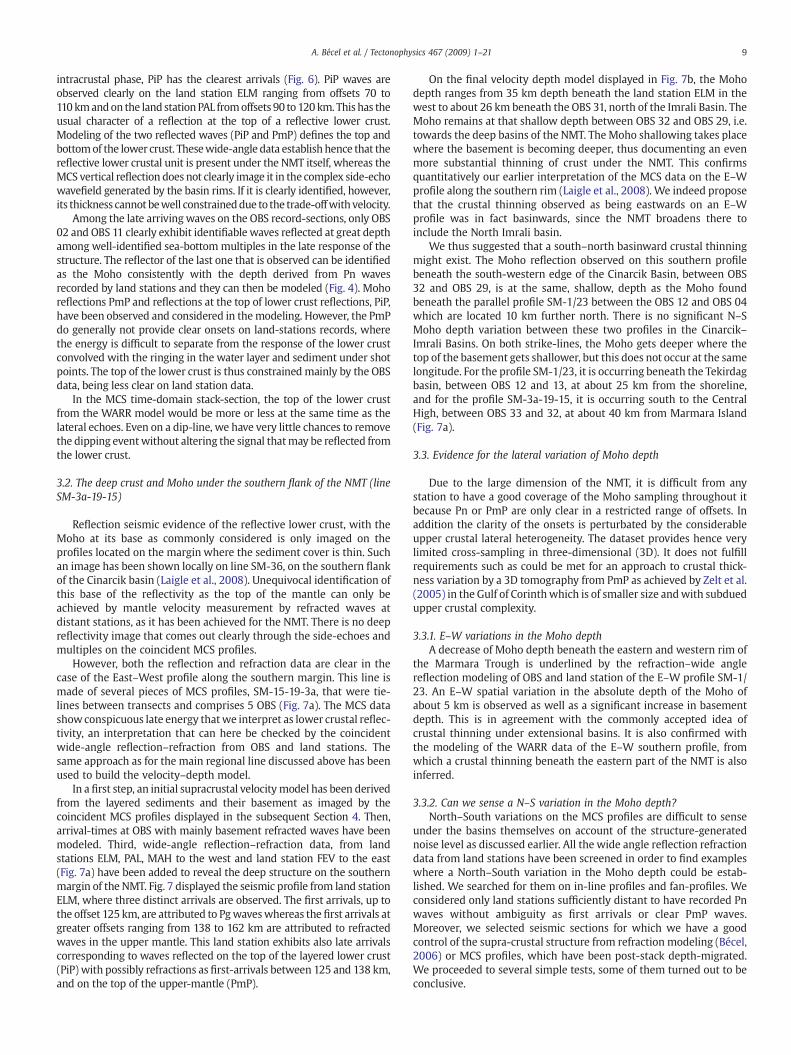
On the final velocity depth model displayed in Fig. 7b, the Mohodepth ranges from 35 km depth beneath the land station ELM in thewest to about 26 km beneath the OBS 31, north of the Imrali Basin. TheMoho remains at that shallow depth between OBS 32 and OBS 29, i.e.towards the deep basins of the NMT. The Moho shallowing takes placewhere the basement is becoming deeper, thus documenting an evenmore substantial thinning of crust under the NMT. This confirmsquantitatively our earlier interpretation of the MCS data on the E–Wprofile along the southern rim (Laigle et al., 2008). We indeed proposethat the crustal thinning observed as being eastwards on an E–Wprofile was in fact basinwards, since the NMT broadens there toinclude the North Imrali basin.
We thus suggested that a south–north basinward crustal thinningmight exist. The Moho reflection observed on this southern profilebeneath the south-western edge of the Cinarcik Basin, between OBS32 and OBS 29, is at the same, shallow, depth as the Moho foundbeneath the parallel profile SM-1/23 between the OBS 12 and OBS 04which are located 10 km further north. There is no significant N–SMoho depth variation between these two profiles in the Cinarcik–Imrali Basins. On both strike-lines, the Moho gets deeper where thetop of the basement gets shallower, but this does not occur at the samelongitude. For the profile SM-1/23, it is occurring beneath the Tekirdagbasin, between OBS 12 and 13, at about 25 km from the shoreline,and for the profile SM-3a-19-15, it is occurring south to the CentralHigh, between OBS 33 and 32, at about 40 km from Marmara Island(Fig. 7a).
3.3. Evidence for the lateral variation of Moho depth
Due to the large dimension of the NMT, it is difficult from anystation to have a good coverage of the Moho sampling throughout itbecause Pn or PmP are only clear in a restricted range of offsets. Inaddition the clarity of the onsets is perturbated by the considerableupper crustal lateral heterogeneity. The dataset provides hence verylimited cross-sampling in three-dimensional (3D). It does not fulfillrequirements such as could be met for an approach to crustal thick-ness variation by a 3D tomography from PmP as achieved by Zelt et al.(2005) in the Gulf of Corinthwhich is of smaller size andwith subduedupper crustal complexity.
3.3.1. E–W variations in the Moho depthA decrease of Moho depth beneath the eastern and western rim of
the Marmara Trough is underlined by the refraction–wide anglereflection modeling of OBS and land station of the E–W profile SM-1/23. An E–W spatial variation in the absolute depth of the Moho ofabout 5 km is observed as well as a significant increase in basementdepth. This is in agreement with the commonly accepted idea ofcrustal thinning under extensional basins. It is also confirmed withthe modeling of the WARR data of the E–W southern profile, fromwhich a crustal thinning beneath the eastern part of the NMT is alsoinferred.
3.3.2. Can we sense a N–S variation in the Moho depth?North–South variations on the MCS profiles are difficult to sense
under the basins themselves on account of the structure-generatednoise level as discussed earlier. All the wide angle reflection refractiondata from land stations have been screened in order to find exampleswhere a North–South variation in the Moho depth could be estab-lished. We searched for them on in-line profiles and fan-profiles. Weconsidered only land stations sufficiently distant to have recorded Pnwaves without ambiguity as first arrivals or clear PmP waves.Moreover, we selected seismic sections for which we have a goodcontrol of the supra-crustal structure from refraction modeling (Bécel,2006) or MCS profiles, which have been post-stack depth-migrated.We proceeded to several simple tests, some of them turned out to beconclusive.
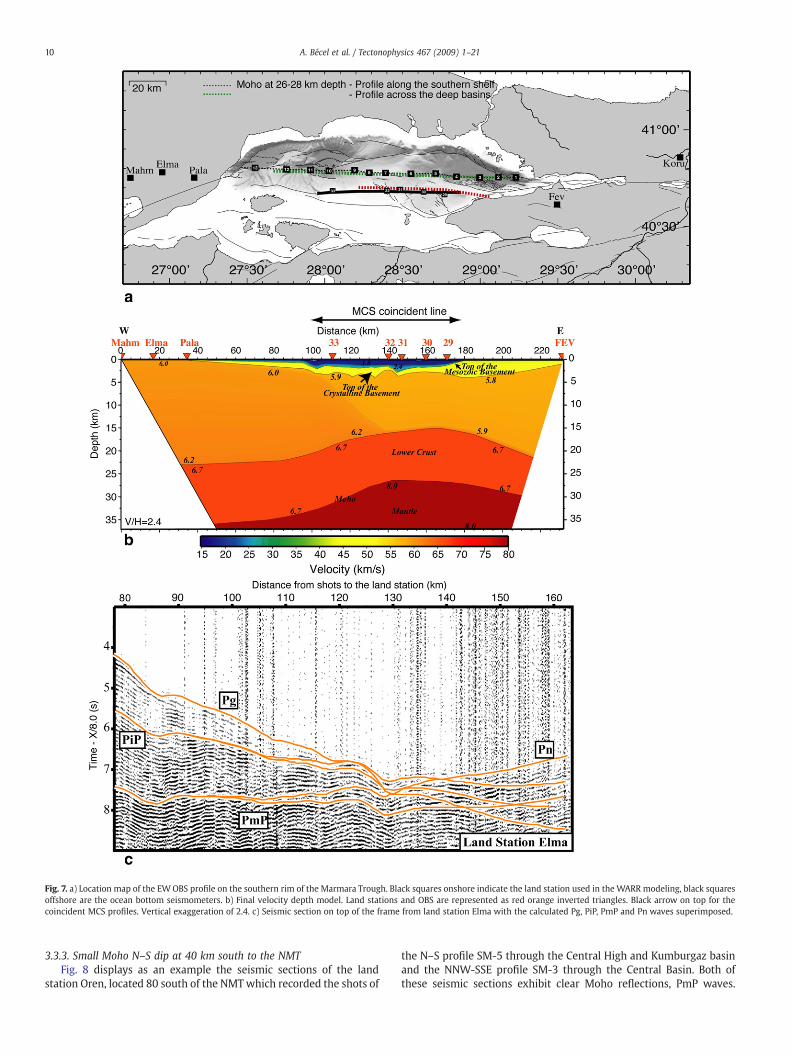
Fig. 7. a) Location map of the EWOBS profile on the southern rim of the Marmara Trough. Black squares onshore indicate the land station used in the WARR modeling, black squaresoffshore are the ocean bottom seismometers. b) Final velocity depth model. Land stations and OBS are represented as red orange inverted triangles. Black arrow on top for thecoincident MCS profiles. Vertical exaggeration of 2.4. c) Seismic section on top of the frame from land station Elma with the calculated Pg, PiP, PmP and Pn waves superimposed.
10 A. Bécel et al. / Tectonophysics 467 (2009) 1–21
3.3.3. Small Moho N–S dip at 40 km south to the NMTFig. 8 displays as an example the seismic sections of the land
station Oren, located 80 south of the NMTwhich recorded the shots of
the N–S profile SM-5 through the Central High and Kumburgaz basinand the NNW-SSE profile SM-3 through the Central Basin. Both ofthese seismic sections exhibit clear Moho reflections, PmP waves.
Fig. 8.North–South variation in the absolute depth of theMoho Discontinuity sensed on land station Orenwhich recorded the shot of the North–South profile 3 across the Central Basin. a) Locationmap— black square in the south indicates thelocation of the land station Oren, the black line indicates the line of shots profile SM-3 and the black square offshore the OBS locations. The red arrow indicates theMoho portion sampled with theWARR data. b) Ray paths of the reflected to theMohowaves (PmP) through themodel with a flatMoho at 30 km depth, vertical exaggeration of 1.5, LC for lower crust. c) Corresponding calculated travel-times superimposed to the seismic section of land station OREN. d) Ray paths of the PmPwaves through the model with a Moho topography. e) Corresponding calculated travel-times superimposed to the seismic section. (For interpretation of the references to color in this figure legend, the reader is referred to the web version ofthis article.)
11A.Bécel
etal./
Tectonophysics467
(2009)1–21
12 A. Bécel et al. / Tectonophysics 467 (2009) 1–21
These two lines have already been modeled with the OBS, giving usaccess to the supra-crustal structure (Bécel, 2006).
To this starting model with the supra-crustal structure, we thenadded two flat interfaces at depth, which correspond to the top of theLLC and the Moho discontinuity at 20 and 30 km depth respectively.The computed travel times for the PmP are superimposed to thoseobserved on the land station seismic section (Fig. 8b,c). The resultsshow a time delay of about 0.2 s between the observed and computedPmP waves, the calculated PmP waves arriving too early. This time-delay is larger than the uncertainty that we have on the PmP phasepicking and can be compensated if we consider a shallower Mohotowards the NMT (Fig. 8d,e). Modeling of these PmP waves leads us toconclude that a N–S Moho depth variation exists 10 km south to thepositions where theMoho depth is constrained by the two crossing E–W profiles. This variation is not dramatic but progressive. For the caseof the profile SM-5, a depth difference of about 2 km (from 28 km to30 km depth) is measured which corresponds to a dip of 4.3° over30 km (Fig. 8d).
The land station data considered here constrain the depth variation,not just beneath the deep basins but atmidway between the station andthe profile. For this profile, Moho is sampled between 62 and 77 kmsouth to theOBS32 (Fig. 8a). Hereweestablish that theMoho sampled atmidpoint between receiver and shots, which is indeed at the southernmargin not of the NMT but of the Sea of Marmara itself is still deeperthan under the NMT and we expect it is upsloping towards it, to reachthe shallow Moho depths observed 20 km further north. This suggeststhat the reduction in Moho depth already begins far to the south fromthe NMT but more progressively than beneath the eastern and westernrims. The same kind of result is also obtained for another profile, SM-3that is located in the Central Basin.
The major results obtained from wide-angle reflection–refrac-tion on reversed profiles are the identification of the upper mantlebeneath the NMT from measuring its velocity, and strong con-straints on a sharp reduction of the Moho depth beneath the NMTwith respect to that just east and west of it, which occurs rightunder the sea-bottom and basement slopes. From the comparison ofthe two E–W profiles SM 1/23 and SM 3A-19-15, the region ofshallow Moho would however not strike as the E–W alignment ofthe presently deepest troughs of the NMT itself, but ESE from thesouthwestern end of Tekirdag, along the southern margin of theCentral Basin and towards the southern margin of North Imralibasin. In contrast, a progressive reduction of the Moho depth over alonger distance from the southern margin of the Sea of Marmara tothe NMT is evidenced. However, a continuous image of the crustalthickness variation at regional scale could not be obtained for thereasons of size, sampling and upper crustal complexity mentionedbefore.
Other land stations seismic sections have been checked for Pn orclear PmP waves in order to get additional constraints on the North–South depth variation. But, as shown just above, the N–S Moho depthvariation is small, introducing a time delay that is only slightly largerthan the resolution or accuracy we have on the picking of the Pn orPmP phases observed.
4. Architecture frombasin bottomto topof lower crust: detachment,extensional faults and basement blocks
A set of MCS profiles with diverse azimuths in the region of thesouthern rim of the Central and Western High (Fig. 1) allow us toresolve the 3D crustal architecture down to the lower crust. This willhelp us in establishing a more specific relation among near-surfaceextensional features such as described in Laigle et al. (2008) and Bécel(2006). In the west, south of the Western High and the Central Basin(Fig. 1b), we are on the southern rim of the NMT. The sedimentarycover being thin, reflection seismics penetrates deeper than under thedeep NMT itself, in part because of less sedimentary multiples at later
times, and is thus able to image down to the lower crust as it has beenshown for the southern E–W line SM-3a-19-15.
4.1. Detachment: a shallow northwards dipping reflector in the uppercrust of the southern NMT
Fig. 9 allows to follow a bright seismic event, labeled “D”, over thewhole length of lines SM-2-3a-3 which is 43 km long. This event isseen at later times than the top of the basement under the stratifiedsediment reflectivity. This figure displays a stack time section as aview taken from the south of the Central Basin (Fig. 9a). These lineshave been obtained with the largest source of 8100 cu. in., with a shotinterval of 150 m and a 15 fold-coverage.
From the course-change point cc1 (middle of Fig. 9b), profile SM-2crosses the NMT through the so-called Western High towards NNW.Between course-change points cc1 and cc2 (Fig. 9b), profile SM-3a isstriking E–Walong the southern rim of the Central Basin. To the rightof course-change point cc2, profile SM-3which strikes N–S crosses theCentral Basin.
On profile SM-2 of Fig. 9b, the base of the sediments (“B”), a seismicevent (“D”) and lateral echoes (“LE”) discussed and modeled from Fig. 2in Section2.3, are clearly imaged. The event called “D” canbemodeled ascorresponding to a reflector (Fig. 2). The latter has a dip of about 20° onthis line towards theWestern High, which is a lower bound value, if theline is not exactly a dip-line. Such a dip of 20° on several kilometers islarger than expected from any lithological layer boundary in thelithosphere, except in particular cases for the top of the basement.
The other option is thus to consider this event “D” as a tectonicboundary like a fault. This reflector appears with an even smallerapparent dip on the time-section SM-3a of Fig. 9 which strikes east.The apparent dip remains also smaller on profile SM-3 into theCentral Basin. In the time-sections, this apparent dip has to be takenwith caution because of the varying thickness of water and sedi-ments above the event “D”, and it will be hereafter checked. How-ever, in the interpretation of the reflector as a fault, its dip is thenrather small, suggesting a rather low-angle crustal normal-fault ordetachment.
An additional set of reflectors on profile SM-3, across the CentralBasin, is also observed. At the southern edge of the Central Basin, thereare segments of reflectors with a southward dip, contrary to thebasinward dip of “D”. With respect to the latter being a detachmentnormal fault, such reflectors would be expected as marking the top oftilted blocks, which are therefore labeled “TB” in Fig. 9. In this image,“D” is overlain by a basement wedge with an opposite, south-westwards dipping top. This basement wedge is interrupted to thenorth by a steep fault that separates the basement material from thesedimentary deposits down to large depths in the subsided CentralBasin (Laigle et al., 2008). The shape of the wedge of basementbetween “D” and “TB” reflectors is indeed the geometry expected for atilted block above a detachment. Moreover, another north-dippingevent can be followed from the outcrop at sea-bottom down to thedetachment “D”. This event has a dip decreasing with depth, since itappears splaying from the detachment “D”, and is thus labeled “SF” forsplay-fault in Fig. 9.
Fig. 10 displays a profile close to the one discussed just above, butwith different orientations. This profile SM-40-41 makes also a turn atthe southern shelf. From the course change point cc3 to the left, profileSM-41 strikes N 50°W across the southern part of the Western Highwhereas to the right of cc3, profile SM-40 strikes N 40°E towards thesouthern edge of the Central Basin.
On profile SM-41 of Fig. 10, the same main structures as the onesimaged on the profile SM-2 are found: a bright seismic eventcorresponding to the detachment “D” on top of which the basementreflector “B” is imagedunder the layered sediments. Around4.5 s, eventswith strongamplitude,which canbeattributed to lateral echoes, are alsoobserved. The intra-crustal detachment can be followed over thewhole
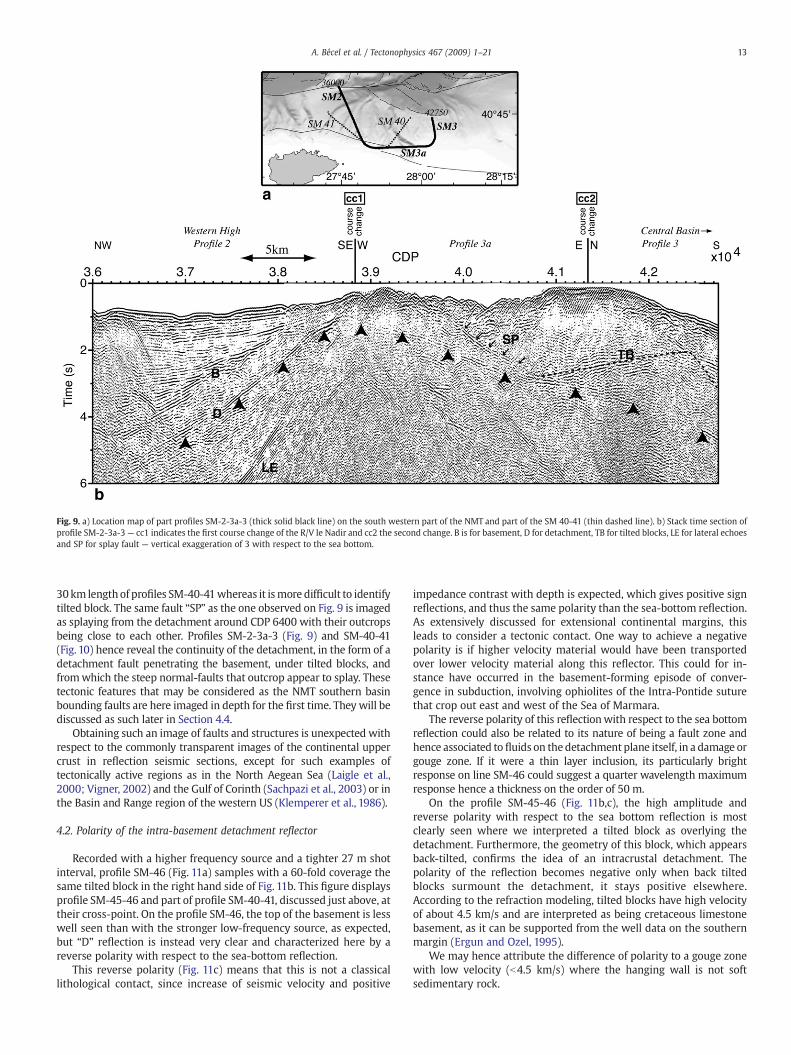
Fig. 9. a) Location map of part profiles SM-2-3a-3 (thick solid black line) on the south western part of the NMT and part of the SM 40-41 (thin dashed line). b) Stack time section ofprofile SM-2-3a-3— cc1 indicates the first course change of the R/V le Nadir and cc2 the second change. B is for basement, D for detachment, TB for tilted blocks, LE for lateral echoesand SP for splay fault — vertical exaggeration of 3 with respect to the sea bottom.
13A. Bécel et al. / Tectonophysics 467 (2009) 1–21
30km lengthof profiles SM-40-41whereas it ismore difficult to identifytilted block. The same fault “SP” as the one observed on Fig. 9 is imagedas splaying from the detachment around CDP 6400 with their outcropsbeing close to each other. Profiles SM-2-3a-3 (Fig. 9) and SM-40-41(Fig. 10) hence reveal the continuity of the detachment, in the form of adetachment fault penetrating the basement, under tilted blocks, andfromwhich the steep normal-faults that outcrop appear to splay. Thesetectonic features that may be considered as the NMT southern basinbounding faults are here imaged in depth for the first time. They will bediscussed as such later in Section 4.4.
Obtaining such an image of faults and structures is unexpected withrespect to the commonly transparent images of the continental uppercrust in reflection seismic sections, except for such examples oftectonically active regions as in the North Aegean Sea (Laigle et al.,2000; Vigner, 2002) and the Gulf of Corinth (Sachpazi et al., 2003) or inthe Basin and Range region of the western US (Klemperer et al., 1986).
4.2. Polarity of the intra-basement detachment reflector
Recorded with a higher frequency source and a tighter 27 m shotinterval, profile SM-46 (Fig. 11a) samples with a 60-fold coverage thesame tilted block in the right hand side of Fig. 11b. This figure displaysprofile SM-45-46 and part of profile SM-40-41, discussed just above, attheir cross-point. On the profile SM-46, the top of the basement is lesswell seen than with the stronger low-frequency source, as expected,but “D” reflection is instead very clear and characterized here by areverse polarity with respect to the sea-bottom reflection.
This reverse polarity (Fig. 11c) means that this is not a classicallithological contact, since increase of seismic velocity and positive
impedance contrast with depth is expected, which gives positive signreflections, and thus the same polarity than the sea-bottom reflection.As extensively discussed for extensional continental margins, thisleads to consider a tectonic contact. One way to achieve a negativepolarity is if higher velocity material would have been transportedover lower velocity material along this reflector. This could for in-stance have occurred in the basement-forming episode of conver-gence in subduction, involving ophiolites of the Intra-Pontide suturethat crop out east and west of the Sea of Marmara.
The reverse polarity of this reflectionwith respect to the sea bottomreflection could also be related to its nature of being a fault zone andhence associated to fluids on the detachment plane itself, in a damage orgouge zone. If it were a thin layer inclusion, its particularly brightresponse on line SM-46 could suggest a quarter wavelength maximumresponse hence a thickness on the order of 50 m.
On the profile SM-45-46 (Fig. 11b,c), the high amplitude andreverse polarity with respect to the sea bottom reflection is mostclearly seen where we interpreted a tilted block as overlying thedetachment. Furthermore, the geometry of this block, which appearsback-tilted, confirms the idea of an intracrustal detachment. Thepolarity of the reflection becomes negative only when back tiltedblocks surmount the detachment, it stays positive elsewhere.According to the refraction modeling, tilted blocks have high velocityof about 4.5 km/s and are interpreted as being cretaceous limestonebasement, as it can be supported from the well data on the southernmargin (Ergun and Ozel, 1995).
We may hence attribute the difference of polarity to a gouge zonewith low velocity (b4.5 km/s) where the hanging wall is not softsedimentary rock.
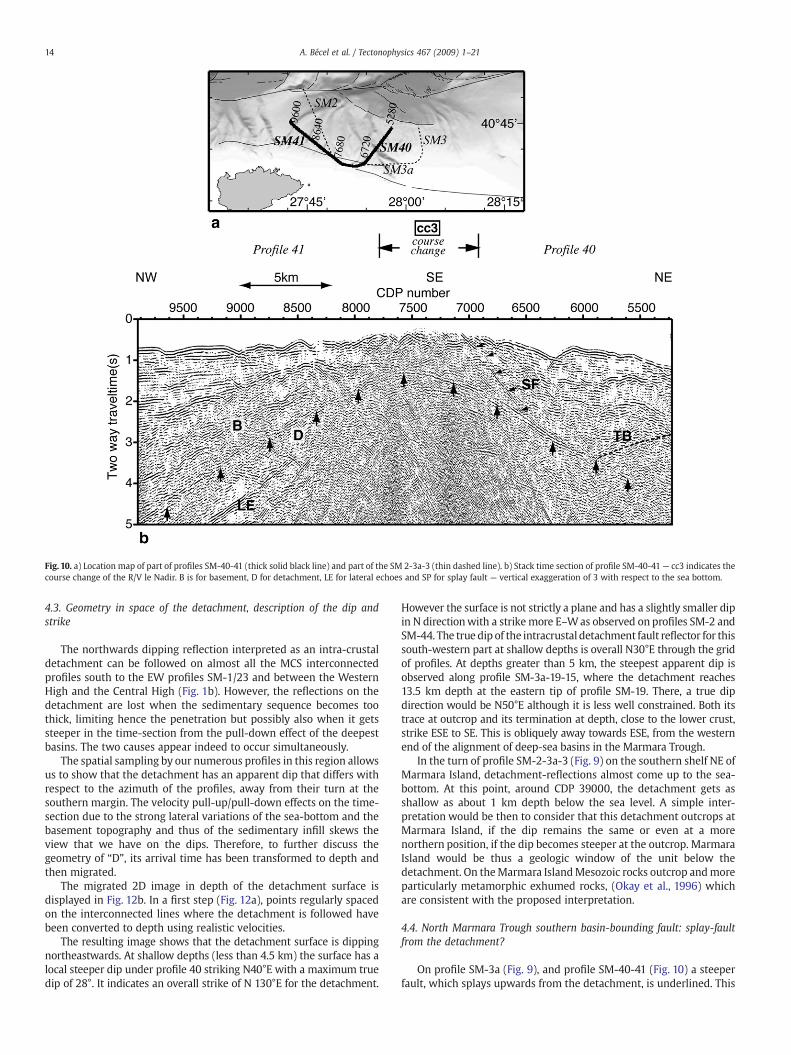
Fig. 10. a) Location map of part of profiles SM-40-41 (thick solid black line) and part of the SM 2-3a-3 (thin dashed line). b) Stack time section of profile SM-40-41— cc3 indicates thecourse change of the R/V le Nadir. B is for basement, D for detachment, LE for lateral echoes and SP for splay fault — vertical exaggeration of 3 with respect to the sea bottom.
14 A. Bécel et al. / Tectonophysics 467 (2009) 1–21
4.3. Geometry in space of the detachment, description of the dip andstrike
The northwards dipping reflection interpreted as an intra-crustaldetachment can be followed on almost all the MCS interconnectedprofiles south to the EW profiles SM-1/23 and between the WesternHigh and the Central High (Fig. 1b). However, the reflections on thedetachment are lost when the sedimentary sequence becomes toothick, limiting hence the penetration but possibly also when it getssteeper in the time-section from the pull-down effect of the deepestbasins. The two causes appear indeed to occur simultaneously.
The spatial sampling by our numerous profiles in this region allowsus to show that the detachment has an apparent dip that differs withrespect to the azimuth of the profiles, away from their turn at thesouthern margin. The velocity pull-up/pull-down effects on the time-section due to the strong lateral variations of the sea-bottom and thebasement topography and thus of the sedimentary infill skews theview that we have on the dips. Therefore, to further discuss thegeometry of “D”, its arrival time has been transformed to depth andthen migrated.
The migrated 2D image in depth of the detachment surface isdisplayed in Fig. 12b. In a first step (Fig. 12a), points regularly spacedon the interconnected lines where the detachment is followed havebeen converted to depth using realistic velocities.
The resulting image shows that the detachment surface is dippingnortheastwards. At shallow depths (less than 4.5 km) the surface has alocal steeper dip under profile 40 striking N40°E with a maximum truedip of 28°. It indicates an overall strike of N 130°E for the detachment.
However the surface is not strictly a plane and has a slightly smaller dipin N directionwith a strikemore E–Was observed on profiles SM-2 andSM-44. The true dip of the intracrustal detachment fault reflector for thissouth-western part at shallow depths is overall N30°E through the gridof profiles. At depths greater than 5 km, the steepest apparent dip isobserved along profile SM-3a-19-15, where the detachment reaches13.5 km depth at the eastern tip of profile SM-19. There, a true dipdirection would be N50°E although it is less well constrained. Both itstrace at outcrop and its termination at depth, close to the lower crust,strike ESE to SE. This is obliquely away towards ESE, from the westernend of the alignment of deep-sea basins in the Marmara Trough.
In the turn of profile SM-2-3a-3 (Fig. 9) on the southern shelf NE ofMarmara Island, detachment-reflections almost come up to the sea-bottom. At this point, around CDP 39000, the detachment gets asshallow as about 1 km depth below the sea level. A simple inter-pretation would be then to consider that this detachment outcrops atMarmara Island, if the dip remains the same or even at a morenorthern position, if the dip becomes steeper at the outcrop. MarmaraIsland would be thus a geologic window of the unit below thedetachment. On theMarmara IslandMesozoic rocks outcrop andmoreparticularly metamorphic exhumed rocks, (Okay et al., 1996) whichare consistent with the proposed interpretation.
4.4. North Marmara Trough southern basin-bounding fault: splay-faultfrom the detachment?
On profile SM-3a (Fig. 9), and profile SM-40-41 (Fig. 10) a steeperfault, which splays upwards from the detachment, is underlined. This
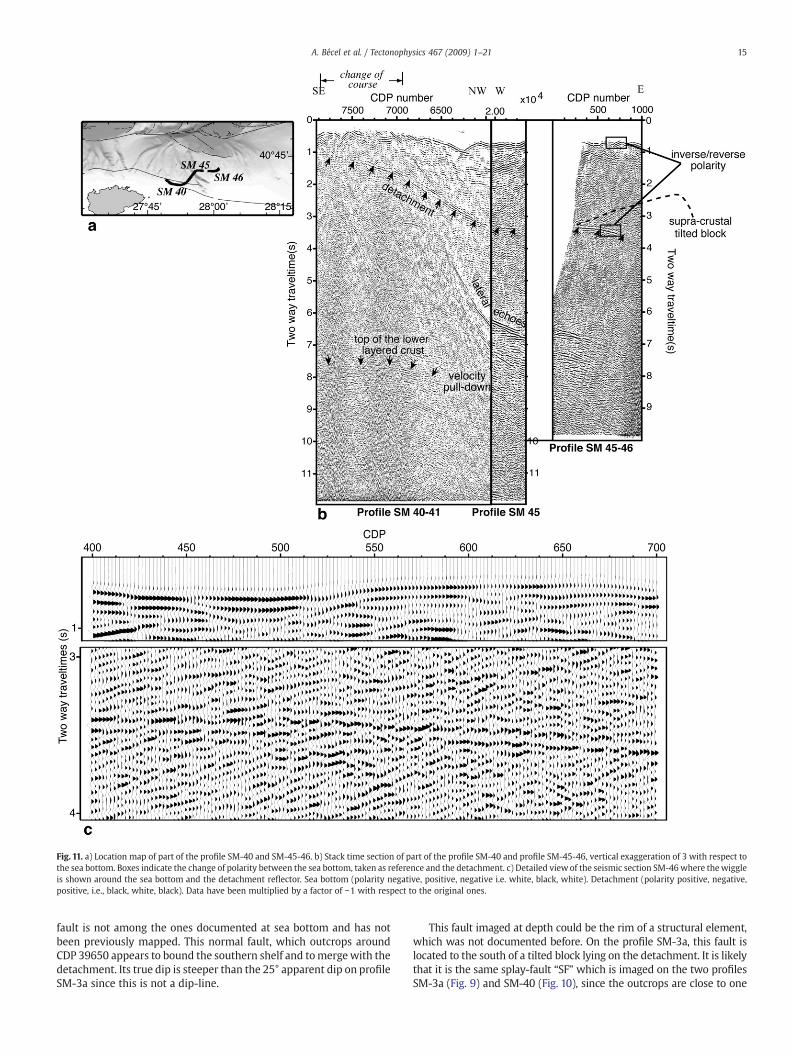
Fig. 11. a) Location map of part of the profile SM-40 and SM-45-46. b) Stack time section of part of the profile SM-40 and profile SM-45-46, vertical exaggeration of 3 with respect tothe sea bottom. Boxes indicate the change of polarity between the sea bottom, taken as reference and the detachment. c) Detailed view of the seismic section SM-46where thewiggleis shown around the sea bottom and the detachment reflector. Sea bottom (polarity negative, positive, negative i.e. white, black, white). Detachment (polarity positive, negative,positive, i.e., black, white, black). Data have been multiplied by a factor of −1 with respect to the original ones.
15A. Bécel et al. / Tectonophysics 467 (2009) 1–21
fault is not among the ones documented at sea bottom and has notbeen previously mapped. This normal fault, which outcrops aroundCDP 39650 appears to bound the southern shelf and tomergewith thedetachment. Its true dip is steeper than the 25° apparent dip on profileSM-3a since this is not a dip-line.
This fault imaged at depth could be the rim of a structural element,which was not documented before. On the profile SM-3a, this fault islocated to the south of a tilted block lying on the detachment. It is likelythat it is the same splay-fault “SF” which is imaged on the two profilesSM-3a (Fig. 9) and SM-40 (Fig. 10), since the outcrops are close to one
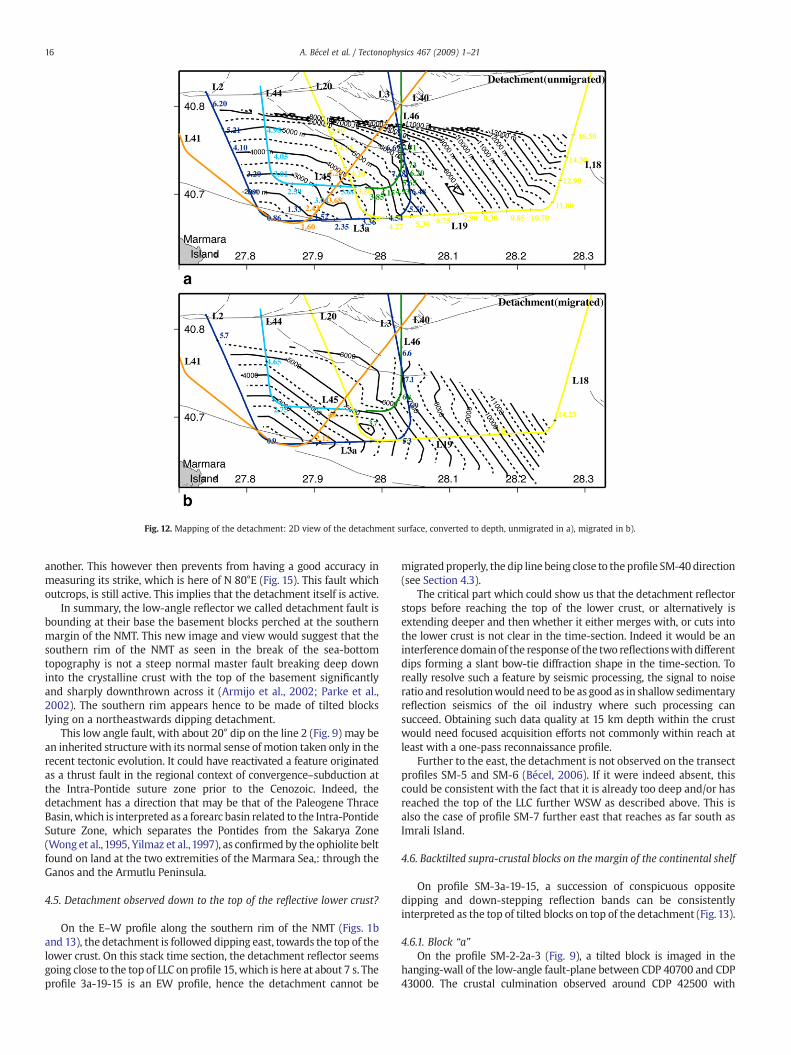
Fig. 12. Mapping of the detachment: 2D view of the detachment surface, converted to depth, unmigrated in a), migrated in b).
16 A. Bécel et al. / Tectonophysics 467 (2009) 1–21
another. This however then prevents from having a good accuracy inmeasuring its strike, which is here of N 80°E (Fig. 15). This fault whichoutcrops, is still active. This implies that the detachment itself is active.
In summary, the low-angle reflector we called detachment fault isbounding at their base the basement blocks perched at the southernmargin of the NMT. This new image and view would suggest that thesouthern rim of the NMT as seen in the break of the sea-bottomtopography is not a steep normal master fault breaking deep downinto the crystalline crust with the top of the basement significantlyand sharply downthrown across it (Armijo et al., 2002; Parke et al.,2002). The southern rim appears hence to be made of tilted blockslying on a northeastwards dipping detachment.
This low angle fault, with about 20° dip on the line 2 (Fig. 9) may bean inherited structure with its normal sense of motion taken only in therecent tectonic evolution. It could have reactivated a feature originatedas a thrust fault in the regional context of convergence–subduction atthe Intra-Pontide suture zone prior to the Cenozoic. Indeed, thedetachment has a direction that may be that of the Paleogene ThraceBasin, which is interpreted as a forearc basin related to the Intra-PontideSuture Zone, which separates the Pontides from the Sakarya Zone(Wong et al.,1995, Yilmaz et al.,1997), as confirmed by the ophiolite beltfound on land at the two extremities of the Marmara Sea,: through theGanos and the Armutlu Peninsula.
4.5. Detachment observed down to the top of the reflective lower crust?
On the E–W profile along the southern rim of the NMT (Figs. 1band 13), the detachment is followed dipping east, towards the top of thelower crust. On this stack time section, the detachment reflector seemsgoing close to the top of LLC on profile 15, which is here at about 7 s. Theprofile 3a-19-15 is an EW profile, hence the detachment cannot be
migratedproperly, the dip line being close to the profile SM-40direction(see Section 4.3).
The critical part which could show us that the detachment reflectorstops before reaching the top of the lower crust, or alternatively isextending deeper and then whether it either merges with, or cuts intothe lower crust is not clear in the time-section. Indeed it would be aninterferencedomain of the response of the two reflectionswith differentdips forming a slant bow-tie diffraction shape in the time-section. Toreally resolve such a feature by seismic processing, the signal to noiseratio and resolutionwould need to be as good as in shallow sedimentaryreflection seismics of the oil industry where such processing cansucceed. Obtaining such data quality at 15 km depth within the crustwould need focused acquisition efforts not commonly within reach atleast with a one-pass reconnaissance profile.
Further to the east, the detachment is not observed on the transectprofiles SM-5 and SM-6 (Bécel, 2006). If it were indeed absent, thiscould be consistent with the fact that it is already too deep and/or hasreached the top of the LLC further WSW as described above. This isalso the case of profile SM-7 further east that reaches as far south asImrali Island.
4.6. Backtilted supra-crustal blocks on the margin of the continental shelf
On profile SM-3a-19-15, a succession of conspicuous oppositedipping and down-stepping reflection bands can be consistentlyinterpreted as the top of tilted blocks on top of the detachment (Fig. 13).
4.6.1. Block “a”On the profile SM-2-2a-3 (Fig. 9), a tilted block is imaged in the
hanging-wall of the low-angle fault-plane between CDP 40700 and CDP43000. The crustal culmination observed around CDP 42500 with
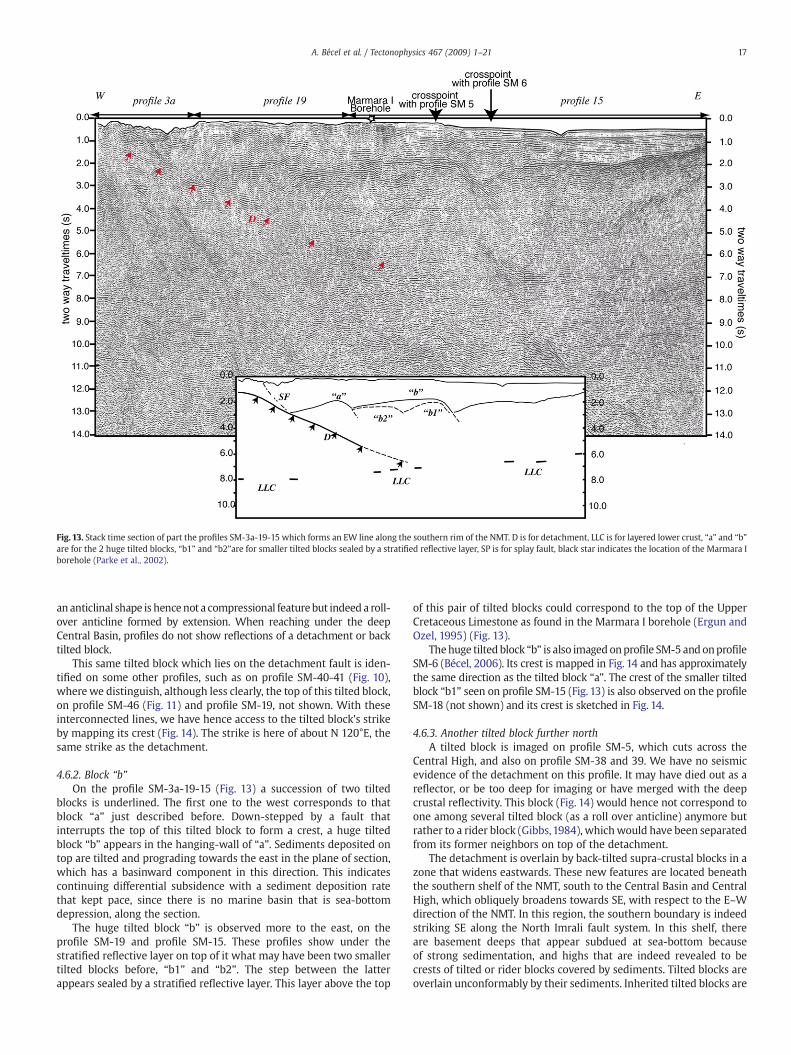
Fig. 13. Stack time section of part the profiles SM-3a-19-15 which forms an EW line along the southern rim of the NMT. D is for detachment, LLC is for layered lower crust, “a” and “b”are for the 2 huge tilted blocks, “b1” and “b2”are for smaller tilted blocks sealed by a stratified reflective layer, SP is for splay fault, black star indicates the location of the Marmara Iborehole (Parke et al., 2002).
17A. Bécel et al. / Tectonophysics 467 (2009) 1–21
an anticlinal shape is hencenot a compressional featurebut indeed a roll-over anticline formed by extension. When reaching under the deepCentral Basin, profiles do not show reflections of a detachment or backtilted block.
This same tilted block which lies on the detachment fault is iden-tified on some other profiles, such as on profile SM-40-41 (Fig. 10),where we distinguish, although less clearly, the top of this tilted block,on profile SM-46 (Fig. 11) and profile SM-19, not shown. With theseinterconnected lines, we have hence access to the tilted block's strikeby mapping its crest (Fig. 14). The strike is here of about N 120°E, thesame strike as the detachment.
4.6.2. Block “b”On the profile SM-3a-19-15 (Fig. 13) a succession of two tilted
blocks is underlined. The first one to the west corresponds to thatblock “a” just described before. Down-stepped by a fault thatinterrupts the top of this tilted block to form a crest, a huge tiltedblock “b” appears in the hanging-wall of “a”. Sediments deposited ontop are tilted and prograding towards the east in the plane of section,which has a basinward component in this direction. This indicatescontinuing differential subsidence with a sediment deposition ratethat kept pace, since there is no marine basin that is sea-bottomdepression, along the section.
The huge tilted block “b” is observed more to the east, on theprofile SM-19 and profile SM-15. These profiles show under thestratified reflective layer on top of it what may have been two smallertilted blocks before, “b1” and “b2”. The step between the latterappears sealed by a stratified reflective layer. This layer above the top
of this pair of tilted blocks could correspond to the top of the UpperCretaceous Limestone as found in the Marmara I borehole (Ergun andOzel, 1995) (Fig. 13).
Thehuge tilted block “b” is also imaged onprofile SM-5 andonprofileSM-6 (Bécel, 2006). Its crest is mapped in Fig. 14 and has approximatelythe same direction as the tilted block “a”. The crest of the smaller tiltedblock “b1” seen on profile SM-15 (Fig. 13) is also observed on the profileSM-18 (not shown) and its crest is sketched in Fig. 14.
4.6.3. Another tilted block further northA tilted block is imaged on profile SM-5, which cuts across the
Central High, and also on profile SM-38 and 39. We have no seismicevidence of the detachment on this profile. It may have died out as areflector, or be too deep for imaging or have merged with the deepcrustal reflectivity. This block (Fig. 14) would hence not correspond toone among several tilted block (as a roll over anticline) anymore butrather to a rider block (Gibbs,1984), whichwould have been separatedfrom its former neighbors on top of the detachment.
The detachment is overlain by back-tilted supra-crustal blocks in azone that widens eastwards. These new features are located beneaththe southern shelf of the NMT, south to the Central Basin and CentralHigh, which obliquely broadens towards SE, with respect to the E–Wdirection of the NMT. In this region, the southern boundary is indeedstriking SE along the North Imrali fault system. In this shelf, thereare basement deeps that appear subdued at sea-bottom becauseof strong sedimentation, and highs that are indeed revealed to becrests of tilted or rider blocks covered by sediments. Tilted blocks areoverlain unconformably by their sediments. Inherited tilted blocks are
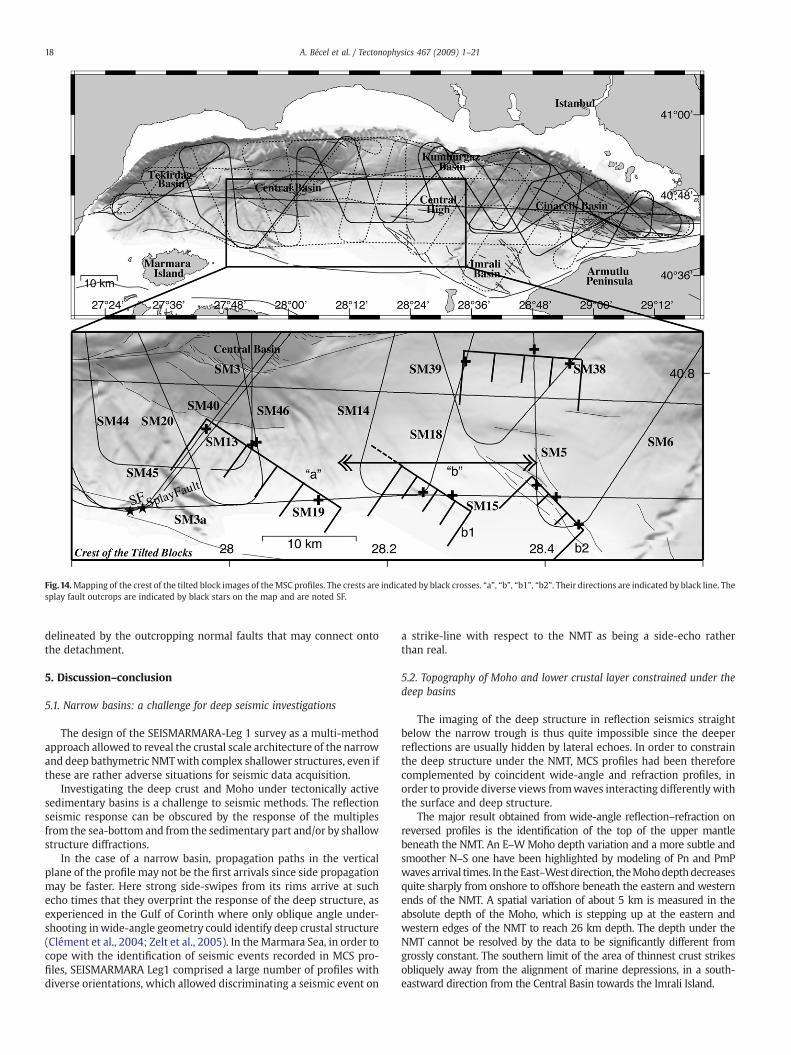
Fig.14.Mapping of the crest of the tilted block images of the MSC profiles. The crests are indicated by black crosses. “a”, “b”, “b1”, “b2”. Their directions are indicated by black line. Thesplay fault outcrops are indicated by black stars on the map and are noted SF.
18 A. Bécel et al. / Tectonophysics 467 (2009) 1–21
delineated by the outcropping normal faults that may connect ontothe detachment.
5. Discussion–conclusion
5.1. Narrow basins: a challenge for deep seismic investigations
The design of the SEISMARMARA-Leg 1 survey as a multi-methodapproach allowed to reveal the crustal scale architecture of the narrowand deep bathymetric NMTwith complex shallower structures, even ifthese are rather adverse situations for seismic data acquisition.
Investigating the deep crust and Moho under tectonically activesedimentary basins is a challenge to seismic methods. The reflectionseismic response can be obscured by the response of the multiplesfrom the sea-bottom and from the sedimentary part and/or by shallowstructure diffractions.
In the case of a narrow basin, propagation paths in the verticalplane of the profile may not be the first arrivals since side propagationmay be faster. Here strong side-swipes from its rims arrive at suchecho times that they overprint the response of the deep structure, asexperienced in the Gulf of Corinth where only oblique angle under-shooting inwide-angle geometry could identify deep crustal structure(Clément et al., 2004; Zelt et al., 2005). In the Marmara Sea, in order tocope with the identification of seismic events recorded in MCS pro-files, SEISMARMARA Leg1 comprised a large number of profiles withdiverse orientations, which allowed discriminating a seismic event on
a strike-line with respect to the NMT as being a side-echo ratherthan real.
5.2. Topography of Moho and lower crustal layer constrained under thedeep basins
The imaging of the deep structure in reflection seismics straightbelow the narrow trough is thus quite impossible since the deeperreflections are usually hidden by lateral echoes. In order to constrainthe deep structure under the NMT, MCS profiles had been thereforecomplemented by coincident wide-angle and refraction profiles, inorder to provide diverse views fromwaves interacting differently withthe surface and deep structure.
The major result obtained from wide-angle reflection–refraction onreversed profiles is the identification of the top of the upper mantlebeneath the NMT. An E–WMoho depth variation and a more subtle andsmoother N–S one have been highlighted by modeling of Pn and PmPwaves arrival times. In theEast–Westdirection, theMohodepthdecreasesquite sharply from onshore to offshore beneath the eastern and westernends of the NMT. A spatial variation of about 5 km is measured in theabsolute depth of the Moho, which is stepping up at the eastern andwestern edges of the NMT to reach 26 km depth. The depth under theNMT cannot be resolved by the data to be significantly different fromgrossly constant. The southern limit of the area of thinnest crust strikesobliquely away from the alignment of marine depressions, in a south-eastward direction from the Central Basin towards the Imrali Island.
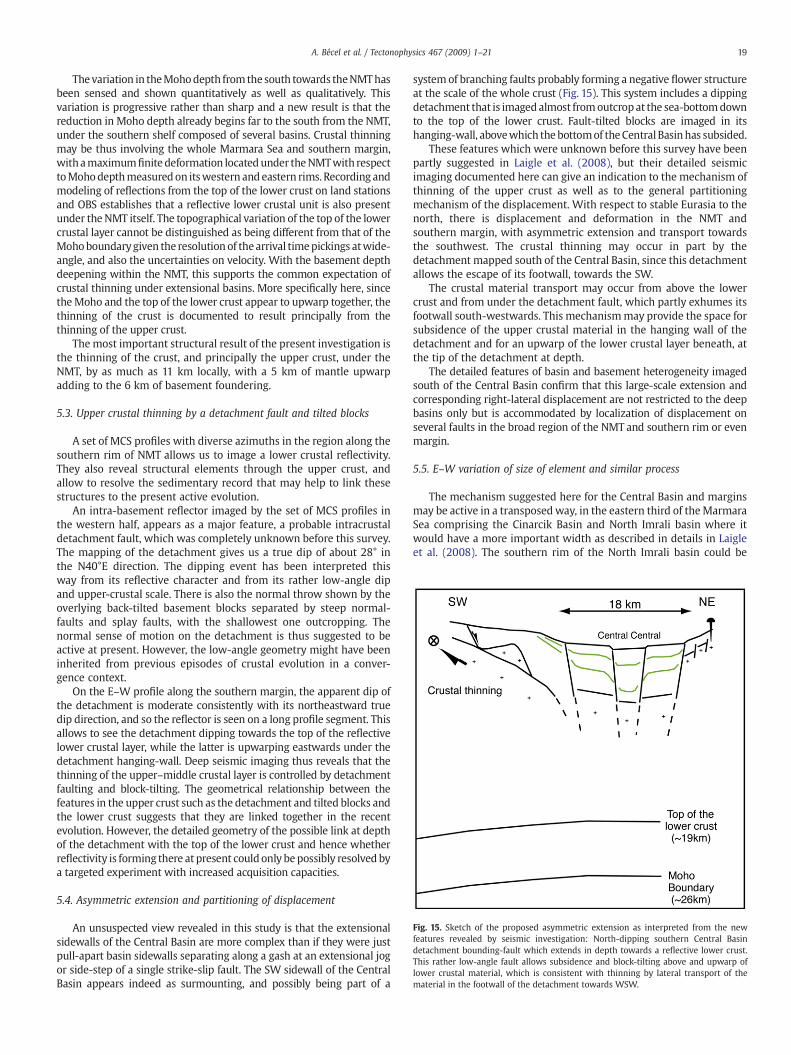
Fig. 15. Sketch of the proposed asymmetric extension as interpreted from the newfeatures revealed by seismic investigation: North-dipping southern Central Basindetachment bounding-fault which extends in depth towards a reflective lower crust.This rather low-angle fault allows subsidence and block-tilting above and upwarp oflower crustal material, which is consistent with thinning by lateral transport of thematerial in the footwall of the detachment towards WSW.
19A. Bécel et al. / Tectonophysics 467 (2009) 1–21
Thevariation in theMohodepth fromthe south towards theNMThasbeen sensed and shown quantitatively as well as qualitatively. Thisvariation is progressive rather than sharp and a new result is that thereduction in Moho depth already begins far to the south from the NMT,under the southern shelf composed of several basins. Crustal thinningmay be thus involving the whole Marmara Sea and southern margin,withamaximumfinite deformation locatedunder theNMTwith respecttoMohodepthmeasuredon itswestern andeastern rims. Recording andmodeling of reflections from the top of the lower crust on land stationsand OBS establishes that a reflective lower crustal unit is also presentunder the NMT itself. The topographical variation of the top of the lowercrustal layer cannot be distinguished as being different from that of theMohoboundarygiven the resolutionof thearrival timepickings atwide-angle, and also the uncertainties on velocity. With the basement depthdeepening within the NMT, this supports the common expectation ofcrustal thinning under extensional basins. More specifically here, sincetheMoho and the top of the lower crust appear to upwarp together, thethinning of the crust is documented to result principally from thethinning of the upper crust.
The most important structural result of the present investigation isthe thinning of the crust, and principally the upper crust, under theNMT, by as much as 11 km locally, with a 5 km of mantle upwarpadding to the 6 km of basement foundering.
5.3. Upper crustal thinning by a detachment fault and tilted blocks
A set of MCS profiles with diverse azimuths in the region along thesouthern rim of NMT allows us to image a lower crustal reflectivity.They also reveal structural elements through the upper crust, andallow to resolve the sedimentary record that may help to link thesestructures to the present active evolution.
An intra-basement reflector imaged by the set of MCS profiles inthe western half, appears as a major feature, a probable intracrustaldetachment fault, which was completely unknown before this survey.The mapping of the detachment gives us a true dip of about 28° inthe N40°E direction. The dipping event has been interpreted thisway from its reflective character and from its rather low-angle dipand upper-crustal scale. There is also the normal throw shown by theoverlying back-tilted basement blocks separated by steep normal-faults and splay faults, with the shallowest one outcropping. Thenormal sense of motion on the detachment is thus suggested to beactive at present. However, the low-angle geometry might have beeninherited from previous episodes of crustal evolution in a conver-gence context.
On the E–W profile along the southern margin, the apparent dip ofthe detachment is moderate consistently with its northeastward truedip direction, and so the reflector is seen on a long profile segment. Thisallows to see the detachment dipping towards the top of the reflectivelower crustal layer, while the latter is upwarping eastwards under thedetachment hanging-wall. Deep seismic imaging thus reveals that thethinning of the upper–middle crustal layer is controlled by detachmentfaulting and block-tilting. The geometrical relationship between thefeatures in the upper crust such as the detachment and tilted blocks andthe lower crust suggests that they are linked together in the recentevolution. However, the detailed geometry of the possible link at depthof the detachment with the top of the lower crust and hence whetherreflectivity is forming there at present could only bepossibly resolved bya targeted experiment with increased acquisition capacities.
5.4. Asymmetric extension and partitioning of displacement
An unsuspected view revealed in this study is that the extensionalsidewalls of the Central Basin are more complex than if they were justpull-apart basin sidewalls separating along a gash at an extensional jogor side-step of a single strike-slip fault. The SW sidewall of the CentralBasin appears indeed as surmounting, and possibly being part of a
system of branching faults probably forming a negative flower structureat the scale of the whole crust (Fig. 15). This system includes a dippingdetachment that is imagedalmost fromoutcrop at the sea-bottomdownto the top of the lower crust. Fault-tilted blocks are imaged in itshanging-wall, abovewhich thebottomof theCentral Basinhas subsided.
These features which were unknown before this survey have beenpartly suggested in Laigle et al. (2008), but their detailed seismicimaging documented here can give an indication to the mechanism ofthinning of the upper crust as well as to the general partitioningmechanism of the displacement. With respect to stable Eurasia to thenorth, there is displacement and deformation in the NMT andsouthern margin, with asymmetric extension and transport towardsthe southwest. The crustal thinning may occur in part by thedetachment mapped south of the Central Basin, since this detachmentallows the escape of its footwall, towards the SW.
The crustal material transport may occur from above the lowercrust and from under the detachment fault, which partly exhumes itsfootwall south-westwards. This mechanismmay provide the space forsubsidence of the upper crustal material in the hanging wall of thedetachment and for an upwarp of the lower crustal layer beneath, atthe tip of the detachment at depth.
The detailed features of basin and basement heterogeneity imagedsouth of the Central Basin confirm that this large-scale extension andcorresponding right-lateral displacement are not restricted to the deepbasins only but is accommodated by localization of displacement onseveral faults in the broad region of the NMT and southern rim or evenmargin.
5.5. E–W variation of size of element and similar process
The mechanism suggested here for the Central Basin and marginsmay be active in a transposedway, in the eastern third of theMarmaraSea comprising the Cinarcik Basin and North Imrali basin where itwould have a more important width as described in details in Laigleet al. (2008). The southern rim of the North Imrali basin could be
20 A. Bécel et al. / Tectonophysics 467 (2009) 1–21
viewed as a detachment normal-fault. In its hanging-wall, the Cinarcikbasin may subside between conjugate normal faults, as in a rotationalglide-block system (e.g. Groshong, 1990). This has also a pull-apartcharacter in 3D, with the changing strike of the bounding faults.Extensional sidewalls of the Central and Cinarcik Basin could thus beconsidered as intra-basins faults of the NMT, with tilted blocks ofdifferent sizes on their southwestern rim.
South of the Central Basin, the detachment is too shallow forhaving in its hanging-wall a tilted basement block as it appears southof the Cinarcik basin where the North Imrali basin is established.
In the whole North Marmara Sea, the deformation seems par-titioned asymmetrically and occurring with similar processes with,along the NMT, a change of size of its elements that relay one anotherand change strike along transfer zones. The geometry of the faultsystem can be regarded as a broad flower structure at crustal or evenlithospheric scale.
5.6. Elements of a principal displacement zone in horizontal plane shearstrain
At the scale of the two hundred kilometers length of the Sea ofMarmara and of several tens of kilometers of relative strike-slipdisplacement across it, it is not only the basement but also the wholelithosphere that is revealed to be activated. This is shown by othermarkers of deformation than the subsidence of basins, that can beaccessed with the deep seismic penetration and imaging, such as thechange in topography of deeper levels, like the top of the lower crust andthe Moho.
Previous interpretations of the Sea of Marmara could only usedepth-limited observations recalled in the introduction such as the seabottom swath-bathymetry and reflection seismic sections limited todepth by the sea bottom multiple. They have emphasized modelelements as diverse as the importance of extension (Aksu et al., 2000;Parke et al., 2002; Yaltirak, 2002), block or plate-like junctions orgeometry (Okayet al., 2000), pull-apart or transtensional jog activity atdiverse scales (Armijo et al., 2002), evolution to strike-slip localization(Le Pichon et al., 2001). The new seismic observations from theSEISMARMARA Leg-1 survey lead us to embed them in a broader anddeeper context. The original insights through the whole crust broughtby the data presented here allow to suggest a consistent model ofthinning, extension and transtension at the scale of the lithosphere.The Sea of Marmara can indeed be regarded as a large negative flowerstructure at the scale of thewhole crust where the principal amount offinite deformation is localized at depth under the North MarmaraTrough.
The diverse nature and orientation of the different faults andstructure can be viewed as the evolution of a principal displacementzone resulting from horizontal plane simple-shear applied at depth atlithospheric scale as suggested by the large-scale dimension andpropagation of the North Anatolian Fault (Laigle et al., 2008).
The crustal thinning newly evidenced here would involveprincipally the North Marmara Trough but also affect its southernmargin, the whole Marmara Sea. This is suggested to occur in part bythe detachment mapped south of the Central Basin, allowing theescape of upper crustal material in its footwall. With respect to stableEurasia to the north, there is displacement and deformation in theNMT and southern margin, with an asymmetric extension, a parti-tioning of displacement and with a transport of material towards thesouthwest.
Acknowledgements
The SEISMARMARA seismic experiment was operated as a jointintegrated project between Turkish and French scientists, researchinstitutions and universities, technical facilities, and funding agencies,coordinated by TUBITAK in Turkey (Naci Görür) and INSU-CNRS in
France (Rolando Armijo). N/O Nadir and the seismic source andstreamer operated by IFREMER/GENAVIR were allocated in the frameof a special extension of deadline for the regular call for proposals foruse of these French national facilities. The OBS provided and operatedby ISV Hokkaido, Japan, as well as the land refraction stations of theINSU pool were funded by ACI CATNAT of the French Ministry ofEducation and Research, with additional support and personnel ofthese institutions and of Turkish ones coordinated by TUBITAK. R/VSismik 1 of MTA was operated for TUBITAK, who also funded Turkishparticipation to all other aspects, in the frame of the cooperativeTurkish–French program following the destructive earthquakes,coordinated by Naci Görür and Rolando Armijo. MCS Processing hasbeen donewith the Geovecteur software of CGG at the CNRS-IPGParis,PROMAX at the University of Pau. We thank the masters and crews ofN/O Nadir, R/V Sismik, the scientific and technical teams of the MCS,OBS and land stations deployments, as well as data recovery andprocessing. The Shipboard Party comprised in addition S. Bazin, S.Cetin, S. Singh, A. Vigner, and R. Saatcilar. We acknowledge the criticalcomments of Pr. E. Flueh and anonymous journal reviewers IPGPcontribution 2462.
References
Aksu, A.E., Hiscott, R.N., Yasar, D., 1999. Oscillating Quaternary water levels of theMarmara Sea and vigorous outflow into the Aegean Sea from the Marmara Sea-Black Sea drainage corridor. Mar. Geol. 153, 275–302.
Aksu, A.E., Calon, T.J., Hiscott, R.N., Yasar, D., 2000. Anatomy of the North Anatolian faultzone in the Marmara Sea, western Turkey. GSA Today 10 (6), 3–7.
Armijo, R., Meyer, B., Hubert, A., Barka, A., 1999. Westward propagation of the NorthAnatolian Fault into the northern Aegean: timing and kinematics. Geology 27,267–270.
Armijo, R., Meyer, B., Navarro, S., King, G., Barka, A., 2002. Asymmetric slip partitioningin the Sea of Marmara pull-apart: a clue to propagation processes of the NorthAnatolian Fault? Terranova 14, 80–86.
Armijo, R., Flerit, F., King, G., Meyer, B., 2003. Linear elastic fracture mechanics explainsthe past and the present evolution of the Aegean. EPSL 217, 85–95.
Avedik, F., Nicolich, R., Hirn, A., Maltezou, F., Mc Bride, J., Cernobori, L., the STREAMERSPROFILES GROUP, 1995. Appraisal of a new high-energy, low frequency seismicpulse generating method on a deep seismic reflection profile in the CentralMediterranean Sea. First Break 13, 277–290.
Avedik, F., Hirn, A., Renard, V., Nicolich, R., Olivet, J.L., Sachpazi, M., 1996. Single-bubble”marine source offers new perspectives for lithospheric exploration. Tectonophysics267, 57–71.
Bécel, A., 2006, Structure Sismique de la Faille Nord Anatolienne en Mer de Marmara,Phd Thesis, Institut de Physique du Globe de Paris.
Bécel, A., Charvis, P., de Voogd, B., Galve, A., Hirn, A., Laigle, M., Lepine, J., Murai, Y.,Ozalaybey, S., Sapin, M., Shimamura, H., Singh, S., Taymaz, T., 2004. Seismic structureand activity of North Anatolian Fault in the Sea ofMarmara from the Seismarmara Leg1 Seismic Survey, EOS Trans., 85(47), Fall Meetng., Suppl., Abstract, S52A-04.
Carton, H., 2004. Testing different seismic sources for academic marine investigation ofthe subsurface. Lithos Sci. Rep. 6, 81–87.
Clément, C., Sachpazi, M., Charvis, P., Graindorge, D., Laigle, M., Hirn, A., Zafiropoulos, G.,2004. Reflection–refraction seismics in the Gulf of Corinth: hints at deep structureand control of the deep marine basin. Tectonophysics 391, 97–108.
Demirbag, E., Rangin, C., Le Pichon, X., Sengor, A.M.C., 2003. Investigation of the tectonics ofthe Main Marmara Fault by means of deep-towed seismic data. Tectonophysics 361,1–19.
Ergun, M., Ozel, E., 1995. Structural relationship between the Sea of Marmara Basin andthe North Anatolian Fault Zone. Terra Nova 7, 278–288.
Flerit, F., Armijo, R., King, G.C.P., Meyer, B., Barka, A., 2003. Slip partitioning in the Sea ofMarmara pull-apart determined from GPS velocity vectors. Geophys. J. Int. 154, 1–7.
Flerit, F., Armijo, R., King, G., Meyer, B., 2006. Which mechanical model for the Sea ofMarmara releasing bend? Geophys. Res. Abstr. (EGU 2006) 8, 06496.
Gibbs, A.D., 1984. Structural evolution of extensional basin margins. J. geol. Soc. London141, 609–620.
Görur, Okay, A.I., 1996. A fore-arc origin for the Thrace Basin, NW Turkey. Geol. Rundsch.85, 662–668.
Groshong, R., 1990. Unique determination of normal fault shape from hanging-wall bedgeometry in detached half grabens. Eclogae geol. Helv. 83, 455–471.
Hirn, A., and 36 others, Seismarmara 2001, 2002. Amarine survey and onshore–offshoreartificial source and natural earthquakes in the seismogenic regions of the Sea ofMarmara. Abstract Volume, p. 9 1st International Symposium of Istanbul TechnicalUniversity on Earth Science and Engineering, Istanbul, 16–18 May 2002.
Hirn, A., the SEISMARMARA Team, 2003. Elements of structure at crustal scale under theSea of Marmara frommultichannel seismics of the SEISMARMARA survey. Geophys.Res. Abstr. 5, 13126.
Imren, C., Le Pichon, X., Rangin, C., Demirbag, E., Ecevitoglu, B., Görür, N., 2001. TheNorth Anatolian Fault within the Sea of Marmara: a new interpretation based on

21A. Bécel et al. / Tectonophysics 467 (2009) 1–21
multi-channel seismic andmulti-beam bathymetry data. Earth Planet. Sci. Lett. 186,143–158.
Klemperer, S.L., Hauge, T.A., Hauser, E.C., Oliver, J.E., Potter, C.J., 1986. The Moho in thenorthern Basin and Range, Nevada, along the COCORP 40oN seismic-reflectiontransect. Geol. Soc. Am. Bull. 97, 603–618.
Laigle, M., Hirn, A., Sachpazi, M., Roussos, N., 2000. North Aegean crustal deformation: anew active fault imaged to 10 km depth by marine reflection seismics. Geology 28,71–74.
Laigle, M., Bécel, A., de Voogd, B., Hirn, A., Taymaz, T., Ozalaybey, S., the Members of theSEISMARMARA Leg1, 2008. A first deep seismic survey in the Sea of Marmara:whole crust and deep basins. Earth Planet. Sci. Lett. 270, 168–179.
Le Pichon, X., Sengör, A.M.C., Demirbag, E., Rangin, C., Imren, C., Armijo, R., Görür, N.,Cagatay, N., Mercier de Lepinay, B., Meyer, B., Saatcilar, R., Tok, B., 2001. The activeMain Marmara Fault. Earth Planet. Sci. Lett. 192, 595–616.
McClusky, S., Bassalanian, S., Barka, A., Demir, C., Ergintav, S., Georgiev, I., Gurkan, O.,Hamburger, M., Hurst, K., Hans-Gert, H.-G., Karstens, K., Kekelidze, G., King, R., Kotzev,V., Lenk, O.,Mahmoud, S.,Mishin, A., Nadariya,M., Ouzounis, A., Paradissis, D., Peter, Y.,Prilepin, M., Relinger, R., Sanli, I., Seeger, H., Tealeb, A., Toksaz, M.N., Veis, G., 2000.Global Positioning systemconstraints onplate kinematics anddynamics in the easternMediterranean and Caucasus. J. Geophys. Res. 105 (B3), 5695–5719.
Okay, A.I., Satir, M., Maluski, H., Siyako, M., Monie, P., Metzger, R., Akyuz, S., 1996. Paleo-and Neo-Tethyan events in northwest Turkey: geological and geochronologicalconstraints. In: Yin, A., Harrison, M. (Eds.), Tectonic Evolution of Asia. CambridgeUniv. Press, New York, pp. 420–441.
Okay, A.I., Demirbag, E., Kurt, H., Okay, N.A., Kuscu, I., 1999. An active deepmarine strike-slip basin along the North Anatolian Fault in Turkey. Tectonics 18, 129–147.
Okay, A.I., Kazlilar-Ozcan, A., Imren, C., Boztepe-Güney, A., Demirbag, E., Kuscu, I., 2000.Active faults and evolving strike-slip basins in the Marmara Sea, northwest Turkeyfrom a multichannel seismic reflection study. Tectonophysics 321, 189–218.
Parke, J.R., White, R.S., McKenzie, D., Minshull, T.A., Bull, J.M., Kuscu, I., Gorur, N., Sengor,C., 2002. Interaction between faulting and sedimentation in the Sea of Marmara,western Turkey. J. Geophys. Res. Solid Earth 107 art. no.-2286.
Reilinger, R.E., McClusky, S.C., Oral, M.B., King, R.W., Toksoz, M.N., Barka, A.A., Kinik, I.,Lenk, O., Sanli, I., 1997. Global Positioning System measurements of present-daycrustal movements in the Arabia–Africa–Eurasia plate collision zone. J. Geophys.Res. 102, 9983–9999.
Sachpazi, M., Hirn, A., Clément, C., Laigle, M., Roussos, N., 2003. Evolution to fastestopening of the Gulf of Corinth continental rift from deep seismic profiles. EarthPlanet. Sci. Lett. 216, 243–257.
Sartoretti, M., 2003, Inversion interactive, et caractérisation des incertitudes structur-ales en milieux géologiques complexes, à partir de données de sismique réflexion,Phd Thesis, Université de Pau.
Smith, A.D., Taymaz, T., Oktay, F., Tüce, H., Alpar, Basaran, H., Jackson, J.A., Kara, S.,Simsek, M., 1995. High-resolution seismic profiling in the Sea of Marmara(northwest Turkey): Late Quaternary sedimentation and sea-level changes. Geol.Soc. Amer. Bull. 107, 923–936.
Straub, C., Kahle, H., Schindler, C., 1997. GPS and geologic estimates of the tectonicactivity in the Marmara Sea region, NW Anatolia. J. Geophys. Res. 102 (27), 587-27601.
Vigner, A., 2002. Images sismiques par réflexions verticale et grand-angle de la croûteen contexte extensif: les Cyclades et le Fossé Nord-Egéen, Phd Thesis, Institut dePhysique du Globe de Paris.
Wong, H.K., Ludmann, T., Ulug, A., Görur, N., 1995. The Sea of Marmara: a plate boundarysea in an escape tectonic regime. Tectonophysics 244, 231–250.
Yaltirak, C., 2002. Tectonic evolution of the Marmara Sea and its surroundings. MarineGeol. 190, 493–523.
Yilmaz, Y., Tuysuz, O., Yigitbas, E., Genc, S.C., Sengor, A.M.C., 1997. Geology and tectonicevolution of the Pontides. In: Robinson, A.C. (Ed.), Regional and Petroleum Geologyof the Black Sea and Surrounding Region. AAPG Mem., 68, pp. 183–186.
Zelt, C., Smith, R.B., 1992. Seismic traveltime inversion for 2D crustal velocity structure.Geophys. J. Int. 108, 16–34.
Zelt, B., Taylor, B., Sachpazi, S., Hirn, A., 2005. Crustal velocity and Moho structurebeneath the Gulf of Corinth, Greece. Geophys. J. Int. 162, 257–268.
Related Documents