OECD WORKSHOP ON COMPETITIVE CITIES AND CLIMATE CHANGE: CHALLENGES AND OPPORTUNITIES International Energy Agency, Paris - 30 November 2007 Ivana Capozza, Marco Magrassi Ministry of Economic Development Evaluation Unit Climate change mitigation policy at city level: the Italian experience

OECD WORKSHOP ON COMPETITIVE CITIES AND CLIMATE CHANGE: CHALLENGES AND OPPORTUNITIES International Energy Agency, Paris - 30 November 2007 Ivana Capozza,
Dec 14, 2015
Welcome message from author
This document is posted to help you gain knowledge. Please leave a comment to let me know what you think about it! Share it to your friends and learn new things together.
Transcript

OECD WORKSHOP ON COMPETITIVE CITIES AND CLIMATE CHANGE: CHALLENGES AND OPPORTUNITIES
International Energy Agency, Paris - 30 November 2007
Ivana Capozza, Marco MagrassiMinistry of Economic Development
Evaluation Unit
Climate change mitigation policy at city level:
the Italian experience
Outline
Climate change impact on Italian cities
Greenhouse gas emissions at national and urban levels in Italy
Attitudes of municipalities in dealing with environmental and climate change issues
Examples on energy and transport
EU funds

Climate change impact on Italian cities
Average temperature 1961-90 Average temperature 2007 Average change
Average temperature Jan-Jun 2007 Average temperature: a comparison 1961/90 – 1997/2007
2007 has been exceptional, but there is an overall negative trend
Heat waves + tropical nights affect every day life and have negative health impacts
Greenhouse gas emissions
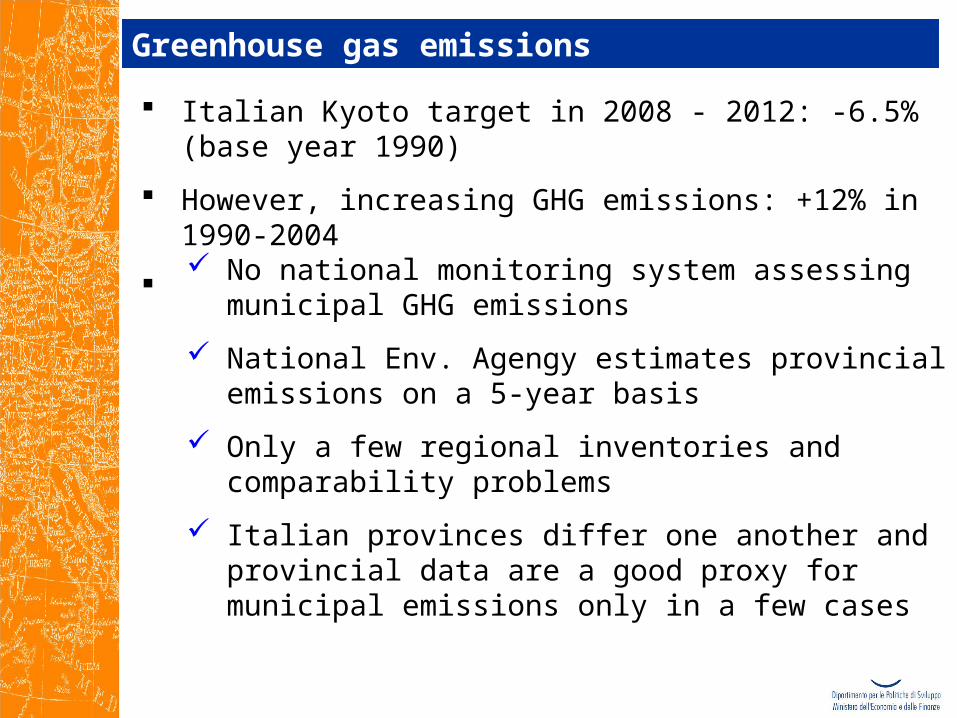
Italian Kyoto target in 2008 - 2012: -6.5% (base year 1990)
However, increasing GHG emissions: +12% in 1990-2004
Emissions at city level? Problems
No national monitoring system assessing municipal GHG emissions
National Env. Agengy estimates provincial emissions on a 5-year basis
Only a few regional inventories and comparability problems
Italian provinces differ one another and provincial data are a good proxy for municipal emissions only in a few cases
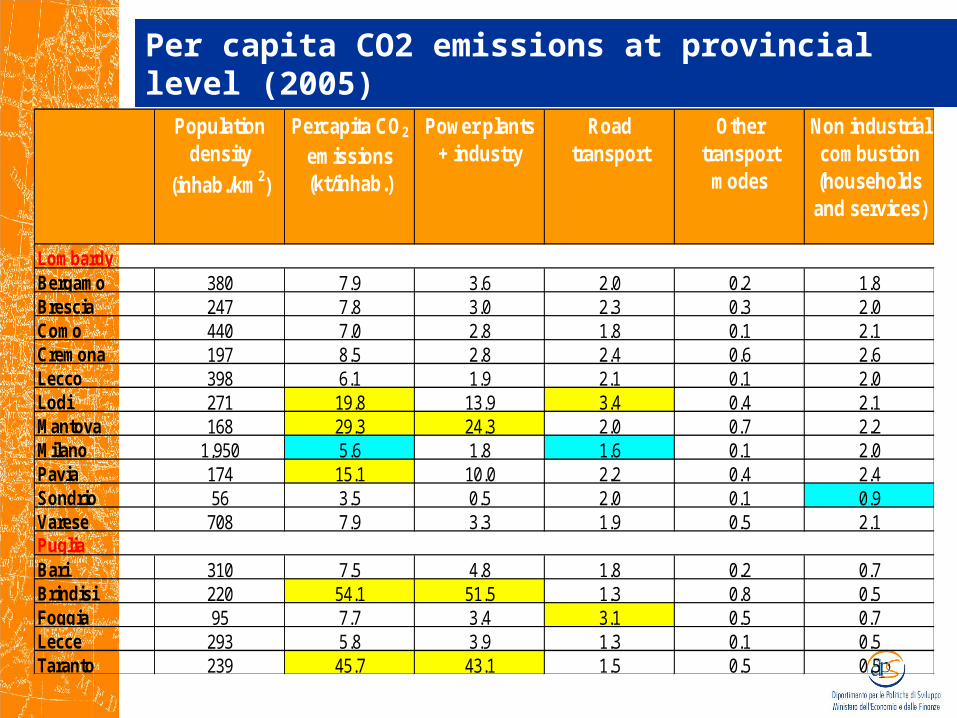
Per capita CO2 emissions at provincial level (2005)
Population density
(inhab./km2)
Percapita CO2
emissions (kt/inhab.)
Power plants + industry
Road transport
Other transport
modes
Non industrial combustion (households and services)
Bergamo 380 7.9 3.6 2.0 0.2 1.8Brescia 247 7.8 3.0 2.3 0.3 2.0Como 440 7.0 2.8 1.8 0.1 2.1Cremona 197 8.5 2.8 2.4 0.6 2.6Lecco 398 6.1 1.9 2.1 0.1 2.0Lodi 271 19.8 13.9 3.4 0.4 2.1Mantova 168 29.3 24.3 2.0 0.7 2.2Milano 1,950 5.6 1.8 1.6 0.1 2.0Pavia 174 15.1 10.0 2.2 0.4 2.4Sondrio 56 3.5 0.5 2.0 0.1 0.9Varese 708 7.9 3.3 1.9 0.5 2.1
Bari 310 7.5 4.8 1.8 0.2 0.7Brindisi 220 54.1 51.5 1.3 0.8 0.5Foggia 95 7.7 3.4 3.1 0.5 0.7Lecce 293 5.8 3.9 1.3 0.1 0.5Taranto 239 45.7 43.1 1.5 0.5 0.5
Lombardy
Puglia
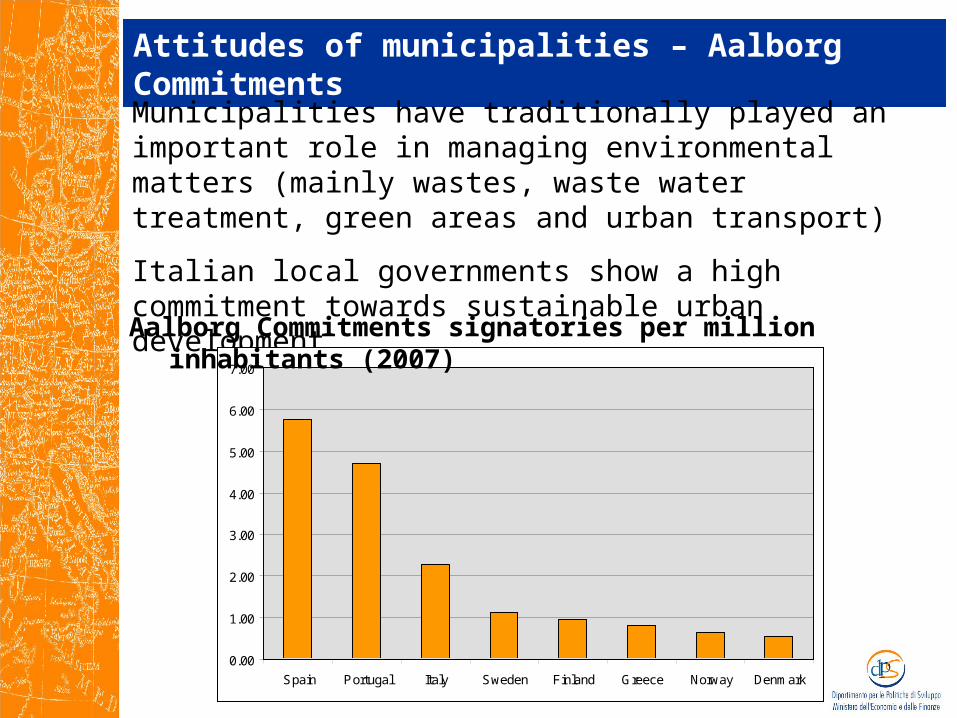
Attitudes of municipalities – Aalborg Commitments
Municipalities have traditionally played an important role in managing environmental matters (mainly wastes, waste water treatment, green areas and urban transport)
Italian local governments show a high commitment towards sustainable urban development
0.00
1.00
2.00
3.00
4.00
5.00
6.00
7.00
Spain Portugal Italy Sweden Finland Greece Norway Denmark
Aalborg Commitments signatories per million inhabitants (2007)

1452 local governments have started a LA21 planning process (75% municipalities)
78% abandoning rate (financial reasons)
85% are in Central and Northern Italy
Action plan implementation is ongoing in some 30% of cases
19% LA21 take account of Kyoto targets
2% of local governments involved in LA21 also have a specific climate change programme
Attitudes of municipalities – Local Agenda 21

Attitudes of municipalities
Public investments in urban or light railways in some major cities (Milan, Rome, Naples)
Municipal energy plans
Several support measures for “clean” energy, industrial and household efficiency, sustainable transport at central and regional level
No comprehensive and specific climate change policy at urban level, but
Sector-specific approach, focusing on energy and urban transport, non necessarily linked to climate concerns, e.g:
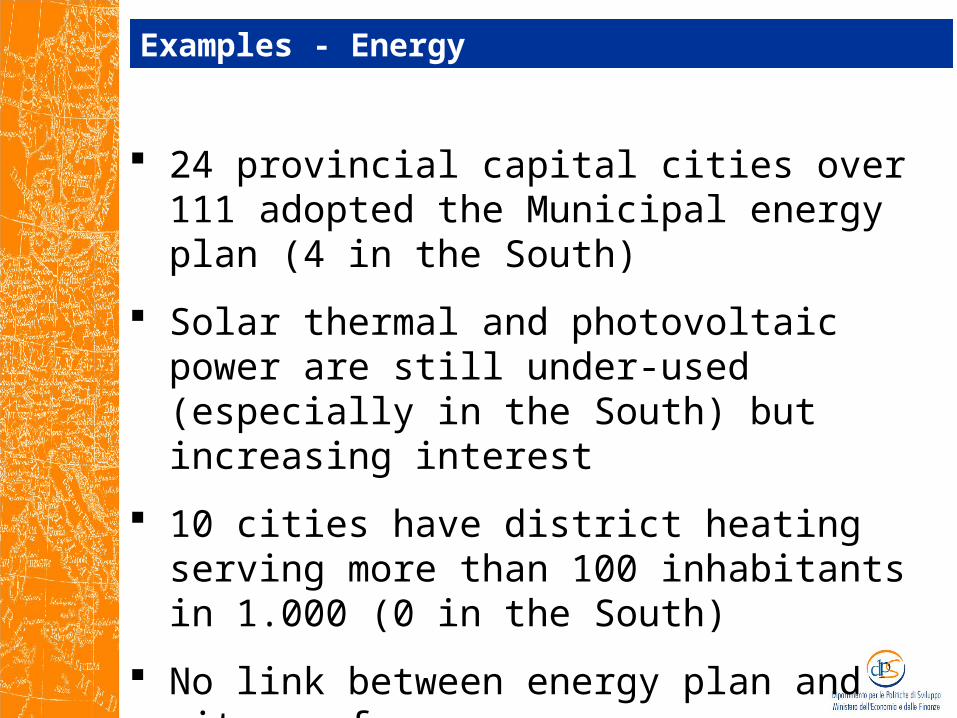
Examples - Energy
24 provincial capital cities over 111 adopted the Municipal energy plan (4 in the South)
Solar thermal and photovoltaic power are still under-used (especially in the South) but increasing interest
10 cities have district heating serving more than 100 inhabitants in 1.000 (0 in the South)
No link between energy plan and city performance
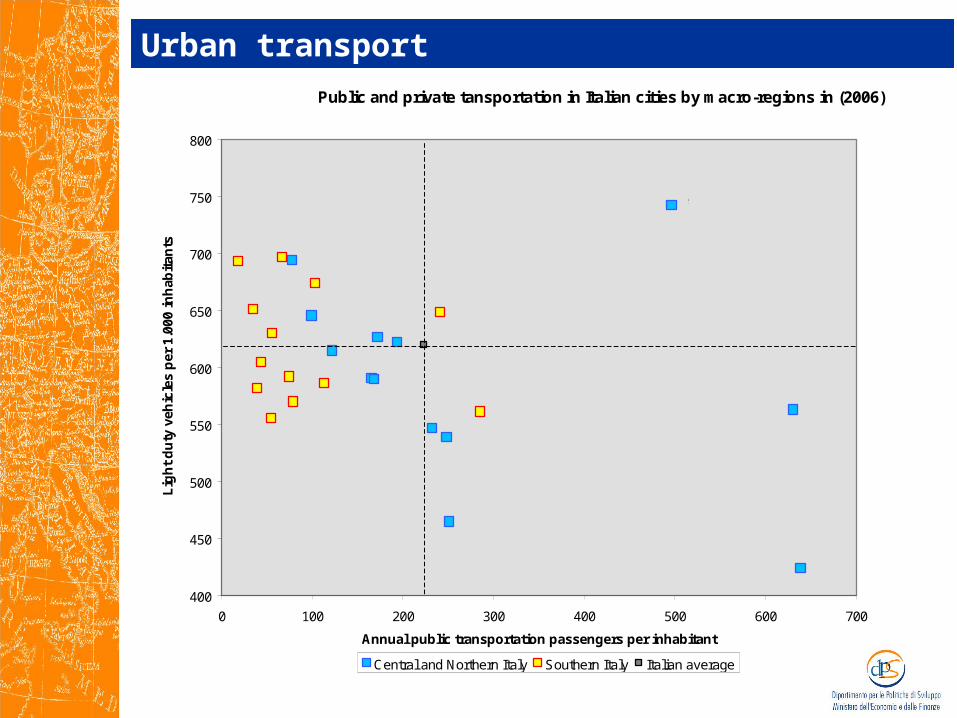
Urban transportPublic and private tansportation in Italian cities by macro-regions in (2006)
400
450
500
550
600
650
700
750
800
0 100 200 300 400 500 600 700
Annual public transportation passengers per inhabitant
Lig
ht
du
ty v
ehic
les
per
1.0
00 i
nh
abit
ants
Central and Northern Italy Southern Italy Italian average
Milan
Venice
Rome
Bari
Perugia
Genova
Naples
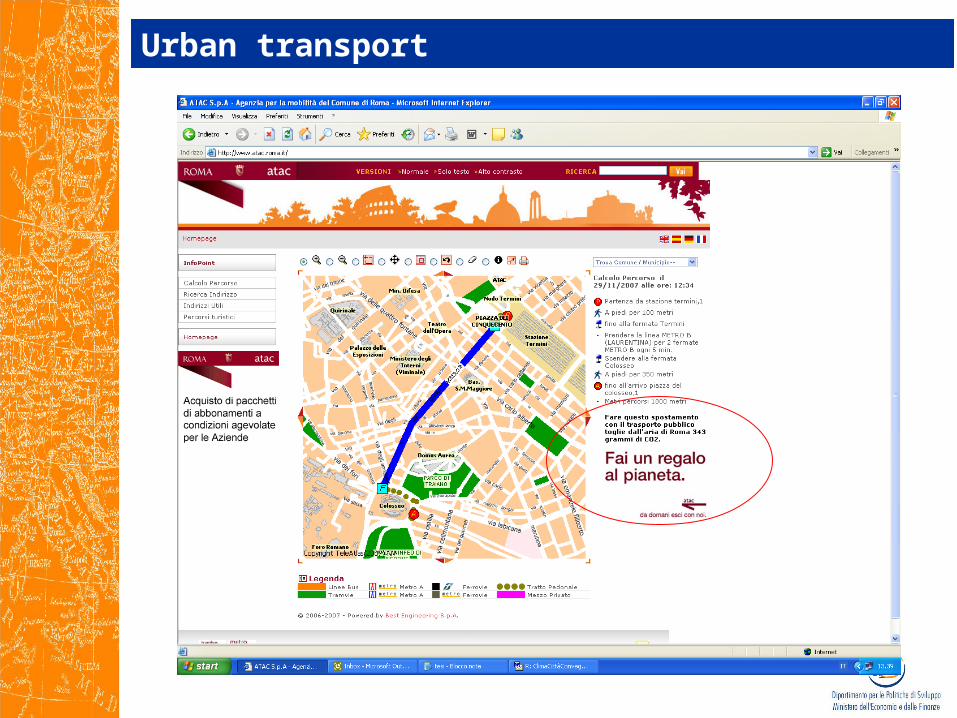
Urban transport
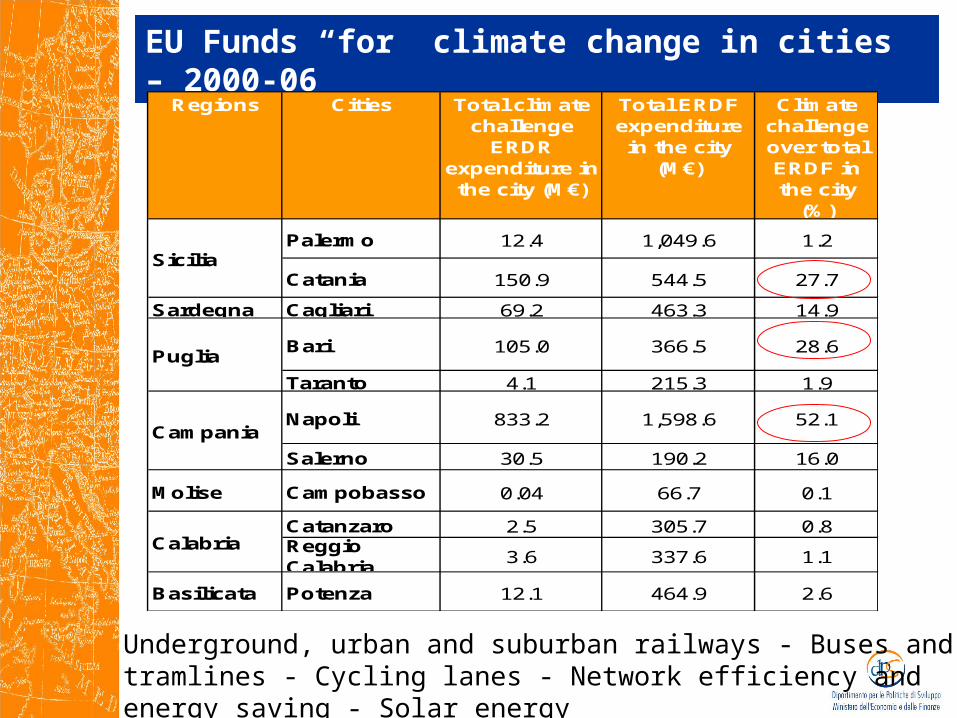
EU Funds “for” climate change in cities – 2000-06
Regions Cities Total climate challenge
ERDR expenditure in the city (M€)
Total ERDF expenditure in the city
(M€)
Climate challenge over total ERDF in the city
(%)
Sardegna Cagliari 69.2 463.3 14.9
Taranto 4.1 215.3 1.9
Molise Campobasso 0.04 66.7 0.1
Puglia
Calabria
Basilicata Potenza
Reggio Calabria
Catanzaro
Salerno
NapoliCampania
12.4
105.0
30.5
Sicilia
Bari
Catania
Palermo 1,049.6 1.2
150.9 544.5 27.7
366.5 28.6
833.2 1,598.6 52.1
190.2 16.0
2.5 305.7 0.8
3.6 337.6 1.1
12.1 464.9 2.6
Underground, urban and suburban railways - Buses and tramlines - Cycling lanes - Network efficiency and energy saving - Solar energy
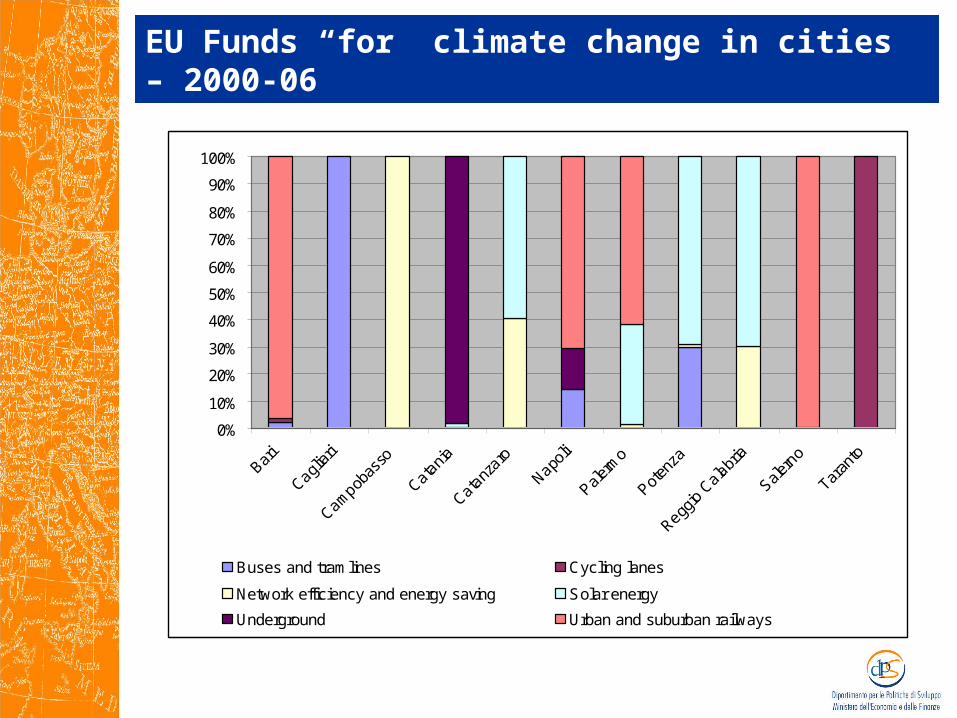
EU Funds “for” climate change in cities – 2000-06
0%
10%
20%
30%
40%
50%
60%
70%
80%
90%
100%
Bari
Cagliar
i
Campobas
so
Catania
Catanz
aro
Napoli
Palerm
o
Poten
za
Reggio
Calabria
Salern
o
Taran
to
Buses and tramlines Cycling lanes
Network efficiency and energy saving Solar energy
Underground Urban and suburban railways
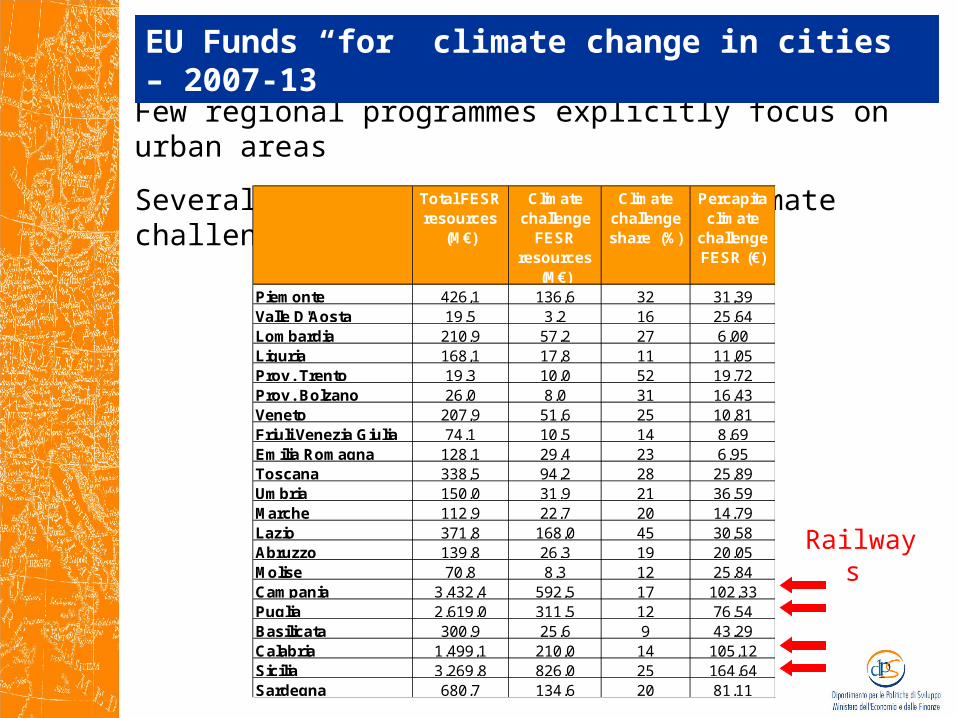
Few regional programmes explicitly focus on urban areas
Several matters can go under the climate challenge headingTotal FESR resources
(M€)
Climate challenge
FESR resources
(M€)
Climate challenge share (%)
Percapita climate
challenge FESR (€)
Piemonte 426,1 136,6 32 31,39Valle D'Aosta 19,5 3,2 16 25,64Lombardia 210,9 57,2 27 6,00Liguria 168,1 17,8 11 11,05Prov. Trento 19,3 10,0 52 19,72Prov. Bolzano 26,0 8,0 31 16,43Veneto 207,9 51,6 25 10,81Friuli Venezia Giulia 74,1 10,5 14 8,69Emilia Romagna 128,1 29,4 23 6,95Toscana 338,5 94,2 28 25,89Umbria 150,0 31,9 21 36,59Marche 112,9 22,7 20 14,79Lazio 371,8 168,0 45 30,58Abruzzo 139,8 26,3 19 20,05Molise 70,8 8,3 12 25,84Campania 3.432,4 592,5 17 102,33Puglia 2.619,0 311,5 12 76,54Basilicata 300,9 25,6 9 43,29Calabria 1.499,1 210,0 14 105,12Sicilia 3.269,8 826,0 25 164,64Sardegna 680,7 134,6 20 81,11
EU Funds “for” climate change in cities – 2007-13
Railways

Conclusions
Patchwork geography of local climate challenge policies
Difficulties in having an overall picture
Few cities appear to be really committed
Sectoral views and scarce financial resources: different thematic strategies are perceived as alternative investments
Investments and actions are mainly linked to economic and social concerns
Opportunities: something is moving
Increasing interest and policy tools and resources made available by central and regional governments
Cities can use these tools withing an integrated approach
It is a question of management capacity and governance
Related Documents