OANDO PLC Annual reports Consolidated and separate financial statements 31 December, 2014

Welcome message from author
This document is posted to help you gain knowledge. Please leave a comment to let me know what you think about it! Share it to your friends and learn new things together.
Transcript

OANDO PLC
Annual reports
Consolidated and separate financial statements
31 December, 2014
OANDO PLC
Annual reports and consolidated financial statements
For the year ended 31 December 2014
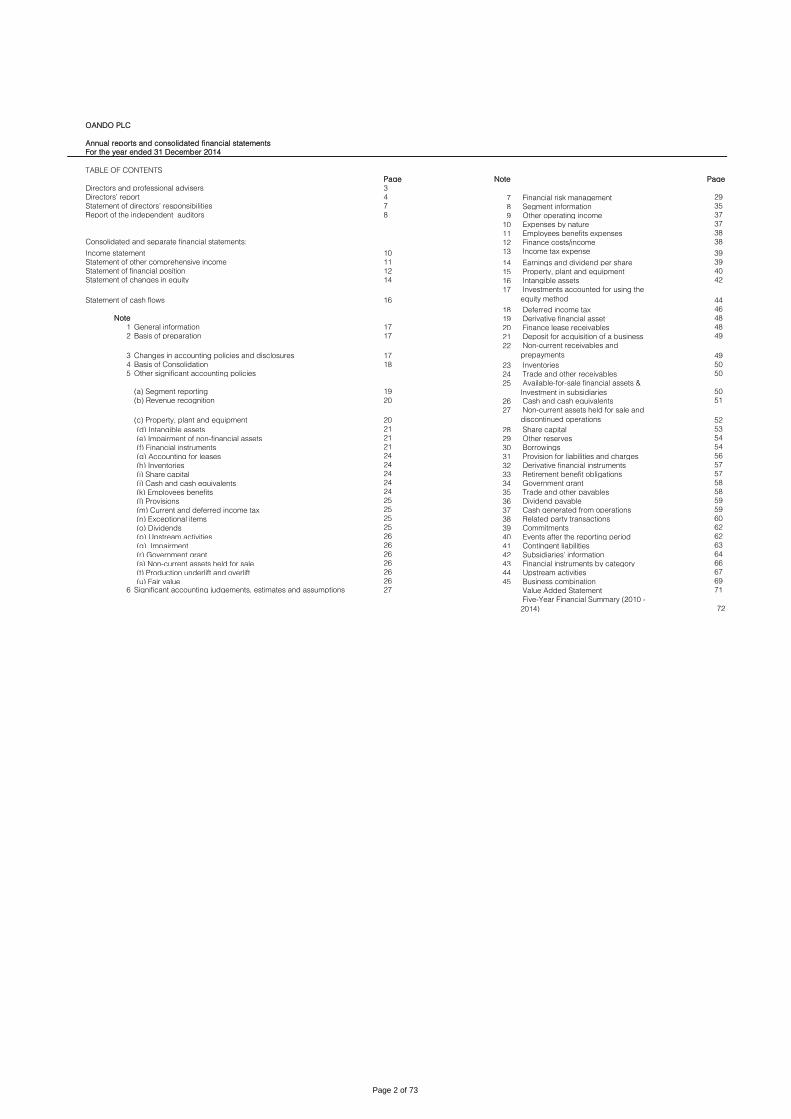
TABLE OF CONTENTS
Page Note Page
Directors and professional advisers 3
Directors’ report 4 7 29
Statement of directors’ responsibilities 7 8 35
Report of the independent auditors 8 9 37
10 37
11 38
Consolidated and separate financial statements: 12 38
Income statement 10 13 39
Statement of other comprehensive income 11 14 39
Statement of financial position 12 15 40
Statement of changes in equity 14 16 42
Statement of cash flows 16
17
44
18 46
Note 19 48
1 General information 17 20 48
2 Basis of preparation 17 21 49
3 Changes in accounting policies and disclosures 17
22
49
4 Basis of Consolidation 18 23 50
5 Other significant accounting policies 24 50
(a) Segment reporting 1925
50
(b) Revenue recognition 20 26 51
(c) Property, plant and equipment 20
27
52
(d) Intangible assets 21 28 53
(e) Impairment of non-financial assets 21 29 54
(f) Financial instruments 21 30 54
(g) Accounting for leases 24 31 56
(h) Inventories 24 32 57
(i) Share capital 24 33 57
(j) Cash and cash equivalents 24 34 58
(k) Employees benefits 24 35 58
(l) Provisions 25 36 59
(m) Current and deferred income tax 25 37 59
(n) Exceptional items 25 38 60
(o) Dividends 25 39 62
(p) Upstream activities 26 40 62
(q) Impairment 26 41 63
(r) Government grant 26 42 64
(s) Non-current assets held for sale 26 43 66
(t) Production underlift and overlift 26 44 67
(u) Fair value 26 45 69
6 Significant accounting judgements, estimates and assumptions 27 71
72
Derivative financial asset
Finance lease receivables
Deposit for acquisition of a business
Non-current receivables and
prepayments
Inventories
Trade and other receivables
Income tax expense
Earnings and dividend per share
Property, plant and equipment
Intangible assets
Investments accounted for using the
equity method
Deferred income tax
Financial risk management
Segment information
Other operating income
Expenses by nature
Employees benefits expenses
Finance costs/income
Cash generated from operations
Related party transactions
Commitments
Events after the reporting period
Contingent liabilities
Subsidiaries' information
Provision for liabilities and charges
Derivative financial instruments
Retirement benefit obligations
Government grant
Trade and other payables
Dividend payable
Available-for-sale financial assets &
Investment in subsidiaries Cash and cash equivalents
Non-current assets held for sale and
discontinued operations
Share capital
Other reserves
Borrowings
Financial instruments by category
Upstream activities
Business combination
Value Added Statement
Five-Year Financial Summary (2010 -
2014)
Page 2 of 73

OANDO PLC
Directors and Professional Advisers
For the year ended 31 December 2014
Directors HRM. Oba A. Gbadebo, CFR (Chairman, Non-Executive Director)
Mr. J.A.Tinubu (Group Chief Executive)
Mr. O. Boyo (Deputy Group Chief Executive)
Mr. B. Osunsanya (Group Executive Director)
Mr. Olufemi Adeyemo (Group Executive Director -Finance)
Mr. Oghogho Akpata (Non-executive Director )
Ammuna Lawan Ali (Non-executive Director )
Chief Sena Anthony (Non-executive Director )
Ms. Nana Afoah Appiah-Korang (Non-executive Director )
Mr. Francesco Cuzzocrea (Non-executive Director )
Engr. Yusuf K.J N'jie (Non-executive Director )
Company Secretary and Ayotola Jagun (Ms)
Chief Compliance Officer
Registered Office 2 Ajose Adeogun Street
Victoria Island, Lagos
Auditors Ernst & Young
Chartered Accountants
10th & 13th floor
UBA House
57, Marina,
Lagos, Nigeria.
Bankers Access Bank Plc.
BNP Paribas
Citibank Nigeria Limited
Citibank, UK
Diamond Bank Plc.
Ecobank Nigeria Plc.
Enterprise Bank
Fidelity Bank Plc.
First Bank of Nigeria Limited
First City Monument Bank Plc.
First Bank UK
Guaranty Trust Bank Plc.
Heritage Bank
Keystone Bank Limited
Mainstreet Bank Limited
Natixis Bank
Stanbic IBTC Bank Plc.
Standard Bank Plc.
Standard Bank Plc., UK
Standard Chartered Bank Nigeria Limited
Standard Chartered Bank Plc., UK
Sterling Bank Plc.
Union Bank Plc.
United Bank for Africa Plc.
United Bank for Africa, New York
Unity Bank
Wema Bank Plc.
Zenith Bank (UK) Limited
Zenith Bank Plc.
African Export-Import Bank
Industrial and Commercial Bank of China Ltd
Rand Merchant Bank (First Rand)
The Standard Bank of South Africa Ltd
Societe Generale Bank
First Atlantic Bank Limited
The Royal Bank Limited
Unibank Ghana Limited
GCB Bank Ghana Limited
Barclays Bank Ghana Limited
Prudential Bank Ghana Limited
HFC Bank Ghana Limited
Page 3 of 73

OANDO PLC
Directors' report
For the year ended 31 December 2014
1 PRINCIPAL ACTIVITY
2 RESULTS AND DIVIDEND
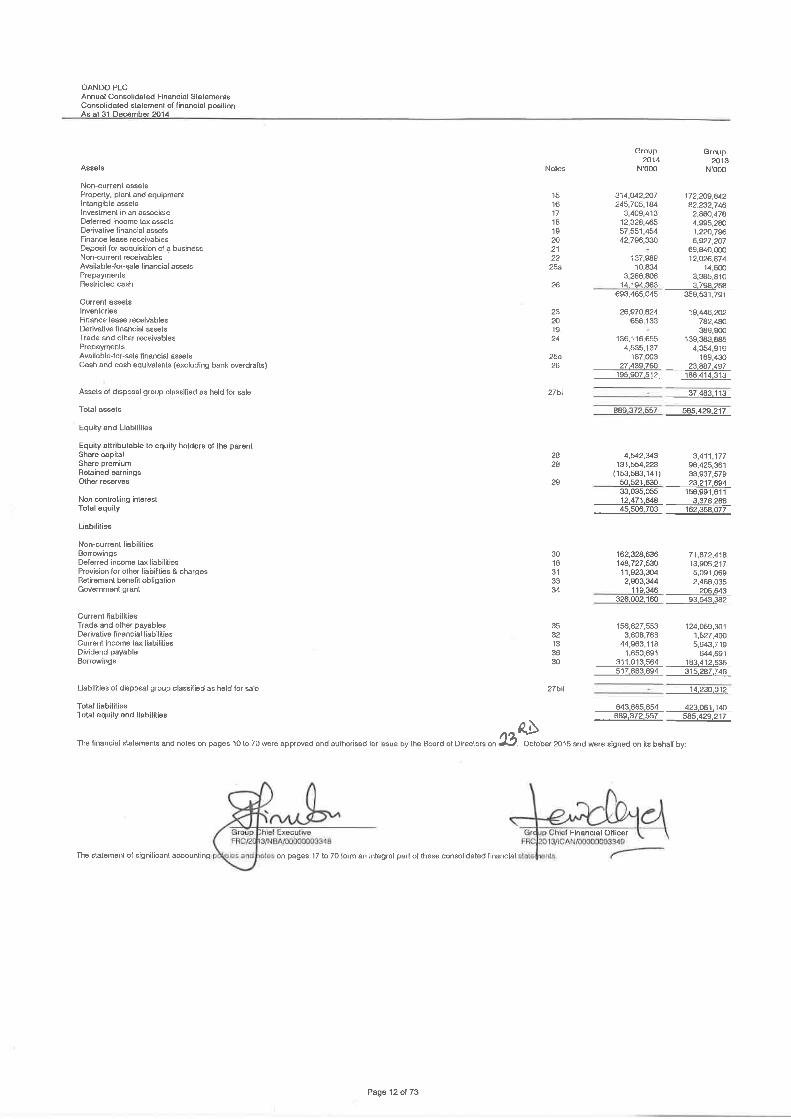
The net loss for the year of N180.5 billion has been transferred to retained earnings.
31-Dec-14 31-Dec-13 31-Dec-14 31-Dec-13
N'000 N'000 N'000 N'000
424,677,646 449,873,466 14,217,468 5,883,304
(171,323,265) 713,207 (100,827,986) 2,783,697
(7,958,945) (5,389,472) (1,572,367) (433,123)
(Loss)/profit for the year from continuing operations (179,282,210) (4,676,265) (102,400,353) 2,350,574
(Loss)/profit for the year from discontinued operations (4,610,976) 6,073,191 - -
(Loss)/profit for the year (183,893,186) 1,396,926 (102,400,353) 2,350,574
(Loss)/profit attributable to owners of the parent (180,538,490) 1,414,462 (102,400,353) 2,350,574
3 Dividend
4 Directors
Direct Indirect
HRM. Oba A. Gbadebo, CFR 262,500 Nil
Mr. J.A. Tinubu* Nil 3,670,995
Mr O. Boyo Nil 2,354,713
Mr. B. Osunsanya 202,491 1,890,398
Mr O. Adeyemo 75,000 1,723,898
Ms. Nana Afoah Appiah-Korang Nil 214,050,580
Chief Sena Anthony 299,133 Nil
Mr. Oghogho Akpata Nil Nil
Ammuna Lawan Ali Nil Nil
Francesco Cuzzocrea^ Nil Nil
Engr. Yusuf K.J N'jie Nil Nil
5 Contracts
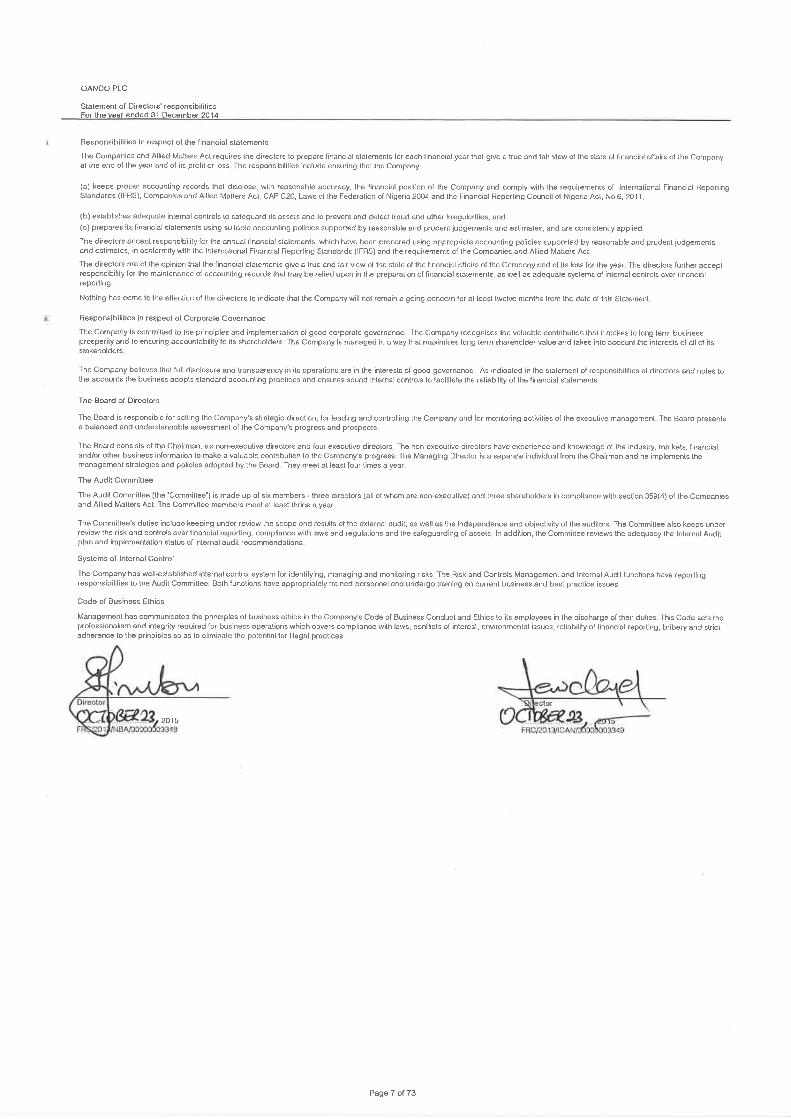
6 Directors' Responsibilities
Income tax expense
The directors approved the payment of interim dividend of N0.70k per share in respect of the 2014 un-audited consolidated financial statements. The dividend was paid to holders of ordinary
shares whose names appear in the Company‘s Nigerian and South African Registers of members at the close of the business on 17th November 2014, subject to the applicable witholding
taxes. Dividend of N0.30k was declared by members of the Company at the Annual General Meeting held on 27 September 2014 in respect of the 2013 financial results.
i. The names of the present directors and those that served during the year are listed on page 3.
ii. According to the Register of Directors' shareholding, the interests of Directors in the issued share capital of the Company for the purposes of section 275 part 1 of schedule 5 of the
Companies and Allied Matters Act, are as follows:
* Ocean and Oil Investments Limited (OOIL) owns 159,701,243 (1.76%) shares in Oando Mr. Jubril Adewale and Mr. Omamofe Boyo own 0.97% and 0.38% respectively in Oando PLC through
OOIL
^Ocean and Oil Development Partners Limited (OODP) owns 5,004,643,096 shares in Oando (55.09%). Mr. Jubril Adewale and Mr. Omamofe Boyo own 20.99% and 12.75% respectively in
Oando PLC through OODP
The Directors submit their Report together with the audited consolidated financial statements for the year ended 31 December 2014, which disclose the state of affairs of the Group and
Company.
The principal activity of Oando Plc. ("the Company") locally and internationally is to have strategic investments in energy companies. The Company is involved in the following business activities
via its subsidiary companies:
a) Marketing of petroleum products, manufacturing and blending of lubricants - Oando Marketing Plc and other petroleum products marketing companies.
b) Pipeline construction and distribution of natural gas to industrial customers - Gaslink Nigeria Limited, Oando Gas and Power Limited, Akute Power Limited and other gas and power
companies.
c) Supply and distribution of petroleum products - Oando Supply and Trading Limited, Ebony Oil & Gas; and Oando Trading, Bermuda.
d) Energy services to upstream companies - Oando Energy Services, and other service companies.
e) Exploration and production (E & P) - Oando Energy Resources Inc., Canada, engaged in production operations and other E & P companies operating within the Gulf of Guinea.
The Company’s registered address is 2 Ajose Adeogun Street, Victoria Island, Lagos, Nigeria.
Group Company
Revenue
(Loss)/profit before income tax
Mr. Francesco Cuzzocrea is a director of OODP
Mr. Tinubu and Mr. Boyo declared their interest in the private placement of the Company's ordinary shares in which Ocean and Oil Development Partners Limited participated for the purpose
of and in line with section 277 of the Companies and Allied Matters Act, and Article 115 of the Company's Articles of Association.
The directors are responsible for the preparation of annual consolidated financial statements, which have been prepared using appropriate accounting policies, supported by reasonable and
prudent judgements and estimates, in conformity with International Financial Reporting Standards issued by the International Accounting Standards Board and the requirements of the
Companies and Allied Matters Act. In doing so, the directors have the responsibilities as described on page 7 of these consolidated financial statements.
Page 4 of 73
OANDO PLC
Directors' report (cont'd)
For the year ended 31 December 2014
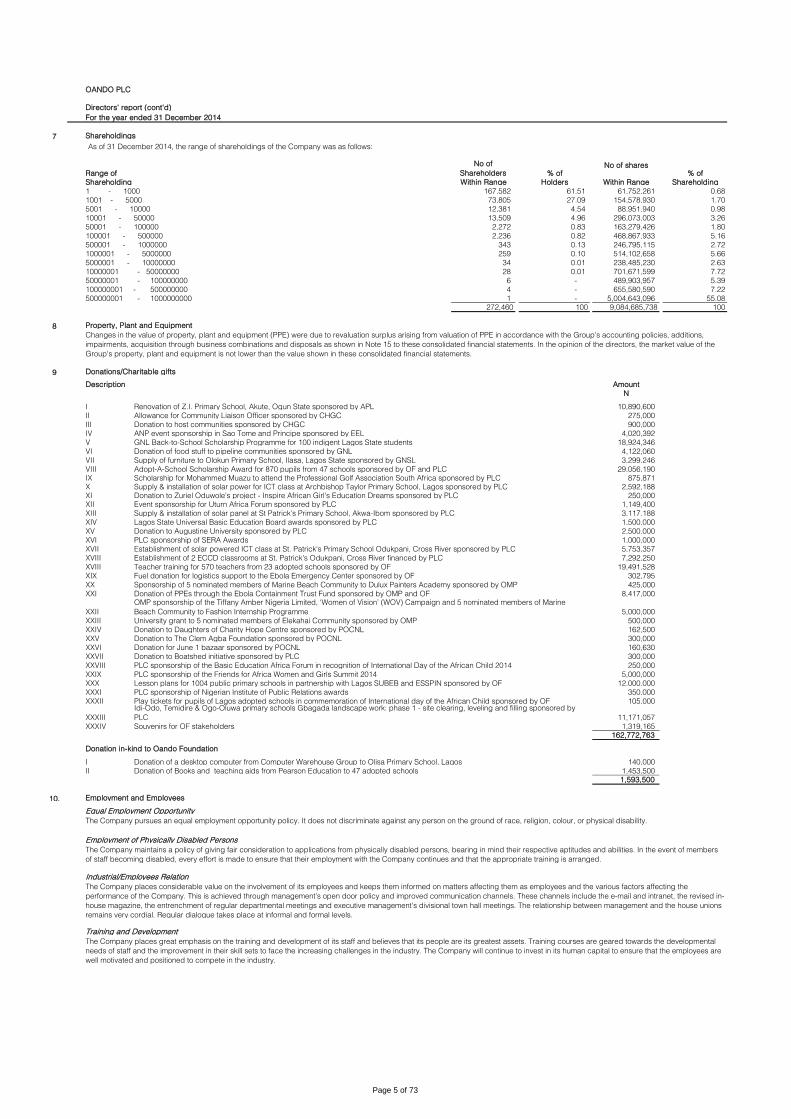
7 Shareholdings
As of 31 December 2014, the range of shareholdings of the Company was as follows:
Range of
No of
Shareholders % ofNo of shares
% of
Shareholding Within Range Holders Within Range Shareholding
1 - 1000 167,582 61.51 61,752,261 0.68
1001 - 5000 73,805 27.09 154,578,930 1.70
5001 - 10000 12,381 4.54 88,951,940 0.98
10001 - 50000 13,509 4.96 296,073,003 3.26
50001 - 100000 2,272 0.83 163,279,426 1.80
100001 - 500000 2,236 0.82 468,867,933 5.16
500001 - 1000000 343 0.13 246,795,115 2.72
1000001 - 5000000 259 0.10 514,102,658 5.66
5000001 - 10000000 34 0.01 238,485,230 2.63
10000001 - 50000000 28 0.01 701,671,599 7.72
50000001 - 100000000 6 - 489,903,957 5.39
100000001 - 500000000 4 - 655,580,590 7.22
500000001 - 1000000000 1 - 5,004,643,096 55.08
272,460 100 9,084,685,738 100
8 Property, Plant and Equipment
9 Donations/Charitable gifts
Description Amount
N
I 10,890,600
II 275,000
III 900,000
IV 4,020,392
V 18,924,346
VI 4,122,060
VII 3,299,246
VIII 29,056,190
IX 875,871
X 2,592,188
XI 250,000
XII 1,149,400
XIII 3,117,188
XIV 1,500,000
XV 2,500,000
XVI 1,000,000
XVII 5,753,357
XVIII 7,292,250
XVIII 19,491,528
XIX 302,795
XX 425,000
XXI 8,417,000
XXII 5,000,000
XXIII 500,000
XXIV 162,500
XXV 300,000
XXVI 160,630
XXVII 300,000
XXVIII 250,000
XXIX 5,000,000
XXX 12,000,000
XXXI 350,000
XXXII 105,000
XXXIII 11,171,057
XXXIV 1,319,165
162,772,763
Donation in-kind to Oando Foundation
I Donation of a desktop computer from Computer Warehouse Group to Olisa Primary School, Lagos 140,000
II Donation of Books and teaching aids from Pearson Education to 47 adopted schools 1,453,500
1,593,500
10. Employment and Employees
Equal Employment Opportunity
Employment of Physically Disabled Persons
Industrial/Employees Relation
Training and Development
Adopt-A-School Scholarship Award for 870 pupils from 47 schools sponsored by OF and PLC
Scholarship for Mohammed Muazu to attend the Professional Golf Association South Africa sponsored by PLC
Supply & installation of solar power for ICT class at Archbishop Taylor Primary School, Lagos sponsored by PLC
Donation to Zuriel Oduwole's project - Inspire African Girl's Education Dreams sponsored by PLC
Event sponsorship for Uturn Africa Forum sponsored by PLC
Supply & installation of solar panel at St Patrick's Primary School, Akwa-Ibom sponsored by PLC
Allowance for Community Liaison Officer sponsored by CHGC
Donation to host communities sponsored by CHGC
ANP event sponsorship in Sao Tome and Principe sponsored by EEL
GNL Back-to-School Scholarship Programme for 100 indigent Lagos State students
Donation of food stuff to pipeline communities sponsored by GNL
Supply of furniture to Olokun Primary School, Ilasa, Lagos State sponsored by GNSL
Changes in the value of property, plant and equipment (PPE) were due to revaluation surplus arising from valuation of PPE in accordance with the Group's accounting policies, additions,
impairments, acquisition through business combinations and disposals as shown in Note 15 to these consolidated financial statements. In the opinion of the directors, the market value of the
Group's property, plant and equipment is not lower than the value shown in these consolidated financial statements.
Renovation of Z.I. Primary School, Akute, Ogun State sponsored by APL
Donation to The Clem Agba Foundation sponsored by POCNL
Donation for June 1 bazaar sponsored by POCNL
Donation to Boatshed initiative sponsored by PLC
PLC sponsorship of the Basic Education Africa Forum in recognition of International Day of the African Child 2014
PLC sponsorship of the Friends for Africa Women and Girls Summit 2014
Lesson plans for 1004 public primary schools in partnership with Lagos SUBEB and ESSPIN sponsored by OF
Fuel donation for logistics support to the Ebola Emergency Center sponsored by OF
Sponsorship of 5 nominated members of Marine Beach Community to Dulux Painters Academy sponsored by OMP
Donation of PPEs through the Ebola Containment Trust Fund sponsored by OMP and OFOMP sponsorship of the Tiffany Amber Nigeria Limited, ‘Women of Vision’ (WOV) Campaign and 5 nominated members of Marine
Beach Community to Fashion Internship Programme
University grant to 5 nominated members of Elekahai Community sponsored by OMP
Donation to Daughters of Charity Hope Centre sponsored by POCNL
Lagos State Universal Basic Education Board awards sponsored by PLC
Donation to Augustine University sponsored by PLC
PLC sponsorship of SERA Awards
Establishment of solar powered ICT class at St. Patrick's Primary School Odukpani, Cross River sponsored by PLC
Establishment of 2 ECCD classrooms at St. Patrick's Odukpani, Cross River financed by PLC
Teacher training for 570 teachers from 23 adopted schools sponsored by OF
The Company places considerable value on the involvement of its employees and keeps them informed on matters affecting them as employees and the various factors affecting the
performance of the Company. This is achieved through management’s open door policy and improved communication channels. These channels include the e-mail and intranet, the revised in-
house magazine, the entrenchment of regular departmental meetings and executive management’s divisional town hall meetings. The relationship between management and the house unions
remains very cordial. Regular dialogue takes place at informal and formal levels.
The Company places great emphasis on the training and development of its staff and believes that its people are its greatest assets. Training courses are geared towards the developmental
needs of staff and the improvement in their skill sets to face the increasing challenges in the industry. The Company will continue to invest in its human capital to ensure that the employees are
well motivated and positioned to compete in the industry.
PLC sponsorship of Nigerian Institute of Public Relations awards
Play tickets for pupils of Lagos adopted schools in commemoration of International day of the African Child sponsored by OFIdi-Odo, Temidire & Ogo-Oluwa primary schools Gbagada landscape work: phase 1 - site clearing, leveling and filling sponsored by
PLC
Souvenirs for OF stakeholders
The Company pursues an equal employment opportunity policy. It does not discriminate against any person on the ground of race, religion, colour, or physical disability.
The Company maintains a policy of giving fair consideration to applications from physically disabled persons, bearing in mind their respective aptitudes and abilities. In the event of members
of staff becoming disabled, every effort is made to ensure that their employment with the Company continues and that the appropriate training is arranged.
Page 5 of 73


OANDO PLC
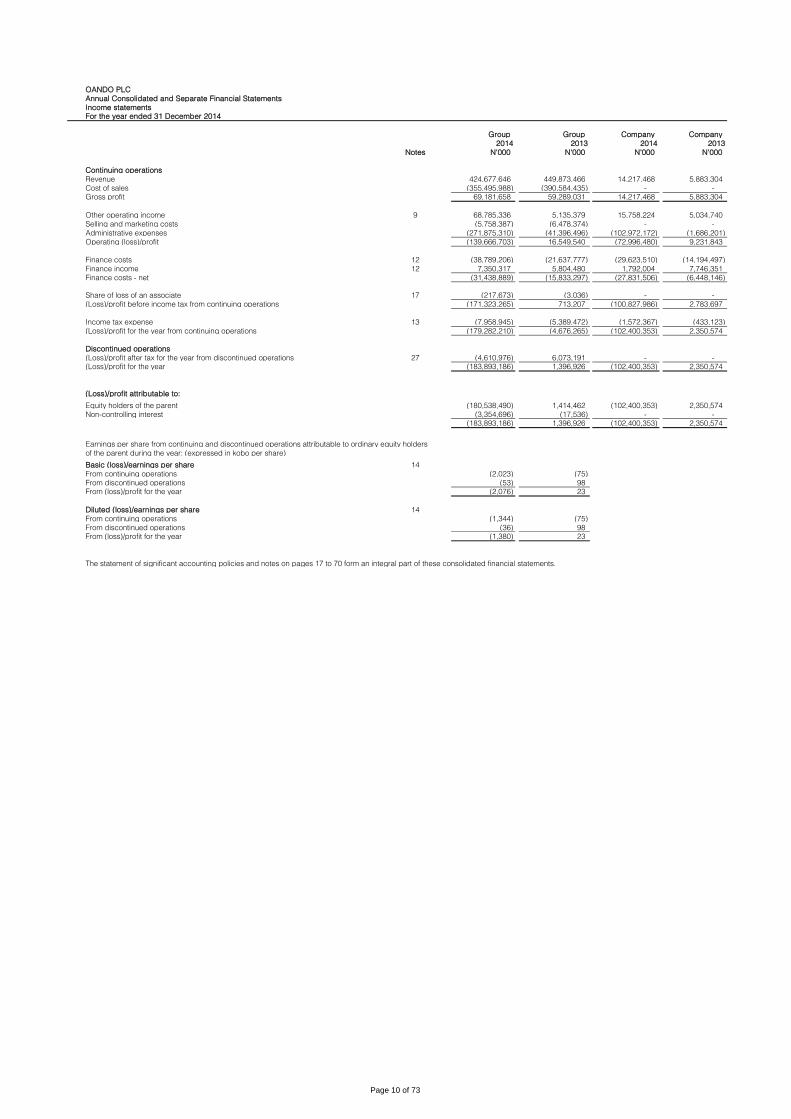
Annual Consolidated and Separate Financial Statements
Income statements
For the year ended 31 December 2014
Group Group Company Company
2014 2013 2014 2013
Notes N'000 N'000 N'000 N'000
Continuing operations
Revenue 424,677,646 449,873,466 14,217,468 5,883,304
Cost of sales (355,495,988) (390,584,435) - -
Gross profit 69,181,658 59,289,031 14,217,468 5,883,304
Other operating income 9 68,785,336 5,135,379 15,758,224 5,034,740
Selling and marketing costs (5,758,387) (6,478,374) - -
Administrative expenses (271,875,310) (41,396,496) (102,972,172) (1,686,201)
Operating (loss)/profit (139,666,703) 16,549,540 (72,996,480) 9,231,843
Finance costs 12 (38,789,206) (21,637,777) (29,623,510) (14,194,497)
Finance income 12 7,350,317 5,804,480 1,792,004 7,746,351
Finance costs - net (31,438,889) (15,833,297) (27,831,506) (6,448,146)
Share of loss of an associate 17 (217,673) (3,036) - -
(Loss)/profit before income tax from continuing operations (171,323,265) 713,207 (100,827,986) 2,783,697
Income tax expense 13 (7,958,945) (5,389,472) (1,572,367) (433,123)
(Loss)/profit for the year from continuing operations (179,282,210) (4,676,265) (102,400,353) 2,350,574
Discontinued operations
(Loss)/profit after tax for the year from discontinued operations 27 (4,610,976) 6,073,191 - -
(Loss)/profit for the year (183,893,186) 1,396,926 (102,400,353) 2,350,574
(Loss)/profit attributable to:
Equity holders of the parent (180,538,490) 1,414,462 (102,400,353) 2,350,574
Non-controlling interest (3,354,696) (17,536) - -
(183,893,186) 1,396,926 (102,400,353) 2,350,574
Earnings per share from continuing and discontinued operations attributable to ordinary equity holders
of the parent during the year: (expressed in kobo per share)
Basic (loss)/earnings per share 14
From continuing operations (2,023) (75)
From discontinued operations (53) 98
From (loss)/profit for the year (2,076) 23
Diluted (loss)/earnings per share 14
From continuing operations (1,344) (75)
From discontinued operations (36) 98
From (loss)/profit for the year (1,380) 23
The statement of significant accounting policies and notes on pages 17 to 70 form an integral part of these consolidated financial statements.
Page 10 of 73
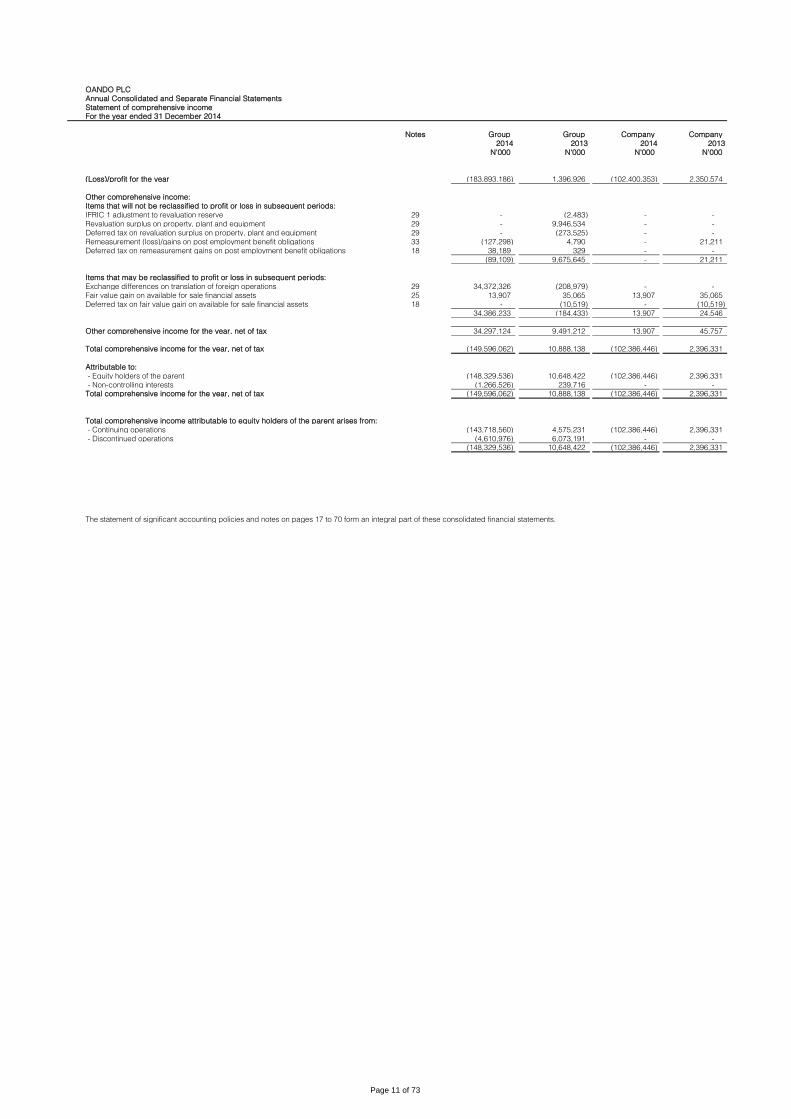
OANDO PLC
Annual Consolidated and Separate Financial Statements
Statement of comprehensive income
For the year ended 31 December 2014
Notes Group Group Company Company
2014 2013 2014 2013
N'000 N'000 N'000 N'000
(Loss)/profit for the year (183,893,186) 1,396,926 (102,400,353) 2,350,574
Other comprehensive income:
Items that will not be reclassified to profit or loss in subsequent periods:
IFRIC 1 adjustment to revaluation reserve 29 - (2,483) - -
Revaluation surplus on property, plant and equipment 29 - 9,946,534 - -
Deferred tax on revaluation surplus on property, plant and equipment 29 - (273,525) - -
Remeasurement (loss)/gains on post employment benefit obligations 33 (127,298) 4,790 - 21,211
Deferred tax on remeasurement gains on post employment benefit obligations 18 38,189 329 - -
(89,109) 9,675,645 - 21,211
Items that may be reclassified to profit or loss in subsequent periods:
Exchange differences on translation of foreign operations 29 34,372,326 (208,979) - -
Fair value gain on available for sale financial assets 25 13,907 35,065 13,907 35,065
Deferred tax on fair value gain on available for sale financial assets 18 - (10,519) - (10,519)
34,386,233 (184,433) 13,907 24,546
Other comprehensive income for the year, net of tax 34,297,124 9,491,212 13,907 45,757
Total comprehensive income for the year, net of tax (149,596,062) 10,888,138 (102,386,446) 2,396,331
Attributable to:
- Equity holders of the parent (148,329,536) 10,648,422 (102,386,446) 2,396,331
- Non-controlling interests (1,266,526) 239,716 - -
Total comprehensive income for the year, net of tax (149,596,062) 10,888,138 (102,386,446) 2,396,331
Total comprehensive income attributable to equity holders of the parent arises from:
- Continuing operations (143,718,560) 4,575,231 (102,386,446) 2,396,331
- Discontinued operations (4,610,976) 6,073,191 - -
(148,329,536) 10,648,422 (102,386,446) 2,396,331
The statement of significant accounting policies and notes on pages 17 to 70 form an integral part of these consolidated financial statements.
Page 11 of 73

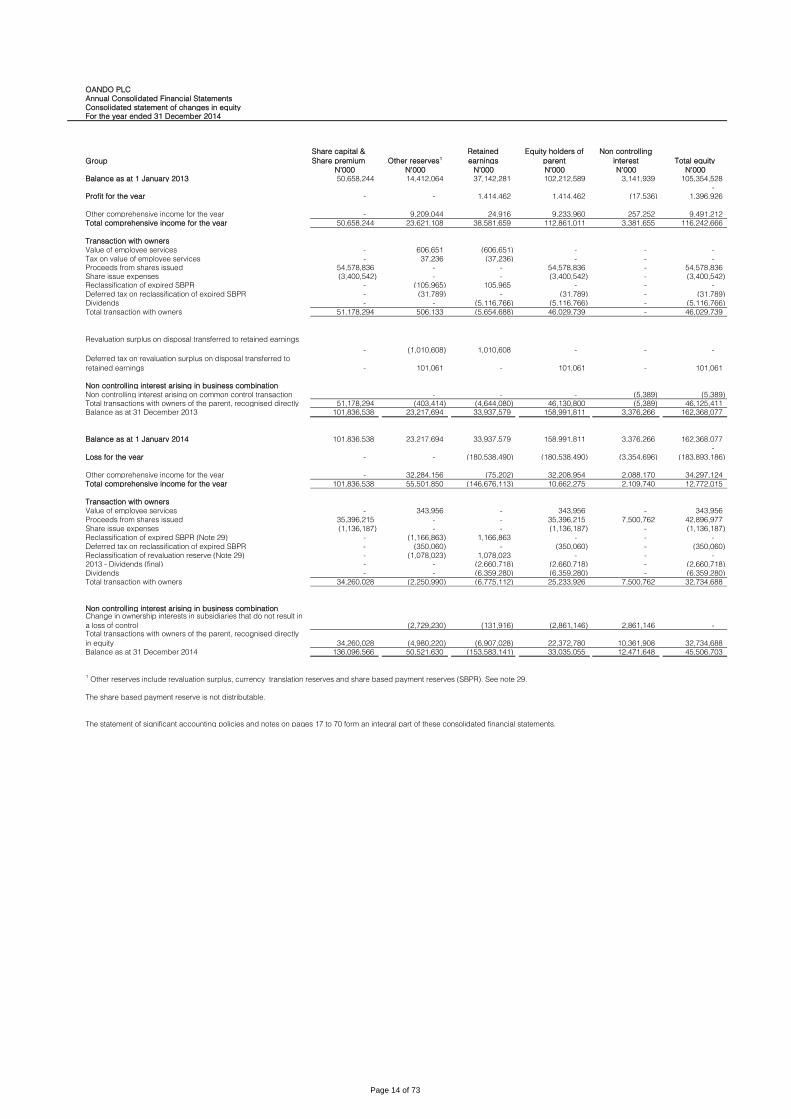
OANDO PLC
Annual Consolidated Financial Statements
Consolidated statement of changes in equity
For the year ended 31 December 2014
Group
Share capital &
Share premium Other reserves1
Retained
earnings
Equity holders of
parent
Non controlling
interest Total equity
N'000 N'000 N'000 N'000 N'000 N'000
Balance as at 1 January 2013 50,658,244 14,412,064 37,142,281 102,212,589 3,141,939 105,354,528
-
Profit for the year - - 1,414,462 1,414,462 (17,536) 1,396,926
Other comprehensive income for the year - 9,209,044 24,916 9,233,960 257,252 9,491,212
Total comprehensive income for the year 50,658,244 23,621,108 38,581,659 112,861,011 3,381,655 116,242,666
Transaction with owners
Value of employee services - 606,651 (606,651) - - -
Tax on value of employee services - 37,236 (37,236) - - -
Proceeds from shares issued 54,578,836 - - 54,578,836 - 54,578,836
Share issue expenses (3,400,542) - - (3,400,542) - (3,400,542)
Reclassification of expired SBPR - (105,965) 105,965 - - -
Deferred tax on reclassification of expired SBPR - (31,789) - (31,789) - (31,789)
Dividends - - (5,116,766) (5,116,766) - (5,116,766)
Total transaction with owners 51,178,294 506,133 (5,654,688) 46,029,739 - 46,029,739
- (1,010,608) 1,010,608 - - -
- 101,061 - 101,061 - 101,061
Non controlling interest arising in business combination
- - - (5,389) (5,389)
51,178,294 (403,414) (4,644,080) 46,130,800 (5,389) 46,125,411
Balance as at 31 December 2013 101,836,538 23,217,694 33,937,579 158,991,811 3,376,266 162,368,077
Balance as at 1 January 2014 101,836,538 23,217,694 33,937,579 158,991,811 3,376,266 162,368,077
-
Loss for the year - - (180,538,490) (180,538,490) (3,354,696) (183,893,186)
Other comprehensive income for the year - 32,284,156 (75,202) 32,208,954 2,088,170 34,297,124
Total comprehensive income for the year 101,836,538 55,501,850 (146,676,113) 10,662,275 2,109,740 12,772,015
Transaction with owners
Value of employee services - 343,956 - 343,956 - 343,956
Proceeds from shares issued 35,396,215 - - 35,396,215 7,500,762 42,896,977
Share issue expenses (1,136,187) - - (1,136,187) - (1,136,187)
Reclassification of expired SBPR (Note 29) - (1,166,863) 1,166,863 - - -
Deferred tax on reclassification of expired SBPR - (350,060) - (350,060) - (350,060)
Reclassification of revaluation reserve (Note 29) - (1,078,023) 1,078,023 - - -
2013 - Dividends (final) - - (2,660,718) (2,660,718) - (2,660,718)
Dividends - - (6,359,280) (6,359,280) - (6,359,280)
Total transaction with owners 34,260,028 (2,250,990) (6,775,112) 25,233,926 7,500,762 32,734,688
Non controlling interest arising in business combination
(2,729,230) (131,916) (2,861,146) 2,861,146 -
34,260,028 (4,980,220) (6,907,028) 22,372,780 10,361,908 32,734,688
Balance as at 31 December 2014 136,096,566 50,521,630 (153,583,141) 33,035,055 12,471,648 45,506,703
The statement of significant accounting policies and notes on pages 17 to 70 form an integral part of these consolidated financial statements.
The share based payment reserve is not distributable.
Non controlling interest arising on common control transaction
Total transactions with owners of the parent, recognised directly
Change in ownership interests in subsidiaries that do not result in
a loss of controlTotal transactions with owners of the parent, recognised directly
in equity
1 Other reserves include revaluation surplus, currency translation reserves and share based payment reserves (SBPR). See note 29.
Revaluation surplus on disposal transferred to retained earnings
Deferred tax on revaluation surplus on disposal transferred to
retained earnings
Page 14 of 73
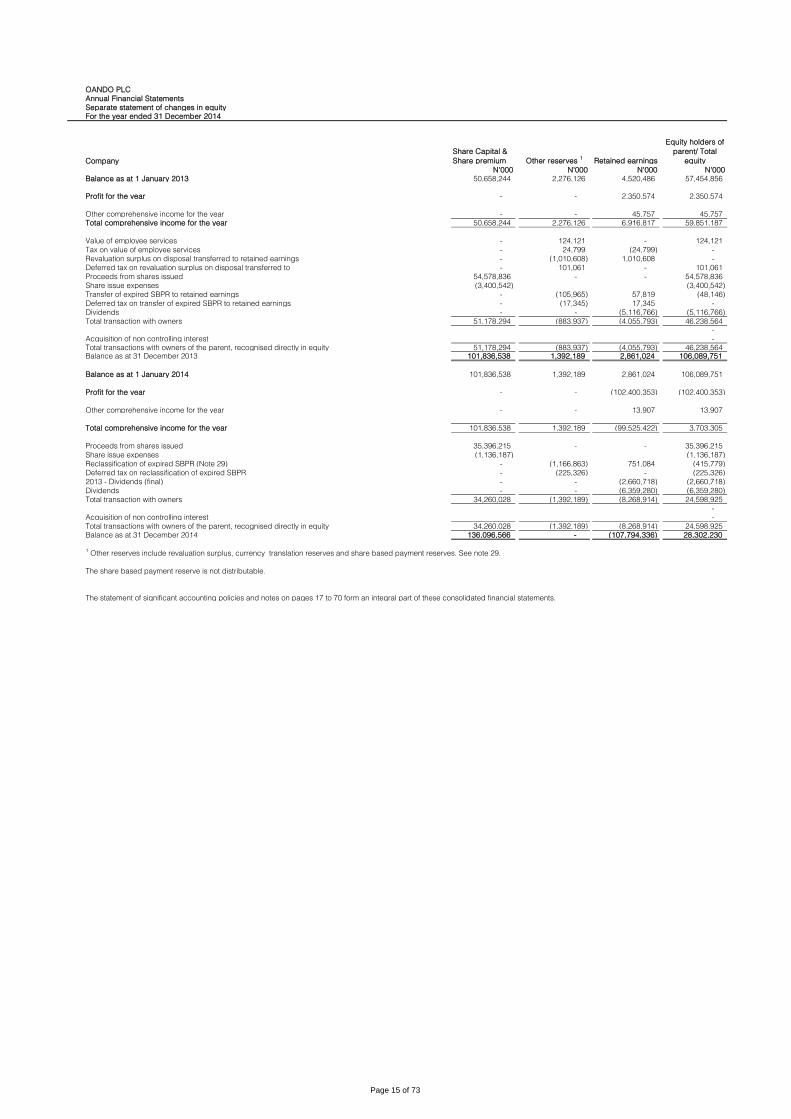
OANDO PLC
Annual Financial Statements
Separate statement of changes in equity
For the year ended 31 December 2014
Company
Share Capital &
Share premium Other reserves 1
Retained earnings
Equity holders of
parent/ Total
equity
N'000 N'000 N'000 N'000
Balance as at 1 January 2013 50,658,244 2,276,126 4,520,486 57,454,856
Profit for the year - - 2,350,574 2,350,574
Other comprehensive income for the year - - 45,757 45,757
Total comprehensive income for the year 50,658,244 2,276,126 6,916,817 59,851,187
Value of employee services - 124,121 - 124,121
Tax on value of employee services - 24,799 (24,799) -
- (1,010,608) 1,010,608 -
- 101,061 - 101,061
Proceeds from shares issued 54,578,836 - - 54,578,836
Share issue expenses (3,400,542) (3,400,542)
Transfer of expired SBPR to retained earnings - (105,965) 57,819 (48,146)
- (17,345) 17,345 -
Dividends - - (5,116,766) (5,116,766)
Total transaction with owners 51,178,294 (883,937) (4,055,793) 46,238,564
-
Acquisition of non controlling interest -
Total transactions with owners of the parent, recognised directly in equity 51,178,294 (883,937) (4,055,793) 46,238,564 Balance as at 31 December 2013 101,836,538 1,392,189 2,861,024 106,089,751
Balance as at 1 January 2014 101,836,538 1,392,189 2,861,024 106,089,751
Profit for the year - - (102,400,353) (102,400,353)
Other comprehensive income for the year - - 13,907 13,907
Total comprehensive income for the year 101,836,538 1,392,189 (99,525,422) 3,703,305
Proceeds from shares issued 35,396,215 - - 35,396,215
Share issue expenses (1,136,187) (1,136,187)
Reclassification of expired SBPR (Note 29) - (1,166,863) 751,084 (415,779)
Deferred tax on reclassification of expired SBPR - (225,326) - (225,326)
2013 - Dividends (final) - - (2,660,718) (2,660,718)
Dividends - - (6,359,280) (6,359,280)
Total transaction with owners 34,260,028 (1,392,189) (8,268,914) 24,598,925
-
Acquisition of non controlling interest -
34,260,028 (1,392,189) (8,268,914) 24,598,925
Balance as at 31 December 2014 136,096,566 - (107,794,336) 28,302,230
The statement of significant accounting policies and notes on pages 17 to 70 form an integral part of these consolidated financial statements.
Revaluation surplus on disposal transferred to retained earnings
Deferred tax on revaluation surplus on disposal transferred to
Deferred tax on transfer of expired SBPR to retained earnings
Total transactions with owners of the parent, recognised directly in equity
1 Other reserves include revaluation surplus, currency translation reserves and share based payment reserves. See note 29.
The share based payment reserve is not distributable.
Page 15 of 73
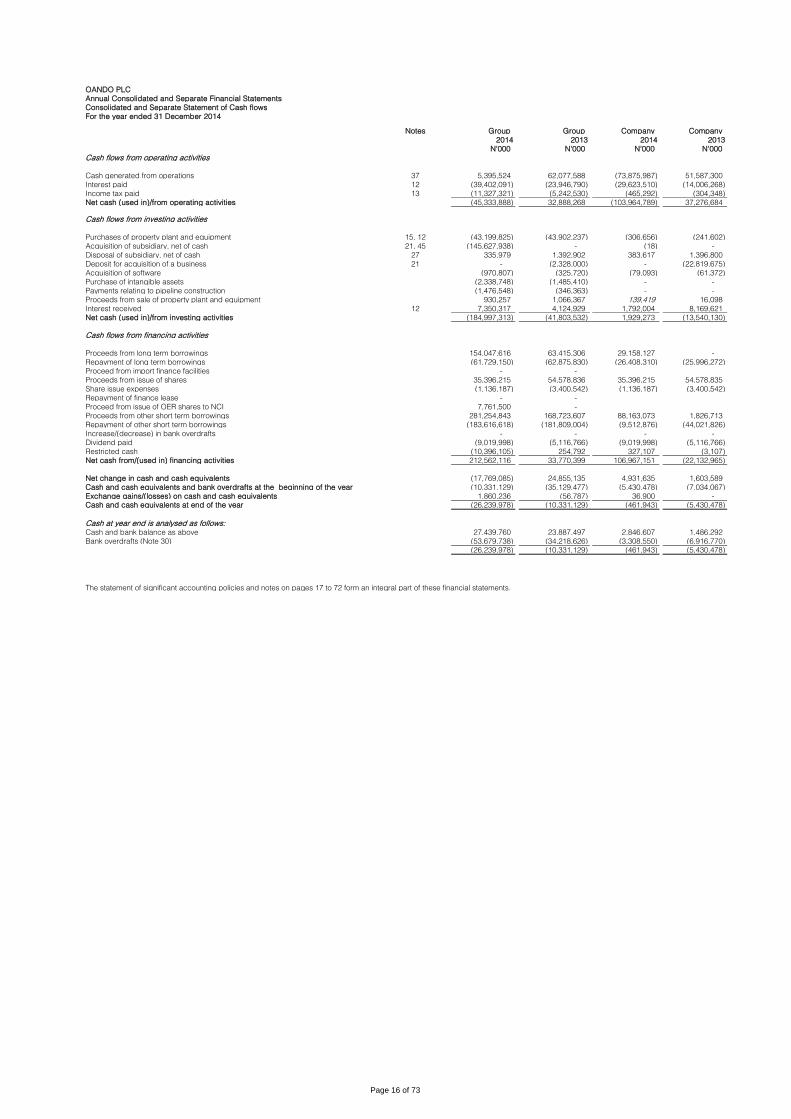
OANDO PLC
Annual Consolidated and Separate Financial Statements
Consolidated and Separate Statement of Cash flows
For the year ended 31 December 2014
Notes Group Group Company Company
2014 2013 2014 2013
N'000 N'000 N'000 N'000
Cash flows from operating activities
Cash generated from operations 37 5,395,524 62,077,588 (73,875,987) 51,587,300
Interest paid 12 (39,402,091) (23,946,790) (29,623,510) (14,006,268)
Income tax paid 13 (11,327,321) (5,242,530) (465,292) (304,348)
Net cash (used in)/from operating activities (45,333,888) 32,888,268 (103,964,789) 37,276,684
Cash flows from investing activities
Purchases of property plant and equipment 15, 12 (43,199,825) (43,902,237) (306,656) (241,602)
Acquisition of subsidiary, net of cash 21, 45 (145,627,938) - (18) -
Disposal of subsidiary, net of cash 27 335,979 1,392,902 383,617 1,396,800
Deposit for acquisition of a business 21 - (2,328,000) - (22,819,675)
Acquisition of software (970,807) (325,720) (79,093) (61,372)
Purchase of intangible assets (2,338,748) (1,485,410) - -
Payments relating to pipeline construction (1,476,548) (346,363) - -
Proceeds from sale of property plant and equipment 930,257 1,066,367 139,419 16,098
Interest received 12 7,350,317 4,124,929 1,792,004 8,169,621
Net cash (used in)/from investing activities (184,997,313) (41,803,532) 1,929,273 (13,540,130)
Cash flows from financing activities
Proceeds from long term borrowings 154,047,616 63,415,306 29,158,127 -
Repayment of long term borrowings (61,729,150) (62,875,830) (26,408,310) (25,996,272)
Proceed from import finance facilities - -
Proceeds from issue of shares 35,396,215 54,578,836 35,396,215 54,578,835
Share issue expenses (1,136,187) (3,400,542) (1,136,187) (3,400,542)
Repayment of finance lease - -
Proceed from issue of OER shares to NCI 7,761,500 -
Proceeds from other short term borrowings 281,254,843 168,723,607 88,163,073 1,826,713
Repayment of other short term borrowings (183,616,618) (181,809,004) (9,512,876) (44,021,826)
Increase/(decrease) in bank overdrafts - - - -
Dividend paid (9,019,998) (5,116,766) (9,019,998) (5,116,766)
Restricted cash (10,396,105) 254,792 327,107 (3,107)
Net cash from/(used in) financing activities 212,562,116 33,770,399 106,967,151 (22,132,965)
Net change in cash and cash equivalents (17,769,085) 24,855,135 4,931,635 1,603,589
Cash and cash equivalents and bank overdrafts at the beginning of the year (10,331,129) (35,129,477) (5,430,478) (7,034,067)
Exchange gains/(losses) on cash and cash equivalents 1,860,236 (56,787) 36,900 -
Cash and cash equivalents at end of the year (26,239,978) (10,331,129) (461,943) (5,430,478)
Cash at year end is analysed as follows:Cash and bank balance as above 27,439,760 23,887,497 2,846,607 1,486,292
Bank overdrafts (Note 30) (53,679,738) (34,218,626) (3,308,550) (6,916,770)
(26,239,978) (10,331,129) (461,943) (5,430,478)
The statement of significant accounting policies and notes on pages 17 to 72 form an integral part of these financial statements.
Page 16 of 73

OANDO PLC
Annual Consolidated and Separate Financial Statements
Notes to the consolidated financial statements
For the year ended 31 December 2014
1. General information
2. Basis of preparation
3. Changes in accounting policies and disclosures
OER effectively became the Group’s main vehicle for all oil exploration and production activities.
Other subsidiaries within the Group and their respective lines of business including Gas and Power, are shown in note 42.
Oando Plc. (the "Company”) is listed on the Nigerian Stock Exchange and the Johannesburg Stock Exchange. The Company conducts downstream business through a wholly owned
subsidiary named Oando Marketing Plc. Oando Marketing Plc. has retail and distribution outlets in Nigeria, Ghana and Togo. In addition, the Company retained 100% interest in Oando
Trading Bermuda (OTB) and Oando Supply & Trading (OST).
OTB supply petroleum products to marketing companies and large industrial customers.
The Group provides energy services to Exploration and Production (E&P) companies through its fully owned subsidiary, Oando Energy Services.
On October 13, 2011, Exile Resources Inc. (“Exile”) and the Upstream Exploration and Production Division (“OEPD”) of Oando PLC (“Oando”) announced that they had entered into a definitive
master agreement dated September 27, 2011 providing for the previously announced proposed acquisition by Exile of certain shareholding interests in Oando subsidiaries via a Reverse Take
Over (“RTO”) in respect of Oil Mining Leases (“OMLs”) and Oil Prospecting Licenses (“OPLs”) (the “Upstream Assets”) of Oando (the “Acquisition”) first announced on August 2, 2011. The
Acquisition was completed on July 24, 2012, giving birth to Oando Energy Resources Inc. (“OER”); a company listed on the Toronto Stock Exchange. Immediately prior to completion of the
Acquisition, Oando PLC and the Oando Exploration and Production Division first entered into a reorganization transaction (the “Oando Reorganization”) with the purpose of facilitating the
transfer of the OEPD interests to OER (formerly Exile).
Oando Plc. (formerly Unipetrol Nigeria Plc.) was registered by a special resolution as a result of the acquisition of the shareholding of Esso Africa Incorporated (principal shareholder of Esso
Standard Nigeria Limited) by the Federal Government of Nigeria. It was partially privatised in 1991 and fully privatised in the year 2000 following the disposal of the 40% shareholding of
Federal Government of Nigeria to Ocean and Oil Investments Limited and the Nigerian public. In December 2002, the Company merged with Agip Nigeria Plc. following its acquisition of 60%
of Agip Petrol’s stake in Agip Nigeria Plc. The Company formally changed its name from Unipetrol Nigeria Plc. to Oando Plc. in December 2003.
The consolidated financial statements of Oando Plc. have been prepared in accordance with International Financial Reporting Standards (IFRS) issued by the International Accounting
Standards Board (IASB) and IFRS Interpretations Committee (IFRS IC) interpretations applicable to companies reporting under IFRS. The annual consolidated financial statements are
presented in Naira, rounded to the nearest thousand, and prepared under the historical cost convention, as modified by the revaluation of land and buildings, available-for-sale financial assets,
and financial assets and financial liabilities (including derivative instruments) at fair value through profit or loss.
The preparation of financial statements in conformity with IFRS requires the use of certain critical accounting estimates. It also requires management to exercise its judgement in the process of
applying the Group’s accounting policies. The areas involving a higher degree of judgement or complexity, or areas where assumptions and estimates are significant to these consolidated
financial statements, are disclosed in Note 6.
IFRIC 21 Levies IFRIC 21 clarifies that an entity recognises a liability for a levy when the activity that triggers payment, as identified by the relevant legislation, occurs. For a levy that is triggered upon reaching
a minimum threshold, the interpretation clarifies that no liability should be anticipated before the specified minimum threshold is reached. Retrospective application is required for IFRIC 21.
This interpretation has no impact on the Group as it has applied the recognition principles under IAS 37 Provisions, Contingent Liabilities and Contingent Assets consistent with the
requirements of IFRIC 21 in prior years.
Impairment of assets – Amendments to IAS 36This amendment removed certain disclosures of the recoverable amount of CGUs which had been included in IAS 36 by the issue of IFRS 13. The Group adopted IFRS 13 in the immediate
past financial year.
Offsetting Financial Assets and Financial Liabilities - Amendments to IAS 32 This amendment clarifies that the right of set-off must not be contingent on a future event. It must also be legally enforceable for all counterparties in the normal course of business, as well as in
the event of default, insolvency or bankruptcy. The amendment did not have a significant effect on the Group financial statements.
Novation of Derivatives and Continuation of Hedge Accounting – Amendments to IAS 39 These amendments provide relief from discontinuing hedge accounting when novation of a derivative designated as a hedging instrument meets certain criteria and retrospective application is
required. These amendments have no impact on the Group as the Group has not novated its derivatives during the current or prior periods.
a) New standards, amendments and interpretations adopted by the Group
The Group applied for the first time certain standards and amendments, which are effective for annual periods beginning on or after 1 January 2014. The nature and the impact of each new
standard and amendment is described below:
Investment Entities (Amendments to IFRS 10, IFRS 12 and IAS 27)These amendments provide an exception to the consolidation requirement for entities that meet the definition of an investment entity under IFRS 10 Consolidated Financial Statements and must
be applied retrospectively, subject to certain transition relief. The exception to consolidation requires investment entities to account for subsidiaries at fair value through profit or loss. These
amendments have no impact on the Group, since none of the entities in the Group qualifies to be an investment entity under IFRS 10.
Annual Improvements 2010-2012 Cycle: Amendments to IFRS 13 – Short-term receivables and payables In the 2010-2012 annual improvements cycle, the IASB issued seven amendments to six standards, which included an amendment to IFRS 13 Fair Value Measurement. The amendment to
IFRS 13 is effective immediately and, thus, for periods beginning at 1 January 2014, and it clarifies in the Basis for Conclusions that short-term receivables and payables with no stated interest
rates can be measured at invoice amounts when the effect of discounting is immaterial. This amendment to IFRS 13 has no impact on the Group.
Annual Improvements 2011-2013 Cycle: Amendments to IFRS 1 – Meaning of ‘effective IFRSs’In the 2011-2013 annual improvements cycle, the IASB issued four amendments to four standards, which included an amendment to IFRS 1 First-time Adoption of International Financial
Reporting Standards. The amendment to IFRS 1 is effective immediately and, thus, for periods beginning at 1 January 2014, and clarifies in the Basis for Conclusions that an entity may choose
to apply either a current standard or a new standard that is not yet mandatory, but permits early application, provided either standard is applied consistently throughout the periods presented
in the entity’s first IFRS financial statements. This amendment to IFRS 1 has no impact on the Group, since the Group is an existing IFRS preparer.
Page 17 of 73

OANDO PLC
Annual Consolidated and Separate Financial Statements
Notes to the consolidated financial statements
For the year ended 31 December 2014
4. Basis of Consolidation
(i) Subsidiaries
(iv) Investment in Associates
b) New standards, amendments and interpretations issued and not effective for the financial year beginning 1 January 2014 but early adopted by the Group
A number of new standards and amendments to standards and interpretations are effective for annual periods beginning after 1 January 2014, and have not been applied in preparing these
consolidated financial statements. None of these is expected to have significant effect on the consolidated financial statements of the Group, except the following set out below:
IFRS 9, ‘Financial instruments’, addresses the classification, measurement and recognition of financial liabilities. The complete version of IFRS 9 was issued in July 2014. It replaces IAS 39 that
relates to the classification and measurement of financial instruments. IFRS 9 retains but simplifies the mixed measurement model and establishes three primary measurement categories of
financial assets: amortised cost, fair value through OCI and fair value through P&L. The basis of classification depends on the entity’s business model and the contractual; cash flow
characteristics of the financial asset. Investments in equity instruments are required to be measured at fair value through profit or loss with the irrevocable option at inception to present
changes in fair value in OCI not recycling. There is a new expected credit model that replaces the incurred loss impairment model in IAS 39. For financial liabilities, there were no changes to
classification and measurement except for the recognition of changes in own credit risk in OCI, for liabilities designated at fair value through profit ot loss. IFRS 9 relaxes the requirements for
hedge effectiveness by replacing the bright line hedge effectiveness test. It requires an economic relationship between the hedged item and hedging instrument and for the ‘hedged ratio’ to
be the same as the one management actually use for risk management purposes. The standard is effective for accounting periods beginning on or after 2018. Early adoption is permitted. The
Group is yet to assess the full impact of IFRS 9.
(ii) Changes in ownership interests in subsidiaries without change of control
The Group treats transactions with non-controlling interests that do not result in loss of control as equity transactions. For purchases from non-controlling interests, the difference between fair
value of any consideration paid and the relevant share acquired of the carrying value of net assets of the subsidiary is recorded in equity. Gains or losses on disposals to non-controlling
interests are also recorded in equity.
(iii) Disposal of subsidiaries
When the Group ceases to have control, any retained interest in the entity is re-measured to its fair value at the date when control is lost, with the change in carrying amount recognised in profit
or loss. The fair value is the initial carrying amount for the purposes of subsequently accounting for the retained interest as an associate, joint venture or financial asset. In addition, any amounts
previously recognised in other comprehensive income in respect of that entity are accounted for as if the Group had directly disposed of the related assets or liabilities. This may mean that
amounts previously recognised in other comprehensive income are reclassified to profit or loss.
Associates are all entities over which the Group has significant influence but not control, generally accompanying a shareholding of between 20% and 50% of the voting rights. Investments in
associates are accounted for using the equity method of accounting. Under the equity method, the investment is initially recognised at cost, and the carrying amount is increased or decreased
to recognise the investor’s share of the change in the associate's net assets after the date of acquisition. The Group’s investment in associates includes goodwill identified on acquisition.
If the ownership interest in an associate is reduced but significant influence is retained, only a proportionate share of the amounts previously recognised in other comprehensive income is
reclassified to profit or loss where appropriate.
The Group’s share of post-acquisition profit or loss is recognised in the income statement, and its share of post-acquisition movements in other comprehensive income is recognised in other
comprehensive income with a corresponding adjustment to the carrying amount of the investment. When the Group’s share of losses in an associate equals or exceeds its interest in the
associate, including any other unsecured receivables, the Group does not recognise further losses, unless it has incurred legal or constructive obligations or made payments on behalf of the
associate.
If the business consideration is achieved in stages, the acquisition date carrying value of the acquirer's previously held equity interest in the acquiree is re-measured to fair value at the
acquisition date; any gains or losses arising from such re-measurement are recognised in profit or loss.
The acquisition method of accounting is used to account for the acquisition of subsidiaries by the Group. The consideration transferred for the acquisition of a subsidiary is the fair value of the
assets transferred, the liabilities incurred to the former owners of the acquiree and the equity interests issued by the Group. The consideration transferred includes the fair value of any asset or
liability resulting from a contingent consideration arrangement.
Identifiable assets acquired and liabilities and contingent liabilities assumed in a business combination are measured initially at their fair values at the acquisition date. On an acquisition-by-
acquisition basis, the Group recognises any non-controlling interest in the acquiree, either at fair value or at the non-controlling interest’s proportionate share of the recognised amounts of
acquiree’s identifiable net assets. Any contingent consideration to be transferred by the Group is recognised at fair value at the acquisition date. Subsequent changes to the fair value of the
contingent consideration that is deemed to be an asset or liability is recognised in accordance with IAS 39 either in profit or loss or as a change to other comprehensive income. Contingent
consideration that is classified as equity is not re-measured, and its subsequent settlement is accounted for within equity.
Acquisition-related costs are expensed as incurred.
The excess of the consideration transferred, the amount of any controlling interest in the acquiree, and the acquisition date fair value of any previous equity interest in the acquiree over the fair
value of the identifiable net assets acquired is recorded as goodwill. If the total of consideration transferred non-controlling interest recognised and previously held interest is less than the fair
value of the net assets of the subsidiary acquired in the case of a bargain purchase, the difference is recognised directly in the income statement.
Inter-company transactions, amounts, balances and income and expenses on transactions between Group companies are eliminated. Profits and losses resulting from transactions that are
recognised in assets are also eliminated. Accounting policies and amounts of subsidiaries have been changed where necessary to ensure consistency with the policies adopted by the Group.
IFRS 15, ‘Revenue from contracts with customers’ deals with revenue recognition and establishes principles for reporting useful information to users of financial statements about the nature,
timing, amount and uncertainty of revenue and cash flows arising from an entity’s contracts with customers. Revenue is recognized when a customer obtains control of a good or service and
thus has the ability to direct the use and obtain the benefits from the good or service. The standard replaces IAS 18 ‘Revenue’ and IAS 11 ‘Construction contracts’ and related interpretations.
The standard is effective for annual periods beginning on or after 1 January 2017 and earlier adoption is permitted. The Group is yet to assess the impact of IFRS 15.
There are no other IFRSs or IFRIC interpretations that are not yet effective that would be expected to have material impact on the Group.
Subsidiaries are all entities (including structured entities) over which the Group has power or control. The Group controls an entity when the Group is exposed to, or has rights to, variable
returns from its involvement with the entity and has the ability to use its power over the entity to affect the amount of the entity’s return. Subsidiaries are fully consolidated from the date on which
control is transferred to the Group. They are de-consolidated from the date that control ceases.
The Group considers all facts and circumstances’, including the size of the Group’s voting rights relative to the size and dispersion of other vote holders in the determination of control.
Page 18 of 73
OANDO PLC
Annual Consolidated and Separate Financial Statements
Notes to the consolidated financial statements
For the year ended 31 December 2014
(v) Joint arrangements
(vi) Functional currency and translation of foreign currencies
(vii) Transactions and balances in Group entities
(viii) Consolidation of Group entities
5. Other significant accounting policies
(a) Segment reporting
The Group determines at each reporting date whether there is any objective evidence that the investment in the associate is impaired. If this is the case, the group calculates the amount of
impairment as the difference between the recoverable amount of the associate and its carrying value and recognises the amount adjacent to ‘share of profit/(loss) of associates in the income
statement.
Profits and losses resulting from upstream and downstream transactions between the Group and its associate are recognised in the Group’s financial statements only to the extent of unrelated
investor’s interests in the associates. Unrealised losses are eliminated unless the transaction provides evidence of an impairment of the asset transferred.
Dilution gains and losses arising in investments in associates are recognised in the income statement.
- income and expenses for each income statement are translated at average exchange rates (unless this average is not a reasonable approximation of the cumulative effect of the rates
prevailing on the transaction dates, in which case income and expenses are translated at a rate on the dates of the transactions) ; and
- all resulting exchange differences are recognised in other comprehensive income.
On consolidation, exchange differences arising from the translation of the net investment in foreign entities are taken to other comprehensive income. When a foreign operation is sold, such
exchange differences are recognised in the profit or loss as part of the gain or loss on sale.
Goodwill and fair value adjustments arising on the acquisition of a foreign entity are treated as assets and liabilities of the foreign entity and translated at the closing rate.
Operating segments are reported in a manner consistent with internal reporting provided to the chief operating decision-maker. The chief operating decision-maker, who is responsible for
allocating resources and assessing performance of the operating segments, has been identified as the Group Leadership Council (GLC).
When the Group enters into a transaction in a joint operation, such as a sale or contribution of assets, the Group recognises gains and losses resulting from such a transaction only to the extent
of its interests in the joint operation.
When such transactions provide evidence of a reduction in the net realisable value of the assets to be sold or contributed to the joint operation, or of an impairment loss of those assets, those
losses are recognised fully by the Group.
When the Group enters into a transaction with a joint operation in which it is a joint operator, such as a purchase of assets, the Group does not recognise its share of the gains and losses until it
resells those assets to a third party.
When such transactions provide evidence of a reduction in the net realisable value of the assets to be purchased or of an impairment loss of those assets, the Group recognises its share of
those losses.
Functional and presentation currency
Items included in the financial statements of each of the Group’s entities are measured using the currency of the primary economic environment in which the entity operates (‘the functional
currency’). These consolidated financial statements are presented in Naira, which is the Group’s functional and presentation currency.
Foreign currency transactions are translated into the functional currency of the respective entity using the exchange rates prevailing on the dates of the transactions or the date of valuation
where items are re-measured. Foreign exchange gains and losses resulting from the settlement of such transactions and from the translation at year-end exchange rates of monetary assets
and liabilities denominated in foreign currencies are recognised in the income statement. except when deferred in other comprehensive income as qualifying cashflow hedges and qualifying
net investment hedges. Foreign exchange gains and losses that relate to borrowings and cash and cash equivalents are presented in the income statement within ‘finance income or costs’. All
other foreign exchange gains and losses are presented in the income statement within ‘other (losses)/gains – net’. Changes in the fair value of monetary securities denominated in foreign
currency classified as available for sale are analysed between translation differences resulting from changes in the amortised cost of the security and other changes in the carrying amount of
the security. Translation differences related to changes in amortised cost are recognised in profit or loss, and other changes in carrying amount are recognised in other comprehensive income.
Translation differences on non-monetary financial assets and liabilities such as equities held at fair value through profit or loss are recognised in profit or loss as part of the fair value gain or
loss. Translation differences on non-monetary financial assets, such as equities classified as available for sale, are included in other comprehensive income.
The results and financial position of all the Group entities (none of which has the currency of a hyperinflationary economy) that have a functional currency different from the presentation
currency are translated into the presentation currency as follows:
- assets and liabilities for each statement of financial position items presented, are translated at the closing rate at the reporting date;
In the separate financial statements of the Company, Investment in associates are measured at cost less impairment.
The group applies IFRS 11 to all joint arrangements as of 1 January 2012. Under IFRS 11 investments in joint arrangements are classified as either joint operations or joint ventures depending
on the contractual rights and obligations of each investor. Joint ventures are accounted for using the equity method.
Under the equity method of accounting, interests in joint ventures are initially recognised at cost and adjusted thereafter to recognise the Group’s share of the post-acquisition profits or losses
and movements in other comprehensive income. When the Group’s share of losses in a joint venture equals or exceeds its interests in the joint ventures (which includes any long-term interests
that, in substance, form part of the Group’s net investment in the joint ventures), the Group does not recognise further losses, unless it has incurred obligations or made payments on behalf of
the joint ventures.
Unrealised gains on transactions between the Group and its joint ventures are eliminated to the extent of the Group’s interest in the joint ventures. Unrealised losses are also eliminated unless
the transaction provides evidence of an impairment of the asset transferred. Accounting policies of the joint ventures have been changed where necessary to ensure consistency with the
policies adopted by the Group. The change in accounting policy is applied from 1 January 2012.
For the arrangements determined to be joint operations, the Group recognises in relation to its interest the following:
- its assets, including its share of any assets held jointly;
- its liabilities, including its share of any liabilities incurred jointly;
- its revenue from the sale of its share of the output arising from the joint operation;
- its share of the revenue from the sale of the output by the joint operation; and
- its expenses, including its share of any expenses incurred jointly.
The Group accounts for the assets, liabilities, revenues and expenses relating to its interest in a joint operation in accordance with the IFRSs applicable to the particular assets, liabilities,
revenues and expenses
Transactions with other parties in the joint operations
Page 19 of 73

OANDO PLC
Annual Consolidated and Separate Financial Statements
Notes to the consolidated financial statements
For the year ended 31 December 2014
(b) Revenue recognition
(i) Sale of goods
(ii) Sale of services
(iii) Construction contracts
(iv) Service concession arrangements
(v) Interest income
(vi) Dividend
(c) Property, plant and equipment
Revenue is measured at the fair value of the consideration received or receivable for sales of goods and services, in the ordinary course of the Group’s activities and is stated net of value-
added tax (VAT), rebates and discounts and after eliminating sales within the Group. The Group recognises revenue when the amount of revenue can be reliably measured, it is probable that
future economic benefits will flow to the entity and when specific criteria have been met for each of the Group’s activities as described below:
All categories of property, plant and equipment are initially recorded at cost. Buildings, freehold land and downstream plant & machinery are subsequently shown at fair value, based on
valuations by external independent valuers, less subsequent depreciation for buildings and plant & machinery. Valuations are performed with sufficient regularity to ensure that the fair value of
a revalued asset does not differ materially from its carrying amount. Any accumulated depreciation at the date of revaluation is eliminated against the gross carrying amount of the asset, and
the net amount is restated to the revalued amount of the asset. All other property, plant and equipment are stated at historical cost less depreciation. Historical cost includes expenditure that is
directly attributable to the acquisition of the items.
Subsequent costs are included in the asset’s carrying amount or recognised as a separate asset, as appropriate, only when it is probable that future economic benefits associated with the
item will flow to the Group and the cost of the item can be measured reliably. The carrying amount of the replaced part is derecognised. All other repairs and maintenance are charged to the
income statement during the financial period in which they are incurred.
Increases in the carrying amount arising on revaluation of property, plant & equipment are credited to other comprehensive income and shown as a component of other reserves in
shareholders' equity. Decreases that offset previous increases of the same asset are charged in other comprehensive income and debited against other reserves directly in equity; all other
decreases are charged to the income statement. Revaluation surplus is recovered through disposal or use of property plant and equipment. In the event of a disposal, the whole of the
revaluation surplus is transferred to retained earnings from other reserves. Otherwise, each year, the difference between depreciation based on the revalued carrying amount of the asset
charged to the income statement, and depreciation based on the assets original cost is transferred from "other reserves" to "retained earnings".
Freehold land is not depreciated. Depreciation on other assets is calculated using the straight line method to write down their cost or revalued amounts to their residual values over their
estimated useful lives as follows:
Buildings 20 – 50 years (2 – 5%)
In Gas & Power, revenue from construction projects is recognized in accordance with IAS 11 Construction Contracts with the use of the percentage-of-completion method provided that the
conditions for application are fulfilled. The percentage of completion is mainly calculated on the basis of the ratio on the balance sheet date of the output volume already delivered to the total
output volume to be delivered. The percentage of completion is also calculated from the ratio of the actual costs already incurred on the balance sheet date to the planned total costs (cost-to-
cost method). If the results of construction contracts cannot be reliably estimated, revenue is calculated using the zero profit method in the amount of the costs incurred and probably
recoverable.
Revenue from the provision of services is recognized in accordance with the percentage of completion method – provided that the conditions for application are fulfilled. In the area of services,
percentage of completion is mainly calculated using the cost-to-cost method.
In the context of concession projects, construction services provided are recognized as revenue in accordance with the percentage of completion method. In the operating phase of
concession projects, the recognition of revenue from operator services depends upon whether a financial or an intangible asset is to be received as consideration for the construction services
provided. If a financial asset is to be received, i.e. the operator receives a fixed payment from the client irrespective of the extent of use, revenue from the provision of operator services is
recognized according to the percentage of completion method.
If an intangible asset is to be received, i.e. the operator receives payments from the users or from the client depending on use, the payments for use are recognized as revenue according to
IAS 18 generally in line with the extent of use of the infrastructure by the users.
If the operator receives both use-dependent and use-independent payments, revenue recognition is split in accordance with the ratio of the two types of payment.
Interest income is recognized using the effective interest method. When a loan or receivable is impaired, the Group reduces the carrying amount to its recoverable amount, being the estimated
future cash flows discounted at the original effective interest rate of the instrument, and continues unwinding the discount as interest income. Interest income on impaired loans and receivables
are recognised using the original effective interest rate.
Dividend income is recognised when the right to receive payment is established.
Revenue from sales of oil, natural gas, chemicals and all other products is recognized at the fair value of consideration received or receivable, after deducting sales taxes, excise duties and
similar levies, when the significant risks and rewards of ownership have been transferred.
In Exploration & Production and Gas & Power, transfer of risks and rewards generally occurs when the product is physically transferred into a vessel, pipe or other delivery mechanism. For
sales to refining companies, it is either when the product is placed on-board a vessel or delivered to the counterparty, depending on the contractually agreed terms. For wholesale sales of oil
products and chemicals it is either at the point of delivery or the point of receipt, depending on contractual terms.
Revenue resulting from the production of oil and natural gas properties in which Oando has an interest with other producers is recognised on the basis of Oando’s working interest (entitlement
method).
Sales between subsidiaries, as disclosed in the segment information.
Sales of services are recognised in the period in which the services are rendered, by reference to the stage of completion of the specific transaction assessed on the basis of the actual service
provided as a proportion of the total services to be provided. The outcome of a transaction can be estimated reliably when all the following conditions are satisfied:
(a) the amount of revenue can be measured reliably;
(b) it is probable that the economic benefits associated with the transaction will flow to the entity;
(c) the stage of completion of the transaction at the reporting date can be measured reliably; and
(d) the costs incurred for the transaction and the costs to complete the transaction can be measured reliably.
In the Energy Services segment, revenue on rig and drilling services rendered to customers is recognised in the accounting period in which the services are rendered based on the number
of hours worked at agreed contractual day rates. The recognition of revenue on this basis provides useful information on the extent of service activity and performance during the period.
When the outcome of the transaction involving the rendering of services cannot be estimated reliably, revenue is recognised only to the extent of the expenses recognised that are recoverable.
Plant and machinery 8 – 20 years (5 – 121/2 %)
Equipment and motor vehicles 3 – 5 years (20 – 331/3 %)
Page 20 of 73
OANDO PLC
Annual Consolidated and Separate Financial Statements
Notes to the consolidated financial statement
For the year ended 31 December 2014
(d) Intangible assets
(a) Goodwill
(b) Computer software
(c) Concession contracts
(e) Impairment of non financial assets
(f) Financial instruments
Financial assets classification
Goodwill is allocated to cash-generating units (CGU’s) for the purpose of impairment testing. The allocation is made to those CGU’s expected to benefit from the business combination in
which the goodwill arose, identified according to operating segment. Each unit or group of units to which goodwill is allocated represents the lower level within the entity at which the goodwill is
monitored for internal management purposes.
Goodwill is tested annually for impairment or more frequently if events or changes in circumstances indicate a potential impairment. The carrying value of goodwill is compared to the
recoverable amount, which is the higher of value in use and the fair value less costs to sell. Any impairment is recognised immediately as an expense and is not subsequently reversed. Gains
and losses on disposal of an entity include the carrying amount of goodwill relating to the entity sold.
Acquired computer software licences are capitalised on the basis of the costs incurred to acquire and bring to use the specific software. Software licenses have a finite useful life and are
carried at cost less accumulated amortisation. Amortisation is calculated using straight line method to allocate the cost over their estimated useful lives of three to five years. The amortisation
period is reviewed at each balance sheet date. Costs associated with maintaining computer software programmes are recognised as an expense when incurred.
The assets’ residual values and useful lives are reviewed, and adjusted if appropriate, at each reporting period. An asset’s carrying amount is written down immediately to its estimated
recoverable amount if the asset’s carrying amount is greater than its estimated recoverable amount.
Gains and losses on disposal of property, plant and equipment are determined by comparing proceeds with carrying amount and are recognised within "other (losses)/gains - net" in the
income statement.
Property, plant and equipment under construction is not depreciated until they are put to use.
Goodwill arises from the acquisition of subsidiaries and is initially measured at cost, being the excess of the aggregate of the consideration transferred and the amount recognized for non-
controlling interest and any interest previously held over the net identifiable assets acquired, liabilities assumed. Goodwill on acquisitions of subsidiaries is included in intangible assets.
Where the cost of a part of an item of property, plant and equipment is significant when compared to the total cost, that part is depreciated separately based on the pattern which reflects how
economic benefits are consumed.
(iii) Available-for-sale financial assets
Available-for-sale financial assets are non-derivatives that are either designated in this category or not classified in any of the other categories. They are included in non-current assets unless
directors intend to dispose of the investment within twelve months of the reporting date.
Under this model, the right to receive payments (or other remuneration) is recognised in the concession operator’s statement of financial position under “Concession intangible assets”. This
right corresponds to the fair value of the asset under concession plus the borrowing costs capitalised during the construction phase. It is amortised over the term of the arrangement in a
manner that reflects the pattern in which the asset’s economic benefits are consumed by the entity, starting from the entry into service of the asset.
Amortisation on the intangible assets is calculated using the straight line method to write down their cost amounts to their residual values over their estimated useful life of 20 years.
Intangible assets that have an indefinite useful life or intangible assets not ready to use are not subject to amortisation and are tested annually for impairment. Assets that are subject to
amortisation are reviewed for impairment whenever events or changes in circumstances indicate that the carrying amount may not be recoverable. An impairment loss is recognised for the
amount by which the asset’s carrying amount exceeds its recoverable amount. The recoverable amount is the higher of an asset’s fair value less costs to sell and value in use. For the purposes
of assessing impairment, assets are grouped at the lowest levels for which there are largely independent inflows (cash-generating units). Prior impairments of non-financial assets (other than
goodwill) are reviewed for possible reversal at each reporting date.
The Group classifies its financial assets into the following categories: financial assets at fair value through profit or loss, loans and receivables, and available-for-sale financial assets. The
classification depends on the purpose for which the investments were acquired. Management determines the classification of its financial assets at initial recognition.
(i) Financial assets at fair value through profit or loss
This category has two sub-categories: financial assets held for trading, and those designated at fair value through profit or loss at inception. A financial asset is classified in this category if
acquired principally for the purpose of selling in the short term or if so designated by directors. Derivatives are also categorised as held for trading. Assets in this category are classified as
current assets if they are either held for trading or are expected to be realised within 12 months of the reporting date. Otherwise, they are classified as non-current. The Group's derivatives are
categorized as FVTPL unless they are designated as hedges and hedge accounting is applied; hedge accounting has not been applied for the Group’s derivatives in the periods presented.
(ii) Loans and receivables
Loans and receivables are non-derivative financial assets with fixed or determinable payments that are not quoted in an active market. They arise when the Group provides money, goods or
services directly to a debtor with no intention of trading the receivable. They are included in current assets, except for maturities greater than twelve months after the reporting date. These are
classified as non-current assets. The Group’s loans and receivables comprise of non-current receivables; trade and other receivables and cash and cash equivalents.
The Group, through its subsidiaries have concession arrangements to fund, design and construct gas pipelines on behalf of the Nigerian Gas Company (NGC). The arrangement requires the
Group as the operator to construct gas pipelines on behalf of NGC (the grantor) and recover the cost incurred from a proportion of the sale of gas to customers. The arrangement is within the
scope of IFRIC 12.
Under the terms of IFRIC 12, a concession operator has a twofold activity:
- a construction activity in respect of its obligations to design, build and finance a new asset that it makes available to the grantor: revenue is recognised on a stage of completion basis in
accordance with IAS 11;
- an operating and maintenance activity in respect of concession assets: revenue is recognised in accordance with IAS 18.
The intangible asset model: The operator has a right to receive payments from users in consideration for the financing and construction of the infrastructure. The intangible asset model also
applies whenever the concession grantor remunerates the concession operator to the extent of use of the infrastructure by users, but with no guarantees as to the amounts that will be paid to
the operator .
Page 21 of 73
OANDO PLC
Annual Consolidated and Separate Financial Statements
Notes to the consolidated financial statements
For the year ended 31 December 2014
Offsetting financial instruments
Recognition and measurement
Purchases and sales of financial assets are recognised on the trade date, which is the date at which the Group commits to purchase or sell the asset. Investments are initially recognised at fair
value plus transaction costs for all financial assets not carried at fair value through profit or loss.
Financial assets carried at fair value through profit or loss are initially recognised at fair value, and transaction cost are expensed in the income statement.
Available for-sale financial assets and financial assets at fair value through profit or loss are subsequently carried at fair value.
Loans and receivables are subsequently carried at amortised cost using the effective interest method.
Realised and unrealised gains and losses arising from changes in the fair value of the ‘financial assets at fair value through profit or loss’ category are included in the income statement within
"other (losses)/gains - net" in the period in which they arise. Dividend income from financial assets at fair value through profit or loss is recognised in the income statement as part of other
income when the Group's right to receive payment is established. Changes in the fair value of monetary and non-monetary securities classified as available-for-sale are recognised in other
comprehensive income. When securities classified as available-for-sale are sold or impaired, the accumulated fair value adjustments are included in the income statement as "gains and losses
from investment securities".
Derecognition
A financial asset (or, where applicable, a part of a financial asset or part of a group of similar financial assets) is primarily derecognised (i.e., removed from the Group’s consolidated statement
of financial position) when:
(i) The rights to receive cash flows from the asset have expired; or
(ii) The Group has transferred its rights to receive cash flows from the asset or has assumed an obligation to pay the received cash flows in full without material delay to a third party under a
‘pass-through’ arrangement; and either (a) the Group has transferred substantially all the risks and rewards of the asset, or (b) the Group has neither transferred nor retained substantially all
the risks and rewards of the asset, but has transferred control of the asset.
When the Group has transferred its rights to receive cash flows from an asset or has entered into a pass-through arrangement, it evaluates if and to what extent it has retained the risks and
rewards of ownership. When it has neither transferred nor retained substantially all of the risks and rewards of the asset, nor transferred control of the asset, the Group continues to recognise
the transferred asset to the extent of the Group’s continuing involvement. In that case, the Group also recognises an associated liability. The transferred asset and the associated liability are
measured on a basis that reflects the rights and obligations that the Group has retained.
Continuing involvement that takes the form of a guarantee over the transferred asset is measured at the lower of the original carrying amount of the asset and the maximum amount of
consideration that the Group could be required to repay.
Impairment of financial assets
The Group assess at the end of each reporting period whether there is objective evidence that a financial asset or group of financial assets is impaired. For debt securities, the Group uses the
criteria referred to in a) above. In the case of equity investment classified as available for sale, a significant or prolonged decline in the fair share of the security below its cost is also evidence
that the assets are impaired. If such evidence exists for available-for-sale financial assets, the cumulative loss (measured as the difference between the acquisition cost and the current fair
value, less any impairment loss on that financial asset previously recognized in profit or loss) is removed from equity and recognized in profit or loss. Impairment losses recognized in the
consolidated income statement on equity instruments are not reversed through the consolidated income statement. If in a subsequent period, the fair value of a debt instrument classified as
available for sale increases and the increase can be objectively related to an event occurring after the impairment loss was recognized in profit or loss, the impairment loss is reversed through
the consolidated income statement.
Financial assets and liabilities are offset and the net amount reported in the balance sheet when there is a legally enforceable right to offset the recognised amounts and there is an intention to
settle on a net basis or realise the asset and settle the liability simultaneously.
Receivables
Receivables are recognised initially at fair value and subsequently measured at amortised cost using the effective interest method less provision for impairment. A provision for impairment of
receivables is established when there is objective evidence that the Group will not be able to collect all the amounts due according to the original terms of receivables. Significant financial
difficulties of the debtor, probability that debtor will enter bankruptcy and default or delinquency in payment (more than 90 days overdue), are the indicators that a trade receivable is impaired.
The carrying amount of the asset is reduced through the use of an allowance account and the amount of the loss is recognised in the profit or loss within administrative costs. When a trade
receivable is uncollectible, it is written off against the allowance account for trade receivables. Subsequent recoveries of amounts previously written off are credited against administrative costs
in the profit or loss.
The amount of the provision is the difference between the carrying amount and the present value of estimated future cash flows, discounted at the original effective interest rate. If collection is
expected within the normal operating cycle of the Group they are classified as current, if not they are presented as non-current assets.
The Group assesses, at each reporting date, whether there is objective evidence that a financial asset or a group of financial assets is impaired. An impairment exists if one or more events that
has occurred since the initial recognition of the asset (an incurred ‘loss event’), has an impact on the estimated future cash flows of the financial asset or the group of financial assets that can
be reliably estimated. Evidence of impairment may include indications that the debtors or a group of debtors is experiencing significant financial difficulty, default or delinquency in interest or
principal payments, the probability that they will enter bankruptcy or other financial reorganisation and observable data indicating that there is a measurable decrease in the estimated future
cash flows, such as changes in arrears or economic conditions that correlate with defaults.
(i) Assets carried at amortized cost
The Group assesses at the end of each reporting period whether there is objective evidence that a financial asset or group of financial assets is impaired. A financial asset or group of financial
assets is impaired and impairment losses are recognized only if there is objective evidence of impairment as a result of one or more events that occurred after the initial recognition of the asset
(a “loss event”) and that loss event (or events) has an impact on the estimated future cash flows of the financial asset or group of financial assets that can be reliably estimated.
Evidence of impairment may include indications that the debtors or a group of debtors is experiencing significant financial difficulty, default or delinquency in interest or principal repayment,
the probability of bankruptcy and where observable, data or information indicate there is a measurable decrease in the estimated future cash flows.
For loans and receivables category, the amount of loss is measured as the difference between the assets carrying amount and the present value of estimated future cash flows (excluding
future credit loss that have been incurred) discounted at the financial assets original effective interest rate. The carrying amount of the asset is reduced and the amount of the loss is
recognized in the consolidated income statement. If a loan or held-to-maturity investment has a variable interest rate, the discount rate for measuring any impairment loss is the current effective
interest rate determined under the contract.
Objective subsequent decreases in impairment loss are reversed against previously recognized impairment loss in the consolidated income statement.
(ii) Assets classified as available for sale.
Page 22 of 73
OANDO PLC
Annual Consolidated and Separate Financial Statements
Notes to the consolidated financial statements
For the year ended 31 December 2014
Derivative financial instruments
Financial liabilities
Derecognition
Embedded derivatives
An embedded derivative is a component of a hybrid (combined) instrument that also includes a non-derivative host contract. An embedded derivative causes some or all of the cash flows that
otherwise would be required by the contract to be modified according to a specified interest rate, financial instrument price, commodity price, foreign exchange rate, index of prices or rates or
other variable (provided in the case of a non-financial variable that the variable is not specific to a party to the contract).
An embedded derivative is only separated and reported at fair value with gains and losses being recognised in the profit or loss component of the statement of comprehensive income when
the following requirements are met:
- where the economic characteristics and risks of the embedded derivative are not clearly and closely related to those of the host contract.
- the terms of the embedded derivative are the same as those of a stand-alone derivative; and
- the combined contract is not held for trading or designated at fair value through profit or loss.
Offsetting financial instruments
Financial assets and liabilities are offset and the net amount reported in the statement of financial position, when there is a legally enforceable right to offset the recognised amounts and there
is an intention to settle on a net basis or realise the asset and settle the liability simultaneously.
Initial recognition and measurement
Financial liabilities are classified, at initial recognition, as financial liabilities at fair value through profit or loss, loans and borrowings, payables, or as derivatives designated as hedging
instruments in an effective hedge, as appropriate.
All financial liabilities are recognised initially at fair value and, in the case of loans and borrowings and payables, net of directly attributable transaction costs. The Group’s financial liabilities
include trade and other payables, loans and borrowings including bank overdrafts, financial guarantee contracts and derivative financial instruments.
Subsequent measurement
The measurement of financial liabilities depends on their classification, as described below:
Financial liabilities at fair value through profit or loss
Financial liabilities at fair value through profit or loss include financial liabilities held for trading and financial liabilities designated upon initial recognition as at fair value through profit or loss.
Financial liabilities are classified as held for trading if they are incurred for the purpose of repurchasing in the near term. This category also includes derivative financial instruments entered into
by the Group that are not designated as hedging instruments in hedge relationships as defined by IAS 39. Separated embedded derivatives are also classified as held for trading unless they
are designated as effective hedging instruments.
A derivative is a financial instrument or contract whose value changes in response to the change in a specified interest rate, financial instrument price, commodity price, foreign exchange rate,
index of prices or rates, credit rating or credit index, or other variable, provided in the case of a non-financial variable that the variable is not specific to a party to the contract (sometimes
called the 'underlying'); requires no initial net investment or an initial net investment that is smaller than would be required for other types of contracts that would be expected to have a similar
response to changes in market factors; and is settled at a future date.
Derivatives are initially recognised at fair value on the date a derivative contract is entered into and are subsequently re-measured at their fair value. The resulting gains or losses are
recognised in profit or loss.
Financial liabilities designated upon initial recognition at fair value through profit or loss are designated at the initial date of recognition, and only if the criteria in IAS 39 are satisfied. The Group
has not designated any financial liability as at fair value through profit or loss.
Borrowings
Borrowings are recognised initially at fair value, net of transaction costs incurred. Borrowings are subsequently carried at amortised cost using the effective interest method; any differences
between proceeds (net of transaction costs) and the redemption value is recognised in the income statement over the period of the borrowings, using the effective interest method.
Borrowings are classified as current liabilities unless the Group has an unconditional right to defer settlement of the liability for at least twelve months after the reporting date.
The Group has designated certain borrowings at fair value with changes in fair value recognised through P&L.
Borrowing costs
Borrowing costs are recognised as an expense in the period in which they are incurred, except when they are directly attributable to the acquisition, construction or production of a qualifying
asset, which are assets that necessarily take a substantial period of time to get ready for their intended use or sale. These are added to the cost of the assets, until such a time as the assets are
substantially ready for their intended use or sale.
Convertible debts
On issue, the debt and equity components of convertible bonds are separated and recorded at fair value net of issue costs. The fair value of the debt component is estimated using the
prevailing market interest rate for similar non-convertible debt. This amount is classified as a liability and measured on an amortised cost basis until extinguished on conversion or maturity of
the bonds. The remainder of the proceeds is allocated to the conversion option and is recognised in equity, net of income tax effects. The carrying amount of the equity component is not re-
measured in subsequent years.
On early repurchase of the convertible bond, the consideration paid is allocated to the liability and equity components at the date of transaction. The liability component at the date of
transaction is determined using the prevailing market interest rate for similar non-convertible debt at the date of the transaction, with the equity component as the residual of the consideration
paid and the liability component at the date of transaction. The difference between the consideration paid for the repurchase allocated to the liability component and the carrying amount of the
liability at that date is recognised in profit or loss. The amount of consideration paid for the repurchase and transaction costs relating to the equity component is recognised in equity.
Payables
Payables are recognised initially at fair value and subsequently measured at amortised cost using the effective interest method. Payables are classified as current if they are due within one
year or less. If not, they are presented as non-current liabilities.
A financial liability is derecognised when the obligation under the liability is discharged or cancelled or expires. When an existing financial liability is replaced by another from the same lender
on substantially different terms, or the terms of an existing liability are substantially modified, such an exchange or modification is treated as the derecognition of the original liability and the
recognition of a new liability. The difference in the respective carrying amounts is recognised in the statement of profit or loss.
Page 23 of 73

OANDO PLC
Annual Consolidated and Separate Financial Statements
Notes to the consolidated financial statements
For the year ended 31 December 2014
(g)
(h)
(i)
(j)
(k)
Inventories
Inventories are stated at the lower of cost and net realisable value. Cost is determined using the weighted average method. The cost of finished goods and work in progress comprises raw
materials, direct labour, other direct costs and related production overheads (based on normal operating capacity), but excludes borrowing costs. Net realisable value is the estimated selling
price in the ordinary course of business, less applicable costs of completion and selling expenses.
Share capital
Ordinary shares are classified as equity. Share issue costs net of tax are charged to the share premium account.
Cash and cash equivalents
Cash and cash equivalents include cash in hand, deposits held at call with banks, other short term highly liquid investments with original maturities of three months or less, restricted cash and
bank overdrafts. Bank overdrafts are shown within borrowings in current liabilities in the consolidated statement of financial position.
Employee benefits
(i) Retirement benefit obligations
Defined contribution scheme
The Group operates a defined contribution retirement benefit schemes for its employees. A defined contribution plan is a pension plan under which the Group pays fixed contributions into a
separate entity. The Group has no legal or constructive obligations to pay further contributions if the fund does not hold sufficient assets to pay all employees the benefits relating to employee
service in the current and prior periods. The Group’s contributions to the defined contribution plan are charged to the profit or loss in the year to which they relate. The assets of the scheme are
funded by contributions from both the Group and employees and are managed by pension fund custodians.
Accounting for leases
Leases
The determination of whether an arrangement is, or contains, a lease is based on the substance of the arrangement at the inception of the lease. The arrangement is, or contains, a lease if
fulfilment is dependent on the use of a specific asset or assets and the arrangement conveys a right to use the asset (or assets), even if that right is not explicitly specified in an arrangement.
Leases in which a significant portion of the risks and rewards of ownership are retained by the lessor are classified as operating leases.
Group as a lessee
Finance leases, which transfer substantially all of the risks and benefits incidental to ownership of the leased item to the Group, are capitalised at the commencement of the lease at the fair
value of the leased property or, if lower, at the present value of the minimum lease payments. Lease payments are apportioned between finance charges and reduction of the lease liability to
achieve a constant rate of interest on the remaining balance of the liability. Finance charges are recognised in finance costs in the statement of profit or loss and other comprehensive income.
A leased asset is depreciated over the useful life of the asset. However, if there is no reasonable certainty that the Group will obtain ownership by the end of the lease term, the asset is
depreciated over the shorter of the estimated useful life of the asset and the lease term.
Operating lease payments are recognised as an operating expense in the statement of profit or loss and other comprehensive income on a straight line basis over the lease term.
Embedded leases
All take-or-pay contracts and concession contracts are reviewed at inception to determine whether they contain any embedded leases. If there are any embedded leases, they are assessed
as either finance or operating leases and accounted for accordingly.
Group as a lessor
Leases where the Group does not transfer substantially all of the risks and benefits of ownership of the asset are classified as operating leases. Initial direct costs incurred in negotiating an
operating lease are added to the carrying amount of the leased asset and recognised over the lease term on the same basis as rental income. Contingent rents are recognised as revenue in
the period in which they are earned.
Defined benefit scheme
The Group operates a defined benefit gratuity scheme in Nigeria, where members of staff who have spent 3 years or more in employment are entitled to benefit payments upon retirement. The
benefit payments are based on final emolument of staff and length of service. A defined benefit plan is a pension plan that is not a defined contribution plan. Typically defined benefit plans
define an amount of gratuity benefit that an employee will receive on retirement, usually dependent on one or more factors such as age, years of service and compensation.
The liability recognised in respect of defined benefit gratuity plans is the present value of the defined benefit obligation at the end of the reporting period less the fair value of plan assets,
together with past-service costs. The defined benefit obligation is calculated annually by an independent actuary using the projected unit credit method. The present value of the defined
benefit obligation is determined by discounting the estimated future cash outflows using the market rates on government bonds that have terms to maturity approximating to the terms of the
related pension obligation.
Remeasurements of the net defined benefit liability, which comprise actuarial gains and losses, the return on plan assets (excluding interest) and the effect of the asset ceiling (if any, excluding
interest), are recognised immediately in OCI. The Group determines the net interest expense (income) on the net defined benefit liability (asset) for the period by applying the discount rate
used to measure the defined benefit obligation at the beginning of the annual period to the then-net defined benefit liability (asset), taking into account any changes in the net defined benefit
liability (asset) during the period as a result of contributions and benefit payments. Net interest expense and other expenses related to defined benefit plans are recognised in the profit or loss.
Past-service costs are recognised immediately in income statement.
Gains or losses on curtailment or settlement are recognised in profit or loss when the curtailment or settlement occurs.
Page 24 of 73
OANDO PLC
Annual Consolidated and Separate Financial Statements
Notes to the consolidated financial statements
For the year ended 31 December 2014
(l)
(m)
(n) Exceptional items
(o) Dividend
Exceptional items are disclosed separately in the financial statements where it is necessary to do so to provide further understanding of the financial performance of the Group. They are
material items of income or expense that have been shown separately due to significance of their nature and amount.
Dividend payable to the Company’s shareholders is recognised as a liability in the consolidated financial statements period in which they are declared (i.e. approved by the shareholders).
(iii) Other share based payment transactions
Where the Group obtains goods or services in compensation for its shares or the terms of the arrangement provide either the entity or the supplier of those goods or services with a choice of
whether the Group settles the transaction in cash (or other assets) or by issuing equity instruments, such transactions are accounted as share based payments in the Group's financial
statements.
(iv) Profit-sharing and bonus plans
The group recognises a liability and an expense for bonuses and profit-sharing, based on a formula that takes into consideration the profit attributable to the company’s shareholders after
certain adjustments. The group recognises a provision where contractually obliged or where there is a past practice that has created a constructive obligation.
Provisions
Provisions for environmental restoration and legal claims are recognised when: the Group has a present legal or constructive obligation as a result of past events; it is more likely than not that
an outflow of resources will be required to settle the obligation; and the amount has been reliably estimated.
Where there are a number of similar obligations, the likelihood that an outflow will be required in settlement is determined by considering the class of obligations as a whole. A provision is
recognised even if the likelihood of an outflow with respect to any one item included in the same class of obligations may be small.
Provisions are measured at the present value of management’s best estimate of the expenditure required to settle the present obligation at the reporting date. The discount rate used to
determine the present value is a pre-tax rate which reflects current market assessments of the time value of money and the specific risk. The increase in the provision due to the passage of
time is recognised as interest expense.
Decommissioning liabilities
A provision is recognised for the decommissioning liabilities for underground tanks described in Note 6. Based on management estimation of the future cash flows required for the
decommissioning of those assets, a provision is recognised and the corresponding amount added to the cost of the asset under property, plant and equipment for assets measured using the
cost model. For assets measured using the revaluation model, subsequent changes in the liability are recognised in revaluation reserves through OCI to the extent of any credit balances
existing in the revaluation surplus reserve in respect of that asset. The present values are determined using a pre-tax rate which reflects current market assessments of the time value of money
and the risks specific to the obligation. Subsequent depreciation charges of the asset are accounted for in accordance with the Group’s depreciation policy and the accretion of discount (i.e.
the increase during the period in the discounted amount of provision arising from the passage of time) included in finance costs.
Estimated site restoration and abandonment costs are based on current requirements, technology and price levels and are stated at fair value, and the associated asset retirement costs are
capitalized as part of the carrying amount of the related tangible fixed assets. The obligation is reflected under provisions in the statement of financial position.
Current and deferred income tax
Income tax expense is the aggregate of the charge to profit or loss in respect of current and deferred income tax.
Current income tax is the amount of income tax payable on the taxable profit for the year determined in accordance with the relevant tax legislation. Education tax is provided at 2% of
assessable profits of companies operating within Nigeria. Tax is recognised in the income statement except to the extent that it relates to items recognised in OCI or equity respectively. In this
case, tax is also recognised in other comprehensive income or directly in equity, respectively.
Deferred income tax is provided in full, using the liability method, on all temporary differences arising between the tax bases of assets and liabilities and their carrying amount in the
consolidated financial statements. However, if the deferred income tax arises from the initial recognition of an asset or liability in a transaction other than a business combination that at the time
of the transaction affects neither accounting nor taxable profit or loss, it is not accounted for. Current and deferred income tax is determined using tax rates and laws enacted or substantively
enacted at the reporting date and are expected to apply when the related deferred income tax liability is settled.
Deferred income tax assets are recognised only to the extent that it is probable that future taxable profits will be available against which the temporary differences can be utilised. Deferred
income tax is provided on temporary differences arising on investments in subsidiaries and associates, except where the timing of the reversal of the temporary difference is controlled by the
Group and it is probable that the temporary difference will not reverse in the foreseeable future.
Deferred income tax assets and liabilities are offset when there is a legally enforceable right to offset current tax assets against current tax liabilities and when the deferred income taxes assets
and liabilities relate to income taxes levied by the same taxation authority on either the same taxable entity or different taxable entities where there is an intention to settle the balances on a net
basis.
(ii) Employee share-based compensation
The Group operates a number of equity-settled, share-based compensation plans, under which the entity receives services from employees as consideration for equity instruments (options/
awards) of the Group. The fair value of the employee services received in exchange for the grant of the option/awards is recognised as an expense. The total amount to be expensed is
determined by reference to the fair value of the options granted, including any market performance conditions(for example, an entity's share prices); excluding the impact of any service and
non-market performance vesting conditions (for example, profitability, sales growth targets and remaining an employee of the entity over a specified time period); and including impact of any
non-vesting conditions (for example, the requirement for employees to save).
Non-market vesting conditions are included in assumptions about the number of options that are expected to vest. The total amount expensed is recognised over the vesting period, which is
the period over which all of the specified vesting conditions are to be satisfied. At each reporting date, the entity revises its estimates of the number of options that are expected to vest based
on the non-market vesting conditions. It recognises the impact of the revision to original estimates, if any, in the income statement, with a corresponding adjustment to share-based payment
reserve in equity.
When the options are exercised, the Group issues new shares. The proceeds received net of any directly attributable transaction costs are credited to share capital (nominal value) and share
premium.
Share-based compensation are settled in Oando Plc’s shares, in the separate or individual financial statements of the subsidiary receiving the employee services, the share based payments
are treated as capital contribution as the subsidiary entity has no obligation to settle the share-based payment transaction.
The entity subsequently re-measures such an equity-settled share-based payment transaction only for changes in non-market vesting conditions.
In the separate financial statements of Oando Plc., the transaction is recognised as an equity-settled share-based payment transaction and additional investments in the subsidiary.
Page 25 of 73
OANDO PLC
Annual Consolidated and Separate Financial Statements
Notes to the consolidated financial statements
For the year ended 31 December 2014
(p) Upstream activities
(q)
(r)
(s) Non-current assets (or disposal groups) held for sale.
(t) Production underlift and overlift
(u) Fair value
Tangible fixed assets related to oil and gas producing activities are depleted on a unit of production basis over the proved developed reserves of the field concerned except in the case of
assets whose useful lives are shorter than the lifetime of the field, in which case the straight-line method is applied. Producible wells are not depleted until they form part of a producing field.
Unit of production rates are based on proved developed reserves, which are oil, gas and other mineral reserves estimated to be recovered from existing facilities using current operating
methods.
Rights and concessions are depleted on the unit-of-production basis over the total proved reserves of the relevant area.
Refer to note "5l" for information on the provision for estimated site restoration, abandonment costs and decommissioning costs.
Exploratory drilling costs are included in intangible assets, pending determination of proved reserves. Exploration & evaluation (E&E) costs related to each license/prospect are initially
capitalized and classified as tangible or intangible based on their nature. Such exploration and evaluation costs may include costs of license acquisition, geological and geophysical surveys,
seismic acquisition, exploration drilling and testing, directly attributable overheads and administrative expenses, but do not include general prospecting or evaluation costs incurred prior to
having obtained the legal rights to explore an area, which are expensed directly to the income statements as they are incurred.
Exploration and evaluation assets capitalised are not depleted and are carried forward until technical feasibility and commercial viability of extracting oil is considered to be determined. This is
when proven and /or probable reserves are determined to exist. Upon determination of proven and / or probable reserves, E&E assets attributable to those reserves are tested for impairment
and then transferred to production oil and gas assets and are then amortised against the results of successful finds on a 'unit of production' basis. Capitalised costs are written off when it is
determined that the well is dry.
Costs incurred in the production of crude oil from the Company's properties are charged to the profit or loss of the period in which they are incurred.
At each reporting date, the Board analyses the movements in the values of assets and liabilities which are required to be re-measured or re-assessed as per the Group’s accounting policies.
For this analysis, the Board verifies the major inputs applied in the latest valuation by agreeing the information in the valuation computation to contracts and other relevant documents. The
Board, in conjunction with the Group’s external valuers, also compares the changes in the fair value of each asset and liability with relevant external sources to determine whether the change is
reasonable. On an interim basis, the Board and the Group’s external valuers present the valuation results to the audit committee and the Group’s independent auditors. This includes a
discussion of the major assumptions used in the valuations.
Non-current assets are classified as assets held for sale when their carrying amount is to be recovered principally through a sale transaction and a sale is considered highly probable. They are
stated at lower of carrying amount and fair value less costs to sell.
The Group receives lifting schedules for oil production generated by the Group’s working interest in certain oil and gas properties. These lifting schedules identify the order and frequency with
which each partner can lift. The amount of oil lifted by each partner at the balance sheet date may not be equal to its working interest in the field. Some partners will have taken more than their
share (overlifted) and others will have taken less than their share (underlifted). The initial measurement of the overlift liability and underlift asset is at the market price of oil at the date of lifting,
consistent with the measurement of the sale and purchase. Overlift balances are subsequently measured at fair value, while Underlift balances are carried at lower of carrying amount and
current fair value.
Fair value is the price that would be received to sell an asset or paid to transfer a liability in an orderly transaction between market participants at the measurement date. The fair value
measurement is based on the presumption that the transaction to sell the asset or transfer the liability takes place either:
- In the principal market for the asset or liability, or
- In the absence of a principal market, in the most advantageous market for the asset or liability.
The principal or the most advantageous market must be accessible to the Group.
The fair value of an asset or a liability is measured using the assumptions that market participants would use when pricing the asset or liability, assuming that market participants act in their
economic best interest. A fair value measurement of a non-financial asset takes into account a market participant's ability to generate economic benefits by using the asset in its highest and
best use or by selling it to another market participant that would use the asset in its highest and best use. The Group uses valuation techniques that are appropriate in the circumstances and
for which sufficient data are available to measure fair value, maximising the use of relevant observable inputs and minimising the use of unobservable inputs.
All assets and liabilities for which fair value is measured or disclosed in the financial statements are categorized within the fair value hierarchy, described as follows, based on the lowest level
input that is significant to the fair value measurement as a whole:
Level 1 — Quoted (unadjusted) market prices in active markets for identical assets or liabilities
Level 2 — Valuation techniques for which the lowest level input that is significant to the fair value measurement is directly or indirectly observable
Level 3 — Valuation techniques for which the lowest level input that is significant to the fair value measurement is unobservable.
For assets and liabilities that are recognised in the financial statements on a recurring basis, the Group determines whether transfers have occurred between Levels in the hierarchy by re-
assessing categorization (based on the lowest level input that is significant to the fair value measurement as a whole) at the end of each reporting period. External valuers are involved for
valuation of significant assets, such as Available for sale financial assets, and significant liabilities. Involvement of external valuers is decided upon annually by the valuation committee after
discussion with and approval by the Group’s audit committee. Selection criteria include market knowledge, reputation, independence and whether professional standards are maintained.
Valuers are normally rotated every three years. The valuation committee decides, after discussions with the Group’s external valuers, which valuation techniques and inputs to use for each
case.
Impairment
All assets are reviewed whenever events or changes in circumstances indicate that the carrying amounts for those assets may not be recoverable. If assets are determined to be impaired, the
carrying amounts of those assets are written down to their recoverable amount, which is the higher of fair value less costs to sell and value in use, the latter being determined as the amount of
estimated risk-adjusted discounted future cash flows. For this purpose, assets are grouped into cash-generating units based on separately identifiable and largely independent cash inflows.
Estimates of future cash flows used in the evaluation for impairment of assets related to hydrocarbon production are made using risk assessments on field and reservoir performance and
include expectations about proved reserves and unproved volumes, which are then risk-weighted utilising the results from projections of geological, production, recovery and economic
factors.
Exploration and evaluation assets are tested for impairment by reference to group of cash-generating units (CGU). Such CGU groupings are not larger than an operating segment. A CGU
comprises of a concession with the wells within the field and its related assets as this is the lowest level at which outputs are generated for which independent cash flows can be segregated.
Management makes investment decisions/allocates resources and monitors performance on a field/concession basis. Impairment testing for E&E assets is carried out on a field by field basis,
which is consistent with the Group’s operating segments as defined by IFRS 8.
Impairments, except those related to goodwill, are reversed as applicable to the extent that the events or circumstances that triggered the original impairment have changed.
Impairment charges and reversals are reported within depreciation, depletion and amortisation. As of the reporting date no impairment charges or reversals were recognized.
Government grant
The Group, through its subsidiaries, benefits from the Bank of Industry (BOI) Scheme where the government through the BOI provide finance to companies in certain industries at subsidised
interest rates. Grants from the government are recognised at their fair value where there is a reasonable assurance that the grant will be received and the Group will comply with all attached
conditions. Government grants relating to costs are deferred and recognised in the income statement over the period necessary to match them with the costs that they are intended to
compensate.
Page 26 of 73

OANDO PLC
Annual Consolidated and Separate Financial Statements
Notes to the consolidated financial statements
For the year ended 31 December 2014
6. Significant accounting judgements, estimates and assumptions
i Fair value estimation
Financial instruments
For the purpose of fair value disclosures, the Group has determined classes of assets and liabilities on the basis of the nature, characteristics and risks of the asset or liability and the level of
the fair value hierarchy as explained above.
The preparation of the Group’s consolidated financial statements requires management to make judgements, estimates and assumptions that affect the reported amounts of revenues,
expenses, assets and liabilities, and the accompanying disclosures, and the disclosure of contingent liabilities at the date of the consolidated financial statements. Estimates and assumptions
are continuously evaluated and are based on management’s experience and other factors, including expectations of future events that are believed to be reasonable under the circumstances.
Uncertainty about these assumptions and estimates could result in outcomes that require a material adjustment to the carrying amount of assets or liabilities affected in future periods. In
particular, the Group has identified the following areas where significant judgements, estimates and assumptions are required. Further information on each of these areas and how they impact
the various accounting policies are described below and also in the relevant notes to the financial statements. Changes in estimates are accounted for prospectively.
Judgements
In the process of applying the Group’s accounting policies, management has made the following judgements, which have the most significant effect on the amounts recognised in the
consolidated financial statements:
(a) Joint arrangements (Note 44)
Judgement is required to determine when the Group has joint control over an arrangement, which requires an assessment of the relevant activities and when the decisions in relation to those
activities require unanimous consent. The Group has determined that the relevant activities for its joint arrangements are those relating to the operating and capital decisions of the
arrangement, including the approval of the annual capital and operating expenditure work program and budget for the joint arrangement, and the approval of chosen service providers for any
major capital expenditure as required by the joint operating agreements applicable to the entity’s joint arrangements. The considerations made in determining joint control are similar to those
necessary to determine control over subsidiaries, as set out in Note 4.1. Judgement is also required to classify a joint arrangement. Classifying the arrangement requires the Group to assess
their rights and obligations arising from the arrangement. Specifically, the Group considers:
- The structure of the joint arrangement – whether it is structured through a separate vehicle
- When the arrangement is structured through a separate vehicle, the Group also considers the rights and obligations arising from: the legal form of the separate vehicle; the terms of the
contractual arrangement; and other facts and circumstances, considered on a case by case basis. This assessment often requires significant judgement. A different conclusion about both joint
control and whether the arrangement is a joint operation or a joint venture, may materially impact the accounting.
(b) Contingencies (Note 41)
Contingent liabilities may arise from the ordinary course of business in relation to claims against the Group, including legal, contractor, land access and other claims. By their nature,
contingencies will be resolved only when one or more uncertain future events occur or fail to occur. The assessment of the existence, and potential quantum, of contingencies inherently
involves the exercise of significant judgement and the use of estimates regarding the outcome of future events.
(c) Service concessions
The contracts between Nigerian Gas Company (NGC) and Gaslink Nigeria Limited for the construction of gas transmission pipelines fall within the scope of IFRIC 12. Management is of the
opinion that the recovery of construction and interest costs are conditional upon sale of gas as specified in the contract and does not give the Group an unconditional right to receive cash.
Hence an intangible asset has been recognised at the present value of the estimated value of capital recovery and interest charges from the sale of gas over the duration of the contract.
The fair value of financial instruments that are not traded in an active market (for example, over-the-counter derivatives) is determined by using valuation techniques. These include the use of
recent arm’s length transactions, reference to other instruments that are substantially the same, discounted cash flows analysis, and option pricing models refined to reflect the issuer’s specific
circumstances. See Note 7 on details of fair value estimation methods applied by the Group.
The carrying value less impairment provision of trade receivables and payables are assumed to approximate their fair values. The fair value of financial liabilities for disclosure purposes is
estimated by discounting the future contractual cash flows at the current market interest rate that is available to the Group for similar financial instruments.
Employee share based payments
The fair value of employee share options is determined using valuation techniques such as the binomial lattice/black scholes model . The valuation inputs such as the volatility, dividend yield. is
based on the market indices of Oando Plc.'s shares.
(d) Capitalisation of borrowing costs
Management exercises sound judgement when determining which assets are qualifying assets, taking into account, among other factors, the nature of the assets. An asset that normally takes
more than one year to prepare for use is usually considered as a qualifying asset. Management determined that the fourth rig (Respect) and exploration and evaluation assets are qualifying
assets and therefore eligible for capitalisation of borrowing cost during the year reviewed.
(e) Exploration costs
Exploration costs are capitalised pending the results of evaluation and appraisal to determine the presence of commercially producible quantities of reserves. Following a positive
determination, continued capitalisation is subject to further exploration or appraisal activity in that either drilling of additional exploratory wells is under way or firmly planned for the near future
or other activities are being undertaken to sufficiently progress the assessment of reserves and the economic and operating viability of the project. In making decisions about whether to
continue to capitalise exploration costs, it is necessary to make judgments about the satisfaction of each of these conditions. If there is a change in one of these judgments in any period, then
the related capitalised exploration costs would be expensed in that period, resulting in a charge to the income statement.
Estimates and assumptions
The key assumptions concerning the future and other key sources of estimation uncertainty at the reporting date that have a significant risk of causing a material adjustment to the carrying
amounts of assets and liabilities within the next financial year, are described below. The Group based its assumptions and estimates on parameters available when the consolidated financial
statements were prepared. Existing circumstances and assumptions about future developments, however, may change due to market change or circumstances arising beyond the control of
the Group. Such changes are reflected in the assumptions when they occur.
The estimates and assumptions that have significant risk of causing material adjsutment to the carrying amounts of asstes and liabilities within the next financial year are addressed below:
The fair value of financial instruments traded in active markets (such as available-for-sale securities) is based on quoted market prices at the reporting date. The quoted market price used for
financial assets held by the Group is the current bid price.
Page 27 of 73
OANDO PLC
Annual Consolidated and Separate Financial Statements
Notes to the consolidated financial statements
For the year ended 31 December 2014
ii
iii Impairment of goodwill
iv
v
vi
vii
Land, building and plant and machinery are carried at revalued amounts. Formal revaluations are performed every three years by independent experts for these asset classes. Appropriate
indices, as determined by independent experts, are applied in the intervening periods to ensure that the assets are carried at fair value at the reporting date. Judgement is applied in the
selection of such indices. Fair value is derived by applying internationally acceptable and appropriately benchmarked valuation techniques such as depreciated replacement cost or market
value approach.
The depreciated replacement cost approach involves estimating the value of the property in its existing use and the gross replacement cost. For this appropriate deductions are made to allow
for age, condition and economic or functional obsolescence, environmental and other factors that might result in the existing property being worth less than a new replacement.
The market value approach involves comparing the properties with identical or similar properties, for which evidence of recent transaction is available or alternatively identical or similar
properties that are available in the market for sale making adequate adjustments on price information to reflect any differences in terms of actual time of the transaction, including legal,
physical and economic characteristics of the properties.
The useful life of each asset group has been determined by independent experts based on the build quality, maintenance history, operational regime and other internationally recognised
benchmarks relative to the assets.
Defined Benefits (Gratuity)
The present value of the defined benefits obligations depend on a number of factors that are determined on an actuarial basis using a number of assumptions. The assumptions used in
determining the net cost (income) for the benefits include appropriate discount rate. Any changes in these assumptions will impact the carrying amount of the obligations.
The Group determines the appropriate discount rate at the end of each year. This is the interest rate that should be used to determine the present value of estimated future cash outflows
expected to be required to settle the gratuity obligations. In determining the appropriate discount rate, the Group considers the interest rates of high-quality government bonds that are
denominated in the currency in which the benefits will be paid and that have terms to maturity approximating the terms of the related gratuity obligation.
Other key assumptions for the obligations are based in part on current market conditions. Additional information is disclosed in Note 33.
Property, plant and equipment
Provision for environmental restoration
The Group has underground tanks for storage of petroleum products in its outlets. Environmental damage caused by such substances may require the Group to incur restoration costs to
comply with the environmental protection regulations in the various jurisdictions in which the Group operates, and to settle any legal or constructive obligation. In addition, the Group has
decommissioning obligations in respect of its oil and gas interests in the Niger Delta area.
Analysis and estimates are performed by the Group, together with its legal advisers, in order to determine the probability, timing and amount involved with probable required outflow of
resources. Estimated restoration costs, for which disbursements are determined to be probable, are recognised as a provision in the Group’s financial statements. The assumptions used for
the estimates are reviewed on a frequent basis (for example, 3 years to under-ground tanks). The difference between the final determination of such obligation amounts and the recognised
provisions are reflected in the income statement.
Estimation of oil and gas reserves
Oil and gas reserves are key elements in Oando’s investment decision-making process that is focused on generating value. They are also an important factor in testing for impairment.
Changes in proved oil and gas reserves will affect the standardised measure of discounted cash flows and unit-of-production depreciation charges to the income statement.
Proved oil and gas reserves are the estimated quantities of crude oil that geological and engineering data demonstrate with reasonable certainty to be recoverable in future years from known
reservoirs under existing economic and operating conditions, i.e., prices and costs as of the date the estimate is made. Proved developed reserves are reserves that can be expected to be
recovered through existing wells with existing equipment and operating methods. Estimates of oil and gas reserves are inherently imprecise, require the application of judgement and are
subject to future revision. Accordingly, financial and accounting measures (such as the standardised measure of discounted cash flows, depreciation, depletion and amortisation charges, and
decommissioning and restoration provisions) that are based on proved reserves are also subject to change.
Furthermore, estimates of proved reserves only include volumes for which access to market is assured with reasonable certainty. All proved reserves estimates are subject to revision, either
upward or downward, based on new information, such as from development drilling and production activities or from changes in economic factors, including product prices, contract terms or
development plans. Changes in the technical maturity of hydrocarbon reserves resulting from new information becoming available from development and production activities have tended to
be the most significant cause of annual revisions.
In general, estimates of reserves for undeveloped or partially developed fields are subject to greater uncertainty over their future life than estimates of reserves for fields that are substantially
developed and depleted. As a field goes into production, the amount of proved reserves will be subject to future revision once additional information becomes available through, for example,
the drilling of additional wells or the observation of long-term reservoir performance under producing conditions. As those fields are further developed, new information may lead to revisions.
Changes to Oando’s estimates of proved reserves, particularly proved developed reserves, also affect the amount of depreciation, depletion and amortisation recorded in the consolidated
financial statements for property, plant and equipment related to hydrocarbon production activities. These changes can for example be the result of production and revisions of reserves. A
reduction in proved developed reserves will increase the rate of depreciation, depletion and amortisation charges (assuming constant production) and reduce income.
Although the possibility exists for changes in reserves to have a critical effect on depreciation, depletion and amortisation charges and, therefore, income, it is expected that in the normal
course of business the diversity of the Oando portfolio will constrain the likelihood of this occurring.
Service concessions
The intangible asset has been recognised at the present value of the estimated value of capital recovery and interest charges from the sale of gas over the duration of the contracts. The
assessment of the present value of the estimated capital recovery requires the use of estimates and assumptions. The volume of sales of gas over the term of the contract is the main driver for
capital recovery. Estimates of future cash flows for recovery of construction costs have been based on the assumption that the sale of gas from the pipeline will approximate the total capacity
of the pipeline.
The Group tests annually whether goodwill has suffered any impairment, in accordance with the accounting policy stated in Note 4. The recoverable amounts of cash-generating units have
been determined based on value-in-use calculations. These calculations require the use of estimates. See Note 16 for detailed assumptions and methods used for impairment calculation.
If the estimated pre-tax discount rate applied to the discounted cash flows of the Marketing and Supply and trading division (Downstream division) had been higher by 17.7% (i.e. 33% instead
of 15.3%), the Group would have recognised an impairment against goodwill of N656million. For other segments (Gas and Power, Energy Services and Exploration & Production), no
impairment would have resulted from application of discount rates higher by 48% respectively.
Income taxes
The Group is subject to income taxes in various jurisdictions. Significant judgment is required in determining the Group’s provision for income taxes. There are many transactions and
calculations for which the ultimate tax determination is uncertain during the ordinary course of business. The Group recognises liabilities for anticipated tax audit issues based on estimates of
whether additional taxes will be due. Where the final tax outcome of these matters is different from the amounts that were initially recorded, such differences will impact the income tax and
deferred tax provisions in the period in which such determination is made.
Page 28 of 73
OANDO PLC
Annual Consolidated and Separate Financial Statements
Notes to the consolidated financial statements
For the year ended 31 December 2014
viii
ix
x
7 Financial risk management
The assumption that the volume of sales over the term of the contract will approximate the total capacity of the pipeline has been based on management’s estimate of existing and future
demand for gas in a region. Estimates of future cash flows for recovery of interest costs were arrived at assuming current bank interest rates applied up until the full recovery of the investment.
Other assumptions include exchange rate of N184.79/ 1USD and applicable FGN bond discount rate, which does not include the specific industry and market risks.
Akute lease
The Group has accounted for the power purchase arrangement between Lagos State Govt and Akute power Limited for the construction of an Electrical Power Plant as a finance lease. Hence
the asset has been recognised at the present value of the estimated lease payments. The estimated lease payments were computed by making assumptions about the total annual volume of
electricity delivered, discounted at the rate implicit in the contract of 17%.
Impairment of assets
For oil and gas properties with no proved reserves, the capitalisation of exploration costs and the basis for carrying those costs on the statement of financial position are explained above. For
other properties, the carrying amounts of major property, plant and equipment are reviewed for possible impairment annually, while all assets are reviewed whenever events or changes in
circumstances indicate that the carrying amounts for those assets may not be recoverable. If assets are determined to be impaired, the carrying amounts of those assets are written down to
their recoverable amount. For this purpose, assets are grouped into cash-generating units based on separately identifiable and largely independent cash inflows. Impairments can also occur
when decisions are taken to dispose off assets.
Impairments, except those relating to goodwill, are reversed as applicable to the extent that the events or circumstances that triggered the original impairment have changed. Estimates of
future cash flows are based on current year end prices, management estimates of future production volumes, market supply and demand and product margins. Expected future production
volumes, which include both proved reserves as well as volumes that are expected to constitute proved reserves in the future, are used for impairment testing because the Group believes this
to be the most appropriate indicator of expected future cash flows, used as a measure of value in use.
Estimates of future cash flows are risk-weighted to reflect expected cash flows and are consistent with those used in the Group’s business plans. A discount rate based on the Group’s
weighted average cost of capital (WACC) is used in impairment testing. Expected cash flows are then risk-adjusted to reflect specific local circumstances or risks surrounding the cash flows.
Oando reviews the discount rate to be applied on an annual basis. The discount rate applied in 2014 was 12% (2013: 15.18%). Asset impairments or their reversal will impact income.
At 31 December 2014, if the Naira had strengthened/weakened by 12% against the US Dollar with all other variables held constant, consolidated pre tax profit for the year would have been
N11.33 billion higher/lower mainly as a result of US Dollar denominated loan balances. (2013: if the Naira had strengthened/weakened by 12% against the US Dollar with all other variables held
constant, consolidated pre tax profit for the year would have been N27.98 billion higher/lower mainly as a result of US Dollar denominated trade payables and loan balances.)
(ii) Price risk
The Group is exposed to equity security price risk because of its investments in the marketable securities classified as available-for-sale. The shares held by the Group are traded on the
Nigerian Stock Exchange (NSE). A 10% change in the market price of the instrument would result in N19.7m gain/loss, to be recognised in equity.
Fluctuations in the international prices of crude oil would have corresponding effects on the results of operations of the Group. In order to mitigate against the risk of fluctuation in international
crude oil prices, the Group hedges its exposure to fluctuations in the price of the commodity by entering into hedges for minimum volumes and prices in US$ per barrel of oil.
Market risk
(i) Foreign exchange risk
The Group operates internationally and is exposed to foreign exchange risk arising primarily from various product sourcing activities as well as other currency exposures, mainly US Dollars.
Foreign exchange risk arises when future commercial transactions and recorded assets and liabilities are denominated in a currency that is not the entity’s functional currency e.g. foreign
denominated loans, purchases and sales transactions etc. The Group manages their foreign exchange risk by revising cost estimates of orders based on exchange rate fluctuations, forward
contracts and cross currency swaps transacted with commercial banks. The Group also apply internal hedging strategies with subsidiaries with USD functional currency.
At 31 December 2014, if the Naira had strengthened/weakened by 12% against the US Dollar with all other variables held constant, consolidated pre tax profit for the year would have been
N1.26 billion lower/higher mainly as a result of US Dollar denominated bank balances and receivables (2013: if the Naira had strengthened/weakened by 12% against the US Dollar with all
other variables held constant, consolidated pre tax profit for the year would have been N5.80 billion lower/higher mainly as a result of US Dollar denominated bank balances).
Useful lives and residual value of property, plant and equipment
The residual values, depreciation methods and estimated useful lives of property, plant and equipment are reviewed at least on an annual basis. The review is based on the current market
situation.
The residual value of the various classes of assets were estimated as follows:
Land and building - 10%
Plant and machinery - 10%
Motor vehicles – 10%
Furniture and fittings - 10%
Computer and IT equipment - 10%
These estimates have been consistent with the amounts realised from previous disposals for the various asset categories.
The Group’s activities expose it to a variety of financial risks: market risk (including currency risk, fair value interest rate risk, cash flows interest rate risk and price risk), credit risk and liquidity
risk. The Group’s overall risk management programme focuses on the unpredictability of financial markets and seeks to minimise potential adverse effect on its financial and operational
performance.
The Group has a risk management function that manages the financial risks relating to the Group’s operations under the policies approved by the Board of Directors. The Group’s liquidity,
credit, foreign currency, interest rate and price risks are continuously monitored. The Board approves written principles for overall risk management, as well as written policies covering specific
areas, such as foreign exchange risk, interest-rate risk, credit risk, and investing excess liquidity. The Group uses derivative financial instruments to manage certain risk exposures.
In August 2014, Oando Energy Resources Ltd (OER) entered into financial commodity contracts which hedge crude oil sales associated with assets acquired in the COP Acquisition (the
“Acquisition Assets”) (as required under the $450 million senior secured loan facility) and Legacy Assets (as required under the $350 million corporate loan facility). The table below
summarizes the nature of the hedges executed pursuant to these arrangements:
Page 29 of 73
OANDO PLC
Annual Consolidated and Separate Financial Statements
Notes to the consolidated financial statements
For the year ended 31 December 2014
VolumePosition Remaining term Fixed ($) Strike ($) Premium (bbl/d)
Acquisition assets:
- Fixed sell, purchased call Jan. 2015 to July 2017 97.00 110.55 - 5,333
- Purchased put Jan. 2015 to July 2017 - 110.55 13.55 2,667
Total volume - Acquisition Assets 8,000
Legacy Assets:
- Purchased put Jan. 2015 to July 20192 - 95 - 115 11.50 - 11.84 2,223
Total volume - Legacy Assets
The hedge was extinguished subsequent to 31 December 2014.
(iii) Cash flow and fair value interest rate risk
Trade receivables Group Group Company Company
2014 2013 2014 2013
N'000 N'000 N'000 N'000Current - Neither past due nor impaired 25,985,079 18,137,787 - -
Past due but not impaired
- by up to 30 days 11,719,627 10,170,860 - -
- by 31 to 60 days 4,223,590 4,207,418 - -
- later than 60 days 13,643,678 12,371,682 - -
Total past due but not impaired 29,586,895 26,749,960 - -
55,571,974 44,887,747 - -
Other receivables Group Group Company Company
2014 2013 2014 2013
N'000 N'000 N'000 N'000Current - Neither past due nor impaired 70,261,776 86,122,449 174,574,149 123,343,383
Management monitors the aging analysis of trade receivables and other receivables on a periodic basis. The analysis of current, past due but not impaired and impaired trade receivables is
as follows:
Receivables are assessed for impairment at the end of the reporting period where there is any objective evidence of impairment. If any such evidence is identified, the Group measures
receivables as the difference between the carrying amount and the present value of estimated future cash flows, discounted at the original effective interest rate.
Included in non-current receivable is underlift receivable of N13.43 billion that is past due and impaired. N38.7 billion of the other receivables of N59.6 billion has also been classified as
doubtful on collection, and therefore impaired.
For the Company, receivables are largely intercompany receivable, and are neither past due nor impaired.
The Group holds short term, highly liquid bank deposits at fixed interest rates. No limits are placed on the ratio of variable rate borrowing to fixed rate borrowing. The effect of an increase or
decrease in interest on bank deposit by 100 point basis is not material.
The Group does not have any investments in quoted corporate bonds that are of fixed rate and carried at fair value through profit or loss. Therefore the Group is not exposed to fair value
interest rate risk.
The Group has borrowings at variable rates, which expose the Group to cash flow interest rate risk. The Group regularly monitors financing options available to ensure optimum interest rates
are obtained. At 31 December 2014, an increase/decrease of 100 basis points on LIBOR/MPR would have resulted in a decrease/increase in consolidated pre tax profit of N1.86 billion
(2013:N1.03 billion), mainly as a result of higher/lower interest charges on variable rate borrowings.
Management enters into derivative contracts as an economic hedge against interest and foreign currency exposures. As at the reporting date, the Group does not have any outstanding
derivatives with respect to interest and foreign currency hedge.
The fair value of the derivative liabilities is included in note 32 and the related fair value losses included in interest expense in note 12.
The effect of the changes in interest rate on short term deposits is not material.
Credit risk
Credit risk is managed on a Group basis. Credit risk arises from cash and cash equivalents, non-current receivables and deposits with banks as well as trade and other receivables. The Group
has no significant concentrations of credit risk. It has policies in place to ensure that credit limits are set for commercial customers taking into consideration the customers’ financial position,
past trading relationship, credit history and other factors. Sales to retail customers are made in cash. The Group has policies that limit the amount of credit exposure to any financial institution.
Price/Unit1
1 Based on the weighted average price/unit for the remainder of contract.
2 Remaining term excludes February 2016 to January 2017.
The effect of the Acquisition Asset hedges is to fix the price of oil that OER receives, on the specific volumes at $97/bbl until the benchmark price of dated Brent crude oil reaches 110.55/bbl;
when dated Brent crude oil price exceeds $110.55/bbl, OER will receive the incremental price above $110.55/bbl. The Acquisition Asset hedges account for 8,000 bbl/day.
The effect of the Legacy Asset hedges is to fix the price of oil that OER receives, on the specific volumes at an average price of $91/bbl until the benchmark price of dated Brent crude oil
reaches the cap price (which ranges from $95/bbl to $115/bbl); when dated Brent crude oil price exceeds the cap price OER will receive the incremental price above cap price. The Legacy
Asset hedges account for an average of 2,223 bbl/day.
If the price of crude oil increase/decrease by 10% assuming all other variables remain constant, consolidated pre tax profit for the year would have been $83.9 million/$76.8million higher/lower.
Page 30 of 73

OANDO PLC
Annual Consolidated and Separate Financial Statements
Notes to the consolidated financial statements
For the year ended 31 December 2014
Counter parties without external credit rating
Non current receivables Group Group Company Company
2014 2013 2014 2013
N'000 N'000 N'000 N'000Group 2 - 11,283,000 - 7,345,639
Trade receivables Group Group Company Company
2014 2013 2014 2013
N'000 N'000 N'000 N'000Group 1 8,637,301 5,771,313 - -
Group 2 16,008,062 9,262,684 - -
Group 3 1,339,716 3,103,790 - -
25,985,079 18,137,787 - -
Other receivables Group Group Company Company
2014 2013 2014 2013
N'000 N'000 N'000 N'000Group 2 70,261,776 86,122,449 174,574,149 123,343,383
Derivative financial instruments
Group 2 57,551,454 1,610,696 1,662,948 1,587,922
Definition of the ratings above:
Group 1
Group 2
Group 3
GroupLess than 1 year Between 1 and
2 years
Between 2 and 5
years
Over 5 years Total
N'000 N'000 N'000 N'000 N'000
At 31 December 2014:
Borrowing (excluding finance lease liabilities) 408,538,742 126,373,038 45,641,466 22,199,176 602,752,422
Trade and other payables 156,627,553 - - 156,627,553
Derivative financial instruments - Convertible options 3,608,768 - - - 3,608,768
At 31 December 2013:
Borrowing (excluding finance lease liabilities) 183,412,635 45,613,868 50,238,191 2,796,853 282,061,547
Trade and other payables 124,059,301 - - - 124,059,301
Derivative financial instruments - interest rate swap 456,807 - - - 456,807
Derivative financial instruments - cross currency swap 575,348 - - - 575,348
Company Less than 1 year
Between 1 and
2 years
Between 2 and 5
years Over 5 years Total
N'000 N'000 N'000 N'000 N'000
At 31 December 2014:
Borrowing (excluding finance lease liabilities) 32,969,130 89,275,588 - - 122,244,718
Trade and other payables 119,978,134 - - - 119,978,134
Derivative financial instruments - interest rate swap - - - - -
Derivative financial instruments - Convertible options 3,608,768 - - - 3,608,768
At 31 December 2013:
Borrowing (excluding finance lease liabilities) 32,250,797 15,017,010 - - 47,267,807
Trade and other payables 109,081,976 - - - 109,081,976
Derivative financial instruments - cross currency swap 575,348 - - - 575,348
Credit quality of financial assets
The credit quality of financial assets that are neither past due nor impaired have been assessed by reference to historical information about counterparty default rates:
New customers (less than 6 months)
existing customers (more than 6 months) with no defaults in the past
existing customers (more than 6 months) with some defaults in the past
Liquidity risk
Cash flow forecasting is performed in the operating entities of the Group and aggregated by Group finance. Group finance monitors cash forecast on a periodic basis in response to liquidity
requirements of the Group. This helps to ensure that the Group has sufficient cash to meeting operational needs while maintaining sufficient headroom on its undrawn committed borrowing
facilities (note 26 and 30). Such forecasting takes into consideration the Group’s debt financing plans, covenant compliance and compliance with internal targets.
The table below analyses the Group’s financial liabilities into relevant maturity groupings based on the remaining period at the reporting date to the contractual maturity date. The amounts
disclosed in the table below are the contractual undiscounted cash flows. Balances due within 12 months equal their carrying balances, as the impact of discounting is not significant.
Page 31 of 73
OANDO PLC
Annual Consolidated and Separate Financial Statements
Notes to the consolidated financial statement
For the year ended 31 December 2014
Group Group Company Company
2014 2013 2014 2013
N'000 N'000 N'000 N'000
Total borrowings 473,342,200 255,285,053 121,833,745 44,005,050
Less: cash and cash equivalents (Note 26) (27,439,760) (23,887,497) (2,846,607) (1,486,292)
Restricted cash (14,194,363) (3,798,258) - (327,107)
Net debt 431,708,077 227,599,298 118,987,138 42,191,651
Total equity 45,506,703 162,368,077 28,302,230 106,089,751
Total capital 477,214,780 389,967,375 147,289,368 148,281,402
Gearing ratio 90% 58% 81% 28%
The table below analyses financial instruments carried at fair value, by valuation method. The different levels have been defined as follows:
Financial instruments measured at fair value Level 1 Level 2 Level 3 Total
N'000 N'000 N'000 N'000Assets
Available for sale financial assets
- Equity securities 197,837 - - 197,837
Derivative financial assets
- Commodity option contracts - 55,427,507 - 55,427,507
- Embedded derivative in Akute - 2,123,947 2,123,947
Total assets 197,837 57,551,454 - 57,749,291
Liabilities
Derivative financial liabilities:
- Convertible options - - 3,608,768 3,608,768
Total liabilities - - 3,608,768 3,608,768
The following table presents the Group’s assets and liabilities that are measured at fair value at 31 December 2013.
Balance Level 1 Level 2 Level 3 Total
N'000 N'000 N'000 N'000Assets
Available for sale financial assets
- Equity securities 183,930 - - 183,930
Derivative financial assets
- Foreign currency forward - 384,967 - 384,967
- Interest rate swap - 4,933 - 4,933
- Embedded derivative in Akute - 1,220,796 1,220,796
Total assets 183,930 1,610,696 - 1,794,626
Liabilities
Derivative financial liabilities
- Interest rate swap - 397,798 - 397,798
- Convertible options - 312,573 - 312,573
- Cross currency swap - 539,964 - 539,964
- Share warrants - 277,065 - 277,065
Financial liabilities at fair value through profit and loss
- Borrowing (Capped loss swap loan) - 520,656 - 520,656
Total liabilities - 2,048,056 - 2,048,056
- Inputs for the asset or liability that are not based on observable market data (that is, unobservable inputs) (level 3).
The following table presents the Group’s assets and liabilities that are measured at fair value at 31 December 2014. See note 15 for disclosures of the Buildings, freehold land and plant &
machinery that are measured at fair value and note 27 for disclosures of the disposal groups held for sale that are measured at fair value.
Capital risk management
The Group’s objectives when managing capital are to safeguard the Group’s ability to continue as a going concern in order to provide returns for shareholders and to maintain an optimal
capital structure to reduce the cost of capital. In order to maintain or adjust the capital structure, the Group may issue new capital or sell assets to reduce debt.
Various financial ratios and internal targets are assessed and reported to the Board on a quarterly basis to monitor and support the key objectives set out above. These ratios and targets
include:
– Gearing ratio;
– Earnings before interest tax depreciation and amortisation (EBITDA);
– Fixed/floating debt ratio;
– Current asset ratio;
– Interest cover;
The Group’s objective is to maintain these financial ratios in excess of any debt covenant restrictions and use them as a performance measurement and hurdle rate. The failure of a covenant
test could render the facilities in default and repayable on demand at the option of the lender.
Accordingly, in situations where these ratios are not met, the Group takes immediate steps to redress the potential negative impact on its financial performance. Such steps include additional
equity capital through rights issue and special placement during the year under review.
Total capital is calculated as equity plus net debt. During 2014, the Group’s strategy was to maintain a gearing ratio between 50% and 75% (2013: 50% and 75%). The gearing ratios as at the
end of December 2014 and 2013 were as follows:
Fair Value estimation
- Quoted prices (unadjusted) in active markets for identical assets or liabilities (level 1).
- Inputs other than quoted prices included within level 1 that are observable for the asset or liability, either directly (that is, as prices) or indirectly (that is, derived from prices) (level 2).
Page 32 of 73
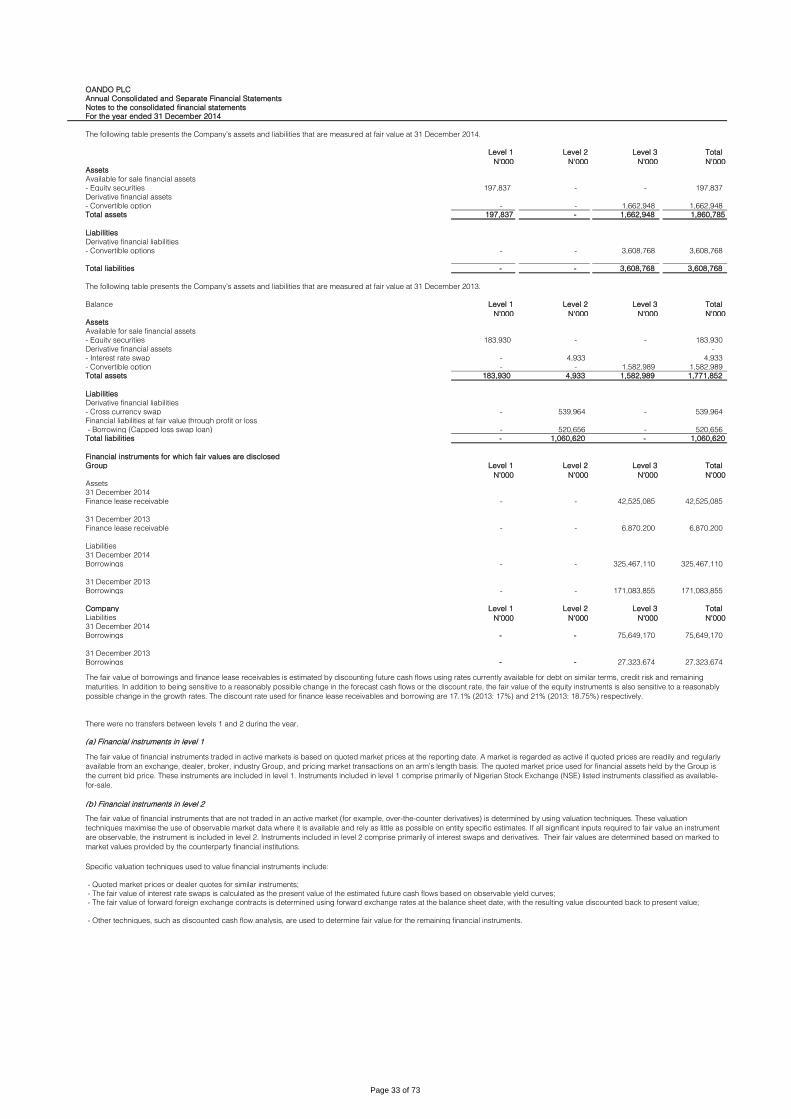
OANDO PLC
Annual Consolidated and Separate Financial Statements
Notes to the consolidated financial statements
For the year ended 31 December 2014
The following table presents the Company’s assets and liabilities that are measured at fair value at 31 December 2014.
Level 1 Level 2 Level 3 Total
N'000 N'000 N'000 N'000Assets
Available for sale financial assets
- Equity securities 197,837 - - 197,837
Derivative financial assets
- Convertible option - - 1,662,948 1,662,948
Total assets 197,837 - 1,662,948 1,860,785
Liabilities
Derivative financial liabilities
- Convertible options - - 3,608,768 3,608,768
Total liabilities - - 3,608,768 3,608,768
The following table presents the Company’s assets and liabilities that are measured at fair value at 31 December 2013.
Balance Level 1 Level 2 Level 3 Total
N'000 N'000 N'000 N'000Assets
Available for sale financial assets
- Equity securities 183,930 - - 183,930
Derivative financial assets -
- Interest rate swap - 4,933 4,933
- Convertible option - - 1,582,989 1,582,989
Total assets 183,930 4,933 1,582,989 1,771,852
Liabilities
Derivative financial liabilities
- Cross currency swap - 539,964 - 539,964
Financial liabilities at fair value through profit or loss
- Borrowing (Capped loss swap loan) - 520,656 - 520,656
Total liabilities - 1,060,620 - 1,060,620
Financial instruments for which fair values are disclosed
Group Level 1 Level 2 Level 3 Total
N'000 N'000 N'000 N'000Assets
31 December 2014
Finance lease receivable - - 42,525,085 42,525,085
31 December 2013
Finance lease receivable - - 6,870,200 6,870,200
Liabilities
31 December 2014
Borrowings - - 325,467,110 325,467,110
31 December 2013
Borrowings - - 171,083,855 171,083,855
Company Level 1 Level 2 Level 3 Total
Liabilities N'000 N'000 N'000 N'00031 December 2014
Borrowings - - 75,649,170 75,649,170
31 December 2013
Borrowings - - 27,323,674 27,323,674
There were no transfers between levels 1 and 2 during the year.
(a) Financial instruments in level 1
(b) Financial instruments in level 2
The fair value of borrowings and finance lease receivables is estimated by discounting future cash flows using rates currently available for debt on similar terms, credit risk and remaining
maturities. In addition to being sensitive to a reasonably possible change in the forecast cash flows or the discount rate, the fair value of the equity instruments is also sensitive to a reasonably
possible change in the growth rates. The discount rate used for finance lease receivables and borrowing are 17.1% (2013: 17%) and 21% (2013: 18.75%) respectively.
The fair value of financial instruments traded in active markets is based on quoted market prices at the reporting date. A market is regarded as active if quoted prices are readily and regularly
available from an exchange, dealer, broker, industry Group, and pricing market transactions on an arm’s length basis. The quoted market price used for financial assets held by the Group is
the current bid price. These instruments are included in level 1. Instruments included in level 1 comprise primarily of Nigerian Stock Exchange (NSE) listed instruments classified as available-
for-sale.
The fair value of financial instruments that are not traded in an active market (for example, over-the-counter derivatives) is determined by using valuation techniques. These valuation
techniques maximise the use of observable market data where it is available and rely as little as possible on entity specific estimates. If all significant inputs required to fair value an instrument
are observable, the instrument is included in level 2. Instruments included in level 2 comprise primarily of interest swaps and derivatives. Their fair values are determined based on marked to
market values provided by the counterparty financial institutions.
Specific valuation techniques used to value financial instruments include:
- Quoted market prices or dealer quotes for similar instruments;
- The fair value of interest rate swaps is calculated as the present value of the estimated future cash flows based on observable yield curves;
- The fair value of forward foreign exchange contracts is determined using forward exchange rates at the balance sheet date, with the resulting value discounted back to present value;
- Other techniques, such as discounted cash flow analysis, are used to determine fair value for the remaining financial instruments.
Page 33 of 73
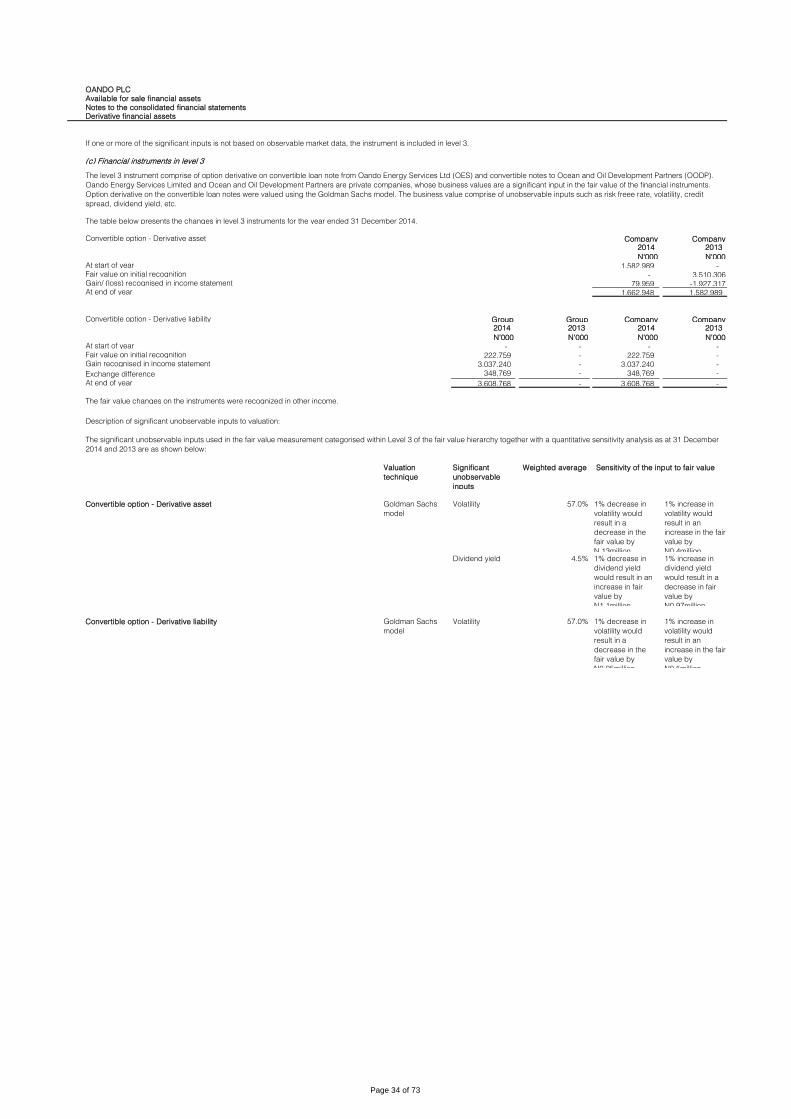
OANDO PLC
Available for sale financial assets
Notes to the consolidated financial statements
Derivative financial assets
(c) Financial instruments in level 3
Convertible option - Derivative asset Company Company2014 2013
N'000 N'000At start of year 1,582,989 - Fair value on initial recognition - 3,510,306Gain/ (loss) recognised in income statement 79,959 -1,927,317At end of year 1,662,948 1,582,989
Convertible option - Derivative liability Group Group Company Company2014 2013 2014 2013
N'000 N'000 N'000 N'000At start of year - - - - Fair value on initial recognition 222,759 - 222,759 - Gain recognised in income statement 3,037,240 - 3,037,240 -
Exchange difference 348,769 - 348,769 -
At end of year 3,608,768 - 3,608,768 -
The fair value changes on the instruments were recognized in other income.
Description of significant unobservable inputs to valuation:
Valuation
technique
Significant
unobservable
inputs
Weighted average
Convertible option - Derivative asset Goldman Sachs
model
Volatility 57.0% 1% decrease in
volatility would
result in a
decrease in the
fair value by
N.13million.
1% increase in
volatility would
result in an
increase in the fair
value by
N0.4million.Dividend yield 4.5% 1% decrease in
dividend yield
would result in an
increase in fair
value by
N1.1million.
1% increase in
dividend yield
would result in a
decrease in fair
value by
N0.97million.
Convertible option - Derivative liability Goldman Sachs
model
Volatility 57.0% 1% decrease in
volatility would
result in a
decrease in the
fair value by
N0.05million.
1% increase in
volatility would
result in an
increase in the fair
value by
N0.5million.
If one or more of the significant inputs is not based on observable market data, the instrument is included in level 3.
The level 3 instrument comprise of option derivative on convertible loan note from Oando Energy Services Ltd (OES) and convertible notes to Ocean and Oil Development Partners (OODP).
Oando Energy Services Limited and Ocean and Oil Development Partners are private companies, whose business values are a significant input in the fair value of the financial instruments.
Option derivative on the convertible loan notes were valued using the Goldman Sachs model. The business value comprise of unobservable inputs such as risk freee rate, volatility, credit
spread, dividend yield, etc.
The table below presents the changes in level 3 instruments for the year ended 31 December 2014.
The significant unobservable inputs used in the fair value measurement categorised within Level 3 of the fair value hierarchy together with a quantitative sensitivity analysis as at 31 December
2014 and 2013 are as shown below:
Sensitivity of the input to fair value
Page 34 of 73

OANDO PLC
Annual Consolidated and Separate Financial Statements
Notes to the consolidated financial statements
For the year ended 31 December 2014
8
Exploration &
Production
Marketing,
Refining &
Terminals
Supply & Trading Gas & power Energy Services Corporate &
Other
Total
N'000 N'000 N'000 N'000 N'000 N'000 N'000
Total gross segment revenue 64,087,994 211,572,959 268,856,378 30,568,454 15,509,495 16,074,000 606,669,280
Inter-segment revenue - (15,613,894) (149,711,166) (556,305) - (15,094,813) (180,976,178)
Revenue from external customers 64,087,994 195,959,065 119,145,212 30,012,149 15,509,495 979,187 425,693,102
Operating (loss)/profit (32,325,870) (5,201,580) 4,367,792 3,944,974 (44,368,393) (54,932,841) (128,515,918)
Finance cost (22,088,600) (2,720,332) (627,851) (1,834,158) (3,608,611) (29,737,767) (60,617,319)
Finance income 617,620 5,607,622 1,141,614 4,428,397 28,670 1,592,745 13,416,668
Finance (cost)/income, net (21,470,980) 2,887,290 513,763 2,594,239 (3,579,941) (28,145,022) (47,200,651)
- - - - - (217,673) (217,673)
(Loss)/profit before income tax (53,796,850) (2,314,290) 4,881,555 6,539,213 (47,948,334) (83,295,536) (175,934,242)
Income tax expense 599,766 260,606 (768,843) (2,825,450) (1,739,561) (3,485,462) (7,958,944)
(Loss)/profit for the year (53,197,084) (2,053,684) 4,112,712 3,713,763 (49,687,895) (86,780,998) (183,893,186)
Exploration &
Production
Marketing,
Refining &
Terminals
Supply & Trading Gas & power Energy Services Corporate &
Other
Total
N'000 N'000 N'000 N'000 N'000 N'000 N'000
Total gross segment sales 19,798,337 227,762,377 311,267,737 32,472,119 21,708,807 7,785,497 620,794,874
Inter-segment sales - (12,361,037) (143,831,296) (537,470) - (7,046,288) (163,776,091)
Sales to external customers 19,798,337 215,401,340 167,436,441 31,934,649 21,708,807 739,209 457,018,783
Operating profit/(loss) (2,280,035) 4,614,118 4,374,520 1,969,623 6,143,720 13,394,716 28,216,662
Finance cost (7,765,529) (4,276,211) (924,547) (1,216,648) (7,228,121) (16,314,490) (37,725,546)
Finance income 722,201 3,243,521 286,833 2,313,674 15,138 9,716,950 16,298,317
Finance (cost)/income, net (7,043,328) (1,032,690) (637,714) 1,097,026 (7,212,983) (6,597,540) (21,427,229)
- - - - - (3,036) (3,036)
(Loss)/profit before income tax (9,323,363) 3,581,428 3,736,806 3,066,649 (1,069,263) 6,794,140 6,786,397
Income tax expense (2,303,314) (1,002,237) (230,309) (1,386,428) (34,116) (433,067) (5,389,471)
(Loss)/profit for the year (11,626,677) 2,579,191 3,506,497 1,680,221 (1,103,379) 6,361,073 1,396,926
Reconciliation of reporting segment information
2014Revenue Operating
profit/(loss)
Finance income Finance cost
N'000 N'000 N'000
As reported in the segment report 606,669,280 (128,515,918) 13,416,668 (60,617,319)
Elimination of inter-segment transactions on consolidation (180,976,178) (11,173,738) (6,066,351) 21,828,113
Reclassfied as discontinued operations (1,015,456) 22,953 - -
As reported in the income statement 424,677,646 (139,666,703) 7,350,317 (38,789,206)
2013 Revenue
Operating
profit/(loss) Finance income Finance cost
N'000 N'000 N'000
As reported in the segment report 620,794,874 28,216,662 16,298,317 (37,725,546)
Elimination of inter-segment transactions on consolidation (163,776,091) (20,901,274) (10,493,837) 16,087,769
Reclassfied as discontinued operations (7,145,317) 9,234,152 - -
As reported in the income statement 449,873,466 16,549,540 5,804,480 (21,637,777)
Segment information
The Group Leadership Council (GLC) is the group's chief operating decision-maker. Management has determined the operating segments based on the performance reports reviewed
monthly by Group Leadership Council (GLC) and these reports are used to make strategic decisions. GLC considers the businesses from a divisional perspective. Each of the division’s
operations may transcend different geographical locations.
The GLC assesses the performance of the operating segments by reviewing actual results against set targets on revenue, operating profit and profit after tax for each divisions.
Interest expenses suffered by the Corporate division on loans raised on behalf of the other divisions and similar operating expenses are transferred to the relevant divisions.
At 31 December 2014, the Group was organised into six operating segments:
(i) Exploration and production (E&P) – involved in the exploration for and production of oil and gas through the acquisition of rights in oil blocks on the Nigerian continental shelf and deep
offshore.
(ii) Marketing, Refinery and Terminals – involved in the marketing and sale of petroleum products. The Group also has three principal refinery and terminals projects currently planned – the
construction of 210,000 MT import terminal in Lekki, the construction of LPG storage facility at Apapa Terminal, and the construction of a marina jetty and subsea pipeline at Lagos Port.
(iii) Supply and Trading – involved in trading of refined and unrefined petroleum products.
(iv) Gas and Power – involved in the distribution of natural gas through the subsidiaries Gaslink and Eastern Horizon. The Group also incorporated two power companies to serve in Nigeria’s
power sector, by providing power to industrial customers.
(v) Energy Services – involved in the provision of services such as drilling and completion fluids and solid control waste management; oil-well cementing and other services to upstream
companies.
(vi) Corporate and others
The segment results for the period ended 31 December, 2014 are as follows:
Share of profit in associate
The segment results for the period ended 31 December, 2013 are as follows:
Share of loss in associate
Inter-segment revenue represents sales between the Marketing, Refining & Terminal segment and the Supply & Trading segment. Profit on inter-segment sales have been eliminated on
consolidation.
Page 35 of 73
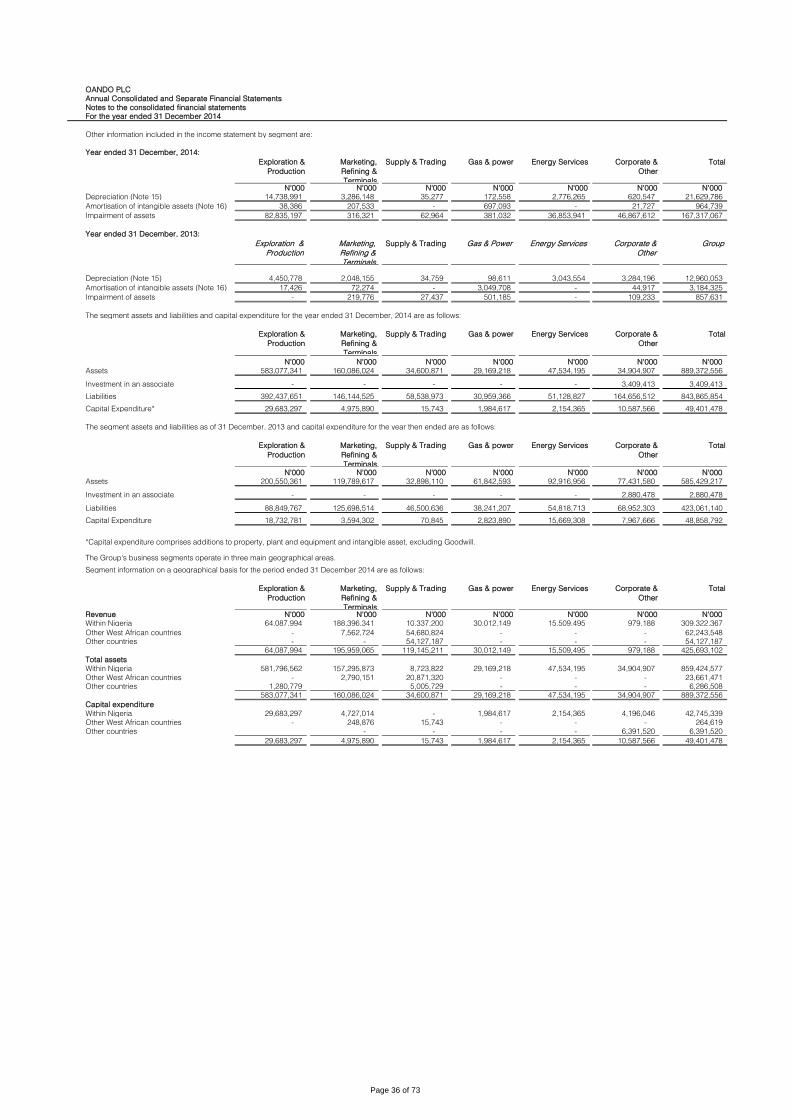
OANDO PLC
Annual Consolidated and Separate Financial Statements
Notes to the consolidated financial statements
For the year ended 31 December 2014
Other information included in the income statement by segment are:
Year ended 31 December, 2014:
Exploration &
Production
Marketing,
Refining &
Terminals
Supply & Trading Gas & power Energy Services Corporate &
Other
Total
N'000 N'000 N'000 N'000 N'000 N'000 N'000
Depreciation (Note 15) 14,738,991 3,286,148 35,277 172,558 2,776,265 620,547 21,629,786
Amortisation of intangible assets (Note 16) 38,386 207,533 - 697,093 - 21,727 964,739
Impairment of assets 82,835,197 316,321 62,964 381,032 36,853,941 46,867,612 167,317,067
Year ended 31 December, 2013:
Exploration &
Production
Marketing,
Refining &
Terminals
Supply & Trading Gas & Power Energy Services Corporate &
Other
Group
Depreciation (Note 15) 4,450,778 2,048,155 34,759 98,611 3,043,554 3,284,196 12,960,053
Amortisation of intangible assets (Note 16) 17,426 72,274 - 3,049,708 - 44,917 3,184,325
Impairment of assets - 219,776 27,437 501,185 - 109,233 857,631
The segment assets and liabilities and capital expenditure for the year ended 31 December, 2014 are as follows:
Exploration &
Production
Marketing,
Refining &
Terminals
Supply & Trading Gas & power Energy Services Corporate &
Other
Total
N'000 N'000 N'000 N'000 N'000 N'000 N'000
Assets 583,077,341 160,086,024 34,600,871 29,169,218 47,534,195 34,904,907 889,372,556
Investment in an associate - - - - - 3,409,413 3,409,413
Liabilities 392,437,651 146,144,525 58,538,973 30,959,366 51,128,827 164,656,512 843,865,854
Capital Expenditure* 29,683,297 4,975,890 15,743 1,984,617 2,154,365 10,587,566 49,401,478
The segment assets and liabilities as of 31 December, 2013 and capital expenditure for the year then ended are as follows:
Exploration &
Production
Marketing,
Refining &
Terminals
Supply & Trading Gas & power Energy Services Corporate &
Other
Total
N'000 N'000 N'000 N'000 N'000 N'000 N'000
Assets 200,550,361 119,789,617 32,898,110 61,842,593 92,916,956 77,431,580 585,429,217
Investment in an associate - - - - - 2,880,478 2,880,478
Liabilities 88,849,767 125,698,514 46,500,636 38,241,207 54,818,713 68,952,303 423,061,140
Capital Expenditure 18,732,781 3,594,302 70,845 2,823,890 15,669,308 7,967,666 48,858,792
The Group's business segments operate in three main geographical areas.
Segment information on a geographical basis for the period ended 31 December 2014 are as follows:
Exploration &
Production
Marketing,
Refining &
Terminals
Supply & Trading Gas & power Energy Services Corporate &
Other
Total
Revenue N'000 N'000 N'000 N'000 N'000 N'000 N'000
Within Nigeria 64,087,994 188,396,341 10,337,200 30,012,149 15,509,495 979,188 309,322,367
- 7,562,724 54,680,824 - - - 62,243,548
Other countries - - 54,127,187 - - - 54,127,187
64,087,994 195,959,065 119,145,211 30,012,149 15,509,495 979,188 425,693,102
Total assets
Within Nigeria 581,796,562 157,295,873 8,723,822 29,169,218 47,534,195 34,904,907 859,424,577
- 2,790,151 20,871,320 - - - 23,661,471
Other countries 1,280,779 5,005,729 - - - 6,286,508
583,077,341 160,086,024 34,600,871 29,169,218 47,534,195 34,904,907 889,372,556
Capital expenditure
Within Nigeria 29,683,297 4,727,014 - 1,984,617 2,154,365 4,196,046 42,745,339
- 248,876 15,743 - - - 264,619
Other countries - - - - 6,391,520 6,391,520
29,683,297 4,975,890 15,743 1,984,617 2,154,365 10,587,566 49,401,478
Other West African countries
Other West African countries
*Capital expenditure comprises additions to property, plant and equipment and intangible asset, excluding Goodwill.
Other West African countries
Page 36 of 73
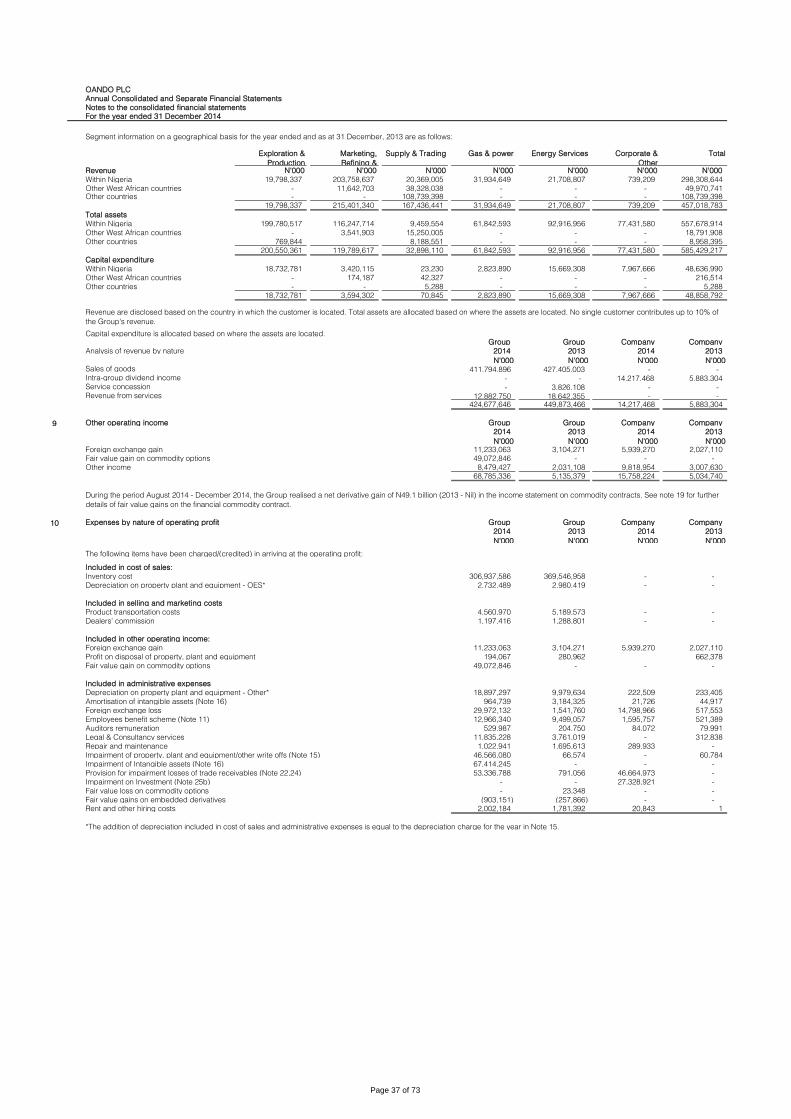
OANDO PLC
Annual Consolidated and Separate Financial Statements
Notes to the consolidated financial statements
For the year ended 31 December 2014
Segment information on a geographical basis for the year ended and as at 31 December, 2013 are as follows:
Exploration &
Production
Marketing,
Refining &
Supply & Trading Gas & power Energy Services Corporate &
Other
Total
Revenue N'000 N'000 N'000 N'000 N'000 N'000 N'000
Within Nigeria 19,798,337 203,758,637 20,369,005 31,934,649 21,708,807 739,209 298,308,644
- 11,642,703 38,328,038 - - - 49,970,741 Other countries - - 108,739,398 - - - 108,739,398
19,798,337 215,401,340 167,436,441 31,934,649 21,708,807 739,209 457,018,783
Total assets
Within Nigeria 199,780,517 116,247,714 9,459,554 61,842,593 92,916,956 77,431,580 557,678,914
- 3,541,903 15,250,005 - - - 18,791,908
Other countries 769,844 8,188,551 - - - 8,958,395
200,550,361 119,789,617 32,898,110 61,842,593 92,916,956 77,431,580 585,429,217
Capital expenditure
Within Nigeria 18,732,781 3,420,115 23,230 2,823,890 15,669,308 7,967,666 48,636,990
- 174,187 42,327 - - - 216,514
Other countries - - 5,288 - - - 5,288
18,732,781 3,594,302 70,845 2,823,890 15,669,308 7,967,666 48,858,792
Group Group Company Company
Analysis of revenue by nature 2014 2013 2014 2013
N'000 N'000 N'000 N'000Sales of goods 411,794,896 427,405,003 - - Intra-group dividend income - - 14,217,468 5,883,304 Service concession - 3,826,108 - - Revenue from services 12,882,750 18,642,355 - -
424,677,646 449,873,466 14,217,468 5,883,304
9 Other operating income Group Group Company Company
2014 2013 2014 2013
N'000 N'000 N'000 N'000Foreign exchange gain 11,233,063 3,104,271 5,939,270 2,027,110
Fair value gain on commodity options 49,072,846 - - -
Other income 8,479,427 2,031,108 9,818,954 3,007,630
68,785,336 5,135,379 15,758,224 5,034,740
10 Expenses by nature of operating profit Group Group Company Company
2014 2013 2014 2013
N'000 N'000 N'000 N'000
The following items have been charged/(credited) in arriving at the operating profit:
Included in cost of sales:
Inventory cost 306,937,586 369,546,958 - -
Depreciation on property plant and equipment - OES* 2,732,489 2,980,419 - -
Included in selling and marketing costs
Product transportation costs 4,560,970 5,189,573 - -
Dealers' commission 1,197,416 1,288,801 - -
Included in other operating income:
Foreign exchange gain 11,233,063 3,104,271 5,939,270 2,027,110
Profit on disposal of property, plant and equipment 194,067 280,962 662,378
Fair value gain on commodity options 49,072,846 - - -
Included in administrative expenses
Depreciation on property plant and equipment - Other* 18,897,297 9,979,634 222,509 233,405
Amortisation of intangible assets (Note 16) 964,739 3,184,325 21,726 44,917
Foreign exchange loss 29,972,132 1,541,760 14,798,966 517,553
Employees benefit scheme (Note 11) 12,966,340 9,499,057 1,595,757 521,389
Auditors remuneration 529,987 204,750 84,072 79,991
Legal & Consultancy services 11,835,228 3,761,019 - 312,838
Repair and maintenance 1,022,941 1,695,613 289,933 -
Impairment of property, plant and equipment/other write offs (Note 15) 46,566,080 66,574 - 60,784
Impairment of Intangible assets (Note 16) 67,414,245 - - -
Provision for impairment losses of trade receivables (Note 22,24) 53,336,788 791,056 46,664,973 -
Impairment on Investment (Note 25b) - - 27,328,921 -
Fair value loss on commodity options - 23,348 - -
Fair value gains on embedded derivatives (903,151) (257,866) - -
Rent and other hiring costs 2,002,184 1,781,392 20,843 1
*The addition of depreciation included in cost of sales and administrative expenses is equal to the depreciation charge for the year in Note 15.
Capital expenditure is allocated based on where the assets are located.
During the period August 2014 - December 2014, the Group realised a net derivative gain of N49.1 billion (2013 - Nil) in the income statement on commodity contracts. See note 19 for further
details of fair value gains on the financial commodity contract.
Other West African countries
Other West African countries
Other West African countries
Revenue are disclosed based on the country in which the customer is located. Total assets are allocated based on where the assets are located. No single customer contributes up to 10% of
the Group's revenue.
Page 37 of 73
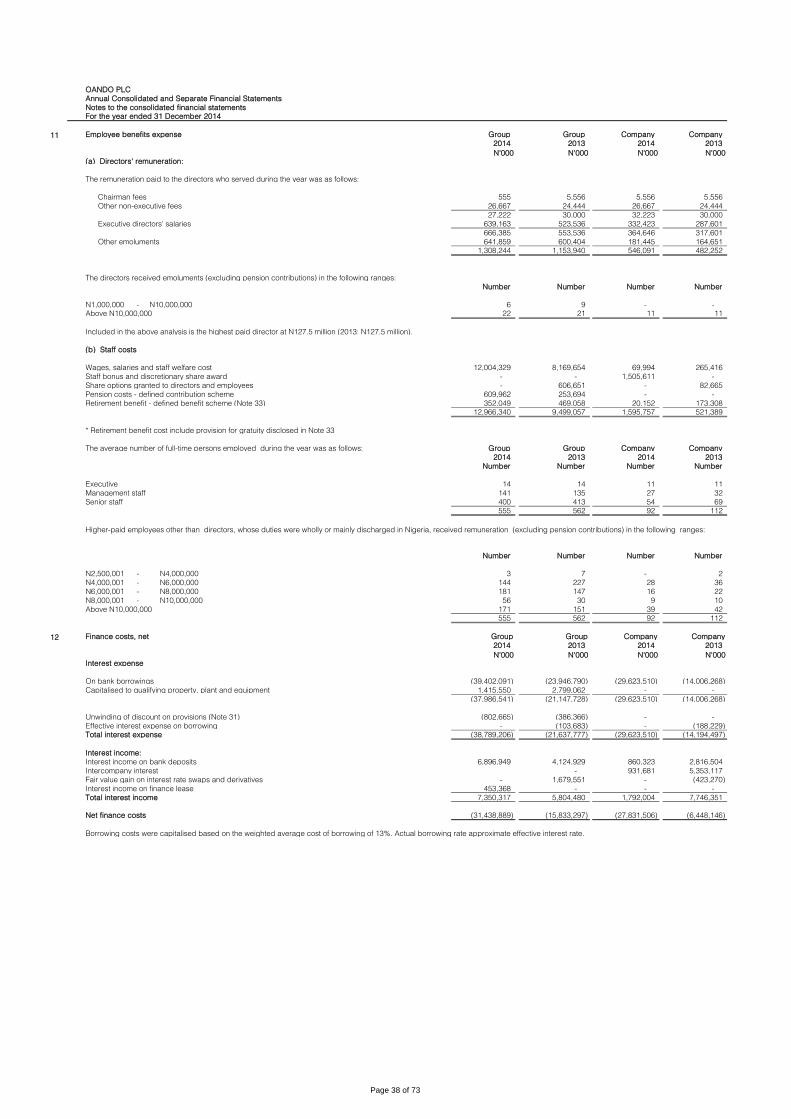
OANDO PLC
Annual Consolidated and Separate Financial Statements
Notes to the consolidated financial statements
For the year ended 31 December 2014
11 Employee benefits expense Group Group Company Company
2014 2013 2014 2013
N'000 N'000 N'000 N'000(a) Directors' remuneration:
The remuneration paid to the directors who served during the year was as follows:
Chairman fees 555 5,556 5,556 5,556
Other non-executive fees 26,667 24,444 26,667 24,444
27,222 30,000 32,223 30,000
Executive directors' salaries 639,163 523,536 332,423 287,601
666,385 553,536 364,646 317,601
Other emoluments 641,859 600,404 181,445 164,651
1,308,244 1,153,940 546,091 482,252
The directors received emoluments (excluding pension contributions) in the following ranges:
Number Number Number Number
N1,000,000 - N10,000,000 6 9 - -
Above N10,000,000 22 21 11 11
Included in the above analysis is the highest paid director at N127.5 million (2013: N127.5 million).
(b) Staff costs
Wages, salaries and staff welfare cost 12,004,329 8,169,654 69,994 265,416
Staff bonus and discretionary share award - - 1,505,611 -
Share options granted to directors and employees - 606,651 - 82,665
Pension costs - defined contribution scheme 609,962 253,694 - -
Retirement benefit - defined benefit scheme (Note 33) 352,049 469,058 20,152 173,308
12,966,340 9,499,057 1,595,757 521,389
* Retirement benefit cost include provision for gratuity disclosed in Note 33
The average number of full-time persons employed during the year was as follows: Group Group Company Company
2014 2013 2014 2013
Number Number Number Number
Executive 14 14 11 11
Management staff 141 135 27 32
Senior staff 400 413 54 69
555 562 92 112
Number Number Number Number
N2,500,001 - N4,000,000 3 7 - 2
N4,000,001 - N6,000,000 144 227 28 36
N6,000,001 - N8,000,000 181 147 16 22
N8,000,001 - N10,000,000 56 30 9 10
Above N10,000,000 171 151 39 42
555 562 92 112
12 Finance costs, net Group Group Company Company
2014 2013 2014 2013
N'000 N'000 N'000 N'000Interest expense
On bank borrowings (39,402,091) (23,946,790) (29,623,510) (14,006,268)
Capitalised to qualifying property, plant and equipment 1,415,550 2,799,062 - -
(37,986,541) (21,147,728) (29,623,510) (14,006,268)
Unwinding of discount on provisions (Note 31) (802,665) (386,366) - -
Effective interest expense on borrowing - (103,683) - (188,229)
Total interest expense (38,789,206) (21,637,777) (29,623,510) (14,194,497)
Interest income:
Interest income on bank deposits 6,896,949 4,124,929 860,323 2,816,504
Intercompany interest - 931,681 5,353,117
Fair value gain on interest rate swaps and derivatives - 1,679,551 - (423,270)
Interest income on finance lease 453,368 - - -
Total interest income 7,350,317 5,804,480 1,792,004 7,746,351
Net finance costs (31,438,889) (15,833,297) (27,831,506) (6,448,146)
Borrowing costs were capitalised based on the weighted average cost of borrowing of 13%. Actual borrowing rate approximate effective interest rate.
Higher-paid employees other than directors, whose duties were wholly or mainly discharged in Nigeria, received remuneration (excluding pension contributions) in the following ranges:
Page 38 of 73

OANDO PLC
Annual Consolidated and Separate Financial Statements
Notes to the consolidated financial statement
For the year ended 31 December 2014
13 Income tax expense
Analysis of income tax charge for the year:
Group Group Company Company
2014 2013 2014 2013
N'000 N'000 N'000 N'000Continuing operations
Current income tax 16,258,875 4,058,296 - 879,830
Minimum tax 546,028 534,285 505,576 534,285
Education tax 435,358 247,924 - -
Adjustments in respect of prior years tax 277,618 (358,823) - (358,824)
17,517,879 4,481,682 505,576 1,055,291
Deferred income tax (Note 18):
Deferred income tax for the year (9,558,934) 907,790 1,066,791 (622,168)
Income tax expense 7,958,945 5,389,472 1,572,367 433,123
Discontinued operations
Deferred income tax (Note 18):
Deferred income tax for the year - 925,452 - -
Income tax expense - 925,452 - -
The tax on the Group’s profit before income tax differs from the theoretical amount that would arise using the statutory income tax rate as follows:
(Loss)/profit before income tax (171,323,265) 713,207 (100,827,986) 2,783,697
(51,396,980) 213,962 (30,248,396) 835,109
Minimum tax 546,028 534,285 505,576 534,285
Education tax 435,358 247,924 - -
Tax effect of income not subject to tax (475,763) (2,805,265) (4,265,241) (2,447,525)
Effect of associate tax 65,302 911 - -
Effect of tax in jurisdiction with lower/higher taxes (30,867,516) (1,157,741) - -
Expenses not deductible for tax purposes 53,837,647 2,941,065 26,535,646 328,935
Over/(Under) provision for income tax in prior years 277,618 (358,823) - (358,823)
Tax losses for which no deferred tax was recognised 35,537,251 5,610,971 9,044,782 1,378,959
Capital gains tax - 162,183 - 162,183
Income tax expense 7,958,945 5,389,472 1,572,367 433,123
Effective tax rate -5% 756% -2% 16%
Current income tax liabilities
Movement in current income tax for the year:
At 1 January 5,643,719 6,417,980 1,511,885 760,941
Payment during the year (11,327,321) (5,242,530) (465,292) (304,347)
On acquisition of business 26,726,014 - - -
Charge for the year: - -
Income tax charge during the year 17,082,521 4,233,758 505,576 1,055,291
Education tax charge during the year 435,358 247,924 - -
Exchange difference 6,402,827 (13,413) - -
Transfer to disposal group classified as held for sale - - - -
At 31 December 44,963,118 5,643,719 1,552,169 1,511,885
14
Group Group2014 2013
N'000 N'000
Loss from continuing operations attributable to equity holders of the parent (175,927,514) (4,658,729)(Loss)/profit from discontinued operations attributable to equity holders of the parent (4,610,976) 6,073,191
(180,538,490) 1,414,462
Weighted average number of ordinary shares outstanding (thousands)
As previously reported 6,822,354 2,274,118 Bonus element - 284,265 Right issue - 3,668,184
Conversion of promisory notes 59,075 -
Private placements 1,816,802 -
8,698,231 6,226,567
Basic/Diluted earnings per share (expressed in kobo per share)From continuing operations (2,023) (75)
From discontinued operations (53) 98
Tax calculated at Nigeria's domestic rates applicable to profits in respective countries - 30% (2013: 30%)
Earnings per share and dividend per share
Basic earnings per share is calculated by dividing the profit attributable to equity holders of the Company by the weighted average number of ordinary shares outstanding during the year.
Weighted average number of shares outstanding at 31 December 2013 includes rights issue during the year.
There was no difference in the weighted average number of ordinary shares used for basic and diluted net loss per share from continuing operation, as the effect of all potentially dilutive
ordinary shares outstanding (4,085,879,000 shares) was anti dilutive.
Dividends per share
Dividend of N0.30k was declared in 2014 in respect of the 2013 financial results.
Page 39 of 73

OANDO PLC
Annual Consolidated and Separate Financial Statements
Notes to the consolidated financial statements
For the year ended 31 December 2014
15 Property, plant and equipment
Group Upstream Asset 1 Land & Buildings
Plant,
machineries &
vehicles
Fixtures, fittings,
Computer &
equipment
Capital work in
progress Total
N'000 N'000 N'000 N'000 N'000 N'000
Year ended 31 December 2013
Opening net book amount 25,783,370 23,656,341 47,672,282 1,879,893 31,332,827 130,324,713
Decommissioning costs 1,137,078 - 4,172 - - 1,141,250
Additions 17,176,208 1,767,241 3,556,386 701,867 23,499,597 46,701,299
Transfer to finance lease receivable - - - - (2,084,565) (2,084,565)
Disposal (2,598) (1,419,869) (368,172) (25,012) (1,683,605) (3,499,256)
Revaluation - 5,733,999 4,210,052 - - 9,944,051
Write off - (42,140) 73,300 7,376 (105,110) (66,574)
Transfer to disposal group classified as held for sale - - (7,930) - - (7,930)
Depreciation charge (4,378,893) (2,114,683) (6,000,591) (464,992) (894) (12,960,053)
Exchange difference (395,385) 363,088 55,840 36,011 (248,578) (189,024)
Reclassification from intangible asset (Note 16) 2,905,931 - - - - 2,905,931
Reclassification 2,676,284 (2,736,452) 3,921,955 (21,083) (3,840,704) -
Net book amount at 31 December 2013 44,901,995 25,207,525 53,117,294 2,114,060 46,868,968 172,209,842
At 31 December 2013
Cost or valuation 70,223,871 27,754,261 70,265,079 5,783,661 46,869,864 220,896,736
Accumulated depreciation (25,321,876) (2,546,736) (17,147,785) (3,669,601) (896) (48,686,894)
Net book amount 44,901,995 25,207,525 53,117,294 2,114,060 46,868,968 172,209,842
Year ended 31 December 2014
Opening net book amount 44,901,995 25,207,525 53,117,294 2,114,060 46,868,968 172,209,842
Decommissioning costs (5,983,870) - 526 - - (5,983,344)
Additions 26,763,614 894,512 9,255,271 1,310,486 6,391,492 44,615,375
Business acquisitions 110,350,834 - - - - 110,350,834
Transfer to finance lease receivable - - - - (1,369,202) (1,369,202)
Transfer from E&E 36,104,905 - - - - 36,104,905
Disposal - (11,745) (723,254) (1,191) - (736,190)
Impairment (Note 10) (10,205,484) - (15,895,914) - (20,464,682) (46,566,080)
Reclassification - 289,145 302,654 (441) (591,358) -
Write off - (149,774) (12,803) 8,094 (2,039) (156,522)
Depreciation charge (14,631,166) (400,595) (5,922,817) (675,208) - (21,629,786)
Exchange difference 26,910,489 (9,795) 330,936 (13,255) (16,000) 27,202,375
Net book amount at 31 December 2014 214,211,317 25,819,273 40,451,893 2,742,545 30,817,179 314,042,207
At 31 December 2014
Cost or valuation 277,284,616 27,180,082 63,381,571 7,325,984 30,817,179 405,989,432
Accumulated depreciation (63,073,299) (1,360,809) (22,929,678) (4,583,439) - (91,947,225)
Net book amount 214,211,317 25,819,273 40,451,893 2,742,545 30,817,179 314,042,207
Company
Year ended 31 December 2013
Upstream Asset Land & Buildings
Plant,
machineries &
vehicles
Fixtures, fittings &
equipment
Capital work in
progress Total
Opening net book amount - 1,625,797 335,200 301,851 759,346 3,022,194
Additions - - 119,749 121,853 - 241,602
Transfers - - 559 - (559) -
Disposal - (1,311,526) (27,389) - (705,327) (2,044,242)
Write off - (7,245) - (79) (53,460) (60,784)
Depreciation charge - (10,192) (106,647) (116,566) - (233,405)
Closing net book amount - 296,834 321,472 307,059 - 925,365
At 31 December 2013
Cost/Valuation - 258,703 596,872 1,261,094 - 2,116,669
Accumulated depreciation - 38,131 (275,400) (954,035) - (1,191,304)
Net book amount - 296,834 321,472 307,059 - 925,365
Year ended 31 December 2014
Opening net book amount - 296,834 321,472 307,059 - 925,365
Additions - - 65,438 241,218 - 306,656
Transfers - - (15,332) - - (15,332)
Disposal - - (14,799) (245) - (15,044)
Adjustments - (161,308) (15,254) 16,614 - (159,948)
Depreciation charge - (11,565) (90,161) (120,783) - (222,509)
Closing net book amount - 123,961 251,364 443,863 - 819,188
At 31 December 2014
Cost/Valuation - 257,003 554,731 1,518,425 - 2,330,159
Accumulated depreciation - (133,042) (303,367) (1,074,562) - (1,510,971)
Net book amount - 123,961 251,364 443,863 - 819,188
(1)See Note 44 for details of upstream assets.
Page 40 of 73
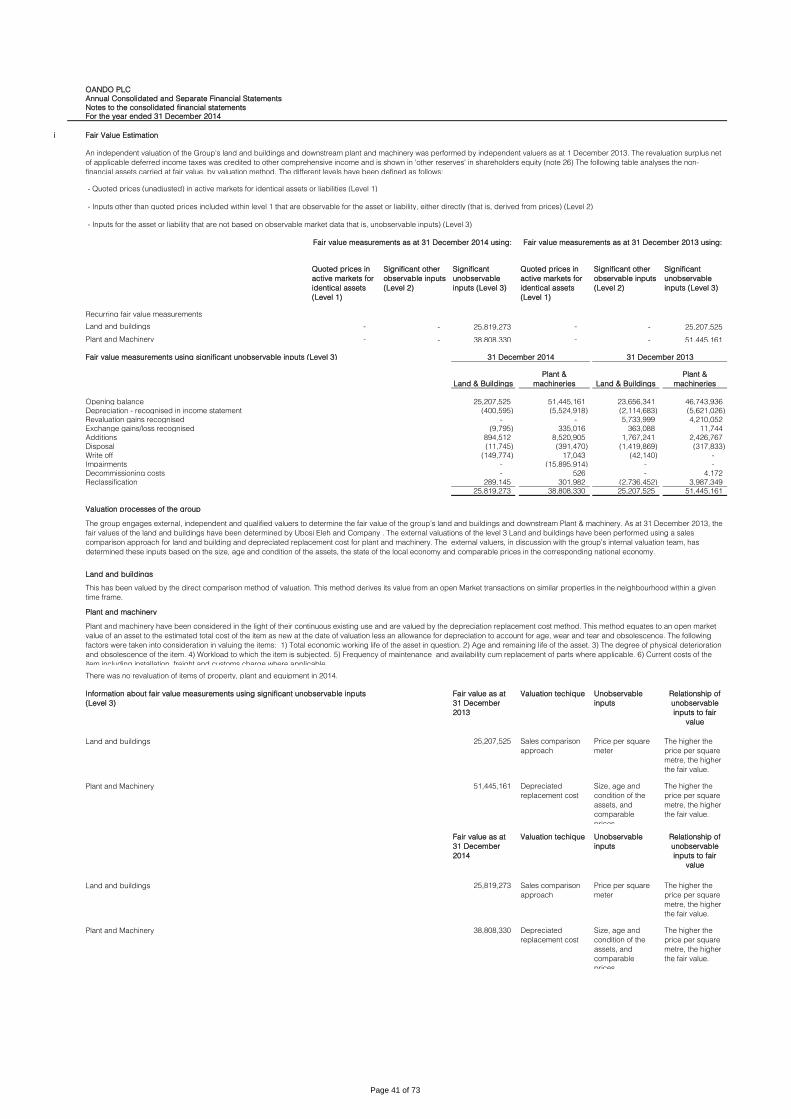
OANDO PLC
Annual Consolidated and Separate Financial Statements
Notes to the consolidated financial statements
For the year ended 31 December 2014
i
Quoted prices in
active markets for
identical assets
(Level 1)
Significant other
observable inputs
(Level 2)
Significant
unobservable
inputs (Level 3)
Quoted prices in
active markets for
identical assets
(Level 1)
Significant other
observable inputs
(Level 2)
Significant
unobservable
inputs (Level 3)
Recurring fair value measurements
Land and buildings - - 25,819,273 - - 25,207,525
Plant and Machinery - - 38,808,330 - - 51,445,161
Fair value measurements using significant unobservable inputs (Level 3)
Land & Buildings
Plant &
machineries Land & Buildings
Plant &
machineries
Opening balance 25,207,525 51,445,161 23,656,341 46,743,936
Depreciation - recognised in income statement (400,595) (5,524,918) (2,114,683) (5,621,026)
Revaluation gains recognised - - 5,733,999 4,210,052
Exchange gains/loss recognised (9,795) 335,016 363,088 11,744
Additions 894,512 8,520,905 1,767,241 2,426,767
Disposal (11,745) (391,470) (1,419,869) (317,833)
Write off (149,774) 17,043 (42,140) -
Impairments - (15,895,914) - -
Decommissioning costs - 526 - 4,172
Reclassification 289,145 301,982 (2,736,452) 3,987,349
25,819,273 38,808,330 25,207,525 51,445,161
Valuation processes of the group
Land and buildings
Plant and machinery
Fair value as at
31 December
2013
Valuation techique Unobservable
inputs
Relationship of
unobservable
inputs to fair
value
Land and buildings 25,207,525 Sales comparison
approach
Price per square
meter
The higher the
price per square
metre, the higher
the fair value.
Plant and Machinery 51,445,161 Depreciated
replacement cost
Size, age and
condition of the
assets, and
comparable
prices.
The higher the
price per square
metre, the higher
the fair value.
Fair value as at
31 December
2014
Valuation techique Unobservable
inputs
Relationship of
unobservable
inputs to fair
value
Land and buildings 25,819,273 Sales comparison
approach
Price per square
meter
The higher the
price per square
metre, the higher
the fair value.
Plant and Machinery 38,808,330 Depreciated
replacement cost
Size, age and
condition of the
assets, and
comparable
prices.
The higher the
price per square
metre, the higher
the fair value.
The group engages external, independent and qualified valuers to determine the fair value of the group’s land and buildings and downstream Plant & machinery. As at 31 December 2013, the
fair values of the land and buildings have been determined by Ubosi Eleh and Company . The external valuations of the level 3 Land and buildings have been performed using a sales
comparison approach for land and building and depreciated replacement cost for plant and machinery. The external valuers, in discussion with the group’s internal valuation team, has
determined these inputs based on the size, age and condition of the assets, the state of the local economy and comparable prices in the corresponding national economy.
This has been valued by the direct comparison method of valuation. This method derives its value from an open Market transactions on similar properties in the neighbourhood within a given
time frame.
Plant and machinery have been considered in the light of their continuous existing use and are valued by the depreciation replacement cost method. This method equates to an open market
value of an asset to the estimated total cost of the item as new at the date of valuation less an allowance for depreciation to account for age, wear and tear and obsolescence. The following
factors were taken into consideration in valuing the items: 1) Total economic working life of the asset in question. 2) Age and remaining life of the asset. 3) The degree of physical deterioration
and obsolescence of the item. 4) Workload to which the item is subjected. 5) Frequency of maintenance and availability cum replacement of parts where applicable. 6) Current costs of the
item including installation, freight and customs charge where applicable.
- Quoted prices (unadjusted) in active markets for identical assets or liabilities (Level 1)
- Inputs other than quoted prices included within level 1 that are observable for the asset or liability, either directly (that is, derived from prices) (Level 2)
- Inputs for the asset or liability that are not based on observable market data that is, unobservable inputs) (Level 3)
Fair value measurements as at 31 December 2014 using: Fair value measurements as at 31 December 2013 using:
31 December 2014 31 December 2013
Fair Value Estimation
An independent valuation of the Group's land and buildings and downstream plant and machinery was performed by independent valuers as at 1 December 2013. The revaluation surplus net
of applicable deferred income taxes was credited to other comprehensive income and is shown in 'other reserves' in shareholders equity (note 26) The following table analyses the non-
financial assets carried at fair value, by valuation method. The different levels have been defined as follows:
There was no revaluation of items of property, plant and equipment in 2014.
Information about fair value measurements using significant unobservable inputs
(Level 3)
Page 41 of 73

OANDO PLC
Annual Consolidated and Separate Financial Statements
Notes to the consolidated financial statements
For the year ended 31 December 2014
ii
Land & Buildings
Plant &
machineries Land & Buildings
Plant &
machineries
N'000 N'000 N'000 N'000
Cost 9,378,408 10,444,699 7,341,738 8,568,343
Accumulated depreciation (327,931) (2,943,401) -313,100 -2,842,391
9,050,476 7,501,298 7,028,638 5,725,952
iii Capital work in progress
iv Impairment loss
16 Intangible assets
Group
Asset under
construction
Goodwill Software costs Exploration and
Evaluation asset
Licence for gas
transmission
pipeline Total
N'000 N'000 N'000 N'000 N'000
Year ended 31 December 2013
Opening net book amount 145,711 26,248,359 460,965 69,580,920 42,417,854 138,853,809
Addition 346,363 - 325,720 1,485,410 - 2,157,493
Impairment (Note 10) - (837,563) - - - (837,563)
Disposal - (2,034,152) - (14,515,295) - (16,549,447)
Transfer to disposal group classified as held for sale - - - - (35,271,000) (35,271,000)
Amortisation charge (Note 10) - - (146,817) - (3,037,508) (3,184,325)
Reclassification to property, plant and equipment (Note 15) - - - (2,905,931) - (2,905,931)
Exchange difference - (627) 558 (30,221) - (30,290)
Closing net book amount as at 31 December 2013 492,074 23,376,017 640,426 53,614,883 4,109,346 82,232,746
Year ended 31 December 2013
Cost 492,074 23,376,017 1,718,196 56,538,085 11,016,359 93,140,731
Accumulated amortisation - - (1,077,770) (2,923,202) (6,907,013) (10,907,985)
Net book amount as at 31 December 2013 492,074 23,376,017 640,426 53,614,883 4,109,346 82,232,746
Year ended 31 December 2014
Opening net book amount 492,074 23,376,017 640,426 53,614,883 4,109,346 82,232,746
Addition 1,476,548 - 970,807 2,338,748 - 4,786,103
Business acquisitions (Note 45) - 157,441,094 - 61,138,733 - 218,579,827
Impairment (Note 10) - (696,030) - (66,718,215) - (67,414,245)
Trf to Upstream Asset - - - (36,104,905) - (36,104,905)
Amortisation charge (Note 10) - - (279,845) - (684,894) (964,739)
Exchange difference - 30,182,100 (3,561) 14,411,858 - 44,590,397
Closing net book amount as at 31 December 2014 1,968,622 210,303,181 1,327,827 28,681,102 3,424,452 245,705,184
Cost 1,968,622 210,303,181 2,693,520 106,333,556 11,016,359 332,315,238
Accumulated amortisation - - (1,365,693) (77,652,454) (7,591,907) (86,610,054)
Net book amount 1,968,622 210,303,181 1,327,827 28,681,102 3,424,452 245,705,184
Company Software costs
N'000
Year ended 31 December 2013
Opening net book amount 89,096
Additions 61,372
Amortisation charge (44,917)
Opening net book amount 105,551
At 31 December 2013
Cost 897,135
Accumulated amortisation and impairment (791,584)
Net book value 105,551
Year ended 31 December 2014
Opening net book amount 105,551
Additions 79,093
Amortisation charge (21,726)
Opening net book amount 162,918
At 31 December 2014
Cost 976,228
Accumulated amortisation and impairment (813,310)
Net book value 162,918
Capital work in progress mainly comprises of OES Respect Rig construction costs incurred as at 31 December 2014. Interest capitalised was N1.4 billion (2013: 2.8 billion)
In 2014, the carrying amount of the OML 90 cash generating unit (CGU) in property, plant and equipment has been reduced to their recoverable amount (Nil) through recognition of an
impairment loss of N11.34 billion ($61.4 million). The impairment was triggered by declining oil prices and significant downward reserve revisions. The recoverable amounts have been
determined based on the asset’s fair value less costs of disposal using a discounted cash flow technique and categorized in Level 2 of the fair value hierarchy. Key assumptions in the
determination of cash flows from reserves include crude oil and natural gas prices, loss factors, and the discount rate (15.2%). Reserves as at December 31, 2014 have been evaluated by
independent qualified reserves evaluators. The carrying amount of the CGU has been fully impaired.
The carrying amount of the four (4) rigs of N65 billion were also written down to their respective recoverable amounts of N29.5 billion based on management's view of value in use of the assets.
This impairment of N36.36 billion was triggered by the decline in oil prices by approximately 50% during the financial year and related decline in day rates accruable to the Rig assets. Value in
use was based on the discounted net cashflow of the assets over their remaining useful lives (discount rate of 14.5%).
If land and buildings and downstream plant and machinery were stated on the historical cost basis, the amount would have been as follows:
31 December 2014 31 December 2013
Page 42 of 73
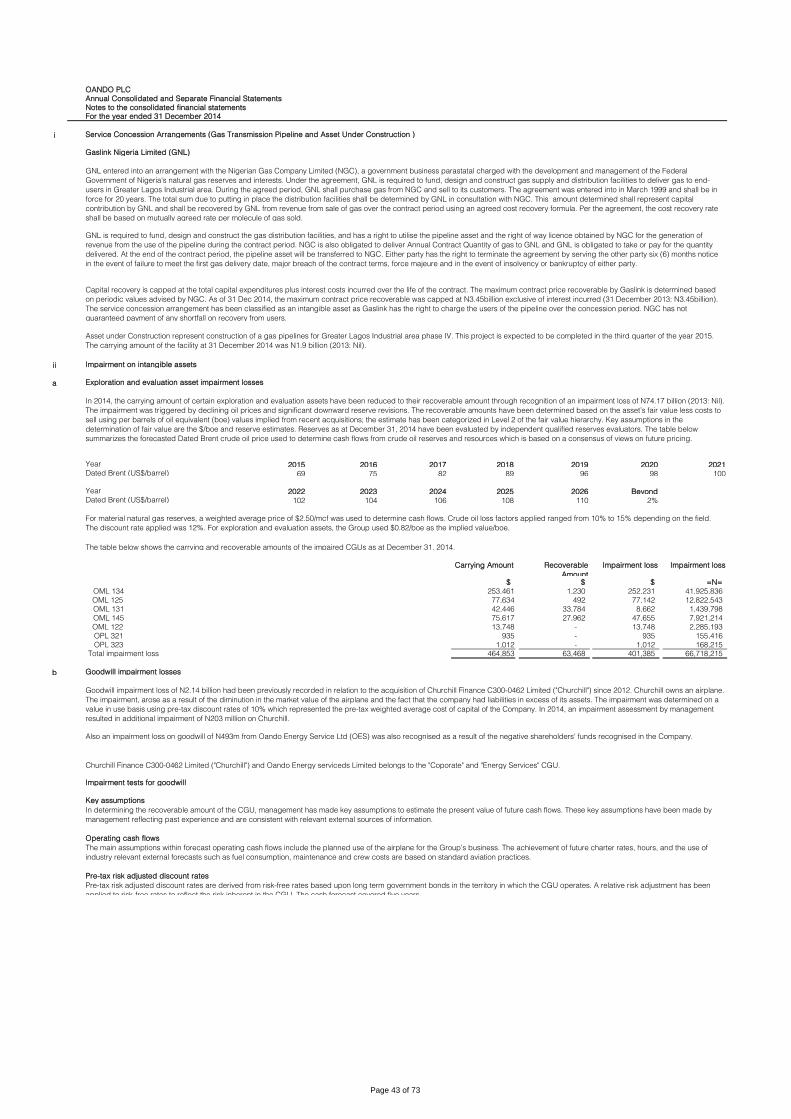
OANDO PLC
Annual Consolidated and Separate Financial Statements
Notes to the consolidated financial statements
For the year ended 31 December 2014
i Service Concession Arrangements (Gas Transmission Pipeline and Asset Under Construction )
Gaslink Nigeria Limited (GNL)
ii Impairment on intangible assets
a Exploration and evaluation asset impairment losses
Year 2015 2016 2017 2018 2019 2020 2021Dated Brent (US$/barrel) 69 75 82 89 96 98 100
Year 2022 2023 2024 2025 2026 BeyondDated Brent (US$/barrel) 102 104 106 108 110 2%
Carrying Amount Recoverable
Amount
Impairment loss Impairment loss
$ $ $ =N=
OML 134 253,461 1,230 252,231 41,925,836
OML 125 77,634 492 77,142 12,822,543
OML 131 42,446 33,784 8,662 1,439,798
OML 145 75,617 27,962 47,655 7,921,214
OML 122 13,748 - 13,748 2,285,193
OPL 321 935 - 935 155,416
OPL 323 1,012 - 1,012 168,215
Total impairment loss 464,853 63,468 401,385 66,718,215
b Goodwill impairment losses
Impairment tests for goodwill
Key assumptions
GNL entered into an arrangement with the Nigerian Gas Company Limited (NGC), a government business parastatal charged with the development and management of the Federal
Government of Nigeria's natural gas reserves and interests. Under the agreement, GNL is required to fund, design and construct gas supply and distribution facilities to deliver gas to end-
users in Greater Lagos Industrial area. During the agreed period, GNL shall purchase gas from NGC and sell to its customers. The agreement was entered into in March 1999 and shall be in
force for 20 years. The total sum due to putting in place the distribution facilities shall be determined by GNL in consultation with NGC. This amount determined shall represent capital
contribution by GNL and shall be recovered by GNL from revenue from sale of gas over the contract period using an agreed cost recovery formula. Per the agreement, the cost recovery rate
shall be based on mutually agreed rate per molecule of gas sold.
GNL is required to fund, design and construct the gas distribution facilities, and has a right to utilise the pipeline asset and the right of way licence obtained by NGC for the generation of
revenue from the use of the pipeline during the contract period. NGC is also obligated to deliver Annual Contract Quantity of gas to GNL and GNL is obligated to take or pay for the quantity
delivered. At the end of the contract period, the pipeline asset will be transferred to NGC. Either party has the right to terminate the agreement by serving the other party six (6) months notice
in the event of failure to meet the first gas delivery date, major breach of the contract terms, force majeure and in the event of insolvency or bankruptcy of either party.
Capital recovery is capped at the total capital expenditures plus interest costs incurred over the life of the contract. The maximum contract price recoverable by Gaslink is determined based
on periodic values advised by NGC. As of 31 Dec 2014, the maximum contract price recoverable was capped at N3.45billion exclusive of interest incurred (31 December 2013: N3.45billion).
The service concession arrangement has been classified as an intangible asset as Gaslink has the right to charge the users of the pipeline over the concession period. NGC has not
guaranteed payment of any shortfall on recovery from users.
Asset under Construction represent construction of a gas pipelines for Greater Lagos Industrial area phase IV. This project is expected to be completed in the third quarter of the year 2015.
The carrying amount of the facility at 31 December 2014 was N1.9 billion (2013: Nil).
In 2014, the carrying amount of certain exploration and evaluation assets have been reduced to their recoverable amount through recognition of an impairment loss of N74.17 billion (2013: Nil).
The impairment was triggered by declining oil prices and significant downward reserve revisions. The recoverable amounts have been determined based on the asset’s fair value less costs to
sell using per barrels of oil equivalent (boe) values implied from recent acquisitions; the estimate has been categorized in Level 2 of the fair value hierarchy. Key assumptions in the
determination of fair value are the $/boe and reserve estimates. Reserves as at December 31, 2014 have been evaluated by independent qualified reserves evaluators. The table below
summarizes the forecasted Dated Brent crude oil price used to determine cash flows from crude oil reserves and resources which is based on a consensus of views on future pricing.
For material natural gas reserves, a weighted average price of $2.50/mcf was used to determine cash flows. Crude oil loss factors applied ranged from 10% to 15% depending on the field.
The discount rate applied was 12%. For exploration and evaluation assets, the Group used $0.82/boe as the implied value/boe.
The table below shows the carrying and recoverable amounts of the impaired CGUs as at December 31, 2014.
Goodwill impairment loss of N2.14 billion had been previously recorded in relation to the acquisition of Churchill Finance C300-0462 Limited ("Churchill") since 2012. Churchill owns an airplane.
The impairment, arose as a result of the diminution in the market value of the airplane and the fact that the company had liabilities in excess of its assets. The impairment was determined on a
value in use basis using pre-tax discount rates of 10% which represented the pre-tax weighted average cost of capital of the Company. In 2014, an impairment assessment by management
resulted in additional impairment of N203 million on Churchill.
Also an impairment loss on goodwill of N493m from Oando Energy Service Ltd (OES) was also recognised as a result of the negative shareholders' funds recognised in the Company.
Churchill Finance C300-0462 Limited ("Churchill") and Oando Energy serviceds Limited belongs to the "Coporate" and "Energy Services" CGU.
In determining the recoverable amount of the CGU, management has made key assumptions to estimate the present value of future cash flows. These key assumptions have been made by
management reflecting past experience and are consistent with relevant external sources of information.
Operating cash flows
The main assumptions within forecast operating cash flows include the planned use of the airplane for the Group’s business. The achievement of future charter rates, hours, and the use of
industry relevant external forecasts such as fuel consumption, maintenance and crew costs are based on standard aviation practices.
Pre-tax risk adjusted discount rates
Pre-tax risk adjusted discount rates are derived from risk-free rates based upon long term government bonds in the territory in which the CGU operates. A relative risk adjustment has been
applied to risk-free rates to reflect the risk inherent in the CGU. The cash forecast covered five years.
Page 43 of 73
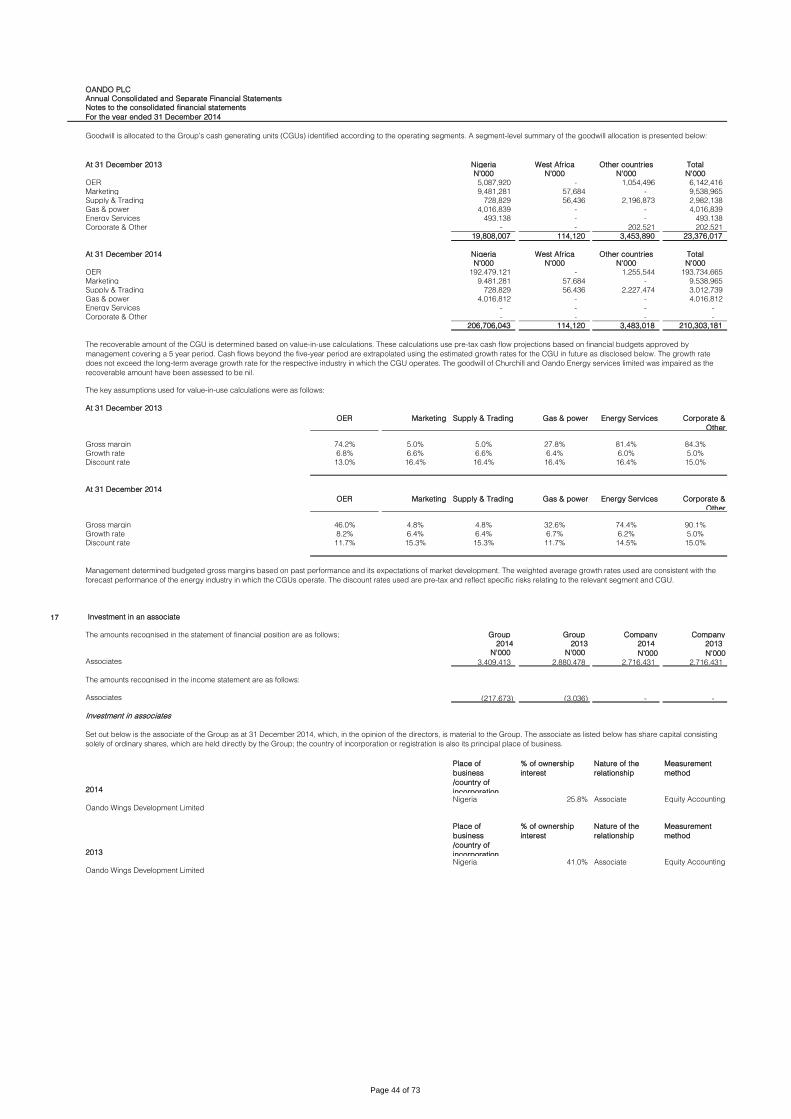
OANDO PLC
Annual Consolidated and Separate Financial Statements
Notes to the consolidated financial statements
For the year ended 31 December 2014
At 31 December 2013 Nigeria West Africa Other countries Total
N'000 N'000 N'000 N'000
OER 5,087,920 - 1,054,496 6,142,416
Marketing 9,481,281 57,684 - 9,538,965
Supply & Trading 728,829 56,436 2,196,873 2,982,138
Gas & power 4,016,839 - - 4,016,839
Energy Services 493,138 - - 493,138
Corporate & Other - - 202,521 202,521
19,808,007 114,120 3,453,890 23,376,017
At 31 December 2014 Nigeria West Africa Other countries Total
N'000 N'000 N'000 N'000
OER 192,479,121 - 1,255,544 193,734,665
Marketing 9,481,281 57,684 - 9,538,965
Supply & Trading 728,829 56,436 2,227,474 3,012,739
Gas & power 4,016,812 - - 4,016,812
Energy Services - - - -
Corporate & Other - - - -
206,706,043 114,120 3,483,018 210,303,181
OER Marketing Supply & Trading Gas & power Energy Services Corporate &
Other
Gross margin 74.2% 5.0% 5.0% 27.8% 81.4% 84.3%
Growth rate 6.8% 6.6% 6.6% 6.4% 6.0% 5.0%
Discount rate 13.0% 16.4% 16.4% 16.4% 16.4% 15.0%
At 31 December 2014
OER Marketing Supply & Trading Gas & power Energy Services Corporate &
Other
Gross margin 46.0% 4.8% 4.8% 32.6% 74.4% 90.1%
Growth rate 8.2% 6.4% 6.4% 6.7% 6.2% 5.0%
Discount rate 11.7% 15.3% 15.3% 11.7% 14.5% 15.0%
17 Investment in an associate
The amounts recognised in the statement of financial position are as follows; Group Group Company Company
2014 2013 2014 2013
N'000 N'000 N'000 N'000Associates 3,409,413 2,880,478 2,716,431 2,716,431
The amounts recognised in the income statement are as follows:
Associates (217,673) (3,036) - -
Investment in associates
2014
Place of
business
/country of
incorporation
% of ownership
interest
Nature of the
relationship
Measurement
method
Oando Wings Development LimitedNigeria 25.8% Associate Equity Accounting
2013
Place of
business
/country of
incorporation
% of ownership
interest
Nature of the
relationship
Measurement
method
Oando Wings Development LimitedNigeria 41.0% Associate Equity Accounting
Set out below is the associate of the Group as at 31 December 2014, which, in the opinion of the directors, is material to the Group. The associate as listed below has share capital consisting
solely of ordinary shares, which are held directly by the Group; the country of incorporation or registration is also its principal place of business.
Goodwill is allocated to the Group’s cash generating units (CGUs) identified according to the operating segments. A segment-level summary of the goodwill allocation is presented below:
The recoverable amount of the CGU is determined based on value-in-use calculations. These calculations use pre-tax cash flow projections based on financial budgets approved by
management covering a 5 year period. Cash flows beyond the five-year period are extrapolated using the estimated growth rates for the CGU in future as disclosed below. The growth rate
does not exceed the long-term average growth rate for the respective industry in which the CGU operates. The goodwill of Churchill and Oando Energy services limited was impaired as the
recoverable amount have been assessed to be nil.
The key assumptions used for value-in-use calculations were as follows:
At 31 December 2013
Management determined budgeted gross margins based on past performance and its expectations of market development. The weighted average growth rates used are consistent with the
forecast performance of the energy industry in which the CGUs operate. The discount rates used are pre-tax and reflect specific risks relating to the relevant segment and CGU.
Page 44 of 73
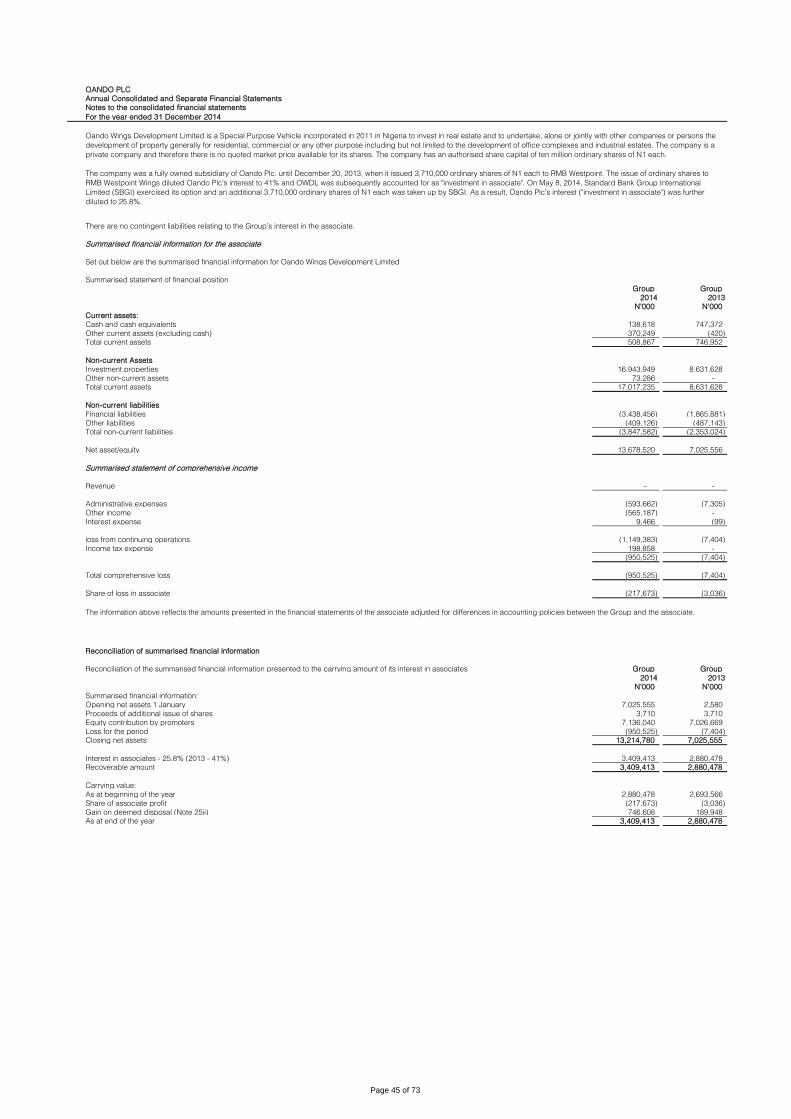
OANDO PLC
Annual Consolidated and Separate Financial Statements
Notes to the consolidated financial statements
For the year ended 31 December 2014
There are no contingent liabilities relating to the Group’s interest in the associate.
Summarised financial information for the associate
Set out below are the summarised financial information for Oando Wings Development Limited
Summarised statement of financial position
Group Group
2014 2013
N'000 N'000
Current assets:
Cash and cash equivalents 138,618 747,372
Other current assets (excluding cash) 370,249 (420)
Total current assets 508,867 746,952
Non-current Assets
Investment properties 16,943,949 8,631,628
Other non-current assets 73,286 -
Total current assets 17,017,235 8,631,628
Non-current liabilities
Financial liabilities (3,438,456) (1,865,881)
Other liabilities (409,126) (487,143)
Total non-current liabilities (3,847,582) (2,353,024)
Net asset/equity 13,678,520 7,025,556
Summarised statement of comprehensive income
Revenue - -
Administrative expenses (593,662) (7,305)
Other income (565,187) -
Interest expense 9,466 (99)
loss from continuing operations (1,149,383) (7,404)
Income tax expense 198,858 -
(950,525) (7,404)
Total comprehensive loss (950,525) (7,404)
Share of loss in associate (217,673) (3,036)
Reconciliation of summarised financial information
Reconciliation of the summarised financial information presented to the carrying amount of its interest in associates Group Group
2014 2013
N'000 N'000
Summarised financial information:
Opening net assets 1 January 7,025,555 2,580
Proceeds of additional issue of shares 3,710 3,710
Equity contribution by promoters 7,136,040 7,026,669
Loss for the period (950,525) (7,404)
Closing net assets 13,214,780 7,025,555
Interest in associates - 25.8% (2013 - 41%) 3,409,413 2,880,478
Recoverable amount 3,409,413 2,880,478
Carrying value:
As at beginning of the year 2,880,478 2,693,566
Share of associate profit (217,673) (3,036)
Gain on deemed disposal (Note 25ii) 746,608 189,948
As at end of the year 3,409,413 2,880,478
Oando Wings Development Limited is a Special Purpose Vehicle incorporated in 2011 in Nigeria to invest in real estate and to undertake, alone or jointly with other companies or persons the
development of property generally for residential, commercial or any other purpose including but not limited to the development of office complexes and industrial estates. The company is a
private company and therefore there is no quoted market price available for its shares. The company has an authorised share capital of ten million ordinary shares of N1 each.
The company was a fully owned subsidiary of Oando Plc. until December 20, 2013, when it issued 3,710,000 ordinary shares of N1 each to RMB Westpoint. The issue of ordinary shares to
RMB Westpoint Wings diluted Oando Plc’s interest to 41% and OWDL was subsequently accounted for as "investment in associate". On May 8, 2014, Standard Bank Group International
Limited (SBGI) exercised its option and an additional 3,710,000 ordinary shares of N1 each was taken up by SBGI. As a result, Oando Plc’s interest ("investment in associate") was further
diluted to 25.8%.
The information above reflects the amounts presented in the financial statements of the associate adjusted for differences in accounting policies between the Group and the associate.
Page 45 of 73
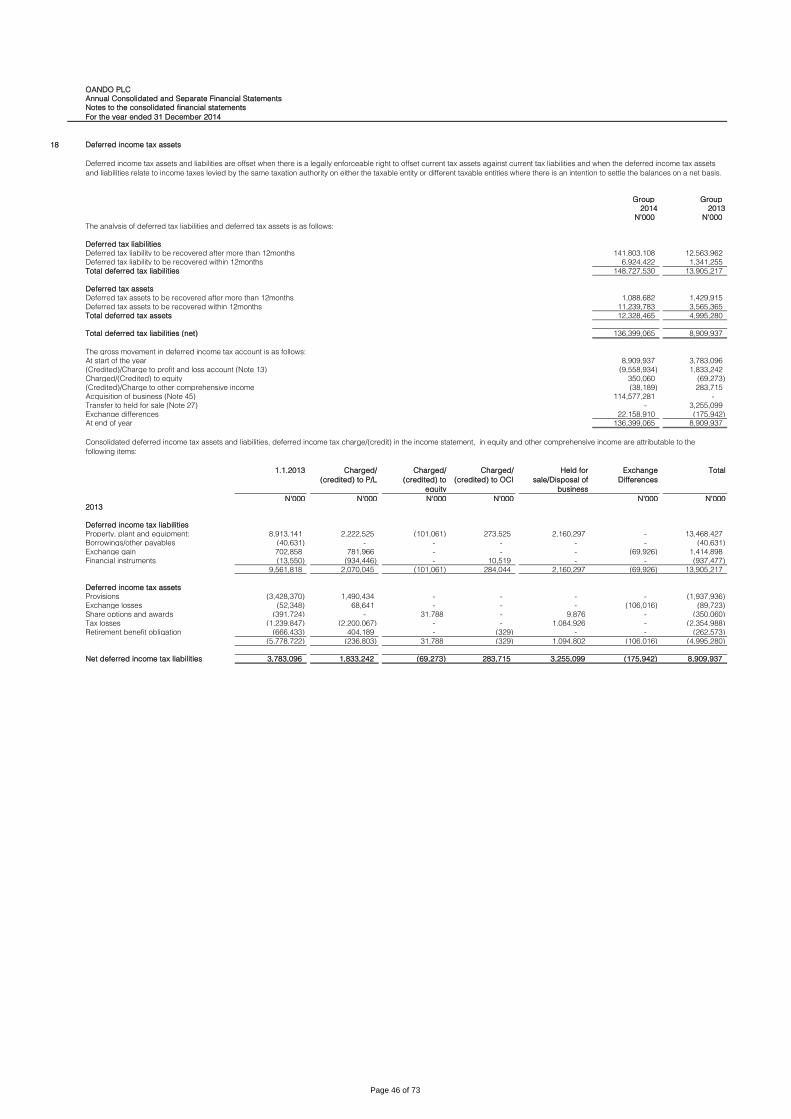
OANDO PLC
Annual Consolidated and Separate Financial Statements
Notes to the consolidated financial statements
For the year ended 31 December 2014
18
Group Group
2014 2013
N'000 N'000
The analysis of deferred tax liabilities and deferred tax assets is as follows:
Deferred tax liabilities
Deferred tax liability to be recovered after more than 12months 141,803,108 12,563,962
Deferred tax liability to be recovered within 12months 6,924,422 1,341,255
Total deferred tax liabilities 148,727,530 13,905,217
Deferred tax assets
Deferred tax assets to be recovered after more than 12months 1,088,682 1,429,915
Deferred tax assets to be recovered within 12months 11,239,783 3,565,365
Total deferred tax assets 12,328,465 4,995,280
Total deferred tax liabilities (net) 136,399,065 8,909,937
The gross movement in deferred income tax account is as follows:
At start of the year 8,909,937 3,783,096
(Credited)/Charge to profit and loss account (Note 13) (9,558,934) 1,833,242
Charged/(Credited) to equity 350,060 (69,273)
(Credited)/Charge to other comprehensive income (38,189) 283,715
Acquisition of business (Note 45) 114,577,281 -
Transfer to held for sale (Note 27) - 3,255,099
Exchange differences 22,158,910 (175,942)
At end of year 136,399,065 8,909,937
1.1.2013 Charged/
(credited) to P/L
Charged/
(credited) to
equity
Charged/
(credited) to OCI
Held for
sale/Disposal of
business
Exchange
Differences
Total
N'000 N'000 N'000 N'000 N'000 N'0002013
Deferred income tax liabilities
Property, plant and equipment: 8,913,141 2,222,525 (101,061) 273,525 2,160,297 - 13,468,427
Borrowings/other payables (40,631) - - - - - (40,631)
Exchange gain 702,858 781,966 - - - (69,926) 1,414,898
Financial instruments (13,550) (934,446) - 10,519 - - (937,477)
9,561,818 2,070,045 (101,061) 284,044 2,160,297 (69,926) 13,905,217
Deferred income tax assets
Provisions (3,428,370) 1,490,434 - - - - (1,937,936)
Exchange losses (52,348) 68,641 - - - (106,016) (89,723)
Share options and awards (391,724) - 31,788 - 9,876 - (350,060)
Tax losses (1,239,847) (2,200,067) - - 1,084,926 - (2,354,988)
Retirement benefit obligation (666,433) 404,189 - (329) - - (262,573)
(5,778,722) (236,803) 31,788 (329) 1,094,802 (106,016) (4,995,280)
Net deferred income tax liabilities 3,783,096 1,833,242 (69,273) 283,715 3,255,099 (175,942) 8,909,937
Deferred income tax assets
Deferred income tax assets and liabilities are offset when there is a legally enforceable right to offset current tax assets against current tax liabilities and when the deferred income tax assets
and liabilities relate to income taxes levied by the same taxation authority on either the taxable entity or different taxable entities where there is an intention to settle the balances on a net basis.
Consolidated deferred income tax assets and liabilities, deferred income tax charge/(credit) in the income statement, in equity and other comprehensive income are attributable to the
following items:
Page 46 of 73
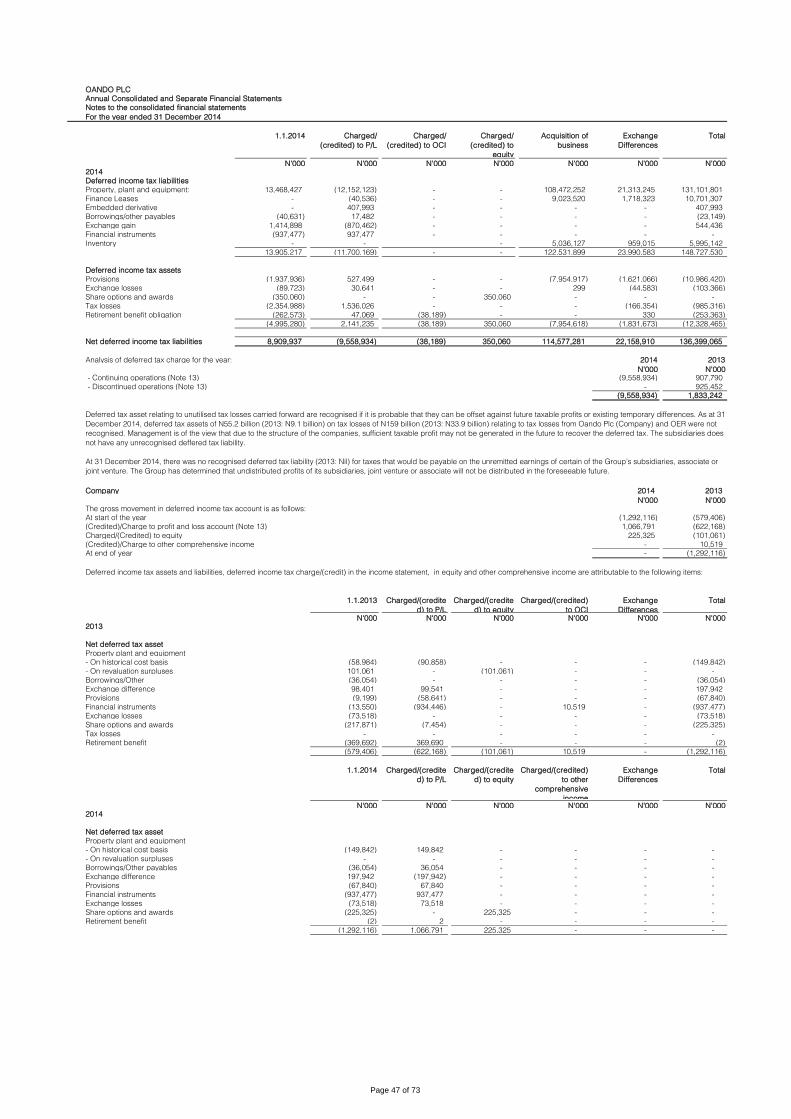
OANDO PLC
Annual Consolidated and Separate Financial Statements
Notes to the consolidated financial statements
For the year ended 31 December 2014
1.1.2014 Charged/
(credited) to P/L
Charged/
(credited) to OCI
Charged/
(credited) to
equity
Acquisition of
business
Exchange
Differences
Total
N'000 N'000 N'000 N'000 N'000 N'000 N'0002014
Deferred income tax liabilities
Property, plant and equipment: 13,468,427 (12,152,123) - - 108,472,252 21,313,245 131,101,801
Finance Leases - (40,536) - - 9,023,520 1,718,323 10,701,307
Embedded derivative - 407,993 - - - - 407,993
Borrowings/other payables (40,631) 17,482 - - - - (23,149)
Exchange gain 1,414,898 (870,462) - - - - 544,436
Financial instruments (937,477) 937,477 - - - - -
Inventory - - - 5,036,127 959,015 5,995,142
13,905,217 (11,700,169) - - 122,531,899 23,990,583 148,727,530
Deferred income tax assets
Provisions (1,937,936) 527,499 - - (7,954,917) (1,621,066) (10,986,420)
Exchange losses (89,723) 30,641 - - 299 (44,583) (103,366)
Share options and awards (350,060) - - 350,060 - - -
Tax losses (2,354,988) 1,536,026 - - - (166,354) (985,316)
Retirement benefit obligation (262,573) 47,069 (38,189) - - 330 (253,363)
(4,995,280) 2,141,235 (38,189) 350,060 (7,954,618) (1,831,673) (12,328,465)
8,909,937 (9,558,934) (38,189) 350,060 114,577,281 22,158,910 136,399,065
Analysis of deferred tax charge for the year: 2014 2013
N'000 N'000 - Continuing operations (Note 13) (9,558,934) 907,790
- Discontinued operations (Note 13) - 925,452
(9,558,934) 1,833,242
Company 2014 2013
N'000 N'000The gross movement in deferred income tax account is as follows:
At start of the year (1,292,116) (579,406)
(Credited)/Charge to profit and loss account (Note 13) 1,066,791 (622,168)
Charged/(Credited) to equity 225,325 (101,061)
(Credited)/Charge to other comprehensive income - 10,519
At end of year - (1,292,116)
1.1.2013 Charged/(credite
d) to P/L
Charged/(credite
d) to equity
Charged/(credited)
to OCI
Exchange
Differences
Total
N'000 N'000 N'000 N'000 N'000 N'0002013
Net deferred tax asset
Property plant and equipment
- On historical cost basis (58,984) (90,858) - - - (149,842)
- On revaluation surpluses 101,061 - (101,061) - - -
Borrowings/Other (36,054) - - - - (36,054)
Exchange difference 98,401 99,541 - - - 197,942
Provisions (9,199) (58,641) - - - (67,840)
Financial instruments (13,550) (934,446) - 10,519 - (937,477)
Exchange losses (73,518) - - - - (73,518)
Share options and awards (217,871) (7,454) - - - (225,325)
Tax losses - - - - - -
Retirement benefit (369,692) 369,690 - - - (2)
(579,406) (622,168) (101,061) 10,519 - (1,292,116)
1.1.2014 Charged/(credite
d) to P/L
Charged/(credite
d) to equity
Charged/(credited)
to other
comprehensive
income
Exchange
Differences
Total
N'000 N'000 N'000 N'000 N'000 N'0002014
Net deferred tax asset
Property plant and equipment
- On historical cost basis (149,842) 149,842 - - - -
- On revaluation surpluses - - - - - -
Borrowings/Other payables (36,054) 36,054 - - - -
Exchange difference 197,942 (197,942) - - - -
Provisions (67,840) 67,840 - - - -
Financial instruments (937,477) 937,477 - - - -
Exchange losses (73,518) 73,518 - - - -
Share options and awards (225,325) - 225,325 - - -
Retirement benefit (2) 2 - - - -
(1,292,116) 1,066,791 225,325 - - -
Net deferred income tax liabilities
Deferred tax asset relating to unutilised tax losses carried forward are recognised if it is probable that they can be offset against future taxable profits or existing temporary differences. As at 31
December 2014, deferred tax assets of N55.2 billion (2013: N9.1 billion) on tax losses of N159 billion (2013: N33.9 billion) relating to tax losses from Oando Plc (Company) and OER were not
recognised. Management is of the view that due to the structure of the companies, sufficient taxable profit may not be generated in the future to recover the deferred tax. The subsidiaries does
not have any unrecognised deffered tax liability.
At 31 December 2014, there was no recognised deferred tax liability (2013: Nil) for taxes that would be payable on the unremitted earnings of certain of the Group’s subsidiaries, associate or
joint venture. The Group has determined that undistributed profits of its subsidiaries, joint venture or associate will not be distributed in the foreseeable future.
Deferred income tax assets and liabilities, deferred income tax charge/(credit) in the income statement, in equity and other comprehensive income are attributable to the following items:
Page 47 of 73

OANDO PLC
Annual Consolidated and Separate Financial Statements
Notes to the consolidated financial statements
For the year ended 31 December 2014
19 Derivative financial assets Group Group Company Company
2014 2013 2014 2013
N'000 N'000 N'000 N'000
Commodity option contracts (i) 55,427,507 - - -
Convertible options (Note 22b) - - 1,662,948 1,582,989
Interest rate swap - 4,933 - 4,933
Foreign currency forwards - 384,967 - -
Embedded derivative - Akute Finance Lease (ii) 2,123,947 1,220,796 - -
57,551,454 1,610,696 1,662,948 1,587,922
Analysis of total derivative financial assets
Non current 57,551,454 1,220,796 1,662,948 1,582,989
Current - 389,900 - 4,933
Total 57,551,454 1,610,696 1,662,948 1,587,922
i Commodity option contracts
Price/Unit1 Volume Fair valuePosition Remaining term Fixed ($) Strike ($) Premium (bbl/d) =N=
Acquisition assets:
- Fixed sell, purchased call Jan. 2015 to July 2017 97.00 110.55 - 5,333 29,127,709
- Purchased put Jan. 2015 to July 2017 - 110.55 13.55 2,667 14,558,865
Total volume - Acquisition Assets 8,000 43,686,574
Legacy Assets:
- Purchased put Jan. 2015 to July 20192 - 95 - 115 11.50 - 11.84 2,223 11,740,933
Total volume - Legacy Assets 55,427,507
ii Embedded derivative - Akute Finance Lease
iii Convertible options
Company Company2014 2013
N'000 N'000At start of year 1,582,989 - Fair value on initial recognition - 3,510,306 Gain/loss recognised in income statement 79,959 (1,927,317)At end of year 1,662,948 1,582,989
20 Finance lease receivables Group Group Company Company
2014 2013 2014 2013
N'000 N'000 N'000 N'000
Finance lease receivable - Current 658,133 782,480 - -
Finance lease receivable - Non Current 42,796,330 6,927,207 - -
43,454,463 7,709,687 - -
(i)
(ii)
Akute Power Limited Power (APL) has a Power Purchase Agreement (PPA) with the Lagos State Water Corporation (LSWC). In addition to the power supply, APL bills LSWC exchange rate
fluctuations between the Naira and US Dollars, where the exchange rate exceeds the ruling rate at the contract inception date. The terms of the agreement creates a derivative financial
instrument, this has been stripped out of the host contract and separately valued. The embedded derivative has been recognized at fair value at each reporting period. At 31 December 2014,
the derivative was an asset and was valued at N2.12 billion (2013 : N1.22 billion).
The table below presents the changes in level 3 instruments for the year ended 31 December 2014.
In 2008, Akute Power Limited (APL) a subsidiary of Oando Plc., entered into a Build, Own, Operate and Transfer (BOOT) arrangement with Lagos State Water Corporation (LSWC) to construct
a gas – fired electric plant and deliver power to LSWC over a period of 20 years (10 years initial period with an option to extend for 2 successive terms of up to 5 years). The construction was
completed in 2010 and commercial operations commenced in February 2010.
Lease agreements in which the other party, as lessee (LSWC) is to be regarded as the economic owner of the leased assets give rise to accounts receivable in the amount of the discounted
future lease payments in the books of the lessor (APL). The carrying value of the finance lease as at 31 December 2014 is N2.66 billion (2013: N3.15 billion).
In August 2014, OER entered into financial commodity contracts which hedge crude oil sales associated with assets acquired in the COP Acquisition (the “Acquisition Assets”) (as required
under the $450 million senior secured loan facility) and Legacy Assets (as required under the $350 million corporate loan facility). The table below summarizes the nature of the hedges
executed pursuant to these arrangements:
1 Based on the weighted average price/unit for the remainder of contract.
2 Remaining term excludes February 2016 to January 2017.
The effect of the Acquisition Asset hedges is to fix the price of oil that OER receives, on the specific volumes at $97/bbl until the benchmark price of dated Brent crude oil reaches 110.55/bbl;
when dated Brent crude oil price exceeds $110.55/bbl OER will receive the incremental price above $110.55/bbl. The Acquisition Asset hedges account for 8,000 bbl/day.
The effect of the Legacy Asset hedges is to fix the price of oil that OER receives, on the specific volumes at an average price of $91/bbl until the benchmark price of dated Brent crude oil
reaches the cap price (which ranges from $95/bbl to $115/bbl); when dated Brent crude oil price exceeds the cap price OER will receive the incremental price above cap price. The Legacy
Asset hedges account for an average of 2,223 bbl/day.
The fair value of the commodity contracts as at December 31, 2014 was N55.4 billion ($299.9 million). During the period August 2014 - December 2014, the Group realised a net derivative
gain of N49.1 billion (2013 - Nil) in the income statement on commodity contracts. Subsequent to December 31, 2014, OER entered into an early settlement and reset arrangements with
hedging counterparties which resulted in the receipt of $234 million in cash which was used to repay existing debt obligation (refer to Note 40).
The fair value of financial commodity contracts are calculated based on observable inputs which include forward prices of crude oil.
The Group through its subsidiary Alausa Power Limited (APL) entered into an agreement with the Lagos State Government (LASG) to build, operate and transfer an electricity generating
power plant located at Alausa, Ikeja, Lagos State, Nigeria, with up to 10MW installed capacity. Under the terms of the contract LASG will purchase 10.4MW of electricity from APL, with a
committed annual demand of 4MW on a take-or-pay basis. The contract is for an initial period of 10 years from commercial operations date with an option to negotiate an extension for
successive terms upon terms and conditions that shall be mutually agreed. Commercial operation commenced in October 2013.
The excess of the present value of the lease receivables over the carrying value of the asset derecognised (N1.2 billion) is recognised as unearned lease premium and amortised as other
operating income to profit or loss over the lease term of 10 years; N126.9 million was amortised in 2014 (2013: N20.5 million). The carrying value of the finance lease as at 31 December 2014 is
N4.62 billion (2013: N3.06 billion).
Page 48 of 73
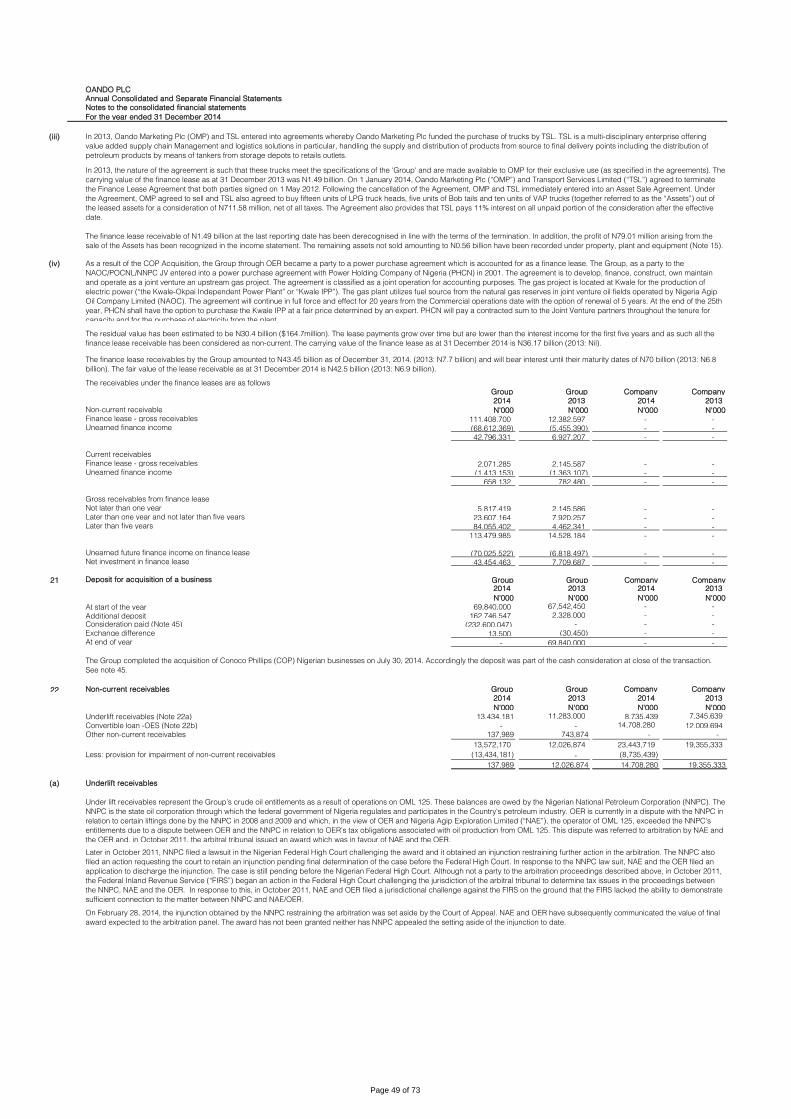
OANDO PLC
Annual Consolidated and Separate Financial Statements
Notes to the consolidated financial statements
For the year ended 31 December 2014
(iii)
(iv)
The receivables under the finance leases are as follows
Group Group Company Company
2014 2013 2014 2013
Non-current receivable N'000 N'000 N'000 N'000Finance lease - gross receivables 111,408,700 12,382,597 - - Unearned finance income (68,612,369) (5,455,390) - -
42,796,331 6,927,207 - -
Current receivables
Finance lease - gross receivables 2,071,285 2,145,587 - - Unearned finance income (1,413,153) (1,363,107) - -
658,132 782,480 - -
Gross receivables from finance lease
Not later than one year 5,817,419 2,145,586 - - Later than one year and not later than five years 23,607,164 7,920,257 - - Later than five years 84,055,402 4,462,341 - -
113,479,985 14,528,184 - -
Unearned future finance income on finance lease (70,025,522) (6,818,497) - - Net investment in finance lease 43,454,463 7,709,687 - -
21 Deposit for acquisition of a business Group Group Company Company2014 2013 2014 2013
N'000 N'000 N'000 N'000
69,840,000 67,542,450 - -
162,746,547 2,328,000 - -
Consideration paid (Note 45) (232,600,047) - - -
Exchange difference 13,500 (30,450) - -
At end of year - 69,840,000 - -
22 Non-current receivables Group Group Company Company
2014 2013 2014 2013
N'000 N'000 N'000 N'000
13,434,181 11,283,000 8,735,439 7,345,639
- - 14,708,280 12,009,694
137,989 743,874 - -
13,572,170 12,026,874 23,443,719 19,355,333
(13,434,181) - (8,735,439)
137,989 12,026,874 14,708,280 19,355,333
(a)
Convertible loan -OES (Note 22b)
Other non-current receivables
Less: provision for impairment of non-current receivables
The finance lease receivables by the Group amounted to N43.45 billion as of December 31, 2014. (2013: N7.7 billion) and will bear interest until their maturity dates of N70 billion (2013: N6.8
billion). The fair value of the lease receivable as at 31 December 2014 is N42.5 billion (2013: N6.9 billion).
At start of the year
Additional deposit
The Group completed the acquisition of Conoco Phillips (COP) Nigerian businesses on July 30, 2014. Accordingly the deposit was part of the cash consideration at close of the transaction.
See note 45.
Underlift receivables (Note 22a)
In 2013, Oando Marketing Plc (OMP) and TSL entered into agreements whereby Oando Marketing Plc funded the purchase of trucks by TSL. TSL is a multi-disciplinary enterprise offering
value added supply chain Management and logistics solutions in particular, handling the supply and distribution of products from source to final delivery points including the distribution of
petroleum products by means of tankers from storage depots to retails outlets.
In 2013, the nature of the agreement is such that these trucks meet the specifications of the 'Group' and are made available to OMP for their exclusive use (as specified in the agreements). The
carrying value of the finance lease as at 31 December 2013 was N1.49 billion. On 1 January 2014, Oando Marketing Plc (“OMP”) and Transport Services Limited (“TSL”) agreed to terminate
the Finance Lease Agreement that both parties signed on 1 May 2012. Following the cancellation of the Agreement, OMP and TSL immediately entered into an Asset Sale Agreement. Under
the Agreement, OMP agreed to sell and TSL also agreed to buy fifteen units of LPG truck heads, five units of Bob tails and ten units of VAP trucks (together referred to as the “Assets”) out of
the leased assets for a consideration of N711.58 million, net of all taxes. The Agreement also provides that TSL pays 11% interest on all unpaid portion of the consideration after the effective
date.
The finance lease receivable of N1.49 billion at the last reporting date has been derecognised in line with the terms of the termination. In addition, the profit of N79.01 million arising from the
sale of the Assets has been recognized in the income statement. The remaining assets not sold amounting to N0.56 billion have been recorded under property, plant and equipment (Note 15).
As a result of the COP Acquisition, the Group through OER became a party to a power purchase agreement which is accounted for as a finance lease. The Group, as a party to the
NAOC/POCNL/NNPC JV entered into a power purchase agreement with Power Holding Company of Nigeria (PHCN) in 2001. The agreement is to develop, finance, construct, own maintain
and operate as a joint venture an upstream gas project. The agreement is classified as a joint operation for accounting purposes. The gas project is located at Kwale for the production of
electric power (“the Kwale-Okpai Independent Power Plant” or “Kwale IPP”). The gas plant utilizes fuel source from the natural gas reserves in joint venture oil fields operated by Nigeria Agip
Oil Company Limited (NAOC). The agreement will continue in full force and effect for 20 years from the Commercial operations date with the option of renewal of 5 years. At the end of the 25th
year, PHCN shall have the option to purchase the Kwale IPP at a fair price determined by an expert. PHCN will pay a contracted sum to the Joint Venture partners throughout the tenure for
capacity and for the purchase of electricity from the plant.
The residual value has been estimated to be N30.4 billion ($164.7million). The lease payments grow over time but are lower than the interest income for the first five years and as such all the
finance lease receivable has been considered as non-current. The carrying value of the finance lease as at 31 December 2014 is N36.17 billion (2013: Nil).
Underlift receivables
Under lift receivables represent the Group’s crude oil entitlements as a result of operations on OML 125. These balances are owed by the Nigerian National Petroleum Corporation (NNPC). The
NNPC is the state oil corporation through which the federal government of Nigeria regulates and participates in the Country's petroleum industry. OER is currently in a dispute with the NNPC in
relation to certain liftings done by the NNPC in 2008 and 2009 and which, in the view of OER and Nigeria Agip Exploration Limited (“NAE”), the operator of OML 125, exceeded the NNPC's
entitlements due to a dispute between OER and the NNPC in relation to OER’s tax obligations associated with oil production from OML 125. This dispute was referred to arbitration by NAE and
the OER and, in October 2011, the arbitral tribunal issued an award which was in favour of NAE and the OER.
Later in October 2011, NNPC filed a lawsuit in the Nigerian Federal High Court challenging the award and it obtained an injunction restraining further action in the arbitration. The NNPC also
filed an action requesting the court to retain an injunction pending final determination of the case before the Federal High Court. In response to the NNPC law suit, NAE and the OER filed an
application to discharge the injunction. The case is still pending before the Nigerian Federal High Court. Although not a party to the arbitration proceedings described above, in October 2011,
the Federal Inland Revenue Service (“FIRS”) began an action in the Federal High Court challenging the jurisdiction of the arbitral tribunal to determine tax issues in the proceedings between
the NNPC, NAE and the OER. In response to this, in October 2011, NAE and OER filed a jurisdictional challenge against the FIRS on the ground that the FIRS lacked the ability to demonstrate
sufficient connection to the matter between NNPC and NAE/OER.
On February 28, 2014, the injunction obtained by the NNPC restraining the arbitration was set aside by the Court of Appeal. NAE and OER have subsequently communicated the value of final
award expected to the arbitration panel. The award has not been granted neither has NNPC appealed the setting aside of the injunction to date.
Page 49 of 73
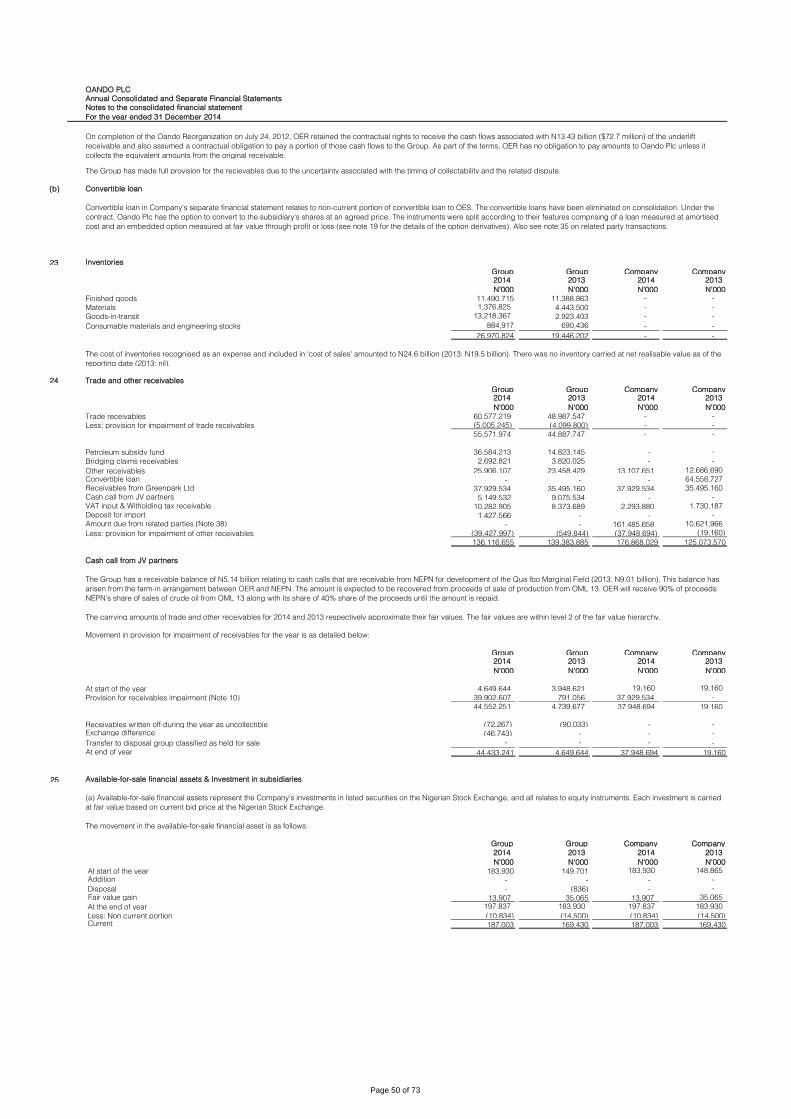
OANDO PLC
Annual Consolidated and Separate Financial Statements
Notes to the consolidated financial statement
For the year ended 31 December 2014
(b)
23 Inventories
Group Group Company Company2014 2013 2014 2013
N'000 N'000 N'000 N'000
11,490,715 11,388,863 - -
1,376,825 4,443,500 - -
13,218,367 2,923,403 - -
Consumable materials and engineering stocks 884,917 690,436 - -
26,970,824 19,446,202 - -
24
Group Group Company Company2014 2013 2014 2013
N'000 N'000 N'000 N'000
60,577,219 48,987,547 - -
(5,005,245) (4,099,800) - -
55,571,974 44,887,747 - -
36,584,213 14,823,145 - -
2,692,821 3,820,025 - -
25,906,107 23,458,429 13,107,651 12,686,690
Convertible loan - - - 64,558,727
Receivables from Greenpark Ltd 37,929,534 35,495,160 37,929,534 35,495,160
Cash call from JV partners 5,149,532 9,075,534 - -
VAT input & Witholding tax receivable 10,282,905 8,373,689 2,293,880 1,730,187
Deposit for import 1,427,566 - - -
Amount due from related parties (Note 38) - - 161,485,658 10,621,966
(39,427,997) (549,844) (37,948,694) (19,160)
136,116,655 139,383,885 176,868,029 125,073,570
Group Group Company Company2014 2013 2014 2013
N'000 N'000 N'000 N'000
4,649,644 3,948,621 19,160 19,160
39,902,607 791,056 37,929,534 -
44,552,251 4,739,677 37,948,694 19,160
(72,267) (90,033) - -
Exchange difference (46,743) - - -
Transfer to disposal group classified as held for sale - - - -
At end of year 44,433,241 4,649,644 37,948,694 19,160
25 Available-for-sale financial assets & Investment in subsidiaries
Group Group Company Company
2014 2013 2014 2013
N'000 N'000 N'000 N'000
183,930 149,701 183,930 148,865
Addition - - - -
- (836) - -
Fair value gain 13,907 35,065 13,907 35,065
197,837 183,930 197,837 183,930
(10,834) (14,500) (10,834) (14,500) Current 187,003 169,430 187,003 169,430
Less: provision for impairment of trade receivables
Petroleum subsidy fund
Bridging claims receivables
Other receivables
Less: provision for impairment of other receivables
Finished goods
Materials
Goods-in-transit
The cost of inventories recognised as an expense and included in ‘cost of sales' amounted to N24.6 billion (2013: N19.5 billion). There was no inventory carried at net realisable value as of the
reporting date (2013: nil).
Trade and other receivables
Trade receivables
On completion of the Oando Reorganization on July 24, 2012, OER retained the contractual rights to receive the cash flows associated with N13.43 billion ($72.7 million) of the underlift
receivable and also assumed a contractual obligation to pay a portion of those cash flows to the Group. As part of the terms, OER has no obligation to pay amounts to Oando Plc unless it
collects the equivalent amounts from the original receivable.
The Group has made full provision for the recievables due to the uncertainty associated with the timing of collectability and the related dispute.
Convertible loan
Convertible loan in Company's separate financial statement relates to non-current portion of convertible loan to OES. The convertible loans have been eliminated on consolidation. Under the
contract, Oando Plc has the option to convert to the subsidiary's shares at an agreed price. The instruments were split according to their features comprising of a loan measured at amortised
cost and an embedded option measured at fair value through profit or loss (see note 19 for the details of the option derivatives). Also see note 35 on related party transactions.
Less: Non current portion
Provision for receivables impairment (Note 10)
Receivables written off during the year as uncollectible
(a) Available-for-sale financial assets represent the Company’s investments in listed securities on the Nigerian Stock Exchange, and all relates to equity instruments. Each investment is carried
at fair value based on current bid price at the Nigerian Stock Exchange.
The movement in the available-for-sale financial asset is as follows:
At start of the year
Disposal
At the end of year
Cash call from JV partners
The Group has a receivable balance of N5.14 billion relating to cash calls that are receivable from NEPN for development of the Qua Ibo Marginal Field (2013: N9.01 billion). This balance has
arisen from the farm-in arrangement between OER and NEPN. The amount is expected to be recovered from proceeds of sale of production from OML 13. OER will receive 90% of proceeds
NEPN’s share of sales of crude oil from OML 13 along with its share of 40% share of the proceeds until the amount is repaid.
The carrying amounts of trade and other receivables for 2014 and 2013 respectively approximate their fair values. The fair values are within level 2 of the fair value hierarchy.
Movement in provision for impairment of receivables for the year is as detailed below:
At start of the year
Page 50 of 73

OANDO PLC
Annual Consolidated and Separate Financial Statements
Notes to the consolidated financial statement
For the year ended 31 December 2014
(b) Investment in subsidiaries Company Company
2014 2013
N'000 N'000
Akute Power Limited 2,500 2,500
Apapa SPM Limited 19,125 19,125
Gaslink Nigeria Limited(1)
6,950,847 7,027,713
Oando Energy Services Limited(1)
27,328,921 27,361,842
Oando Gas and Power Limited 1,000 1,000
Oando Lekki Refinery Limited 2,500 2,500
Oando Marketing Limited(1)
15,573,050 15,784,793
Oando Port Harcourt refinery Limited 2,500 2,500
Oando Properties Limited 250 250
Oando Supply and Trading Limited(1)
764,594 822,105
Oando Trading Limited Bermuda 3,435,950 3,435,950
OML 112 & 117 Limited 6,538 6,538
Oando Terminal and Logistics Limited 2,500 2,500
Oando Liberia Limited 6,538 6,538
OES Passion Limited 1,752 1,752
OES Professionalism Limited 10,000 10,000
Central Horizon Gas Company Limited 5,100 5,100
Ajah Distribution Limited 2,500 2,500
Alausa Power Limited 2,500 2,500
Gasgrid Nigeria Limited 2,500 2,500
Oando Resources Limited 2,500 2,500
Lekki Gardens Power Limited 2,500 2,500
Oando Exploration Equator Holdings Limited 1,816 1,816 Oando Servco Nig Limited - -
XRS 1 Limited 18 -
Oando Energy Resources Inc. 50,997,514 53,681,593
105,125,513 108,188,615
Provision for diminution(2) (27,331,422) (2,500)
77,794,091 108,186,115
(i)
(ii)
Group2013
N'000Oando wings net asset as at date of deemed disposal 7,032,959Oando Plc's share 41.0%Fair value of interest retained (41%) 2,883,513Net asset immediately prior to deemed disposal/ loss of control -2,693,565Gain on deemed disposal 189,948
Group2014
N'000Oando wings net asset as at date of deemed disposal 14,346,634 Oando Plc's share 25.8%Fair value of interest retained (25.8%) 3,701,432 Oando Plc's share of Oando Wings net asset immediately prior to deemed disposal (2,954,824)Gain on deemed disposal 746,608
26 Cash and cash equivalents (excluding bank overdraft) Group Group Company Company2014 2013 2014 2013
N'000 N'000 N'000 N'000Cash at bank and in hand 20,791,765 21,367,677 2,174,093 115,726
Short term deposits 6,647,995 2,519,820 672,514 1,370,566
27,439,760 23,887,497 2,846,607 1,486,292 Restricted cash 14,194,363 3,798,258 - 327,107
41,634,123 27,685,755 2,846,607 1,813,399
(1) Group settled share based transactions is recognised as an equity-settled share-based payment transaction and additional investments in the subsidiary. All the outstanding share options
granted in 2010 had been forfeited as the options were not taken up as of the expiry date. Subsequently, all previously recognised increase in investment in the subsidiaries were reversed.
(2) In 2014, the carrying amount (N27.3 billion) of the Investment in OES has been reduced to its recoverable amount (Nil) through recognition of an impairment loss of N27.3 billion. Decline in
performance, resulting in significant reduction in net asset was trigger of the impairment assessment. See note 16(b) for disclosures on determining the recoverable amounts.
Conversion of loan to equity in OER
In 2014, Oando Plc transferred its rights to the conversion of the N171.8 billion ($929.9 million) Convertible loan notes previously issued by OER in accordance with the Convertible Notes
Purchase Agreements to Oando Resources Ltd (“ORL”). Consequently, OER issued 650,785,739 common shares and 325,392,869 warrants in favour of ORL, a wholly owned subsidiary of
Oando Plc. The investment of ORL in OER has been eliminated on consolidation.
Gain on deemed disposal of Oando Wings
OWDL was a fully owned subsidiary of Oando Plc until December 20, 2013, when shares were issued to RMB West port. See note 17. Please see below for details of the gain on deemed
disposal of the company:
The fair value of the company at the date control was lost was based on the net asset of the company between Oando Plc and RMB Westport. The gain on deemed disposal has been
recognised in other incomes.
The weighted average effective interest rate on short-term bank deposits at the year-end was 11.7% (2013:17.1%). These deposits have an average maturity of 30 days. The management
assessed that the fair value of cash and short term deposits approximates their carrying amounts.
Page 51 of 73
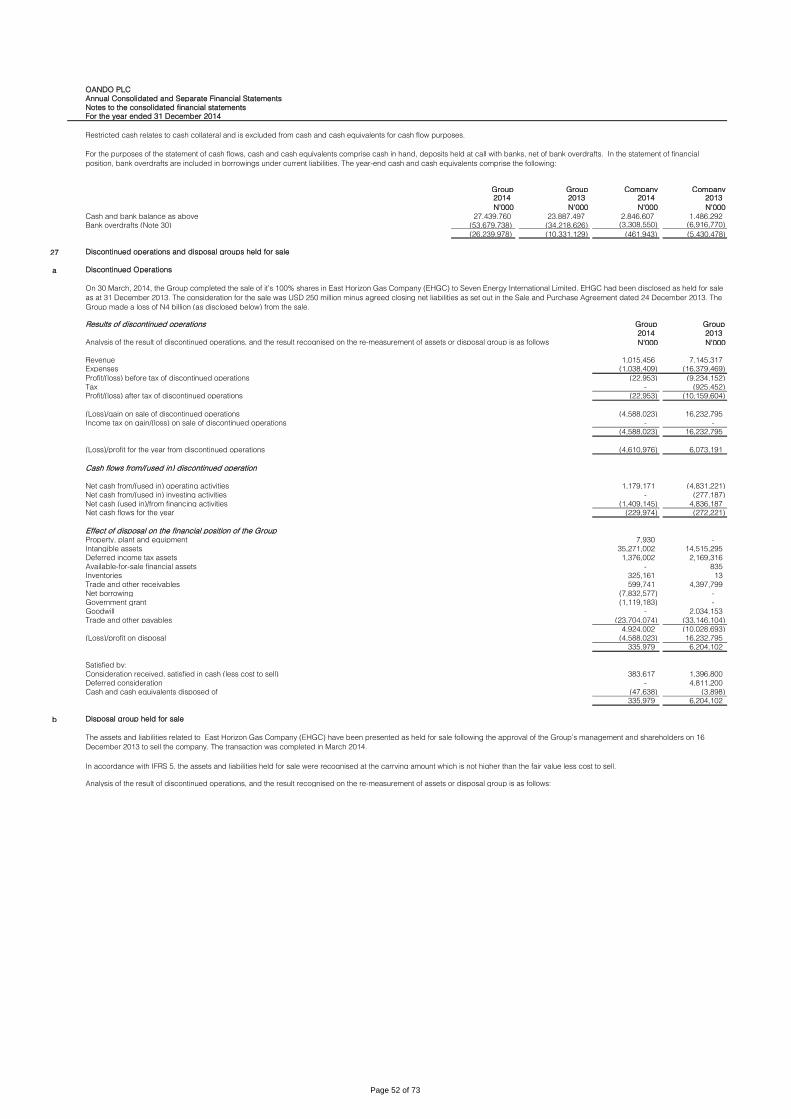
OANDO PLC
Annual Consolidated and Separate Financial Statements
Notes to the consolidated financial statements
For the year ended 31 December 2014
Group Group Company Company2014 2013 2014 2013
N'000 N'000 N'000 N'000
27,439,760 23,887,497 2,846,607 1,486,292
(53,679,738) (34,218,626) (3,308,550) (6,916,770)
(26,239,978) (10,331,129) (461,943) (5,430,478)
27 Discontinued operations and disposal groups held for sale
a Discontinued Operations
Results of discontinued operations Group Group
2014 2013
Analysis of the result of discontinued operations, and the result recognised on the re-measurement of assets or disposal group is as follows N'000 N'000
Revenue 1,015,456 7,145,317
Expenses (1,038,409) (16,379,469)
Profit/(loss) before tax of discontinued operations (22,953) (9,234,152)
Tax - (925,452)
Profit/(loss) after tax of discontinued operations (22,953) (10,159,604)
(Loss)/gain on sale of discontinued operations (4,588,023) 16,232,795
Income tax on gain/(loss) on sale of discontinued operations - -
(4,588,023) 16,232,795
(Loss)/profit for the year from discontinued operations (4,610,976) 6,073,191
Cash flows from/(used in) discontinued operation
Net cash from/(used in) operating activities 1,179,171 (4,831,221)
Net cash from/(used in) investing activities - (277,187)
Net cash (used in)/from financing activities (1,409,145) 4,836,187
Net cash flows for the year (229,974) (272,221)
Effect of disposal on the financial position of the GroupProperty, plant and equipment 7,930 -
Intangible assets 35,271,002 14,515,295
Deferred income tax assets 1,376,002 2,169,316
Available-for-sale financial assets - 835
Inventories 325,161 13
Trade and other receivables 599,741 4,397,799
Net borrowing (7,832,577) -
Government grant (1,119,183) -
Goodwill - 2,034,153
Trade and other payables (23,704,074) (33,146,104)
4,924,002 (10,028,693)
(Loss)/profit on disposal (4,588,023) 16,232,795
335,979 6,204,102
Satisfied by:
Consideration received, satisfied in cash (less cost to sell) 383,617 1,396,800
Deferred consideration - 4,811,200
Cash and cash equivalents disposed of (47,638) (3,898)
335,979 6,204,102
b Disposal group held for sale
Analysis of the result of discontinued operations, and the result recognised on the re-measurement of assets or disposal group is as follows:
Bank overdrafts (Note 30)
On 30 March, 2014, the Group completed the sale of it’s 100% shares in East Horizon Gas Company (EHGC) to Seven Energy International Limited. EHGC had been disclosed as held for sale
as at 31 December 2013. The consideration for the sale was USD 250 million minus agreed closing net liabilities as set out in the Sale and Purchase Agreement dated 24 December 2013. The
Group made a loss of N4 billion (as disclosed below) from the sale.
The assets and liabilities related to East Horizon Gas Company (EHGC) have been presented as held for sale following the approval of the Group’s management and shareholders on 16
December 2013 to sell the company. The transaction was completed in March 2014.
In accordance with IFRS 5, the assets and liabilities held for sale were recognised at the carrying amount which is not higher than the fair value less cost to sell.
Restricted cash relates to cash collateral and is excluded from cash and cash equivalents for cash flow purposes.
For the purposes of the statement of cash flows, cash and cash equivalents comprise cash in hand, deposits held at call with banks, net of bank overdrafts. In the statement of financial
position, bank overdrafts are included in borrowings under current liabilities. The year-end cash and cash equivalents comprise the following:
Cash and bank balance as above
Page 52 of 73
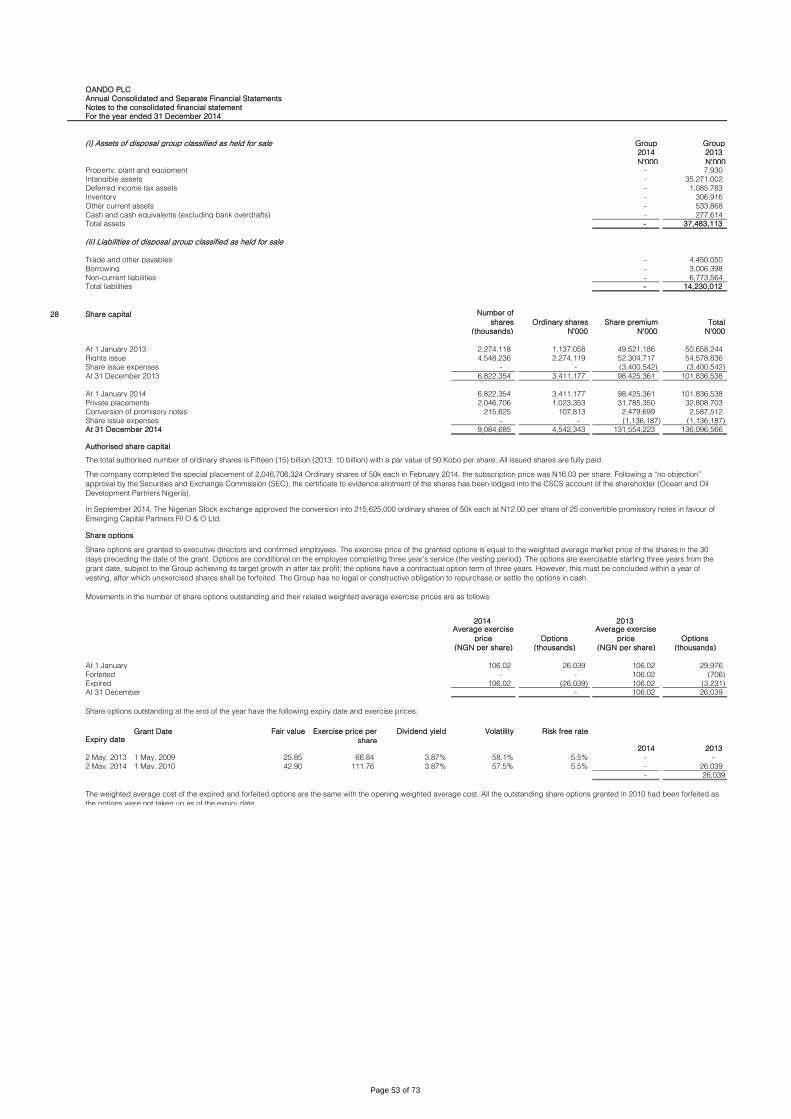
OANDO PLC
Annual Consolidated and Separate Financial Statements
Notes to the consolidated financial statement
For the year ended 31 December 2014
(i) Assets of disposal group classified as held for sale Group Group
2014 2013
N'000 N'000Property, plant and equipment - 7,930
Intangible assets - 35,271,002
Deferred income tax assets - 1,085,783
Inventory - 306,916
Other current assets - 533,868
Cash and cash equivalents (excluding bank overdrafts) - 277,614
Total assets - 37,483,113
(ii) Liabilities of disposal group classified as held for sale
Trade and other payables - 4,450,050
Borrowing - 3,006,398
Non-current liabilities - 6,773,564
Total liabilities - 14,230,012
28 Share capital Number of
shares Ordinary shares Share premium Total
(thousands) N'000 N'000 N'000
At 1 January 2013 2,274,118 1,137,058 49,521,186 50,658,244
Rights issue 4,548,236 2,274,119 52,304,717 54,578,836
Share issue expenses - - (3,400,542) (3,400,542)
At 31 December 2013 6,822,354 3,411,177 98,425,361 101,836,538
At 1 January 2014 6,822,354 3,411,177 98,425,361 101,836,538
Private placements 2,046,706 1,023,353 31,785,350 32,808,703
Conversion of promisory notes 215,625 107,813 2,479,699 2,587,512
Share issue expenses - - (1,136,187) (1,136,187)
At 31 December 2014 9,084,685 4,542,343 131,554,223 136,096,566
Authorised share capital
Share options
2014 2013Average exercise
price Options
Average exercise
price Options
(NGN per share) (thousands) (NGN per share) (thousands)
At 1 January 106.02 26,039 106.02 29,976
Forfeited - - 106.02 (706)
Expired 106.02 (26,039) 106.02 (3,231)
At 31 December - 106.02 26,039
Expiry dateGrant Date Fair value Exercise price per
share
Dividend yield Volatility Risk free rate
2014 2013
2 May, 2013 1 May, 2009 25.85 66.84 3.87% 58.1% 5.5% - -
2 May, 2014 1 May, 2010 42.90 111.76 3.87% 57.5% 5.5% - 26,039
- 26,039
The company completed the special placement of 2,046,706,324 Ordinary shares of 50k each in February 2014, the subscription price was N16.03 per share. Following a “no objection”
approval by the Securities and Exchange Commission (SEC), the certificate to evidence allotment of the shares has been lodged into the CSCS account of the shareholder (Ocean and Oil
Development Partners Nigeria).
In September 2014, The Nigerian Stock exchange approved the conversion into 215,625,000 ordinary shares of 50k each at N12.00 per share of 25 convertible promissory notes in favour of
Emerging Capital Partners Fll O & O Ltd.
Share options are granted to executive directors and confirmed employees. The exercise price of the granted options is equal to the weighted average market price of the shares in the 30
days preceding the date of the grant. Options are conditional on the employee completing three year’s service (the vesting period). The options are exercisable starting three years from the
grant date, subject to the Group achieving its target growth in after tax profit; the options have a contractual option term of three years. However, this must be concluded within a year of
vesting, after which unexercised shares shall be forfeited. The Group has no legal or constructive obligation to repurchase or settle the options in cash.
Movements in the number of share options outstanding and their related weighted average exercise prices are as follows:
Share options outstanding at the end of the year have the following expiry date and exercise prices:
The weighted average cost of the expired and forfeited options are the same with the opening weighted average cost. All the outstanding share options granted in 2010 had been forfeited as
the options were not taken up as of the expiry date.
The total authorised number of ordinary shares is Fifteen (15) billion (2013: 10 billion) with a par value of 50 Kobo per share. All issued shares are fully paid.
Page 53 of 73

OANDO PLC
Annual Consolidated and Separate Financial Statements
Notes to the consolidated financial statement
For the year ended 31 December 2014
29 Other reserves Revaluation1
reserves
Share based2
payment reserve
Currency
translation
reserve
Total
Group (thousands) N'000 N'000 N'000
At 1 January 2013 15,639,029 1,779,851 (3,006,816) 14,412,064
Exchange difference on translation of foreign operations - - (457,680) (457,680)
Convertible bond- Equity component - - - -
Revaluation surplus on disposal transferred to retained earnings (1,010,608) - (1,010,608)
Deferred tax on revaluation surplus on disposal transferred to retained earnings 101,061 - 101,061
Share based payment reserve charge - 606,651 - 606,651
Tax on value of employee services - 37,236 - 37,236
Transfer of expired SBPR to retained earnings - (105,965) - (105,965)
Deferred tax on transfer of expired SBPR to retained earnings - (31,789) - (31,789)
IFRIC 1 adjustment to revaluation reserve (2,483) - - (2,483)
Gains on revaluation of property, plant and equipment 9,942,732 - - 9,942,732
Deferred tax on revaluation surplus (273,525) - - (273,525)
At 31 December 2013 24,396,206 2,285,984 (3,464,496) 23,217,694
At 1 January 2014 24,396,206 2,285,984 (3,464,496) 23,217,694
Exchange difference on translation of foreign operations - - 32,284,156 32,284,156
- - (2,729,230) (2,729,230)
Share based payment reserve charge - 343,956 - 343,956
Transfer of expired SBPR to retained earnings - (1,166,863) - (1,166,863)
Deferred tax on transfer of expired SBPR to retained earnings - (350,060) - (350,060)
Reclassification of revaluation reserve (1,078,023) - - (1,078,023)
At 31 December 2014 23,318,183 1,113,017 26,090,430 50,521,630
Other reserves
Revaluation1
reserves
Share based2
payment reserve
Currency
translation
reserve Total
Company (thousands) N'000 N'000 N'000
At 1 January 2013 909,547 1,366,579 - 2,276,126
Revaluation surplus on disposal transferred to retained earnings (1,010,608) (1,010,608)
Deferred tax on revaluation surplus on disposal transferred to retained earnings 101,061 101,061
Share based payment reserve - 124,121 - 124,121
Deferred tax on share based payment 24,799 24,799
Transfer of expired SBPR to retained earnings - (105,965) - (105,965)
Deferred tax on transfer of expired SBPR to retained earnings - (17,345) - (17,345)
At 31 December 2013 as restated - 1,392,189 - 1,392,189
At 1 January 2014 - 1,392,189 - 1,392,189
Transfer of expired SBPR to retained earnings - (1,166,863) - (1,166,863)
Deferred tax on transfer of expired SBPR to retained earnings - (225,326) - (225,326)
At 31 December 2014 - - - -
30 Borrowings Group Group Company Company2014 2013 2014 2013
N'000 N'000 N'000 N'000The borrowings are made up as follows:
162,328,636 71,872,418 4,142,857 11,942,482
53,679,738 34,218,626 3,308,550 6,916,770
188,395,721 146,681,886 45,444,233 22,633,675
68,169,026 - 68,169,026 -
769,079 2,512,123 769,079 2,512,123
311,013,564 183,412,635 117,690,888 32,062,568
473,342,200 255,285,053 121,833,745 44,005,050
Convertible note
Other third party debt
Total borrowings
The borrowings above include secured bank borrowings amounting to N28.2 billion (2013: N51.2 billion). Oando Plc (the borrower) by a security trust deed (“STD”) dated 9 October 2009 and
amendments in 2010 (Supplemental Security Trust Deed), 2011 (Second Supplemental Security Trust Deed), and 2014 (Third Supplemental Security Trust Deed), created Security over its
assets in favour of FBN Trustees Limited (Security Trustee and formerly known as First Trustees Nigeria Limited). The STD creates fixed and floating charges over plant, machinery, vehicles,
computers, office and other equipment, all book and other debts, accounts receivables, all stock, shares, bonds, notes or loan capital, all copyrights, patents, licences, trademarks, etc., for
and on behalf of the Lender.
(b) Current
Bank overdraft (Note 26)
Bank loans
Change in ownership interests in subsidiaries that do not result in
a loss of control
Share based payment reserve
The share-based payment reserve is used to recognise the value of equity-settled share-based payments provided to employees, including key management personnel, as part of their
remuneration. Refer to Note 28 for further details of these plans. Share based payment reserve is not available for distribution to shareholders.
Currency translation reserve
The translation reserve comprises all foreign currency difference arising from the translation of the financial statements of foreign operations, as well as the effective portion of any foreign
currency differences arising from hedges of a net investment in a foreign operation.
Revaluation reserve
The revaluation reserve is used to recognise revaluation increase (surplus) on property, plant and equipment. However, the increase shall be recognised in surplus or deficit to the extent that it
reverses a revaluation decrease of the same asset previously recognised in surplus or deficit. Revaluation reserve is not available for redistribution to shareholders until realised through
disposal of related assets.
(a) Non-current - Bank loans
Page 54 of 73
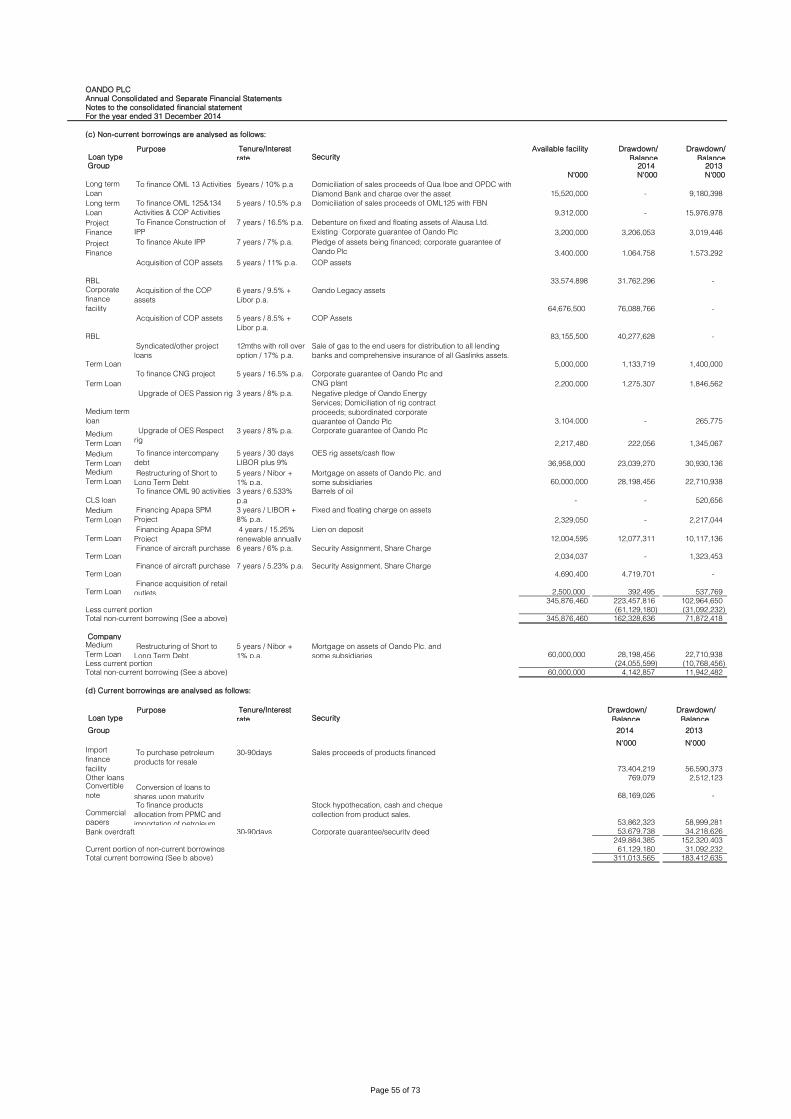
OANDO PLC
Annual Consolidated and Separate Financial Statements
Notes to the consolidated financial statement
For the year ended 31 December 2014
(c) Non-current borrowings are analysed as follows:
Loan typePurpose Tenure/Interest
rate Security Available facility Drawdown/
Balance
Drawdown/
Balance Group 2014 2013
N'000 N'000 N'000
Long term
Loan
To finance OML 13 Activities 5years / 10% p.a
15,520,000 - 9,180,398
Long term
Loan
To finance OML 125&134
Activities & COP Activities
5 years / 10.5% p.a
9,312,000 - 15,976,978
Project
Finance
To Finance Construction of
IPP
7 years / 16.5% p.a.
3,200,000 3,206,053 3,019,446
Project
Finance
To finance Akute IPP 7 years / 7% p.a.
3,400,000 1,064,758 1,573,292
RBL
Acquisition of COP assets 5 years / 11% p.a.
33,574,898 31,762,296 -
Corporate
finance
facility
Acquisition of the COP
assets
6 years / 9.5% +
Libor p.a.
64,676,500 76,088,766 -
RBL
Acquisition of COP assets 5 years / 8.5% +
Libor p.a.
83,155,500 40,277,628 -
Term Loan
Syndicated/other project
loans
12mths with roll over
option / 17% p.a.
5,000,000 1,133,719 1,400,000
Term Loan
To finance CNG project 5 years / 16.5% p.a.
2,200,000 1,275,307 1,846,562
Medium term
loan
Upgrade of OES Passion rig 3 years / 8% p.a.
3,104,000 - 265,775
Medium
Term Loan
Upgrade of OES Respect
rig
3 years / 8% p.a.
2,217,480 222,056 1,345,067
Medium
Term Loan
To finance intercompany
debt
5 years / 30 days
LIBOR plus 9%
margin36,958,000 23,039,270 30,930,136
Medium
Term Loan Restructuring of Short to
Long Term Debt
5 years / Nibor +
1% p.a. 60,000,000 28,198,456 22,710,938
CLS loan
To finance OML 90 activities 3 years / 6.533%
p.a - - 520,656
Medium
Term Loan
Financing Apapa SPM
Project
3 years / LIBOR +
8% p.a. 2,329,050 - 2,217,044
Term Loan
Financing Apapa SPM
Project
4 years / 15.25%
renewable annually 12,004,595 12,077,311 10,117,136
Term Loan Finance of aircraft purchase 6 years / 6% p.a.
2,034,037 - 1,323,453
Term Loan Finance of aircraft purchase 7 years / 5.23% p.a.
4,690,400 4,719,701 -
Term Loan Finance acquisition of retail
outlets 2,500,000 392,495 537,769
345,876,460 223,457,816 102,964,650
Less current portion (61,129,180) (31,092,232)
Total non-current borrowing (See a above) 345,876,460 162,328,636 71,872,418
Company Medium
Term Loan Restructuring of Short to
Long Term Debt
5 years / Nibor +
1% p.a. 60,000,000 28,198,456 22,710,938
Less current portion (24,055,599) (10,768,456)
Total non-current borrowing (See a above) 60,000,000 4,142,857 11,942,482
(d) Current borrowings are analysed as follows:
Loan typePurpose Tenure/Interest
rate Security Drawdown/
Balance
Drawdown/
Balance
Group 2014 2013
N'000 N'000Import
finance
facility
To purchase petroleum
products for resale
30-90days
73,404,219 56,590,373
Other loans 769,079 2,512,123 Convertible
note Conversion of loans to
shares upon maturity 68,169,026 -
Commercial
papers
To finance products
allocation from PPMC and
importation of petroleum 53,862,323 58,999,281
30-90days 53,679,738 34,218,626
249,884,385 152,320,403
Current portion of non-current borrowings 61,129,180 31,092,232
Total current borrowing (See b above) 311,013,565 183,412,635
Domiciliation of sales proceeds of Qua Iboe and OPDC with
Diamond Bank and charge over the asset
Barrels of oil
Fixed and floating charge on assets
Lien on deposit
Security Assignment, Share Charge
Security Assignment, Share Charge
Mortgage on assets of Oando Plc. and
some subsidiaries
Sale of gas to the end users for distribution to all lending
banks and comprehensive insurance of all Gaslinks assets.
Corporate guarantee of Oando Plc and
CNG plant
Negative pledge of Oando Energy
Services; Domiciliation of rig contract
proceeds; subordinated corporate
guarantee of Oando Plc
Corporate guarantee of Oando Plc
OES rig assets/cash flow
Mortgage on assets of Oando Plc. and
some subsidiaries
Domiciliation of sales proceeds of OML125 with FBN
Debenture on fixed and floating assets of Alausa Ltd.
Existing Corporate guarantee of Oando Plc
Pledge of assets being financed; corporate guarantee of
Oando Plc
COP assets
Oando Legacy assets
COP Assets
Sales proceeds of products financed
Stock hypothecation, cash and cheque
collection from product sales.
Bank overdraft Corporate guarantee/security deed
Page 55 of 73

OANDO PLC
Annual Consolidated and Separate Financial Statements
Notes to the consolidated financial statement
For the year ended 31 December 2014
Company 2014 2013
N'000 N'000Import
finance
facility
To purchase petroleum
products for resale
30-90days
4,225,560 2,737,699
Other loans 769,079 2,512,123 Convertible
note Conversion of loans to
shares upon maturity 68,169,026 -
Commercial
papers
To finance products
allocation from PPMC and
importation of petroleum
products 17,163,074 9,127,520
30-365days, 12.5%-
15.5% 3,308,550 6,916,770
93,635,289 21,294,112
Current portion of non-current borrowings 24,055,599 10,768,456
Total current borrowing (See b above) 117,690,888 32,062,568
Convertible loan notes
Instrument
Issue date
Instrument value Clean Bond value
(amortised cost)
Interest rates
=N='000 %
Dec-14 =N=1 billion 961,011 Libor + 8
Jan-14 =N=1.98 billion 1,959,854 MPR + 1
Jul-14 =N=10 billion 9,977,076 10
Jul-14 $50 million 9,218,160 8
Feb-14 $100 million 18,455,801 Libor + 8
Mar-14 $150 million 27,597,125 Libor + 8
68,169,027
Weighted average effective interest rates at the year end were: 2014 2013
- Bank overdraft 21.0% 18.0%
- Bank loans 13.0% 18.0%
- Import finance facility 5.00% 3.50%
- Finance leases 18.5% 18.5%
- Other loans 8.75% 8.75%
Group
2014 2013 2014 2013
N'000 N'000 N'000 N'000
Bank loans 473,342,200 255,285,053 325,467,110 171,083,855
Company
2014 2013 2014 2013
N'000 N'000 N'000 N'000
Bank loans 121,833,745 44,005,050 75,649,170 27,323,674
The carrying amounts of the Group's borrowings are denominated in the following currencies:
Group Group Company Company2014 2013 2014 2013
N'000 N'000 N'000 N'000Nigerian Naira 231,836,201 117,339,196 55,401,741 40,972,271
US Dollar 240,767,173 137,121,758 66,432,004 3,032,779
West African CFA 738,826 824,099 - -
473,342,200 255,285,053 121,833,745 44,005,050
31 Provisions for liabilities and charges
Group Group Company Company
2014 2013 2014 2013
N'000 N'000 N'000 N'000
Underground tanks 877,008 870,150 - -
Oil and gas fields 11,046,296 4,220,919 - -
11,923,304 5,091,069 - -
Fair values are based on cash flows using a discount rate based upon the borrowing rate that directors expect would be available to the Group at the reporting date. Set out below is a
comparison of the carrying amounts and fair values of the Company’s borrowings that are carried in the financial statements.
Carrying amounts Fair values
Carrying amounts Fair values
Provisions for liabilities and charges relate to underground tanks decommissioning and oil and gas assets abandonment restoration obligation as follows:
Stock hypothecation, cash and cheque
collection from product sales.
Bank overdraft Corporate guarantee/security deed
During the year, the Company entered into agreements with Ocean and Oil Development Partners Limited (OODP) and Offshore Personnel Services Limited (OPSL) converting funds received.
The Company also offered the Lenders (Holders) the right to opt for conversion of the loans balances to its own issued shares upon maturity (period subsequent to year end).
The average conversion price was the lower of:
a. Proposed right issue or private/public placement per share of common stock to be concluded by December 2014, or
b. The volume-weighted average price (VWAP) of an ordinary share of the Company on the Nigerian Stock Exchange for the five (5) trading days immediately preceeding, but not including,
the relevant conversion closing date.
Table below shows details of the Convertible Notes issued:
Sales proceeds of products financed
Page 56 of 73
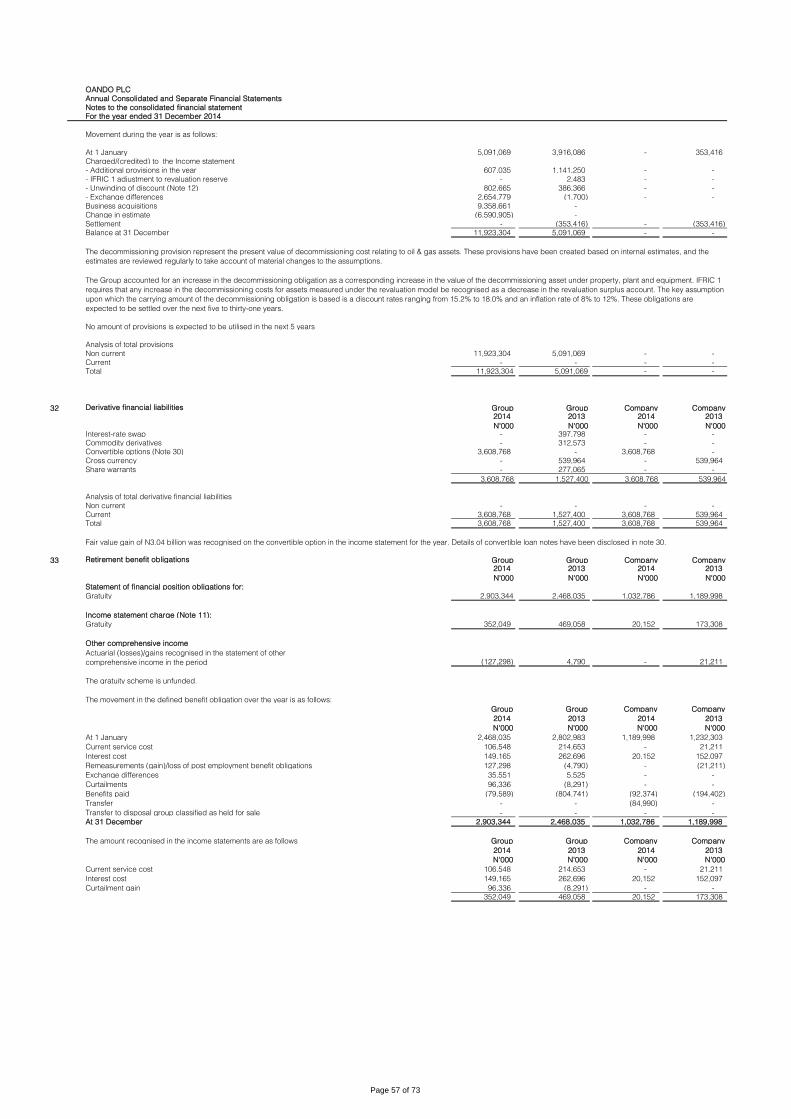
OANDO PLC
Annual Consolidated and Separate Financial Statements
Notes to the consolidated financial statement
For the year ended 31 December 2014
Movement during the year is as follows:
At 1 January 5,091,069 3,916,086 - 353,416
Charged/(credited) to the Income statement
- Additional provisions in the year 607,035 1,141,250 - -
- IFRIC 1 adjustment to revaluation reserve - 2,483 - -
- Unwinding of discount (Note 12) 802,665 386,366 - -
- Exchange differences 2,654,779 (1,700) - -
Business acquisitions 9,358,661 -
Change in estimate (6,590,905) -
Settlement - (353,416) - (353,416)
Balance at 31 December 11,923,304 5,091,069 - -
No amount of provisions is expected to be utilised in the next 5 years
Analysis of total provisions
Non current 11,923,304 5,091,069 - -
Current - - - -
Total 11,923,304 5,091,069 - -
32 Derivative financial liabilities Group Group Company Company2014 2013 2014 2013
N'000 N'000 N'000 N'000Interest-rate swap - 397,798 - -
Commodity derivatives - 312,573 - -
Convertible options (Note 30) 3,608,768 - 3,608,768 -
Cross currency - 539,964 - 539,964
Share warrants - 277,065 - -
3,608,768 1,527,400 3,608,768 539,964
Analysis of total derivative financial liabilities
Non current - - - -
Current 3,608,768 1,527,400 3,608,768 539,964
Total 3,608,768 1,527,400 3,608,768 539,964
33 Retirement benefit obligations Group Group Company Company2014 2013 2014 2013
N'000 N'000 N'000 N'000
Statement of financial position obligations for:
Gratuity 2,903,344 2,468,035 1,032,786 1,189,998
Income statement charge (Note 11):
Gratuity 352,049 469,058 20,152 173,308
Other comprehensive income
(127,298) 4,790 - 21,211
The gratuity scheme is unfunded.
The movement in the defined benefit obligation over the year is as follows:
Group Group Company Company
2014 2013 2014 2013
N'000 N'000 N'000 N'000
At 1 January 2,468,035 2,802,983 1,189,998 1,232,303
Current service cost 106,548 214,653 - 21,211
Interest cost 149,165 262,696 20,152 152,097
Remeasurements (gain)/loss of post employment benefit obligations 127,298 (4,790) - (21,211)
Exchange differences 35,551 5,525 - -
Curtailments 96,336 (8,291) - -
Benefits paid (79,589) (804,741) (92,374) (194,402)
Transfer - - (84,990) -
Transfer to disposal group classified as held for sale - - - -
At 31 December 2,903,344 2,468,035 1,032,786 1,189,998
The amount recognised in the income statements are as follows Group Group Company Company
2014 2013 2014 2013
N'000 N'000 N'000 N'000
Current service cost 106,548 214,653 - 21,211
Interest cost 149,165 262,696 20,152 152,097
Curtailment gain 96,336 (8,291) - -
352,049 469,058 20,152 173,308
The decommissioning provision represent the present value of decommissioning cost relating to oil & gas assets. These provisions have been created based on internal estimates, and the
estimates are reviewed regularly to take account of material changes to the assumptions.
The Group accounted for an increase in the decommissioning obligation as a corresponding increase in the value of the decommissioning asset under property, plant and equipment. IFRIC 1
requires that any increase in the decommissioning costs for assets measured under the revaluation model be recognised as a decrease in the revaluation surplus account. The key assumption
upon which the carrying amount of the decommissioning obligation is based is a discount rates ranging from 15.2% to 18.0% and an inflation rate of 8% to 12%. These obligations are
expected to be settled over the next five to thirty-one years.
Fair value gain of N3.04 billion was recognised on the convertible option in the income statement for the year. Details of convertible loan notes have been disclosed in note 30.
Actuarial (losses)/gains recognised in the statement of other
comprehensive income in the period
Page 57 of 73

OANDO PLC
Annual Consolidated and Separate Financial Statements
Notes to the consolidated financial statement
For the year ended 31 December 2014
Remeasurements of post employment benefit obligations Group Group Company Company
2014 2013 2014 2013
The factors that that contributed to the net actuarial gain for the year is as follows: N'000 N'000 N'000 N'000
Change in demographic assumptions (69,454) (71,556) - (4,857)Changes in financial assumptions 196,752 66,766 - (16,354)
127,298 (4,790) - (21,211)
Description of the plan
Curtailment
The following were the principal actuarial assumptions at the reporting date (expressed as weighted averages).
2014 2013
Discount rate 16.0% 13.0%
Future salary increases 12.0% 12.0%
Inflation rate 9.5% 8.0%
These tables translate into withdrawal rates as follows:
Age 2014 2013
18-29 4.5% 4.5%30-44 6.0% 6.0%45-49 2.5% 2.5%50-59 2.0% 2.0%60+ 100.0% 100.0%
Sensitivity Analysis
31 December 2014 Defined benefit obligation
Increase Decrease
N'000 N'000
Discount rate (1% movement) (31,106) 35,837
Future salary increases (1% movement) 35,837 (31,609)
31 December 2013 Defined benefit obligation
Increase Decrease
N'000 N'000
Discount rate (1% movement) (30,727) 35,401
Future salary increases (1% movement) 35,401 (31,225)
The maturity profile of the Retired Benefit Obligation is as detailed below: 2014 2013
N'000 N'000
Within the next 12 months 128,908 109,581
Between 2 and 5 years 977,622 758,220
Between 5 and 10 years 1,868,607 1,305,041
Beyond 10 years 6,965,796 4,556,466
The weighted average duration of the defined benefit obligtion is 13.9 years (2013: 13.9 years)
34 Government grant
35 Trade and other payables Group Group Company Company2014 2013 2014 2013
N'000 N'000 N'000 N'00073,891,847 45,070,167 710,148 -
34,677,237 11,099,231 - 2,813,991
25,247,073 26,495,911 23,254,936 2,626,068
- 17,677,781 - 17,677,781
18,104,994 18,433,978 4,206,393 410,527
- - 91,806,657 85,553,609
1,536,714 1,416,499 - -
3,169,688 3,865,734 - -
156,627,553 124,059,301 119,978,134 109,081,976
The normal retirement age is the age at which a staff member completes 30 years of service or reaches the age of 60, whichever comes first. The gratuity benefits are payable to staff members
with at least 3 years’ service. The gratuity benefit is calculated as follows:
- Less than 10 years of service: 8.33% of qualifying gross salary per annum for each year of service; and
- More than 10 years of service: once the annual qualifying gross salary.
The qualifying gross salary for employees consists of basic salary, transport, lunch, utility and housing allowances.
With effect from 1 January 2012, the Group discontinued the Scheme for management staff and increased employer’s contribution in respect of their existing contribution plan under the 2004
Pension Act. In 2013, the Group further discontinued the scheme for all senior staff except those in Oando Marketing Plc. Alexander Forbes Consulting Actuaries Nigeria Limited (Alexander
Forbes) was engaged to determine the liability from the scheme, which was estimated at N979 million. The Group intends to pay the money over to a fund manager who will manage the funds
on behalf of employees. Till then, the liability shall bear an interest rate equivalent to the average of the 90 day deposit rate of First Bank of Nigeria and Guaranty Trust Bank. Interest on the
liability is included in the interest cost above.
Assumptions regarding future mortality experience are set based on actuarial advice in accordance with published statistics and experience in Nigeria. Mortality assumptions are based on the
British A49/52 ultimate table published by the institute of actuaries of England.
Accrued expenses
Amount due to related parties
Deferred income
Reasonably possible changes at the reporting date to one of the relevant actuarial assumptions, holding other assumptions constant, would have affected the defined benefit obligation by the
amounts shown below.
Government grant relates to below the market rate loan obtained through the restructuring of the loan secured for the construction of the Akute plant under the bank of industry loan scheme.
The fair value of the grant was recognized initially on the grant date and subsequently amortized on a straight line basis over the tenor of the loan. There were no unfulfilled conditions relating
to the grant as at the reporting date. The initial grant was N417million out of which N123 million and N87 million were credited to interest expense in the statement of comprehensive income at
the end of 2012 and 2013 respectively. N87 million out of balance of N207 million at the beginning of the year was further credited to interest expense in 2014, leaving a balance of N119 million
at 31 December 2014.
Trade payables - Products
Trade payables - Other vendors
Other payables
Deposit for shares
Customers security deposit
Trade payables are non-interest bearing and are normally settled within one year. The carrying amounts of trade and other payables for 2014 and 2013 respectively approximate their fair
values.
Page 58 of 73
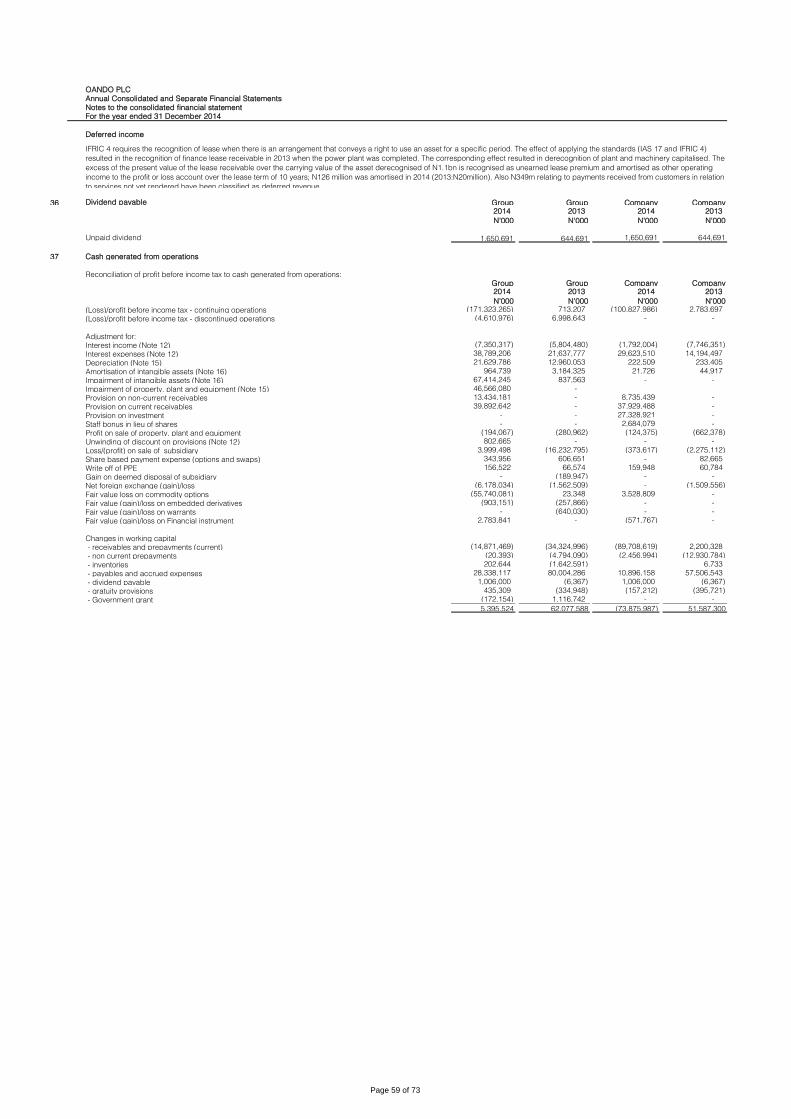
OANDO PLC
Annual Consolidated and Separate Financial Statements
Notes to the consolidated financial statement
For the year ended 31 December 2014
Deferred income
36 Dividend payable Group Group Company Company2014 2013 2014 2013
N'000 N'000 N'000 N'000
Unpaid dividend 1,650,691 644,691 1,650,691 644,691
37
Group Group Company Company2014 2013 2014 2013
N'000 N'000 N'000 N'000(171,323,265) 713,207 (100,827,986) 2,783,697
(4,610,976) 6,998,643 - -
(7,350,317) (5,804,480) (1,792,004) (7,746,351)
38,789,206 21,637,777 29,623,510 14,194,497
21,629,786 12,960,053 222,509 233,405
964,739 3,184,325 21,726 44,917
67,414,245 837,563 - -
46,566,080 -
13,434,181 - 8,735,439 -
39,892,642 - 37,929,488 -
- - 27,328,921 -
- - 2,684,079 -
(194,067) (280,962) (124,375) (662,378)
802,665 - - -
3,999,498 (16,232,795) (373,617) (2,275,112)
343,956 606,651 - 82,665
156,522 66,574 159,948 60,784
- (189,947) - -
(6,178,034) (1,562,509) - (1,509,556)
(55,740,081) 23,348 3,528,809 -
(903,151) (257,866) - -
- (640,030) - -
2,783,841 - (571,767) -
(14,871,469) (34,324,996) (89,708,619) 2,200,328
(20,393) (4,794,090) (2,456,994) (12,930,784)
202,644 (1,642,591) 6,733
28,338,117 80,004,286 10,896,158 57,506,543
1,006,000 (6,367) 1,006,000 (6,367)
435,309 (334,948) (157,212) (395,721)
(172,154) 1,116,742 - -
5,395,524 62,077,588 (73,875,987) 51,587,300
Interest expenses (Note 12)
Depreciation (Note 15)
Amortisation of intangible assets (Note 16)
Impairment of intangible assets (Note 16)
Reconciliation of profit before income tax to cash generated from operations:
(Loss)/profit before income tax - continuing operations
(Loss)/profit before income tax - discontinued operations
Adjustment for:
Interest income (Note 12)
IFRIC 4 requires the recognition of lease when there is an arrangement that conveys a right to use an asset for a specific period. The effect of applying the standards (IAS 17 and IFRIC 4)
resulted in the recognition of finance lease receivable in 2013 when the power plant was completed. The corresponding effect resulted in derecognition of plant and machinery capitalised. The
excess of the present value of the lease receivable over the carrying value of the asset derecognised of N1.1bn is recognised as unearned lease premium and amortised as other operating
income to the profit or loss account over the lease term of 10 years; N126 million was amortised in 2014 (2013:N20million). Also N349m relating to payments received from customers in relation
to services not yet rendered have been classified as deferred revenue.
Cash generated from operations
Fair value loss on commodity options
Fair value (gain)/loss on embedded derivatives
Fair value (gain)/loss on warrants
Fair value (gain)/loss on Financial instrument
Changes in working capital
- receivables and prepayments (current)
Unwinding of discount on provisions (Note 12)
Loss/(profit) on sale of subsidiary
Share based payment expense (options and swaps)
Write off of PPE
Gain on deemed disposal of subsidiary
Net foreign exchange (gain)/loss
Impairment of property, plant and equipment (Note 15)
Provision on non-current receivables
Provision on current receivables
Provision on investment
Staff bonus in lieu of shares
Profit on sale of property, plant and equipment
- non current prepayments
- inventories
- payables and accrued expenses
- dividend payable
- gratuity provisions
- Government grant
Page 59 of 73
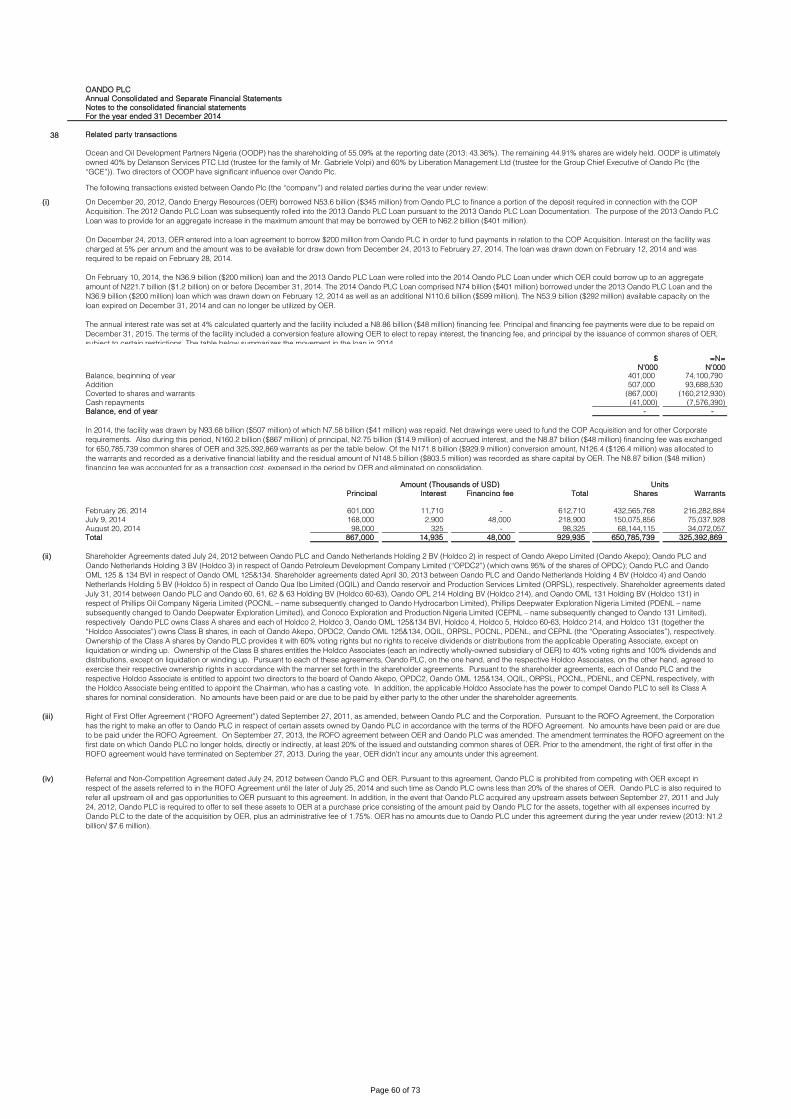
OANDO PLC
Annual Consolidated and Separate Financial Statements
Notes to the consolidated financial statements
For the year ended 31 December 2014
38 Related party transactions
The following transactions existed between Oando Plc (the “company”) and related parties during the year under review:
(i)
$ =N=
N'000 N'000Balance, beginning of year 401,000 74,100,790
Addition 507,000 93,688,530
Coverted to shares and warrants (867,000) (160,212,930)
Cash repayments (41,000) (7,576,390)
Balance, end of year - -
Principal Interest Financing fee Total Shares Warrants
601,000 11,710 - 612,710 432,565,768 216,282,884
168,000 2,900 48,000 218,900 150,075,856 75,037,928
98,000 325 - 98,325 68,144,115 34,072,057
Total 867,000 14,935 48,000 929,935 650,785,739 325,392,869
(ii)
(iii)
(iv)
February 26, 2014
July 9, 2014
August 20, 2014
Shareholder Agreements dated July 24, 2012 between Oando PLC and Oando Netherlands Holding 2 BV (Holdco 2) in respect of Oando Akepo Limited (Oando Akepo); Oando PLC and
Oando Netherlands Holding 3 BV (Holdco 3) in respect of Oando Petroleum Development Company Limited (“OPDC2”) (which owns 95% of the shares of OPDC); Oando PLC and Oando
OML 125 & 134 BVI in respect of Oando OML 125&134. Shareholder agreements dated April 30, 2013 between Oando PLC and Oando Netherlands Holding 4 BV (Holdco 4) and Oando
Netherlands Holding 5 BV (Holdco 5) in respect of Oando Qua Ibo Limited (OQIL) and Oando reservoir and Production Services Limited (ORPSL), respectively. Shareholder agreements dated
July 31, 2014 between Oando PLC and Oando 60, 61, 62 & 63 Holding BV (Holdco 60-63), Oando OPL 214 Holding BV (Holdco 214), and Oando OML 131 Holding BV (Holdco 131) in
respect of Phillips Oil Company Nigeria Limited (POCNL – name subsequently changed to Oando Hydrocarbon Limited), Phillips Deepwater Exploration Nigeria Limited (PDENL – name
subsequently changed to Oando Deepwater Exploration Limited), and Conoco Exploration and Production Nigeria Limited (CEPNL – name subsequently changed to Oando 131 Limited),
respectively Oando PLC owns Class A shares and each of Holdco 2, Holdco 3, Oando OML 125&134 BVI, Holdco 4, Holdco 5, Holdco 60-63, Holdco 214, and Holdco 131 (together the
“Holdco Associates”) owns Class B shares, in each of Oando Akepo, OPDC2, Oando OML 125&134, OQIL, ORPSL, POCNL, PDENL, and CEPNL (the “Operating Associates”), respectively.
Ownership of the Class A shares by Oando PLC provides it with 60% voting rights but no rights to receive dividends or distributions from the applicable Operating Associate, except on
liquidation or winding up. Ownership of the Class B shares entitles the Holdco Associates (each an indirectly wholly-owned subsidiary of OER) to 40% voting rights and 100% dividends and
distributions, except on liquidation or winding up. Pursuant to each of these agreements, Oando PLC, on the one hand, and the respective Holdco Associates, on the other hand, agreed to
exercise their respective ownership rights in accordance with the manner set forth in the shareholder agreements. Pursuant to the shareholder agreements, each of Oando PLC and the
respective Holdco Associate is entitled to appoint two directors to the board of Oando Akepo, OPDC2, Oando OML 125&134, OQIL, ORPSL, POCNL, PDENL, and CEPNL respectively, with
the Holdco Associate being entitled to appoint the Chairman, who has a casting vote. In addition, the applicable Holdco Associate has the power to compel Oando PLC to sell its Class A
shares for nominal consideration. No amounts have been paid or are due to be paid by either party to the other under the shareholder agreements.
Right of First Offer Agreement (“ROFO Agreement”) dated September 27, 2011, as amended, between Oando PLC and the Corporation. Pursuant to the ROFO Agreement, the Corporation
has the right to make an offer to Oando PLC in respect of certain assets owned by Oando PLC in accordance with the terms of the ROFO Agreement. No amounts have been paid or are due
to be paid under the ROFO Agreement. On September 27, 2013, the ROFO agreement between OER and Oando PLC was amended. The amendment terminates the ROFO agreement on the
first date on which Oando PLC no longer holds, directly or indirectly, at least 20% of the issued and outstanding common shares of OER. Prior to the amendment, the right of first offer in the
ROFO agreement would have terminated on September 27, 2013. During the year, OER didn’t incur any amounts under this agreement.
Referral and Non-Competition Agreement dated July 24, 2012 between Oando PLC and OER. Pursuant to this agreement, Oando PLC is prohibited from competing with OER except in
respect of the assets referred to in the ROFO Agreement until the later of July 25, 2014 and such time as Oando PLC owns less than 20% of the shares of OER. Oando PLC is also required to
refer all upstream oil and gas opportunities to OER pursuant to this agreement. In addition, in the event that Oando PLC acquired any upstream assets between September 27, 2011 and July
24, 2012, Oando PLC is required to offer to sell these assets to OER at a purchase price consisting of the amount paid by Oando PLC for the assets, together with all expenses incurred by
Oando PLC to the date of the acquisition by OER, plus an administrative fee of 1.75%. OER has no amounts due to Oando PLC under this agreement during the year under review (2013: N1.2
billion/ $7.6 million).
Ocean and Oil Development Partners Nigeria (OODP) has the shareholding of 55.09% at the reporting date (2013: 43.36%). The remaining 44.91% shares are widely held. OODP is ultimately
owned 40% by Delanson Services PTC Ltd (trustee for the family of Mr. Gabriele Volpi) and 60% by Liberation Management Ltd (trustee for the Group Chief Executive of Oando Plc (the
“GCE”)). Two directors of OODP have significant influence over Oando Plc.
On December 20, 2012, Oando Energy Resources (OER) borrowed N53.6 billion ($345 million) from Oando PLC to finance a portion of the deposit required in connection with the COP
Acquisition. The 2012 Oando PLC Loan was subsequently rolled into the 2013 Oando PLC Loan pursuant to the 2013 Oando PLC Loan Documentation. The purpose of the 2013 Oando PLC
Loan was to provide for an aggregate increase in the maximum amount that may be borrowed by OER to N62.2 billion ($401 million).
On December 24, 2013, OER entered into a loan agreement to borrow $200 million from Oando PLC in order to fund payments in relation to the COP Acquisition. Interest on the facility was
charged at 5% per annum and the amount was to be available for draw down from December 24, 2013 to February 27, 2014. The loan was drawn down on February 12, 2014 and was
required to be repaid on February 28, 2014.
On February 10, 2014, the N36.9 billion ($200 million) loan and the 2013 Oando PLC Loan were rolled into the 2014 Oando PLC Loan under which OER could borrow up to an aggregate
amount of N221.7 billion ($1.2 billion) on or before December 31, 2014. The 2014 Oando PLC Loan comprised N74 billion ($401 million) borrowed under the 2013 Oando PLC Loan and the
N36.9 billion ($200 million) loan which was drawn down on February 12, 2014 as well as an additional N110.6 billion ($599 million). The N53.9 billion ($292 million) available capacity on the
loan expired on December 31, 2014 and can no longer be utilized by OER.
The annual interest rate was set at 4% calculated quarterly and the facility included a N8.86 billion ($48 million) financing fee. Principal and financing fee payments were due to be repaid on
December 31, 2015. The terms of the facility included a conversion feature allowing OER to elect to repay interest, the financing fee, and principal by the issuance of common shares of OER,
subject to certain restrictions. The table below summarizes the movement in the loan in 2014.
In 2014, the facility was drawn by N93.68 billion ($507 million) of which N7.58 billion ($41 million) was repaid. Net drawings were used to fund the COP Acquisition and for other Corporate
requirements. Also during this period, N160.2 billion ($867 million) of principal, N2.75 billion ($14.9 million) of accrued interest, and the N8.87 billion ($48 million) financing fee was exchanged
for 650,785,739 common shares of OER and 325,392,869 warrants as per the table below. Of the N171.8 billion ($929.9 million) conversion amount, N126.4 ($126.4 million) was allocated to
the warrants and recorded as a derivative financial liability and the residual amount of N148.5 billion ($803.5 million) was recorded as share capital by OER. The N8.87 billion ($48 million)
financing fee was accounted for as a transaction cost, expensed in the period by OER and eliminated on consolidation.
Amount (Thousands of USD) Units
Page 60 of 73
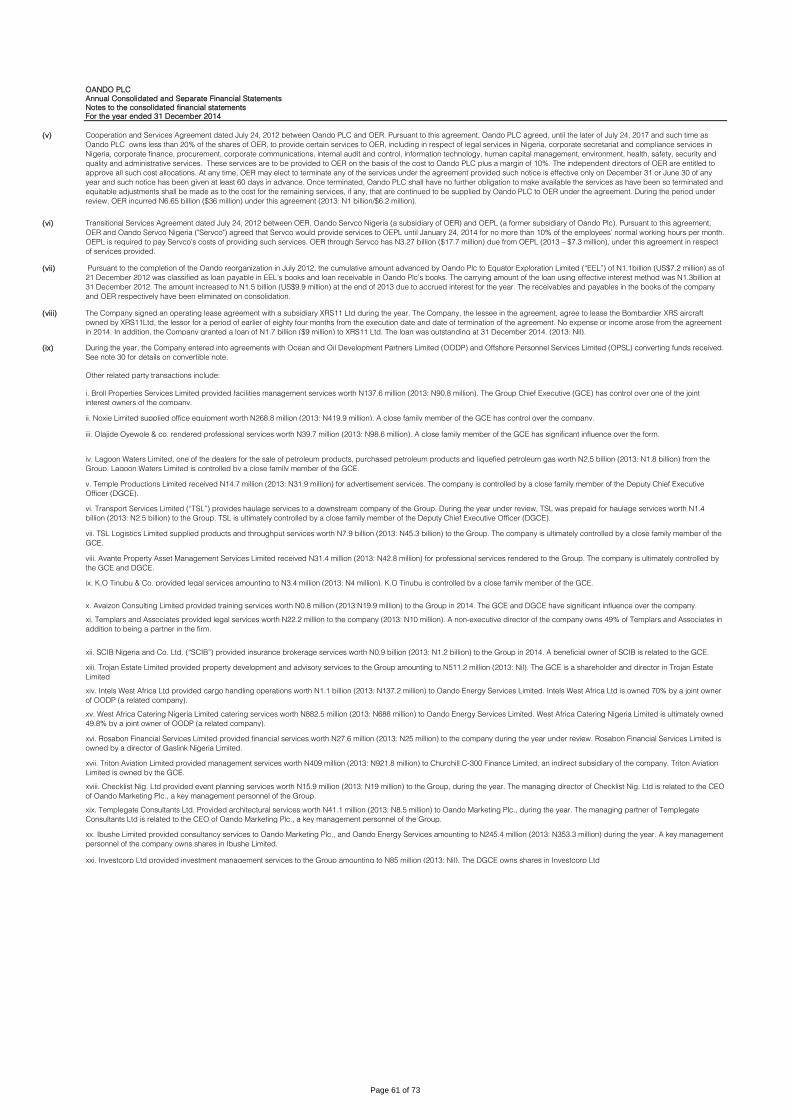
OANDO PLC
Annual Consolidated and Separate Financial Statements
Notes to the consolidated financial statements
For the year ended 31 December 2014
(v)
(vi)
(vii)
(viii)
(ix)
vi. Transport Services Limited (“TSL”) provides haulage services to a downstream company of the Group. During the year under review, TSL was prepaid for haulage services worth N1.4
billion (2013: N2.5 billion) to the Group. TSL is ultimately controlled by a close family member of the Deputy Chief Executive Officer (DGCE).
vii. TSL Logistics Limited supplied products and throughput services worth N7.9 billion (2013: N45.3 billion) to the Group. The company is ultimately controlled by a close family member of the
GCE.
viii. Avante Property Asset Management Services Limited received N31.4 million (2013: N42.8 million) for professional services rendered to the Group. The company is ultimately controlled by
the GCE and DGCE.
ix. K.O Tinubu & Co. provided legal services amounting to N3.4 million (2013: N4 million). K.O Tinubu is controlled by a close family member of the GCE.
x. Avaizon Consulting Limited provided training services worth N0.8 million (2013:N19.9 million) to the Group in 2014. The GCE and DGCE have significant influence over the company.
xi. Templars and Associates provided legal services worth N22.2 million to the company (2013: N10 million). A non-executive director of the company owns 49% of Templars and Associates in
addition to being a partner in the firm.
Other related party transactions include:
i. Broll Properties Services Limited provided facilities management services worth N137.6 million (2013: N90.8 million). The Group Chief Executive (GCE) has control over one of the joint
interest owners of the company.
ii. Noxie Limited supplied office equipment worth N268.8 million (2013: N419.9 million). A close family member of the GCE has control over the company.
iii. Olajide Oyewole & co. rendered professional services worth N39.7 million (2013: N98.6 million). A close family member of the GCE has significant influence over the form.
iv. Lagoon Waters Limited, one of the dealers for the sale of petroleum products, purchased petroleum products and liquefied petroleum gas worth N2.5 billion (2013: N1.8 billion) from the
Group. Lagoon Waters Limited is controlled by a close family member of the GCE.
v. Temple Productions Limited received N14.7 million (2013: N31.9 million) for advertisement services. The company is controlled by a close family member of the Deputy Chief Executive
Officer (DGCE).
Cooperation and Services Agreement dated July 24, 2012 between Oando PLC and OER. Pursuant to this agreement, Oando PLC agreed, until the later of July 24, 2017 and such time as
Oando PLC owns less than 20% of the shares of OER, to provide certain services to OER, including in respect of legal services in Nigeria, corporate secretariat and compliance services in
Nigeria, corporate finance, procurement, corporate communications, internal audit and control, information technology, human capital management, environment, health, safety, security and
quality and administrative services. These services are to be provided to OER on the basis of the cost to Oando PLC plus a margin of 10%. The independent directors of OER are entitled to
approve all such cost allocations. At any time, OER may elect to terminate any of the services under the agreement provided such notice is effective only on December 31 or June 30 of any
year and such notice has been given at least 60 days in advance. Once terminated, Oando PLC shall have no further obligation to make available the services as have been so terminated and
equitable adjustments shall be made as to the cost for the remaining services, if any, that are continued to be supplied by Oando PLC to OER under the agreement. During the period under
review, OER incurred N6.65 billion ($36 million) under this agreement (2013: N1 billion/$6.2 million).
Transitional Services Agreement dated July 24, 2012 between OER, Oando Servco Nigeria (a subsidiary of OER) and OEPL (a former subsidiary of Oando Plc). Pursuant to this agreement,
OER and Oando Servco Nigeria ("Servco") agreed that Servco would provide services to OEPL until January 24, 2014 for no more than 10% of the employees’ normal working hours per month.
OEPL is required to pay Servco’s costs of providing such services. OER through Servco has N3.27 billion ($17.7 million) due from OEPL (2013 – $7.3 million), under this agreement in respect
of services provided.
Pursuant to the completion of the Oando reorganization in July 2012, the cumulative amount advanced by Oando Plc to Equator Exploration Limited (“EEL”) of N1.1billion (US$7.2 million) as of
21 December 2012 was classified as loan payable in EEL’s books and loan receivable in Oando Plc’s books. The carrying amount of the loan using effective interest method was N1.3billion at
31 December 2012. The amount increased to N1.5 billion (US$9.9 million) at the end of 2013 due to accrued interest for the year. The receivables and payables in the books of the company
and OER respectively have been eliminated on consolidation.
The Company signed an operating lease agreement with a subsidiary XRS11 Ltd during the year. The Company, the lessee in the agreement, agree to lease the Bombardier XRS aircraft
owned by XRS11Ltd, the lessor for a period of earlier of eighty four months from the execution date and date of termination of the agreement. No expense or income arose from the agreement
in 2014. In addition, the Company granted a loan of N1.7 billion ($9 million) to XRS11 Ltd. The loan was outstanding at 31 December 2014. (2013: Nil).
During the year, the Company entered into agreements with Ocean and Oil Development Partners Limited (OODP) and Offshore Personnel Services Limited (OPSL) converting funds received.
See note 30 for details on convertible note.
xviii. Checklist Nig. Ltd provided event planning services worth N15.9 million (2013: N19 million) to the Group, during the year. The managing director of Checklist Nig. Ltd is related to the CEO
of Oando Marketing Plc., a key management personnel of the Group.
xix. Templegate Consultants Ltd. Provided architectural services worth N41.1 million (2013: N8.5 million) to Oando Marketing Plc., during the year. The managing partner of Templegate
Consultants Ltd is related to the CEO of Oando Marketing Plc., a key management personnel of the Group.
xx. Ibushe Limited provided consultancy services to Oando Marketing Plc., and Oando Energy Services amounting to N245.4 million (2013: N353.3 million) during the year. A key management
personnel of the company owns shares in Ibushe Limited.
xxi. Investcorp Ltd provided investment management services to the Group amounting to N85 million (2013: Nil). The DGCE owns shares in Investcorp Ltd
xii. SCIB Nigeria and Co. Ltd. (“SCIB”) provided insurance brokerage services worth N0.9 billion (2013: N1.2 billion) to the Group in 2014. A beneficial owner of SCIB is related to the GCE.
xiii. Trojan Estate Limited provided property development and advisory services to the Group amounting to N511.2 million (2013: Nil). The GCE is a shareholder and director in Trojan Estate
Limited
xiv. Intels West Africa Ltd provided cargo handling operations worth N1.1 billion (2013: N137.2 million) to Oando Energy Services Limited. Intels West Africa Ltd is owned 70% by a joint owner
of OODP (a related company).
xv. West Africa Catering Nigeria Limited catering services worth N882.5 million (2013: N688 million) to Oando Energy Services Limited. West Africa Catering Nigeria Limited is ultimately owned
49.8% by a joint owner of OODP (a related company).
xvi. Rosabon Financial Services Limited provided financial services worth N27.6 million (2013: N25 million) to the company during the year under review. Rosabon Financial Services Limited is
owned by a director of Gaslink Nigeria Limited.
xvii. Triton Aviation Limited provided management services worth N409 million (2013: N921.8 million) to Churchill C-300 Finance Limited, an indirect subsidiary of the company. Triton Aviation
Limited is owned by the GCE.
Page 61 of 73

OANDO PLC
Annual Consolidated and Separate Financial Statements
Notes to the consolidated financial statements
For the year ended 31 December 2014
Key management personnel
2014 2013
N'000 N'000
Salaries and other short-term employee benefits 2,232,247 1,345,203
Share options and management stock options 184,236 75,700
Post employment benefits 51,233 40,525
2,467,716 1,461,428
Year-end balances arising from transactions with related parties
The following receivables or payables at December 31, 2014 arose from transactions with related parties:
Company Company
2014 2013
N'000 N'000
Receivables from related parties:Apapa SPM Limited 6,528,912 5,561,639
Churchill C-300 Finance Ltd - 85
East Horizon Gas Company Ltd - 3,179
Gaslink Nigeria Limited - 1,505,284
Oando Akute Power Limited - 4,550
Oando Energy Resources Ltd. 144,369,355 -
Oando Energy Services Limited 8,214,684 2,735,933
Oando Foundation - 152,212
Oando Gas and Power Limited 1,730 1,730
Oando Lekki Refinery Limited 375,741 375,741
Oando Properties Limited 59,063 59,063
Oando Terminal & Logistics Ltd 222,120 222,120
XRS II 1,713,623 -
Oando Port Harcourt Refinery 430 430
Payables to related parties:Ajah Distribution Company 2,500 2,500
Alausa Power Ltd 2,500 2,500
Central Horizon Gas Company Ltd 5,100 5,100
Gasgrid Nigeria Limited 2,500 2,500
Gaslink Nigeria Limited 11,842,712 -
Lekki Gardens Power Ltd 2,500 2,500
Oando Energy Resources Inc. 28,018 15,000
Churchill C-300 Finance Ltd 250,764 -
Oando Liberia 9,240 7,760
Oando Marketing Plc 71,009,141 75,093,045
Oando Supply and Trading Limited 1,580,300 3,148,306
Oando Trading Bermuda 7,060,360 7,274,399
Oando Energy Services Limited 11,004 -
XRS I 18 -
39 Commitments
40 Events after the reporting period
(i) Right issue
(ii) 2015 Early Settlement and Reset Arrangement
The company on 3 December 2014 made offer by way of right issues to existing shareholders of one (1) new ordinary share for every three (3) ordinary shares of 50kobo each as at the close
business on Friday 25 July, 2014. The Company plans to use the proceeds to deleverage its balance sheet via repayment of existing financial debt obligations, and replenish working capital
lines.
On 5 June 2015, the Nigerian Stock Exchange confirmed the listing of 2,949,933,156 ordinary shares of the Company allotted under the Rights issue on 4 June 2015.
On 6 February 2015, OER entered into an early settlement and reset arrangement with hedging counterparties associated with the Acquisition and Legacy Asset hedges which resulted in the
receipt of N43.2 billion ($234 million) that was used to reduce outstanding debt. Specifically, N34 billion ($184 million) from the settlement plus an additional N739 million ($4 million) from cash
was paid to reduce outstanding principal on the N83.1 billion ($450 million) loan by N34.7 billion ($188 million) and N9.4 billion ($51 million) was paid to reduce outstanding principal on the
N64.68 billion ($350 million) loan.
The arrangement led to a resetting of the Acquisition and Legacy Asset hedges with a fixed price of $65/bbl and strike of $75/bbl, with no changes to the expiry or volumes in the original
contract. The effect of the Acquisition and Legacy Asset hedges is to fix the price of crude oil that OER receives, on the specific volumes at $65/bbl until the benchmark price of Dated Brent
crude oil reaches $75/bbl. If Dated Brent crude oil price exceeds $75/bbl, OER will receive the incremental price above $75/bbl to preserve some upside. As noted above, the original hedges
were required by the terms of the N83.1 billion ($450 million) and N64.68 billion ($350 million) loan facilities. The lenders were required to approve the early settlement and reset arrangement.
Key management includes directors (executive and non-executive) and members of the Group Leadership Council. The compensation paid or payable to key management for employee
services is shown below:
The Group had outstanding capital expenditure contracted but not provided for under property, plant and equipment amounting to N1.81 billion (2013: N5.54 billion) at December 31, 2014.
Page 62 of 73

OANDO PLC
Annual Consolidated and Separate Financial Statements
Notes to the consolidated financial statement
For the year ended 31 December 2014
(iii) Sale of Marketing and Supply & Trading division
41
(i)
(ii)
(iii)
(iv)
(v)
(a)
(b)
Oando Plc (“Oando”) executed definitive agreement (the "Agreement") with HV Investments II B.V., (“HVI”), a joint venture owned by a fund advised by Helios Investment Partners (“Helios”)
and The Vitol Group (“Vitol”), to acquire 49% of the voting rights and 60% of the economic rights in Oando’s downstream businesses (“Oando Downstream”), for a total consideration of
N90.8billion (US$461.3 million), conditional upon the receipt of regulatory approvals and subject to customary purchase price adjustments, including working capital. 51% of the voting rights
will be held by Oando and a Nigerian Helios Affiliate in the ratio of 49%:2%, respectively. The total consideration of US$461.3 million will be funded by a US$276.8 million cash contribution from
HVI and US$184.5 million in preference shares issued to Oando Plc, subject to customary purchase price adjustments, including working capital and long-term debt. The Share Purchase
Agreement for the transaction was signed on 18 June 2015 and the sale is expected to be concluded latest early 2016.
The Oando downstream businesses primarily consist of:
Bilabri Oil Field (OML 122)
In 2007, the Company transferred, under the Bilabri Settlement Agreement, the full responsibility for completing the development of the Bilabri oil field in OML 122 to Peak Petroleum Industries
(Nigeria) Limited (“Peak”). Peak specifically assumed responsibility for the project’s future funding and historical unpaid liabilities. In the event that Peak fails to meet its obligations to the
projects creditors, it remains possible that the Company may be called upon to meet the debts. Therefore, a contingent liability of NGN 4.0 billion exists at December 31, 2014 (2013: N3.4
billion). The Company has assessed the likelihood that cash outflows will be required to settle the obligation as remote, and therefore, no liability has been recorded in the financial statements
at December 31, 2014 (2013: Nil).
OPL 321 and OPL 323
In January 2009, the Nigerian government voided the allocation of OPL 323 and OPL 321 to the operator, Korea National Oil Corporation (KNOC) and reallocated the blocks to the winning
group of the 2005 licensing round comprising ONGC Videsh, Equator (an indirect subsidiary of Oando Plc) and Owel. KNOC instituted a lawsuit against the government and a judgement was
awarded in her favor. The government and Owel appealed the judgement. The case has now gone to the Supreme Court. In 2009, the government refunded the signature bonus paid by
Equator. The CompanyEquator has not recognized a liability to the government for the blocks subsequent to the refund of the signature bonus. This is due to the uncertainty surrounding the
timing of the settlement of the ongoing dispute as well as to the amount to be paid upon settlement. Also, there is no obligation to pay the signature bonus as Equator can opt in or out once the
legal dispute is settled. Equator has declared its intention to continue to invest in the blocks. Equator has impaired the carrying value and currently carries both assets at Nil value (2013:
N351.1 million).
Equator originally bid as member of a consortium for OPL 321 and 323. It was granted a 30% interest in the Production Sharing Contracts “PSCs” but two of its bidding partners were not
included as direct participants in the PSCs, as a result, Equator granted those bidding partners 3% and 1% carried economic interests respectively in recognition of their contribution to the
consortium. During 2007, it was agreed with the bidding partners that they would surrender their carried interests in return for warrants in Equator and payments of N739.16 million and
N184.79 million. The warrants were issued immediately but it was agreed that the cash payments would be deferred. The warrants have expired. In the first instance, payment would be made
within 5 days after the closing of a farm out of a 20% interest in OPL 323 to a subsidiary of BG Corporation PLC (BG). However, BG terminated the farm out agreement. Under the successor
obligation, Equator issued loan notes with an aggregate value of NGN 923.95 million which are redeemable out of the first NGN 923.95 million of proceeds received on the occurrence of any
one of the following events related to OPL 321 or OPL 323:
- A farm out with another party;
- A sale or partial sale of the interests; and
- A sale or partial sale of subsidiaries holding the relevant PSCs.
During 2010, one bidding partner successfully sued Equator in an arbitration tribunal for N184.79 million. This has been paid in full. On the advice of legal Counsel, Equator maintains that the
remaining N739.16 million owed is not yet due and that any second arbitration hearing can be successfully defended. If none of the above events occurred, it is assumed that Equator will not
need to settle the NGN 739.16 million loan note and can defer payment indefinitely. The above contingencies are based on the best judgements of the Board and management.
Equator has been involved in settlement negotiations in respect of the dispute between KNOC, Owel and the Nigerian Government. The negotiating parties have agreed in principle to
restructure the working interests in order to accommodate additional members into the new consortium being formed pursuant to the negotiations.
Guarantees to third parties
Guarantees, performance bonds, and advance payment guarantees issued in favour of memebers of he Group by commercial banks and third parties amounted to NGN 51.31 billion (2013:
N84.2 billion). Oando Plc also guaranteed various loans in respect of the following subsidiaries: Ebony Oil and Gas Limited (N12.94 billion); Oando Terminals and Logistics (N22.17 billion);
Oando Marketing Plc (N6.0 billion).
Pending litigation
There are a number of legal suits outstanding against the Company for stated amounts of NGN213.4 billion (2013: N4.25 billion). Of the total legal suits outstanding, NGN180.26 billion was filed
against OER’s portion of NAOC JV (OML 60-63). On the advice of Counsel, the Board of Directors are of the opinion that no material losses are expected to arise. Therefore, no provision has
been made in the financial statements.
Pending tax audit
Oando Energy Services (OES) is awaiting the outcome of a recently concluded tax audit and probable liability not yet recognised is estimated at N900 million. Based on the advice of legal
counsel, the directors are of the opinion that outcome of pending litigations would likely be in favour of the Company.
a) Oando Marketing Plc (“OMP”), a petroleum product retailing and distribution company with over 400 retail outlets and strategically located terminals in Nigeria, Ghana and Togo. OMP
distributes premium motor spirit, automotive gas oil, dual-purpose kerosene, aviation turbine kerosene, low pour fuel oil, lubricating oils, greases, bitumen and liquefied petroleum gas. Key
OMP subsidiaries that are part of the Acquisition include, Oando Ghana Limited, Oando Togo SA, and Clean Cooking Fuel Investments Ltd.
b) Oando Supply & Trading Limited (“OS&T”), a trader of petroleum products in the sub-Saharan region, supplying and trading crude oil and refined petroleum products. OS&T trades large
volume cargoes to major oil marketers and independent marketers in Nigeria.
c) Oando Trading Limited (Bermuda) (“OTB”), an entity involved in the trading of crude oil and refined petroleum products in international markets.
d) Apapa SPM Limited, the marina jetty and subsea pipeline system capable of berthing large vessels that will increase the delivery capacity and offloading efficiency of petroleum products
into major petroleum marketers’ storage facilities at Apapa, Lagos.
e) Ebony Oil & Gas Limited, the Ghanaian supply and trading entity with a provisional bulk distribution company license supplying white products.
Contingent liabilities
Page 63 of 73
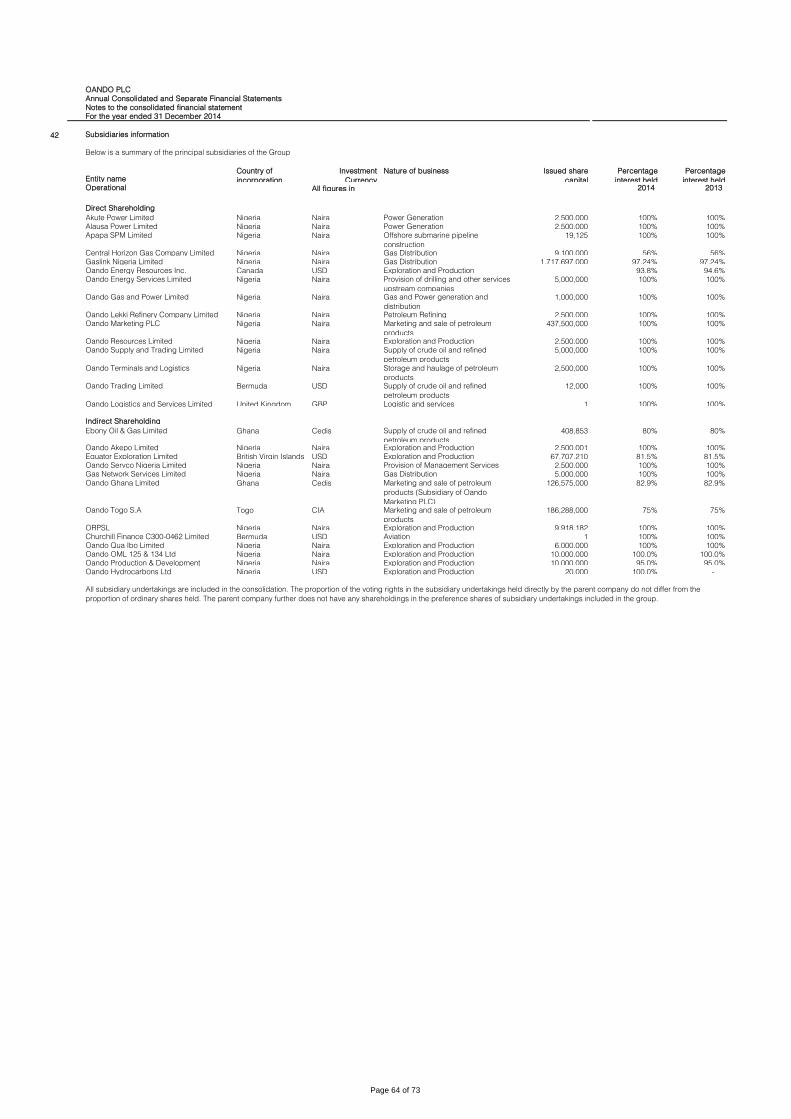
OANDO PLC
Annual Consolidated and Separate Financial Statements
Notes to the consolidated financial statement
For the year ended 31 December 2014
42 Subsidiaries information
Below is a summary of the principal subsidiaries of the Group
Entity nameCountry of
incorporation
Investment
Currency
Issued share
capital
Percentage
interest held
Percentage
interest heldOperational All figures in 2014 2013
Direct Shareholding
Nigeria Naira 2,500,000 100% 100%
Nigeria Naira 2,500,000 100% 100%
Nigeria Naira 19,125 100% 100%
Nigeria Naira 9,100,000 56% 56%
Nigeria Naira 1,717,697,000 97.24% 97.24%
Canada USD 93.8% 94.6%
Nigeria Naira 5,000,000 100% 100%
Nigeria Naira 1,000,000 100% 100%
Nigeria Naira 2,500,000 100% 100%
Nigeria Naira 437,500,000 100% 100%
Nigeria Naira 2,500,000 100% 100%
Nigeria Naira 5,000,000 100% 100%
Nigeria Naira 2,500,000 100% 100%
Bermuda USD 12,000 100% 100%
United Kingdom GBP 1 100% 100%
Indirect Shareholding
Ghana Cedis 408,853 80% 80%
Nigeria Naira 2,500,001 100% 100%
British Virgin Islands USD 67,707,210 81.5% 81.5%
Nigeria Naira 2,500,000 100% 100%
Nigeria Naira 5,000,000 100% 100%
Ghana Cedis 126,575,000 82.9% 82.9%
Togo CIA 186,288,000 75% 75%
Nigeria Naira 9,918,182 100% 100%
Bermuda USD 1 100% 100%
Nigeria Naira 6,000,000 100% 100%
Nigeria Naira 10,000,000 100.0% 100.0%
Nigeria Naira 10,000,000 95.0% 95.0%
Nigeria USD 20,000 100.0% -
Oando Energy Resources Inc. Exploration and Production
Oando Energy Services Limited Provision of drilling and other services
upstream companiesOando Gas and Power Limited Gas and Power generation and
distribution
Central Horizon Gas Company Limited Gas Distribution
Gaslink Nigeria Limited Gas Distribution
Nature of business
Akute Power Limited Power Generation
Alausa Power Limited Power Generation
Apapa SPM Limited Offshore submarine pipeline
construction
Oando Logistics and Services Limited Logistic and services
Ebony Oil & Gas Limited Supply of crude oil and refined
petroleum productsOando Akepo Limited Exploration and Production
Oando Supply and Trading Limited Supply of crude oil and refined
petroleum products
Oando Terminals and Logistics Storage and haulage of petroleum
productsOando Trading Limited Supply of crude oil and refined
petroleum products
Oando Lekki Refinery Company Limited Petroleum Refining
Oando Marketing PLC Marketing and sale of petroleum
productsOando Resources Limited Exploration and Production
Churchill Finance C300-0462 Limited Aviation
Oando Qua Ibo Limited Exploration and Production
Oando OML 125 & 134 Ltd Exploration and Production
Oando Ghana Limited Marketing and sale of petroleum
products (Subsidiary of Oando
Marketing PLC)Oando Togo S.A Marketing and sale of petroleum
productsORPSL Exploration and Production
Equator Exploration Limited Exploration and Production
Oando Servco Nigeria Limited Provision of Management Services
Gas Network Services Limited Gas Distribution
Oando Production & Development Exploration and Production
Oando Hydrocarbons Ltd Exploration and Production
All subsidiary undertakings are included in the consolidation. The proportion of the voting rights in the subsidiary undertakings held directly by the parent company do not differ from the
proportion of ordinary shares held. The parent company further does not have any shareholdings in the preference shares of subsidiary undertakings included in the group.
Page 64 of 73
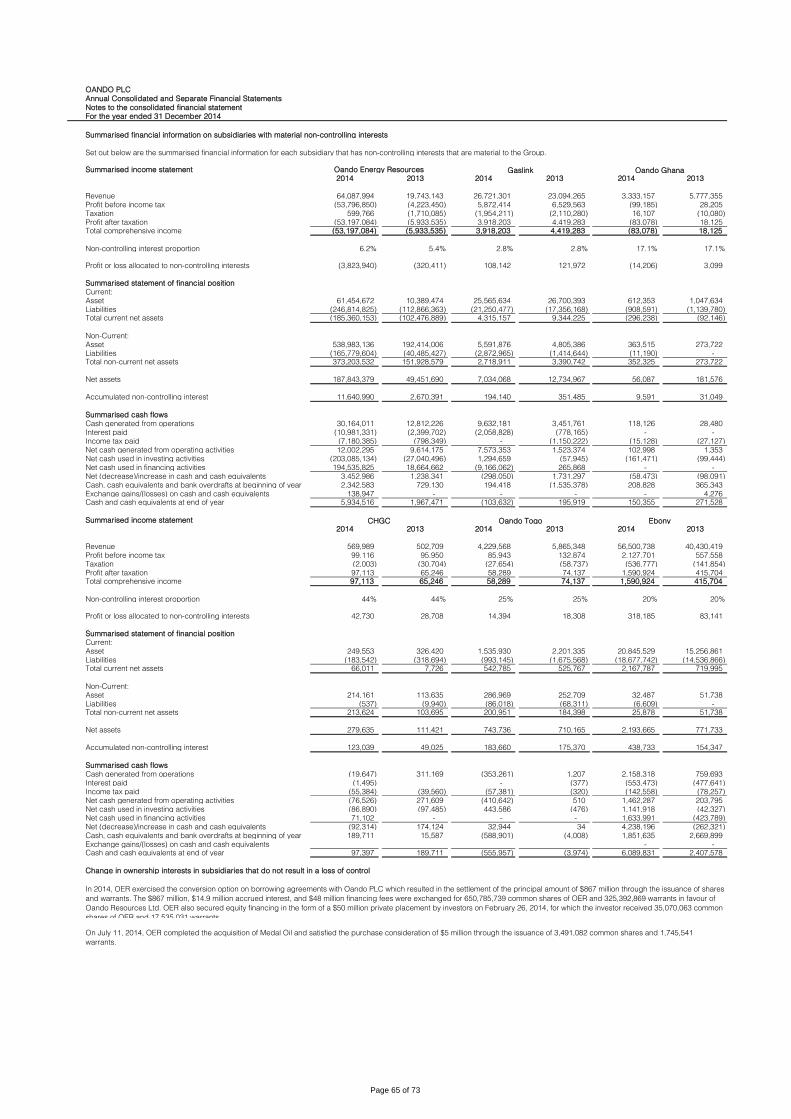
OANDO PLC
Annual Consolidated and Separate Financial Statements
Notes to the consolidated financial statement
For the year ended 31 December 2014
Summarised income statement
2014 2013 2014 2013 2014 2013
Revenue 64,087,994 19,743,143 26,721,301 23,094,265 3,333,157 5,777,355
Profit before income tax (53,796,850) (4,223,450) 5,872,414 6,529,563 (99,185) 28,205
Taxation 599,766 (1,710,085) (1,954,211) (2,110,280) 16,107 (10,080)
Profit after taxation (53,197,084) (5,933,535) 3,918,203 4,419,283 (83,078) 18,125 Total comprehensive income (53,197,084) (5,933,535) 3,918,203 4,419,283 (83,078) 18,125
Non-controlling interest proportion 6.2% 5.4% 2.8% 2.8% 17.1% 17.1%
(3,823,940) (320,411) 108,142 121,972 (14,206) 3,099
Summarised statement of financial position
Current:
Asset 61,454,672 10,389,474 25,565,634 26,700,393 612,353 1,047,634
Liabilities (246,814,825) (112,866,363) (21,250,477) (17,356,168) (908,591) (1,139,780) Total current net assets (185,360,153) (102,476,889) 4,315,157 9,344,225 (296,238) (92,146)
Non-Current:
Asset 538,983,136 192,414,006 5,591,876 4,805,386 363,515 273,722
Liabilities (165,779,604) (40,485,427) (2,872,965) (1,414,644) (11,190) - Total non-current net assets 373,203,532 151,928,579 2,718,911 3,390,742 352,325 273,722
Net assets 187,843,379 49,451,690 7,034,068 12,734,967 56,087 181,576
Accumulated non-controlling interest 11,640,990 2,670,391 194,140 351,485 9,591 31,049
Summarised cash flows
Cash generated from operations 30,164,011 12,812,226 9,632,181 3,451,761 118,126 28,480
Interest paid (10,981,331) (2,399,702) (2,058,828) (778,165) - -
Income tax paid (7,180,385) (798,349) - (1,150,222) (15,128) (27,127)
Net cash generated from operating activities 12,002,295 9,614,175 7,573,353 1,523,374 102,998 1,353
Net cash used in investing activities (203,085,134) (27,040,496) 1,294,659 (57,945) (161,471) (99,444)
Net cash used in financing activities 194,535,825 18,664,662 (9,166,062) 265,868 - -
Net (decrease)/increase in cash and cash equivalents 3,452,986 1,238,341 (298,050) 1,731,297 (58,473) (98,091)
Cash, cash equivalents and bank overdrafts at beginning of year 2,342,583 729,130 194,418 (1,535,378) 208,828 365,343
Exchange gains/(losses) on cash and cash equivalents 138,947 - - - - 4,276 Cash and cash equivalents at end of year 5,934,516 1,967,471 (103,632) 195,919 150,355 271,528
Summarised income statement
2014 2013 2014 2013 2014 2013
Revenue 569,989 502,709 4,229,568 5,865,348 56,500,738 40,430,419
Profit before income tax 99,116 95,950 85,943 132,874 2,127,701 557,558
Taxation (2,003) (30,704) (27,654) (58,737) (536,777) (141,854)
Profit after taxation 97,113 65,246 58,289 74,137 1,590,924 415,704 Total comprehensive income 97,113 65,246 58,289 74,137 1,590,924 415,704
Non-controlling interest proportion 44% 44% 25% 25% 20% 20%
42,730 28,708 14,394 18,308 318,185 83,141
Summarised statement of financial position
Current:
Asset 249,553 326,420 1,535,930 2,201,335 20,845,529 15,256,861
Liabilities (183,542) (318,694) (993,145) (1,675,568) (18,677,742) (14,536,866) Total current net assets 66,011 7,726 542,785 525,767 2,167,787 719,995
Non-Current:
Asset 214,161 113,635 286,969 252,709 32,487 51,738
Liabilities (537) (9,940) (86,018) (68,311) (6,609) - Total non-current net assets 213,624 103,695 200,951 184,398 25,878 51,738
Net assets 279,635 111,421 743,736 710,165 2,193,665 771,733
Accumulated non-controlling interest 123,039 49,025 183,660 175,370 438,733 154,347
Summarised cash flows
Cash generated from operations (19,647) 311,169 (353,261) 1,207 2,158,318 759,693
Interest paid (1,495) - (377) (553,473) (477,641)
Income tax paid (55,384) (39,560) (57,381) (320) (142,558) (78,257)
Net cash generated from operating activities (76,526) 271,609 (410,642) 510 1,462,287 203,795
Net cash used in investing activities (86,890) (97,485) 443,586 (476) 1,141,918 (42,327)
Net cash used in financing activities 71,102 - - - 1,633,991 (423,789)
Net (decrease)/increase in cash and cash equivalents (92,314) 174,124 32,944 34 4,238,196 (262,321)
Cash, cash equivalents and bank overdrafts at beginning of year 189,711 15,587 (588,901) (4,008) 1,851,635 2,669,899
Exchange gains/(losses) on cash and cash equivalents - - Cash and cash equivalents at end of year 97,397 189,711 (555,957) (3,974) 6,089,831 2,407,578
Change in ownership interests in subsidiaries that do not result in a loss of control
Profit or loss allocated to non-controlling interests
In 2014, OER exercised the conversion option on borrowing agreements with Oando PLC which resulted in the settlement of the principal amount of $867 million through the issuance of shares
and warrants. The $867 million, $14.9 million accrued interest, and $48 million financing fees were exchanged for 650,785,739 common shares of OER and 325,392,869 warrants in favour of
Oando Resources Ltd. OER also secured equity financing in the form of a $50 million private placement by investors on February 26, 2014, for which the investor received 35,070,063 common
shares of OER and 17,535,031 warrants.
On July 11, 2014, OER completed the acquisition of Medal Oil and satisfied the purchase consideration of $5 million through the issuance of 3,491,082 common shares and 1,745,541
warrants.
Set out below are the summarised financial information for each subsidiary that has non-controlling interests that are material to the Group.
Oando Energy Resources Gaslink Oando Ghana
Profit or loss allocated to non-controlling interests
CHGC Oando Togo Ebony
Summarised financial information on subsidiaries with material non-controlling interests
Page 65 of 73

OANDO PLC
Annual Consolidated and Separate Financial Statements
Notes to the consolidated financial statement
For the year ended 31 December 2014
Impact of change in ownership interests in subsidiaries that do not result in a loss of control is as analysed below: Group Group
2014 2013
N'000 N'000
Consideration received from non-controlling interest - - Increase in non-controlling interest 2,861,146 - Group's loss on deemed disposal 2,861,146 -
43 Financial instruments by category
GROUP
Financial
instruments at
fair value through
profit and loss
Loans and
receivables
Available-for-sale Total
2014 N'000 N'000 N'000 N'000Assets per statement of financial position:
Available-for-sale financial assets - - 197,837 197,837 Non-current receivable (excluding operating lease) - - - - Trade and other receivables (excluding prepayments) - 124,406,184 - 124,406,184 Commodity option contracts 55,427,507 - - 55,427,507 Interest rate swap - - - - Foreign currency forwards - - - - Embedded derivative in Akute 2,123,947 - - 2,123,947 Cash and cash equivalents - 41,634,123 - 41,634,123
57,551,454 166,040,307 197,837 223,789,598
Financial
instruments at fair
value through
profit and loss
Other financial
liabilities at
amortised cost
Total
2014 N'000 N'000 N'000Liabilities per statement of financial position:
Borrowings (excluding finance lease liabilities) - 473,342,200 473,342,200
Finance lease liabilities - - -
Trade and other payables (excluding derivative financial instruments, accrued expenses and deferred income - 155,090,839 155,090,839
Interest-rate swap - - -
Commodity derivatives - - -
Convertible options 3,608,768 - 3,608,768
Cross currency - - -
Share warrants - - - 3,608,768 628,433,039 632,041,807
Financial
instruments at
fair value through
profit and loss
Loans and
receivables
Available-for-sale Total
2013 N'000 N'000 N'000 N'000Assets per statement of financial position:
Available-for-sale financial assets - - 183,930 183,930
Non-current receivable (excluding operating lease) - 11,283,000 - 11,283,000
Trade and other receivables (excluding prepayments) - 131,010,196 - 131,010,196
Interest rate swap 4,933 - - 4,933
Foreign currency forwards 384,967 - - 384,967
Embedded derivative in Akute 1,220,796 - - 1,220,796
Cash and cash equivalents - 27,685,755 - 27,685,755 1,610,696 169,978,951 183,930 171,773,577
Financial
instruments at fair
value through
profit and loss
Other financial
liabilities at
amortised cost
Total
2013 N'000 N'000 N'000Liabilities per statement of financial position:
Borrowings (excluding finance lease liabilities) 520,656 254,764,397 255,285,053
Finance lease liabilities - - -
Trade and other payables (excluding derivative financial instruments, accrued expenses and deferred income - 122,642,802 122,642,802
Interest-rate swap 397,798 - 397,798
Commodity derivatives 312,573 - 312,573
Cross currency 539,964 - 539,964
Share warrants 277,065 - 277,065 2,048,056 377,407,199 379,455,255
On July 11, 2014, OER completed the acquisition of Medal Oil and satisfied the purchase consideration of $5 million through the issuance of 3,491,082 common shares and 1,745,541
warrants.
Page 66 of 73
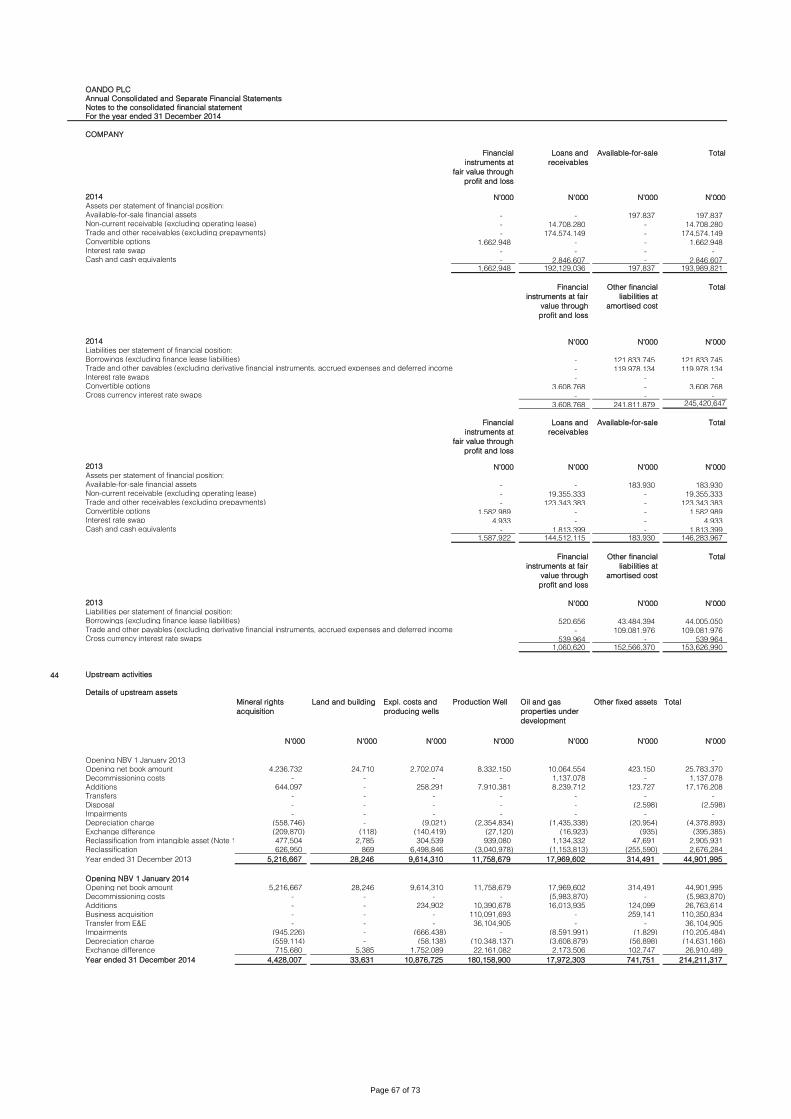
OANDO PLC
Annual Consolidated and Separate Financial Statements
Notes to the consolidated financial statement
For the year ended 31 December 2014
COMPANY
Financial
instruments at
fair value through
profit and loss
Loans and
receivables
Available-for-sale Total
2014 N'000 N'000 N'000 N'000Assets per statement of financial position:
Available-for-sale financial assets - - 197,837 197,837 Non-current receivable (excluding operating lease) - 14,708,280 - 14,708,280 Trade and other receivables (excluding prepayments) - 174,574,149 - 174,574,149 Convertible options 1,662,948 - - 1,662,948 Interest rate swap - - - - Cash and cash equivalents - 2,846,607 - 2,846,607
1,662,948 192,129,036 197,837 193,989,821
Financial
instruments at fair
value through
profit and loss
Other financial
liabilities at
amortised cost
Total
2014 N'000 N'000 N'000Liabilities per statement of financial position:
Borrowings (excluding finance lease liabilities) - 121,833,745 121,833,745 Trade and other payables (excluding derivative financial instruments, accrued expenses and deferred income - 119,978,134 119,978,134 Interest rate swaps - - - Convertible options 3,608,768 - 3,608,768 Cross currency interest rate swaps - - -
3,608,768 241,811,879 245,420,647
Financial
instruments at
fair value through
profit and loss
Loans and
receivables
Available-for-sale Total
2013 N'000 N'000 N'000 N'000Assets per statement of financial position:
Available-for-sale financial assets - - 183,930 183,930 Non-current receivable (excluding operating lease) - 19,355,333 - 19,355,333 Trade and other receivables (excluding prepayments) - 123,343,383 - 123,343,383 Convertible options 1,582,989 - - 1,582,989 Interest rate swap 4,933 - - 4,933 Cash and cash equivalents - 1,813,399 - 1,813,399
1,587,922 144,512,115 183,930 146,283,967
Financial
instruments at fair
value through
profit and loss
Other financial
liabilities at
amortised cost
Total
2013 N'000 N'000 N'000Liabilities per statement of financial position:
Borrowings (excluding finance lease liabilities) 520,656 43,484,394 44,005,050 Trade and other payables (excluding derivative financial instruments, accrued expenses and deferred income - 109,081,976 109,081,976 Cross currency interest rate swaps 539,964 - 539,964
1,060,620 152,566,370 153,626,990
44 Upstream activities
Details of upstream assets
Mineral rights
acquisition
Land and building Expl. costs and
producing wells
Production Well Oil and gas
properties under
development
Other fixed assets Total
N'000 N'000 N'000 N'000 N'000 N'000 N'000
Opening NBV 1 January 2013 -
Opening net book amount 4,236,732 24,710 2,702,074 8,332,150 10,064,554 423,150 25,783,370
Decommissioning costs - - - - 1,137,078 - 1,137,078
Additions 644,097 - 258,291 7,910,381 8,239,712 123,727 17,176,208
Transfers - - - - - - -
Disposal - - - - - (2,598) (2,598)
Impairments - - - - - - -
Depreciation charge (558,746) - (9,021) (2,354,834) (1,435,338) (20,954) (4,378,893)
Exchange difference (209,870) (118) (140,419) (27,120) (16,923) (935) (395,385)
Reclassification from intangible asset (Note 16) 477,504 2,785 304,539 939,080 1,134,332 47,691 2,905,931
Reclassification 626,950 869 6,498,846 (3,040,978) (1,153,813) (255,590) 2,676,284
Year ended 31 December 2013 5,216,667 28,246 9,614,310 11,758,679 17,969,602 314,491 44,901,995
Opening NBV 1 January 2014
Opening net book amount 5,216,667 28,246 9,614,310 11,758,679 17,969,602 314,491 44,901,995
Decommissioning costs - - - - (5,983,870) - (5,983,870)
Additions - - 234,902 10,390,678 16,013,935 124,099 26,763,614
Business acquisition - - - 110,091,693 - 259,141 110,350,834
Transfer from E&E - - - 36,104,905 - - 36,104,905
Impairments (945,226) - (666,438) - (8,591,991) (1,829) (10,205,484)
Depreciation charge (559,114) - (58,138) (10,348,137) (3,608,879) (56,898) (14,631,166)
Exchange difference 715,680 5,385 1,752,089 22,161,082 2,173,506 102,747 26,910,489
Year ended 31 December 2014 4,428,007 33,631 10,876,725 180,158,900 17,972,303 741,751 214,211,317
Page 67 of 73
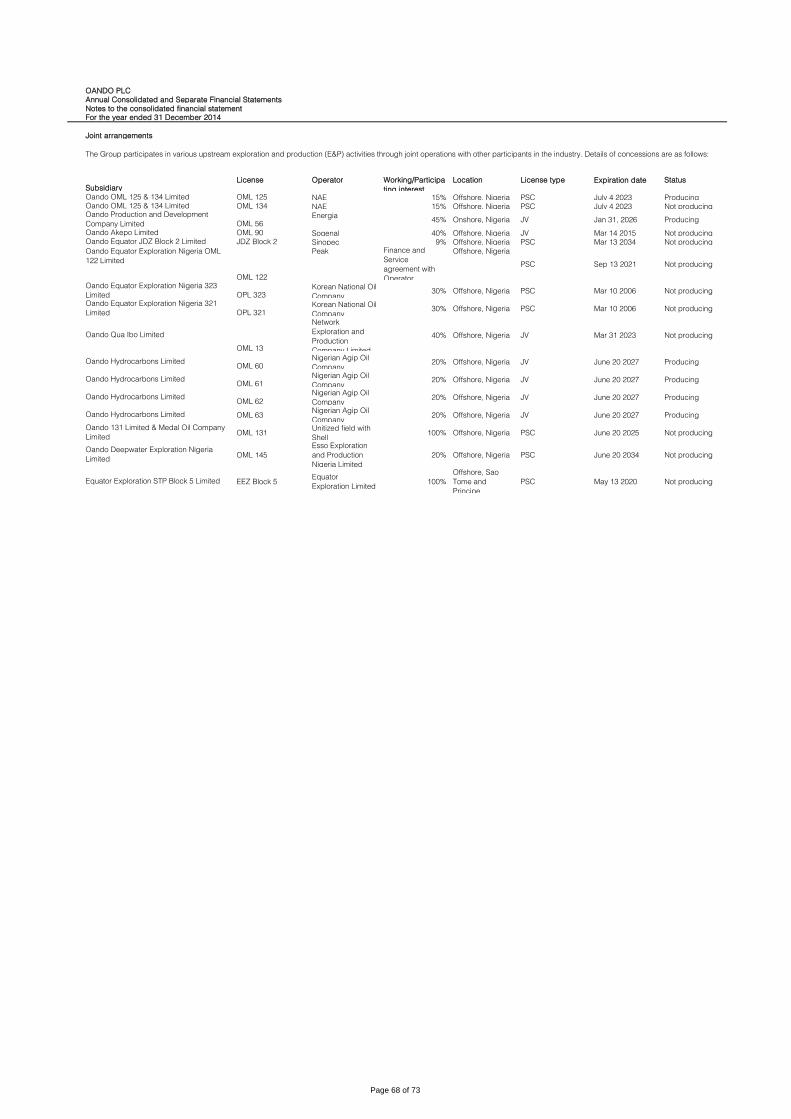
OANDO PLC
Annual Consolidated and Separate Financial Statements
Notes to the consolidated financial statement
For the year ended 31 December 2014
Joint arrangements
Subsidiary License Operator Working/Participa
ting interest
Location License type Expiration date Status
OML 125 NAE 15% Offshore, Nigeria PSC July 4 2023 ProducingOML 134 NAE 15% Offshore, Nigeria PSC July 4 2023 Not producing
OML 56Energia
45% Onshore, Nigeria JV Jan 31, 2026 Producing
OML 90 Sogenal 40% Offshore, Nigeria JV Mar 14 2015 Not producingJDZ Block 2 Sinopec 9% Offshore, Nigeria PSC Mar 13 2034 Not producing
OML 122
Peak Finance and
Service
agreement with
Operator
Offshore, Nigeria
PSC Sep 13 2021 Not producing
OPL 323Korean National Oil
Company30% Offshore, Nigeria PSC Mar 10 2006 Not producing
OPL 321Korean National Oil
Company30% Offshore, Nigeria PSC Mar 10 2006 Not producing
OML 13
Network
Exploration and
Production
Company Limited
40% Offshore, Nigeria JV Mar 31 2023 Not producing
OML 60Nigerian Agip Oil
Company20% Offshore, Nigeria JV June 20 2027 Producing
OML 61Nigerian Agip Oil
Company20% Offshore, Nigeria JV June 20 2027 Producing
OML 62Nigerian Agip Oil
Company20% Offshore, Nigeria JV June 20 2027 Producing
OML 63Nigerian Agip Oil
Company20% Offshore, Nigeria JV June 20 2027 Producing
OML 131Unitized field with
Shell100% Offshore, Nigeria PSC June 20 2025 Not producing
OML 145
Esso Exploration
and Production
Nigeria Limited
20% Offshore, Nigeria PSC June 20 2034 Not producing
EEZ Block 5Equator
Exploration Limited100%
Offshore, Sao
Tome and
Principe
PSC May 13 2020 Not producing
The Group participates in various upstream exploration and production (E&P) activities through joint operations with other participants in the industry. Details of concessions are as follows:
Oando OML 125 & 134 Limited
Oando 131 Limited & Medal Oil Company
Limited
Oando Deepwater Exploration Nigeria
Limited
Equator Exploration STP Block 5 Limited
Oando Equator Exploration Nigeria 321
Limited
Oando Qua Ibo Limited
Oando Hydrocarbons Limited
Oando Hydrocarbons Limited
Oando Hydrocarbons Limited
Oando Hydrocarbons Limited
Oando OML 125 & 134 LimitedOando Production and Development
Company LimitedOando Akepo Limited
Oando Equator JDZ Block 2 Limited
Oando Equator Exploration Nigeria OML
122 Limited
Oando Equator Exploration Nigeria 323
Limited
Page 68 of 73
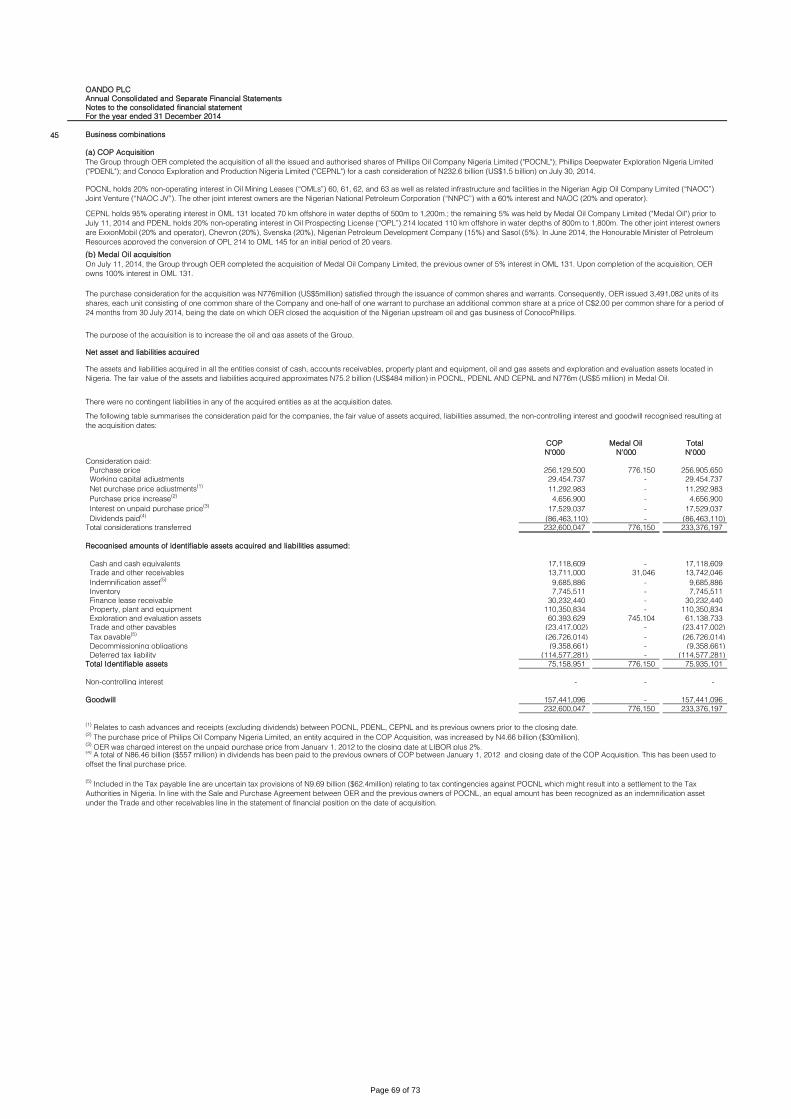
OANDO PLC
Annual Consolidated and Separate Financial Statements
Notes to the consolidated financial statement
For the year ended 31 December 2014
45 Business combinations
(a) COP Acquisition
(b) Medal Oil acquisition
Net asset and liabilities acquired
COP Medal Oil Total
N'000 N'000 N'000
Consideration paid:
Purchase price 256,129,500 776,150 256,905,650
Working capital adjustments 29,454,737 - 29,454,737
Net purchase price adjustments(1)
11,292,983 - 11,292,983
Purchase price increase(2)
4,656,900 - 4,656,900
Interest on unpaid purchase price(3)
17,529,037 - 17,529,037
Dividends paid(4)
(86,463,110) - (86,463,110)
Total considerations transferred 232,600,047 776,150 233,376,197
Recognised amounts of identifiable assets acquired and liabilities assumed:
Cash and cash equivalents 17,118,609 - 17,118,609
Trade and other receivables 13,711,000 31,046 13,742,046
Indemnification asset(5)
9,685,886 - 9,685,886
Inventory 7,745,511 - 7,745,511
Finance lease receivable 30,232,440 - 30,232,440
Property, plant and equipment 110,350,834 - 110,350,834
Exploration and evaluation assets 60,393,629 745,104 61,138,733
Trade and other payables (23,417,002) - (23,417,002)
Tax payable(5)
(26,726,014) - (26,726,014)
Decommissioning obligations (9,358,661) - (9,358,661)
Deferred tax liability (114,577,281) - (114,577,281)
Total Identifiable assets 75,158,951 776,150 75,935,101
Non-controlling interest - - -
Goodwill 157,441,096 - 157,441,096
232,600,047 776,150 233,376,197
(1) Relates to cash advances and receipts (excluding dividends) between POCNL, PDENL, CEPNL and its previous owners prior to the closing date.
(2) The purchase price of Philips Oil Company Nigeria Limited, an entity acquired in the COP Acquisition, was increased by N4.66 billion ($30million).
(3) OER was charged interest on the unpaid purchase price from January 1, 2012 to the closing date at LIBOR plus 2%.
The Group through OER completed the acquisition of all the issued and authorised shares of Phillips Oil Company Nigeria Limited ("POCNL"); Phillips Deepwater Exploration Nigeria Limited
("PDENL"); and Conoco Exploration and Production Nigeria Limited ("CEPNL") for a cash consideration of N232.6 billion (US$1.5 billion) on July 30, 2014.
POCNL holds 20% non-operating interest in Oil Mining Leases (“OMLs”) 60, 61, 62, and 63 as well as related infrastructure and facilities in the Nigerian Agip Oil Company Limited (“NAOC”)
Joint Venture (“NAOC JV”). The other joint interest owners are the Nigerian National Petroleum Corporation (“NNPC”) with a 60% interest and NAOC (20% and operator).
CEPNL holds 95% operating interest in OML 131 located 70 km offshore in water depths of 500m to 1,200m.; the remaining 5% was held by Medal Oil Company Limited ("Medal Oil") prior to
July 11, 2014 and PDENL holds 20% non-operating interest in Oil Prospecting License (“OPL”) 214 located 110 km offshore in water depths of 800m to 1,800m. The other joint interest owners
are ExxonMobil (20% and operator), Chevron (20%), Svenska (20%), Nigerian Petroleum Development Company (15%) and Sasol (5%). In June 2014, the Honourable Minister of Petroleum
Resources approved the conversion of OPL 214 to OML 145 for an initial period of 20 years.
(4) A total of N86.46 billion ($557 million) in dividends has been paid to the previous owners of COP between January 1, 2012 and closing date of the COP Acquisition. This has been used to
offset the final purchase price.
(5) Included in the Tax payable line are uncertain tax provisions of N9.69 billion ($62.4million) relating to tax contingencies against POCNL which might result into a settlement to the Tax
Authorities in Nigeria. In line with the Sale and Purchase Agreement between OER and the previous owners of POCNL, an equal amount has been recognized as an indemnification asset
under the Trade and other receivables line in the statement of financial position on the date of acquisition.
On July 11, 2014, the Group through OER completed the acquisition of Medal Oil Company Limited, the previous owner of 5% interest in OML 131. Upon completion of the acquisition, OER
owns 100% interest in OML 131.
The purchase consideration for the acquisition was N776million (US$5million) satisfied through the issuance of common shares and warrants. Consequently, OER issued 3,491,082 units of its
shares, each unit consisting of one common share of the Company and one-half of one warrant to purchase an additional common share at a price of C$2.00 per common share for a period of
24 months from 30 July 2014, being the date on which OER closed the acquisition of the Nigerian upstream oil and gas business of ConocoPhillips.
The purpose of the acquisition is to increase the oil and gas assets of the Group.
The assets and liabilities acquired in all the entities consist of cash, accounts receivables, property plant and equipment, oil and gas assets and exploration and evaluation assets located in
Nigeria. The fair value of the assets and liabilities acquired approximates N75.2 billion (US$484 million) in POCNL, PDENL AND CEPNL and N776m (US$5 million) in Medal Oil.
There were no contingent liabilities in any of the acquired entities as at the acquisition dates.
The following table summarises the consideration paid for the companies, the fair value of assets acquired, liabilities assumed, the non-controlling interest and goodwill recognised resulting at
the acquisition dates:
Page 69 of 73
OANDO PLC
Annual Consolidated and Separate Financial Statements
Notes to the consolidated financial statement
For the year ended 31 December 2014
Accounting method
Acquisition-related costs totaling N14.1 billion (US$84.9 million) have been recognized as an expense in the year ended December 31, 2014 in the income statement, while transaction cost of
N10.7 billion (US$58.0 million) associated with the borrowing has been deducted from borrowing obtained to close the acquisition. Goodwill arising on this acquisition relates to the potential
upside related tax benefits and opportunities afforded to indigenous oil and gas companies in Nigeria. Goodwill is not deductible for tax purposes.
Impairment assessments were performed on the goodwill amounts above. No impairment loss was recognised during the period.
From the period July 30, 2014 to December 31, 2014, the acquired entities contributed revenues, net of royalties, of N49.7 billion ($299.0 million) and net income before tax for the period of
N6.3 billion ($38.1 million) to OER operations. If the acquisition had occurred on January 1, 2014, management estimates for the year ended December 31, 2014, that its pro forma revenues,
net of royalties, would have been approximately N98.1 billion ($590.1 million) and net income before tax for the year would have been approximately N27.3 billion ($164.4 million). Proforma net
income before tax is defined as profit before tax adjusted for the effect of the impairment loss of N8.5 billion ($51.3 million). Pro forma information disclosed here is not necessarily
representative of future performance. The fair values of assets and liabilities recognized are estimates due to the uncertainty of provisional amounts recognized. Amendments may be made to
the purchase price equation as the cost estimates and balances are finalized.
The amounts of revenue, net of royalties, since the acquisitionof Medal Oil included in the income statement for the year ended December 31, 2014 was $nil, as the oil and gas properties
acquired are in the development or exploration phase. It is impractical to determine the net income in the current reporting period had this transaction closed on January 1, 2014. The effect of
retrospective application of IFRS policies is not determinable and requires significant estimates of the amounts and information that are not readily available to the Company.
The Group acquired the companies to increase its upstream activities.
Medal oil's acquisition has been accounted for as an asset acquisition with the purchase consideration of N776 million (US$5million) allocated as (a) N745 million (US$4.8million) to exploration
and evaluation assets, and; (b) N31 million (US$0.2million) to other assets.
Acquisition of POCNL, PDENL and CEPNL has been accounted for as a business combination with the fair value of the assets acquired and liabilities assumed at the date.
The excess of the consideration transferred over the fair value of the identifiable net assets acquired was recorded as goodwill. The fair value of inventory was determined with reference to the
current market price and the number of units of inventory less transportation costs. The fair values of the finance lease receivable, property, plant and equipment and exploration and
evaluation assets and decommissioning obligations were calculated using the discounted cash flow method using discount rates ranging from 12% - 15.5%. Deferred taxes were calculated in
accordance with IAS 12. The seller has contractually agreed to indemnify OER for uncertain tax provisions of N9.69 billion ($62.4 million) relating to tax contingencies against POCNL which
might result into a settlement to the Tax Authorities in Nigeria; an indemnification asset of N9.69 billion ($62.4 million), equivalent to the fair value of the indemnified liability included in tax
payable, was recognised by OER on the acquisition date. At December 31, 2014, OER’s estimate of the range of outcomes (undiscounted) for the settlement of the indemnity asset was
between Nil and N3.3 billion ($21.5 million). This estimate is based on settlements subsequent to year end. The fair values of all other assets and liabilities on the acquisition date were
determined with reference to their carrying values. For acquired receivables, the fair values disclosed in the table above approximate the gross contractual amounts receivable except for trade
and other receivables which is stated at N357 million ($2.3 million) less than its total gross contractual amount due to an allowance for amounts not expected to be collected. At the acquisition
date, OER expected all contractual cash flows associated with acquired receivables to be collected, except the aforementioned N357 million ($2.3 million) trade and other receivables amount.
Page 70 of 73
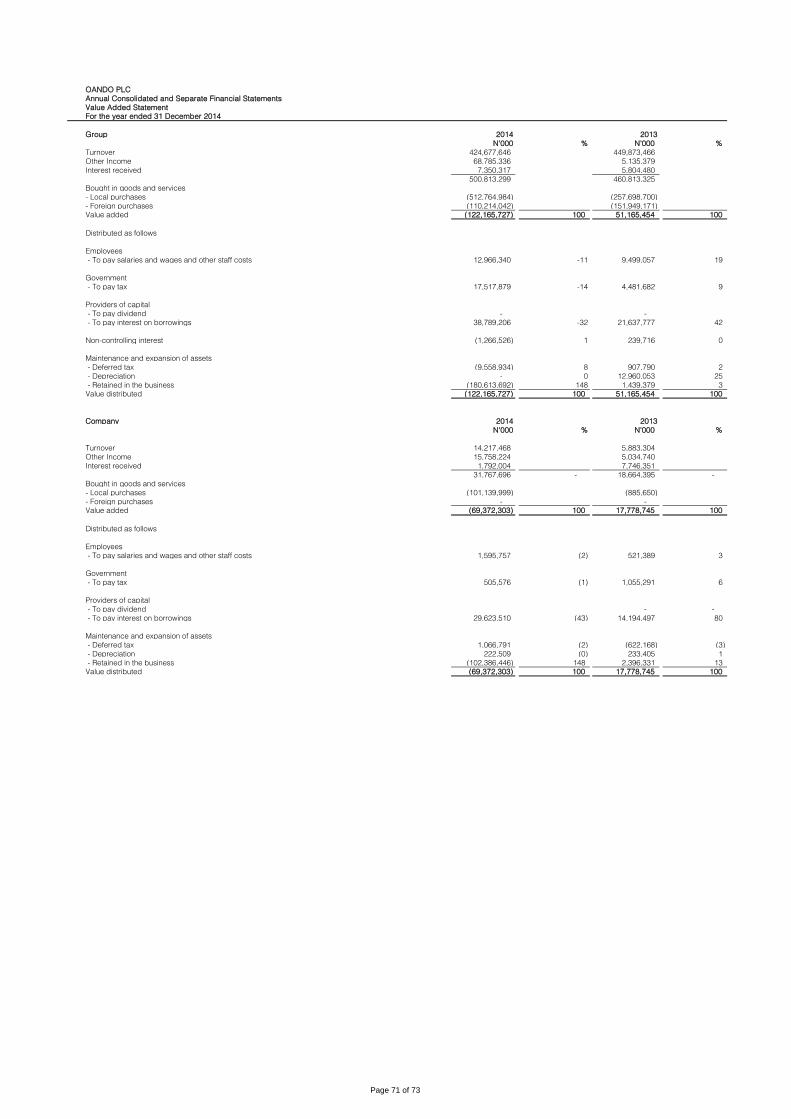
OANDO PLC
Annual Consolidated and Separate Financial Statements
Value Added Statement
For the year ended 31 December 2014
Group 2014 2013
N'000 % N'000 %
Turnover 424,677,646 449,873,466
Other Income 68,785,336 5,135,379
Interest received 7,350,317 5,804,480
500,813,299 460,813,325
Bought in goods and services
- Local purchases (512,764,984) (257,698,700)
- Foreign purchases (110,214,042) (151,949,171)
Value added (122,165,727) 100 51,165,454 100
Distributed as follows
Employees
- To pay salaries and wages and other staff costs 12,966,340 -11 9,499,057 19
Government
- To pay tax 17,517,879 -14 4,481,682 9
Providers of capital
- To pay dividend - -
- To pay interest on borrowings 38,789,206 -32 21,637,777 42
Non-controlling interest (1,266,526) 1 239,716 0
Maintenance and expansion of assets
- Deferred tax (9,558,934) 8 907,790 2
- Depreciation - 0 12,960,053 25
- Retained in the business (180,613,692) 148 1,439,379 3
Value distributed (122,165,727) 100 51,165,454 100
Company 2014 2013
N'000 % N'000 %
Turnover 14,217,468 5,883,304
Other Income 15,758,224 5,034,740
Interest received 1,792,004 7,746,351
31,767,696 - 18,664,395 -
Bought in goods and services
- Local purchases (101,139,999) (885,650)
- Foreign purchases - -
Value added (69,372,303) 100 17,778,745 100
Distributed as follows
Employees
- To pay salaries and wages and other staff costs 1,595,757 (2) 521,389 3
Government
- To pay tax 505,576 (1) 1,055,291 6
Providers of capital
- To pay dividend - -
- To pay interest on borrowings 29,623,510 (43) 14,194,497 80
Maintenance and expansion of assets
- Deferred tax 1,066,791 (2) (622,168) (3)
- Depreciation 222,509 (0) 233,405 1
- Retained in the business (102,386,446) 148 2,396,331 13
Value distributed (69,372,303) 100 17,778,745 100
Page 71 of 73

OANDO PLC
Annual Consolidated and Separate Financial Statements
Five-Year Financial Summary (2010 - 2014)
For the year ended 31 December 2014
GROUP 2014 2013 2012 2011 2010
N'000 N'000 N'000 N'000 N'000
Property, plant and equipment 314,042,207 172,209,842 130,324,713 109,479,209 97,892,224
Intangible exploration assets, other intangible assets and goodwill 245,705,184 82,232,746 138,853,809 119,333,366 104,860,339
Deferred income tax assets 12,328,465 4,995,280 13,424,518 9,908,773 6,486,391
Available for sale investments 10,834 14,500 1,000 1,000 1,000
Investments accounted for using the equity method 3,409,413 2,880,478 - - -
Deposit for acquisition of a business - 69,840,000 67,542,450 - -
Other Non-Current receivables 117,968,942 27,358,945 18,863,930 9,884,972 6,388,010
Net current liabilities (321,956,182) (126,873,433) (161,081,158) (45,720,711) (25,712,334)
Assets/(liabilities) of disposal group classified as held for sale - 23,253,101
Borrowings (162,328,636) (71,872,418) (75,221,070) (86,012,291) (74,800,422)
Deferred income tax liabilities (148,727,530) (13,905,217) (17,207,614) (16,919,822) (16,736,310)
Other Non-Current liabilities (14,945,994) (7,765,747) (10,146,050) (7,189,510) (4,699,054)
45,506,703 162,368,077 105,354,528 92,764,986 93,679,844
Share capital 4,542,343 3,411,177 1,137,058 1,137,058 905,084
Share premium 131,554,223 98,425,361 49,521,186 49,521,186 49,042,111
Retained earnings (153,583,141) 33,937,579 37,142,281 27,658,713 28,152,852
Other reserves 50,521,630 23,217,694 14,412,064 13,376,928 14,567,862
Non controlling interest 12,471,648 3,376,266 3,141,939 1,071,101 1,011,935
45,506,703 162,368,077 105,354,528 92,764,986 93,679,844
Revenue 424,677,646 449,873,466 650,565,603 571,305,637 378,925,430
Profit before income tax (175,934,241) 7,711,850 14,177,442 13,885,097 24,318,845
Income tax expense (7,958,945) (6,314,924) (8,666,859) (11,252,759) (9,943,879)
Profit for the year (183,893,186) 1,396,926 5,510,583 2,632,338 14,374,966
Per share data
Weighted average number of shares 8,698,231 6,226,567 2,268,415 1,734,746 904,884
Basic earnings per share (kobo) (2,076) 23 126 829 1,132
Diluted earnings per share (kobo) (1,380) 23 127 0 -
Dividends per share (kobo) - 30 239 300 300
Net assets per share (kobo) 523 2,608 4,089 5,364 5,836
Dividend cover (times) - 0.76 0.53 3 3.77
Page 72 of 73
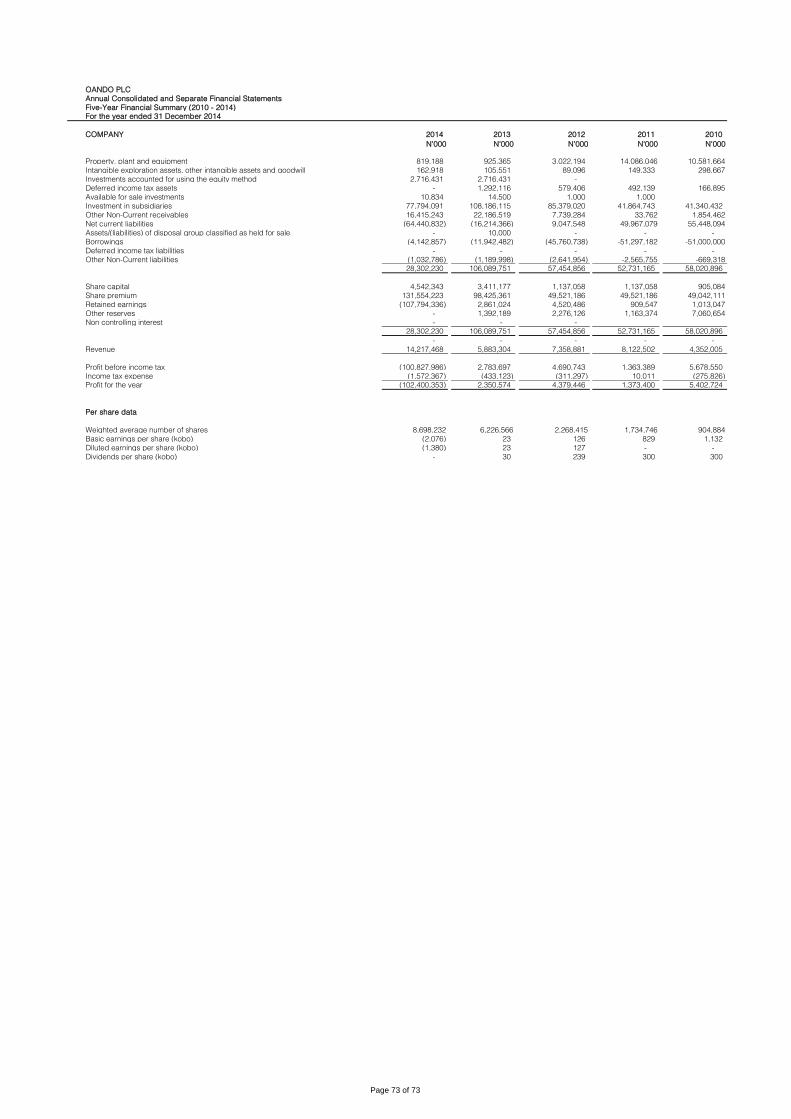
OANDO PLC
Annual Consolidated and Separate Financial Statements
Five-Year Financial Summary (2010 - 2014)
For the year ended 31 December 2014
COMPANY 2014 2013 2012 2011 2010
N'000 N'000 N'000 N'000 N'000
Property, plant and equipment 819,188 925,365 3,022,194 14,086,046 10,581,664
Intangible exploration assets, other intangible assets and goodwill 162,918 105,551 89,096 149,333 298,667
Investments accounted for using the equity method 2,716,431 2,716,431 -
Deferred income tax assets - 1,292,116 579,406 492,139 166,895
Available for sale investments 10,834 14,500 1,000 1,000
Investment in subsidiaries 77,794,091 108,186,115 85,379,020 41,864,743 41,340,432
Other Non-Current receivables 16,415,243 22,186,519 7,739,284 33,762 1,854,462
Net current liabilities (64,440,832) (16,214,366) 9,047,548 49,967,079 55,448,094
Assets/(liabilities) of disposal group classified as held for sale - 10,000 - - -
Borrowings (4,142,857) (11,942,482) (45,760,738) -51,297,182 -51,000,000
Deferred income tax liabilities - - - - -
Other Non-Current liabilities (1,032,786) (1,189,998) (2,641,954) -2,565,755 -669,318
28,302,230 106,089,751 57,454,856 52,731,165 58,020,896
Share capital 4,542,343 3,411,177 1,137,058 1,137,058 905,084
Share premium 131,554,223 98,425,361 49,521,186 49,521,186 49,042,111
Retained earnings (107,794,336) 2,861,024 4,520,486 909,547 1,013,047
Other reserves - 1,392,189 2,276,126 1,163,374 7,060,654
Non controlling interest - - -
28,302,230 106,089,751 57,454,856 52,731,165 58,020,896
- - - - -
Revenue 14,217,468 5,883,304 7,358,881 8,122,502 4,352,005
Profit before income tax (100,827,986) 2,783,697 4,690,743 1,363,389 5,678,550
Income tax expense (1,572,367) (433,123) (311,297) 10,011 (275,826)
Profit for the year (102,400,353) 2,350,574 4,379,446 1,373,400 5,402,724
Per share data
Weighted average number of shares 8,698,232 6,226,566 2,268,415 1,734,746 904,884
Basic earnings per share (kobo) (2,076) 23 126 829 1,132
Diluted earnings per share (kobo) (1,380) 23 127 - -
Dividends per share (kobo) - 30 239 300 300
Page 73 of 73
Related Documents