Welcome message from author
This document is posted to help you gain knowledge. Please leave a comment to let me know what you think about it! Share it to your friends and learn new things together.
Transcript


OANDO PLC
Annual reports and consolidated financial statements
For the year ended 31 December 2017
TABLE OF CONTENTS
Page Note Page
Directors and professional advisers 3
Directors’ report 4 7 48
Statement of directors’ responsibilities 7 8 55
Report of the independent auditors 8 9 58
10 59
11 59
Consolidated and separate financial statements: 12 60
Statement of profit or loss 15 13 61
Statement of other comprehensive income 16 14 62
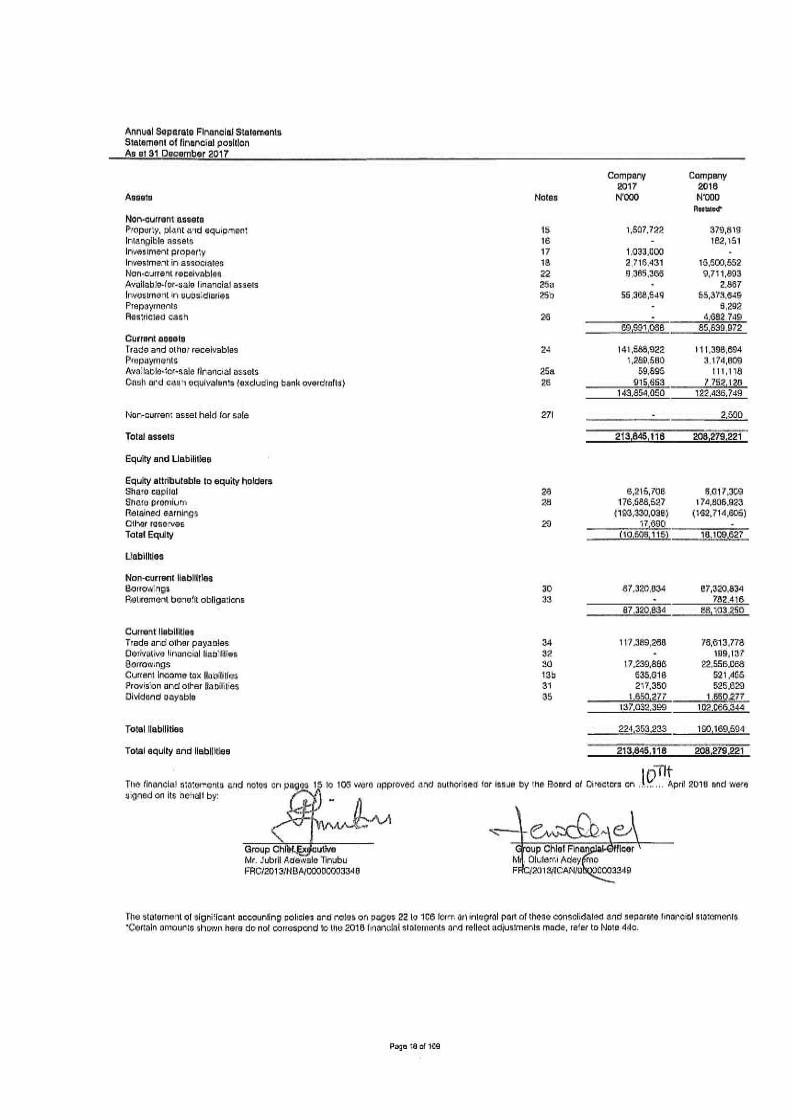
Statement of financial position 17 15 63
Statement of changes in equity 19 16 64
Statement of cash flows 21 17 67
18 67
19 70
Note 20 72
1 General information 22 21 73
2 Basis of preparation 22 22 74
3 Changes in accounting policies and disclosures 23 23 75
4 Basis of Consolidation 30 24 75
5 Other significant accounting policies 25 75
(a) Segment reporting 33 26 76
(b) Revenue recognition 33 27 77
(c) Property, plant and equipment 34 28 81
(d) Intangible assets 35 29 81
(e) Impairment of non-financial assets 35 30 82
(f) Financial instruments 36 31 85
(g) Accounting for leases 39 32 86
(h) Inventories 40 33 86
(i) Share capital 40 34 87
(j) Cash and cash equivalents 40 35 Dividend payable 87
(k) Employees benefits 40 36 Supplementary cash flow information 88
(l) Provisions 41 37 89
(m) Current income and deferred tax 41 38 Commitments 91
(n) Exceptional items 42 39 92
(o) Dividend 42 40 92
(p) Upstream activities 42 41 93
(q) Impairment 43 42 96
(r) Non-current assets held for sale 43 43 98
(s) Production underlift and overlift 43 44 100
(t) Fair value 43 45 Going concern 106
(u) Offshore processing arrangements 44 Other National Disclosures:
(v) Investment properties 45 Value Added Statement 107
6 45 108-109
Contingent liabilities
Subsidiaries' information
Financial instruments by category
Upstream activities
Prior year restatements
Significant accounting judgements, estimates and
assumptions
Five-Year Financial Summary (2013 -
2017)
Provision and other liabilities
Derivative financial liabilities
Retirement benefit obligations
Trade and other payables
Related party transactions
Events after the reporting period
Available-for-sale financial assets &
Investment in subsidiaries
Cash and cash equivalents
Discontinued operations and disposal
groups held for sale
Share capital & share premium
Other reserves
Borrowings
Deferred tax
Derivative financial assets
Finance lease receivables
Non-current receivables
Inventories
Trade and other receivables
Income tax expense
Earnings and dividend per share
Property, plant and equipment
Intangible assets
Investment property
Investment in associate accounted for
using the equity method
Financial risk management
Segment information
Other operating income
Expenses by nature
Employee benefit expenses
Finance costs/income
Page 2 of 109

OANDO PLC
Directors and Professional Advisers
For the year ended 31 December 2017
Directors HRM. Oba A. Gbadebo, CFR (Chairman, Non-Executive Director)
Mr. J.A.Tinubu (Group Chief Executive)
Mr. O. Boyo (Deputy Group Chief Executive)
Mr. Olufemi Adeyemo (Group Chief Financial Officer; Executive Director)
Mr. B. Osunsanya (Non-Executive Director)
Mr. Oghogho Akpata (Non-Executive Director)
Chief Sena Anthony (Non-Executive Director)
Mr. Tanimu Yakubu (Non-Executive Director)
Mr. Ike Osakwe (Non-Executive Director)
Mr. Ademola Akinrele (Non-Executive Director)
Company Secretary and Ayotola Jagun (Ms)
Chief Compliance Officer
Registered Office 17a The Wings Complex, Ozumba Mbadiwe
Victoria Island, Lagos
Auditors Ernst & Young
10th & 13th floor
UBA House
57, Marina,
Lagos, Nigeria.
Bankers Access Bank Plc
Access Bank UK
Afrexim
Bank of Montreal Canada
BNP
Citibank, UK
Diamond Bank Plc
Ecobank Nigeria Plc
Federated bank
Fidelity bank Plc
First Bank (UK)
First Bank of Nigeria Plc
First City Monument Bank Plc
First City Monument Bank UK
Guaranty Trust Bank Plc
Heritage Bank Plc
Industrial and Commercial Bank of China Ltd
ING Bank
Investec Bank
Keystone Bank Limited
National Bank of Fujairah (NBF)
Natixis Bank
Rand Merchant Bank
Stanbic IBTC Bank Plc
Standard Bank of South Africa Ltd
Standard Chartered Bank Plc., UK
Standard Chartered Bank(Nig.) Ltd
Union Bank of Nigeria Plc
United Bank for Africa Plc
United Bank for Africa, New York
Zenith Bank Plc
Ecobank Sao Tome e Principe
Mauritius Commercial Bank
Page 3 of 109

OANDO PLC
Directors' report
For the year ended 31 December 2017
1 Principal Activity
2 Results
31-Dec-17 31-Dec-16 31-Dec-17 31-Dec-16
N'000 N'000 N'000 N'000
497,422,483 455,746,734 - 10,234,612
Profit/(loss) before income tax from continuing operations 20,764,585 (62,956,942) (30,599,529) (27,934,427)
(7,295,366) 37,569,028 (15,904) (146,405)
Profit/(loss) for the year from continuing operations 13,469,219 (25,387,914) (30,615,433) (28,080,832)
Profit for the year from discontinued operations 6,303,557 29,300,521 - -
Profit/(loss) for the year 19,772,776 3,912,607 (30,615,433) (28,080,832)
Profit/(loss) attributable to owners of the parent 13,941,744 3,543,373 (30,615,433) (28,080,832)
3 Dividend
4 Directors
Direct Indirect
HRM. Oba A. Gbadebo, CFR 437,500 Nil
Mr. J.A. Tinubu* Nil 3,670,995
Mr O. Boyo* Nil 2,354,713
Mr. B. Osunsanya 269,988 1,890,398
Mr O. Adeyemo 75,000 1,723,898
Tanimu Yakubu 5,997,315 5,998,700
Chief Sena Anthony 299,133 Nil
Mr. Oghogho Akpata Nil Nil
Ike Osakwe 139,343 Nil
Ademola Akinrele 96,510 Nil
Revenue
Income tax (expense)/credit
The Directors have not proposed dividend for the year ended 31 December 2017 (2016: nil).
i. The names of the present directors and those that served during the year are listed on page 3.
ii. According to the Register of Directors' shareholding, the interests of Directors in the issued share capital of the Company for the purposes of section 275
part 1 of schedule 5 of the Companies and Allied Matters Act, are as follows:
The Directors submit their Report together with the audited consolidated financial statements for the year ended 31 December 2017, which disclose the state
of affairs of the Group and Company.
The principal activity of Oando PLC ("the Company") locally and internationally is to have strategic investments in energy companies. The Company was
involved in the following business activities via its subsidiary companies during the year reviewed:
a) Exploration and production (E & P) - Oando Energy Resources Inc., Canada, engaged in production operations and other E & P companies operating
within the Gulf of Guinea.
b) Supply and distribution of petroleum products - Oando Trading Dubai and Oando Trading Bermuda.
In 2016, the Company divested its interest in the downstream businesses and significant part of the gas and power businesses.
In 2017, the Company completed a sale of its 100% interest in Alausa Power Limited. Alausa Power Limited was involved in the production and supply of
power to Lagos State.
The Company’s registered address is 17a The Wings Complex, Ozumba Mbadiwe, Victoria Island, Lagos, Nigeria.
The Group's net profit/(loss) for the year of N13.9 billion (Company: N30.6 billion) attributable to owners of equity has been transferred to retained earnings.
Group Company
Page 4 of 109

OANDO PLC
Directors' report (cont'd)
For the year ended 31 December 2017
5 Contracts
6 Directors' Responsibilities
7 Shareholdings
As of 31 December 2017, the range of shareholdings of the Company was as follows:
Range of Shareholding No of
Shareholders % of
No of shares
% of
Within Range Holders Within Range Shareholding
1 - 1,000 168,231 61.68 61,723,758 0.50
1,001 - 5,000 73,058 26.79 153,139,091 1.23
5,001 - 10,000 12,452 4.57 89,891,326 0.72
10,001 - 50,000 13,529 4.96 297,571,759 2.39
50,001 - 100,000 2,388 0.87 172,046,470 1.39
100,001 - 500,000 2,400 0.88 498,709,084 4.01
500,001 - 1,000,000 325 0.12 233,183,664 1.88
1,000,001 - 5,000,000 297 0.11 590,675,845 4.75
5,000,001 - 10,000,000 33 0.01 222,962,817 1.80
10,000,001 - 50,000,000 24 0.01 585,782,765 4.71
50,000,001 - 100,000,000 6 - 461,618,260 3.71
100,000,001 - 12,431,412,481 9 - 9,064,107,642 72.91
272,752 100.00 12,431,412,481 100.00
8 Property, Plant and Equipment
9 Donations/Charitable gifts
Description Amount
N
I
13,454,073
II 15,776,408
III
1,799,770
IV
29,583,637
V
21,337,251
VI
3,177,458
VII
3,487,365
VIII 489,075
IX 1,894,553
X 6,000,000
XI 5,000,000
XII 730,000
XIII 135,559,599
XIV 15,515,125
253,804,314
Sponsorship of film production in favour of Temple Production LTD
Establishment 7 Walk-in -centers in 5 Oando Foundation adopted schools
Sponsorship of African Philanthrophy Forum 2017
Provision of furniture for the Education Intervention Project in Borno State.
Scholarship Award to 5 indigenous pupils of Ogun State
Donation to the National Association of Niger Delta Students (NANDS).
Benefit in kind to Oando Foundation from the Group
Scholarship award for 570 pupils across 22 states and the FCT
Institutional capacity building and mentorship support provided for 241 School Based Management
Committee members covering 16 schools in Ebonyi, Enugu, Cross River and Sokoto
Renovation/new-builds and provision of furniture in 7 Oando Foundation adopted schools in Plateau,
Bauchi, Sokoto and Kwara States
Training of 561 teachers and 43 head teachers across Plateau, Ebonyi, Ekiti, Cross River, Enugu, Oyo,
Ondo, Osun and Akwa Ibom States
Distribution of over 1,000 teaching and learning materials in 22 Oando Foundation adopted schools to
improve learning outcomes
Institutional capacity building and mentorship support provided for 53 Local Government Education
Authority (LGEA) officers to improve service delivery in Enugu, Ebonyi, Cross River, Akwa Ibom, Bayelsa
and Rivers States
Ocean and Oil Development Partners Limited (OODP) owns 7,131,736,673 (57.37% of total number of shares) shares in the Company. OODP is ultimately
owned 40% by Mr. Gabriele Volpi, 40% by the Group Chief Executive and 20% by the Deputy Chief Executive of the Company.
None of the Directors notified the Company of any declarable interest in contracts in which the Company was involved during the year under review for the
purpose of section 277 of the Companies and Allied Matters Act, and Article 115 of the Company's Articles of Association.
The Directors are responsible for the preparation of annual consolidated financial statements, which have been prepared using appropriate accounting
policies, supported by reasonable and prudent judgements and estimates, in conformity with International Financial Reporting Standards issued by the
International Accounting Standards Board and the requirements of the Companies and Allied Matters Act. In doing so, the Directors have the responsibilities
as described on page 7 of these consolidated financial statements.
Changes in the value of property, plant and equipment (PPE) were mainly due to additions, depreciation, disposals and exchange differences as shown in
Note 15 to these consolidated financial statements. In the opinion of the Directors, the market value of the Group's property, plant and equipment is not lower
than the value shown in these consolidated financial statements.
Establishment of ICT Centers in 5 Oando Foundation adopted schools inclusive of ICT training, and
teaching materials to support curriculum based lessons across Niger, Bauchi, Adamawa, Taraba &
Kwara States
*Additional shares: Ocean and Oil Investments Limited (OOIL) owns approximately 159,701,243 (1.28% of total number of shares) shares in the Company. Mr.
Jubril Adewale Tinubu and Mr. Omamofe Boyo own 0.70% and 0.28% respectively in the Company through OOIL.
Page 5 of 109
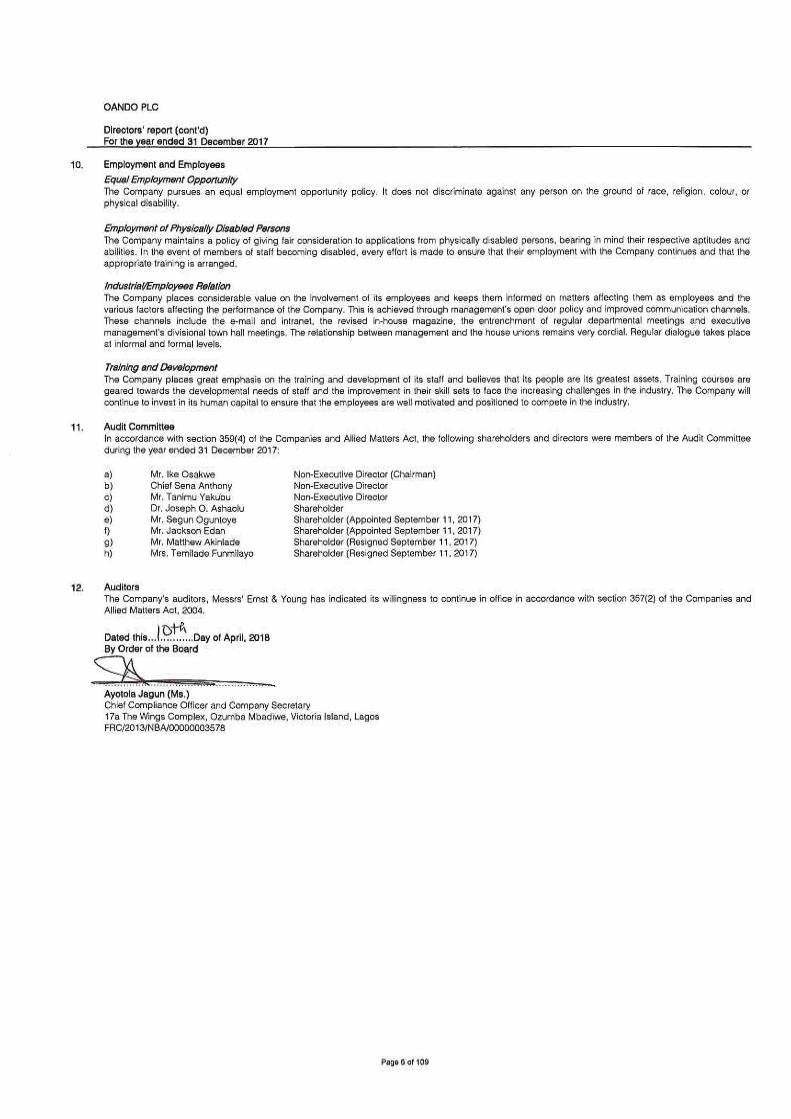

Report of the Audit Committee
We have exercised out statutory functions in compliance with Section 359 (6) of the Companies
and Allied Matters Act 2004 and we the members of the Oando PLC Audit Committee have, on
the documents and information made available to us;
a. Reviewed the scope and planning of the audit requirements and found them
satisfactory
b. Reviewed the External Auditors’ Management Controls Report for the year ended
December 31, 2017 as well as the Management response thereto,
c. Appraised the Financial Statements for the year ended 31 December 2017 and are
satisfied with the explanations provided.
We ascertain that the accounting and reporting policies of the Company for the year ended
December 31, 2017 are in accordance with legal requirements and agreed ethical practices.
Dated this 10th day of April 2018
Ike Osakwe
FRC/2017/ICAN/00000016455
Members of the Audit Committee are
Ike Osakwe (Independent Non-Executive Director/Chairman)
Chief Sena Anthony (Independent Non-Executive Director)
Mr. Tanimu Yakubu (Non-Executive Director)
Dr. Joseph Asaolu (Shareholder Member)
Mr. Segun Oguntoye (Shareholder Member- Appointed September 11, 2017)
Mr. Jackson Edah (Shareholder Member- Appointed September 11, 2017)
Mr. Matthew Akinlade (Shareholder Member- Resigned September 11, 2017)
Mr. Temilade Funmilayo Durojaiye (Shareholder Member- Resigned September 11, 2017)


OANDO PLC
Annual Consolidated and Separate Financial Statements
Statement of profit or loss
For the year ended 31 December 2017
GROUP Group Group Company Company
2017 2016 2017 2016
Notes N'000 N'000 N'000 N'000
Restated* Restated*
Continuing operations
Revenue 8c 497,422,483 455,746,734 - 10,234,612
Cost of sales (409,341,126) (426,933,813) - -
Gross profit 88,081,357 28,812,921 - 10,234,612
Other operating income 9 46,490,127 73,200,990 25,989,048 98,194,765
Administrative expenses (77,893,766) (109,252,946) (40,348,802) (103,131,018)
Operating profit/(loss) 56,677,718 (7,239,035) (14,359,754) 5,298,359
Finance costs 12a (43,743,860) (58,313,162) (19,166,179) (33,260,203)
Finance income 12b 9,959,732 7,256,765 2,926,404 27,417
Finance costs - net (33,784,128) (51,056,397) (16,239,775) (33,232,786)
Share of loss of associates 18 (2,129,005) (4,661,510) - -
Profit/(loss) before income tax from continuing operations 20,764,585 (62,956,942) (30,599,529) (27,934,427)
Income tax (expense)/credit 13(a) (7,295,366) 37,569,028 (15,904) (146,405)
Profit/(loss) for the year from continuing operations 13,469,219 (25,387,914) (30,615,433) (28,080,832)
Discontinued operations
27g 6,303,557 29,300,521 - -
Profit/(loss) for the year 19,772,776 3,912,607 (30,615,433) (28,080,832)
Profit/(loss) attributable to:
Equity holders of the parent 13,941,744 3,543,373 (30,615,433) (28,080,832)
Non-controlling interest 5,831,032 369,234 - -
19,772,776 3,912,607 (30,615,433) (28,080,832)
Earnings per share from continuing and discontinued operations attributable to ordinary equity holders
of the parent during the year: (expressed in kobo per share)
Basic and diluted earnings per share 14
From continuing operations 62 (211)
From discontinued operations 51 241
From profit for the year 113 30
*Certain amounts shown here do not correspond to the 2016 financial statements and reflect adjustments made, refer to Note 44a.
Profit after tax for the year from discontinued operations
The statement of significant accounting policies and notes on pages 22 to 106 form an integral part of these consolidated and separate financial statements.
Page 15 of 109

OANDO PLC
Annual Consolidated and Separate Financial Statements
Statement of other comprehensive income
For the year ended 31 December 2017
Notes Group Group Company Company
2017 2016 2017 2016
N'000 N'000 N'000 N'000
Restated* Restated*
Profit/(loss) for the year 19,772,776 3,912,607 (30,615,433) (28,080,832)
Other comprehensive income:
51,258,513 108,469,348 - -
Share of associate's foreign currency translation reserve 29 3,237,573 - - -
Fair value gain on available for sale financial assets 25 17,690 - 17,690 -
13a - - - -
54,513,776 108,469,348 17,690 -
Reclassification to profit or loss
29 (3,291,936) - - -
51,221,840 108,469,348 17,690 -
70,994,616 112,381,955 (30,597,743) (28,080,832)
Attributable to:
- Equity holders of the parent 51,634,878 86,819,326 (30,597,743) (28,080,832)
- Non-controlling interests 19,359,738 25,562,629 - -
70,994,616 112,381,955 (30,597,743) (28,080,832)
- Continuing operations 45,331,321 57,518,805 (30,597,743) (28,080,832)
- Discontinued operations 6,303,557 29,300,521 - -
51,634,878 86,819,326 (30,597,743) (28,080,832)
*Certain amounts shown here do not correspond to the 2016 financial statements and reflect adjustments made, refer to Note 44b.
Total comprehensive income/(loss) for the year, net of tax
Total comprehensive income/(loss) for the year, net of tax
Total comprehensive income/(loss) attributable to equity holders of the
parent arises from:
The statement of significant accounting policies and notes on pages 22 to 106 form an integral part of these consolidated and separate financial statements.
Items that may be reclassified to profit or loss in subsequent periods:
Exchange differences on translation of foreign operations
Deferred tax on fair value gain on available for sale financial
assets
Reclassification of share of OVH Energy BV's foreign currency
translation reserve
Other comprehensive income for the year, net of tax
Items that will not be reclassified to profit or loss in subsequent periods:
Page 16 of 109


OANDO PLC
Annual Consolidated Financial Statements
Consolidated statement of changes in equity
For the year ended 31 December 2017
Group
Share capital &
Share
premium1
Other
reserves2
Retained
earnings
Equity holders of
parent
Non controlling
interest Total equity
N'000 N'000 N'000 N'000 N'000 N'000
Balance as at 1 January 2016 180,824,232 55,750,740 (199,723,265) 36,851,707 14,042,219 50,893,926
Profit for the year - - 3,543,373 3,543,373 369,234 3,912,607
- 83,275,953 - 83,275,953 25,193,395 108,469,348
Total comprehensive income - 83,275,953 3,543,373 86,819,326 25,562,629 112,381,955
Transaction with owners
Value of employee services - 469,829 - 469,829 - 469,829
- (22,194,982) 22,194,982 - - -
Reclassification of FCTLR (Note 29) - (1,218,976) 1,218,976 - - -
Dividend paid to non-controlling interest - - - - (80,743) (80,743)
Disposal of subsidiary - - - - (1,056,732) (1,056,732)
Total transaction with owners - (22,944,129) 23,413,958 469,829 (1,137,475) (667,646)
Non controlling interest arising in business combination
- (22,674,827) 20,897,366 (1,777,461) 31,513,805 29,736,344
- (45,618,956) 44,311,324 (1,307,632) 30,376,330 29,068,698
Balance as at 31 December 2016 180,824,232 93,407,737 (151,868,568) 122,363,401 69,981,178 192,344,579
Balance as at 1 January 2017 180,824,232 93,407,737 (151,868,568) 122,363,401 69,981,178 192,344,579
Profit for the year - - 13,941,744 13,941,744 5,831,032 19,772,776
- 37,693,134 - 37,693,134 13,528,706 51,221,840
- 37,693,134 13,941,744 51,634,878 19,359,738 70,994,616
Transaction with owners
Proceeds from shares issued (note 28) 1,980,001 - - 1,980,001 - 1,980,001
Total transaction with owners 1,980,001 - - 1,980,001 - 1,980,001
Non controlling interest arising in business combination
- 374,151 (750,275) (376,124) (1,507,292) (1,883,416)
1,980,001 374,151 (750,275) 1,603,877 (1,507,292) 96,585
Balance as at 31 December 2017 182,804,233 131,475,022 (138,677,099) 175,602,156 87,833,624 263,435,780
Change in ownership interests in
subsidiaries that do not result in a loss of
control (note 41c)
Total transactions with owners of the parent,
recognised directly in equity
1 Share capital includes ordinary shares and share premium
2 Other reserves include currency translation reserves, available for sale reserve and share based payment reserves (SBPR). See note 29.
The statement of significant accounting policies and notes on pages 22 to 106 form an integral part of these consolidated and separate financial statements.
Reclassification of revaluation reserve (Note
29)
Change in ownership interests in
subsidiaries that do not result in a loss of
control (note 41c)
Total transactions with owners of the parent,
recognised directly in equity
Other comprehensive income/(loss) for the
year
Total comprehensive income for the year
Other comprehensive income for the year
Page 19 of 109

OANDO PLC
Annual Financial Statements
Separate statement of changes in equity
For the year ended 31 December 2017
Company
Share Capital &
Share premiumOther reserves
1 Retained earnings Equity holders of
parent/ Total
equityN'000 N'000 N'000 N'000
Balance as at 1 January 2016 180,824,232 - (134,633,774) 46,190,458
Loss for the year - - (28,080,831) (28,080,831)
Other comprehensive loss for the year - - - -
Total comprehensive loss - - (28,080,831) (28,080,831)
Balance as at 31 December 2016 180,824,232 - (162,714,605) 18,109,627
Balance as at 1 January 2017 180,824,232 - (162,714,605) 18,109,627
Loss for the year - - (30,615,433) (30,615,433)
Other comprehensive income for the year - 17,690 - 17,690
Total comprehensive income/(loss) for the year 180,824,232 17,690 (193,330,038) (12,488,116)
Transaction with owners -Conversion of OODP's convertible debt (note 28) 1,980,001 - - 1,980,000
Balance as at 31 December 2017 182,804,233 17,690 (193,330,038) (10,508,116)
1 Other reserves comprise of available for sale reserve. See note 29.
The statement of significant accounting policies and notes on pages 22 to 106 form an integral part of these consolidated and separate financial statements.
Page 20 of 109

OANDO PLC
Annual Consolidated and Separate Financial Statements
Consolidated and Separate Statement of Cash flows
For the year ended 31 December 2017
Notes Group Group Company Company
2017 2016 2017 2016
N'000 N'000 N'000 N'000
Cash flows from operating activities
Cash generated from operations 36 85,239,610 134,152,191 5,402,480 10,796,689
Refund to prospective buyers of subsidiaries 31 (308,278) (2,434,105) (308,279) (2,434,105)
Interest paid (24,404,228) (51,749,555) (14,608,602) (31,440,709)
Income tax paid* 13b (10,351,862) (8,360,556) (1,741) (1,397,429)
Gratuity benefit paid (1,285,161) 172,799 (754,311) (39,021)
Net cash from/(used in) operating activities 48,890,081 71,780,774 (10,270,453) (24,514,575)
Cash flows from investing activities
15 (19,822,073) (14,502,822) (1,280,732) (66,568)
Proceeds from disposal of subsidiary, net of cash 27e 871,978 (16,276,387) - 14,261,979
Proceeds from disposal of investment in associate 22b 609,184 - - -
Investment in an associate 18 (2,444) - - -
Purchase of investment property 17 (127,983) - (127,983) -
31 - 525,629 - 525,629
27dii 2,253,879 - 2,253,879 -
Acquisition of software 16 - (965) - (965)
Proceeds from disposal of available for sale investment 25a 71,780 - 71,780
Purchase of intangible exploration assets* 16 (1,475,010) (2,118,766) - -
Payments relating to license and pipeline construction* 16 - (3,750,270) - -
Proceeds from sale of property, plant and equipment 19,203 133,356 4,606 19,771
Finance lease received 7,719,125 6,338,044 - -
Proceeds from sale of intangibles 16 - 3,532,829 - -
Interest received 745,635 5,954,288 745,575 27,417
Net cash (used in)/from investing activities (9,136,726) (20,165,064) 1,667,125 14,767,263
Cash flows from financing activities
Proceeds from long term borrowings 305,900 120,932,111 - 114,847,914
Repayment of long term borrowings (7,350,185) (42,472,435) - (33,741,366)
Proceeds from other short term borrowings 32,037,524 78,635,165 11,311,834 72,948,429
Repayment of other short term borrowings (63,502,898) (152,923,226) (16,562,576) (106,246,410)
22b 2,198,358 - 2,198,358 -
Acquired minority interest 41c (1,883,416) - - -
Purchase of shares from NCI - (1,368,350) - -
Dividend paid to NCI - (80,743) - -
Restricted cash (5,603,461) 2,467,131 4,682,749 (4,441,582)
Net cash (used in)/from financing activities (43,798,178) 5,189,653 1,630,365 43,366,985
Net change in cash and cash equivalents (4,044,823) 56,805,363 (6,972,963) 33,619,673
Cash and cash equivalents at the beginning of the year 10,596,470 (48,781,363) 7,752,128 (26,128,902)
Exchange gains/(losses) on cash and cash equivalents 1,343,414 2,572,470 136,488 261,357
Cash and cash equivalents at end of the year 7,895,061 10,596,470 915,653 7,752,128
Cash and cash equivalents at 31 December 2017:
26 7,895,061 10,390,585 915,653 7,752,128
Included in the assets of the disposal group 27f - 205,885 - -
7,895,061 10,596,470 915,653 7,752,128
Cash and cash equivalent at year end is analysed as follows:
Cash and bank balance as above 7,895,061 10,390,585 915,653 7,752,128
Bank overdrafts (Note 30) - - - -
7,895,061 10,390,585 915,653 7,752,128
The statement of significant accounting policies and notes on pages 22 to 106 form an integral part of these consolidated and separate financial statements.
Proceeds from contingent consideration from Helios with
respect to the sale of the Gas & Power entities
Proceeds from loan note from from Helios with respect to the
sale of the Gas & Power entities
Included in cash and cash equivalents per statement of
financial position
1 Purchases of property, plant and equipment exclude capitalised interest (2017: nil; 2016: nil)
* Disclosures are for both continuing and discontinued operations.
Purchases of property plant and equipment* 1
Deposit received from prospective buyers of subsidiaries
Page 21 of 109

OANDO PLC
Annual Consolidated and Separate Financial Statements
Notes to the consolidated and separate financial statements
For the year ended 31 December 2017
1. General information
2. Basis of preparation
The consolidated financial statements of Oando Plc. have been prepared in accordance with International Financial Reporting Standards (IFRS) issued by the
International Accounting Standards Board (IASB). The annual consolidated financial statements are presented in Naira, rounded to the nearest thousand, and
prepared under the historical cost convention, except for the revaluation of land and buildings, available-for-sale financial assets, and financial assets and
financial liabilities (including derivative instruments) at fair value through profit or loss.
The preparation of financial statements in conformity with IFRS requires the use of certain critical accounting estimates. It also requires management to
exercise its judgement in the process of applying the Group’s accounting policies. The areas involving a higher degree of judgement or complexity, or areas
where assumptions and estimates are significant to these consolidated financial statements, are disclosed in Note 6.
Pursuant of the Amended and Restated Loan Agreement between West Africa Investment Limited (the ‚Lender‛ /‛WAIL‛), Goldeneye Energy Resources
Limited (the ‚Borrower‛) and Oando PLC (the ‚Guarantor‛) dated March 31, 2016, on one hand; and another Amended and Restated Loan Agreement
between Goldeneye Energy Resources Limited (the ‚Borrower‛), Southern Star Shipping Co Inc. (the ‚Lender"/‛SS‛) and Oando Plc (the ‚Guarantor‛) also
dated 31 March 2016; Oando PLC provided financial guarantee to the Lenders to the tune of US$32m (WAIL: US$27m, SS: US$5m). The essence of the loans
was for the borrower to acquire shares owned by the Lenders in Oando Exploration and Production Holdings Limited (OEPH), a wholly owned subsidiary of
Oando PLC. The Borrower agreed to repay the loans in 12 installments starting from March 2017.
The financial guarantee required Oando Plc to pay to the Lenders in its capacity as Guarantor, the loan amounts due (inclusive of accrued interest) if the
Borrower is unable to pay while the Borrower is also required to transfer the relevant number of shares held in OEPH to the Guarantor or its Nominee in the
event of default.
Upon failure by the Borrower to honour the repayment agreement, the Guarantor paid US$ 6.1m (which represented principal plus accrued interest) to SS on
October 4, 2017. On the same date, the borrower executed a share transfer instrument for the purpose of transferring all the shares previously acquired from
SS to the Calabar Power Limited, a wholly owned subsidiary of Oando PLC. Consequently, the Guarantor was discharged of the financial guarantee to SS and
Oando PLC now owns 78.18% (2016: 77.74%) shares in OEPH Holdings (see note 41c). The Borrower and Lenders are not related parties to the Guarantor.
OER effectively became the Group’s main vehicle for all oil exploration and production activities.
In 2016, OER previously quoted on Toronto Stock Exchange (TSX), notified the (TSX) of its intention to voluntarily delist from the TSX. The intention to delist
from the TSX was approved at a Board meeting held on the 18th day of December, 2015. The shares of OER were delisted from the TSX at the close of
business on Monday, May 16th 2016. Upon delisting, the requirement to file annual reports and quaterly reports to the Exchange will no longer be required.
The Company believes the objectives of the listing in the TSX was not achieved and the Company judges that the continued listing on the TSX was not
economically justified.
To effect the delisting, a restructuring of the OER Group was done and a special purpose vehicle, Oando Exploration and Production Holdings Limited
(‚OEPH‛) was set up to acquire all of the issued and outstanding shares of OER. As a result of the restructuring, shares held by the previous owners of OER
(Oando PLC (93.49%), the institutional investors in OER (5.08%) and certain Key Management Personnel (1.43%) were required to be transferred to OEPH, in
exchange for an equivalent number of shares in OEPH. The share for share exchange between entities in the Oando Group is considered as a business
combination under common control not within the scope of IFRS 3.
OEPH purchased the remaining shares in OER from the remaining shareholders who did not partake in the share exchange arrangement for a cash
consideration. The shareholders of the 5,733,277 shares were paid a cash consideration of US$1.20 per share in accordance with the plan of arrangement. As
a result of the above, OEPH Holdings now owns 100% of the shares in OER.
Oando PLC (formerly Unipetrol Nigeria Plc.) was registered by a special resolution as a result of the acquisition of the shareholding of Esso Africa
Incorporated (principal shareholder of Esso Standard Nigeria Limited) by the Federal Government of Nigeria. It was partially privatised in 1991 and fully
privatised in the year 2000 following the disposal of the 40% shareholding of Federal Government of Nigeria to Ocean and Oil Investments Limited and the
Nigerian public. In December 2002, the Company merged with Agip Nigeria Plc. following its acquisition of 60% of Agip Petrol’s stake in Agip Nigeria Plc. The
Company formally changed its name from Unipetrol Nigeria Plc. to Oando PLC in December 2003.
Oando PLC (the "Company‛) is listed on the Nigerian Stock Exchange and the Johannesburg Stock Exchange. In 2016, the Company embarked on a
reorganisation and disposed some subsidiaries in the Energy, Downstream and Gas & Power segments. The Company disposed Oando Energy Services and
Akute Power Ltd effective 31 March 2016 and also target companies in the Downstream division effective 30 June 2016. It also divested its interest in the Gas
and Power segment in December 2016 with the exception of Alausa Power Ltd which was disposed off on 31 March 2017. The Company retains its significant
ownership in Oando Trading Bermuda (OTB), Oando Trading Dubai (OTD) and its upstream businesses (See note 8 for segment result), hereinafter referred
to as the Group.
On October 13, 2011, Exile Resources Inc. (‚Exile‛) and the Oando Exploration and Production Division (‚OEPD‛) of Oando PLC (‚Oando‛) announced that
they had entered into a definitive master agreement dated September 27, 2011 providing for the previously announced proposed acquisition by Exile of
certain shareholding interests in Oando subsidiaries via a Reverse Take Over (‚RTO‛) in respect of Oil Mining Leases (‚OMLs‛) and Oil Prospecting Licenses
(‚OPLs‛) (the ‚Upstream Assets‛) of Oando (the ‚Acquisition‛) first announced on August 2, 2011. The Acquisition was completed on July 24, 2012
(Completion date"), giving birth to Oando Energy Resources Inc. (‚OER‛); a company which was listed on the Toronto Stock Exchange between the
Completion date and May 2016. Immediately prior to completion of the Acquisition, Oando PLC and the Oando Exploration and Production Division first
entered into a reorganization transaction (the ‚Oando Reorganization‛) with the purpose of facilitating the transfer of the OEPD interests to OER (formerly
Exile).
Page 22 of 109

OANDO PLC
Annual Consolidated and Separate Financial Statements
Notes to the consolidated and separate financial statements
For the year ended 31 December 2017
3. Changes in accounting policies and disclosures
Amendments to IAS 7 Statement of Cash Flows: Disclosure Initiative
A number of new standards and amendments to standards and interpretations are effective for annual periods beginning after 1 January 2017, and have not
been applied in preparing these consolidated financial statements. None of these is expected to have significant effect on the consolidated financial
statements of the Group, except the following set out below:
IFRS 2 Classification and Measurement of Share-based Payment Transactions (Amendments to IFRS 2)
The IASB issued amendments to IFRS 2 Share-based Payment that address three main areas: the effects of vesting conditions on the measurement of a cash-
settled share-based payment transaction; the classification of a share-based payment transaction with net settlement features for withholding tax obligations;
and accounting where a modification to the terms and conditions of a share-based payment transaction changes its classification from cash settled to equity
settled.
On adoption, entities are required to apply the amendments without restating prior periods, but retrospective application is permitted if elected for all three
amendments and other criteria are met. The amendments are effective for annual periods beginning on or after 1 January 2018, with early application
permitted. These amendments are not expected to have any impact on the Group.
Transfers of Investment Property (Amendments to IAS 40)
Effective for annual periods beginning on or after 1 January 2018.
The amendments clarify when an entity should transfer property, including property under construction or development into, or out of investment property. The
amendments state that a change in use occurs when the property meets, or ceases to meet, the definition of investment property and there is evidence of the
change in use. A mere change in management’s intentions for the use of a property does not provide evidence of a change in use. These amendments are
not expected to have any impact on the Group.
IFRIC Interpretation 22 Foreign Currency Transactions and Advance Consideration
Effective for annual periods beginning on or after 1 January 2018.
The interpretation clarifies that in determining the spot exchange rate to use on initial recognition of the related asset, expense or income (or part of it) on the
derecognition of a non-monetary asset or non-monetary liability relating to advance consideration, the date of the transaction is the date on which an entity
initially recognises the non-monetary asset or non-monetary liability arising from the advance consideration. If there are multiple payments or receipts in
advance, then the entity must determine a date of the transactions for each payment or receipt of advance consideration. These amendments are not
expected to have any impact on the Group.
The amendments clarify that an entity needs to consider whether tax law restricts the sources of taxable profits against which it may make deductions on the
reversal of that deductible temporary difference. Furthermore, the amendments provide guidance on how an entity should determine future taxable profits and
explain the circumstances in which taxable profit may include the recovery of some assets for more than their carrying amount.
Entities are required to apply the amendments retrospectively. However, on initial application of the amendments, the change in the opening equity of the
earliest comparative period may be recognised in opening retained earnings (or in another component of equity, as appropriate), without allocating the
change between opening retained earnings and other components of equity. Entities applying this relief must disclose that fact. If an entity applies the
amendments for an earlier period, it must disclose that fact. These amendments do not have any impact on the Group.
Amendments to IFRS 12 Disclosure of Interests in Other Entities: Clarification of the scope of disclosure requirements in IFRS 12
The amendments clarify that the disclosure requirements in IFRS 12, other than those in paragraphs B10”B16, apply to an entity’s interest in a subsidiary, a
joint venture or an associate (or a portion of its interest in a joint venture or an associate) that is classified (or included in a disposal group that is classified) as
held for sale. These amendments do not have any impact on the Group.
b) New standards, amendments and interpretations issued and not effective for the financial year beginning 1 January 2017
a) New standards, amendments and interpretations adopted by the Group
The Group applied for the first time certain standards and amendments, which are effective for annual periods beginning on or after 1 January 2017. The
Group has not early adopted any other standard, interpretation or amendment that has been issued but is not yet effective.
Although these new standards and amendments were applied for the first time in 2017, they did not have a material impact on the annual consolidated
financial statements of the Group. The nature and the impact of each new standard or amendment is described below:
The amendments to IAS 7 Statement of Cash Flows are part of the IASB’s Disclosure Initiative and require an entity to provide disclosures that enable users of
financial statements to evaluate changes in liabilities arising from financing activities, including both changes arising from cash flows and non-cash changes
(such as foreign exchange gains or losses). On initial application of the amendment, entities are not required to provide comparative information for preceding
periods. The Group has provided the information for the current period in note 36b.
Amendments to IAS 12 Income Taxes: Recognition of Deferred Tax Assets for Unrealised Losses
Page 23 of 109

OANDO PLC
Annual Consolidated and Separate Financial Statements
Notes to the consolidated and separate financial statements
For the year ended 31 December 2017
'IFRS 9, ‘Financial instruments
For all other debt instruments other than trade receivables, the Group will apply general approach under which financial assets are classified into three stages
i.e. stage 1, stage 2 or stage 3 depending on whether or not the credit risk of the financial asset has increased significantly. The Group has determined that,
due to the unsecured nature of its loans and receivables, the loss allowance will increase with corresponding related decrease in the deferred tax liability. The
impact proposed is an estimated figure which is likely to change when the Group implements the standard.
(a) Classification and measurement
The Group does not expect a significant impact on its statement of financial position or equity on applying the classification and measurement requirements of
IFRS 9.
Debt instruments classified as loans and receivables
Under IAS 39, the Group has the following debt instruments which are classified under loans and receivables:
“ Trade receivables
“ Loan notes
“ Receivables from related parties
“ Dues from bankers on realized portion of commodity contracts
“ ConocoPhillips Acquisition consent refund
“ Underlift receivables
“ Bank balancesThese debt instruments are held to collect contractual cash flows and are expected to give rise to cash flows representing solely payments of principal and
interest. The Group analysed the contractual cash flow characteristics of those instruments and concluded that they meet the criteria for amortised cost
measurement under IFRS 9. Therefore, reclassification of these instruments is not required. In addition, the measurement basis for these debt instruments will
continue to be amortised cost, thus leading to no change in the current practice.
Available for sale equity investments
The Group has investments in quoted equity shares. It expects to continue measuring at fair value all financial assets currently held at fair value. The quoted
equity shares are currently held as available-for-sale with gains and losses recorded in other comprehensive income (OCI). On transition to IFRS 9, Quoted
equity shares, classified as current assets, currently held as available-for-sale (AFS) with gains and losses recorded in OCI will be measured at fair value
through profit or loss, which will increase volatility in recorded profit or loss. The AFS reserve related to those securities in amount, which is currently
presented as accumulated OCI, will be reclassified to retained earnings. The equity shares classified as non -current are intended to be held for the
foreseeable future. The Group will apply the option to present fair value changes in OCI, and, therefore, the application of IFRS 9 will not have a significant
impact.
The Group recognised impairment loss on these equity investments up to 31 December 2017. The carrying amounts of these investments (after adjusting for
the impairment loss) will be compared with the fair value at 1 January 2018 with appropriate adjustment recognised. There is no impairment for equity
investments measured at fair value under IFRS 9.
Loan notes
Loan notes are held to collect contractual cash flows and are expected to give rise to cash flows representing solely payments of principal and interest. The
Group analysed the contractual cash flow characteristics of the instrument and concluded that the debt instruments meet the criteria for amortised cost
measurement under IFRS 9. Therefore, reclassification for the instrument is not required.
(b) Impairment
IFRS 9 requires the Group to record expected credit losses on all of its debt securities, loans, trade receivables, lease receivables and contract assets, either
on a 12-month or lifetime basis. The Group will apply the simplified approach and record lifetime expected losses on all trade receivables and contract assets
that do not have significant financing component. The Group have opted to apply simplified approach for all lease receivables. The Group has determined
that, due to the unsecured nature of its loans and receivables, the loss allowance will increase with corresponding related decrease in the deferred tax liability
or increase in the deferred tax asset.
In July 2014, the IASB issued the final version of IFRS 9 Financial Instruments that replaces IAS 39 and all previous versions of IFRS 9. IFRS 9 brings together
all three aspects of the accounting for financial instruments project: classification and measurement, impairment and hedge accounting. IFRS 9 is effective for
annual periods beginning on or after 1 January 2018, with early application permitted. Except for hedge accounting, retrospective application is required, but
the provision of comparative information is not compulsory. For hedge accounting, the requirements are generally applied prospectively, with some limited
exceptions.
The Group plans to adopt the new standard on the required effective date and will not restate comparative information.
Shortly before finalising the 2017 financial statements, the Group performed a detailed impact assessment of all three aspects of IFRS 9. This assessment is
based on currently available information and may be subject to changes arising from further reasonable and supportable information being made available to
the Group in 2018 when the Group will adopt IFRS 9.
Overall, the Group expects no significant impact on its statement of financial position and equity except for the effect of applying the impairment requirements
of IFRS 9.
The Group expects an increase in the loss allowance resulting in a negative impact on equity as discussed below. In addition, the Group will implement
changes in classification of certain financial instruments.
Page 24 of 109

OANDO PLC
Annual Consolidated and Separate Financial Statements
Notes to the consolidated and separate financial statements
For the year ended 31 December 2017
IFRS 15, ‘Revenue from contracts with customers’
IFRS 15 defines a customer ‚as a party that has contracted with an entity to obtain goods or services that are an output of the entity’s ordinary activities in
exchange for consideration. Thus, the group’s assessment reveals that vendor-customer relationship does not exist between the Group and its JV partners.
Adoption of IFRS 15 by the Group is not expected to have any impact on the Group’s revenue and profit or loss. 15.
(ii) Contract enforceability and termination clauses
On a timely basis, the Group enters into contracts with its customers through the JO operator designated to act as the administrator to deliver goods. In these
contracts, termination clauses are clearly specified. The Group has entered into a valid contract for all signed Agreement and remains binding on the
contracting parties for the specified contract duration without any simple termination clause because both parties to the contract have present enforceable
rights and obligations throughout the contract period. Under the current standard, the assessment of termination clauses is not of paramount importance as
revenue is recognised based on the volume of products delivered. Thus, the Group recognizes revenue when risk and reward passes to the buyer as
products are delivered to the buyer.
IFRS 15 explains that a contract does not exist if each party to the contract has the unilateral enforceable right to terminate a wholly unperformed contract
without compensating the other party (or parties). Additionally, for implied contracts, the Group may be required to account for contracts with stated terms as
month-to-month (or possibly a shorter duration) contracts if the parties can terminate the contract without penalty. For sale of gas, crude oil and energy
charge.
The Group’s revenue assessment under IFRS 15 clearly shows that the contracts are binding on all parties throughout the duration of the contract and as such
contract period is as stated in the contract. The Group is expected to measure its revenue under IFRS 15 overtime using a measure of progress. However,
adoption of IFRS 15 by the Group is not expected to have any impact on the Group’s revenue and profit or loss. Measuring progress using output method (as
anticipated) is not expected to be significantly different from revenue recognised under the current standard. The Group will need develop clear accounting
policy to evaluate termination clauses and any related termination payments (if any).
(c) Hedge accounting
Although IFRS 9 does not change the general principles of how an entity accounts for effective hedges, the Group does not apply hedge accounting. As
such, this aspect of IFRS 9 will not have impact on the Group.
(d) Other adjustments
In addition to the adjustments described above, on adoption of IFRS 9, other items of the primary financial statements such as deferred taxes will be adjusted
as necessary.
IFRS 15 was issued in May 2014, and amended in April 2016, and establishes a five-step model to account for revenue arising from contracts with customers.
Under IFRS 15, revenue is recognised at an amount that reflects the consideration to which an entity expects to be entitled in exchange for transferring goods
or services to a customer.
The new revenue standard will supersede all current revenue recognition requirements under IFRS. Either a full retrospective application or a modified
retrospective application is required for annual periods beginning on or after 1 January 2018. Early adoption is permitted. The Group plans to adopt the new
standard on the required effective date using the either of the methods which will be selected during the implementation phase.
Shortly before finalising the 2017 financial statements, the Group performed a detailed assessment of IFRS 15 and the outcome of this assessment is
described below.
The Group is in the business of exploration, production, pipeline construction, supply and delivery of petroleum products, crude oil and natural gas resource.
The goods are sold on their own in separate identified contracts with customers.
The key issues identified, and the Group’s views and perspectives, are set out below. These are based on the Group’s current interpretation of IFRS 15 and
may be subject to changes as interpretations evolve more generally. Furthermore, the Group is considering and will continue to monitor any further
development.
A. Sale of goods
For contracts with customers in which the sale of Crude oil, gas, energy and sale of petroleum products is generally expected to be the only performance
obligations. The Group expects the revenue recognition to occur over time when control of the asset is transferred to the customer, generally on delivery of the
goods.
To date, the Group has identified the following issues that require consideration
(i) Collaborative arrangements
The Group is into exploration, production and sale of crude oil and natural gas resources in a joint operation with other joint operation (JO) partners. From time
to time the Group enters into contracts with its customers through the JO operator designated to act as the administrator to deliver goods. In these contracts,
the Group, being a participant in a joint operation will recognise revenue from contracts with customers under IFRS 15 based on its actual sales to customers
in that period. No adjustments will be recorded in revenue to account for any variance between the actual share of production volumes sold to date and the
share of production which the party has been entitled to sell to date. The Group will adjust production costs to align volumes for which production costs are
recognised with volumes sold. Therefore, under the current standard, the Group’s concluded that its JO partners are not customers. The Group excludes
transactions arising from arrangements where the parties are participating in an activity together and share the risks and benefits of that activity.
Page 25 of 109

OANDO PLC
Annual Consolidated and Separate Financial Statements
Notes to the consolidated and separate financial statements
For the year ended 31 December 2017
(v) Series of distinct goods and services
For the sale of gas and energy, the Group delivers its promised goods to customers in volumes depending on annual contract quantity and all variations
provided by the contract.
Under IFRS 15, a series of distinct goods or services has the same pattern of transfer to the customer if both of the following criteria are met:
“ each distinct good or service in the series that the entity promises to transfer to the customer would meet the criteria in revenue recognition over time to be a
performance obligation satisfied overtime; and
“ the same method would be used to measure the entity’s progress towards complete satisfaction of the performance obligation to transfer each distinct good
or service in the series to the customer.
The Group currently does not assess its promises as series of goods. Unit delivered are applied to the price to recognise revenue as any point the volumes
are delivered. However, under IFRS 15, the Group will need to recognize its revenue over time with an appropriate measure of progress. This measure will be
most likely be based on volumes delivered. By implication, the envisaged impact may be considerably low as the Group currently recognises revenue when
risk and reward passes to the buyer as products are delivered to the buyer. The Group will need develop clear accounting policy on series performance
obligations.
(vi) Variable consideration
Some contracts with customers provide variability in price and quantity to be delivered. Currently, the Group recognises revenue from the sale
of goods measured at the fair value of the consideration received or receivable, net of returns and allowances. If revenue cannot be reliably
measured, the Group defers revenue recognition until the uncertainty is resolved. Such provisions give rise to variable consideration under
IFRS 15, and will be required to be estimated at contract inception and updated thereafter.
IFRS 15 requires the estimated variable consideration to be constrained to prevent over-recognition of revenue .The Group expects that
application of the constraint will result in more revenue being deferred than under current IFRS.
(iii) Collectability issues ” River State Government (RSG)
The Group has a contract with RSG through a joint operation arrangement to deliver natural gas at the agreed delivery point. Under the current accounting
policy, the Group recognises revenue from the sale of gas measured at the fair value of the consideration received or receivable. The Group recognises
revenue and a corresponding impairment loss when it realises that it is not probable that it will collect the amount to which it will be entitled.
Under IFRS 15, the group assesses the customer’s ability and intent to pay the amount of consideration to which it will be entitled in exchange for the goods
that will be transferred to the customer. The Group concluded that since it is not probable that the Group will collect amounts to which it is entitled, the model
in IFRS 15 will not be applicable to the contract with RSG until the concerns about collectability have been resolved. There will be no adjustment that will
impact retained earnings at the reporting date.
(iv) Distinct goods and services
For Crude oil contracts, the Group delivers its promised goods to customers as a separate performance obligations and the Group always recognise the
transaction price as revenue when those goods are transferred to the customer.
Under IFRS 15, a good or service that is promised to a customer is distinct if both of the following criteria are met:
a) the customer can benefit from the good or service either on its own or together with other resources that are readily available to the customer (i.e. the good
or service is capable of being distinct); and
b) the entity’s promise to transfer the good or service to the customer is separately identifiable from other promises in the contract (i.e. the good or service is
distinct within the context of the contract).The Group currently does not assess its promises as distinct goods. Unit delivered are applied to the price to
recognise revenue as any point the volumes are delivered. However, under IFRS, the Group will need to determine whether the goods is capable of being
distinct at contract inception.
In line with IFRS 15, the crude transferred are distinct goods transferred at a point in time and revenue should be recognised when control passes to the
customer.
By implication, the envisaged impact may be considerably low as the Group currently recognises revenue when risk and reward passes to the buyer as
products are delivered to the buyer. The point at which risk and reward of ownership is transferred as assessed under the current standard is not different
from the point at which control is transferred as assessed under IFRS 15. However, the Group will need develop a clear accounting policy on distinct
performance obligations.
Page 26 of 109

OANDO PLC
Annual Consolidated and Separate Financial Statements
Notes to the consolidated and separate financial statements
For the year ended 31 December 2017
Examples of revenue contracts to which this concept applies are stated below:
(vii) Measuring Progress
The Group has entered into a valid contract for all signed revenue agreement and remains binding on the contracting parties for the specified contract
duration without any simple termination clause because both parties to the contract have present enforceable rights and obligations throughout the contract
period. Under the current accounting policy, the Group currently recognises revenue when risk and reward pass to the buyer as products are delivered to the
buyer.
IFRS 15 explains that when the Group has determined that a performance obligation is satisfied over time, the standard requires the Group to select a single
revenue recognition method for the relevant performance obligation that faithfully depicts the Group’s performance in transferring control of the goods or
services. In addition, the Group should apply the method selected consistently to similar performance obligations. Hence, at the end of each reporting period,
an entity is required to re-measure its progress toward completion of the performance obligation. On adoption of IFRS 15, the Group is not expected to have
any impact on its revenue and profit or loss. Measuring progress using output method (as anticipated) is not expected to be significantly different from
revenue recognised under the current standard. However, the Group will need develop clear accounting policy initiative for determining the appropriate
method for measuring progress.
B. Rendering of services
The Group’s technical service segment provides technical services. For contracts with customers in which the rendering of technical services is generally
expected to be the only performance obligation, adoption of IFRS 15 is not expected to have any impact on the Group’s revenue and profit or loss.
To date, the Group has identified the following issues that require consideration:
(i) Scope ” Completed Contract
The Group has completed the performance of providing technical services to its customers before the date of initial application of IFRS 15, even though it’s
yet to receive its full consideration.
IFRS 15 permit an entity: (a) under the full retrospective method, not to restate contracts that are completed contracts at the beginning of the earliest period
presented; (b) under the modified retrospective method, to either apply IFRS 15 to only contracts that are not completed contracts at the date of initial
application; or to all contracts including completed contracts at the date of initial application;
Adoption of IFRS 15 by the Group is not expected to have any impact on the Group’s revenue and profit or loss. Depending on the manner in which the Group
elects to transition to IFRS 15, it may not need to apply IFRS 15 to technical services and financing arrangement contracts.
C. Principal versus agent considerations
The Group is into exploration, production and sale of crude oil and natural gas resources in a joint arrangement with other JO partners. From time to time the
Group enters into contracts with its customers through the JO operator designated to act as the administrator to deliver goods. In these contracts, the Group
is considered to be primarily responsible for fulfilling the promise to deliver the goods that relates to the proportion of it participating interests in the supply
area. The Group does have inventory risk relating to its interest in the joint venture’s operation before the specified product is been transferred to the
customer. In addition, the Group establishes the price for the specified goods. Therefore, the Group’s consideration in these contracts is determined to be the
gross amount to which it expects to be entitled.
“ Market based fees ” provisionally priced contracts
For crude oil contracts, the transaction price is not fixed. A portion of the Group’s transaction price depends on indexes whose outcome are uncertain.
Under the current standard, the Group does not recognize revenue immediately control has been passed to the Customer but wait for few days when
transaction price based on some future specific indexes have been obtained.
Under IFRS 15, entities will need to estimate the transaction price, particularly when it includes variable consideration. Crude oil contracts will include
provisional pricing at the time of lifting/shipment, with final pricing based on the market price for a particular period. Upon evaluation, the Group determines
that the inclusion of such indexes in the contracts represents variable consideration. However, under IFRS 15 further judgement will be required to constrain
the estimated transaction price. Additionally, since the price is conditional upon an index which is likely to be an embedded derivative, judgement will be
required to identify the point at which the variable consideration becomes unconditional, and is then considered a financial asset within the scope of IFRS
9/IAS 39.
The Group applied the requirements in IFRS 15 on constraining estimates of variable consideration and concluded that an adjustment to increase revenue for
sale of goods with a corresponding impact on equity. However, IFRS 15 states that if a contract is partially within scope of this standard and partially in the
scope of another standard, an entity will first apply the separation and measurement requirements of the other standard(s). Therefore, to the extent that
provisional pricing features are considered to be in the scope of another standard, they will be outside the scope of IFRS 15 and entities will be required to
account for these in accordance with IFRS 9. Any subsequent changes that arise due to differences between initial and final estimate will still be considered
within the scope of IFRS 15 and will be subject to the constraint on estimates of variable consideration. Revenue in respect of the host contract will be
recognised when control passes to the customer (which has been determined to be the same point in time, i.e., when the crude oil passes the ship’s rail) and
will be measured at the amount the entity expects to be entitled ” being the estimate of the price expected to be received at the end of the quotational period,
i.e., using the most recently determined estimate of Brent element in crude (which is not consistent with the current practice). The Group will need develop a
clear accounting policy on variable consideration.
Page 27 of 109

OANDO PLC
Annual Consolidated and Separate Financial Statements
Notes to the consolidated and separate financial statements
For the year ended 31 December 2017
D. Presentation and disclosure requirements
The presentation and disclosure requirements in IFRS 15 are more detailed than under current IFRS. The presentation requirements represent a significant
change from current practice and significantly increases the volume of disclosures required in the Group’s financial statements. Many of the disclosure
requirements in IFRS 15 are new and the Group has assessed that the impact of some of these disclosures requirements will be significant. In particular, the
Group expects that the notes to the financial statements will be expanded because of the disclosure of significant judgements made: when determining the
transaction price of those contracts that include variable consideration. Also, extended disclosures are expected as a result of the significant judgement made
when assessing the contracts where the Group has concluded that: certain revenue-generating collaborative arrangements would be within the scope of IFRS
15, it acts as a principal instead of an agent. In addition, as required by IFRS 15, the Group will disaggregate revenue recognised from contracts with
customers into categories that depict how the nature, amount, timing and uncertainty of revenue and cash flows are affected by economic factors. It will also
disclose information about the relationship between the disclosure of disaggregated revenue and revenue information disclosed for each reportable segment.
In 2017 the Group continued testing of appropriate systems, internal controls, policies and procedures necessary to collect and disclose the required
information.
IFRS 16 Leases
IFRS 16 was issued in January 2016 and it replaces IAS 17 Leases, IFRIC 4 Determining whether an Arrangement contains a Lease, SIC-15 Operating Leases-
Incentives and SIC-27 Evaluating the Substance of Transactions Involving the Legal Form of a Lease. IFRS 16 sets out the principles for the recognition,
measurement, presentation and disclosure of leases and requires lessees to account for all leases under a single on-balance sheet model similar to the
accounting for finance leases under IAS 17. The standard includes two recognition exemptions for lessees: leases of ’low-value’ assets (e.g., personal
computers); and short-term leases (i.e., leases with a lease term of 12 months or less). At the commencement date of a lease, a lessee will recognise a liability
to make lease payments (i.e., the lease liability) and an asset representing the right to use the underlying asset during the lease term (i.e., the right-of-use
asset). Lessees will be required to separately recognise the interest expense on the lease liability and the depreciation expense on the right-of-use asset.
Lessees will be also required to re-measure the lease liability upon the occurrence of certain events (e.g., a change in the lease term, a change in future lease
payments resulting from a change in an index or rate used to determine those payments). The lessee will generally recognise the amount of the re-
measurement of the lease liability as an adjustment to the right-of-use asset.
Lessor accounting under IFRS 16 is substantially unchanged from today’s accounting under IAS 17. Lessors will continue to classify all leases using the same
classification principle as in IAS 17 and distinguish between two types of leases: operating and finance leases.
IIFRS 16 also requires lessees and lessors to make more extensive disclosures than under IAS 17.
IFRS 16 is effective for annual periods beginning on or after 1 January 2019. Early application is permitted, but not before an entity applies IFRS 15. A lessee
can choose to apply the standard using either a full retrospective or a modified retrospective approach. The standard’s transition provisions permit certain
reliefs.
The Group currently has an existing operating lease arrangement which is as follows:
Building
During the year the Group performed an impact assessment and assessed that, due to the differences between the accounting requirements for operating
leases in IAS 17 and the requirements for lease accounting by lessees in IFRS 16, that the impact is likely to be significant. The Group currently recognises
the prepaid amount for the lease as its current and non-current assets and expense the lease payment annually.
At the commencement date of the building, the Group will recognise a liability to make lease payments (i.e., the lease liability) and an asset representing the
right to use the underlying asset during the lease term (i.e., the right-of-use asset). The Group will be required to separately recognise the interest expense on
the lease liability and the depreciation expense on the right-of-use asset.
The Group will also be required to remeasure the lease liability upon the occurrence of certain events (e.g., a change in the lease term, a change in future
lease payments resulting from a change in an index or rate used to determine those payments). The lessee will generally recognise the amount of the re-
measurement of the lease liability as an adjustment to the right-of-use asset.
Under the current accounting policy, based on the existence of credit risk and the nature of the consideration in the contract, the Group concluded that it has
an exposure to the significant risks and rewards associated with the sale of goods to its customers, and accounted for the contracts as if it is a principal.
IFRS 15 requires assessment of whether the Group controls a specified good or service before it is transferred to the customer. The Group has determined
that it controls the goods before they are transferred to customers, and hence, is a principal rather than an agent in these contracts. In addition, the Group
concluded that it transfers control over its sales over time. Adoption of IFRS 15 by the Group is not expected to have any impact on the Group’s revenue and
profit or loss.
Page 28 of 109

OANDO PLC
Annual Consolidated and Separate Financial Statements
Notes to the consolidated and separate financial statements
For the year ended 31 December 2017
Following is a summary of the amendments from the 2015-2017 annual improvements cycle.
IFRS 3 Business Combinations
Previously held interests in a joint operation
“ The amendments clarify that, when an entity obtains control of a business that is a joint operation, it applies the requirements for a business combination
achieved in stages, including remeasuring previously held interests in the assets and liabilities of the joint operation at fair value.
“ In doing so, the acquirer remeasures its entire previously held interest in the joint operation.
“ An entity applies those amendments to business combinations for which the acquisition date is on or after the beginning of the first annual reporting period
beginning on or after 1 January 2019. Earlier application is permitted. The Group is assessing the potential effect of the amendments on its consolidated
financial statements.
Following is a summary of the amendments from the 2014-2016 annual improvements cycle.
IFRS 1 First-time Adoption of International Financial Reporting Standards
Deletion of short-term exemptions for first-time adopters
“ Short-term exemptions in paragraphs E3”E7 of IFRS 1 were deleted because they have now served their intended purpose.
“ The amendment is effective from 1 January 2018.
This is not applicable to the Group.
IAS 28 Investments in Associates and Joint Ventures
Clarification that measuring investees at fair value through profit or loss is an investment-by investment choice
“ The amendments clarifies that:
An entity that is a venture capital organisation, or other qualifying entity, may elect, at initial recognition on an investment-by-investment basis, to measure its
investments in associates and joint ventures at fair value through profit or loss.
If an entity that is not itself an investment entity has an interest in an associate or joint venture that is an investment entity, the entity may, when applying the
equity method, elect to retain the fair value measurement applied by that investment entity associate or joint venture to the investment entity associate’s or
joint venture’s interests in subsidiaries. This election is made separately for each investment entity associate or joint venture, at the later of the date on which
(a) the investment entity associate or joint venture is initially recognised; (b) the associate or joint venture becomes an investment entity; and (c) the
investment entity associate or joint venture first becomes a parent.
“ The amendments should be applied retrospectively and are effective from 1 January 2018, with earlier application permitted. If an entity applies those
amendments for an earlier period, it must disclose that fact. The Group is still assessing the impact of this amendment.
(e) Annual Improvements 2015-2017 Cycle
In June 2017, the IASB issued IFRIC Interpretation 23 Uncertainty over Income Tax Treatments which clarifies application of the recognition and measurement
requirements in IAS 12 Income Taxes when there is uncertainty over income tax treatments.
The interpretation addresses the accounting for income taxes when tax treatments involve uncertainty that affects the application of IAS 12. The interpretation
does not apply to taxes or levies outside the scope of IAS 12, nor does it specifically include requirements relating to interest and penalties associated with
uncertain tax treatments.
An entity has to determine whether to consider each uncertain tax treatment separately or together with one or more other
uncertain tax treatments. The approach that better predicts the resolution of the uncertainty should be followed. The interpretation is effective for annual
reporting periods beginning on or after 1 January 2019, but certain transition reliefs are available. In 2018, the Group plans to assess the potential effect of
this on its consolidated financial statements.
(c) New and amended standards and interpretations that do not relate to the Group
- Applying IFRS 9 Financial Instruments with IFRS 4 Insurance Contracts - Amendments to IFRS 4 - Effective 1 January 2018
- Long-term Interests in Associates and Joint Ventures - Amendments to IAS 28 Effective 1 January 2019
- IFRS 17 Insurance Contracts - Effective 1 January 2021
- Ammendments to IAS 19 Employee Benefits -The amendments apply to plan amendments, curtailments or settlements that occur on or after 1 January 2019,
with earlier application permitted.
-Amendments to IFRS 10 and IAS 28: Sale or Contribution of Assets between an Investor and its Associate or Joint Venture - The IASB has deferred the
effective date of these amendments indefinitely, but an entity that early adopts the amendments must apply them prospectively.
(d) Annual Improvements 2014-2016 Cycle
IFRS 16 also requires the Group to make more extensive disclosures than under IAS 17. The Group can choose to apply the standard using either a full
retrospective or a modified retrospective approach. The standard’s transition provisions permit certain reliefs.
In 2018, the Group will continue to assess the potential effect of IFRS 16 on its consolidated financial statements.
IFRIC Interpretation 23 Uncertainty over IncomeTax Treatments
Page 29 of 109

OANDO PLC
Annual Consolidated and Separate Financial Statements
Notes to the consolidated and separate financial statements
For the year ended 31 December 2017
IFRS 11 Joint Arrangements
IAS 12 Income Taxes
IAS 23 Borrowing Costs
4. Basis of Consolidation
(i) Subsidiaries
The Group treats transactions with non-controlling interests that do not result in loss of control as equity transactions. For purchases from non-controlling
interests, the difference between fair value of any consideration paid and the relevant share acquired of the carrying value of net assets of the subsidiary is
recorded in equity. Gains or losses on disposals to non-controlling interests are also recorded in equity.
Cash flows arising from changes in ownership interests in a subsidiary that do not result in a loss of control are classified as cash flows from financing
activities.
The Group considers all facts and circumstances’, including the size of the Group’s voting rights relative to the size and dispersion of other vote holders in the
determination of control.
Identifiable assets acquired and liabilities and contingent liabilities assumed in a business combination are measured initially at their fair values at the
acquisition date. On an acquisition-by-acquisition basis, the Group recognises any non-controlling interest in the acquiree, either at fair value or at the non-
controlling interest’s proportionate share of the recognised amounts of acquiree’s identifiable net assets. Any contingent consideration to be transferred by
the Group is recognised at fair value at the acquisition date. Subsequent changes to the fair value of the contingent consideration that is deemed to be an
asset or liability is recognised in accordance with IAS 39 either in profit or loss or as a change to other comprehensive income. Contingent consideration that
is classified as equity is not re-measured, and its subsequent settlement is accounted for within equity.
Acquisition-related costs are expensed as incurred.
The excess of the consideration transferred, the amount of any non-controlling interest in the acquiree, and the acquisition date fair value of any previous
equity interest in the acquiree over the fair value of the identifiable net assets acquired is recorded as goodwill. If the total of consideration transferred, non-
controlling interest recognised and previously held interest is less than the fair value of the net assets of the subsidiary acquired in the case of a bargain
purchase, the difference is recognised directly in the statement of profit or loss.
Inter-company transactions, amounts, balances and income and expenses on transactions between Group companies are eliminated. Profits and losses
resulting from transactions that are recognised in assets are also eliminated. Accounting policies and amounts of subsidiaries have been changed where
necessary to ensure consistency with the policies adopted by the Group.
(ii) Changes in ownership interests in subsidiaries without change of control
Previously held interests in a joint operation
“ A party that participates in, but does not have joint control of, a joint operation might obtain joint control of the joint operation in which the activity of the joint
operation constitutes a business as defined in IFRS 3. The amendments clarify that the previously held interests in that joint operation are not remeasured.
“ An entity applies those amendments to transactions in which it obtains joint control on or after the beginning of the first annual reporting period beginning on
or after 1 January 2019. Earlier application is permitted. The Group is assessing the potential effect of the amendments on its consolidated financial
statements.
Income tax consequences of payments on financial instruments classified as equity
“ The amendments clarify that the income tax consequences of dividends are linked more directly to past transactions or events that generated distributable
profits than to distributions to owners. Therefore, an entity recognises the income tax consequences of dividends in profit or loss, other comprehensive income
or equity according to where the entity originally recognised those past transactions or events.
“ An entity applies those amendments for annual reporting periods beginning on or after 1 January 2019. Earlier application is permitted. When an entity first
applies those amendments, it applies them to the income tax consequences of dividends recognised on or after the beginning of the earliest comparative
period. The Group is assessing the potential effect of the amendments on its consolidated financial statements.
Borrowing costs eligible for capitalisation
“ The amendments clarify that an entity treats as part of general borrowings any borrowing originally made to develop a qualifying asset when substantially all
of the activities necessary to prepare that asset for its intended use or sale are complete.
“ An entity applies those amendments to borrowing costs incurred on or after the beginning of the annual reporting period in which the entity first applies
those amendments.
“ An entity applies those amendments for annual reporting periods beginning on or after 1 January 2019. Earlier application is permitted. The Group is
assessing the potential effect of the amendments on its consolidated financial statements.
Subsidiaries are all entities (including structured entities) over which the Group has power or control. The Group controls an entity when the Group is exposed
to, or has rights to, variable returns from its involvement with the entity and has the ability to use its power over the entity to affect the amount of the entity’s
return. Subsidiaries are fully consolidated from the date on which control is transferred to the Group. They are de-consolidated from the date that control
ceases.
In the separate financial statement, investment in subsidiaries is measured at cost less accumulated impairments. Investment in subsidiary is impaired when
its recoverable amount is lower than its carrying value and when there are indicators of impairments.
Page 30 of 109

OANDO PLC
Annual Consolidated and Separate Financial Statements
Notes to the consolidated and separate financial statements
For the year ended 31 December 2017
(iv) Investment in associates
(v) Joint arrangements
The group applies IFRS 11 to all joint arrangements as of 1 January 2013. Under IFRS 11 investments in joint arrangements are classified as either joint
operations or joint ventures depending on the contractual rights and obligations of each investor. Joint ventures are accounted for using the equity method.
Under the equity method of accounting, interests in joint ventures are initially recognised at cost and adjusted thereafter to recognise the Group’s share of the
post-acquisition profits or losses and movements in other comprehensive income. When the Group’s share of losses in a joint venture equals or exceeds its
interests in the joint ventures (which includes any long-term interests that, in substance, form part of the Group’s net investment in the joint ventures), the
Group does not recognise further losses, unless it has incurred obligations or made payments on behalf of the joint ventures.
Unrealised gains and losses on transactions between the Group and its joint ventures are eliminated to the extent of the Group’s interest in the joint ventures.
Unrealised losses are also eliminated unless the transaction provides evidence of an impairment of the asset transferred. Accounting policies of the joint
ventures have been changed where necessary to ensure consistency with the policies adopted by the Group.
For the arrangements determined to be joint operations, the Group recognises in relation to its interest the following:
- its assets, including its share of any assets held jointly;
- its liabilities, including its share of any liabilities incurred jointly;
- its share of the revenue from the sale of the output by the joint operation; and
- its expenses, including its share of any expenses incurred jointly.
The Group accounts for the assets, liabilities, revenues and expenses relating to its interest in a joint operation in accordance with the IFRSs applicable to the
particular assets, liabilities, revenues and expenses
(iii) Disposal of subsidiaries
When the Group ceases to have control, any retained interest in the entity is re-measured to its fair value at the date when control is lost, with the change in
carrying amount recognised in profit or loss. The fair value is the initial carrying amount for the purposes of subsequently accounting for the retained interest
as an associate, joint venture or financial asset. In addition, any amounts previously recognised in other comprehensive income in respect of that entity are
accounted for as if the Group had directly disposed of the related assets or liabilities. This may mean that amounts previously recognised in other
comprehensive income are reclassified to profit or loss.
Associates are all entities over which the Group has significant influence but not control. Investments in associates are accounted for using the equity method
of accounting. Under the equity method, the investment is initially recognised at cost, and the carrying amount is increased or decreased to recognise the
investor’s share of the change in the associate's net assets after the date of acquisition. The Group’s investment in associates includes goodwill identified on
acquisition.
If the ownership interest in an associate is reduced but significant influence is retained, only a proportionate share of the amounts previously recognised in
other comprehensive income is reclassified to profit or loss where appropriate.
The Group’s share of post-acquisition profit or loss is recognised in the statement of profit or loss, and its share of post-acquisition movements in other
comprehensive income is recognised in other comprehensive income with a corresponding adjustment to the carrying amount of the investment. When the
Group’s share of losses in an associate equals or exceeds its interest in the associate, including any other long term receivables, loans or unsecured
receivables, the Group does not recognise further losses, unless it has incurred legal or constructive obligations or made payments on behalf of the associate.
The Group determines at each reporting date whether there is any objective evidence that the investment in the associate is impaired. If this is the case, the
group calculates the amount of impairment as the difference between the recoverable amount of the associate and its carrying value and recognises the
amount adjacent to share of profit/(loss) of associates in the statement of profit or loss.
Profits and losses resulting from transactions between the Group and its associate are recognised in the Group’s financial statements only to the extent of
unrelated investor’s interests in the associates. Unrealised losses are eliminated unless the transaction provides evidence of an impairment of the asset
transferred.
Dilution gains and losses arising in investments in associates are recognised in the statement of profit or loss.
In the separate financial statements of the Company, investment in associates are measured at cost less impairment. Investment in associate is impaired
when its recoverable amount is lower than its carrying value.
Page 31 of 109
OANDO PLC
Annual Consolidated and Separate Financial Statements
Notes to the consolidated and separate financial statements
For the year ended 31 December 2017
(vi) Functional currency and translation of foreign currencies
(vii) Transactions and balances in Group entities
(viii) Consolidation of Group entities
- all resulting exchange differences are recognised in other comprehensive income.
On consolidation, exchange differences arising from the translation of the net investment in foreign entities are taken to other comprehensive income. When a
foreign operation is sold, such exchange differences are recognised in the profit or loss as part of the gain or loss on sale.
Goodwill and fair value adjustments arising on the acquisition of a foreign entity are treated as assets and liabilities of the foreign entity and translated at the
closing rate.
Functional and presentation currency
These consolidated financial statements are presented in Naira, which is the Group’s presentation currency. Items included in the financial statements of each
of the Group’s entities are measured using the currency of the primary economic environment in which the entity operates (‘the functional currency’).
The Company's functional and presenation currency is Naira.
Foreign currency transactions are translated into the functional currency of the respective entity using the exchange rates prevailing on the dates of the
transactions or the date of valuation where items are re-measured. Foreign exchange gains and losses resulting from the settlement of such transactions and
from the translation at year-end exchange rates of monetary assets and liabilities denominated in foreign currencies are recognised in the statement of profit
or loss except when deferred in other comprehensive income as qualifying cashflow hedges and qualifying net investment hedges. Foreign exchange gains
and losses that relate to borrowings and cash and cash equivalents are presented in the statement of profit or loss within ‘finance income or costs’. All other
foreign exchange gains and losses are presented in the statement of profit or loss within ‘other (losses)/gains ” net’. Changes in the fair value of monetary
securities denominated in foreign currency classified as available for sale are analysed between translation differences resulting from changes in the
amortised cost of the security and other changes in the carrying amount of the security. Translation differences related to changes in amortised cost are
recognised in profit or loss, and other changes in carrying amount are recognised in other comprehensive income. Translation differences on non-monetary
financial assets and liabilities such as equities held at fair value through profit or loss are recognised in profit or loss as part of the fair value gain or loss.
Translation differences on non-monetary financial assets, such as equities classified as available for sale, are included in other comprehensive income.
The results and financial position of all the Group entities (none of which has the currency of a hyperinflationary economy) that have a functional currency
different from the presentation currency are translated into the presentation currency as follows:
- assets and liabilities for each statement of financial position items presented, are translated at the closing rate at the reporting date;
- income and expenses for each statement of profit or loss are translated at average exchange rates where it is impracticable to translate using spot rate.
Where the average is not a reasonable approximation of the cumulative effect of the rates prevailing on the transaction dates, in which case the income and
expense are translated at a rate on the dates of the transactions; and
Transactions with other parties in the joint operations
When the Group enters into a transaction in a joint operation, such as a sale or contribution of assets, the Group recognises gains and losses resulting from
such a transaction only to the extent of its interests in the joint operation.
When such transactions provide evidence of a reduction in the net realisable value of the assets to be sold or contributed to the joint operation, or of an
impairment loss of those assets, those losses are recognised fully by the Group.
When the Group enters into a transaction with a joint operation in which it is a joint operator, such as a purchase of assets, the Group does not recognise its
share of the gains and losses until it resells those assets to a third party. When such transactions provide evidence of a reduction in the net realisable value of
the assets to be purchased or of an impairment loss of those assets, the Group recognises its share of those losses.
Page 32 of 109
OANDO PLC
Annual Consolidated and Separate Financial Statements
Notes to the consolidated and separate financial statements
For the year ended 31 December 2017
5. Other significant accounting policies
(a) Segment reporting
(b) Revenue recognition
(i) Sale of goods
Revenue from sales of oil, natural gas, chemicals and all other products is recognized at the fair value of consideration received or receivable, after deducting
sales taxes, excise duties and similar levies, when the significant risks and rewards of ownership have been transferred.
In Exploration & Production, transfer of risks and rewards generally occurs when the product is physically transferred into a vessel, pipe or other delivery
mechanism. For sales to refining companies, it is either when the product is placed on-board a vessel or delivered to the counterparty, depending on the
contractually agreed terms. For wholesale sales of oil products and chemicals it is either at the point of delivery or the point of receipt, depending on
contractual terms.
Revenue resulting from the production of oil and natural gas properties in which Oando has an interest with other producers is recognised on the basis of
Oando’s working interest (entitlement method).
Sales between subsidiaries, as disclosed in the segment information.
(ix) Business combinations and goodwill
Business combinations are accounted for using the acquisition method. The cost of an acquisition is measured as the aggregate of the consideration
transferred, which is measured at acquisition date fair value, and the amount of any non-controlling interests in the acquiree. For each business combination,
the Group elects whether to measure the non-controlling interests in the acquiree at fair value or at the proportionate share of the acquiree’s identifiable net
assets. Acquisition-related costs are expensed as incurred and included in administrative expenses.
When the Group acquires a business, it assesses the financial assets and liabilities assumed for appropriate classification and designation in accordance with
the contractual terms, economic circumstances and pertinent conditions as at the acquisition date. This includes the separation of embedded derivatives in
host contracts by the acquiree.
Any contingent consideration to be transferred by the acquirer will be recognised at fair value at the acquisition date. Contingent consideration classified as
an asset or liability that is a financial instrument and within the scope of IAS 39 Financial Instruments: Recognition and Measurement, is measured at fair value
with the changes in fair value recognised in the statement of profit or loss.
If the business combination is achieved in stages, the acquisition date carrying value of the acquirer's previously held equity interest in the acquiree is re-
measured to fair value at the acquisition date; any gains or losses arising from such re-measurement are recognised in profit or loss.
Goodwill is initially measured at cost (being the excess of the aggregate of the consideration transferred and the amount recognised for non-controlling
interests and any previous interest held over the net identifiable assets acquired and liabilities assumed). If the fair value of the net assets acquired is in
excess of the aggregate consideration transferred, the Group re-assesses whether it has correctly identified all of the assets acquired and all of the liabilities
assumed and reviews the procedures used to measure the amounts to be recognised at the acquisition date. If the reassessment still results in an excess of
the fair value of net assets acquired over the aggregate consideration transferred, then the gain is recognised in profit or loss.
After initial recognition, goodwill is measured at cost less any accumulated impairment losses. For the purpose of impairment testing, goodwill acquired in a
business combination is, from the acquisition date, allocated to each of the Group’s cash-generating units that are expected to benefit from the combination,
irrespective of whether other assets or liabilities of the acquiree are assigned to those units. Where goodwill has been allocated to a cash-generating unit
(CGU) and part of the operation within that unit is disposed of, the goodwill associated with the disposed operation is included in the carrying amount of the
operation when determining the gain or loss on disposal. Goodwill disposed in these circumstances is measured based on the relative values of the disposed
operation and the portion of the cash-generating unit retained.
Operating segments are reported in a manner consistent with internal reporting provided to the chief operating decision-maker. The chief operating decision-
maker, who is responsible for allocating resources and assessing performance of the operating segments, has been identified as the Group Leadership
Council (GLC).
Revenue is measured at the fair value of the consideration received or receivable for sales of goods and services, in the ordinary course of the Group’s
activities and is stated net of value-added tax (VAT), rebates and discounts and after eliminating sales within the Group. The Group recognises revenue when
the amount of revenue can be reliably measured, it is probable that future economic benefits will flow to the entity and when specific criteria have been met for
each of the Group’s activities as described below:
Page 33 of 109

OANDO PLC
Annual Consolidated and Separate Financial Statements
Notes to the consolidated and separate financial statements
For the year ended 31 December 2017
(ii) Rendering of services
(iii) Interest income
(iv) Dividend
(c) Property, plant and equipment
All categories of property, plant and equipment are initially recorded at cost. Buildings and freehold land are subsequently shown at fair value, based on
valuations by external independent valuers, less subsequent depreciation for buildings and plant & machinery. Valuations are performed with sufficient
regularity to ensure that the fair value of a revalued asset does not differ materially from its carrying amount. Any accumulated depreciation at the date of
revaluation is eliminated against the gross carrying amount of the asset, and the net amount is restated to the revalued amount of the asset. All other property,
plant and equipment are stated at historical cost less depreciation. Historical cost includes expenditure that is directly attributable to the acquisition of the
items.
Subsequent costs are included in the asset’s carrying amount or recognised as a separate asset, as appropriate, only when it is probable that future
economic benefits associated with the item will flow to the Group and the cost of the item can be measured reliably. The carrying amount of the replaced part
is derecognised. All other repairs and maintenance are charged to the statement of profit or loss during the financial period in which they are incurred.
Increases in the carrying amount arising on revaluation of property, plant & equipment are credited to other comprehensive income and shown as a
component of other reserves in shareholders' equity. Decreases that offset previous increases of the same asset are charged in other comprehensive income
and debited against other reserves directly in equity; all other decreases are charged to the statement of profit or loss. Revaluation surplus is recovered
through disposal or use of property plant and equipment. In the event of a disposal, the whole of the revaluation surplus is transferred to retained earnings
from other reserves. Otherwise, each year, the difference between depreciation based on the revalued carrying amount of the asset charged to the statement
of profit or loss, and depreciation based on the assets original cost is transferred from "other reserves" to "retained earnings".
Interest income is recognized using the effective interest method. When a loan or receivable is impaired, the Group reduces the carrying amount to its
recoverable amount, being the estimated future cash flows discounted at the original effective interest rate of the instrument, and continues unwinding the
discount as interest income. Interest income on impaired loans and receivables are recognised using the original effective interest rate.
Dividend income is recognised when the right to receive payment is established.
Services rendered are recognised in the period in which the services are rendered, by reference to the stage of completion of the specific transaction
assessed on the basis of the actual service provided as a proportion of the total services to be provided. The outcome of a transaction can be estimated
reliably when all the following conditions are satisfied:
(a) the amount of revenue can be measured reliably;
(b) it is probable that the economic benefits associated with the transaction will flow to the entity;
(c) the stage of completion of the transaction at the reporting date can be measured reliably; and
(d) the costs incurred for the transaction and the costs to complete the transaction can be measured reliably.
Page 34 of 109

OANDO PLC
Annual Consolidated and Separate Financial Statements
Notes to the consolidated and separate financial statements
For the year ended 31 December 2017
(d) Intangible assets
(a) Goodwill
(b) Computer software
(e) Impairment of non financial assets
In assessing value in use, the estimated future cash flows are discounted to their present value using a pre-tax discount rate that reflects current market
assessments of the time value of money and the risks specific to the asset. In determining fair value less costs of disposal, recent market transactions are
taken into account. If no such transactions can be identified, an appropriate valuation model is used. These calculations are corroborated by valuation
multiples, quoted share prices for publicly traded companies or other available fair value indicators.
Intangible assets that have an indefinite useful life or intangible assets not ready to use are not subject to amortisation and are tested annually for impairment.
Assets that are subject to amortisation are reviewed for impairment whenever events or changes in circumstances indicate that the carrying amount may not
be recoverable.
The Group assesses, at each reporting date, whether there is an indication that an asset may be impaired. If any indication exists, or when annual impairment
testing for an asset is required, the Group estimates the asset’s recoverable amount. An asset’s recoverable amount is the higher of an asset’s or CGU’s fair
value less costs of disposal and its value in use. The recoverable amount is determined for an individual asset, unless the asset does not generate cash
inflows that are largely independent of those from other assets or groups of assets in which case, it is included within the recoverable amount of those group
of assets. When the carrying amount of an asset or CGU exceeds its recoverable amount, the asset is considered impaired and is written down to its
recoverable amount.
Goodwill is tested annually for impairment or more frequently if events or changes in circumstances indicate a potential impairment. The carrying value of
goodwill is compared to the recoverable amount, which is the higher of value in use and the fair value less costs to sell. Any impairment is recognised
immediately as an expense and is not subsequently reversed. Gains and losses on disposal of an entity include the carrying amount of goodwill relating to the
entity sold.
Acquired computer software licences are capitalised on the basis of the costs incurred to acquire and bring to use the specific software. Software licenses
have a finite useful life and are carried at cost less accumulated amortisation. Amortisation is calculated using straight line method to allocate the cost over
their estimated useful lives of three to five years. The amortisation period and residual values are reviewed at each balance sheet date. Costs associated with
maintaining computer software programmes are recognised as an expense when incurred.
Where the cost of a part of an item of property, plant and equipment is significant when compared to the total cost, that part is depreciated separately based
on the pattern which reflects how economic benefits are consumed. The assets’ residual values and useful lives are reviewed, and adjusted if appropriate, at
each reporting period. An asset’s carrying amount is written down immediately to its estimated recoverable amount if the asset’s carrying amount is greater
than its estimated recoverable amount. Gains and losses on disposal of property, plant and equipment are determined by comparing proceeds with carrying
amount and are recognised within "operating profit/(loss)" in the statement of profit or loss .
Property, plant and equipment under construction is not depreciated until they are available for use.
Goodwill arises from the acquisition of subsidiaries and is initially measured at cost, being the excess of the aggregate of the consideration transferred and
the amount recognized for non-controlling interest and any interest previously held over the net identifiable assets acquired, liabilities assumed. Goodwill on
acquisitions of subsidiaries is included in intangible assets. After initial recognition, goodwill is measured at cost less any accumulated impairment losses.
Goodwill is allocated to cash-generating units (CGU’s) for the purpose of impairment testing. The allocation is made to those CGU’s expected to benefit from
the business combination in which the goodwill arose, identified according to operating segment. Each unit or group of units to which goodwill is allocated
represents the lower level within the entity at which the goodwill is monitored for internal management purposes.
Plant and machinery 8 ” 20 years (5 ” 121/2 %)
Equipment and motor vehicles 3 ” 5 years (20 ” 331/3 %)
Production wells Unit-of-production (UOP)
Freehold land is not depreciated. Depreciation on other assets is calculated using the straight line method to write down their cost or revalued amounts to
their residual values over their estimated useful lives as follows:
Buildings 20 ” 50 years (2 ” 5%)
Page 35 of 109

OANDO PLC
Annual Consolidated and Separate Financial Statements
Notes to the consolidated and separate financial statements
For the year ended 31 December 2017
(f) Financial instruments
Financial assets classification
Recognition and measurement
Purchases and sales of financial assets are recognised on the trade date, which is the date at which the Group commits to purchase or sell the asset.
Investments are initially recognised at fair value plus transaction costs for all financial assets not carried at fair value through profit or loss.
Financial assets carried at fair value through profit or loss are initially recognised at fair value, and transaction cost are expensed in the statement of profit or
loss.
Available for-sale financial assets and financial assets at fair value through profit or loss are subsequently carried at fair value.
Loans and receivables are subsequently carried at amortised cost using the effective interest method.
Realised and unrealised gains and losses arising from changes in the fair value of the ‘financial assets at fair value through profit or loss’ category are
included in the statement of profit or loss within "operating profit/(loss)" in the period in which they arise. Dividend income from financial assets at fair value
through profit or loss is recognised in the statement of profit or loss as part of other income when the Group's right to receive payment is established.
Changes in the fair value of monetary and non-monetary securities classified as available-for-sale are recognised in other comprehensive income. When
securities classified as available-for-sale are sold or impaired, the accumulated fair value adjustments are included in the statement of profit or loss as "gains
and losses from investment securities".
Derecognition
A financial asset (or, where applicable, a part of a financial asset or part of a group of similar financial assets) is primarily derecognised (i.e., removed from
the Group’s consolidated statement of financial position) when:
(i) The rights to receive cash flows from the asset have expired; or
(ii) The Group has transferred its rights to receive cash flows from the asset or has assumed an obligation to pay the received cash flows in full without
material delay to a third party under a ‘pass-through’ arrangement; and either (a) the Group has transferred substantially all the risks and rewards of the asset,
or (b) the Group has neither transferred nor retained substantially all the risks and rewards of the asset, but has transferred control of the asset.
When the Group has transferred its rights to receive cash flows from an asset or has entered into a pass-through arrangement, it evaluates if and to what
extent it has retained the risks and rewards of ownership. When it has neither transferred nor retained substantially all of the risks and rewards of the asset,
nor transferred control of the asset, the Group continues to recognise the transferred asset to the extent of the Group’s continuing involvement. In that case,
the Group also recognises an associated liability. The transferred asset and the associated liability are measured on a basis that reflects the rights and
obligations that the Group has retained.
Continuing involvement that takes the form of a guarantee over the transferred asset is measured at the lower of the original carrying amount of the asset and
the maximum amount of consideration that the Group could be required to repay.
The Group classifies its financial assets into the following categories: financial assets at fair value through profit or loss, loans and receivables and available-
for-sale financial assets. The classification depends on the purpose for which the investments were acquired. Management determines the classification of its
financial assets at initial recognition.
(i) Financial assets at fair value through profit or loss
This category has two sub-categories: financial assets held for trading, and those designated at fair value through profit or loss (FVTPL) at inception. A
financial asset is classified in this category if acquired principally for the purpose of selling in the short term or if so designated by directors. Derivatives are
also categorised as held for trading. Assets in this category are classified as current assets if they are either held for trading or are expected to be realised
within 12 months of the reporting date. Otherwise, they are classified as non-current. The Group's derivatives are categorized as FVTPL unless they are
designated as hedges and hedge accounting is applied; hedge accounting has not been applied for the Group’s derivatives in the periods presented.
(ii) Loans and receivables
Loans and receivables are non-derivative financial assets with fixed or determinable payments that are not quoted in an active market. They arise when the
Group provides goods or services and funding directly to a debtor with no intention of trading the receivable. They are included in current assets, except for
maturities greater than twelve months after the reporting date. These are classified as non-current assets. The Group’s loans and receivables comprise of non-
current receivables; trade and other receivables and cash and cash equivalents.
(iii) Available-for-sale financial assets
Available-for-sale financial assets are non-derivatives that are either designated in this category or not classified in any of the other categories. They are
included in non-current assets unless the Group intend to dispose of the investment within twelve months of the reporting date.
Page 36 of 109

OANDO PLC
Annual Consolidated and Separate Financial Statements
Notes to the consolidated and separate financial statements
For the year ended 31 December 2017
Derivative financial instruments
The amount of the allowance is the difference between the carrying amount and the present value of estimated future cash flows, discounted at the original
effective interest rate. If collection is expected within the normal operating cycle of the Group they are classified as current, if not they are presented as non-
current assets.
(ii) Assets classified as available for sale
The Group assess at the end of each reporting period whether there is objective evidence that a financial asset or group of financial assets is impaired. For
debt securities, the Group uses the criteria referred to in a) above. In the case of equity investment classified as available for sale, a significant or prolonged
decline in the fair share of the security below its cost is also evidence that the assets are impaired. If such evidence exists for available-for-sale financial
assets, the cumulative loss (measured as the difference between the acquisition cost and the current fair value, less any impairment loss on that financial
asset previously recognized in profit or loss) is removed from equity and recognized in profit or loss. Impairment losses recognized in the consolidated
statement of profit or loss on equity instruments are not reversed through the consolidated statement of profit or loss. If in a subsequent period, the fair value
of a debt instrument classified as available for sale increases and the increase can be objectively related to an event occurring after the impairment loss was
recognized in profit or loss, the impairment loss is reversed through the consolidated statement of profit or loss.
A derivative is a financial instrument or contract whose value changes in response to the change in a specified interest rate, financial instrument price,
commodity price, foreign exchange rate, index of prices or rates, credit rating or credit index, or other variable, provided in the case of a non-financial
variable that the variable is not specific to a party to the contract (sometimes called the 'underlying'); requires no initial net investment or an initial net
investment that is smaller than would be required for other types of contracts that would be expected to have a similar response to changes in market factors;
and is settled at a future date.
Derivatives are initially recognised at fair value on the date a derivative contract is entered into and are subsequently re-measured at their fair value. The
resulting gains or losses are recognised in profit or loss.
Impairment of financial assets
The Group assesses, at each reporting date, whether there is objective evidence that a financial asset or a group of financial assets is impaired. An
impairment exists if one or more events that has occurred since the initial recognition of the asset (an incurred ‘loss event’), has an impact on the estimated
future cash flows of the financial asset or the group of financial assets that can be reliably estimated. Evidence of impairment may include indications that the
debtors or a group of debtors is experiencing significant financial difficulty, default or delinquency in interest or principal payments, the probability that they
will enter bankruptcy or other financial reorganisation and observable data indicating that there is a measurable decrease in the estimated future cash flows,
such as changes in arrears or economic conditions that correlate with defaults.
(i) Assets carried at amortized cost
The Group assesses at the end of each reporting period whether there is objective evidence that a financial asset or group of financial assets is impaired. For
financial assets carried at amortised cost, the Group first assesses whether impairment exists individually for financial assets that are individually significant,
or collectively for financial assets that are not individually significant.
For loans and receivables category, the amount of loss is measured as the difference between the assets carrying amount and the present value of estimated
future cash flows (excluding future credit loss that have been incurred) discounted at the financial assets original effective interest rate. The carrying amount
of the asset is reduced and the amount of the loss is recognized in the consolidated statement of profit or loss. If a loan or held-to-maturity investment has a
variable interest rate, the discount rate for measuring any impairment loss is the current effective interest rate determined under the contract.
Objective subsequent decreases in impairment loss are reversed against previously recognized impairment loss in the consolidated statement of profit or
loss.
Receivables
Receivables are recognised initially at fair value and subsequently measured at amortised cost using the effective interest method less allowance for
impairment. An impairment allowance of receivables is established when there is objective evidence that the Group will not be able to collect all the amounts
due according to the original terms of receivables. Significant financial difficulties of the debtor, probability that debtor will enter bankruptcy and default or
delinquency in payment (more than 90 days overdue), are the indicators that a trade receivable is impaired. The carrying amount of the asset is reduced
through the use of an allowance account and the amount of the loss is recognised in the profit or loss within administrative costs. When a trade receivable is
uncollectible, it is written off against the allowance account for trade receivables. Subsequent recoveries of amounts previously written off are credited against
administrative costs in the consolidated statement of profit or loss.
Page 37 of 109

OANDO PLC
Annual Consolidated and Separate Financial Statements
Notes to the consolidated and separate financial statements
For the year ended 31 December 2017
Financial liabilities
Financial liabilities designated upon initial recognition at fair value through profit or loss are designated at the initial date of recognition, and only if the criteria
in IAS 39 are satisfied. The Group has not designated any financial liability at fair value through profit or loss.
Borrowings
Borrowings are recognised initially at fair value, net of transaction costs incurred. Borrowings are subsequently carried at amortised cost using the effective
interest method; any differences between proceeds (net of transaction costs) and the redemption value is recognised in the consolidated statement of profit
or loss over the period of the borrowings, using the effective interest method.
Borrowings are classified as current liabilities unless the Group has an unconditional right to defer settlement of the liability for at least twelve months after the
reporting date.
Borrowing costs
Borrowing costs are recognised as an expense in the period in which they are incurred, except when they are directly attributable to the acquisition,
construction or production of a qualifying asset, which are assets that necessarily take a substantial period of time to get ready for their intended use or sale.
These are added to the cost of the assets, until such a time as the assets are substantially ready for their intended use or sale.
Offsetting financial instruments
Financial assets and liabilities are offset and the net amount reported in the statement of financial position, when there is a legally enforceable right to offset
the recognised amounts and there is an intention to settle on a net basis or realise the asset and settle the liability simultaneously.
Initial recognition and measurement
Financial liabilities are classified, at initial recognition, as financial liabilities at fair value through profit or loss, loans and borrowings, payables, or as
derivatives designated as hedging instruments in an effective hedge, as appropriate.
All financial liabilities are recognised initially at fair value and, in the case of loans and borrowings and payables, net of directly attributable transaction costs.
The Group’s financial liabilities include trade and other payables, loans and borrowings including bank overdrafts, financial guarantee contracts and derivative
financial instruments.
Subsequent measurement
The measurement of financial liabilities depends on their classification, as described below:
Financial liabilities at fair value through profit or loss
Financial liabilities at fair value through profit or loss include financial liabilities held for trading and financial liabilities designated upon initial recognition as at
fair value through profit or loss.
Financial liabilities are classified as held for trading if they are incurred for the purpose of repurchasing in the near term. This category also includes derivative
financial instruments entered into by the Group that are not designated as hedging instruments in hedge relationships as defined by IAS 39. Separated
embedded derivatives are also classified as held for trading unless they are designated as effective hedging instruments.
Embedded derivatives
An embedded derivative is a component of a hybrid (combined) instrument that also includes a non-derivative host contract. An embedded derivative causes
some or all of the cash flows that otherwise would be required by the contract to be modified according to a specified interest rate, financial instrument price,
commodity price, foreign exchange rate, index of prices or rates or other variable (provided in the case of a non-financial variable that the variable is not
specific to a party to the contract).
An embedded derivative is only separated and reported at fair value with gains and losses being recognised in the profit or loss component of the statement
of comprehensive income when the following requirements are met:
- where the economic characteristics and risks of the embedded derivative are not clearly and closely related to those of the host contract.
- the terms of the embedded derivative are the same as those of a stand-alone derivative; and
- the combined contract is not held for trading or designated at fair value through profit or loss.
Page 38 of 109

OANDO PLC
Annual Consolidated and Separate Financial Statements
Notes to the consolidated and separate financial statements
For the year ended 31 December 2017
Derecognition
(g)
Group as a lessor
Leases where the Group does not transfer substantially all of the risks and benefits of ownership of the asset are classified as operating leases. Initial direct
costs incurred in negotiating an operating lease are added to the carrying amount of the leased asset and recognised over the lease term on the same basis
as rental income. Contingent rents are recognised as revenue in the period in which they are earned.
Under a finance lease substantially all the risks and rewards incindental to legal ownership are transferred to the lessee, and a lease receivable is recognized
which is equal to the net investment in the lease. The recognition of finance income shall be based on a pattern reflecting a constant periodic rate of return on
the lessor's net investment in the finance lease.
Payables
Payables are recognised initially at fair value and subsequently measured at amortised cost using the effective interest method. Payables are classified as
current if they are due within one year or less. If not, they are presented as non-current liabilities.
A financial liability is derecognised when the obligation under the liability is discharged or cancelled or expires. When an existing financial liability is replaced
by another from the same lender on substantially different terms, or the terms of an existing liability are substantially modified, such an exchange or
modification is treated as the derecognition of the original liability and the recognition of a new liability. The difference in the respective carrying amounts is
recognised in the statement of profit or loss.
Accounting for leases
Leases
The determination of whether an arrangement is, or contains, a lease is based on the substance of the arrangement at the inception of the lease. The
arrangement is, or contains, a lease if fulfilment is dependent on the use of a specific asset or assets and the arrangement conveys a right to use the asset (or
assets), even if that right is not explicitly specified in an arrangement. Leases in which a significant portion of the risks and rewards of ownership are retained
by the lessor are classified as operating leases.
Group as a lessee
Finance leases, which transfer substantially all of the risks and benefits incidental to ownership of the leased item to the Group, are capitalised at the
commencement of the lease at the fair value of the leased property or, if lower, at the present value of the minimum lease payments. Lease payments are
apportioned between finance charges and reduction of the lease liability to achieve a constant rate of interest on the remaining balance of the liability. Finance
charges are recognised in finance costs in the statement of profit or loss and other comprehensive income.
A leased asset is depreciated over the useful life of the asset. However, if there is no reasonable certainty that the Group will obtain ownership by the end of
the lease term, the asset is depreciated over the shorter of the estimated useful life of the asset and the lease term.
Operating lease payments are recognised as an operating expense in the statement of profit or loss and other comprehensive income on a straight line basis
over the lease term.
Embedded leases
All take-or-pay contracts and concession contracts are reviewed at inception to determine whether they contain any embedded leases. If there are any
embedded leases, they are assessed as either finance or operating leases and accounted for accordingly.
Convertible debts
On issue, the debt and equity components of convertible bonds are separated and recorded at fair value net of issue costs. The fair value of the debt
component is estimated using the prevailing market interest rate for similar non-convertible debt. This amount is classified as a liability and measured on an
amortised cost basis until extinguished on conversion or maturity of the bonds. The remainder of the proceeds is allocated to the conversion option and is
recognised in equity, net of income tax effects. The carrying amount of the equity component is not re-measured in subsequent years. On early repurchase of
the convertible bond, the consideration paid is allocated to the liability and equity components at the date of transaction. The liability component at the date of
transaction is determined using the prevailing market interest rate for similar non-convertible debt at the date of the transaction, with the equity component as
the residual of the consideration paid and the liability component at the date of transaction. The difference between the consideration paid for the repurchase
allocated to the liability component and the carrying amount of the liability at that date is recognised in profit or loss. The amount of consideration paid for the
repurchase and transaction costs relating to the equity component is recognised in equity. Where the convertible notes are issued in foreign currency, it gives
rise to an embedded derivative which is split from the host contract (See 5fii).
Page 39 of 109

OANDO PLC
Annual Consolidated and Separate Financial Statements
Notes to the consolidated and separate financial statements
For the year ended 31 December 2017
(h)
(i)
(j)
(k)
(i) Retirement benefit obligations
Defined contribution scheme
The Group operates a defined contribution retirement benefit schemes for its employees. A defined contribution plan is a pension plan under which the
Group pays fixed contributions into a separate entity. The Group has no legal or constructive obligations to pay further contributions if the fund does not hold
sufficient assets to pay all employees the benefits relating to employee service in the current and prior periods. The Group’s contributions to the defined
contribution plan are charged to the profit or loss in the year to which they relate. The assets of the scheme are funded by contributions from both the Group
and employees and are managed by pension fund custodians in line with the National Pension Commission (PenCom) Pension Reform Act (PRA).
Defined benefit scheme
The Group operated a defined benefit gratuity scheme in Nigeria, where members of staff who had spent 3 years or more in employment are entitled to
benefit payments upon retirement. This defined benefit plan was curtailed in 2012 and 2013 for management and non-management staff respectively.
The liability recognized in respect of the discontinued defined benefit plan at the time of curtailment was based on the final settlement amounts communicated
to each employee. The settlement amounts bore an interest rate equivalent to 90 days deposit rate from the time of curtailment up until when they were paid to
an external funds manager in 2017. Prior to the obligation being funded, the interest costs accruing to the employees are recorded in the statement of profit or
loss and included as part of the liability in the statement of financial position.
After the settlement was paid to the fund manager during the year, the Group no longer has any obligation on the statement of financial position.
(ii) Employee share-based compensation
The Group operates a number of equity-settled, share-based compensation plans, under which the entity receives services from employees as consideration
for equity instruments (options/ awards) of the Group. The fair value of the employee services received in exchange for the grant of the option/awards is
recognised as an expense. The total amount to be expensed is determined by reference to the fair value of the options granted, including any market
performance conditions (for example, an entity's share prices); excluding the impact of any service and non-market performance vesting conditions (for
example, profitability, sales growth targets and remaining an employee of the entity over a specified time period); and including impact of any non-vesting
conditions (for example, the requirement for employees to save).
Non-market vesting conditions are included in assumptions about the number of options that are expected to vest. The total amount expensed is recognised
over the vesting period, which is the period over which all of the specified vesting conditions are to be satisfied. At each reporting date, the entity revises its
estimates of the number of options that are expected to vest based on the non-market vesting conditions. It recognises the impact of the revision to original
estimates, if any, in the statement of profit or loss, with a corresponding adjustment to share-based payment reserve in equity.
Inventories
Inventories are stated at the lower of cost and net realisable value. Cost is determined using the weighted average method. The cost of finished goods and
work in progress comprises raw materials, direct labour, other direct costs and related production overheads (based on normal operating capacity), but
excludes borrowing costs. Net realisable value is the estimated selling price in the ordinary course of business, less estimated costs of completion and selling
expenses.
Share capital
Ordinary shares are classified as equity. Share issue costs net of tax are charged to the share premium account.
Cash and cash equivalents
Cash and cash equivalents include cash in hand, deposits held at call with banks, other short term highly liquid investments with original maturities of three
months or less and bank overdrafts. Bank overdrafts are shown within borrowings in current liabilities in the consolidated statement of financial position.
Employee benefits
Page 40 of 109

OANDO PLC
Annual Consolidated and Separate Financial Statements
Notes to the consolidated and separate financial statements
For the year ended 31 December 2017
(l)
(m)
(iii) Other share based payment transactions
Where the Group obtains goods or services in compensation for its shares or the terms of the arrangement provide either the entity or the supplier of those
goods or services with a choice of whether the Group settles the transaction in cash (or other assets) or by issuing equity instruments, such transactions are
accounted as share based payments in the Group's financial statements.
(iv) Profit-sharing and bonus plans
The Group recognises a liability and an expense for bonuses and profit-sharing, based on a formula that takes into consideration the profit attributable to the
company’s shareholders after certain adjustments. The group recognises a provision where contractually obliged or where there is a past practice that has
created a constructive obligation.
Provisions
Provisions are recognised when the Group has a present obligation (legal or constructive) as a result of a past event, it is probable that an outflow of
resources embodying economic benefits will be required to settle the obligation and a reliable estimate can be made of the amount of the obligation. When
the Group expects some or all of a provision to be reimbursed, for example, under an insurance contract, the reimbursement is recognised as a separate
asset, but only when the reimbursement is virtually certain. The expense relating to a provision is presented in the statement of profit or loss.
Provisions for environmental restoration and legal claims are recognised when: the Group has a present legal or constructive obligation as a result of past
events; it is more likely than not that an outflow of resources will be required to settle the obligation; and the amount has been reliably estimated.
Where there are a number of similar obligations, the likelihood that an outflow will be required in settlement is determined by considering the class of
obligations as a whole. A provision is recognised even if the likelihood of an outflow with respect to any one item included in the same class of obligations may
be small.
Provisions are measured at the present value of management’s best estimate of the expenditure required to settle the present obligation at the reporting date.
The discount rate used to determine the present value is a pre-tax rate which reflects current market assessments of the time value of money and the specific
risk. The increase in the provision due to the passage of time is recognised as interest expense.
Decommissioning liabilities
A provision is recognised for the decommissioning liabilities for underground tanks described in Note 6v. Based on management estimation of the future cash
flows required for the decommissioning of those assets, a provision is recognised and the corresponding amount added to the cost of the asset under
property, plant and equipment for assets measured using the cost model. For assets measured using the revaluation model, subsequent changes in the
liability are recognised in revaluation reserves through OCI to the extent of any credit balances existing in the revaluation surplus reserve in respect of that
asset. The present values are determined using a pre-tax rate which reflects current market assessments of the time value of money and the risks specific to
the obligation. Subsequent depreciation charges of the asset are accounted for in accordance with the Group’s depreciation policy and the accretion of
discount (i.e. the increase during the period in the discounted amount of provision arising from the passage of time) included in finance costs.
Estimated site restoration and abandonment costs are based on current requirements, technology and price levels and are stated at fair value, and the
associated asset retirement costs are capitalized as part of the carrying amount of the related tangible fixed assets. The obligation is reflected under
provisions in the statement of financial position.
Current income and deferred tax
Income tax expense is the aggregate of the charge to profit or loss in respect of current and deferred income tax.
Current income tax is the amount of income tax payable on the taxable profit for the year determined in accordance with the relevant tax legislation. Education
tax is provided at 2% of assessable profits of companies operating within Nigeria. Tax is recognised in the statement of profit or loss except to the extent that
it relates to items recognised in OCI or equity respectively. In this case, tax is also recognised in other comprehensive income or directly in equity,
respectively.
When the options are exercised, the Group issues new shares. The proceeds received net of any directly attributable transaction costs are credited to share
capital (nominal value) and share premium.
Share-based compensation are settled in Oando PLC’s shares, in the separate or individual financial statements of the subsidiary receiving the employee
services, the share based payments are treated as capital contribution as the subsidiary entity has no obligation to settle the share-based payment
transaction.
The entity subsequently re-measures such an equity-settled share-based payment transaction only for changes in non-market vesting conditions.
In the separate financial statements of Oando PLC, the transaction is recognised as an equity-settled share-based payment transaction and additional
investments in the subsidiary.
Page 41 of 109

OANDO PLC
Annual Consolidated and Separate Financial Statements
Notes to the consolidated and separate financial statements
For the year ended 31 December 2017
(n) Exceptional items
(o) Dividend
(p) Upstream activities
Exploration and evaluation assets
Oil and gas assets
Refer to note "5L" and note 31 for information on the provision for estimated site restoration, abandonment costs and decommissioning costs.
Pre-license cost are expensed in the profit or loss in the period in which they occur .
Farm-out arrangements for E&E assets for which OER is the farmor are accounted for by recognizing only the cash payments received and do not recognize
any consideration in respect of the value of the work to be performed by the farmee. The carrying value of the remaining interest is the previous cost of the full
interest reduced by the amount of cash consideration received for entering the agreement. The effect will be that there is no gain recognized on the disposal
unless the cash consideration received exceeds the carrying value of the entire asset held.
When technical feasibility and commercial viability is determinable, costs attributable to those reserves are reclassified from E&E assets to a separate
category within Property Plant and Equipment (‚PP&E‛) referred to as oil and gas properties under development or oil and gas producing assets. Costs
incurred subsequent to the determination of technical feasibility and commercial viability and the costs of replacing parts of property, plant and equipment are
recognized as oil and gas interests only when they increase the future economic benefits embodied in the specific asset to which they relate. All other
expenditures are recognized in profit or loss as incurred. Such capitalized oil and natural gas interests generally represent costs incurred in developing
proved and/or probable reserves and bringing in or enhancing production from such reserves, and are accumulated on a field or geotechnical area basis.
The carrying amount of any replaced or sold component is derecognized. The costs of the day-to-day servicing of property and equipment are recognized in
the statement of comprehensive loss as incurred.
Oil and gas assets are measured at cost less accumulated depletion and depreciation and accumulated impairment losses. Oil and gas assets are
incorporated into Cash Generating Units ‚CGU’s‛ for impairment testing.
The net carrying value of development or production assets is depleted using the unit of production method by reference to the ratio of production in the year
to the related proved and probable reserves, taking into account estimated future development costs necessary to bring those reserves into production.
Future development costs are estimated taking into account the level of development required to produce the reserves. These estimates are reviewed by
independent reserve engineers at least annually.
Proved and probable reserves are estimated using independent reserve engineer reports and represent the estimated quantities of crude oil, natural gas and
natural gas liquids which geological, geophysical and engineering data demonstrate with a specified degree of certainty to be recoverable in future years
from known reservoirs and which are considered commercially producible.
Deferred tax is provided in full, using the liability method, on all temporary differences arising between the tax bases of assets and liabilities and their carrying
amount in the consolidated financial statements. However, if the deferred tax arises from the initial recognition of an asset or liability in a transaction other than
a business combination that at the time of the transaction affects neither accounting nor taxable profit or loss, it is not accounted for. Current income deferred
tax is determined using tax rates and laws enacted or substantively enacted at the reporting date and are expected to apply when the related deferred tax
liability is settled.
Deferred tax assets are recognised only to the extent that it is probable that future taxable profits will be available against which the temporary differences can
be utilised. Deferred tax is provided on temporary differences arising on investments in subsidiaries and associates, except where the timing of the reversal of
the temporary difference is controlled by the Group and it is probable that the temporary difference will not reverse in the foreseeable future.
Deferred tax assets and liabilities are offset when there is a legally enforceable right to offset current tax assets against current tax liabilities and when the
deferred taxes assets and liabilities relate to income taxes levied by the same taxation authority on either the same taxable entity or different taxable entities
where there is an intention to settle the balances on a net basis.
Exceptional items are disclosed separately in the financial statements where it is necessary to do so to provide further understanding of the financial
performance of the Group. They are material items of income or expense that have been shown separately due to significance of their nature and amount.
Dividend payable to the Company’s shareholders is recognised as a liability in the consolidated financial statements in the period in which they are declared
(i.e. approved by the shareholders).
Exploration and evaluation (‚E&E‛) assets represent expenditures incurred on exploration properties for which technical feasibility and commercial viability
have not been determined. E&E costs are initially capitalized as either tangible or intangible exploration and evaluation assets according to the nature of the
assets acquired, these costs include acquisition of rights to explore, exploration drilling, carrying costs of unproved properties, and any other activities
relating to evaluation of technical feasibility and commercial viability of extracting oil and gas resources. OER will expense items that are not directly
attributable to the exploration and evaluation asset pool. Costs that are incurred prior to obtaining the legal right to explore, develop or extract resources are
expensed in the statement of income (loss) as incurred. Costs that are capitalized are recorded using the cost model with which they will be carried at cost
less accumulated impairment. Costs that are capitalized are accumulated in cost centers by well, field or exploration area pending determination of technical
feasibility and commercial viability.
Once technical feasibility and commercial viability of extracting the oil or gas is demonstrable, intangible exploration and evaluation assets attributable to
those reserves are first tested for impairment and then reclassified from exploration and evaluation assets to a separate category within Property Plant and
Equipment (‚PP&E‛) referred to as oil and gas development assets and oil and gas assets. If it is determined that commercial discovery has not been
achieved, these costs are charged to expense.
Page 42 of 109

OANDO PLC
Annual Consolidated and Separate Financial Statements
Notes to the consolidated and separate financial statements
For the year ended 31 December 2017
(q)
(r) Non-current assets (or disposal groups) held for sale.
(s) Production underlift and overlift
(t) Fair value
Non-current assets are classified as assets held for sale when their carrying amount is to be recovered principally through a sale transaction and a sale is
considered highly probable. They are stated at lower of carrying amount and fair value less costs to sell.
The Group receives lifting schedules for oil production generated by the Group’s working interest in certain oil and gas properties. These lifting schedules
identify the order and frequency with which each partner can lift. The amount of oil lifted by each partner at the balance sheet date may not be equal to its
working interest in the field. Some partners will have taken more than their share (overlifted) and others will have taken less than their share (underlifted). The
initial measurement of the overlift liability and underlift asset is at the market price of oil at the date of lifting, consistent with the measurement of the sale and
purchase. Overlift balances are subsequently measured at fair value, while Underlift balances are carried at lower of carrying amount and current fair value.
Fair value is the price that would be received to sell an asset or paid to transfer a liability in an orderly transaction between market participants at the
measurement date. The fair value measurement is based on the presumption that the transaction to sell the asset or transfer the liability takes place either:
- In the principal market for the asset or liability, or
- In the absence of a principal market, in the most advantageous market for the asset or liability.
The principal or the most advantageous market must be accessible to the Group.
The fair value of an asset or a liability is measured using the assumptions that market participants would use when pricing the asset or liability, assuming that
market participants act in their economic best interest. A fair value measurement of a non-financial asset takes into account a market participant's ability to
generate economic benefits by using the asset in its highest and best use or by selling it to another market participant that would use the asset in its highest
and best use. The Group uses valuation techniques that are appropriate in the circumstances and for which sufficient data are available to measure fair value,
maximising the use of relevant observable inputs and minimising the use of unobservable inputs.
All assets and liabilities for which fair value is measured or disclosed in the financial statements are categorized within the fair value hierarchy, described as
follows, based on the lowest level input that is significant to the fair value measurement as a whole:
Level 1 „ Quoted (unadjusted) market prices in active markets for identical assets or liabilities
Level 2 „ Valuation techniques for which the lowest level input that is significant to the fair value measurement is directly or indirectly observable
Level 3 „ Valuation techniques for which the lowest level input that is significant to the fair value measurement is unobservable.
For assets and liabilities that are recognised in the financial statements on a recurring basis, the Group determines whether transfers have occurred between
Levels in the hierarchy by re-assessing categorization (based on the lowest level input that is significant to the fair value measurement as a whole) at the end
of each reporting period. External valuers are involved for valuation of significant assets, such as available for sale financial assets, and significant liabilities.
Involvement of external valuers is decided upon annually by the valuation committee after discussion with and approval by the Group’s audit committee.
Selection criteria include market knowledge, reputation, independence and whether professional standards are maintained. Valuers are normally rotated every
three years. The valuation committee decides, after discussions with the Group’s external valuers, which valuation techniques and inputs to use for each case.
Impairment
The Group assesses its assets for indicators of impairments annually. All assets are reviewed whenever events or changes in circumstances indicate that the
carrying amounts for those assets may not be recoverable. If assets are determined to be impaired, the carrying amounts of those assets are written down to
their recoverable amount, which is the higher of fair value less costs to sell and value in use, the latter being determined as the amount of estimated risk-
adjusted discounted future cash flows. For this purpose, assets are grouped into cash-generating units based on separately identifiable and largely
independent cash inflows.
Estimates of future cash flows used in the evaluation for impairment of assets related to hydrocarbon production are made using risk assessments on field
and reservoir performance and include expectations about proved reserves and unproved volumes, which are then risk-weighted utilising the results from
projections of geological, production, recovery and economic factors.
Exploration and evaluation assets are tested for impairment by reference to group of cash-generating units (CGU). Such CGU groupings are not larger than
an operating segment. A CGU comprises of a concession with the wells within the field and its related assets as this is the lowest level at which outputs are
generated for which independent cash flows can be segregated. Management makes investment decisions/allocates resources and monitors performance on
a field/concession basis. Impairment testing for E&E assets is carried out on a field by field basis, which is consistent with the Group’s operating segments as
defined by IFRS 8.
Impairments, except those related to goodwill, are reversed as applicable to the extent that the events or circumstances that triggered the original impairment
have changed.
Impairment charges and reversals are reported within depreciation, depletion and amortisation. As of the reporting date, an impairment charge of N162
million was recognised in intangibles assets. See note 16c.
Page 43 of 109

OANDO PLC
Annual Consolidated and Separate Financial Statements
Notes to the consolidated and separate financial statements
For the year ended 31 December 2017
(u) Offshore processing arrangements
The Group acting in the capacity of a principal
The Group acting in the capacity of an agent
Where the Group lifted crude oil but delivered petroleum products subsequent to the accounting period, it does not record the value of the crude oil received
as part of revenue. Rather, the Group records the value of crude oil received as deferred revenue under current liabilities.
Where the Group pre-delivered products in expectation of lifting of crude oil in future, it does not record the value in the Statement of profit or loss in order to
comply with the matching concept. Rather, it will deplete cash (where actual payment was done) or increase trade payables and receivables. The Group
transfers the amount recognised from trade receivables to cost of sales and recognise the value of crude oil lifted as turnover, when crude oil is eventually
lifted in respect of the pre-delivery.
The Group discloses letters of credit and amounts outstanding at the reporting date under contingent liabilities in the notes to the financial statements.
The Group acts as an agent in an offshore processing arrangement where the gross inflows of economic benefits include amounts collected on behalf of a
third party. Such amounts do not result in increases in equity for the Group. Thus, the amounts collected on behalf of the counterparty are not revenue.
Instead, revenue is the amount of commission earned for acting as an agent. Costs incurred by the Group are done on behalf of the counterparty and they are
fully reimbursable.
At each reporting date, the Board analyses the movements in the values of assets and liabilities which are required to be re-measured or re-assessed as per
the Group’s accounting policies. For this analysis, the Board verifies the major inputs applied in the latest valuation by agreeing the information in the valuation
computation to contracts and other relevant documents. The Board, in conjunction with the Group’s external valuers, also compares the changes in the fair
value of each asset and liability with relevant external sources to determine whether the change is reasonable. On an interim basis, the Board and the Group’s
external valuers present the valuation results to the audit committee and the Group’s independent auditors. This includes a discussion of the major
assumptions used in the valuations.
For the purpose of fair value disclosures, the Group has determined classes of assets and liabilities on the basis of the nature, characteristics and risks of the
asset or liability and the level of the fair value hierarchy as explained above.
An offshore processing arrangement involves the lifting of crude oil from an owner (usually government/third party) in agreed specifications and quantities for
a swap for agreed yields and specifications of refined petroleum products. Under such arrangements, the owner of the crude oil may not attach monetary
value to the crude oil delivered to the Group or the refined products received from the Group. Rather, the owner defines the yields and specification of refined
products expected from the Group. Sometimes, the owner may request the Group to deliver specific refined products, increase quantity of certain products
contrary to previously agreed quantity ratios, or make cash payments in lieu of delivery of products not required (‚retained products‛). It is also possible that
the owner may request the Group to pre-deliver refined products against future lifting of crude oil. Parties to offshore processing arrangements are often
guided by terms and conditions codified in an Agreement/Contract. Such terms may include risk and title to crude oil and refined products, free on board or
cost, insurance and freight deliveries by counterparties, obligations of counterparties, costs and basis of reimbursements, etc. Depending on the terms of an
offshore processing arrangement, the Group may act as a principal or an agent.
The Group acts as a principal in an offshore processing arrangement and has significant risks and rewards associated with the sale of products or rendering
of services when the following conditions are met:
“ it has the primary responsibility for providing the products or services to the customer or for fulfilling the order, for example by being responsible for the
acceptability of the products or services ordered or purchased by the customer;
“ it has inventory risk before or after the customer order, during shipping or on return;
“ it has latitude in establishing prices, either directly or indirectly, for example by providing additional products or services; and
“ it bears the customer's credit risk on the receivable due from the customer.
The Group shall recognise revenue from the sale of products when all the following conditions have been satisfied:
“ it has transferred to the counterparty the significant risks and rewards of ownership of the products;
“ it retains neither continuing managerial involvement to the degree usually associated with ownership nor effective control over the products sold;
“ the amount of revenue can be measured reliably;
“ it is probable that the economic benefits associated with the transaction will flow to the Group; and
“ the costs incurred or to be incurred in respect of the transaction can be measured reliably.
The gross amount of the crude oil received by the Group under an offshore processing arrangement represents consideration for the obligation to the
counterparty. Risk and rewards transfer to the counter party upon delivery of refined products. At this point, the Group determines the value of crude oil
received using the market price on the date of receipt and records the value as revenue. In addition, the Group records processing fees received/receivable
from the counterparty as part of revenue. The Group determines the value of refined products at cost and includes the value in cost of sales in the Statement
of profit or loss. All direct costs relating to an offshore processing arrangement that are not reimbursable are included in cost of sales, where applicable, in the
Statement of profit or loss. Such costs may include processing, freight, demurrage, insurance, directly attributable fees and charges, etc. All expenses, which
are not directly related to an offshore processing arrangement is included as part of administrative expenses.
Page 44 of 109

OANDO PLC
Annual Consolidated and Separate Financial Statements
Notes to the consolidated and separate financial statements
For the year ended 31 December 2017
(v) Investment property
6. Significant accounting judgements, estimates and assumptions
Judgement is also required to classify a joint arrangement. Classifying the arrangement requires the Group to assess their rights and obligations arising from
the arrangement. Specifically, the Group considers:
- The structure of the joint arrangement ” whether it is structured through a separate vehicle
- When the arrangement is structured through a separate vehicle, the Group also considers the rights and obligations arising from: the legal form of the
separate vehicle; the terms of the contractual arrangement; and other facts and circumstances, considered on a case by case basis. This assessment often
requires significant judgement. A different conclusion about both joint control and whether the arrangement is a joint operation or a joint venture, may
materially impact the accounting.
(b) In 2016, the Group recognised a liability of N16.8 billion ($55million) in respect of the adjustment to the consideration received on disposal of some of the
entities in the Downstream segment. This liability was based on the assumption that the unrecognised contingent liability of N17.5billion ($57.4million) arising
from agreed pass-through items from Ebony oil and gas, Ghana would be collected in 2017. During the year under review, the completion amount was
agreed between the buyer and seller, thereby increasing the liability to $112 million. The liability became due but was extinguished in exchange for the
issuance of 210,000 Class A shares only to the HV Shareholder by OVH Energy BV (formerly Copper JV/BV). This mode of settlement of the liability resulted in
the seller's interest in OVH Energy BV through Oando Netherlands Holdings 2 Cooperative U.A. being diluted to 5% from 40%. The dilution has been
accounted for in these consolidated financial statements under note 18.
(c) Capitalisation of borrowing costs
Management exercises sound judgement when determining which assets are qualifying assets, taking into account, among other factors, the nature of the
assets. An asset that normally takes more than one year to prepare for use is usually considered as a qualifying asset.
(d) Exploration costs
Exploration costs are capitalised pending the results of evaluation and appraisal to determine the presence of commercially producible quantities of reserves.
Following a positive determination, continued capitalisation is subject to further exploration or appraisal activity in that either drilling of additional exploratory
wells is under way or firmly planned for the near future or other activities are being undertaken to sufficiently progress the assessment of reserves and the
economic and operating viability of the project. In making decisions about whether to continue to capitalise exploration costs, it is necessary to make
judgments about the satisfaction of each of these conditions. If there is a change in one of these judgments in any period, then the related capitalised
exploration costs would be expensed in that period, resulting in a charge to the statement of profit or loss.
Investment properties are measured initially at cost, including transaction costs. Subsequent to initial recognition, investment properties are stated at fair
value, which reflects market conditions at the reporting date. Gains or losses arising from changes in the fair values of investment properties are included in
profit or loss in the period in which they arise, including the corresponding tax effect. Fair values are determined based on an annual valuation performed by
an accredited external independent valuer applying a valuation model recommended by the International Valuation Standards Committee.
Investment properties are derecognised either when they have been disposed of or when they are permanently withdrawn from use and no future economic
benefit is expected from their disposal. The difference between the net disposal proceeds and the carrying amount of the asset is recognised in profit or loss
in the period of derecognition. The Group has elected to state investment properties at fair value in accordance with IAS 40.
The preparation of the Group’s consolidated financial statements requires management to make judgements, estimates and assumptions that affect the
reported amounts of revenues, expenses, assets and liabilities, and the accompanying disclosures, and the disclosure of contingent liabilities at the date of
the consolidated financial statements. Estimates and assumptions are continuously evaluated and are based on management’s experience and other factors,
including expectations of future events that are believed to be reasonable under the circumstances. Uncertainty about these assumptions and estimates
could result in outcomes that require a material adjustment to the carrying amount of assets or liabilities affected in future periods. In particular, the Group has
identified the following areas where significant judgements, estimates and assumptions are required. Further information on each of these areas and how they
impact the various accounting policies are described below and also in the relevant notes to the financial statements. Changes in estimates are accounted for
prospectively.
Judgements
In the process of applying the Group’s accounting policies, management has made the following judgements, which have the most significant effect on the
amounts recognised in the consolidated financial statements:
(a) Joint arrangements (Note 43b)
Judgement is required to determine when the Group has joint control over an arrangement, which requires an assessment of the relevant activities and when
the decisions in relation to those activities require unanimous consent. The Group has determined that the relevant activities for its joint arrangements are
those relating to the operating and capital decisions of the arrangement, including the approval of the annual capital and operating expenditure work program
and budget for the joint arrangement, and the approval of chosen service providers for any major capital expenditure as required by the joint operating
agreements applicable to the entity’s joint arrangements. The considerations made in determining joint control are similar to those necessary to determine
control over subsidiaries, as set out in Note 4i.
Page 45 of 109
OANDO PLC
Annual Consolidated and Separate Financial Statements
Notes to the consolidated and separate financial statements
For the year ended 31 December 2017
i Fair value estimation
Financial instruments
ii
The useful life of each asset group has been determined by independent experts based on the build quality, maintenance history, operational regime and
other internationally recognised benchmarks relative to the assets.
Defined Benefits (Gratuity)
The present value of the defined benefits obligations depend on a number of factors that are determined on an actuarial basis using a number of
assumptions. The assumptions used in determining the net cost (income) for the benefits include appropriate discount rate. Any changes in these
assumptions will impact the carrying amount of the obligations.
The Group determines the appropriate discount rate at the end of each year. This is the interest rate that should be used to determine the present value of
estimated future cash outflows expected to be required to settle the gratuity obligations. In determining the appropriate discount rate, the Group considers the
interest rates of high-quality government bonds that are denominated in the currency in which the benefits will be paid and that have terms to maturity
approximating the terms of the related gratuity obligation.
Other key assumptions for the obligations are based in part on current market conditions. Additional information is disclosed in Note 33.
The carrying value less impairment provision of trade receivables and payables are assumed to approximate their fair values. The fair value of financial
liabilities for disclosure purposes is estimated by discounting the future contractual cash flows at the current market interest rate that is available to the Group
for similar financial instruments.
Investment in Glover BV and OVH Energy BV
Investment in Glover BV was gained in 2016. The values of the assets and liabilities used in determining the net asset are provisional amount applicable under
measurement period in line with IFRS 3. As of 31 December 2017 and date of this report, the fair value of Glover BV has not been finalised. Since
measurement period ended on 31 December 2017, subsequent changes in the provisional amount will be treated as a change in accounting estimate and will
be recognised int he period of the change.
OVH Energy BV (formerly Copper BV/JV) which was previously an associate in 2016 became an investment during 2017.
Employee share based payments
The fair value of employee share options is determined using valuation techniques such as the binomial lattice/black scholes model . The valuation inputs
such as the volatility, dividend yield is based on the market indices of Oando PLC's shares.
Property, plant and equipment
Land, building and plant and machinery are carried at revalued amounts. Formal revaluations are performed every three years by independent experts for
these asset classes. Appropriate indices, as determined by independent experts, are applied in the intervening periods to ensure that the assets are carried
at fair value at the reporting date. Judgement is applied in the selection of such indices. Fair value is derived by applying internationally acceptable and
appropriately benchmarked valuation techniques such as depreciated replacement cost or market value approach.
The depreciated replacement cost approach involves estimating the value of the property in its existing use and the gross replacement cost. For this
appropriate deductions are made to allow for age, condition and economic or functional obsolescence, environmental and other factors that might result in the
existing property being worth less than a new replacement.
The market value approach involves comparing the properties with identical or similar properties, for which evidence of recent transaction is available or
alternatively identical or similar properties that are available in the market for sale making adequate adjustments on price information to reflect any differences
in terms of actual time of the transaction, including legal, physical and economic characteristics of the properties.
Estimates and assumptions
The key assumptions concerning the future and other key sources of estimation uncertainty at the reporting date that have a significant risk of causing a
material adjustment to the carrying amounts of assets and liabilities within the next financial year, are described below. The Group based its assumptions and
estimates on parameters available when the consolidated financial statements were prepared. Existing circumstances and assumptions about future
developments, however, may change due to market change or circumstances arising beyond the control of the Group. Such changes are reflected in the
assumptions when they occur.
The estimates and assumptions that have significant risk of causing material adjustment to the carrying amounts of assets and liabilities within the next
financial year are addressed below:
The fair value of financial instruments that are not traded in an active market (for example, over-the-counter derivatives) is determined by using valuation
techniques. These include the use of recent arm’s length transactions, reference to other instruments that are substantially the same, discounted cash flows
analysis, and option pricing models refined to reflect the issuer’s specific circumstances. See Note 7 on details of fair value estimation methods applied by the
Group.
(e) Offshore processing arrangements
Judgement is required in order to determine whether the Group or any of its affiliates acts as a principal or an agent in an offshore processing arrangement. In
doing so, the Group considers the nature of arrangements, terms and conditions agreed to by the Group and counterparties and other relevant information. A
different conclusion about the role of the Group in an offshore processing arrangement may materially impact the accounting for offshore processing
arrangements.
Page 46 of 109

OANDO PLC
Annual Consolidated and Separate Financial Statements
Notes to the consolidated and separate financial statements
For the year ended 31 December 2017
iii Impairment of goodwill
iv
v
vi Estimation of oil and gas reserves
Oil and gas reserves are key elements in Oando’s investment decision-making process that is focused on generating value. They are also an important factor
in testing for impairment. Changes in proved oil and gas reserves will affect the standardised measure of discounted cash flows and unit-of-production
depreciation charges to the statement of profit or loss.
Proved oil and gas reserves are the estimated quantities of crude oil that geological and engineering data demonstrate with reasonable certainty to be
recoverable in future years from known reservoirs under existing economic and operating conditions, i.e., prices and costs as of the date the estimate is
made. Proved developed reserves are reserves that can be expected to be recovered through existing wells with existing equipment and operating methods.
Estimates of oil and gas reserves are inherently imprecise, require the application of judgement and are subject to future revision. Accordingly, financial and
accounting measures (such as the standardised measure of discounted cash flows, depreciation, depletion and amortisation charges, and decommissioning
and restoration provisions) that are based on proved reserves are also subject to change.
Proved reserves are estimated by reference to available reservoir and well information, including production and pressure trends for producing reservoirs
and, in some cases, subject to definitional limits, to similar data from other producing reservoirs. Proved reserves estimates are attributed to future
development projects only where there is a significant commitment to project funding and execution and for which applicable governmental and regulatory
approvals have been secured or are reasonably certain to be secured.
Furthermore, estimates of proved reserves only include volumes for which access to market is assured with reasonable certainty. All proved reserves
estimates are subject to revision, either upward or downward, based on new information, such as from development drilling and production activities or from
changes in economic factors, including product prices, contract terms or development plans. Changes in the technical maturity of hydrocarbon reserves
resulting from new information becoming available from development and production activities have tended to be the most significant cause of annual
revisions.
In general, estimates of reserves for undeveloped or partially developed fields are subject to greater uncertainty over their future life than estimates of
reserves for fields that are substantially developed and depleted. As a field goes into production, the amount of proved reserves will be subject to future
revision once additional information becomes available through, for example, the drilling of additional wells or the observation of long-term reservoir
performance under producing conditions. As those fields are further developed, new information may lead to revisions.
Changes to Oando’s estimates of proved reserves, particularly proved developed reserves, also affect the amount of depreciation, depletion and amortisation
recorded in the consolidated financial statements for property, plant and equipment related to hydrocarbon production activities. These changes can for
example be the result of production and revisions of reserves. A reduction in proved developed reserves will increase the rate of depreciation, depletion and
amortisation charges (assuming constant production) and reduce income.
Although the possibility exists for changes in reserves to have a critical effect on depreciation, depletion and amortisation charges and, therefore, income, it is
expected that in the normal course of business the diversity of Oando's portfolio will constrain the likelihood of this occurring.
The Group tests annually whether goodwill has suffered any impairment, in accordance with the accounting policy stated in Note 5e. The recoverable amounts
of cash-generating units have been determined based on value-in-use calculations. These calculations require the use of estimates. See Note 16 for detailed
assumptions and methods used for impairment calculation.
If the estimated pre-tax discount rate applied to the discounted cash flows of the Exploration & Production segment had been higher by 7.57% (i.e. 25.87%
instead of 18.30%), the Group would have recognised an impairment against goodwill of N42million. For the Trading segment, no impairment would have
resulted from application of discount rates lower than 70%.
Income taxes
The Group is subject to income taxes in various jurisdictions. Significant judgment is required in determining the Group’s provision for income taxes. There are
many transactions and calculations for which the ultimate tax determination is uncertain during the ordinary course of business. The Group recognises
liabilities for anticipated tax audit issues based on estimates of whether additional taxes will be due. Where the final tax outcome of these matters is different
from the amounts that were initially recorded, such differences will impact the income tax and deferred tax provisions in the period in which such
determination is made.
Provision for environmental restoration
The Group records a liability for the fair value of legal obligations associated with the decommissioning of oil and gas assets in the period in which they are
incurred, normally when the asset is purchased or developed. On recognition of the liability there is a corresponding increase in the carrying amount of the
related asset known as the decommissioning cost, which is depleted on a unit-of-production basis over the life of the reserves. The liability is adjusted each
reporting period to reflect the passage of time using the risk free rate, with the interest charged to earnings, and for revisions, to the estimated future cash
flows. The changes in the estimate for decommissioning obligation are recorded both under the related asset and liability. When the estimate results in a
reduction, the changes deducted from the carrying amount of the asset shall not exceed the carrying amount of the asset. Actual costs incurred upon
settlement of the obligations are charged against the liability.
Page 47 of 109

OANDO PLC
Annual Consolidated and Separate Financial Statements
Notes to the consolidated and separate financial statements
For the year ended 31 December 2017
vii
viii
ix
7 Financial risk management
Market risk
Market risk is the risk that the fair value of future cash flows of a financial instrument will fluctuate because of changes in market prices. Market risk comprises
three types of risk: interest rate risk, currency risk and other price risk, such as equity price risk and commodity risk. Financial instruments affected by market
risk include loans and borrowings, deposits, trade and other receivables and payables, non current receivables, AFS financial assets and derivative financial
instruments.
Estimates of future cash flows are risk-weighted to reflect expected cash flows and are consistent with those used in the Group’s business plans. A discount
rate based on the Group’s weighted average cost of capital (WACC) is used in impairment testing. Expected cash flows are then risk-adjusted to reflect
specific local circumstances or risks surrounding the cash flows. Oando reviews the discount rate to be applied on an annual basis. The discount rate applied
in 2017 was 17.94% (2016: 21%). Asset impairments or their reversal will impact income.
Useful lives and residual value of property, plant and equipment
The residual values, depreciation methods and estimated useful lives of property, plant and equipment are reviewed at least on an annual basis. The review is
based on the current market situation.
The residual value of the various classes of assets were estimated as follows:
Land and building - 10%
Plant and machinery - 10%
Motor vehicles ” 10%
Furniture and fittings - 10%
Computer and IT equipment - 10%
These estimates have been consistent with the amounts realised from previous disposals for the various asset categories.
Investment property
During the year, the Company acquired an investment property (a land). The fair value of the property was determined using the direct market comparison
method of valuation by an independent Estate Valuer, Ubosi Eleh and Co. The direct comparison method involves the analysis of similar properties that have
recently been transacted upon in the open market within the locality and adjusting appropriately to take care of the peculiarities and level of completion of the
subject property in arriving at the value. This has therefore been classified under level 3.
The Group’s activities expose it to a variety of financial risks: market risk (including currency risk, fair value interest rate risk, cash flows interest rate risk and
price risk), credit risk and liquidity risk. The Group’s overall risk management programme focuses on the unpredictability of financial markets and seeks to
minimise potential adverse effect on its financial and operational performance.
The Group has a risk management function that manages the financial risks relating to the Group’s operations under the policies approved by the Board of
Directors. The Group’s liquidity, credit, foreign currency, interest rate and price risks are continuously monitored. The Board approves written principles for
overall risk management, as well as written policies covering specific areas, such as foreign exchange risk, interest-rate risk and credit risk. The Group uses
derivative financial instruments to manage certain risk exposures.
The assumption that the volume of sales over the term of the contract will approximate the total capacity of the pipeline has been based on management’s
estimate of existing and future demand for gas in a region. Estimates of future cash flows for recovery of interest costs were arrived at assuming current bank
interest rates applied up until the full recovery of the investment. Other assumptions include exchange rate of N360.33/USD and applicable FGN bond
discount rate, which does not include the specific industry and market risks.
Impairment of assets
For oil and gas properties with no proved reserves, the capitalisation of exploration costs and the basis for carrying those costs on the statement of financial
position are explained above. For other properties, the carrying amounts of major property, plant and equipment are reviewed for possible impairment
annually, while all assets are reviewed whenever events or changes in circumstances indicate that the carrying amounts for those assets may not be
recoverable. If assets are determined to be impaired, the carrying amounts of those assets are written down to their recoverable amount. For this purpose,
assets are grouped into cash-generating units based on separately identifiable and largely independent cash inflows. Impairments can also occur when
decisions are taken to dispose off assets.
Impairments, except those relating to goodwill, are reversed as applicable to the extent that the events or circumstances that triggered the original impairment
have changed. Estimates of future cash flows are based on current year end prices, management estimates of future production volumes, market supply and
demand and product margins. Expected future production volumes, which include both proved reserves as well as volumes that are expected to constitute
proved reserves in the future, are used for impairment testing because the Group believes this to be the most appropriate indicator of expected future cash
flows, used as a measure of value in use.
Page 48 of 109

OANDO PLC
Annual Consolidated and Separate Financial Statements
Notes to the consolidated and separate financial statements
For the year ended 31 December 2017
Instrument Sensitivity
Range
Increase in variable Decrease in
variable
N'000 N'000
Financial commodity contracts +/- $10 per barrel change in Brent crude oil price (8,688) 35,995
(iii) Interest rate risk
Credit risk
Credit risk is managed on a Group basis. Credit risk arises from cash and cash equivalents, non-current receivables and deposits with banks as well as trade
and other receivables. The Group has no significant concentrations of credit risk. It has policies in place to ensure that credit limits are set for commercial
customers taking into consideration the customers’ financial position, past trading relationship, credit history and other factors. Sales to retail customers are
made in cash. The Group has policies that limit the amount of credit exposure to any financial institution.
Management monitors the aging analysis of trade receivables and other receivables on a periodic basis. The analysis of current, past due but not impaired
and impaired trade receivables is as follows:
The table below provides a summary of the impact of changes in crude oil prices and interest rates on income before tax, with all other variables held
constant for the year ended December 31, 2017.
Income/(loss) before tax
The Group had no short term, highly liquid bank deposits at fixed interest rates as at 31 December 2017. No limits are placed on the ratio of variable rate
borrowing to fixed rate borrowing.
The Group does not have any investments in quoted corporate bonds that are of fixed rate and carried at fair value through profit or loss. Therefore the Group
is not exposed to fair value interest rate risk arising from corporate bonds.
The Group has borrowings at variable rates, which expose the Group to cash flow interest rate risk. The Group regularly monitors financing options available
to ensure optimum interest rates are obtained.
At 31 December 2017, an increase/decrease of 100 basis points on LIBOR/MPR would have resulted in a decrease/increase in consolidated/Company's pre
tax profit/(loss) of N1.3 billion/N62.5 million (2016: N1.3 billion/N94.8 million), mainly as a result of higher/lower interest charges on variable rate borrowings.
Management enters into derivative contracts as an economic hedge against interest and foreign currency exposures. As at the reporting date, the Group
does not have any outstanding derivatives with respect to interest and foreign currency hedge.
At 31 December 2017, if the Naira had strengthened/weakened by 12% against the US Dollar with all other variables held constant, the consolidated pre tax
profit for the year would have been N36.89 billion higher/lower mainly as a result of US Dollar denominated borrowing balances. Comparatively, if the Naira
had strengthened/weakened by 12% against the US Dollar with all other variables held constant, the consolidated pre tax profit for the year would have been
N30.95 billion higher/lower mainly as a result of US Dollar denominated trade payables and loan balances. The Company's pre tax loss would have also been
N1.27 billion higher/lower mainly as a result of US Dollar denominated borrowing balances (2016: N2.27 billion).
(ii) Price risk
Equity price risk
The Group is exposed to equity security price risk because of its investments in the marketable securities classified as available-for-sale. The shares held by
the Group are traded on the Nigerian Stock Exchange (NSE). A 10% change in the market price of the instrument would result in N6 million gain/loss (2016:
N11.4 million), to be recognised in equity.
Commodity price risk
Fluctuations in the international prices of crude oil would have corresponding effects on the results of operations of the Group. In order to mitigate against the
risk of fluctuation in international crude oil prices, the Group hedges its exposure to fluctuations in the price of the commodity by entering into hedges for
minimum volumes and prices in US$ per barrel of oil.
(i) Foreign exchange risk
The Group operates internationally and is exposed to foreign exchange risk arising primarily from various product sourcing activities as well as other currency
exposures, mainly US Dollars. Foreign exchange risk arises when future commercial transactions and recorded assets and liabilities are denominated in a
currency that is not the entity’s functional currency e.g. foreign currency denominated loans, purchases and sales transactions etc. The Group manages their
foreign exchange risk by revising cost estimates of orders based on exchange rate fluctuations, forward contracts and cross currency swaps transacted with
commercial banks. The Group also apply internal hedging strategies with subsidiaries with USD functional currency.
At 31 December 2017, if the Naira had strengthened/weakened by 12% against the US Dollar with all other variables held constant, the consolidated pre tax
profit for the year would have been N17.41 billion lower/higher mainly as a result of US Dollar denominated bank balances and receivables. Comparatively, if
the Naira had strengthened/weakened by 12% against the US Dollar with all other variables held constant, the consolidated pre tax profit for the year would
have been N11.27 billion lower/higher mainly as a result of US Dollar denominated bank balances. The Company's pre tax loss would have also been N1.78
million lower/higher mainly as a result of US Dollar denominated bank balances and receivables (2016: N2.29 million).
Page 49 of 109

OANDO PLC
Annual Consolidated and Separate Financial Statements
Notes to the consolidated and separate financial statements
For the year ended 31 December 2017
Trade receivables Group Group Company Company
2017 2016 2017 2016
N'000 N'000 N'000 N'000
Current - Neither past due nor impaired 35,757,751 6,039,195 - -
Past due but not impaired
- by up to 30 days - 29,575,663 - -
- by 31 to 60 days 11,335 - - -
- later than 60 days 7,798,606 11,599,162 - -
Total past due but not impaired 7,809,941 41,174,825 - -
Impaired 1,773,006 1,450,898 - -
45,340,698 48,664,918 - -
Other receivables Group Group Company Company
2017 2016 2017 2016
N'000 N'000 N'000 N'000
Current - Neither past due nor impaired 46,341,982 48,210,899 138,771,677 108,581,449
Impaired 19,973,091 15,924,891 54,304,370 51,595,951
66,315,073 64,135,790 193,076,047 160,177,400
Non-current receivables
Neither past due nor impaired 23,202,580 22,034,389 9,365,366 9,711,893
Impaired 40,751,790 32,681,515 17,033,619 14,418,044
63,954,370 54,715,904 26,398,985 24,129,937
Derivative financial instruments
Current - Neither past due nor impaired 18,572 6,932,527 - -
Finance lease receivables
Non-current - Neither past due nor impaired 72,539,702 60,926,511 - -
Counter parties without external credit rating
Trade receivables Group Group Company Company
2017 2016 2017 2016
N'000 N'000 N'000 N'000
Group 1 - - - -
Group 2 35,757,751 4,701,816 - -
Group 3 - 1,337,379 - -
35,757,751 6,039,195 - -
Other receivables
Group 2 46,341,982 48,210,899 138,771,677 108,581,449
Non current receivables
Group 2 23,202,580 22,034,389 9,365,366 9,711,893
Derivative financial instruments
Group 2 18,572 6,932,527 - -
Finance lease receivables
Group 2 72,539,702 60,926,511 - -
Definition of the ratings above:
Group 1
Group 2
Group 3
Existing customers (more than 6 months) with no defaults in the past
Existing customers (more than 6 months) with some defaults in the past
Credit quality of financial assets
The credit quality of financial assets that are neither past due nor impaired have been assessed by reference to historical information about counterparty
default rates:
New customers (less than 6 months)
Page 50 of 109

OANDO PLC
Annual Consolidated and Separate Financial Statements
Notes to the consolidated and separate financial statements
For the year ended 31 December 2017
Group Less than 1
year
Between 1 and
2 years
Between 2 and 5
years
Over 5 years Total
N'000 N'000 N'000 N'000 N'000
At 31 December 2017:
Borrowings 169,456,415 27,284,322 136,509,931 - 333,250,668
Trade and other payables 182,248,908 - - - 182,248,908
Total 351,705,323 27,284,322 136,509,931 - 515,499,576
At 31 December 2016:
Borrowings 185,473,395 18,789,541 104,177,221 - 308,440,157
Trade and other payables 193,486,708 798,249 - - 194,284,957
Total 378,960,103 19,587,790 104,177,221 - 502,725,114
Company Less than 1
year
Between 1 and
2 years
Between 2 and 5
years Over 5 years Total
N'000 N'000 N'000 N'000 N'000
At 31 December 2017:
Borrowings 15,490,288 18,379,059 129,483,663 - 163,353,010
Trade and other payables 114,569,897 - - - 114,569,897
Total 130,060,185 18,379,059 129,483,663 - 277,922,907
At 31 December 2016:
Borrowings 37,197,645 15,236,572 101,547,822 - 153,982,039
Trade and other payables 74,441,578 - - - 74,441,578
Total 111,639,223 15,236,572 101,547,822 - 228,423,617
Various financial ratios and internal targets are assessed and reported to the Board on a quarterly basis to monitor and support the key objectives set out
above. These ratios and targets include:
” Gearing ratio;
” Earnings before interest tax depreciation and amortisation (EBITDA);
” Fixed/floating debt ratio;
” Current asset ratio;
” Interest cover;
The Group’s objective is to maintain these financial ratios in excess of any debt covenant restrictions and use them as a performance measurement and
hurdle rate. The failure of a covenant test could render the facilities in default and repayable on demand at the option of the lender.
Liquidity risk
Cash flow forecasting is performed in the operating entities of the Group and aggregated by Group treasury. Group treasury monitors cash forecast on a
periodic basis in response to liquidity requirements of the Group. This helps to ensure that the Group has sufficient cash to meeting operational needs while
maintaining sufficient headroom on its undrawn committed borrowing facilities. Such forecasting takes into consideration the Group’s debt financing plans,
covenant compliance and compliance with internal targets.
The table below analyses the Group’s financial liabilities into relevant maturity groupings based on the remaining period at the reporting date to the
contractual maturity date. The amounts disclosed in the table below are the contractual undiscounted cash flows.
Capital risk management
The Group’s objectives when managing capital are to safeguard the Group’s ability to continue as a going concern in order to provide returns for shareholders
and to maintain an optimal capital structure to reduce the cost of capital. In order to maintain or adjust the capital structure, the Group may issue new capital
or sell assets to reduce debt.
Page 51 of 109

OANDO PLC
Annual Consolidated and Separate Financial Statements
Notes to the consolidated and separate financial statements
For the year ended 31 December 2017
Group Group Company Company
2017 2016 2017 2016
N'000 N'000 N'000 N'000
Total borrowings 237,442,259 246,117,715 104,560,720 109,876,902
Less: cash and cash equivalents (Note 26) (7,895,061) (10,390,585) (915,653) (7,752,128)
Restricted cash (12,479,146) (6,538,952) - (4,682,749)
Net debt 217,068,052 229,188,178 103,645,067 97,442,025
Total equity 263,435,780 192,344,579 (10,508,115) 18,109,627
Total capital 480,503,832 421,532,757 93,136,952 115,551,652
Gearing ratio 45% 54% 111% 84%
The table below analyses financial instruments carried at fair value, by valuation method. The different levels have been defined as follows:
Financial instruments measured at fair value Level 1 Level 2 Level 3 Total
N'000 N'000 N'000 N'000
Assets
Available for sale financial assets
- Equity securities 61,856 - - 61,856
Derivative financial assets
- Commodity option contracts - 18,572 - 18,572
Investment property - - 1,033,000 1,033,000
Total assets 61,856 18,572 1,033,000 1,113,428
Liabilities
Derivative financial liabilities:
- Convertible options - - - -
Total liabilities - - - -
The following table presents the Group’s assets and liabilities that are measured at fair value at 31 December 2016.
Balance Level 1 Level 2 Level 3 Total
N'000 N'000 N'000 N'000
Assets
Available for sale financial assets
- Equity securities 115,642 - - 115,642
Derivative financial assets
- Commodity option contracts - 6,932,527 - 6,932,527
Total assets 115,642 6,932,527 - 7,048,169
Liabilities
Derivative financial liabilities
- Convertible options - - 199,137 199,137
Total liabilities - - 199,137 199,137
- Inputs other than quoted prices included within level 1 that are observable for the asset or liability, either directly (that is, as prices) or indirectly (that is,
derived from prices) (level 2).
- Inputs for the asset or liability that are not based on observable market data (that is, unobservable inputs) (level 3).
The following table presents the Group’s assets and liabilities that are measured at fair value at 31 December 2017.
Accordingly, in situations where these ratios are not met, the Group takes immediate steps to redress the potential negative impact on its financial
performance. Such steps include additional equity capital through rights issue and special placement.
Total capital is calculated as equity plus net debt. During 2017, the Group’s strategy was to maintain a gearing ratio between 50% and 75% (2016: 50% and
75%). The gearing ratios as at the end of December 2017 and 2016 were as follows:
Fair Value estimation
- Quoted prices (unadjusted) in active markets for identical assets or liabilities (level 1).
Page 52 of 109

OANDO PLC
Annual Consolidated and Separate Financial Statements
Notes to the consolidated and separate financial statements
For the year ended 31 December 2017
The following table presents the Company’s assets and liabilities that are measured at fair value at 31 December 2017.
Level 1 Level 2 Level 3 Total
N'000 N'000 N'000 N'000
Assets
Available for sale financial assets
- Equity securities 59,895 - - 59,895
Investment property - - 1,033,000 1,033,000
Total assets 59,895 - 1,033,000 1,092,895
Liabilities
Derivative financial liabilities
- Convertible options - - - -
Total liabilities - - - -
The following table presents the Company’s assets and liabilities that are measured at fair value at 31 December 2016.
Balance Level 1 Level 2 Level 3 Total
N'000 N'000 N'000 N'000
Assets
Available for sale financial assets
- Equity securities 113,985 - - 113,985
Total assets 113,985 - - 113,985
Liabilities
Derivative financial liabilities
- Convertible options - - 199,137 199,137
Total liabilities - - 199,137 199,137
Financial instruments not measured at fair value but for which fair values are disclosed
Group Level 1 Level 2 Level 3 Total
N'000 N'000 N'000 N'000
Assets
31 December 2017
Finance lease receivable - - 63,981,672 63,981,672
Non-current receivables - - 18,463,613 18,463,613
31 December 2016
Finance lease receivable - - 43,884,459 43,884,459
Non-current receivables - - 18,210,239 18,210,239
Liabilities
31 December 2017
Borrowings - - 246,034,268 246,034,268
31 December 2016
Borrowings - - 214,716,750 214,716,750
Company Level 1 Level 2 Level 3 Total
N'000 N'000 N'000 N'000
Assets
31 December 2017
Non-current receivables - - 10,776,983 10,776,983
31 December 2016
Non-current receivables - - 8,026,358 8,026,358
Liabilities
31 December 2017
Borrowings - - 101,399,730 101,399,730
31 December 2016
Borrowings - - 135,071,964 135,071,964
There were no transfers between levels 1 and 2 during the year.
The fair value of borrowings and finance lease receivables is estimated by discounting future cash flows using rates currently available for debt on similar
terms, credit risk and remaining maturities. The own non-performance risk for borrowings as at 31 December 2017 and 2016 has been considered in the
determination of the fair value and is immaterial. For receivables, the models incorporate various inputs including the credit quality of counterparties. In
addition to being sensitive to a reasonably possible change in the forecast cash flows or the discount rate, the fair value of the equity instruments is also
sensitive to a reasonably possible change in the growth rates. The individual credit worthiness of the customers have been considered in the valuation. The
discount rate used for finance lease receivables and borrowing are 15.0% (2016: 21%) and 15.0% (2016: 21%) respectively.
Page 53 of 109

OANDO PLC
Annual Consolidated and Separate Financial Statements
Notes to the consolidated and separate financial statements
For the year ended 31 December 2017
(a) Financial instruments in level 1
(b) Financial instruments in level 2
(c) Financial instruments in level 3
Convertible option - Derivative liability Group Group Company Company
2017 2016 2017 2016
N'000 N'000 N'000 N'000
At 1 January 199,137 5,160,802 180,928 5,160,802
Gain recognised in statement of profit or loss (180,928) (4,961,665) (180,928) (4,979,874)
Converted during the year (18,209) - - -
Exchange difference - - - -
At 31 December - 199,137 - 180,928
The fair value changes on the instruments were recognized in other operating income.
Investment property Group Company
2017 2017
N'000 N'000
At 1 January - -
Purchase 127,983 127,983
Fair value gain recognised in statement of profit or loss 905,017 905,017
At 31 December 1,033,000 1,033,000
The fair value gain on the investment property has been recognized in other operating income.
Description of significant unobservable inputs to valuation:
- Other techniques, such as discounted cash flow analysis, are used to determine fair value for the remaining financial instruments.
If one or more of the significant inputs is not based on observable market data, the instrument is included in level 3.
The level 3 instrument comprise of convertible notes to Ocean and Oil Development Partners (OODP). Ocean and Oil Development Partners is a private
company, whose business values are a significant input in the fair value of the financial instruments. Option derivative on the convertible loan notes were
valued using the Goldman Sachs model. The business value comprise of unobservable inputs such as risk free rate, volatility, credit spread, dividend yield,
etc.
During the year under review, OODP notified the Company of its intention to convert a total of N1.98billion in exchange for 396,793,587 fully paid Ordinary
Shares of the Company's common equity and in 2016, OODP exercised her option of conversion and a total of 128,413,672 shares were issued in exchange
for $154,096,406 convertible loan notes. See note 36 for the details.
The table below presents the changes in level 3 instruments for the year ended 31 December 2017.
During the year, the Company acquired an investment property (a land). The fair value of the property was determined using the direct market comparison
method of valuation by an independent Estate Valuer, Ubosi Eleh and Co. The direct comparison method involves the analysis of similar properties that have
recently been transacted upon in the open market within the locality and adjusting appropriately to take care of the peculiarities and level of completion of the
subject property in arriving at the value. This has therefore been classified under level 3.
The derivative liability was fully extinguished in 2017 whereas the significant unobservable inputs used in the fair value measurement categorised within Level
3 of the fair value hierarchy together with a quantitative sensitivity analysis as at 31 December 2016 is as shown below:
The fair value of financial instruments traded in active markets is based on unadjusted quoted market prices at the reporting date. A market is regarded as
active if quoted prices are readily and regularly available from an exchange, dealer, broker, industry Group, and pricing market transactions on an arm’s
length basis. The quoted market price used for financial assets held by the Group is the current bid price. These instruments are included in level 1.
Instruments included in level 1 comprise primarily of Nigerian Stock Exchange (NSE) listed instruments classified as available-for-sale.
The fair value of financial instruments that are not traded in an active market (for example, over-the-counter derivatives) is determined by using valuation
techniques. These valuation techniques maximise the use of observable market data where it is available and rely as little as possible on entity specific
estimates. If all significant inputs required to fair value an instrument are observable, the instrument is included in level 2. Instruments included in level 2
comprise primarily of interest swaps and derivatives. Their fair values are determined based on marked to market values provided by the counterparty
financial institutions. The models incorporate various inputs including the credit quality of counterparties, foreign exchange spot and forward rates, yield
curves of the respective currencies, currency basis spreads between the respective currencies, interest rate curves and forward rate curves of the underlying
commodity.
Specific valuation techniques used to value financial instruments include:
- The fair value of commodity contracts are calculated based on observable inputs which include forward prices of crude oil.
- The fair value of interest rate swaps is calculated as the present value of the estimated future cash flows based on observable yield curves;
- The fair value of forward foreign exchange contracts is determined using forward exchange rates at the reporting date, with the resulting value discounted
back to present value;
Page 54 of 109

OANDO PLC
Annual Consolidated and Separate Financial Statements
Notes to the consolidated and separate financial statements
For the year ended 31 December 2017
2016 Valuation
technique
Significant
unobservable
inputs
Weighted
average
Convertible option - Derivative liability Goldman
Sachs model
Volatility 65.0% 1% decrease in
volatility would result
in a decrease in the
fair value by N2.3
million.
1% increase in
volatility would
result in an
increase in the fair
value by N2.1
million.
Dividend yield 1.9% 1% decrease in
dividend yield
would result in an
increase in fair value
by N805,972.
1% increase in
dividend yield
would result in a
decrease in fair
value by
N795,192.
Description of valuation techniques used and key inputs to valuation of investment properties:
2017
Valuation
technique
Significant
unobservable
inputs
Sensitivity Range
Investment property Direct Market
Comparism
Method
Estimated value
per square
metre
(N200,000)
5% 5% decrease in
estimated value per
sqm would result in
a decrease in the
fair value by N51.7
million.
5% increase in
estimated value
per sqm would
result in an
increase in the fair
value by
N51.7million.10% 10% decrease in
estimated value per
sqm would result in
a decrease in the
fair value by N103.3
million.
10% increase in
estimated value
per sqm would
result in an
increase in the fair
value by N103.3
million.15% 15% decrease in
estimated value per
sqm would result in
a decrease in the
fair value by N154.9
million.
15% increase in
estimated value
per sqm would
result in an
increase in the fair
value by
N154.9million.
8
The Group was re-organised following the sale of target entities in the marketing, refining and terminals segment, Gas and Power segment (excluding Alausa
Power Ltd) and Energy Services Segment. The Group discontinued the Energy Services segment, marketing, refining and terminals segment and gas and
power segment (excluding Alausa Power Ltd) effective 31 March 2016, 30 June 2016, 31st December respectively whereas Alausa Power Ltd was
discontinued 31 march 2017. At 31 December, the Group has three operating segments namely:
(i) Exploration and production (E&P) ” involved in the exploration for and production of oil and gas through the acquisition of rights in oil blocks on the
Nigerian continental shelf and deep offshore.
(ii) Supply and Trading ” involved in trading of crude refined and unrefined petroleum products.
(iii) Corporate and others
In 2016, some of the business entities that form Gas & Power, Energy Services and Marketing, Refining & Terminals operating segments were disposed of.
However, management has decided to present financial information for these segments in 2016 because this is consistent with the information presented to
the Chief Operating Decision Maker till the end of 2016.
Sensitivity of the input to fair value
Sensitivity of the input to fair value
Segment information
The Group Leadership Council (GLC) is the group's chief operating decision-maker. Management has determined the operating segments based on the
performance reports reviewed monthly by Group Leadership Council (GLC) and these reports are used to make strategic decisions. GLC considers the
businesses from a divisional perspective. Each of the division’s operations may transcend different geographical locations.
The GLC assesses the performance of the operating segments by reviewing actual results against set targets on revenue, operating profit and profit after tax
for each division. Interest expenses suffered by the Corporate division on loans raised on behalf of the other divisions and similar operating expenses are
transferred to the relevant divisions. Transactions between operating segments are on arm's length basis in a manner similar to transactions with third parties.
Page 55 of 109
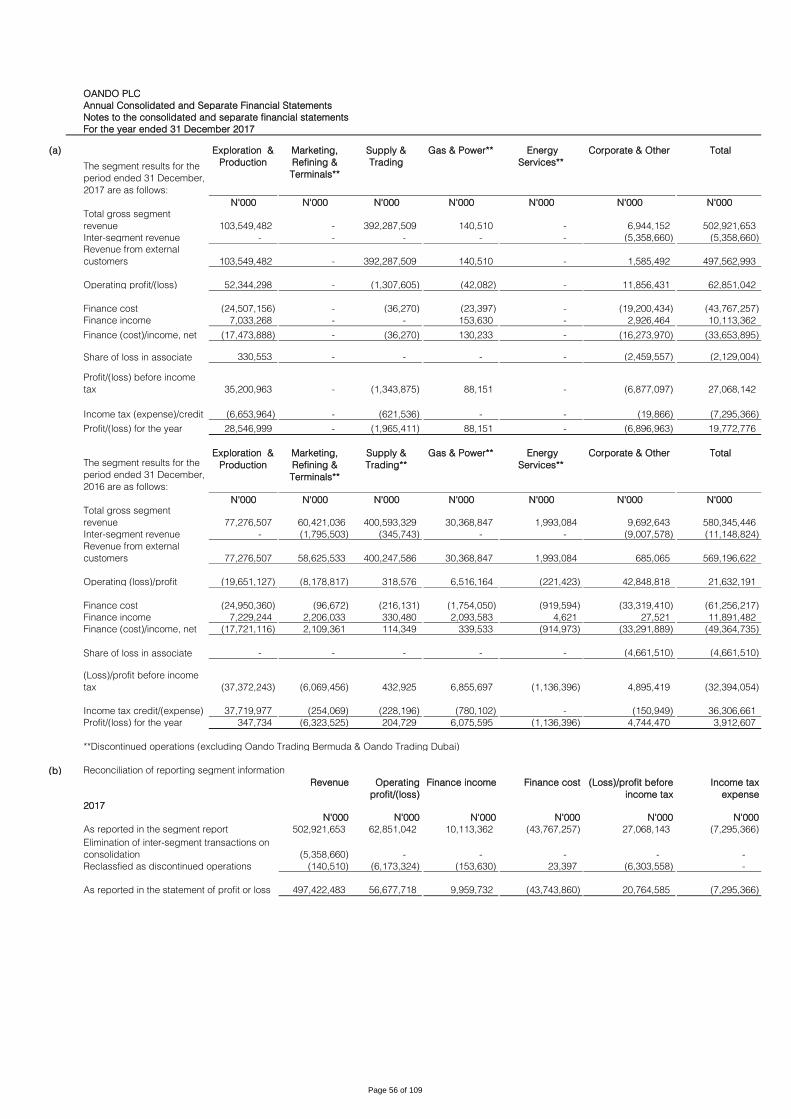
OANDO PLC
Annual Consolidated and Separate Financial Statements
Notes to the consolidated and separate financial statements
For the year ended 31 December 2017
(a) Exploration &
Production
Marketing,
Refining &
Terminals**
Supply &
Trading
Gas & Power** Energy
Services**
Corporate & Other Total
N'000 N'000 N'000 N'000 N'000 N'000 N'000
103,549,482 - 392,287,509 140,510 - 6,944,152 502,921,653
Inter-segment revenue - - - - - (5,358,660) (5,358,660)
103,549,482 - 392,287,509 140,510 - 1,585,492 497,562,993
Operating profit/(loss) 52,344,298 - (1,307,605) (42,082) - 11,856,431 62,851,042
Finance cost (24,507,156) - (36,270) (23,397) - (19,200,434) (43,767,257)
Finance income 7,033,268 - - 153,630 - 2,926,464 10,113,362
(17,473,888) - (36,270) 130,233 - (16,273,970) (33,653,895)
330,553 - - - - (2,459,557) (2,129,004)
35,200,963 - (1,343,875) 88,151 - (6,877,097) 27,068,142
(6,653,964) - (621,536) - - (19,866) (7,295,366)
Profit/(loss) for the year 28,546,999 - (1,965,411) 88,151 - (6,896,963) 19,772,776
Exploration &
Production
Marketing,
Refining &
Terminals**
Supply &
Trading**
Gas & Power** Energy
Services**
Corporate & Other Total
N'000 N'000 N'000 N'000 N'000 N'000 N'000
77,276,507 60,421,036 400,593,329 30,368,847 1,993,084 9,692,643 580,345,446
Inter-segment revenue - (1,795,503) (345,743) - - (9,007,578) (11,148,824)
77,276,507 58,625,533 400,247,586 30,368,847 1,993,084 685,065 569,196,622
Operating (loss)/profit (19,651,127) (8,178,817) 318,576 6,516,164 (221,423) 42,848,818 21,632,191
Finance cost (24,950,360) (96,672) (216,131) (1,754,050) (919,594) (33,319,410) (61,256,217)
Finance income 7,229,244 2,206,033 330,480 2,093,583 4,621 27,521 11,891,482
Finance (cost)/income, net (17,721,116) 2,109,361 114,349 339,533 (914,973) (33,291,889) (49,364,735)
- - - - - (4,661,510) (4,661,510)
(37,372,243) (6,069,456) 432,925 6,855,697 (1,136,396) 4,895,419 (32,394,054)
37,719,977 (254,069) (228,196) (780,102) - (150,949) 36,306,661
Profit/(loss) for the year 347,734 (6,323,525) 204,729 6,075,595 (1,136,396) 4,744,470 3,912,607
**Discontinued operations (excluding Oando Trading Bermuda & Oando Trading Dubai)
(b) Reconciliation of reporting segment information
2017
Revenue Operating
profit/(loss)
Finance income Finance cost (Loss)/profit before
income tax
Income tax
expense
N'000 N'000 N'000 N'000 N'000 N'000
As reported in the segment report 502,921,653 62,851,042 10,113,362 (43,767,257) 27,068,143 (7,295,366)
(5,358,660) - - - - -
Reclassfied as discontinued operations (140,510) (6,173,324) (153,630) 23,397 (6,303,558) -
497,422,483 56,677,718 9,959,732 (43,743,860) 20,764,585 (7,295,366) As reported in the statement of profit or loss
Total gross segment
revenue
Revenue from external
customers
Share of loss in associate
(Loss)/profit before income
tax
Income tax credit/(expense)
Elimination of inter-segment transactions on
consolidation
Revenue from external
customers
Finance (cost)/income, net
Share of loss in associate
Profit/(loss) before income
tax
Income tax (expense)/credit
The segment results for the
period ended 31 December,
2016 are as follows:
The segment results for the
period ended 31 December,
2017 are as follows:
Total gross segment
revenue
Page 56 of 109

OANDO PLC
Annual Consolidated and Separate Financial Statements
Notes to the consolidated and separate financial statements
For the year ended 31 December 2017
2016 Revenue
Operating
profit/(loss) Finance income Finance cost
(Loss)/profit before
income tax
Income tax
expense
N'000 N'000 N'000 N'000 N'000 N'000
As reported in the segment report 580,345,446 21,632,191 11,891,482 (61,256,217) (32,394,054) 36,306,661
(11,148,824) - - - - -
Reclassfied as discontinued operations (113,449,888) (28,871,226) (4,634,717) 2,943,055 (30,562,888) 1,262,367
455,746,734 (7,239,035) 7,256,765 (58,313,162) (62,956,942) 37,569,028
Other information included in the statement of profit or loss by segment are:
Year ended 31 December, 2017:
Exploration &
Production
Marketing,
Refining &
Terminals**
Supply &
Trading**
Gas & Power** Energy
Services**
Corporate & Other Total
N'000 N'000 N'000 N'000 N'000 N'000 N'000
Depreciation (Note 10) 17,275,046 - 10,054 - - 1,474,612 18,759,712
166,243 - - - - 19,773 186,016
3,007,416 - - 13,074 - 2,328,325 5,348,815
Year ended 31 December, 2016:
Exploration &
Production
Marketing,
Refining &
Terminals**
Supply &
Trading**
Gas & Power** Energy
Services**
Corporate & Other Group
N'000 N'000 N'000 N'000 N'000 N'000 N'000
Depreciation (Note 15)* 16,053,168 - 7,063 89,366 556,478 1,355,941 18,062,016
144,631 - - 354,864 - 101,896 601,391
Impairment of assets* 16,340,997 195,778 223,652 797,564 - 13,560,105 31,118,096
*Depreciation, amortisation and impairments presented above represents both continuing and discontinued operations.
The segment assets and liabilities and capital expenditure for the year ended 31 December, 2017 are as follows:
Exploration &
Production
Marketing,
Refining &
Terminals**
Supply &
Trading**
Gas & Power** Energy
Services**
Corporate & Other Total
N'000 N'000 N'000 N'000 N'000 N'000 N'000
Assets 927,512,819 - 38,954,637 - - 73,708,448 1,040,175,904
Investment in an associate - - - - - 7,540,014 7,540,014
Liabilities 548,501,776 8,434 31,514,888 - - 196,715,027 776,740,125
Capital Expenditure* 19,823,532 - 184,856 - - 1,288,695 21,297,083
The segment assets and liabilities as of 31 December, 2016 and capital expenditure for the year then ended are as follows:
Exploration &
Production
Marketing,
Refining &
Terminals**
Supply &
Trading**
Gas & Power** Energy
Services**
Corporate & Other Total
N'000 N'000 N'000 N'000 N'000 N'000 N'000
Assets 842,709,368 - 43,499,621 5,548,312 - 99,787,674 991,544,975
Investment in an associate - - - - - 10,653,425 10,653,425
Liabilities 536,062,352 8,434 43,133,196 4,841,423 - 215,154,991 799,200,396
Capital Expenditure 11,171,375 - 3,511 4,790,201 - 67,170 16,032,257
Amortisation of intangible
assets (Note 16)*
*Capital expenditure comprises additions to property, plant and equipment and intangible asset, excluding Goodwill.
Elimination of inter-segment transactions on
consolidation
As reported in the statement of profit or loss
Inter-segment revenue represents intercompany dividend income, sales between XRS 11 & OLS with other subsidiaries. Profit on inter-segment sales and
intercompany dividend income have been eliminated on consolidation.
Amortisation of intangible
assets (Note 10)
Impairment of assets (Note
10)*
Page 57 of 109

OANDO PLCAnnual Consolidated and Separate Financial Statements
Notes to the consolidated and separate financial statements
For the year ended 31 December 2017
The Group's business segments operate in three main geographical areas.
Segment information on a geographical basis for the period ended 31 December 2017 are as follows:
Exploration &
Production
Marketing,
Refining &
Terminals**
Supply &
Trading**
Gas & Power** Energy
Services**
Corporate & Other Total
Revenue N'000 N'000 N'000 N'000 N'000 N'000 N'000
Within Nigeria 103,549,482 - - 140,510 - 1,585,490 105,275,482
- - - - - - -
Other countries - - 392,287,511 - - - 392,287,511
103,549,482 - 392,287,511 140,510 - 1,585,490 497,562,993
Total assets
Within Nigeria 925,702,161 - - - - 73,708,448 999,410,609
- - 122,011 - - - 122,011
Other countries 1,810,658 - 38,832,626 - - - 40,643,284
927,512,819 - 38,954,637 - - 73,708,448 1,040,175,904
Capital expenditure
Within Nigeria 19,823,532 - - - - 1,284,654 21,108,186
- - - - - - -
Other countries - - 184,856 - - 4,041 188,897
19,823,532 - 184,856 - - 1,288,695 21,297,083
Segment information on a geographical basis for the year ended and as at 31 December, 2016 are as follows:
Exploration &
Production
Marketing,
Refining &
Terminals**
Supply &
Trading**
Gas & Power** Energy
Services**
Corporate & Other Total
Revenue N'000 N'000 N'000 N'000 N'000 N'000 N'000
Within Nigeria 77,276,507 55,217,046 - 30,368,847 1,993,084 685,062 165,540,546
- 3,408,487 22,462,424 - - - 25,870,911
Other countries - - 377,785,165 - - - 377,785,165
77,276,507 58,625,533 400,247,589 30,368,847 1,993,084 685,062 569,196,622
Total assets
Within Nigeria 841,766,184 - - 5,548,312 - 99,787,674 947,102,170
- - 103,276 - - - 103,276
Other countries 943,184 - 43,396,345 - - - 44,339,529
842,709,368 - 43,499,621 5,548,312 - 99,787,674 991,544,975
Capital expenditure
Within Nigeria 11,171,375 - 3,511 4,790,201 - 67,170 16,032,257
- - - - - - -
Other countries - - - - - - -
11,171,375 - 3,511 4,790,201 - 67,170 16,032,257
Group Group Company Company
(c) Analysis of revenue by nature 2017 2016 2017 2016
N'000 N'000 N'000 N'000
Sales of goods 496,272,230 450,402,100 - -
Intra-group dividend income - - - 10,234,612
Revenue from services 1,150,253 5,344,634 - -
497,422,483 455,746,734 - 10,234,612
9 Other operating income Group Group Company Company
2017 2016 2017 2016
N'000 N'000 N'000 N'000
Foreign exchange gain (note 10) 23,458,246 25,819,892 15,595,876 16,740,463
4,650,927 (4,814,773) 180,929 4,961,665
Fair value gain on investment property 905,017 - 905,017 -
Gain on sale of 5% interest in Glover BV 75,364 - - -
Gain on sale of 35% interest in OVH Energy BV 12,181,634 - 4,821,973 -
Gain on sale of subsidiaries - - 143,176 57,577,366
Sundry income 5,218,939 52,195,871 4,342,077 18,915,271
46,490,127 73,200,990 25,989,048 98,194,765
Fair value gain/(loss) on commodity options and derivative liability (note 10)
Other West African countries
Other West African countries
Other West African countries
Other West African countries
Revenue are disclosed based on the country in which the customer is located. Total assets are allocated based on where the assets are located. No single
customer contributes up to 10% of the Group's revenue.
Capital expenditure is allocated based on where the assets are located.
Other West African countries
Other West African countries
Page 58 of 109

OANDO PLC
Annual Consolidated and Separate Financial Statements
Notes to the consolidated and separate financial statements
For the year ended 31 December 2017
10 Expenses by nature of operating profit Group Group Company Company
2017 2016 2017 2016
N'000 N'000 N'000 N'000
The following items have been charged/(credited) in arriving at the operating profit:
Included in cost of sales:
Inventory cost 380,095,536 350,348,613 - -
Included in other operating income:
Foreign exchange gain (Note 9) 23,458,246 25,819,892 15,595,876 16,740,463
Profit on disposal of property, plant and equipment 16,039 - 4,399 -
Fair value gain/(loss) on commodity options and derivative liability (Note 9) 4,650,927 (4,814,773) 180,929 4,961,665
Included in administrative expenses
Depletion/depreciation on property plant and equipment - Other* (Note 15) 18,759,712 17,416,172 152,622 175,281
Amortisation of intangible assets (Note 16) 186,016 246,527 19,774 101,896
Foreign exchange loss 21,170,831 31,555,669 29,861,339 43,378,797
Employees benefit scheme (Note 11) 6,959,928 6,205,073 460,905 715,881
Group Group Company Company
2017 2016 2017 2016
N'000 N'000 N'000 N'000
Auditors remuneration 414,394 418,118 99,750 99,750
Legal & consultancy services 5,335,280 13,896,489 190,022 7,517,626
Repair and maintenance 3,963,988 4,571,953 5,055 24,610
Impairment of property, plant and equipment - 16,001,499 - -
Impairment of intangible assets (Note 16) 162,377 - 162,377 -
Impairment losses of non-current receivables (Note 22) 1,844,201 - - -
Impairment losses of trade and other receivables (Note 24) 3,329,163 13,877,458 2,533,703 50,332,803
Write off of receivables 2,789,967 - - -
Impairment losses on available for sale asset (Note 25) (3,291,936) 22,145 - 22,145
Loss on disposal of property, plant and equipment - 40,559 - 3,280
Rent and other hiring costs 6,040,976 1,175,402 3,420,954 25,348
The following items have been charged/(credited) in arriving at the loss from discontinued operations:
Amortisation of intangible assets (Note 16) - 354,864 - -
Depletion/depreciation on property plant and equipment - 645,844 - -
Impairment losses of trade and other receivables 13,074 1,216,994 - -
Employees benefit scheme (Note 11) - 3,272,530 - -
11 Employee benefit expenses Group Group Company Company
2017 2016 2017 2016
N'000 N'000 N'000 N'000
(a) Directors' remuneration:
The remuneration paid to the directors who served during the year was as follows:
Chairman fees 5,556 5,556 5,556 5,556
Other non-executive fees 162,424 293,999 26,667 26,667
167,980 299,555 32,222 32,223
Executive directors' salaries 682,451 776,607 682,451 451,676
850,430 1,076,162 714,673 483,899
Other emoluments 621,100 857,289 450,434 243,235
1,471,530 1,933,451 1,165,107 727,134
During the year, the Group realised a net derivative gain of N4.7 billion (2016 - loss of N4.8 billion) and derivative gain of N181 million (2016 - N4.96 billion) in
the consolidated and separate statement of profit or loss on commodity contracts and convertible options respectively. See note 20 for further details of fair
value (loss)/gain on the financial commodity contract. During the year under review, the Group and Company sundry income is largely made up of crude
income and other direct charges to customers.
In 2016, the amount was largely made up of gain on sale of Premium Motor Spirit (PMS) to Oando Marketing Limited, brokerage income, crude income,
consent fee refund, gain on reorganisation of OGP and other direct charges to customers.
Page 59 of 109

OANDO PLC
Annual Consolidated and Separate Financial Statements
Notes to the consolidated and separate financial statements
For the year ended 31 December 2017
Group Group Company Company
2017 2016 2017 2016
Number Number Number Number
N1,000,000 - N10,000,000 - 5 - -
Above N10,000,000 12 27 10 13
Included in the above analysis is the highest paid director at N340 million (2016: N322 million).
(b) Staff costs Group Group Company Company
2017 2016 2017 2016
N'000 N'000 N'000 N'000
Wages, salaries and staff welfare cost 6,368,456 8,446,669 376,141 631,710
Share options granted to directors and employees - 469,829 - -
Pension costs - defined contribution scheme 537,407 587,629 38,240 43,464
Retirement benefit - defined benefit scheme (Note 33) 54,065 (26,524) 46,524 40,707
6,959,928 9,477,603 460,905 715,881
Analysis of staff cost for the year:
- Continuing operations (Note 10) 6,959,928 6,205,073 460,905 715,881
- Discontinued operations (Note 10) - 3,272,530 - -
6,959,928 9,477,603 460,905 715,881
Group Group Company Company
2017 2016 2017 2016
Number Number Number Number
Executive 2 2 2 2
Management staff 70 82 16 23
Senior staff 60 103 12 34
132 187 30 59
2017 2016 2017 2016
Number Number Number Number
N2,500,001 - N4,000,000 - 2 - -
N4,000,001 - N6,000,000 - 12 - 5
N6,000,001 - N8,000,000 - 33 - 11
N8,000,001 - N10,000,000 1 29 1 13
Above N10,000,000 131 111 29 30
132 187 30 59
12 Finance costs, net Group Group Company Company
2017 2016 2017 2016
N'000 N'000 N'000 N'000
(a) Finance cost:
On bank borrowings (35,794,297) (48,806,500) (19,166,179) (33,260,203)
Unwinding of discount on provisions* (Note 31) (7,949,563) (9,506,662) - -
Total finance cost (43,743,860) (58,313,162) (19,166,179) (33,260,203)
(b) Finance income:
Interest income on bank deposits 2,867,556 1,319,571 2,926,404 27,417
Interest income on finance lease 7,092,176 5,937,194 - -
Total finance income 9,959,732 7,256,765 2,926,404 27,417
Net finance costs (33,784,128) (51,056,397) (16,239,775) (33,232,786)
*Unwinding of discount on provisions includes N955 million (2016: 1.4 billion) which relates to OML 125 & 134 disposed in 2017 (Note 27e).
No borrowing costs were capitalised in 2017 (2016: nil). Actual borrowing rate approximate effective interest rate.
Higher-paid employees other than directors, whose duties were wholly or mainly discharged in Nigeria, received remuneration (excluding pension
contributions) in the following ranges:
The directors received emoluments (excluding pension contributions) in the
following ranges:
The average number of full-time persons employed during the year was as
follows:
Page 60 of 109

OANDO PLC
Annual Consolidated and Separate Financial Statements
Notes to the consolidated and separate financial statements
For the year ended 31 December 2017
13 (a) Income tax expense
Analysis of income tax charge for the year:
Group Group Company Company
2017 2016 2017 2016
N'000 N'000 N'000 N'000
Continuing operations
Current income tax 11,626,089 854,707 - -
Minimum tax 15,539 144,664 15,539 144,663
Capital gains tax 365 1,742 365 1,742
Education tax 834,163 40,831 - -
Adjustments in respect of prior years tax - (5,045,293) - -
12,476,156 (4,003,349) 15,904 146,405
Deferred income tax (Note 19):
Deferred income tax credit for the year* (5,180,790) (33,565,679) - -
Income tax expense/(credit) 7,295,366 (37,569,028) 15,904 146,405
Discontinued operations
Current income tax** - 2,248,103 - -
Education tax - 118,387 - -
- 2,366,490 - -
Deferred income tax (Note 19):
Deferred income tax for the year - (1,104,122) - -
Income tax expense - 1,262,368 - -
*N7.4 billion of this amount relates to OML 125 & 134 disposed in 2017 (Note 27e)
**N482 million of this amount relates to the current income tax from downstream entities disposed in 2016 (Note 27e)
The tax on the Group’s profit before income tax differs from the theoretical amount that would arise using the statutory income tax rate as follows:
Group Group Company Company
2017 2016 2017 2016
N'000 N'000 N'000 N'000
Profit/(loss) before income tax 20,764,585 (62,956,942) (30,599,529) (27,934,427)
6,229,376 (18,887,083) (9,179,859) (8,380,328)
Minimum tax 15,539 144,664 15,539 144,663
Education tax 834,163 40,831 - -
Capital gains tax 365 1,742 365 1,742
Tax effect of income not subject to tax (8,168,413) (37,160,951) (2,985,060) (16,339,965)
Effect of associate tax 638,702 1,398,453 - -
Effect of tax rate diferential (4,749,790) (24,180,665) - -
Expenses not deductible for tax purposes 28,981,578 16,874,332 6,410,910 15,368,685
Utilization of previous year unrecognized tax losses (48,093,099) - - -
Over-provisions for income tax - (5,045,293) - -
Tax losses for which no deferred tax was recognised 640,333 9,351,608 5,754,009 9,351,608
Impact of unutilised tax credits carried forward 30,966,612 19,893,334 - -
Income tax expense/(credit) 7,295,366 (37,569,028) 15,904 146,405
Effective tax rate 35% 60% 0% -1%
Investment in available for sale assets is not subject to tax. Therefore, a gain or loss on the valuation of this investment is not subject to income or deferred
tax.
Tax calculated at Nigeria's domestic rates applicable to profits in respective
countries - 30% (2016: 30%)
Page 61 of 109

OANDO PLC
Annual Consolidated and Separate Financial Statements
Notes to the consolidated and separate financial statements
For the year ended 31 December 2017
Group Group Company Company
2017 2016 2017 2016
N'000 N'000 N'000 N'000
(b) Current income tax liabilities
Movement in current income tax for the year:
At 1 January 59,108,565 49,643,097 521,455 1,772,479
Payment during the year (10,351,862) (8,039,319) (1,741) (1,397,429)
Derecognition of indemnified liability (1,124,389) - -
Adjustments in respect of prior years tax - (5,045,293) - -
Current income tax derecognised due to disposal of entities - (2,742,239) - -
Charge for the year:
Income tax charge during the year - Continuing operations (Note 13a) 11,641,628 999,371 15,539 144,663
Income tax charge during the year - Discontinued operations - 1,765,838 - -
Education tax charge during the year- Continuing operations (Note 13a) 834,163 40,831 - -
Education tax charge during the year - Discontinued operations (Note 13a) - 118,387 - -
Capital gains tax - Continuing operations 365 1,742 365 1,742
Exchange difference 12,297,187 22,366,150 - -
At 31 December 72,405,657 59,108,565 535,618 521,455
14
Group Group
2017 2016
N'000 N'000
Profit/(loss) from continuing operations attributable to equity holders of the parent 7,638,187 (25,407,327)
Profit from discontinued operations attributable to equity holders of the parent 6,303,557 28,950,700
13,941,744 3,543,373
Weighted average number of ordinary shares outstanding (thousands) :
Opening balance 12,034,618 12,034,618
Conversion of debt to equity 371,790 -
12,406,408 12,034,618
Basic/diluted earnings per share (expressed in kobo per share)
From continuing operations 62 (211)
From discontinued operations 51 241
113 30
Earnings per share and dividend per share
Basic earnings per share is calculated by dividing the profit attributable to equity holders of the Company by the weighted average number of Ordinary
Shares outstanding during the year.
Diluted earnings per share
Diluted earnings per share is calculated by adjusting the weighted average number of Ordinary Shares outstanding to assume conversion of all dilutive
potential Ordinary Shares. However, there were no convertible debts at the year end.
Page 62 of 109

OANDO PLC
Annual Consolidated and Separate Financial Statements
Notes to the consolidated and separate financial statements
For the year ended 31 December 2017
15 Property, plant and equipment
GroupUpstream
Asset 1
Land &
Buildings
Plant &
machineries
Fixtures, fittings,
computer &
equipment, motor
vehicles
Capital work in
progress Total
N'000 N'000 N'000 N'000 N'000 N'000
At 1 January 2016
Cost or valuation 267,972,158 1,018,205 11,613,799 4,004,686 629,311 285,238,159
Accumulated depreciation (56,988,398) (16,756) (2,736,209) (2,366,724) - (62,108,087)
Net book amount 210,983,760 1,001,449 8,877,590 1,637,962 629,311 223,130,072
Year ended 31 December 2016
Opening net book amount 210,983,760 1,001,449 8,877,590 1,637,962 629,311 223,130,072
(32,525,818) - - - - (32,525,818)
Additions 9,221,077 - 104,988 102,657 920,559 10,349,281
Transfer/reclassification from WIP - (349,097) 422,996 (73,899) -
- - - (965) - (965)
Disposal of PPE - - 578,424 (52,108) - 526,316
Disposal of subsidiary - (648,680) (1,459,679) (1,068,465) (1,252,062) (4,428,886)
(15,849,715) - (820,329) (746,128) - (17,416,172)
- (3,672) (45,570) (40,103) - (89,345)
Exchange difference 109,703,257 3,982,998 310,964 113,997,219
281,532,561 - 11,218,422 566,810 223,909 293,541,702
At 31 December 2016
Cost or valuation 387,303,188 380 16,162,458 3,655,017 223,909 407,344,952
Accumulated depreciation (105,770,627) (380) (4,944,036) (3,088,207) - (113,803,250)
Net book amount 281,532,561 - 11,218,422 566,810 223,909 293,541,702
Year ended 31 December 2017
Opening net book amount 281,532,561 - 11,218,422 566,810 223,909 293,541,702
Decommissioning costs (Note 31) (1,055,562) - - - - (1,055,562)
Additions 18,264,089 868,929 - 689,055 19,822,073
Reclassification (221,582) - (167,394) 388,976 - -
Disposal of PPE - - - (3,164) - (3,164)
Write off* - - - - (223,909) (223,909)
(17,145,435) (7,241) (1,080,135) (526,901) - (18,759,712)
Exchange difference 48,308,560 - 1,854,892 (18,767) - 50,144,685
329,682,631 861,688 11,825,785 1,096,009 - 343,466,113
At 31 December 2017
Cost or valuation 474,663,959 869,378 19,066,506 4,807,087 - 499,406,930
Accumulated depreciation (144,981,328) (7,690) (7,240,721) (3,711,078) - (155,940,817)
Net book amount 329,682,631 861,688 11,825,785 1,096,009 - 343,466,113
*Write off represents capital projects that is deemed irrecoverable.
Depletion/Depreciation charge - Continuing
operations (Note 10)
Net book amount at 31 December 2017
Depletion/Depreciation charge - Continuing
operations (Note 10)Depletion/Depreciation charge -
Discontinued operations - (Note 10)
Net book amount at 31 December 2016
Decommissioning cost/Remeasurement of
estimate (Note 31)
Trf to disposal group classified as held for
sale
Page 63 of 109

OANDO PLC
Annual Consolidated and Separate Financial Statements
Notes to the consolidated and separate financial statements
For the year ended 31 December 2017
Company Land &
Buildings
Plant &
machineries
Fixtures, fittings,
computer &
equipment, motor
vehicles
Capital work in
progress
Total
N'000 N'000 N'000 N'000 N'000
At 1 January 2016
Cost or valuation - 154,241 1,305,000 1,459,241
Accumulated depreciation - (99,149) (848,509) (947,658)
Net book amount - 55,092 456,491 - 511,583
Year ended 31 December 2016
Opening net book amount - 55,092 456,491 511,583
Additions - - 66,568 66,568
Disposal - - (23,051) (23,051)
Depreciation charge - (11,680) (163,601) (175,281)
Closing net book amount - 43,412 336,407 - 379,819
At 31 December 2016
Cost/Valuation - 154,241 1,316,467 1,470,708
Accumulated depreciation - (110,829) (980,060) (1,090,889)
Net book amount - 43,412 336,407 - 379,819
Year ended 31 December 2017
Opening net book amount - 43,412 336,407 - 379,819
Additions 868,929 - 411,803 - 1,280,732
Disposal - - (207) - (207)
Depreciation charge (7,241) (11,020) (134,361) - (152,622)
Closing net book amount 861,688 32,392 613,642 - 1,507,722
At 31 December 2017
Cost/Valuation 868,929 154,241 1,722,574 - 2,745,744
Accumulated depreciation (7,241) (121,849) (1,108,932) - (1,238,022)
Net book amount 861,688 32,392 613,642 - 1,507,722
i
16 Intangible assets
Group
Asset under
construction
Goodwill Software costs Exploration and
Evaluation asset
Licence for gas
transmission
pipelineTotal
N'000 N'000 N'000 N'000 N'000 N'000
At 1 January 2016
Cost or valuation 7,957,677 215,204,378 1,647,837 49,692,354 11,222,341 285,724,587
Accumulated amortization and impairment - (696,030) (1,106,818) (20,901,364) (8,304,630) (31,008,842)
Net book amount 7,957,677 214,508,348 541,019 28,790,990 2,917,711 254,715,745
Year ended 31 December 2016
Opening net book amount 7,957,677 214,508,348 541,019 28,790,990 2,917,711 254,715,745
Additions 3,737,154 - 965 1,931,741 13,116 5,682,976
Disposal during the year - Farm out - - - (3,532,829) - (3,532,829)
Disposal of subsidiary (11,694,831) (4,016,812) (33,337) - (2,584,058) (18,329,038)
- - (246,527) - - (246,527)
- - (8,095) - (346,769) (354,864)
Exchange difference - 108,178,658 91,527 15,324,820 - 123,595,005
- 318,670,194 345,552 42,514,722 - 361,530,468
Year ended 31 December 2016
Cost - 319,366,225 1,776,534 74,541,429 - 395,684,188
- (696,031) (1,430,982) (32,026,707) - (34,153,720)
- 318,670,194 345,552 42,514,722 - 361,530,468
Closing net book amount as at 31
December 2016
Accumulated amortisation and impairment
Net book amount as at 31 December 2016
See note 30 for PPE pledged as security.
Amortisation charge - Continuing operations
(Note 10)
Amortisation charge - Discontinued
operations (Note 10)
(1)See Note 43(a) for details of upstream assets.
Page 64 of 109

OANDO PLC
Annual Consolidated and Separate Financial Statements
Notes to the consolidated and separate financial statements
For the year ended 31 December 2017
Year ended 31 December 2017
Opening net book amount - 318,670,194 345,552 42,514,722 - 361,530,468
Addition - - - 1,475,010 - 1,475,010
- (186,016) - - (186,016)
Impairment - - (162,377) - - (162,377)
Exchange difference - 56,494,056 2,841 7,712,588 - 64,209,485
- 375,164,250 - 51,702,320 - 426,866,570
Cost - 375,860,280 1,892,261 89,538,986 - 467,291,527
- (696,030) (1,892,261) (37,836,666) - (40,424,957)
- 375,164,250 - 51,702,320 - 426,866,570
Company Software costs
N'000
At 1 January 2016
Cost 1,137,641
Accumulated amortisation and impairment (854,559)
Net book amount 283,082
Year ended 31 December 2016
Opening net book amount 283,082
Additions 965
Amortisation charge (101,896)
Closing net book amount 182,151
At 31 December 2016
Cost 1,138,606
Accumulated amortisation and impairment (956,455)
Net book value 182,151
Year ended 31 December 2017
Opening net book amount 182,151
Amortisation charge (19,774)
Impairment (162,377)
Closing net book amount -
At 31 December 2017
Cost 1,138,606
Accumulated amortisation and impairment (1,138,606)
Net book value -
i Impairment on intangible assets
a Exploration and evaluation asset impairment losses
The above exploration and evaluation assets represent expenditures arising from the exploration and evaluation of oil and gas interests. The costs relate to oil
and gas properties primarily located in Nigeria and São Tomé and Príncipe ‚STP‛. The technical feasibility and commercial viability of extracting oil and gas
has not yet been determined in relation to the above properties, and therefore, they remain classified as exploration and evaluation assets at December 31,
2017.
On February 19, 2016 OER through its subsidiary, Equator Exploration Limited ‚Equator‛, executed a Production Sharing Contract with the National Petroleum
Agency of-STP ‚ANP-STP‛ for an 87.5% participating interest in Block 12. OER subsequently farmed out 65% participating interest and transferred
operatorship in Blocks 5 and 12 to Kosmos Energy Sao Tome and Principe. After completion of both farm-outs, OER now holds 20% and 22.5% in Blocks 5
and 12 respectively. The farm-out arrangements with Kosmos have been accounted for by recognizing only the cash payments received without recognizing
any consideration in respect of the value of the work to be performed by the farmee. The carrying value of the remaining interest after the farm-out is the
previous cost of the full interest in both Blocks 5 and 12 reduced by the amount of cash consideration received for entering the agreement. The effect is that
there was no gain recognized on the disposal as the cash consideration received did exceed the carrying value of the entire asset held.
Key assumptions in the determination of cash flows from reserves include crude oil, natural gas and natural gas liquids ‚NGL‛ prices, loss factors and the
discount rate. Reserves as at December 31, 2017 have been evaluated by independent qualified reserves evaluators. The table below summarizes the
forecasted prices used to determine cash flows from crude oil reserves and resources which is based on the futures market forward curve for Brent.
Accumulated amortisation and impairment
Net book amount as at 31 December 2017
Amortisation charge - Continuing operations
(Note 10)
Closing net book amount as at 31
December 2017
Page 65 of 109

OANDO PLC
Annual Consolidated and Separate Financial Statements
Notes to the consolidated and separate financial statementsFor the year ended 31 December 2017
Year 2018 2019 2020 2021 2022 2023 2024
Dated Brent (US$/barrel) 63.25 63.49 66.38 70.60 73.48 75.65 78.07
NGL (US$/barrel) 11.58 11.60 11.75 11.98 12.14 12.25 12.39
Natural gas (US$/mcf) 1.70 1.70 1.76 1.85 1.91 1.95 2.00
Year 2025 2026 2027 2028 2029 2030 Beyond
Dated Brent (US$/barrel) 80.25 82.07 83.70 85.36 87.06 88.82 +2%
NGL (US$/barrel) 12.50 12.60 12.69 12.78 12.87 12.97 +1%
Natural gas (US$/mcf) 2.05 2.08 2.12 2.15 2.19 2.22 +1%
b Goodwill impairment losses
Impairment tests for goodwill
Key assumptions
At 31 December 2016 Nigeria Other countries Total
N'000 N'000 N'000
OER 316,473,330 - 316,473,330
Oando Trading Bermuda (OTB) - 2,196,864 2,196,864
316,473,330 2,196,864 318,670,194
At 31 December 2017 Nigeria Other countries Total
N'000 N'000 N'000
OER 372,568,853 - 372,568,853
Oando Trading Bermuda (OTB) - 2,595,397 2,595,397
372,568,853 2,595,397 375,164,250
OER Oando Trading
Bermuda
OER Oando Trading
Bermuda
Growth rate 18.3% 13.9% 13.7% 7.9%
Discount rate 8.9% 6.6% 20.3% 16.8%
Goodwill is allocated to the Group’s cash generating units (CGUs) identified according to the operating segments. A segment-level summary of the goodwill
allocation is presented below:
The recoverable amount of the CGU is determined based on value-in-use calculations. These calculations use pre-tax cash flow projections based on financial
budgets approved by management covering a 5 year period. Cash flows beyond the five-year period are extrapolated using the estimated growth rates for
the CGU in future as disclosed below. The growth rate does not exceed the long-term average growth rate for the respective industry in which the CGU
operates.
The key assumptions used for value-in-use calculations were as follows:
At 31 December 2017 At 31 December 2016
Management determined budgeted gross margins based on past performance and its expectations of market development. The weighted average growth
rates used are consistent with the forecast performance of the oil and gas industry in which the CGUs operate. The discount rates used are pre-tax and reflect
specific risks relating to the relevant segment and CGU.
Crude oil loss factors applied ranged from 12% on an annual basis to end of field life and for the first five years depending on the field. The discount rate
applied was 12%. For exploration and evaluation assets, OER used $0.86/boe as the implied value/boe on 2C unrisked contingent resources based on
comparable market transactions and consideration of forward price declines.
Management determined that exploration and evaluation assets are qualifying assets and therefore eligible for capitalisation of borrowing cost. However, no
borrowing cost was capitalised during the year reviewed. The assessment above did not lead to any impairment loss.
No goodwill impairment was recognised in 2017 (2016: nil).
In determining the recoverable amount of a CGU, management has made key assumptions to estimate the present value of future cash flows. These key
assumptions have been made by management reflecting past experience and are consistent with relevant external sources of information.
Cashflows
The cashflow projections are from financial budgets approved by senior management covering a 5year period.
Pre-tax risk adjusted discount rates
Pre-tax risk adjusted discount rates are derived from risk-free rates based upon long term government bonds in the territory in which the CGU operates. A
relative risk adjustment has been applied to risk-free rates to reflect the risk inherent in the CGU. The cash forecast covered five years.
Page 66 of 109

OANDO PLC
Annual Consolidated and Separate Financial Statements
Notes to the consolidated and separate financial statementsFor the year ended 31 December 2017
c Software impairment
17 Investment property
18 Investment in associates accounted for using the equity method
Group Group Company Company
2017 2016 2017 2016
N'000 N'000 N'000 N'000
Investment in associates 7,540,014 10,653,425 2,716,431 15,500,552
The amounts recognised in the statement of profit or loss are as follows:
Share of loss (2,129,005) (4,661,510) - -
Investment in associate
2017
Place of
business
Country of
incorporation
% of ownership
interest
Nature of the
relationship
Measurement
method
Oando Wings Development Limited (OWDL) Nigeria Nigeria 25.8% Associate Equity Accounting
Glover BV Netherlands Netherlands 25.0% Associate Equity Accounting
Umugini Asset Company Limited Nigeria Nigeria 11.25% Associate Equity Accounting
2016
Oando Wings Development Limited
Nigeria Nigeria 25.8% Associate Equity Accounting
Copper JV/BV Netherlands Netherlands 40.0% Associate Equity Accounting
Glover BV Netherlands Netherlands 30.0% Associate Equity Accounting
Oando Wings Development Limited
Oando Wings Development Limited (OWDL) is a Special Purpose Vehicle incorporated in 2011 in Nigeria to invest in real estate and to undertake, alone or
jointly with other companies or persons the development of property generally for residential, commercial or any other purpose including but not limited to the
development of office complexes and industrial estates. The company is a private company and therefore there is no quoted market price available for its
shares. The company has an authorised share capital of ten million ordinary shares of N1 each.
The company was a fully owned subsidiary of Oando PLC until December 20, 2013, when it issued 3,710,000 ordinary shares of N1 each to RMB Westpoint.
The issue of ordinary shares to RMB Westpoint Wings diluted Oando Plc’s interest to 41% and OWDL was subsequently accounted for as "investment in
associate". On May 8, 2014, Standard Bank Group International Limited (SBGI) exercised its option and an additional 3,710,000 ordinary shares of N1 each
was taken up by SBGI. As a result, Oando Plc’s interest ("investment in associate") was further diluted to 25.8%.
On 2nd November 2016, Oando PLC ('the Borrower') entered into a rental funding facilities agreement with RMB Westpoint, SB Wings Development Limited
('the Lenders') and Oando Wings Development Limited ('the Lessor') amended on 7 March 2017. The Lenders will make available to the Borrower,
$20,500,000 divided into Facility A $10,725,000 and Facility B $9,775,000. However, the agreement provides that, on each Facility A Profit Share Date, the
Lenders shall subscribe for, and the Lessor shall issue, that number of ordinary shares in the share capital of the Lessor to the Lenders (in their Pro Rata
Share of Facility A) as required to give effect to the reduced shareholding percentage of the Borrower in the Lessor for the relevant Facility A and B Profit
Share Period as contained in the agreement.
The Company charged an impairment of N162 million to software being the carrying value of hyperion software which has been discontinued and deemed to
be irrecoverable.
During the year, a land in Nigeria purchased by Oando PLC for N127.9 million and valued at N1 billion has been classified as an investment property as
management's intention for use has not been determined. A fair value gain of N905 million has been recognised in the statement of profit or loss. This carrying
value represents the fair value of the property. The fair value of the property was determined using the direct market comparison method of valuation by an
independent Estate Valuer, Ubosi Eleh and Co.
There was no rental income and related operating expenses on this property during the year. The Group has no restrictions on the realisability of its
investment properties and no contractual obligations to purchase, construct or develop investment properties or for repairs, maintenance and enhancements.
The amounts recognised in the statement of financial position are as follows;
Set out below are the associates of the Group at 31 December 2017, which, in the opinion of the directors, are material to the Group. The associates have
share capital consisting solely of Ordinary Shares, which are held directly by the Group. The countries of incorporation or registration of the associates are
also their principal places of business.
Page 67 of 109

OANDO PLC
Annual Consolidated and Separate Financial Statements
Notes to the consolidated and separate financial statements
For the year ended 31 December 2017
OVH Energy BV (formerly Copper JV/BV) & Glover BV
Umugini Asset Company Limited
Summarised financial information for the associate
Set out below are the summarised financial information for the associates
2016
Summarised statement of financial position Glover BV* Copper JV OWDL
2016 2016 2016
N'000 N'000 N'000
Total current assets 12,033,169 90,005,500 726,274
Total non-current assets 54,520,224 98,747,490 54,489,810
Total current liabilities (48,891,682) (87,230,000) (1,699,119)
Total non-current liabilities (11,672,140) (88,236,500) (26,190,180)
Net asset/equity 5,989,571 13,286,490 27,326,785
Summarised statement of comprehensive income
Revenue - 127,217,993 226,639
Administrative expenses (140,031,504) -
Other expenses 549,777
(Loss)/profit from continuing operations - (12,813,511) 776,416
Income tax credit 1,021,627
(Loss)/profit after tax - (12,813,511) 1,798,043
Total comprehensive loss - (12,813,511) 1,798,043
Share of loss in associate - (5,125,404) 463,895
The principal activity of Umugini Asset Company Limited ‚UACL‛ is to carry on the business of planning, design, construction, ownership and provision of
crude pipeline and fiscal metering facilities for the custody, operation, maintenance, handling and transportation by pipeline of stabilized crude on behalf of
the shareholders and other Oil and gas Producing Companies to downstream crude oil terminal facilities.
The associate has share capital consisting solely of Ordinary Shares, which are held in-trust by Energia Limited for the Company's indirect subsidiary, Oando
Production and Development Company Limited (OPDCL). Through the shareholder and heads of terms agreement, OPDCL is guaranteed a seat on the board
of UACL and participates in all significant financial and operating decisions even though it only holds 11.25% ownership.
Oando PLC exerts significant influence over these associates as the Group has representatives on the board of directors and is involved in management
decisions taken by the entities. All the associates above have been fully accounted for in these consolidated financial sattements.
The information above reflects the amounts presented in the financial statements of the associate adjusted for differences in accounting policies between the
Group and the associate.
As at 31 December 2017, the Lenders had given a loan of N3.8 billion ($10.7 million) (Note 30d) to the Borrower. The borrowing has been accounted for at
amortized cost and the effect reflected in the consolidated and separate statement of profit or loss.
The effect of the deemed disposal has not been accounted for in these audited consolidated and separate financial statements as the dilution of interest has
not been finalised. Had the deemed disposal been finalised, Oando PLC's interest in OWDL would have reduced to 23.3% from 25.8% as of the reporting
date.
Oando PLC acquired two new associates namely OVH Energy BV (formerly Copper JV/BV) (40%) and Glover BV (30%) on 01 July 2016 and 31st December
2016 respectively by virtue of the consideration shares for the sale of targeted companies in the Marketing, Refining and Terminals, and Gas & Power
segments. The fair values of the interest received were N10.44billion & N2.34billion respectively and they were taken as the carrying value of the associate.
The Group's interest reduced from 30% to 25% in Glover BV effective 31 January 2017 following the acquisition of 5% interest in Glover BV by Helios. The sale
and residual interest have been accounted for in these audited consolidated and separate financial statements (note 22b).
On 31 December 2016, the Group accounted for the sale of certain downstream companies using best estimates. The completion accounts for the sale of the
downstream companies, which form the basis of final accounting, was fully agreed by the buyer and seller post-September 2017. The Settlement Agreement
was approved by the Board of Directors on 8th December 2017 which led to the dilution of Oando Netherlands Holdings 2 Cooperative U.A.'s interest in OVH
Energy BV from 40% to 5%. Consequently, the agreed completion amount of US$112 million in favour of the buyer has been reflected in these audited
consolidated and separate financial statements. In addition, OVH Energy BV is now accounted for as an investment in line with the terms of the Settlement
Agreement with effect from 8th December 2017 (note 27a).
Page 68 of 109

OANDO PLC
Annual Consolidated and Separate Financial Statements
Notes to the consolidated and separate financial statementsFor the year ended 31 December 2017
Reconciliation of summarised financial information
Glover BV* Copper JV OWDL TOTAL
2016 2016 2016 2016
N'000 N'000 N'000 N'000
30.0% 40.0% 25.80%
Share of net asset 1,796,871 5,314,596 7,050,311 14,161,778
Equity contribution by promoters - - (4,055,602) (4,055,602)
Goodwill 547,250 - - 547,250
Carrying value of the associate 2,344,121 5,314,596 2,994,709 10,653,426
Carrying value:
As at beginning of the year - - 2,530,813 2,530,813
Investment in associates 2,344,121 10,440,002 - 12,784,123
Share of (loss)/profit in associate - (5,125,406) 463,895 (4,661,511)
As at end of the year 2,344,121 5,314,596 2,994,708 10,653,425
Glover BV* Copper JV
N'000 N'000
FV of consideration 2,344,121 10,440,002
FV of 30%/40% of net asset (1,796,871) (10,440,002)
Goodwill 547,250 -
*Glover BV has been represented to show the effect of goodwill on acquisiton of associates.
Summarised financial information for the associate
Set out below are the summarised financial information for the associates
2017
Umugini Asset
Company
Limited
Glover BV* OVH Energy BV** OWDL
Summarised statement of financial position 2017 2017 2017 2017
N'000 N'000 N'000 N'000
Current assets:
Total current assets 8,001,128 17,025,362 - 2,388,747
Total non-current assets 24,585,316 54,910,239 - 70,536,963
Total current liabilities (21,162,902) (25,601,736) - (5,005,565)
Total non-current liabilities (7,989,867) (36,074,747) - (36,181,749)
Net asset/(liabilities)/equity 3,433,675 10,259,118 - 31,738,396
Summarised statement of comprehensive income
Revenue 2,208,423 42,171,580 250,476,178 5,327,758
Profit/(loss) after tax 2,938,254 4,269,547 (11,791,495) 4,622,322
Other comprehensive loss - - - (210,710)
Total comprehensive income/(loss) 2,938,254 4,269,547 (11,791,495) 4,411,612
Share of profit/(loss) in associate* 330,553 1,064,481 (4,716,598) 1,192,559
*Included in OWDL's share of profit for 2017 is N1.3 billion relating to the difference between the estimated and final results for 2016 year.
Umugini Asset
Company
Limited Glover BV*
OVH Energy
BV** OWDL TOTAL
2017 2017 2017 2017 2017
N'000 N'000 N'000 N'000 N'000
11.25% 25.0% 0.0% 25.8%
Share of net asset 386,289 2,564,779 - 8,188,506 11,139,574
Goodwill - 456,042 - - 456,042
Equity contribution by promoters - - - (4,055,602) (4,055,602)
Carrying value of the associate 386,289 3,020,821 - 4,132,904 7,540,014
Goodwill on acquisition of associates
The information above reflects the amounts presented in the financial statements of the associate adjusted for differences in accounting policies between the
Group and the associate.
Reconciliation of the summarised financial information
presented to the carrying amount of its interest in associates
Reconciliation of the summarised financial information presented to the
carrying amount of its interest in associates
Page 69 of 109
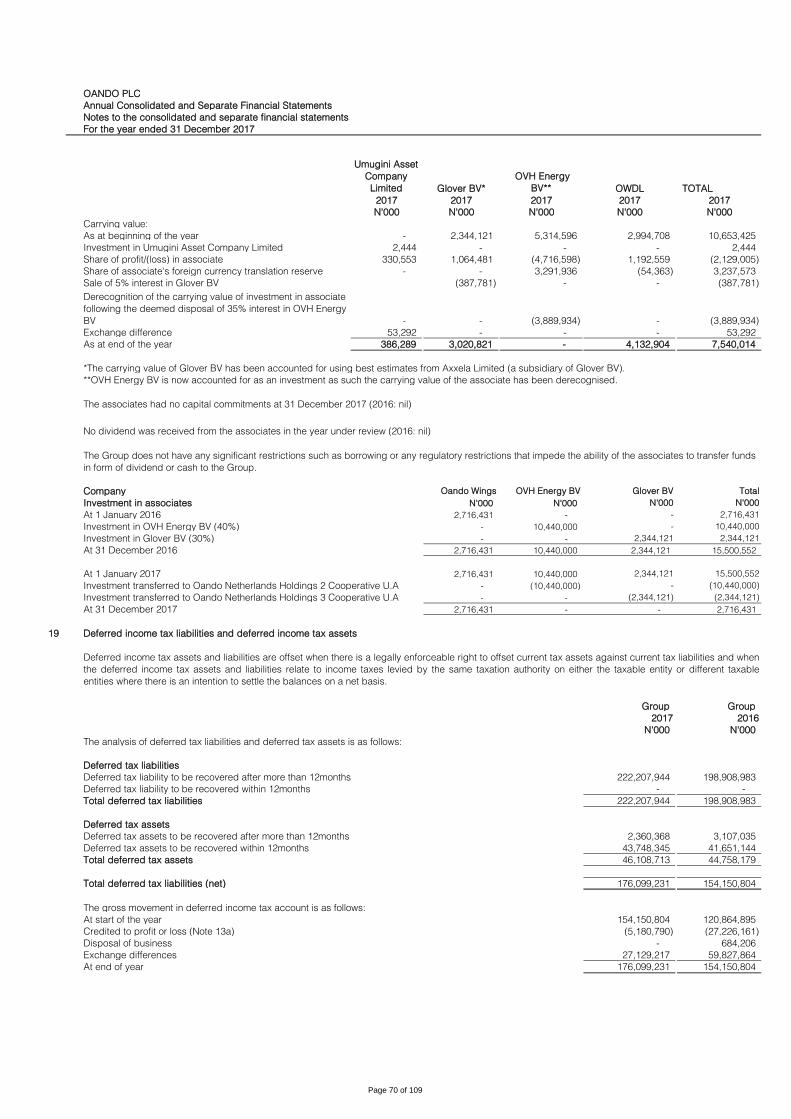
OANDO PLC
Annual Consolidated and Separate Financial Statements
Notes to the consolidated and separate financial statements
For the year ended 31 December 2017
Umugini Asset
Company
Limited Glover BV*
OVH Energy
BV** OWDL TOTAL
2017 2017 2017 2017 2017
N'000 N'000 N'000 N'000 N'000
Carrying value:
As at beginning of the year - 2,344,121 5,314,596 2,994,708 10,653,425
Investment in Umugini Asset Company Limited 2,444 - - - 2,444
Share of profit/(loss) in associate 330,553 1,064,481 (4,716,598) 1,192,559 (2,129,005)
Share of associate's foreign currency translation reserve - - 3,291,936 (54,363) 3,237,573
Sale of 5% interest in Glover BV (387,781) - - (387,781)
- - (3,889,934) - (3,889,934)
Exchange difference 53,292 - - - 53,292
As at end of the year 386,289 3,020,821 - 4,132,904 7,540,014
*The carrying value of Glover BV has been accounted for using best estimates from Axxela Limited (a subsidiary of Glover BV).
**OVH Energy BV is now accounted for as an investment as such the carrying value of the associate has been derecognised.
No dividend was received from the associates in the year under review (2016: nil)
Company Oando Wings OVH Energy BV Glover BV Total
N'000 N'000 N'000 N'000
At 1 January 2016 2,716,431 - - 2,716,431
Investment in OVH Energy BV (40%) - 10,440,000 - 10,440,000
Investment in Glover BV (30%) - - 2,344,121 2,344,121
At 31 December 2016 2,716,431 10,440,000 2,344,121 15,500,552
At 1 January 2017 2,716,431 10,440,000 2,344,121 15,500,552
Investment transferred to Oando Netherlands Holdings 2 Cooperative U.A - (10,440,000) - (10,440,000)
Investment transferred to Oando Netherlands Holdings 3 Cooperative U.A - - (2,344,121) (2,344,121)
At 31 December 2017 2,716,431 - - 2,716,431
19
Group Group
2017 2016
N'000 N'000
The analysis of deferred tax liabilities and deferred tax assets is as follows:
Deferred tax liabilities
Deferred tax liability to be recovered after more than 12months 222,207,944 198,908,983
Deferred tax liability to be recovered within 12months - -
Total deferred tax liabilities 222,207,944 198,908,983
Deferred tax assets
Deferred tax assets to be recovered after more than 12months 2,360,368 3,107,035
Deferred tax assets to be recovered within 12months 43,748,345 41,651,144
Total deferred tax assets 46,108,713 44,758,179
Total deferred tax liabilities (net) 176,099,231 154,150,804
The gross movement in deferred income tax account is as follows:
At start of the year 154,150,804 120,864,895
Credited to profit or loss (Note 13a) (5,180,790) (27,226,161)
Disposal of business - 684,206
Exchange differences 27,129,217 59,827,864
At end of year 176,099,231 154,150,804
The associates had no capital commitments at 31 December 2017 (2016: nil)
The Group does not have any significant restrictions such as borrowing or any regulatory restrictions that impede the ability of the associates to transfer funds
in form of dividend or cash to the Group.
Investment in associates
Deferred income tax liabilities and deferred income tax assets
Deferred income tax assets and liabilities are offset when there is a legally enforceable right to offset current tax assets against current tax liabilities and when
the deferred income tax assets and liabilities relate to income taxes levied by the same taxation authority on either the taxable entity or different taxable
entities where there is an intention to settle the balances on a net basis.
Derecognition of the carrying value of investment in associate
following the deemed disposal of 35% interest in OVH Energy
BV
Page 70 of 109

OANDO PLC
Annual Consolidated and Separate Financial Statements
Notes to the consolidated and separate financial statements
For the year ended 31 December 2017
GROUP
1.1.2016:
Continuing
operations
Charged/
(credited) to
P/L
Disposal of
business
Exchange
Differences
31.12.2016
N'000 N'000 N'000 N'000 N'000
2016
Deferred income tax liabilities
143,694,600 (33,808,953) (67,695) 70,903,576 180,721,528
Intangible assets - (377,491) 377,491 - -
Finance Leases 11,757,286 147,788 - 6,282,381 18,187,455
Financial instruments 455,538 - (455,538) - -
155,907,424 (34,038,656) (145,742) 77,185,957 198,908,983
Deferred income tax assets
Provisions (35,090,489) 9,589,156 741,391 (16,921,158) (41,681,100)
Tax losses - (2,669,351) - (437,684) (3,107,035)
Retirement benefit obligation 125,861 (96,802) - 897 29,956
Financial instruments (77,901) (10,508) 88,557 (148) -
(35,042,529) 6,812,495 829,948 (17,358,093) (44,758,179)
120,864,895 (27,226,161) 684,206 59,827,864 154,150,804
1.1.2017:
Continuing
operations
Charged/
(credited) to
P/L
Adjustments Exchange
Differences
31.12.2017
N'000 N'000 N'000 N'000 N'000
2017
Deferred income tax liabilities
180,721,528 (11,320,456) 192,561 30,959,559 200,553,192
Finance Leases 18,187,455 144,601 - 3,322,696 21,654,752
198,908,983 (11,175,855) 192,561 34,282,255 222,207,944
Deferred income tax assets
Provisions (41,681,100) 4,866,784 (162,605) (6,771,424) (43,748,345)
Tax losses (3,107,035) 1,128,281 - (381,614) (2,360,368)
Retirement benefit obligation 29,956 (29,956) - -
(44,758,179) 5,995,065 (192,561) (7,153,038) (46,108,713)
154,150,804 (5,180,790) - 27,129,217 176,099,231
Analysis of deferred tax charge for the year: 2017 2016
N'000 N'000
- Continuing operations (Note 13) (5,180,790) (33,565,679)
- Discontinued operations (Note 13) - (1,104,122)
(5,180,790) (34,669,801)
Net deferred income tax
Deferred tax asset relating to unutilised tax losses carried forward are recognised if it is probable that they can be offset against future taxable profits or
existing temporary differences. As at 31 December 2017, the Group had unused tax losses of N304.3 billion (2016: N254.9 billion) relating to tax losses from
Oando PLC (Company) and OER which were not recognised. Management is of the view that due to the structure of the companies, sufficient taxable profit
may not be generated in the nearest future to absorb the reversal of the deferred tax. The tax losses can be carried forward indefinitely. Oando PLC and OER
do not have any unrecognised deffered tax liability.
At 31 December 2017, there was no recognised deferred tax liability (2016: Nil) for taxes that would be payable on the unremitted earnings of certain of the
Group’s subsidiaries, associate or joint venture. The Group has determined that undistributed profits of its subsidiaries, joint venture or associate will not be
distributed in the foreseeable future.
Consolidated deferred income tax assets and liabilities, deferred income tax charge/(credit) in the statement of profit or loss, in equity and other
comprehensive income are attributable to the following items:
Property, plant and equipment and
Exploration and evaluation assets
Net deferred income tax
liabilities
Property, plant and equipment and
Exploration and evaluation assets
Page 71 of 109

OANDO PLC
Annual Consolidated and Separate Financial Statements
Notes to the consolidated and separate financial statements
For the year ended 31 December 2017
20 Derivative financial assets Group Group Company Company
2017 2016 2017 2016
N'000 N'000 N'000 N'000
Commodity option contracts (i) 18,572 6,932,527 - -
18,572 6,932,527 - -
Analysis of total derivative financial assets
Non current - 844,438 - -
Current 18,572 6,088,089 - -
Total 18,572 6,932,527 - -
i Commodity option contracts
Volume Fair value
Position Remaining term Fixed ($) Strike ($) Premium (bbl/d)2
=N=
- Purchased put1
Jan 2018 to Dec 2018 - 45.00 - 600 18,572
The table below summarizes the details of the financial commodity contracts in place as at December 31, 2017 as a result of these arrangements:
Price/Unit
1 Financial commodities contract associated with the Corporate Finance Loan Facility.
2 Average volume over the remaining life of the contract.
On June 9, 2017, OER entered into an early settlement with hedging counterparties on the hedges associated with the Corporate Finance Facility. OER also
entered into a reset arrangement on the Corporate Finance Facility related hedges which is effective from July 2017. The crystallization of the hedges resulted
in the receipt of $10.3 million in net cash ($11.4 million relating to settlement of hedges offset against $1.1 million representing the cost of the reset). The
proceeds were used to repay existing debt obligation.
The hedges associated with the Senior Secured Facility expired in July 2017 and OER received a final settlement of $4.1 million. OER effectively received total
net cash of $14.4 million during the year relating to both crystalized and expired hedges.
Derivatives, including financial commodity contracts, are initially recognized at fair value on the date the derivative contract is entered into and are
subsequently re-measured at their fair value with the resulting gains or losses recognized as income or expense in the statement of profit or loss in the period.
For the year ended December 31, 2017, OER recorded net fair value loss on financial commodity contracts of N2.6 billion (2017: $8.3 million; 2016-N26.8
billion; $102.1 million). OER also realized net gains of N7 billion (2017:$22.7 million; 2016 - N16.98 billion; $64.8 million) from monthly settlements on the
financial commodity contracts.
The fair value of commodity contracts is calculated based on observable inputs which include forward prices of crude oil.
The company has unused tax losses of N137 billion (2016: N117.8 billion) for which no deferred tax was recognised. There is no time limit within which the tax
assets could be utilised.
Page 72 of 109

OANDO PLC
Annual Consolidated and Separate Financial Statements
Notes to the consolidated and separate financial statements
For the year ended 31 December 2017
21 Finance lease receivables Group Group Company Company
2017 2016 2017 2016
N'000 N'000 N'000 N'000
Finance lease receivable - Current - - - -
Finance lease receivable - Non Current 72,539,702 60,926,511 - -
72,539,702 60,926,511 - -
(i)
The receivables under the finance leases are as follows
Group Group Company Company
2017 2016 2017 2016
Non-current receivable N'000 N'000 N'000 N'000
Finance lease - gross receivables 170,489,824 150,807,015 - -
Unearned finance income (97,950,122) (89,880,504) - -
72,539,702 60,926,511 - -
Current receivables
Finance lease - gross receivables - - - -
Unearned finance income - - - -
- - - -
Group Group Company Company
2017 2016 2017 2016
N'000 N'000 N'000 N'000
No later than one year:
Total future value 7,866,944 6,496,500 - -
Unearned interest income (8,292,494) (6,971,080) - -
Present value (425,550) (474,580) - -
Between one and five years:
Total future value 33,485,827 27,652,215 - -
Unearned interest income (33,370,882) (28,216,160) - -
Present value 114,945 (563,945) - -
Later than five years:
Total future value 69,808,718 66,439,980 - -
Unguaranteed residual value 59,328,335 50,218,250 - -
Unearned interest income (56,286,746) (54,693,210) - -
Present value 72,850,307 61,965,020 - -
Finance lease receivable 72,539,702 60,926,495 - -
Gross receivables from finance lease
Not later than one year 7,866,944 6,496,532 - -
Later than one year and not later than five years 33,485,827 35,003,021 - -
Later than five years 129,137,053 109,307,462 - -
170,489,824 150,807,015 - -
Unearned future finance income on finance lease (97,950,122) (89,880,504) - -
Net investment in finance lease 72,539,702 60,926,511 - -
OER, as a party to the NAOC/POCNL/NNPC JV entered into a power purchase agreement with Power Holding Company of Nigeria (now Nigerian Bulk
Electricity Trading ‚NBET‛) in 2001. The agreement is to develop, finance, construct, own maintain and operate as a joint operations an upstream gas project.
The gas project is located in Kwale for the production of electric power (‚the Kwale-Okpai Independent Power Plant‛ or ‚Kwale IPP‛). The gas plant utilizes
fuel source from the natural gas reserves in jointly operated oil fields operated by Nigeria Agip Oil Company Limited (NAOC). The agreement will continue in
full force and effect for 20 years from the Commercial operations date with the option of renewal of 5 years. At the end of the 25th year, PHCN shall have the
option to purchase the Kwale IPP at a fair price determined by an expert. PHCN will pay a contracted sum to the Joint operations partners throughout the
tenure for capacity and for the purchase of electricity from the plant. Th etransaction has been accounted for as a finance lease.
The unguaranteed residual value has been estimated to be N59.3 billion ($164.7million). The lease payments grow over time but are lower than the interest
income for the first five years and as such all the finance lease receivable has been considered as non-current.
The net investment in finance lease receivables by the Group amounted to N72.5 billion ($201. 3 million) at December 31, 2017 (2016: N60.9 billion; $199.8
million) and will bear interest until their maturity dates of N98 billion; $271.8 million (2016: N89.9 billion; $294.7 million). The increase is attributable to
exchange difference. The fair value of the lease receivable as at 31 December 2017 is N63.9 billion; $177.6 million (2016: N43.9 billion; $143.9 million).
Page 73 of 109
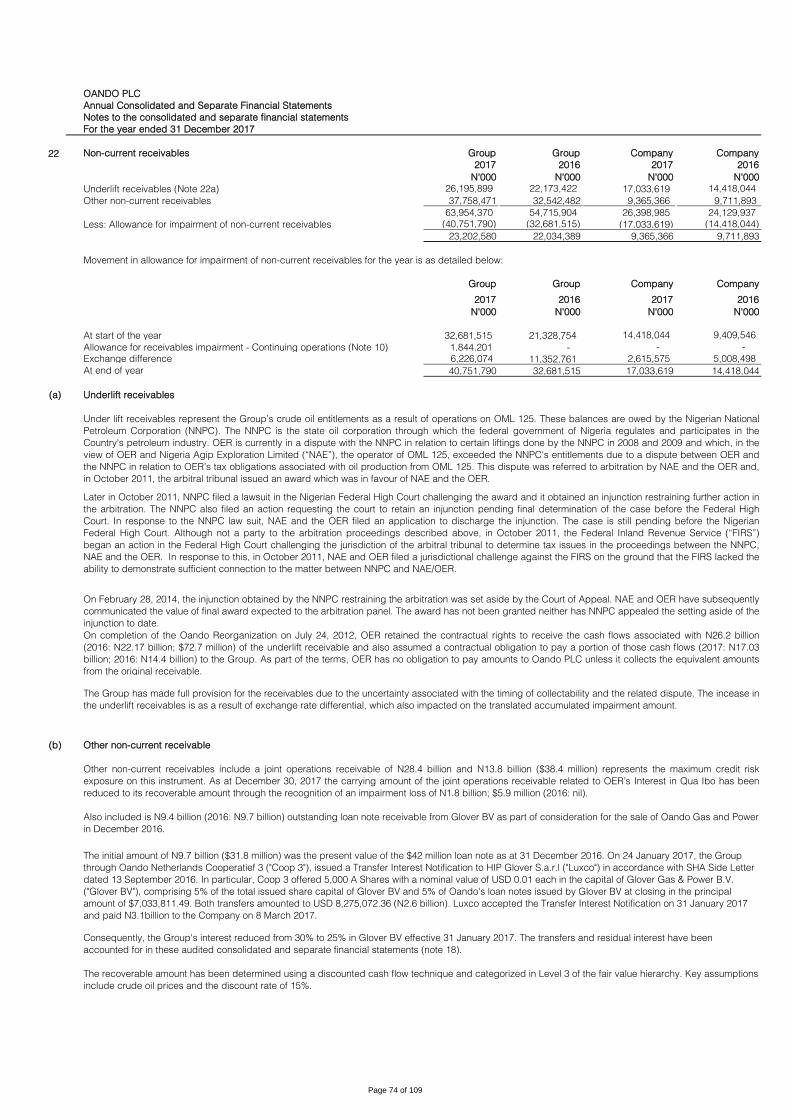
OANDO PLC
Annual Consolidated and Separate Financial Statements
Notes to the consolidated and separate financial statements
For the year ended 31 December 2017
22 Non-current receivables Group Group Company Company
2017 2016 2017 2016
N'000 N'000 N'000 N'000
26,195,899 22,173,422 17,033,619 14,418,044
37,758,471 32,542,482 9,365,366 9,711,893
63,954,370 54,715,904 26,398,985 24,129,937
(40,751,790) (32,681,515) (17,033,619) (14,418,044)
23,202,580 22,034,389 9,365,366 9,711,893
Group Group Company Company
2017 2016 2017 2016
N'000 N'000 N'000 N'000
32,681,515 21,328,754 14,418,044 9,409,546
1,844,201 - - -
Exchange difference 6,226,074 11,352,761 2,615,575 5,008,498
At end of year 40,751,790 32,681,515 17,033,619 14,418,044
(a)
(b) Other non-current receivable
Other non-current receivables include a joint operations receivable of N28.4 billion and N13.8 billion ($38.4 million) represents the maximum credit risk
exposure on this instrument. As at December 30, 2017 the carrying amount of the joint operations receivable related to OER’s Interest in Qua Ibo has been
reduced to its recoverable amount through the recognition of an impairment loss of N1.8 billion; $5.9 million (2016: nil).
Also included is N9.4 billion (2016: N9.7 billion) outstanding loan note receivable from Glover BV as part of consideration for the sale of Oando Gas and Power
in December 2016.
The initial amount of N9.7 billion ($31.8 million) was the present value of the $42 million loan note as at 31 December 2016. On 24 January 2017, the Group
through Oando Netherlands Cooperatief 3 ("Coop 3"), issued a Transfer Interest Notification to HIP Glover S.a.r.l ("Luxco") in accordance with SHA Side Letter
dated 13 September 2016. In particular, Coop 3 offered 5,000 A Shares with a nominal value of USD 0.01 each in the capital of Glover Gas & Power B.V.
("Glover BV"), comprising 5% of the total issued share capital of Glover BV and 5% of Oando's loan notes issued by Glover BV at closing in the principal
amount of $7,033,811.49. Both transfers amounted to USD 8,275,072.36 (N2.6 billion). Luxco accepted the Transfer Interest Notification on 31 January 2017
and paid N3.1billion to the Company on 8 March 2017.
Consequently, the Group's interest reduced from 30% to 25% in Glover BV effective 31 January 2017. The transfers and residual interest have been
accounted for in these audited consolidated and separate financial statements (note 18).
The recoverable amount has been determined using a discounted cash flow technique and categorized in Level 3 of the fair value hierarchy. Key assumptions
include crude oil prices and the discount rate of 15%.
Underlift receivables
Under lift receivables represent the Group’s crude oil entitlements as a result of operations on OML 125. These balances are owed by the Nigerian National
Petroleum Corporation (NNPC). The NNPC is the state oil corporation through which the federal government of Nigeria regulates and participates in the
Country's petroleum industry. OER is currently in a dispute with the NNPC in relation to certain liftings done by the NNPC in 2008 and 2009 and which, in the
view of OER and Nigeria Agip Exploration Limited (‚NAE‛), the operator of OML 125, exceeded the NNPC's entitlements due to a dispute between OER and
the NNPC in relation to OER’s tax obligations associated with oil production from OML 125. This dispute was referred to arbitration by NAE and the OER and,
in October 2011, the arbitral tribunal issued an award which was in favour of NAE and the OER.
Later in October 2011, NNPC filed a lawsuit in the Nigerian Federal High Court challenging the award and it obtained an injunction restraining further action in
the arbitration. The NNPC also filed an action requesting the court to retain an injunction pending final determination of the case before the Federal High
Court. In response to the NNPC law suit, NAE and the OER filed an application to discharge the injunction. The case is still pending before the Nigerian
Federal High Court. Although not a party to the arbitration proceedings described above, in October 2011, the Federal Inland Revenue Service (‚FIRS‛)
began an action in the Federal High Court challenging the jurisdiction of the arbitral tribunal to determine tax issues in the proceedings between the NNPC,
NAE and the OER. In response to this, in October 2011, NAE and OER filed a jurisdictional challenge against the FIRS on the ground that the FIRS lacked the
ability to demonstrate sufficient connection to the matter between NNPC and NAE/OER.
On February 28, 2014, the injunction obtained by the NNPC restraining the arbitration was set aside by the Court of Appeal. NAE and OER have subsequently
communicated the value of final award expected to the arbitration panel. The award has not been granted neither has NNPC appealed the setting aside of the
injunction to date.
On completion of the Oando Reorganization on July 24, 2012, OER retained the contractual rights to receive the cash flows associated with N26.2 billion
(2016: N22.17 billion; $72.7 million) of the underlift receivable and also assumed a contractual obligation to pay a portion of those cash flows (2017: N17.03
billion; 2016: N14.4 billion) to the Group. As part of the terms, OER has no obligation to pay amounts to Oando PLC unless it collects the equivalent amounts
from the original receivable.
The Group has made full provision for the receivables due to the uncertainty associated with the timing of collectability and the related dispute. The incease in
the underlift receivables is as a result of exchange rate differential, which also impacted on the translated accumulated impairment amount.
Other non-current receivables
Less: Allowance for impairment of non-current receivables
Movement in allowance for impairment of non-current receivables for the year is as detailed below:
At start of the year
Allowance for receivables impairment - Continuing operations (Note 10)
Underlift receivables (Note 22a)
Page 74 of 109

OANDO PLC
Annual Consolidated and Separate Financial Statements
Notes to the consolidated and separate financial statements
For the year ended 31 December 2017
23 Inventories Group Group Company Company
2017 2016 2017 2016
N'000 N'000 N'000 N'000
1,647,997 1,321,893 - -
935,097 797,857 - -
- 10,684,582 - -
2,583,094 12,804,332 - -
24
Group Group Company Company
2017 2016 2017 2016
N'000 N'000 N'000 N'000
45,340,699 48,664,918 - -
(1,773,006) (1,450,898) - -
43,567,693 47,214,020 - -
66,315,073 64,135,790 41,601,804 16,249,243
Witholding tax receivable 3,884,340 11,577,121 2,817,245 2,817,245
Deposit for import 4,941 37 - -
Amount due from related parties (Note 37) - - 151,474,243 143,928,157
(19,973,091) (15,924,891) (54,304,370) (51,595,951)
93,798,956 107,002,077 141,588,922 111,398,694
Group Group Company Company
2017 2016 2017 2016
N'000 N'000 N'000 N'000
17,375,789 5,399,704 51,595,951 7,248,882
3,329,163 13,877,458 2,533,702 50,332,803
- 780,561 - -
(113,518) (782,743) - (5,985,734)
Disposal of subsidiary - (2,347,205) - -
Exchange difference 1,154,663 771,637 174,717 -
Transfer to disposal group classified as held for sale - (323,623) - -
At end of year 21,746,097 17,375,789 54,304,370 51,595,951
25 Available-for-sale financial assets & investment in subsidiaries
Group Group Company Company
2017 2016 2017 2016
N'000 N'000 N'000 N'000
115,642 137,202 113,985 136,130
Disposal (71,780) - (71,780) -
Impairment loss (note 10) - (22,145) - (22,145)
Fair value gain 17,690 - 17,690 -
Exchange difference 304 585 - -
61,856 115,642 59,895 113,985
At start of the year
At the end of year
Receivables written off during the year as uncollectible
Trade & other receivables are non-interest bearing and are normally settled within one year. The carrying amounts of trade and other receivables for 2017 and
2016 respectively approximate their fair values.
(a) Available-for-sale financial assets represent the Company’s investments in listed securities on the Nigerian Stock Exchange, and they all relates to equity
instruments. Each investment is carried at fair value based on current bid price at the Nigerian Stock Exchange.
The movement in the available-for-sale financial asset is as follows:
The carrying amounts of trade and other receivables for 2017 and 2016 respectively approximate their fair values due to their short term nature. The fair
values are within level 2 of the fair value hierarchy.
Movement in provision for impairment of receivables for the year is as detailed below:
As previously stated:
At start of the year
Allowance for receivables impairment - Continuing operations (Note 10)
Allowance for receivables impairment - Discontinued operations
Other receivables
Less: Allowance for impairment of other receivables
Other receivables during the year under review relates to cash call advances to joint operations partners of N28.8 billion ($80 million), receivable of N1.1
billion ($3 million) from NAE on the sale of OML 125/134 and receivable for services provided to third-party companies of N18.4 billion.
Other receivables in prior year relates to cash call advances to joint operations partners of N18.7 billion ($61.3 million), COP consent refund of N7.6 billion
($24.8 million), receivable receivable for services provided to third-party companies of N20.7 billion and N854 million ($2.8 million) relates to amounts due
from bankers on realized portion of commodity contracts.
Products-in-transit
The cost of inventories recognised as an expense (written down to NRV) and included in ‘cost of sales' was nil (2016: nil). There was no inventory carried at
net realisable value as of the reporting date (2016: nil).
Trade and other receivables
Trade receivables
Less: Allowance for impairment of trade receivables
Finished goods
Materials
Page 75 of 109

OANDO PLC
Annual Consolidated and Separate Financial Statements
Notes to the consolidated and separate financial statements
For the year ended 31 December 2017
Group Group Company Company
2017 2016 2017 2016
Impairment loss represents a significant and prolonged decline in fair value. N'000 N'000 N'000 N'000
(a) Analysis of available-for-sale financial asset
Non current - 2,867 - 2,867
Current 61,856 112,775 59,895 111,118
Total 61,856 115,642 59,895 113,985
(b) Investment in subsidiaries (Cost) Company Company
2017 2016
N'000 N'000
Oando Exploration and Production Limited 3,895,788 3,895,788
Oando Benin 3,997 3,997
Oando Trading Limited Bermuda 3,435,950 3,435,950
OML 112 & 117 Limited 6,538 6,538
Oando Terminal and Logistics Limited 2,500 2,500
Oando Liberia Limited 6,538 6,538
OES Passion Limited 1,752 1,752
OES Professionalism Limited 10,000 10,000
Oando Resources Limited 2,500 2,500
Trading DMCC 917,717 917,717
Oando Oil Limited - -
Oando Exploration Equator Holdings Limited 1,816 1,816 Oando Servco Nig Limited - -
XRS 1 Limited 18 18
Oando Energy Resources Inc. 50,997,513 50,997,513
59,282,627 59,282,627
Allowance for impairment (3,914,078) (3,914,078)
55,368,549 55,368,549
Company Company
2017 2016
N'000 N'000
At start of the year 3,914,078 3,916,943
Liquidated subsidiaries - (2,865)
At end of year 3,914,078 3,914,078
26 Cash and cash equivalents (excluding bank overdrafts) Group Group Company Company
2017 2016 2017 2016
N'000 N'000 N'000 N'000
Cash at bank and in hand 7,895,061 10,390,585 915,653 7,752,128
Restricted cash 12,479,146 6,538,952 - 4,682,749
20,374,207 16,929,537 915,653 12,434,877
Group Group Company Company
2017 2016 2017 2016
N'000 N'000 N'000 N'000
7,895,061 10,390,585 915,653 7,752,128
The weighted average effective interest rate on short-term bank deposits at the year-end was 6.25% (2016: 7%). These deposits have an average maturity of
30 days. The management assessed that the fair value of cash and short term deposits approximates their carrying amounts.
Restricted cash relates to cash collateral and is excluded from cash and cash equivalents for cash flow purposes.
For the purposes of the statement of cash flows, cash and cash equivalents comprise cash in hand, deposits held at call with banks, net of bank overdrafts. In
the statement of financial position, bank overdrafts are included in borrowings under current liabilities. The year-end cash and cash equivalents comprise the
following:
Cash at bank and in hand
Movement in allowance for impairment of investments for the year is as detailed below:
Page 76 of 109

OANDO PLC
Annual Consolidated and Separate Financial Statements
Notes to the consolidated and separate financial statements
For the year ended 31 December 2017
27 Discontinued operations and disposal groups held for sale
Copper JV Co thereafter acquired 100% of the voting interests in Oando PLC’s shareholding interests in some of its selected marketing and supply & trading
companies. Copper JV is owned 60% by HV II and 40% by Oando Netherlands Holdings 2 Cooperative U.A. Oando PLC owns 100% of Oando Netherlands
Holdings 2 Cooperative U.A. As a result of the sale, Oando PLC now owns 40% of voting, legal and economic rights in Copper JV Co (who owns 100% of the
select downstream entities sold by Oando PLC).
The companies sold by Oando PLC and acquired by Copper JV Co are: Oando Marketing Ltd (‘‘Formerly OMP’’) and its subsidiaries (Oando Togo, Oando
Ghana and Clean Cooking Fuels Ltd); Oando Supply and Trading Ltd (‘‘OST’’); Apapa SPM Limited (‘‘ASPM’’); Oando Trippmart Limited (‘‘OTL’’) and Ebony
Oil and Gas Limited ” (‘‘EOGL’’).
As a result of the sale, the Group lost control in the entities sold, but exerts significant influence over Copper JV. The Group accounted for its 40% interest in
Copper JV as an investment in Associate under IAS 28. The initial carrying value of the Associate was determined as the fair value of interest retained of
N10.44billion (pls refer to Note 18 for the current status of this associate).
A (loss)/gain on disposal of (N11.3billion) and N3.8billion, have been recognized in the 2016 consolidated financial statement (under profit after tax for the
year from discontinued operations) and separate financial statement respectively.
ii. Sale of Gas & Power entities
On 13 September 2016, the Group signed a Sale & Purchase Agreement (SPA) to dispose 100% shares in Oando Gas and Power Limited (OGP) to Glover BV
a Special Purpose Vehicle owned by Helios. The transaction was concluded in December 2016.
Prior to the sale, the Group restructured/reorganized the shares of the target sale companies. As a result of the restructuring, shares of the target subsidiaries
(Gaslink Nigeria Limited, Central Horizon Gas Company, Highlands LNG Limited, Gasgrid Nigeria Limited, Ajah Distribution Limited, Transit Nigeria Limited,
Lekki Gardens Power Limited) previously held by Oando PLC were transferred to OGP through a group restructuring. Consequently, OGP became the parent
company, and Oando PLC, the ultimate parent of all the target subsidiaries to be sold. However, as at year end, the OGP was sold and the receivable from
the restructuring was settled by Helios the buyer of OGP and realised by the Group.
Consideration received by Oando for the sale of shares includes cash (N14.26bn), deferred consideration (N3.15bn), issue of loan note (N9.7billion) and
share consideration in Glover BV valued at N2.34billion. Following the share consideration, the Group gained 30% shares in Glover BV through Oando Holdco
3, a wholly owned subsidiary of Oando PLC.
As a result of the sale, the Group lost control in OGP, but however exerts significant influence over Glover BV. The Group accounted for its 30% interest in
Glover BV as an investment in Associate under IAS 28. The initial carrying value of the Associate was determined as the fair value of shares transferred to
Oando PLC through Oando Holdco 3. The fair value of the associate at initial recognition in 2016 was N2.34billion (pls refer to Note 18 for the current status of
this associate).
A gain on disposal of N22billion and N28.5billion, have been recognized in the 2016 consolidated financial statement (under profit after tax for the year from
discontinued operations) and separate financial statement respectively.
The Group's interest reduced from 30% to 25% in Glover BV effective 31 January 2017 following the acquisition of 5% interest in Glover BV by Helios. The sale
and residual interest have been accounted for in these audited consolidated and separate financial statements (note 22b).
iii. Sale of Akute Power
On 30th October 2015, the Group signed a Sale and Purchase Agreement ("SPA") for the disposal of 100% of its equity interest in Akute Power Limited to
Viathan Engineering Limited. As a result of the reorganization of the Gas & Power enities prior to the finalization of the sale, Akute Power Limited was
transfered to OGP which was owned 100% by Oando PLC, through a share exchange agreement. The transaction was concluded on 11 March 2016 after
fulfilment of all closing conditions and obligations prior to that date of sale of OGP.
As a result of the sale, the Group lost control in Akute Power and have derecognized all assets and liabilities. A loss on disposal of N1.52billion, have been
recognized in the 2016 audited consolidated financial statements (under profit after tax for the year from discontinued operations).
The assets and liabilities of some target companies of the marketing, refining and terminals and Supply & Trading segments, Oando Energy Services Limited
and Akute Power Limited were presented as held for sale at 31 December 2015, following the approval of the Group’s management and shareholders at the
37th Annual General Meeting (AGM) on 27 October 2014 and approval by the Securities and Exchange Commission ("SEC") to sell the entities. Analysis of the
result of entities classified as discontinued operations and held for sale are as shown below:
(a) Subsidiaries disposed and presented as discontinued operations in/from Q1 2016
i. Sale of Marketing, refining and terminals and Supply & Trading Companies
On 30 June 2016, the Group concluded the sale of some selected down stream entities. Oando entered into a Share Purchase Agreement (SPA) with a
consortium comprising of Helios Investors Partners (‘‘Helios) and The Vitol Group (‘‘Vitol’’) to sell some of its equity interests in some selected Oando
downstream companies in return for consideration. In order to complete the sale transaction, the purchaser, Vitol, entered into a partnership with Helios to
form HV Investments II (‘‘HV II’’). HV II is owned 50% each by both Vitol & Helios. HVII and Oando Netherlands (‘‘herein Oando Coop.’’), created a company
called Copper JV Co.
Page 77 of 109

OANDO PLC
Annual Consolidated and Separate Financial Statements
Notes to the consolidated and separate financial statements
For the year ended 31 December 2017
2016
Oando Energy
Services
Akute Power
Limited
Marketing,
refining and
terminals and
Supply & Trading
segments
Gas and Power Total
N'000 N'000 N'000 N'000 N'000
- 1,819,769 32,943,233 28,478,817 63,241,819 21,437,371 (3,344,531) (44,361,197) (2,845,922) (29,114,279)
Goodwill - - (1,354,317) (4,016,812) (5,371,129)
NCI - - 1,458,632 401,900 1,860,532 21,437,371 (1,524,762) (11,313,649) 22,017,983 30,616,943
(b) Liquidation of subsidiaries
Summarized financial statement
2016
Oando Port-
Harcourt
refinery
Oando Lekki
Refinery
Oando Property
Limited Total
N'000 N'000 N'000 N'000
Asset 2,500 - 13,100 15,600
Liabilities - (376) (374) (750)
Net asset/(liability) 2,500 (376) 12,726 14,850
Share capital (2,500) (2,500) (250) (5,250)
Retained earnings - 2,876 (12,476) (9,600)
Net (asset)/liability (2,500) b 376 c (12,726) (14,850)
Gain on deemed disposal
Fair value of consideration received - - - -
Fair value of interest retained - - - -
Non controlling interest - - - -
- - - -
Net (asset)/liability (2,500) 376 (12,726) (14,850)
Goodwill - - - -
(Loss)/gain on deemed disposal (2,500) 376 (12,726) (14,850)
*The gain/(loss) on disposal of subsidiaries has been presented as part of profit/(loss) from discontinued operations in the 2016 statement of profit or loss.
In 2016, the Company employed the services of Mr. Olajide Oyewole to voluntarily liquidate 3 dormant entities namely Oando Port-Harcourt Refinery Limited,
Oando Lekki Refinery Limited and Oando Property Limited. The liquidation process which commenced sometime ago, was successfully completed.
Consequently, the companies have been dissolved. The liquidation was as a result of dormancy for several years. All creditors/payables have been duly
settled and assets realized with the exception of the amount due to the parent company, Oando PLC.
Consequently, the investment in the subsidiaries have been written off in the 2016 separate financial statement and a loss of N5.2 million recognized in the
2016 statement of profit or loss being the carrying value of the investments before liquidation. Also the net receivable of N435million due from the the entities
were also been written off in 2016.
As a result of cessation of business, control was lost and the subsidiaries are excluded from these consolidated financial statements. A gain on deemed
disposal of N420.38million and loss of N5.25 million was recognized in the 2016 consolidated (under profit after tax for the year from discontinued operations)
and separate statement of profit or loss. The gain on disposal arose due to the net liability position of Oando Lekki Refinery and Oando Property Limited from
amount payable to Oando PLC.
iv. Sale of Oando Energy Services
On 31 December 2015, a Share Purchase and Sale Agreement ("SPA") to sell the entire issued share capital of Oando Energy Services Limited ("OES") to
OES Integrated Services Limited (the buyer), a Nigerian company, under a Management Buy-out (MBO) arrangement was signed. A no objection consent
was obtained by SEC on 31 March 2016. Oando Energy Services was in a net liability position of N20.92billion and was disposed for a consideration of $1.
Consequently the Group lost control and derecognized assets & liabilities of the entity.
A gain/(loss) on disposal of N21.4billion and (N46.97billion), have been recognized in the 2016 consolidated financial statement and separate financial
statement respectively.
Consideration
Net liability/(asset)
Gain/(loss) on disposal*
Page 78 of 109
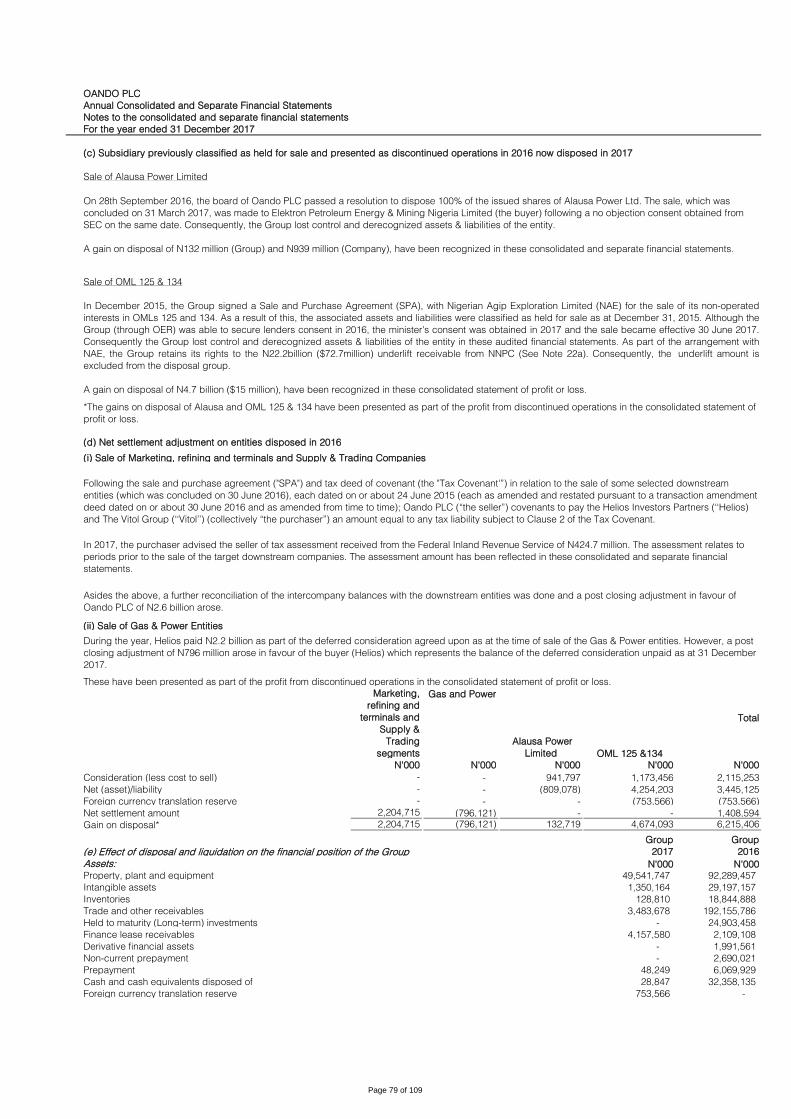
OANDO PLC
Annual Consolidated and Separate Financial Statements
Notes to the consolidated and separate financial statements
For the year ended 31 December 2017
(c) Subsidiary previously classified as held for sale and presented as discontinued operations in 2016 now disposed in 2017
Sale of Alausa Power Limited
(d) Net settlement adjustment on entities disposed in 2016
(i) Sale of Marketing, refining and terminals and Supply & Trading Companies
(ii) Sale of Gas & Power Entities
These have been presented as part of the profit from discontinued operations in the consolidated statement of profit or loss.
Marketing,
refining and
terminals and
Supply &
Trading
segments
Gas and Power
Alausa Power
Limited OML 125 &134
Total
N'000 N'000 N'000 N'000 N'000
- - 941,797 1,173,456 2,115,253 - - (809,078) 4,254,203 3,445,125
Foreign currency translation reserve - - - (753,566) (753,566)
Net settlement amount 2,204,715 (796,121) - - 1,408,594 2,204,715 (796,121) 132,719 4,674,093 6,215,406
Group Group
(e) Effect of disposal and liquidation on the financial position of the Group 2017 2016
Assets: N'000 N'000
Property, plant and equipment 49,541,747 92,289,457
Intangible assets 1,350,164 29,197,157
Inventories 128,810 18,844,888
Trade and other receivables 3,483,678 192,155,786
Held to maturity (Long-term) investments - 24,903,458
Finance lease receivables 4,157,580 2,109,108
Derivative financial assets - 1,991,561
Non-current prepayment - 2,690,021
Prepayment 48,249 6,069,929
Cash and cash equivalents disposed of 28,847 32,358,135
Foreign currency translation reserve 753,566 -
Consideration (less cost to sell)
Net (asset)/liability
Gain on disposal*
Sale of OML 125 & 134
In December 2015, the Group signed a Sale and Purchase Agreement (SPA), with Nigerian Agip Exploration Limited (NAE) for the sale of its non-operated
interests in OMLs 125 and 134. As a result of this, the associated assets and liabilities were classified as held for sale as at December 31, 2015. Although the
Group (through OER) was able to secure lenders consent in 2016, the minister's consent was obtained in 2017 and the sale became effective 30 June 2017.
Consequently the Group lost control and derecognized assets & liabilities of the entity in these audited financial statements. As part of the arrangement with
NAE, the Group retains its rights to the N22.2billion ($72.7million) underlift receivable from NNPC (See Note 22a). Consequently, the underlift amount is
excluded from the disposal group.
A gain on disposal of N4.7 billion ($15 million), have been recognized in these consolidated statement of profit or loss.
*The gains on disposal of Alausa and OML 125 & 134 have been presented as part of the profit from discontinued operations in the consolidated statement of
profit or loss.
Following the sale and purchase agreement ("SPA") and tax deed of covenant (the "Tax Covenant'‛) in relation to the sale of some selected downstream
entities (which was concluded on 30 June 2016), each dated on or about 24 June 2015 (each as amended and restated pursuant to a transaction amendment
deed dated on or about 30 June 2016 and as amended from time to time); Oando PLC (‚the seller‛) covenants to pay the Helios Investors Partners (‘‘Helios)
and The Vitol Group (‘‘Vitol’’) (collectively ‚the purchaser‛) an amount equal to any tax liability subject to Clause 2 of the Tax Covenant.
In 2017, the purchaser advised the seller of tax assessment received from the Federal Inland Revenue Service of N424.7 million. The assessment relates to
periods prior to the sale of the target downstream companies. The assessment amount has been reflected in these consolidated and separate financial
statements.
Asides the above, a further reconciliation of the intercompany balances with the downstream entities was done and a post closing adjustment in favour of
Oando PLC of N2.6 billion arose.
During the year, Helios paid N2.2 billion as part of the deferred consideration agreed upon as at the time of sale of the Gas & Power entities. However, a post
closing adjustment of N796 million arose in favour of the buyer (Helios) which represents the balance of the deferred consideration unpaid as at 31 December
2017.
On 28th September 2016, the board of Oando PLC passed a resolution to dispose 100% of the issued shares of Alausa Power Ltd. The sale, which was
concluded on 31 March 2017, was made to Elektron Petroleum Energy & Mining Nigeria Limited (the buyer) following a no objection consent obtained from
SEC on the same date. Consequently, the Group lost control and derecognized assets & liabilities of the entity.
A gain on disposal of N132 million (Group) and N939 million (Company), have been recognized in these consolidated and separate financial statements.
Page 79 of 109

OANDO PLC
Annual Consolidated and Separate Financial Statements
Notes to the consolidated and separate financial statements
For the year ended 31 December 2017
Group Group
2017 2016
Liabilities: N'000 N'000
Total borrowing (1,553,928) (174,314,001)
Government grant (449,434) (17,499)
Dividend payable - (1,404,490)
Current income tax liabilities (78,299) (4,958,075)
Deferred income tax liabilities (8,468,886) (664,106)
Retirement benefit obligation - (1,822,681)
Other non-current liabilities - (3,152,216)
Provision for other liabilities & charges (14,874,401) (900,087)
Trade and other payables (36,759,253) (180,876,087)
(2,691,560) 34,500,258
Profit on disposal 6,215,406 30,602,093
Effect of disposal and liquidation on the financial position of the Group 3,523,846 65,102,351
Satisfied by:
Consideration received, satisfied in cash (less cost to sell) 90,083 16,081,748
Share exchange - 12,784,121
Purchase price adjustment 913,485 (17,736,444)
Net intercompany payable net off (410,647) 34,371,784
Non-controlling interest (NCI) - 1,860,532
Deferred consideration 2,930,925 17,740,610
3,523,846 65,102,351
Assets of disposal group classified as held for sale Group Group
2017 2016
N'000 N'000
Property, plant and equipment - 41,934,577
Intangible assets - 1,142,841
Finance lease receivables - 4,201,638
Deferred tax assets - 106,409
Inventory - 62,455
Trade and other receivables - 2,301,937
Prepayments - 90,910
Cash and cash equivalents (excluding bank overdrafts) - 205,885
Total assets - 50,046,652
Liabilities of disposal group classified as held for sale
Trade and other payables - 31,384,984
Current income tax liabilities - 66,276
Borrowing - 1,628,127
Provision for other liabilities & charges - 11,715,403
Deferred tax liabilities - 7,274,866
Government Grant - 449,434
Total liabilities - 52,519,090
Subsidiaries classified as held for sale Company Company
2017 2016
N'000 N'000
Investment in subsidiaries
Alausa Power Ltd - 2,500
- 2,500
(f) Analysis of the result of assets and liabilities from the subsidiary classified as held for sale after re-measurement of assets from the disposal group is
as follows:
Page 80 of 109

OANDO PLC
Annual Consolidated and Separate Financial Statements
Notes to the consolidated and separate financial statements
For the year ended 31 December 2017
(g) Results of discontinued operations Group Group
2017 2016
N'000 N'000
Revenue 140,510 113,449,888
Expenses (52,359) (113,489,093)
Profit/(loss) before income tax from discontinued operations 88,151 (39,205)
Income tax expense (Note 13a)* - (1,262,367)
Profit/(loss) after tax from discontinued operations 88,151 (1,301,572)
Gain on sale of discontinued operations 6,215,406 30,602,093
6,215,406 30,602,093
Profit after tax for the year from discontinued operations 6,303,557 29,300,521
*Income tax expense represents income, education and changes in deferred tax.
Cash flows from/(used in) discontinued operations
Net cash used in operating activities (300,527) (4,724,907)
Net cash from/(used in) investing activities 197,688 (137,561)
Net cash (used in)/from financing activities (74,198) 4,421,723
Net cash flows for the year (177,037) (440,745)
28 Share capital & share premium Number of
shares Ordinary shares Share premium Total
(thousands) N'000 N'000 N'000
At 1 January 2016 12,034,618 6,017,309 174,806,923 180,824,232
At 31 December 2016 12,034,618 6,017,309 174,806,923 180,824,232
At 1 January 2017 12,034,618 6,017,309 174,806,923 180,824,232
Conversion of OODP's debt to equity 396,794 198,397 1,781,604 1,980,001
At 31 December 2017 12,431,412 6,215,706 176,588,527 182,804,233
Authorised share capital
29 Other reserves Revaluation
reserves1
Share based
payment
reserve2
Currency
translation
reserve3
Available for sale
reserve4
Total
Group (thousands) N'000 N'000 N'000 N'000
At 1 January 2016 22,186,494 1,620,670 31,943,576 - 55,750,740
Exchange difference on translation of foreign operations 8,488 - 74,276,740 - 74,285,228
- - (22,674,827) - (22,674,827)
8,990,725 8,990,725
469,829 469,829
Reclassification of FCTLR to retained earnings* - - (1,218,976) - (1,218,976)
(22,194,982) - - - (22,194,982)
At 31 December 2016 - 2,090,499 91,317,238 - 93,407,737
At 1 January 2017 - 2,090,499 91,317,238 - 93,407,737
Exchange difference on translation of foreign operations - - 42,848,217 - 42,848,217
- - (5,118,409) (5,118,409)
- - 374,151 - 374,151
- - (3,291,936) (3,291,936)
Share of associate's foreign currency translation reserve 3,237,573 - 3,237,573
Fair value (loss)/gain on available for sale financial assets - - - 17,690 17,690
At 31 December 2017 - 2,090,499 129,366,834 17,690 131,475,022
Reclassification of revaluation reserve to retained earnings*
Exchange loss on net investment in foreign operations
Change in ownership interests in subsidiaries that do not
result in a loss of control
Reclassification of share of OVH Energy BV's foreign currency
translation reserve
Ocean and Oil Development Partners ("OODP") notified the Company of its intention to convert N1.98billion in exchange for 396,793,587 fully paid Ordinary
Shares of the Company's common equity. The Company filed the conversion notice with the Securities and Exchange Commission ("SEC") in 2016 and
received SEC's approval during the period under review. The shares have been alloted to OODP and recognised under equity in these consolidated and
separate financial statements.
Change in ownership interests in subsidiaries that do not
result in a loss of control
Exchange differences on net investment in foreign operations
Value of employee services
Analysis of the result of discontinued operations, and the result recognised on the re-measurement of assets or
disposal group is as follows:
The total authorised number of Ordinary Shares is fifteen (15) billion (2015: 15 billion) with a par value of 50 Kobo per share. All issued shares are fully paid.
Page 81 of 109

OANDO PLC
Annual Consolidated and Separate Financial Statements
Notes to the consolidated financial statement
For the year ended 31 December 2017
*In line with IFRS 10, items previously recognised in OCI have been transferred to retained earnings upon disposal of subsidiary.
Other reserves Share based2
payment reserve
Available for sale
reserve4
Total
Company N'000 N'000 N'000
At 1 January 2016 - - -
At 31 December 2016 - - -
Share based2
payment reserve
Available for sale
reserve4
Total
N'000 N'000 N'000
At 1 January 2017 - - -
Fair value (loss)/gain on available for sale financial assets - 17,690 17,690
Deferred tax on fair value gain on available for sale financial assets - - -
At 31 December 2017 - 17,690 17,690
30 Borrowings Group Group Company Company
2017 2016 2017 2016
N'000 N'000 N'000 N'000
Borrowings are made up as follows:
99,587,920 101,639,606 87,320,834 87,320,834
Bank loans 137,854,339 142,516,317 17,239,886 20,594,276
Convertible note - 1,961,792 - 1,961,792
137,854,339 144,478,109 17,239,886 22,556,068
Total borrowings 237,442,259 246,117,715 104,560,720 109,876,902
(b) Current
Revaluation reserve(1)
The revaluation reserve is used to recognise revaluation increase (surplus) on property, plant and equipment. However, the increase is recognised in surplus
or deficit to the extent that it reverses a revaluation decrease of the same asset previously recognised in surplus or deficit. Revaluation reserve is not available
for redistribution to shareholders until realised through disposal of related assets.
Share based payment reserve(2)
The share-based payment reserve is used to recognise the value of equity-settled share-based payments provided to employees, including key management
personnel, as part of their remuneration. Share based payment reserve is not available for distribution to shareholders. As a result of the delisting from the TSX
in 2016, all outstanding stock options became fully vested.
Share options issued to employees and officers of OER as compensation for services received had different strike prices and vesting periods. As these
options were accounted for as equity settled share based payments, a share based payment reserve had been created in OER’s books until the time of
vesting per the share option contract held with the employee.
However as a result of the delisting from TSX, there was an accelerated vesting of all outstanding options granted to the employees. As such some options
were in-the-money (7,410,000 units) and others were out-of-the-money (1,600,000 units) at transaction date. All option holders with exercise price of CAD 1.08
and CAD 1.14 (converted to US$ at close date of $0.84 and $0.88 respectively) which is less than the offer price of US$1.20 were to get the difference in
value between the converted exercise price and the offer price. These category of option holders are deemed to be in-the-money and an oustanding
settlement obligation of N613 million (2017: $1.7 million; 2016: $2.2 million) has been recorded in the books of OER. The remaining option holders are not in-
the-money and are not entitled to any payments.
Currency translation reserve(3)
The translation reserve comprises all foreign currency difference arising from the translation of the financial statements of foreign operations, as well as
intercompany balances arising from net investment in foreign operations.
Available for sale reserve(4)
Changes in the fair value and exchange differences arising on translation of investments that are classified as available-for-sale financial assets (eg equities),
are recognised in other comprehensive income and accumulated in a separate reserve within equity. Amounts are reclassified to profit or loss when the
associated assets are sold or impaired.
(a) Non-current - Bank
The Group accounted for an increase in the decommissioning obligation as a corresponding increase in the value of the decommissioning asset under
property, plant and equipment. IFRIC 1 requires that any decrease/increase in the decommissioning costs for assets measured under the revaluation model
be recognised as an increase/decrease in the revaluation surplus account. There was an increase in the re-measurement of the decommissioning obligation
estimate during the year. However, the subsidiary with the revaluation reserve was disposed in 2016, hence there was no IFRIC 1 adjustment (2016: nil).
Page 82 of 109
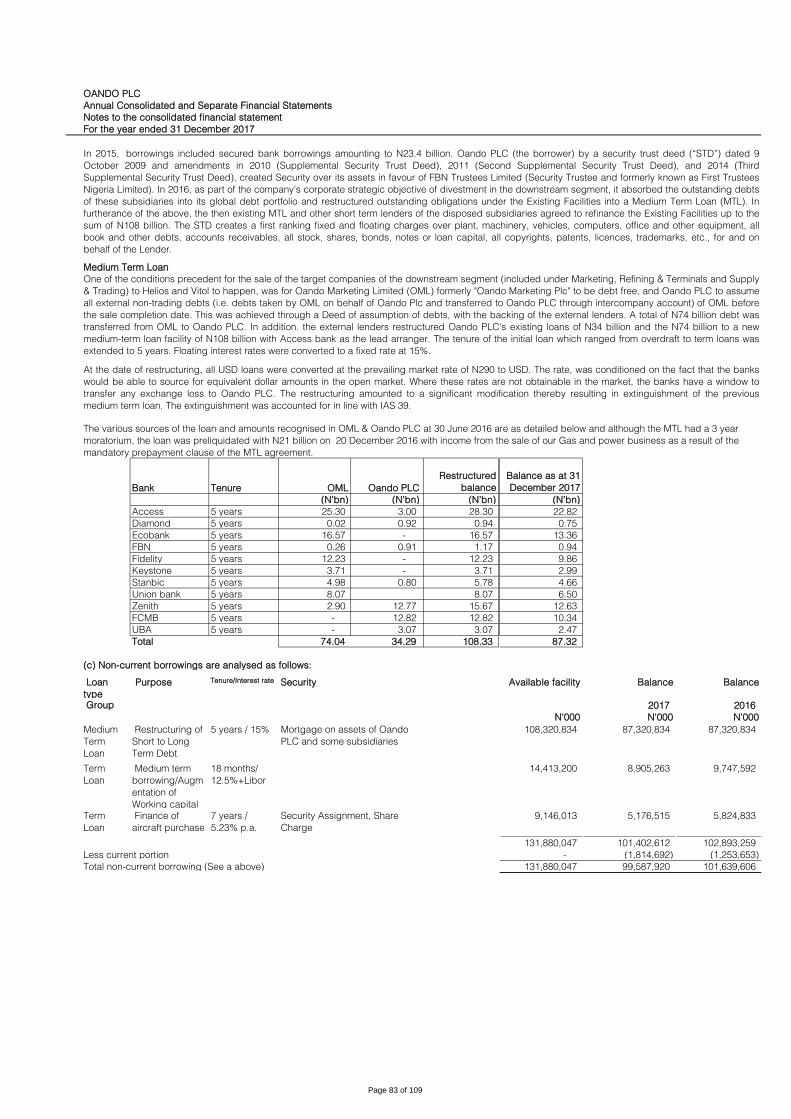
OANDO PLC
Annual Consolidated and Separate Financial Statements
Notes to the consolidated financial statement
For the year ended 31 December 2017
Bank Tenure OML Oando PLC
Restructured
balance
Balance as at 31
December 2017
(N’bn) (N’bn) (N’bn) (N’bn)
Access 5 years 25.30 3.00 28.30 22.82
Diamond 5 years 0.02 0.92 0.94 0.75
Ecobank 5 years 16.57 - 16.57 13.36
FBN 5 years 0.26 0.91 1.17 0.94
Fidelity 5 years 12.23 - 12.23 9.86
Keystone 5 years 3.71 - 3.71 2.99
Stanbic 5 years 4.98 0.80 5.78 4.66
Union bank 5 years 8.07 8.07 6.50
Zenith 5 years 2.90 12.77 15.67 12.63
FCMB 5 years - 12.82 12.82 10.34
UBA 5 years - 3.07 3.07 2.47
Total 74.04 34.29 108.33 87.32
(c) Non-current borrowings are analysed as follows:
Loan
type
Purpose Tenure/Interest rate Security Available facility Balance Balance
Group 2017 2016
N'000 N'000 N'000
Medium
Term
Loan
Restructuring of
Short to Long
Term Debt
5 years / 15% 108,320,834 87,320,834 87,320,834
Term
Loan
Medium term
borrowing/Augm
entation of
Working capital
18 months/
12.5%+Libor
14,413,200 8,905,263 9,747,592
Term
Loan
Finance of
aircraft purchase
7 years /
5.23% p.a.
9,146,013 5,176,515 5,824,833
131,880,047 101,402,612 102,893,259
Less current portion - (1,814,692) (1,253,653)
Total non-current borrowing (See a above) 131,880,047 99,587,920 101,639,606
Mortgage on assets of Oando
PLC and some subsidiaries
Security Assignment, Share
Charge
In 2015, borrowings included secured bank borrowings amounting to N23.4 billion. Oando PLC (the borrower) by a security trust deed (‚STD‛) dated 9
October 2009 and amendments in 2010 (Supplemental Security Trust Deed), 2011 (Second Supplemental Security Trust Deed), and 2014 (Third
Supplemental Security Trust Deed), created Security over its assets in favour of FBN Trustees Limited (Security Trustee and formerly known as First Trustees
Nigeria Limited). In 2016, as part of the company’s corporate strategic objective of divestment in the downstream segment, it absorbed the outstanding debts
of these subsidiaries into its global debt portfolio and restructured outstanding obligations under the Existing Facilities into a Medium Term Loan (MTL). In
furtherance of the above, the then existing MTL and other short term lenders of the disposed subsidiaries agreed to refinance the Existing Facilities up to the
sum of N108 billion. The STD creates a first ranking fixed and floating charges over plant, machinery, vehicles, computers, office and other equipment, all
book and other debts, accounts receivables, all stock, shares, bonds, notes or loan capital, all copyrights, patents, licences, trademarks, etc., for and on
behalf of the Lender.
Medium Term Loan
One of the conditions precedent for the sale of the target companies of the downstream segment (included under Marketing, Refining & Terminals and Supply
& Trading) to Helios and Vitol to happen, was for Oando Marketing Limited (OML) formerly "Oando Marketing Plc" to be debt free, and Oando PLC to assume
all external non-trading debts (i.e. debts taken by OML on behalf of Oando Plc and transferred to Oando PLC through intercompany account) of OML before
the sale completion date. This was achieved through a Deed of assumption of debts, with the backing of the external lenders. A total of N74 billion debt was
transferred from OML to Oando PLC. In addition. the external lenders restructured Oando PLC's existing loans of N34 billion and the N74 billion to a new
medium-term loan facility of N108 billion with Access bank as the lead arranger. The tenure of the initial loan which ranged from overdraft to term loans was
extended to 5 years. Floating interest rates were converted to a fixed rate at 15%.
At the date of restructuring, all USD loans were converted at the prevailing market rate of N290 to USD. The rate, was conditioned on the fact that the banks
would be able to source for equivalent dollar amounts in the open market. Where these rates are not obtainable in the market, the banks have a window to
transfer any exchange loss to Oando PLC. The restructuring amounted to a significant modification thereby resulting in extinguishment of the previous
medium term loan. The extinguishment was accounted for in line with IAS 39.
The various sources of the loan and amounts recognised in OML & Oando PLC at 30 June 2016 are as detailed below and although the MTL had a 3 year
moratorium, the loan was preliquidated with N21 billion on 20 December 2016 with income from the sale of our Gas and power business as a result of the
mandatory prepayment clause of the MTL agreement.
Page 83 of 109

OANDO PLC
At 1 January 2016
Notes to the consolidated and separate financial statements
For the year ended 31 December 2017
Available facility Balance Balance
2017 2016
Company N'000 N'000 N'000
Medium
Term
Loan
Restructuring of
Short to Long
Term Debt
5 years / 15%
108,320,834 87,320,834 87,320,834
Less current portion - - -
Total non-current borrowing (See a above) 108,320,834 87,320,834 87,320,834
(d) Current borrowings are analysed as follows:
Loan
type
Purpose Tenure/Interest
rate Security Balance Balance
Group 2017 2016
N'000 N'000
Import
finance
facility
To purchase
petroleum
products for
resale
30-90days
- 6,182,367
Other
loans 1,849,753 1,910,962
Convertibl
e note
Conversion of
loans to shares
upon maturity - 1,961,792
Corporate
finance
facility
Acquisition of
the COP assets
6 years / 9.5%
+ Libor p.a.
78,221,878 65,512,780
RBL Acquisition of
COP assets
5 years / 8.5%
+Libor p.a.
38,728,130 47,062,279
Bridge
Facility
Refinanced from
ODS Sale by a
Medium Term
Loan in June
2016
15%
- 11,110,082
Asset
Acquistio
n Finance
Conoco Phillips
asset acquisition
LIBOR +10.5%
- 6,482,314
Working
Capital
Finance
Working Capital
Finance
NIBOR + 1.5%
- 3,001,880
Bridge
Facility Working Capital
Facility
15%
7,043,835 -
Promisorr
y Note Term loan 1year libor+2%
6,247,380 -
Term loan Term loan - 107,736 -
RFF Loan OWDL rental
funding facility 3,840,935 -
136,039,647 143,224,456
Current portion of non-current borrowings 1,814,692 1,253,653
Total current borrowing (See b above) 137,854,339 144,478,109
Sales proceeds of products
financed
Oando Legacy assets
COP Assets
MTL Security package
Mortgage on assets of Oando
PLC and some subsidiaries
Page 84 of 109
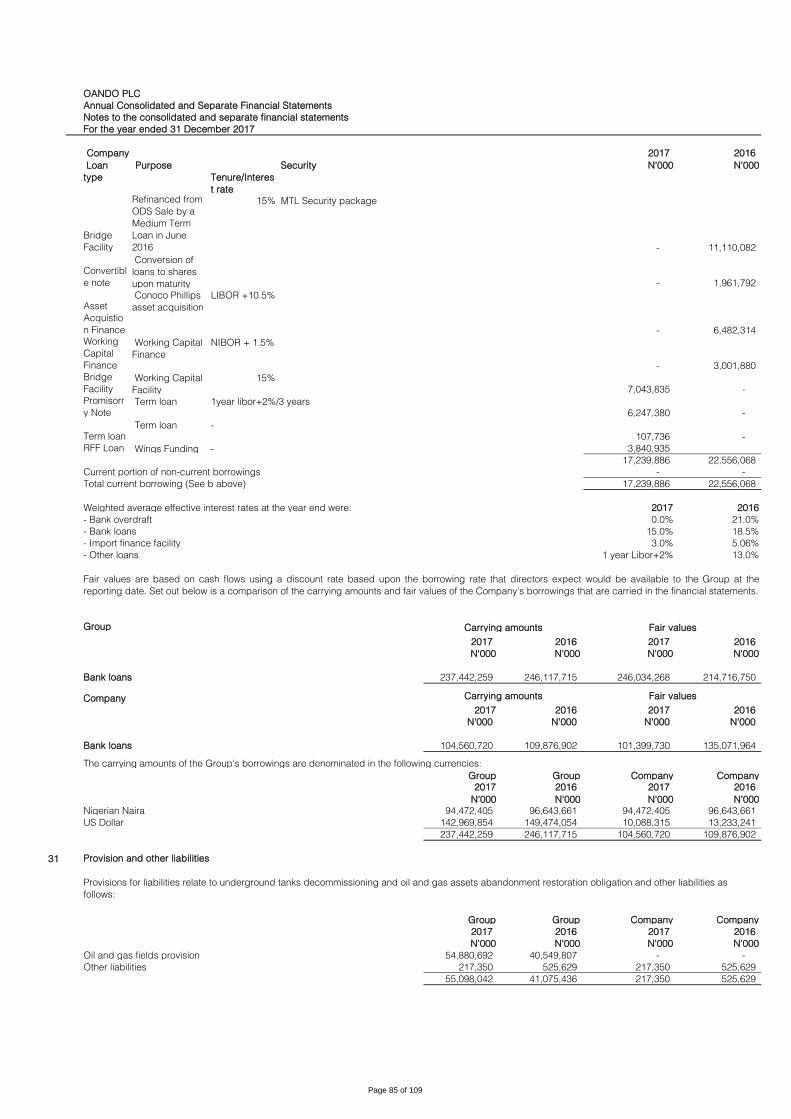
OANDO PLC
Annual Consolidated and Separate Financial Statements
Notes to the consolidated and separate financial statements
For the year ended 31 December 2017
Company 2017 2016
Loan
type
Purpose
Tenure/Interes
t rate
Security N'000 N'000
Bridge
Facility
Refinanced from
ODS Sale by a
Medium Term
Loan in June
2016
15%
- 11,110,082
Convertibl
e note
Conversion of
loans to shares
upon maturity - 1,961,792
Asset
Acquistio
n Finance
Conoco Phillips
asset acquisition
LIBOR +10.5%
- 6,482,314
Working
Capital
Finance
Working Capital
Finance
NIBOR + 1.5%
- 3,001,880
Bridge
Facility Working Capital
Facility
15%
7,043,835 -
Promisorr
y Note Term loan 1year libor+2%/3 years
6,247,380 -
Term loan Term loan -
107,736 -
RFF Loan Wings Funding - 3,840,935
17,239,886 22,556,068
Current portion of non-current borrowings - -
Total current borrowing (See b above) 17,239,886 22,556,068
Weighted average effective interest rates at the year end were: 2017 2016
- Bank overdraft 0.0% 21.0%
- Bank loans 15.0% 18.5%
- Import finance facility 3.0% 5.06%
- Other loans 1 year Libor+2% 13.0%
Group
2017 2016 2017 2016
N'000 N'000 N'000 N'000
Bank loans 237,442,259 246,117,715 246,034,268 214,716,750
Company
2017 2016 2017 2016
N'000 N'000 N'000 N'000
Bank loans 104,560,720 109,876,902 101,399,730 135,071,964
The carrying amounts of the Group's borrowings are denominated in the following currencies:
Group Group Company Company
2017 2016 2017 2016
N'000 N'000 N'000 N'000
Nigerian Naira 94,472,405 96,643,661 94,472,405 96,643,661
US Dollar 142,969,854 149,474,054 10,088,315 13,233,241
237,442,259 246,117,715 104,560,720 109,876,902
31 Provision and other liabilities
Group Group Company Company
2017 2016 2017 2016
N'000 N'000 N'000 N'000
Oil and gas fields provision 54,880,692 40,549,807 - -
Other liabilities 217,350 525,629 217,350 525,629
55,098,042 41,075,436 217,350 525,629
Carrying amounts Fair values
Provisions for liabilities relate to underground tanks decommissioning and oil and gas assets abandonment restoration obligation and other liabilities as
follows:
Fair values are based on cash flows using a discount rate based upon the borrowing rate that directors expect would be available to the Group at the
reporting date. Set out below is a comparison of the carrying amounts and fair values of the Company’s borrowings that are carried in the financial statements.
Carrying amounts Fair values
MTL Security package
Page 85 of 109

OANDO PLC
Annual Consolidated and Separate Financial Statements
Notes to the consolidated and separate financial statements
For the year ended 31 December 2017
Group Group
2017 2016
N'000 N'000
Movement during the year in provisions for decommissioning cost is as follows:
At 1 January
- Opening balance 40,549,807 41,499,048
- (Reduction)/additional provisions on tank decommissioning in the year* (1,146,956) (32,525,818)
Charged/(credited) to the statement of profit or loss
- Unwinding of discount 6,994,106 8,151,034
- Exchange differences 8,483,735 23,425,543
Balance at 31 December 54,880,692 40,549,807
Group Group Company Company
2017 2016 2017 2016
N'000 N'000 N'000 N'000
Movement in other liabilities during the year is as follows:
At 1 January 525,629 2,434,105 525,629 2,434,105
Additions - 525,629 - 525,629
Settlement (308,279) (2,434,105) (308,279) (2,434,105)
217,350 525,629 217,350 525,629
Group Group Company Company
2017 2016 2017 2016
N'000 N'000 N'000 N'000
Analysis of total provisions and other liabilities
Non current 54,880,692 40,549,807 - -
Current 217,350 525,629 217,350 525,629
Total 55,098,042 41,075,436 217,350 525,629
32 Derivative financial liabilities Group Group Company Company
2017 2016 2017 2016
N'000 N'000 N'000 N'000
Convertible options (Note 30) - 199,137 - 199,137
Analysis of total derivative financial liabilities
Non current - - - -
Current - 199,137 - 199,137
Total - 199,137 - 199,137
33 Retirement benefit obligations Group Group Company Company
2017 2016 2017 2016
N'000 N'000 N'000 N'000
(a) Statement of financial position obligations for:
Gratuity - 1,161,705 - 782,416
(b) Statement of profit or loss charge (Note 11b):
Gratuity 54,065 (26,524) 46,524 40,707
Fair value gain of N181 million (2016: N4.96 billion) was recognised on the convertible option converted during the year in these statement of profit or loss.
The decommissioning provision represent the present value of decommissioning cost relating to oil & gas assets. These provisions have been created based
on internal estimates, and the estimates are reviewed regularly to take account of material changes to the assumptions.
The Group accounted for an increase in the decommissioning obligation as a corresponding increase in the value of the decommissioning asset under
property, plant and equipment. IFRIC 1 requires that any increase in the decommissioning costs for assets measured under the revaluation model be
recognised as a decrease in the revaluation surplus account. The key assumption upon which the carrying amount of the decommissioning obligation is
based is a discount rates ranging from 15.61% to 15.82% (2016: 15.73% to 19.75%) and an inflation rate of 12.7% (2016: 12.9%). These obligations are
expected to be settled over the next two to thirty-five years.
*N91.4 million of this amount has been expensed as this relates to decommisioning cost on OML 90 for which the carrying value of PPE has been fully
impaired and deemed irrecoverable.
Other liabilities in 2017 relates to bid deposits received on the sale of Alausa which is yet to be fully refunded to the initial buyer (2016: bid deposits received
on the sale of Alausa). This was classfied as current as the sale has been finalised in Q1 2017 (see Note 27c).
Page 86 of 109

OANDO PLC
Annual Consolidated and Separate Financial Statements
Notes to the consolidated and separate financial statements
For the year ended 31 December 2017
(c) Other comprehensive income Group Group Company Company
2017 2016 2017 2016
N'000 N'000 N'000 N'000
- - - -
The gratuity scheme is funded.
The movement in the defined benefit obligation over the year is as follows:
Group Group Company Company
2017 2016 2017 2016
At 1 January: N'000 N'000 N'000 N'000
Opening balance: Contiuing operations 1,161,705 1,487,923 782,416 850,598
Interest cost 65,095 216,165 57,554 56,221
Interest cost not passed through statement of profit or loss - - - -
Exchange differences 69,391 (61,773) - -
Benefits paid (1,285,161) (141,529) (754,311) (39,021)
Disposal - (323,567) - -
Write back* (11,030) (15,514) (11,030) (15,514)
Transfer - - (74,629) (69,868)
At 31 December - 1,161,705 - 782,416
Transfers relates to liabilities of employees transferrred to other entities within the group.
(d) The amount recognised in the statement of profit or loss are as follows Group Group Company Company
2017 2016 2017 2016
N'000 N'000 N'000 N'000
Write back* (11,030) (15,514) (11,030) (15,514)
Interest cost 65,095 216,165 57,554 56,221
Exchange difference - (227,175) - -
54,065 (26,524) 46,524 40,707
*Write back represents reversal of excess provision on exited staff's liability.
34 Trade and other payables Group Group Company Company
2017 2016 2017 2016
N'000 N'000 N'000 N'000
34,470,762 86,717,711 - -
25,220,712 8,187,185 - -
40,189,452 46,215,803 18,063,702 27,864,518
5,687,037 4,174,531 2,819,371 2,172,200
82,367,982 53,164,258 6,419,681 8,496,114
- - 90,086,514 38,080,946
187,935,945 198,459,488 117,389,268 76,613,778
35 Dividend payable Group Group Company Company
2017 2016 2017 2016
N'000 N'000 N'000 N'000
Unpaid dividend 1,650,277 1,650,277 1,650,277 1,650,277
Other payables relates to mainly outstanding royalties.
Trade & other payables are non-interest bearing and are normally settled within one year. The carrying amounts of trade and other payables for 2017 and
2016 respectively approximate their fair values.
Amount due to related parties
Trade payables - Products
Trade payables - Other vendors
Other payables
Statutory payables (WHT, VAT, PAYE etc)
Accrued expenses
Remeasurement losses recognised in the statement of other comprehensive
income in the period
Page 87 of 109

OANDO PLC
Annual Consolidated and Separate Financial Statements
Notes to the consolidated and separate financial statements
For the year ended 31 December 2017
36 Supplementary cash flow information
(a) Cash generated from operations
Group Group Company Company
2017 2016 2017 2016
N'000 N'000 N'000 N'000
Restated* Restated*
Profit/(loss) before income tax - continuing operations 20,764,585 (62,956,942) (30,599,529) (27,934,427)
Profit before income tax - discontinued operations 6,303,557 30,562,888 - -
Adjustment for:
Interest income (Note 12) (9,959,732) (7,256,765) (2,926,404) (27,417)
Interest expenses (Note 12) 35,794,297 58,313,162 19,166,179 33,260,203
Interest income - Discontinued operations (153,630) (4,634,717) - -
Interest expenses - Discontinued operations 23,397 2,943,055 - -
Depreciation (Note 10) 18,759,712 18,062,016 152,622 175,281
Amortisation of intangible assets (Note 10) 186,016 601,391 19,774 101,896
Impairment of intangible assets (Note 16) 162,377 - 162,377 -
Impairment of property, plant and equipment (Note 10) - 16,001,499 - -
Impairment losses on available for sale asset (Note 25a) - 22,145 - 22,145
Impairment allowance on non-current receivables (Note 22) 1,844,201 - - -
Impairment allowance on current receivables (Note 24) 3,342,237 15,094,452 2,533,702 50,332,803
Dividend income - - - (5,376,430)
Share of loss of an associate (Note 18) 2,129,005 4,661,510 - -
Profit/(loss) on sale of property, plant and equipment (Note 10) (16,039) 40,559 (4,399) 3,280
Unwinding of discount on provisions (Note 12a) 7,949,563 9,506,662 - -
Profit on sale of investments (36,705,184) - - -
Profit/(loss) on sale of subsidiary (Note 27d) (1,541,313) (30,602,093) 18,343,699 (57,166,653)
Profit on sale of OMLs 125&134 (Note 27d) (4,674,093) - -
Share based payment expense (options and swaps) - 469,829 - -
Write off of property, plant and equipment (Note 15) 223,909 - - -
Net foreign exchange (gain)/loss (1,653,862) 12,801,175 2,102,379 (261,357)
Fair value loss on commodity options 2,995,655 9,776,438 - -
Proceeds from early hedge settlement 5,175,929 - - -
Fair value gain on valuation of investment property (note 17) (905,017) - (905,017) -
Fair value gain on convertible options (Note 9, 32) (180,929) (4,961,665) (180,929) (4,961,665)
Changes in working capital
Receivables and prepayments (current) 691,573 (87,067,988) (17,199,869) 110,566,136
Non-current receivables and prepayments 308,819 (7,030,012) (1,845,539) 7,519
Inventories 12,492,268 (16,552,338) - -
Payables and accrued expenses 21,828,245 176,115,908 16,611,539 (87,915,464)
Gratuity provisions 54,064 (192,862) (28,105) (29,161)
Government grant - 434,884 - -
85,239,610 134,152,191 5,402,480 10,796,689
*Certain amounts shown here do not correspond to the 2016 financial statements and reflect adjustments made, refer to Note 44d.
(b) Changes in liabilities arising from financing activities
GROUP
1-Jan-17 Cash flows Foreign
exchange
movement
Other 31-Dec-17
N'000 N'000 N'000 N'000 N'000
Current interest bearing loans and borrowings 144,478,109 (31,391,175) 23,919,242 848,164 137,854,340
Non-current interest bearing loans and borrowings 101,639,606 (7,044,285) 2,440,059 2,552,540 99,587,920
Dividends payable 1,650,277 1,650,277
Total liabilities from financing activities 247,767,992 (38,435,460) 26,359,301 3,400,704 239,092,537
Reconciliation of profit before income tax to cash generated from operations:
Page 88 of 109
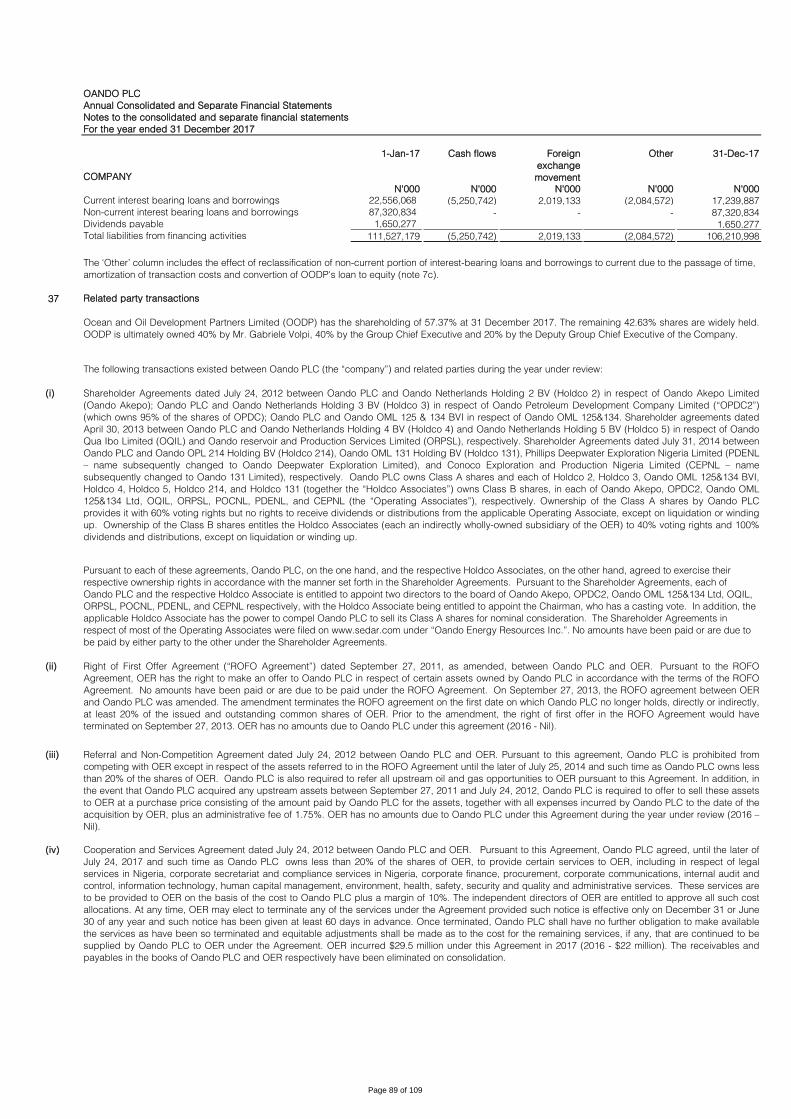
OANDO PLC
Annual Consolidated and Separate Financial Statements
Notes to the consolidated and separate financial statements
For the year ended 31 December 2017
COMPANY
1-Jan-17 Cash flows Foreign
exchange
movement
Other 31-Dec-17
N'000 N'000 N'000 N'000 N'000
Current interest bearing loans and borrowings 22,556,068 (5,250,742) 2,019,133 (2,084,572) 17,239,887
Non-current interest bearing loans and borrowings 87,320,834 - - - 87,320,834
Dividends payable 1,650,277 1,650,277
Total liabilities from financing activities 111,527,179 (5,250,742) 2,019,133 (2,084,572) 106,210,998
37 Related party transactions
The following transactions existed between Oando PLC (the ‚company‛) and related parties during the year under review:
(i)
(ii)
(iii)
(iv) Cooperation and Services Agreement dated July 24, 2012 between Oando PLC and OER. Pursuant to this Agreement, Oando PLC agreed, until the later of
July 24, 2017 and such time as Oando PLC owns less than 20% of the shares of OER, to provide certain services to OER, including in respect of legal
services in Nigeria, corporate secretariat and compliance services in Nigeria, corporate finance, procurement, corporate communications, internal audit and
control, information technology, human capital management, environment, health, safety, security and quality and administrative services. These services are
to be provided to OER on the basis of the cost to Oando PLC plus a margin of 10%. The independent directors of OER are entitled to approve all such cost
allocations. At any time, OER may elect to terminate any of the services under the Agreement provided such notice is effective only on December 31 or June
30 of any year and such notice has been given at least 60 days in advance. Once terminated, Oando PLC shall have no further obligation to make available
the services as have been so terminated and equitable adjustments shall be made as to the cost for the remaining services, if any, that are continued to be
supplied by Oando PLC to OER under the Agreement. OER incurred $29.5 million under this Agreement in 2017 (2016 - $22 million). The receivables and
payables in the books of Oando PLC and OER respectively have been eliminated on consolidation.
The ‘Other’ column includes the effect of reclassification of non-current portion of interest-bearing loans and borrowings to current due to the passage of time,
amortization of transaction costs and convertion of OODP's loan to equity (note 7c).
Ocean and Oil Development Partners Limited (OODP) has the shareholding of 57.37% at 31 December 2017. The remaining 42.63% shares are widely held.
OODP is ultimately owned 40% by Mr. Gabriele Volpi, 40% by the Group Chief Executive and 20% by the Deputy Group Chief Executive of the Company.
Shareholder Agreements dated July 24, 2012 between Oando PLC and Oando Netherlands Holding 2 BV (Holdco 2) in respect of Oando Akepo Limited
(Oando Akepo); Oando PLC and Oando Netherlands Holding 3 BV (Holdco 3) in respect of Oando Petroleum Development Company Limited (‚OPDC2‛)
(which owns 95% of the shares of OPDC); Oando PLC and Oando OML 125 & 134 BVI in respect of Oando OML 125&134. Shareholder agreements dated
April 30, 2013 between Oando PLC and Oando Netherlands Holding 4 BV (Holdco 4) and Oando Netherlands Holding 5 BV (Holdco 5) in respect of Oando
Qua Ibo Limited (OQIL) and Oando reservoir and Production Services Limited (ORPSL), respectively. Shareholder Agreements dated July 31, 2014 between
Oando PLC and Oando OPL 214 Holding BV (Holdco 214), Oando OML 131 Holding BV (Holdco 131), Phillips Deepwater Exploration Nigeria Limited (PDENL
” name subsequently changed to Oando Deepwater Exploration Limited), and Conoco Exploration and Production Nigeria Limited (CEPNL ” name
subsequently changed to Oando 131 Limited), respectively. Oando PLC owns Class A shares and each of Holdco 2, Holdco 3, Oando OML 125&134 BVI,
Holdco 4, Holdco 5, Holdco 214, and Holdco 131 (together the ‚Holdco Associates‛) owns Class B shares, in each of Oando Akepo, OPDC2, Oando OML
125&134 Ltd, OQIL, ORPSL, POCNL, PDENL, and CEPNL (the ‚Operating Associates‛), respectively. Ownership of the Class A shares by Oando PLC
provides it with 60% voting rights but no rights to receive dividends or distributions from the applicable Operating Associate, except on liquidation or winding
up. Ownership of the Class B shares entitles the Holdco Associates (each an indirectly wholly-owned subsidiary of the OER) to 40% voting rights and 100%
dividends and distributions, except on liquidation or winding up.
Pursuant to each of these agreements, Oando PLC, on the one hand, and the respective Holdco Associates, on the other hand, agreed to exercise their
respective ownership rights in accordance with the manner set forth in the Shareholder Agreements. Pursuant to the Shareholder Agreements, each of
Oando PLC and the respective Holdco Associate is entitled to appoint two directors to the board of Oando Akepo, OPDC2, Oando OML 125&134 Ltd, OQIL,
ORPSL, POCNL, PDENL, and CEPNL respectively, with the Holdco Associate being entitled to appoint the Chairman, who has a casting vote. In addition, the
applicable Holdco Associate has the power to compel Oando PLC to sell its Class A shares for nominal consideration. The Shareholder Agreements in
respect of most of the Operating Associates were filed on www.sedar.com under ‚Oando Energy Resources Inc.‛. No amounts have been paid or are due to
be paid by either party to the other under the Shareholder Agreements.
Right of First Offer Agreement (‚ROFO Agreement‛) dated September 27, 2011, as amended, between Oando PLC and OER. Pursuant to the ROFO
Agreement, OER has the right to make an offer to Oando PLC in respect of certain assets owned by Oando PLC in accordance with the terms of the ROFO
Agreement. No amounts have been paid or are due to be paid under the ROFO Agreement. On September 27, 2013, the ROFO agreement between OER
and Oando PLC was amended. The amendment terminates the ROFO agreement on the first date on which Oando PLC no longer holds, directly or indirectly,
at least 20% of the issued and outstanding common shares of OER. Prior to the amendment, the right of first offer in the ROFO Agreement would have
terminated on September 27, 2013. OER has no amounts due to Oando PLC under this agreement (2016 - Nil).
Referral and Non-Competition Agreement dated July 24, 2012 between Oando PLC and OER. Pursuant to this agreement, Oando PLC is prohibited from
competing with OER except in respect of the assets referred to in the ROFO Agreement until the later of July 25, 2014 and such time as Oando PLC owns less
than 20% of the shares of OER. Oando PLC is also required to refer all upstream oil and gas opportunities to OER pursuant to this Agreement. In addition, in
the event that Oando PLC acquired any upstream assets between September 27, 2011 and July 24, 2012, Oando PLC is required to offer to sell these assets
to OER at a purchase price consisting of the amount paid by Oando PLC for the assets, together with all expenses incurred by Oando PLC to the date of the
acquisition by OER, plus an administrative fee of 1.75%. OER has no amounts due to Oando PLC under this Agreement during the year under review (2016 ”
Nil).
Page 89 of 109

OANDO PLC
Annual Consolidated and Separate Financial Statements
Notes to the consolidated and separate financial statements
For the year ended 31 December 2017
(v)
(vi)
(vii)
(viii)
(ix)
(x)
v.Triton Aviation Limited provided management services consisting of consumables, jet fuel, handling charges, third party charters, aircraft maintenance and
crew maintenance to XRS II, an indirect subsidiary of the Company and was paid fees of N93.7million and reimbursement of N430.9million (2016: fees ”
N79.9million, reimbursement - N413million) for the provision of the services. In addition to the reimbursement of N413million in 2016, the Group paid N8.3
million to Triton for aircraft charter. Triton Aviation Limited is owned by the GCE.
vi. Templars and Associates provided legal services worth N1.2bn (Nil: 2016) in connection with upstream merger, acquisition and disposal of oil mining
license and the recovery of the overpayment of N6.5billion (USD24.75million) consent fees levied on the acquisition of upstream assets. The managing partner
of Templars and Associates is a non-executive director in Oando PLC.
vii. OER provided financial sponsorship, which amounted to N15.5 million, to Temple Production Ltd. The Director of Temple Production Ltd is a close family
member of the DGCE.
Facility Agreement dated October 3, 2017 between Rand Merchant Bank Nigeria Limited (the ‚Lender‛), Gaslink Nigeria Limited (the ‚Borrower‛), Oando Gas
& Power Limited (the ‚Guarantor‛) and Oando PLC. Under the Agreement, Gaslink Nigeria Limited (the ‚Borrower‛) borrowed N3.5 billion from the Lender at
an annual rate of NIBOR plus applicable margin of 5% for a tenor of one year. The parties agreed that, if the Borrower does not repay the outstanding
principal plus all accrued interest on the repayment date, Oando PLC shall have the option to provide the Oando Facility to the Borrower for the purpose of
liquidation of the obligation. If Oando exercises the Oando Facility Option, the Borrower and Oando shall enter into, and shall procure that their affiliates shall
enter into, such documents and do all things Oando may reasonably require in order to effect the Oando Equity Conversion in Oando Gas and Power Limited
Oando Gas and Power Limited is owned by an associate of the Group.
Other related party transactions include:
i. Broll Properties Services Limited provided facilities management services consisting of structural, electrical and equipment maintenance and consumables
for which the Group reimbursed the company N102.2million. In addition, the Group paid N9.5million fees for the services rendered (2016: reimbursable ”
N151million, fees ” N10.2million). The GCE has control over one of the joint interest owners of the company.
ii. Noxie Limited supplied office equipment worth N201.6 million (2016: N86.3 million) to Oando PLC. A close family member of the GCE has control over Noxie
Limited.
iii. Olajide Oyewole & co. rendered professional services worth N7.7million (2016: N235.6 million) to Oando PLC. A close family member of the GCE has
significant influence over the firm.
iv. SCIB Nigeria and Co. Ltd. (‚SCIB‛) provided insurance brokerage services worth N122 million (2016: N1 billion) to various members of the Group. A
beneficial owner of SCIB is related to the GCE.
Transitional Services Agreement dated July 24, 2012 between OER, Oando Servco Nigeria (a subsidiary of OER) and OEPL (a subsidiary of Oando PLC).
Pursuant to this Agreement, OER and Oando Servco Nigeria ("Servco") agreed that Servco would provide services to OEPL until January 24, 2014 for no more
than 10% of the employees’ normal working hours per month. OEPL is required to pay Servco’s costs of providing such services. OER through Servco has
N6.4 billion ($17.7 million) due from OEPL (2016: N5.4 billion/$17.7 million), under this Agreement in respect of services provided. During 2017, OER impaired
part of the receivable by N2.2 billion ($6.9 million). The impairment amount was reversed on consolidation. In addition, the receivables and payables in the
books of OEPL and OER respectively have been eliminated on consolidation.
Pursuant to the completion of the Oando reorganization in July 2012, the cumulative amount advanced by Oando PLC to Equator Exploration Limited,
subsidiary of OER (‚EEL‛) of N1.1billion (US$7.2 million) as of 21 December 2012 was classified as loan payable in EEL’s books and loan receivable in Oando
PLC’s books. The carrying amount of the loan using effective interest method was N1.3billion at 31 December 2012. The amount increased to N2.4 billion at
31 December 2015 (2014: N2.0 billion) due to accrued interest. During 2016, the Company impaired the receivable and accrued interest of N2.7 billion. In
2017, the Company accrued an interest of N368 million which was also impaired. The impairment was reversed on consolidation. In addition, the receivables
and payables in the books of the Company and EEL respectively have been eliminated on consolidation.
The Company signed an amendment to the operating lease agreement with a subsidiary, XRSII Ltd in 2015. The Company, the lessee in the agreement,
agreed to lease the Bombardier XRS aircraft owned by XRS11 Ltd, the lessor, for a period of earlier of eighty four months from the execution date and date of
termination of the agreement. XRS II Ltd recognized income of N3.8 billion which arose from the agreement in 2017 (2016: N2.9 billion). In addition, the
outstanding loan amount from XRSII to the Company was N3.2 billion (2016:N2.7 billion). The income and loan have been eliminated on consolidation.
Settlement Deed agreement dated October 1, 2017 between Oando PLC, Oando Netherlands Holdings 2 Cooperatief U.A, HV Investments II B.V and OVH
Energy B.V, following the completion of the sale of target downstream subsidiaries, pursuant to a Sale and Purchase Agreement dated on or about 24 June
2015 (as amended on or about 28 January 2016 and 30 June 2016) revealed that Oando PLC owed OVH Energy BV approximately $112m being the net
adjustment amount. Oando PLC and OVH Energy BV agreed settlement of the net adjustment amount as follows: a dilution of Oando Netherlands Holdings 2
Cooperatief U.A to 5% from 40% through the issuance of 210,000 additional A shares to HV Investments II B.V. Further to the dilution, Oando PLC (through
Oando Netherlands Holdings 2 Cooperatief U.A) shall be entitled to an option to buy buy 13,333 B Shares in OVH B.V (Option 1); or 28,235 B Shares in OVH
B.V (Option 2) ; or 45,000 B Shares in OVH B.V (Option 3).
Debt Assumption deed dated November 1, 2016 between Oando PLC (the Borrower) and Oando Wings Development Limited (the Lessor), Oando PLC has
leased certain premises from Oando Wings Development Limited under the terms of a lease agreement dated 20 August 2012, as amended. In order to
meet rental payment obligations to the landlord, Oando PLC entered into a Rental Funding Facilities Agreement (comprising of US$10.725 Facility A and
US$9.775 Facilities B) with RMB Westport Wings Limited and SB Wings Development Limited (the ‚Lenders‛).. Oando PLC had drawn down N3.8billion
(US$10.7 million) under the Rental Funding Facilities Agreement as of the reporting date.
Page 90 of 109
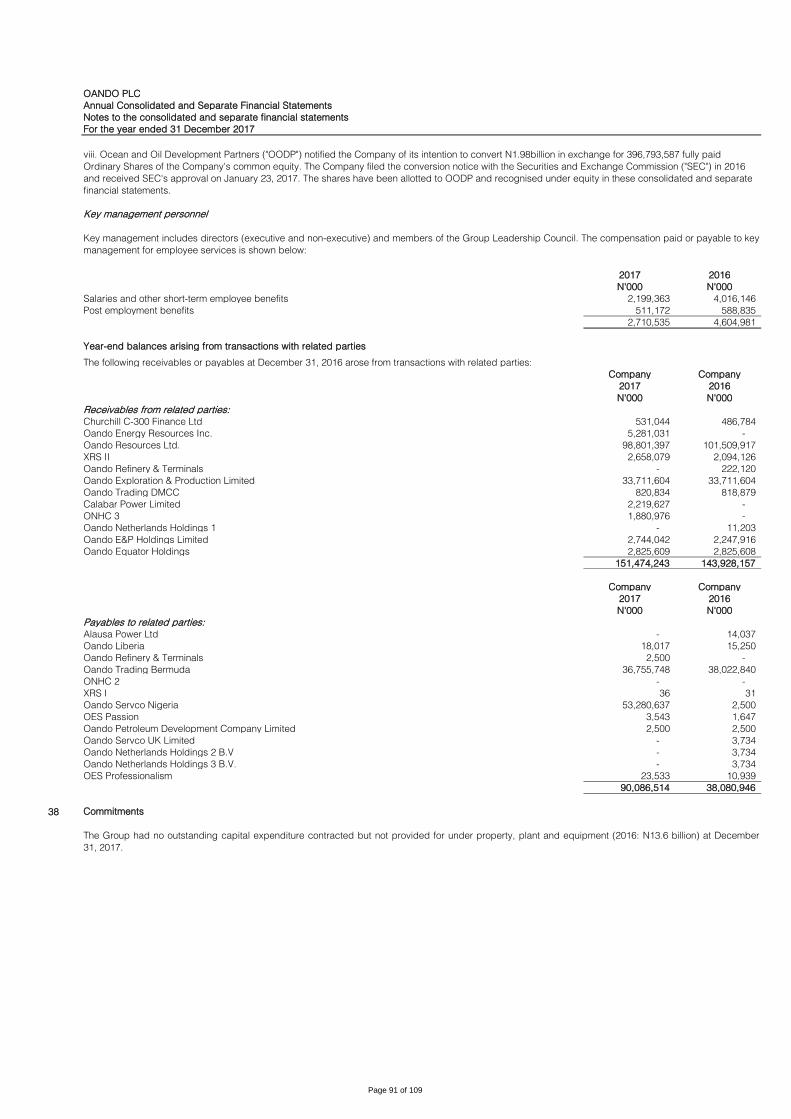
OANDO PLC
Annual Consolidated and Separate Financial Statements
Notes to the consolidated and separate financial statements
For the year ended 31 December 2017
Key management personnel
2017 2016
N'000 N'000
Salaries and other short-term employee benefits 2,199,363 4,016,146
Post employment benefits 511,172 588,835
2,710,535 4,604,981
Year-end balances arising from transactions with related parties
The following receivables or payables at December 31, 2016 arose from transactions with related parties:
Company Company
2017 2016
N'000 N'000
Receivables from related parties:
Churchill C-300 Finance Ltd 531,044 486,784
Oando Energy Resources Inc. 5,281,031 -
Oando Resources Ltd. 98,801,397 101,509,917
XRS II 2,658,079 2,094,126
Oando Refinery & Terminals - 222,120
Oando Exploration & Production Limited 33,711,604 33,711,604
Oando Trading DMCC 820,834 818,879
Calabar Power Limited 2,219,627 -
ONHC 3 1,880,976 -
Oando Netherlands Holdings 1 - 11,203
Oando E&P Holdings Limited 2,744,042 2,247,916
Oando Equator Holdings 2,825,609 2,825,608
151,474,243 143,928,157
Company Company
2017 2016
N'000 N'000
Payables to related parties:
Alausa Power Ltd - 14,037
Oando Liberia 18,017 15,250
Oando Refinery & Terminals 2,500 -
Oando Trading Bermuda 36,755,748 38,022,840
ONHC 2 - -
XRS I 36 31
Oando Servco Nigeria 53,280,637 2,500
OES Passion 3,543 1,647
Oando Petroleum Development Company Limited 2,500 2,500
Oando Servco UK Limited - 3,734
Oando Netherlands Holdings 2 B.V - 3,734
Oando Netherlands Holdings 3 B.V. - 3,734
OES Professionalism 23,533 10,939
90,086,514 38,080,946
38 Commitments
viii. Ocean and Oil Development Partners ("OODP") notified the Company of its intention to convert N1.98billion in exchange for 396,793,587 fully paid
Ordinary Shares of the Company's common equity. The Company filed the conversion notice with the Securities and Exchange Commission ("SEC") in 2016
and received SEC's approval on January 23, 2017. The shares have been allotted to OODP and recognised under equity in these consolidated and separate
financial statements.
Key management includes directors (executive and non-executive) and members of the Group Leadership Council. The compensation paid or payable to key
management for employee services is shown below:
The Group had no outstanding capital expenditure contracted but not provided for under property, plant and equipment (2016: N13.6 billion) at December
31, 2017.
Page 91 of 109

OANDO PLC
Annual Consolidated and Separate Financial Statements
Notes to the consolidated and separate financial statements
For the year ended 31 December 2017
39 Events after the reporting period
(i) Second tranche of OML 125 and 134 disposal
(ii) Appointment of directors
(iii)
40
(i) (a)
(b)
(c)
(ii)
(iii)
In 2007, OER transferred, under the Bilabri Settlement Agreement, the full responsibility for completing the development of the Bilabri oil field in OML 122 to
Peak Petroleum Industries (Nigeria) Limited (‚Peak‛). Peak specifically assumed responsibility for the project’s future funding and historical unpaid liabilities.
In the event that Peak fails to meet its obligations to the projects creditors, it remains possible that OER may be called upon to meet the debts. Therefore, a
contingent liability of $21.7 million exists at December 31, 2017 (2016 ” $21.7 million). On May 26, 2015, Peak and OER (through Equator Exploration (OML
122) Limited) signed a Settlement Agreement which set out the terms under which Peak would pay OER the sum of $52.2 million (‚Settlement Amount‛) as full
and final settlement of its indebtedness to OER, three months from the date of the Settlement Agreement. Peak requested for an extension of time to pay the
Settlement Amount which was granted by OER. Despite the extension, as at December 31, 2017, Peak has still failed to pay the Settlement Amount. OER has
deemed this to be a contingent asset until such time as when the inflow of economic benefit from Peak becomes virtually certain.
Guarantees to third parties
Guarantees, performance bonds, and advance payment guarantees issued in favour of members of the Group by commercial banks and third parties
amounted to N299.1 billion (2016: N543.3 billion).
Pursuant of the Amended and Restated Loan Agreement between West Africa Investment Limited (the ‚Lender‛ /‛WAIL‛), Goldeneye Energy Resources
Limited (the ‚Borrower‛) and Oando PLC (the ‚Guarantor‛) dated March 31, 2016, on one hand; and another Amended and Restated Loan Agreement
between Goldeneye Energy Resources Limited (the ‚Borrower‛), Southern Star Shipping Co Inc. (the ‚Lender"/‛SS‛) and Oando Plc (the ‚Guarantor‛) also
dated 31 March 2016; Oando PLC provided financial guarantee to the Lenders to the tune of US$32m (WAIL: US$27m, SS: US$5m). The essence of the loans
was for the borrower to acquire shares owned by the Lenders in Oando Exploration and Production Holdings Limited (OEPH), a wholly owned subsidiary of
Oando PLC. The Borrower agreed to repay the loans in 12 installments starting from March 2017.
The financial guarantee required Oando Plc to pay to the Lenders in its capacity as Guarantor, the loan amounts due (inclusive of accrued interest) if the
Borrower is unable to pay while the Borrower is also required to transfer the relevant number of shares held in OEPH to the Guarantor or its Nominee in the
event of default. Upon failure by the Borrower to honour the repayment agreement, the Guarantor paid US$ 6.1m (which represented principal plus accrued interest) to SS on
October 4, 2017. On the same date, the borrower executed a share transfer instrument for the purpose of transferring all the shares previously acquired from
SS to the Calabar Power Limited, a wholly owned subsidiary of Oando PLC. Consequently, the Guarantor was discharged of the financial guarantee to SS.
On September 29, 2017, WAIL, the borrower and the Guarantor signed Amended and Restated Loan Agreement. The Agreement extends repayment of the
outstanding loan amount (principal and accrued interest) by the borrower to the Lender to March 31, 2018. Thus, a contingent liability existed for the
Company at the reporting date. Management performed fair valuation of the financial guarantee and the valuation of the OEPH shares receivable from the
Borrower and determined that no provision is required as the value of the shares exceed the loan guarantee amount.
Outstanding Letters of credit in respect of the offshore processing arrangement (OPA) amounted to N23.8 billion ($66 million) (2016:N59.4billion) at the
reporting date.
Pending litigation
There are a number of legal suits outstanding against the Company for stated amounts of NGN444.9 billion (2016: N608.2 billion). Of the total legal suits
outstanding, NGN437.6 billion (2016: N528.2 billion) was filed against OER’s portion of NAOC JV (OML 60-63). On the advice of Counsel, the Board of
Directors are of the opinion that no material losses are expected to arise. Therefore, no provision has been made in the financial statements.
Bilabri Oil Field (OML 122)
On January 16, 2018, OER received a payment of $3.0 million into the collection account under the corporate facility. In line with the amended SPA, this
amount represent second tranche and final payment of cash consideration for the disposal of OML 125 and 134 to NAE.
The Board of Directors of the Company appointed Alhaji Bukar Aji, OON, as a non-executive director of the Company effective 19 January 2018. The Board
also appointed Mr. Muntari Muhammad Zubairu as an executive director of the Company effective February 5, 2018. Both appointments were made in
accordance with Article 88 of the Company’s articles of association.
Extension of repayment to West Africa Investment Limited
As regards the loan agreement (fully disclosed under contingent liability below) between Golden Eye Energy Resources Limited (‛Borrower‛), West Africa
Investment Limited (‛Lender‛) and Oando PLC (‛Guarantor‛); the Borrower, vide a letter dated March 12, 2018, has informed the Lender of its inability to
repay the loan and accrued interest on March 31, 2018 as earlier agreed on September 29, 2017. The Borrower, vide the same letter, has requested an
extension of the repayment date and maturity date of the outstanding obligation to June 30, 2018.
Contingent liabilities
Page 92 of 109

OANDO PLC
Annual Consolidated and Separate Financial Statements
Notes to the consolidated and separate financial statements
For the year ended 31 December 2017
(iv)
(a)
(b)
(v) Tax contingencies
41 Subsidiaries' information
(a) Below is a summary of the principal subsidiaries of the Group
Country of
incorporation
Investment
Currency
Issued share
capital
Percentage interest
held
Percentage
interest held
All figures in
thousands 2017 2016
Direct Shareholding
United
Kingdom
GBP 1 100% 100%
Nigeria Naira 2,500,000 100% 100%
Nigeria Naira 2,500,000 100% 100%
Dubai USD 11,000,000 100% 100%
Cayman Island USD 50,000 100% 100%
Bermuda USD 3,500,000 100% 100%
Netherlands Euro - 100% 100%
Netherlands Euro - 100% 100%
Canada USD 792,228,566 78.18% 77.74%
Oando Netherlands
Holdings 3 Cooperative U.A
Financial holding company
Oando E&P Holdings
Limited
Financial holding company
XRS 1 Investment company
Oando Trading Limited Supply of crude oil and refined
petroleum products
Oando Netherlands
Holdings 2 Cooperative U.A
Financial holding company
Oando Resources Limited Exploration and Production
Oando Terminals and
Logistics
Storage and haulage of
petroleum products
Oando Trading DMCC Supply of crude oil and refined
petroleum products
Oando Oil Limited (OOL), the Company's indirect subsidiary, during the year received tax assessments from the FIRS for additional Petroleum Profit and
Education Taxes relating to 2006, 2007 and 2009. The total assessments, which included penalty and interest, amounted to an additional tax liability of $79.7
million (Petroleum Profit Tax of $77.9 million and Education Tax of $1.8 million). OOL has objected to this and also filed tax appeals at the Tax Appeal Tribunal
and Federal High Court to challenge and discharge the assessments. As this period relates to tax years before the effective acquisition date of January 1,
2012, ConocoPhillips company and Phillips Investment Company LLC, the previous owners of the company has provided an indemnity for these liabilities. The
amount is deemed to be a contingent liability and has not been provided for in these consolidated financial statements.
Entity name
Nature of business
Operational subsidiaries
Oando Logistics and
Services Limited
Logistics and services
OPL 321 and OPL 323
In January 2009, the Nigerian government voided the allocation of OPL 323 and OPL 321 to the operator, Korea National Oil Corporation (KNOC) and
allocated the blocks to the winning group of the 2005 licensing round comprising ONGC Videsh, Equator and Owel. KNOC brought a lawsuit against the
government and a judgement was given in their favor. The government and Owel appealed the judgement. The Court of Appeal ruled against KNOC on the
grounds that it instituted its original action wrongly. KNOC filed an appeal to the Supreme Court in June 2012. In February 2017, the Supreme Court affirmed
the decision of the Court of Appeal. In 2009, the government refunded the signature bonus paid by Equator. The Company Equator, has not recognized a
liability to the government for the blocks subsequent to the refund of the signature bonus. Following the decision of the Supreme Court, Equator has declared
its intention to continue to invest in the blocks. Equator has impaired the carrying value and currently carries both assets at Nil value (2016: nil).
Equator originally bid as member of a consortium for OPL 323 and 321. It was granted a 30% interest in the Production Sharing Contracts ‚PSCs‛ but two of
its bidding partners were not included as direct participants in the PSCs, as a result, Equator granted those bidding partners 3% and 1% carried economic
interests respectively in recognition of their contribution to the consortium. During 2007, it was agreed with the bidding partners that they would surrender their
carried interests in return for warrants in Equator and payments of $4 million and $1 million. The warrants were issued immediately but it was agreed that the
cash payments would be deferred. The warrants have expired. In the first instance, payment would be made within 5 days after the closing of a farm out of a
20% interest in OPL 323 to a subsidiary of BG Corporation PLC (BG). However, BG terminated the farm out agreement. Under the successor obligation,
Equator issued loan notes with an aggregate value of $5 million which are redeemable out of the first $5 million of proceeds received on the occurrence of any
one of the following events related to OPL 321 or OPL 323:
- A farm out with another party;
- A sale or partial sale of the interests; and
- A sale or partial sale of subsidiaries holding the relevant PSCs.
During 2010, one bidding partner successfully sued Equator in an arbitration tribunal for $1 million. This has been paid in full. On the advice of legal counsel,
Equator maintains that the remaining $4 million owed is not yet due and that any second arbitration hearing can be successfully defended. If none of the
above events occur, it is assumed that Equator will not need to settle the $4 million loan note and can defer payment indefinitely. The above contingencies are
based on the best judgements of the Board and management.
Page 93 of 109

OANDO PLC
Annual Consolidated and Separate Financial Statements
Notes to the consolidated and separate financial statements
For the year ended 31 December 2017
Country of
incorporation
Investment
Currency
Issued share
capital
Percentage interest
held
Percentage
interest held
Indirect ShareholdingAll figures in
thousands
South Africa Rand 120 100% 100%
South Africa Rand 980 49% 49%
Rwanda Rwandan
Francs
100,000,000 100% 100%
Mozambique MZM 200,000 100% 100%
Cayman Island USD 50,000 100% 100%
Bermuda USD 1 100% 100%
Canada USD 796,049,213 78.18% 77.7%
Nigeria Naira 9,100,000 0% 0%
Nigeria Naira 1,717,697,000 0% 0%
Nigeria Naira 2,500,000 0% 0%
Nigeria Naira 10,000,000 0% 0%
Nigeria Naira 5,000,000 0% 0%
Nigeria Naira 19,125,000 0% 0%
Nigeria Naira 437,500,000 0% 0%
Nigeria Naira 6,250,000 0% 0%
Nigeria Naira 2,500,000 0% 0%
Ghana Cedis 2,346,000 0% 0%
Togo CIA 186,288,000 0% 0%
Nigeria Naira 5,000,000 0% 0%
Ghana Cedis 100 0% 0%
Nigeria Naira 2,500,000 0% 100%
Gas Network Services Gas Distribution
Ebony Oil & Gas Limited Supply of crude oil and refined
petroleum products
Alausa Power Limited Power Generation
Oando Lekki Refinery Petroleum Refining
Oando Ghana Limited Marketing and sale of petroleum
products (Subsidiary of Oando
Marketing PLC)
Oando Togo S.A Marketing and sale of petroleum
products
Apapa SPM Limited Offshore submarine pipeline
construction
Oando Marketing Ltd Marketing and sale of petroleum
products
Oando Supply and Trading
Limited
Supply of crude oil and refined
petroleum products
Akute Power Limited Power Generation
Oando Gas and Power
Limited
Gas and Power generation and
distribution
Oando Energy Services
Limited
Provision of drilling and other
services upstream companies
All subsidiary undertakings are included in the consolidation. The proportion of the voting rights in the subsidiary undertakings held directly by the parent
company do not differ from the proportion of ordinary shares held.
Disposed Subsidiaries
Central Horizon Gas
Company Limited
Gas Distribution
Gaslink Nigeria Limited Gas Distribution
Oando Energy Resources
Inc. (Subsidiary of Oando
E&P Holdings Limited)
Exploration and Production
Petrad Mozambique
Limitada
Storage, Trading and Distribution
of Petroleum and Gas Products
XRS 11 Aviation
Churchill Finance C300-0462
Limited
Aviation
Ebony Oil and Gas South
Africa Proprietary Limited
Storage, Trading and Distribution
of Petroleum and Gas Products
Royal Ebony Terminal
Proprietary Limited
Storage, Trading and Distribution
of Petroleum and Gas Products
Ebony Trading Rwanda
Limited
Storage, Trading and Distribution
of Petroleum and Gas Products
Entity name
Nature of business
Page 94 of 109

OANDO PLC
Annual Consolidated and Separate Financial Statements
Notes to the consolidated and separate financial statements
For the year ended 31 December 2017
(b)
2017 2016 2017 2016 2017 2016
N'000 N'000 N'000 N'000 N'000 N'000
Revenue 103,549,482 77,276,507 - 26,733,938 - 1,214,770
Profit before income tax 33,372,039 (37,632,784) - 6,849,289 - (199,930)
Taxation (6,653,964) 37,719,977 - (716,478) - -
Profit after taxation 26,718,075 87,193 - 6,132,811 - (199,930)
Total comprehensive income 26,718,075 87,193 - 6,132,811 - (199,930)
Non-controlling interest proportion 21.8% 22.3% 0.0% 2.8% 0.0% 17.1%
5,831,032 19,413 - 169,266 - (34,188)
Dividends paid to non-controlling interests - - - 80,743 - -
Summarised statement of financial position
Current:
Asset 58,120,087 92,465,975 - - - -
Liabilities (276,334,547) (321,623,648) - - - -
Total current net assets (218,214,460) (229,157,673) - - - -
Non-Current:
Asset 861,004,147 779,628,519 - - - -
Liabilities (237,906,670) (234,020,620) - - - -
Total non-current net assets 623,097,477 545,607,899 - - - -
Net assets 404,883,017 316,450,226 - - - -
Accumulated non-controlling interest 88,478,648 70,554,972 - - - -
2017 2016 2017 2016 2017 2016
N'000 N'000 N'000 N'000 N'000 N'000
Summarised cash flows
Cash generated from operations 82,857,302 56,453,609 - - - -
Interest paid (9,393,215) (7,291,910) - - - -
Income tax paid (8,924,300) (4,127,051) - - - -
64,539,787 45,034,648 - - - -
Net cash used in investing activities (32,075,856) (25,698,690) - - - -
Net cash used in financing activities (27,608,124) (26,930,615) - - - -
4,855,807 (7,594,657) - - - -
1,114,775 8,709,432 - - - -
202,231 - - - - -
Cash and cash equivalents at end of year 6,172,813 1,114,775 - - - -
2017 2016 2017 2016 2017 2016
N'000 N'000 N'000 N'000 N'000 N'000
Revenue - 1,102,127 - 2,193,717 - 22,808,166
Profit before income tax - 215,586 - 33,194 - 924,775
Taxation - (61,379) - (4,069) - (226,277)
Profit after taxation - 154,208 - 29,125 - 698,498
Other comprehensive income - - - - - -
Total comprehensive income - 154,208 - 29,125 - 698,498
Non-controlling interest proportion 0% 44% 0% 25% 0% 20%
- 67,852 - 7,192 - 139,700
Dividends paid to non-controlling interests - - - - - -
Profit or loss allocated to non-controlling
Cash, cash equivalents and bank overdrafts
at beginning of year
Exchange gains/(losses) on cash and cash
equivalents
Summarised statement of profit or loss
CHGC Oando Togo Ebony
Profit or loss allocated to non-controlling
Oando Energy Resources Gaslink Oando Ghana
Net cash generated from operating activities
Net (decrease)/increase in cash and cash
equivalents
Summarised financial information on subsidiaries with material non-controlling interests
Set out below are the summarised financial information for each subsidiary that has non-controlling interests that are material to the Group as at 31 December
2017.
Summarised statement of profit or loss
Oando Energy Resources Gaslink Oando Ghana
Page 95 of 109

OANDO PLC
Annual Consolidated and Separate Financial Statements
Notes to the consolidated and separate financial statements
For the year ended 31 December 2017
(c) Change in ownership interests in subsidiaries that do not result in a loss of control
Group Group
2017 2016
N'000 N'000
Consideration (paid to)/received from non-controlling interest (1,883,416) 29,736,344
Decrease/(increase) in non-controlling interest 1,507,292 (31,513,805)
Group's loss on deemed disposal (376,124) (1,777,461)
42 (a) Financial instruments by category
GROUP
Financial
instruments at
fair value
through profit
and loss
Loans and
receivables
Available-for-sale Total
2017 N'000 N'000 N'000 N'000
Assets per statement of financial position:
Available-for-sale financial assets - - 61,856 61,856
Non-current receivable - 23,202,580 - 23,202,580
Trade and other receivables - 89,909,675 - 89,909,675
Commodity option contracts 18,572 - - 18,572
Cash and cash equivalents - 20,374,207 - 20,374,207 18,572 133,486,462 61,856 133,566,890
Financial
instruments at
fair value through
profit and loss
Other financial
liabilities at
amortised cost
Total
2017 N'000 N'000 N'000
Liabilities per statement of financial position:
Borrowings - 237,442,259 237,442,259
Trade and other payables - 187,935,945 187,935,945
- 425,378,204 425,378,204
Pursuant of the Amended and Restated Loan Agreement between West Africa Investment Limited (the ‚Lender‛ /‛WAIL‛), Goldeneye Energy Resources
Limited (the ‚Borrower‛) and Oando PLC (the ‚Guarantor‛) dated March 31, 2016, on one hand; and another Amended and Restated Loan Agreement
between Goldeneye Energy Resources Limited (the ‚Borrower‛), Southern Star Shipping Co Inc. (the ‚Lender"/‛SS‛) and Oando Plc (the ‚Guarantor‛) also
dated 31 March 2016; Oando PLC provided financial guarantee to the Lenders to the tune of US$32m (WAIL: US$27m, SS: US$5m). The essence of the loans
was for the borrower to acquire shares owned by the Lenders in Oando Exploration and Production Holdings Limited (OEPH), a wholly owned subsidiary of
Oando PLC. The Borrower agreed to repay the loans in 12 installments starting from March 2017.
The financial guarantee required Oando Plc to pay to the Lenders in its capacity as Guarantor, the loan amounts due (inclusive of accrued interest) if the
Borrower is unable to pay while the Borrower is also required to transfer the relevant number of shares held in OEPH to the Guarantor or its Nominee in the
event of default.
Upon failure by the Borrower to honour the repayment agreement, the Guarantor paid US$ 6.1m (which represented principal plus accrued interest) to SS on
October 4, 2017. On the same date, the borrower executed a share transfer instrument for the purpose of transferring all the shares previously acquired from
SS to the Calabar Power Limited, a wholly owned subsidiary of Oando PLC. Consequently, the Guarantor was discharged of the financial guarantee to SS.
Consequently, the indirect percentage ownership in OER increased from 77.735 (NCI: 22.26%) to 78.176 (NCI: 21.82%). The loss on deemed disposal has
been recognised directly in equity.
Impact of change in ownership interests in subsidiaries that do not result in a loss of control is as analysed below:
On May 31, 2016, Ocean and Oil Development Partners Limited (OODP) exercised the option to convert the amount oustanding on their dollar denominated
convertble notes of $154,096,406.44 to 128,413,672 Ordinary Shares of Oando PLC's holding in OER under and pursuant to the terms of the Convertible Note
Purchase Agreement dated 23 July 2014. Also, following the delisting of OER from TSX in May 2016, the institutional investors were bought over by Oando
E&P and certain performance share units (‚PSU‛) and stock options given to certain employees in May 2015 were accelerated and made to vest at
transaction date. Consequently, the indirect percentage ownership in OER reduced from 93.73% (NCI: 6.27%) to 77.735 (NCI: 22.26%). The loss on deemed
disposal has been recognised directly in equity.
Page 96 of 109

OANDO PLC
Annual Consolidated and Separate Financial Statements
Notes to the consolidated and separate financial statements
For the year ended 31 December 2017
Financial
instruments at
fair value
through profit
and loss
Loans and
receivables
Available-for-sale Total
2016 N'000 N'000 N'000 N'000
Assets per statement of financial position:
Available-for-sale financial assets - - 115,642 115,642
Non-current receivable - 22,034,389 - 22,034,389
Trade and other receivables - 95,424,919 - 95,424,919
Commodity option contracts 6,932,527 - - 6,932,527
Cash and cash equivalents - 16,929,537 - 16,929,537
6,932,527 134,388,845 115,642 141,437,014
Financial
instruments at
fair value through
profit and loss
Other financial
liabilities at
amortised cost
Total
2016 N'000 N'000 N'000
Liabilities per statement of financial position:
Borrowings - 246,117,715 246,117,715
Trade and other payables - 198,459,488 198,459,488
Convertible options 199,137 - 199,137
199,137 444,577,203 444,776,340
COMPANY
Financial
instruments at
fair value
through profit
and loss
Loans and
receivables
Available-for-sale Total
2017 N'000 N'000 N'000 N'000
Assets per statement of financial position:
Available-for-sale financial assets - - 59,895 59,895
Trade and other receivables - 138,771,677 - 138,771,677
Cash and cash equivalents - 915,653 - 915,653
- 139,687,330 59,895 139,747,225
Financial
instruments at
fair value through
profit and loss
Other financial
liabilities at
amortised cost
Total
2017 N'000 N'000 N'000
Liabilities per statement of financial position:
Borrowings - 104,560,720 104,560,720
Trade and other payables - 117,389,268 117,389,268
- 221,949,988 221,949,988
2016
Financial
instruments at
fair value
through profit
and loss
Loans and
receivables
Available-for-sale Total
Assets per statement of financial position: N'000 N'000 N'000 N'000
Available-for-sale financial assets - - 115,642 115,642
Trade and other receivables - 108,581,449 - 108,581,449
Cash and cash equivalents - 12,434,877 - 12,434,877
- 121,016,326 115,642 121,131,968
2016
Financial
instruments at
fair value through
profit and loss
Other financial
liabilities at
amortised cost
Total
Liabilities per statement of financial position: N'000 N'000 N'000
Borrowings - 109,876,902 109,876,902
Trade and other payables - 82,408,778 82,408,778
Convertible options 199,137 - 199,137
199,137 192,285,680 192,484,817
Page 97 of 109

OANDO PLC
Annual Consolidated and Separate Financial Statements
Notes to the consolidated and separate financial statements
For the year ended 31 December 2017
(b)
Group
2017 2016 2017 2016
N'000 N'000 N'000 N'000
23,202,580 22,034,389 18,463,613 18,210,239
72,539,702 60,926,511 63,981,672 43,884,459
18,572 6,932,527 18,572 6,932,527
61,856 115,642 61,856 115,642
- 199,137 - 199,137
Borrowings 237,442,259 246,117,715 246,034,268 214,716,750
Company
9,365,366 9,711,893 9,365,366 8,026,358
Available for sale investment measured at the fair value 59,895 113,985 59,895 113,985
- 199,137 - 199,137
Borrowings 104,560,720 109,876,902 101,399,730 135,071,964
43 Upstream activities
(a) Details of upstream assets
Mineral rights
acquisition
Land and
building
Expl. costs
and producing
wells
Production Well Oil and gas
properties under
development
Other fixed assets Total
N'000 N'000 N'000 N'000 N'000 N'000 N'000
Opening NBV 1 January 2016
Opening net book amount 4,351,455 36,227 11,685,845 166,353,901 27,959,802 596,530 210,983,760
Decommissioning costs - - - - (32,525,818) - (32,525,818)
Additions - - - 8,958,072 263,005 - 9,221,077
Depreciation charge (23,715) - (37,367) (13,964,372) (1,792,384) (31,877) (15,849,715)
Exchange difference 2,312,297 19,283 6,213,995 86,256,884 14,588,505 312,293 109,703,257
6,640,037 55,510 17,862,473 247,604,485 8,493,110 876,946 281,532,561
Opening NBV 1 January 2017
6,640,037 55,510 17,862,473 247,604,485 8,493,110 876,946 281,532,561
Decommissioning costs - - - - (1,055,562) - (1,055,562)
Additions - - 1,144,815 16,971,774 132,164 15,336 18,264,089
Transfer to FFE - - - - - (221,582) (221,582)
Depreciation charge (26,372) - (121,711) (13,814,925) (3,135,350) (47,077) (17,145,435)
Exchange difference 1,200,316 10,070 3,220,806 42,690,624 1,035,247 151,497 48,308,560
7,813,981 65,580 22,106,383 293,451,958 5,469,609 775,120 329,682,631
(b) Joint arrangements
2017
License Operator Working/Partici
pating interest
Location License type Expiration date Status
OML 56 Energia 45%
participatory
interest
Onshore JV January 31, 2023 Producing
Oando Akepo Limited OML 90 Sogenal 30%
participatory
interest
Offshore JV May 15, 2018 Non- Producing
OML 90 Sogenal 10%
participatory
interest
Offshore JV May 15, 2018 Non- Producing
OML 13 Network
Exploration and
Production
Company
Limted
40% working
interest
Onshore JV March 13, 2025 Producing
Year ended 31 December
2017
The Group participates in various upstream exploration and production (E&P) activities through joint operations with other participants in the industry. Details
of concessions are as follows:
Oando Production and
Development Company
Limited
Exile Resources Nigeria
Limited
Oando Qua Ibo Limited
Derivative financial liabilities
Year ended 31 December
2016
Opening net book amount
Non-current receivables
Finance lease receivables
Derivative financial assets
Available for sale investment measured at the fair value
Derivative financial liabilities
Non-current receivables
Financial Instruments: Carrying values and fair values
Carrying amounts Fair values
Page 98 of 109

OANDO PLC
Annual Consolidated and Separate Financial Statements
Notes to the consolidated and separate financial statements
For the year ended 31 December 2017
2017
License Operator Working/Partici
pating interest
Location License type Expiration date Status
Oando Oil Limited OML 60, 61,
62 and 63
Nigeria Agip Oil
Company
Limited
20% working
interest
Onshore JV July 22, 2027 Producing
OML 145 ExxonMobil 21.05%
working
interest
Offshore PSC June 12, 2034 Non- Producing
Oando 131 Limited OML 131 Oando 131
Limited
95%
participatory
interest
Offshore PSC April 13, 2025 Non- Producing
Medal Oil Company Limited OML 131 Oando 131
Limited
5%
participatory
interest
Offshore PSC April 13, 2025 Non- Producing
OPL 323 KNOC 30%
participating
interest
Offshore PSC March 10, 2036 Non- Producing
OPL 321 KNOC 30%
participating
interest
Offshore PSC March 10, 2036 Non- Producing
OML 122 PEAK Carried interest
of 5% in the
Bilabri oil
project and a
paying interest
of 12.5% in any
gas
development
Offshore PSC Sept. 13, 2021 Non- Producing
Block 5 Kosmos Energy
20%
participating
interest Offshore PSC
May 13, 2043 Non- Producing
Block 12 Kosmos Energy
22.5%
participating
interest Offshore PSC
February 22, 2044 Non- Producing
Equator Exploration Nigeria
323 Limited
Equator Exploration Nigeria
321 Limited
Equator Exploration (OML
122) Limited
Equator Exploration STP
Block 5 Limited
Equator Exploration STP
Block 12 Limited
Oando Deepwater
Exploration Nigeria Limited
Page 99 of 109

OANDO PLC
Annual Consolidated and Separate Financial Statements
Notes to the consolidated and separate financial statements
For the year ended 31 December 2017
44 Prior year restatements
(a) Reconciliation of previously published consolidated and separate statement of profit or loss
GROUP IFRS previously
reported
Effect of
restatement
IFRS restated
N'000 N'000 N'000
Continuing operations
Revenue 455,746,734 - 455,746,734
Cost of sales (426,933,813) - (426,933,813)
Gross profit 28,812,921 - 28,812,921
Other operating income 72,782,420 418,570 73,200,990
Administrative expenses (109,252,946) - (109,252,946)
Operating loss (7,657,605) 418,570 (7,239,035)
Finance costs (58,313,162) - (58,313,162)
Finance income 7,256,765 - 7,256,765
Finance costs - net (51,056,397) - (51,056,397)
Share of loss of associates (4,661,510) - (4,661,510)
Loss before income tax from continuing operations (63,375,512) 418,570 (62,956,942)
Income tax credit 37,569,028 - 37,569,028
Loss for the year from continuing operations (25,806,484) 418,570 (25,387,914)
Discontinued operations
Profit after tax for the year from discontinued operations 29,300,521 - 29,300,521
Profit for the year 3,494,037 418,570 3,912,607
Profit attributable to:
Equity holders of the parent 3,124,803 418,570 3,543,373
Non-controlling interest 369,234 - 369,234
3,494,037 418,570 3,912,607
Earnings/(loss) per share from continuing and discontinued operations attributable to ordinary equity holders
of the parent during the year: (expressed in kobo per share)
Basic and diluted earnings per share
From continuing operations (215) 4 (211)
From discontinued operations 241 - 241
From loss for the year 26 4 30
OTB declared a dividend of $19 million (N5.8 billion) to Oando PLC during the period ended 31 December 2016. This dividend income was not recognized in
the audited financial statements of Oando PLC for the year ended 31 December 2016 and as such, the prior period has been restated to reflect the impact of
this transaction as shown below.
Page 100 of 109

OANDO PLC
Annual Consolidated and Separate Financial Statements
Notes to the consolidated and separate financial statements
For the year ended 31 December 2017
COMPANY IFRS previously
reported
Effect of
restatement
IFRS restated
N'000 N'000 N'000
Revenue 4,858,182 5,376,430 10,234,612
Cost of sales - - -
Gross profit 4,858,182 5,376,430 10,234,612
Other operating income 97,776,195 418,570 98,194,765
Administrative expenses (103,131,018) - (103,131,018)
Operating (loss)/profit (496,641) 5,795,000 5,298,359
Finance costs (33,260,203) - (33,260,203)
Finance income 27,417 - 27,417
Finance costs - net (33,232,786) - (33,232,786)
Loss before income tax (33,729,427) 5,795,000 (27,934,427)
Income tax expense (146,405) - (146,405)
Loss for the period (33,875,832) 5,795,000 (28,080,832)
Total comprehensive loss for the period (33,875,832) 5,795,000 (28,080,832)
Attributable to:
Equity holders of the parent (33,875,832) 5,795,000 (28,080,832)
Non controlling interest - - -
(33,875,832) 5,795,000 (28,080,832)
Page 101 of 109

OANDO PLC
Annual Consolidated and Separate Financial Statements
Notes to the consolidated and separate financial statements
For the year ended 31 December 2017
(b) Reconciliation of previously published consolidated and separate statement of other comprehensive income
GROUP
IFRS previously
reported
Effect of
restatement
IFRS restated
N'000 N'000 N'000
Profit for the year 3,494,037 418,570 3,912,607
Other comprehensive income:
108,887,918 (418,570) 108,469,348
108,887,918 (418,570) 108,469,348
108,887,918 (418,570) 108,469,348
112,381,955 - 112,381,955
Attributable to:
- Equity holders of the parent 86,819,326 - 86,819,326
- Non-controlling interests 25,562,629 - 25,562,629
112,381,955 - 112,381,955
- Continuing operations 57,518,805 - 57,518,805
- Discontinued operations 29,300,521 - 29,300,521
86,819,326 - 86,819,326
COMPANY
IFRS previously
reported
Effect of
restatement
IFRS restated
N'000 N'000 N'000
Loss for the year (33,875,832) 5,795,000 (28,080,832)
Other comprehensive income for the year, net of tax - - -
Total comprehensive loss for the year, net of tax (33,875,832) 5,795,000 (28,080,832)
Attributable to:
- Equity holders of the parent (33,875,832) 5,795,000 (28,080,832)
- Non-controlling interests
(33,875,832) (28,080,832)
Total comprehensive income for the year, net of tax
Total comprehensive income/(loss) attributable to equity holders of the
parent arises from:
Total comprehensive loss for the year, net of tax
Items that will not be reclassified to profit or loss in subsequent periods:
Items that may be reclassified to profit or loss in subsequent periods:
Exchange differences on translation of foreign operations
Other comprehensive income for the year, net of tax
Total comprehensive income for the year, net of tax
Page 102 of 109

OANDO PLC
Annual Consolidated and Separate Financial Statements
Notes to the consolidated and separate financial statements
For the year ended 31 December 2017
(c) Reconciliation of previously published consolidated and separate statement of financial position
GROUP
IFRS previously
reported
Effect of
restatement
IFRS restated
Assets N'000 N'000 N'000
Non-current assets
Property, plant and equipment 293,541,702 - 293,541,702
Intangible assets 361,530,468 - 361,530,468
Investment in associates 10,653,425 - 10,653,425
Deferred tax assets 44,758,179 - 44,758,179
Derivative financial assets 844,438 - 844,438
Finance lease receivables 60,926,511 - 60,926,511
Non-current receivables 22,034,389 - 22,034,389
Available-for-sale financial assets 2,867 - 2,867
Prepayments 6,292 - 6,292
Restricted cash 6,538,952 - 6,538,952
800,837,223 - 800,837,223
Current assets
Inventories 12,804,332 - 12,804,332
Derivative financial assets 6,088,089 - 6,088,089
Trade and other receivables 107,002,077 - 107,002,077
Prepayments 4,263,242 - 4,263,242
Deferred income tax assets -
Available-for-sale financial assets 112,775 - 112,775
Cash and cash equivalents (excluding bank overdrafts) 10,390,585 - 10,390,585
140,661,100 - 140,661,100
Assets of disposal group classified as held for sale 50,046,652 - 50,046,652
Total assets 991,544,975 - 991,544,975
Equity and Liabilities
Equity attributable to equity holders of the parent
Share capital 6,017,309 - 6,017,309
Share premium 174,806,923 - 174,806,923
Retained loss (152,287,138) 418,570 (151,868,568)
Other reserves 93,826,307 (418,570) 93,407,737
122,363,401 - 122,363,401
Non controlling interest 69,981,178 - 69,981,178
Total equity 192,344,579 - 192,344,579
Liabilities
Non-current liabilities
Borrowings 101,639,606 - 101,639,606
Deferred tax liabilities 198,908,983 - 198,908,983
Provision and other liabilities 40,549,807 - 40,549,807
Retirement benefit obligations 1,161,705 - 1,161,705
342,260,101 - 342,260,101
Current liabilities
Trade and other payables 198,459,488 - 198,459,488
Derivative financial liabilities 199,137 - 199,137
Borrowings 144,478,109 - 144,478,109
Current income tax liabilities 59,108,565 - 59,108,565
Provision and other liabilities 525,629 - 525,629
Dividend payable 1,650,277 - 1,650,277
404,421,205 - 404,421,205
Liabilities of disposal group classified as held for sale 52,519,090 - 52,519,090
Total liabilities 799,200,396 - 799,200,396
Total equity and liabilities 991,544,975 - 991,544,975
Page 103 of 109

OANDO PLC
Annual Consolidated and Separate Financial Statements
Notes to the consolidated and separate financial statements
For the year ended 31 December 2017
COMPANY IFRS previously
reported
Effect of
restatement
IFRS restated
N'000 N'000 N'000
Assets
Non-current assets
Property, plant and equipment 379,819 - 379,819
Intangible assets 182,151 - 182,151
Investment in associates 15,500,552 - 15,500,552
Non-current receivables 9,711,893 - 9,711,893
Available-for-sale financial assets 2,867 - 2,867
Investment in subsidiaries 55,373,649 - 55,373,649
Prepayments 6,292 - 6,292
Restricted cash 4,682,749 - 4,682,749
85,839,972 - 85,839,972
Current assets
Trade and other receivables 111,398,694 - 111,398,694
Prepayments 3,174,809 - 3,174,809
Available-for-sale financial assets 111,118 - 111,118
Cash and cash equivalents (excluding bank overdrafts) 7,752,128 - 7,752,128
122,436,749 - 122,436,749
Non current asset held for sale 2,500 - 2,500
Total assets 208,279,221 - 208,279,221
Equity and Liabilities
Equity attributable to equity holders
Share capital 6,017,309 - 6,017,309
Share premium 174,806,923 - 174,806,923
Retained loss (168,509,605) 5,795,000 (162,714,605)
Total Equity 12,314,627 5,795,000 18,109,627
Liabilities
Non-current liabilities
Borrowings 87,320,834 - 87,320,834
Retirement benefit obligations 782,416 - 782,416
88,103,250 - 88,103,250
Current liabilities
Trade and other payables 82,408,778 (5,795,000) 76,613,778
Derivative financial liabilities 199,137 - 199,137
Borrowings 22,556,068 - 22,556,068
Current income tax liabilities 521,455 - 521,455
Provision and other liabilities 525,629 - 525,629
Dividend payable 1,650,277 - 1,650,277
107,861,344 (5,795,000) 102,066,344
Total liabilities 195,964,594 (5,795,000) 190,169,594
Total equity and liabilities 208,279,221 - 208,279,221
Page 104 of 109

OANDO PLC
Annual Consolidated and Separate Financial Statements
Notes to the consolidated and separate financial statements
For the year ended 31 December 2017
(d) Reconciliation of previously published consolidated and separate cash generated from operations
GROUP IFRS previously
reported
Effect of
restatement
IFRS restated
N'000 N'000 N'000
Profit/(loss) before income tax - continuing operations (63,375,512) 418,570 (62,956,942)
Profit before income tax - discontinued operations 30,562,888 - 30,562,888
-
Adjustment for: -
Interest income (Note 12) (7,256,765) - (7,256,765)
Interest expenses (Note 12) 58,313,162 - 58,313,162
Interest income - Discontinued operations (4,634,717) - (4,634,717)
Interest expenses - Discontinued operations 2,943,055 - 2,943,055
Depreciation (Note 10) 18,062,016 - 18,062,016
Amortisation of intangible assets (Note 10) 601,391 - 601,391
Impairment of intangible assets (Note 16) - - -
Impairment of property, plant and equipment (Note 10) 16,001,499 - 16,001,499
Impairment losses on available for sale asset (Note 25a) 22,145 - 22,145
Impairment allowance on non-current receivables (Note 22) - - -
Impairment allowance on current receivables (Note 24) 15,094,452 - 15,094,452
Share of loss of an associate (Note 18) 4,661,510 - 4,661,510
Profit/(loss) on sale of property, plant and equipment (Note 10) 40,559 - 40,559
Unwinding of discount on provisions (Note 12a) 9,506,662 - 9,506,662
Profit/(loss) on sale of subsidiary (Note 27d) (30,602,093) - (30,602,093)
Share based payment expense (options and swaps) 469,829 - 469,829
Net foreign exchange (gain)/loss 12,801,175 - 12,801,175
Fair value loss on commodity options 9,776,438 - 9,776,438
Fair value gain on convertible options (Note 9, 32) (4,961,665) - (4,961,665)
-
Changes in working capital -
Receivables and prepayments (current) (87,067,988) - (87,067,988)
Non-current receivables and prepayments (7,030,012) - (7,030,012)
Inventories (16,552,338) - (16,552,338)
Payables and accrued expenses 174,100,373 (418,570) 173,681,803
Gratuity provisions (192,862) - (192,862)
Gratuity benefit paid 172,799 - 172,799
Government grant 434,884 - 434,884
131,890,885 - 131,890,885
COMPANY IFRS previously
reported
Effect of
restatement
IFRS restated
N'000 N'000 N'000
Cash flows from operating activities
Loss before income tax (33,729,427) 5,795,000 (27,934,427)
-
Adjustment for: -
Interest income (Note 12) (27,417) - (27,417)
Interest expenses (Note 12) 33,260,203 - 33,260,203
Depreciation (Note 10) 175,281 - 175,281
Amortisation of intangible assets (Note 10) 101,896 - 101,896
Impairment losses on available for sale asset (Note 25a) 22,145 - 22,145
Dividend income - (5,376,430) (5,376,430)
Impairment allowance on current receivables (Note 24) 50,332,803 - 50,332,803
Loss on sale of property, plant and equipment (Note 10) 3,280 - 3,280
Profit on sale of subsidiary (Note 27d) (57,166,653) - (57,166,653)
Net foreign exchange gain (261,357) - (261,357)
Fair value gain on convertible options (Note 9, 32) (4,961,665) - (4,961,665)
-
Changes in working capital -
Receivables and prepayments (current) 110,566,136 - 110,566,136
Non-current receivables and prepayments 7,519 - 7,519
Payables and accrued expenses (87,496,894) (418,570) (87,915,464)
Gratuity provisions (29,161) - (29,161)
Gratuity benefit paid (39,021) - (39,021)
Provision and other liabilties (2,434,105) - (2,434,105)
8,323,563 - 8,323,563
Page 105 of 109

OANDO PLC
Annual Consolidated and Separate Financial Statements
Notes to the consolidated and separate financial statements
For the year ended 31 December 2017
45
The financial statements have been prepared on the basis of accounting principles applicable to a going concern. This basis presumes that the realisation of
assets and settlement of liabilities will occur in the ordinary course of business.
- Refinance an approximate N9 billion credit facility provided by one of the bilateral lenders.
- Sale of the Company’s shares in Oando Energy Resources to raise up to N84 billion in 2018 in order to prepay debt across the Group
- Sale of the Company’s 25% stake in Glover BV to raise up to N24 billion over the next 18 months. Proceeds will be applied towards principal repayment of
debts across the Group
- Recapitalisation through private placement to raise up to N18 billion by December 2020.
The initiatives discussed above are expected to improve the profitability of the group through interest savings arising from repayment of borrowings.
These conditions indicate the existence of material uncertainty which may cast significant doubt on the Company’s ability to continue as a going concern and,
therefore, the Company may be unable to realise its assets and discharge its liabilities in the normal course of business.
Going concern
The Company recorded comprehensive losses of N30.6 billion during the year ended 31 December 2017 (2016: comprehensive losses N28.1billion). The
Company also recorded net liabilities of N10.5 billion (2016: net assets ” N18.1 billion). As of year-end, the Group reported net current liabilities of
N293.1billion (2016 net current liabilities N263.8billion).
Management has developed key strategic initiatives which aim to return the Company (and Group) to profitability, improve working capital and cash flows.
The key initiatives include:
- Restructure the Reserve Based Loan and Corporate Loan Facilities at Oando Energy Resources to ensure the loans:
(a) are default free and fully compliant with credit agreements,
(b) achieve a tenor extension of up to two years, and
(c) reduce debt service requirements in the near term.
The net effect of the initiative will be to reclassify up to N117 billions of current liabilities into long-term liabilities thus creating a substantial remedy to the
negative working capital position. Implementation of this initiative started in 2016 and will be completed between April 2018 and June 2018.
Page 106 of 109

OANDO PLC
Consolidated and Separate Financial Statements
Value Added Statement
For the year ended 31 December 2017
Group 2017 2016
N'000 % N'000 %
Turnover 497,422,483 455,746,734
Other income 46,490,127 73,200,990
Interest received 9,959,732 7,256,765
553,872,342 536,204,489
Bought in goods and services
- Local purchases (443,811,994) (457,692,999)
- Foreign purchases - (415,866)
Value added 110,060,348 100 78,095,624 100
Distributed as follows
Employees
- To pay salaries and wages and other staff costs 6,959,928 6 9,477,603 12
Government
- To pay tax 12,476,156 11 (1,636,859) (2)
Providers of capital
- To pay dividend - -
- To pay interest on borrowings 43,743,860 40 58,313,162 75
Non-controlling interest 19,359,738 18 25,562,629 33
Maintenance and expansion of assets
- Deferred tax (5,180,790) (5) (34,669,801) (44)
- Depreciation 18,759,712 17 17,505,517 22
- Retained in the business 13,941,744 13 3,543,373 5
Value distributed 110,060,348 100 78,095,624 100
Company 2017 2016
N'000 % N'000 %
Turnover - 4,858,182
Other Income 25,989,048 97,776,195
Interest received 2,926,404 27,417
28,915,452 - 102,661,794 -
Bought in goods and services
- Local purchases (39,735,275) (96,444,854)
- Foreign purchases - -
Value added (10,819,823) (100) 6,216,940 100
Distributed as follows
Employees
- To pay salaries and wages and other staff costs 460,905 4 715,881 12
Government
- To pay tax 15,904 0 146,405 2
Providers of capital
- To pay dividend - -
- To pay interest on borrowings 19,166,179 177 33,260,203 535
Maintenance and expansion of assets
- Deferred tax - - - -
- Depreciation 152,622 1 175,281 3
- Retained in the business (30,615,433) (283) (28,080,830) (452)
Value distributed (10,819,823) (100) 6,216,940 100
Page 107 of 109

OANDO PLC
Consolidated and Separate Financial Statements
Five-Year Financial Summary (2013 - 2017)
For the year ended 31 December 2017
GROUP 2017 2016 2015 2014 2013
N'000 N'000 N'000 N'000 N'000
Property, plant and equipment 343,466,113 293,541,702 223,130,072 314,042,207 172,209,842
426,866,570 361,530,468 254,715,745 245,705,184 82,232,746
Investment property 1,033,000 - - - -
Deferred income tax assets 46,108,713 44,758,179 35,042,529 12,328,465 4,995,280
Available for sale investments - 2,867 5,067 10,834 14,500
Investments accounted for using the equity method 7,540,014 10,653,425 2,530,813 3,409,413 2,880,478
Deposit for acquisition of a business - - - - 69,840,000
Other non-current receivables 108,221,428 90,350,582 74,298,769 123,118,474 27,358,945
Net current liabilities (293,123,502) (263,760,105) (260,443,505) (329,001,646) (126,873,433)
- (2,472,438) (23,492,732) - 23,253,101
Borrowings (99,587,920) (101,639,606) (55,998,437) (162,328,636) (71,872,418)
Deferred income tax liabilities (222,207,944) (198,908,983) (155,907,424) (148,727,530) (13,905,217)
Other non-Current liabilities (54,880,692) (41,711,512) (42,986,971) (14,945,994) (7,765,747)
263,435,780 192,344,579 50,893,926 43,610,771 162,368,077
Share capital 6,215,706 6,017,309 6,017,309 4,542,343 3,411,177
Share premium 176,588,527 174,806,923 174,806,923 131,554,223 98,425,361
Retained earnings (138,677,099) (151,868,568) (199,723,265) (150,300,361) 33,937,579
Other reserves 131,475,022 93,407,737 55,750,740 45,342,918 23,217,694
Non controlling interest 87,833,624 69,981,178 14,042,219 12,471,648 3,376,266
263,435,780 192,344,579 50,893,926 43,610,771 162,368,077
Revenue 497,422,483 455,746,734 203,431,526 92,912,344 449,873,466
Profit before income tax 27,068,142 (32,394,054) (51,136,898) (137,696,205) 7,711,850
Income tax expense (7,295,366) 36,306,661 1,447,021 (7,958,945) (6,314,924)
Profit for the year 19,772,776 3,912,607 (49,689,877) (145,655,150) 1,396,926
Per share data
Weighted average number of shares 12,406,408 12,034,618 11,940,150 8,698,231 6,226,567
Basic earnings per share (kobo) 113 30 (422) (2,076) 23
Diluted earnings per share (kobo) 113 30 (274) (1,380) 23
Dividends per share (kobo) - - - - 30
Assets/(liabilities) of disposal group classified as held for sale
Intangible exploration assets, other intangible assets and
goodwill
Page 108 of 109

OANDO PLC
Consolidated and Separate Financial Statements
Five-Year Financial Summary (2013 - 2017)
For the year ended 31 December 2017
COMPANY 2017 2016 2015 2014 2013
N'000 N'000 N'000 N'000 N'000
Property, plant and equipment 1,507,722 379,819 511,583 819,188 925,365
- 182,151 283,082 162,918 105,551
Investment property 1,033,000 - - - -
Investments accounted for using the equity method 2,716,431 15,500,552 2,716,431 2,716,431 2,716,431
Deferred income tax assets - - - - 1,292,116
Available for sale investments - 2,867 5,067 10,834 14,500
Investment in subsidiaries 55,368,549 55,373,649 61,424,349 77,794,091 108,186,115
Other non-current receivables 9,365,366 14,400,934 254,978 16,415,243 22,186,519
Net current liabilities 6,821,651 20,370,405 (32,778,930) (34,709,292) (16,214,366)
- 2,500 16,359,269 - 10,000
Borrowings (87,320,834) (87,320,834) (1,734,773) (4,142,857) (11,942,482)
Deferred income tax liabilities - - - - -
Other non-current liabilities - (782,416) (850,598) (1,032,786) (1,189,998)
(10,508,115) 18,109,627 46,190,458 58,033,770 106,089,751
Share capital 6,215,706 6,017,309 6,017,309 4,542,343 3,411,177
Share premium 176,588,527 174,806,923 174,806,923 131,554,223 98,425,361
Retained earnings (193,330,038) (162,714,605) (134,633,774) (78,066,602) 2,861,024
Other reserves 17,690 - - 3,806 1,392,189
(10,508,115) 18,109,627 46,190,458 58,033,770 106,089,751
- - - - -
Revenue - 10,234,612 8,452,665 14,217,468 5,883,304
Profit before income tax (30,599,529) (27,934,427) (56,325,673) (64,925,182) 2,783,697
Income tax expense (15,904) (146,405) (241,499) (1,572,367) (433,123)
Profit for the year (30,615,433) (28,080,832) (56,567,172) (66,497,549) 2,350,574
Per share data
Weighted average number of shares 12,406,408 12,034,618 11,940,150 8,698,231 6,226,567
Basic earnings per share (kobo) 113 30 (422) (2,076) 23
Diluted earnings per share (kobo) 113 30 (274) (1,380) 23
Dividends per share (kobo) - - - - 30
Intangible exploration assets, other intangible assets and
goodwill
Assets/(liabilities) of disposal group classified as held for sale
Page 109 of 109
Related Documents