Nutritional assessment of somatolactin function in gilthead sea bream (Sparus aurata ): concurrent changes in somatotropic axis and pancreatic hormones Silvia Vega-Rubı ´n de Celis a , Pablo Rojas b , Pedro Go ´ mez-Requeni a , Amaya Albalat b , Joaquim Gutie ´rrez b , Franc ¸oise Me ´dale c , Sadasivam J. Kaushik c , Isabel Navarro b , Jaume Pe ´rez-Sa ´nchez a, * a Biology, Culture and Pathology of Fish Species, Instituto de Acuicultura de Torre de la Sal (CSIC), 12595 Ribera de Cabanes, Castello ´n, Spain b Departament de Fisiologia, Facultat de Biologia, Universitat de Barcelona, Avda. Diagonal 645, Barcelona, Spain c Laboratoire de Nutrition des Poissons, Unite ´e Mixte INRA-IFREMER, 64310 Saint-Pe ´e-sur-Nivelle, France Received 4 February 2004; received in revised form 22 April 2004; accepted 29 June 2004 Abstract The role of somatolactin (SL) in the regulation of energy homeostasis in gilthead sea bream (Sparus aurata ) has been analysed. First, a down-regulation of plasma SL levels in response to gross shifts in dietary amino acid profile and the graded replacement of fish meal by plant protein sources (50%, 75% and 100%) has been observed. Thus, the impaired growth performance with changes in dietary amino acid profile and dietary protein source was accompanied by a decrease in plasma SL levels, which also decreased over the course of the post-prandial period irrespective of dietary nitrogen source. Secondly, we examined the effect of SL and growth hormone (GH) administration on voluntary feed intake. A single intraperitoneal injection of recombinant gilthead sea bream SL (0.1 Ag/g fish) evoked a short-term inhibition of feed intake, whereas the same dose of GH exerted a marked enhancement of feed intake that still persisted 1 week later. Further, we addressed the effect of arginine (Arg) injection upon SL and related metabolic hormones (GH, insulin-like growth factor- I (IGF-I), insulin and glucagon) in fish fed diets with different nitrogen sources. A consistent effect of Arg injection (6.6 Amol/g fish) on plasma GH and IGF-I levels was not found regardless of dietary treatment. In contrast, the insulinotropic effect of Arg was found irrespective of dietary treatment, although the up-regulation of plasma glucagon and glucose levels was more persistent in fish fed a fish meal based diet (diet FM) than in those fed a plant protein diet with a 75% replacement (diet PP75). In the same way, a persistent and two-fold increase in plasma SL levels was observed in fish fed diet FM, whereas no effect was found in fish fed diet PP75. Taken together, these findings provide additional evidence for a role of SL as a marker of energy status, which may be perceived by fish as a daily and seasonal signal of abundant energy at a precise calendar time. D 2004 Elsevier Inc. All rights reserved. Keywords: Amino acid profile; Arginine; Feed intake; Gilthead sea bream; Glucagon; Growth hormone; Insulin; Insulin-like growth factor-I; Protein source; Somatolactin 1. Introduction Growth hormone (GH) and prolactin (PRL) are single chain polypeptides that were recognized as members of the same protein family many years ago. Subsequently, this family expanded with the discovery of mammalian placental lactogens (PLs) (Walker et al., 1991), fish somatolactin (SL) (Rand-Weaver et al., 1991), and more recently with a trout SL-like protein (Yang and Chen, 2003) that shares 56% homology with trout SL. It is now recognized that the rate of SL evolution is lower than that found for GH and PRL genes (Forsyth and Wallis, 2002), and the contribution of 1095-6433/$ - see front matter D 2004 Elsevier Inc. All rights reserved. doi:10.1016/j.cbpb.2004.06.007 * Corresponding author. Tel.: +34 964 319500; fax: +34 964 319509. E-mail address: [email protected] (J. Pe ´rez-Sa ´nchez). Comparative Biochemistry and Physiology, Part A 138 (2004) 533– 542 www.elsevier.com/locate/cbpa

Welcome message from author
This document is posted to help you gain knowledge. Please leave a comment to let me know what you think about it! Share it to your friends and learn new things together.
Transcript
www.elsevier.com/locate/cbpa
Comparative Biochemistry and Physiol
Nutritional assessment of somatolactin function in gilthead sea bream
(Sparus aurata): concurrent changes in somatotropic axis and
pancreatic hormones
Silvia Vega-Rubın de Celisa, Pablo Rojasb, Pedro Gomez-Requenia, Amaya Albalatb,
Joaquim Gutierrezb, Francoise Medalec, Sadasivam J. Kaushikc,
Isabel Navarrob, Jaume Perez-Sancheza,*
aBiology, Culture and Pathology of Fish Species, Instituto de Acuicultura de Torre de la Sal (CSIC), 12595 Ribera de Cabanes, Castellon, SpainbDepartament de Fisiologia, Facultat de Biologia, Universitat de Barcelona, Avda. Diagonal 645, Barcelona, Spain
cLaboratoire de Nutrition des Poissons, Unitee Mixte INRA-IFREMER, 64310 Saint-Pee-sur-Nivelle, France
Received 4 February 2004; received in revised form 22 April 2004; accepted 29 June 2004
Abstract
The role of somatolactin (SL) in the regulation of energy homeostasis in gilthead sea bream (Sparus aurata) has been analysed. First, a
down-regulation of plasma SL levels in response to gross shifts in dietary amino acid profile and the graded replacement of fish meal by
plant protein sources (50%, 75% and 100%) has been observed. Thus, the impaired growth performance with changes in dietary amino
acid profile and dietary protein source was accompanied by a decrease in plasma SL levels, which also decreased over the course of the
post-prandial period irrespective of dietary nitrogen source. Secondly, we examined the effect of SL and growth hormone (GH)
administration on voluntary feed intake. A single intraperitoneal injection of recombinant gilthead sea bream SL (0.1 Ag/g fish) evoked a
short-term inhibition of feed intake, whereas the same dose of GH exerted a marked enhancement of feed intake that still persisted 1 week
later. Further, we addressed the effect of arginine (Arg) injection upon SL and related metabolic hormones (GH, insulin-like growth factor-
I (IGF-I), insulin and glucagon) in fish fed diets with different nitrogen sources. A consistent effect of Arg injection (6.6 Amol/g fish) on
plasma GH and IGF-I levels was not found regardless of dietary treatment. In contrast, the insulinotropic effect of Arg was found
irrespective of dietary treatment, although the up-regulation of plasma glucagon and glucose levels was more persistent in fish fed a fish
meal based diet (diet FM) than in those fed a plant protein diet with a 75% replacement (diet PP75). In the same way, a persistent and
two-fold increase in plasma SL levels was observed in fish fed diet FM, whereas no effect was found in fish fed diet PP75. Taken
together, these findings provide additional evidence for a role of SL as a marker of energy status, which may be perceived by fish as a
daily and seasonal signal of abundant energy at a precise calendar time.
D 2004 Elsevier Inc. All rights reserved.
Keywords: Amino acid profile; Arginine; Feed intake; Gilthead sea bream; Glucagon; Growth hormone; Insulin; Insulin-like growth factor-I; Protein source;
Somatolactin
1. Introduction
Growth hormone (GH) and prolactin (PRL) are single
chain polypeptides that were recognized as members of the
1095-6433/$ - see front matter D 2004 Elsevier Inc. All rights reserved.
doi:10.1016/j.cbpb.2004.06.007
* Corresponding author. Tel.: +34 964 319500; fax: +34 964 319509.
E-mail address: [email protected] (J. Perez-Sanchez).
same protein family many years ago. Subsequently, this
family expanded with the discovery of mammalian placental
lactogens (PLs) (Walker et al., 1991), fish somatolactin (SL)
(Rand-Weaver et al., 1991), and more recently with a trout
SL-like protein (Yang and Chen, 2003) that shares 56%
homology with trout SL. It is now recognized that the rate of
SL evolution is lower than that found for GH and PRL
genes (Forsyth and Wallis, 2002), and the contribution of
ogy, Part A 138 (2004) 533–542
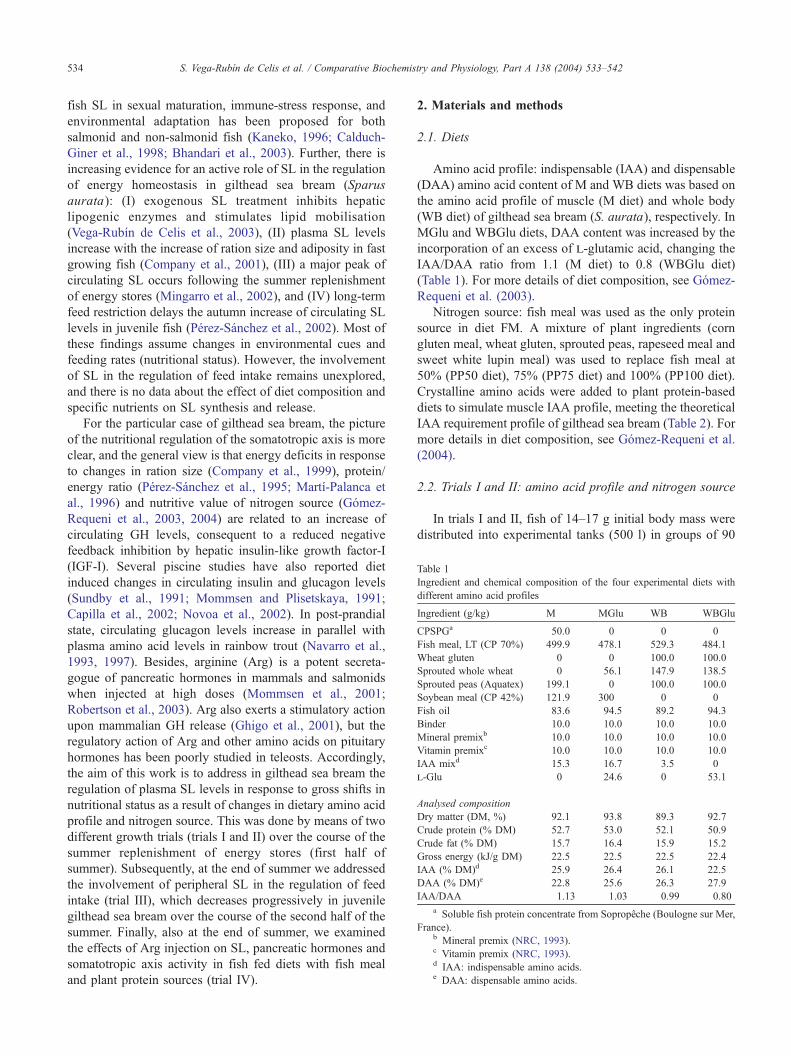
Table 1
Ingredient and chemical composition of the four experimental diets with
different amino acid profiles
Ingredient (g/kg) M MGlu WB WBGlu
CPSPGa 50.0 0 0 0
Fish meal, LT (CP 70%) 499.9 478.1 529.3 484.1
Wheat gluten 0 0 100.0 100.0
Sprouted whole wheat 0 56.1 147.9 138.5
Sprouted peas (Aquatex) 199.1 0 100.0 100.0
Soybean meal (CP 42%) 121.9 300 0 0
Fish oil 83.6 94.5 89.2 94.3
Binder 10.0 10.0 10.0 10.0
Mineral premixb 10.0 10.0 10.0 10.0
Vitamin premixc 10.0 10.0 10.0 10.0
IAA mixd 15.3 16.7 3.5 0
l-Glu 0 24.6 0 53.1
Analysed composition
Dry matter (DM, %) 92.1 93.8 89.3 92.7
Crude protein (% DM) 52.7 53.0 52.1 50.9
Crude fat (% DM) 15.7 16.4 15.9 15.2
Gross energy (kJ/g DM) 22.5 22.5 22.5 22.4
IAA (% DM)d 25.9 26.4 26.1 22.5
DAA (% DM)e 22.8 25.6 26.3 27.9
IAA/DAA 1.13 1.03 0.99 0.80
a Soluble fish protein concentrate from Sopropeche (Boulogne sur Mer,
France).b Mineral premix (NRC, 1993).c Vitamin premix (NRC, 1993).d IAA: indispensable amino acids.e DAA: dispensable amino acids.
S. Vega-Rubın de Celis et al. / Comparative Biochemistry and Physiology, Part A 138 (2004) 533–542534
fish SL in sexual maturation, immune-stress response, and
environmental adaptation has been proposed for both
salmonid and non-salmonid fish (Kaneko, 1996; Calduch-
Giner et al., 1998; Bhandari et al., 2003). Further, there is
increasing evidence for an active role of SL in the regulation
of energy homeostasis in gilthead sea bream (Sparus
aurata): (I) exogenous SL treatment inhibits hepatic
lipogenic enzymes and stimulates lipid mobilisation
(Vega-Rubın de Celis et al., 2003), (II) plasma SL levels
increase with the increase of ration size and adiposity in fast
growing fish (Company et al., 2001), (III) a major peak of
circulating SL occurs following the summer replenishment
of energy stores (Mingarro et al., 2002), and (IV) long-term
feed restriction delays the autumn increase of circulating SL
levels in juvenile fish (Perez-Sanchez et al., 2002). Most of
these findings assume changes in environmental cues and
feeding rates (nutritional status). However, the involvement
of SL in the regulation of feed intake remains unexplored,
and there is no data about the effect of diet composition and
specific nutrients on SL synthesis and release.
For the particular case of gilthead sea bream, the picture
of the nutritional regulation of the somatotropic axis is more
clear, and the general view is that energy deficits in response
to changes in ration size (Company et al., 1999), protein/
energy ratio (Perez-Sanchez et al., 1995; Martı-Palanca et
al., 1996) and nutritive value of nitrogen source (Gomez-
Requeni et al., 2003, 2004) are related to an increase of
circulating GH levels, consequent to a reduced negative
feedback inhibition by hepatic insulin-like growth factor-I
(IGF-I). Several piscine studies have also reported diet
induced changes in circulating insulin and glucagon levels
(Sundby et al., 1991; Mommsen and Plisetskaya, 1991;
Capilla et al., 2002; Novoa et al., 2002). In post-prandial
state, circulating glucagon levels increase in parallel with
plasma amino acid levels in rainbow trout (Navarro et al.,
1993, 1997). Besides, arginine (Arg) is a potent secreta-
gogue of pancreatic hormones in mammals and salmonids
when injected at high doses (Mommsen et al., 2001;
Robertson et al., 2003). Arg also exerts a stimulatory action
upon mammalian GH release (Ghigo et al., 2001), but the
regulatory action of Arg and other amino acids on pituitary
hormones has been poorly studied in teleosts. Accordingly,
the aim of this work is to address in gilthead sea bream the
regulation of plasma SL levels in response to gross shifts in
nutritional status as a result of changes in dietary amino acid
profile and nitrogen source. This was done by means of two
different growth trials (trials I and II) over the course of the
summer replenishment of energy stores (first half of
summer). Subsequently, at the end of summer we addressed
the involvement of peripheral SL in the regulation of feed
intake (trial III), which decreases progressively in juvenile
gilthead sea bream over the course of the second half of the
summer. Finally, also at the end of summer, we examined
the effects of Arg injection on SL, pancreatic hormones and
somatotropic axis activity in fish fed diets with fish meal
and plant protein sources (trial IV).
2. Materials and methods
2.1. Diets
Amino acid profile: indispensable (IAA) and dispensable
(DAA) amino acid content of M and WB diets was based on
the amino acid profile of muscle (M diet) and whole body
(WB diet) of gilthead sea bream (S. aurata), respectively. In
MGlu and WBGlu diets, DAA content was increased by the
incorporation of an excess of l-glutamic acid, changing the
IAA/DAA ratio from 1.1 (M diet) to 0.8 (WBGlu diet)
(Table 1). For more details of diet composition, see Gomez-
Requeni et al. (2003).
Nitrogen source: fish meal was used as the only protein
source in diet FM. A mixture of plant ingredients (corn
gluten meal, wheat gluten, sprouted peas, rapeseed meal and
sweet white lupin meal) was used to replace fish meal at
50% (PP50 diet), 75% (PP75 diet) and 100% (PP100 diet).
Crystalline amino acids were added to plant protein-based
diets to simulate muscle IAA profile, meeting the theoretical
IAA requirement profile of gilthead sea bream (Table 2). For
more details in diet composition, see Gomez-Requeni et al.
(2004).
2.2. Trials I and II: amino acid profile and nitrogen source
In trials I and II, fish of 14–17 g initial body mass were
distributed into experimental tanks (500 l) in groups of 90
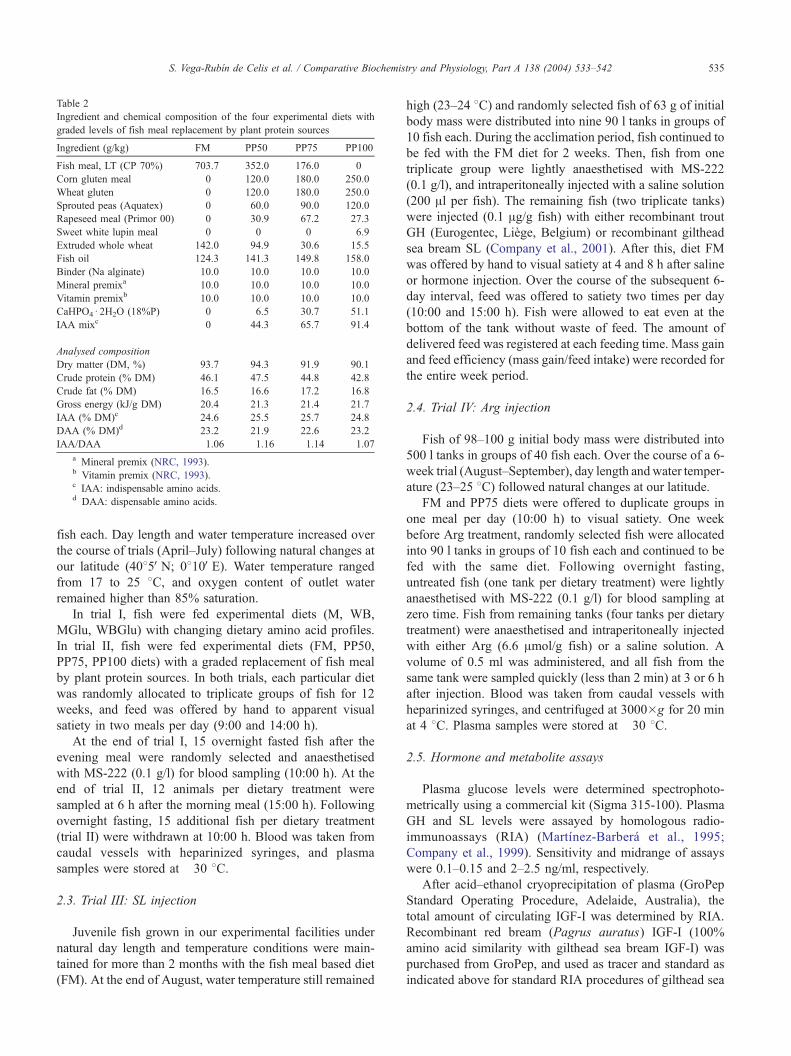
Table 2
Ingredient and chemical composition of the four experimental diets with
graded levels of fish meal replacement by plant protein sources
Ingredient (g/kg) FM PP50 PP75 PP100
Fish meal, LT (CP 70%) 703.7 352.0 176.0 0
Corn gluten meal 0 120.0 180.0 250.0
Wheat gluten 0 120.0 180.0 250.0
Sprouted peas (Aquatex) 0 60.0 90.0 120.0
Rapeseed meal (Primor 00) 0 30.9 67.2 27.3
Sweet white lupin meal 0 0 0 6.9
Extruded whole wheat 142.0 94.9 30.6 15.5
Fish oil 124.3 141.3 149.8 158.0
Binder (Na alginate) 10.0 10.0 10.0 10.0
Mineral premixa 10.0 10.0 10.0 10.0
Vitamin premixb 10.0 10.0 10.0 10.0
CaHPO4d 2H2O (18%P) 0 6.5 30.7 51.1
IAA mixc 0 44.3 65.7 91.4
Analysed composition
Dry matter (DM, %) 93.7 94.3 91.9 90.1
Crude protein (% DM) 46.1 47.5 44.8 42.8
Crude fat (% DM) 16.5 16.6 17.2 16.8
Gross energy (kJ/g DM) 20.4 21.3 21.4 21.7
IAA (% DM)c 24.6 25.5 25.7 24.8
DAA (% DM)d 23.2 21.9 22.6 23.2
IAA/DAA 1.06 1.16 1.14 1.07
a Mineral premix (NRC, 1993).b Vitamin premix (NRC, 1993).c IAA: indispensable amino acids.d DAA: dispensable amino acids.
S. Vega-Rubın de Celis et al. / Comparative Biochemistry and Physiology, Part A 138 (2004) 533–542 535
fish each. Day length and water temperature increased over
the course of trials (April–July) following natural changes at
our latitude (4085VN; 0810VE). Water temperature ranged
from 17 to 25 8C, and oxygen content of outlet water
remained higher than 85% saturation.
In trial I, fish were fed experimental diets (M, WB,
MGlu, WBGlu) with changing dietary amino acid profiles.
In trial II, fish were fed experimental diets (FM, PP50,
PP75, PP100 diets) with a graded replacement of fish meal
by plant protein sources. In both trials, each particular diet
was randomly allocated to triplicate groups of fish for 12
weeks, and feed was offered by hand to apparent visual
satiety in two meals per day (9:00 and 14:00 h).
At the end of trial I, 15 overnight fasted fish after the
evening meal were randomly selected and anaesthetised
with MS-222 (0.1 g/l) for blood sampling (10:00 h). At the
end of trial II, 12 animals per dietary treatment were
sampled at 6 h after the morning meal (15:00 h). Following
overnight fasting, 15 additional fish per dietary treatment
(trial II) were withdrawn at 10:00 h. Blood was taken from
caudal vessels with heparinized syringes, and plasma
samples were stored at �30 8C.
2.3. Trial III: SL injection
Juvenile fish grown in our experimental facilities under
natural day length and temperature conditions were main-
tained for more than 2 months with the fish meal based diet
(FM). At the end of August, water temperature still remained
high (23–24 8C) and randomly selected fish of 63 g of initial
body mass were distributed into nine 90 l tanks in groups of
10 fish each. During the acclimation period, fish continued to
be fed with the FM diet for 2 weeks. Then, fish from one
triplicate group were lightly anaesthetised with MS-222
(0.1 g/l), and intraperitoneally injected with a saline solution
(200 Al per fish). The remaining fish (two triplicate tanks)
were injected (0.1 Ag/g fish) with either recombinant trout
GH (Eurogentec, Liege, Belgium) or recombinant gilthead
sea bream SL (Company et al., 2001). After this, diet FM
was offered by hand to visual satiety at 4 and 8 h after saline
or hormone injection. Over the course of the subsequent 6-
day interval, feed was offered to satiety two times per day
(10:00 and 15:00 h). Fish were allowed to eat even at the
bottom of the tank without waste of feed. The amount of
delivered feed was registered at each feeding time. Mass gain
and feed efficiency (mass gain/feed intake) were recorded for
the entire week period.
2.4. Trial IV: Arg injection
Fish of 98–100 g initial body mass were distributed into
500 l tanks in groups of 40 fish each. Over the course of a 6-
week trial (August–September), day length andwater temper-
ature (23–25 8C) followed natural changes at our latitude.
FM and PP75 diets were offered to duplicate groups in
one meal per day (10:00 h) to visual satiety. One week
before Arg treatment, randomly selected fish were allocated
into 90 l tanks in groups of 10 fish each and continued to be
fed with the same diet. Following overnight fasting,
untreated fish (one tank per dietary treatment) were lightly
anaesthetised with MS-222 (0.1 g/l) for blood sampling at
zero time. Fish from remaining tanks (four tanks per dietary
treatment) were anaesthetised and intraperitoneally injected
with either Arg (6.6 Amol/g fish) or a saline solution. A
volume of 0.5 ml was administered, and all fish from the
same tank were sampled quickly (less than 2 min) at 3 or 6 h
after injection. Blood was taken from caudal vessels with
heparinized syringes, and centrifuged at 3000�g for 20 min
at 4 8C. Plasma samples were stored at �30 8C.
2.5. Hormone and metabolite assays
Plasma glucose levels were determined spectrophoto-
metrically using a commercial kit (Sigma 315-100). Plasma
GH and SL levels were assayed by homologous radio-
immunoassays (RIA) (Martınez-Barbera et al., 1995;
Company et al., 1999). Sensitivity and midrange of assays
were 0.1–0.15 and 2–2.5 ng/ml, respectively.
After acid–ethanol cryoprecipitation of plasma (GroPep
Standard Operating Procedure, Adelaide, Australia), the
total amount of circulating IGF-I was determined by RIA.
Recombinant red bream (Pagrus auratus) IGF-I (100%
amino acid similarity with gilthead sea bream IGF-I) was
purchased from GroPep, and used as tracer and standard as
indicated above for standard RIA procedures of gilthead sea
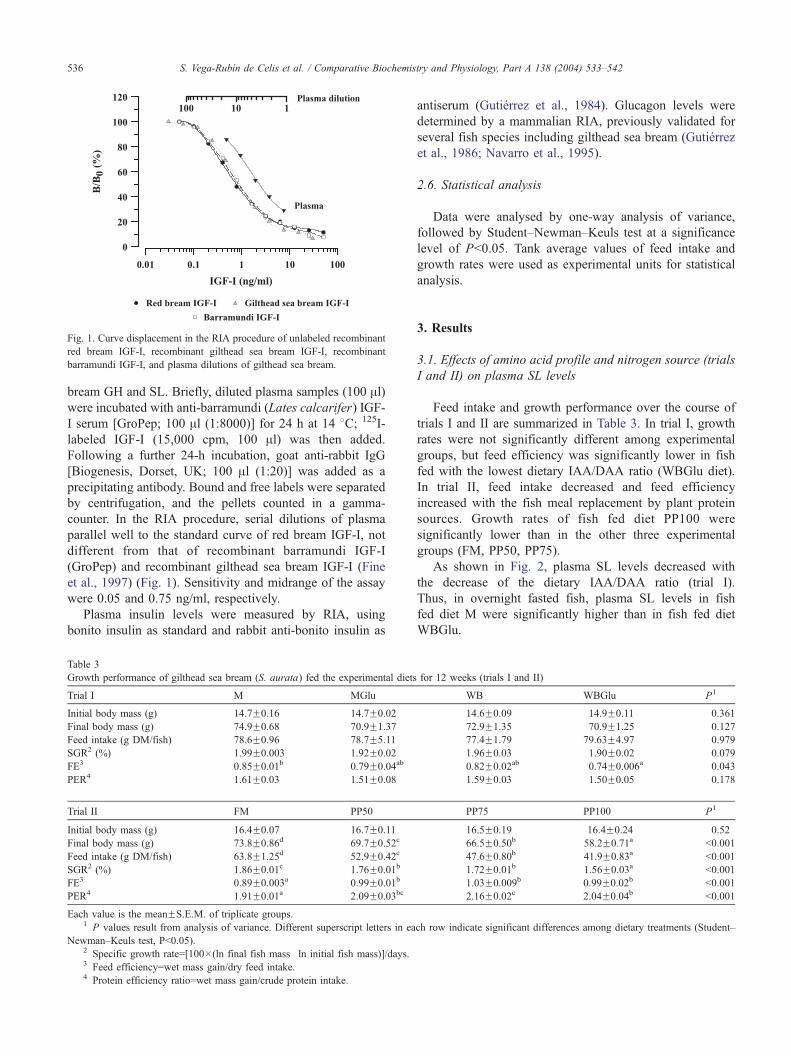
Fig. 1. Curve displacement in the RIA procedure of unlabeled recombinant
red bream IGF-I, recombinant gilthead sea bream IGF-I, recombinant
barramundi IGF-I, and plasma dilutions of gilthead sea bream.
S. Vega-Rubın de Celis et al. / Comparative Biochemistry and Physiology, Part A 138 (2004) 533–542536
bream GH and SL. Briefly, diluted plasma samples (100 Al)were incubated with anti-barramundi (Lates calcarifer) IGF-
I serum [GroPep; 100 Al (1:8000)] for 24 h at 14 8C; 125I-
labeled IGF-I (15,000 cpm, 100 Al) was then added.
Following a further 24-h incubation, goat anti-rabbit IgG
[Biogenesis, Dorset, UK; 100 Al (1:20)] was added as a
precipitating antibody. Bound and free labels were separated
by centrifugation, and the pellets counted in a gamma-
counter. In the RIA procedure, serial dilutions of plasma
parallel well to the standard curve of red bream IGF-I, not
different from that of recombinant barramundi IGF-I
(GroPep) and recombinant gilthead sea bream IGF-I (Fine
et al., 1997) (Fig. 1). Sensitivity and midrange of the assay
were 0.05 and 0.75 ng/ml, respectively.
Plasma insulin levels were measured by RIA, using
bonito insulin as standard and rabbit anti-bonito insulin as
Table 3
Growth performance of gilthead sea bream (S. aurata) fed the experimental diets
Trial I M MGlu
Initial body mass (g) 14.7F0.16 14.7F0.02
Final body mass (g) 74.9F0.68 70.9F1.37
Feed intake (g DM/fish) 78.6F0.96 78.7F5.11
SGR2 (%) 1.99F0.003 1.92F0.02
FE3 0.85F0.01b 0.79F0.04ab
PER4 1.61F0.03 1.51F0.08
Trial II FM PP50
Initial body mass (g) 16.4F0.07 16.7F0.11
Final body mass (g) 73.8F0.86d 69.7F0.52c
Feed intake (g DM/fish) 63.8F1.25d 52.9F0.42c
SGR2 (%) 1.86F0.01c 1.76F0.01b
FE3 0.89F0.003a 0.99F0.01b
PER4 1.91F0.01a 2.09F0.03bc
Each value is the meanFS.E.M. of triplicate groups.1 P values result from analysis of variance. Different superscript letters in ea
Newman–Keuls test, Pb0.05).2 Specific growth rate=[100�(ln final fish mass�ln initial fish mass)]/days.3 Feed efficiency=wet mass gain/dry feed intake.4 Protein efficiency ratio=wet mass gain/crude protein intake.
antiserum (Gutierrez et al., 1984). Glucagon levels were
determined by a mammalian RIA, previously validated for
several fish species including gilthead sea bream (Gutierrez
et al., 1986; Navarro et al., 1995).
2.6. Statistical analysis
Data were analysed by one-way analysis of variance,
followed by Student–Newman–Keuls test at a significance
level of Pb0.05. Tank average values of feed intake and
growth rates were used as experimental units for statistical
analysis.
3. Results
3.1. Effects of amino acid profile and nitrogen source (trials
I and II) on plasma SL levels
Feed intake and growth performance over the course of
trials I and II are summarized in Table 3. In trial I, growth
rates were not significantly different among experimental
groups, but feed efficiency was significantly lower in fish
fed with the lowest dietary IAA/DAA ratio (WBGlu diet).
In trial II, feed intake decreased and feed efficiency
increased with the fish meal replacement by plant protein
sources. Growth rates of fish fed diet PP100 were
significantly lower than in the other three experimental
groups (FM, PP50, PP75).
As shown in Fig. 2, plasma SL levels decreased with
the decrease of the dietary IAA/DAA ratio (trial I).
Thus, in overnight fasted fish, plasma SL levels in fish
fed diet M were significantly higher than in fish fed diet
WBGlu.
for 12 weeks (trials I and II)
WB WBGlu P1
14.6F0.09 14.9F0.11 0.361
72.9F1.35 70.9F1.25 0.127
77.4F1.79 79.63F4.97 0.979
1.96F0.03 1.90F0.02 0.079
0.82F0.02ab 0.74F0.006a 0.043
1.59F0.03 1.50F0.05 0.178
PP75 PP100 P1
16.5F0.19 16.4F0.24 0.52
66.5F0.50b 58.2F0.71a b0.001
47.6F0.80b 41.9F0.83a b0.001
1.72F0.01b 1.56F0.03a b0.001
1.03F0.009b 0.99F0.02b b0.001
2.16F0.02c 2.04F0.04b b0.001
ch row indicate significant differences among dietary treatments (Student–
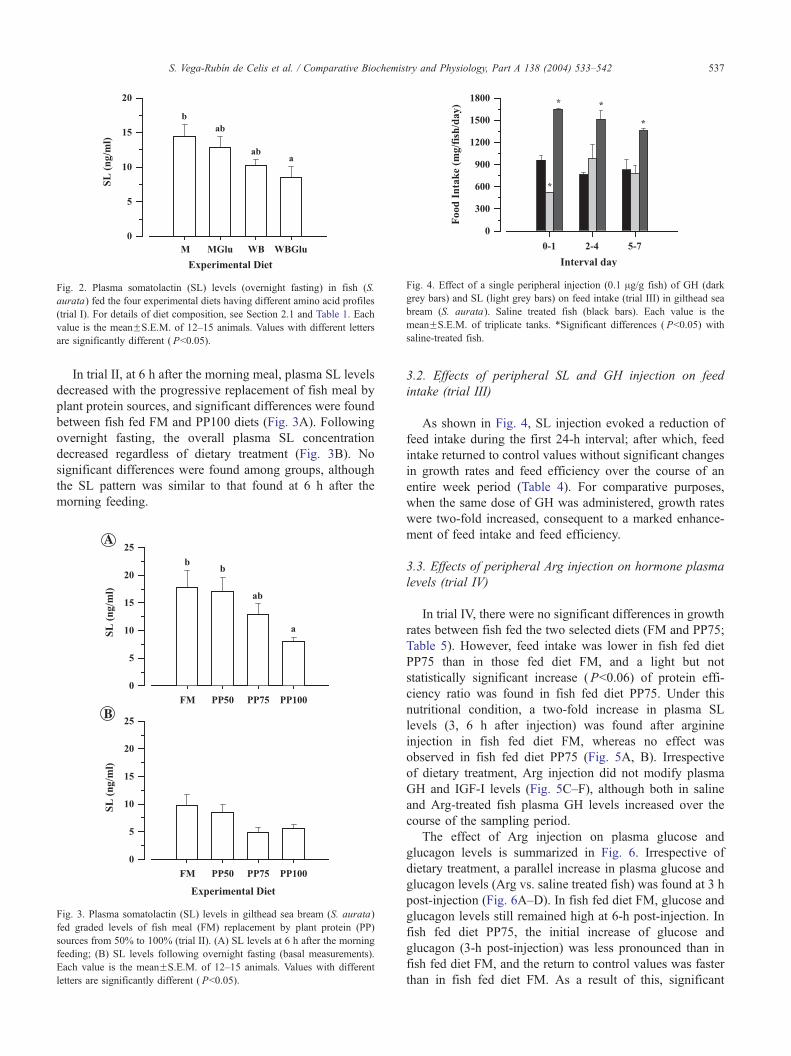
Fig. 4. Effect of a single peripheral injection (0.1 Ag/g fish) of GH (dark
grey bars) and SL (light grey bars) on feed intake (trial III) in gilthead sea
bream (S. aurata). Saline treated fish (black bars). Each value is the
meanFS.E.M. of triplicate tanks. *Significant differences ( Pb0.05) with
saline-treated fish.
Fig. 2. Plasma somatolactin (SL) levels (overnight fasting) in fish (S.
aurata) fed the four experimental diets having different amino acid profiles
(trial I). For details of diet composition, see Section 2.1 and Table 1. Each
value is the meanFS.E.M. of 12–15 animals. Values with different letters
are significantly different ( Pb0.05).
S. Vega-Rubın de Celis et al. / Comparative Biochemistry and Physiology, Part A 138 (2004) 533–542 537
In trial II, at 6 h after the morning meal, plasma SL levels
decreased with the progressive replacement of fish meal by
plant protein sources, and significant differences were found
between fish fed FM and PP100 diets (Fig. 3A). Following
overnight fasting, the overall plasma SL concentration
decreased regardless of dietary treatment (Fig. 3B). No
significant differences were found among groups, although
the SL pattern was similar to that found at 6 h after the
morning feeding.
Fig. 3. Plasma somatolactin (SL) levels in gilthead sea bream (S. aurata)
fed graded levels of fish meal (FM) replacement by plant protein (PP)
sources from 50% to 100% (trial II). (A) SL levels at 6 h after the morning
feeding; (B) SL levels following overnight fasting (basal measurements).
Each value is the meanFS.E.M. of 12–15 animals. Values with different
letters are significantly different ( Pb0.05).
3.2. Effects of peripheral SL and GH injection on feed
intake (trial III)
As shown in Fig. 4, SL injection evoked a reduction of
feed intake during the first 24-h interval; after which, feed
intake returned to control values without significant changes
in growth rates and feed efficiency over the course of an
entire week period (Table 4). For comparative purposes,
when the same dose of GH was administered, growth rates
were two-fold increased, consequent to a marked enhance-
ment of feed intake and feed efficiency.
3.3. Effects of peripheral Arg injection on hormone plasma
levels (trial IV)
In trial IV, there were no significant differences in growth
rates between fish fed the two selected diets (FM and PP75;
Table 5). However, feed intake was lower in fish fed diet
PP75 than in those fed diet FM, and a light but not
statistically significant increase (Pb0.06) of protein effi-
ciency ratio was found in fish fed diet PP75. Under this
nutritional condition, a two-fold increase in plasma SL
levels (3, 6 h after injection) was found after arginine
injection in fish fed diet FM, whereas no effect was
observed in fish fed diet PP75 (Fig. 5A, B). Irrespective
of dietary treatment, Arg injection did not modify plasma
GH and IGF-I levels (Fig. 5C–F), although both in saline
and Arg-treated fish plasma GH levels increased over the
course of the sampling period.
The effect of Arg injection on plasma glucose and
glucagon levels is summarized in Fig. 6. Irrespective of
dietary treatment, a parallel increase in plasma glucose and
glucagon levels (Arg vs. saline treated fish) was found at 3 h
post-injection (Fig. 6A–D). In fish fed diet FM, glucose and
glucagon levels still remained high at 6-h post-injection. In
fish fed diet PP75, the initial increase of glucose and
glucagon (3-h post-injection) was less pronounced than in
fish fed diet FM, and the return to control values was faster
than in fish fed diet FM. As a result of this, significant
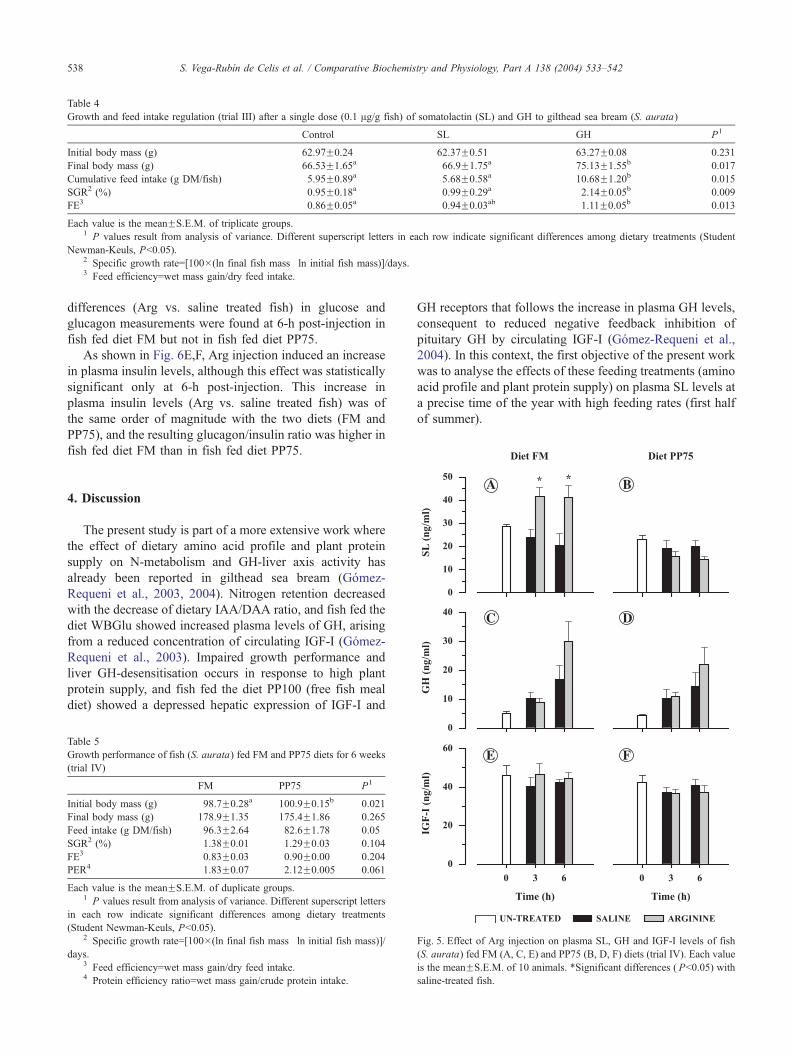
Table 4
Growth and feed intake regulation (trial III) after a single dose (0.1 Ag/g fish) of somatolactin (SL) and GH to gilthead sea bream (S. aurata)
Control SL GH P1
Initial body mass (g) 62.97F0.24 62.37F0.51 63.27F0.08 0.231
Final body mass (g) 66.53F1.65a 66.9F1.75a 75.13F1.55b 0.017
Cumulative feed intake (g DM/fish) 5.95F0.89a 5.68F0.58a 10.68F1.20b 0.015
SGR2 (%) 0.95F0.18a 0.99F0.29a 2.14F0.05b 0.009
FE3 0.86F0.05a 0.94F0.03ab 1.11F0.05b 0.013
Each value is the meanFS.E.M. of triplicate groups.1 P values result from analysis of variance. Different superscript letters in each row indicate significant differences among dietary treatments (Student
Newman-Keuls, Pb0.05).2 Specific growth rate=[100�(ln final fish mass�ln initial fish mass)]/days.3 Feed efficiency=wet mass gain/dry feed intake.
S. Vega-Rubın de Celis et al. / Comparative Biochemistry and Physiology, Part A 138 (2004) 533–542538
differences (Arg vs. saline treated fish) in glucose and
glucagon measurements were found at 6-h post-injection in
fish fed diet FM but not in fish fed diet PP75.
As shown in Fig. 6E,F, Arg injection induced an increase
in plasma insulin levels, although this effect was statistically
significant only at 6-h post-injection. This increase in
plasma insulin levels (Arg vs. saline treated fish) was of
the same order of magnitude with the two diets (FM and
PP75), and the resulting glucagon/insulin ratio was higher in
fish fed diet FM than in fish fed diet PP75.
4. Discussion
The present study is part of a more extensive work where
the effect of dietary amino acid profile and plant protein
supply on N-metabolism and GH-liver axis activity has
already been reported in gilthead sea bream (Gomez-
Requeni et al., 2003, 2004). Nitrogen retention decreased
with the decrease of dietary IAA/DAA ratio, and fish fed the
diet WBGlu showed increased plasma levels of GH, arising
from a reduced concentration of circulating IGF-I (Gomez-
Requeni et al., 2003). Impaired growth performance and
liver GH-desensitisation occurs in response to high plant
protein supply, and fish fed the diet PP100 (free fish meal
diet) showed a depressed hepatic expression of IGF-I and
Table 5
Growth performance of fish (S. aurata) fed FM and PP75 diets for 6 weeks
(trial IV)
FM PP75 P1
Initial body mass (g) 98.7F0.28a 100.9F0.15b 0.021
Final body mass (g) 178.9F1.35 175.4F1.86 0.265
Feed intake (g DM/fish) 96.3F2.64 82.6F1.78 0.05
SGR2 (%) 1.38F0.01 1.29F0.03 0.104
FE3 0.83F0.03 0.90F0.00 0.204
PER4 1.83F0.07 2.12F0.005 0.061
Each value is the meanFS.E.M. of duplicate groups.1 P values result from analysis of variance. Different superscript letters
in each row indicate significant differences among dietary treatments
(Student Newman-Keuls, Pb0.05).2 Specific growth rate=[100�(ln final fish mass�ln initial fish mass)]/
days.3 Feed efficiency=wet mass gain/dry feed intake.4 Protein efficiency ratio=wet mass gain/crude protein intake.
GH receptors that follows the increase in plasma GH levels,
consequent to reduced negative feedback inhibition of
pituitary GH by circulating IGF-I (Gomez-Requeni et al.,
2004). In this context, the first objective of the present work
was to analyse the effects of these feeding treatments (amino
acid profile and plant protein supply) on plasma SL levels at
a precise time of the year with high feeding rates (first half
of summer).
Fig. 5. Effect of Arg injection on plasma SL, GH and IGF-I levels of fish
(S. aurata) fed FM (A, C, E) and PP75 (B, D, F) diets (trial IV). Each value
is the meanFS.E.M. of 10 animals. *Significant differences ( Pb0.05) with
saline-treated fish.
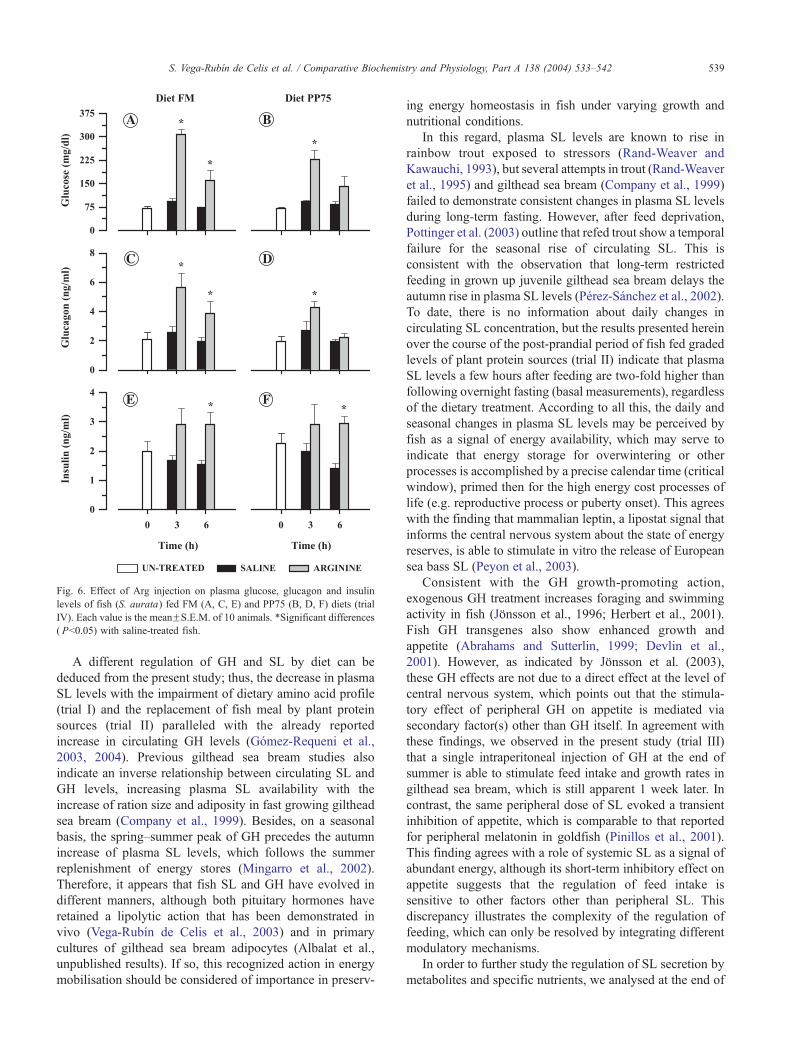
Fig. 6. Effect of Arg injection on plasma glucose, glucagon and insulin
levels of fish (S. aurata) fed FM (A, C, E) and PP75 (B, D, F) diets (trial
IV). Each value is the meanFS.E.M. of 10 animals. *Significant differences
( Pb0.05) with saline-treated fish.
S. Vega-Rubın de Celis et al. / Comparative Biochemistry and Physiology, Part A 138 (2004) 533–542 539
A different regulation of GH and SL by diet can be
deduced from the present study; thus, the decrease in plasma
SL levels with the impairment of dietary amino acid profile
(trial I) and the replacement of fish meal by plant protein
sources (trial II) paralleled with the already reported
increase in circulating GH levels (Gomez-Requeni et al.,
2003, 2004). Previous gilthead sea bream studies also
indicate an inverse relationship between circulating SL and
GH levels, increasing plasma SL availability with the
increase of ration size and adiposity in fast growing gilthead
sea bream (Company et al., 1999). Besides, on a seasonal
basis, the spring–summer peak of GH precedes the autumn
increase of plasma SL levels, which follows the summer
replenishment of energy stores (Mingarro et al., 2002).
Therefore, it appears that fish SL and GH have evolved in
different manners, although both pituitary hormones have
retained a lipolytic action that has been demonstrated in
vivo (Vega-Rubın de Celis et al., 2003) and in primary
cultures of gilthead sea bream adipocytes (Albalat et al.,
unpublished results). If so, this recognized action in energy
mobilisation should be considered of importance in preserv-
ing energy homeostasis in fish under varying growth and
nutritional conditions.
In this regard, plasma SL levels are known to rise in
rainbow trout exposed to stressors (Rand-Weaver and
Kawauchi, 1993), but several attempts in trout (Rand-Weaver
et al., 1995) and gilthead sea bream (Company et al., 1999)
failed to demonstrate consistent changes in plasma SL levels
during long-term fasting. However, after feed deprivation,
Pottinger et al. (2003) outline that refed trout show a temporal
failure for the seasonal rise of circulating SL. This is
consistent with the observation that long-term restricted
feeding in grown up juvenile gilthead sea bream delays the
autumn rise in plasma SL levels (Perez-Sanchez et al., 2002).
To date, there is no information about daily changes in
circulating SL concentration, but the results presented herein
over the course of the post-prandial period of fish fed graded
levels of plant protein sources (trial II) indicate that plasma
SL levels a few hours after feeding are two-fold higher than
following overnight fasting (basal measurements), regardless
of the dietary treatment. According to all this, the daily and
seasonal changes in plasma SL levels may be perceived by
fish as a signal of energy availability, which may serve to
indicate that energy storage for overwintering or other
processes is accomplished by a precise calendar time (critical
window), primed then for the high energy cost processes of
life (e.g. reproductive process or puberty onset). This agrees
with the finding that mammalian leptin, a lipostat signal that
informs the central nervous system about the state of energy
reserves, is able to stimulate in vitro the release of European
sea bass SL (Peyon et al., 2003).
Consistent with the GH growth-promoting action,
exogenous GH treatment increases foraging and swimming
activity in fish (Jfnsson et al., 1996; Herbert et al., 2001).
Fish GH transgenes also show enhanced growth and
appetite (Abrahams and Sutterlin, 1999; Devlin et al.,
2001). However, as indicated by Jfnsson et al. (2003),
these GH effects are not due to a direct effect at the level of
central nervous system, which points out that the stimula-
tory effect of peripheral GH on appetite is mediated via
secondary factor(s) other than GH itself. In agreement with
these findings, we observed in the present study (trial III)
that a single intraperitoneal injection of GH at the end of
summer is able to stimulate feed intake and growth rates in
gilthead sea bream, which is still apparent 1 week later. In
contrast, the same peripheral dose of SL evoked a transient
inhibition of appetite, which is comparable to that reported
for peripheral melatonin in goldfish (Pinillos et al., 2001).
This finding agrees with a role of systemic SL as a signal of
abundant energy, although its short-term inhibitory effect on
appetite suggests that the regulation of feed intake is
sensitive to other factors other than peripheral SL. This
discrepancy illustrates the complexity of the regulation of
feeding, which can only be resolved by integrating different
modulatory mechanisms.
In order to further study the regulation of SL secretion by
metabolites and specific nutrients, we analysed at the end of
S. Vega-Rubın de Celis et al. / Comparative Biochemistry and Physiology, Part A 138 (2004) 533–542540
summer (a critical time for the seasonal up-regulation of
gilthead sea bream SL; trial IV) the effect of Arg
administration on plasma levels of SL and related metabolic
hormones (GH, IGF-I, pancreatic hormones). In mammals,
Arg treatment has a stimulatory effect on pituitary GH
release (Ghigo et al., 2001), but in the present study this
amino acid did not induce a consistent increase of
circulating GH levels. We also failed to demonstrate any
effect on plasma IGF-I levels, and it is likely that the lack of
response of the GH-liver axis is due, at least in part, to the
down-regulation of the somatotropic axis activity precisely
at the time of year when the Arg injection was performed
(September) (Perez-Sanchez et al., 1994; Mingarro et al.,
2002). In contrast, Arg injection was able to induce a fast
and persistent increase in plasma SL levels in fish fed diet
FM. This is in accordance with the fact that the seasonal rise
of plasma SL levels occurs at autumn or just before in
gilthead sea bream (Mingarro et al., 2002). However, the
achieved response depends on the feeding treatment, and no
effect of Arg injection on plasma SL levels was found in
fish fed diet PP75, which always showed a reduced feed
intake (trials II and IV) in comparison to fish fed the FM
diet. This non-responsiveness of SL to Arg treatment would
be explained by some deficit in energy status, although the
fine regulation of both SL and GH needs further research on
the nutritional and seasonal bases.
Arg has a strong insulinotropic action in mammals and
fish (Mommsen and Plisetskaya, 1991), and injections of this
amino acid have been used by several authors as a model of
hyperinsulinemia (six- to nine-fold increase) in salmonids
(Carneiro et al., 1993; Banos et al., 1999; Mommsen et al.,
2001). However, this is the first study in which this Arg has
been tested in gilthead sea bream, and the obtained results
indicate that a relatively high dose of Arg injection only
induced a two-fold increase of circulating insulin levels
regardless of dietary treatment. This poor insulin response is
similar to that found in carp (Parrizas et al., 1994; Banos et
al., 1997), which suggests a low sensitivity of pancreatic h-cells to this amino acid in these fish species.
In salmonids, when the effect of Arg treatment on insulin
and glucagon was studied simultaneously, the insulinotropic
action often predominates over glucagon stimulation (Car-
neiro et al., 1993) and glycemia decreases or does not
change (Plisetskaya et al., 1991). However, the results
presented here show a more pronounced stimulatory effect
over glucagon than insulin. Besides, the resulting increase
of glucagon and insulin ratio would mediate the hyper-
glycemic state in Arg treated fish, showing these animals
parallel plasma profiles of glucose and glucagon over time.
This observation remains valid even when comparisons are
made between fish fed FM and PP75 diets. The lowest
glucagon response in fish fed diet PP75 was concurrent with
a lower and less persistent increase in plasma glucose levels
in fish fed diet PP75. This fact contrasts with a similar
increase of insulin levels in both groups (FM and PP75
diets), which suggests a different effect of dietary treatment
on glucagon and insulin response to Arg. Furthermore, it
could also be possible that the important increase in
glucagon after 3 h would stimulate insulin levels at 6 h in
both groups. In mammals, it is generally accepted that the
up-regulation of glucagon stimulates in turn insulin secre-
tion. Indeed, when different amino acids were tested in
sheep, none was able to specifically increase glucagon
release without increasing at the same time insulin or GH
secretion (Kuhara et al., 1991).
In mammals, a stimulatory effect of insulin over plasma
IGF-I levels has been demonstrated in vivo and in vitro
(Griffen et al., 1987; Bfni-Schnetzler et al., 1991; Hurson et
al., 1995). The stimulatory action of insulin and Arg over
plasma IGF-I levels has also been demonstrated in
salmonids (Banos et al., 1999). Indeed, insulin stimulates,
synergistically with GH, the IGF-I mRNA expression in
hepatocyte cultures of coho salmon (Duan et al., 1992;
Duan and Plisetskaya, 1993). Consequently, it appears that
both GH and insulin act in concert to enhance liver IGF-I
synthesis and release. In the present study, the insulinotropic
effect of Arg treatment was moderate, and irrespective of
dietary treatment a consistent effect of Arg on plasma GH
levels was not found. So, it is not surprising that no effect of
Arg injection over plasma IGF-I levels was observed. The
already mentioned decrease in the somatotropic axis activity
in autumn could contribute to the lack of IGF-I response.
In summary, the response of SL to the reduced nutritive
value of diet is characterized by a down-regulation of
plasma SL levels, which also occurs over the course of the
post-prandial period regardless of dietary treatment. This,
together with the transient but significant reduction of feed
intake by peripheral SL, provides additional evidence for an
active role of SL as a marker of energy surplus (availability)
daily and year round. Regarding Arg injection, measure-
ments of SL, GH-IGF axis and pancreatic hormones suggest
that the achieved response depends on season and past-
nutritional story. Additional research is now underway to
integrate the regulatory action of SL with other modulatory
mechanisms of feed intake and adiposity.
Acknowledgements
This research was funded by European Union (Q5RS-
2000-30068; bPerspectives of Plant Protein Use in Aqua-
cultureQ, PEPPA) and Spanish projects (PB98-672-02 and
AGL 2001-2903). S.V.-R. was recipient of a research grant
from the Spanish National Research Council (CSIC, I3P
Program).
References
Abrahams, M.W., Sutterlin, A., 1999. The foraging and antipredator
behaviour of growth-enhanced transgenic Atlantic salmon. Anim.
Behav. 58, 933–942.
S. Vega-Rubın de Celis et al. / Comparative Biochemistry and Physiology, Part A 138 (2004) 533–542 541
Banos, N., Moon, T.W., Castejon, C., Gutierrez, J., Navarro, I., 1997.
Insulin and insulin-like growth factor-I (IGF-I) binding in fish
red muscle: regulation by high insulin levels. Regul. Pept. 68,
181–187.
Banos, N., Planas, J.V., Gutierrez, J., Navarro, I., 1999. Regulation of
plasma insulin-like growth factor-I levels in brown trout (Salmo trutta).
Comp. Biochem. Physiol. C124, 33–40.
Bhandari, R.K., Taniyama, S., Kitahashi, T., Ando, H., Yamauchi, K.,
Zohar, Y., Ueda, H., Urano, A., 2003. Seasonal changes of responses to
gonadotropin-releasing hormone analog in expression of growth
hormone/prolactin/somatolactin genes in the pituitary of masu salmon.
Gen. Comp. Endocrinol. 130, 55–63.
Bfni-Schnetzler, M., Schmid, C., Meier, P.J., Froesch, E.R., 1991. Insulin
regulates insulin-like growth factor-I mRNA in rat hepatocytes. Am. J.
Physiol. 260, E846–E851.
Calduch-Giner, J.A., Pendon, C., Valdivia, M.M., Perez-Sanchez, J.,
1998. Recombinant somatolactin as a stable and bioactive protein
in a cell culture bioassay: development and validation of a
sensitive and reproducible radioimmunoassay. J. Endocrinol. 156,
441–447.
Capilla, E., Medale, F., Navarro, I., Panserat, S., Vachot, C., Kaushik, S.,
Gutierrez, J., 2002. Muscle binding and plasma levels in relation to liver
glucokinase activity, glucose metabolism and dietary carbohydrates in
rainbow trout. Regul. Pept. 110, 123–132.
Carneiro, N.M., Navarro, I., Gutierrez, J., Plisetskaya, E.M., 1993. Hepatic
extraction of circulating insulin and glucagon in brown trout (Salmo
trutta fario) after glucose and arginine injection. J. Exp. Zool. 267,
416–422.
Company, R., Calduch-Giner, J.A., Kaushik, S.J., Perez-Sanchez, J., 1999.
Growth performance and adiposity in gilthead sea bream (Sparus
aurata): risks and benefits of high energy diets. Aquaculture 171,
279–292.
Company, R., Astola, A., Pendon, C., Valdivia, M.M., Perez-Sanchez, J.,
2001. Somatotropic regulation of fish growth and adiposity: growth
hormone (GH) and somatolactin (SL) relationship. Comp. Biochem.
Physiol. C130, 435–445.
Devlin, R.H., Biagi, C.A., Yesaki, T.Y., Smailus, D.E., Byatt, J.C., 2001.
Growth of domesticated transgenic fish. Nature 409, 781–782.
Duan, C., Plisetskaya, E.M., 1993. Nutritional regulation of insulin-like
growth factor-I mRNA expression in salmon tissues. J. Endocrinol. 139,
243–252.
Duan, C., Duguay, S.J., Plisetskaya, E.M., 1992. Hormonal regulation of
insulin-like growth factor-I (IGF-I) mRNA expression in coho salmon.
Am. Zool. 32 (13) (Abstract).
Fine, M., Amuly, R., Sandowski, Y., Marchant, T.A., Chan, S.J., Gertler,
A., Funkenstein, B., 1997. Recombinant gilthead sea bream (Sparus
aurata) insulin-like growth factor-I: subcloning, expression in
Escherichia coli, purification and characterization. J. Endocrinol.
153, 139–150.
Forsyth, I.A., Wallis, M., 2002. Growth hormone and prolactin:
molecular and functional evolution. J. Mammary Gland Biol. Neo-
plasia 7, 291–312.
Ghigo, E., Aimaretti, G., Arvat, E., Camanni, F., 2001. Growth hormone-
releasing hormone combined with arginine or growth hormone
secretagogues for the diagnosis of growth hormone deficiency in
adults. Endocrine 15, 29–38.
Gomez-Requeni, P., Mingarro, M., Kirchner, S., Calduch-Giner, J.A.,
Medale, F., Corraze, G., Panserat, S., Martin, S.A.M., Houlihan, D.F.,
Kaushik, S.J., Perez-Sanchez, J., 2003. Effects of dietary amino acid
profile on growth performance, key metabolic enzymes and somato-
tropic axis responsiveness of gilthead sea bream (Sparus aurata).
Aquaculture 220, 749–767.
Gomez-Requeni, P., Mingarro, M., Calduch-Giner, J.A., Medale, F., Martin,
S.A.M., Houlihan, D.F., Kaushik, S., Perez-Sanchez, J., 2004. Protein
growth performance, amino acid utilisation and somatotropic axis
responsiveness to fish meal replacement by plant protein sources in
gilthead sea bream (Sparus aurata). Aquaculture 232, 493–510.
Griffen, S.C., Russell, S.M., Katz, L.S., Nicoll, C.S., 1987. Insulin exerts
metabolic and growth-promoting effects by a direct action on the liver
in vivo: clarification of the functional significance of the portal vascular
link between the beta cells of the pancreatic islets and the liver. Proc.
Natl. Acad. Sci. U. S. A. 84, 7300–7304.
Gutierrez, J., Zanuy, S., Carrillo, M., Planas, J., 1984. Daily rhythms of
insulin and glucose plasma levels in sea bass Dicentrarchus labrax after
experimental feeding. Gen. Comp. Endocrinol. 55, 393–397.
Gutierrez, J., Fernandez, J., Blasco, J., Gesse, J.M., Planas, J., 1986. Plasma
glucagon levels in different species of fish. Gen. Comp. Endocrinol. 63,
328–333.
Herbert, N.A., Armstrong, J.D., Bjfrnsson, B.Th., 2001. Evidence that
growth hormone-induced elevation in routine metabolism of juvenile
Atlantic salmon is a result of increased spontaneous activity. J. Fish
Biol. 59, 754–757.
Hurson, M., Regan, M.C., Kirk, S.J., Wasserkrug, H.L., Barbul, A., 1995.
Metabolic effects of arginine in a healthy elderly population. J. Parenter.
Enteral Nutr. 19, 227–230.
Jfnsson, E., Johnsson, J.I., Bjornsson, B.T., 1996. Growth hormone
increases predation exposure of rainbow trout. Proc. R. Soc. Lond.
B263, 647–651.
Jfnsson, E., Johansson, V., Bjornsson, B.T., Winberg, S., 2003. Central
nervous system actions of growth hormone on brain monoamine levels
and behavior of juvenile rainbow trout. Horm. Behav. 43, 367–374.
Kaneko, T., 1996. Cell biology of somatolactin. Int. Rev. Cytol. 169,
1–24.
Kuhara, T., Ikeda, S., Ohneda, A., Sasaki, Y., 1991. Effects of intravenous
infusion of 17 amino acids on the secretion of GH, glucagon, and
insulin in sheep. Am. J. Physiol. 260, E21–E26.
Martınez-Barbera, J.P., Pendon, C., Martı-Palanca, H., Calduch-Giner, J.A.,
Valdivia, M.M., Perez-Sanchez, J., 1995. The use of recombinant
gilthead sea bream (Sparus aurata) growth hormone for radioiodination
and standard preparation in radioimmunoassay. Comp. Biochem.
Physiol. A110, 335–340.
Martı-Palanca, H., Martınez-Barbera, J.P., Pendon, C., Valdivia, M.M.,
Perez-Sanchez, J., Kaushik, S., 1996. Growth hormone as a function of
age and dietary protein:energy ratio in a marine teleost, the gilthead sea
bream (Sparus aurata). Growth Regul. 6, 253–259.
Mingarro, M., Vega-Rubın de Celis, S., Astola, A., Pendon, C.,
Martınez-Valdivia, M., Perez-Sanchez, J., 2002. Endocrine mediators
of seasonal growth in gilthead sea bream (Sparus aurata): the growth
hormone and somatolactin paradigm. Gen. Comp. Endocrinol. 128,
102–111.
Mommsen, T.P., Plisetskaya, E.M., 1991. Insulin in fishes and
agnathans: history, structure, and metabolic regulation. Rev. Aquat.
Sci. 4, 225–259.
Mommsen, T.P., Moon, T.W., Plisetskaya, E.M., 2001. Effects of arginine
on pancreatic hormones and hepatic metabolism in rainbow trout.
Physiol. Biochem. Zool. 74, 668–678.
Navarro, I., Carneiro, M.N., Parrizas, M., Maestro, J.L., Planas, J.,
Gutierrez, J., 1993. Post-feeding levels of insulin and glucagon in trout
(Salmo trutta). Comp. Biochem. Physiol. A104, 389–393.
Navarro, I., Gutierrez, J., Planas, J., 1995. Estimates of fish glucagon by
heterologous radioimmunoassay: antibody selection and cross-reactiv-
ities. Comp. Biochem. Physiol. C110, 313–319.
Navarro, I., Blasco, J., Banos, N., Gutierrez, J., 1997. Effects of fasting and
feeding on plasma amino acid levels in brown trout. Fish Physiol.
Biochem. 16, 303–309.
Novoa, S., Capilla, E., Rojas, P., Navarro, I., Gutiurrez, J., 2002. Insulin
and glucagon response to dietary carbohydrate in rainbow trout.
Proceedings of the 21st Conference of European Comparative
Endocrinologists. European Society of Comparative Endocrinology
Publishers, Bonn, Germany, pp. 149.
S. Vega-Rubın de Celis et al. / Comparative Biochemistry and Physiology, Part A 138 (2004) 533–542542
NRC (National Research Council), 1993. Nutrient Requirements of Fish.
National Academy Press, Washington, DC. 114 pp.
Parrizas, M., Banos, N., Baro, J., Planas, J., Gutierrez, J., 1994. Up-
regulation of insulin binding in fish skeletal muscle by high insulin
levels. Regul. Pept. 53, 211–222.
Perez-Sanchez, J., Martı-Palanca, H., Le Bail, P.-Y., 1994. Seasonal
changes in circulating growth hormone (GH), hepatic GH-binding
and plasma insulin-like growth factor-I immunoreactivity in a marine
fish, gilthead sea bream, Sparus aurata. Fish Physiol. Biochem. 13,
199–208.
Perez-Sanchez, J., Martı-Palanca, H., Kaushik, S.J., 1995. Ration size and
protein intake affect circulating growth hormone concentration, hepatic
growth hormone binding and plasma insulin-like growth factor-I
immunoreactivity in a marine teleost, the gilthead sea bream (Sparus
aurata). J. Nutr. 125, 546–552.
Perez-Sanchez, J., Calduch-Giner, J.A., Mingarro, M., Vega-Rubın de
Celis, S., Gumez-Requeni, P., Saera-Vila, A., Astola, A., Valdivia,
M.M., 2002. Overview of fish growth hormone family. New insights in
genomic organization and heterogeneity of growth hormone receptors.
Fish Physiol. Biochem. 27, 243–258.
Peyon, P., Vega-Rubın de Celis, S., Gomez-Requeni, P., Zanuy, S., Perez-
Sanchez, J., Carrillo, M., 2003. In vitro effect of leptin on somatolactin
release in the European sea bass (Dicentrarchus labrax): dependence on
the reproductive status and interaction with NPY and GnRH. Gen.
Comp. Endocrinol. 132, 284–292.
Pinillos, M.L., De Pedro, N., Alonso-Gomez, A.L., Alonso-Bedate, M.,
Delgado, M.J., 2001. Feed intake inhibition by melatonin in goldfish
(Carassius auratus). Physiol. Behav. 72, 629–634.
Plisetskaya, E.M., Buchelli-Narvaez, L.I., Hardy, R., Dickhoff, W.D., 1991.
Effects of injected and dietary arginine on plasma insulin levels and
growth of pacific salmon and rainbow trout. Comp. Biochem. Physiol.
A98, 165–170.
Pottinger, T.G., Rand-Weaver, M., Sumpter, J.P., 2003. Overwinter fasting
and re-feeding in rainbow trout: plasma growth hormone and cortisol
levels in relation to energy mobilisation. Comp. Biochem. Physiol.
B136, 403–417.
Rand-Weaver, M., Kawauchi, H., 1993. Growth hormone, prolactin and
somatolactin: a structural overview. In: Hochachka, P.W., Mommsen,
T.P. (Eds.), Biochemistry and Molecular Biology of Fishes, Molecular
Biology Frontiers, vol. 2. Elsevier, Amsterdam, pp. 39–56.
Rand-Weaver, M., Noso, T., Muramoto, K., Kawauchi, H., 1991. Isolation
and characterization of somatolactin, a new protein related to growth
hormone and prolactin from Atlantic cod (Gadus morhua) pituitary
glands. Biochemistry 30, 1509–1515.
Rand-Weaver, M., Pottinger, T.G., Sumpter, J.P., 1995. Pronounced
seasonal rhythms in plasma somatolactin levels in rainbow trout. J.
Endocrinol. 146, 113–119.
Robertson, R.P., Sutherland, D.E., Seaquist, E.R., Lanz, K.J., 2003.
Glucagon, catecholamine, and symptom responses to hypoglycemia in
living donors of pancreas segments. Diabetes 52, 1689–1694.
Sundby, A., Hemre, G.-I., Borrebaek, B., Christophersen, B., Blom, A.K.,
1991. Insulin and glucagon family peptides in relation to activities of
hepatic hexokinase and other enzymes in fed and starved Atlantic
salmon (Salmo salar) and cod (Gadus morhua). Comp. Biochem.
Physiol. B100, 467–470.
Vega-Rubın de Celis, S., Gomez, P., Calduch-Giner, J.A., Medale, F.,
Perez-Sanchez, J., 2003. Expression and characterisation of European
sea bass (Dicentrarchus labrax) somatolactin (SL): assessment of in
vivo metabolic effects. Mar. Biotechnol. 5, 92–101.
Walker, W.H., Fitzpatrick, S.L., Barrera-Saldana, H.A., Resendez-Perez, D.,
Saunders, G.F., 1991. The human placental lactogen genes: structure,
function, evolution and transcriptional regulation. Endocr. Rev. 12,
316–328.
Yang, B.-Y., Chen, T.T., 2003. Identification of a new growth hormone
family protein, somatolactin-like protein, in the rainbow trout (Onco-
rhynchus mykiss) pituitary gland. Endocrinology 144, 850–857.
Related Documents