Newly Qualified Teachers: Annual Survey 2016 Research report August 2016 Julia Pye, Rowena Stobart, Lucy Lindley, Ipsos MORI

Welcome message from author
This document is posted to help you gain knowledge. Please leave a comment to let me know what you think about it! Share it to your friends and learn new things together.
Transcript

Newly Qualified Teachers: Annual Survey 2016 Research report
August 2016
Julia Pye, Rowena Stobart, Lucy Lindley, Ipsos MORI
2
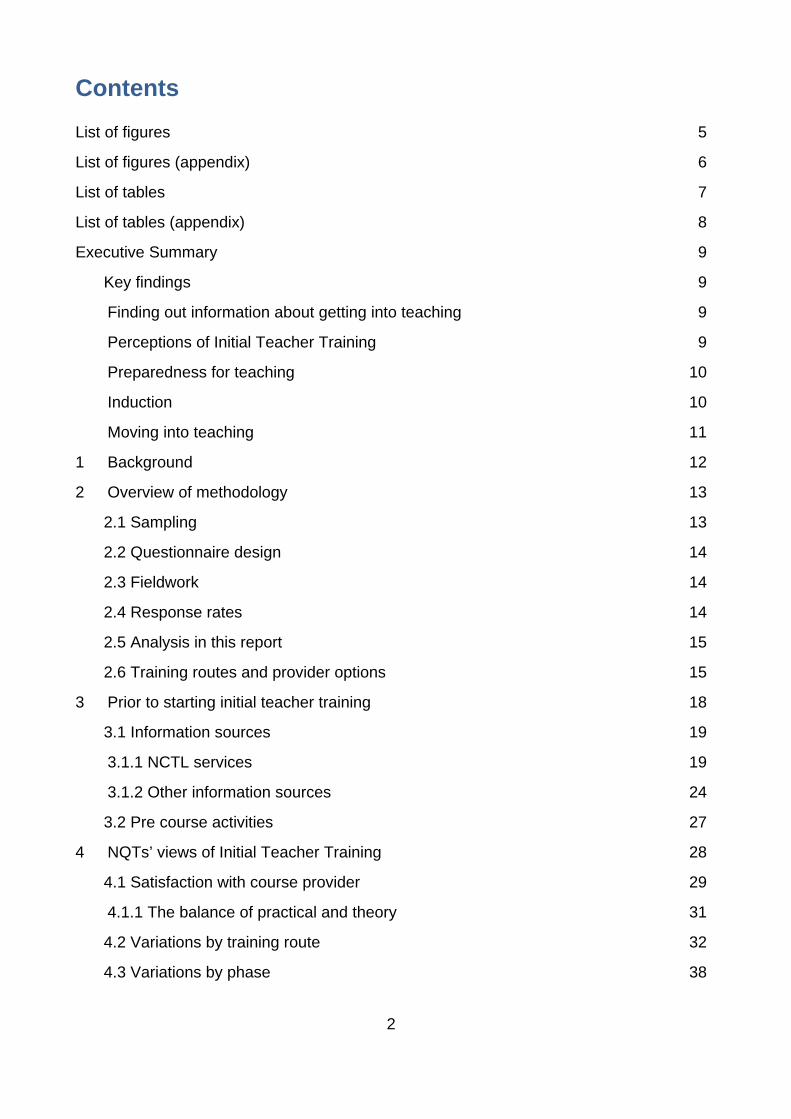
Contents List of figures 5
List of figures (appendix) 6
List of tables 7
List of tables (appendix) 8
Executive Summary 9
Key findings 9
Finding out information about getting into teaching 9
Perceptions of Initial Teacher Training 9
Preparedness for teaching 10
Induction 10
Moving into teaching 11
1 Background 12
2 Overview of methodology 13
2.1 Sampling 13
2.2 Questionnaire design 14
2.3 Fieldwork 14
2.4 Response rates 14
2.5 Analysis in this report 15
2.6 Training routes and provider options 15
3 Prior to starting initial teacher training 18
3.1 Information sources 19
3.1.1 NCTL services 19
3.1.2 Other information sources 24
3.2 Pre course activities 27
4 NQTs’ views of Initial Teacher Training 28
4.1 Satisfaction with course provider 29
4.1.1 The balance of practical and theory 31
4.2 Variations by training route 32
4.3 Variations by phase 38

3
4.4 Other variations in perceptions of training quality 39
5 NQTs’ views of how well their Initial Teacher Training prepared them to teach 40
5.1 NQTs’ views of how well Initial Teacher Training prepared them for their role 41
5.2 Variations by training route 43
5.3 Variations by phase 45
5.4 Other variations 48
6 Statutory induction 49
6.1 Overall satisfaction with the induction 50
6.1.1 Satisfaction with induction elements 50
6.1.2 Variations by subgroups 51
6.2 Themes from open response questions 53
6.2.1 Mentors and tutors 53
6.2.2 Training 54
6.2.3 Large workloads 54
7 Moving into teaching roles 56
7.1 How NQTs found their roles 56
7.1.1 Route and phase 57
7.1.2 Subject 57
7.1.3 Gender 58
8 Conclusions 59
Appendix: Survey methodology 62
A.1 Questionnaire design and testing 62
A.1.1 Background to questionnaire changes 62
A.1.2 Desk review of questionnaire 62
A.1.3 Cognitive interview methodology and sampling 64
A.1.4 Changes in questionnaire following cognitive interviews 66
A.1.5 Analysis of survey responses and implications for questionnaire design 66
A.2 Sample design 70
A.3 Sample profile 71
A.4 Fieldwork 74
A.5 Response rates 74

4
A.5 Advance letters 76
A.6 Postal survey 78
A.7 Mobile-optimised online survey 78
A.8 Email reminders 79
A.9 Text reminders 79
A.10 Conclusions and recommendations 80
5
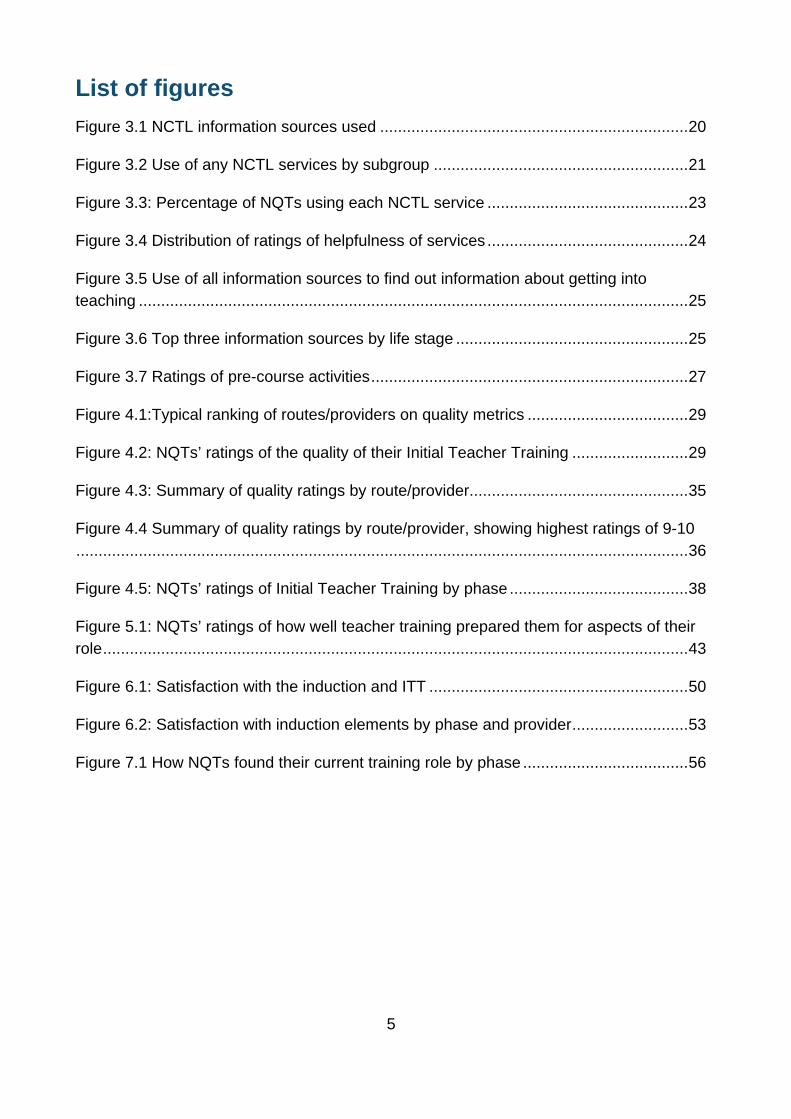
List of figures Figure 3.1 NCTL information sources used ..................................................................... 20
Figure 3.2 Use of any NCTL services by subgroup ......................................................... 21
Figure 3.3: Percentage of NQTs using each NCTL service ............................................. 23
Figure 3.4 Distribution of ratings of helpfulness of services ............................................. 24
Figure 3.5 Use of all information sources to find out information about getting into teaching ........................................................................................................................... 25
Figure 3.6 Top three information sources by life stage .................................................... 25
Figure 3.7 Ratings of pre-course activities ....................................................................... 27
Figure 4.1:Typical ranking of routes/providers on quality metrics .................................... 29
Figure 4.2: NQTs’ ratings of the quality of their Initial Teacher Training .......................... 29
Figure 4.3: Summary of quality ratings by route/provider................................................. 35
Figure 4.4 Summary of quality ratings by route/provider, showing highest ratings of 9-10 ......................................................................................................................................... 36
Figure 4.5: NQTs’ ratings of Initial Teacher Training by phase ........................................ 38
Figure 5.1: NQTs’ ratings of how well teacher training prepared them for aspects of their role ................................................................................................................................... 43
Figure 6.1: Satisfaction with the induction and ITT .......................................................... 50
Figure 6.2: Satisfaction with induction elements by phase and provider .......................... 53
Figure 7.1 How NQTs found their current training role by phase ..................................... 56

6
List of figures (appendix) Figure A. 4. 1: Contact protocol for 2016 national survey of NQTs .................................. 74

7
List of tables Table 1.1: Final year trainees, by provider and route of Initial Teacher Training, for the academic year 2014-15 ................................................................................................... 12
Table 4.1 NQTs’ views of the amount of practical experience and theory on their ITT .... 31
Table 4.2 Correlation between the overall quality of ITT and measures of course teaching, support and content .......................................................................................... 32
Table 5.1 Proportion of NQTs saying their ITT prepared them well for each aspect of teaching ........................................................................................................................... 40
Table 5.2 Proportion of NQTs that felt ITT prepared them well for each aspect of teaching, by training provider ........................................................................................... 44
Table 5.3 aspects of teaching where ratings ‘gap’ between SCITT-trained NQTs and HEI-trained NQTs were largest ............................................................................................... 45
Table 5.4 Proportion of NQTs that felt ITT prepared them well for each aspect of teaching, by phase ........................................................................................................... 46
Table 5.5 Aspects of teaching where ratings ‘gap’ between primary-trained NQTs and secondary-trained NQTs were largest ............................................................................. 47
Table 6.1 Correlation between the overall quality of induction and measures of planning, support, feedback and guidance on CPD ........................................................................ 51
Table 7.1 Breakdown of those who found work via their training school by phase and route ................................................................................................................................ 57

8
List of tables (appendix) Table A.1.1 Cognitive testing sample composition .......................................................... 65
Table A.1.2 Mean time to complete online survey ........................................................... 66
Table A.1.3 Online survey completion times .................................................................... 67
Table A.1.4 Where respondents abandoned the survey .................................................. 68
Table: A.1.5 Variation in responses at Q10/Q11 grids ..................................................... 69
Table A 2.1 NQT population and sample profile .............................................................. 70
Table A.3.1: Achieved sample profile (unweighted) ......................................................... 72
Table A.4.1 Online survey outcomes for main and reserve sample ................................. 75
Table A.4.2: Online survey outcomes for all issued sample............................................. 75
Table A.4.3: Postal survey outcomes (main sample only) ............................................... 76
Table A.4.4 Numbers of responses and response rates for sample sent advance letter vs. those not sent advance letter ........................................................................................... 77
Table A.4.5 Type of device used to complete online survey ............................................ 78
Table A.4.6 Operating systems used to complete online survey ..................................... 79

9
Executive Summary Ipsos MORI was commissioned by the National College for Teaching & Leadership (NCTL) to run the 2016 Newly Qualified Teachers (NQTs) survey. The survey is the latest in a series, the most recent of which ran in 2015. The survey represents those NQTs who gained Qualified Teacher Status (QTS) between December 2014 and November 2015. The sample was selected from NCTL’s database of NQTs. The achieved sample size was 1,915, with 1,612 NQTs responding online and 303 by post between 18 May and 18 July 2016. Data are weighted by phase/route, region, life stage and gender to the profile of eligible NQTs in the population. This year’s survey was slightly different to earlier surveys in the series, because it took a sample of NQTs rather than a census, and because it used a mixed-mode (online and postal) rather than online surveying methodology.
Key findings
Finding out information about getting into teaching
Some 43% of NQTs had used NCTL services to find out about getting into teaching, with the Get into Teaching website the most commonly used source (by 40%). No more than 12% had used any of the other NCTL services asked about – Train to Teach events, the School Experience Programme, or the Teaching Information Line. At least 70% of NQTs using each NCTL service rated it as helpful.
There was a clear divide by age in the sources of information used: UCAS and university prospectuses were the most commonly used sources of information for NQTs under 27 years old, while NCTL Get into Teaching services were the most commonly cited sources of information for older entrants.
NQTs rated the information and activities they received from their provider prior to starting Initial Teacher Training (ITT) relatively poorly when compared with other measures captured in this survey: 53% rated them as 7-10 out of 10 in terms of how well they prepared NQTs for teaching.
Perceptions of Initial Teacher Training
As in previous surveys in the series, the great majority of NQTs were satisfied with the Initial Teacher Training (ITT) they received. Some 81% of NQTs rated the overall quality of their training as 7-10 out of 10, with a third rating it as 9-10 out of 10. A clear majority of NQTs on all training routes gave positive ratings of the quality of their training, the support they received, their course provider, and the amount of theory and practical training provided. Three quarters would recommend their training provider to others.

10
There are consistent differences by route: NQTs on school-centred initial teacher training (SCITT) routes generally indicated higher levels of satisfaction than NQTs on higher education institution (HEI) -led courses or Teach First. Within the SCITT-led School Direct route, those who received a salary were generally less satisfied than those who paid a fee.
Preparedness for teaching
The majority of NQTs felt well prepared for most of the 21 skills asked about on the survey.1 The relative ratings for each aspect of teaching are similar to previous surveys in the series. As in 2015, NQTs were particularly positive about their preparedness for general teaching skills and requirements, and the way their training aided their future career progression. In line with previous years, NQTs felt their training had prepared them less well to cater for pupils with specific needs – such as those with English as an Additional Language (EAL) or Special Educational Needs (SEN), deploy support staff in the classroom, or communicate with parents/ carers.
SCITT-trained NQTs typically felt their training prepared them better for teaching than NQTs on other routes: SCITT-trained NQTs gave significantly higher ratings than those trained on HEI-led routes on 19 of 21 aspects of teaching asked about on the survey, and higher than Teach First NQTs on 14 aspects.
As in the 2015 survey, secondary-trained NQTs typically felt their training prepared them better for teaching than primary-trained NQTs: secondary-trained NQTs rated 14 of 17 aspects of teaching significantly higher than primary-trained NQTs. This does not merely reflect differences by route: a higher proportion of secondary-trained than primary-trained NQTs on both SCITT- and HEI-led courses rated themselves as prepared for 11 of the 17 aspects of teaching asked about.
Induction
Some 87% of NQTs were currently completing their statutory induction year (or “NQT year”). As in last year’s survey, NQTs surveyed in 2016 were generally content with their induction: 76% rated the quality of their induction between 7 and 10. Over 70% of NQTs rated each element of their induction asked about on the survey as 7-10 out of 10: free time for planning, preparation and assessment; support from a tutor; feedback on teaching observations; and guidance on identifying appropriate continuing professional development.
1 See Chapter 5 for details of the skills asked about.

11
Moving into teaching
A question was added to this year’s survey asking NQTs currently in teaching (95% of all respondents) how they found out about their current position. From this question it was established that the most widely used method of getting a job was through working or training at a school: nearly two in five (36%) found their role this way. School Direct and Teach First NQTs were more likely to find work through schools they had trained in than other routes, which is in line with the aims of these routes.

12
1 Background Attracting high-quality new entrants to the teaching profession is a priority for the Department for Education (DfE) and the National College for Teaching & Leadership (NCTL). The cost of training new teachers amounts to around £700 million each year2. There are over 450,000 teachers in the workforce in total, with c.30,600 qualified teachers (NQTs) joining the teaching profession in 20153.
In recent years, there has been a substantial shift in the way entrants to the workforce are trained. Newly Qualified Teachers (NQTs) are now less likely to be trained in higher education institutions (HEI) and more likely than ever to be trained in schools. According to government figures released in August 2016 the proportion of postgraduate trainees on HEI-led routes declined from 67% in 2013-14 to 56% in 2015 among those on their first year of ITT; over the same period the proportion training through a school based route increased from 33% to 44%4.
Table 1.1: Final year trainees, by provider and route of Initial Teacher Training, for the academic year 2014-15
All trainees Awarded QTS Postgraduate, of which: 26,607 24,355 HEI-led 15,376 13,848 School-led, of which: 11,232 10,507
Delivered with HEI partner provider 6,017 5,586 Delivered with SCITT partner provider/ SCITT-led 5,215 4,921
Teach First 1,372 1,286 Undergraduate 7,336 6,265
Source: DfE Statistical First Release 31/2016, 28 July 2016 The annual survey of newly qualified teachers has been conducted since 2003. The aim of this research report is to:
• understand NQTs’ perceptions about the effectiveness of their teacher training in preparing them to teach;
• identify key differences in these perceptions across NQTs, and in particular, variations between those training via different routes; and,
• identify areas for improvement in the future delivery of initial teacher training.
2 https://www.nao.org.uk/report/training-new-teachers/ 3 https://www.gov.uk/government/statistics/initial-teacher-training-performance-profiles-2014-to-2015 4
https://www.gov.uk/government/uploads/system/uploads/attachment_data/file/541055/SFR31_2016_Text.pdf
13
2 Overview of methodology Ipsos MORI was commissioned by the National College for Teaching & Leadership (NCTL) to run the 2015 Newly Qualified Teachers (NQTs) survey. The survey is the latest in a series, the most recent of which ran in 2015. This year’s study was different to earlier surveys in a number of respects, primarily because it ran as a survey rather than attempting a census of NQTs. This change allowed Ipsos MORI to test a number of ways of improving response rates on a smaller-scale wave of the survey, while generating nationally representative data that would enable key trends to be monitored as part of the survey series.
The survey has run online since 2013, but this year used a mixed-mode online and postal methodology. Those NQTs who did not respond to the initial email invitations and reminders to complete the online survey were sent a copy of the questionnaire in the post. Where mobile telephone numbers were available, NQTs were also sent text message reminders about the survey (with clickable links to complete the survey on their smartphones), in case they had not seen or checked their emails. The online survey was optimised for completion on mobile devices.
Further information about the methodology can be found in the Appendix.
2.1 Sampling NCTL provided a database of all eligible NQTs – i.e. those who gained QTS between December 2014 and November 2015. In total the database contained 32,189 records, of which 27,509 were contactable for this survey (either had an email or postal address). A sample of 4,437 NQTs was drawn from the database. Towards the end of fieldwork, it became apparent that the overall numbers responding to the survey were lower than required, and a reserve sample of 2,583 NQTs was issued. Because the fieldwork for the reserve sample was much shorter, they only received the online survey rather than the full mixed-mode design and received only two email invitations to complete the online survey.
The sample was designed to boost sub-groups in the population that were of analytical interest but which would generate small numbers in a fully proportionate sample. These included primary and secondary Teach First NQTs, and those on School Direct (salaried) routes (see Table 2.1 below). A full breakdown of the sample selected can be found in the Appendices. The achieved sample size was 1,915, with 1,612 responding online and 303 by post. Data are weighted by phase/route, region, life stage and gender to the profile of eligible NQTs in the population.

14
2.2 Questionnaire design Ipsos MORI worked with NCTL to review the 2015 questionnaire. The review aimed to address some of the issues noted on previous survey waves and most notably the fact that almost all NQTs rated every aspect of their training as one of the top two points on the four-point scale used previously. Following a series of 20 cognitive interviews with NQTs, the questionnaire was revised and updated. Key changes include:
• The use of a 10-point rather than a 4-point scale for most questions.
• Changes in question wording to clarify key points. For example, on a series of questions about how well prepared NQTs are for teaching, wording clarified that NQTs should think about how well their training prepared them for various aspects of teaching, rather than how well prepared they felt.
• The addition of new questions to capture more information about aspects of their course that NQTs’ verbatim comments had indicated as being important in previous survey waves, including: the amount of personal support provided; and the balance of practical and theory taught on their course. Other questions were added to explore whether more course information could help in generating actionable findings, such as the number and duration of in-school placements.
The changes were discussed with the study steering group in April 2016, and the steering group assisted in making final revisions to the questions asked.
2.3 Fieldwork The fieldwork for the main sample ran from 18 May to 18 July 2016. Fieldwork was conducted online and via a postal paper survey. The reserve sample was in field from 30 June to 18 July 2016, and used an online method only.
2.4 Response rates A total of 1,915 NQTs responded to the survey. This represents a response rate of 31% for the main sample which received the full complement of reminders and a mixed-mode surveying approach. The response rate for the reserve sample was 21%, giving an overall response rate of 27%. An analysis of the variables available on the sample did not reveal any obvious sources of bias in the responding sample: for example, 95% of survey respondents were in a teaching role (including full- and part-time teachers,

15
teaching assistants, and other roles in school) which matches the proportion in the DfE’s latest statistical release.5
2.5 Analysis in this report The analysis in this report is based primarily on NQTs’ responses to survey questions. However, we also include analysis of the verbatim responses to a small number of open-ended questions. These verbatim responses were analysed and coded in detail, and the quotations used in this report are typical of the most common responses given at each open-ended question. Because the open responses reflect only the views of those who chose to comment at these questions, we have not quantified the numbers giving each response.
The analysis looks at differences between NQTs, and in particular at differences between NQTs on different training routes. However, it is worth bearing in mind that the actual experiences of NQTs across different training routes may be similar. The table below illustrates the key training routes used for analysis in this report, and an overview of the key features of each.
It is worth noting that Teach First NQTs are included in the NQTs survey, although responses for this group are markedly different to other NQTs’ in several respects. This may reflect the unique nature of the Teach First training route. As we note in the methodology report (see Appendix) there may be some value in the future in reviewing the extent to which the standard questions asked on this survey are suitable for those entering the profession via the Teach First route.
2.6 Training routes and provider options Initial teacher training (ITT) is provided by either:
• a university or by,
• a school centred initial teacher training provider (SCITT).
Teaching is a graduate-profession and the majority of trainees enter training at post graduate level.
5 DfE data shows that, of those NQTs who gained QTS a total of 95% were in a teaching role after 6 months. https://www.gov.uk/government/statistics/initial-teacher-training-performance-profiles-2014-to-2015 (Derived from Table 5 in the main data tables)

16
Both universities and SCITTs provide a number of different routes for training towards the award of qualified teacher status (QTS). These include training programmes led by universities, SCITTs and schools.
• Provider-led (fee-paying) postgraduate courses – these can be delivered by both universities and SCITTs and lead to the award of QTS and, where offered, the option of a post-graduate qualification.
• School Direct (fee-paying) – designed by a group of schools in partnership with a university or SCITT provider. Courses generally last a year and result in QTS – most also offer an academic award such as a PGCE.
• School Direct (SD) salaried - designed by a group of schools in partnership with a HEI or SCITT provider. Trainees are selected directly by the school or school-partnership and they earn a salary whilst they train. Courses normally take a year to complete and result in the award of QTS for successful candidates – most also offer an academic award such as a PGCE. Trainees are employed as an unqualified teacher while they learn ‘on-the-job’, supported by experienced teachers and mentors.
• Other provider-led routes include:
o Teach First – a school-based training route that places graduates with strong academic records in disadvantaged schools. ITT is provided by universities. Teach First is a two-year leadership development programme; it includes training, coaching and work-experience leading to a post graduate certificate in education (PGCE) qualification. The first year is equivalent to the ITT year and results in the award of QTS; the second is equivalent to the NQT or statutory induction year.
o Undergraduate courses – trainees gain a degree and QTS on a three or four year course at a university. The majority of these programmes are for primary trainee teachers.
Differences between NQTs at different life stages are also commented upon. The classifications used are:
• Graduates (up to 27 years old);
• Career finders (27-31 years old); and,
• Career changers (32 years or older).

17
The report only comments on statistically significant differences between groups of NQTs. Charts and tables use letters to indicate where the findings for one sub-group are statistically significantly higher than the findings for the group it is compared with.

18
3 Prior to starting initial teacher training
New questions on this year’s survey asked NQTs about their use of NCTL services to find out information about Initial Teacher Training (ITT) prior to starting ITT, and the pre-course activities and information they received from their training providers.
Some 43% of NQTs recalled using NCTL services to find out information about getting into teaching. The Get into Teaching website, used by 40%, was the most widely used NCTL service. The majority of NQTs had not heard of three other NCTL services asked about, and less than 15% had used any one of them: Train to Teach events, the School Experience Programme, and the Teaching Information Line. Despite limited use of some services, at least 70% of NQTs using each service rated it as helpful (7-10 out of 10).
NQTs were more likely to have used non-NCTL sources than NCTL services to gather information about Initial Teacher Training, primarily UCAS (used by 65%) and university prospectuses (59%). Informal sources such as word of mouth (60%) and advice from teachers (57%) were also widely used.
There is a clear difference by life stage in the use of services and information sources to find out about ITT: the most commonly used sources for NQTs under 27 years old were UCAS and university prospectuses, while the Get into Teaching website was the most commonly used service for older NQTs. In line with this, those training via HEI-led courses were more likely to use UCAS and university prospectuses, and those on SCITT-led courses more likely to use Get into Teaching.
Ratings of how well the pre-course activities and information from their training provider prepared them for the start of their course were less positive than other survey measures: 53% of NQTs rated this information as 7 or more out of 10.
19
3.1 Information sources
3.1.1 NCTL services
Awareness and use
NCTL and DfE have four main information sources as part of their Get into Teaching service: the website; the School Experience Programme; an information line (phone and web chat); and Train to Teach events. The survey asked about NQT’s awareness and use of these four services in the period prior to them starting their ITT.
Of the NCTL services asked about, more NQTs had heard of the Get into Teaching website than any other service. Nearly two thirds (65%) had heard of the website and of those, 40% used it6. NQTs’ levels of awareness of other services were limited: the majority had not heard of each service and 30% had not heard of any of the four services.
In terms of the number of NCTL sources used by NQTs, 27% used one service, 11% used two, 3% used three and 1% used all four. Over half (57%) used none of the services.
To note, the survey question asked about information gathered after someone had made the decision to get into teaching. Therefore it is possible that NQTs had used NCTL information sources but only in order to influence their decision to get into teaching, not as an information source once they had made their choice.
6 This result is similar to previous research which looked into sources of support for potential trainees when they were making the decision to get into teaching. The survey found that two in five (39%) had been supported by government websites when making the decision about whether to train as a teacher and this was most likely to be the Get Into Teaching website https://www.gov.uk/government/uploads/system/uploads/attachment_data/file/530894/RR502_Customer_Journey_to_initial_teacher_training.pdf
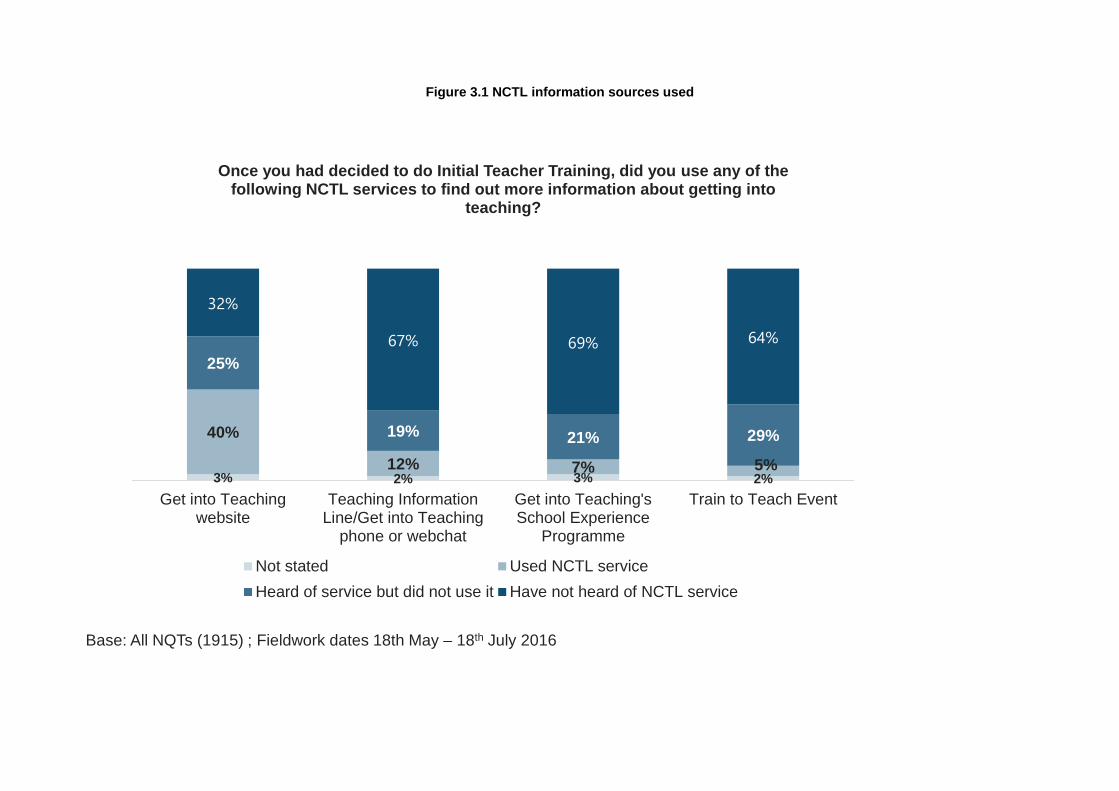
Figure 3.1 NCTL information sources used
3% 2% 3% 2%
40%
12% 7% 5%
25%
19% 21% 29%
32%
67% 69% 64%
Get into Teachingwebsite
Teaching InformationLine/Get into Teaching
phone or webchat
Get into Teaching'sSchool Experience
Programme
Train to Teach Event
Once you had decided to do Initial Teacher Training, did you use any of the following NCTL services to find out more information about getting into
teaching?
Not stated Used NCTL serviceHeard of service but did not use it Have not heard of NCTL service
Base: All NQTs (1915) ; Fieldwork dates 18th May – 18th July 2016

Variations by subgroups
Figure 3.2 Use of any NCTL services by subgroup7
7 The letters in the chart denote where figures are statistically significantly higher than other categories within the same group. For example, primary-trained NQTs are denoted with a, and the letter a after the secondary finding of 54% in Figure 3.2 indicates that the secondary figure of 54% is significantly higher than the primary figure of 35%. The same notation is used throughout this report. Note that subject specialisms are based on secondary teachers only.
Overall Phase Provider type Life stage Subject
43%
35%
54%
41%
57%
15%
33%
50%
72%
48%
60%
Once you had decided to do Initial Teacher Training, did you use any following NCTL services to find out more information about getting into teaching?
Base: All NQTs (1915) ; Fieldwork dates 18th May – 18th July 2016
Primary Secondary Teach FirstHEI SCITT Graduate Career finder
Career changer(942) (973) (220)(1292) (403) (1034)
(429) (452)
Other subjects
STEM/MFL/Classics
(466) (384)
% who used any NCTL
service
a b
a
a b c
a c
a b
b c
a b c
a
b
c
b c
a
a b
a

The data displayed in Figure 3.2 show the following variations by subgroup:
• Secondary-trained NQTs were more likely than primary-trained NQTs to have used at least one of the NCTL services.
• NQTs trained on HEI- and SCITT-led routes were much more likely than those trained via Teach First to use an NCTL service.
• Career changer NQTs were more likely than younger NQTs to have used an NCTL service.
• Secondary-trained NQTs who specialised in science, technology, engineering and mathematics (STEM), modern foreign languages (MFL) and Classics8 were more likely to have used any of the services than other subjects (see Figure 3.3). This reflects that STEM and languages are included in the Premier Plus9 service which allows potential NQTs to access certain areas of the website and the School Experience Programme. The services are focused on recruiting for shortage secondary subjects which accounts for the higher numbers of secondary-trained NQTs using the services.
8 There were very few (6) classics-trained NQTs in the sample. 9 Students entitled to Premier Plus during the academic year 13/14 were those teaching maths, physics, chemistry, languages and computing, with a degree class of 2:1 or above (plus 2:2 for maths only). This changed mid-way through the year to include those with a 2:2 (with the exception of maths and physics, where someone with lower than a 2:2 but who had a B+ at A-Level were also eligible) and D&T.
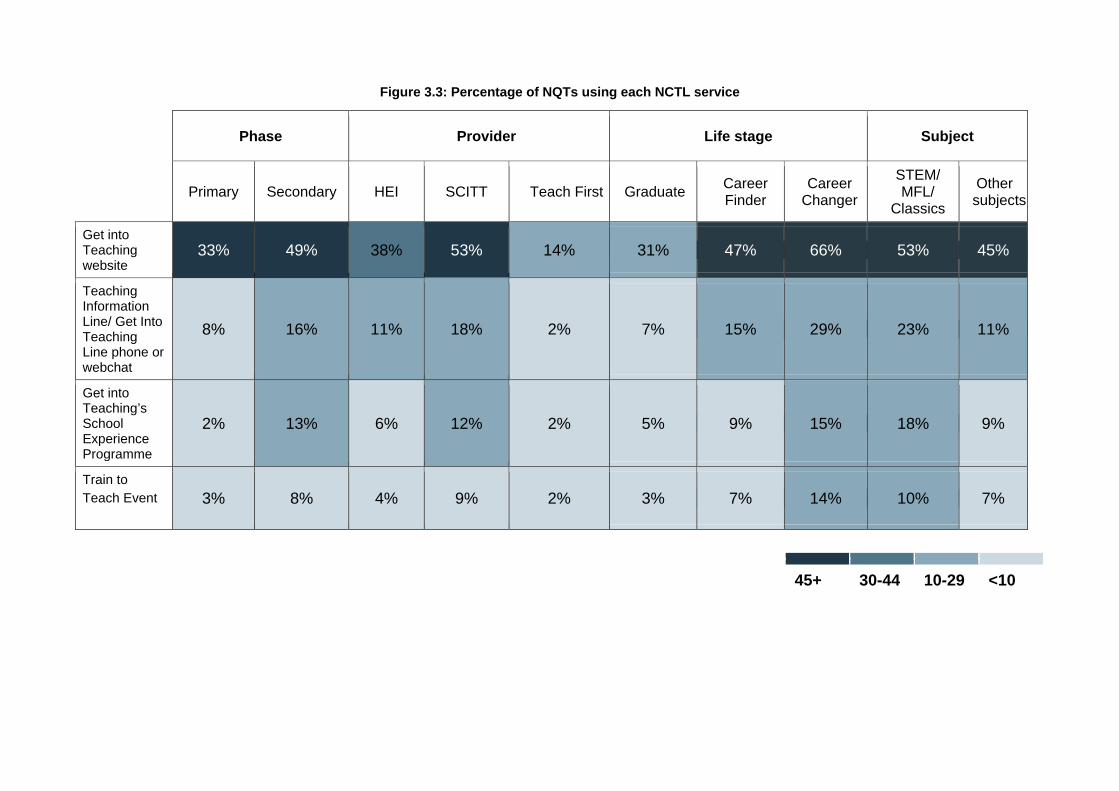
Figure 3.3: Percentage of NQTs using each NCTL service
Phase Provider Life stage Subject
Primary Secondary HEI SCITT Teach First Graduate Career Finder
Career Changer
STEM/ MFL/
Classics
Other subjects
Get into Teaching website
33% 49% 38% 53% 14% 31% 47% 66% 53% 45%
Teaching Information Line/ Get Into Teaching Line phone or webchat
8% 16% 11% 18% 2% 7% 15% 29% 23% 11%
Get into Teaching’s School Experience Programme
2% 13% 6% 12% 2% 5% 9% 15% 18% 9%
Train to Teach Event 3% 8% 4% 9% 2% 3% 7% 14% 10% 7%
45+ 30-44 10-29 <10

Helpfulness of services
NQTs found the NCTL information sources they used helpful; at least 70% gave each of the services a rating of 7-10, as can be seen in Figure 3.4. Those attending Train to Teach events were particularly positive.
Although it was the most widely used of NCTL’s ‘Get into Teaching’ services, NQTs were less likely to consider the website helpful than any other service, with 30% rating it between 1 and 6. Other services received a high number of top ratings, notably the School Experience Programme which one in three (30%) gave a rating of 10. The findings suggest that smaller-scale events, that are more tailored, may have a bigger impact on those who use them.
Figure 3.4 Distribution of ratings of helpfulness of services
3.1.2 Other information sources
The survey asked about other sources of information NQTs had used to find out information about getting into teaching, as well as NCTL services. UCAS was the most widely used source of information for prospective trainees, as can be seen in Figure 3.5, with a high proportion also using university prospectuses and websites. Informal sources were also used by a majority, including word of mouth and advice from current trainees and teachers.
3% 6% 6% 3%
26% 20% 16% 14%
47%35% 39% 50%
23%39% 39% 33%
Get Into Teaching website Get Into Teaching's SchoolExperience Programme
Teaching Information Line/Get Into Teaching Line
phone or webchat
Train to Teach Event
1-3 4-6 7-8 9-10
70% 74% 77% 83%% rating 7-10:
How helpful was each NCTL service in providing information about the options available to get into teaching?
Base: All NQTs (1915) ; Fieldwork dates 18th May – 18th July 2016

25
Figure 3.5 Use of all information sources to find out information about getting into teaching
The following variations by subgroup were evident:
Life stage
As shown in Figure 3.6 younger NQTs were more likely to use formal, university-oriented, sources than older NQTs. NQTs aged 33 or older were more likely to use the Get into Teaching Website, as well as informal sources.
Figure 3.6 Top three information sources by life stage
Graduate (under 27) (base:1034)
Career finder (27-31) (base:429)
Career changer (32+) (base:452)
UCAS (70%) Word of mouth (66%) Get into Teaching Website (66%)
University websites/ prospectuses (64%)
Advice from current trainees/teachers (59%)
Advice from current trainees/teachers (61%)
Word of mouth (59%) UCAS (56%) Word of mouth (56%)
Base: All NQTs (1,915) surveyed 18 May – 18 July 2016; see columns for sub-group base sizes
65%
60%
59%
57%
44%
43%
17%
UCAS
Word of mouth
University websites/prospectuses
Advice from current trainees/teachers
School visits
Any NCTL service
Careers talks
Base: All NQTs (1915) ; Fieldwork dates 18th May – 18th July 2016
Once you had decided to do Initial Teacher Training, did you use any following NCTL services to find out more information about getting into teaching/ Did you use any other sources of information to find out about teacher
training?

26
Route and provider
Teach First NQTs were less likely than trainees on other routes to cite word of mouth, UCAS, university prospectuses, advice from current trainees or school visits as sources of information. However, they were more likely to cite career talks (used by 36% vs. 17% of NQTs overall) and Teach First information sources (26%).
Those on HEI-led routes were more likely than NQTs trained via other routes to use university prospectuses (68% vs. 30%).
Gender
Men were more likely than women to use informal sources of information. Over three in five men (65%) said they used word of mouth as a source of information, compared to 58% of women. This pattern does not reflect gender differences across age groups as the gender difference was consistent across the life stages10. Women were more likely to use UCAS than men (67% vs. 56%) and were also more likely to use university websites and prospectuses (61% vs. 54%).
10 For example, 64% of male graduates used word of mouth as a source of information, compared with 57% of female graduates. The same pattern applies for other life stages.

27
3.2 Pre course activities In addition to asking NQTs about the information sources used, the survey also asked whether pre-course activities were helpful or not. NQTs were asked to give a rating between 1 and 10 as to how helpful the activities were.
Figure 3.7 Ratings of pre-course activities
Ratings of how well pre-course activities prepared NQTs for the start of the training were lower than ratings of NCTL information services, and lower than the ratings for other aspects of ITT captured in the survey: just over half (53%) of NQTs gave the activities a rating between 7 and 10 (Figure 3.7).
There was a small but significant difference between primary- and secondary-trained NQTs, with 57% of secondary-trained NQTs giving a rating between 7 and 10, compared to 50% of primary NQTs. SCITT-led postgraduate NQTs gave higher ratings than NQTs trained via other routes; 64% gave the activities a rating between 7 and 10 (not shown in Figure 3.7). There was no significant variation to note amongst other subgroups.
53%
50%
57%
52%
57%56%
54%
48%
55%
Overall Primary Secondary HEI SCITT TeachFirst
Graduate Careerfinder
Careerchanger
Base: All NQTs (1915) ; Fieldwork dates 18th May – 18th July 2016
How well did the pre-course activities and information you received from your training provider prepare you for the start of training?
a b
a% rating
7-10:
28
4 NQTs’ views of Initial Teacher Training
As in previous surveys in the series, the great majority of NQTs were satisfied with the Initial Teacher Training (ITT) they received. Some 81% of NQTs rated the overall quality of their training as 7-10 out of 10, with a third rating it as 9-10 out of 10. A clear majority of NQTs on all training routes gave positive ratings of the quality of their training, the support they received, their course provider, and the amount of theory and practical training provided. Three quarters would recommend their training provider to others.
There are consistent differences by route: NQTs on SCITT routes generally indicated higher levels of satisfaction than NQTs on HEI-led courses or Teach First. Teach First NQTs were less positive than NQTs on average about the overall quality of their ITT, and ranked lowest on all the quality metrics captured in the survey. Within the SCITT-led School Direct route, those who received a salary were generally less satisfied than those who paid a fee. Across a few aspects of course satisfaction – the quality of teaching, in-school professional/personal support, and the amount of practical experience on the course – HEI-led postgraduate and (especially) undergraduate NQTs were less satisfied than HEI-led School Direct NQTs.
Interpreting these ratings is difficult: different training routes will attract different types of candidate, and variations could reflect cohort differences as much as the quality of training itself. Furthermore, the Teach First route is quite distinct and comparisons with other routes should be made with caution.
There were few differences by phase, although secondary-trained NQTs were more likely than primary-trained NQTs to rate the quality of support they received from their provider highly, and to say they would recommend their provider to others.

29
Figure 4.1:Typical ranking of routes/providers on quality metrics11
Highest ratings SCITT-led postgraduate SCITT-led School Direct fee HEI-led postgraduate/ undergraduate HEI-led School Direct (fee/ salaried) SCITT-led School Direct salaried Lowest ratings Teach First
4.1 Satisfaction with course provider Figure 4.2: NQTs’ ratings of the quality of their Initial Teacher Training
Source: 2016 National Survey of NQTs
As Figure 4.2 demonstrates, overall satisfaction with Initial Teacher Training (ITT) remains very high: 81% of NQTs rated their course as 7 or more out of 10. While figures are not directly comparable with previous waves due to changes in the measures used, the overall picture – indicating that the great majority of NQTs were satisfied with their training – remains unchanged.12 Similarly, the great majority of NQTs gave high ratings
11 Note this ranking applies for most, but not all, quality metrics. Shading does not indicate statistically significant differences. Quality metrics included: overall rating of quality of ITT; rating of quality of taught programme; the professional and personal support received in school; the professional and personal support received from the course provider; whether NQTs would recommend their provider. 12 In the 2015 survey, 89% of primary and 90% of secondary NQTs rated their training as ‘good’ or ‘very good’.
4 6 7 8 815
19 18 19 16
49 4333 35
29
33 3141 38
46
Overall course quality Quality of teaching Quality of in-schoolsupport
Quality of support fromprovider
Likelihood ofrecommending provider
Base: All NQTs (1915); Fieldwork dates 18th May – 18th July 2016
81% 75% 74% 73% 75%% rating 7-10:
9-10
7-8
4-6
1-3
How would you rate the …. on a scale of 1 to 10 where 1 means … was extremely poor and 10 means it was extremely good?

30
for the course teaching, and the personal and professional support they received, and most would recommend their training provider to others: 73% - 75% of NQTs rated each of these aspects as 7-10 out of 10.
While the headline findings are positive, the figures show there is scope for improvement in that only a third of NQTs gave their course the highest ratings of 9 or 10 out of 10. A fifth (19%) of NQTs rated their course as 1-6 out of 1013.
NQTs’ verbatim comments highlight the importance of the support provided by schools, mentors and training providers in their evaluations of the overall course quality: both positive and negative comments highlight support as being critical. The comments below are typical of those made on this subject:
“Very supportive department who passed their passion for teaching on to us.” HEI-led undergraduate, primary, graduate
“My training was extremely organised and well planned to allow for maximum time in the classroom but still gain theoretical knowledge.” SCITT-led School Direct fee, primary, graduate “I found my external mentor from my training provider very abrupt and at times demoralising. She would at times provide very conflicting feedback which could be confusing. I lost of lot of confidence due to her behaviour and if it was not for my lovely colleagues and school then I would have seriously considered not persevering with teacher training. She was not encouraging at all.” SCITT-led School Direct salaried, secondary, graduate
Across all types of provision, several comments highlight inconsistencies in the levels of support provided; NQTs with both positive and negative experiences often gave an ‘average’ rating across their schools/ providers.
“The support I received at my first placement school was outstanding. The support I received at my second placement school was very poor. I have sought to incorporate both experiences into my answers.” HEI-led postgraduate, secondary, career changer
13 Furthermore, while comparisons should be treated with caution due to differences in questions, methodology, and populations, NQTs’ ratings appear to be lower than similar surveys record: for example, 74% of learners on the Skills Funding Agency’s (SFA) Learner Satisfaction Survey report their provider is ‘good’ quality (8-10), compared with 62% giving an equivalent rating on this survey; and 76% of learners on the SFA survey report that the teaching quality on their course is good (8-10) compared with 57% of NQTs. Findings are based on over 300,000 responses from learners aged 16+ surveyed in 2014-15. https://www.gov.uk/government/publications/fe-choices-national-reporting-learner-satisfaction-survey

31
4.1.1 The balance of practical and theory
NQTs were generally content with the balance of practical experience and theory taught on their course (Table 4.1). NQTs were more likely to say they received the right amount of practical training than the right amount of theory (78% practical vs. 67% theory)14. Generally, where NQTs were not content with the amount of theory and practice on their course, responses indicated they wanted more practical experience (19%) and less theory (20%), although a significant minority wanted more theory (13%). (See next section for variations in NQTs’ views across ITT training routes.)
Table 4.1 NQTs’ views of the amount of practical experience and theory on their ITT
Amount of practical experience Too much About right Too little Total
Amount of
theory
Too much * 12% 8% 20% About right 1% 56% 9% 67% Too little 1% 10% 2% 13%
Total 3% 78% 19% 100% Base: All NQTs (1,906) who responded to both questions
These findings reflect a common theme in NQTs’ verbatim responses: some felt that training was insufficiently practical, and often conveyed a perception that the theoretical components of the course could be improved with more focus on practical activities for the classroom:
“I felt the academic component of the course was weighted too much towards educational theorems and philosophical discourse. It would have been far more valuable to learn about classrooms activities such as games or other interactive activities.” HEI-led postgraduate, secondary, career changer
As would be expected, there are strong correlations between NQTs’ rating of the overall quality of their ITT, and their ratings of the quality of course teaching, personal/ professional support, and the content of the course. Some measures are more strongly correlated than others: in particular, NQTs’ views about the amount of practical experience and theory on their course link closely with overall ratings of course quality:
14 The cognitive testing showed that ‘theory’ was generally interpreted as including any taught elements of the training course, including general education theory, subject-specific teaching, and practical teaching skills and tips. Theory was any training element done outside the classroom, including lectures, seminars, and essays.

32
for example, 92% of those who rated their overall ITT quality as 9 or 10 also said their course gave them ‘the right amount’ of practical experience.15 (Table 4.2)
Table 4.2 Correlation between the overall quality of ITT and measures of course teaching, support and content
Of those who rated overall quality of ITT highly, also rated other metrics of teaching quality, support and content highly:
Overall quality of ITT rated 7-10 (Base: 1,538)
Overall quality of ITT rated 9-10
(Base: 611)
Quality of teaching (9-10) 37% 67% Support in school (9-10) 47% 63% Support from provider (9-10) 46% 71% Amount of theory (about right) 72% 83% Amount of practical (about right) 83% 92%
Base: NQTs surveyed 18 May – 18 July 2016; see columns for base sizes for each group
4.2 Variations by training route There are fairly consistent variations in NQTs’ ratings of their course across different ITT routes. Interpreting what these variations mean in practice is difficult, as they may reflect differences in the NQTs opting to train via each route, as much as the differences in quality between the routes themselves16. Furthermore, the Teach First route is quite distinct.
Despite these variations, the majority of NQTs on all routes were content with their course quality and content. This implies that the variety of routes available for ITT is helpful in catering for a wide range of individual preferences,17 but the variation in NQTs’ preferences suggests that it will be important to match potential ITT entrants to the most suitable routes.
• Generally, SCITT routes were rated more highly than the average across all NQTs, while Teach First had lower than average ratings on the overall quality of ITT and the in-school support provided, and often ranked lowest on the quality metrics captured in the survey. (See Figures 4.3 and 4.4 below.)
15 Please note that we have only explored bivariate relationships in this analysis, and have not run any more complex analysis to control for other factors or variables. 16 See discussion in: http://www.ifs.org.uk/uploads/publications/comms/R118.pdf 17 http://www.ifs.org.uk/uploads/publications/comms/R118.pdf

33
• Ratings for Teach First and SCITT School Direct salaried routes were generally similar, which may reflect similarities in these two routes: in both cases, trainees are teaching from the beginning of their training and the provider has a relatively small role. However, SCITT School Direct salaried NQTs were more likely than Teach First NQTs to rate the support from their school highly.
• SCITT-led postgraduate and SCITT-led School Direct fee routes were rated more highly than other routes across most measures of course quality. For example, SCITT-led postgraduate NQTs rated their course more highly than NQTs across nearly all other routes on the overall quality of their ITT, the quality of teaching, and the amount of theory taught. SCITT-led School Direct fee NQTs gave significantly higher ratings than the average across NQTs on a few measures, including the overall quality of their ITT and the amount of theory and practical experience they gained.
• Across several measures, NQTs on SCITT-led School Direct fee courses were more positive than NQTs from SCITT-led School Direct salaried routes. For example, the proportion rating the support they received from their provider as 9 or 10 was 51% among SCITT-led School Direct fee trained NQTs, but only 32% among SCITT-led School Direct salaried NQTs. Likewise, 83% of those on a fee-paying SCITT School Direct route would be likely to recommend their provider18, compared with only 70% of those on a salaried SCITT School Direct route. However, the same difference between fee-paying and salaried NQTs was not apparent for HEI-led School Direct courses. There were no comments from the open responses on the survey that indicate why this would be the case.
• NQTs trained on HEI-led undergraduate courses were especially unlikely to give their ITT the highest ratings of 9 or 10. While HEI-led undergraduate ratings are in line with the average when looking at the proportion of NQTs giving their courses good ratings (7-10 out of 10), NQTs on this route ranked lowest across all measures of course quality in giving the highest ratings (9-10 out of 10). (Table 4.4). This does not appear to reflect typical differences by age: there were no significant differences by life stage generally in NQTs’ ratings of their ITT.
• NQTs trained on HEI-led postgraduate and (especially) undergraduate courses were less likely than other NQTs to consider their course had the right balance of theory and practice. Those on HEI-led courses were most likely to think there was too much theory, and too little practical experience on their course.19 Among those on HEI-led courses, undergraduates were more likely
18 A rating of 7 or more out of 10. 19 Some 31% NQTs on HEI-led undergraduate courses, and 22% on HEI-led postgraduate courses thought there was ‘too much theory’, compared with 13% across all other routes. And 39% of postgraduates and
34
than postgraduates to consider their training gave them too little practical experience (39% vs. 21%). This may reflect the fact that similar amounts of practical experience are spread over a longer course for undergraduates than postgraduates.
• NQTs trained on school-based courses were most likely to feel they had too little theory on their course. This was especially true of those on School Direct salaried courses, whether led by school or HEI (23% and 28% respectively thought there was too little theory). Teach First NQTs were also relatively likely to say there was too little theory (22%), and were most likely to say they had had ‘too much’ practical experience (13% vs. 3% across all other routes).
21% of undergraduates considered there was too little practical experience on their course, compared with 8% across all other routes

35
Figure 4.3: Summary of quality ratings by route/provider
(Letters indicate statistically significant differences; shading indicates highest/ lowest ranked route for each metric)
% rated 7-10 out of 10 % ‘about right’
Overall quality of ITT
Quality of
teaching
Support in
school
Support from
provider
Amount of
theory
Amount of
practical
Overall (1,915) 81 75 74 73 66 78 A SCITT-led
postgrad (127) 89(D-H) 87(B-H) 78(H) 82(C-E,G,H) 76(C-F) 89(C,D,H)
B SCITT-led School Direct fee (129)
87(G,H) 76 79(G,H) 80 75 93(C,D,H)
C HEI-led undergrad (252)
83(H) 75 74(H) 70 64 61(H)
D HEI-led postgrad (682)
81(H) 75(F,G) 74(H) 73 65 77(C)
E HEI School Direct fee (235)
80 70 80(H) 69 66 86(C,D,H)
F HEI-led School Direct salaried (123)
78 69 74(H) 73 58 86(C,D,H)
G SCITT-led School Direct salaried (144)
77 67 71(H) 71 68 88(C,D,H)
H Teach First (220)
74 68 59 72 67 74
Base: All NQTs (1,915) surveyed 18 May – 18 July 2016; see rows for sub-group base sizes

36
Figure 4.4 Summary of quality ratings by route/provider, showing highest ratings of 9-10 (Letters indicate statistically significant differences; shading indicates highest/ lowest ranked route for each metric)
% rated 9-10 out of 10 % ‘about right’
Overall quality of ITT
Quality of
teaching
Support in
school
Support from
provider
Amount of
theory
Amount of
practical
Overall (1,915)
33 31 41 38 66 78
A SCITT-led postgrad (127)
47(A,C,E-H) 43
(A,C,D,F-H) 54 (E,G,H) 56 (C-H) 76(C-F) 89(E,G,H)
B SCITT-led School Direct fee (129)
37(G,H) 32 55 (E,G,H) 51 (C-H) 75(E,H) 93(E,G,H)
C HEI School Direct fee (235)
33(G,H) 28 51 (E,G,H) 34 66 86(E,G,H)
D HEI-led School Direct salaried (123)
36(G,H) 24 48(E,G,H) 34 58 86(E,G,H)
E HEI-led postgrad (682)
35(G,H) 35 (D,F,H) 36(E,G,H) 39 65(H) 77(E,G,H)
F SCITT-led School Direct salaried (144)
26 26 49(E,G,H) 32 68 88(E,G,H)
G Teach First (220)
24 29 35 34 67 74
H HEI-led undergrad (252)
22 23 33 31 64 61(E,G,H)
Base: All NQTs (1,915) surveyed 18 May – 18 July 2016; see rows for sub-group base sizes

37
NQTs’ verbatim comments highlight a few potential reasons why NQTs who trained via SCITT-led courses were typically more positive than those trained on HEI-led routes. Comments from NQTs on HEI-led courses typically revealed a perception that their lecturers were out of date, and/or that a more practical focus to teaching would be preferable.
“Training needs to focus on life in the classroom now, rather than theory from decades ago taught by University staff who have not taught in schools for decades themselves.” HEI-led postgraduate, secondary, graduate
Views are also likely to reflect personal preferences, which some respondents acknowledged:
“I am personally an active learner and therefore the taught course may have been very good, but for someone like myself who struggles to maintain focus I did not feel it was particularly beneficial for me to sit in a classroom.” SCITT led postgraduate, primary, career finder
However, one of the risks of School Direct courses appears to be a lack of coordination between schools and providers, a common theme in the verbatim responses both this year and in last year’s survey:
“I completed training via School Direct and I found that the schools and training providers weren't very joined up and their expectations were vastly different.” HEI-led School direct combined, primary, graduate “Support for trainees in school was not effectively quality assured so as a result was very poor.” HEI-led postgrad, primary, career changer
NQTs often highlighted difficulties accessing school placements that had undermined the value of their training: in some cases placements were seen as inappropriate – either geographically, or because of the type of role/school – but in other cases NQTs referenced difficulties in setting up any placement:
“I was out of placement for 9 weeks because the university could not find me a placement, which severely knocked my confidence.” HEI-led postgrad, School Direct Salaried, primary, career changer

38
4.3 Variations by phase Primary- and secondary-trained NQTs, on the whole, gave comparable ratings across almost all the measures of quality captured in the survey. This appears to be consistent with previous surveys in the series, when overall quality ratings were consistent across primary- and secondary-trained NQTs: for example, in 2015, 89% of primary and 90% of secondary NQTs rated their overall training as good/very good.
However, secondary NQTs were more positive than primary NQTs about the support they received from their course provider (43% vs. 34% gave a rating of 9-10). Secondary NQTs were also more likely to indicate they would recommend their course provider (81% vs. 71%). These differences may be linked to the fact that secondary trainees have subject-specific tutors, whereas most primary trainees do not, and therefore secondary trainees have more continuity in support, and/or share a common interest with their tutor.
Figure 4.5: NQTs’ ratings of Initial Teacher Training by phase
Source: 2016 National Survey of NQTs
The main difference between primary and secondary NQTs’ responses was in their views about whether they received the ‘right amount’ of practical training. Secondary-trained NQTs were more likely than primary-trained NQTs to say their training gave them ‘about right’ amount of practical experience (85% vs. 72%). Primary-trained NQTs were more likely to say they had ‘too little’ practical experience (26% vs. 11%). The phase difference was not apparent across all routes: for most routes, there were no differences between primary-trained and secondary-trained NQTs; however, there were significant differences
81
74 7469 (b) 71 (b)
8276 75
7881
Overall course quality Quality of teaching Quality of in-schoolsupport
Quality of providersupport
Likelihood ofrecommending provider
Primary (a) Secondary (b)
% primary and secondary NQTs rating each aspect of Initial Teaching Training as 7-10 out of 10
Base: All primary (941) and secondary (973) NQTs; Fieldwork dates 18th May – 18th July 2016

39
by phase among NQTs trained on HEI-led undergraduate and postgraduate courses, and for SCITT-led postgraduate courses.
There were no significant differences by phase in NQTs’ views of the amount of theoretical background they were taught on their training course, nor the way the theory and practical elements of training linked together.
4.4 Other variations in perceptions of training quality There were few variations across the quality metrics captured in the survey by other demographic or course characteristics, and none that were consistent across all the measures. For example, when looking at the overall course rating, there were no differences by subject, phase, the number of school placements, the time spent teaching in school, nor by NQT age or gender.
There were a few significant differences of note on specific measures:
• Female NQTs were slightly (but significantly) less content than male NQTs about the support provided on their course, both from the course provider and in school. Female and male NQTs were equally likely to give very positive or very negative ratings of their support, but within the moderate range of ratings male NQTs were slightly more positive.20 This finding is consistent with slightly lower ratings of support during school inductions among female NQTs.
• Those who spent less time with pupils on their course were less likely to recommend their provider (among those spending up to 13 weeks working with pupils 29% giving a rating of 9-10 in terms of how likely they were to recommend, compared with 48% of those who spent 14 or more weeks with pupils).
• ‘Career changers’ (aged 32+) were less likely than younger NQTs to be satisfied with the support they received in school (64% gave a rating of 7-10 vs. 76% of younger NQTs).
20 Looking at the support provided by the course provider, 72% women and 77% of men gave a rating of 7-10; looking at in-school support, 73% women and 78% men gave a rating of 7-10.

40
5 NQTs’ views of how well their Initial Teacher Training prepared them to teach
Table 5.1 Proportion of NQTs saying their ITT prepared them well for each aspect of teaching
% rating 7-10
General teaching skills/ requirements
Career development/ progression
Subject teaching
Teaching pupils with specific/ differing needs
80%+
• Personal/professional conduct
• Pupil safeguarding • Plan effective lessons
70-79% • Maintain good behaviour
• Identify your CPD needs
• Teach primary maths
60-69%
• Promote British values • Provide effective
feedback to pupils • Assess pupils’ progress
• Apply for teaching jobs
• Stay up-to-date with educational research
• Teach your specialist subject(s)
• Teach pupils to read (primary)
• Teach across a range of abilities
50-59% • Deploy support staff
effectively • Teach all
curriculum • Teach across all
ethnic backgrounds • Teach SEN pupils
The majority of NQTs felt well prepared for most of the 21 skills asked about on the survey (Table 5.1). The relative ratings for each aspect of teaching are similar to previous surveys in the series. As in 2015, NQTs were particularly positive about their preparedness for general teaching skills and requirements, and the way their training aided their future career progression. In line with previous years, NQTs felt their training had prepared them less well to cater for pupils with specific needs, such as those with English as an Additional Language (EAL) or Special Educational Needs (SEN) , deploy support staff in the classroom, or communicate with parents/carers.
SCITT-trained NQTs typically felt their training prepared them better for teaching than NQTs on other routes: SCITT-trained NQTs gave significantly higher ratings than those trained on HEI-led routes on 19 of 21 aspects of teaching asked about on the survey, and higher than Teach First NQTs on 14 aspects.
As in the 2015 survey, secondary NQTs typically felt their training prepared them better for teaching than primary NQTs: secondary-trained NQTs rated 14 of 17 aspects of teaching significantly higher than primary-trained NQTs.

41
% rating 7-10
General teaching skills/ requirements
Career development/ progression
Subject teaching
Teaching pupils with specific/ differing needs
• Communicate with parents/carers
subjects (primary)
<50% • Teach reading
(secondary) • Teach EAL pupils
Base: All NQTs (1,915) surveyed 18 May – 18 July 2016
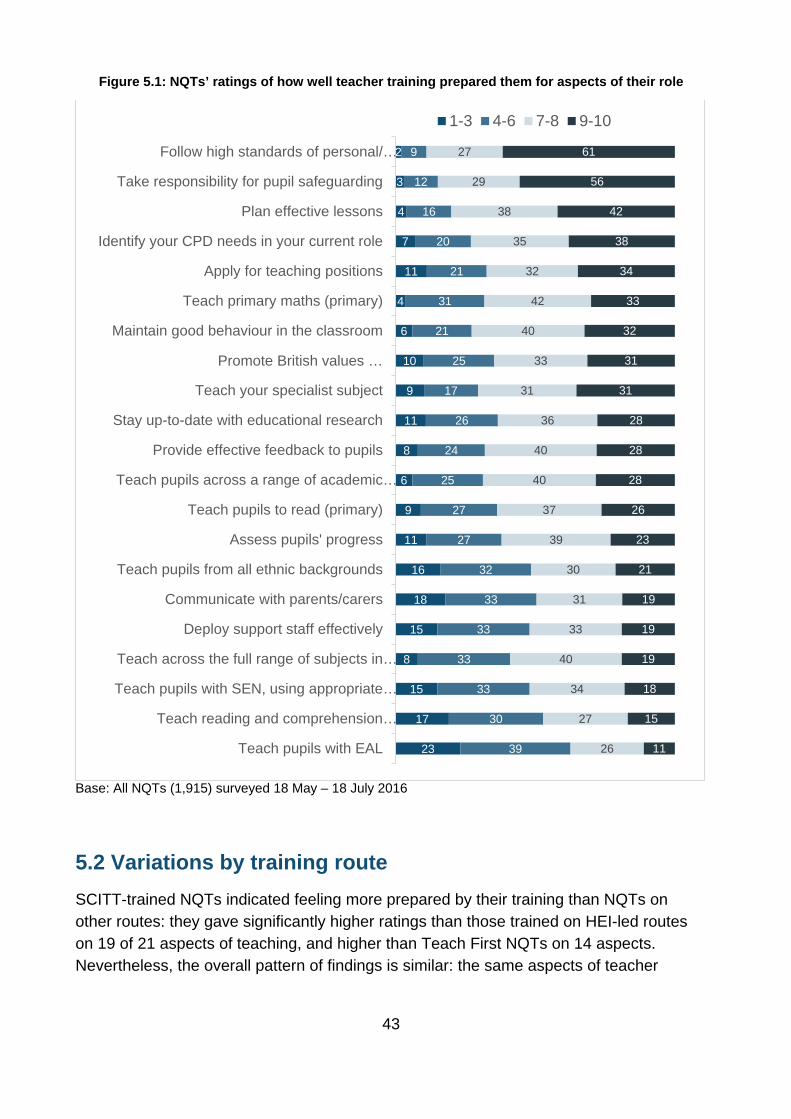
5.1 NQTs’ views of how well Initial Teacher Training prepared them for their role The survey asked NQTs about how well prepared they felt to deal with the teaching skills, and the personal and professional standards, that are outlined in the Teachers’ Standards framework21. The majority of NQTs felt well prepared by their training for most of the 21 skills asked about on the survey (Figure 5.1). The relative ratings for each aspect of teaching are similar to previous surveys in the series22. As in 2015, NQTs were particularly positive about how their training prepared them for general teaching skills and requirements, including planning effective lessons, pupil safeguarding, and maintaining professional standards of conduct. NQTs’ ratings also indicate broad contentment with how their training prepared them to develop and progress in their careers, and in particular to identify their CPD needs.
As in previous years, NQTs felt their training had prepared them less well to cater for pupils with specific needs, such as those with English as an Additional Language (EAL) or Special Educational Needs (SEN) , deploy support staff, or communicate with parents/ carers. However, as discussed in Chapter 4 NQTs rated their training very highly, and their verbatim responses indicated they felt aspects which rank relatively poorly – such as working with parents or SEN pupils – can only be mastered with real life experience, rather than taught during formal training periods.
“I feel like actually doing the job is the only way to actually know what you are doing!” HEI-led School direct, Primary, Graduate
21 The survey questions broadly aligned with the Teachers’ Standards, although the wording used was simplified for the survey. https://www.gov.uk/government/uploads/system/uploads/attachment_data/file/301107/Teachers__Standards.pdf 22 As with other measures, direct comparisons are not possible due to a change in the scale used on this year’s survey.

42
“I feel that all three of my school placements were excellent and taught me nearly everything I needed to know to be able to start my teaching career. I felt like the university were not as helpful as we didn't spend a lot of time there and the communication between lecturers was awful. The schools provided most of my training to gain the qualification.” HEI-led School direct, Primary, Career Finder
As in the quotation above, several NQTs highlighted the importance of well-organised and well-planned placements in ensuring they gained a round experience of different contexts and teaching styles.
43
Figure 5.1: NQTs’ ratings of how well teacher training prepared them for aspects of their role
Base: All NQTs (1,915) surveyed 18 May – 18 July 2016
5.2 Variations by training route SCITT-trained NQTs indicated feeling more prepared by their training than NQTs on other routes: they gave significantly higher ratings than those trained on HEI-led routes on 19 of 21 aspects of teaching, and higher than Teach First NQTs on 14 aspects. Nevertheless, the overall pattern of findings is similar: the same aspects of teacher
23
17
15
8
15
18
16
11
9
6
8
11
9
10
6
4
11
7
4
3
2
39
30
33
33
33
33
32
27
27
25
24
26
17
25
21
31
21
20
16
12
9
26
27
34
40
33
31
30
39
37
40
40
36
31
33
40
42
32
35
38
29
27
11
15
18
19
19
19
21
23
26
28
28
28
31
31
32
33
34
38
42
56
61
Teach pupils with EAL
Teach reading and comprehension…
Teach pupils with SEN, using appropriate…
Teach across the full range of subjects in…
Deploy support staff effectively
Communicate with parents/carers
Teach pupils from all ethnic backgrounds
Assess pupils' progress
Teach pupils to read (primary)
Teach pupils across a range of academic…
Provide effective feedback to pupils
Stay up-to-date with educational research
Teach your specialist subject
Promote British values …
Maintain good behaviour in the classroom
Teach primary maths (primary)
Apply for teaching positions
Identify your CPD needs in your current role
Plan effective lessons
Take responsibility for pupil safeguarding
Follow high standards of personal/…
1-3 4-6 7-8 9-10

44
training are rated relatively well and poorly by NQTs regardless of their training provider23. HEI-trained and Teach First-trained NQTs generally gave similar responses.
Table 5.2 Proportion of NQTs that felt ITT prepared them well for each aspect of teaching, by training provider
% rating each aspect as 7-10 HEI-led
(a) SCITT-led
(b) Teach First
(c) Base: all NQTs training with each provider: (1,292) (403) (220) Follow high standards of personal/ professional conduct
87 92a,c 85
Take responsibility for pupil safeguarding 84 93a,c 87 Plan effective lessons 79 85a,c 73 Teach primary maths (primary) 73 82a 72 Identify your CPD needs in your current role 71 78a 77 Maintain good behaviour in the classroom 71 82a,c 72 Teach pupils across a range of academic abilities 67 75a,c 67 Provide effective feedback to pupils 66 78a,c 67 Apply for teaching positions 66c 72a,c 35 Stay up-to-date with educational research 62 69a,c 60 Teach pupils to read, including phonics and comprehension (primary)
61 74a,c 55
Promote British values such as democracy, liberty, mutual respect and tolerance
60 77a 70a
Assess pupils' progress 59 72a,c 64 Teach your specialist subject 60 65 73 Teach all subjects in the curriculum (primary) 56 71a 59 Deploy support staff effectively 49 64a,c 40 Teach pupils with SEN, using appropriate support 49 65a,c 45 Communicate with parents/carers 46 66a,c 54 Teach pupils from all ethnic backgrounds 49 55a 54 Teach reading and comprehension (secondary) 43 41 37a Teach pupils with EAL 35 45a,c 34
The biggest differences in the ratings of NQTs trained via HEI-led and SCITT-led training routes are shown in Table 5.3 below.
23 If the 21 aspects are ranked by the % of NQTs rating 7 or higher, the rankings for NQTs from SCITT-led routes show a very high correlation (.93) with NQTs from HEI-led courses for example.

45
Table 5.3 aspects of teaching where ratings ‘gap’ between SCITT-trained NQTs and HEI-trained NQTs were largest
Aspect ‘Gap’ between ratings of NQTS on HEI- and SCITT-
led ITT
Overall ranking (all NQTs)24
Communicating with parents/carers 20 percentage points 16 Promoting British values 17 percentage points 8 Teach pupils with SEN 16 percentage points 19 Teach across the full range of subjects (primary)
15 percentage points 18
Deploy support staff effectively 15 percentage points 17 Base: All NQTs (1,915) surveyed 18 May – 18 July 2016 It is notable that SCITT-trained NQTs were significantly more likely than HEI-led NQTs to have felt their training prepared them for those aspects of teaching which were rated lowest overall (i.e. those ranked 16-21 overall). It is not immediately clear from the survey data why this is the case: one potential explanation is that SCITT-trained NQTs feel they gain more practical experience during their course. There is mixed support for this hypothesis in the data. In support, NQTs spending longer periods of time in the classroom during their training were more likely than other NQTs to say they felt well prepared by their training for most aspects of teaching25. However, the same pattern is not evident among Teach First NQTs, who gain more class-based experience than SCITT-trained NQTs but give similar ratings to those trained on HEI routes. As noted above, it may be that because undergraduates’ practical experience is spread over a longer course, it may feel as if they are not gaining enough practical experience of the classroom (as highlighted in the quotes from NQTs on HEI-led routes above). Undergraduate courses also have to fulfil the requirements of an undergraduate degree and therefore contain a greater emphasis on theory.
5.3 Variations by phase Secondary NQTs typically indicated feeling more prepared than primary NQTs by their course (Table 5.4). Secondary-trained NQTs rated 14 of 17 aspects of teaching significantly higher than primary-trained NQTs26. Primary NQTs were more likely than secondary NQTs to say they were prepared to deploy support staff effectively. This
24 Rankings are based on the proportion of NQTs rating how well their training prepared them for each aspect of teaching as 7 or more out of 10. 25 Those who spent 27+ weeks in the class room on their training were significantly more likely than those spending less classroom time to say they were prepared (7-10 out of 10) for 14 of 21 aspects asked about. 26 Of the 21 aspects of teaching asked about, four related only to primary- or secondary-trained NQTs, and another 17 were asked of all NQTs.

46
pattern of findings echoes the 2015 results, when secondary-trained NQTs were also more likely to indicate their training had prepared them well across most aspects of teaching.
Table 5.4 Proportion of NQTs that felt ITT prepared them well for each aspect of teaching, by phase
% rating each aspect as 7-10 All NQTs Primary (a) Secondary (b) Base: all NQTs trained in each phase: (1,916) (942) (973) Follow high standards of personal/ professional conduct
88 87 90
Take responsibility for pupil safeguarding 86 83 89a Plan effective lessons 80 75 85a Teach primary maths (primary) 74 74 - Identify your CPD needs in your current role 73 69 77a Maintain good behaviour in the classroom 73 72 73 Teach pupils across a range of academic abilities
69 64 75a
Provide effective feedback to pupils 68 63 75a Apply for teaching positions 65 62 69a Stay up-to-date with educational research 63 61 66a Teach pupils to read, including phonics and comprehension (primary)
63 63 -
Promote British values such as democracy, liberty, mutual respect and tolerance
63 59 69a
Assess pupils' progress 62 54 72a Teach your specialist subject 62 46 81a Teach across the full range of subjects in the curriculum (primary)
59 59 -
Deploy support staff effectively 51 55b 47 Teach pupils with SEN, using appropriate support
52 47 58a
Communicate with parents/carers 50 46 55a Teach pupils from all ethnic backgrounds 50 47 55a Teach reading and comprehension (secondary) 42 - 42 Teach pupils with EAL 37 34 40a
A number of the lowest ratings may relate to aspects of teaching which primary or secondary NQTs felt were less directly applicable to their role. Secondary NQTs gave relatively low ratings about the preparation they had to teach reading and comprehension, for example, which may reflect that this requirement has (or is perceived to have) less salience at this level.

47
The largest difference in ratings between primary- and secondary-trained NQTs related to being prepared to teach their specialist subject; the relatively low primary ratings on this measure may reflect that this may not seem as relevant at the primary phase (Table 5.5).
Secondary-trained NQTs indicated feeling more prepared than primary NQTs across a number of areas that apply across the phases, however, including a large difference in assessing pupils’ progress and providing effective feedback; this finding is in line with similar results in 2015. Again, this could reflect differences in requirements across the phases, with primary teachers assessing pupils across a broader range of subjects. There were no significant differences among secondary NQTs with different subject specialisms27. Further investigation to understand the factors behind the relatively low primary ratings on this measure could be valuable.
Table 5.5 Aspects of teaching where ratings ‘gap’ between primary-trained NQTs and secondary-trained NQTs were largest
Aspect ‘Gap’ between primary and secondary NQTs’ ratings
Overall ranking (all NQTs)28
Teach your specialist subject 35 percentage points 14 Assess pupils’ progress 18 percentage points 13 Provide effective feedback to pupils 12 percentage points 8 Teach pupils across a range of academic abilities
11 percentage points 7
Teach pupils with SEN, using appropriate support
11 percentage points 17
Base: All NQTs (1,915) surveyed 18 May – 18 July 2016 Initial analysis of the data does not support the notion that the phase differences are entirely explained by the provider differences noted in section 5.129: a higher proportion of secondary than primary NQTs on both SCITT- and HEI-led courses rated themselves as prepared for 11 of the 17 aspects of teaching asked about.
27 The proportion of secondary NQTs rating their training as having prepared them well for assessing pupils’ progress ranged very little: from 71% among those trained to teach STEM subjects, to 73% for those trained to teach MFL/Classics and other (non-STEM and non-EBacc) subjects. 28 Rankings are based on the proportion of NQTs rating how well their training prepared them for each aspect of teaching as 7 or more out of 10. 29 Based on analysis of bivariate relationships: no regression analysis has been conducted on the 2016 findings.

48
5.4 Other variations Aside from the provider (and the related differences in the duration of NQTs’ classroom experience during their training) and phase, there were no other consistent differences in terms of how well NQTs felt their Initial Teacher Training prepared them for teaching.

49
6 Statutory induction
As in previous surveys, questions were asked about NQTs’ statutory induction year. The statutory induction usually refers to the first full school year that an NQT works in a school. The induction combines a personalised programme of development, support and professional dialogue with monitoring and an assessment of performance against the relevant standards. A preamble to questions about the induction was added this year, to ensure NQTs were clear about the definition, and to ensure they were considering the induction year separately from the ITT year. Cognitive testing of the questions showed this worked well.
Some 87% of NQTs were currently completing their statutory induction. As in last year’s survey, NQTs surveyed in 2016 were generally content with their induction: 76% rated the quality of their induction between 7 and 10.
Ratings of elements of the individual elements of the induction were high. No fewer than 70% of NQTs gave each element asked about a rating between 7 and 10: free time for planning, preparation and assessment; support from a tutor; feedback on teaching observations; and guidance on identifying appropriate continuing professional development.

50
6.1 Overall satisfaction with the induction Generally NQTs were content with the induction, as Figure 6.1 demonstrates. More than three in four (76%) gave it a rating between 7 and 10, with nearly a quarter (24%) giving a rating of 10. Only 6% rated it between 1 and 3.
Figure 6.1: Satisfaction with the induction and ITT
Figure 6.1 highlights that the distribution of results for ratings of the induction and ITT were similar at the lower end of the scale but that NQTs were more likely to give the induction a rating between 9 and 10 than the ITT (43% vs 33%). Results were similar last year, with NQTs generally giving positive ratings for their induction, and very few (4% of primary NQTs and 5% of secondary NQTs) saying that the induction had not been helpful at all.
6.1.1 Satisfaction with induction elements
In addition to asking NQTs to give an overall rating of their induction, the survey asked NQTs to rate whether they received too little, too much or about the right amount of support in the following areas:
• free time for planning, preparation and assessment; • support from a tutor; • feedback on teaching observations; and,
4% 6%15% 18%
49% 33%
33%43%
Overall satisfaction with ITT Overall satisfaction with the induction
How would you rate the overall quality of your induction on a scale of 1 to 10 where 1 means the training was extremely poor and 10 means it was
extremely good?
9-10
7-8
4-6
1-3
Base: All NQTs who started or are currently completing statutory induction (1665) ; Fieldwork dates 18th May –18th July 2016

51
• guidance on identifying appropriate continuing professional development. Ratings of these areas were generally high. Overall, no fewer than 72% of NQTs said their induction gave them ‘about the right amount’ of each (see first column Table 6.1). The high ratings reflect the findings from last year’s survey, where large numbers reported that they had received support in these areas. What the questions confirm this year however is that high numbers of NQTs feel that they receive enough support in these areas, not just that support was present, as was measured last year. There is a strong association between each element and the overall rating, as shown in Figure 6.1, suggesting that all these aspects are important in providing a good quality induction experience.
Table 6.1 Correlation between the overall quality of induction and measures of planning, support, feedback and guidance on CPD
Quality measure Proportion
rating ‘about right’
Overall quality of induction rated 7-10
Overall quality of induction rated 9-10
Free time for planning, preparation and assessment (about right)
77% 84% 89%
Support given from a tutor (about right) 76% 89% 95%
Feedback on teaching and observations (about right)
85% 93% 95%
Guidance on identifying appropriate continuing professional development (about right)
72% 84% 91%
6.1.2 Variations by subgroups
Training route
NQTs’ satisfaction with their induction did not usually vary by training route. The exception to this is Teach First, where 59% gave the induction a rating between 7 and 10, compared to other routes where a minimum of 72% gave a rating of 7-10. As shown in Figure 6.2, this reflects relatively low ratings of each element of their induction among
52
Teach First NQTs compared with NQTs on other training routes. Because Teach First participants receive a tailored leadership programme, it is possible that these NQTs feel their induction is less important in their development than other NQTs. Further insight from the open responses from the survey indicate that Teach First NQTs might feel that training given in the NQT year isn’t sufficiently tailored for their needs:
“School treats Teach First teachers completing their NQT year exactly the same as people starting in their first job, having done a more traditional PGCE. This has been a constant source of frustration, and many of the compulsory sessions for NQTs have been irrelevant to me (as someone in the former category), and felt like a complete waste of time.” Teach First, Secondary, Career Finder
It is also possible that, although the survey outlined what was meant by the NQT year, Teach First respondents answered the questions about their first year, rather than their subsequent NQT year although cognitive testing of the questions and the open responses given by Teach First NQTs suggests understanding was generally good.
Phase
More primary- than secondary-trained NQTs indicated they were content with the elements of their induction. As Figure 6.2 shows, significantly more primary- than secondary-trained NQTs rated three of the four elements of induction as being ‘about right’. Despite this, primary-trained NQTs gave a similar overall rating for the induction as secondary-trained NQTs: 77% of primary-trained NQTs and 74% of secondary-trained NQTs gave the induction a rating of 7-10 overall.
Life stage
Older NQTs were more likely than younger groups to say they received too little free time for preparation and planning: 26% of career changers; 22% of career finders; and 19% of graduates said they had too little PPA time. This may be because older NQTs are more likely to be juggling family commitments with training and therefore have less time to work at home:
“I'm not sure I was prepared for the intensity of the training year on the School Direct programme, as a mother of 3 I found it hard to cope with. I perhaps should have been more realistic about what it would entail.” SCITT led postgrad, Secondary, Career Changer

53
Figure 6.2: Satisfaction with induction elements by phase and provider
Other variations
In terms of other variations, among those with a disability, 66% rated the overall quality of the induction as 7-10, compared with 77% without a disability.
There was no significant variation in views of the induction between phase and life stage.
6.2 Themes from open response questions The survey included an open response question for NQTs to add any comments they had on the induction. A few main themes emerged in these responses:
6.2.1 Mentors and tutors
NQTs wrote about their experiences both with good and bad mentors and tutors and the importance that this has for their enjoyment of the NQT year:
“While I appreciate there will always be areas to develop professionally, NQT tutors need to know how to speak to and support NQTs. This means that they ought to know how to give two targets and a strength (for example), just as we expect students to do when reflecting on their own learning. My tutor will support me if I ask a specific question but, aside from that, I feel largely like I have been on
Base: All NQTs who started or are currently completing statutory induction (1665) ; Fieldwork dates 18th May – 18th July 2016
Has your induction given you too much, too little or about the right amount of ...
% answered ‘about right’
Phase Provider Type
Primary Secondary HEI SCITT Teach First
…free time for planning, preparation and assessment?
83 70 79 77 56
…support from a tutor? 76 76 78 74 59
…feedback on teaching observations? 88 81 86 84 66
… guidance on identifying appropriate continuing professional development?
74 68 72 73 54
80+ 75-79 70-74 <70
a b c d e
e eb
b e e
eeb

54
my own during this period and, if not for my family, I would have already left the negative environment teaching has presented itself to be in my current school.” HEI-led postgraduate, Secondary, Career finder “I have been very fortunate with my mentor choice, she is nurturing and gives me reachable and honest goals.” HEI-led undergraduate, Primary, Graduate
6.2.2 Training
NQTs spoke about both the positive and negative aspects of the induction training. Positive comments were general but those who spoke negatively about their training highlighted a few points including that:
• Training is repetitive and that training can be irrelevant:
“Some of the training as an NQT can simply re-hash PGCE training as they can be combined sessions for UQT's as well as NQT's” Postgraduate, HEI, Secondary, Graduate
• More subject-specific training is needed:
“I have been placed in a position where I do not have a head of department or a subject specialist to help me learn my subject skills” Postgraduate, HEI, Secondary, Graduate
• Not receiving enough NQT time, impeding NQTs’ development:
“My school has often not provided NQT time during the week, making it difficult for continuous professional development and observing other teachers” Postgraduate, HEI, Primary, Graduate
6.2.3 Large workloads
NQTs also commented on the large workload that they had in the NQT year, which is the cause of stress for some:
“Throughout my induction year I have worked from 8am-5:30pm Monday to Friday. I have also worked 8-10 hours at weekends during my first term, 6-8 during my second term and 4-6 during my third term. I also work 20-30 hours at home during school holidays. If my workload was reduced I wouldn't have needed to do so much work at

55
home.” SCITT-led School Direct, Secondary, Career Finder

56
7 Moving into teaching roles A question was added to this year’s survey asking how NQTs working in teaching roles found out about their current position. The most widely used method of getting a job was through working or training at a school: over a third (36%) found their role this way.
School Direct and Teach First NQTs were more likely than NQTs trained on other routes to find work through schools they had trained in. This is in line with the aims of these routes: that permanent positions are found through the schools that the NQTs train in.
Primary-trained NQTs were more likely than secondary-trained NQTs to find jobs through Local Authority websites, whereas secondary teachers were more likely to find their role through teaching press.
7.1 How NQTs found their roles Figure 7.1 shows how NQTs currently in work found their job. The most common route into work, mentioned by 36%, was through previously working/training with their school.
Figure 7.1 How NQTs found their current training role by phase
9%
18%
18%
32%
38%
33%
20%
14%
13%
35%
Through local authority websites
Recruitment agency/ job search sites
Word of mouth
Through teaching press/ websites
I previously worked at the school/I trained with the school
Primary Secondary
Base: All NQTs currently working in a teaching role (1821) ; Fieldwork dates 18th May – 18th July 2016
How did you find out about your current role?
b
ba
a

57
7.1.1 Route and phase
As seen in Table 7.1, NQTs from Teach First and School Direct routes are more likely to find work via their training school, compared to other routes. This reflects the aim of these routes, whereby schools recruit trainees they feel they are subsequently likely to employ. These figures are consistent with Government data, which also shows that those trained via School Direct route (either SCITT or HEI-led) are more likely than those qualifying via other routes to be in employment 6 months after the award of QTS30.
Primary-trained NQTs were more likely than secondary-trained NQTs to have found a job through a Local Authority website (33% vs 9%). By contrast, secondary-trained NQTs were more likely than primary-trained NQTs to have found a job through the teaching press or websites (32% vs 13%).
Table 7.1 Breakdown of those who found work via their training school by phase and route
Total Primary Secondary
Teach First 83% 87% 81%
SCITT-led School Direct Salaried
73% 77% 70%
HEI-led School Direct (fee/salaried)
51% 57% 43%
SCITT-led School Direct fee
35% 33% 38%
SCITT-led postgraduate
35% 27% 44%
HEI-led undergraduate
27% 29% 17%
HEI-led postgraduate
27% 25% 28%
Total 35% 35% 38%
7.1.2 Subject
NQTs who teach STEM and other English Baccalaureate classes were more likely to have found their job through a school they had previously worked in or they had trained in, compared to other subjects (41% vs 32%). Within each subject group, SCITT-trained
30https://www.gov.uk/government/uploads/system/uploads/attachment_data/file/541055/SFR31_2016_Text.pdf

58
NQTs were more likely than HEI-trained NQTs to say they got a job with a school they had previously worked or trained in.
7.1.3 Gender
More men than women found jobs through word of mouth (20% vs 15%) and more women than men found jobs through local authority websites (25% vs 14%). This echoes findings from Chapter 3 on information sources, where women were more likely than men to use formal information services.

59
8 Conclusions • NCTL Get Into Teaching services are helpful in attracting potential entrants to the
profession, and particularly in attracting entrants aged 27 and older. NCTL may wish to review the value for money of the services offered, given that some are used by relatively small numbers. However, NCTL services are all highly rated by those who use them. It is worth noting that this survey may not capture the full impact of the services due to the length of the recall period, and the way in which questions were asked (the survey asked about information used once NQTs had already decided to take up ITT, and not the information used prior to that). To remedy this, further research could be undertaken to capture ‘real time’ views, after an NQT has used an NCTL service, such as pop-up surveys on the website or feedback forms at Train to Teach events. Qualitative research would also shed light on the decision-making processes applicants for ITT went through when applying for their courses.
• Graduates (those under 27) were most likely to use UCAS and university prospectuses for information. It may be worth considering whether NCTL can work with UCAS and/or HEIs to improve the information provided about all the routes into teaching that are available, and how the website could be tailored to be useful to graduates as well as older entrants. Career changers (those over 33) were the most likely to use the website, and it may be worth investigating whether the website is providing the information needed for this group.
• The great majority of NQTs are positive about the quality of their Initial Teacher Training, regardless of the route they trained on. This implies that the variety of routes available for ITT is helpful in catering for a wide range of individual preferences,31 but the variation in NQTs’ preferences suggests that it will be important to match potential ITT entrants to the most suitable routes.
• NQTs’ verbatim comments highlight the importance of the quality of support and mentoring that NQTs are given during their training. As initial teacher training shifts increasingly to school-based models, it may be worth reviewing how support is provided and whether any guidance could be provided to in-school and external mentors and how they can support NQTs. Further qualitative research to explore the factors that contribute to outstanding support may be helpful in supporting this work.
• NQTs on the whole feel well prepared to start their teaching career. There were some notable exceptions including relatively low feelings of preparedness for: teaching reading and comprehension, communicating with parents/careers, using
31 http://www.ifs.org.uk/uploads/publications/comms/R118.pdf

60
support staff, and teaching pupils with differing needs/ abilities (SEN, BME, EAL). Upwards of 15% of NQTs rated their preparedness on each of these aspects as 1-3 out of 10. However, NQTs’ verbatim comments indicated a feeling that some of these issues could only be learnt ‘on the job’ rather than through formal training.
• As in last year’s survey, secondary-trained NQTs indicated feeling more prepared than primary NQTs across a number of areas that apply across the phases, including a large difference in assessing pupils’ progress and providing effective feedback. This could reflect differences in requirements across the phases, with primary teachers assessing pupils across a broader range of subjects. Further investigation to understand the factors behind the relatively low primary ratings on this measure could be valuable.
• The survey supports a growing body of evidence showing that school-based routes can be highly effective for some NQTs.32 NQTs trained via SCITT-led courses were more positive than those trained via other routes about the overall quality of their training, and their feelings of being prepared for various aspects of teaching. They were also more likely to report having gained employment through their training school. However, it remains difficult to interpret how far differences between routes are due to the different types of NQT attracted to each route rather than variations in the quality of the routes themselves. There is some evidence within the survey to indicate that longer periods of time in the classroom gaining practical experience are associated with more positive responses in a number of areas, including how well prepared NQTs feel for teaching, however.
• NQTs who trained via the SCITT salaried route are consistently less positive than NQTs who trained on fee-paying SCITT routes. This may be because salaried trainees are not supernumerary, unlike other trainees, and therefore expectations and workloads are commensurately higher. Further work to investigate the great disparity in views between fee-paying and salaried NQTs on SCITT routes could be useful given the increasing numbers trained via SCITT routes.
• There are few differences between primary- and secondary-trained NQTs across the survey. Secondary-trained NQTs were more likely to indicate feeling better prepared to teach across several measures, but ratings elsewhere were fairly consistent across the phases.
• The balance of theory and practical work on courses was generally considered about right by NQTs. However, where NQTs were not content with the balance of
32 See for example, latest Government statistics on NQTs: https://www.gov.uk/government/uploads/system/uploads/attachment_data/file/541055/SFR31_2016_Text.pdf and other work to review the training routes available: https://www.ifs.org.uk/uploads/publications/comms/r100.pdf
https://www.gov.uk/government/uploads/system/uploads/attachment_data/file/541055/SFR31_2016_Text.pdf

61
the course, their responses indicated they would like more practical experience. NQTs’ verbatim comments highlight a preference among some at least for theory that is rooted in practice and less abstract than some current teaching.
• The great majority of NQTs report they are completing their statutory induction (85%) and most find the induction helpful. Factors affecting the quality of induction are similar to those which appear to influence ratings of the overall ITT quality: feelings of being supported or mentored adequately, receiving appropriate high-quality training, and having protected NQT time to settle into roles and consolidate learning.
• In may be worth considering how the induction experience accommodates NQTs of all ages. For example, older NQTs were more likely than younger groups to say they received too little free time for preparation and planning. Verbatim responses suggest this could be because the demands of family life mean it is harder for this older cohort to take their work home.
• The survey used a slightly different methodology and questionnaire in 2016 compared with previous waves. A separate methodology report, with recommendations about how the survey could be developed and adapted in the future, can be found in the Appendix to this report.

62
Appendix: Survey methodology
A.1 Questionnaire design and testing Prior to starting the survey, Ipsos MORI worked with NCTL to review and update the survey questionnaire. This section describes the rationale for reviewing the survey, and the method used to cognitively test the changes made to the survey.
A.1.1 Background to questionnaire changes
There were several reasons why the questionnaire was reviewed for the 2016 survey:
• Analysis of responses to the 2015 survey had been limited by the fact that (a) there was little differentiation in the responses given by NQTs, and in particular most NQTs were selecting the same two points on the rating scale used for most survey measures; and (b) while the survey captured key measures, it collected little background or contextual information to help interpret those responses.
• NQTs’ verbatim responses in previous survey waves suggested that respondents were interpreting key survey questions inconsistently;
• The survey response rate had been falling; because the design and questions asked on self-completion questionnaires (i.e. online and/or postal surveys) are so important in motivating respondents to complete the surveys, it was worth reviewing the overall length and relevance of the questions; and,
• The 2016 survey was different in a number of respects – it was a sample survey rather than taking a census of NQTs, and used a slightly different methodology – and so it was a good point to review the questionnaire.
A.1.2 Desk review of questionnaire
Ipsos MORI conducted an initial desk-based review of the questionnaire, including a review of responses to the 2015 survey. A number of recommendations were made following this review.
• The rating scale used on most survey measures should be updated from a four-point scale to a longer scale, and the wording of the scale should be adapted to convey the questions’ meaning more clearly. Several survey measures ask NQTs how well their training prepared them for various aspects of teaching: NQTs’ verbatim responses in previous waves indicated that many answered the question to indicate how well prepared they felt per se, regardless of what their training had contributed to their feelings of preparedness. Furthermore, responses to previous

63
surveys showed there was very little differentiation in the responses on the four-point scale used (very good, good, satisfactory, poor), with nearly all respondents selecting the top two responses (very good or good) on nearly all measures.
o Recommendation: use a 7- or 10-point rating scale to provide greater differentiation in responses (and thus greater analysis potential), with the end-points of the scale labelled ‘did not prepare you well’ and ‘prepared you very well’ for key measures, to emphasise that respondents are being asked to rate their training rather than how well prepared they currently feel.
How well did your training prepare you for each of the following? Please give your answer on a scale from 1 to 10 where 1 means you think the training didn’t prepare you at all well and 10 means you think the training prepared you very well. Did not prepare
you at all well Prepared you
very well
1 2 3 4 5 6 7 8 9 10
[questionnaire item]
• The review suggested exploring whether there was value in adding some contextual or general questions at the start of the survey about the nature of the course NQTs completed and their current status. For example, a question about whether the respondent is currently in a teaching role could be helpful in interpreting their responses, as well as ensuring they are filtered to appropriate questions in the survey. Furthermore, to ensure the response rate is as good as possible the early questions in the survey (and ideally all questions in the survey) should ask about those issues which NQTs themselves are likely to consider as being particularly salient to their quality of their training experience. If the questions ask about points which seem to be irrelevant, or to reflect someone else’s agenda, response rates are likely to suffer.
o Recommendation: add questions at the start of the survey, and throughout, to capture contextual information and information about issues that appear to be particularly relevant for NQTs. These could include, for example, the support they received from their placement schools and providers, and the way the theory/practical elements of their course linked together – both issues highlighted by NQTs in verbatim comments in previous surveys.
• The overall course rating question is asked at the start of the survey. In most
surveys, this type of question is asked at the end. There are a few reasons for this: first, because the preceding questions effectively prompt respondents to think

64
about all the elements of their course that may affect their evaluation of their ITT, and help them to give a judgement. Second, this could be a relatively difficult question to respond to as the first question in the survey – in that it takes some consideration, in comparison to a more factual question. There is lots of evidence that respondents are particularly likely to drop out of surveys at the first question, and so it is imperative when designing self-completion surveys to make the first few questions as easy to answer as possible, and as relevant to the topic of the survey as possible.
o Recommendation: move the first question (overall quality of ITT) to come after all questions about ITT.33
• The major part of the survey asks NQTs to say how well their ITT prepared them
for a number of aspects of teaching. The questions are asked as a series of 30 statements with the same response scale. Previous responses suggested that NQTs do not differentiate between many of the statements (i.e. their responses to items that appear to be similar are similar), and so some of the statements are likely to be redundant, while adding to the survey length (and so decreasing the response rate).
o Recommendation: condense the number of statements asked, and simplify statements. Consider how this is laid out on the page, as long grids in online surveys are associated with higher abandonment rates.
A.1.3 Cognitive interview methodology and sampling
The questionnaire was revised to incorporate the suggestions outlined in A.1.2. The questionnaire was then cognitively tested with a sample of 20 NQTs. The sample was drawn from NCTL’s database of NQTs, and designed to provide a spread of NQTs by phase and training route. The profile of participating NQTs is shown below. All interviews were conducted by telephone and lasted around 45 minutes. NQTs were given an incentive of £20 as a thank you for their time.
33 Note that this recommendation was not implemented – see A.1.4 for details.

65
Table A.1.1 Cognitive testing sample composition
Participant Questionnaire version Route Phase 1
1 A Secondary School Direct (Fee) 2 B Secondary Teach First 3 A Secondary Undergraduate (UG) 4 A Primary Postgraduate (PG) 5 B Primary UG 6 A Primary PG 7 A Primary UG 8 B Secondary School Direct (Fee) 9 B Secondary PG
Phase 2 10 C Secondary SCITT 11 C Primary SCITT
12 C Primary PG (In the sample as Modern & Ancient Languages PG)
13 C Primary School Direct (Fee)
14 C Primary UG (In the sample as Mathematics UG)
15 D Primary School Direct (Salaried) 16 D Primary SCITT 17 D Primary School Direct (Fee) 18 D Secondary School Direct (Salaried) 19 E Secondary SCITT 20 E Primary School Direct (Salaried)
Across the 20 interviews, slightly different versions of the questions were tested:
• Versions A and B had an identical set of questions, but used different response scales (A started with a 10-point numerical scale, and used a 7-point scale with verbal labels for each scale point in the second half of the questionnaire, while B used the shorter labelled scale in the first half of the survey and the numerical scale later).
• Ipsos MORI and NCTL reviewed the findings and recommendations from phase 1 of cognitive testing, and the questionnaire was updated accordingly for version C.
• Version D included minor text amendments to Q7 and Q12b for clarification.
66
A.1.4 Changes in questionnaire following cognitive interviews
Following the cognitive testing the following key changes were made to the questionnaire, compared with the 2015 questionnaire:
• The rating scale used throughout the survey was changed from a 4-point to a 10-point scale. The end points were labelled to help convey the precise meaning of each question (see section A.1.3).
• The first part of the survey was adapted to ask some background questions of NQTs, including the pre-course information they received; the number of school placements they completed and the length of time they spent teaching/observing lessons as part of their training. This section also asked questions to capture NQTs’ views about their perceptions of key aspects of their training, including the balance of theory /practical experience, and ratings of the personal/professional support they received from schools and providers.
• The section of the survey asking about NQTs’ preparedness for different aspects of teaching (Q10 and Q11 on the 2016 survey) was shortened from 30 to 21 statements. The statements were presented across four pages/screens in the online survey (see Table A.1.4 below), to avoid an off-putting large grid being presented on the screen to respondents.
• The section asking about NQTs’ inductions was revised fairly substantially, and shortened compared with the previous survey. An introduction was added to ensure that NQTs differentiated the induction section from earlier questions about their ITT. Routing was added so those NQTs not completing an induction (or not working in a teaching role) skipped questions that would not be relevant to them.
• The overall satisfaction question was not moved to the end of the survey but kept as the first question (as per previous surveys) to ensure comparability over time.
A.1.5 Analysis of survey responses and implications for questionnaire design
Length
The mean completion time of the online survey across all those responding online was 11 minutes and 52 seconds. However, if we exclude respondents where the survey was open for very long periods (and where the website ‘timed out’) – which is probably a better indication of the completion time for the survey – the mean response time falls to just under 9 minutes. 84% of respondents completed the survey within 5-15 minutes.
Table A.1.2 Mean time to complete online survey

67
Mean completion time (all respondents) 11 mins 52 seconds Mean completion time (excluding respondents where online survey timed out)
8 mins 44 seconds
Table A.1.3 Online survey completion times
Number of minutes to complete % respondents (excluding
those where survey timed out) 3 minutes up to (but not including) 5 minutes 10% 5 minutes up to (but not including) 7 minutes 30% 7 minutes up to (but not including) 10 minutes 32% 10 minutes up to (but not including) 15 minutes 22% 15 minutes up to (but not including) 20 minutes 6% 20 minutes or more 2%
Which questions associated with biggest break-offs?
The number of respondents abandoning the survey varied across the questions asked. 27% of the 256 respondents who abandoned the survey did so at the first two questions (69 respondents abandoned at Q1 or Q2a). There was also a spike in respondents quitting the survey at Q10 and Q11 (65 respondents in total abandoned the survey at this point, 25% of all who quit the survey). This was expected, because this section of the survey is a large grid of 21 statements asking about respondents’ preparedness for different aspects of teaching. It would be worth considering ways in which this grid could be reduced further for the next wave of the study.

68
Table A.1.4 Where respondents abandoned the survey
Question number
Number of respondents abandoning survey at this question
Type of question
Q1 31 Scale Q2a 38 Grid (4 statements) Q2b 15 Grid (4 statements) Q3 10 Pre-coded list Q4 12 Scale Q5 6 Numerical Q6 18 Numerical Q7 5 Grid (2 statements) Q8 - Scale Q9 17 Grid (3 statements)
Q10 41 Grid (15 statements – 3 pages
of 5 statements each) Q11 24 Grid (6 statements) Q12 7 Scale Q13 - Open-ended Q14 2 Pre-coded list Q15 8 Pre-coded list Q16 5 Scale Q17 2 Grid (4 statements) Q18 2 Open-ended Q19 10 Pre-coded list
Q20/21 3 Open-ended/ database
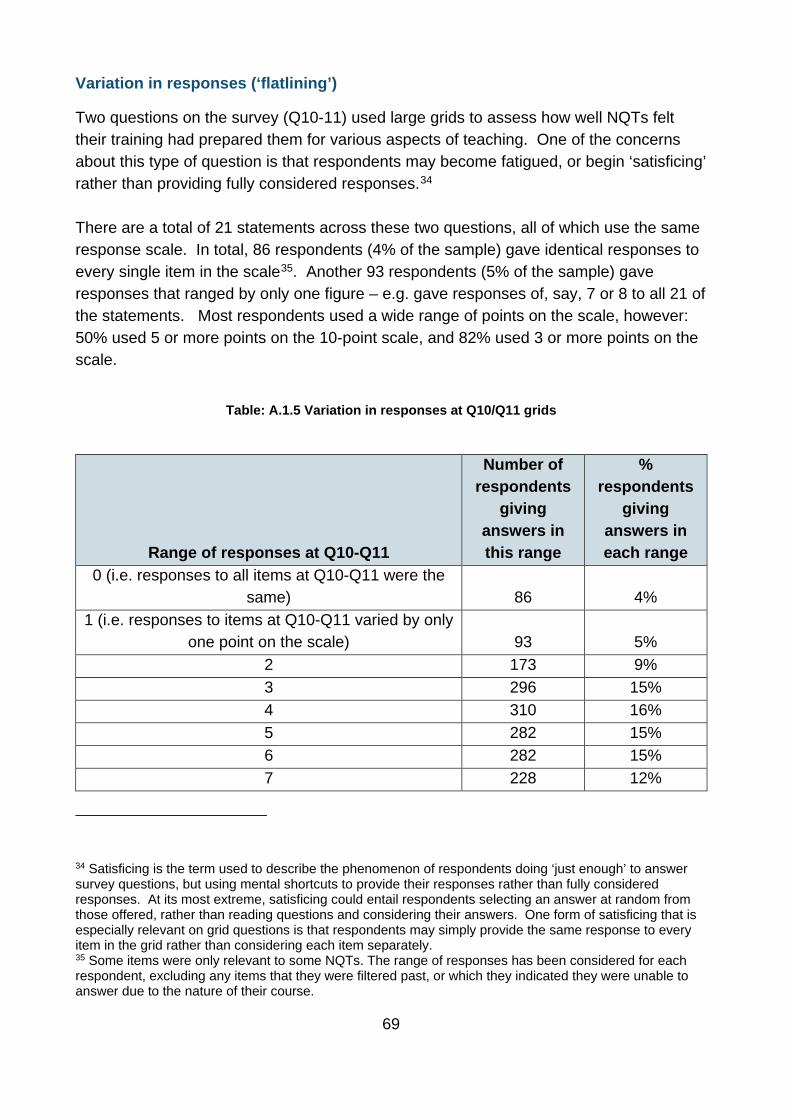
69
Variation in responses (‘flatlining’)
Two questions on the survey (Q10-11) used large grids to assess how well NQTs felt their training had prepared them for various aspects of teaching. One of the concerns about this type of question is that respondents may become fatigued, or begin ‘satisficing’ rather than providing fully considered responses.34 There are a total of 21 statements across these two questions, all of which use the same response scale. In total, 86 respondents (4% of the sample) gave identical responses to every single item in the scale35. Another 93 respondents (5% of the sample) gave responses that ranged by only one figure – e.g. gave responses of, say, 7 or 8 to all 21 of the statements. Most respondents used a wide range of points on the scale, however: 50% used 5 or more points on the 10-point scale, and 82% used 3 or more points on the scale.
Table: A.1.5 Variation in responses at Q10/Q11 grids
Range of responses at Q10-Q11
Number of respondents
giving answers in this range
% respondents
giving answers in each range
0 (i.e. responses to all items at Q10-Q11 were the same) 86 4%
1 (i.e. responses to items at Q10-Q11 varied by only one point on the scale) 93 5%
2 173 9% 3 296 15% 4 310 16% 5 282 15% 6 282 15% 7 228 12%
34 Satisficing is the term used to describe the phenomenon of respondents doing ‘just enough’ to answer survey questions, but using mental shortcuts to provide their responses rather than fully considered responses. At its most extreme, satisficing could entail respondents selecting an answer at random from those offered, rather than reading questions and considering their answers. One form of satisficing that is especially relevant on grid questions is that respondents may simply provide the same response to every item in the grid rather than considering each item separately. 35 Some items were only relevant to some NQTs. The range of responses has been considered for each respondent, excluding any items that they were filtered past, or which they indicated they were unable to answer due to the nature of their course.

70
Range of responses at Q10-Q11
Number of respondents
giving answers in this range
% respondents
giving answers in each range
8 165 9% 9 - -
10 - - Total 1,915 100%
A.2 Sample design NCTL provided a database of all eligible NQTs – i.e. those who gained QTS between December 2014 and November 2015. In total the database contained 32,189 records, of which 27,509 were contactable for this survey (either had an email or postal address). A sample of 4,437 NQTs was drawn from the database. The sample was disproportionately stratified by training route (see below) and proportionately stratified by:
• Subject group (STEM/ MFL/ other EBacc/ other subjects), • Gender (Male/Female), • Disability status (Disabled/ Not disabled), • Ethnicity (White/BME), • Region (Government Office Region), and • Age.
Table A 2.1 NQT population and sample profile
Training route Population
Target
Main selected
Reserve selected All sampled
N % N % N % N % Primary provider led 11260 41% 515 1287 29% 958 37% 2245 32% Primary school Direct salaried 1302 5% 106 266 6% 64 2% 330 5% Primary school direct training 2373 9% 160 399 9% 313 12% 712 10% Primary Teach First 350 1% 106 266 6% 84 3% 350 5% Secondary provider led 7724 28% 462 1154 26% 500 19% 1654 24%

71
Training route Population
Target
Main selected
Reserve selected All sampled
N % N % N % N % Secondary school direct salaried 1053 4% 133 333 8% 15 1% 348 5% Secondary school direct training 2520 9% 160 399 9% 55 2% 454 6% Secondary Teach First 927 3% 133 333 8% 594 23% 927 13% Grand total 27509 100% 1775 4437 100% 2583 100% 7020 100%
Towards the end of fieldwork, it became apparent that the overall numbers responding to the survey were lower than required, and a reserve sample of 2,583 NQTs was issued. The reserve sample was stratified in the same way as the main sample. The numbers selected within each training route were based on the numbers still required to reach the targets set, based on the responses already gathered at that point in fieldwork.
The achieved sample size was 1,913, with 1,612 responding online and 303 by post. Data are weighted by phase/route, region, life stage and gender to the profile of eligible NQTs in the population.
A.3 Sample profile Table A.3.1 shows the achieved unweighted sample profile, and how it compares to the contactable population for this survey. Note that the sample was disproportionately stratified by training route and phase, and so differences in the population and achieved sample on these variables are by design. The table illustrates that differences on other variables – such as subject specialism, life stage, region, gender, disability status, and ethnicity – were all very small.

72
Table A.3.1: Achieved sample profile (unweighted)
Population Achieved
N % N % Primary provider=led 11260 41% 552 29% Primary School Direct salaried 1302 5% 121 6% Primary School Direct training 2373 9% 199 10% Primary Teach First 350 1% 70 4% Secondary provider-led 7724 28% 511 27% Secondary School Direct salaried 1053 4% 146 8% Secondary School Direct training 2520 9% 166 9% Secondary Teach First 927 3% 150 8% Total 27,509 100% 1,915 100%
Primary 15285 56% 942 49% Secondary 12224 44% 973 51% Total 27,509 100% 1,915 100%
Provider-led 18984 69% 1063 56% School Direct Salaried 2355 9% 267 14% School Direct Training 4893 18% 365 19% Teach First 1277 5% 220 11% Total 27,509 100% 1,915 100%
STEM 4460 16% 363 19% MFL and classics 1163 4% 109 6% Other EBACC 3306 12% 282 15% All other subjects 3295 12% 219 11% Primary 15285 56% 942 49% Total 27,509 100% 1,915 100%
Primary - Career changer (32+) 2506 9% 211 11% Primary - Career finder (27-31) 2630 10% 173 9% Primary - Graduate (under 27) 10149 37% 558 29% Secondary - Career changer (32+) 2104 8% 212 11% Secondary - Career finder (27-31) 2434 9% 199 10% Secondary - Graduate (under 27) 7686 28% 562 29% Total 27,509 100% 1,915 100%
East Midlands 2012 7% 147 8% East of England 2357 9% 191 10% London 4250 15% 296 15% North East 1380 5% 75 4% North West 4797 17% 276 14%

73
Population Achieved
N % N % South East 4420 16% 346 18% South West 2618 10% 177 9% West Midlands 2921 11% 209 11% Yorkshire and The Humber 2662 10% 192 10% Not given 92 0% 6 0% Total 27,509 100% 1,915 100%
Primary - female 12657 46% 798 42% Primary - male 2628 10% 144 8% Secondary - female 7925 29% 653 34% Secondary -male 4299 16% 320 17% Total 27,509 100% 1,915 100%
Any disability 2129 8% 160 8% No disability 24556 89% 1697 89% Not known 824 3% 58 3% Total 27,509 100% 1,915 100%
White 23759 86% 1635 85% BME 2920 11% 219 11% Refused/missing 830 3% 61 3% Total 27,509 100% 1,915 100%
Design weights were applied to the data for phase/route. Non-response weights were applied by route*phase, region, life stage and gender, with data weighted to the profile of eligible NQTs in the population. The design effect associated with the weights applied was 1.17, which means the effective sample size for analysis is 1,641: in other words, the weights applied were fairly small, which reflects that the profile of responding NQTs was very similar to the population.
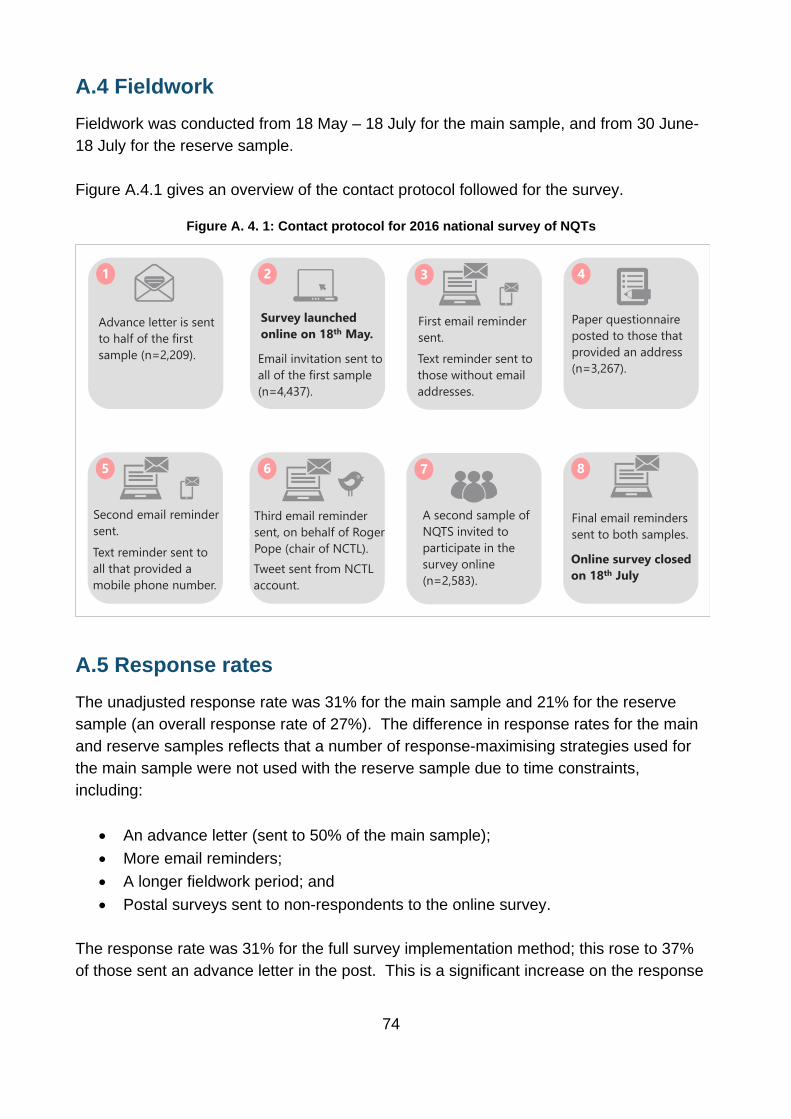
74
A.4 Fieldwork Fieldwork was conducted from 18 May – 18 July for the main sample, and from 30 June-18 July for the reserve sample. Figure A.4.1 gives an overview of the contact protocol followed for the survey.
Figure A. 4. 1: Contact protocol for 2016 national survey of NQTs
A.5 Response rates The unadjusted response rate was 31% for the main sample and 21% for the reserve sample (an overall response rate of 27%). The difference in response rates for the main and reserve samples reflects that a number of response-maximising strategies used for the main sample were not used with the reserve sample due to time constraints, including:
• An advance letter (sent to 50% of the main sample); • More email reminders; • A longer fieldwork period; and • Postal surveys sent to non-respondents to the online survey.
The response rate was 31% for the full survey implementation method; this rose to 37% of those sent an advance letter in the post. This is a significant increase on the response
1
Advance letter is sent to half of the first sample (n=2,209).
2 3
First email reminder sent.Text reminder sent to those without email addresses.
4
Survey launched online on 18th May.
Email invitation sent to all of the first sample (n=4,437).
Paper questionnaire posted to those that provided an address (n=3,267).
5 6 7 8
Second email reminder sent.Text reminder sent to all that provided a mobile phone number.
Third email reminder sent, on behalf of Roger Pope (chair of NCTL).
A second sample of NQTS invited to participate in the survey online (n=2,583).
Final email reminders sent to both samples.
Online survey closed on 18th JulyTweet sent from NCTL
account.
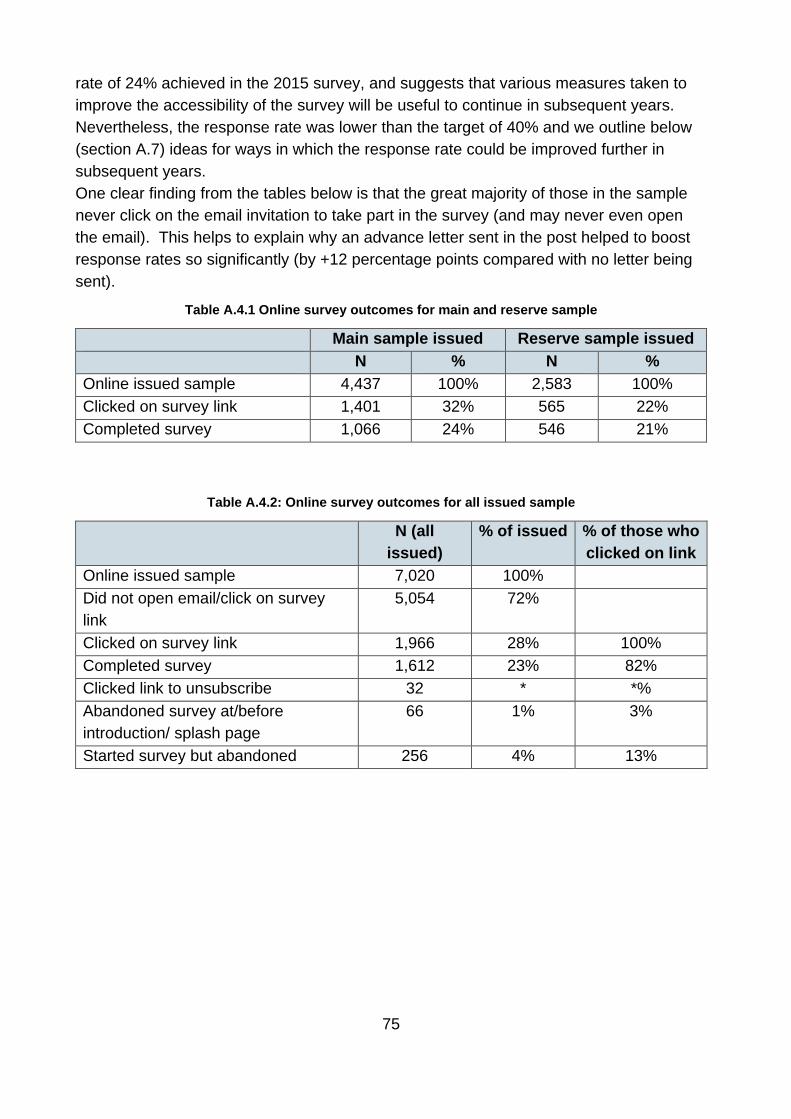
75
rate of 24% achieved in the 2015 survey, and suggests that various measures taken to improve the accessibility of the survey will be useful to continue in subsequent years. Nevertheless, the response rate was lower than the target of 40% and we outline below (section A.7) ideas for ways in which the response rate could be improved further in subsequent years. One clear finding from the tables below is that the great majority of those in the sample never click on the email invitation to take part in the survey (and may never even open the email). This helps to explain why an advance letter sent in the post helped to boost response rates so significantly (by +12 percentage points compared with no letter being sent).
Table A.4.1 Online survey outcomes for main and reserve sample
Main sample issued Reserve sample issued N % N % Online issued sample 4,437 100% 2,583 100% Clicked on survey link 1,401 32% 565 22% Completed survey 1,066 24% 546 21%
Table A.4.2: Online survey outcomes for all issued sample
N (all issued)
% of issued % of those who clicked on link
Online issued sample 7,020 100% Did not open email/click on survey link
5,054 72%
Clicked on survey link 1,966 28% 100% Completed survey 1,612 23% 82% Clicked link to unsubscribe 32 * *% Abandoned survey at/before introduction/ splash page
66 1% 3%
Started survey but abandoned 256 4% 13%

76
Table A.4.3: Postal survey outcomes (main sample only)
N % of issued No response to online survey at cut-off point 3,304 No address available 37 Postal survey sent (all where address available) 3,267 100% Deadwood/incorrect addresses 3 * Postal completions 303 9% Invalid postal completions (online survey already completed)
4 *
A.5 Advance letters This year’s survey was used to test a number of measures that may help to enhance the response rate to the survey when it is likely to move back to a provider-led model rather than a national survey next year. Survey literature suggested that response rates could be enhanced by sending advance letters in the post to those we sampled. Researchers speculate that the letters are effective because:
• they make it more likely that potential respondents are aware of the survey. In particular, a letter could be effective if potential respondents do not check emails at all or regularly and therefore would not see the email invitations;
• they emphasise the importance of the survey: while an email invitation can be sent at a very low cost, sending a letter by post demonstrates that the organisations sponsoring/running the survey is willing to invest in the time and cost of posting materials;
• they help to enhance the effectiveness of the email invitation: the postal invitation is more likely to be seen, while the email invitation is easier to use (because it contains a clickable hyperlink to the survey page), and the letter could serve to direct respondents to the email, legitimise the email, or remind them they have received the email.
Because sending postal invitations carries an additional cost – which would be significant if the survey were run as a census, as in previous waves – a random half of NQTs in the main sample were sent the advance letter in the post, while the other half of the sample did not receive this letter.

77
The rest of the reminder schedule was the same for all those sampled, regardless of whether the advance letter was sent or not. Due to time constraints, no advance letters were sent to the reserve sample. Table A.4.4 shows that the advance letter had a significant positive impact on the response rate: the online survey response rate increased from 18% to 30% when a letter was sent, and the overall response rate across both online and postal modes increased from 25% to 37% when an advance letter was sent. Sending an advance letter did not appear to have a positive impact on the response rate to the postal survey, and in fact the response rate was slightly higher among those respondents who had not been sent an advance letter. This could reflect that the first postal contact has a motivating impact for some respondents: for those not sent the advance letter, the postal survey was the first postal contact and thus had a slightly bigger impact. The findings suggest that contacting potential respondents by post is effective in reaching those who do not respond to email alone. The impact of the letter needs to be weighed against the additional cost of contacting respondents by post (either with an advance letter and/or with a full postal survey); however, given its clear impact it may be useful in future waves either to boost response across the sample or to target specific sub-groups where response rates are typically lower and/or where higher response rates are needed to in order to achieve a minimum number of responses for analysis purposes. Table A.4.1 Numbers of responses and response rates for sample sent advance letter vs. those not
sent advance letter
Sent advance letter Not sent advance letter Number in sample 2,210 2,227 Number of responses (main only) 807 564 Response rate (main only) 37% 25% Number of online responses 661 405 Online response rate 30% 18% Number of postal surveys issued 1,718 1,549 Number of postal responses 146 159 Postal response rate 8% 10% Proportion of all respondents responding online
85% 81%
Base: main sample only (pre-notification letters not sent for reserve sample)
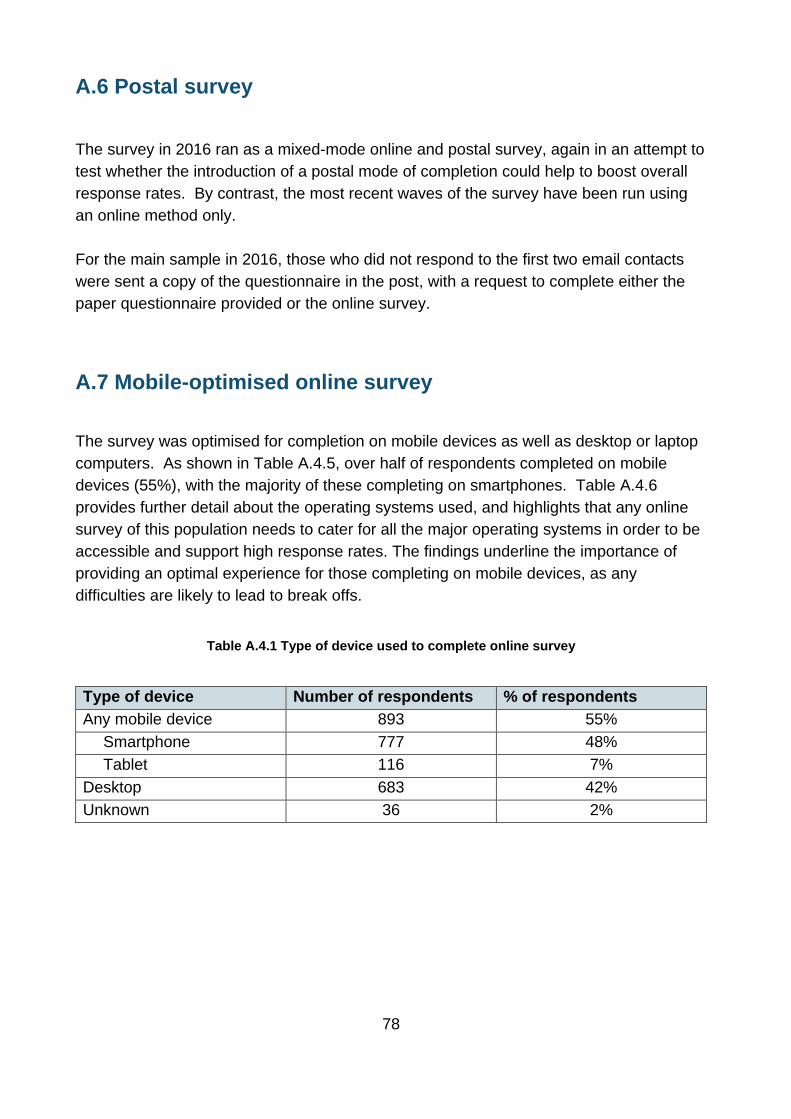
78
A.6 Postal survey The survey in 2016 ran as a mixed-mode online and postal survey, again in an attempt to test whether the introduction of a postal mode of completion could help to boost overall response rates. By contrast, the most recent waves of the survey have been run using an online method only. For the main sample in 2016, those who did not respond to the first two email contacts were sent a copy of the questionnaire in the post, with a request to complete either the paper questionnaire provided or the online survey.
A.7 Mobile-optimised online survey The survey was optimised for completion on mobile devices as well as desktop or laptop computers. As shown in Table A.4.5, over half of respondents completed on mobile devices (55%), with the majority of these completing on smartphones. Table A.4.6 provides further detail about the operating systems used, and highlights that any online survey of this population needs to cater for all the major operating systems in order to be accessible and support high response rates. The findings underline the importance of providing an optimal experience for those completing on mobile devices, as any difficulties are likely to lead to break offs.
Table A.4.1 Type of device used to complete online survey
Type of device Number of respondents % of respondents Any mobile device 893 55%
Smartphone 777 48% Tablet 116 7%
Desktop 683 42% Unknown 36 2%

79
Table A.4.2 Operating systems used to complete online survey
Operating system Number of respondents % of respondents iOS/Mac 803 50% Android 251 16% Windows 549 34% Other 9 1%
A.8 Email reminders A total of five email contacts were made for the main sample: the initial survey invitation, and four reminder emails. Each reminder was sent to those who had not completed the survey to date. In addition, the second email reminder was accompanied by a text message which was sent to all for whom a mobile telephone number was available. Due to a shorter period of time in the field, the reserve sample was contacted only twice by email: the initial invitation and one reminder.
A.9 Text reminders Two text message reminders were sent to the main sample. The first was sent to those for whom no email address was available (these NQTs remained in the sample because we had a postal address for them, and therefore they could be contacted to participate in the survey). The second reminder was sent to all for whom a mobile telephone number was available, in parallel with the second email reminder. As we did not experiment in sending the text reminders it is difficult to judge what impact they had on the overall response rates (our data does not reveal whether respondents accessed the survey by clicking on the email link or on the link in the text message). However, respondents did not appear to be bothered by being contacted by text message – in that none raised any complaints with Ipsos MORI/NCTL as a result – and this additional mode of contact is likely to be helpful in maximising the number of potential respondents who receive the survey, including those who do not check their emails.

80
A.10 Conclusions and recommendations
Questionnaire
• Maintain the 10-point rating scale which gives greater differentiation in responses than the previous 4-point rating scale, more scope for in-depth analysis, and better insights for providers on areas where they are relatively strong and where performance could be improved. Analysis of the survey responses shows that the great majority of NQTs were using a range of points on the scale.
• Review Questions 10-11 to explore whether the number of items could be condensed: the long list of similar questions here is associated with the highest break-off rates of any questions in the survey.
• Review the value of newer questions with key stakeholders and the steering group. In particular, explore whether questions about the information sources NQTs used to find out about teaching are picking up on the specific issues that stakeholders need to plan communications in the future. Note that other forms of data gathering may be more accurate as a way of capturing information about how NQTs get into teaching than this survey, including real-time information captured as NQTs use the various sources of information available.
• Consider whether Teach First NQTs should be included in the survey, and the extent to which the standardised questions asked on the survey are suitable for this particular cohort. The findings throughout the survey indicate significant differences for this cohort; given the stark differences between the Teach First training route and others, direct comparisons between Teach First and other routes may not be appropriate.
Fieldwork mode and survey administration
• Over half of NQTs completed the survey using smartphones or tablets: it is important to continue using mobile-optimised online surveys in future waves, as any difficulties in accessing or using the survey will increase the proportion who drop out of the survey.
• Two thirds of those sent the email invitation did not click on the survey link, although completion rates were high among those who did click on the link. Any strategies that can be used to encourage NQTs to open the email and click on the link will be helpful in boosting response rates in the future. This could include, for example, direct contacts from NQTs’ providers; or more communications to publicise the survey through providers, schools, the trade press, and social media. Although they were not tested experimentally in the current survey, we would

81
expect the use of different forms of contact – such as text message reminders, tweets, and different messages within email reminders – to be effective based on other survey evidence.
• Sending an advance letter by post was associated with a +12 percentage point increase in response rates in the 2016 survey. We recommend sending the letters in future. If the cost of sending letters to the full sample exceeds the available budget, consider sending letters to specific sub-groups of particular interest, and/or groups where the population size is relatively small, and/or subgroups where response rates are relatively low.
• Although we did not test experimentally the impact of sending text message reminders, we were able to pilot them on the 2016 survey. The team had some concerns that sending text message reminders may be seen as intrusive, especially for those who had received an advance letter and multiple email reminders about the survey. However, there was no evidence that those we contacted had concerns or were aggravated by being contacted by text, and we recommend text messages are used in the future to help remind respondents, and to provide a different type of contact that may motivate those who have not responded to email reminders.
• Consider reviewing the timings for the survey administration. Some of the comments made by NQTs during the cognitive testing suggested that some considered their ITT to be less relevant to them now they were into their teaching career. A few suggested timing the survey around holidays, such as the Christmas holidays, so that NQTs could accommodate the survey despite busy teaching schedules.
• The use of the postal mode is effective in boosting the overall survey response rate. However, there do not appear to be many systematic differences in the profile of those responding online and by post – in other words, the postal survey does not appear to reduce bias (at least on observable characteristics) in the achieved sample. The postal survey contributed 7% to the main survey response rate (of 31%), while the advance letter had an impact of +12 percentage points. On balance, if budget is not available to run both a postal survey and send advance letters, the latter may be a more cost-effective way of boosting response. Alternatively, advance letters and the postal survey could both be used to target sub-groups of the sample where higher response rates are necessary or desirable for analysis purposes.

82
Reference: DFE - RR621
ISBN: 978-1-78105-682-0
The views expressed in this report are the authors’ and do not necessarily reflect those of the Department for Education.
Any enquiries regarding this publication should be sent to us at: [email protected] or www.education.gov.uk/contactus
This document is available for download at www.gov.uk/government/publications
Related Documents