BRAIN A JOURNAL OF NEUROLOGY Neural correlates of cognitive impairment in posterior cortical atrophy Aure ´lie Kas, 1,2, * Leonardo Cruz de Souza, 3,4,5, * Dalila Samri, 5 Paolo Bartolomeo, 3,6 Lucette Lacomblez, 5,7,8 Michel Kalafat, 5 Raffaella Migliaccio, 3,6 Michel Thiebaut de Schotten, 3,9 Laurent Cohen, 3,5,10 Bruno Dubois, 3,5,7 Marie-Odile Habert 1,7, * and Marie Sarazin 3,5, * 1 AP-HP, Groupe hospitalier Pitie ´ -Salpe ˆ trie ` re, service de Me ´ decine Nucle ´ aire, Paris, F-75013, France 2 URA CNRS-CEA 2210, MIRCen, I2BM/DSV, Orsay, F-91400, France 3 INSERM-UPMC UMRS 975, Centre de Recherche de l’Institut du Cerveau et de la Moelle e ´ pinie ` re, Cognition, neuro-imagerie et maladies du cerveau, Paris, F-75013, France 4 CNRS, UMR 7225, Paris, F-75013, France 5 AP-HP, Groupe hospitalier Pitie ´ -Salpe ˆ trie ` re, Department of Neurology, Paris, F-75013, France 6 Department of Psychology, Catholic University of Milan, Largo Gemelli, 1, 20123, Milan, Italy 7 Universite ´ Pierre et Marie Curie-Paris 6, INSERM, UMR-S 678, F-75013, Paris, France 8 Universite ´ Pierre et Marie Curie-Paris 6, Service de Pharmacologie, F-75013, Paris, France 9 Natbrainlab, Department of Forensic and Neurodevelopmental Sciences, Institute of Psychiatry, King’s College London, London, WC2R 2LS, UK 10 Universite ´ Pierre et Marie Curie-Paris 6, Faculte ´ de me ´ decine Pitie ´ -Salpe ˆ trie ` re, IFR 70, F-75013, Paris, France *These authors contributed equally to this work. Correspondence to: Aure ´ lie Kas, Service de Me ´ decine Nucle ´ aire, GH Pitie ´ -Salpe ˆ trie ` re, 47-83, boulevard de l’Ho ˆ pital, 75651 Paris Cedex 13, France E-mail: [email protected] With the prospect of disease-modifying drugs that will target the physiopathological process of Alzheimer’s disease, it is now crucial to increase the understanding of the atypical focal presentations of Alzheimer’s disease, such as posterior cortical atrophy. This study aimed to (i) characterize the brain perfusion profile in posterior cortical atrophy using regions of interest and a voxel-based approach; (ii) study the influence of the disease duration on the clinical and imaging profiles; and (iii) explore the correlations between brain perfusion and cognitive deficits. Thirty-nine patients with posterior cortical atrophy underwent a specific battery of neuropsychological tests, mainly targeting visuospatial functions, and a brain perfusion scintigraphy with 99m Tc-ethyl cysteinate dimer. The imaging analysis included a comparison with a group of 24 patients with Alzheimer’s disease, matched for age, disease duration and Mini-Mental State Examination, and 24 healthy controls. The single-photon emission computed tomography profile in patients with posterior cortical atrophy was characterized by extensive and severe hypoperfu- sion in the occipital, parietal, posterior temporal cortices and in a smaller cortical area corresponding to the frontal eye fields (Brodmann areas 6/8). Compared with patients with Alzheimer’s disease, the group with posterior cortical atrophy showed more severe occipitoparietal hypoperfusion and higher perfusion in the frontal, anterior cingulate and mesiotemporal regions. When considering the disease duration, the functional changes began and remained centred on the posterior lobes, even in the late stage. Correlation analyses of brain perfusion and neuropsychological scores in posterior cortical atrophy highlighted the prominent role of left inferior parietal damage in acalculia, Gerstmann’s syndrome, left–right indistinction and limb apraxia, doi:10.1093/brain/awr055 Brain 2011: Page 1 of 15 | 1 Received October 28, 2010. Revised February 3, 2011. Accepted February 5, 2011 ß The Author (2011). Published by Oxford University Press on behalf of the Guarantors of Brain. All rights reserved. For Permissions, please email: [email protected] Brain Advance Access published April 7, 2011 by guest on April 9, 2011 brain.oxfordjournals.org Downloaded from

Welcome message from author
This document is posted to help you gain knowledge. Please leave a comment to let me know what you think about it! Share it to your friends and learn new things together.
Transcript

BRAINA JOURNAL OF NEUROLOGY
Neural correlates of cognitive impairment inposterior cortical atrophyAurelie Kas,1,2,* Leonardo Cruz de Souza,3,4,5,* Dalila Samri,5 Paolo Bartolomeo,3,6
Lucette Lacomblez,5,7,8 Michel Kalafat,5 Raffaella Migliaccio,3,6 Michel Thiebaut de Schotten,3,9
Laurent Cohen,3,5,10 Bruno Dubois,3,5,7 Marie-Odile Habert1,7,* and Marie Sarazin3,5,*
1 AP-HP, Groupe hospitalier Pitie-Salpetriere, service de Medecine Nucleaire, Paris, F-75013, France
2 URA CNRS-CEA 2210, MIRCen, I2BM/DSV, Orsay, F-91400, France
3 INSERM-UPMC UMRS 975, Centre de Recherche de l’Institut du Cerveau et de la Moelle epiniere, Cognition, neuro-imagerie et maladies
du cerveau, Paris, F-75013, France
4 CNRS, UMR 7225, Paris, F-75013, France
5 AP-HP, Groupe hospitalier Pitie-Salpetriere, Department of Neurology, Paris, F-75013, France
6 Department of Psychology, Catholic University of Milan, Largo Gemelli, 1, 20123, Milan, Italy
7 Universite Pierre et Marie Curie-Paris 6, INSERM, UMR-S 678, F-75013, Paris, France
8 Universite Pierre et Marie Curie-Paris 6, Service de Pharmacologie, F-75013, Paris, France
9 Natbrainlab, Department of Forensic and Neurodevelopmental Sciences, Institute of Psychiatry, King’s College London, London, WC2R 2LS, UK
10 Universite Pierre et Marie Curie-Paris 6, Faculte de medecine Pitie-Salpetriere, IFR 70, F-75013, Paris, France
*These authors contributed equally to this work.
Correspondence to: Aurelie Kas,
Service de Medecine Nucleaire,
GH Pitie-Salpetriere,
47-83, boulevard de l’Hopital,
75651 Paris Cedex 13,
France
E-mail: [email protected]
With the prospect of disease-modifying drugs that will target the physiopathological process of Alzheimer’s disease, it is now
crucial to increase the understanding of the atypical focal presentations of Alzheimer’s disease, such as posterior cortical
atrophy. This study aimed to (i) characterize the brain perfusion profile in posterior cortical atrophy using regions of interest
and a voxel-based approach; (ii) study the influence of the disease duration on the clinical and imaging profiles; and (iii) explore
the correlations between brain perfusion and cognitive deficits. Thirty-nine patients with posterior cortical atrophy underwent a
specific battery of neuropsychological tests, mainly targeting visuospatial functions, and a brain perfusion scintigraphy with99mTc-ethyl cysteinate dimer. The imaging analysis included a comparison with a group of 24 patients with Alzheimer’s disease,
matched for age, disease duration and Mini-Mental State Examination, and 24 healthy controls. The single-photon emission
computed tomography profile in patients with posterior cortical atrophy was characterized by extensive and severe hypoperfu-
sion in the occipital, parietal, posterior temporal cortices and in a smaller cortical area corresponding to the frontal eye fields
(Brodmann areas 6/8). Compared with patients with Alzheimer’s disease, the group with posterior cortical atrophy showed more
severe occipitoparietal hypoperfusion and higher perfusion in the frontal, anterior cingulate and mesiotemporal regions. When
considering the disease duration, the functional changes began and remained centred on the posterior lobes, even in the late
stage. Correlation analyses of brain perfusion and neuropsychological scores in posterior cortical atrophy highlighted the
prominent role of left inferior parietal damage in acalculia, Gerstmann’s syndrome, left–right indistinction and limb apraxia,
doi:10.1093/brain/awr055 Brain 2011: Page 1 of 15 | 1
Received October 28, 2010. Revised February 3, 2011. Accepted February 5, 2011
� The Author (2011). Published by Oxford University Press on behalf of the Guarantors of Brain. All rights reserved.
For Permissions, please email: [email protected]
Brain Advance Access published April 7, 2011 by guest on A
pril 9, 2011brain.oxfordjournals.org
Dow
nloaded from
whereas damage to the bilateral dorsal occipitoparietal regions appeared to be involved in Balint’s syndrome. Our findings
provide new insight into the natural history of functional changes according to disease duration and highlight the role of parietal
and occipital cortices in the cognitive syndromes that characterize the posterior cortical atrophy.
Keywords: PCA; Alzheimer’s disease; SPECT; cerebral perfusion; neuropsychological correlations
Abbreviations: MMSE = Mini-Mental State Examination; PCA = posterior cortical atrophy; SPECT = single photon emissioncomputed tomography
IntroductionPosterior cortical atrophy (PCA) was first used by Benson et al.
(1988) to describe a progressive dementing syndrome in which the
onset is characterized by early, higher order visual deficits. Patients
develop features of Balint’s syndrome (ocular apraxia, optic ataxia
and simultanagnosia), Gerstmann’s syndrome (acalculia, agraphia,
finger agnosia and left–right disorientation), visual agnosia and
transcortical sensory aphasia, whereas episodic memory is
preserved or only mildly impaired.
Neuropathological studies demonstrated that the primary cause
of PCA is Alzheimer’s disease followed, more rarely, by corticoba-
sal degeneration, dementia with Lewy bodies or prion disease
(Renner et al., 2004; Tang-Wai et al., 2004; McMonagle et al.,
2006; Alladi et al., 2007). In cases of Alzheimer’s disease path-
ology, PCA and typical Alzheimer’s disease can be distinguished by
the distribution of these pathological changes; patients with PCA
have a higher density of neurofibrillary tangles in the occipital
regions and fewer in the prefrontal cortex, hippocampus and
subiculum (Hof et al., 1997; Galton et al., 2000; Tang-Wai
et al., 2004). Thus, the term ‘atypical focal cortical presentation
of Alzheimer’s disease’ was proposed, as well as ‘visual variant of
Alzheimer’s disease’ (Levine et al., 1993; Kramer and Miller, 2000;
Alladi et al., 2007). With the prospect of disease-modifying drugs
that will target the physiopathological process of Alzheimer’s
disease, it is crucial to increase our understanding of PCA. Little
is known about the topography and the natural progression of
PCA. Indeed, the rarity of the disease makes it difficult to create
a clinical cohort. In a longitudinal follow-up of 19 patients with
PCA, McMonagle et al. (2006) reported early and prominent
visuospatial deficits with latter, but variable, agnosia and posterior
language deficit (alexia, agraphia and transcortical aphasia),
whereas memory and frontal lobe functions remained relatively
spared. This cognitive profile suggests that PCA symptoms
remain mainly posterior, in accordance with the neurofibrillary tan-
gles topography observed in PCA (Hof et al., 1997; Galton et al.,
2000; Tang-Wai et al., 2004). In case reports, other authors
reported marked deteriorations in other cognitive domains, includ-
ing memory, leading to global cognitive impairment (Levine et al.,
1993; Della Sala et al., 1996). The question of diffuse versus focal
posterior clinical evolution in PCA remains open.
Functional neuroimaging, using PET or single photon emission
computed tomography (SPECT), offers reliable and sensitive
methods to investigate in vivo the cerebral perfusion or metabolic
defects in dementia disorders, even at early stages (Habert et al.,
2011). Both hypoperfusion and hypometabolism display synaptic
dysfunction or neuronal loss and provide information about the
topography and the severity of lesions, regardless of the under-
lying pathological process. Only a few studies of patients with
PCA have been published. PET studies have reported a prominent
hypometabolism in the parietal associative cortex, with a variable
involvement of the adjacent temporal and occipital associative
cortices, while the frontal and mesiotemporal regions were rela-
tively spared (Bokde et al., 2001; Nestor et al., 2003; Schmidtke
et al., 2005). However, these studies are hampered by the small
number of subjects (no more than 10 patients) and by the succinct
exploration of neuropsychological deficits. Brain perfusion SPECT
use has only been reported in single cases of patients with PCA
(Ross et al., 1996; Galton et al., 2000; Goethals and Santens,
2001).
Therefore, we aimed first to use brain SPECT to study the profile
of brain hypoperfusion in a large group of patients with PCA,
compared with normal controls and patients with Alzheimer’s
disease. In addition, we analysed the patterns of perfusion
decrease in patients with PCA according to the duration of the
symptoms. Second, we analysed the neural bases of the PCA syn-
drome by studying the correlations between the SPECT data and
the scores of a specific battery of neuropsychological tests, which
mainly explore visuospatial functions. The method of clinico/
imaging correlations allows the study of the anatomical correlates
of a cognitive process assessed by a specific test in patients with
neurodegenerative disorders (Desgranges et al., 2002), but has
not yet been used in patients with PCA.
Materials and methods
SubjectsThirty-nine subjects (61.1 � 7.8 years old, 37 right-handed, two
left-handed) with a clinical diagnosis of PCA were admitted to the
Centre of Cognitive and Behavioural Disorders (Pitie-Salpetriere
Hospital, Paris, France) between 2002 and 2008 (Table 1). The
diagnosis of PCA was based on the clinical criteria from
(McMonagle et al., 2006) (details in Table 2). Ophthalmological
assessment excluded primary causes of visual disorder for all patients.
Patients with parkinsonian signs, symptoms suggestive of dementia
with Lewy bodies or severe depression or, more generally, patients
with medical conditions that could interfere with cognitive perform-
ance were excluded. All patients were clinically followed for at least
24 months to confirm that visuospatial dysfunctions remained the
main cause of cognitive impairment, in accordance with the diagnosis
of PCA.
2 | Brain 2011: Page 2 of 15 A. Kas et al.
by guest on April 9, 2011
brain.oxfordjournals.orgD
ownloaded from

All imaging and clinical data were generated during routine clinical
workup in the Neurology Department and were extracted for the pur-
pose of this study. Therefore, according to French legislation, explicit
informed consent was waived. However, the regulation concerning
electronic filing was followed, and both patients and their relatives
were informed that individual data could be used in clinical research
studies.
For the purpose of imaging analysis, we also studied 24 patients
with probable Alzheimer’s disease, diagnosed according to NINCDS–
ADRDA criteria (McKhann et al., 1984), who were matched to the
group with PCA for age, disease duration and Mini-Mental State
Examination (MMSE) score. All of the patients with Alzheimer’s
disease were described in a previous study (Habert et al., 2011).
Twenty-four healthy subjects, also previously described (Le Ber
et al., 2006), were used as controls (Table 1).
Posterior cortical atrophy neurologicaland neuropsychological assessmentNeurological assessment was performed by trained clinicians (M.S.,
L.C.d.S., M.K., L.L. and B.D.) with expertise in the field of dementia.
Clinical features of memory deficits, visuospatial deficit, visual agnosia,
environmental disorientation, body schema distortion, spatial neglect
or any feature suggestive of Balint’s or Gerstmann’s syndromes were
considered present if clearly documented by history or on examination.
All patients were tested by the same neuropsychologist (D.S.) using a
standardized neuropsychological battery. The battery consisted of two
series of tests and took �2 h. The first series included the MMSE
(Folstein et al., 1975), the Free and Cued Selective Reminding Test
(Van der Linden, 2004), the Frontal Assessment Battery (Dubois et al.,
2000), picture naming test and word generation tasks for category and
letter fluency (Kremin, 1999). Visual and verbal direct and backward
span (Wechsler, 1981) were employed to assess working memory,
defined as the capacity for the temporary storage and manipulation
of the information that is necessary for the realization of a given
complex cognitive task (Baddeley, 2003). Patients who scored 1.5
standard deviations (SD) below the norm were considered to have a
working memory deficit.
The second series, the ‘posterior neuropsychological battery’,
included the following:
(i) Copy of the Rey figure to examine visuoconstructive function
(Liberman et al., 1994) (maximum score = 36);
(ii) A limb apraxia battery (Peigneux and Van der Linden, 2000)
(maximum score = 32);
(iii) The Cookie Theft picture from the Boston Diagnostic Aphasia
Examination (Goodglass, 1983) and the five series of overlap-
ping figures (Gainotti et al., 1991) to assess simultanagnosia,
defined as the inability to perceive two or more objects
simultaneously (maximum score = 25);
(iv) Assessment of ocular apraxia [defined as the inability to volun-
tarily direct one’s gaze to a particular point (Charles and Hillis,
2005)]. The patient was seated in front of the examiner at a
distance of 50 cm and was asked to move his eyes towards a
moving target after staring at the examiner’s nose. The four
visual quadrants were evaluated (maximum score = 4);
(v) Assessment of optic ataxia [defined as the impairment of
goal-directed hand movements towards visually presented tar-
gets (Trillenberg et al., 2007)]: The patient was seated in front
of the examiner at a distance of 50 cm and asked first to stare at
the examiner’s nose, then to use a designated hand (left or
right) to touch a moving target without moving his eyes from
the examiner’s nose. The examiner moved the target through
Table 1 General demographic features of the study groups
PCA Alzheimer’s disease Controls P-value
Number of subjects 39 24 24 NS
Gender (male/female) 10/29 14/10 7/17 P5 0.05a
Age (years) 61.1 � 7.8 (47.9–80.3) 65.1 � 12.1 (42.0–82.9) 69 � 6.9 (52–81) P5 0.05b
Education level (years) 10.5 � 5 (2–15) 7.8 � 5.1 (2–15) 10.6 � 4.1 (3–15) P5 0.05a
Onset age (years) 57.4 � 7.7 (45–74) 62.4 � 11.1 (40–80) NS
Duration (years) 3.8 � 2.1 (0.6–12.6) 3.7 � 2.0 (1.2–8.1) NS
MMSE (/30) 18.1 � 5.0 (6–27) 19.4 � 5.0 (10–26) 28.8 � 0.7 (28–30) P5 0.05b
Values are mean � SD (min–max).a PCA versus Alzheimer’s disease (Mann–Whitney U-test).b PCA versus controls (Mann–Whitney U-test); NS = not significant.
Table 2 Inclusion criteria for PCA
Inclusion criteria for PCA (adapted from McMonagle et al., 2006)
(i) Insidious onset and gradual progression of cognitive impairment.
(ii) Presentation with prominent visuospatial impairment in the absence of ophthalmologic impairment.
(iii) Evidence of complex visual disorder on examination: elements of Balint’s syndrome (optic ataxia, ocular apraxia and simultanagno-
sia), and/or Gerstmann’s syndrome (acalculia, agraphia, left–right disorientation and finger agnosia), visual agnosia or spatial neglect.
(iv) Proportionately less memory loss or reduced verbal fluency.
(v) Absence of focal lesion (brain tumour, haematoma or stroke) on brain scan or MRI.
Cognitive and SPECT profiles in PCA Brain 2011: Page 3 of 15 | 3
by guest on April 9, 2011
brain.oxfordjournals.orgD
ownloaded from

the four visual quadrants. One point was given for each time
the patient could reach the target with his hand (maximum
score = 8);
(vi) Right–left distinction and body schema assessment. The patient
was asked to indicate 12 body parts on both himself and the
examiner (maximum score = 24);
(vii) Digital gnosia (defined as the ability to recognize the fingers of
the hand). First, the patient was asked to show each of the five
fingers when named by the examiner. Next, they were asked to
name each one of the five fingers showed by the examiner
(maximum score = 10);
(viii) Mental calculation. The patient was asked to perform a series of
seven subtractions, seven additions and six multiplications (max-
imum score = 20);
(ix) Agraphia. The ‘agraphia score’ (out of 11) was established by
asking the patient to write a dictated sentence composed of
11 frequently used French words.
Finally, we defined the sum of the simultanagnosia, visual praxia
and optic ataxia scores (out of 37) as the Balint’s syndrome score
and the sum of the agraphia, acalculia, digital agnosia and right–left
distinction scores (out of 65) as the Gerstmann’s syndrome score.
All patients with PCA underwent the first series of tests, and 30 out
of 39 patients underwent the posterior neuropsychological battery.
Subgroups of patients with posteriorcortical atrophy according to diseasedurationThe patients with PCA were divided in two groups based on the
estimated disease duration. A cut-off of 3 years was chosen, based
on the median length of disease duration, to define two groups of
equal size: (i) a short disease duration group, with a disease duration
43 years (19 patients); and (ii) a long disease duration group with
a disease duration 43 years (20 patients, mean 5.1 � 2.1 years, range
3.3–12.6). The majority of long disease duration patients had disease
duration between 3.3 and 6.5 years. One patient had 8-year disease
duration and another had 12.6-year disease duration. We also isolated
seven patients within the short disease duration group with a very
short (42 years) disease duration (Supplementary Table 1). All statis-
tical analyses of demographic and neuropsychological data were per-
formed with STATISTICA 5.5 A (� StatSoft). Descriptive statistics were
used to characterize each group. Differences in medians between
groups were compared using the Mann–Whitney U-test.
Brain perfusion single photon emissioncomputed tomography studyAll subjects underwent a brain perfusion SPECT within 3 months of
diagnosis. Thirty minutes after the injection of 99mTc-ethyl cysteinate
dimer (925 MBq) 120 projections were acquired in a 128 � 128 matrix
with a three-headed gamma-camera equipped with parallel high
resolution collimators (Irix, Philips). Projections were reconstructed
using an iterative algorithm, post-filtered (low pass filter: order = 4,
cut-off frequency = 0.4 cm�1), then corrected for attenuation using
the Chang method (m = 0.12 cm�1). Reconstructed volumes were
spatially normalized to the Montreal Neurological Institute space
with Statistical Parametric Mapping software (SPM2, Welcome
Department of Cognitive Neurology, University College, London),
using a SPECT perfusion template. A 12-parameter affine
transformation was used, followed by a non-linear estimation of the
deformations required for an optimal registration. Normalized images
were smoothed using an isotropic Gaussian kernel of 12 mm. The di-
mensions of the resulting voxel were 2 � 2 � 2 mm3. To take into
account the presence of severely hypoperfused regions in patients
with Alzheimer’s disease and patients with PCA, differences in global
cerebral activity were removed between subjects by scaling the voxel
values of each individual image to the cerebellar activity, and the
analyses performed with a grey matter threshold set at 40% of
whole brain mean activity (Nestor et al., 2003).
Statistical analysis of neuroimagingdataA first set of analyses was designed to define the brain perfusion
profile in the overall population of 39 patients with PCA. A second
set aimed to explore the relationship between the brain perfusion and
neuropsychological scores, especially the scores pertaining to
visuospatial functions.
Brain perfusion profile in posterior cortical atrophy andAlzheimer’s disease
The first analysis was designed to compare the extent of hypoperfused
brain regions in the group with PCA with the healthy controls, using
a two-sample t-test. Then, the group with PCA was compared with
the Alzheimer’s disease age-matched group to investigate regions of
hypoperfusion common to Alzheimer’s disease and PCA and those
specific to PCA. Second, to explore the natural progression of PCA,
brain hypoperfusion was evaluated in patients with PCA at different
stages of the disease by comparing the groups with very short, short
and long disease duration and healthy control groups two by two,
using a two-sample t-test. We also correlated brain perfusion with
the duration of symptoms, measured in years.
All Statistical Parametric Mapping T-maps were obtained using a
statistical significance threshold of P5 0.001, corrected for multiple
tests using the False Discovery Rate method. To decrease the risk of
false positive results, clusters of 5100 voxels were not considered.
Age was entered as a nuisance variable. The Montreal Neurological
Institute coordinates were converted into Talairach coordinates using
WFU PickAtlas software (http://www.fmri.wfubmc.edu/download
.htm). Further analyses using anatomical volumes of interest obtained
from the AAL software (Tzourio-Mazoyer et al., 2002) were also
performed to study between-group differences in brain perfusion.
Comparisons between the groups were performed with a Mann–
Whitney test. Volumes of interest were also used to calculate
asymmetry indexes between left (L) and right (R) cortical perfusion
as follows: (L � R) � 200%/(L + R).
Brain perfusion correlation with neuropsychologicalscores in posterior cortical atrophy
Voxel-based correlations were studied independently of age, educa-
tional level and MMSE, except for constructive apraxia and mental
calculation scores. For the latter, MMSE was not set as a nuisance
variable because it evaluates constructive praxis and mental calculation
per se. T-maps were obtained at a height threshold of P5 0.005
uncorrected, which is an accepted procedure in correlation analyses
considering the number of subjects (Desgranges et al., 1998). The
minimal cluster size was set at 100 voxels. Individual adjusted normal-
ized regional activities values were extracted from the eligible clusters
4 | Brain 2011: Page 4 of 15 A. Kas et al.
by guest on April 9, 2011
brain.oxfordjournals.orgD
ownloaded from

to calculate correlation coefficients using MarsBaR software (Brett,
2002).
Results
Clinical and cognitive characteristicsof the posterior cortical atrophy cohortThe clinical and cognitive characteristics of this population are
detailed in Tables 1 and 3. The mean disease duration at the
time of SPECT was 3.8 � 2.1 years (0.6–12.6 years).
Comparison between posterior cortical atrophy,Alzheimer’s disease and control groups
The group with PCA was younger than the control group (U-test,
P5 0.001) but did not differ in educational level or gender
distribution. The groups with PCA and Alzheimer’s disease were
similar for age and MMSE scores, duration of disease and age of
onset (U-test, all P40.5). Performances on the episodic verbal
memory test were significantly higher in the PCA than the
Alzheimer’s disease group: free recall was 16.6 � 8.6 for patients
with PCA and 11.1 � 7.1 for patients with Alzheimer’s disease;
total recall (free + cued recall) was 35.5 � 11.2 for patients with
PCA and 28.2 � 9.7 for patients with Alzheimer’s disease (U-test,
all P = 0.05).
Cognitive characteristics of patients with posterior cor-tical atrophy
The most frequent neurological signs were working memory
impairment (100%), with visual memory more impaired than the
verbal modality; limb apraxia (95%) and simultanagnosia (92%).
Overall, 31% of patients presented a complete Balint’s syndrome
and 36% had a complete Gerstmann’s syndrome. Others findings
included visual agnosia and aphasia, predominantly characterized
by reading and writing deficits (Table 3).
Comparison between short and long disease durationposterior cortical atrophy
No significant differences in demographics, neurological symptoms
or neuropsychological performances were observed between
groups with short and long disease duration PCA
(Supplementary Table 1).
Single photon emission computedtomography analysis
Comparison between patients with posterior corticalatrophy, patients with Alzheimer’s disease and controlsubjects
Comparing the group with PCA to the healthy controls revealed
extensive and severe hypoperfusion in the parietooccipitotemporal
cortex and the middle and posterior cingulum, and involvement of
the bilateral pulvinar (P50.001 corrected) (Fig. 1 and Table 4).
The distribution of the hypoperfusion over the posterior cortex
was bilateral and symmetrical, with the most severe decrease in
Table 3 Neurological characteristics andneuropsychological scores of patients with PCA
Neurological symptoms Number of affected subjects (%)
Working memory deficit 39 100
Visual symptoms
Simultanagnosia 36 92
Optic ataxia 19 49
Ocular apraxia 15 38
Complete Balint’s syndrome 12 31
Limb apraxia 37 95
Gerstman’s syndrome
Agraphia 28 72
Acalculia 25 64
Digital agnosia 20 51
Right–left indistinction 20 51
Complete Gerstmann’ssyndrome
14 36
Aphasia 21 54
Alexia 14 36
Neuropsychological tests(maximal score)
Mean score � SD Range
Global cognitive efficiency
MMSE (30) 18.2 � 5.3 6–27
Time and spatial orientation (10) 7.1 � 2.3 2–10
Executive functions
Frontal assessment battery (18) 10.4 � 3.7 3–17
Verbal episodic memory (FCSRT)
Immediate recall (16) 10.3 � 4.2 1–16
Total free recall (48) 16.6 � 8.6 2–36
Total free and cued recall (48) 35.5 � 11.2 9–48
Working memory
Direct and backward verbal span 7.2 � 1.7 3–10
Direct and backward visual span 3.8 � 2.3 0–8
Total verbal and visual spans 11 � 3.6 3–17
Language
Categorial fluency 8.7 � 5.13 2–20
Letter fluency 5.9 � 4.6 0–13
Pictures naming (12) 10 � 1.58 8–12
Visuo-constructive function
Rey copya (36) 17.2 � 12.5 4–35
Limb apraxia
Imitation of meaninglessgestures (20)
10.4 � 4.3 4–18
Pantomime of familial gestures onverbal command (12)
9.6 � 2.7 4–12
Gerstmann’s syndrome (65) 47.7 � 13.5 18–63
Right–left indistinction (24) 20.6 � 3.9 11–24
Agraphia (11) 6.6 � 4 0–11
Digital Agnosia (10) 7.4 � 2.8 1–10
Acalculia (20) 13.3 � 5.6 1–20
Balint’s syndrome (37) 24.7 � 8.7 2–36
Optic ataxia (8) 5 � 2.8 0–8
Simultanagnosia (25) 15.9 � 6.9 2–23
Ocular apraxia (4) 3.3 � 1.1 0–4
a Data were available for 12/39 patients because 27 patients could not or refusedto perform the test due to the severity of visual impairment.FCRT = Free and Cued Selective Reminding Test; SD = standard deviation.
Cognitive and SPECT profiles in PCA Brain 2011: Page 5 of 15 | 5
by guest on April 9, 2011
brain.oxfordjournals.orgD
ownloaded from
the inferior parietal cortex [Brodmann area (BA) 40]. The frontal
cortex was also hypoperfused, with a cluster running along the
middle and superior frontal gyri (from BA 6 and 8 to BA 9),
including the bilateral frontal eyes fields (BA 6/8) and spreading
to the opercular part of the left frontal cortex (BA 44). At
P5 0.05 corrected, the T-map revealed a hypoperfusion of the
bilateral hippocampus. These results were confirmed by the
volumes of interest analysis (Supplementary Fig. 1). The calcula-
tion of asymmetry indexes showed that occipital and parietal
hypoperfusions were prominent on the right side in 19 patients
and on the left side in 17 patients, and were symmetrical in three
patients.
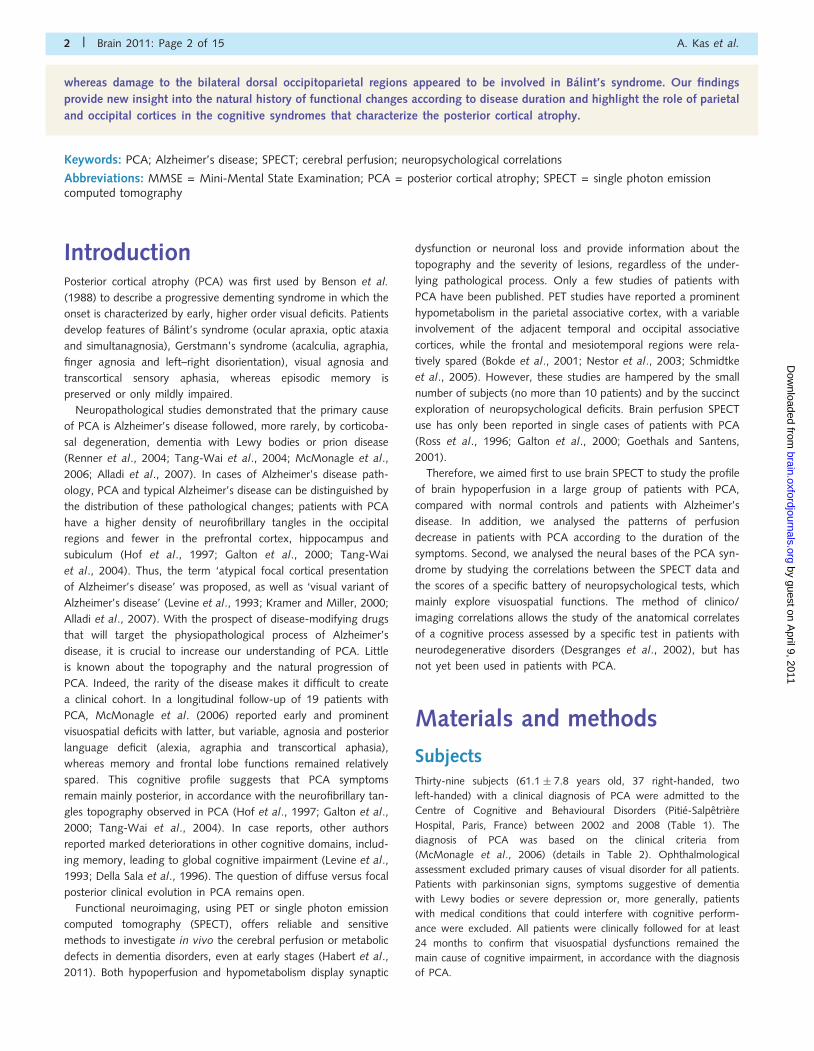
Figure 1 Comparisons of brain perfusion among patients with PCA, patients with Alzheimer’s disease (AD) and controls, using Statistical
Parametric Mapping. (Top) Z-score hypoperfusion maps of patients with PCA compared with controls. The maps were projected onto a
surface rendering and axial views of the customized MRI template. Axial slices are shown in accordance with radiological convention (right
is left). The group with PCA showed an extensive and symmetrical hypoperfusion in the occipital, parietal and posterior temporal cortices
(P50.001 false discovery rate corrected). (Middle) Z-score hypoperfusion maps of patients with Alzheimer’s disease compared with
controls. Patients with Alzheimer’s disease showed extensive hypoperfusion throughout the posterior associative cortex, as well as in the
prefrontal cortex and the bilateral hippocampus (P50.001 false discovery rate corrected). (Bottom) Z-score hypoperfusion maps of
patients with PCA compared with patients with Alzheimer’s disease. The maps were projected onto surface rendering and axial views of
the customized MRI template. The hypoperfusion in the parieto-occipital cortex was more severe in patients with PCA than in patients
with Alzheimer’s disease (blue, P5 0.05 corrected). Conversely, significantly higher perfusion (red) was observed in the frontal, anterior
cingulate, inferior and medial temporal regions of patients with PCA compared with patients with Alzheimer’s disease. Axial slices are
shown in accordance with radiological convention.
6 | Brain 2011: Page 6 of 15 A. Kas et al.
by guest on April 9, 2011
brain.oxfordjournals.orgD
ownloaded from

Compared with controls, patients with Alzheimer’s disease
showed extensive hypoperfusion throughout the bilateral temporo-
parietooccipital cortex, including the posterior cingulate and the
precuneus, and extending to the dorsolateral prefrontal cortex.
Bilateral hippocampal gyri were significantly hypoperfused
(P50.001 corrected).
Comparison between patients with posterior corticalatrophy and patients with Alzheimer’s disease
To allow broad visualization of the regional perfusion differences
between patients with PCA and patients with Alzheimer’s disease,
results were displayed on T-maps thresholded at P50.05, cor-
rected. Compared with the Alzheimer’s disease group, the group
with PCA had significantly decreased perfusion in the associative
posterior cortex (Fig. 1 and Table 4). The hypoperfused regions
were mainly on the left-side, and they extended along the dorsal
visual associative cortex (dorsal BA 18/19) to the superior parietal
lobe (BA 7), the precuneus, the median occipital cortex and the
middle cingulum. The T-maps revealed hypoperfusion in the bilat-
eral temporal cortex (BA 37/21) and the occipitotemporal junction
(BA 19/39). Conversely, the patients with Alzheimer’s disease
showed much more hypoperfusion in the bilateral dorsolateral
(BA 46/45/10), ventrolateral and orbital (BA 47/11) prefrontal
cortices, the mesial prefrontal and anterior cingulate cortices,
the anterior temporal cortex and the hippocampus (Fig. 1 and
Table 4). Similar results were obtained with volumes of interest
analyses (Supplementary Fig. 1).
Comparison between very short, short and long diseaseduration and control subjects
When compared with controls, the very short disease duration
subgroup showed a bilateral hypoperfusion in the posterior asso-
ciative cortex, more prominent in the left inferior parietal cortex
and the precuneus (P50.001 corrected; Fig. 2). It extended to
the dorsal occipital cortex, the posterior cingulum and the left
superior frontal cortex (BA 6). Compared with controls, the
patients with short disease duration PCA had extensive and
severe hypoperfusion in the bilateral posterior cortex (parietal,
inferior and median occipital cortex and left posterior temporal
cortex) and the middle and posterior cingulum. There was also
involvement of the bilateral superior frontal cortex (BA 6), includ-
ing the frontal eyes fields (x = �24, y = 2.5, z = 51 mm in the
Talairach atlas). Finally, compared with controls, the patients
with long disease duration PCA had more symmetrical hypoperfu-
sion throughout the parietal, occipital and posterior temporal cor-
tices. Despite the extension to the cingulate cortex, the anterior
cingulum remained unaffected. Hypoperfusion of the bilateral
frontal superior cortex (BA 6) was observed. No statistically sig-
nificant difference in cortical perfusion was found among PCA
subgroups. A significant negative correlation was found in the
whole group with PCA, between the disease duration and the
perfusion of the bilateral inferior parietal cortex, the bilateral tem-
porooccipital junction and the right inferior occipital gyrus
(P5 0.005).
Correlation between brain perfusion andneuropsychological scores in posterior cortical atrophy
Table 5 shows the significant positive correlations (P50.005)
between perfusion and cognitive profile. Correlations were found
between visual working memory scores and the perfusion of pre-
cuneus (Fig. 3), and between the limb apraxia scores and the
perfusion of the left angular gyrus and precuneus (Fig. 4).
The Balint scores were correlated to perfusion in the dorsal
regions of the parietal and occipital lobes, the precuneus and
the cuneus, with right predominance. Both ocular apraxia and
optic ataxia were primarily related to hypoperfusion of the bilateral
superior parietal cortex and the right precuneus. Right superior
occipital cortex involvement was also detected with optic ataxia.
Table 4 SPM results for patients with PCA compared with controls and patients with Alzheimer’s disease
Cluster-level Coordinates (mm) Location
Pcorrected KE Puncorrected T x y z
PCA minus controls
0.000 111 735 0.000 11.30 �34 48 56 Left inferior parietal lobule (BA 40)
10.95 �26 �55 58 Left superior parietal lobule (BA 7)
10.77 34 �44 48 Right inferior parietal lobule (BA 40)
Alzheimer’s disease minus controls
0.000 92 521 0.000 7.34 �34 �43 �2 Left hippocampus
7.31 36 �46 48 Right inferior parietal lobule (BA 40)
7.27 32 �31 �5 Right hippocampus
PCA minus Alzheimer’s disease
0.000 28 441 0.000 6.34 �30 �82 22 Left middle occipital gyrus (BA 19)
6.09 �26 �58 �0.4 Left lingual gyrus (BA 19)
5.91 �22 �72 39 Left precuneus (BA 7)
Alzheimer’s disease minus PCA
0.000 33 597 0.000 6.23 12 48 �6 Right anterior cingulate (BA 32)
6.16 2 52 �20 Right orbital gyrus (BA 11)
5.98 18 68 �5 Right superior frontal gyrus (BA 10)
Coordinates are in millimetres relative to the anterior commissure, corresponding to the atlas of Talairach and Tournoux. Statistical maps were thresholded for significance atP5 0.001, false discovery rate corrected with a cluster extent of 100 voxels. KE = number of voxels per cluster.
Cognitive and SPECT profiles in PCA Brain 2011: Page 7 of 15 | 7
by guest on April 9, 2011
brain.oxfordjournals.orgD
ownloaded from

Simultanagnosia was mostly related to the lateral occipital cortex
(the bilateral middle and inferior occipital gyrus and right superior
occipital cortex), with an extension toward the right cuneus, the
precuneus and the temporooccipital junction (Fig. 5).
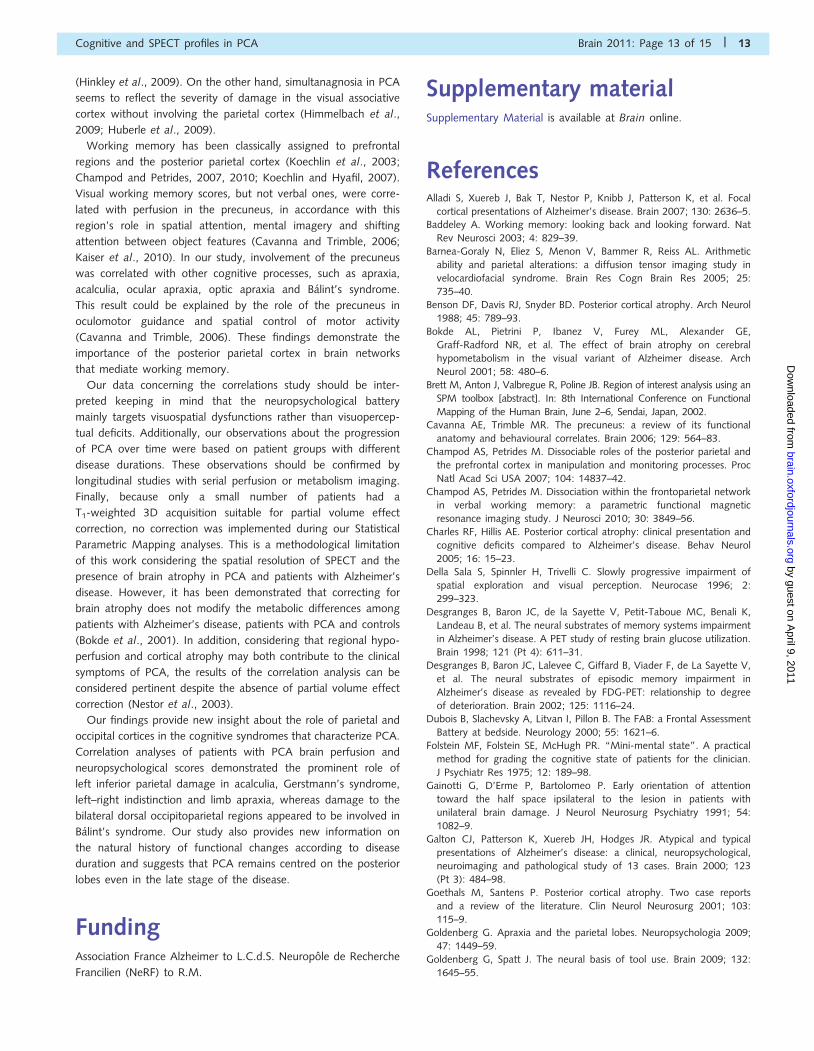
We found a significant relationship between the Gertsmann
scores and parietal hypoperfusion confined to the left angular
cortex. Right–left confusion scores were also correlated with left
angular perfusion and the middle temporal cortex. Positive correl-
ations with acalculia scores were found in larger areas: (i) the
largest cluster mostly covered the left angular cortex and extended
to the supramarginal cortex; (ii) the left precuneus, with an exten-
sion to the middle cingulum; and (iii) the posterior part of the left
middle temporal cortex. These clusters were still significant at
P5 0.05 corrected (Fig. 6).
No significant correlation was observed among digital agnosia,
agraphia or verbal working memory scores.
DiscussionThis study investigated the clinical, cognitive and functional
neuroimaging features in a large cohort of 39 patients with PCA.
The perfusion profile was characterized by extensive and severe
hypoperfusion in the lateral and medial parietooccipitotemporal
cortices. Interestingly, the hypoperfusion remained focused on
the posterior regions even at the late stage of the disease.
Strong correlations were found between specific neuropsycho-
logical battery scores and posterior cortical hypoperfusion.
The clinical features of the 39 patients with PCA were similar to
those of previously described cohorts of PCA. A large proportion
of patients (85%) had an onset before the age of 65 years
(Mendez et al., 2002; Tang-Wai et al., 2004; McMonagle
et al., 2006; Whitwell et al., 2007; Lehmann et al., 2009).
The most common symptoms were limb apraxia (95%), simulta-
nagnosia (92%), agraphia (72%) and elements of Balint’s and/or
Gerstmann’s syndromes, while a full syndrome was observed in a
third of the patients (Renner et al., 2004; Tang-Wai et al., 2004;
McMonagle et al., 2006). Interestingly, working memory
impairment (visuospatial, rather than verbal) was a consistent
sign, whereas episodic memory deficit was only mild and always
overshadowed by visuospatial dysfunction.
Single photon emission computedtomography perfusion profile inposterior cortical atrophyWe found extensive hypoperfusion of the bilateral posterior
cortex, most prominent in the lateral and medial parietooccipital
regions but extending to the posterior temporal cortex, the middle
Figure 2 Brain hypoperfusion according to PCA duration. Z-score hypoperfusion maps of controls compared with subgroups with PCA
with 53 years or 43 years disease duration, projected onto surface rendering of the MRI template. A third subgroup with very short
disease duration (42 years) was also identified. Early hypoperfusions involved the parietal cortex (particularly the precuneus and the
inferior parietal cortex), the dorsal occipital regions, the middle and posterior cingulum and the left superior frontal cortex (P5 0.001
corrected). After 3 years of duration, the hypoperfusion involved the whole parietal and occipital cortices, the posterior temporal cortex
and the bilateral frontal superior cortex (BA 6).
8 | Brain 2011: Page 8 of 15 A. Kas et al.
by guest on April 9, 2011
brain.oxfordjournals.orgD
ownloaded from

and the posterior cingulum and the bilateral pulvinar, in agree-
ment with previous PET studies (Bokde et al., 2001; Nestor
et al., 2003; Schmidtke et al., 2005). In addition, we found
hypoperfusion in the superior frontal cortex, especially the frontal
eyes field areas, even at the early stage of the disease (Nestor
et al., 2003; Schmidtke et al., 2005; Whitwell et al., 2007). The
frontal eyes fields are known to be involved in the generation of
voluntary eye movements (Nestor et al., 2003; Schmidtke et al.,
2005; Whitwell et al., 2007). The deafferentation process, caused
by the Wallerian degeneration of projecting fibres from posterior
visual association areas, is a likely explanation for this phenom-
enon. Functional imaging studies using various paradigms to
investigate saccadic eye movements in healthy volunteers have
found associated activations in both the dorsal stream (BA 19
and BA 7) and frontal eyes fields (Kimmig et al., 2001, 2008;
Nagel et al., 2006). In line with this hypothesis, early in the
course of disease, we observed frontal involvement on the side
with the greatest parietooccipital hypoperfusion. The frontal hypo-
perfusion became bilateral in later stages of the disease, when
posterior hypoperfusion became severe and symmetrical.
Compared with patients with Alzheimer’s disease, patients with
PCA showed more severe hypoperfusion in the occipitoparietal
regions, in accordance with MRI studies assessing regional cortical
atrophy (Whitwell et al., 2007; Lehmann et al., 2009; Migliaccio
et al., 2009). Additionally, the hypoperfusion was more severe in
the parietooccipital cortex than the temporooccipital cortex, con-
sistent with the hypothesis that damage in the dorsal visual stream
could distinguish PCA from Alzheimer’s disease, whereas damage
Table 5 Coordinates of significant cluster maxima for the positive correlations between perfusion and neuropsychologicalscores and negative correlations with disease duration in the group with PCA
Anatomical regions Brodmannarea
Coordinatesx y z (mm)
Z-scores(n voxels)
Correlation coefficient,(P-value)
Correlations with visuospatial working memory score
Left precuneus 5/7 �8 �37 48 3.46 (530) 0.56 (50.005)
Correlations with limb apraxia score
Left angular gyrus 39 �57 �60 36 3.72 (1734) 0.60 (50.001)
Left precuneus 7 �10 �40 50 3.28 (251) 0.58 (50.01)
Correlations with acalculia score
Left angular gyrus 39 �53 �41 1 3.87 (1121) 0.63 (50.001)
Left precuneus/middle cingulum 7/31 �10 �41 43 3.73 (529) 0.48 (50.05)
Left middle temporal gyrus 21 �42 �60 45 3.93 (451) 0.53 (50.01)
Correlations with right–left confusion score
Left angular gyrus 7 �38 �65 51 3.19 (136) 0.56 (50.01)
Left middle temporal gyrus 37/21 �65 �58 5 3.56 (134) 0.63 (50.001)
Left superior frontal gyrus 8 �14 49 43 3.42 (120) 0.63 (50.01)
Correlations with Gerstmann’s score
Left angular gyrus 39 �48 �62 42 3.04 (342) 0.57 (50.01)
Correlations with ocular apraxia score
Left superior parietal lobule 7 �30 �55 69 3.86 (102) 0.65 (50.001)
Right precentral gyrus 6 24 �17 65 3.28 (107) 0.61 (50.001)
Right precuneus 7 6 �55 64 2.94 (210) 0.60 (50.001)
Correlations with simultanagnosia score
Right inferior occipital gyrus/middle occipital gyrus 18 36 �82 �3 3.34 (2570) 0.55 (50.01)
Left middle occipital gyrus 18 �34 �83 4 3.18 (407) 0.53 (50.01)
Correlations with optic ataxia score
Right precuneus 7 8 �53 62 4.06 (597) 0.64 (50.001)
Left superior parietal lobule 5/7 �30 �39 66 3.74 (469) 0.61 (50.001)
Right superior occipital gyrus 19 30 �78 37 3.31 (506) 0.57 (50.01)
Correlations with Balint’s score
Right precuneus/superior parietal lobule 7 8 �53 62 3.52 (378) 0.62 (50.001)
Right cuneus 18 14 �103 7 3.57 (277) 0.51 (50.01)
Left superior parietal lobule 7 �30 �53 69 3.02 (130) 0.59 (50.01)
Right precentral gyrus 6 22 �18 74 3.14 (116) 0.57 (50.01)
Right superior occipital gyrus 19 24 �74 31 2.88 (346) 0.51 (50.01)
Right fusiform gyrus 19 34 �62 �4 2.82 (103) 0.43 (50.05)
Correlations with disease duration (years)
Right supramarginalis gyrus 40 55 �53 34 3.47 (1803) �0.48 (50.005)
Left angular gyrus 39 �51 �66 35 3.29 (154) �0.38 (50.05)
Left middle temporal gyrus 37 �42 �52 10 3.21 (1355) �0.42 (50.01)
Right inferior occipital gyrus 18 30 �86 �11 3.00 (115) �0.46 (50.005)
Coordinates are in millimetres relative to the anterior commissure, corresponding to the Talairach atlas. Statistical maps were thresholded for significance at P50.005, witha cluster extent of 100 voxels.
Cognitive and SPECT profiles in PCA Brain 2011: Page 9 of 15 | 9
by guest on April 9, 2011
brain.oxfordjournals.orgD
ownloaded from
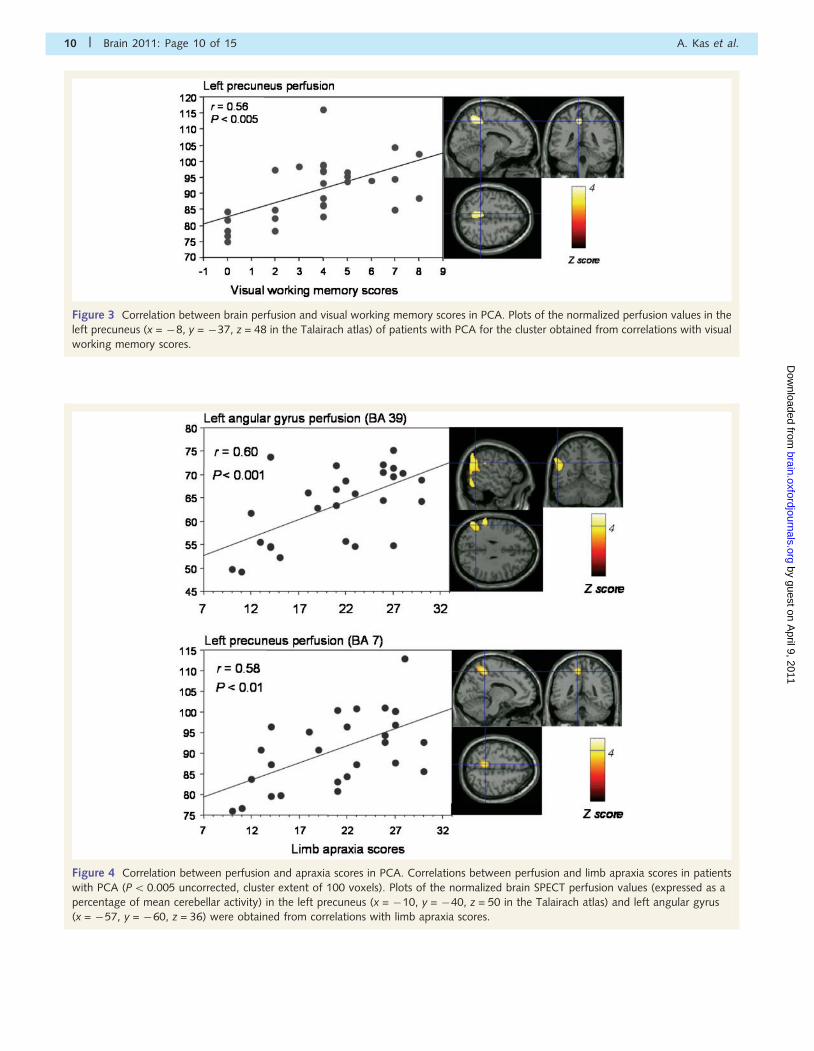
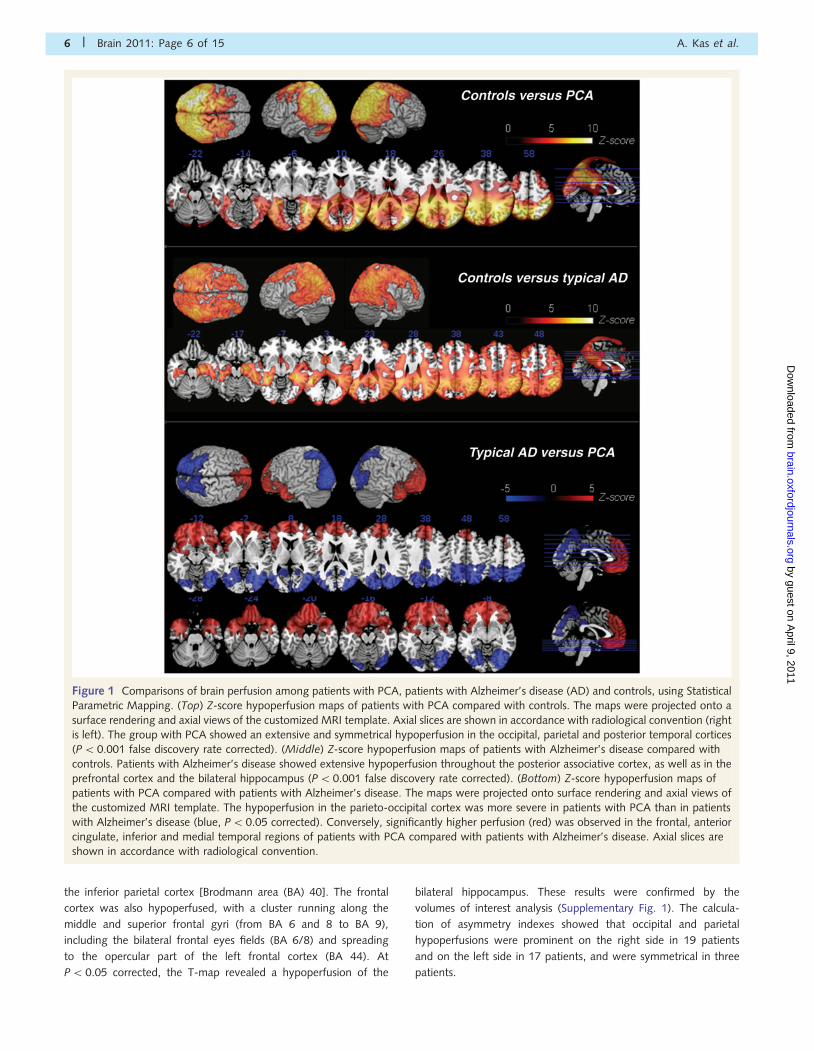
Figure 3 Correlation between brain perfusion and visual working memory scores in PCA. Plots of the normalized perfusion values in the
left precuneus (x = �8, y = �37, z = 48 in the Talairach atlas) of patients with PCA for the cluster obtained from correlations with visual
working memory scores.
Figure 4 Correlation between perfusion and apraxia scores in PCA. Correlations between perfusion and limb apraxia scores in patients
with PCA (P5 0.005 uncorrected, cluster extent of 100 voxels). Plots of the normalized brain SPECT perfusion values (expressed as a
percentage of mean cerebellar activity) in the left precuneus (x = �10, y = �40, z = 50 in the Talairach atlas) and left angular gyrus
(x = �57, y = �60, z = 36) were obtained from correlations with limb apraxia scores.
10 | Brain 2011: Page 10 of 15 A. Kas et al.
by guest on April 9, 2011
brain.oxfordjournals.orgD
ownloaded from
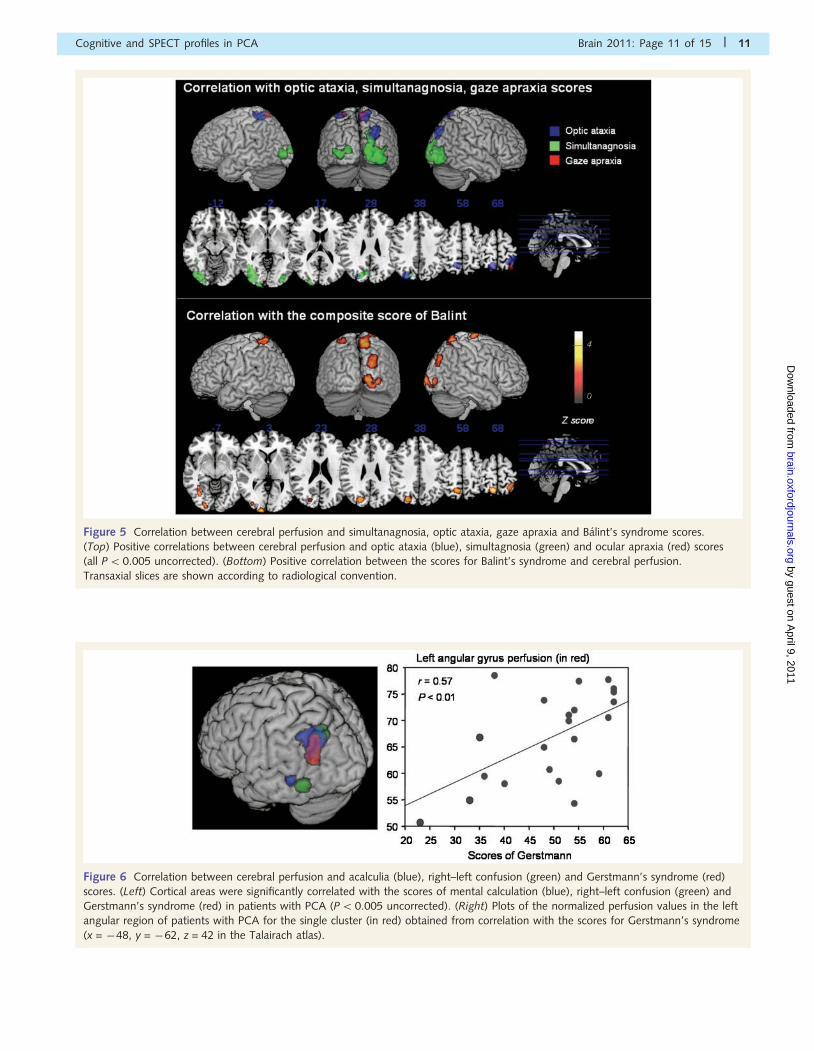
Figure 5 Correlation between cerebral perfusion and simultanagnosia, optic ataxia, gaze apraxia and Balint’s syndrome scores.
(Top) Positive correlations between cerebral perfusion and optic ataxia (blue), simultagnosia (green) and ocular apraxia (red) scores
(all P5 0.005 uncorrected). (Bottom) Positive correlation between the scores for Balint’s syndrome and cerebral perfusion.
Transaxial slices are shown according to radiological convention.
Figure 6 Correlation between cerebral perfusion and acalculia (blue), right–left confusion (green) and Gerstmann’s syndrome (red)
scores. (Left) Cortical areas were significantly correlated with the scores of mental calculation (blue), right–left confusion (green) and
Gerstmann’s syndrome (red) in patients with PCA (P50.005 uncorrected). (Right) Plots of the normalized perfusion values in the left
angular region of patients with PCA for the single cluster (in red) obtained from correlation with the scores for Gerstmann’s syndrome
(x = �48, y = �62, z = 42 in the Talairach atlas).
Cognitive and SPECT profiles in PCA Brain 2011: Page 11 of 15 | 11
by guest on April 9, 2011
brain.oxfordjournals.orgD
ownloaded from

in the inferior parietal lobule was common to both conditions
(Charles and Hillis, 2005; McMonagle et al., 2006). The group
with PCA showed significantly higher perfusion in mesiotemporal
and anterior prefrontal regions, especially the orbitofrontal cortex,
than the patients with Alzheimer’s disease. This finding is consist-
ent with the relative preservation of episodic memory (Charles and
Hillis, 2005; McMonagle et al., 2006) and insight (Schmitz et al.,
2006; Rosen et al. 2010) at the initial and intermediate stages
of PCA.
Little is known about the natural progression of the degenera-
tive process in PCA. When considering the disease duration, the
most severe hypoperfusion was observed in the dorsal parietal
cortex in the disease’s early stage, while temporooccipital hypo-
perfusion appeared later. This result is in agreement with the only
clinical longitudinal study of patients with PCA (n = 19 patients),
which showed early visuospatial deficits with later visual agnosia
and alexia (McMonagle et al., 2006). These results suggest that
PCA remains a focal posterior disorder. Given that the most
frequent underlying pathology found in autopsy studies is
Alzheimer’s disease (Tang-Wai et al., 2004; Alladi et al., 2007),
we expected to find a more widespread progression of cortical
hypoperfusion. On the contrary, our findings showed that both
the topography and the progression of cortical hypoperfusions
differ between the two diseases. However, our results were ob-
tained from a cross-sectional study, and therefore, any conclusions
about the patterns of progression should be drawn with caution.
Moreover, the majority of patients from the group with long
disease duration PCA had a mean disease duration of 5 years,
which may not be long enough to observe more global patterns
of hypoperfusion. To verify this point, an individual analysis of the
two patients with the longest disease durations (8 and 12.6 years)
showed that hypoperfusion mainly remained predominant in the
posterior regions (Supplementary Fig. 2). Future studies are
needed to clarify this observation.
Anatomical correlates of posteriorcortical atrophy syndromeWe also aimed to understand the neural basis of the major cog-
nitive symptoms by studying the correlations between cognitive
scores and hypoperfusion areas.
Limb apraxia was one of the most common features in our
sample and the limb apraxia scores were mainly correlated with
the perfusion of the left posterior parietal cortex. The left lateral-
ization is consistent with other studies, supporting the theory
that the left hemisphere specializes in generating movement
(Moll et al., 2000; Tessari et al., 2007; Goldenberg, 2009;
Goldenberg and Spatt, 2009). Moreover, recent studies have
shown that apraxia is associated with damage to a network of
brain regions, including the parietal cortex, the superior posterior
temporal cortex and the white matter bundles connecting the
frontal and parietal association areas (Johnson-Frey et al., 2005;
Zadikoff and Lang, 2005; Tessari et al., 2007; Weiss et al., 2008;
Ramayya et al., 2010). In our study, the apraxia scores pooled the
imitation of meaningless and meaningful gestures and pantomimes
of familiar gestures and were highly correlated with the left
angular gyrus, suggesting that this region plays a crucial role in
integrating praxis information, meaningless action imitation,
meaningful action imitation and pantomime (Tessari et al., 2007;
Weiss et al., 2008; Goldenberg and Spatt, 2009).
The Gerstmann score and its components (except digital
agnosia) were significantly correlated with the perfusion of the
left parietal lobe, especially the left angular gyrus. This finding is
in accordance with neuropsychological studies conducted in
patients undergoing open brain surgery, which showed a relation-
ship between Gerstmann’s syndrome elements and the left parietal
cortex (Rusconi et al., 2010). It is of note that these regions
overlap with cortical sites where electrical stimulation elicited
elements of Gerstmann’s syndrome (Rusconi et al., 2010).
Among the symptoms of Gerstmann’s syndrome, mental arithmet-
ic is the most studied in the literature. Most of these data were
obtained in patients with focal lesions or in experimental tasks in
healthy volunteers, but never in patients with PCA. In our study,
mental calculation scores were strongly correlated with perfusion
of the left angular and supramarginalis cortices, in agreement with
brain electrostimulation studies (Roux et al., 2003). In functional
MRI studies in normal volunteers, arithmetic processing was
mediated by left-hemisphere specialization of the anterior and
posterior parts of the intra-parietal sulcus (Zago et al., 2008).
Repetitive transcranial magnetic stimulation over the left angular
gyrus in healthy subjects disrupted tasks requiring number magni-
tude processing (Rusconi et al., 2005). The left posterior parietal
regions’ role in calculation is also supported by studies of patients
with acalculia (Martory et al., 2003) and with developmental
dyscalculia (Barnea-Goraly et al., 2005). Additionally, our study
showed a significant correlation between the perfusion of the
left parietal lobe (BA 39) and left–right distinction scores, consist-
ent with functional neuroimaging studies demonstrating the left
posterior parietal regions’ role in left–right orientation (Rusconi
et al., 2009, 2010). Finally, recent data obtained by combining
functional and structural neuroimaging of parietal lobe organiza-
tion in the healthy brain, suggest that pure Gerstmann’s syndrome
might arise from the disconnection, via lesion, of separate but
colocalized tracts in the subcortical parietal white matter
(Rusconi et al., 2010). The study of white matter connections in
patients with PCA would be of great interest in identifying the
underlying network involved in the disease.
The Balint’s score was correlated with the perfusion of areas
involving the superior parietal lobule, the superior occipital
cortex, the cuneus, the precuneus and the precentral cortex.
Within Balint’s syndrome, correlation patterns for ocular apraxia
and optic ataxia were distinct from those of simultanagnosia.
Within the framework of ventral- versus dorsal-route organization
of the visual system, optic ataxia and ocular apraxia can be inter-
preted as deficits involving the dorsal pathway, while simultanag-
nosia can be interpreted as a deficit involving mainly the higher
associative visual occipital areas. These results are in accordance
with the neural correlates of optic ataxia with superior parietal
lobule lesions, either unilateral or bilateral (Milner and Goodale,
1995; Trillenberg et al., 2007) and with recent functional MRI
studies showing that the dorsal stream (the lateral occipitoparietal
junction) was associated with orientation changes for graspable
stimuli (Rice et al., 2007) and visually guided reaching-to-grasp
12 | Brain 2011: Page 12 of 15 A. Kas et al.
by guest on April 9, 2011
brain.oxfordjournals.orgD
ownloaded from
(Hinkley et al., 2009). On the other hand, simultanagnosia in PCA
seems to reflect the severity of damage in the visual associative
cortex without involving the parietal cortex (Himmelbach et al.,
2009; Huberle et al., 2009).
Working memory has been classically assigned to prefrontal
regions and the posterior parietal cortex (Koechlin et al., 2003;
Champod and Petrides, 2007, 2010; Koechlin and Hyafil, 2007).
Visual working memory scores, but not verbal ones, were corre-
lated with perfusion in the precuneus, in accordance with this
region’s role in spatial attention, mental imagery and shifting
attention between object features (Cavanna and Trimble, 2006;
Kaiser et al., 2010). In our study, involvement of the precuneus
was correlated with other cognitive processes, such as apraxia,
acalculia, ocular apraxia, optic apraxia and Balint’s syndrome.
This result could be explained by the role of the precuneus in
oculomotor guidance and spatial control of motor activity
(Cavanna and Trimble, 2006). These findings demonstrate the
importance of the posterior parietal cortex in brain networks
that mediate working memory.
Our data concerning the correlations study should be inter-
preted keeping in mind that the neuropsychological battery
mainly targets visuospatial dysfunctions rather than visuopercep-
tual deficits. Additionally, our observations about the progression
of PCA over time were based on patient groups with different
disease durations. These observations should be confirmed by
longitudinal studies with serial perfusion or metabolism imaging.
Finally, because only a small number of patients had a
T1-weighted 3D acquisition suitable for partial volume effect
correction, no correction was implemented during our Statistical
Parametric Mapping analyses. This is a methodological limitation
of this work considering the spatial resolution of SPECT and the
presence of brain atrophy in PCA and patients with Alzheimer’s
disease. However, it has been demonstrated that correcting for
brain atrophy does not modify the metabolic differences among
patients with Alzheimer’s disease, patients with PCA and controls
(Bokde et al., 2001). In addition, considering that regional hypo-
perfusion and cortical atrophy may both contribute to the clinical
symptoms of PCA, the results of the correlation analysis can be
considered pertinent despite the absence of partial volume effect
correction (Nestor et al., 2003).
Our findings provide new insight about the role of parietal and
occipital cortices in the cognitive syndromes that characterize PCA.
Correlation analyses of patients with PCA brain perfusion and
neuropsychological scores demonstrated the prominent role of
left inferior parietal damage in acalculia, Gerstmann’s syndrome,
left–right indistinction and limb apraxia, whereas damage to the
bilateral dorsal occipitoparietal regions appeared to be involved in
Balint’s syndrome. Our study also provides new information on
the natural history of functional changes according to disease
duration and suggests that PCA remains centred on the posterior
lobes even in the late stage of the disease.
FundingAssociation France Alzheimer to L.C.d.S. Neuropole de Recherche
Francilien (NeRF) to R.M.
Supplementary materialSupplementary Material is available at Brain online.
ReferencesAlladi S, Xuereb J, Bak T, Nestor P, Knibb J, Patterson K, et al. Focal
cortical presentations of Alzheimer’s disease. Brain 2007; 130: 2636–5.Baddeley A. Working memory: looking back and looking forward. Nat
Rev Neurosci 2003; 4: 829–39.
Barnea-Goraly N, Eliez S, Menon V, Bammer R, Reiss AL. Arithmetic
ability and parietal alterations: a diffusion tensor imaging study in
velocardiofacial syndrome. Brain Res Cogn Brain Res 2005; 25:
735–40.Benson DF, Davis RJ, Snyder BD. Posterior cortical atrophy. Arch Neurol
1988; 45: 789–93.
Bokde AL, Pietrini P, Ibanez V, Furey ML, Alexander GE,
Graff-Radford NR, et al. The effect of brain atrophy on cerebral
hypometabolism in the visual variant of Alzheimer disease. Arch
Neurol 2001; 58: 480–6.
Brett M, Anton J, Valbregue R, Poline JB. Region of interest analysis using an
SPM toolbox [abstract]. In: 8th International Conference on Functional
Mapping of the Human Brain, June 2–6, Sendai, Japan, 2002.
Cavanna AE, Trimble MR. The precuneus: a review of its functional
anatomy and behavioural correlates. Brain 2006; 129: 564–83.
Champod AS, Petrides M. Dissociable roles of the posterior parietal and
the prefrontal cortex in manipulation and monitoring processes. Proc
Natl Acad Sci USA 2007; 104: 14837–42.
Champod AS, Petrides M. Dissociation within the frontoparietal network
in verbal working memory: a parametric functional magnetic
resonance imaging study. J Neurosci 2010; 30: 3849–56.
Charles RF, Hillis AE. Posterior cortical atrophy: clinical presentation and
cognitive deficits compared to Alzheimer’s disease. Behav Neurol
2005; 16: 15–23.Della Sala S, Spinnler H, Trivelli C. Slowly progressive impairment of
spatial exploration and visual perception. Neurocase 1996; 2:
299–323.
Desgranges B, Baron JC, de la Sayette V, Petit-Taboue MC, Benali K,
Landeau B, et al. The neural substrates of memory systems impairment
in Alzheimer’s disease. A PET study of resting brain glucose utilization.
Brain 1998; 121 (Pt 4): 611–31.
Desgranges B, Baron JC, Lalevee C, Giffard B, Viader F, de La Sayette V,
et al. The neural substrates of episodic memory impairment in
Alzheimer’s disease as revealed by FDG-PET: relationship to degree
of deterioration. Brain 2002; 125: 1116–24.Dubois B, Slachevsky A, Litvan I, Pillon B. The FAB: a Frontal Assessment
Battery at bedside. Neurology 2000; 55: 1621–6.
Folstein MF, Folstein SE, McHugh PR. “Mini-mental state”. A practical
method for grading the cognitive state of patients for the clinician.
J Psychiatr Res 1975; 12: 189–98.Gainotti G, D’Erme P, Bartolomeo P. Early orientation of attention
toward the half space ipsilateral to the lesion in patients with
unilateral brain damage. J Neurol Neurosurg Psychiatry 1991; 54:
1082–9.
Galton CJ, Patterson K, Xuereb JH, Hodges JR. Atypical and typical
presentations of Alzheimer’s disease: a clinical, neuropsychological,
neuroimaging and pathological study of 13 cases. Brain 2000; 123
(Pt 3): 484–98.
Goethals M, Santens P. Posterior cortical atrophy. Two case reports
and a review of the literature. Clin Neurol Neurosurg 2001; 103:
115–9.Goldenberg G. Apraxia and the parietal lobes. Neuropsychologia 2009;
47: 1449–59.
Goldenberg G, Spatt J. The neural basis of tool use. Brain 2009; 132:
1645–55.
Cognitive and SPECT profiles in PCA Brain 2011: Page 13 of 15 | 13
by guest on April 9, 2011
brain.oxfordjournals.orgD
ownloaded from

Goodglass HK, Kaplan E. The assessment of aphasia and related
disorders. Philadelphia, PA: Lea & Febiger; 1983.
Habert MO, Horn JF, Sarazin M, Lotterie JA, Puel M, Onen F, et al. Brain
perfusion SPECT with an automated quantitative tool can identify
prodromal Alzheimer’s disease among patients with mild cognitive
impairment. Neurobiol Aging 2011; 32: 15–23.
Himmelbach M, Erb M, Klockgether T, Moskau S, Karnath HO. fMRI of
global visual perception in simultanagnosia. Neuropsychologia 2009;
47: 1173–7.Hinkley LB, Krubitzer LA, Padberg J, Disbrow EA. Visual-manual
exploration and posterior parietal cortex in humans. J Neurophysiol
2009; 102: 3433–46.
Hof PR, Vogt BA, Bouras C, Morrison JH. Atypical form of Alzheimer’s
disease with prominent posterior cortical atrophy: a review of lesion
distribution and circuit disconnection in cortical visual pathways.
Vision Res 1997; 37: 3609–25.
Huberle E, Rupek P, Lappe M, Karnath HO. Perception of global gestalt
by temporal integration in simultanagnosia. Eur J Neurosci 2009; 29:
197–204.Johnson-Frey SH, Newman-Norlund R, Grafton ST. A distributed left
hemisphere network active during planning of everyday tool use
skills. Cereb Cortex 2005; 15: 681–95.
Kaiser S, Kopka ML, Rentrop M, Walther S, Kronmuller K, Olbrich R,
et al. Maintenance of real objects and their verbal designations in
working memory. Neurosci Lett 2010; 469: 65–9.
Kim EJ, Cho SS, Jeong Y, Park KC, Kang SJ, Kang E, et al. Glucose
metabolism in early onset versus late onset Alzheimer’s disease: an
SPM analysis of 120 patients. Brain 2005; 128: 1790–801.
Kimmig H, Greenlee MW, Gondan M, Schira M, Kassubek J, Mergner T.
Relationship between saccadic eye movements and cortical activity as
measured by fMRI: quantitative and qualitative aspects. Exp Brain Res
2001; 141: 184–94.
Kimmig H, Ohlendorf S, Speck O, Sprenger A, Rutschmann RM,
Haller S, et al. fMRI evidence for sensorimotor transformations in
human cortex during smooth pursuit eye movements.
Neuropsychologia 2008; 46: 2203–13.
Koechlin E, Hyafil A. Anterior prefrontal function and the limits of human
decision-making. Science 2007; 318: 594–8.
Koechlin E, Ody C, Kouneiher F. The architecture of cognitive control in
the human prefrontal cortex. Science 2003; 302: 1181–5.
Kramer JH, Miller BL. Alzheimer’s disease and its focal variants. Semin
Neurol 2000; 20: 447–54.
Kremin H, Perrier D, De Wilde M. DENO-100-Paradigme experimental et
test clinique de denomination controlee: effet relatif de 7 variables
experimentales sur les performances de 16 sujets atteints de maladies
degeneratives. Rev Neuropsychol 1999; 9: 439–40.
Le Ber I, Guedj E, Gabelle A, Verpillat P, Volteau M, Thomas-Anterion C,
et al. Demographic, neurological and behavioural characteristics and
brain perfusion SPECT in frontal variant of frontotemporal dementia.
Brain 2006; 129: 3051–65.
Lehmann M, Crutch SJ, Ridgway GR, Ridha BH, Barnes J,
Warrington EK, et al. Cortical thickness and voxel-based morphometry
in posterior cortical atrophy and typical Alzheimer’s disease. Neurobiol
Aging 2009, doi:10.1016/j.neurobiolaging.2009.08.017.
Levine DN, Lee JM, Fisher CM. The visual variant of Alzheimer’s disease:
a clinicopathologic case study. Neurology 1993; 43: 305–13.
Liberman J, Stewart W, Seines O, Gordon B. Rater agreement for
the Rey-Osterrieth Complex Figure Test. J Clin Psychol 1994; 50:
615–24.
Marshall GA, Fairbanks LA, Tekin S, Vinters HV, Cummings JL.
Early-onset Alzheimer’s disease is associated with greater pathologic
burden. J Geriatr Psychiatry Neurol 2007; 20: 29–33.
Martory MD, Mayer E, Pegna AJ, Annoni JM, Landis T, Khateb A. Pure
global acalculia following a left subangular lesion. Neurocase 2003; 9:
319–28.McKhann G, Drachman D, Folstein M, Katzman R, Price D, Stadlan EM.
Clinical diagnosis of Alzheimer’s disease: report of the
NINCDS-ADRDA Work Group under the auspices of Department of
Health and Human Services Task Force on Alzheimer’s Disease.
Neurology 1984; 34: 939–44.
McMonagle P, Deering F, Berliner Y, Kertesz A. The cognitive profile of
posterior cortical atrophy. Neurology 2006; 66: 331–8.
Mendez MF, Ghajarania M, Perryman KM. Posterior cortical atrophy:
clinical characteristics and differences compared to Alzheimer’s disease.
Dement Geriatr Cogn Disord 2002; 14: 33–40.
Migliaccio R, Agosta F, Rascovsky K, Karydas A, Bonasera S,
Rabinovici GD, et al. Clinical syndromes associated with posterior
atrophy: early age at onset AD spectrum. Neurology 2009; 73:
1571–8.
Milner AD, Goodale MA. The Visual Brain in Action. Oxford: Oxford
University Press; 1995.
Moll J, de Oliveira-Souza R, Passman LJ, Cunha FC, Souza-Lima F,
Andreiuolo PA. Functional MRI correlates of real and imagined
tool-use pantomimes. Neurology 2000; 54: 1331–6.
Nagel M, Sprenger A, Zapf S, Erdmann C, Kompf D, Heide W, et al.
Parametric modulation of cortical activation during smooth pursuit
with and without target blanking. An fMRI study. Neuroimage
2006; 29: 1319–25.
Nestor PJ, Caine D, Fryer TD, Clarke J, Hodges JR. The topography of
metabolic deficits in posterior cortical atrophy (the visual variant of
Alzheimer’s disease) with FDG-PET. J Neurol Neurosurg Psychiatry
2003; 74: 1521–9.
Peigneux P, Van der Linden M. Presentation d’une batterie neuro-
psychologique et cognitive pour l’evaluation de l’apraxie gestuelle.
Revue de Neuropsychologie 2000; 10: 311–62.
Ramayya AG, Glasser MF, Rilling JK. A DTI investigation of neural sub-
strates supporting tool use. Cereb Cortex 2010; 20: 507–16.Renner JA, Burns JM, Hou CE, McKeel DW Jr, Storandt M, Morris JC.
Progressive posterior cortical dysfunction: a clinicopathologic series.
Neurology 2004; 63: 1175–80.
Rice NJ, Valyear KF, Goodale MA, Milner AD, Culham JC. Orientation
sensitivity to graspable objects: an fMRI adaptation study. Neuroimage
2007; 36 (Suppl 2): T87–93.
Rosen HJ, Alcantar O, Rothlind J, Sturm V, Kramer JH, Weiner M, et al.
Neuroanatomical correlates of cognitive self-appraisal in neurodegen-
erative disease. Neuroimage 2010; 49: 3358–64.Ross SJ, Graham N, Stuart-Green L, Prins M, Xuereb J, Patterson K, et al.
Progressive biparietal atrophy: an atypical presentation of Alzheimer’s
disease. J Neurol Neurosurg Psychiatry 1996; 61: 388–95.
Roux FE, Boetto S, Sacko O, Chollet F, Tremoulet M. Writing, calculat-
ing, and finger recognition in the region of the angular gyrus: a
cortical stimulation study of Gerstmann syndrome. J Neurosurg
2003; 99: 716–27.Rusconi E, Pinel P, Dehaene S, Kleinschmidt A. The enigma of
Gerstmann’s syndrome revisited: a telling tale of the vicissitudes of
neuropsychology. Brain 2010; 133: 320–32.
Rusconi E, Pinel P, Eger E, Lebihan D, Thirion B, Dehaene S, et al.
A disconnection account of Gerstmann syndrome: Functional neuro-
anatomy evidence. Ann Neurol 2009; 66: 654–62.
Rusconi E, Walsh V, Butterworth B. Dexterity with numbers: rTMS over
left angular gyrus disrupts finger gnosis and number processing.
Neuropsychologia 2005; 43: 1609–24.Schmidtke K, Hull M, Talazko J. Posterior cortical atrophy: variant of
Alzheimer’s disease? A case series with PET findings. J Neurol 2005;
252: 27–35.
Schmitz TW, Rowley HA, Kawahara TN, Johnson SC. Neural correlates of
self-evaluative accuracy after traumatic brain injury. Neuropsychologia
2006; 44: 762–73.
Tang-Wai DF, Graff-Radford NR, Boeve BF, Dickson DW, Parisi JE,
Crook R, et al. Clinical, genetic, and neuropathologic characteristics
of posterior cortical atrophy. Neurology 2004; 63: 1168–74.Tessari A, Canessa N, Ukmar M, Rumiati RI. Neuropsychological
evidence for a strategic control of multiple routes in imitation. Brain
2007; 130: 1111–26.
Trillenberg P, Sprenger A, Petersen D, Kompf D, Heide W, Helmchen C.
Functional dissociation of saccade and hand reaching control with
14 | Brain 2011: Page 14 of 15 A. Kas et al.
by guest on April 9, 2011
brain.oxfordjournals.orgD
ownloaded from

bilateral lesions of the medial wall of the intraparietal sulcus: implica-tions for optic ataxia. Neuroimage 2007; 36 (Suppl 2): T69–76.
Tzourio-Mazoyer N, Landeau B, Papathanassiou D, Crivello F, Etard O,
Delcroix N, et al. Automated anatomical labeling of activations in SPM
using a macroscopic anatomical parcellation of the MNI MRIsingle-subject brain. Neuroimage 2002; 15: 273–89.
Van der Linden M, Coyette F, Poitrenaud J. et les membres du
GREMEM. L’epreuve de rappel libre/rappel indice a 16 items (RL/RI
16). In: Van der Linden M, Adam S, Agniel A et les membres duGREMEM, editors. L’evaluation des troubles de la memoire.
Presentation de quatre tests de memoire episodique (avec leur etalon-
nage). Marseille: Sollal; 2004. p. 25–47.
Wechsler D. The Wechsler Adult Intelligence Scale–Revised. San Antonio:Psychological Corporation; 1981.
Weiss PH, Rahbari NN, Hesse MD, Fink GR. Deficient sequencing of
pantomimes in apraxia. Neurology 2008; 70: 834–40.
Whitwell JL, Jack CR Jr, Kantarci K, Weigand SD, Boeve BF,Knopman DS, et al. Imaging correlates of posterior cortical atrophy.
Neurobiol Aging 2007; 28: 1051–61.
Zadikoff C, Lang AE. Apraxia in movement disorders. Brain 2005; 128:
1480–97.Zago L, Petit L, Turbelin MR, Andersson F, Vigneau M, Tzourio-
Mazoyer N. How verbal and spatial manipulation networks contribute
to calculation: an fMRI study. Neuropsychologia 2008; 46: 2403–14.
Cognitive and SPECT profiles in PCA Brain 2011: Page 15 of 15 | 15
by guest on April 9, 2011
brain.oxfordjournals.orgD
ownloaded from
Related Documents