Please cite this article in press as: Cerasa A, et al. Morphological correlates of MAO A VNTR polymorphism: New evidence from cortical thickness measurement. Behav Brain Res (2010), doi:10.1016/j.bbr.2010.03.021 ARTICLE IN PRESS UNCORRECTED PROOF G Model BBR 6420 1–7 Behavioural Brain Research xxx (2010) xxx–xxx 1 Contents lists available at ScienceDirect Behavioural Brain Research journal homepage: www.elsevier.com/locate/bbr Research report 1 Morphological correlates of MAO A VNTR polymorphism: New evidence from cortical thickness measurement 2 3 Antonio Cerasa a,∗ , Andrea Cherubini d , Aldo Quattrone a,c , Maria C. Gioia a , Angela Magariello b , Maria Muglia b , Ida Manna b , Francesca Assogna d , Carlo Caltagirone d,e , Gianfranco Spalletta d 4 5 a Neuroimaging Research Unit, Institute of Neurological Sciences, National Research Council, Catanzaro, Italy 6 b Institute of Neurological Sciences, National Research Council, Piano Lago di Mangone, Cosenza, Italy 7 c Institute of Neurology, University “Magna Graecia”, Catanzaro, Italy 8 d IRCCS Santa Lucia Foundation, Rome, Italy 9 e Tor Vergata” University, Dept. of Neuroscience, Rome, Italy 10 11 article info 12 13 Article history: 14 Received 21 December 2009 15 Received in revised form 24 February 2010 16 Accepted 11 March 2010 17 Available online xxx 18 Keywords: 19 MAO A VNTR genotype 20 Cortical thickness 21 Imaging genetics 22 Orbitofrontal cortex 23 abstract A functional variant in the mono-amine oxidase A (MAO A) gene has been shown to impact neural function related to cognitive and affective processing and increase risk for conduct disorders. However, whether MAO A could be a candidate gene for structural variation in the human brain remains to be clarified. This study is the first to investigate the effect of this genotype on brain morphology by measuring cortical thickness. We genotyped 59 healthy male subjects (36 carrying the MAO A High-activity allele and 23 the MAO A Low-activity allele) who underwent structural MRI at 3 T. Models of the grey-white and pial surfaces were generated for each individual’s cortices, and the distance between these two surfaces was used to compute cortical thickness within a priori regions of interest of the orbitofrontal and cingulate cortices. Surface-based analysis of the cortical mantle showed that the MAO A genotype was associated with structural differences in the orbitofrontal cortex bilaterally, where the MAO A High-activity group showed the highest cortical thickness value and the MAO A Low-activity group the lowest. Otherwise, no significant difference was detected within the cingulate cortex. Thus, we confirm the hypothesis that the MAO A genotype has a specific impact on human brain morphology. In particular, thickness measurement of the orbitofrontal cortex provides new evidence about the biological impact of the MAO A genotype on neural systems relevant to the pathophysiology of behavioural disorders. © 2010 Published by Elsevier B.V. 1. Introduction 24 Mono-amine oxidase (MAO) is a mitochondrial enzyme that 25 degrades the neurotransmitters serotonin (5-HT) and (to a lesser 26 extent) noradrenaline and dopamine [50]. There are two distinct 27 forms of the enzyme: A and B. MAO A provides the major enzymatic 28 clearing step for serotonin and norepinephrine during brain devel- 29 opment [50]. The MAO A coding gene (Xp11.4–Xp11.3) presents a 30 well-characterized variable number tandem repeat (VNTR) func- 31 tional polymorphism in the promoter region, which has two 32 Abbreviations: MAO A, mono-amine oxidase A; MRI, magnetic resonance imag- ing; VBM, voxel-based morphometry; 5-HT, serotonin; VNTR, variable number tandem repeat; ROIs, regions of interest; PUs, parcellation units; GLM, general linear model; DOSS, different offsets same slopes; DODS, different offsets different slopes; ICV, intracranial volume. ∗ Corresponding author at: Institute of Neurological Sciences, National Research Council, Piano Lago di Mangone, 87050 Cosenza, Italy. Tel.: +39 0984 9801270; fax: +39 0984 969306. E-mail address: [email protected] (A. Cerasa). common alleles that selectively influence protein transcription and, 33 hence, enzymatic activity. Enzyme expression is relatively high for 34 carriers of 3.5 or 4 repeats (MAO A High) and lower for carriers of 35 2, 3 or 5 repeats (MAO A Low) [48]. 36 The presence of this functional polymorphism has stimulated 37 several studies on its association at an intermediate phenotypic 38 level (gene-brain function or gene-brain structure relationships) or 39 at phenotypic level (gene-cognitive function or gene-behavioural 40 disorder relationships). Unfortunately, major parts of this research 41 were characterized by conflicting findings. Whereas the association 42 of this genotype with antisocial behaviour in human cross-sectional 43 studies underlined the role of the MAO A High-activity allele in 44 males as a risk factor [36], population studies investigating the 45 gene-by-environment interaction defined a clear and pronounced 46 effect of the MAO A Low variant to predict conduct disorders 47 in males with adverse early experiences [6,23]. Similarly, several 48 imaging genetic studies investigating the neurofunctional correlate 49 of the MAO A VNTR polymorphism presented different interpre- 50 tations as to whether the High- or Low-activity allelic variant is 51 the risk factor. One study highlighted the under-activation of the 52 0166-4328/$ – see front matter © 2010 Published by Elsevier B.V. doi:10.1016/j.bbr.2010.03.021

Welcome message from author
This document is posted to help you gain knowledge. Please leave a comment to let me know what you think about it! Share it to your friends and learn new things together.
Transcript

G
B
1
R1
Mc
2
3
AM
4
5
a6b7c8d9e10
11
a12
13
A14
R15
R16
A17
A
18
K19
M20
C21
I22
O23
124
25
d26
e27
f28
c29
o30
w31
t32
itmI
Cf
0d
ARTICLE IN PRESS
TED
PR
OO
F
Model
BR 6420 1–7
Behavioural Brain Research xxx (2010) xxx–xxx
Contents lists available at ScienceDirect
Behavioural Brain Research
journa l homepage: www.e lsev ier .com/ locate /bbr
esearch report
orphological correlates of MAO A VNTR polymorphism: New evidence fromortical thickness measurement
ntonio Cerasaa,∗, Andrea Cherubinid, Aldo Quattronea,c, Maria C. Gioiaa, Angela Magariellob,aria Mugliab, Ida Mannab, Francesca Assognad, Carlo Caltagironed,e, Gianfranco Spallettad
Neuroimaging Research Unit, Institute of Neurological Sciences, National Research Council, Catanzaro, ItalyInstitute of Neurological Sciences, National Research Council, Piano Lago di Mangone, Cosenza, ItalyInstitute of Neurology, University “Magna Graecia”, Catanzaro, ItalyIRCCS Santa Lucia Foundation, Rome, ItalyTor Vergata” University, Dept. of Neuroscience, Rome, Italy
r t i c l e i n f o
rticle history:eceived 21 December 2009eceived in revised form 24 February 2010ccepted 11 March 2010vailable online xxx
eywords:AO A VNTR genotype
ortical thickness
a b s t r a c t
A functional variant in the mono-amine oxidase A (MAO A) gene has been shown to impact neural functionrelated to cognitive and affective processing and increase risk for conduct disorders. However, whetherMAO A could be a candidate gene for structural variation in the human brain remains to be clarified. Thisstudy is the first to investigate the effect of this genotype on brain morphology by measuring corticalthickness. We genotyped 59 healthy male subjects (36 carrying the MAO A High-activity allele and 23the MAO A Low-activity allele) who underwent structural MRI at 3 T. Models of the grey-white and pialsurfaces were generated for each individual’s cortices, and the distance between these two surfaces wasused to compute cortical thickness within a priori regions of interest of the orbitofrontal and cingulate
Cmaging geneticsrbitofrontal cortex
cortices. Surface-based analysis of the cortical mantle showed that the MAO A genotype was associatedwith structural differences in the orbitofrontal cortex bilaterally, where the MAO A High-activity groupshowed the highest cortical thickness value and the MAO A Low-activity group the lowest. Otherwise, nosignificant difference was detected within the cingulate cortex. Thus, we confirm the hypothesis that theMAO A genotype has a specific impact on human brain morphology. In particular, thickness measurementof the orbitofrontal cortex provides new evidence about the biological impact of the MAO A genotype on
o the
33
34
35
36
37
38
OR
REneural systems relevant t
. Introduction
Mono-amine oxidase (MAO) is a mitochondrial enzyme thategrades the neurotransmitters serotonin (5-HT) and (to a lesserxtent) noradrenaline and dopamine [50]. There are two distinctorms of the enzyme: A and B. MAO A provides the major enzymatic
Please cite this article in press as: Cerasa A, et al. Morphological correlates omeasurement. Behav Brain Res (2010), doi:10.1016/j.bbr.2010.03.021
UN
Clearing step for serotonin and norepinephrine during brain devel-pment [50]. The MAO A coding gene (Xp11.4–Xp11.3) presents aell-characterized variable number tandem repeat (VNTR) func-
ional polymorphism in the promoter region, which has two
Abbreviations: MAO A, mono-amine oxidase A; MRI, magnetic resonance imag-ng; VBM, voxel-based morphometry; 5-HT, serotonin; VNTR, variable numberandem repeat; ROIs, regions of interest; PUs, parcellation units; GLM, general linear
odel; DOSS, different offsets same slopes; DODS, different offsets different slopes;CV, intracranial volume.∗ Corresponding author at: Institute of Neurological Sciences, National Researchouncil, Piano Lago di Mangone, 87050 Cosenza, Italy. Tel.: +39 0984 9801270;
ax: +39 0984 969306.E-mail address: [email protected] (A. Cerasa).
39
40
41
42
43
44
45
46
47
166-4328/$ – see front matter © 2010 Published by Elsevier B.V.oi:10.1016/j.bbr.2010.03.021
pathophysiology of behavioural disorders.© 2010 Published by Elsevier B.V.
common alleles that selectively influence protein transcription and,hence, enzymatic activity. Enzyme expression is relatively high forcarriers of 3.5 or 4 repeats (MAO A High) and lower for carriers of2, 3 or 5 repeats (MAO A Low) [48].
The presence of this functional polymorphism has stimulatedseveral studies on its association at an intermediate phenotypiclevel (gene-brain function or gene-brain structure relationships) orat phenotypic level (gene-cognitive function or gene-behaviouraldisorder relationships). Unfortunately, major parts of this researchwere characterized by conflicting findings. Whereas the associationof this genotype with antisocial behaviour in human cross-sectionalstudies underlined the role of the MAO A High-activity allele inmales as a risk factor [36], population studies investigating thegene-by-environment interaction defined a clear and pronouncedeffect of the MAO A Low variant to predict conduct disorders
f MAO A VNTR polymorphism: New evidence from cortical thickness
in males with adverse early experiences [6,23]. Similarly, several 48
imaging genetic studies investigating the neurofunctional correlate 49
of the MAO A VNTR polymorphism presented different interpre- 50
tations as to whether the High- or Low-activity allelic variant is 51
the risk factor. One study highlighted the under-activation of the 52

IN
T
G
B
2 Brain
o53
c54
[55
a56
n57
[58
t59
t60
s61
[62
g63
m64
65
d66
a67
n68
s69
t70
a71
s72
273
274
75
r76
e77
h78
s79
n80
m81
s82
t83
o84
A85
(86
i87
o88
[89
h90
o91
a92
b93
(94
r95
i96
o97
(98
m99
s100
g101
8102
b103
p104
e105
w106
C107
108
4109
M110
a111
f112
a113
[114
f115
(116
2117
118
d119
s120
t121
w122
(123
124
125
126
127
128
129
130
131
132
133
134
135
136
137
138
139
140
141
142
143
144
145
146
147
148
149
150
151
152
153
154
155
156
157
158
159
160
161
162
163
164
165
166
167
168
169
170
171
172
173
174
175
176
177
178
179
180
181
182
183
184
185
186
187
188
189
ARTICLE
UN
CO
RR
EC
Model
BR 6420 1–7
A. Cerasa et al. / Behavioural
rbitofrontal cortex or the anterior cingulate cortex in individualsarrying the MAO A Low variant during cognitive control paradigm38], whereas others underscored the hyperactivity of the samereas in the High-activity carriers during functional magnetic reso-ance imaging (fMRI) tasks involving equivalent cognitive process7,17,41,42]. Even the employment of structural MRI to investigatehe neuroanatomic effects of this genotype did not help to discernhis doubt. In fact, in two different studies using an optimized ver-ion of voxel-based morphometry (VBM), Meyer-Lindenberg et al.38] and Cerasa et al. [8] both found similar findings but had diver-ent interpretations about the impact of this genotype on brainorphology.Thus, the aim of this study is to provide, for the first time, evi-
ence of physical characteristics associated with the MAO-A Highnd MAO-A Low activity variants by using an in vivo cortical thick-ess measurement. Given the aforementioned abundant evidenceshowing how this genotype affects both brain function and struc-ure of the orbitofrontal and cingulate cortices, we computed theverage cortical thickness in these specific regions in individualubjects.
. Methods
.1. Participants
One hundred fifty-five healthy individuals (Caucasian, age-range: 18–70) wereecruited by local advertisements. Inclusion criteria were: (1) male; (2) right hand-dness, according to the Edinburgh Handedness Inventory [39]; (3) vision andearing sufficient for compliance with testing procedures; (4) neuropsychologicalcores above the cutoff scores, corrected for age and educational level, identifyingormal cognitive level in the Italian population (see Section 2.2). We included onlyen for two reasons: (a) MAO A polymorphism maps in a region of the X chromo-
ome is suspected to escape the normal inactivation [5] which makes it very difficulto compare homozygous males (carrying either one MAO A High-activity allele orne MAO A Low-activity allele) to homozygous females (carrying either two MAOHigh-activity alleles or two MAO A Low-activity alleles) or heterozygous females
carrying both one MAO A High-activity allele and one MAO A Low-activity allele)n terms of enzymatic activity; (b) there is evidence that the effects of MAO A allelesn the serotonergic function in vivo vary as a function of both ethnicity and gender38,55]. Exclusion criteria were: (1) major medical illnesses, known or suspectedistory of alcoholism or drug dependence and abuse during lifetime; (2) mental dis-rders (i.e., schizophrenia, mood disorders, anxiety disorders, personality disorders,nd any other significant mental disorder), according to DSM-IV criteria assessedy the Structured Clinical Interviews for DSM-IV Axis I (SCID-I) [18] and Axis IISCID-II) [19], and/or neurological disorders diagnosed by an accurate clinical neu-ological examination; (3) dementia, according to DSM-IV criteria or mild cognitivempairment according to Petersen criteria [44] and confirmed by the administrationf the Mental Deterioration Battery (MDB) [4]; (4) Mini Mental State ExaminationMMSE, [25]) score < 27; (5) presence of vascular brain lesions, brain tumour and/or
arked cortical and subcortical atrophy on MRI scan. From the initial sample of 155ubjects, 61 subjects (39.4%) were excluded from the sample for being of femaleender, 11 (7.1%) were excluded because of substance abuse including cannabis,(5.2%) because of a dementia diagnosis or MMSE score lower than 27, 13 (8.4%)
ecause of medical illness or neuropsychiatric disorder, and 3 (1.9%) because ofrevious traumatic brain injury. After the initial screening, 59 subjects were consid-red eligible. All subjects signed written, informed consent. The study proceduresere undertaken in accordance with the guidance of Santa Lucia Foundation Ethicsommittee.
All male subjects were genotyped based on the High-activity (no. 36; 3.5 orrepeats) and the Low-activity (no. 23; 2, 3 and 5 repeats) allelic variants of theAO A VNTR polymorphism. To check for known potentially confounding vari-
bles, since differences in brain anatomy have been previously associated with aunctional polymorphism in the targeting region of the BDNF gene (Val66Met)[45]s well as with the 5-HTT variants of the serotonin transporter gene (5-HTTLPR)46], we genotyped our group according to these polymorphisms to accountor potential confounds in interpreting MAO A effects on brain morphologyTable 1).
.2. Neuropsychological assessment
Please cite this article in press as: Cerasa A, et al. Morphological correlates omeasurement. Behav Brain Res (2010), doi:10.1016/j.bbr.2010.03.021
Two trained neuropsychologists, who were blind to the aim of the study, con-ucted the cognitive assessment, which was performed within 15 days of MRI. Weelected the following tests from the MDB in order to provide information abouthe functionality of different cognitive domains such as: verbal memory (Rey’s 15-ord Immediate Recall (RIR) and Delayed Recall (RDR)), short-term visual memory
Immediate Visual Memory (IVM)), logical reasoning (Raven’s Progressive Matri-
PRESS
ED P
RO
OF
Research xxx (2010) xxx–xxx
ces’ 47 (PM47)) and language (Phonological Verbal Fluency (PVF) and SentenceConstruction (SC)).
As “executive functioning” denotes a set of different cognitive abilities thatare involved in complex, goal-directed thought and behaviour, the following exec-utive dimensions were assessed: (a) attention control, (b) set-shifting, and (c)working memory [51,52]. (a) In order to assess abilities of attention control andinhibition, we administered the Stroop test (ST) [53]. Time of performance waschosen as a measurement. (b) Set-shifting or cognitive flexibility was assessedusing the Modified Wisconsin Card Sorting test (MWCST) [30]. The number ofperseverative/no-perseverative errors was chosen as a measurement. (c) In orderto measure verbal, spatial and visual working memory we administered the n-backtest. In this test, participants were required to continuously monitor a sequence ofverbal/spatial/visual stimuli (a total of 22 items for each task, visually presented ona screen) and to select items that appeared as n-back items in any sequence. Thenumber of correct responses was generally considered as index of working memoryperformance. In this study we only considered highly cognitive demanding n − 2level performance.
Although none of the participants met the criteria for major depressive episodesor other psychiatric disorders, we further investigated the presence of depressiveand anxiety symptoms using the Hamilton Depression rating scale (HDRS) and theHamilton Rating Scale Anxiety (HAM-A), respectively [28,29].
2.3. Genotyping
DNA was extracted from blood samples obtained from all subjects accord-ing to standard procedures. Genotyping for the MAO A VNTR, 5-HTTLPR, andBDNF Val66Met polymorphisms was performed as described previously (seeSupplementary material) [7,8,41,42].
2.4. Magnetic resonance imaging
Each of the 59 participants underwent the same imaging protocol with awhole-brain T1-weighted scan using a 3 T Allegra MR imager (Siemens, Erlangen,Germany) with a standard quadrature head coil. Whole-brain T1-weighted imageswere obtained in the sagittal plane using a modified driven equilibrium Fouriertransform (MDEFT) [14] sequence (TE/TR = 2.4/7.92 ms, flip angle 15◦ , voxel-size1 mm × 1 mm × 1 mm).
2.5. Cortical thickness
MRI-based quantification of cortical thickness was performed using Freesurfer (v.4.05) software package (http://surfer.nmr.mgh.harvard.edu). This method has beenpreviously described in detail [13,20,21]. The procedure involves segmentation ofwhite matter, tessellation of the grey/white matter junction, inflation of the foldedsurface, tessellation patterns and automatic correction of topological defects in theresulting mainfold. Cortical thickness measurements were obtained by reconstruct-ing representations of the grey/white matter boundary and the cortical surface. Thedistance between these two surfaces was calculated individually at each point acrossthe cortical mantle. This method uses both intensity and continuity informationfrom the entire 3D MRI volume in segmentation and deformation procedures toconstruct representations of cortical thickness. The maps are created using spa-tial intensity gradients across tissue classes and are therefore not simply relianton absolute signal intensity. The entire cortex in each individual subject was thenvisually inspected, and any inaccuracies in Talairach-transformation, skull strippingand segmentation were manually corrected and re-inspected. The anatomic accu-racy of the grey and white matter surfaces was reviewed with particular attentionto the temporal pole where non-brain tissue often needs to be excluded. Thick-ness measurements can be mapped onto the “inflated” surface of each participant’sreconstructed brain, thus allowing visualization without interference from corticalfolding. Maps were smoothed using a circularly symmetrical Gaussian kernel acrossthe surface with a standard deviation of 12.6 mm and averaged across participantsusing a non-rigid high-dimensional spherical averaging method to align corticalfolding patterns [20]. This procedure provides accurate matching of morphologicallyhomologous cortical locations among participants on the basis of each individual’sanatomy while minimizing metric distortions, resulting in a mean measure of corti-cal thickness for each group at each point on the reconstructed surface. This sphericalmorphing procedure was used to construct the cortical thickness difference brainmaps.
2.6. Computation of average cortical thickness within ROIs
Given the substantial evidence highlighting the influence of the MAO A geno-type on the function and structure of specific brain regions, the primary aim ofthis study was to focus on group differences within two regions of interest (ROIs)
f MAO A VNTR polymorphism: New evidence from cortical thickness
or parcellation units (PUs): (a) the orbitofrontal cortex (including the sub-regions 190
pars triangularis, pars orbitalis, medial and lateral orbitofrontal cortices) and (b) the 191
cingulate cortex (including the sub-regions isthmus, posterior, rostral- and caudal- 192
anterior cortices). Cortical ROIs or PUs were drawn on maps of average folding 193
patterns on the cortical surface, with reference to an anatomical atlas (Fig. 1). For 194
each of these structures the right- and left-hemisphere measurements are esti- 195

Please cite this article in press as: Cerasa A, et al. Morphological correlates omeasurement. Behav Brain Res (2010), doi:10.1016/j.bbr.2010.03.021
ARTICLE IN PRESS
UN
CO
RR
ECTE
D P
RO
OF
G Model
BBR 6420 1–7
A. Cerasa et al. / Behavioural Brain Research xxx (2010) xxx–xxx 3
Table 1Group demographics for cortical thickness analysis.
Demographic data MAO A High activity MAO A Low activity p values
No. 36 23Age (years) 37.8 ± 14 41.9 ± 16.8 0.31b
Educational level (years) 13 (8–19) 13 (11–21) 0.43c
Verbal memoryRIR 43.3 ± 7.9 42.9 ± 7.4 0.84b
RDR 9.52 ± 2.5 9.3 ± 2.2 0.8b
Short-term visual memoryIVM 19.3 ± 1.3 19.6 ± 1.2 0.41b
Logical reasoningPM 47 29.6 ± 3.1 29.1 ± 2.1 0.45b
LanguagePVF 31.95 ± 11.4 34.5 ± 11.1 0.41b
SC 19.6 ± 3.2 18 ± 4.3 0.12b
Executive functionST read (time, s) 13.5 ± 2.6 13.7 ± 3.3 0.79b
ST color (time, s) 16.9 ± 3.1 18.1 ± 4 0.25b
ST color-word (time, s) 28.5 ± 6.6 29.6 ± 7.6 0.57b
MWCST PE 0.42 ± 1.12 0.43 ± 1 0.98b
MWCST No PE 0.42 ± 0.75 0.9 ± 0.9 0.04b
Verbal N-back 2-back 17.5 ± 2.6 14.9 ± 5.4 0.02b
Spatial N-back 2-back 17.5 ± 3 14.6 ± 5.4 0.01b
Visuo-spatial N-back 2-back 18.2 ± 2.4 16.1 ± 5.1 0.052b
Psychological variablesHAM-A 3.94 ± 4.6 5.14 ± 4.2 0.34b
HDRS 2.3 ± 2.4 3.1 ± 2.8 0.23b
Genetic backgroundBDNF Val66Met (%) val group val/val 69.5% 69.6% 0.89a
BDNF Val66Met (%) met group grcarriers 30.5% 30.4%5-HTTLPR (%) short variant 80.6% 72.8% 0.19a
5-HTTLPR (%) long variant 19.4% 27.2%
Data are given as mean values (SD) or median values (range) when appropriate. RIR and RDR, Rey’s 15-word Immediate and Differite Recall; IVM, Immediate Visual Memory;PM 47, Raven’s Progressive Matrices’47; PVF, Phonological Verbal Fluency; SC, Sentence Construction; ST, Stroop Task. MWCST PE and No PE, Modified Wisconsin Card Sortingtest, perseverative and no-perseverative errors. HAM-A, Hamilton Rating Scale Anxiety. HDRS, Hamilton Depression Rating Scale. BDNF, Brain Derived Neurotrophic Factor;5-HTTLPR, Serotonin Transporter gene polymorphism.
a Chi-square test.b One-way ANOVA.c Mann–Whitney test.
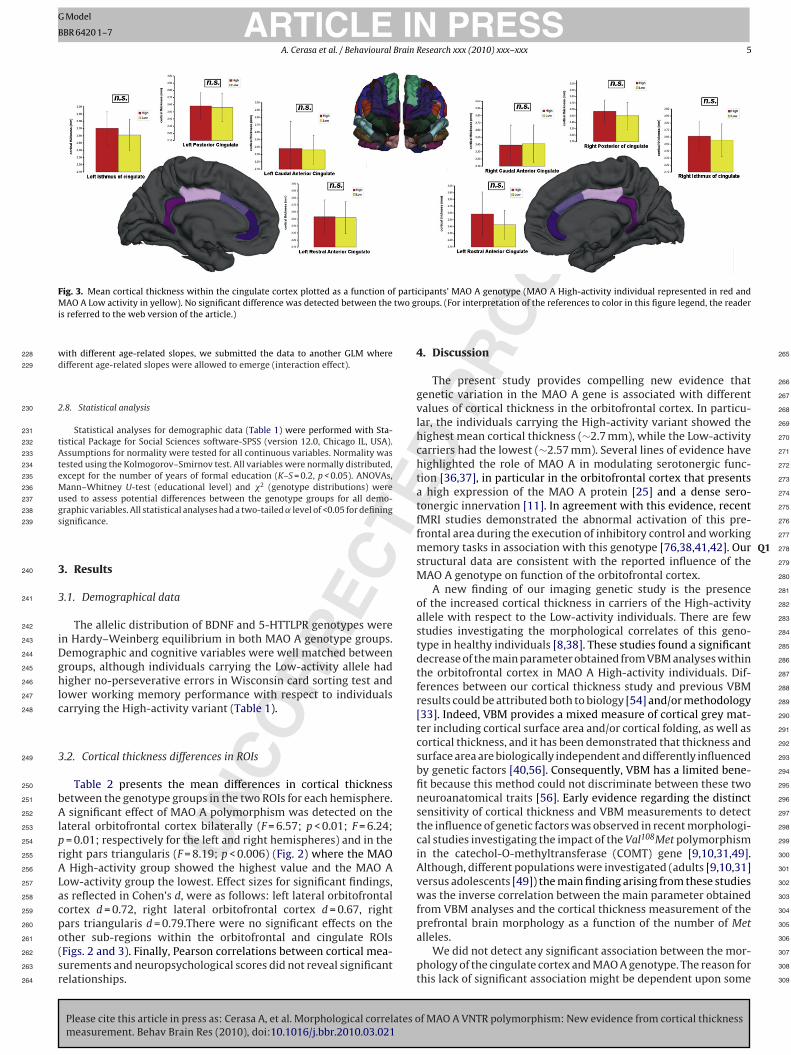
Fig. 1. Cortical parcellation units (PUs) involved with a priori hypothesis. Theorbitofrontal cortex was composed by: pars triangularis, pars orbitalis, medial, andlateral orbitofrontal cortex. The cingulate cortex included the sub-regions isthmus,posterior and rostral- and caudal-anterior cortices. Only one hemisphere is shown.
196
197
198
199
200
201
202
203
204
205
206
207
208
209
210
211
212
213
214
215
216
217
218
219
220
221
mated separately. This method has been validated against manual tracings in healthycontrols and is part of the publicly available Freesurfer package (derived using thesurface-based morphing procedure as described by Fischl et al. [22]). Each ROI wasmapped back onto each individual subject’s unfolded surface by applying the samealgorithm that morphed each subject’s unfolded surface to the average sphericalsurface representation in reverse. Mean thickness for each ROI was calculated byaveraging the mean cortical thickness measurements at each vertex within a givenROI. Statistical analysis was performed within each ROI by using AnCOVA with ageand gender as covariates of no-interest. The level of statistical significance for eachROI was set at p ≤ 0.01 after correction for the number of multiple comparisons:p < 0.05/4 = 0.0125. As a measure of the effect sizes, the Cohen’s d [12] was cal-culated, which indicates the magnitude of mean differences (using the estimatedmarginal means) in SD units. We also tested for correlations between the corticalthickness measurement in the ROIs and all neuropsychological measures (Pearson’r). To reduce type I errors, the level of statistical significance for correlation analysiswas set at p ≤ 0.01.
2.7. Computation of statistical cortical thickness difference maps in thewhole-brain
To further characterize the morphological correlates of the MAO A genotype weadopted a voxel-wise brain mapping approach to the entire cortical mantle (resultsare presented in the Supplementary Material). For each hemisphere, estimation ofstatistical effects was generated by computing a general linear model (GLM) of theeffects of the MAO A genotype on cortical thickness at each vertex. Two types ofdesigns were used in these analyses [16]. A different offset, same slope (DOSS) designwas used to test whether a main effect of group on thickness could be found. Adifferent offset, different slope (DODS) design was used to test whether cortical
f MAO A VNTR polymorphism: New evidence from cortical thickness
thickness was more related to age in one genotype group than in the other. This is 222
conceptually similar to an interaction between age and genotype. First, to explore 223
the effects of MAO A polymorphism on regional cortical thickness independent of 224
participant age, we conducted a GLM with the MAO A genotype (High activity, Low 225
activity) as a classification variable assuming identical age-related slopes between 226
groups (main effect). To test whether or not the MAO A genotype was associated 227

Please cite this article in press as: Cerasa A, et al. Morphological correlates of MAO A VNTR polymorphism: New evidence from cortical thicknessmeasurement. Behav Brain Res (2010), doi:10.1016/j.bbr.2010.03.021
ARTICLE IN PRESS
UN
CO
RR
ECTE
D P
RO
OF
G Model
BBR 6420 1–7
4 A. Cerasa et al. / Behavioural Brain Research xxx (2010) xxx–xxx
Table 2Mean cortical thickness in genotype groups within individual Parcellation Units (PUs). Q5
Left hemisphere Cortical thickness, mean ± SD (mm) p-level
MAO A High activity MAO A Low activity
Orbitofrontal cortexPars triangularis 2.406 ± 0.18 2.347 ± 0.19 0.24Pars orbitalis 2.691 ± 0.21 2.666 ± 0.19 0.65Lateral orbitofrontal cortex 2.68 ± 0.18 2.561 ± 0.15 0.01*Medial orbitofrontal cortex 2.511 ± 0.21 2.454 ± 0.26 0.35
CingulatecortexRostral-anterior cingulate cortex 2.53 ± 0.24 2.52 ± 0.23 0.82Caudal-anterior cingulate cortex 2.38 ± 0,37 2.362 ± 0.2 0.83Posterior cingulate cortex 2.581 ± 0.18 2.559 ± 0.19 0.66Isthmus 2.704 ± 0.23 2.61 ± 0.21 0.12
Right hemisphere Cortical thickness, mean ± SD (mm) p-level
MAO A High activity MAO A Low activity
Orbitofrontal cortexPars triangularis 2.523 ± 0.16 2.411 ± 0.12 0.006*Pars orbitalis 2.812 ± 0.2 2.75 ± 0.26 0.83Lateral orbitofrontal cortex 2.715 ± 0.18 2.581 ± 0.22 0.01*Medial orbitofrontal cortex 2.428 ± 0.22 2.329 ± 0.22 0.1
CingulatecortexRostral-anterior cingulate cortex 2.585 ± 0.33 2.428 ± 0.21 0.06Caudal-anterior cingulate cortex 2.394 ± 0,28 2.411 ± 0.26 0.81Posterior cingulate cortex 2.571 ± 0.18 2.501 ± 0.21 0.17Isthmus 2.611 ± 0.21 2.556 ± 0.23 0.35
AnCOVA analysis corrected for age.
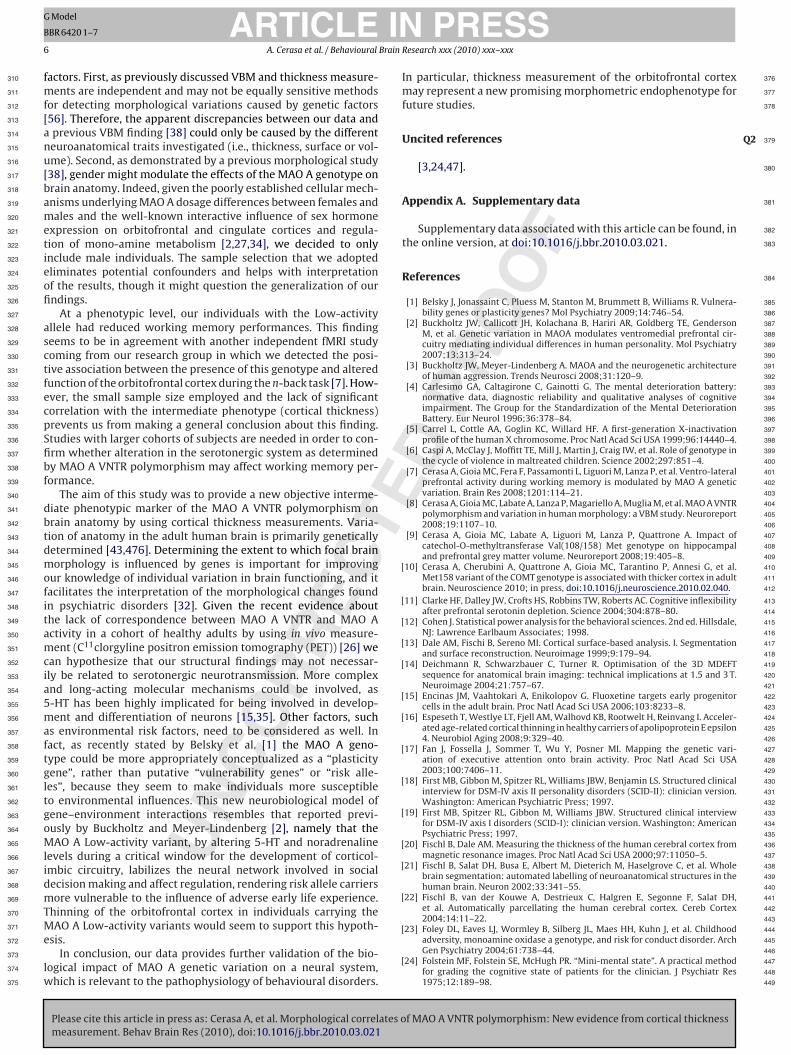
Fig. 2. Mean cortical thickness for the genotype groups within the orbitofrontal cortex as automatically parcellated by Freesurfer. The MAO A High activity represented inred and MAO A Low activity in yellow. A significant difference was detected in the lateral orbitofrontal cortex bilaterally and in the right pars triangularis sub-regions wherethe individuals carrying the MAO A High-activity variant showed an increased thickness with respect to carriers of MAO A Low variant. (For interpretation of the references Q4to color in this figure legend, the reader is referred to the web version of the article.)
ARTICLE IN PRESS
T
F
G Model
BBR 6420 1–7
A. Cerasa et al. / Behavioural Brain Research xxx (2010) xxx–xxx 5
F f partiM two gi
w228
d229
2230
231
t232
A233
t234
e235
M236
u237
g238
s239
3240
3241
242
i243
D244
g245
h246
l247
c248
3249
250
b251
A252
l253
p254
r255
A256
L257
a258
c259
p260
o261
(262
s263
r264
265
266
267
268
269
270
271
272
273
274
275
276
277
Q1 278
279
280
281
282
283
284
285
286
287
288
289
290
291
292
293
294
295
296
297
298
299
300
301
302
303
304
UN
CO
RR
ECig. 3. Mean cortical thickness within the cingulate cortex plotted as a function oAO A Low activity in yellow). No significant difference was detected between the
s referred to the web version of the article.)
ith different age-related slopes, we submitted the data to another GLM whereifferent age-related slopes were allowed to emerge (interaction effect).
.8. Statistical analysis
Statistical analyses for demographic data (Table 1) were performed with Sta-istical Package for Social Sciences software-SPSS (version 12.0, Chicago IL, USA).ssumptions for normality were tested for all continuous variables. Normality was
ested using the Kolmogorov–Smirnov test. All variables were normally distributed,xcept for the number of years of formal education (K–S = 0.2, p < 0.05). ANOVAs,ann–Whitney U-test (educational level) and �2 (genotype distributions) were
sed to assess potential differences between the genotype groups for all demo-raphic variables. All statistical analyses had a two-tailed ˛ level of <0.05 for definingignificance.
. Results
.1. Demographical data
The allelic distribution of BDNF and 5-HTTLPR genotypes weren Hardy–Weinberg equilibrium in both MAO A genotype groups.emographic and cognitive variables were well matched betweenroups, although individuals carrying the Low-activity allele hadigher no-perseverative errors in Wisconsin card sorting test and
ower working memory performance with respect to individualsarrying the High-activity variant (Table 1).
.2. Cortical thickness differences in ROIs
Table 2 presents the mean differences in cortical thicknessetween the genotype groups in the two ROIs for each hemisphere.significant effect of MAO A polymorphism was detected on the
ateral orbitofrontal cortex bilaterally (F = 6.57; p < 0.01; F = 6.24;= 0.01; respectively for the left and right hemispheres) and in the
ight pars triangularis (F = 8.19; p < 0.006) (Fig. 2) where the MAOHigh-activity group showed the highest value and the MAO A
ow-activity group the lowest. Effect sizes for significant findings,s reflected in Cohen’s d, were as follows: left lateral orbitofrontalortex d = 0.72, right lateral orbitofrontal cortex d = 0.67, right
Please cite this article in press as: Cerasa A, et al. Morphological correlates omeasurement. Behav Brain Res (2010), doi:10.1016/j.bbr.2010.03.021
ars triangularis d = 0.79.There were no significant effects on thether sub-regions within the orbitofrontal and cingulate ROIsFigs. 2 and 3). Finally, Pearson correlations between cortical mea-urements and neuropsychological scores did not reveal significantelationships.
ED P
RO
Ocipants’ MAO A genotype (MAO A High-activity individual represented in red androups. (For interpretation of the references to color in this figure legend, the reader
4. Discussion
The present study provides compelling new evidence thatgenetic variation in the MAO A gene is associated with differentvalues of cortical thickness in the orbitofrontal cortex. In particu-lar, the individuals carrying the High-activity variant showed thehighest mean cortical thickness (∼2.7 mm), while the Low-activitycarriers had the lowest (∼2.57 mm). Several lines of evidence havehighlighted the role of MAO A in modulating serotonergic func-tion [36,37], in particular in the orbitofrontal cortex that presentsa high expression of the MAO A protein [25] and a dense sero-tonergic innervation [11]. In agreement with this evidence, recentfMRI studies demonstrated the abnormal activation of this pre-frontal area during the execution of inhibitory control and workingmemory tasks in association with this genotype [76,38,41,42]. Ourstructural data are consistent with the reported influence of theMAO A genotype on function of the orbitofrontal cortex.
A new finding of our imaging genetic study is the presenceof the increased cortical thickness in carriers of the High-activityallele with respect to the Low-activity individuals. There are fewstudies investigating the morphological correlates of this geno-type in healthy individuals [8,38]. These studies found a significantdecrease of the main parameter obtained from VBM analyses withinthe orbitofrontal cortex in MAO A High-activity individuals. Dif-ferences between our cortical thickness study and previous VBMresults could be attributed both to biology [54] and/or methodology[33]. Indeed, VBM provides a mixed measure of cortical grey mat-ter including cortical surface area and/or cortical folding, as well ascortical thickness, and it has been demonstrated that thickness andsurface area are biologically independent and differently influencedby genetic factors [40,56]. Consequently, VBM has a limited bene-fit because this method could not discriminate between these twoneuroanatomical traits [56]. Early evidence regarding the distinctsensitivity of cortical thickness and VBM measurements to detectthe influence of genetic factors was observed in recent morphologi-cal studies investigating the impact of the Val108Met polymorphismin the catechol-O-methyltransferase (COMT) gene [9,10,31,49].Although, different populations were investigated (adults [9,10,31]versus adolescents [49]) the main finding arising from these studieswas the inverse correlation between the main parameter obtainedfrom VBM analyses and the cortical thickness measurement of the
f MAO A VNTR polymorphism: New evidence from cortical thickness
prefrontal brain morphology as a function of the number of Met 305
alleles. 306
We did not detect any significant association between the mor- 307
phology of the cingulate cortex and MAO A genotype. The reason for 308
this lack of significant association might be dependent upon some 309
IN
T
G
B
6 Brain
f310
m311
f312
[313
a314
n315
u316
[317
b318
a319
m320
e321
t322
i323
e324
o325
fi326
327
a328
s329
c330
t331
f332
e333
c334
p335
S336
fi337
b338
f339
340
d341
b342
t343
d344
m345
o346
f347
i348
t349
a350
m351
c352
i353
a354
5355
m356
a357
f358
t359
g360
l361
t362
g363
o364
M365
l366
i367
d368
m369
T370
M371
e372
373
l374
w375
376
377
378
Q2 379
380
381
382
383
384
385
386
387
388
389
390
391
392
393
394
395
396
397
398
399
400
401
402
403
404
405
406
407
408
409
[ 410
411
412
[ 413
414
[ 415
416
[ 417
418
[ 419
420
421
[ 422
423
[ 424
425
426
[ 427
428
429
[ 430
431
432
[ 433
434
435
[ 436
437
[ 438
439
440
[ 441
442
443
ARTICLE
UN
CO
RR
EC
Model
BR 6420 1–7
A. Cerasa et al. / Behavioural
actors. First, as previously discussed VBM and thickness measure-ents are independent and may not be equally sensitive methods
or detecting morphological variations caused by genetic factors56]. Therefore, the apparent discrepancies between our data andprevious VBM finding [38] could only be caused by the differenteuroanatomical traits investigated (i.e., thickness, surface or vol-me). Second, as demonstrated by a previous morphological study38], gender might modulate the effects of the MAO A genotype onrain anatomy. Indeed, given the poorly established cellular mech-nisms underlying MAO A dosage differences between females andales and the well-known interactive influence of sex hormone
xpression on orbitofrontal and cingulate cortices and regula-ion of mono-amine metabolism [2,27,34], we decided to onlynclude male individuals. The sample selection that we adoptedliminates potential confounders and helps with interpretationf the results, though it might question the generalization of ourndings.
At a phenotypic level, our individuals with the Low-activityllele had reduced working memory performances. This findingeems to be in agreement with another independent fMRI studyoming from our research group in which we detected the posi-ive association between the presence of this genotype and alteredunction of the orbitofrontal cortex during the n-back task [7]. How-ver, the small sample size employed and the lack of significantorrelation with the intermediate phenotype (cortical thickness)revents us from making a general conclusion about this finding.tudies with larger cohorts of subjects are needed in order to con-rm whether alteration in the serotonergic system as determinedy MAO A VNTR polymorphism may affect working memory per-ormance.
The aim of this study was to provide a new objective interme-iate phenotypic marker of the MAO A VNTR polymorphism onrain anatomy by using cortical thickness measurements. Varia-ion of anatomy in the adult human brain is primarily geneticallyetermined [43,476]. Determining the extent to which focal brainorphology is influenced by genes is important for improving
ur knowledge of individual variation in brain functioning, and itacilitates the interpretation of the morphological changes foundn psychiatric disorders [32]. Given the recent evidence abouthe lack of correspondence between MAO A VNTR and MAO Activity in a cohort of healthy adults by using in vivo measure-ent (C11clorgyline positron emission tomography (PET)) [26] we
an hypothesize that our structural findings may not necessar-ly be related to serotonergic neurotransmission. More complexnd long-acting molecular mechanisms could be involved, as-HT has been highly implicated for being involved in develop-ent and differentiation of neurons [15,35]. Other factors, such
s environmental risk factors, need to be considered as well. Inact, as recently stated by Belsky et al. [1] the MAO A geno-ype could be more appropriately conceptualized as a “plasticityene”, rather than putative “vulnerability genes” or “risk alle-es”, because they seem to make individuals more susceptibleo environmental influences. This new neurobiological model ofene–environment interactions resembles that reported previ-usly by Buckholtz and Meyer-Lindenberg [2], namely that theAO A Low-activity variant, by altering 5-HT and noradrenaline
evels during a critical window for the development of corticol-mbic circuitry, labilizes the neural network involved in socialecision making and affect regulation, rendering risk allele carriersore vulnerable to the influence of adverse early life experience.
hinning of the orbitofrontal cortex in individuals carrying the
Please cite this article in press as: Cerasa A, et al. Morphological correlates omeasurement. Behav Brain Res (2010), doi:10.1016/j.bbr.2010.03.021
AO A Low-activity variants would seem to support this hypoth-sis.
In conclusion, our data provides further validation of the bio-ogical impact of MAO A genetic variation on a neural system,
hich is relevant to the pathophysiology of behavioural disorders.
[
[
PRESS
ED P
RO
OF
Research xxx (2010) xxx–xxx
In particular, thickness measurement of the orbitofrontal cortexmay represent a new promising morphometric endophenotype forfuture studies.
Uncited references
[3,24,47].
Appendix A. Supplementary data
Supplementary data associated with this article can be found, inthe online version, at doi:10.1016/j.bbr.2010.03.021.
References
[1] Belsky J, Jonassaint C, Pluess M, Stanton M, Brummett B, Williams R. Vulnera-bility genes or plasticity genes? Mol Psychiatry 2009;14:746–54.
[2] Buckholtz JW, Callicott JH, Kolachana B, Hariri AR, Goldberg TE, GendersonM, et al. Genetic variation in MAOA modulates ventromedial prefrontal cir-cuitry mediating individual differences in human personality. Mol Psychiatry2007;13:313–24.
[3] Buckholtz JW, Meyer-Lindenberg A. MAOA and the neurogenetic architectureof human aggression. Trends Neurosci 2008;31:120–9.
[4] Carlesimo GA, Caltagirone C, Gainotti G. The mental deterioration battery:normative data, diagnostic reliability and qualitative analyses of cognitiveimpairment. The Group for the Standardization of the Mental DeteriorationBattery. Eur Neurol 1996;36:378–84.
[5] Carrel L, Cottle AA, Goglin KC, Willard HF. A first-generation X-inactivationprofile of the human X chromosome. Proc Natl Acad Sci USA 1999;96:14440–4.
[6] Caspi A, McClay J, Moffitt TE, Mill J, Martin J, Craig IW, et al. Role of genotype inthe cycle of violence in maltreated children. Science 2002;297:851–4.
[7] Cerasa A, Gioia MC, Fera F, Passamonti L, Liguori M, Lanza P, et al. Ventro-lateralprefrontal activity during working memory is modulated by MAO A geneticvariation. Brain Res 2008;1201:114–21.
[8] Cerasa A, Gioia MC, Labate A, Lanza P, Magariello A, Muglia M, et al. MAO A VNTRpolymorphism and variation in human morphology: a VBM study. Neuroreport2008;19:1107–10.
[9] Cerasa A, Gioia MC, Labate A, Liguori M, Lanza P, Quattrone A. Impact ofcatechol-O-methyltransferase Val(108/158) Met genotype on hippocampaland prefrontal grey matter volume. Neuroreport 2008;19:405–8.
10] Cerasa A, Cherubini A, Quattrone A, Gioia MC, Tarantino P, Annesi G, et al.Met158 variant of the COMT genotype is associated with thicker cortex in adultbrain. Neuroscience 2010; in press, doi:10.1016/j.neuroscience.2010.02.040.
11] Clarke HF, Dalley JW, Crofts HS, Robbins TW, Roberts AC. Cognitive inflexibilityafter prefrontal serotonin depletion. Science 2004;304:878–80.
12] Cohen J. Statistical power analysis for the behavioral sciences. 2nd ed. Hillsdale,NJ: Lawrence Earlbaum Associates; 1998.
13] Dale AM, Fischi B, Sereno MI. Cortical surface-based analysis. I. Segmentationand surface reconstruction. Neuroimage 1999;9:179–94.
14] Deichmann R, Schwarzbauer C, Turner R. Optimisation of the 3D MDEFTsequence for anatomical brain imaging: technical implications at 1.5 and 3 T.Neuroimage 2004;21:757–67.
15] Encinas JM, Vaahtokari A, Enikolopov G. Fluoxetine targets early progenitorcells in the adult brain. Proc Natl Acad Sci USA 2006;103:8233–8.
16] Espeseth T, Westlye LT, Fjell AM, Walhovd KB, Rootwelt H, Reinvang I. Acceler-ated age-related cortical thinning in healthy carriers of apolipoprotein E epsilon4. Neurobiol Aging 2008;9:329–40.
17] Fan J, Fossella J, Sommer T, Wu Y, Posner MI. Mapping the genetic vari-ation of executive attention onto brain activity. Proc Natl Acad Sci USA2003;100:7406–11.
18] First MB, Gibbon M, Spitzer RL, Williams JBW, Benjamin LS. Structured clinicalinterview for DSM-IV axis II personality disorders (SCID-II): clinician version.Washington: American Psychiatric Press; 1997.
19] First MB, Spitzer RL, Gibbon M, Williams JBW. Structured clinical interviewfor DSM-IV axis I disorders (SCID-I): clinician version. Washington: AmericanPsychiatric Press; 1997.
20] Fischl B, Dale AM. Measuring the thickness of the human cerebral cortex frommagnetic resonance images. Proc Natl Acad Sci USA 2000;97:11050–5.
21] Fischl B, Salat DH, Busa E, Albert M, Dieterich M, Haselgrove C, et al. Wholebrain segmentation: automated labelling of neuroanatomical structures in thehuman brain. Neuron 2002;33:341–55.
22] Fischl B, van der Kouwe A, Destrieux C, Halgren E, Segonne F, Salat DH,et al. Automatically parcellating the human cerebral cortex. Cereb Cortex2004;14:11–22.
f MAO A VNTR polymorphism: New evidence from cortical thickness
23] Foley DL, Eaves LJ, Wormley B, Silberg JL, Maes HH, Kuhn J, et al. Childhood 444
adversity, monoamine oxidase a genotype, and risk for conduct disorder. Arch 445
Gen Psychiatry 2004;61:738–44. 446
24] Folstein MF, Folstein SE, McHugh PR. “Mini-mental state”. A practical method 447
for grading the cognitive state of patients for the clinician. J Psychiatr Res 448
1975;12:189–98. 449

ING
B
Brain
[450
451
452
[453
454
455
[456
457
458
[459
460
[461
462
[463
Q3464
[465
466
467
[468
469
470
[471
472
473
[474
475
476
[477
478
[479
480
481
482
[483
484
485
[486
487
488
[489
490
[491
492
493
[494
495
[ 496
497
498
499
[ 500
501
502
[ 503
504
505
[ 506
507
508
[ 509
510
511
512
[ 513
514
515
[ 516
517
[ 518
519
520
[ 521
522
[ 523
524
525
[ 526
527
528
529
[ 530
531
[ 532
533
534
[ 535
Serotonin-related gene polymorphisms and central nervous system serotonin 536
ARTICLEModel
BR 6420 1–7
A. Cerasa et al. / Behavioural
25] Fowler JS, MacGregor RR, Wolf AP, Arnett CD, Dewey SL, Schlyer D, et al.Mapping human brain monoamine oxidase A and B with 11C-labeled suicideinactivators and PET. Science 1987;235:481–5.
26] Fowler JS, Alia-Klein N, Kriplani A, Logan J, Williams B, Zhu W, et al. Evidencethat brain MAO A activity does not correspond to MAO A genotype in healthymale subjects. Biol Psychiatry 2007;62:355–8.
27] Gundlah C, Lu NZ, Bethea CL. Ovarian steroid regulation of monoamine oxidase-A and -B mRNAs in the macaque dorsal raphe and hypothalamic nuclei.Psychopharmacology (Berl) 2002;160:271–82.
28] Hamilton H. Development of a rating scale for primary depressive illness. Br JSoc Clin Psychol 1967;6:278–96.
29] Hamilton M. The assessment of anxiety states by rating. Br J Med Psychol1959;32:50–5.
30] Heaton RK, Chelune GJ, Talley JL, Kay GC, Curtiss G. Wisconsin card sorting testmanual. Odessa, FL: Psychological Assessment Resources; 1993.
31] Honea R, Verchinski BA, Pezawas L, Kolachana BS, Callicott JH, Mattay VS, etal. Impact of interacting functional variants in COMT on regional grey mattervolume in human brain. Neuroimage 2009;45:44–51.
32] Hulshoff Pol HE, Schnack HG, Posthuma D, Mandl RC, Baaré WF, van Oel C, et al.Genetic contributions to human brain morphology and intelligence. J Neurosci2006;26:10235–42.
33] Hutton C, Draganski B, Ashburner J, Weiskopf N. A comparison betweenvoxel-based cortical thickness and voxel-based morphometry in normal aging.Neuroimage 2009;48:371–80.
34] MacLusky NJ, Naftolin F, Goldman-Rakic PS. Estrogen formation and binding inthe cerebral cortex of the developing rhesus monkey. Proc Natl Acad Sci USA1986;83:513–6.
35] Malberg JE, Eisch AJ, Nestler EJ, Duman RS. Chronic antidepressant treatmentincreases neurogenesis in adult rat hippocampus. J Neurosci 2000;20:9104–10.
36] Manuck SB, Flory JD, Ferrell RE, Mann JJ, Muldoon MF. A regulatory polymor-phism of the monoamine oxidase-A gene may be associated with variability inaggression, impulsivity and central nervous system serotonergic responsivity.Psychiatry Res 2000;95:9–23.
37] Manuck SB, Flory JD, Muldoon MF, Ferrell RE. Central nervous systemserotonergic responsivity and aggressive disposition in men. Physiol Behav2002;77:705–9.
38] Meyer-Lindenberg A, Buckholtz JW, Kolachana BR, Hariri A, Pezawas L, Blasi G,et al. Neural mechanisms of genetic risk for impulsivity and violence in humans.Proc Natl Acad Sci USA 2006;103:6269–74.
39] Oldfield RC. The assessment and analysis of handedness: the Edinburgh inven-tory. Neuropsychologia 1971;9:97–113.
Please cite this article in press as: Cerasa A, et al. Morphological correlates omeasurement. Behav Brain Res (2010), doi:10.1016/j.bbr.2010.03.021
UN
CO
RR
ECT40] Panizzon MS, Fennema-Notestine C, Eyler LT, Jernigan TL, Prom-Wormley E,
Neale M, et al. Distinct genetic influences on cortical surface area and corticalthickness. Cereb Cortex 2009;19:728–35.
41] Passamonti L, Cerasa A, Gioia MC, Magariello A, Muglia M, Quattrone A, et al.Genetically dependent modulation of serotonergic inactivation in the humanprefrontal cortex. Neuroimage 2008;40:1264–73.
[
PRESS
D P
RO
OF
Research xxx (2010) xxx–xxx 7
42] Passamonti L, Fera F, Magariello A, Cerasa A, Gioia MC, Muglia M, et al.Monoamine oxidase-a genetic variations influence brain activity associatedwith inhibitory control: new insight into the neural correlates of impulsivity.Biol Psychiatry 2006;59:334–40.
43] Pennington BF, Filipek PA, Lefly D, Chhabildas N, Kennedy DN, Simon JH, etal. A twin MRI study of size variations in the human brain. J Cogn Neurosci2000;12:223–32.
44] Petersen RC, Smith GE, Waring SC, Ivnik RJ, Tangalos EG, Kokmen E. Mildcognitive impairment. Clinical characterization and outcome. Arch Neurol1999;56:303–8.
45] Pezawas L, Verchinski BA, Mattay VS, Callicott JH, Kolachana BS, Straub RE, et al.The brain-derived neurotrophic factor val66met polymorphism and variationin human cortical morphology. J Neurosci 2004;24:10099–102.
46] Pezawas L, Meyer-Lindenberg A, Drabant EM, Verchinski BA, Munoz KE,Kolachana BS, et al. 5-HTTLPR polymorphism impacts human cingulate-amygdala interactions: a genetic susceptibility mechanism for depression. NatNeurosci 2005;8:828–34.
47] Pfefferbaum A, Sullivan EV, Swan GE, Carmeli D. Brain structure in men remainshighly heritable in the seventh and eighth decades of life. Neurobiol Aging2000;21:63–74.
48] Sabol SZ, Hu S, Hamer D. A functional polymorphism in the monoamine oxidaseA gene promoter. Hum Genet 1998;103:273–9.
49] Shaw P, Wallace GL, Addington A, Evans A, Rapoport J, Giedd JN. Effects of theVal158Met catechol-O-methyltransferase polymorphism on cortical structurein children and adolescents. Mol Psychiatry 2009;14:348–9.
50] Shih JC, Chen K. MAO-A and -B gene knock-out mice exhibit distinctly differentbehaviour. Neurobiology 1999;7:235–46.
51] Spalletta G, Tomaiuolo F, Di Paola M, Trequattrini A, Bria P, Macaluso E, et al.The neuroanatomy of verbal working memory in schizophrenia: a voxel-basedmorphometry study. Clin Schizophr Relat Psych 2008;2:79–87.
52] Spoletini I, Cherubini A, Di Paola M, Banfi G, Rüsch N, Martinotti G, et al.Reduced fronto-temporal connectivity is associated with frontal grey matterdensity reduction and neuropsychological deficit in schizophrenia. SchizophrRes 2009;108:57–68.
53] Stroop JR. Studies of interference in serial verbal reactions. J Exp Psychol1935;18:643–62.
54] Voets NL, Hough MG, Douaud G, Matthews PM, James A, Winmill L, etal. Evidence for abnormalities of cortical development in adolescent-onsetschizophrenia. Neuroimage 2008;43:665–75.
55] Williams RB, Marchuk DA, Gadde KM, Barefoot JC, Grichnik K, Helms MJ, et al.
f MAO A VNTR polymorphism: New evidence from cortical thickness
Efunction. Neuropsychopharmacology 2003;28:533–41. 537
56] Winkler AM, Kochunov P, Blangero J, Almasy L, Zilles K, Fox PT, et al. 538
Cortical thickness or grey matter volume? The importance of selecting 539
the phenotype for imaging genetics studies. Neuroimage 2009; in press, 540
doi:10.1016/j.neuroimage.2009.12.028. 541
Related Documents