Page 1 of 33 February 2015 Neponset Outfall Catchment Analysis The federal Clean Water Act, passed in 1972, established regulation of pollutant discharges into “waters of the United States.” 1 This law requires municipalities to qualify for a permit under the National Pollutant Discharge Elimination System (NPEDS) program in order to lawfully discharge stormwater into rivers, streams, and lakes. In Massachusetts, the 2003 Region 1 Final General Permit for Stormwater Discharges from Small Municipal Separate Storm Sewer Systems (MS4) is in effect, although it expired in 2008. 2 To qualify for a permit, MS4 municipalities must, for example, provide a plan for Best Management Practices (BMPs) designed to “collectively control the discharge of the pollutant(s) of concern,” when the stormwater discharge contributes to Impaired Waters (303(d) waters). 3 The draft of the new Massachusetts MS4 requirement has been released for a period of public comment, and if adopted, MS4 municipalities will be required to adopt stronger measures for minimizing the impact of their stormwater on the cleanliness of the receiving waters and on the habitats of any endangered species in the area. 4 In 2013, the Neponset River Watershed Association (NepRWA) and MAPC secured a Community Innovation Challenge (CIC) grant from the state of Massachusetts to assist the Neponset Valley Watershed municipalities in collaborating to adopt a new approach to meet the new MS4 requirements. The CIC grant program promotes municipal efficiency through regional collaboration. In this case, the goal was to provide policy templates, recommendations, and technical tools that Neponset Valley municipalities could use to meet the new requirements of the MS4 permit. Representatives from conservation commissions and departments of public works who are both involved in the permitting or in operation and management of stormwater came together to create the Neponset Valley Regional Stormwater Collaborative. The collaborative includes representatives from Canton, Dedham, Foxborough, Medfield, Milton, Norwood, Randolph, Sharon, Stoughton, Walpole, Westwood, and the Boston Water and Sewer Commission, with Boston participating as a technical advisor. In order for Massachusetts MS4 municipalities to meet the terms of the new permit, they will likely need to meet more stringent illicit discharge detection and elimination (IDDE) requirements. “Illicit Discharges” are any discharges to the stormwater system that contains substances other than stormwater, such as chemicals, oils, gasoline, or waste. 5 Such discharges are associated with auto 1 United States Environmental Protection Agency. “Summary of the Clean Water Act.” http://www2.epa.gov/laws- regulations/summary-clean-water-act Last modified November 12, 2014 2 Environmental Protection Agency. 2003. National Pollutant Discharge Elimination System (NPEDS) General Permit for Stormwater Discharges from Small Separate Storm Sewer System. http://www.epa.gov/region1/npdes/permits/permit_final_ms4.pdf 3 United States Environmental Protection Agency 2003: 5. 4 United States Environmental Protection Agency. 2014. National Pollutant Discharge Elimination System (NPEDS) General Permits for Stormwater Discharges from Small Municipal Separate Storm Sewer Systems in Massachusetts . http://www.epa.gov/region1/npdes/stormwater/ma/2014DraftMASmallMS4GeneralPermit.pdf 5 With some exceptions. United States Environmental Protection Agency. “Illicit Discharges.” http://water.epa.gov/polwaste/nps/discharges.cfm Last modified November 28, 2012.

Welcome message from author
This document is posted to help you gain knowledge. Please leave a comment to let me know what you think about it! Share it to your friends and learn new things together.
Transcript
Page 1 of 33
February 2015
Neponset Outfall Catchment Analysis
The federal Clean Water Act, passed in 1972, established regulation of pollutant discharges into
“waters of the United States.” 1 This law requires municipalities to qualify for a permit under the
National Pollutant Discharge Elimination System (NPEDS) program in order to lawfully discharge
stormwater into rivers, streams, and lakes. In Massachusetts, the 2003 Region 1 Final General
Permit for Stormwater Discharges from Small Municipal Separate Storm Sewer Systems (MS4) is
in effect, although it expired in 2008.2 To qualify for a permit, MS4 municipalities must, for
example, provide a plan for Best Management Practices (BMPs) designed to “collectively control
the discharge of the pollutant(s) of concern,” when the stormwater discharge contributes to
Impaired Waters (303(d) waters).3 The draft of the new Massachusetts MS4 requirement has
been released for a period of public comment, and if adopted, MS4 municipalities will be
required to adopt stronger measures for minimizing the impact of their stormwater on the
cleanliness of the receiving waters and on the habitats of any endangered species in the area.4
In 2013, the Neponset River Watershed Association (NepRWA) and MAPC secured a Community
Innovation Challenge (CIC) grant from the state of Massachusetts to assist the Neponset Valley
Watershed municipalities in collaborating to adopt a new approach to meet the new MS4
requirements. The CIC grant program promotes municipal efficiency through regional
collaboration. In this case, the goal was to provide policy templates, recommendations, and
technical tools that Neponset Valley municipalities could use to meet the new requirements of the
MS4 permit. Representatives from conservation commissions and departments of public works who
are both involved in the permitting or in operation and management of stormwater came together
to create the Neponset Valley Regional Stormwater Collaborative. The collaborative includes
representatives from Canton, Dedham, Foxborough, Medfield, Milton, Norwood, Randolph,
Sharon, Stoughton, Walpole, Westwood, and the Boston Water and Sewer Commission, with
Boston participating as a technical advisor.
In order for Massachusetts MS4 municipalities to meet the terms of the new permit, they will likely
need to meet more stringent illicit discharge detection and elimination (IDDE) requirements. “Illicit
Discharges” are any discharges to the stormwater system that contains substances other than
stormwater, such as chemicals, oils, gasoline, or waste.5 Such discharges are associated with auto
1 United States Environmental Protection Agency. “Summary of the Clean Water Act.” http://www2.epa.gov/laws-
regulations/summary-clean-water-act Last modified November 12, 2014 2 Environmental Protection Agency. 2003. National Pollutant Discharge Elimination System (NPEDS) General Permit for
Stormwater Discharges from Small Separate Storm Sewer System. http://www.epa.gov/region1/npdes/permits/permit_final_ms4.pdf 3 United States Environmental Protection Agency 2003: 5. 4 United States Environmental Protection Agency. 2014. National Pollutant Discharge Elimination System (NPEDS)
General Permits for Stormwater Discharges from Small Municipal Separate Storm Sewer Systems in Massachusetts . http://www.epa.gov/region1/npdes/stormwater/ma/2014DraftMASmallMS4GeneralPermit.pdf 5 With some exceptions. United States Environmental Protection Agency. “I llicit Discharges.” http://water.epa.gov/polwaste/nps/discharges.cfm Last modified November 28, 2012.
Page 2 of 33
or other industrial activities, older residences, and failing septic systems. According to the draft
MS4 permit, Massachusetts MS4 municipalities will be required to a) delineate catchment areas
draining to each outfall, b) identify the receiving waters associated with those outfalls, and c) rate
the potential for illicit discharge of the outfall catchment areas as High, Medium, or Low. This
rating can be used as a tool to focus outreach, infrastructure, and enforcement campaigns to
property owners or neighborhoods. Meeting this standard requires technical analysis of
hydrology, topography, land use, and stormwater infrastructure.
Several public agencies have previously tackled the task of automatically delineating catchments
using topographic data, such as San Francisco, Portland, and Tampa.6 If these methods could be
adapted to the Massachusetts context, then municipalities might be able to meet the standard
more cost-effectively. However, any attempt at standardization must contend with the highly
varied quality and completeness of municipal stormwater infrastructure data and the often limited
technical capacity available at the local level. To reduce redundancy of effort and account for
the varied resources available in different cities and towns, MAPC developed a regionally
applicable method to conduct this analysis requiring a bare minimum of local stormwater
infrastructure data in a standardized format. The product is a catalog of data and a set of
ArcGIS tools that can be applied for any municipality in Massachusetts. This document describes
the method and provides municipalities with instructions for implementing it using ArcGIS and
CommunityViz, an ArcGIS add-in.
To develop a widely applicable process, we first began with a pilot analysis in the Town of
Milton. A review of the infrastructure datasets from each Neponset Watershed municipality
indicated that Milton’s data was both representative of the kinds of data available from the
Neponset municipalities, and was relatively complete. In keeping with the regional spirit of the
CIC grants, we wanted to maximize the number of communities that would be able to apply this
tool, so we used the most commonly available infrastructure datasets provided by Milton,
combined with publicly available digital elevation model (DEM), to delineate each catchment
area contributing to each outfall. For the ranking process, we used datasets on potential illicit
discharge generating sites, such as older homes and car washes, present within the catchment
areas to rank the catchments as low, medium, or high priority for inspection. These factors can be
weighted based on their importance and combined to create a composite score, providing a
measure for the low, medium, and high risk delineation.
NepRWA collected the municipal stormwater infrastructure data from the participating
municipalities and guided parts of the analysis, and MAPC conducted the analysis. We have
produced maps and digital data of the catchment areas in Milton, along with an ArcGIS toolbox
(MAPC Catchment Delineation Toolbox) and the following detailed methodology to help the other
6 “Urban Catchment Delineation Tool.” https://code.google.com/p/besasm-
toys/wiki/urbanCatchmentDelineationTool Last modified June 13, 2012; Nick Birth and Greg Braswell. 2011. “The ‘Urban Drainage’ Model: SF DPW uses Lidar DEM and Custom Algorithm for Delineating Drainage Catchments and
Hydrologic Modelling.” Bay Area Automated Mapping Association Journal 5: 5-6.http://www.baama.org/Resources/Documents/BAAMA_Journal_V5I1_LoRes.pdf .
Page 3 of 33
municipalities delineate their own outfall catchment areas.7 Additionally, we created a minimum
set of data standards for municipal stormwater infrastructure data in order for this method to be
the most effective, and provided an assessment of missing or incomplete data in each Neponset
Watershed municipality based on data that they provided. Finally, we created an Outfalls and
Impaired Waters database, which contains a report on each receiving water by municipality,
along with a list of outfalls that contribute to that water body.
Delineating Outfall Catchments
The basic process for delineating the catchment areas for each outfall was to download,
assemble, and enhance the Digital Elevation Model, then use it to define small catchments for each
catch basin, and finally aggregate those smaller catchments into larger outfall catchment areas. In
order to streamline the process for municipalities across Massachusetts, we created three custom
ArcGIS tools: the Lidar Mosaic tool, the Create Burn Raster tool, and the Complete Watershed
tool, packaged as the MAPC Catchment Delineation Toolbox. The tools are publicly available for
download on the ArcGIS Online website.8 The method requires the following input datasets:
Input Datasets for Delineating Outfall Catchments
1. Digital Elevation Model (DEM): for this analysis, we used the high resolution (1m) digital
elevation models9 These models were created from point data captured by Lidar sensors
in flights from 2002 to 2012, and processed by USGS.
2. Public Rights of Way: From the MassGIS Level 3 Parcels and MAPC Massachusetts Land
Parcel Database.10
3. Water features: MassDEP Hydrography11
4. Road center lines: MassDOT Road Inventory12
5. Catch Basins: Point feature class provided by the municipality13
6. Stormwater Pipes: Line feature class provided by the municipality
7. Outfalls: Point feature class provided by the municipality
7 The catchment delineation process requires ArcGIS 10.2 and the Spatial Analyst extension. The ranking process
requires CommunityViz. 8 Go to http://www.arcgis.com/home/item.html?id=2c01d185375c4e1ea85195b7c9b96150 to download the
toolbox. 9 United States Geological Survey. “USGS Color Ortho Imagery.” April 2013, April 2014. MassGIS.
http://www.mass.gov/anf/research-and-tech/it-serv-and-support/application-serv/office -of-geographic-information-massgis/ 10 Metropolitan Area Planning Council. “MAPC Massachusetts Land Parcel Database.” 2012. MAPC. 11 Massachusetts Department of Environmental Protection. “MassDEP Hydrography (1:25,000).” March 2010.
MassGIS. http://www.mass.gov/anf/research-and-tech/it-serv-and-support/application-serv/office -of-geographic-information-massgis/datalayers/hd.html 12 Massachusetts Department of Transportation. “”MassDOT Roads.” June 2014. MassGIS. http://www.mass.gov/anf/research-and-tech/it-serv-and-support/application-serv/office -of-geographic-
information-massgis/datalayers/eotroads.html 13 The original Milton catch basin and outfall ID fields were not populated consistently, so we gave them a CB_ID and
an OF_ID field, respectively. We also gave each interconnected system of stormwater pipes a unique identifier called “Pipesys_ID”, described below.
Page 4 of 33
Preprocessing the DEM
First, we downloaded the relevant Lidar images from MassGIS and mosaicked them into a single
DEM. We performed the following steps in ArcGIS to create a DEM that covered the entire Town
of Milton:
1. Set Null value to -9999
2. Built Pyramids and Calculated Statistics
3. Mosaicked to New Raster
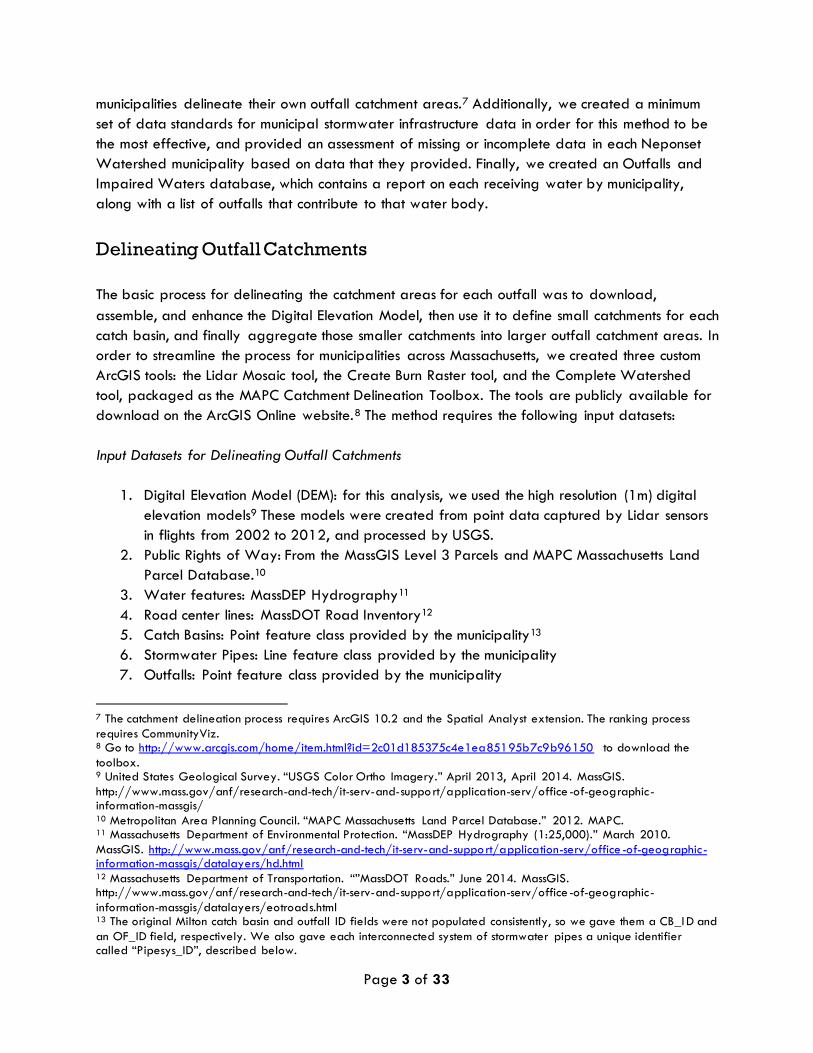
We built this process into an ArcGIS script tool called the Lidar Mosaic Tool (these tools require
the Spatial Analyst extension). To use this tool, download the relevant Lidar images from
MassGIS. Then, unzip all the files and save them in a single folder. Finally, run the tool inputting
the folder in the “workspace” box and the desired name of the output raster (without an
extension) in the “output raster” box.
Enhancing the DEM
Although the lidar elevation model has a very high spatial resolution, it is still not precise
enough to capture the relief and drainage patterns created by gutters, curbs, road crowns, or
other features that are small but greatly impact stormwater runoff patterns. In order to take these
important stormwater control features into account, we had to enhance the DEM to simulate these
features by “burning” or etching them into the DEM. This process ensures that within an urban
area, water is modeled as flowing off of properties and into roadways, where it cannot leave a
gutter once it enters one, and does not cross the crown of the road. In addition to modeling
features of the urban landscape more faithfully, we burned in the streambeds and other bodies
of water because the DEM did not accurately capture the known streambed for smaller streams
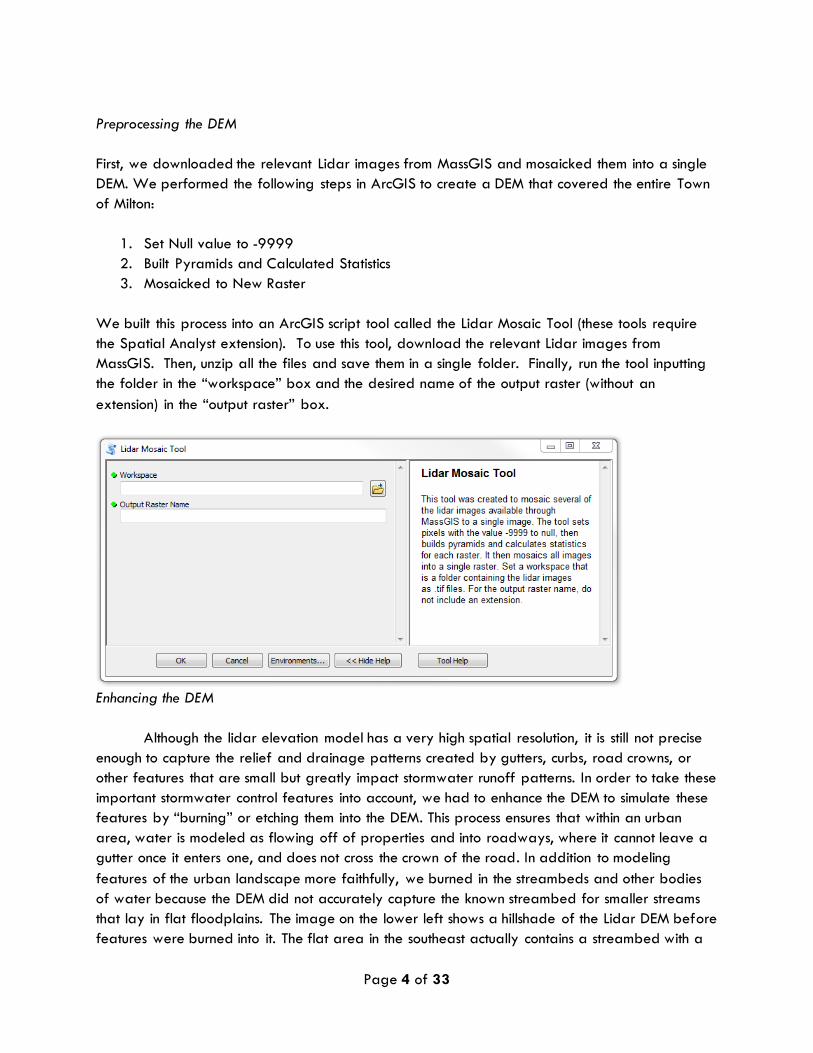
that lay in flat floodplains. The image on the lower left shows a hillshade of the Lidar DEM before
features were burned into it. The flat area in the southeast actually contains a streambed with a
Page 5 of 33
flat floodplain, which does not appear on the DEM, which means that the watershed tool will not
accurately map the flow accumulation in this area. The roads also appear completely flat, as the
slight curve of the road crown is not represented in the DEM. The lower right image shows the
area after gutters, road crowns, and water bodies have been burned into it, which corrects these
flat areas by etching known features into the elevation model, making it more representative of
the hydrologic conditions in the area.
Figure 1. Hillshades before and after enhancement.
We created several “burn” rasters, which are raster representations of features such as
streams or gutters. The cells representing the feature are set to the “burn value,” or the value that
will be added to the original DEM, and all other cells are set to 0. We created a tool for use in
ArcGIS to create these rasters more easily. See the table below for the burn values that we used
to enhance the DEM.
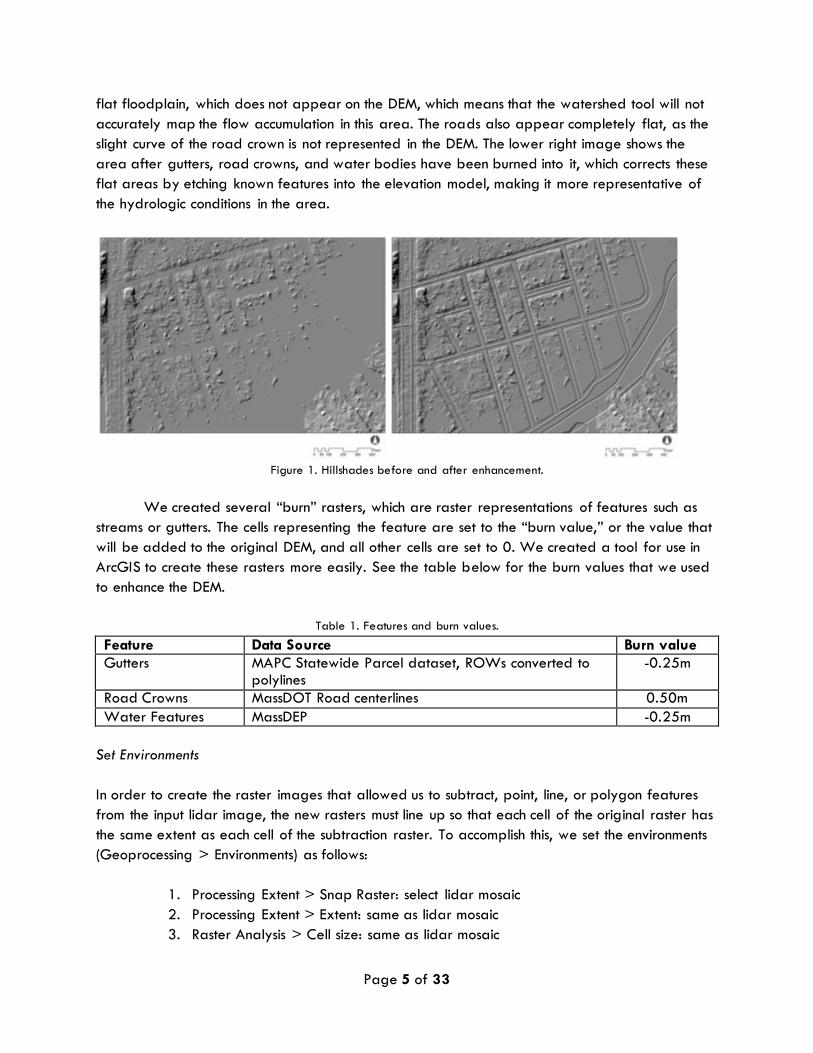
Table 1. Features and burn values.
Feature Data Source Burn value
Gutters MAPC Statewide Parcel dataset, ROWs converted to polylines
-0.25m
Road Crowns MassDOT Road centerlines 0.50m
Water Features MassDEP -0.25m
Set Environments
In order to create the raster images that allowed us to subtract, point, line, or polygon features
from the input lidar image, the new rasters must line up so that each cell of the original raster has
the same extent as each cell of the subtraction raster. To accomplish this, we set the environments
(Geoprocessing > Environments) as follows:
1. Processing Extent > Snap Raster: select lidar mosaic
2. Processing Extent > Extent: same as lidar mosaic
3. Raster Analysis > Cell size: same as lidar mosaic
Page 6 of 33
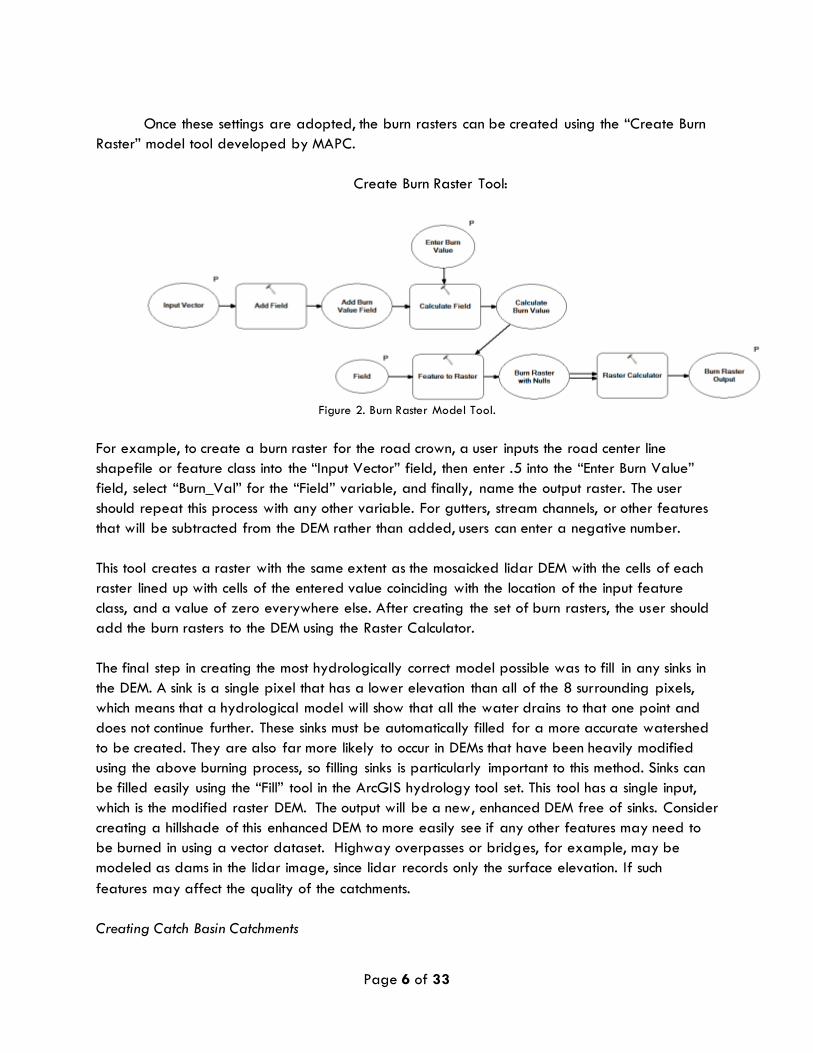
Once these settings are adopted, the burn rasters can be created using the “Create Burn
Raster” model tool developed by MAPC.
Create Burn Raster Tool:
Figure 2. Burn Raster Model Tool.
For example, to create a burn raster for the road crown, a user inputs the road center line
shapefile or feature class into the “Input Vector” field, then enter .5 into the “Enter Burn Value”
field, select “Burn_Val” for the “Field” variable, and finally, name the output raster. The user
should repeat this process with any other variable. For gutters, stream channels, or other features
that will be subtracted from the DEM rather than added, users can enter a negative number.
This tool creates a raster with the same extent as the mosaicked lidar DEM with the cells of each
raster lined up with cells of the entered value coinciding with the location of the input feature
class, and a value of zero everywhere else. After creating the set of burn rasters, the user should
add the burn rasters to the DEM using the Raster Calculator.
The final step in creating the most hydrologically correct model possible was to fill in any sinks in
the DEM. A sink is a single pixel that has a lower elevation than all of the 8 surrounding pixels,
which means that a hydrological model will show that all the water drains to that one point and
does not continue further. These sinks must be automatically filled for a more accurate watershed
to be created. They are also far more likely to occur in DEMs that have been heavily modified
using the above burning process, so filling sinks is particularly important to this method. Sinks can
be filled easily using the “Fill” tool in the ArcGIS hydrology tool set. This tool has a single input,
which is the modified raster DEM. The output will be a new, enhanced DEM free of sinks. Consider
creating a hillshade of this enhanced DEM to more easily see if any other features may need to
be burned in using a vector dataset. Highway overpasses or bridges, for example, may be
modeled as dams in the lidar image, since lidar records only the surface elevation. If such
features may affect the quality of the catchments.
Creating Catch Basin Catchments
Page 7 of 33
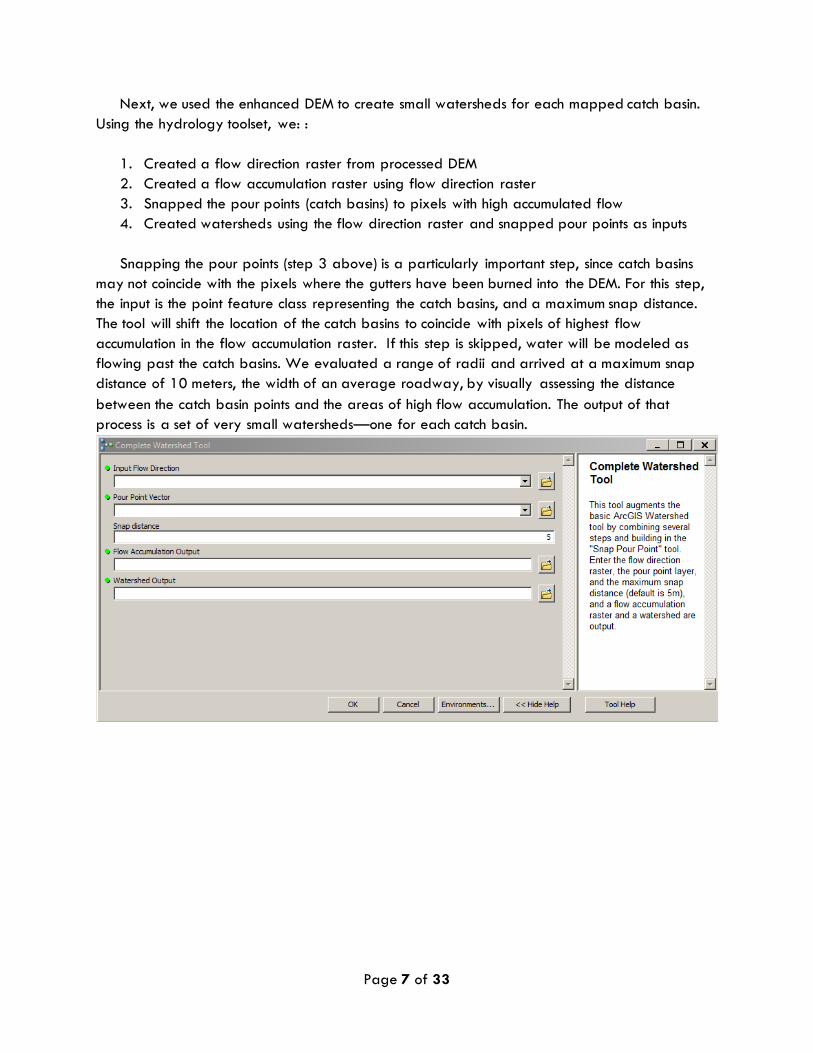
Next, we used the enhanced DEM to create small watersheds for each mapped catch basin.
Using the hydrology toolset, we: :
1. Created a flow direction raster from processed DEM
2. Created a flow accumulation raster using flow direction raster
3. Snapped the pour points (catch basins) to pixels with high accumulated flow
4. Created watersheds using the flow direction raster and snapped pour points as inputs
Snapping the pour points (step 3 above) is a particularly important step, since catch basins
may not coincide with the pixels where the gutters have been burned into the DEM. For this step,
the input is the point feature class representing the catch basins, and a maximum snap distance.
The tool will shift the location of the catch basins to coincide with pixels of highest flow
accumulation in the flow accumulation raster. If this step is skipped, water will be modeled as
flowing past the catch basins. We evaluated a range of radii and arrived at a maximum snap
distance of 10 meters, the width of an average roadway, by visually assessing the distance
between the catch basin points and the areas of high flow accumulation. The output of that
process is a set of very small watersheds—one for each catch basin.
Page 8 of 33
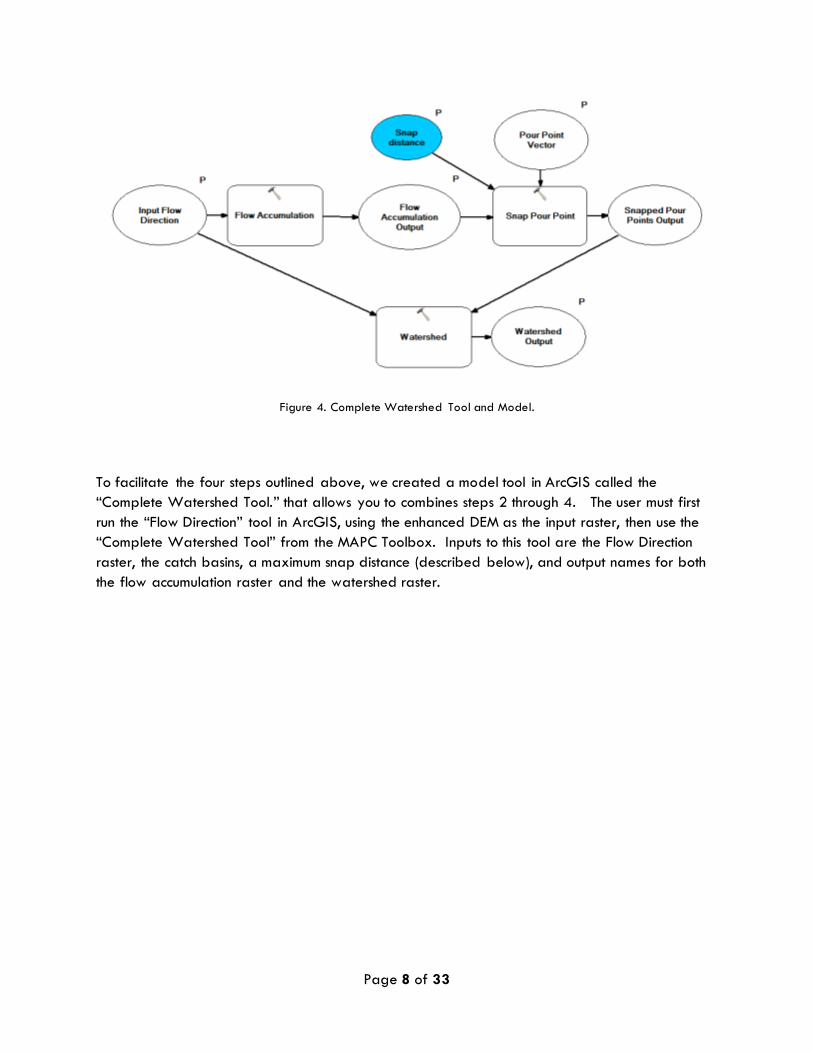
Figure 4. Complete Watershed Tool and Model.
To facilitate the four steps outlined above, we created a model tool in ArcGIS called the
“Complete Watershed Tool.” that allows you to combines steps 2 through 4. The user must first
run the “Flow Direction” tool in ArcGIS, using the enhanced DEM as the input raster, then use the
“Complete Watershed Tool” from the MAPC Toolbox. Inputs to this tool are the Flow Direction
raster, the catch basins, a maximum snap distance (described below), and output names for both
the flow accumulation raster and the watershed raster.
Page 9 of 33
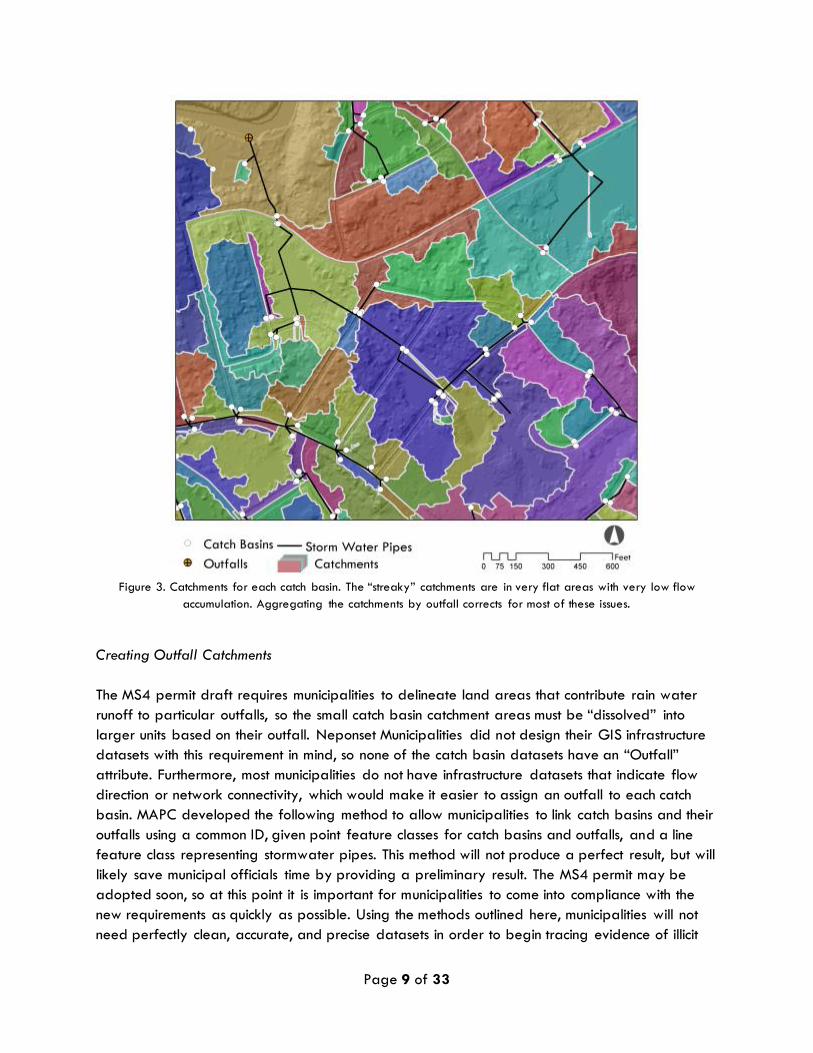
Figure 3. Catchments for each catch basin. The “streaky” catchments are in very flat areas with very low flow
accumulation. Aggregating the catchments by outfall corrects for most of these issues.
Creating Outfall Catchments
The MS4 permit draft requires municipalities to delineate land areas that contribute rain water
runoff to particular outfalls, so the small catch basin catchment areas must be “dissolved” into
larger units based on their outfall. Neponset Municipalities did not design their GIS infrastructure
datasets with this requirement in mind, so none of the catch basin datasets have an “Outfall”
attribute. Furthermore, most municipalities do not have infrastructure datasets that indicate flow
direction or network connectivity, which would make it easier to assign an outfall to each catch
basin. MAPC developed the following method to allow municipalities to link catch basins and their
outfalls using a common ID, given point feature classes for catch basins and outfalls, and a line
feature class representing stormwater pipes. This method will not produce a perfect result, but will
likely save municipal officials time by providing a preliminary result. The MS4 permit may be
adopted soon, so at this point it is important for municipalities to come into compliance with the
new requirements as quickly as possible. Using the methods outlined here, municipalities will not
need perfectly clean, accurate, and precise datasets in order to begin tracing evidence of illicit
Page 10 of 33
discharge discovered at an outfall back to the land area that contributed rain water to that
outfall.
Creating “pipe system” IDs
To connect catch basins to their outfalls, we:
1. Buffered the pipe line features out according to the pipe diameter, then dissolve.
2. Created a “Pipesys_ID” field in the attribute table of the new pipe polygon feature class.
3. Populated the “Pipesys_ID” field with the OID number using the field calculator.
4. Performed a spatial join to link the original pipe line network to the pipe polygon feature
class.
5. Performed additional spatial joins to link the pipe polygon feature class to both the catch
basins and the outfalls.
At this point, all interconnected pipes shared a Pipesys_ID, and all associated outfalls and
catch basins shared that ID. When selecting the buffer distance, we visually inspected the spatial
relationship between a sample of the catch basins and outfalls and the pipe lines. Although in
some cases the point features were not snapped to the line network precisely, in most cases they
still intersected with the buffered pipe systems, so the imprecision did not affect the results.
Another way to address snapping errors in the data would be to set a search distance when
performing the spatial join.
Checking the data
After applying the automated method above to Milton’s data, we noticed several
inconsistencies in the infrastructure data. Common errors include pipe systems without associated
outfalls, catch basins with no associated pipe networks, interconnected pipe networks, and outfalls
with no associated pipe network or “uphill” outfalls. We met with officials from Milton’s
Department of Public Works to correct some of these areas based on their local knowledge. The
local DPW staff informed us of some of the most common sources for these errors. The Milton
DPW has a very complete dataset recording the location of every catch basin in the municipality.
Because those features are easily visible from the surface, and their locations are relatively
predictable, they were able to perform a survey recording each catch basin location in the town
with a GPS. The underground components of the infrastructure were much more difficult for them
to survey, because the pipe networks may be very old in some parts of town, or are not owned or
operated by the municipality, and they do not have access to the plans for those segments of
pipes and their associated outfalls.
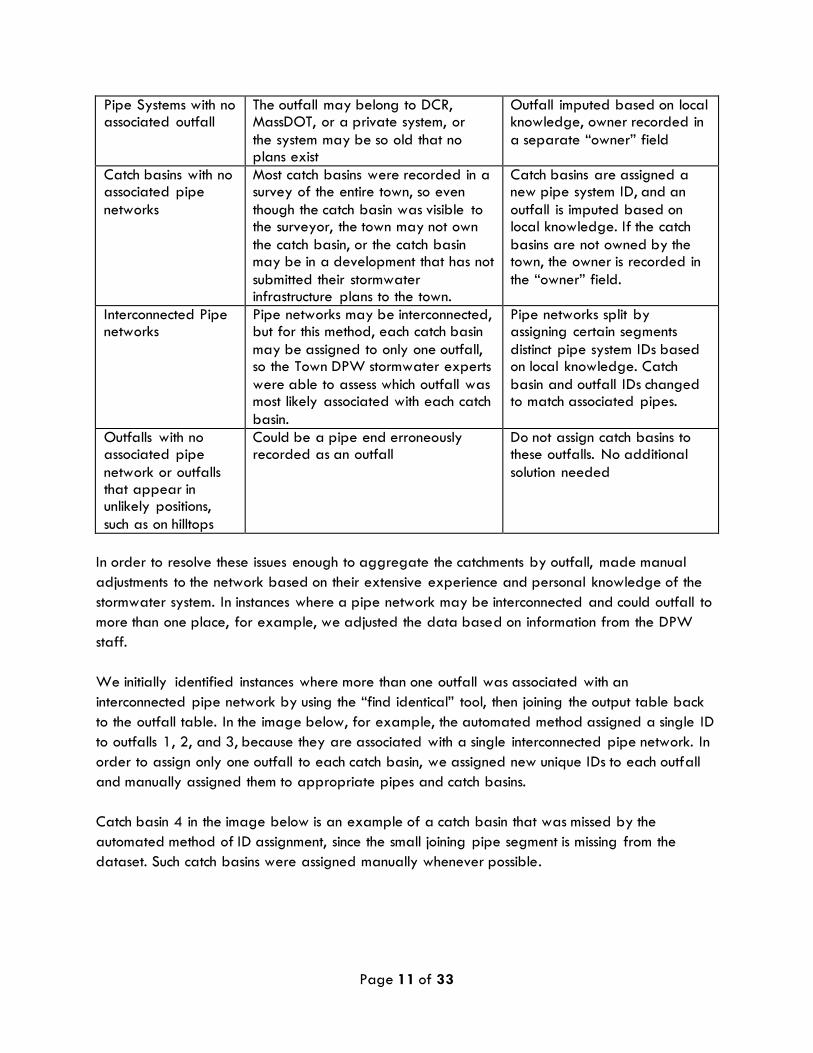
Table 2. Common problems with municipal stormwater data.
Data Problem Common Causes Solution
Page 11 of 33
Pipe Systems with no associated outfall
The outfall may belong to DCR, MassDOT, or a private system, or
the system may be so old that no plans exist
Outfall imputed based on local knowledge, owner recorded in
a separate “owner” field
Catch basins with no associated pipe
networks
Most catch basins were recorded in a survey of the entire town, so even
though the catch basin was visible to the surveyor, the town may not own
the catch basin, or the catch basin may be in a development that has not
submitted their stormwater infrastructure plans to the town.
Catch basins are assigned a new pipe system ID, and an
outfall is imputed based on local knowledge. If the catch
basins are not owned by the town, the owner is recorded in
the “owner” field.
Interconnected Pipe networks
Pipe networks may be interconnected, but for this method, each catch basin
may be assigned to only one outfall, so the Town DPW stormwater experts
were able to assess which outfall was most likely associated with each catch
basin.
Pipe networks split by assigning certain segments
distinct pipe system IDs based on local knowledge. Catch
basin and outfall IDs changed to match associated pipes.
Outfalls with no associated pipe
network or outfalls that appear in unlikely positions,
such as on hilltops
Could be a pipe end erroneously recorded as an outfall
Do not assign catch basins to these outfalls. No additional
solution needed
In order to resolve these issues enough to aggregate the catchments by outfall, made manual
adjustments to the network based on their extensive experience and personal knowledge of the
stormwater system. In instances where a pipe network may be interconnected and could outfall to
more than one place, for example, we adjusted the data based on information from the DPW
staff.
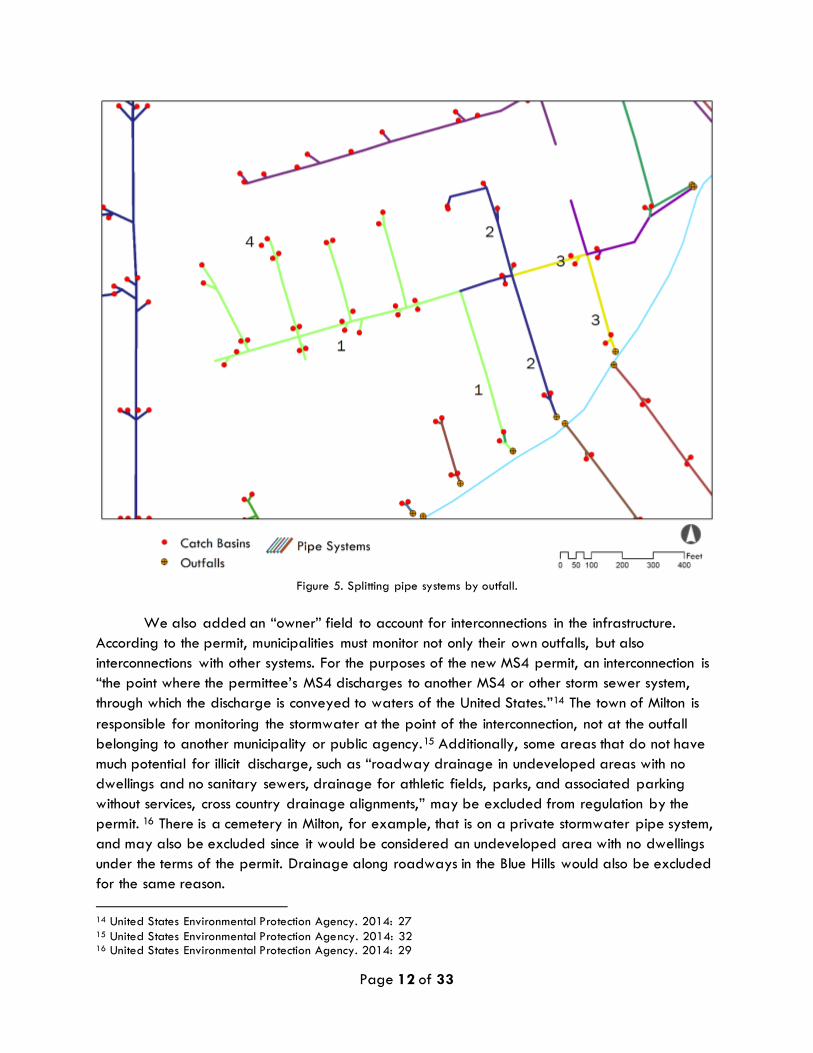
We initially identified instances where more than one outfall was associated with an
interconnected pipe network by using the “find identical” tool, then joining the output table back
to the outfall table. In the image below, for example, the automated method assigned a single ID
to outfalls 1, 2, and 3, because they are associated with a single interconnected pipe network. In
order to assign only one outfall to each catch basin, we assigned new unique IDs to each outfall
and manually assigned them to appropriate pipes and catch basins.
Catch basin 4 in the image below is an example of a catch basin that was missed by the
automated method of ID assignment, since the small joining pipe segment is missing from the
dataset. Such catch basins were assigned manually whenever possible.
Page 12 of 33
Figure 5. Splitting pipe systems by outfall.
We also added an “owner” field to account for interconnections in the infrastructure.
According to the permit, municipalities must monitor not only their own outfalls, but also
interconnections with other systems. For the purposes of the new MS4 permit, an interconnection is
“the point where the permittee’s MS4 discharges to another MS4 or other storm sewer system,
through which the discharge is conveyed to waters of the United States.”14 The town of Milton is
responsible for monitoring the stormwater at the point of the interconnection, not at the outfall
belonging to another municipality or public agency.15 Additionally, some areas that do not have
much potential for illicit discharge, such as “roadway drainage in undeveloped areas with no
dwellings and no sanitary sewers, drainage for athletic fields, parks, and associated parking
without services, cross country drainage alignments,” may be excluded from regulation by the
permit. 16 There is a cemetery in Milton, for example, that is on a private stormwater pipe system,
and may also be excluded since it would be considered an undeveloped area with no dwellings
under the terms of the permit. Drainage along roadways in the Blue Hills would also be excluded
for the same reason.
14 United States Environmental Protection Agency. 2014: 27 15 United States Environmental Protection Agency. 2014: 32 16 United States Environmental Protection Agency. 2014: 29
Page 13 of 33
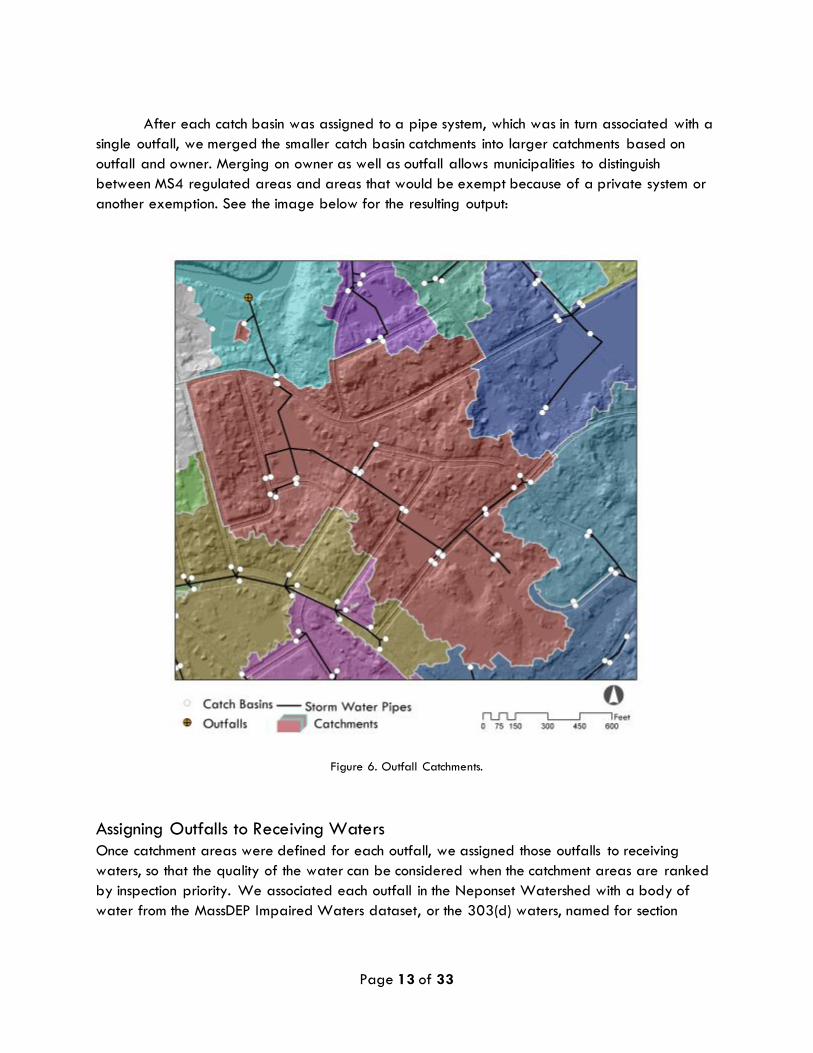
After each catch basin was assigned to a pipe system, which was in turn associated with a
single outfall, we merged the smaller catch basin catchments into larger catchments based on
outfall and owner. Merging on owner as well as outfall allows municipalities to distinguish
between MS4 regulated areas and areas that would be exempt because of a private system or
another exemption. See the image below for the resulting output:
Figure 6. Outfall Catchments.
Assigning Outfalls to Receiving Waters
Once catchment areas were defined for each outfall, we assigned those outfalls to receiving
waters, so that the quality of the water can be considered when the catchment areas are ranked
by inspection priority. We associated each outfall in the Neponset Watershed with a body of
water from the MassDEP Impaired Waters dataset, or the 303(d) waters, named for section
Page 14 of 33
303(d) of the Federal Clean Water Act. 17 Section 303(d) requires each state to monitor the
quality of its bodies of water. This dataset includes both a line and polygon feature class
representing the bodies of water that MassDEP monitors according to the requirements of section
303(d).18 Each stream segment or lake has a unique identifier, or “AU ID”, which allows the user
to link the spatial data to either of the two data tables, described below. The new MS4 permit
will most likely require municipalities to be able to identify which properties will produce runoff
that will feed into a catch basin, which will ultimately outfall to each body of water in the 303(d)
dataset. Our methodology so far has made the connection between an area of land, or
catchment, through the stormwater drainage system to the outfall. The next section describes the
connection between the outfalls and the receiving waters that they feed.
The first step of this process was to associate each outfall with a body of water from the 303(d)
Integrated List of Waters (IL Waters) dataset, maintained by MassDEP and available through
MassGIS. Because the 303(d) dataset does not include smaller streams, it was often difficult to tell
which was the receiving water. To deal with this challenge with the Milton dataset, since we had
already downloaded, processed, and mosaicked a high-resolution DEM, we created a custom
stream network using the hydrology toolset and the pre-processed DEM to identify the much
smaller streams and brooks including intermittent drainage that connect outfalls to larger bodies
of water.
Using a flow accumulation raster created using a raw DEM we used the Con tool to create a
raster with a value of 1 for pixels with a flow accumulation value above 20,000. Then, we
converted this raster dataset into a vector using the Stream to Feature tool. Using this custom
stream network, we were able to assign each outfall to a downstream body of water with an
impairment classification.
For the other municipalities, for which we had not downloaded and mosaicked lidar DEMs, we
used pre-existing datasets to determine which 303(d) water a particular outfall discharges to. The
general process was straight-forward, and done manually, by visually assessing which 303(d)
water body an outfall was associated with, and assigning the corresponding AU ID to the outfall.
Because each city and town records its stormwater data differently, we added several fields to
each outfall layer to aid in standardizing the outfall datasets. Many municipalities did not have
unique identifiers for their outfalls, or were inconsistent in filling in a value for that field, so we
added an “OF_ID” field as a unique identifier. The unique identifier we assigned has the prefix
of the municipal ID number, a value from 1 to 351 assigned by the Massachusetts Department of
Revenue, followed by a hyphen and an integer starting with 1. We also added the latitude and
longitude in decimal degrees, so that the outfalls could be mapped from the exported table if
17 Visit http://www.mass.gov/anf/research-and-tech/it-serv-and-support/application-serv/office-of-geographic-
information-massgis/datalayers/wbs2012.html for details and metadata. 18 Massachusetts Department of Environmental Protection. “MassDEP 2012 Integrated List of Waters
(305(b)/303(d)).” May 2013. MassGIS. http://www.mass.gov/anf/research-and-tech/it-serv-and-support/application-serv/office-of-geographic-info rmation-massgis/datalayers/wbs2012.html
Page 15 of 33
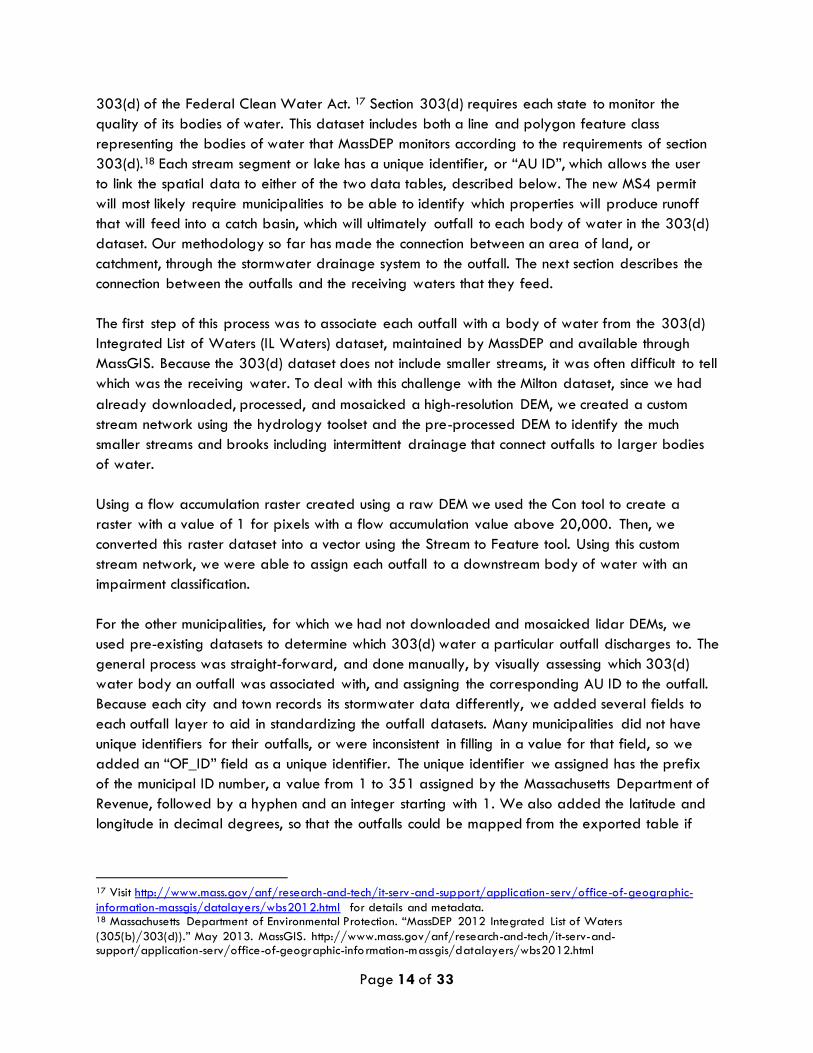
necessary. Finally, we added an “AU_ID” (Assessment Unit ID) field that would contain the ID of
the associated impaired body of water from the Impaired Waters dataset, described below.
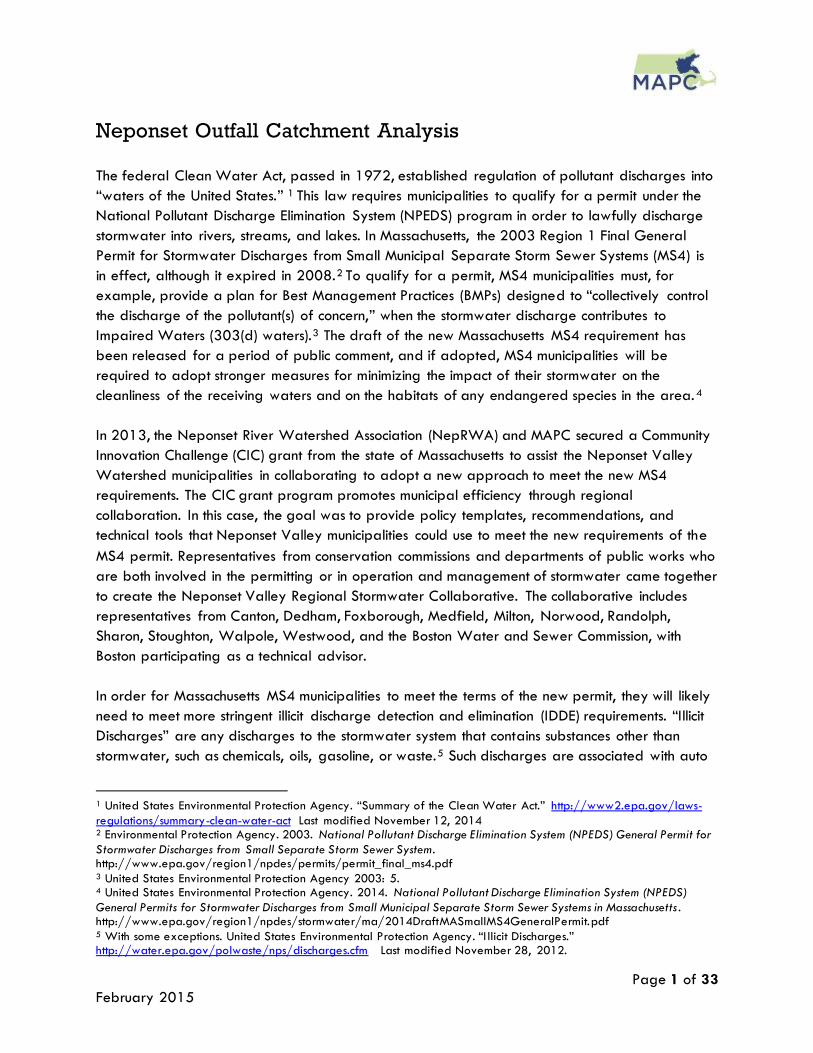
Fig 1. Mass DEP Impaired Waters dataset, available through MassGIS. Labels are AU_IDs
Our general strategy was to select outfalls within 100 m of a particular feature, and then use the
field calculator to assign the appropriate AU ID. Figure 2 illustrates how few outfalls can be
assigned AU IDs based only on the Impaired Waters dataset. Fortunately, many finer-grained
datasets are available to supplement this dataset.
Page 16 of 33
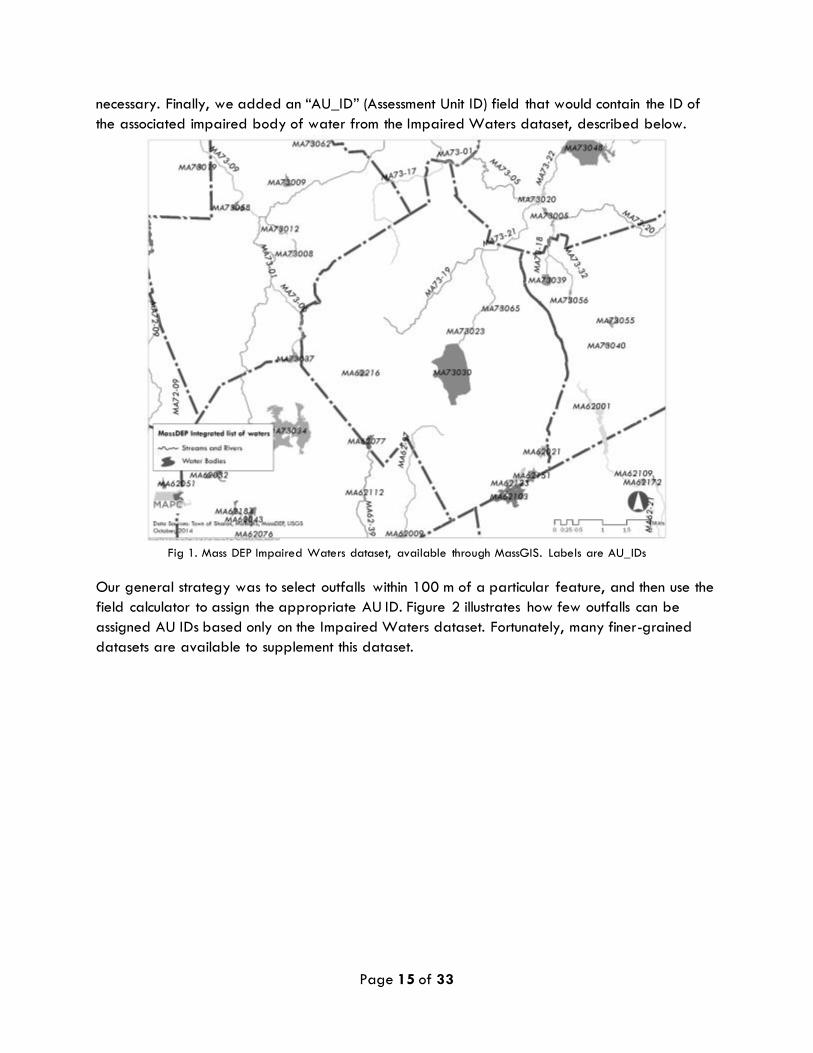
Figure 2. The Impaired Waters (Integrated list of waters) dataset. Red outfalls outfall directly to an impaired water.
Gray outfalls cannot be assigned based on this dataset alone.
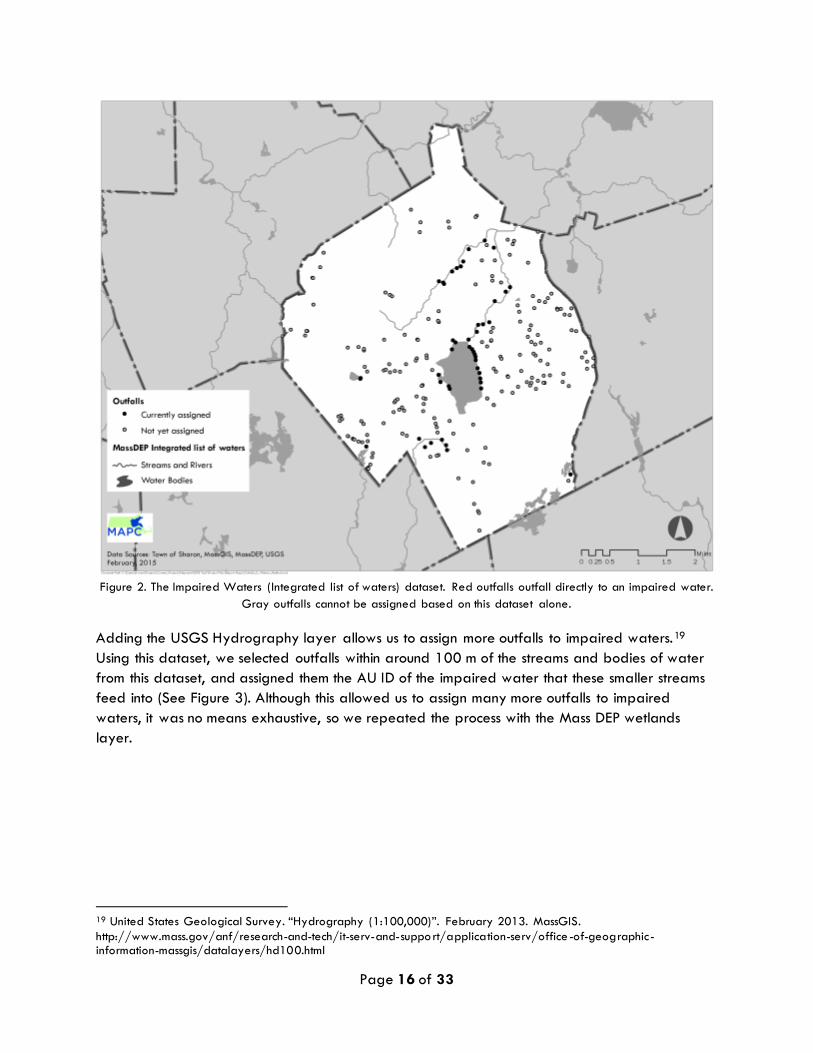
Adding the USGS Hydrography layer allows us to assign more outfalls to impaired waters.19
Using this dataset, we selected outfalls within around 100 m of the streams and bodies of water
from this dataset, and assigned them the AU ID of the impaired water that these smaller streams
feed into (See Figure 3). Although this allowed us to assign many more outfalls to impaired
waters, it was no means exhaustive, so we repeated the process with the Mass DEP wetlands
layer.
19 United States Geological Survey. “Hydrography (1:100,000)”. February 2013. MassGIS.
http://www.mass.gov/anf/research-and-tech/it-serv-and-support/application-serv/office -of-geographic-information-massgis/datalayers/hd100.html
Page 17 of 33
Figure 3. Using the USGS Hydrography dataset to associate the outfall to the Impaired Water.
Figure 4. Using the USGS Hydrography dataset to assign an AU ID to additional outfalls.
Page 18 of 33
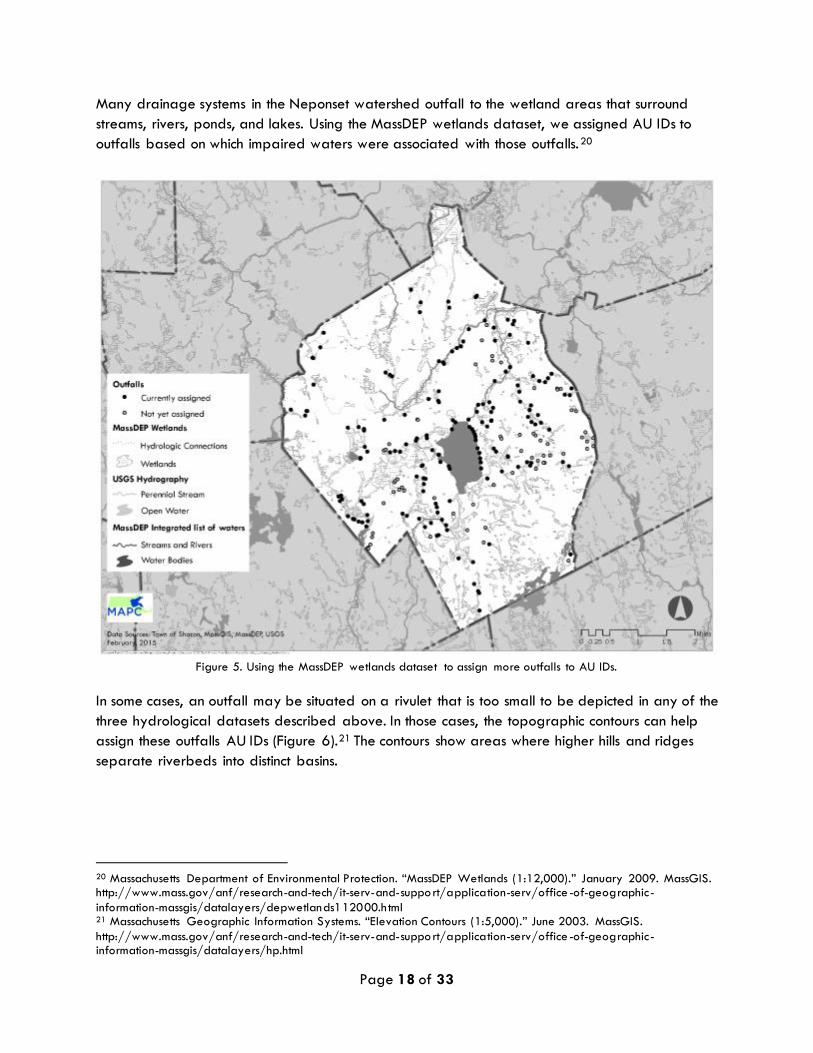
Many drainage systems in the Neponset watershed outfall to the wetland areas that surround
streams, rivers, ponds, and lakes. Using the MassDEP wetlands dataset, we assigned AU IDs to
outfalls based on which impaired waters were associated with those outfalls.20
Figure 5. Using the MassDEP wetlands dataset to assign more outfalls to AU IDs.
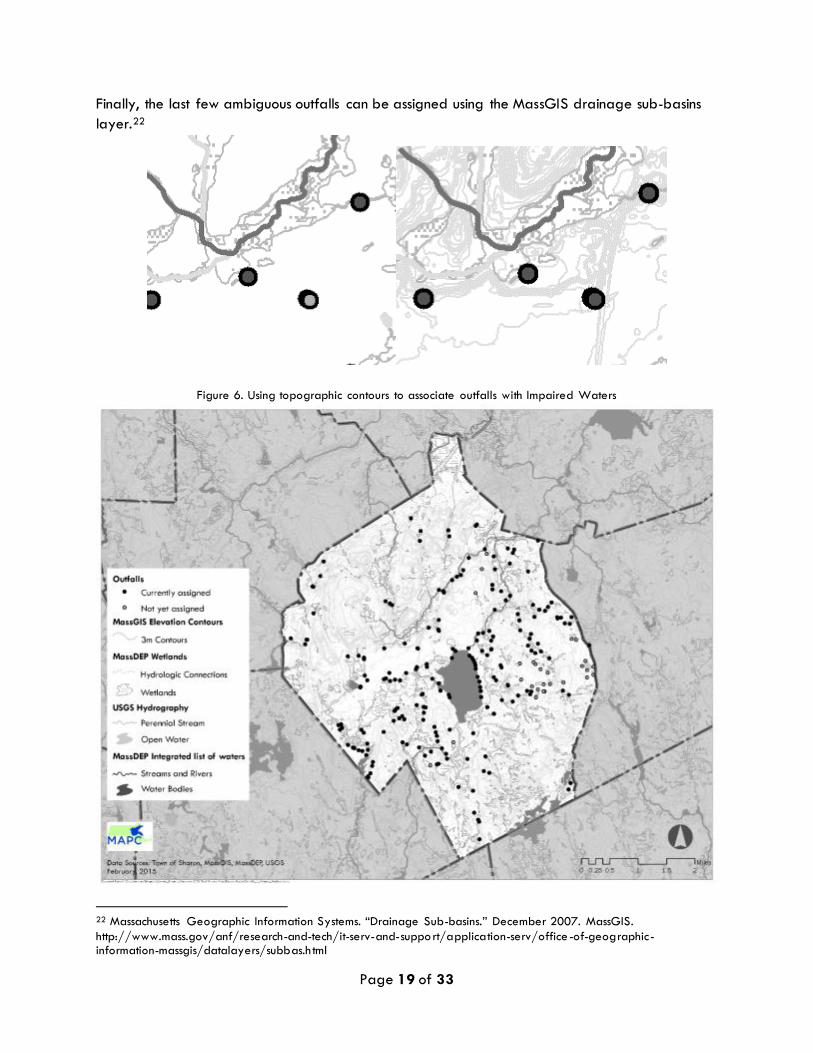
In some cases, an outfall may be situated on a rivulet that is too small to be depicted in any of the
three hydrological datasets described above. In those cases, the topographic contours can help
assign these outfalls AU IDs (Figure 6).21 The contours show areas where higher hills and ridges
separate riverbeds into distinct basins.
20 Massachusetts Department of Environmental Protection. “MassDEP Wetlands (1:12,000).” January 2009. MassGIS. http://www.mass.gov/anf/research-and-tech/it-serv-and-support/application-serv/office -of-geographic-
information-massgis/datalayers/depwetlands112000.html 21 Massachusetts Geographic Information Systems. “Elevation Contours (1:5,000).” June 2003. MassGIS.
http://www.mass.gov/anf/research-and-tech/it-serv-and-support/application-serv/office -of-geographic-information-massgis/datalayers/hp.html
Page 19 of 33
Finally, the last few ambiguous outfalls can be assigned using the MassGIS drainage sub-basins
layer.22
Figure 6. Using topographic contours to associate outfalls with Impaired Waters
22 Massachusetts Geographic Information Systems. “Drainage Sub-basins.” December 2007. MassGIS.
http://www.mass.gov/anf/research-and-tech/it-serv-and-support/application-serv/office -of-geographic-information-massgis/datalayers/subbas.h tml
Page 20 of 33
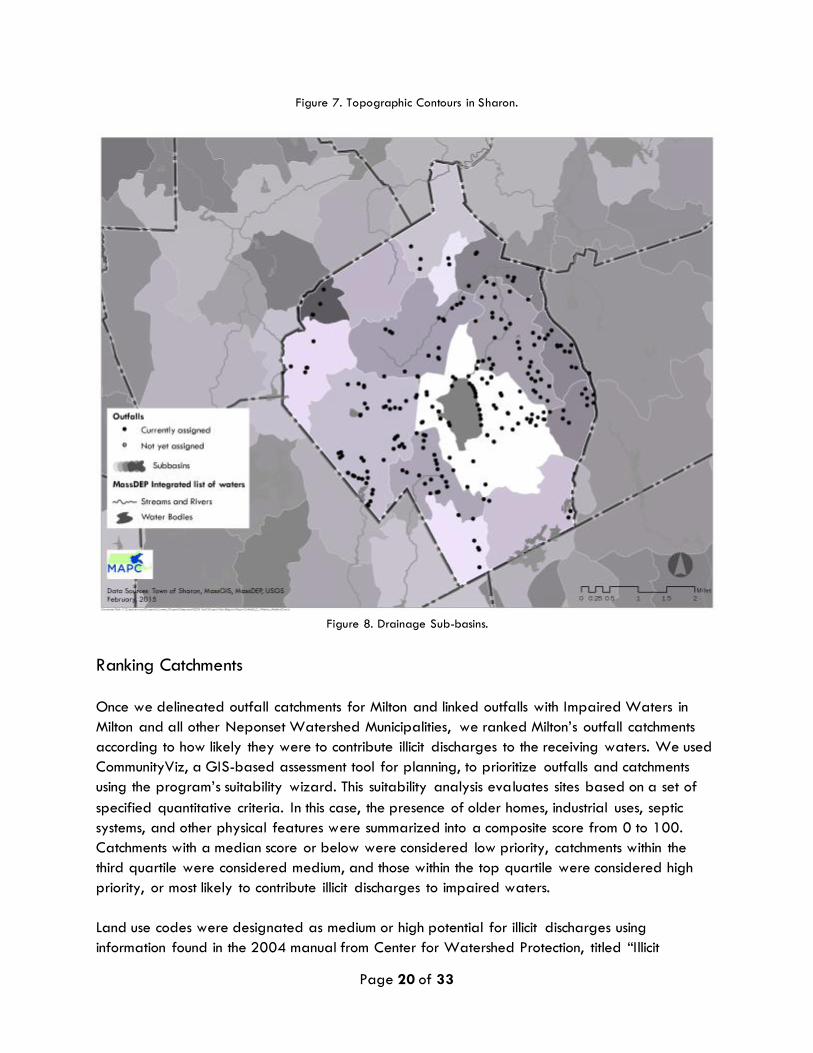
Figure 7. Topographic Contours in Sharon.
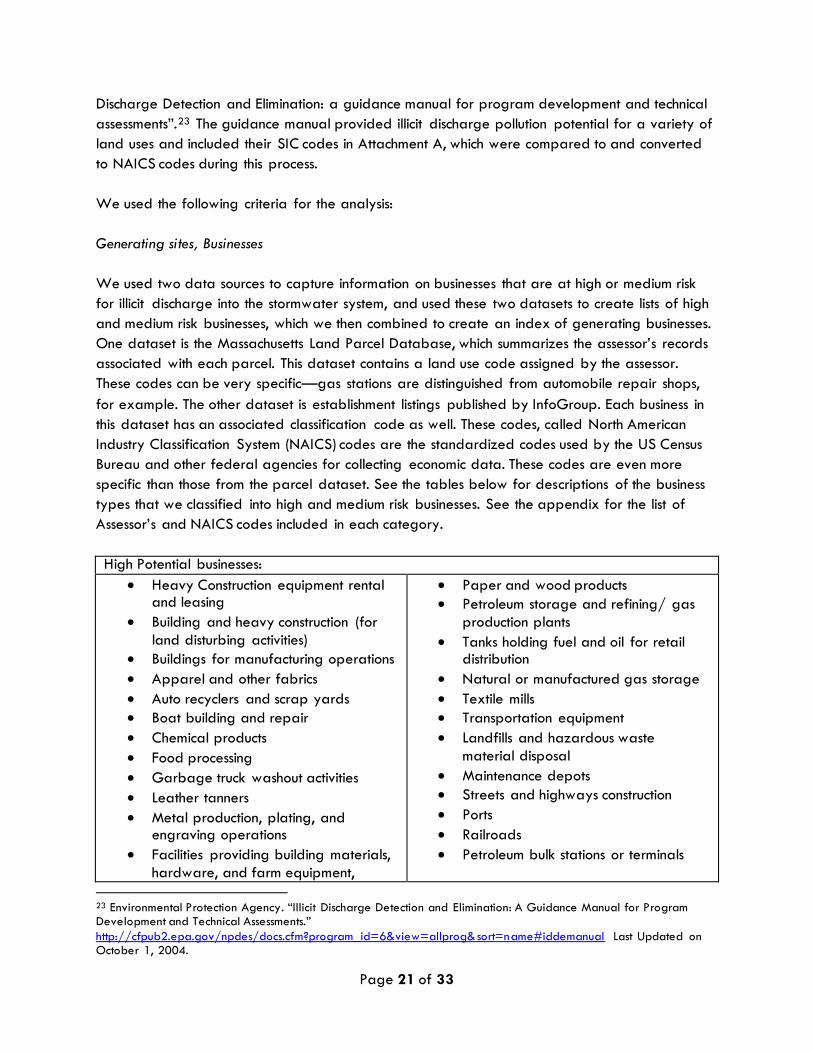
Figure 8. Drainage Sub-basins.
Ranking Catchments
Once we delineated outfall catchments for Milton and linked outfalls with Impaired Waters in
Milton and all other Neponset Watershed Municipalities, we ranked Milton’s outfall catchments
according to how likely they were to contribute illicit discharges to the receiving waters. We used
CommunityViz, a GIS-based assessment tool for planning, to prioritize outfalls and catchments
using the program’s suitability wizard. This suitability analysis evaluates sites based on a set of
specified quantitative criteria. In this case, the presence of older homes, industrial uses, septic
systems, and other physical features were summarized into a composite score from 0 to 100.
Catchments with a median score or below were considered low priority, catchments within the
third quartile were considered medium, and those within the top quartile were considered high
priority, or most likely to contribute illicit discharges to impaired waters.
Land use codes were designated as medium or high potential for illicit discharges using
information found in the 2004 manual from Center for Watershed Protection, titled “Illicit
Page 21 of 33
Discharge Detection and Elimination: a guidance manual for program development and technical
assessments”.23 The guidance manual provided illicit discharge pollution potential for a variety of
land uses and included their SIC codes in Attachment A, which were compared to and converted
to NAICS codes during this process.
We used the following criteria for the analysis:
Generating sites, Businesses
We used two data sources to capture information on businesses that are at high or medium risk
for illicit discharge into the stormwater system, and used these two datasets to create lists of high
and medium risk businesses, which we then combined to create an index of generating businesses.
One dataset is the Massachusetts Land Parcel Database, which summarizes the assessor’s records
associated with each parcel. This dataset contains a land use code assigned by the assessor.
These codes can be very specific—gas stations are distinguished from automobile repair shops,
for example. The other dataset is establishment listings published by InfoGroup. Each business in
this dataset has an associated classification code as well. These codes, called North American
Industry Classification System (NAICS) codes are the standardized codes used by the US Census
Bureau and other federal agencies for collecting economic data. These codes are even more
specific than those from the parcel dataset. See the tables below for descriptions of the business
types that we classified into high and medium risk businesses. See the appendix for the list of
Assessor’s and NAICS codes included in each category.
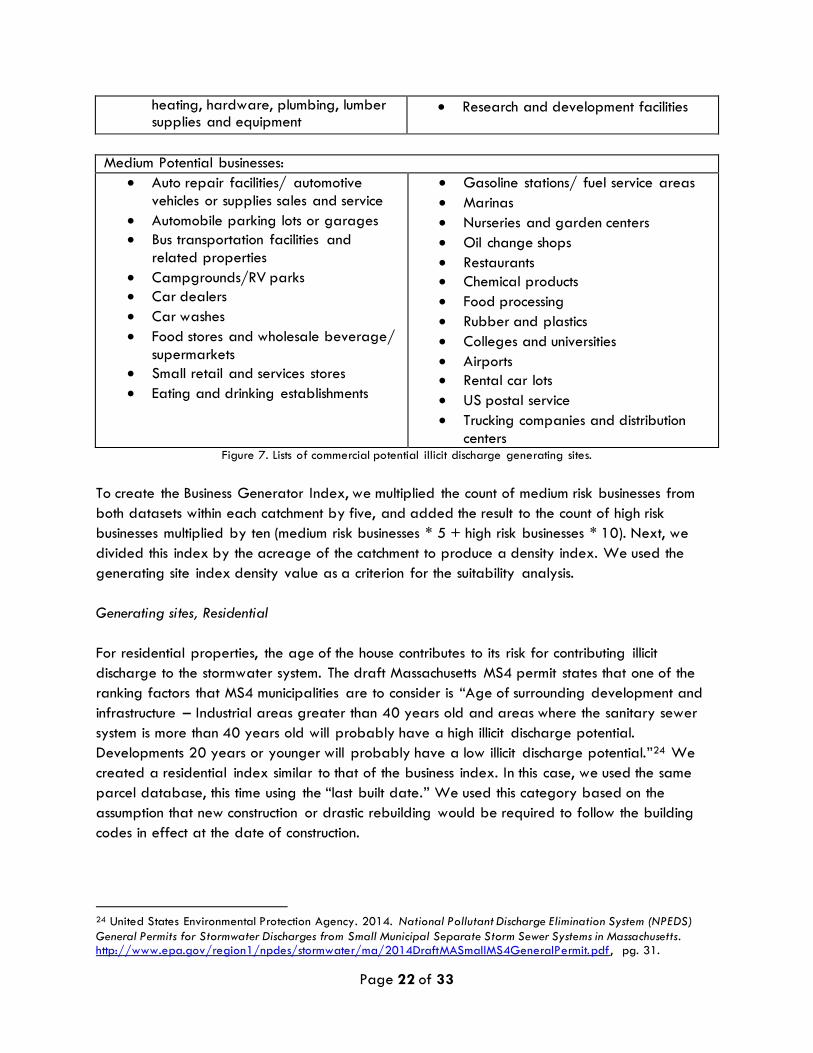
High Potential businesses:
Heavy Construction equipment rental and leasing
Building and heavy construction (for
land disturbing activities)
Buildings for manufacturing operations
Apparel and other fabrics
Auto recyclers and scrap yards
Boat building and repair
Chemical products
Food processing
Garbage truck washout activities
Leather tanners
Metal production, plating, and engraving operations
Facilities providing building materials,
hardware, and farm equipment,
Paper and wood products
Petroleum storage and refining/ gas
production plants
Tanks holding fuel and oil for retail distribution
Natural or manufactured gas storage
Textile mills
Transportation equipment
Landfills and hazardous waste
material disposal
Maintenance depots
Streets and highways construction
Ports
Railroads
Petroleum bulk stations or terminals
23 Environmental Protection Agency. “Illicit Discharge Detection and Elimination: A Guidance Manual for Program Development and Technical Assessments.”
http://cfpub2.epa.gov/npdes/docs.cfm?program_id=6&view=allprog&sort=name#iddemanual Last Updated on October 1, 2004.
Page 22 of 33
heating, hardware, plumbing, lumber supplies and equipment
Research and development facilities
Medium Potential businesses:
Auto repair facilities/ automotive
vehicles or supplies sales and service
Automobile parking lots or garages
Bus transportation facilities and
related properties
Campgrounds/RV parks
Car dealers
Car washes
Food stores and wholesale beverage/
supermarkets
Small retail and services stores
Eating and drinking establishments
Gasoline stations/ fuel service areas
Marinas
Nurseries and garden centers
Oil change shops
Restaurants
Chemical products
Food processing
Rubber and plastics
Colleges and universities
Airports
Rental car lots
US postal service
Trucking companies and distribution
centers Figure 7. Lists of commercial potential illicit discharge generating sites.
To create the Business Generator Index, we multiplied the count of medium risk businesses from
both datasets within each catchment by five, and added the result to the count of high risk
businesses multiplied by ten (medium risk businesses * 5 + high risk businesses * 10). Next, we
divided this index by the acreage of the catchment to produce a density index. We used the
generating site index density value as a criterion for the suitability analysis.
Generating sites, Residential
For residential properties, the age of the house contributes to its risk for contributing illicit
discharge to the stormwater system. The draft Massachusetts MS4 permit states that one of the
ranking factors that MS4 municipalities are to consider is “Age of surrounding development and
infrastructure – Industrial areas greater than 40 years old and areas where the sanitary sewer
system is more than 40 years old will probably have a high illicit discharge potential.
Developments 20 years or younger will probably have a low illicit discharge potential.”24 We
created a residential index similar to that of the business index. In this case, we used the same
parcel database, this time using the “last built date.” We used this category based on the
assumption that new construction or drastic rebuilding would be required to follow the building
codes in effect at the date of construction.
24 United States Environmental Protection Agency. 2014. National Pollutant Discharge Elimination System (NPEDS)
General Permits for Stormwater Discharges from Small Municipal Separate Storm Sewer Systems in Massachusetts. http://www.epa.gov/region1/npdes/stormwater/ma/2014DraftMASmallMS4GeneralPermit.pdf, pg. 31.
Page 23 of 33
Again, we created two categories of residential risk: high, for the count of houses in a catchment
built more than 40 years ago, and medium, for the count of houses in the catchment built 20 to 40
years ago. We created an index using the same formula as that for the business index (count of
medium risk *5 + count of high risk *10), and divided the result by the acreage of the catchment.
We used this housing index per acre value as a criterion for the suitability model.
Sewer and Septic
We also created criteria reflecting the density of sewer lines and the concentration of septic
systems within each catchment. Based on the line shapefiles we got from the GIS Analyst at
Milton’s DPW sent us, we calculated the length of sewer pipe within each catchment divided by
the total area of that catchment. Milton also provided us with a shapefile representing each
parcel that has a septic system. For the “septic” criterion, we simply divided the number of septic
systems in each catchment by the acreage of that catchment.
Quality of Receiving Waters
As described above, each catchment was associated with a single receiving water in the
Integrated List of Waters created and maintained by MassDEP and published by MassGIS. We
used the category of the associated receiving waters as a criterion within the suitability analysis.
Categories of Impaired waters range from 1 to 5, with 5 being the most impaired, and 1 being
unimpaired. Category 2 and 3 waters may be unimpaired for some uses and not assessed for
others, or there may not be enough information available to make an assessment. Within Milton,
all waters were rated a category 5, but elsewhere in the Neponset Watershed, some of the
waters rank in a lower category, so we included the receiving water criterion even though it
makes no difference in the rankings of the catchments for Milton.
The suitability analysis
After defining the five criteria described above, we ran a suitability analysis that ranked each
catchment from 0 (least problematic) to 100 (most problematic) for each catchment. To create this
ranking, each criterion was assigned a weight, based on how much that criterion should impact the
resulting ranking (Table 3). The weights can be changed easily within CommunityViz, and should
be decided upon based on the data specific to that town. If the entire town is on septic systems
rather than town sewer lines, for example, it will not make sense to use the density of sewer lines
as a criterion, since all catchments would have a value of 0, so this criterion would not change the
overall score. Based on the weights above, the results for Milton are summarized in the map
below:
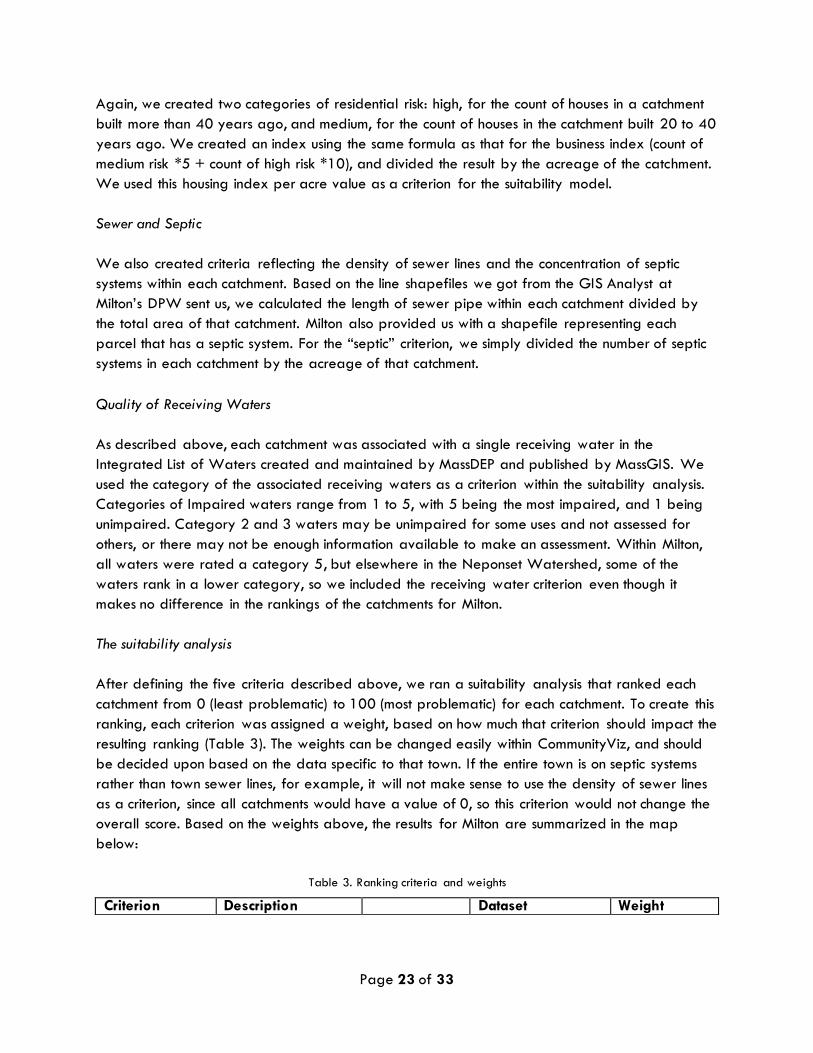
Table 3. Ranking criteria and weights
Criterion Description Dataset Weight
Page 24 of 33
Business Generating Site
Index Density
Count of businesses of specified types
divided by catchment area (in acres)
MAPC Massachusetts Land
Parcel Database, InfoGroup
8
House Age
Index Density
Summary index,
weighted count of houses older than
40 and 20 years.
MAPC
Massachusetts Land Parcel Database
6
Density of sewer pipes
Length of sewer pipes per acre
municipal infrastructure data
2
Density of septic
systems
Number of septic
systems per acre
municipal data 7
Quality of receiving waters
Category of water, 3, 4, or 5
303(d) Integrated List of Waters
dataset from MassDEP, available
through MassGIS
2
Page 25 of 33
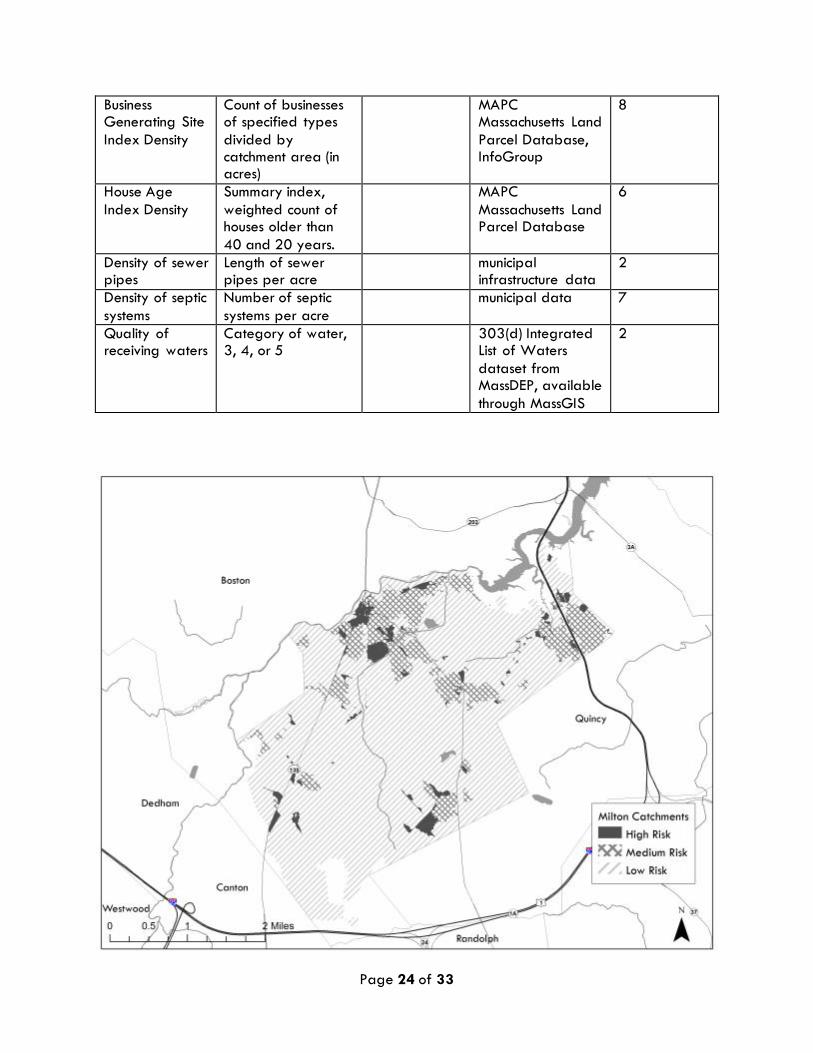
Figure 8. Catchment Ranking, low risk (hatched), medium (cross hatched), and high risk (solid).
Areas in dark gray represent high priority catchments, or catchments with the highest chance of
contributing pollution to the stormwater system. Cross hatching represents catchments with a
moderate chance, and hatching is the lowest chance. Much of the hatched area, for example, is in
the Blue Hills conservation area.
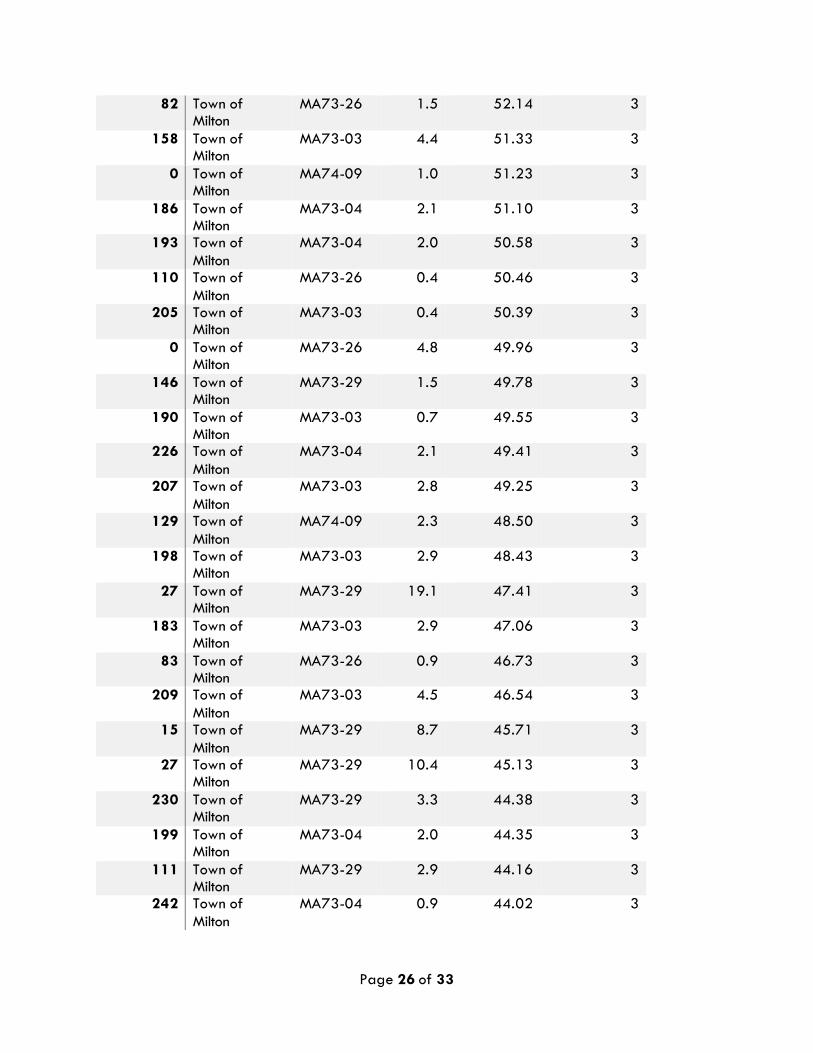
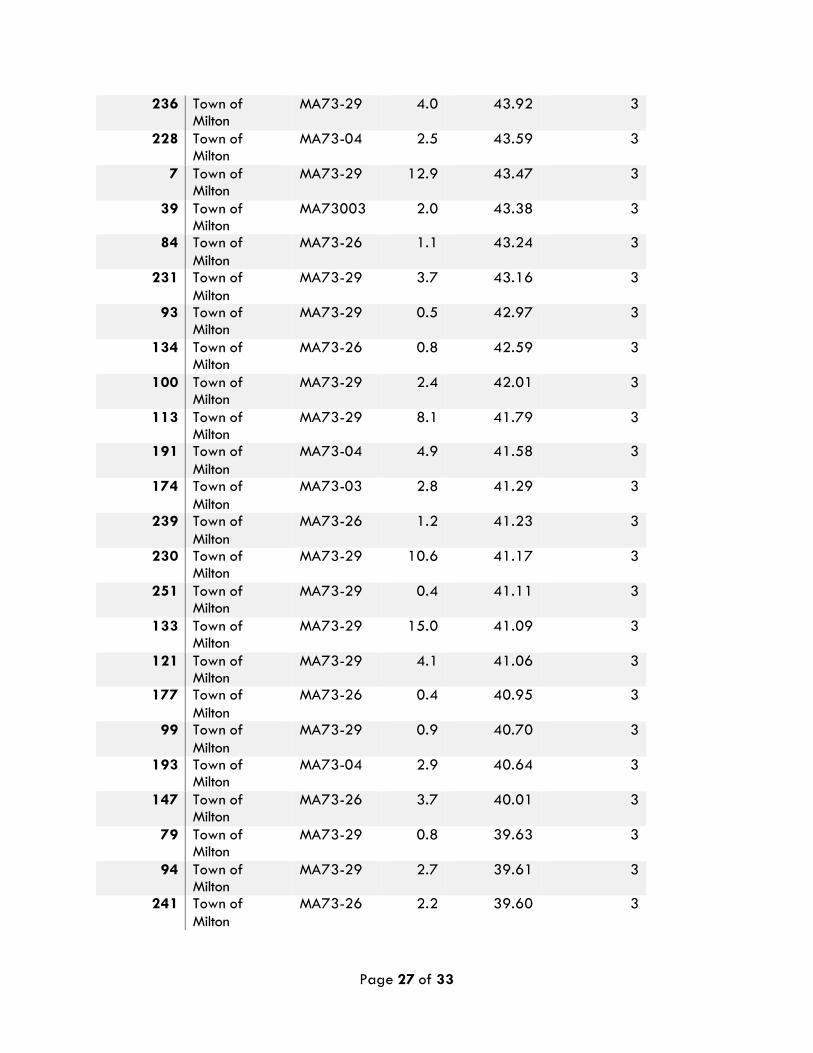
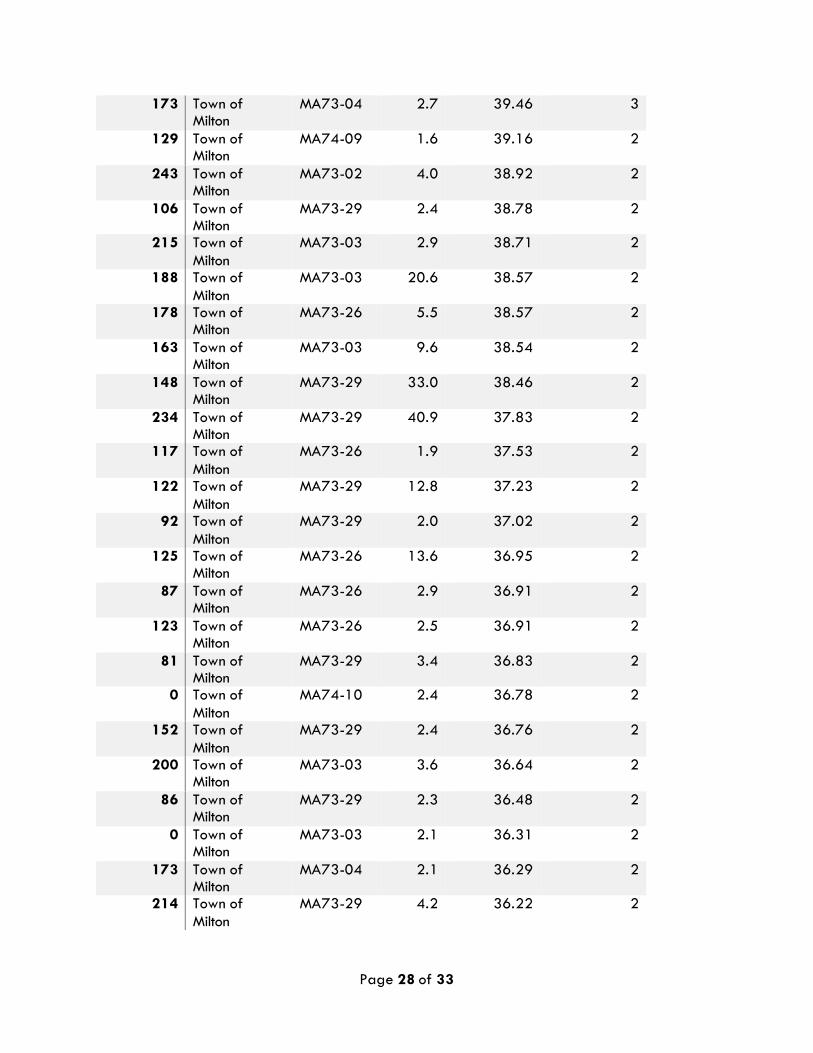
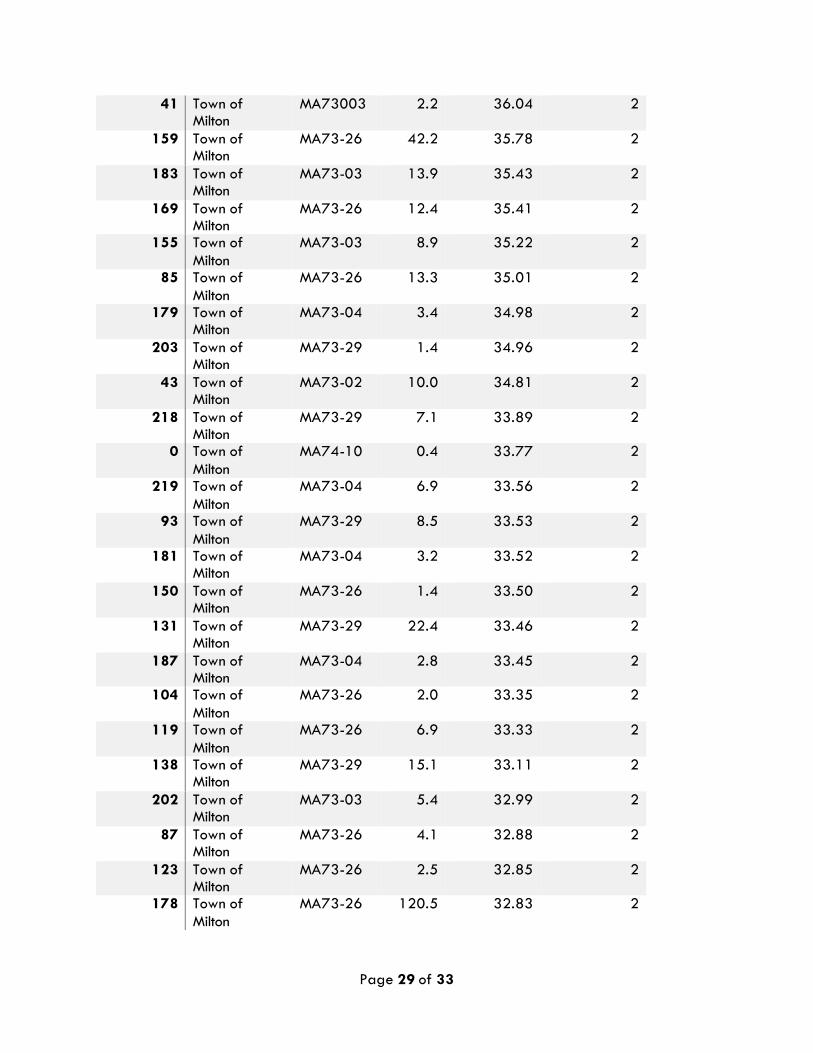
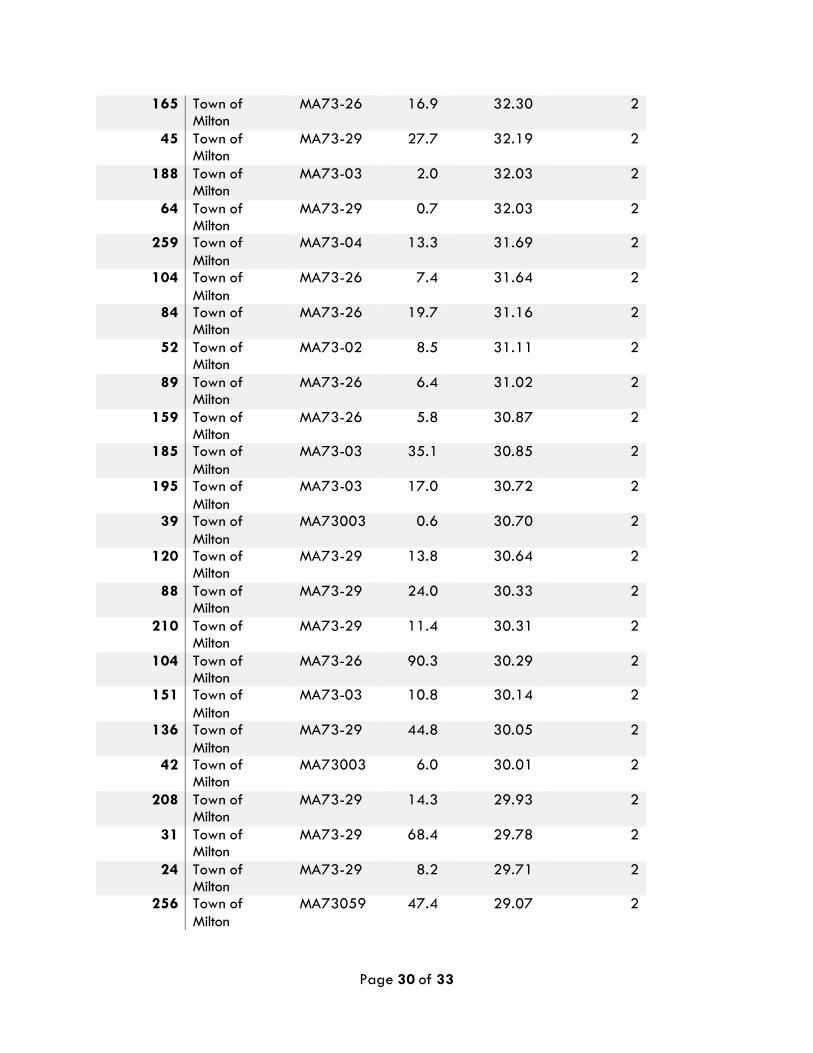
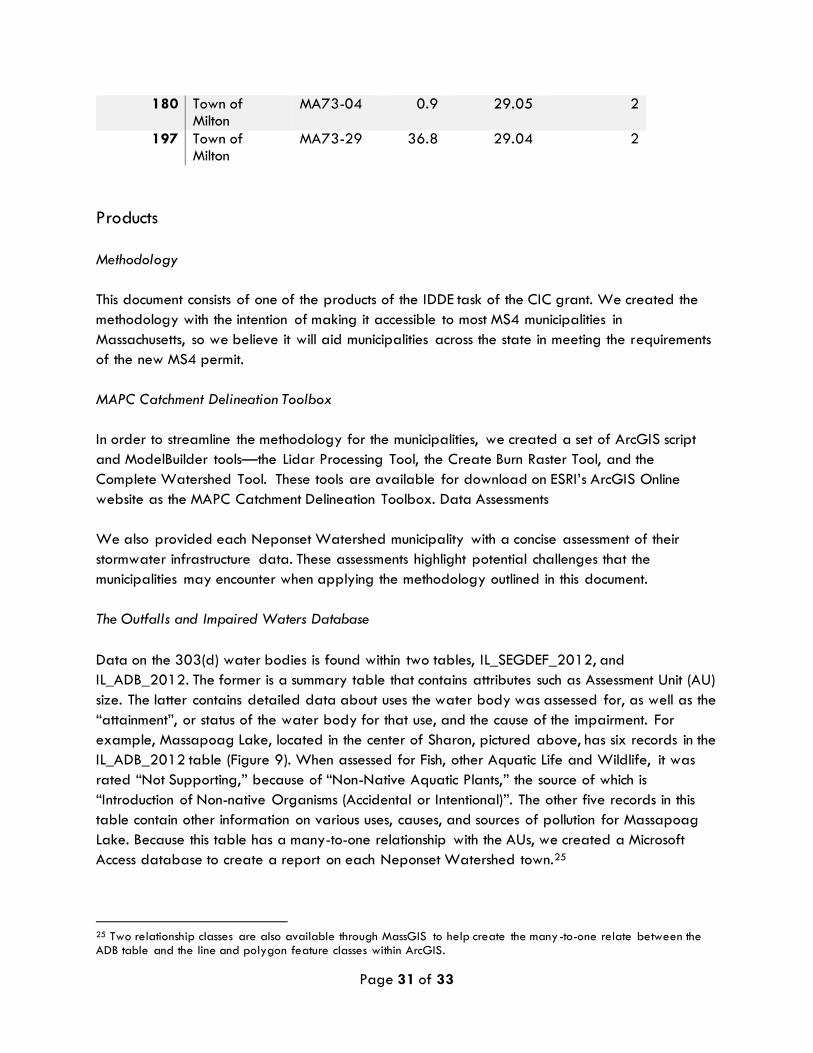
Table 4. Milton Outfall Catchment Ranking Results. 3 = High, 2 = Medium.
PIPESYS_ID OWNER AU_ID ACRES SUITABILITY PRIORITY
LEVEL
104 Town of Milton
MA73-26 0.8 94.32 3
248 Town of Milton
MA73-29 1.9 89.51 3
253 Town of Milton
MA73-29 4.9 83.09 3
160 Town of
Milton
MA73-03 0.9 76.50 3
188 Town of
Milton
MA73-03 0.7 67.32 3
23 Town of
Milton
MA73-02 2.2 67.32 3
217 Town of Milton
MA73-29 0.8 66.40 3
7 Town of Milton
MA73-29 4.0 64.76 3
178 Town of Milton
MA73-26 0.6 62.40 3
178 Town of
Milton
MA73-26 0.5 62.22 3
103 Town of
Milton
MA73-26 1.5 58.42 3
25 Town of
Milton
MA73-02 4.1 57.72 3
134 Town of Milton
MA73-26 0.4 56.28 3
231 Town of Milton
MA73-29 0.6 56.27 3
76 Town of Milton
MA73-29 2.7 54.32 3
207 Town of Milton
MA73-03 1.5 52.80 3
154 Town of
Milton
MA73-26 0.6 52.65 3
170 Town of
Milton
MA73-26 0.4 52.23 3
Page 26 of 33
82 Town of Milton
MA73-26 1.5 52.14 3
158 Town of Milton
MA73-03 4.4 51.33 3
0 Town of Milton
MA74-09 1.0 51.23 3
186 Town of Milton
MA73-04 2.1 51.10 3
193 Town of
Milton
MA73-04 2.0 50.58 3
110 Town of
Milton
MA73-26 0.4 50.46 3
205 Town of Milton
MA73-03 0.4 50.39 3
0 Town of Milton
MA73-26 4.8 49.96 3
146 Town of Milton
MA73-29 1.5 49.78 3
190 Town of Milton
MA73-03 0.7 49.55 3
226 Town of
Milton
MA73-04 2.1 49.41 3
207 Town of
Milton
MA73-03 2.8 49.25 3
129 Town of
Milton
MA74-09 2.3 48.50 3
198 Town of Milton
MA73-03 2.9 48.43 3
27 Town of Milton
MA73-29 19.1 47.41 3
183 Town of Milton
MA73-03 2.9 47.06 3
83 Town of Milton
MA73-26 0.9 46.73 3
209 Town of
Milton
MA73-03 4.5 46.54 3
15 Town of
Milton
MA73-29 8.7 45.71 3
27 Town of Milton
MA73-29 10.4 45.13 3
230 Town of Milton
MA73-29 3.3 44.38 3
199 Town of Milton
MA73-04 2.0 44.35 3
111 Town of Milton
MA73-29 2.9 44.16 3
242 Town of
Milton
MA73-04 0.9 44.02 3
Page 27 of 33
236 Town of Milton
MA73-29 4.0 43.92 3
228 Town of Milton
MA73-04 2.5 43.59 3
7 Town of Milton
MA73-29 12.9 43.47 3
39 Town of Milton
MA73003 2.0 43.38 3
84 Town of
Milton
MA73-26 1.1 43.24 3
231 Town of
Milton
MA73-29 3.7 43.16 3
93 Town of Milton
MA73-29 0.5 42.97 3
134 Town of Milton
MA73-26 0.8 42.59 3
100 Town of Milton
MA73-29 2.4 42.01 3
113 Town of Milton
MA73-29 8.1 41.79 3
191 Town of
Milton
MA73-04 4.9 41.58 3
174 Town of
Milton
MA73-03 2.8 41.29 3
239 Town of
Milton
MA73-26 1.2 41.23 3
230 Town of Milton
MA73-29 10.6 41.17 3
251 Town of Milton
MA73-29 0.4 41.11 3
133 Town of Milton
MA73-29 15.0 41.09 3
121 Town of Milton
MA73-29 4.1 41.06 3
177 Town of
Milton
MA73-26 0.4 40.95 3
99 Town of
Milton
MA73-29 0.9 40.70 3
193 Town of Milton
MA73-04 2.9 40.64 3
147 Town of Milton
MA73-26 3.7 40.01 3
79 Town of Milton
MA73-29 0.8 39.63 3
94 Town of Milton
MA73-29 2.7 39.61 3
241 Town of
Milton
MA73-26 2.2 39.60 3
Page 28 of 33
173 Town of Milton
MA73-04 2.7 39.46 3
129 Town of Milton
MA74-09 1.6 39.16 2
243 Town of Milton
MA73-02 4.0 38.92 2
106 Town of Milton
MA73-29 2.4 38.78 2
215 Town of
Milton
MA73-03 2.9 38.71 2
188 Town of
Milton
MA73-03 20.6 38.57 2
178 Town of Milton
MA73-26 5.5 38.57 2
163 Town of Milton
MA73-03 9.6 38.54 2
148 Town of Milton
MA73-29 33.0 38.46 2
234 Town of Milton
MA73-29 40.9 37.83 2
117 Town of
Milton
MA73-26 1.9 37.53 2
122 Town of
Milton
MA73-29 12.8 37.23 2
92 Town of
Milton
MA73-29 2.0 37.02 2
125 Town of Milton
MA73-26 13.6 36.95 2
87 Town of Milton
MA73-26 2.9 36.91 2
123 Town of Milton
MA73-26 2.5 36.91 2
81 Town of Milton
MA73-29 3.4 36.83 2
0 Town of
Milton
MA74-10 2.4 36.78 2
152 Town of
Milton
MA73-29 2.4 36.76 2
200 Town of Milton
MA73-03 3.6 36.64 2
86 Town of Milton
MA73-29 2.3 36.48 2
0 Town of Milton
MA73-03 2.1 36.31 2
173 Town of Milton
MA73-04 2.1 36.29 2
214 Town of
Milton
MA73-29 4.2 36.22 2
Page 29 of 33
41 Town of Milton
MA73003 2.2 36.04 2
159 Town of Milton
MA73-26 42.2 35.78 2
183 Town of Milton
MA73-03 13.9 35.43 2
169 Town of Milton
MA73-26 12.4 35.41 2
155 Town of
Milton
MA73-03 8.9 35.22 2
85 Town of
Milton
MA73-26 13.3 35.01 2
179 Town of Milton
MA73-04 3.4 34.98 2
203 Town of Milton
MA73-29 1.4 34.96 2
43 Town of Milton
MA73-02 10.0 34.81 2
218 Town of Milton
MA73-29 7.1 33.89 2
0 Town of
Milton
MA74-10 0.4 33.77 2
219 Town of
Milton
MA73-04 6.9 33.56 2
93 Town of
Milton
MA73-29 8.5 33.53 2
181 Town of Milton
MA73-04 3.2 33.52 2
150 Town of Milton
MA73-26 1.4 33.50 2
131 Town of Milton
MA73-29 22.4 33.46 2
187 Town of Milton
MA73-04 2.8 33.45 2
104 Town of
Milton
MA73-26 2.0 33.35 2
119 Town of
Milton
MA73-26 6.9 33.33 2
138 Town of Milton
MA73-29 15.1 33.11 2
202 Town of Milton
MA73-03 5.4 32.99 2
87 Town of Milton
MA73-26 4.1 32.88 2
123 Town of Milton
MA73-26 2.5 32.85 2
178 Town of
Milton
MA73-26 120.5 32.83 2
Page 30 of 33
165 Town of Milton
MA73-26 16.9 32.30 2
45 Town of Milton
MA73-29 27.7 32.19 2
188 Town of Milton
MA73-03 2.0 32.03 2
64 Town of Milton
MA73-29 0.7 32.03 2
259 Town of
Milton
MA73-04 13.3 31.69 2
104 Town of
Milton
MA73-26 7.4 31.64 2
84 Town of Milton
MA73-26 19.7 31.16 2
52 Town of Milton
MA73-02 8.5 31.11 2
89 Town of Milton
MA73-26 6.4 31.02 2
159 Town of Milton
MA73-26 5.8 30.87 2
185 Town of
Milton
MA73-03 35.1 30.85 2
195 Town of
Milton
MA73-03 17.0 30.72 2
39 Town of
Milton
MA73003 0.6 30.70 2
120 Town of Milton
MA73-29 13.8 30.64 2
88 Town of Milton
MA73-29 24.0 30.33 2
210 Town of Milton
MA73-29 11.4 30.31 2
104 Town of Milton
MA73-26 90.3 30.29 2
151 Town of
Milton
MA73-03 10.8 30.14 2
136 Town of
Milton
MA73-29 44.8 30.05 2
42 Town of Milton
MA73003 6.0 30.01 2
208 Town of Milton
MA73-29 14.3 29.93 2
31 Town of Milton
MA73-29 68.4 29.78 2
24 Town of Milton
MA73-29 8.2 29.71 2
256 Town of
Milton
MA73059 47.4 29.07 2
Page 31 of 33
180 Town of Milton
MA73-04 0.9 29.05 2
197 Town of Milton
MA73-29 36.8 29.04 2
Products
Methodology
This document consists of one of the products of the IDDE task of the CIC grant. We created the
methodology with the intention of making it accessible to most MS4 municipalities in
Massachusetts, so we believe it will aid municipalities across the state in meeting the requirements
of the new MS4 permit.
MAPC Catchment Delineation Toolbox
In order to streamline the methodology for the municipalities, we created a set of ArcGIS script
and ModelBuilder tools—the Lidar Processing Tool, the Create Burn Raster Tool, and the
Complete Watershed Tool. These tools are available for download on ESRI’s ArcGIS Online
website as the MAPC Catchment Delineation Toolbox. Data Assessments
We also provided each Neponset Watershed municipality with a concise assessment of their
stormwater infrastructure data. These assessments highlight potential challenges that the
municipalities may encounter when applying the methodology outlined in this document.
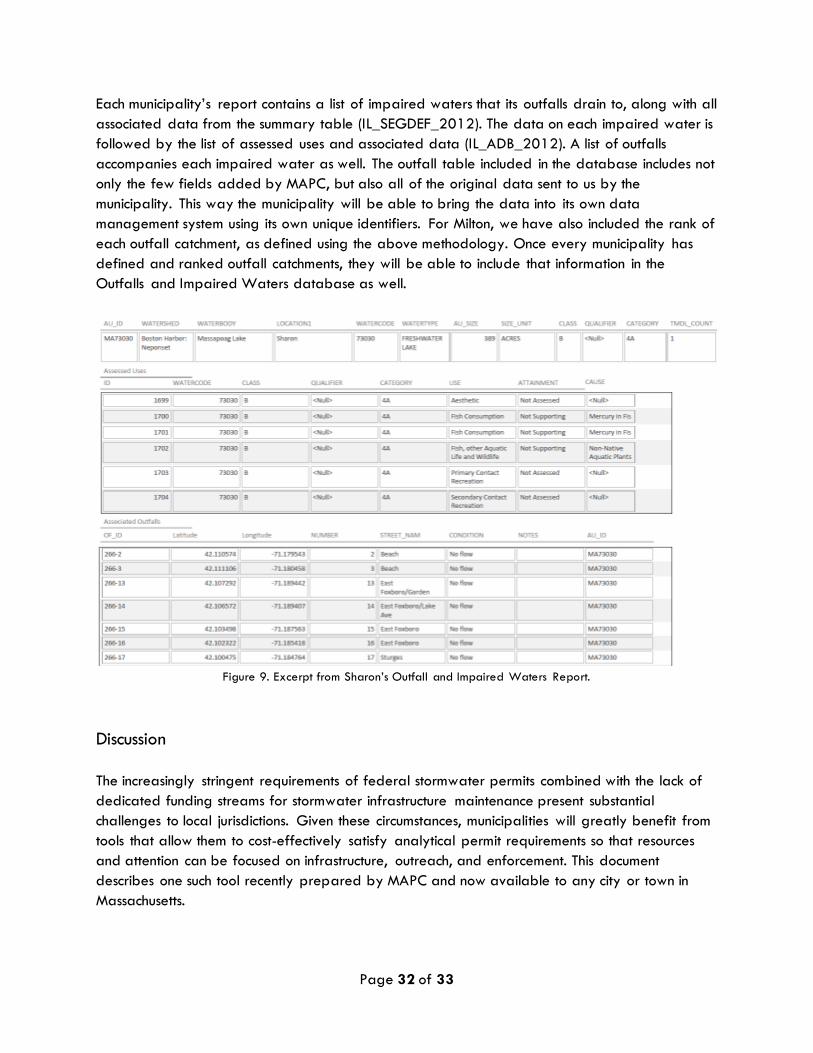
The Outfalls and Impaired Waters Database
Data on the 303(d) water bodies is found within two tables, IL_SEGDEF_2012, and
IL_ADB_2012. The former is a summary table that contains attributes such as Assessment Unit (AU)
size. The latter contains detailed data about uses the water body was assessed for, as well as the
“attainment”, or status of the water body for that use, and the cause of the impairment. For
example, Massapoag Lake, located in the center of Sharon, pictured above, has six records in the
IL_ADB_2012 table (Figure 9). When assessed for Fish, other Aquatic Life and Wildlife, it was
rated “Not Supporting,” because of “Non-Native Aquatic Plants,” the source of which is
“Introduction of Non-native Organisms (Accidental or Intentional)”. The other five records in this
table contain other information on various uses, causes, and sources of pollution for Massapoag
Lake. Because this table has a many-to-one relationship with the AUs, we created a Microsoft
Access database to create a report on each Neponset Watershed town.25
25 Two relationship classes are also available through MassGIS to help create the many-to-one relate between the ADB table and the line and polygon feature classes within ArcGIS.
Page 32 of 33
Each municipality’s report contains a list of impaired waters that its outfalls drain to, along with all
associated data from the summary table (IL_SEGDEF_2012). The data on each impaired water is
followed by the list of assessed uses and associated data (IL_ADB_2012). A list of outfalls
accompanies each impaired water as well. The outfall table included in the database includes not
only the few fields added by MAPC, but also all of the original data sent to us by the
municipality. This way the municipality will be able to bring the data into its own data
management system using its own unique identifiers. For Milton, we have also included the rank of
each outfall catchment, as defined using the above methodology. Once every municipality has
defined and ranked outfall catchments, they will be able to include that information in the
Outfalls and Impaired Waters database as well.
Figure 9. Excerpt from Sharon’s Outfall and Impaired Waters Report.
Discussion
The increasingly stringent requirements of federal stormwater permits combined with the lack of
dedicated funding streams for stormwater infrastructure maintenance present substantial
challenges to local jurisdictions. Given these circumstances, municipalities will greatly benefit from
tools that allow them to cost-effectively satisfy analytical permit requirements so that resources
and attention can be focused on infrastructure, outreach, and enforcement. This document
describes one such tool recently prepared by MAPC and now available to any city or town in
Massachusetts.
Page 33 of 33
The methodology and data resources described here will help many municipalities meet the
“catchment delineation” requirement in the system mapping section of the new MS4 permit,
provided the Outfall/ Interconnection Inventory is relatively complete, and gaps in knowledge can
be filled by DPW staff.26 Cities and towns do not need to collect or developed detailed
stormwater infrastructure information, and MAPC has also provided highly detailed information
on land uses and establishments that pose a higher risk for water pollution, eliminating the need
for cities and towns to acquire or compile such data. Furthermore, the tool is structured to provide
the specific types of data and designations required by the NPDES permit. For example, the
permit requires municipalities to classify catchments into four groups—excluded, high priority, low
priority, and problem. These products should help municipalities with the first three categories. If
municipalities assign an “owner” to each catch basin, they will be able to distinguish between
excluded and included catchments. The step-by-step instructions provided in this document,
combined with the published data catalog and ArcGIS tool published online, will enable
jurisdictions or consultants with relatively modest technical capabilities to use this method.
The delineation methodology and ranking process has some limitations that could be addressed
through additional data collection. For example, it would have been useful to include the age of
the sewer pipes as a criterion. Most municipalities in the Neponset Watershed do not have this
data available, however. The catchment ranking described here does not distinguish between
problem catchments and other catchments. For the purposes of the MS4 permit, a “problem
catchment” is one that has had an outfall that tested as contaminated, or that direct observation
indicates that there is some kind of illicit discharge connected to that outfall.27 Such a catchment
would be considered a problem catchment regardless of its ranking in this suitability analysis, and
must be investigated. In the future, the ranking could include historical data on whether a
catchment has ever been designated a problem catchment, so that former problem catchments will
rank higher than those that have had no observed contamination. If data are available, such
analysis could be easily incorporated into a future version of the tool.
26 United States Environmental Protection Agency. 2014. 26-28 27 United States Environmental Protection Agency. 2014. 30
Related Documents