Nutrient Fluxes in the Neponset River Watershed sccwrp.org

Welcome message from author
This document is posted to help you gain knowledge. Please leave a comment to let me know what you think about it! Share it to your friends and learn new things together.
Transcript
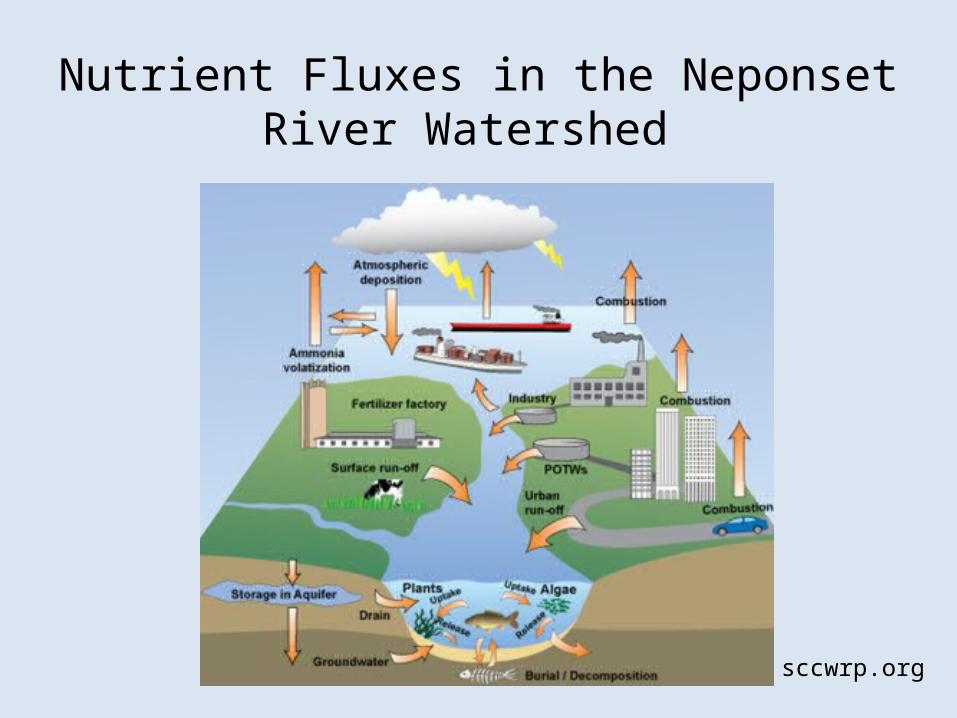
Nutrient Fluxes in the Neponset River Watershed
sccwrp.org
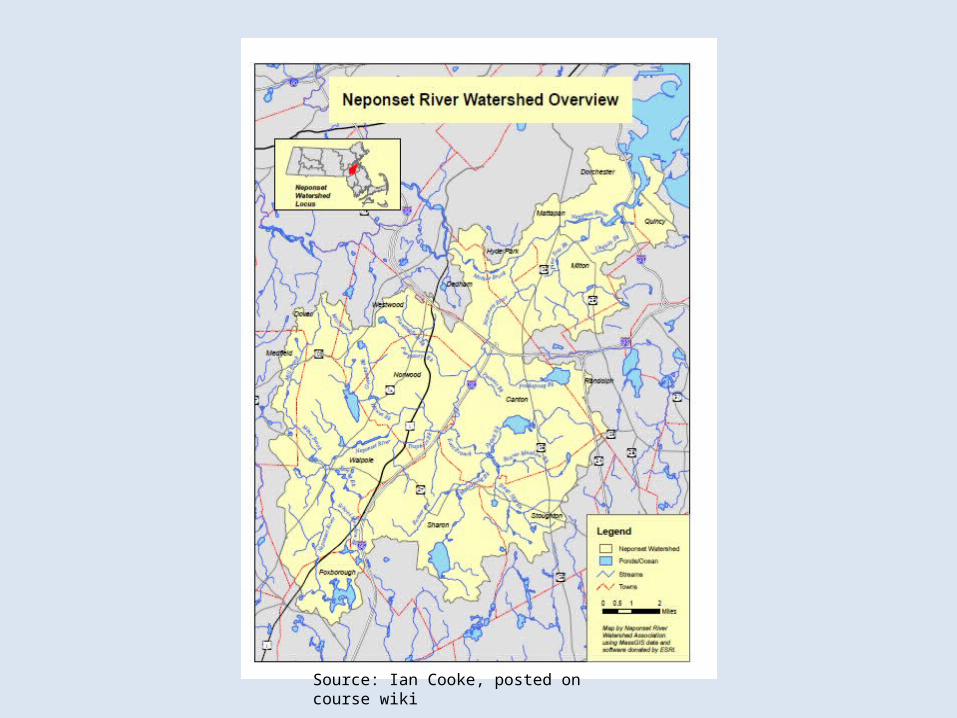
Source: Ian Cooke, posted on course wiki
First Step: Nutrient Data from the MWRA Website
• Data starting in 1994 up to 2011
• Tested for nutrients, bacteria, DO, clarity, algae, etc.
• 9 sites in the river and river mouth
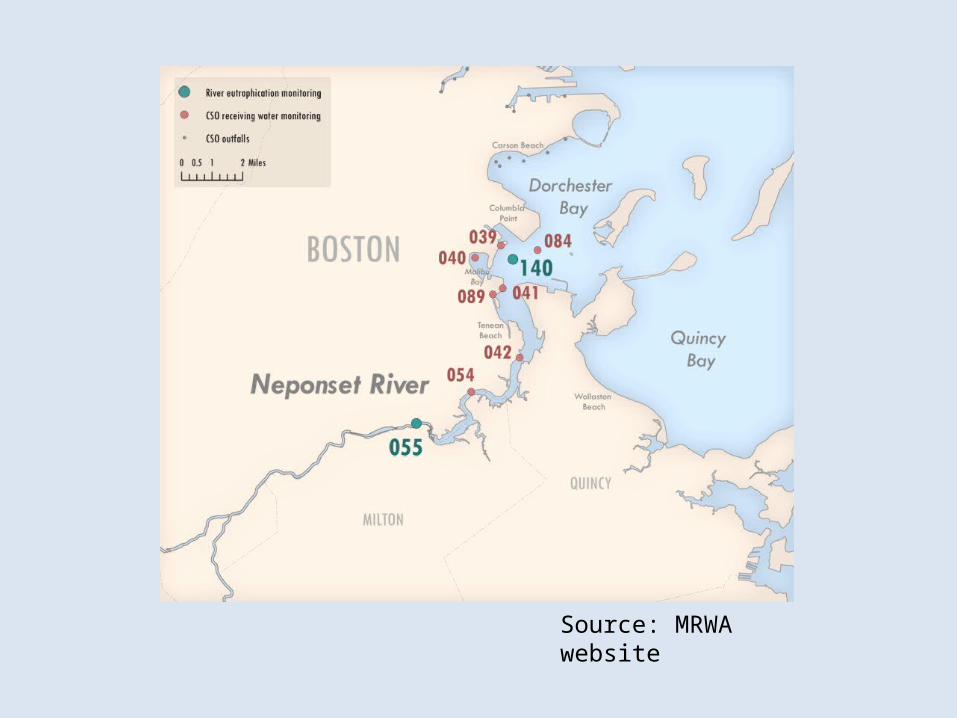
Source: MRWA website
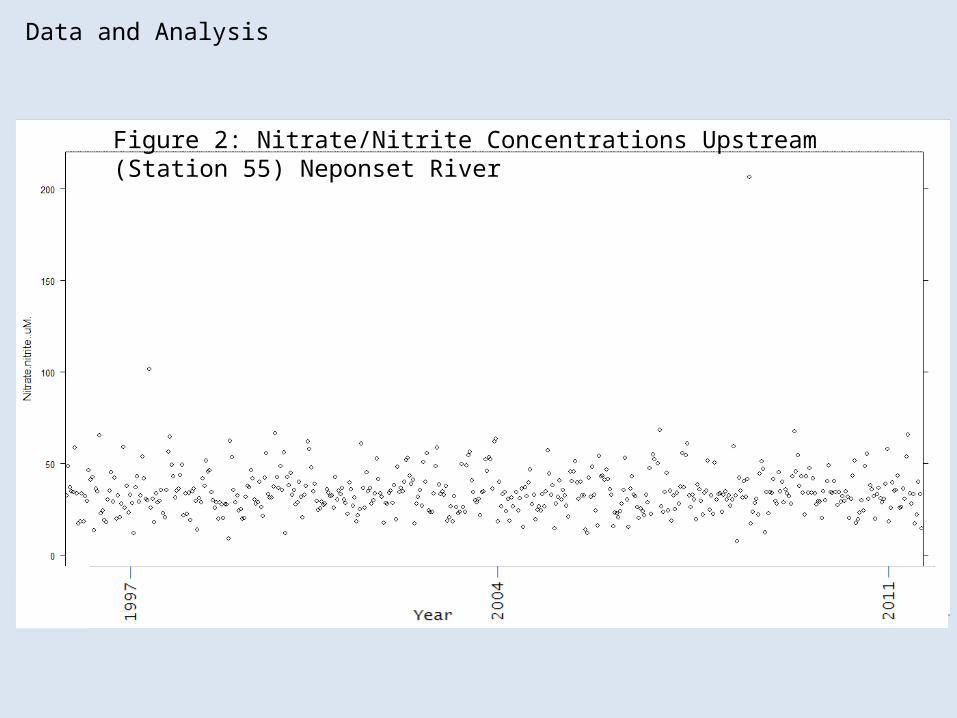
Figure 2: Nitrate/Nitrite Concentrations Upstream (Station 55) Neponset River
Data and Analysis
Data and Analysis
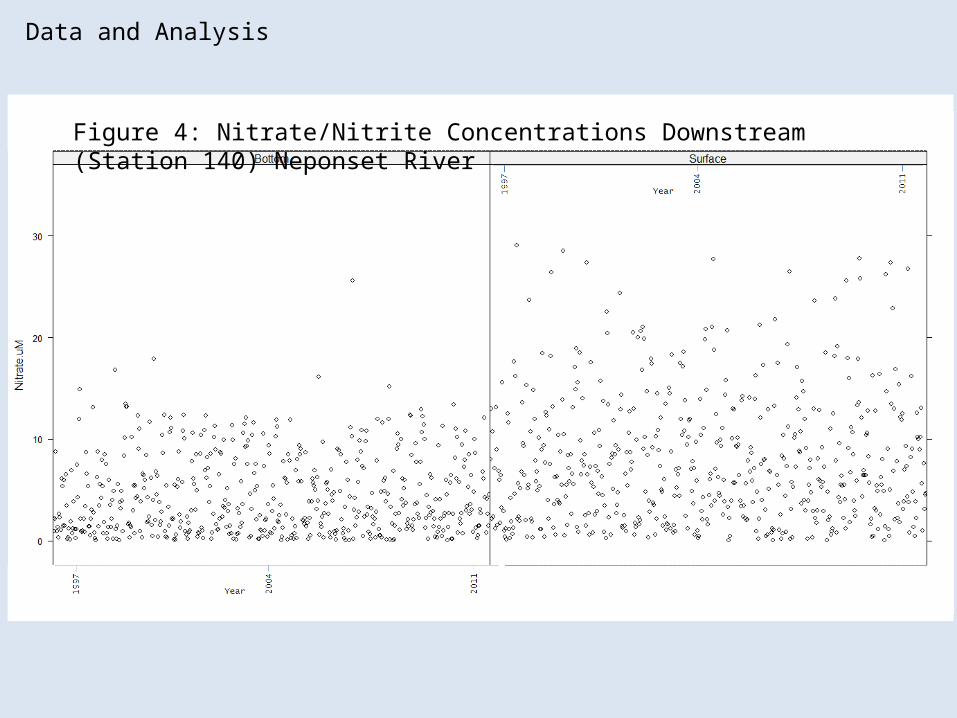
Figure 4: Nitrate/Nitrite Concentrations Downstream (Station 140) Neponset River
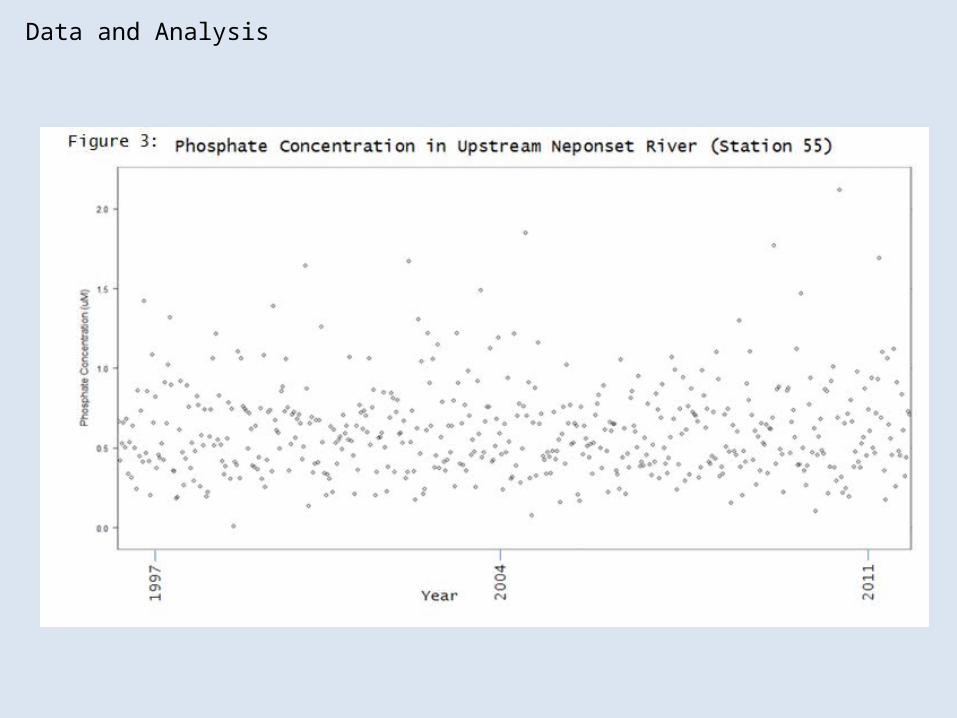
Data and Analysis
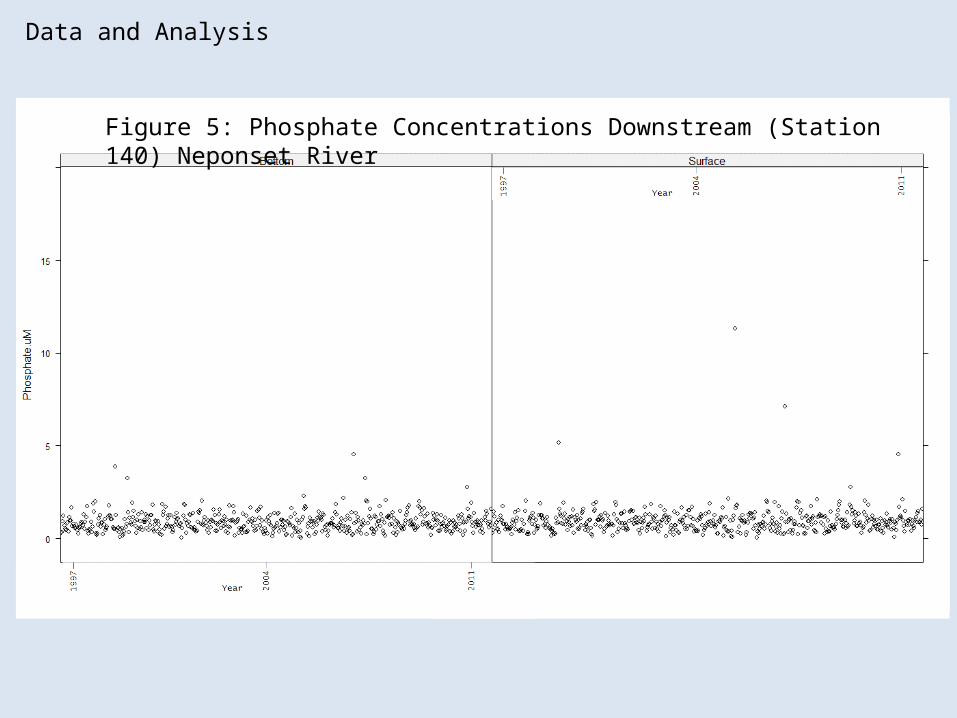
Figure 5: Phosphate Concentrations Downstream (Station 140) Neponset River
Data and Analysis
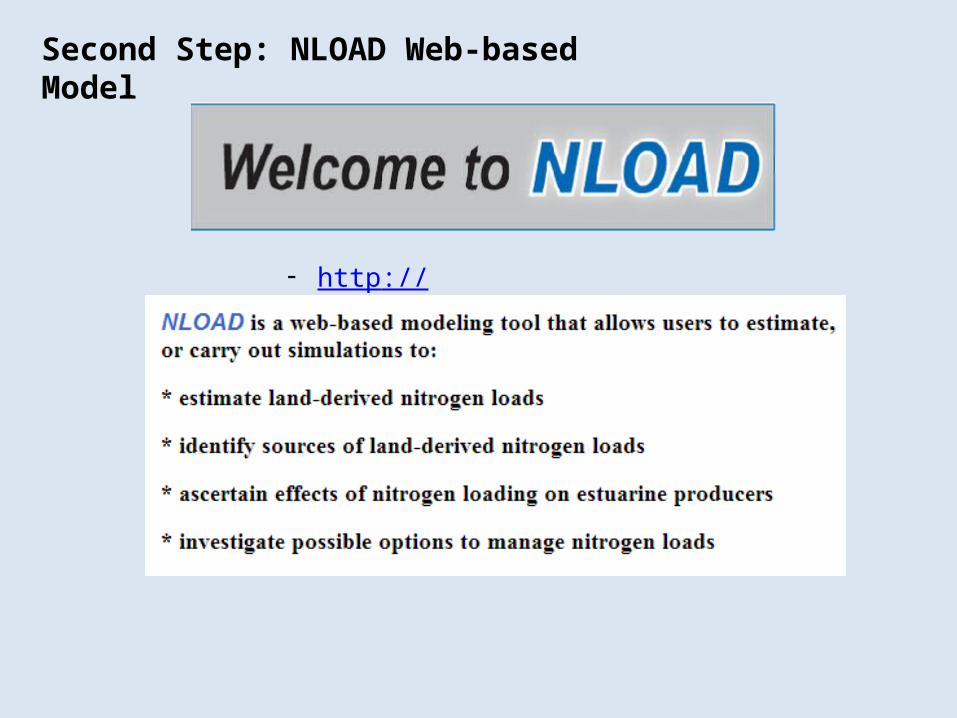
Second Step: NLOAD Web-based Model
- http://nload.mbl.edu/index.php
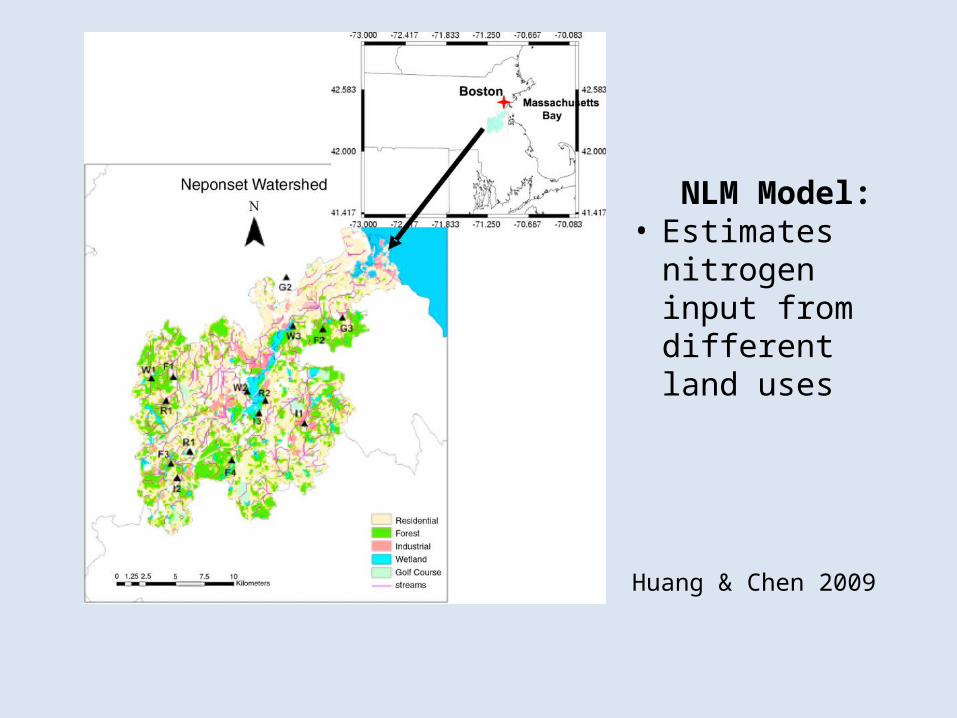
Huang & Chen 2009
NLM Model:• Estimates nitrogen
input from different land uses
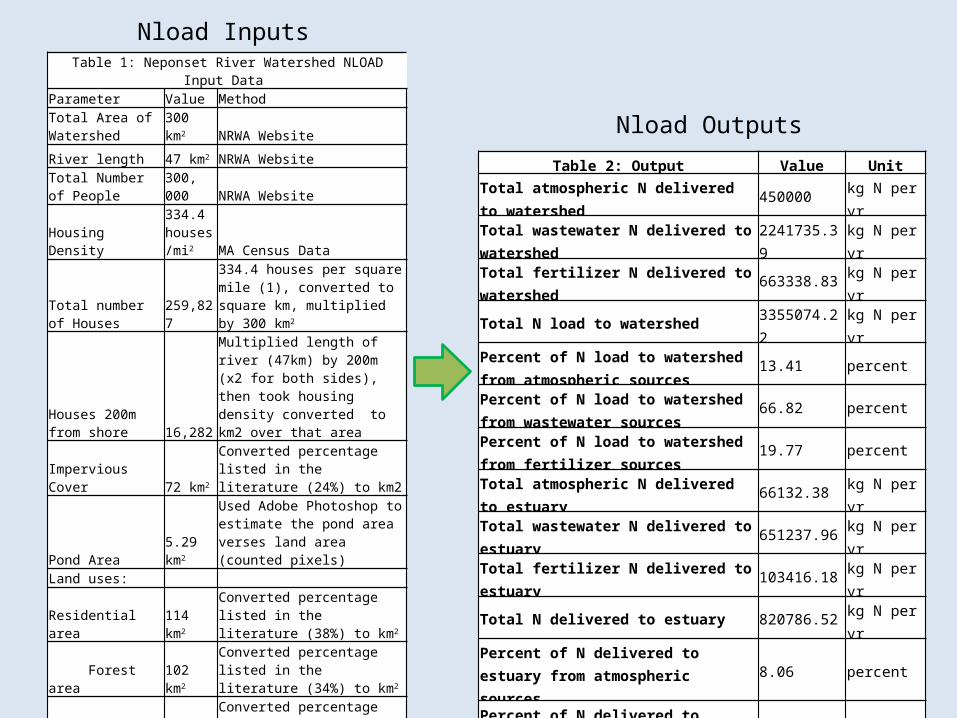
Table 1: Neponset River Watershed NLOAD Input Data Parameter Value Method Total Area of Watershed 300 km2 NRWA Website
River length 47 km2 NRWA WebsiteTotal Number of People 300, 000 NRWA Website
Housing Density
334.4 houses/mi2 MA Census Data
Total number of Houses 259,827
334.4 houses per square mile (1), converted to square km, multiplied by 300 km2
Houses 200m from shore 16,282
Multiplied length of river (47km) by 200m (x2 for both sides), then took housing density converted to km2 over that area
Impervious Cover 72 km2Converted percentage listed in the literature (24%) to km2
Pond Area 5.29 km2
Used Adobe Photoshop to estimate the pond area verses land area (counted pixels)
Land uses:
Residential area 114 km2Converted percentage listed in the literature (38%) to km2
Forest area 102 km2Converted percentage listed in the literature (34%) to km2
Industry 15 km2Converted percentage listed in the literature (5%) to km2
Wetland 12 km2Converted percentage listed in the literature (4%) to km2
Golf Course 6 km2Converted percentage listed in the literature (2%) to km2
Baseball fields 0.15 km2
Estimated using GIS: 15 baseball fields in the watershed each 9800 m2, equals 147,000 m2 or 0.147 km2
Cranberry Bogs 0 km2Estimated using GIS: no visible bogs in the watershed
Nload Inputs
Table 2: Output Value UnitTotal atmospheric N delivered to watershed 450000 kg N per yrTotal wastewater N delivered to watershed 2241735.39 kg N per yrTotal fertilizer N delivered to watershed 663338.83 kg N per yrTotal N load to watershed 3355074.22 kg N per yr
Percent of N load to watershed from atmospheric sources 13.41 percent
Percent of N load to watershed from wastewater sources 66.82 percent
Percent of N load to watershed from fertilizer sources 19.77 percent
Total atmospheric N delivered to estuary 66132.38 kg N per yrTotal wastewater N delivered to estuary 651237.96 kg N per yrTotal fertilizer N delivered to estuary 103416.18 kg N per yrTotal N delivered to estuary 820786.52 kg N per yr
Percent of N delivered to estuary from atmospheric sources 8.06 percent
Percent of N delivered to estuary from wastewater sources 79.34 percent
Percent of N delivered to estuary from fertilizer sources 12.6 percent
Nload Outputs
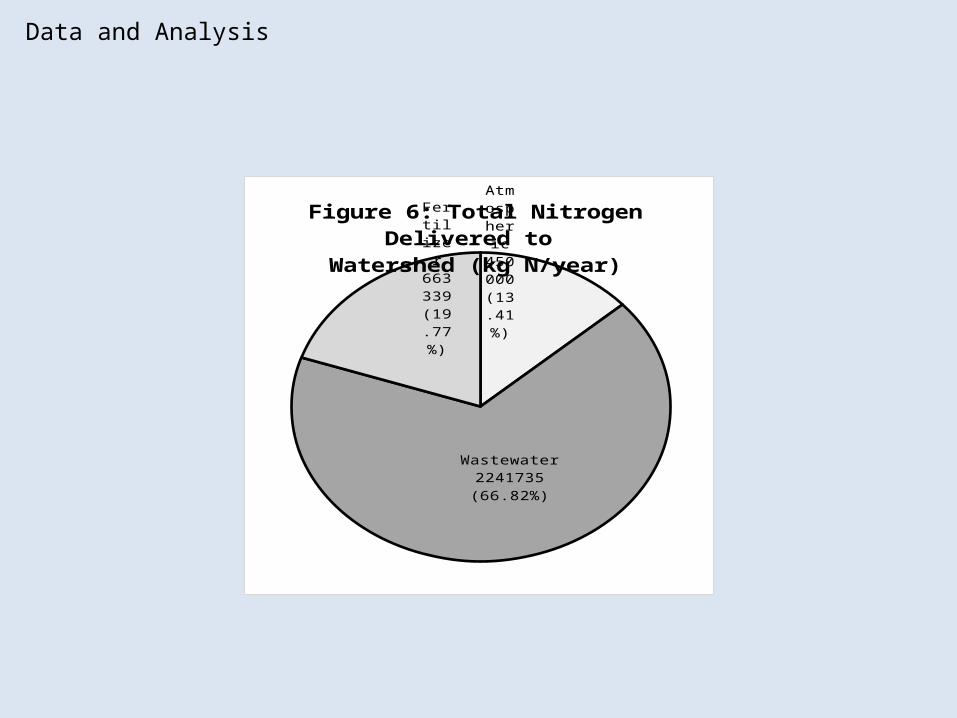
At-mo-
spheric
450000
(13.41%)
Wastewater 2241735 (66.82%)
Fertil-izer
663339
(19.77%)
Figure 6: Total Nitrogen Delivered to Watershed (kg N/year)
Data and Analysis
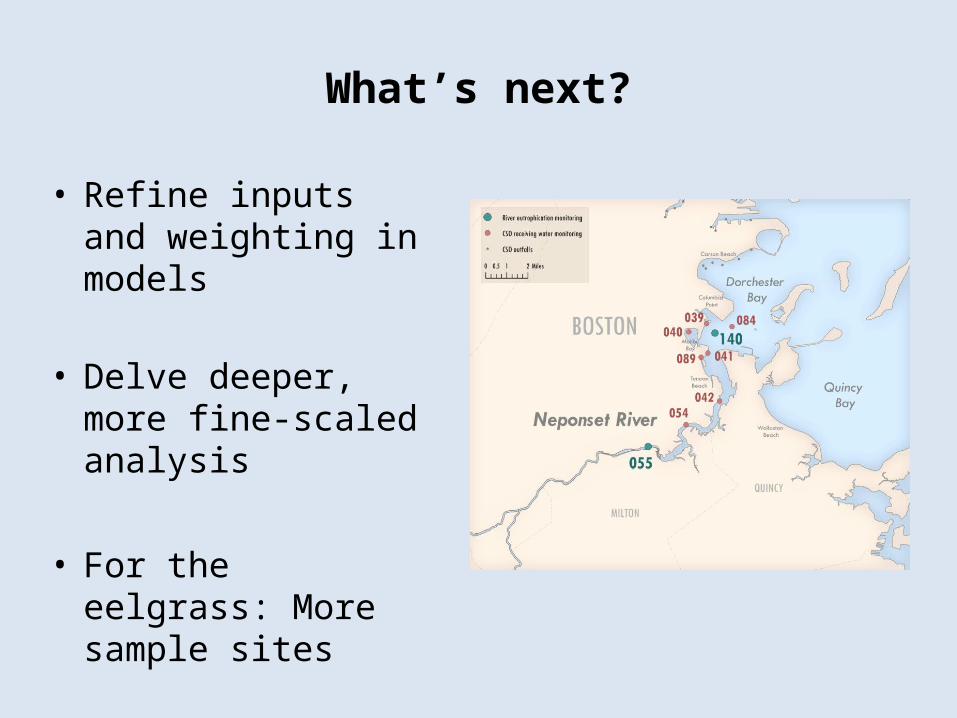
What’s next?
• Refine inputs and weighting in models
• Delve deeper, more fine-scaled analysis
• For the eelgrass: More sample sites
Related Documents