NAVAL POSTGRADUATE SCHOOL MONTEREY, CALIFORNIA MBA PROFESSIONAL REPORT An Industry Analysis of the MBA Market and the Competitive Positioning of the GSBPP By: Garrett W. Hager Thomas T. King March 2007 Advisors: Peter Coughlan, William Gates Approved for public release; distribution is unlimited.

Welcome message from author
This document is posted to help you gain knowledge. Please leave a comment to let me know what you think about it! Share it to your friends and learn new things together.
Transcript

NAVAL POSTGRADUATE
SCHOOL
MONTEREY, CALIFORNIA
MBA PROFESSIONAL REPORT
An Industry Analysis of the MBA Market and the
Competitive Positioning of the GSBPP
By: Garrett W. Hager Thomas T. King
March 2007
Advisors: Peter Coughlan, William Gates
Approved for public release; distribution is unlimited.

THIS PAGE INTENTIONALLY LEFT BLANK

i
REPORT DOCUMENTATION PAGE Form Approved OMB No. 0704-0188
Public reporting burden for this collection of information is estimated to average 1 hour per response, including the time for reviewing instruction, searching existing data sources, gathering and maintaining the data needed, and completing and reviewing the collection of information. Send comments regarding this burden estimate or any other aspect of this collection of information, including suggestions for reducing this burden, to Washington headquarters Services, Directorate for Information Operations and Reports, 1215 Jefferson Davis Highway, Suite 1204, Arlington, VA 22202-4302, and to the Office of Management and Budget, Paperwork Reduction Project (0704-0188) Washington DC 20503. 1. AGENCY USE ONLY (Leave blank)
2. REPORT DATE March 2007
3. REPORT TYPE AND DATES COVERED MBA Professional Report
4. TITLE AND SUBTITLE An Industry Analysis of the MBA Market and the Competitive Positioning of the GSBPP 6. AUTHOR(S) Capt Garrett Hager and Maj Thomas King
5. FUNDING NUMBERS
7. PERFORMING ORGANIZATION NAME(S) AND ADDRESS(ES) Naval Postgraduate School Monterey, CA 93943-5000
8. PERFORMING ORGANIZATION REPORT NUMBER
9. SPONSORING /MONITORING AGENCY NAME(S) AND ADDRESS(ES) N/A
10. SPONSORING/MONITORING AGENCY REPORT NUMBER
11. SUPPLEMENTARY NOTES The views expressed in this thesis are those of the author and do not reflect the official policy or position of the Department of Defense or the U.S. Government. 12a. DISTRIBUTION / AVAILABILITY STATEMENT Approved for public release; distribution is unlimited
12b. DISTRIBUTION CODE
13. ABSTRACT (maximum 200 words) The purpose of this Master of Business Administration (MBA) project is to perform
an industry analysis of the MBA market utilizing the principles of industry analysis noted in Michael Porter’s “Five Forces Analysis” model. The intent of this project is to create an awareness of how these competitive forces: shape the MBA market, define the relationships between stakeholders within the market, and affect the overall attractiveness of the MBA market. The goal is to provide GSBPP policy makers a tool to assist in the understanding of the industry environment and the development of a sustainable competitive position for the GSBPP. The authors believe the GSBPP can benefit greatly from this knowledge. The starting point of this project was to perform a comprehensive search and analysis of secondary resources for data concerning the nature of competition, incentives of buyers (students and employers/recruiters) and sellers (faculty), and threat of substitutes within the MBA market. It is noted that the nature of competition is a critical force affecting the MBA market, as an MBA program’s reputation drives almost all aspects of its strategy. Full understanding of these market forces should help enable the GSBPP to aptly compete in this market.
15. NUMBER OF PAGES
173
14. SUBJECT TERMS MBA Industry Analysis, MBA Market, Industry Analysis, GSBPP, Five Forces Analysis
16. PRICE CODE
17. SECURITY CLASSIFICATION OF REPORT
Unclassified
18. SECURITY CLASSIFICATION OF THIS PAGE
Unclassified
19. SECURITY CLASSIFICATION OF ABSTRACT
Unclassified
20. LIMITATION OF ABSTRACT
UL NSN 7540-01-280-5500 Standard Form 298 (Rev. 2-89) Prescribed by ANSI Std. 239-18

ii
THIS PAGE INTENTIONALLY LEFT BLANK

iii
Approved for public release; distribution is unlimited
AN INDUSTRY ANALYSIS OF THE MBA MARKET AND THE COMPETITIVE POSITIONING OF THE GSBPP
Garrett W. Hager, Captain, United States Marine Corps Thomas T. King, Major, United States Marine Corps
Submitted in partial fulfillment of the requirements for the degree of
MASTER OF BUSINESS ADMINISTRATION
from the
NAVAL POSTGRADUATE SCHOOL March 2007
Authors: Garrett Hager
Thomas King
Approved by: Peter Coughlan, Lead Advisor
William Gates, Support Advisor
Robert N. Beck, Dean Graduate School of Business and Public Policy

iv
THIS PAGE INTENTIONALLY LEFT BLANK

v
ABSTRACT
The purpose of this Master of Business Administration
(MBA) project is to perform an industry analysis of the MBA
market utilizing the principles of industry analysis noted
in Michael Porter’s “Five Forces Analysis” model. The
intent of this project is to create an awareness of how
these competitive forces: shape the MBA market, define the
relationships between stakeholders within the market, and
affect the overall attractiveness of the MBA market. The
goal is to provide GSBPP policy makers a tool to assist in
the understanding of the industry environment and the
development of a sustainable competitive position for the
GSBPP. The authors believe the GSBPP can benefit greatly
from this knowledge. The starting point of this project
was to perform a comprehensive search and analysis of
secondary resources for data concerning the nature of
competition, incentives of buyers (students and
employers/recruiters) and sellers (faculty), and threat of
substitutes within the MBA market. It is noted that the
nature of competition is a critical force affecting the MBA
market, as an MBA program’s reputation drives almost all
aspects of its strategy. Full understanding of these
market forces should help enable the GSBPP to aptly compete
in this market.

vi
THIS PAGE INTENTIONALLY LEFT BLANK

vii
TABLE OF CONTENTS
I. INTRODUCTION ............................................1 II. INDUSTRY ANALYSIS OVERVIEW ..............................5
A. INTRODUCTION TO INDUSTRY ANALYSIS AND THE FIVE FORCES .............................................5
B. COMPETITION ........................................6 C. SUPPLIERS ..........................................7 D. BUYERS .............................................7 E. SUBSTITUTES ........................................8 F. THREAT OF ENTRY ....................................8 G. OTHER INDUSTRY FORCES ..............................9 H. METHODOLOGY .......................................10
III. COMPETITION ............................................13 A. BUSINESS SCHOOL MISSION ...........................13
1. Education ....................................13 2. Research .....................................15
B. COSTS .............................................18 C. REVENUES ..........................................20 D. VERTICAL DIFFERENTIATION ..........................25
1. Rankings .....................................25 2. Accreditation ................................38
E. HORIZONTAL DIFFERENTIATION ........................39 1. Specialization ...............................39 2. Partnership ..................................42 3. Regional Focus and Flexibility ...............42
F. ANALYSIS ..........................................43 IV. BUYERS .................................................47
A. STUDENTS ..........................................47 1. GMAT .........................................47 2. Admissions ...................................49 3. Program Selection Criteria ...................51 4. Value of an MBA ..............................55 5. Salaries .....................................59
B. EMPLOYERS .........................................70 1. Who Hires MBAs? ..............................71 2. Why Do Employers Hire MBAs? ..................73 3. From Which Schools Do Employers Hires MBAs? ..74 4. Why Do Some Employers Sponsor MBA Education? .76
C. ANALYSIS ..........................................78 1. Students .....................................78 2. Employers ....................................80
V. FACULTY ................................................83
viii
A. CATEGORIES OF BUSINESS SCHOOL FACULTY .............83 B. BALANCING TENURE-TRACK VS. “CONTINGENT” FACULTY ...86 C. FACULTY CAREER PROGRESSION ........................88 D. FACULTY ROLES: TEACHING VS. RESEARCH ..............93
1. The Nature of Business School Research .......97 E. BUSINESS FACULTY SHORTAGE: DEMAND EXCEEDS SUPPLY ..98
1. An Increasingly Foreign Candidate Pool ......102 2. Competing with the Private Sector ...........103 3. Confronting the Shortage ....................104 4. Turning to Non-Business and Contingent
Faculty .....................................106 F. FACULTY COMPENSATION .............................107 G. FACULTY CAREER CHOICE ............................110 H. FACULTY JOB SELECTION ............................113
1. Why Faculty Choose to Work at a Particular School ......................................114
2. Relocating to New Positions .................116 I. FACULTY JOB SATISFACTION .........................117
1. Lower Satisfaction Among Untenured Tenure-Track Faculty ...............................119
2. Sacrificing Family and Personal Life for the Academic Career .............................121
VI. SUBSTITUTES ...........................................125 A. CORPORATE UNIVERSITIES ...........................126 B. NON-TRADITIONAL ..................................128 C. EXECUTIVE EDUCATION ..............................130
1. Degree Granting Executive Education .........130 2. Non-Degree Granting Executive Education .....131
D. CONCLUSION .......................................131 E. ANALYSIS .........................................135
VII. ANALYSIS, CONCLUSIONS, AND RECOMMENDATIONS ............139 A. ANALYSIS OF GSBPP IN RELATION TO THE MBA MARKET
ANALYSIS .........................................139 B. CONCLUSIONS ......................................144 C. RECOMMENDATIONS ..................................145
APPENDIX ...................................................147 LIST OF REFERENCES .........................................153 INITIAL DISTRIBUTION LIST ..................................159

ix
LIST OF FIGURES
Figure 1. MBA Representative Core Course Requirement......14 Figure 2. Expense Components for the Harvard Business
School, FY 2005.................................19 Figure 3. Revenue Components for the Harvard Business
School, FY 2005.................................21 Figure 4. Components of Revenue for the University of
Wisconsin Business School.......................22 Figure 5. Criteria Used by Publications to Rank MBA
Programs........................................26 Figure 6. Publication’s Top Ten MBA Rankings..............28 Figure 7. The “Virtuous Cycle” of High Rankings...........36 Figure 8. The “Vicious Cycle” of Low Rankings.............37 Figure 9. GMAT Data, Then vs. Now.........................48 Figure 10. School Selection Criteria.......................53 Figure 11. Importance of School Selection Criteria.........54 Figure 12. Top Ten Standardized Ratings of Specific
Criteria within Key Aspects.....................54 Figure 13. Overall Numbers.................................55 Figure 14. Impact of Top 10 Ranking........................56 Figure 15. Impact of Top 50 Ranking........................56 Figure 16. Value of the MBA Program........................58 Figure 17. Satisfaction with Aspects of the MBA Degree.....59 Figure 18. Average Base Salary among MBA Grads who
Received/Accepted Offer of Employment...........61 Figure 19. Estimated Starting Salary for New Hires.........61 Figure 20. Salaries and Bonuses for Respondents who
Accepted a Job Offer, by Work Experience........62 Figure 21. Method of Financing Graduate Management
Education.......................................63 Figure 22. Right Decision to Pursue the MBA Degree.........63 Figure 23. Motivation to Pursue a Graduate Management
Education.......................................64 Figure 24. Reservations about Pursuing Graduate Management
Education.......................................65 Figure 25. Overall Value of the MBA Degree.................66 Figure 26. Satisfaction with the MBA Degree................67 Figure 27. Level of Improvement in Skills and Abilities....68 Figure 28. Job Level.......................................68 Figure 29. Career Switching vs. Career Enhancement.........69 Figure 30. Job Functions...................................69 Figure 31. Industry Group Pursued for Employment...........70 Figure 32. Number of Job Offers............................71

x
Figure 33. Corporate Recruiters Survey 2006................74 Figure 34. Number of Schools Which Company Visits to
Recruit MBAs (GMAC, 2006a)......................76 Figure 35. Corporate Reimbursement and Sponsorship
Programs Among Firms That Hire MBAs (GMAC, 2006a)..........................................77
Figure 36. Sources of Job Offers...........................77 Figure 37. Classification of Higher Education Faculty......83 Figure 38. Faculty Employment Status by Institutional
Category, Fall 2005.............................85 Figure 39. Trends in Faculty Employment Status, All
Colleges & Universities, 1975-2005..............86 Figure 40. Generalization of the Tenure-Track Career
Ladder..........................................89 Figure 41. Generalization of the Non-Tenure-Track Career
Ladder..........................................92 Figure 42. Distribution of Faculty by Rank and
Institutional Category, 2005-2006...............93 Figure 43. Balance of Faculty Interest between Teaching
and Research....................................94 Figure 44. Research Publications of Full-Time Faculty
Members, 2001-2002..............................96 Figure 45. Degrees Conferred in Business and Management in
the U.S. (1969-2004)...........................100 Figure 46. Doctoral Career Choices of Business and
Management Doctorates (2004)...................104 Figure 47. Average 9-Month Salary by Business Field and
Rank (2005-06) ($ in 000’s)....................109 Figure 48. Top Reasons Faculty Pursue an Academic Career..111 Figure 49. Importance of Factors in Accepting a Business
School Faculty Position (7 point scale, 7=extremely important,1=not at all important)..115
Figure 50. Top Reasons Faculty Are Satisfied with a Particular Academic Position...................119
Figure 51. Top Sources of Stress among Faculty Members, Compared by Gender.............................123
Figure 52. Impact of Program Type.........................134 Figure 53. Overall Value of the MBA Degree, by Program
Type...........................................134

xi
ACKNOWLEDGMENTS
The authors would like to acknowledge our wives and
children. Without their support, we could not have
accomplished this milestone in our academic careers. We
would also like to acknowledge the help of Professor Peter
Coughlan. Without his tremendous effort, motivation, and
dedication, we would not have completed such a worthwhile
effort. A special thanks also goes out to Professor
William Gates for his tireless dedication to this project
and to us. Thank you all.

xii
THIS PAGE INTENTIONALLY LEFT BLANK

1
I. INTRODUCTION
Traditional business schools face threats to their
competitive positioning as the educational industry becomes
more diverse. The ability of educational institutions to
remain competitive is contingent upon their ability to
correctly identify the factors that influence the industry
and to adjust their strategy accordingly. Specifically,
The Naval Postgraduate School’s (NPS) Graduate School of
Business and Public Policy (GSBPP) must develop a strategy
to provide its customers and suppliers with greater value
than the alternatives provided in a growing management
business education industry.
For its customers, providing greater value refers to
GSBPP’s ability to provide the greatest “bang for the buck”
in terms of benefits relative to costs. With so many
competitors in the market, there is no guarantee that GSBPP
will perpetually continue to provide best value. If at any
point the school no longer provides the best value, the
Department of Defense (DoD) will find other sources of
supply for its graduate education requirements.
The concept of best value is relative. Understanding
how GSBPP relates to its environment is critical to
identifying the activities in which the school should
engage. However, this first necessitates a clear
definition of the environment. This thesis will rely
primarily upon articles written by Michael Porter. In his
article “How Competitive Forces Shape Strategy,” Porter
defines an industry as a group of firms that market
products which are close substitutes for each other.

2
In the article, Porter identifies the five primary
competitive forces. These forces are the elements that
this thesis will analyze with relation to the graduate
business education industry as a whole and then as to how
GSBPP’s position within the industry allows it to compete.
The purpose of this MBA Graduate Project, in
particular, is to conduct an industry analysis of the
notional market for Master of Business Administration
(MBAs) degrees. In this endeavor, an identification and
analysis of the market forces affecting the MBA market was
conducted to determine what type of competitive positioning
is necessary to be successful. By assessing these market
forces, or any market forces for a given industry, business
strategists provide insight that allows them to understand
the competitive positioning of their organization within
that industry. This knowledge enables them to make
informed decisions about the strategic direction of their
company.
Too often, strategic decisions are made in absence of
this information. This leads to a “marketing myopia” of
sorts that usually appears in a company’s focus only on its
buyers when making decisions regarding price, product,
promotion, etc. This can cause an organization to make
strategic blunders because they fail to recognize how their
decisions affect relationships with suppliers. It can also
cause them to give up valuable market share to its primary
competitors. Another problem that this ignorance can cause
is inadvertently increasing demand for substitutes to its
products. Either of these situations can cause loss of
money through diminished sales or increased input costs.

3
These principles not only apply to the private sector,
but also to the public and non-profit sectors. The same
valuable lessons about understanding the industry in which
an organization competes and of an organization’s
positioning within that market are universal. Even though
you might not earn a profit, there are lessons to be
learned about the environment in which you operate.
In this case, the five forces approach will be
employed to analyze attributes of the market for graduate
business education, which will ultimately be used to
evaluate the competitive position of the Naval Postgraduate
School’s (NPS) Graduate School of Business and Public
Policy (GSBPP).

4
THIS PAGE INTENTIONALLY LEFT BLANK.

5
II. INDUSTRY ANALYSIS OVERVIEW
A. INTRODUCTION TO INDUSTRY ANALYSIS AND THE FIVE FORCES
Michael Porter’s articles, “How Competitive Forces
Shape Strategy” and “Note on the Structural Analysis of
Industries,” provide guidance on how to evaluate the
competition in any industry. Porter maintains, “The
intensity of competition in an industry is neither a matter
of coincidence or bad luck.” He argues that the nature of
competition is based on the economics of the industry and
five basic competitive forces, which are illustrated in
exhibit A.
Both articles provide reference for the necessary
background, which will be the basis for analyzing the
business school industry. Prior to delving into the
specifics of the B-School industry, it is useful to provide

6
some background information and definitions on Porter’s
five forces to better understand the common terms and
ideas.
The two Porter articles highlight the importance of
examining the five forces for understanding what causes an
industry to behave in a certain way. The contention is
that evaluation of these forces will provide insights into
the prospects for long-range profitability. Each of the
forces is discussed below to offer a commonly accepted
definition and enough background to allow the layman to
understand the concepts in not only a general context but
in the specific application to B-Schools.
B. COMPETITION
The first of the five forces influencing industry
economics is the rivalry among existing competitors in a
market. Porter refers to this as “jockeying for position.”
The intensity of the rivalry among competitors is related
to the following factors:
• Number and relative size of competitors
• Level of industry growth
• Degree of differentiation
• Relative magnitude of fixed costs
• Level of exit barriers
• Diversity of strategies employed by rivals

7
C. SUPPLIERS
Supplier power is a second force to be considered.
Suppliers who have advantages of limited availability of
their product may raise prices or reduce quality in an
effort to increase their profits. Actions such as these
diminish the profit potential of competitors in a given
industry if there is no alternative. Porter suggests that
a supplier group is powerful if:
• It is dominated by few companies and is more
concentrated than the industry to which it
sells.
• The input supplied is unique, differentiated or
requires significant switching costs.
• Suppliers pose a credible threat of forward
integration.
• Industry is not an important customer of the
supplier group.
D. BUYERS
The buyer group constitutes the third industry force
and this group is powerful if:
• It is concentrated or purchases in large
volume.
• Products are standard or undifferentiated.
• Products it purchases from the industry in
question form a component and represent a
significant fraction of cost.

8
• The buyer group earns low profits (increasing
the incentive to lower its purchasing cost)
• Product is unimportant to the quality of
buyers’ products or services.
E. SUBSTITUTES
Substitutes are the fourth force. They are products
that can be used as alternatives and provide similar
utility at less price. The key to substitutes is the
customer’s willingness or ability to trade off
differentiated functionality for cost. If an industry
fails to differentiate in a way that prohibits the trade-
off, the substitute will place downward pressure on
industry prices.
F. THREAT OF ENTRY
Threat of entry is the final force addressed. The
importance of this force is based on the premise that new
competitors in an industry bring added capacity. The added
capacity will provide a downward pressure on prices as
competitors fight for increased market share. Entry
barriers, however, can be high. These high barriers
increase the risk for the new entrant and can deter entry
if the promise of profit is not great enough to outweigh
the risk. Porter cites six major barriers to entry:
• Economies of Scale – force entrants to enter on a
large scale or accept a cost disadvantage
• Product Differentiation — implies finding a
position to overcome entrenched customer
loyalties

9
• Capital Requirements - need for large sums of
upfront capital which may not be recoverable
• Cost Disadvantages independent of size –
advantages attained through learning curve,
proprietary technology, geographic location, etc.
• Access to distribution channels – new entrants
must find room or displace current competitors to
get their product to market
• Government policy – industry regulations,
controls, accreditation and licensing
requirements may prohibit entry to potential
competitors.
G. OTHER INDUSTRY FORCES
While Porter’s approach identifies and analyzes the
five key forces in any market, there may also be other
forces that may not fit neatly into one of these five
categories but may nonetheless significantly affect any
given market’s economics and structure. It is up to the
individual organization to investigate their respective
markets thoroughly to determine what other forces are out
there. Forces could range from external stakeholders, such
as the media and government, to organizations that produce
complements that impact the demand for the primary products
in that market. In any case, for each force or stakeholder
group, it is important to understand its degree of leverage
over the organization as well as its incentives as they
relate to its interaction with the organization.
The need to look beyond the basic five forces is
observable in the personal computer market, where

10
complementors play a key role. Manufacturers of peripheral
devices, such as printers, monitors, and software, do not
compete with personal computers. They do, however,
interact with the computer manufacturers by either
collaborating with them or with their competition. By
making devices for use on or with the personal computers,
they enhance the desirability of the computers themselves,
and in this way their products serve as complements to the
personal computer industry. It is important for the
computer manufacturers to consider this when determining
their competitive strategies within the computer market.
If they overlook the manufactures of the peripherals, they
could alienate themselves and drive them to form strategic
partnerships with other firms in the market. And, if they
want to elicit the help of the peripheral manufacturers,
they need to consider what types of incentives they are
prepared to offer them to earn their loyalty. This shows
that there are more forces at play than just the
competitors, buyers, suppliers, substitutes, and potential
entrants. It is important that a thorough investigation
and analysis of the market and all key stakeholders be
conducted so that no stakeholder is left out.
H. METHODOLOGY
The methodology in applying the five forces analysis
to the MBA market was to scrutinize each of the “five
forces” to see exactly how each would be utilized to
understand the effects they collectively have on the
economics and structure in the market for MBA education.
We conducted an in-depth search of secondary research to
gather information to answer questions pertaining to each
of the five forces. Upon completion of our research, we

11
concluded that the major forces that affect the MBA market
were competition between business schools, buyers of
business education including both students and employers,
faculty as the key suppliers to the industry, and
substitutes in the forms of alternative means of delivering
graduate business education. Because the factors
contributing to barriers to entry in the industry primarily
consist of factors, (such a building a reputation) which
were also relevant to the nature of competition, potential
entrants were not considered in an individual category but
were addressed as part of our analysis of competition. The
following chapters provide the results of our research.

12
THIS PAGE INTENTIONALLY LEFT BLANK

13
III. COMPETITION
In 2004, the AACSB conducted a Strategic Management
Survey of member schools. In that survey, business school
deans reported that the greatest pressures on their job
came from managing faculty issues (cited by 74% of
respondents), identifying and pursuing new funding sources
(45%), and distinguishing their business school from
competitors (24%). (Fairbank, Libanca, & LeClair, 2005)
These results demonstrate the diverse elements of
competition in the MBA market and illustrate why
competitive rivalry is a critical important market force
in this industry. They also highlight the areas of the
competition that are the most prominent within this
category: cost, revenues, and reputation.
A. BUSINESS SCHOOL MISSION
The business school mission includes two primary
components: education and research.
1. Education
A typical core MBA curriculum can be seen in Figure 1.
(Lathroum, 1998) Among the top 10 MBA programs, the range
of core (i.e., required) courses ranges from as few as 6 to
as many as 16, with an average somewhere around 11. The
total MBA courses that students must complete at these
programs range much more narrowly from 19 to 23. While
course offerings at the different schools are generally
similar (both inside and outside the core), the experiences
of different MBA students can vary widely based on the
elective courses they choose to take. Moreover, the course
offerings and content appear to be important to students
given that a factor analysis conducted in 2006 showed that

14
the MBA curriculum has a profound impact on the perceived
value of the MBA. (Syed, 2006)
Figure 1. MBA Representative Core Course Requirement
While business schools consider it their mission to
educate students for their entire career, they are under
intense pressure from the business community to focus less
on higher level long-term education and, instead, focus on
short-term training on business practices. Other
professional schools have faced this battle between
education and the profession’s demand for vocational
training. Law schools, for instance, have said “No” to the
profession’s suggestions that they should be providing more
hands-on training and practical application skills that
could help them pass the bar exam. Law schools have
instead opted for a model of education that prepares
Management and
Organization
Financial Management Economics
Strategic Management Financial Accounting Microeconomics
Human Resource Management Managerial
Accounting
Macroeconomics
Organizational Behavior Finance
Management Communication
Leadership
Quantitative Skills Marketing Other
Operations Management Marketing Business Ethics
Statistics Business Law
Decisions Analysis

15
students for a career in law vice their next job. (Dulek,
1992)
James Howell, co-author of the 1959 Gordon-Howell
report, agrees with this logic, arguing that:
A business school has to serve the profession, but that doesn’t mean that it should always do what the profession wants it to do. Its obligations are to its students and to the profession as it’s emerging, not necessarily as it exists today. I think it’s important that business schools stay some distance away from the business community. Their primary responsibility is not to today’s business community; it’s to the business community of the future, and, in a more abstract sense, to society. You’re trying to serve society through professional education… (Dulek, 1992)
This speaks against the call for curriculum reform
that typically leads to less vigorous, vocational type
courses that focus on current trends in business and
primarily teach students skills to be successful at their
first job vice techniques that will equip them for a
successful career. (Dulek, 1992)
2. Research
In 1959, the Gordon-Howell Report was published as the
culmination of a series of reports and papers focused on
surveying professional business education. This report
deduced that the American business education system was
nothing more than a collection of trade schools that
operated without reliance on any strong scientific
foundation whatsoever. (Dulek, 1992) Overall, business
schools were poorly regarded both on their own campuses and
in business circles.(Dulek, 1992) Herb Simon, a Nobel
laureate, concluded, “Accurately or not, we perceived
American business education at that time as a wasteland of

16
vocationalism that needed to be transformed into science-
based professionalism, as medicine and engineering had been
transformed a generation or two earlier…”(Dulek, 1992)
One of the first institutes to offer science-based
graduate business education was the Graduate School of
Industrial Administration (GSIA) at Carnegie Tech in 1949.
Staffed largely with economists from the University of
Chicago, GSIA produced an impressive portfolio of research
and doctoral students.(Dulek, 1992) GSIA’s first dean,
Lee Bach, wrote in 1951,
…business administration is a new profession. It still operates heavily on rules of thumb and hunches, often unnecessarily so. It is a profession that is growing up rapidly. A crucial part of that growth must be the amassing of careful scientific analysis and research to lay bare what is hearsay in management, what is fundamental skill, and what is transient practice. I am personally convinced that careful, fundamental research in the management fields over the next half century can and will vastly improve our present knowledge and skills.(Dulek, 1992)
Echoing Mr. Bach’s concerns, the Gordon-Howell Report
provided a recipe to change the perceptions held of the
business schools:
Collegiate business education should educate for the whole career and not primarily for the first job. It should view the practice of business professionally in the sense of relating it to what we have in the way of relevant, systematic bodies of knowledge. It should emphasize the development of basic problem-solving and organizational skills and socially constructive attitudes rather than memory of facts or training in routine skills.(Dulek, 1992)

17
By incorporating the suggestions in the Gordon-Howell
Report, Graduate Business Education took a turn. Leading
business schools began investing heavily in science-based
research faculty and doctoral programs to shift their focus
from training to education. (Dulek, 1992) They expanded
heavily into doctoral education as well. Schools began to
recognize that having doctoral students serves three
purposes: (1) doctoral students enhance faculty research
efforts by assisting them and co-authoring topics; (2)
teaching doctoral seminars motivates faculty to perform
more and better research; and (3) most importantly,
“doctoral students are the researchers and teachers of
future generations.” (Dulek, 1992)
Having shifted the focus from training to education
and placing a greater emphasis on research, business
schools completed a drastic turnaround. This turnaround
helped to improve the perception of the MBA. MBAs boomed
from 3,200 in 1955-56 to over 102,000 in 1997-98; an annual
compound growth rate of about 8.4 percent. (Dulek, 1992) In
addition, business school faculties were publishing in
prominent international social science journals. (Dulek,
1992)
Known for their research skills and analytical
backgrounds, business schools added economists to their
staff. This new breed of faculty used its systematic
bodies of knowledge to create new and inspiring curricula.
Courses that relied on vocational, experience-based
principles were replaced by courses that focused on problem
solving and organizational skills.(Dulek, 1992) Concepts
such as the capital asset pricing model, the efficient
markets hypothesis, game theory, linear programming models

18
for constrained resource allocation, and option pricing and
risk management, which now serve as some of the staples of
MBA curricula, came from basic research conducted decades
earlier. As one scholar noted:
The latter practical application [of these basic research findings] followed in much the same way as nuclear power followed the basic theories of high-energy physics and Einstein’s theory of relativity, or as Watson and Crick’s basic research into the double helix structure of DNA led to today’s extensive applied research in genetic engineering. Basic theoretical research precedes applied research. Powering the boom of business education in the 1980s and 1990s was the highly abstract, then-impractical basic research of the 1960s and 1970s. (Dulek, 1992)
This emphasis on fundamental, theoretical research
caused a revolution in business education. Instead of
teaching facts about business, schools began to emphasize
learning to think about business problems and situations.
Business schools began to educate students vice train them.
(Dulek, 1992) Now, in the wake of the successful shift from
vocation to education, MBAs from top ranked schools are
highly sought after by businesses, as noted professor James
Howell is quoted as saying, “because of the theoretical,
abstract intellectual approach that they bring. They are
the ones who come in with new ideas and see problems in
different ways.” (Dulek, 1992)
B. COSTS
A surprising reality regarding the economics of
graduate business education was expressed by Kenneth Dunn,
dean of Carnegie Mellon's Tepper School of Business, when
he observed, “You lose money on every MBA … My guess is
that no top MBAs cover their cost, because you need

19
outstanding faculty to attract the students; to attract
outstanding faculty, you need money to finance their
research.” (Economist Staff, 2004)
Figure 2 demonstrates the types of costs that a
typical MBA program can expect to incur during normal
business operation. This figure was taken from the Annual
Report of the Harvard Business School, however the relative
breakdown of expenses is typical of major business schools.
It is interesting to note that the salaries and benefits
for faculty account for the majority of the costs,
comprising 50 percent of the total expenditures.
Figure 2. Expense Components for the Harvard Business School, FY 2005
The significant costs associated with graduate
management education have left room for competitive entry
by low cost providers. A decade ago, if you had asked
business school deans what they thought would be the
stiffest competition to residential MBA programs, they
might have said private consulting firms or corporate

20
universities. However, they are now facing the reality
that they must compete with the low-cost providers who can
turn a profit because they are not burdened with the high
fixed costs of the “bricks and mortar” university. These
smaller for-profit companies are not tied to traditional
campuses like the high-cost providers are. Thus, they can
reach markets that are too costly for the traditional MBA
programs. (Bisoux, 2004)
The problem facing the traditional high-cost
management education providers is that to serve a shifting
customer demographic, business schools must offer students
real-world experience, greater access to information,
expanded use of technology, a higher level of skill
development, and more sophisticated global perspectives.
(Westerbeck, 2004) They are also forced to provide new
services, including career placement assistance and
convenient hours. At the same time, they are trying to
fund new facilities, building renovations, and upgrades to
technology. This is a costly set of requirements that
require more resources and better-educated faculty. The
combination of these costs exceeds what tuition alone can
cover.
C. REVENUES
Today, MBA programs are facing an increasingly complex
funding scenario as traditional sources of funding are
shrinking, requiring deans to spend more energy considering
how to raise capital. As Newman, Couturier, and Scurry
(2004) observe, “the search for truth” in higher education
institutions “is rivaled by a search for revenues.” (Gappa,
Austin, & Trice, 2007) At the same time, competition for
faculty and students is intensifying, leading to higher

21
salaries and more money invested in recruitment. (Fairbank,
Labianca, & LeClair, 2005) Where is the money coming from?
Despite what one might think, the majority of money
isn’t coming from MBA tuition. Most traditional MBA
programs, as well as universities in general, recognize
that tuition alone will not cover the rising costs of
employing faculty and paying for their research, much less
all of the other costs previously discussed. Figures 3 and
4 provide a breakdown of revenues for a representative
private (Harvard Business School) and public (University of
Wisconsin) business school.
Figure 3. Revenue Components for the Harvard Business School, FY 2005
At Harvard, tuition and fees only comprise 21 percent
of the total revenue; at Wisconsin, tuition and fees only
generate 37 percent of revenue, and that is with state aid
subsidizing tuition. These figures show that the vast
majority of universities have to seek out other sources of
revenue to stay out of the red. Harvard and Wisconsin each

22
rely heavily on private funding and endowments, 21 percent
and 21.9 percent respectively, to continue to operate.
Figure 4. Components of Revenue for the University of Wisconsin Business School
In today’s market, most schools are forced to rely on
endowments, donations from alumni, and contributions from
companies with a vested interest in the institution’s
success. (Economist Staff, 2004) Melvin Stith, dean of
Florida State University’s College of business, says, “Most
[public] universities would say they get 50 cents on the
dollar from state appropriations and make up the rest
through philanthropy.” (MBA.com, 2005a) GMAC’s Selections
recently studied the naming gifts that business schools

23
received between 1998 and 2003. Of this group, 13 schools
received between $25 million and $62 million in
donations.(Fields, 2006) Since November 2001, BizEd has
reported gifts of $20 million or more to six business
schools, in addition to those cited in the Selections
study. The largest naming gift was $100 million and
awarded by Stephen M. Ross to what is now the University of
Michigan’s Ross School of Business.(Fields, 2006)
In the same article, BizEd reported 11 gifts or grants
ranging from $5 million to $17 million, and 37 gifts or
grants ranging from $1 million to $5 million. (Fields,
2006) Of the 387 AACSB-accredited schools that responded
to a 2002-2003 survey by AACSB Knowledge Services, almost
10 percent had endowments exceeding $50 million. Sixty
percent, however, had endowments of $5 million or
less.(Fields, 2006) One study shows that philanthropic
contributions to both public and private universities
averages somewhere around $24 billion a year. (Tyson,
Spring 03) These studies clearly demonstrate the major
role that gifts and endowments play in the school’s
financial well-being.
These philanthropic donations do more than just fund
the business programs. In some cases, these gifts can
propel a program into the rankings. This can have a
profound effect on strategic growth. The Sam Walton
College of Business, after receiving a mega-gift of $50
million, began to rise in U.S. News and World Report’s
business school rankings and currently ranks as a top-50
school. Two years after Notre Dame’s Mendoza College of

24
Business received a $30 million gift, it vaulted up the
rankings, breaking into Business Week’s top-30 in
2002.(Tyson, Spring 03)
It seems that the only educational programs that are
generating positive cash flow at business schools are the
non-traditional MBA programs (i.e. part-time, executive
education, and other types of hybrid MBAs). (Bisoux, 2006)
At Harvard, executive education tuition contributed 23
percent to the total revenue received in 2005. At
Wisconsin, executive education was 27 percent of their
total revenues in 2005.
Some traditional Business schools have also added the
option of marketing their services to the external
customers. They can sell their instruction, information,
and consulting services to other outside organizations,
thus providing them some degree of independence from
university and state support in meeting their budget
shortfalls. (Bisoux, 2004) Wisconsin attributed 21.9
percent of their 2005 revenues to these activities. This
puts the advantage in favor of the larger, private schools
that have a lengthy pedigree of alumni with resources to
donate back to the institutions.
Given the difficulties that these traditional programs
have generating income, it is not surprising that the state
funded institutions are facing increasing competition for
financial aid from their respective states. With more and
more institutions seeking monetary relief, the supply of
money is shrinking. In fact, one AACSB publication noted
that “23 states approved spending plans for higher
education for the 2003-2004 fiscal year. Each of these
plans allocated less funding than in the previous year.

25
Thirteen states made similar cuts in 2002-2003, and five
states did so in 2001-2002.” (Fields, 2006) It is evident
that this trend of decreasing funding does not bode well
for the smaller, government funded programs. With this
glib picture of the MBA marketplace, one wonders why a
university would offer the degree. In fact, in many cases,
offering a traditional MBA degree represents more of an
investment in the school’s reputation than an effort to
make a profit. (Bisoux, 2006)
D. VERTICAL DIFFERENTIATION
1. Rankings
In 1988, Business Week published its first rankings of
business schools. Since then, four other sources have been
publishing rankings: The Wall Street Journal, Financial
Times, U.S. News and World, and Forbes. In determining
rankings, these publications take into account student
surveys, a survey of corporate recruiters, faculty
research, average undergraduate GPA, average GMAT scores, a
survey of business school deans, acceptance rate
(selectivity), starting salary and bonuses of graduates,
placement percentage, salary increase for graduates, career
progression of the students, diversity and international
exposure, and alumni ratings. See Figure 5 for a complete
breakdown of which publications use what criteria for their
rankings. The publications take a combination of these
statistics and formulate their rankings. Students rated
The Wall Street Journal, which ranks MBA programs
exclusively on recruiter surveys, as the publication with
the most credible rankings. (Schoenfeld & Bruce, 2005)
An interesting fact about rankings is that, because of
the differences in how they compile the rankings, the

26
publications do not always agree on how the MBA schools
rank. For instance, when The Wall Street Journal’s ranking
first came out in 2001, it had Stanford at 45, whereas
Business Week had Stanford at 11, and US News had Stanford
at number 1. (Mast, 2001)
Figure 5. Criteria Used by Publications to Rank MBA Programs
Publication Criteria
Business Week WSJ Financial
Times U.S. News Forbes
Student Surveys X X
Recruiter Surveys X X X
Graduate Surveys X
Faculty Published Research X X
Faculty With Doctorate X
Employment Upon Graduation X X
Employment 3 Months After Graduation X X
Salary & Bonus Upon Graduation X X X
ROI X X
Gender Diversity X
International Diversity X
Average undergrad GPA X
Average GMAT Score X
Average Acceptance Rate X
Out of State Tuition & Fees X
Full-time Enrollment X
Applicant Ranking of Credibility #1 #2 #3 #4 #5
Figure 6 illustrates how these differences manifest
themselves in the most recent Top Ten list of each
publication. The average correlation between the five
surveys is only 0.46.(Zimmerman, 2001) Since 1.00 shows
complete correlation and 0.00 shows absolutely no
correlation, this data indicates that there is relatively
little correlation between the five publications and their
rankings.

27
First published at a time when the vast majority of
MBA programs failed to keep buyer opinions in mind, the
original idea behind the rankings was to force MBA
providers to be responsive to their primary constituents:
students and employers. The rankings therefore were
intended to implement a system of reward and punishment to
hold the universities accountable to their customers.
(Mast, 2001) This system, has, in a sense, backfired.

28
Figure 6. Publication’s Top Ten MBA Rankings
Recent Rankings of Top Ten MBA Programs by Various Publications
Business Week 2006 Financial Times 2007 US News 2006
1 University of Chicago GSB
Univ. of Pennsylvania (Wharton)
Harvard Business School
2 Univ. of Pennsylvania (Wharton)
Columbia Business School
Stanford University GSB
3 Northwestern University (Kellogg)
Harvard Business School
Univ. of Pennsylvania (Wharton)
4 Harvard Business School
Stanford University GSB MIT (Sloan)
5 University of Michigan (Ross)
University of Chicago GSB
Northwestern University (Kellogg)
6 Stanford University GSB NYU (Stern) University of Chicago
GSB
7 MIT (Sloan) Darthmouth (Tuck) Columbia Business School
8 UC Berkeley (Haas) Yale School of Management UC Berkeley (Haas)
9 Duke University (Fuqua) MIT (Sloan) Darthmouth (Tuck)
10 Columbia Business School UCLA (Anderson) UCLA (Anderson)
The Wall Street Journal 2006 Forbes 2005
1 University of Michigan (Ross) Dartmouth (Tuck)
2 Darthmouth (Tuck) Univ. of Pennsylvania (Wharton)
3 Carnegie Mellon University (Tepper)
University of Chicago GSB
4 Columbia Business School
Columbia Business School
5 UC Berkeley (Haas) Yale School of Management
6 Northwestern University (Kellogg)
Stanford University GSB
7 Univ. of Pennsylvania (Wharton)
Harvard Business School
8 UNC Chapel Hill (Kenan-Flagler)
University of Virginia (Darden)
9 Yale School of Management Cornell
10 MIT (Sloan) Northwestern University (Kellogg)
29
Some schools have simply become obsessed with their
position on the rankings, to the point of even firing deans
who fail to produce desired improvements in position.(Mast,
2001) More than just endangering the jobs of b-school
deans, this quest to top the list of MBA programs has put
business schools in a jam.
A number of observers have argued that these rankings
lead some deans to focus on looking like a good school
rather than being a good school.(Zimmerman, 2001) Why
wouldn’t they? After all, the typical tour of duty for a
dean lasts between five and ten years, so deans have strong
incentives to focus on tactics to enhance short-term
rankings rather than utilize resources on things like
research and doctoral education that only yield dividends
long after the dean has left office. (Zimmerman, 2001) So,
in trying to “look good,” deans shift a large percentage of
resources to engineer the ranking of their full-time MBA
programs. Unfortunately, given the limited resources of
most universities, this has robbed a large percentage of
resources once devoted to undergraduate programs,
curricular innovation and research.(Policano, 2005)
In his compelling paper entitled “Can American
Business Schools Survive?” Jerold Zimmerman states:
This ratings race has caused schools to divert resources from investment in knowledge creation, including doctoral education and research, to short-term strategies aimed at improving rankings. The resulting decline in business doctorates is creating a severe shortage of quality faculty. American business schools are mortgaging their future; they are consuming their seed corn. (Zimmerman, 2001)

30
Before 1985, the top U.S. business schools were
research-centric. In fact, the quality of the business
school’s reputation was driven by the quality of its
research.(Zimmerman, 2001) “Schools with cutting-edge
research attracted the best students and top young faculty,
as well as gifts and grants, which enable them to retain
existing faculty.” (Zimmerman, 2001) However, even though
schools maintain a bias for research faculty, most MBA
programs today face the reality that students and employers
prefer teaching faculty over research faculty. (Zimmerman,
2001)
Consequently, one of the most common casualties of the
resource reallocation that stems from the pursuit rankings
is the business doctoral program. (Zimmerman, 2001) As
resources are rerouted to furnish new facilities and
advertising agendas, the doctoral programs are starved.
These programs have shrunk because there is no funding to
continue the student stipends that draw in high-quality
students, and professors are stripped of their financial
resources to conduct research that brings in the new
knowledge.
More than financial resources are affected.
Professors are also robbed of their time that is normally
devoted to research because they are forced to maintain a
larger teaching load.(Zimmerman, 2001) Schools are
actually asking professors to teach extra classes instead
of performing the much needed research.(Zimmerman, 2001)
Research is where the primary instruction for the doctoral
students occurs. The benefits for maintaining a doctoral
program were already detailed in a preceding section of
this chapter. Without such programs, business schools risk

31
becoming stagnant in their ability to shape the leaders of
tomorrow but, much worse, they lose their ability to
educate the educators of tomorrow.
To further illustrate this point, John Kraft, Chair of
the Association to Advance Collegiate Schools of Business
(AACSB) and Dean of the University of Florida Business
School, wrote that, “the top ten [business] Ph.D. producers
have reduced by one-third the number of Ph.D.s produced
annually compared to ten years ago … In the next ten years
the number of Ph.D. graduates will approach 50% of the
output of the 1990s in the face of increasing demand for
faculty.” (Zimmerman, 2001) Deans might encourage research
that has a high level of visibility via the news media, but
this is mainly to enhance the school’s standings in the
rankings. (Zimmerman, 2001)
Rankings have dramatically changed business education
in other significant and perhaps undesirable ways:
(Policano, 2005)
• Higher GMAT requirements: Higher GMAT scores for entrants translate into higher rankings. Therefore schools have raised entrance requirements.
• Smaller Cohorts: To compete against top tier school’s brand recognition, second and third tier schools have adopted a strategy of decreased class sizes. This boosts the selectivity factor and possibly facilitates rankings increases, thereby attracting larger numbers of top students.
• Overemphasis on paychecks: This sends the message that the education, networking and quality of the program are not what is important. It implies that the salary after graduation is what is important.

32
• Shifts in Spending: As schools divert money to improve rankings it weakens the quality of the learning environment. However more money for better faculty and better research facilities should also improve the learning environment. This presents a strategic dilemma of how business schools can balance between rankings and education in different ways to gain competitive advantage?
• More frills less substance: Business schools are adding student perks like fitness centers and extravagant décor, while neglecting classrooms and the learning environment.
• Marketing Bonanzas: AACSB conducted an informal survey that found 6 of 7 schools were undergoing major branding initiatives. Five had actually contracted with external PR agencies. These expenditures do not affect quality yet they likely increase rankings.
Tom McQuillan, executive director of the MBA program
at Temple University’s Fox School of Business commented on
the focus on rankings:
It’s an absolute top priority, because students take these rankings very seriously … There’s a tremendous amount of pressure to focus on the rankings, so it’s very easy to get distracted from the things you should be doing. Institutions which have enjoyed a positive ranking and who slip four of five slots start looking at all their practices — and that program may have been very successful to begin with. (Wuorio, 2001)
So why pursue rankings at all? It has already been
mentioned that the rankings system isn’t a perfect science.
Results are based on responses to a number of surveys, and
not all of those given the surveys respond. The five
publications that publish rankings do not agree on who

33
should be in the top ten and in what order. They do not
even agree on which criteria should be considered in the
rankings.
Should it matter? Do students care what goes into
determining the rankings? Most universities don’t even
think that students read the ranking methodology. (Tyson,
2001) Shouldn’t students care how and why the school of
their choices is ranked the way it is? It isn’t like these
rankings are movie reviews. One author made an analogy to
demonstrate the danger of treating these rankings as such:
“We only spend several dollars per ticket and a few hours
at a movie; a business school student invests a great deal
of money, time, and effort in business school and, to some
extent, banks a career on choosing the right school.”
(Tyson, 2001)
Regardless of whether or not the students understand —
or even care to understand — the reasoning behind the
rankings, the perception is that the higher ranked a
school, the better it is. Case in point: The University of
Pennsylvania’s Wharton School was ranked number 1 by
Business Week four times between 1993 and 2000. During
those same years, the applicant pool increased
dramatically, from 4,300 in 1993 to 8,400 in 1999. (Wuorio,
2001) In 2001, The Wall Street Journal ranked the Amos Tuck
School of Business at Dartmouth number one. As a result,
application inquiries increased sixty percent in the year
between September 2000 and 2001. (Wuorio, 2001) In
response to its ranking, Tuck’s dean Paul Danos said, “It
certainly has an effect on the number of students choosing
to come here. But it also ratchets up everybody’s
expectations. Nobody wants to come to a place that’s

34
ranked 1 and leave when it’s at number 20. And people who
say they don’t care about that are being just a bit
disingenuous.” (Wuorio, 2001)
It isn’t just the spark to applications that drives
the obsession with rankings. Success in rankings is also
tied to increases in alumni funding. The Edwin L. Cox
School of Business at Southern Methodist University was
ranked 9th by The Wall Street Journal. This boosted alumni
annual fund contributions by 150 percent in just a few
years. Besides opening their pocketbooks, alumni also
opened their schedules by increasing their involvement in
the two mentoring programs the business school provides for
its students. (Wuorio, 2001) This falls in line with the
beliefs of one dean from a top-rated business school who
stated, “The reality is that, independent of whether you
believe rankings accurately reflect quality, the perception
of the outside world is [that] it does and consequently
resources flow to schools who are highly ranked.”
(Zimmerman, 2001)
The University of North Carolina’s James Dean, Jr.,
recognizes that this obsession with always vying for higher
rankings has created an “arms race” of sorts among the
business schools. “The fact that once a school gets ranked
highly, it can attract more students, resources, and
faculty to remain near the top of the rankings only
reinforces the idea that the rich get richer and the poor
stay poor.” (Wuorio, 2001)
The reason to drive for high rankings is the attempt
to do one thing: develop a brand name. Branding is a very
important aspect of competition in the MBA market. Sources
say that establishing a brand name is one of the most

35
urgent matters facing business school deans. The reasoning
is tied back into rankings. According to Martin Schatz,
“…the rankings have a tendency to become self-fulfilling
prophecies.” (Tyson, 2004) The higher a school is ranked,
the better it is perceived to be. Therefore, the best
potential students and faculty apply because they want to
be a part of the best schools and, consequently, the school
ends up producing the best graduates, partly because of the
quality of the newly recruited faculty but mostly because
of the high quality inputs (student applicants) in the
first place. The higher the quality of graduates, the
greater the school’s reputation among recruiters. Finally,
because the quality of students (measured by GMAT scores,
undergraduate GPA, and school acceptance rate), the quality
of the faculty (measured by research productivity and
percentage with doctorates), and the perception of
recruiters (measured via survey) all factor into one or
more of the published rankings, the school’s high ranking
is reinforced or even improved. Figure 7 illustrates this
self-reinforcing virtuous cycle for those schools fortunate
enough to be ranking highly in the various publication.

36
Figure 7. The “Virtuous Cycle” of High Rankings
Suffice it to say, if a school is known by its name to
be a high-quality school, it will in fact be (or become) a
high quality school. Furthermore, note that the virtuous
cycle in Figure 7 holds true even if all MBA programs
provided the exact same real educational benefit (in
particular, the cycle would remain even if the arrow
connecting high quality faculty to high quality graduates
was removed from Figure 7). In other words, the rankings
may have very little to do with the actual quality of an
MBA program and could instead be 100% the result of
perception and, in particular, the rankings themselves.
Moreover, note that the same dynamics which create the
virtuous cycle for highly ranked schools in Figure 7 also
create a self-reinforcing “vicious cycle” for poorly ranked
schools. This is illustrated in Figure 8, in which a low
ranking leads to low quality student applicants and low
quality faculty, which produces low quality graduates,
which in turn produces a low quality perception among
recruiters, which together reinforces or worsens the
High Quality Faculty
High Ranking in Publications
High Quality Graduates
High Quality Student Applicants
High Quality Recruiter Perception

37
school’s low ranking. Thus, it is also true that if a
school is known by its name to be a low-quality school, it
will in fact be (or become) a low quality school. When it
comes to MBA rankings, therefore, the rich get richer and
the poor get poorer.
Figure 8. The “Vicious Cycle” of Low Rankings
The resulting incredible importance of perception in
general and rankings in particular make the branding of
business schools a key element in their ability to attract
higher quality professors, students, and donors. (Fairbank
et al., 2005) Most schools are likely to undertake some
sort of branding initiative as they seek to compete in this
market. The largest push is likely to come from newly
founded international business schools and U.S. schools
that have a regional or local community frame of
reference.(Fairbank et al., 2005) U.S. Regional schools
hope to distinguish themselves from competitors at the
High Quality Faculty
High Ranking in Publications
High Quality Graduates
High Quality Student Applicants
High Quality Recruiter Perception
Low Quality Faculty
Low Ranking in Publications
Low Quality Graduates
Low Quality Student Applicants
Low Quality Recruiter Perception

38
local level, and thereby gain market share in a place
typically dominated by smaller, local schools. (Fairbank et
al., 2005)
Beyond seeking higher standings in the rankings,
schools have begun to seek other methods to establish brand
identity. Some AACSB-accredited schools in major markets
are placing joint advertisements to distinguish themselves
from non-accredited schools. (Fairbank et al., 2005) Due
to the growing reputation of non-U.S. business schools and
the increasing demand for business education worldwide,
more students are choosing to acquire business education
from non-U.S. providers. In addition, doctorally qualified
faculties have a broader choice of highly regarded non-U.S.
business schools than ever. (AACSB, 2002)
2. Accreditation
Accreditation is another means of setting MBA programs
apart from others. There are 650 members in the AACSB.
(Zimmerman, 2001) For AACSB accreditation requirements,
see Appendix A. In the MBA industry, there are essentially
three tiers of MBA programs. There are the ranked
programs. Although the Top 20 are considered the elite,
making the Top 50 is still an accomplishment. Below the
ranked schools are the non-ranked accredited programs.
These are the less revered schools that have met the
accreditation standards but cannot compete on the same
level as the ranked schools. Below the non-ranked
programs, and at the bottom of the list, are the non-
ranked, non-accredited programs. These are the programs
that do not conform to widely accepted standards of what a
business school and an MBA program should be and
consequently cannot compete for rankings. They are not

39
necessarily bad programs. They could be brand new upstart
programs that are in the process of gaining accreditation
but have not yet done so.
E. HORIZONTAL DIFFERENTIATION
1. Specialization
Because of the virtuous and vicious cycles that serve
to reinforce overall rankings of “quality” in this market,
there is little opportunity for accredited but unranked (or
lower ranked) business schools to compete head-on with “big
boys” and actually substantively improve their reputation
based on overall quality. Therefore, many MBA programs
have looked for ways to compete via horizontal
differentiation (i.e. specialization or focus) rather than
vertical differentiation (i.e. overall quality to the mass
market).
The MBA market in the U.S. is an unregulated industry
that allows schools to develop their own distinctive styles
and personalities, as well as to define their own missions.
Understandably, a level of “cutthroat” competition exists
in this market that is second to none. (Dobni & Dobni,
1996) To succeed in such a competitive market, business
schools have to capitalize on all available tools and
technological resources to create their own competitive
contexts or “niches” in which to compete.(Westerbeck, 2004)
To create these unique competitive contexts, each school
must look at the features it offers, from its faculty and
programs to its schedule and delivery methods, and promote
those that are most likely to draw attention.(Bisoux, 2006)
The market wasn’t always like this. The MBA that was
offered by North American business schools in the 1980s was
largely undifferentiated. Due to the AACSB’s accreditation

40
requirements to cover a “common body of knowledge,” core
and elective tracks rarely differed from campus to campus.
(Schmotter, 2004) During the 1990s, however, the “one-
size-fits-all” model was abolished due to immense pressure
from stakeholders; the AACSB’s accreditation standards were
revised, giving individual programs the flexibility to
carve out niches in which they could operate.
In some cases, a school might be particularly well
known in certain elective areas, and this might drive
students’ decisions to take those specific courses. On the
other hand, some schools decide to emphasize a specialized
MBA that offers degrees in management with an emphasis in
specific professional industries and disciplines, such as
engineering or health care. By shifting the focus toward
these interdisciplinary degrees, schools can exploit
existing strengths, carve out a new niche, and create
clusters of excellence within the institution.(Fairbank et
al., 2005) The goal is to attract students with unique
experience in certain professional areas by enabling them
to earn an MBA specifically focused in that realm.
It is understandable that schools are quick to market
the fact that they were highly ranked. Attaching a single
number to a program has driven some to promote those
elements that separate them from the others: outstanding
faculty, ideal location, or outstanding parts of their
curriculum. JoAnne Starr, MBA program assistant at the
Graduate School of Management, University of California at
Irvine, agrees, noting that the pressure on schools to
clearly delineate their strengths has grown with the
popularity of various published rankings. “You have to

41
clarify what makes you distinctive. The question is, ‘Do
we know what our core value is that we can promote to
students?’” (Wuorio, 2001)
Just because a school specializes in a particular
field or curriculum doesn’t mean that it can’t benefit from
published rankings. The rankings in the Wall Street
Journal, for example, identify the top three programs in a
number of specialty areas, and a number of lesser-known
schools have been able to make a name for themselves by
appearing in these specialty rankings. Babson College, for
example, is ranked by the Wall Street Journal as the second
best business school in the field of entrepreneurship,
Thunderbird is ranked number one in international business,
Purdue University is ranked number three in operations
management, and the University of Texas is ranked number
three in accounting. None of those four schools, on the
other hand, were even included on the Wall Street Journal’s
overall listing of top MBA programs, so it was only their
specialization that enabled them to capture attention from
the publication.
Smaller publications have begun creating even more
specialized MBA rankings. Computerworld put out its fifth
ranking of “techno MBA programs” in October 2001. (Wuorio,
2001) The rankings sought to determine which schools are
putting out the best technology leaders. (Wuorio, 2001)
In 1997, Working Woman ranked the most female friendly MBA
programs. The report considered factors such as the
school’s percentage of students and faculty that were
women, the diversity of views in its curriculum, and the
opportunities for female students and alumnae to
network.(Wuorio, 2001) Other publications that ranked

42
specialized MBA programs include Success Magazine (ranking
entrepreneurial schools) and Hispanic Business (ranking the
top ten schools for Hispanics). (Wuorio, 2001)
2. Partnership
Another approach to differentiate programs is to form
partnerships with proven business organizations and infuse
their methodologies into the program curriculum. Columbia,
which ranks No. 10, offers a new MBA called the Program for
Social Intelligence. This program combines aspects of the
proven management philosophies of such corporate giants as
General Electric and Goldman Sachs, including brainstorming
exercises and marketing plan simulations, and forms the
program around them. (Lavelle & Lehman, 2006) Another
avenue of specialization is offering an MBA with an
international focus. More than 400 international business
programs are currently available in the U.S., up from less
than 200 a decade ago. (AACSB, 2002)
3. Regional Focus and Flexibility
Not all schools have the means to completely revamp
their curriculum. Instead, some instead simply shift the
target customer of their programs.
Typically, small schools have had success attracting
local students who do not want to travel too far from home.
They offer convenience to working professionals who live
nearby. To students who simply appreciate the advantages
of a safe, comfortable environment where they can get close
attention, small schools offer the solution. (Shinn, 2004a)
This trend towards regional focus has led the Wall Street
Journal to include a ranking of the top 50 regional MBA
programs in addition to its rankings of national and
international programs.

43
By being sensitive to students’ rigorous and demanding
work and family schedules, schools can reach a certain
student population that needs creative program alternatives
in terms of scheduling and content.(Bisoux, 2006) Some
schools are shortening their programs to attract students
who have neither the freedom nor the ability to devote 24
months to earning an MBA degree. This trend is catching
on. In 2003, 37 percent of member programs took 21 to 22
months to complete; in 2005, that number dropped to 27
percent. Programs that take 17-18 months to complete,
however, increased to 17 percent of members in 2005, up
from 15 percent in 2003.(Bisoux, 2006) With intense
competition for students and MBA providers desperately
trying to maintain market share, on the other hand, there
is a danger of designing programs that fall short of what
an MBA program should be. MBA providers must therefore be
careful about the degree to which they specialize or
customize their MBA programs.
F. ANALYSIS
For better or worse, it is evident that competition
for rankings currently drives the MBA industry.
Universities expend vast resources in the pursuit of being
highly ranked or even ranked at all. Rankings drive how
students, faculty, and employers perceive the MBA program.
In turn, how students, faculty, and employers perceive the
MBA program drives rankings. However, rankings do not
necessarily equate to the value of the education.
Just because one person went to the Harvard Business
School and another went to a small, non-ranked school
doesn’t mean the education was less valuable. In fact,
rankings may reveal very little about the actual quality of

44
the education. All rankings reveal is what the average GPA
and GMAT score is for its students, how many applicants the
program turned away, average salary upon graduation for its
graduates, how much research is published by the faculty,
etc. Nowhere in the rankings is there a category for
“quality of the education.” The reason, many argue, is
that an MBA has similar “real” intellectual value no matter
where it comes from. MBA programs differ, without
question. But in the end, many observers suggest that an
MBA is an MBA.
Unfortunately for the students who attend a non-ranked
school, there is a strong perception that a difference in
the quality of the education exists. It is this perception
that drives schools to compete as hard as they do for
rankings in effort to establish themselves as “value
leaders.”
The Top 20 schools in any published ranking generally
stay the Top 20, although the order may shift slightly from
year-to-year. It is primarily the legacy of these schools
that keeps them at the top. In recognition of this
relative permanency in the rankings, some publications have
even been accused of changing the weighting of their
criteria slightly each year simply to create small changes
in the rankings that could help sell more magazines.
The static and impenetrable nature of business school
rankings therefore leaves little room for newcomers or
small schools to make a big splash. Non-ranked programs
thus do all kinds of things to set themselves apart from
the rest of the pack, especially small programs that do not
have access to the vast resources that the larger schools

45
have. The reason is because, ultimately, whether they are
ranked or not, they have to get students in the chairs.
As mentioned above, a few tactics exist to do this.
Some have begun to revamp their curriculum, trying to offer
more of what students want. Some have reduced “education”
in favor of “training” to offer more of what employers
want. This is because MBA programs are torn between
meeting the desires of the students that want to gain
knowledge that will help them throughout their management
career and the employers that want MBA graduates to hit the
ground running with basic applied business skills
appropriate for an early-career position.
Other schools have decided to specialize in a
particular profession, creating a niche market inside the
broader MBA market. As mentioned, Thunderbird is ranked
first among MBA programs offering MBAs in international
business and Babson College is ranked second in the field
of entrepreneurship. Other schools specialize in medical
MBAs or IT MBAs. Still others have decided to seek a
regional strategy to create a brand. They seek to be the
university for the local students that do not want to
travel too far from home or are working professionals that
have to work the MBA around their careers. Whatever the
case, since breaking into the Top 20 (or even the top 50,
in most cases) is virtually impossible, these programs have
sought other avenues to set themselves apart.
The other aspect of the MBA industry that stands out
is the fact that it is an expensive business. The rising
salaries of professors and the rising costs of research are
key contributors to the increasing costs. Tuition alone
will not cover the costs of running an MBA program. The

46
primary source of funding is donations and endowments from
alumni. The schools that are the most successful are those
that have been around a while and have long lines of alumni
that are willing and able to give back to their alma
maters. Even then, the big schools still utilize executive
education, consulting services, and research projects to
provide additional revenue. New programs or small ones do
not have the lineages that may allow them to supplement
their revenues in these ways and thus, consequently, they
are even more at a disadvantage. These new and small MBA
program also pursue additional avenues of funding but also
must compete with other small schools for government
funding that is diminishing year by year. Raising
necessary funds is a problem that all MBA programs must
deal with, and it will continue to compound.
To be a player in the MBA industry, a MBA program
needs access to adequate revenue sources. Without it, it
will be difficult to put together a program that carries
any credibility. The next step is to earn accreditation.
After that, it is necessary to decide if the program will
compete for rankings in the overall MBA industry or if the
program will seek out a niche strategy through
specialization or a regional focus. Once that decision is
made, it is simply a matter of hiring faculty and getting
students to apply and come to the program. A program must
maintain a long-term mindset. Being competitive in the MBA
industry is not a sprint; it is a marathon. A program
cannot be Harvard or Dartmouth in a year. It is about
paying dues and making a name for the program with quality
education and research.

47
IV. BUYERS
Depending on your perspective, the buyers of graduate
management education are either the students, employers, or
both. No matter the classification of these two different
stakeholder groups, however, an effective industry analysis
requires understanding the incentives and leverage of both
groups.
A. STUDENTS
Students at MBA programs have waited an average of 62
months — or a little more than 5 years — between completing
their undergraduate (first university) degree and enrolling
in a graduate business program. Most MBA students did not
even consider an MBA degree until about 3 years had passed
since their undergraduate degree. (MBA.com, 2005b) Then,
it typically takes about one and a half years before
they’ll actually apply to a graduate program after first
considering graduate education. People applying to full-
time 2-year MBA programs submitted an average of 3.2
applications.(MBA.com, 2005b) After applications are
submitted, about a month passes on average before an
attempt to score highly on the Graduate Management
Admission Test (GMAT) is made. Finally, six months after
the GMAT is completed, a student typically enrolls in one
of the graduate business programs that have accepted
him/her.(MBA.com, 2005b)
1. GMAT
Before a student’s first tuition payment is due,
he/she must decide which program is right for them. This
is important because simply applying to a program can cost
between $100 and $200 per application. A Graduate

48
Management Admission Test (GMAT) can cost upwards of $200.
(Tyson, Spring 03) Costs are more than monetary. Students
preparing for the GMAT spend an average of 97 hours
preparing for the test. (MBA.com, 2005b)
According to a 2005 survey of 155 two-year business
schools, the median average GMAT score among the schools
was 592 (out of 800), with the 75th percentile being 640,
and the bottom 25th percentile being 526.(AACSB, 2006b)
Figure 9 shows how GMAT scores have changed over the last
fifty-three years.
Figure 9. GMAT Data, Then vs. Now
Category 1954 2002
GMAT volume at year-end 2,553 249,632
Number of U.S Programs requiring the GMAT
9 851
Price U.S. $10
U.S. $225
GMAT mean score 500 528
The GMAT examination is a standardized test designed
to measure basic verbal, mathematical, and analytical
writing skills that have been developed over a long period
of time through education and work. (139, p 1) GMAT scores
consistently outperform undergraduate GPA or any other
quantitative measure as a predictor of academic success in
MBA programs. (GMAC, 2006c) The best predictor of academic
success, however, is achieved when GMAT factors are
combined with undergraduate GPA. (GMAC, 2006c) The data
show that the GMAT exam has exceptionally high “predictive

49
validity” for most MBA programs. When one considers the
range of variables that can have an effect on a student’s
First Year Average, such as motivation, job considerations,
family considerations, course preferences, professor
preferences, teaching quality, and grading quality, the
predictive validity of these core admission data is quite
impressive.
2. Admissions
In 2001, the majority (three-fourths) of MBA students
had at least three years of pre-MBA work experience,
(Edgington & Olkin, 2002) and experience continues to
become an important aspect of admission criteria. (Conley,
2002) Many schools will take a chance on someone with
minimal work experience, but schools also recognize that
prior experience is associated with the ability to get a
job after graduation, which is a big factor in determining
rankings.(Conley, 2002) Regardless, the trend seems to be
a drive toward recruiting younger and younger applicants.
The intent is to pick up the stellar students before they
get locked into a career from which they cannot take 2
years off when they become 27 or 28. (Mast, 2002)
Overall, MBA admissions is considered an art. “It
would be nice if admissions were a science,” says Linda
Meehan, once an assistant dean and executive director of
admissions and financial aid at Columbia Business School.
“It would be nice to be able to rely on the GMAT score and
not look at anything else. That would be easy, but it
wouldn’t give us what we are looking for, because what we
are looking for is not measured in numbers only.” (Fisher,
2002) While most schools look beyond GMAT scores, they also
recognize the importance of the GMAT in assessing academic

50
aptitude and the ability to handle a tough
curriculum.(Mast, 2002) When you combine GMAT scores with
GPA, course work, letters of recommendation, interviews,
and essays, you can glean a pretty precise image of a
student’s abilities.(Tyson, 2002) Whatever the combination
a school uses to determine admissions, the fact of the
matter is that it is “an inherently and necessarily
subjective process” that requires choosing between
individuals who are equally qualified.(Tyson, 2002)
According to Jett Pihakis, once the director of
domestic admissions for the Haas School of Business at the
University of California, Berkeley, “It would be nice if
there were one ideal applicant, however we’d have a class
more homogenous than heterogeneous — and that is not what
we want.” (Mast, 2002)
Despite the stated desire for a heterogeneous student
mix, most business schools do look for common traits,
including academic prowess, initiative, leadership
potential, ability to work in teams, and top-notch
communication skills.(Mast, 2002) A former director of
MBA admissions and financial aid at the Wharton School of
Business was quoted as saying, “I don’t want a class full
of investment bankers or consultants. I also want
nontraditional students: people who have worked in
government or the nonprofit world. The mix is what makes
for an incredible learning environment.” (Mast, 2002)
There are many reasons students choose to pursue an
MBA, which is why self-assessment is so important. A
prospective student needs to investigate the program and
find the one that best fits their distinct personal
attributes. (Mast, 2002)

51
When individuals who were not enrolled in an MBA
program but who had attended an MBA forum a year earlier
were asked why they weren’t currently attending an MBA
program, the number one reason given was that the MBA
program of their choice rejected them. The distant runner-
up was that they were not satisfied with their GMAT.
(Edgington & Olkin, 2002) Nonetheless, the process of self-
selection, or deciding to pursue an MBA and which programs
to apply to, is probably a stronger determinant of the type
of students that end up at a particular school than is the
school’s selection process. (Edgington & Olkin, 2002)
3. Program Selection Criteria
After deciding to pursue an MBA and taking the GMAT,
students must narrow the choices of programs to which they
will apply. Students are also becoming more and more brand
conscious, but they aren’t convinced simply by reputation
that a school is high quality.
The following characteristics were listed as those
that ranked highly when choosing the right program:
• Prestige and global recognition;
• Career options the school affords;
• Quality and reputation of the faculty;
• Rankings in publications; and
• Reputation of alumni. (Olkin, 2004)
See Figure 10 for a full ranking of criteria that
students felt were important when choosing an MBA program.
The quality of the school’s curriculum, satisfaction
with an increase in long-term potential through the
development of skills and abilities, and the quality of the
faculty provide the greatest explanatory power in

52
understanding how a student rates the overall value of the
MBA degree.(GMAC, 2006b) To understand student satisfaction
with the increase in long-term potential through the
development of skills and abilities, one study conducted a
survey and formed a regression analysis to determine which
skills and abilities affect their satisfaction in relation
to the others.(GMAC, 2006b) Improvements in the ability
to think strategically are most likely to affect a
student’s satisfaction with long-term potential. (GMAC,
2006b)
Another survey asked prospective students to rank
categories of key aspects in their school selection
process. Figure 11 demonstrates the results of this
survey.
Finally, for categories ranked one, two, or three in
the previous survey, respondents received a question asking
them to rate the importance of detailed criteria within the
category. (Schoenfeld & Bruce, 2005) Figure 12
demonstrates the results of this survey. Quality of the
faculty emerges as the most important criterion used by
perspective students in selecting a graduate business
school, followed by the local respect and reputation of the
school, and the program types offered.(Schoenfeld & Bruce,
2005) Another study showed that one of the most powerful
drivers of satisfaction with the school is the presence of
a close-knit community. This aspect was important to all
respondents, regardless of whether they were enrolled in a
full-time, part-time, or executive MBA program. (GMAC,
2006b)

53
Figure 10. School Selection Criteria
School Selection Criteria
Percent Criteria (n = 5,253)
Quality/reputation of the school 75% Quality/reputation of the faculty 66% Prestige or global recognition of the school 64% It is an accreditation program 62% The school's reputation in placing graduates in jobs 60% Career options available to graduates 58% Financial cost of school 56% Availability of scholarships, grants or other financial aid 55% Published rankings of its graduate management program 52% Improved chances for an international career 51% School offers the specific curriculum I wanted 49% The students and faculty have diverse backgrounds and experience 49% School offers a practice-oriented education 44% Cost of living is affordable 43% Reputation of alumni 43% The school is close to employment opportunities 38% Convenient class schedules 37% The school is close to home or work 29% The school provides the opportunity to learn/improve a foreign language 26% There are people like me at this college or university 25% The school is in an exciting city 23% My employer will pay for my education at this school 18% Personal experience as an undergraduate 18% Other 4% Responses may add to more than 100% due to multiple selections.
Source: Global MBA Graduate Survey, 2006.

54
Figure 11. Importance of School Selection Criteria Program Type Total
Full-Time Part-Time Executive
Mean Rank Mean Rank Mean Rank Mean Rank It was an accredited program 4.1 1 4.3 1 4.4 1 4.2 1 Quality/reputation of the faculty 4.0 4 3.9 5 4.1 3 4.0 2 Prestige or global recognition of the college or university
4.0 3 3.8 6 4.0 6 4.0 3
Location of the college or university
3.8 8 4.3 2 4.1 4 3.9 4
Career options available to graduates
4.0 2 3.5 9 3.3 11 3.9 5
Published rankings of its graduate management program
3.8 5 3.6 8 3.6 9 3.8 6
School offered the specific curriculum I wanted
3.8 7 3.7 7 3.9 7 3.8 7
Local respect 3.6 10 4.0 4 4.0 5 3.7 8 The school’s reputation in placing graduates
3.8 6 3.2 12 3.0 13 3.6 9
The students and faculty had diverse backgrounds and experience
3.6 9 3.2 11 3.6 8 3.5 10
Source: School Brand Images and Brand Choices in MBA Programs
Figure 12. Top Ten Standardized Ratings of Specific Criteria within Key Aspects
Specific Criterion Rank Standardized Score
Quality of the faculty 1 4.24 Local respect/reputation 2 4.12 Program type offered 3 4.01 Rigor of academic program 4 3.97 Quality of current students 5 3.89 Published ranking of its graduate management program
6 3.87
Successful alumni 7 3.86 Job placement reputation of the school 8 3.78 Program completion time 9 3.75 Selectivity of admissions 10 3.67 *The highest ranked category for each respondent is given a score of 3, the next highest is given a score of 2, and the third highest is given a score of 1. Each specific piece of information is recorded where 6 equals extremely important and 0 equals not at all important. Next, a computed score is derived by multiplying the rank with the component scores for each respondent. Each of the computed scores is the weighted by the overall percentage of respondents similarly ranking the overall categories. Finally, the arithmetic mean is calculated fore each component.
Source: School Brand Images and Brand Choices in MBA Programs
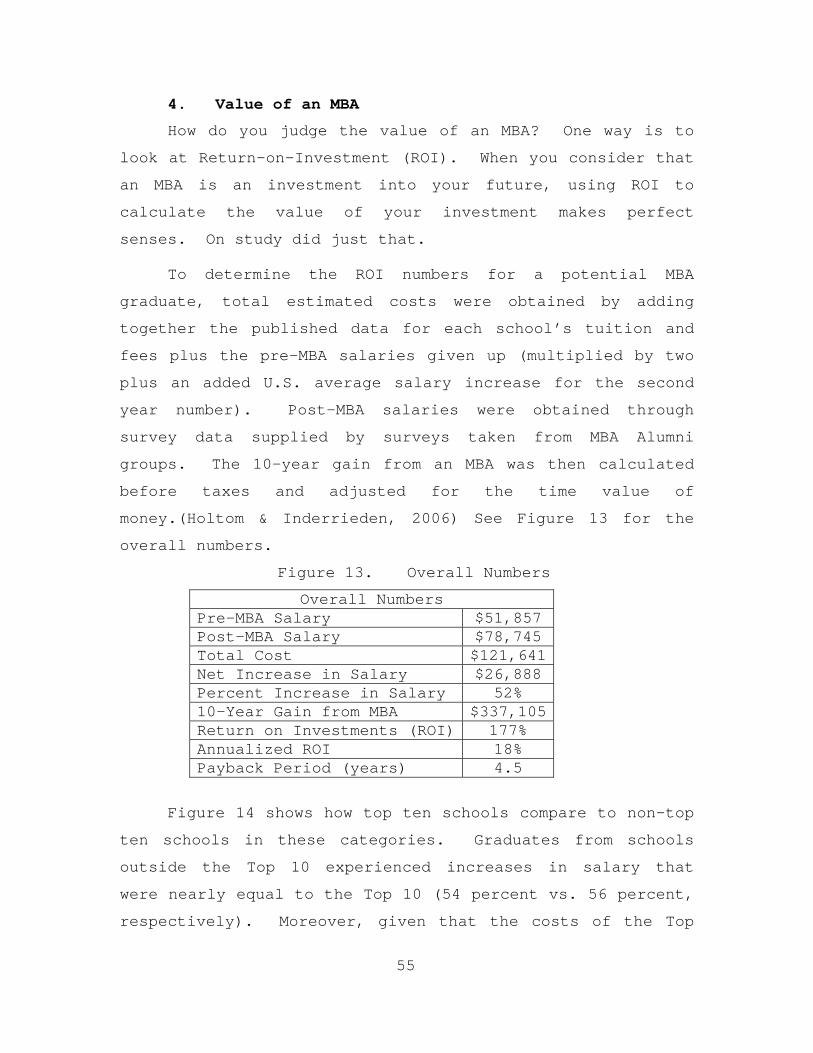
55
4. Value of an MBA
How do you judge the value of an MBA? One way is to
look at Return-on-Investment (ROI). When you consider that
an MBA is an investment into your future, using ROI to
calculate the value of your investment makes perfect
senses. On study did just that.
To determine the ROI numbers for a potential MBA
graduate, total estimated costs were obtained by adding
together the published data for each school’s tuition and
fees plus the pre-MBA salaries given up (multiplied by two
plus an added U.S. average salary increase for the second
year number). Post-MBA salaries were obtained through
survey data supplied by surveys taken from MBA Alumni
groups. The 10-year gain from an MBA was then calculated
before taxes and adjusted for the time value of
money.(Holtom & Inderrieden, 2006) See Figure 13 for the
overall numbers.
Figure 13. Overall Numbers
Overall Numbers Pre-MBA Salary $51,857 Post-MBA Salary $78,745 Total Cost $121,641Net Increase in Salary $26,888 Percent Increase in Salary 52% 10-Year Gain from MBA $337,105Return on Investments (ROI) 177% Annualized ROI 18% Payback Period (years) 4.5
Figure 14 shows how top ten schools compare to non-top
ten schools in these categories. Graduates from schools
outside the Top 10 experienced increases in salary that
were nearly equal to the Top 10 (54 percent vs. 56 percent,
respectively). Moreover, given that the costs of the Top

56
10 programs were higher (both in tuition and opportunity
cost of foregone salary), the ROI was lower and the payback
period for graduates of the Top 10 programs was longer by
15 months on average.
Figure 14. Impact of Top 10 Ranking
Variable Top 10 Not Top 10 Pre-MBA Salary $61,935 $51,619 Post-MBA Salary $96,420 $79,703 Total Cost $198,321 $123,712 Net Increase in Salary $34,485 $28,084 Percent Increase in Salary 56% 54% 10-Year Gain from MBA $432,348 $352,103 Return on Investments (ROI) 118% 185% Annualized ROI 12% 18% Payback Period (years) 5.8 4.4
For specific schools, the payback period can be as
long as 14 years.(Holtom & Inderrieden, 2006; Holtom &
Inderrieden, 2006) To provide a broader comparison, the
study also examined the outcomes achieved by graduates from
the Top 50 schools vs. those outside the Top 50. Figure 15
provides the results of this comparison.
Figure 15. Impact of Top 50 Ranking
Variable Top 50 Not Top 50 Pre-MBA Salary $53,019 $50,680 Post-MBA Salary $83,736 $73,448 Total Cost $141,717 $95,777 Net Increase in Salary $30,718 $22,768 Percent Increase in Salary 58% 45% 10-Year Gain from MBA $385,116 $285,452 Return on Investments (ROI) 172% 198% Annualized ROI 17% 20% Payback Period (years) 4.6 4.2

57
Oddly enough, the ROI is higher and the payback period
is shorter for graduates of programs outside the Top 50.
These results indicate that students at lower tier MBA
programs actually enjoy a higher return on their investment
than students at higher tier schools. Note, however, that
it is important to consider selection effects when
interpreting these results: the students at lower tier
schools differ from students at higher schools, most
importantly in terms of their foregone pre-MBA salary.
Therefore the results of this analysis can not be
interpreted to suggest that a lower tier school is a better
investment for all students.
A different study estimated the total ROI as of 2006
that had been achieved by the MBA classes of 2000 to 2005.
The mean percentage of investment that MBA graduates had
recouped was 45%, 54%, 60%, 67%, 71%, and 77%, from 2000 to
2005 respectively.(GMAC, 2006c) Another survey asked
graduates if pursuing an MBA degree was the right decision,
most respondents said they definitely made the correct
decision. (GMAC, 2006c)
According to the Council of Graduate Schools, the
number of master’s degrees granted in the U.S. has
increased 61 percent since 1984. Business degrees are
second only to education as far as master’s degrees being
awarded and are quickly on the rise. The number of MBAs
given in 2000 was 46 percent greater than that number given
in 1990. (Fisher, 2002)
Because demand for the MBA degree is driven by many
factors including the real as well as perceived value, we
end this section by examining graduates’ perceptions of the
value of the degree. Specifically, they were asked: When

58
you compare the total monetary cost of your MBA program to
the career opportunities you have received as a result of
obtaining your degree, how would you rate the overall value
of your MBA degree? The results are presented in Figure
16.
Figure 16. Value of the MBA Program
Variable Mean Full-Time 2.10 Part-Time 2.57
Program
Executive 2.55 Top 10 1.63 Not Top 10 2.18 Top 50 2.08
Ranking
Not Top 50 2.28 Legend: When you compare the total monetary cost of your MBA program to the career opportunities you have received as a result of obtaining your degree, how would you rate the overall value of your MBA degree? a. Outstanding 1 d. Fair 4 b. Excellent 2 e. Poor 5 c. Good 3
Source: Examining the Value Added by Graduate Management Education, 2006
Graduates of full-time programs were the most upbeat,
followed by executive MBAs and part-timers. It is also
interesting to note that, despite the earlier analysis
indicating that students at lower tier MBA program enjoy a
higher return on their investment, graduates from top 10
schools rated the overall value of their MBA degree
significantly higher than did graduates from schools
outside the top 10.(Holtom & Inderrieden, 2006)
Finally, to help us understand what it is about the
MBA that generates such high satisfaction among graduates,
Figure 17 shows graduate ratings of satisfaction with
specific aspects of the MBA degree.

59
Figure 17. Satisfaction with Aspects of the MBA Degree
Aspect Satisfaction Rating
Job Security 2.64 Increase in work environment flexibility 2.04 Preparation to get a good job in the business world
2.00
Opportunity to network and to form relationships with long-term value
1.96
An increase in earning power 1.90 Opportunity for quicker advancement 1.86 Development of your management knowledge/technical skills
1.74
Credentials you desired 1.74 An increase in your career options 1.70 Opportunity to improve yourself personally
1.59
Legend: Extremely Satisfied = 1; Very Satisfied = 2; Somewhat Satisfied = 3; Not Very Satisfied = 4; Not at all Satisfied = 5
Source: Examining the Value Added by Graduate Management Education, 2006
5. Salaries
Another common way to look at the value of an MBA is
too look at the salary received following the attainment of
the degree. Corporate recruiters surveyed by GMAC from
2002-2006 were asked to estimate the starting annual salary
for their new professional hires from MBA schools relative
to other graduate programs. On average, starting annual
salaries for MBA graduates was $11,000 more than other
graduates. (Murray, 2006) On the other hand, another study
demonstrated that employees who have been in the workforce
longer earn significantly more per year than those who
recently graduated with an MBA.
According to one study the mean 2006 annual salary for
MBAs who had graduated in years 2000 to 2005, was $107,694,
$101,319, $90,263, $87,874, $82,578, and $82,466
respectively. (GMAC, 2006b) This shows that the longer an

60
MBA is in the work force, the higher their salary is. In
five years, an MBA can expect an increase of approximately
130 percent in salary. The same trend can be seen in the
average total compensation package. The mean total
compensation package in 2006 for MBA graduates who had
graduated in the years 2000 to 2005 was $157,821, $134,759,
$113,347, $113,208, $109,161, and $104,888, respectively.
(GMAC, 2006c)
The economic benefit enjoyed by a graduate business
degree recipient was $659,726 as compared to that of the
average graduate degree recipient with a value of $254,085.
(Committee on Issues in Management Education, 2005)
Benefits of an MBA include: higher starting salary, greater
compensation growth, more stable long-term employment, and
a higher likelihood of participating in the workforce. In
2001, the lifetime earning power of the “average” MBA was
about $550,000 greater than the average college graduate.
From 1992-2002, in the U.S., the average compensation for
each MBA grew from $56,000 after completing their degrees
to $387,600 (including bonuses and other compensation)
after ten years. This is compared to the $43,000 average
salary for those with a non-management college degree.
(Committee on Issues in Management Education, 2005)
Figure 18 shows a graph of average annual base salary
among MBA graduates who have received or accepted an offer
of employment, while Figure 19 presents a comparison of
starting annual salaries for MBA and non-MBA graduates from
2002-2006.

61
Figure 18. Average Base Salary among MBA Grads who Received/Accepted Offer of Employment
Average Annual Base Salary
$85,442
$77,535$79,545
$78,608
$88,626
$92,360
$70,000
$75,000
$80,000
$85,000
$90,000
$95,000
2001 2002 2003 2004 2005 2006
Year
Avera
ge A
nn
ual
Sala
ry
MBA.com Registrants Survey Comprehensive Data Report, 2005
Figure 19. Estimated Starting Salary for New Hires
Year-to-Year Comparison
U.S. Dollars (Mean)
New Hire 2002 2003 2004 2005 2006
From MBA Program $72,021 $73,859 $77,066 $78,040 $80,809 From other graduate program $52,322 $56,518 $62,371 $60,865 $65,780 From undergraduate program $41,381 $42,936 $45,029 $45,652 $46,436
Source: MBA Alumni Perspectives Survey, April 2006
The total additional compensation package for new MBA
hires has an additional value of $18,928. (GMAC, 2006a)
Students who responded to yet another survey reported
that they made, on average, an annual salary of $61,302
before entering the MBA program. They expect to earn an

62
average annual salary of $86,350 upon graduation. This
represents a 41 percent increase.(GMAC, 2006b) Also asked
was if the graduating students were receiving a signing
bonus. Almost half (47%) expect to receive some form of
signing bonus of somewhere around $15,457. Figure 20 shows
salary and bonus statistics for MBA graduates with various
levels of work experience prior to entering the MBA
program. (GMAC, 2006b)
Figure 20. Salaries and Bonuses for Respondents who Accepted a Job Offer, by Work Experience
Annual Base Salary and Signing Bonus
Less than 3 years
3 years, but less than 6
years
6 or more years
Annual base salary earned before starting MBA
$40,349 $51,718 $75,529
Annual base salary expected in first job after graduation
$68,399 $81,710 $100,887
Pre- and post-MBA difference ($)
$28,050 $29,992 $25,358
Pre- and post-MBA difference (%)
70% 58% 34%
Percentage expect to receive signing bonus
44% 55% 43%
Amount of signing bonus*
$10,736 $16,256 $17,521
*p<.05; Items in bold in the contingency table significantly affect the overall X2 statistic. Source: Global MBA Graduate Survey, 2006
Another consideration for MBA students is how to pay
for the education. Figure 21 shows just how prospective
students plan on funding their MBA. The results reveal

63
that the majority of students plan on getting loans to
cover the costs of graduate education.(MBA.com, 2005a)
Figure 21. Method of Financing Graduate Management Education
Method of Financing Graduate Management Education (Average Percent of Education Financed by Each Student)
Enrolled/ Admitted
Financial Source n = 1,188
Loans 27% Employer reimbursement/sponsorships* 17% Grants, fellowships, scholarships* 15% Personal Earnings* 13% Support from parents* 13% Personal Savings 11% Spouse's (partner's) earnings 2% Other 2%
Total 100% *p < 0.05; Items in bold represent significant differences based on Bonferroni comparison in an ANOVA.
Source: Global MBA Graduate Survey, 2006
When asked whether or not earning the MBA degree was
worth the price and if they would do it all over again,
knowing what they know now, a remarkable 72 percent said
“definitely yes.” The rest of those survey results can be
seen in Figure 22. (MBA.com, 2005a)
Figure 22. Right Decision to Pursue the MBA Degree
Knowing what you know now, would you still have pursued an MBA Degree?
Full-Time (n = 2,828)
Definitely yes 72% Probably yes 22% Probably no 4% Definitely no 1% Total 100% Source: MBA.com Registrants Survey, 2005

64
Figure 23 shows the results of a survey of 3,415
individuals considering an MBA concerning their motivation
for choosing to pursue management education. The number
one motivator was the hope that the MBA would provide an
opportunity for more challenging/interesting work in the
future.
Figure 23. Motivation to Pursue a Graduate Management Education
Motivation to Pursue a Graduate Management Education (Percent Very True to Me)
Among Those Applying/Plan
to Apply My Reason for pursuing graduate management education is
because it will…
(n = 3,415)
Provide me an opportunity for more challenging/interesting work in the future* 67% give me a sense of personal satisfaction and achievement* 61% be a part of my planned career development* 59% improve my long term income and financial stability* 57% allow me to remain marketable (competitive)* 57% allow me to obtain the professional credentials I need for advancement* 56% provide me the right connections to get a good job in the future* 46% help me develop the skills necessary to do my job* 46% allow me to transition from my current career path to a new one* 41% help me to develop the confidence I need to succeed* 40% help me achieve my goal of starting my own business* 34% allow me to change occupational area* 31% help me get the respect I deserve at work* 26% *p < 0.05; Items in bold significantly affect the overall X2 statistics of the contingency table. Source: Global MBA Graduate Survey, 2006
Figure 24 shows the results of a survey of the same
3,415 potential MBA students asking about their
reservations, if any, about pursuing an MBA degree. The
number one concern was related to affordability.

65
Figure 24. Reservations about Pursuing Graduate Management Education
Reservations about Pursuing a Graduate Management Education (Percent Very True to Me)
Among Those Applying/Plan
to Apply Reservations (n = 3,415)
The interviews I may have to have may be a barrier for me 4% The essays I have to write bay be a barrier for me 5% The recommendations I need to get may be a barrier for me* 5% My scores on admission tests may be a barrier for me* 12% My employment history may be a barrier for me 6% My undergraduate academic record may be a barrier for me* 9% It is too intimidating 3% It may require me to delay accepting attractive job opportunities 6% I may not receive the same benefits others will 5% It may require me to take on large financial debts* 29% The economy/job prospects are too uncertain 5% It may require more money that I have available* 33% It would severely limit the time I have for people who are important to me* 8% It may require me to postpone marriage, having a child, or other personal plans 10% The demands of graduate business school on my time/energy may be too great 8% *p<0.05; Items in bold significantly affect the overall X2 statistics of the contingency table. Source: Global MBA Graduate Survey, 2006
In another survey, respondents were asked to rate the
overall value of their MBA degree by comparing the total
cost of the degree to the career opportunities received
because of the degree. Sixty-three percent of the
graduates stated that the value of their MBA degree was
outstanding or excellent relative to cost. (MBA.com, 2005a)
Their responses can be seen in Figure 25. (MBA.com,
2005a)

66
Figure 25. Overall Value of the MBA Degree
Response 2005 Percentage (n = 2,828)
2006 Percentage (n = 6,139)
Outstanding 24% 22% Excellent 34% 41% Good 27% 29% Fair 10% 7% Poor 5% 1% Total 100% 100% Source: MBA.com Registrants Survey, 2005
The same survey also asked students to rate the
various aspects of their degree that they felt added the
most value. The top three aspects that received a rating of
outstanding or excellent were faculty (68%), fellow
students (64%), and the curriculum (57%). (Global MBA
graduate survey2006)
When asked to describe the school’s culture, most
students used the following attributes to do so:
collaborative; heterogeneous student body; active learning;
academic curriculum; personal; small class sizes; teaching-
oriented; team emphasis; egalitarian; emphasizes critical
discussion; casual; and close-knit community. (MBA.com,
2005a)
Figure 26 shows how students rated their satisfaction
of their MBA for each of several different benefits.
Graduating students were also asked to rate their level of
improvement for various skills and abilities. (MBA.com,
2005a) See Figure 27 for results.

67
Figure 26. Satisfaction with the MBA Degree (n = 6,139)
My MBA degree has given me…
Extremely Satisfied
Very Satisfied
Somewhat Satisfied
Not Very Satisfied
Not at all Sati-sfied Total
A sense of personal satisfaction 50% 37% 10% 2% 1% 100% Credentials I need to increase career options 38% 46% 14% 2% 0% 100% An opportunity for more challenging/interesting work in the future
38% 45% 15% 2% 1% 100%
An increase in long-term potential through the development of skills/ abilities
37% 48% 13% 2% 1% 100%
The ability to remain marketable (competitive) 37% 47% 13% 2% 0% 100% Advancement potential 36% 47% 15% 2% 0% 100% The potential for long term income and financial stability
33% 45% 19% 3% 0% 100%
Confidence I need to succeed 32% 45% 19% 3% 1% 100% Respect and recognition 27% 46% 23% 3% 1% 100% The ability to change occupational area 27% 41% 26% 5% 1% 100% The ability to switch industries 25% 37% 29% 7% 2% 100% The ability to expand by international employment opportunities
21% 32% 34% 11% 3% 100%
The right connections to get a good job in the future
21% 31% 32% 13% 4% 100%
Source: Global MBA Graduate Survey, 2006
Graduating students were also asked to indicate the
organizational level in which they previously worked and
what level they plan on entering upon degree completion.
Figure 28 shows the results. (MBA.com, 2005a)
Graduating MBA students were moreover asked about
their years of work experience prior to beginning their MBA
degree. About two-fifths had worked 6 years or more, 37
percent worked between 3 and 6 years, 16 percent worked
less than 3 years, and only 6 percent entered the full-time
MBA program without any job experience. (MBA.com, 2005a)

68
Figure 27. Level of Improvement in Skills and Abilities (n = 6,139)
Skill/Ability A Great Deal
A Good Amount Some A Little
None at All
N/A—Already Profic-ient Total
Ability to think strategically 42% 41% 11% 3% 1% 1% 100%Ability to think globally 33% 39% 18% 6% 2% 2% 100%Ability to integrate information from a wife variety of sources
29% 45% 17% 4% 1% 3% 100%
Ability to think analytically 29% 43% 16% 4% 1% 6% 100%Leadership Skills 29% 41% 20% 6% 2% 3% 100%Ability to adapt/change to new situations 27% 44% 18% 55 2% 4% 100%Oral Communication skills 27% 40% 20% 6% 2% 5% 100%Ability to make decisions with imperfect information
26% 46% 20% 5% 1% 2% 100%
Creative problem-solving skills 24% 44% 20% 6% 2% 3% 100%Quantitative Skills 24% 40% 22% 6% 2% 5% 100%Cultural sensitivity and awareness 24% 34% 23% 9% 4% 7% 100%Interpersonal Skills 23% 40% 22% 7% 2% 6% 100%Project management/ implementation skills 22% 39% 25% 8% 3% 4% 100%Skills in corporate ethical conduct 21% 37% 24% 10% 4% 5% 100%Initiative/risk-taking ability 20% 43% 24% 7% 3% 3% 100%Written communication skills 19% 37% 24% 9% 3% 9% 100%Recruiting, managing, maintaining staff 16% 33% 30% 13% 6% 2% 100%Technology skills for your specialty 15% 28% 28% 13% 8% 8% 100%
Source: Global MBA Graduate Survey, 2006
Figure 28. Job Level
Job Level Pre-MBA Post-MBA Entry Level 24% 9% Mid-Level 56% 49% Senior Level 13% 28% Executive Level 4% 9% Business Owner/self-employed 3% 5% Other 1% 1% Total 100% 100%
Source: MBA.com Registrants Survey, 2005

69
Sometimes getting an MBA can serve as a catalyst to
starting a new career or switching career fields. Figure
29 presents a classification of recent MBA graduates as
either “career enhancers” or “career switchers” based on
their responses to a survey regarding motivations.
(MBA.com, 2005a)
Figure 29. Career Switching vs. Career Enhancement
Response (n = 4,757)Career enhancers 51% Career switchers 49% Total 100%
Source: MBA.com Registrants Survey, 2005
Figure 30 shows what job functions recent graduates
plan to assume upon completing their degree.(MBA.com,
2005a)
Figure 30. Job Functions
Function (n = 5,377) Finance/accounting 35% Marketing/sales 20% Consulting 16% General management 12% Operations/logistics 8% Information technology/MIS 6% Human Resources 3% Total 100%
Source: MBA.com Registrants Survey, 2005
According to the Global MBA Survey of the classes of
2000 and 2001, finance and marketing were the most popular
concentration areas. Strategy was tied with general
management for third place.(Edgington & Olkin, 2002)
Figure 31 shows the results of the survey.

70
Figure 31. Industry Group Pursued for Employment
Industry Group Pre-MBA (n =
5,775)
Post-MBA (n = 5,121)
% Point Difference
*
% Change
Finance/Accounting
18.7% 25.5% 6.8% 36.5%
Products & Services
21.3% 22.5% 1.2% 5.4%
Consulting 14.5% 17.9% 3.3% 23.0% High Technology 17.5% 11.2% -6.3% -
36.1% Healthcare/ Pharmaceuticals
5.7% 4.5% -1.2% -20.7%
Manufacturing 7.2% 7.6% .3% 4.7% Nonprofit/ Government
8.8% 4.5% -4.3% -48.6%
Energy/Utility 2.9% 3.0% .2% 6.6% Other 3.4% 3.3% -0.1% -2.6% Total 100% 100% -- -- *The percentage point and percent change may differ slightly from those calculable with the pre- and post-MBA percentages displayed because of rounding.
Source: Global MBA Graduate Survey, 2006
According to another survey, MBA graduates indicated
that they work an average of fifty-one hours per
week.(MBA.com, 2005a)
B. EMPLOYERS
Employers can choose to sponsor (through tuition
assistance) an employee’s further education or they can
simply recruit MBA graduates as new hires. Either way, an
MBA has to be important to corporations for students to
spend the time, money and effort necessary to attain an
MBA. Corporations essentially make the market for MBAs.
As the corporate world demands more MBAs, they become more
valuable. As demand decreases, so does their value.

71
The employer’s incentive for hiring MBAs is that they
hope the MBAs will add value to their company. Added value
comes from not only the skill set provided by an MBA grad
but the intangible skills, such as fresh perspective and
critical thinking skills.
1. Who Hires MBAs?
Among the top 30 schools, MBA graduates in 2006
received on average slightly more than two offers apiece
from potential employers, up 20% over the previous year.
In May of 2002, half of the nation’s MBA grads were still
looking for work. In May of 2006, only 14% were. (Lavelle
& Lehman, 2006)
From a survey of nearly 150 schools in 2006, Figure 32
depicts the average number of job offers received among MBA
graduates who had received at least one job offer. (GMAC,
2006b)
Figure 32. Number of Job Offers
Accepted Offer
Received Offers, Not Yet Accepted
Response (n = 1,490) (n = 522) One job offer 41% 33% Two job offers 26% 34% Three job offers 19% 20% Four or more job offers 15% 13% Total 100% 100% Items in bold in the contingency table significantly affect the overall X2 statistic
Source: Global MBA Graduate Survey, 2006
The traditional MBA employers have been firms in
financial services, management consulting and consumer
goods. They remain the biggest employers of MBAs to this
date. The trend in recent years, however, has been for
smaller firms in a variety of different industries,
72
including high-tech start-ups and nonprofits, to hire them,
and for graduates to start their own businesses. Government
employers have joined the fray, too, often preferring MBAs
to those with master's degrees in fields such as public
administration, public health and international relations.
The mix of employers varies from year to year, depending
largely upon the health of their own industries.(Montauk,
2002) Employers are growing more diverse. According to
Alysa Polkes, director of the Anderson School of Business’s
(UCLA) MBA Career Management Center, some promising
industries that are up-and-coming for MBAs “include
defense, government positions, and mid-cap firms that make
durable goods.” (Conley, 2002)
It is important to note that discussions of the
employers of MBAs generally focus only on a graduate’s
first employer or those recruiters who are interested in
hiring “freshly minted” MBAs. Almost no mention is
generally made of the value of an MBA to employers 10 to 20
years down the road, when a graduate uses the MBA as a top-
level manager. These future mid-career and late-career
employers are also important stakeholders for business
schools and are, in effect, consumers of graduate
management education or buyers of MBA graduates. These two
different stakeholder groups, initial vs. future employers,
however, clearly have different incentives. Initial
employers seek value in the short term while future
employers (and consequently MBA students themselves) expect
MBA programs to provide education that is valuable over the
long-term. Business schools consequently must make trade
offs between the interests of these two groups and
delicately balance training vs. education.

73
2. Why Do Employers Hire MBAs?
In the broadest sense, the MBA degree represents a way
of thinking, not just a set of financial skills and
business knowledge. When asked why Williams-Sonoma hires
MBAs, HR manager Leslie Zurburg says, “We are looking for
the 50,000 ft view – the strategic thinker who takes an
analytical approach. Operations managers who have risen
through the company’s ranks are experts at getting things
done, Zurburg says. But MBAs from the outside can bring a
fresh prospective. Critical thinking is not a course, per
se. But this ability is woven into the MBA curriculum,
which relies heavily on the case-study approach.
John Pantano, cofounder of Radianse, a startup that
develops indoor global positioning products, hires MBAs
because they have “professional training in problem
solving. They know how to frame problems, ask questions
and collect data.”
In a 2006 survey conduct by the Graduate Management
Admissions Council (GMAC), MBA recruiters were asked to
indicate the skills and abilities they find attractive in
MBA graduates. Figure 33 provides the results of this
survey. The responses indicated that ability to think
analytically and strategically are valued most by potential
employers of MBAs. Those skills coming in close behind
include quantitative skills, leadership skills, oral
communication skills, creative problem-solving skills, the
ability to integrate information, and project
management/implementation skills. (GMAC, 2006b)

74
Figure 33. Corporate Recruiters Survey 2006
Source: Corporate Recruiters Survey, 2006
3. From Which Schools Do Employers Hires MBAs?
When 940 recruiters were asked how they viewed the
reputation of a school in a Corporate Recruiter Survey in
2002-03, seventy-five percent of the respondents listed
experiential factors (i.e., the success of alumni they’ve
previously hired and their own experiences dealing with the
university). Over 50 percent listed the quality of the
curriculum, and thirty-three percent listed the quality of
the faculty. (Olkin, 2004)
Skills/Abilities Recruiters Find Attractive in MBA Graduates
Skills/Abilities n = 1,173
Ability to think analytically 78%
Ability to think strategically 71%
Quantitative skills 58%
Leadership skills 56%
Oral communication skills 53%
Creative problem-solving skills 52%
Ability to integrate information 51%
Project management/implementation skills 51%
Interpersonal skills 48%
Written communication skills 48%
Ability to adapt/change to new Situations 45%
Work ethic 38%
Ability to make decisions with imperfect information 35%
Initiative/risk-taking ability 33%
Technological skills 28%
People management skills 27%
Cultural sensitivity and awareness 22%
Skills in corporate ethical conduct 20%
Other 3%
None of the above 3% Responses may add to more than 100% due to multiple selections

75
Karen Keasler, manager of IBM’s Marketing Leadership
Development Program indicates that she uses Business Week
and U.S. News and World Report rankings as kind of a filter
to help decide where her recruiting efforts and resources
can be best focused. “I’ll generally cut it off at the top
30 schools from those lists,” she says. “That doesn’t mean
I wouldn’t consider a great candidate from a school that
wasn’t on those lists, but I have to spend my recruitment
dollars carefully.” (Wuorio, 2001)
“Getting an MBA is a big accomplishment.” says
Michelle Rapp, associate director of graduate student
career services at Boston based Suffolk University. “But
once you have it, you still have to compete for jobs. MBA
students say, ‘I want to interview at [a top ten consulting
firm],’and I tell them, ‘That company recruits only from
top 10 schools.’ You have to be realistic.”
Top schools are brand names, agrees another recruiter.
When you are competing against a brand name, “the burden of
proof is on you,” he says, even though core MBA courses
remain remarkably similar across different institutions.
Degree creep (meaning more and more people are getting
MBA’s to stay competitive) has devalued the degree. “The
quality of the MBA program has become
determinative.”(Montauk, 2002)
Nonetheless, businesses are sending recruiters to more
schools in search of MBAs from a broader range of outlets.
Figure 34 shows that in a 2005 survey, 37 percent of the
recruiters surveyed visited 7 or more schools to recruit
MBAs. The data shows that the average number of schools
that recruiters visit is 8.

76
Figure 34. Number of Schools Which Company Visits to Recruit MBAs (GMAC, 2006a)
Actual 2005 Number of Schools
(n = 816)
None 17%
3 or less 23%
4, but less than 7 23%
7 or more 37%
Total 100%
Mean 8
Source: Corporate Recruiters Survey, 2006
4. Why Do Some Employers Sponsor MBA Education?
In one study of 2,570 employees, 55 percent indicated
that their company provided education support and even
reimbursement for career development.(GMAC, 2006c) In
fact, about one in ten (11%) of new MBA graduates state
they are postponing their job search to fulfill contractual
obligations with their current employer.(GMAC, 2006b)
Figure 35 demonstrates that the preference for
corporations when reimbursing for or sponsoring MBA degrees
is for part-time MBA programs. While many employers are
willing to pay for graduate degrees for their employees,
they frequently require some form of payback to the
company.

77
Figure 35. Corporate Reimbursement and Sponsorship Programs Among Firms That Hire MBAs (GMAC, 2006a)
Statistic Full-Time
MBA Part-Time
MBA Executive
MBA Percentage sponsored/reimbursed 59% 66% 62%
Average Cost per employee per year $27,750 $21,327 $27,098
Source: Corporate Recruiters Survey, 2006
So what motivates employers to pay for graduate
management education? “Research shows that companies that
invest in education for their employees have a much higher
retention rate than companies that don’t,” notes Mark
Allen, director of executive education at the Graziadio
School of Business and Management at Pepperdine University.
“It’s almost counter intuitive. People who don’t invest in
education say, ‘What if I pay to educate employees and they
leave?’ I answer, ‘You’re asking the wrong question. What
if you don’t educate them, and they stay?’” (Shinn, 2004b)
Even if an employer doesn’t directly fund an
employee’s MBA education, the organization will often seek
to re-hire its former employees after completion of the
degree. Figure 36 shows that 26% of MBA graduates received
job offers from a current or previous employer.
Figure 36. Sources of Job Offers
Source (n = 2,001)An on-campus recruiter 48% An organization where you had an internship or work project
43%
An organization contacted in an off-campus job search
34%
Current or previous employing organization 26% An alumnus from your school 11% Other 7% Source: Corporate Recruiters Survey, 2006

78
C. ANALYSIS
1. Students
What is the true value of an MBA? The true value lies
in the eye of the beholder. In the MBA industry, the
beholders are the buyers who are the students and the
employers who will hire the students.
With respect to the power of student as buyers, both
the MBA programs and the students posses some leverage.
While the students decide where to apply, the MBA programs
ultimately can deny a student acceptance. However, the MBA
programs have to attract students. The MBA is a product
that people can live without. It is almost a luxury item.
Only those willing and able to afford and complete the MBA
program can purchase this item. So, even though the MBA
programs can deny access to students they do not feel are
worthy to participate in their programs, if students do not
apply, they sell no product. It is for this reason that
students and MBA programs share leverage. The MBA programs
need the students as much as the students need the MBA
programs.
That being said, there is obviously significant demand
for the MBA degree from students. The reason they demand
the degree is because they believe that it will enable them
to receive greater opportunities in their career, receive a
higher salary, or launch them into a new career. With the
plethora of MBA programs to choose from, how do they
decide? In many cases, students choose the highest ranked
program to which they are accepted, although this may not
always be the best financial decision.

79
Students choose the highest ranked schools because, in
their mind, the top-ranked schools give them the highest
potential to fulfill their purposes for pursing the MBA in
the first place. However, choosing to get a full-time MBA
from the top-ranked schools does not necessarily offer the
best ROI.
Given that a student has to give up a current salary
and job position to pursue a full-time MBA in hopes of a
future increase in salary, the opportunity costs during the
“mean time” are usually high. In fact, after looking at
the data provided in the chapter, a conclusion could be
drawn that pursing an MBA degree at all is not worth what
you have to give up.
Luckily, for those who cannot afford to quit their job
for two years or who cannot afford to pay for the full-
time, two-year MBA program, there are alternatives that can
limit the opportunity costs incurred while still offering
an MBA. However, evidence shows that students choosing the
part-time degree or executive degree are not as satisfied
with their degrees as those who incurred the costs to earn
the two-year, full-time degree. Also, those who choose to
pursue part-time or distance learning degree miss out on
the important classroom environment and/or on-campus
networking that the resident degree provides.
From a purely financial value perspective, it is not
clear that students benefit most from choosing a top-ranked
school or even pursuing an MBA degree at all. Surveys
suggest, however, that the MBA conveys significant
intangible non-financial value. In particular, students
perceive a greater value in a degree earned from a top-
ranked school than they do from a lower- or non-ranked

80
school. This perception fuels the competition for rankings
that was mentioned in the previous chapter.
2. Employers
Employer preferences have a significant affect on
market for MBAs. The employer’s demand for MBAs dictates
the job availability and salary range. Historical evidence
suggests that the demand for MBAs is cyclical. In cycles
of high demand salaries for MBAs are proportionally higher.
The inverse is true in cycles of low demand. Regardless
of the point in the cycle, employers are always seeking the
best value to raise their company’s performance by
enhancing employees’ abilities.
Best value is defined as the greatest benefit relative
to cost. What employers define as “benefit,” however, can
range from training which allows employees to perform
routine tasks more efficiently to higher-level education
which emphasizes critical thinking and complex problem
solving skills.
The lower end and least expensive end of the spectrum
is focused on training. Costs for providing training for
employees can be low and still provide positive return on
investment. Certifying employees in relevant disciplines
assures that the work force has the necessary tools to
realize efficiencies. Examples of this end would be Lean
Six Sigma Green Belt Training or Defense Acquisition
University Certifications.
There are options in the middle range of the spectrum
that can partially address both training and educational
requirements. Primarily this intermediate range focuses on
education and training delivery methods such as online

81
courses, seminars, corporate universities or enrolling
employees as part time students in non-resident MBA
programs.
The high end of the spectrum is the most expensive
option and focuses on education that will give employees
the critical thinking and problem solving skills needed to
take the company’s performance to a new level of
profitability. Employers who invest at this level make use
of recruiters to hire MBA graduates from top schools.
Employers are not short on options to find the best
value for their company’s requirements. Potential students
and current employees watch the hiring and advancement
trends of their industry. In other words, they take their
guidance from what employers are seeking. It is imperative
for business schools to understand the dynamics of
employer’s expectations and to position themselves where
their services are consistent with the needs of this
important customer. The customer in this case, however, is
not only the first organization to employ the MBA graduate,
but also every future employer who will expect the graduate
management education to bring value to its organization.

82
THIS PAGE INTENTIONALLY LEFT BLANK

83
V. FACULTY
A. CATEGORIES OF BUSINESS SCHOOL FACULTY
The most important suppliers to the graduate
management education industry are the business school
faculty who fill the teaching, research, and administrative
roles with any MBA program. To understand the incentives,
leverage, and importance of these key suppliers, one must
first understand the different categories of business
school faculty.
Generally speaking, faculty can be classified based on
the nature of their employment relationship with their
college or university. A typical faculty member’s
employment may be either full-time or part-time and, if
full-time, either tenure-track or non-tenure-track.
Finally, full-time tenure-track faculty member can be
either tenured or untenured. While faculty categories and
job titles can vary significantly across institutions,
Figure 37 provides a general picture of the breakdown of
faculty categories at a typical university.
Figure 37. Classification of Higher Education Faculty
All College & University Faculty
Full-Time Part-Time
Non-Tenure Track
Senior Lecturer
Lecturer
Tenure Track
Tenured
Untenured
Assistant Professor
Professor
Associate Professor
All College & University Faculty
Full-Time Part-Time
Non-Tenure Track
Senior Lecturer
Lecturer
Tenure Track
Tenured
Untenured
Assistant Professor
Professor
Associate Professor

84
Full-time tenure-track (FTTT) faculty members
typically follow the path of the “prototypical American
scholar” (Boyer 1990) or “complete scholar” (Rice 1996)
engaged in research, teaching and service. (Gappa et al.,
2007) As the name implies, tenure-track faculty positions
offer the potential for professional “tenure,” which
provides a guarantee of job security in that a tenured
faculty member is granted the contractual right not to be
fired without cause. A tenure-track faculty member has
generally earned a doctorate or other terminal degree in
his or her chosen field and usually carries the title of
professor, associate professor, or assistant professor.
Full-time non-tenure track (FTNTT) faculty, in
contrast, do not have the opportunity to receive
professional tenure and are generally employed under
contract-renewable appointments. Typical non-tenure track
faculty positions carry titles such as lecturer or
instructor and generally involve specialization, usually in
teaching but sometimes in research.(Gappa et al., 2007)
FTNTT faculty appointments represent a more flexible
alternative to tenured appointments and are useful in
hiring professionals with special expertise who would not
necessarily seek or be qualified for tenure-track
positions. Business schools, for example, hire senior
“professors of practice,” that is, people with extensive
practical experience in their professions to augment
tenure-track faculty in such curricular areas as
accounting, where knowledge of practice is critical. (Gappa
et al., 2007)
Part-time faculty (sometimes called “adjunct faculty”)
are hired temporarily to teach specific courses and are
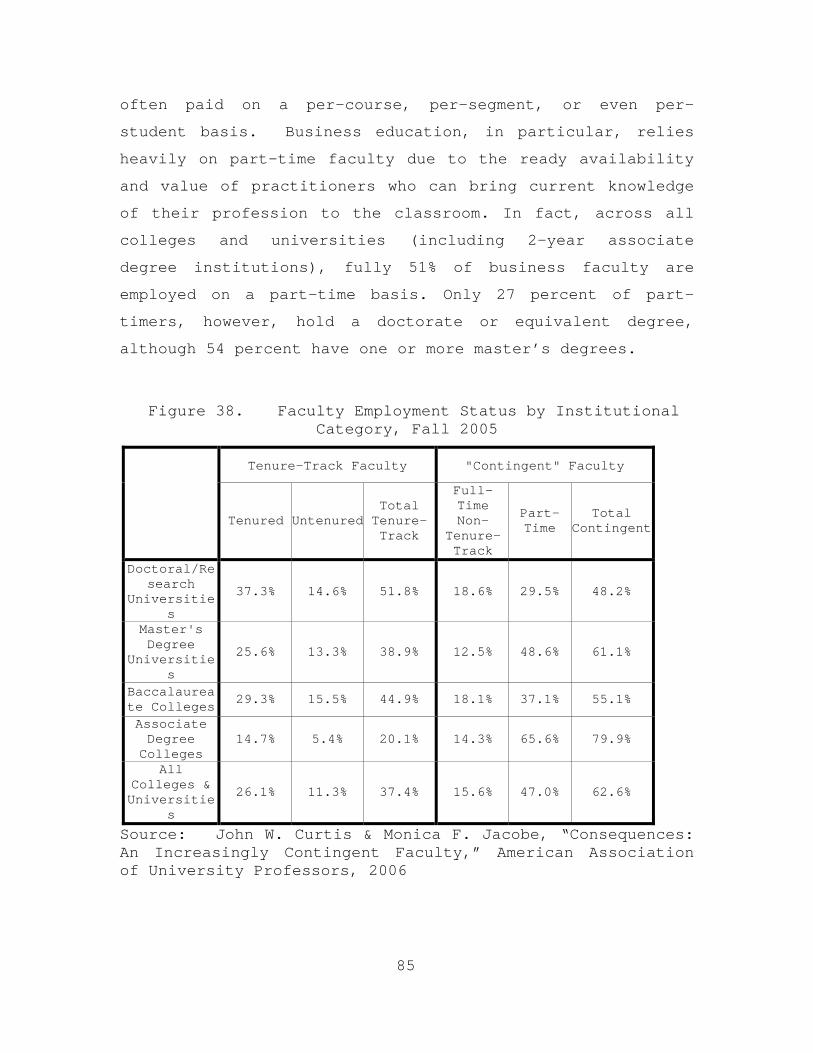
85
often paid on a per-course, per-segment, or even per-
student basis. Business education, in particular, relies
heavily on part-time faculty due to the ready availability
and value of practitioners who can bring current knowledge
of their profession to the classroom. In fact, across all
colleges and universities (including 2-year associate
degree institutions), fully 51% of business faculty are
employed on a part-time basis. Only 27 percent of part-
timers, however, hold a doctorate or equivalent degree,
although 54 percent have one or more master’s degrees.
Figure 38. Faculty Employment Status by Institutional Category, Fall 2005
Tenure-Track Faculty "Contingent" Faculty
Tenured UntenuredTotal Tenure-Track
Full-Time Non-
Tenure-Track
Part-Time
Total Contingent
Doctoral/Research
Universities
37.3% 14.6% 51.8% 18.6% 29.5% 48.2%
Master's Degree
Universities
25.6% 13.3% 38.9% 12.5% 48.6% 61.1%
Baccalaureate Colleges 29.3% 15.5% 44.9% 18.1% 37.1% 55.1%
Associate Degree Colleges
14.7% 5.4% 20.1% 14.3% 65.6% 79.9%
All Colleges & Universitie
s 26.1% 11.3% 37.4% 15.6% 47.0% 62.6%
Source: John W. Curtis & Monica F. Jacobe, “Consequences: An Increasingly Contingent Faculty,” American Association of University Professors, 2006

86
Taken together, part-time and non-tenure track faculty
are identified as “contingent faculty” by the American
Association of University Professors (AAUP). With this
classification in mind, Figure 38 provides a breakdown of
higher education faculty in the United States by employment
status and institutional category.
B. BALANCING TENURE-TRACK VS. “CONTINGENT” FACULTY
During the last three decades, there has been a
significant growth in the share of faculty members in
American colleges and universities that are employed in
part-time or full-time non tenure-track positions. This
trend away from tenure-track appointments in favor of more
contingent appointments is illustrated in Figure 39.
Figure 39. Trends in Faculty Employment Status, All Colleges & Universities, 1975-2005
Tenure-Track Faculty "Contingent" Faculty
Tenured Untenured Total Tenure-Track
Full-Time Non- Tenure-Track Part-Time Total
Contingent
1975 36.5% 20.3% 56.8% 13.0% 30.2% 43.2%
1989 33.1% 13.7% 46.8% 16.9% 36.4% 53.3%
1995 30.6% 11.8% 42.4% 16.7% 40.9% 57.6%
2005 26.1% 11.3% 37.4% 15.6% 47.0% 62.6%
Source: John W. Curtis & Monica F. Jacobe, “Consequences: An Increasingly Contingent Faculty,” American Association of University Professors, 2006
While the data used in Figure 39 includes all
educational fields, the increasing use of contingent

87
faculty is also clearly evident in the field of business
and management. The AACSB reports that the number of
faculty in non-tenure-track positions at business schools
has risen slowly but steadily in recent years, further
noting that, “It seems clear that more schools are using
adjunct or visiting professors to fill in open teaching
slots, or they might be hiring faculty on a more temporary
basis while they consider how to restructure staffs to
create long-term solutions.” (LeClair, 2004)
In fact, nearly one-quarter of all new hires at
business schools in 2005 were in the instructor or lecturer
rank. (AACSB, 2006a)
This widespread substitution of contingent faculty for
tenure-track faculty is at least partially due to the
growing financial pressures faced by higher education
institutions, coupled with the lower cost and greater
flexibility associated with contingent employment.
(Ehrenberg & Zhang Liang, 2004) This trend has potential
negative consequences, however, in terms of both teaching
and research.
With respect to teaching, Ehrenberg and Liang (2004)
found that increases in the percentage of either part-time
faculty or non-tenure track faculty were each associated
with a reduction in graduation rates. (Ehrenberg & Zhang
Liang, 2004) In particular, they found that, other factors
held constant, a 10 percentage point increase in the
percentage of part-time faculty at a public academic
institution was associated with a 2.65 percentage point
reduction in the institution’s graduation rate. Similarly,
a 10-percentage point increase in the percentage of full-
time non-tenure-track faculty at a public college or

88
university was associated with a 2.32 percentage point
reduction in the institution’s graduation rate.
Particularly relevant for graduate management education,
the magnitude of both of these effects was found to be
greatest at a master’s level institutions. (Ehrenberg &
Zhang Liang, 2004) The American Association of University
Professors has similarly warned about the negative impact
on educational quality that is inherent in the trend toward
greater reliance on contingent faculty.
The negative research implications of this trend, on
the other hand, are a consequence of the limited time
generally available to contingent faculty for conducting
research as well as the sometimes less significant
preparation for academic research relative to their tenure-
track colleagues. First of all, faculty in contingent
positions often carry heavy teaching loads with little time
for academic research.(Gappa et al., 2007) Secondly, the
percentage of faculty with doctorate degrees focused on
research is significantly lower among contingent faculty
than tenure-track-faculty. In addition, while AACSB
accreditation standards allow for the use of non-doctoral
“professionally qualified” faculty where suited to the
schools mission, the requirements nonetheless specify
ratios of doctorally qualified faculty relative to full
staff. (AACSB, 2003)
C. FACULTY CAREER PROGRESSION
The career “ladder” and progression processes vary
significantly between tenure-track and non-tenure-track
faculty positions. Whereas the tenure-track career path is
characterized by an “up or out” progression with the
potential reward of tenure, the non-tenure-track career

89
path is one in which promotion is not a requirement for
retention but even the most senior faculty members may lack
true job security.
First, consider Figure 40, which provides a
generalization of the typical tenure-track faculty career
path.
Figure 40. Generalization of the Tenure-Track Career Ladder
Doctoral Degree
Assistant Professor
Full Professor
Associate Professor
Academic Career
Non-Academic
Career
Awarded Tenure
DeniedTenure
Promoted
NotPromoted
Out
Out
Doctoral Degree
Assistant Professor
Full Professor
Associate Professor
Academic Career
Non-Academic
Career
Awarded Tenure
DeniedTenure
Promoted
NotPromoted
Out
Out
Virtually all tenure track appointments first require
completion of a doctorate degree (Gappa et al., 2007) ,
which generally involves achievement of four primary
milestones:
• approximately two years of coursework, which provides the foundation of research knowledge;
• a comprehensive exam or set of exams;
• an acceptable dissertation research proposal and consequent written dissertation; and

90
• a successful oral “defense” of the dissertation to the faculty of the degree-granting institution(Briley, 1997)
Combined, the entire process of earning a doctorate
degree in a business or management field requires an
average of 7.7 years of “registered time” after receiving
the baccalaureate degree, according to a 2004 Survey of
Earned Doctorates conducted by the National Opinion
Research Center. (AACSB, 2006b) The same survey concluded
that the average age at the time of achieving a doctorate
in business or management was 35.7 years old. (AACSB,
2006b)
Initial tenure-track appointments are generally at the
rank of assistant professor, a position which can be held
for only a limited amount of time before the faculty member
is considered for promotion to associate professor, a
promotion which usually (but not always) comes with the
granting of tenure. The limited number of years during
which a junior faculty member is allowed to “qualify”
himself or herself for promotion to a tenured position is
commonly referred to as the “tenure clock” and, while
highly variable across schools, is commonly around six
years in the business and management fields. The tenure-
track career path is considered an “up or out” system in
that, if denied tenure, a faculty member must subsequently
leave the school, although he or she is often granted a
one-year “grace period” in which to find another position.
Tenured associate professors subsequently face the
opportunity for promotion to “full” professor, although
this promotion is frequently not an “up or out” decision.

91
While the above description is an attempt to describe
the typical tenure-track career progression, it is
important to note that the standards, process, and
timelines vary significantly across schools and across
disciplines. For example, while both associate professor
and full professor are commonly tenured positions, a 2006
survey by the AAUP found that 6.1% of faculty with the
title of professor were, in fact, untenured (4.9% being
non-tenure-track positions) and 19.7% of faculty with title
of associate professor were untenured (8.1% being non-
tenure-track positions).(Thornton, 2006) At some business
schools, in fact, associate professor is an untenured
position and tenure is only granted at time of promotion to
full professor, making this second promotion hurdle an
additional “up or out” decision.
The non-tenure-track career ladder, on the other hand,
could perhaps be described as providing potentially greater
job security (relative to the tenure-track ladder) at the
junior levels but less job security at the senior levels. A
generalization of the non-tenure track career ladder is
provided in Figure 41.
While it is not uncommon for lecturers or instructors
to possess doctorate degrees, especially at higher-level
research universities, it is often not a requirement for
appointment to these non-tenure-track positions.
Frequently, candidates with a master’s degree combined with
significant practitioner experience are employed as
lecturers, especially in “professional” fields such as
business.
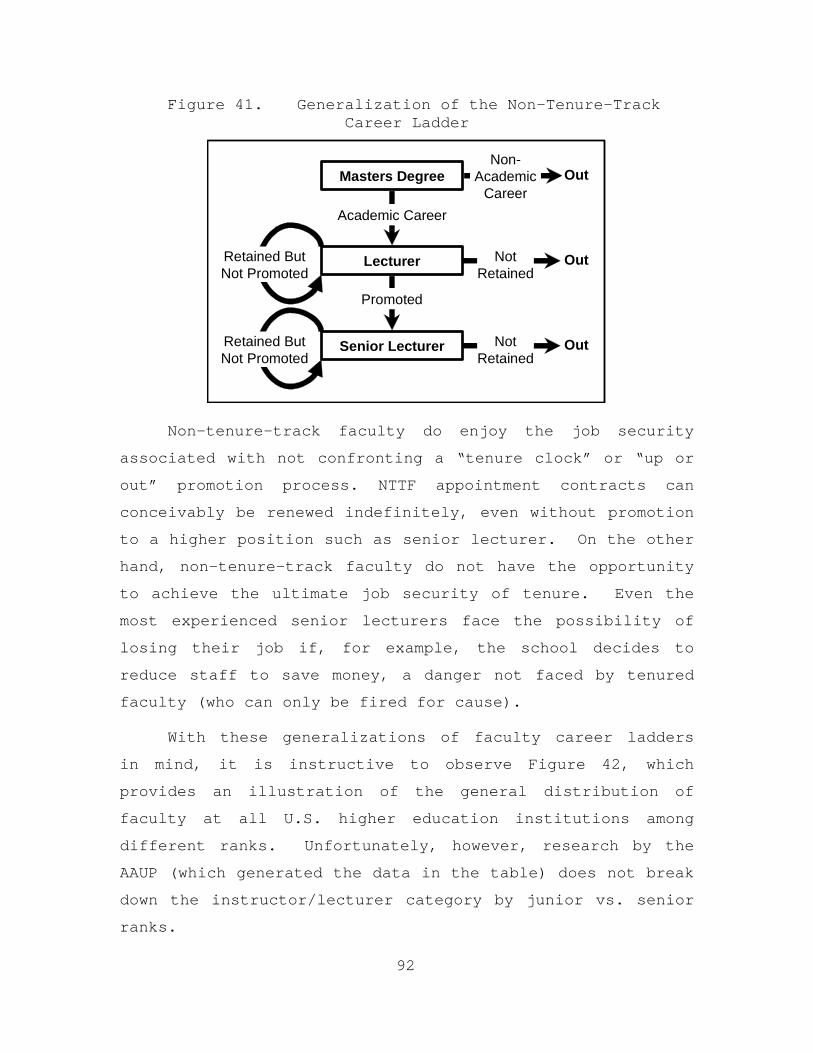
92
Figure 41. Generalization of the Non-Tenure-Track Career Ladder
NotRetained
Out
Masters Degree
Lecturer
Senior Lecturer
Academic Career
Non-Academic
Career
Promoted
NotRetained
Retained ButNot Promoted
Out
OutRetained ButNot Promoted
Non-tenure-track faculty do enjoy the job security
associated with not confronting a “tenure clock” or “up or
out” promotion process. NTTF appointment contracts can
conceivably be renewed indefinitely, even without promotion
to a higher position such as senior lecturer. On the other
hand, non-tenure-track faculty do not have the opportunity
to achieve the ultimate job security of tenure. Even the
most experienced senior lecturers face the possibility of
losing their job if, for example, the school decides to
reduce staff to save money, a danger not faced by tenured
faculty (who can only be fired for cause).
With these generalizations of faculty career ladders
in mind, it is instructive to observe Figure 42, which
provides an illustration of the general distribution of
faculty at all U.S. higher education institutions among
different ranks. Unfortunately, however, research by the
AAUP (which generated the data in the table) does not break
down the instructor/lecturer category by junior vs. senior
ranks.

93
Figure 42. Distribution of Faculty by Rank and Institutional Category, 2005-2006
Professor Associate Professor
Assistant Professor
Instructor / Lecturer
No Rank
Doctoral/Research Universities 37.4% 26.0% 24.3% 11.0% 1.2%
Master's Degree Universities 29.0% 27.0% 29.7% 12.9% 1.4%
Baccalaureate Colleges 29.5% 28.6% 32.3% 8.7% 0.9%
Associate Degree Colleges 27.3% 25.2% 27.7% 19.1% 0.7%
All Colleges & Universities 33.1% 26.6% 27.2% 11.8% 1.2%
Source: American Association of University Professors, “The Annual Report on the Economic Status of the Profession: 2005-06,” March-April 2006.
D. FACULTY ROLES: TEACHING VS. RESEARCH
While business school faculty members fill numerous
administrative and other roles, the primary
responsibilities of the professors and lecturers at any
institution generally reside in the two areas of teaching
and research. While contingent faculty are often given
incentives that require or encourage productivity in a
particular dimension (usually teaching but sometimes
research), tenure-track faculty are, at least on the face
of things, encouraged to devote their efforts to both
teaching and research.
Figure 43 illustrates where faculty members of all
categories and all disciplines place themselves in the
relative balance between teaching and research. It is of
interest to note from the table that the largest group of
faculty at both public and private universities was those
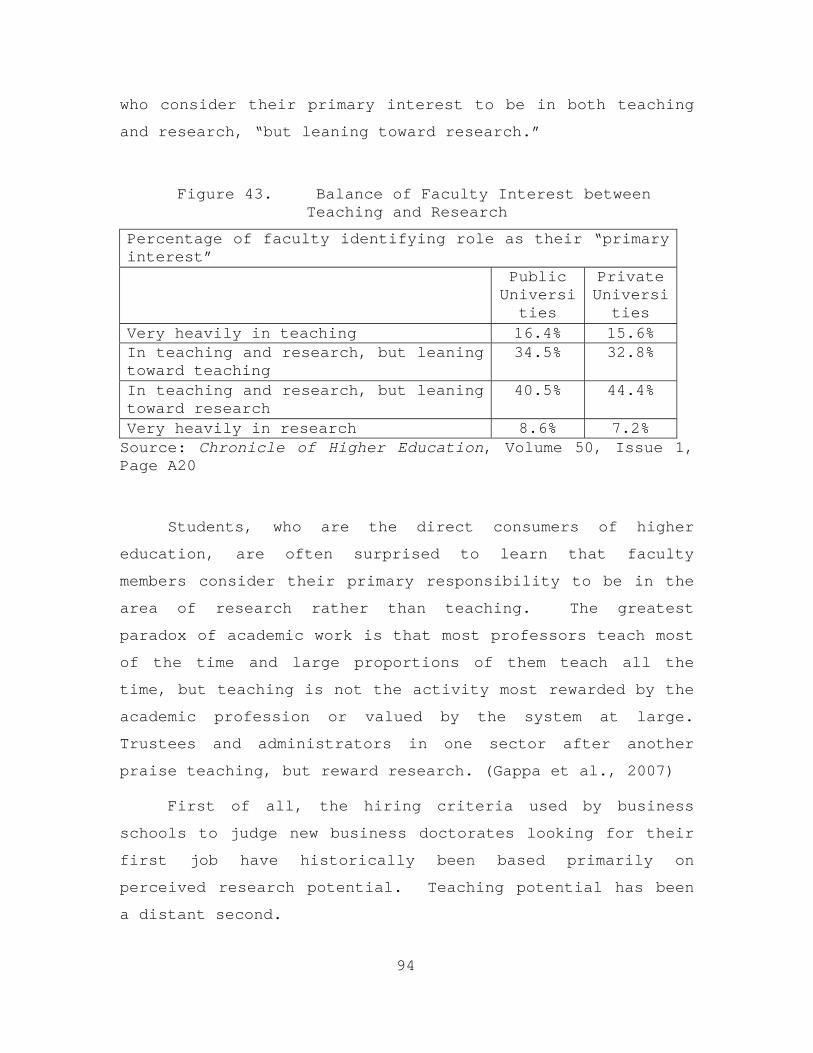
94
who consider their primary interest to be in both teaching
and research, “but leaning toward research.”
Figure 43. Balance of Faculty Interest between Teaching and Research
Percentage of faculty identifying role as their “primary interest” Public
Universities
Private Universities
Very heavily in teaching 16.4% 15.6% In teaching and research, but leaningtoward teaching
34.5% 32.8%
In teaching and research, but leaning toward research
40.5% 44.4%
Very heavily in research 8.6% 7.2% Source: Chronicle of Higher Education, Volume 50, Issue 1, Page A20
Students, who are the direct consumers of higher
education, are often surprised to learn that faculty
members consider their primary responsibility to be in the
area of research rather than teaching. The greatest
paradox of academic work is that most professors teach most
of the time and large proportions of them teach all the
time, but teaching is not the activity most rewarded by the
academic profession or valued by the system at large.
Trustees and administrators in one sector after another
praise teaching, but reward research. (Gappa et al., 2007)
First of all, the hiring criteria used by business
schools to judge new business doctorates looking for their
first job have historically been based primarily on
perceived research potential. Teaching potential has been
a distant second.

95
Second, the standards for promotion in general and
tenure in particular, which in large part determine faculty
activities, have traditionally defined faculty productivity
in terms of research and publication. Service and teaching
are risky priorities for faculty members seeking promotion
or tenure at many institutions. As one young faculty
member lamented, “As a new junior professor, I have come
into the profession with a strong interest in research but
an equally strong interest in serving students by helping
them learn both inside and outside of the classroom. The
attitude I’m receiving from all levels…. Is that research
is what counts. If the other areas of service and teaching
are lacking but research is strong, then promotions will
follow.”(Diamond & Bronwyn E. Adam, 1993)
Third, greater research productivity simply correlates
to higher faculty compensation. Evidence that research and
publication significantly affect a faculty members’
compensation level appears in a number of studies
(Fairweather 1993; Fairweather, 1995; Hunnicutt, Taylor,
and Keeffe, 1991; Kasten, 1984; Marchant and Newman, 1994,
Prewit, Phillips, and Yasin, 1991).(Sutton & Bergerson, )
Empirical studies of factors that affect individual faculty
compensation typically have found that the best predictor
of salary within an institution and within any rank are an
individual’s years of experience (Lewis, 1996). The number
of articles published, however, is the second best
predictor (Tuckman and Tuckman, 1976). Publication of
scholarly journal articles enables individual faculty
members to be promoted more rapidly and once the top rank
is reached, publication enables an individual’s
compensation to continue to rise. Book publication,

96
however, is not as rewarding as article publication.(Sutton
& Bergerson, ) Figure 44 shows the range of publications
for full-time faculty members between 2001-2002.
Figure 44. Research Publications of Full-Time Faculty Members, 2001-2002
Percentage of faculty with given number of professional writings published or accepted for publication in the last two years
Public Universities
Private Universities
None 19.6% 18.1% 1 to 2 26.5% 26.5% 3 to 4 27.3% 28.0% 5 to 10 20.6% 22.1% 11 to 20 4.7% 4.7% 21 to 50 1.1% 0.5%
More than 50 0.2% 0.1%
Source: Chronicle of Higher Education, Volume 50, Issue 1, Page A20
In addition, these empirical studies suggest that
faculty rewards for teaching are minimal at best. Kasten
(1984) reports that “Research on the relationship between
teaching and rewards has been inconclusive,” and cites
eleven studies since 1970 that reached different
conclusions about teaching and faculty rewards. (Sutton &
Bergerson, )
Finally, regardless of financial and career
incentives, it should come as no surprise that tenure-track
faculty members would be inclined towards research rather
than teaching, given the fact that the most significant
pre-requisite to becoming a tenure-track faculty member is
completion of an appropriate doctorate degree. Most
97
doctoral programs provide intensive preparation for high-
level research and very little preparation for classroom
teaching. This is especially true among the most highly
ranked programs. (Briley, 1997) Anyone who would choose to
spend 5 to 9 years of their life in a business doctoral
program must possess a strong affinity for research to
begin with and would moreover leave the program with skills
primarily suited for this particular task.
1. The Nature of Business School Research
If research is indeed so important to a tenure-track
faculty member’s career, it is important to inquire about
what actually qualifies as research. While the definition
of “academic research” varies significantly across
institutions and discipline, AACSB accreditation standards
provide some guidance as to the nature of research in the
field of business scholarship.
The final report of the AACSB Task Force on Faculty
Research defined research in the following way: “Research
must be written, be subject to scrutiny and criticism by
one’s peers and extend the boundaries of current
knowledge.” The report went on to note that written
material (such as some consulting reports) that is
proprietary would not meet the definition and thus would
not qualify as research. (Diamond & Bronwyn E. Adam, 1993)
The AACSB accreditation standard requiring
“intellectual contributions” requires business school
faculty members to “make intellectual contributions on a
continuing basis appropriate to the mission of the school.
The outputs of intellectual contributions should be
available for public scrutiny by academic peers or
practitioners.” The standard goes on to interpret the

98
components of such intellectual contributions to include
the creation of new knowledge (basic scholarship); the
application, transfer, and interpretation of knowledge to
improve management practice and teaching (applied
scholarship) and the enhancement of the educational value
of instructional efforts of the institution or discipline
(instructional developments). (Diamond & Bronwyn E. Adam,
1993)
While this AACSB standard asks faculty members to
conduct research that is “appropriate to the mission of the
school,” it is important to note that untenured faculty
members must be wary of conducting research that is too
closely tied to the interests of a particular school or
select set of schools. For example, while researching
“instructional developments” such as case studies is highly
valued at schools such as the Harvard Business School, the
University of Virginia (Darden School of Business), and
other select institutions which emphasize development of
such teaching materials, such research is often devalued at
most business schools which emphasize traditional journal
publications in their hiring and promotion criteria. For
this reason, junior faculty who have no guarantee of
continued employment must be concerned about research that
constitutes a “relationship-specific investment” in a
particular institution or set of institutions and,
consequently, untenured faculty must be more concerned
about conducting research that will make them marketable to
a broad set of potential employers.
E. BUSINESS FACULTY SHORTAGE: DEMAND EXCEEDS SUPPLY
While the number of master’s degrees in business and
management awarded in the U.S. has exploded in recent

99
decades, the number of doctoral degrees in business and
management has stagnated and even declined. The
consequences of these two trends is that there is an
increasing demand for qualified business faculty while at
the same time there is a stagnating or decreasing supply of
such faculty.
In 2002, the AACSB issued an ominous report,
“Management Education at Risk,” and in 2003, its Doctoral
Faculty Commission issued its findings in “Sustaining
Scholarship in Business Schools.” Both of these reports
issue warnings of the impending shortage of doctoral
business faculty.(Fields, 2006)
Whereas there are more Master’s Degrees granted each
year in business than in any field other than education,
the business and management field ranks only eighth in
terms of the number of doctoral degrees conferred each
year.(Chronicle, 2007) Figure 45 documents the number of
master’s degrees and doctoral degrees awarded in the U.S.,
as well as the ratio between the two numbers, from 1969 to
2004. Most troubling is the recent period from 1994-5 to
2001-2 when the number of doctoral degrees conferred
declined by 17% while the number of master’s degrees
increased by 28%. The ratio of master’s degrees to
doctoral degrees increases from 67.3 to 104.1 during this
period.

100
Figure 45. Degrees Conferred in Business and Management in the U.S. (1969-2004)
Year Master’s Degrees
Doctoral Degrees
Ratio
1969-70 21,561 620 34.8 1970-71 25,977 757 34.3 1971-72 30,028 859 35.0 1972-73 30,638 902 34.0 1973-74 32,172 919 35.0 1974-75 35,758 936 38.2 1975-76 42,054 900 46.7 1976-77 46,006 827 55.6 1977-78 47,837 823 58.1 1978-79 49,855 821 60.7 1979-80 54,484 753 72.4 1980-81 57,391 795 72.2 1981-82 60,763 815 74.6 1982-83 64,758 776 83.5 1983-84 66,150 929 71.2 1984-85 66,996 831 80.6 1985-86 66,689 934 71.4 1986-87 67,093 1,062 63.2 1987-88 69,230 1,063 65.1 1988-89 73,065 1,100 66.4 1989-90 76,676 1,093 70.2 1990-91 78,255 1,185 66.0 1991-92 84,642 1,242 68.1 1992-93 89,615 1,346 66.6 1993-94 93,437 1,364 68.5 1994-95 93,809 1,394 67.3 1995-96 93,982 1,368 68.7 1996-97 97,619 1,336 73.1 1997-98 102,171 1,290 79.2 1998-99 108,085 1,202 89.9 1999-00 112,258 1,196 93.9 2000-01 116,475 1,180 98.7 2001-02 120,277 1,155 104.1 2002-03 129,178 1,257 102.8 2003-04 139,344 1,481 94.1
Source: AACSB
The problem is not only that there are fewer business
doctorates overall (at least relative to master’s degrees),
but also that there a fewer business doctorates from the

101
top schools. For example, the percentage of doctorates
produced by the AACSB-accredited institutions decreased to
84% in 1999-2000 from 92% a decade earlier. (AACSB, 2003)
Moreover, most of the top-25 business Ph.D. producers have
shrunk their programs.(Zimmerman, 2001) “If you look at
the list AACSB puts out on the top 10 producers and take
out a couple of schools that don’t really provide people
for the academic market,” noted University of Florida
business dean, John Kraft, “you would see almost every
major school has probably substantially reduced their Ph.D.
program, and that’s not going to change.” (AACSB, 1998)
The driving forces behind this trend are budget
constraints and changing priorities. Business schools have
to find the resources to compete and the Ph.D. program is
the place to cut. There are fewer resources being put into
doctorate programs at the top schools primarily because of
the competition for rankings in Business Week, the Wall
Street Journal and so on. “Much more effort is delivered to
the MBAs and, of necessity, it has an effect on the
training of Ph.D. students,” noted Ross Watts, chair of the
Ph.D. program and professor of accounting and finance at
the University of Rochester. “The faculty is just not as
available as it used to be. They are putting a lot more
effort into their MBA teaching, which isn’t inappropriate,
but the Ph.D. program becomes the stepsister.” (AACSB,
1998)
Surveys by the AACSB on present and future faculty
demand clearly indicate that a shortage is present and
growing. In 2005, 400 schools surveyed (out of an estimated
1,500 U.S. schools offering business degrees) were
recruiting for nearly 1,150 new doctorates at a time when

102
only slightly more than 1,000 business doctorates are
produced each year. These same 400 schools expected more
than 3,100 new doctoral degree positions to open up in the
next five years due to retirements and additions to
existing staff.(Fairbank et al., 2005) The AACSB also
estimated that the supply of business Ph.D.s would trail
demand by 1,142 in 2007 and 2,419 in 2012. If more things
go right than wrong, the AACSB noted that the shortage
could be as few as 21 in 2007 and 334 in 2012. But, in a
worst-case scenario, the shortfall may reach as many as
3,043 in 2007 and as many as 5,689 in 2012.(Fields, 2006)
1. An Increasingly Foreign Candidate Pool
The stagnation or decline in the development of new
business doctorates is also accompanied by an increase in
the number of foreign doctorates from U.S. schools. To
make up for the shortage in the doctoral programs, many
U.S. business schools have turned to foreign applicants,
mainly from China and the former Soviet Union states.
(Zimmerman, 2001) A study by the AACSB revealed that only
52.9 percent of students enrolled in U.S. business doctoral
programs were U.S. citizens or had permanent Visas. The
rest were non-U.S. citizens without permanent visas.(AACSB,
2006b) Michigan’s Caul said that of 150 finance
applications he looked at this year, 60 percent were from
China alone. Duke’s program had 120 applications this year
and 156 were from foreign students, according to Jim
Bettman, director of the Ph.D. program. Two-thirds of
UCLA’s applicants in the past three years have been from
other countries.
So while business Ph.D. candidates from non-English
speaking foreign countries are clamoring for American

103
training in management, the concern is that these
applicants may lack the English language skills necessary
to walk into a classroom and immediately be an excellent
teacher.(AACSB, 1998) These applicants may want to teach in
American schools, but they are not easy to place on
faculties because they lack fluency in English and ease
with an MBA classroom style. (AACSB, 1998) Not
surprisingly, the percentage of foreign-born faculty at
U.S. business schools is increasing. Among the top 50
schools in the most recent Financial Times ranking, almost
31 percent of faculty, on average, were international. If
the top 50 schools were to be grouped into U.S. school and
non-U.S. schools, international faculty members would
represent, on average, 25 percent and 42 percent,
respectively, of the faculties. (AACSB, 2002)
2. Competing with the Private Sector
It is also important to note that the actual supply of
new faculty to graduate business education is significantly
lower than the production of business doctorates, as many
of these graduates choose careers outside of academia.
Figure 46 shows the different career choices for newly
minted business and management doctorates as of 2004.
(AACSB, 2006b)
“Increasingly, more and more new Ph.D. graduates are
going into the private sector,” noted David Kidwell, dean
at Minnesota's Carlson School of Business. “Those students
provide a high level of theoretical and quantitative
understanding of their disciplines and research, which is
increasingly valuable to high end consulting firms. It’s
not a huge trend, but it is one that is increasing.”
(AACSB, 1998)

104
Figure 46. Doctoral Career Choices of Business and Management Doctorates (2004)
Postdoctoral Plans Percent Postdoctoral Study 4.1 Employment After Doctorate 79.5 Educational Institution 63.4 Industry/Business 10.0 Government 2.4 Nonprofit 1.9 Other and unknown employment 1.7 Unknown Postdoctoral plans 16.4 Source: Survey of Earned Doctorates, 2004, National Opinion Research Center
The private sector, especially investment houses,
technology companies and accounting firms also are looking
for talent; and, they come armed with bigger budgets than
business schools.(AACSB, 1998) In fact, a Wall Street
company will readily pay two to four times as much as a b-
school when they want what the Ph.D. has to offer. (AACSB,
1998)
Schools trying to reverse this trend offer higher
starting salaries to new doctorates. So far, however, the
percentage of doctorates choosing other careers has not
declined, according to AACSB International. (Fields, 2006)
3. Confronting the Shortage
As one publication from the AACSB noted, “when it
comes to attracting academically qualified faculty, we are
deep in a seller’s market of pandemic proportions.”
(Pulley, 2006) “When you look at supply and demand for
business faculty,” notes Sara Freedman, dean of Mississippi
State University’s College of Business and Industry, “there
are not enough faculty coming through the traditional
doctoral programs to staff our programs. Yet, the ability

105
to recruit and retain faculty is central to strengthening
programs.” (Tyson, Spring 03)
Andrew Policano, business dean at the University of
Wiconsin-Madison, and other administrators believe they are
on the front edge of doctoral faculty crunch. Last year,
Wisconsin left six positions vacant out of a dozen it was
seeking to fill. “We have continuing vacancies from one
year to the next. We use visitors, people on sabbatical who
will be teaching half time, faculty who are taking a full
visit, or younger doctoral students who have just finished
dissertations and aren’t quite ready for permanent
positions.” Policano said.(AACSB, 1998)
Regardless of the actual number of Ph.D.s who may be
in the pool, b-schools that consider themselves to be in a
“top” echelon are not going to hire someone for their
faculty who does not meet their standards. Thus, educators
say, it is “stars,” young, middle-aged or older, who are
being avidly pursued and wooed, not only by the top five,
but by the top 10, 20, and 50. “Compared to five or six
years ago, more schools than just the top five now think
they are really good schools and they want to only go after
the best,” said Gautam Caul, associate dean and professor
of finance at the University of Michigan. “The fact that
there are vacancies left may not be so much an indication
of potential candidates having gone down, but quality
standards having gone up.”
Stephen Lippmann, at the UCLA Andersen School of
Business, has the same view. “We have openings and we would
like to hire in a couple of fields. It’s not that there
aren’t candidates to hire, it’s that meeting our
expectations is harder. Everybody wants to hire the same

106
small set.”(AACSB, 1998) Such intense competition for
candidates at the upper tier schools takes talent away from
the pool of candidates available to the second tier
schools, which then forces less-endowed schools to reach
down into the next tier, which reduces the pool the smaller
schools have to choose from. “You just keep putting
pressure further down in the pipeline,” Policano said.
(AACSB, 1998)
4. Turning to Non-Business and Contingent Faculty
In light of this competition for talent, universities
have shifted their hiring techniques to cope with the
shortage of qualified faculty. One avenue pursued has been
to hire Ph.D.s from other disciplines and train them how to
teach business courses. (Shinn, 2005)
Business schools have also increased hiring of non-
tenure-track “clinical professors” as a way to gain
practitioner expertise on their faculty as well as
economize on salaries.(AACSB, 1998) Primarily used to
subsidize the increased teaching burden, these new hires
typically devote little, if any, time to research and have
no involvement with doctoral education programs.
(Zimmerman, 2001) This can be a big concern because it
makes it increasingly difficult for schools to maintain the
research component of their missions. Once business
schools lose their research leaders, they may have
difficulty hiring worthy replacements. (Fields, 2006) If
these schools are unable to maintain an adequate percentage
of academically qualified faculty that perform research,
they may also be unable to meet AACSB accreditation
requirements. (Fields, 2006)

107
Wisconsin and Illinois report that they are adding
some clinical faculty, but are doing so very carefully in
order to maintain the balance with the high quality
research faculty a leading institution must have. Howard
Thomas, dean at the University of Illinois, noted,
“Clinical faculty still have the aura of second-class
citizens among doctoral, tenure-track faculty, but I really
see them as playing a key role in providing quality,
cutting edge instruction.” (AACSB, 1998)
To fill vacant positions, other schools have turned to
adjunct or visiting faculty. UCLA, as well as Stanford,
Lippmann said, now hire five to 10 percent adjunct faculty.
“These are excellent teachers with top quality experience.
Thirty years ago we wouldn’t have looked at such a person.”
(AACSB, 1998)
F. FACULTY COMPENSATION
Business school faculty members have traditionally
enjoyed higher salaries than most of their counterparts in
other academic fields, and the recent shortage in qualified
business faculty has only increased this relative advantage
in compensation. According to a 2006 survey of 226,000
faculty members at 844 public and private four-year
colleges and universities, faculty in the business and
management field earned the third-highest average salaries
among the 32 different fields classified, ranking behind
only legal studies and engineering.
Figure 47 illustrates the average nine-month salary
received by business school faculty, broken down by
specific field and academic rank. Note that academic
salaries are generally reported in nine-month terms because

108
most faculty are only guaranteed nine-months of employment
each year (some schools guarantee more, some less). Faculty
commonly must seek additional internal or external funding
for additional research or teaching for the remaining three
months of the year (usually the summer). Given that most
faculty do, in fact, find such funding, however, the values
in Figure 47 significantly under-represent the average
salaries actually earned on an annual basis.(Chronicle,
2006)
Of particular note from Figure 47 is the fact that,
overall, the average salary for new hires exceeds the
salary for all faculty, especially at the tenured ranks. In
some fields and ranks, the premium paid to new hires is
quite significant. As the pool of high quality, freshly
minted Ph.D.’s is diminishing; competition for associate
and assistant professors is increasing. Institutions that
can afford to bid are becoming more aggressive in
recruiting faculty from other schools, inflating salaries
beyond what some can afford.(AACSB, 1998)
Intense competition for new faculty is also reflected
in increases in non-salary compensation (e.g. research
funds and overload teaching). Business schools are also
pursuing faculty at peer institution with job offers for
family members, apartments and other perks.(AACSB, 1998)
Wisconsin’s Policano sees it as a trickle down effect
that begins with the top schools paying a higher price or
offering more perks for a shrinking pool of faculty. Each
next layer of schools then reaches down into another tier
of quality, with diminishing quality form a smaller and
smaller pool.(AACSB, 1998)

109
Figure 47. Average 9-Month Salary by Business Field and Rank (2005-06) ($ in 000’s)
Professor Associate Professor
Assistant Professor
Lecturer / Instructor
Field/Discipline
All New Hires All New
Hires All New Hires All New
Hires
Finance / Banking / Real Estate / Insurance
134.0 142.3 107.1 126.4 109.0 111.0 60.9 60.0
Production/ Operations Management
118.2 159.2 95.9 109.9 92.6 87.5 58.7 44.8
Accounting / Taxation 118.1 135.7 98.3 111.4 98.1 104.2 54.6 51.4
Marketing 117.6 110.8 93.7 95.5 90.5 89.3 56.5 55.3
Quantitative Methods/Operations Research/Statistics
117.4 -- 91.1 119.3 81.4 75.1 50.1 51.6
Management / Behav. Science/ International Bus. / Strategic Mgmt.
115.3 110.6 91.8 99.1 87.8 88.9 52.3 50.2
CIS / MIS 114.1 85.6 94.8 94.3 91.7 87.4 52.3 47.4
Economics / Managerial Economics
107.3 116.7 79.1 101.4 72.9 71.9 51.7 52.8
All disciplines (including those not named above)
117.1 121.1 93.7 105.0 91.0 91.8 53.6 50.8
Source: AACSB International - ref 214.
110
“It’s crisis time for the public universities,” says
Policano. “We are on a razor’s edge and at any given
moment, if the private schools with heavy endowments come
and offer support for top faculty it would be very
difficult to compete.” (AACSB, 1998)
Spiking salaries for doctorally qualified new hires
has created a new problem: salary inversion.(Fields, 2006)
UCLA, for example, is “very aggressive,” Lippmann said in
recruiting rookies, often paying them more than three,
four, and five-year faculty. “Not long ago, my 12 month
salary was lower than a rookie’s and I’m a chaired
professor.” (AACSB, 1998)Soon, it may not be uncommon for
an associate professor with ten years of experience and a
solid record of teaching, research, and service to earn
$10,000 less than a new hire just brought on board.(Fields,
2006) Illinois' Thomas noted that, “People now retiring
often have much lower salaries than those of starting
professors.” (AACSB, 1998)
It does not stop with new hires. It affects the
experienced faculty as well. Rising salaries for new hires
has encouraged experienced faculty to move to different
institutions to receive pay raises of their own, and thus
the market continues to stay extremely competitive.
(LeClair, 2004) This does not bode well for schools
because the senior faculty who relocate are replaceable
only at a significant premium over their current salaries,
even if the successors are far more junior. (AACSB, 2003)
G. FACULTY CAREER CHOICE
Given that most business school faculty members could
be earning considerably greater compensation in the private

111
sector, it is important to understand why they would choose
an academic career in the first place. While not specific
to business schools, Figure 48 provides the results of a
survey of higher education faculty members regarding why
they decided to pursue an academic career. While not
surprising that “intellectual challenge” was the number one
reason for pursuing an academic career, it is perhaps
revealing that the next four reasons all relate to either
intellectual or professional freedom.
Figure 48. Top Reasons Faculty Pursue an Academic Career
Percentage of faculty identifying reason as “very important” in decision to pursue an academic career Public
Universities
Private Universities
Intellectual challenge 88.5% 89.2% Freedom to pursue scholarly/teaching interests
83.0% 82.1%
Intellectual freedom 81.4% 79.4% Autonomy 76.7% 77.4% Flexible schedule 67.6% 66.3% Opportunities for research 61.1% 61.4% Opportunities for teaching 60.0% 60.4% Opportunity to influence social change
22.3% 20.0%
Occupational prestige/professional status
19.5% 19.5%
Source: Chronicle of Higher Education, Volume 50, Issue 1, Page A20
It is the importance of intellectual freedom in higher
education that motivates the institution of academic
tenure, which provides a level of job security, which is
quite rare in the American economy. Academic tenure, it is

112
argued, protects established teachers and researchers when
they dissent from prevailing opinion or openly disagree
with authorities within or outside the school. Thus
academic tenure is similar to the lifetime tenure that
protects some judges from external pressure. Without job
security, the scholarly community as a whole might favor
"safe" lines of inquiry. (Wikipedia, 2007)
It is important to note, however, that universities
also have economic rationales for adopting tenure systems.
First, job security and the accompanying autonomy are
significant employee benefits; without them, universities
might have to pay higher salaries or take other measures to
attract and retain faculty. Second, junior faculty are
driven to establish themselves by the high stakes of the
tenure decision (i.e., lifetime tenure vs. job loss),
arguably helping to create a culture of excellence within
the university. Finally, tenured faculty may be more likely
to make “relationship-specific investments” of their time
and energy in improving the universities where they expect
to remain for life; they may also be more willing to hire,
mentor and promote talented junior colleagues who could
otherwise threaten their positions. Many of these
rationales resemble those for senior partner positions in
law and accounting firms. (Wikipedia, 2007)
While the number two and three reasons that faculty
choose academic careers in Figure 48 are associated with
intellectual freedom, the number four and five reasons are
clearly associated with professional or lifestyle freedom.
Academic positions generally do not require faculty to
“clock in and out,” to bill by the hour, to work normal
business hours, or even to be physically located on campus

113
when conducting their work (other than the actual time
spent in the classroom). Many faculty members, especially
full-time faculty with tenure, operate with a minimum of
supervision from their institutions and outside agencies,
structuring their work as they want.(Gappa et al., 2007) A
faculty career is hence one that is judged on product
(research published, classes taught well, etc.), rather
than process.
The importance that academic faculty place on
professional freedom was conveyed quite succinctly by NPS
Associate Professor David Henderson recently when he noted
that, “The reason that many of us became academics is
because we get to choose when and where we do our 70 hours
of work a week.” (Quoted by Associate Professor Peter
Coughlan during interview.) Professor Henderson’s quote
captures well the tradeoff that faculty make when they
choose an academic career: They are willing to work at jobs
that require them to put in as much as 70 hours per week,
but in return they expect to be given the freedom to work
when, where, and how they see fit.
H. FACULTY JOB SELECTION
Perhaps not surprising given the “up or out” nature of
tenure-track positions, business schools are constantly in
pursuit of new faculty. From 2002 and 2005, between seven
and nine percent of all full-time faculty in U.S. business
schools were new hires, with schools averaging around four
new faculty members per year. (AACSB, 2006a; LeClair, 2004;
Shinn, 2005) Almost 60 percent of new hires at business
schools were experienced – that is, neither new doctorates
nor candidates for doctorates known as “all but
dissertation” (ABD’s). (LeClair, 2004)

114
For a view of the job selection process from the
faculty perspective, Hunt (2004) conducted a survey among
207 business school faculty members who had recently
accepted employment at their first academic position (all
had registered in the Academy of Management online job
placement services). Respondents had contacted an average
of 31.1 schools in their job search and received an average
of 3.8 on-campus interviews. (Hunt, 2004) Male respondents
reported 2.73 job offers and females had an average of 2.19
job offers. Those who ended up accepting a position at a
doctoral (i.e. research-oriented) school had received an
average of 2.67 offers, while those at non-doctoral schools
had 2.52 offers. (Hunt, 2004)
1. Why Faculty Choose to Work at a Particular School
To assess the priorities of business and management
faculty when selecting among potential academic employers,
Hunt asked the respondents to his survey to rate the
importance of 32 different factors on the decision to
accept employment at their current school.(Hunt, 2004)
Results for the 20 most important factors are given in
Figure 49, separated between respondents at doctoral and
non-doctoral schools.
Among new faculty at both doctoral and non-doctoral
institutions, teaching load (i.e. minimization of the
number of different courses, segments, and/or terms that
the faculty member would be required to teach) was the most
important factor in determining which academic position to
accept among competing offers. Moreover, teaching load was
the number one factor by a quite significant margin among
faculty at doctoral institutions.

115
Figure 49. Importance of Factors in Accepting a Business School Faculty Position (7 point scale, 7=extremely important,1=not at all important)
Doctoral Schools
Non-Doctoral Schools
Variable Mean Rank Mean RankTeaching load (number of courses,segments, terms, etc.) 6.41 1 6.03 1
Likelihood of obtaining tenure 6.00 2 5.78 3 Compatibility with other faculty 5.93 3 5.95 2 Spouse's evaluation of area 5.63 4,5 5.48 6 Funding for research, researchassistants, & research time 5.63 4,5 5.20 12
Criteria used for promotion andtenure decisions 5.56 6,7 5.73 4
Funding for travel to meetings 5.56 6,7 5.40 7 Prestige of school or department 5.44 8 4.53 22 Background, interests, & research orientation of the faculty 5.37 9 4.58 21
Library and computer facilities 5.30 10 5.23 11 Opportunity to teach desired courses 5.19 11 5.63 5 Base salary 5.15 12 5.30 9 Compatibility with department head 5.12 13 4.90 12 Existence of Ph.D. program 4.96 14 2.44 32 Fringe benefits package 4.85 15 4.63 17,18Geographic location of school 4.74 16,17 5.33 8 Availability of supplementaryresearch grants 4.74 16.17 4.10 25,26
Quality and motivation of students 4.70 18 4.75 14 Cost of living in area 4.67 19 4.63 17,18Physical facilities (e.g. faculty offices, classrooms etc.) 4.50 20 4.60 19,20
Source: Table 2 from ref 202 pg 60 & 61
It is also of interest to note from Figure 49 that
salary was only the 12th most important decision factor
among new faculty at doctoral institutions and the 9th most
important factor among new faculty at non-doctoral
institutions. As William Nichols, associate dean at
University of Norte Dame’s Mendoza College of Business,

116
noted, “Money alone doesn’t drive faculty recruitment, but
it allows you to have a conversation with some of the best
faculty in the United States.”(Tyson, Spring 03)
Additional insight into job selection criteria among
faculty was provided in research conducted by Trower
(2002). Trower’s investigation into the job choices of new
doctoral-degree recipients and new faculty in the first or
second year of employment showed that faculty as well new
Ph.D graduates prefer tenure-track appointments for the
economic security and academic status they provide.
Respondents also indicated, however, that they would select
non-tenure-track appointments for the sake of geographical
location, flexibility, and balance between teaching and
research.(Gappa et al., 2007)
2. Relocating to New Positions
Given the fact that academic careers are often
characterized by a number of “stops” at different
institutions, it is important to examine the costs and
incentives for faculty when they switch employers.
First of all, academic careers have special switching
costs associated with the tenure process. Certainly,
tenured faculty members are generally unlikely to switch
employers and give up the job security of tenure unless
their new employer is willing to offer them tenure as well.
Offering immediate tenure to a faculty member at another
institution, however, might be a difficult pill to swallow
for the offering school, given that the faculty at the new
institution must effectively choose a colleague for life
despite having perhaps never worked closely with the
individual. Untenured faculty on the tenure-track face a
different sort of switching cost: The cost of starting

117
over. When an assistant professor moves from one
institution to another, his or her “tenure clock” is often
either restarted or at least set back a number of years,
pushing farther away the possible attainment of the “Holy
Grail” of tenure.
In light of these switching costs, Eaton and Hunt
(2002) examined the reasons that faculty decide to
relocate. Factors of importance were similar to those of
new PhDs in Figure 49. Most relocating faculty members left
their previous employment voluntarily. The main reasons
were incompatibility with other faculty and spouse’s
evaluation of the area. However, a number of respondents
indicated that they were not dissatisfied, but had received
an outstanding offer from another university. Those who
left involuntarily either did not receive tenure or thought
they would not in the future. (Hunt, 2004)
Additional insight is provided from a survey of
faculty members conducted by the U.S. Department of
Education. In responding to a question about the most
important characteristics of a new job if a faculty member
were to leave his or her current institution, tenured and
tenure-track faculty replied that tenure was very important
(83 percent), followed by job security in general (71
percent), and geographical location (70 percent). These
faculty members also placed a high priority on spousal
employment (69 percent)(Gappa et al., 2007)
I. FACULTY JOB SATISFACTION
College and university faculty, as a whole, exhibit
remarkably high levels of career and job satisfaction. In
their responses to the 2004 National Survey of

118
Postsecondary Faculty, faculty members showed a high degree
of satisfaction (87.5 percent) with their jobs overall,
regardless of appointment, time base, institutional type,
gender, or ethnic background.(Gappa et al., 2007) Analysis
of several Carnegie Foundation for the Advancement of
Teaching surveys conducted between 1969 and 1997 shows that
for decades full-time faculty members have remained
generally satisfied with their career choices and their
institutions. Very few have indicated that they would
change their profession if they had it to do over again.
They have retained their positive attitudes about their
academic careers even though their workloads have escalated
and their salaries have not always kept pace with
inflation. (Gappa et al., 2007)
Moreover, the previously mentioned survey of recently
hired business school faculty members conducted by Hunt
indicated high levels of confidence that these new hires
had indeed selected the right faculty position. On a scale
of 1 to 7, with 7 representing that one was sure that he or
she had chosen the correct offer, respondents at doctoral
schools averaged 6.04, while the average for those at non-
doctoral schools was 6.19.(Hunt, 2004)
The aspects of their career or particular academic
position that faculty find most satisfying are illustrated
by the survey results in Figure 50. “Autonomy and
independence” ranks as the best aspect of their job by a
large margin for faculty at both public and private
universities.

119
Figure 50. Top Reasons Faculty Are Satisfied with a Particular Academic Position
Percentage of faculty identifying aspect of job as “satisfactory” or “very satisfactory” Public
Universities
Private Universities
Autonomy and independence 88.4% 89.8% Job security 80.0% 81.3% Opportunity to develop new ideas 79.6% 82.7% Overall job satisfaction 73.6% 78.7% Professional relationships with other faculty members
72.4% 75.3%
Competency of colleagues 72.1% 76.4% Opportunity for scholarly pursuits 70.5% 73.3% Teaching load 62.5% 66.0% Office/lab space 61.4% 70.2% Social relationships with other faculty members
57.1% 63.0%
Relationships with administration 57.1% 61.3% Visibility for jobs at other institutions/organizations
49.5% 52.8%
Salary and fringe benefits 46.6% 56.3% Quality of students 44.0% 70.0% Source: Chronicle of Higher Education, Volume 50, Issue 1, Page A20
1. Lower Satisfaction Among Untenured Tenure-Track Faculty
The overall high level of job satisfaction among
academic faculty may mask lower levels of satisfaction
among particular groups, however. Indeed, a survey of
untenured tenure-track faculty members at six research
universities led to less positive results. In this case, 25
percent responded that they were either dissatisfied of
very dissatisfied with their college or university as a
place to work (Trower and Bleak 2004). This population of
early career faculty in highly competitive environments may
have included a significant proportion of individuals who

120
were in the process of determining whether they really
wanted to continue building their careers in the academy.
New tenure-track faculty members enter their academic
careers because they believe that faculty work involves
autonomy, flexibility, freedom to pursue academic
interests, and opportunities to serve society through
education. Unfortunately, what early career faculty members
hope for does not fully match what they actually experience
(Rice, 1996b; Rice, Sorcinelli, and Austin, 2000). Olsen
(1993) found that satisfaction with faculty work actually
declined over the first several years of a tenure-track
appointment, and that this decline was accompanied by an
increase in job-related stress attributed to conflicts
involving time and work-life balance.(Gappa et al., 2007)
Early-career faculty have reported finding the tenure
process and its expectations mystifying (Rice, Sorcinelli,
and Austin, 2000; Austin and Rice 1998). Over and over
again, researchers on the topic have heard comments such as
“Everything is so vague, ambiguous, and illusive” or “There
is no steady, reliable feedback” or “I cannot get a good
read on what it takes to get tenure” (Rice, Sorcinelli, and
Austin, 2000). One new faculty member succinctly referred
to the tenure process as “archery in the dark” (Rice,
1996b, p.31).
For many untenured tenure-track faculty members, the
rigidity of the tenure timeline is the most critical aspect
of the tenure process (Austin and Rice, 1998). As
performance expectations continue to increase, funding
opportunities are decreasing, and this gap is causing
greater competition for grants to support research in some
fields. Academic journals’ review processes and schedules

121
often result in long delays before authors are notified
about receipt of their work, much less about its
acceptance, and there may be even longer delays until an
accepted manuscript appears in print.(Gappa et al., 2007)
The end result of the tenure process is that “people
stagger to the end of the tenure review” (Tierney and
Bensimon, 1996, p. 73). If they attain tenure, they feel
relieved rather than elated. One respondent, the first to
have gained tenure in his school in ten years, said, “It’s
been dehumanizing … I’m disheartened by the whole thing”;
another commented, “I’ve got it. I will never give it up,
because I would never put my family through that again.
Never” (Tierney and Bensimon, 1996. p.73).
2. Sacrificing Family and Personal Life for the Academic Career
Many faculty members report that they face constant
pressure to turn their attention in too many different
directions, and that they find the pace of work hectic and
relentless (Rice, Sorcinelli, and Austin 2000). Many new
faculty members, and graduate students aspiring to be
faculty members, are expressing concern about what they
perceive to be increasing expectations for higher levels of
productivity. The often report feeling pulled in many
directions simultaneously and wonder whether they can find
workable ways to manage their personal and professional
responsibilities. (Gappa et al., 2007)
All faculty members, but especially new tenure-track
faculty, face multiple demands on their time as well as
high expectations for their accomplishment in teaching,
research and service. Their time at work is fragmented
among diverse and conflicting priorities: students expect

122
excellent faculty performance in the classroom: senior
colleagues seek these new colleagues’ participation in
departmental, campus, and professional service; and new
tenure-track faculty members simultaneously must produce
research and scholarly work. (Gappa et al., 2007)
Consequently, the total hours which full-time tenure-track
faculty work weekly at their institutions have increased.
The average work week for full-time tenure-track faculty
across all disciplines has increased from 51 hours in 1988
to 56 hours in 2003 at research universities, from 46 to 53
at comprehensive institutions, and from 41 to 50 at all
other institutions.(Gappa et al., 2007) The percentage of
faculty members reporting that they work more than 55 hours
a week has grown from 13 percent in 1972 to 47 percent in
2003.(Gappa et al., 2007) While these figures indicate the
increasing workload of faculty overall, the problem is
considered particularly acute at business schools, where a
shrinking supply of professors are often pulled in many
different directions as they are asked to teach more
classes, conduct more research, and become more involved
with students and business communities.(Fairbank et al.,
2005)
The negative impact of these increased work demands on
the family and personal lives of faculty members is
indicated by the survey data in Figure 51. The top two
sources of stress among faculty members relate to lack of
time available for either personal activities or household
responsibilities.

123
Figure 51. Top Sources of Stress among Faculty Members, Compared by Gender
Source of Stress Males Females Lack of Personal Time 68.5% 81.9% Management of Household Responsibilities 68.0% 81.8% Teaching Load 61.6% 70.8% Committee Work 54.7% 61.1% Tenure review/Promotion Process 40.3% 50.8%
Source: Page 109 of Ref 208
In other survey work, finding enough time to do their
work was one of the most frequently mentioned sources of
stress among early-career faculty in a range of
institutional types (Rice, Sorcinellie, and Austin, 2000).
Some graduate students and new faculty, as they observe the
stress and long hours that characterize the work lives of
their senior colleagues, have expressed uncertainty about
wanting to continue pursuing their academic careers.(Gappa
et al., 2007)
The academic career therefore is paradoxical. Despite
its advantages of independence and flexibility, it is
psychologically difficult. The lack of ability to limit
work, the tendency to compare oneself primarily to the
exceptional giants in one’s field, and the high incidence
of overload make it particularly difficult for academics to
find a satisfactory integration of work with private life.
It is the unbounded nature of the academic career that is
the heart of the problem. Time is critical for professors,
because there is not enough of it to do all the things
their job requires: teaching, research, and institutional
and professional service. It is therefore impossible for
faculty members to protect other aspects of their lives,

124
and work tends to dominate. These factors help to explain
why 31 percent of faculty are considering work outside the
academy (Lindholm et al., 2005) (Gappa et al., 2007)

125
VI. SUBSTITUTES
Perhaps the number one area of graduate management
education that will see revisions in the years ahead is the
curriculum itself, with an emphasis on offering increased
flexibility through expanded programs.(Fairbank et al.,
2005) The idea is that with more options available to
choose from, students will be enticed by the opportunity to
design their own educational experience by selecting
courses that interest them. This is in direct opposition
to the old model of taking a course load that has already
been designed by the school. This new strategy has been
the primary tactic for lower-tier schools seeking a
competitive advantage against the larger schools. Now,
even top-ranked schools recognize the validity in the
strategy and are scrapping the “one-size-fits-all” model in
favor of the new customizable models that emphasize
flexibility and individuality.(Lavelle & Lehman, 2006)
According to a 2004 survey by AACSB International, about
300 business schools were planning either to add academic
programs or substantially revise their curricula. More
than 50 schools had already made revisions.
The origins of the MBA industry are rooted in a time
when communications technology was much more limited than
it is today. The limitations of technology necessitated
that post-graduate education take place on campus and
physically in the presence of the faculty. Today,
technology and buyer demand have evolved to provide
educational options that were not available in the past.
These options have a direct affect on the market for post-
graduate education and are valid substitutes for

126
traditional business schools. As one source noted, “The
industry is no longer monolithic. Business education is
delivered in a fragmented market-place and in multiple
formats.” (AACSB, 2002)
Traditional university-based business schools account
for only a fraction of the broad management education
industry.(AACSB, 2002) Filling MBA seats has become more
difficult as students have more and more MBA choices.
(Bisoux, 2006) The number of applications to traditional
full-time programs decreased at 78 percent of business
schools in the 2002-2003 and 2003-2004 academic years,
according to the Graduate Management Admissions
Council.(Pulley, 2006) Across the industry it is becoming
more apparent that, more and more, students have rigorous
and demanding work and family schedules that require the
need for more creative program alternatives in terms of
scheduling and content. (Bisoux, 2006)
There are many forms of education or training that
might be considered as substitutes to the traditional
residential MBA program. A review of current literature
published by trade magazines, accreditation reports and
weekly periodicals points to executive programs, corporate
universities, and non-traditional business schools (part
time, satellite campuses or online) as the substitutes that
claim the biggest share of prospective MBA students.
A. CORPORATE UNIVERSITIES
Corporate Universities were once thought of as
glorified training departments. They have evolved to
become much more strategic in focus and are key
contributors in helping the parent organization achieve

127
goals through education. The corporate university exists
to accomplish the following objectives:
(1) teach topics like leadership and
communication to executives;
(2) standardize skills and knowledge for certain
jobs within the company;
(3) help the company as a whole develop a unified
culture; and
(4) develop strong networks among
employees.”(Shinn, 2004b)
Achieving these objectives in support of corporate
strategy requires an education-based approach as opposed to
training based approach.
In a survey of 2,570 employees, 64 percent say their
company provides some type of in-house training for
educational/career development.(GMAC, ) Of the over 1600
companies nationwide that have instituted their own version
of corporate universities, many have implemented the robust
curricula necessary to educate rather than train. A
sampling of course offerings include: Industry Trends,
Customers and Competitors, Business Strategies, Best
Practices, Creative Problem Solving and Leadership
Development. The educational philosophy, as employed by
the corporate university, tailors the curricula to provide
only courses of value to the company’s objectives.
Corporate Universities now pose an important threat to
traditional management and business schools.(Gary, 1998)
The threat implied is that employers can streamline
education and training to provide the company specific
need-to-know information. While this may not provide the

128
well rounded education that a traditional business school
could provide, it satisfies corporate requirements without
the increase in salary that an MBA would command and allows
the employee to train at the company’s convenience.
Traditional business schools have taken this threat
seriously. Many, in fact, have changed strategies to
account for this threat. A common example of strategy
change to remain competitive is diversification, which is
being achieved through partnerships. These partnerships
capitalize on the combination of business industry
knowledge, which is a stalwart of the b-school curricula,
and the specific educational needs that corporations need
to advance their strategic goals. MBA providers have even
begun to partner themselves with corporations in designing
company specific MBAs or other training courses. In
essence these partnerships “lean out” the traditional MBA
process by identifying the value stream and providing only
the subject matter in which the company finds value.
B. NON-TRADITIONAL
This category includes methods of delivery such as E
learning and non-resident MBA. American MBA programs are
challenged with the plethora of options available to
prospective students. MBA programs are proliferating in
other parts of the world, part-time programs are increasing
in popularity, and online programs have proven remarkably
alluring.(Greenbaum, 2006)
These programs tend to be more accommodating to
working professionals and students with scheduling needs.
(Syed, 2006) Non-traditional schools such as University of
Phoenix and Webster provide the majority of their education

129
through satellite campuses and online offerings. They
distribute learning to those who might not otherwise have
sought postgraduate education. The convenience of their
offerings almost certainly siphons off some students from
traditional business schools. Moreover, these providers
argue that their accreditation makes their degree as
valuable as any other accredited school. In addition, the
convenience of local campuses and Internet courses can, for
some prospective students or employers, outweigh the
reputation of traditional business schools.
Part-time MBA programs at AACSB member schools in the
U.S. (excluding executive MBA programs and distance
education programs) represent 58 percent of these schools’
MBA program enrollment.(AACSB, 2002) This statistic
illustrates the appeal of non-traditional delivery methods.
It is logical to assume that this 58% represents both
potential students of full-time residential business
schools as well as students who might not otherwise have
pursued an MBA. The power and appeal of non-traditional
delivery methods provide opportunities for traditional
schools to diversify to remain competitive. With the
infrastructure already in place (faculty, curriculum,
facilities, etc.) many traditional schools discovered that
diversifying to offer part time programs is essential to
retain the necessary revenue to continue operations.
Recent statistics show that more than 48 percent of
American Business schools now offer online MBAs.(Economist
Staff, 2004)
The trend to diversify in methods of education
delivery has been necessary. Consider that upstarts such
as the Universities of Phoenix and Webster both have annual

130
enrollments of around 4,000 and 7,000 full and part-time
MBA students, respectively.(AACSB, 2002) In 1999, the
University of Phoenix awarded 3,473 business master’s
degrees at 11 U.S. campuses and another 1,430 through its
online arm.(AACSB, 2002) The national presence gained by
University of Phoenix in just a few years, and in spite of
its detractors, has built market capital of more than $13
billion and established more than 140 campuses.(Westerbeck,
2004) These types of success stories in the non-
traditional market will continue to erode the enrollment of
the traditional schools who fail to find strategies that
allow them to compete.
C. EXECUTIVE EDUCATION
Executive Education provides a heading to capture both
degree and non-degree granting programs that are aimed at
mid-career professionals. Both are similar to non-
traditional programs in that they are accommodating to
working professionals and may provide more flexibility than
traditional school offerings. These programs provide yet
another substitute that potential traditional MBA students
may consider.
1. Degree Granting Executive Education
These are accredited curricula administered by degree
granting institutions that cater to mid-career
professionals. The time requirement is less than that of a
traditional MBA. One of the key differences between
executive and traditional full-time programs, however, is
the limited or lack of opportunity to specialize in an
executive program.(Syed, 2006)
Given that these Executive MBAs (or EMBAs) target mid-
career individuals, it is not surprising that these
131
programs attract older students.(Syed, 2006) The average
age of executive education applicants is 34.3 year old.
2. Non-Degree Granting Executive Education
This training does not lead to accreditation but does
teach valuable skills. The trade off is between having
employees learn a skill to keep them current in a dynamic
environment or to facilitate their progression in the
company hierarchy. Helping the students learn a skill will
enable them to remain current in the respective field and
may even give them an advantage in career advancement.
D. CONCLUSION
It is fair to ask if the value of a traditional MBA
may have slipped in the opinions of some employers.
Increased supply of alternate methods of higher education
points to evidence that this may be true. The increased
availability of substitutes could not be sustained if
demand did not increase at a comparable rate.
There is, however, a scenario that might offer a
counter to this perspective. It may simply be that the
demand for resident graduate business education has
remained constant (with adjustments for population
increases) and the demand for substitutes is created mostly
among customers who would not have pursued a traditional
MBA in the first place.
Either way, statistics show that nontraditional
programs attract the vast majority of MBA enrollments in
the U.S. In the 2003-2004 academic year, only 24 percent
of MBA enrollments at AACSB-member schools in the U.S. were
in traditional two-year programs. In 2004-2005, that number
slipped to slightly more than 21 percent. Enrollment in

132
part-time evening and weekend MBA programs ticked up to
63.7 percent in 2004-2005 from 61.2 percent in 2003-2004.
(Bisoux, 2006)
Because substitutes draw students from traditional
programs, the traditional programs have had to diversify by
assimilating attributes of the substitutes to remain
competitive. Traditional b-schools now recognize the
revenue generating potential of adding part time and
executive programs to their offerings. Part-time programs
also help schools achieve cost efficiency and prevent
competitors from stealing market share.(Fairbank et al.,
2005)
While there are conditions that illustrate the
competition for the same prospective student between the
traditional and non-traditional school, there is also
evidence that they are sometimes after different customers.
An analysis of GMAT data by GMAC revealed that the average
age of part time applicants is 29 years old with an average
GMAT score of 490. Full time applicants average 26 years
of age with an average GMAT score of 540.(Syed, 2006)
This same survey, however, found evidence of some
overlap in the target customer base. In particular, 34% of
respondents who considered a full time two-year traditional
MBA program also considered a full time one year
accelerated program, 16% considered a part time program,
10% considered an EMBA program, and 7% considered an
online/distance-learning program.(MBA.com, 2005a)
There are full time (traditional) universities that
have no incentive to diversify. They are fully capable of
remaining competitive on reputation and published rankings

133
while selling to a student demographic which values the
opportunity to be fully immersed and take advantage of
program offerings such as career services (including campus
interviews), career counseling, social and professional
clubs, and other “campus life” events, like an executive
speaker series.(Syed, 2006)
However, mid-tier traditional business schools have
already started diversifying to include part time and on
line offerings. Catering to this market and claiming a
portion of the prospective students that don’t have the
option of full-time education is a must for some schools to
remain competitive in today’s market.
Figure 52 shows that full-time MBAs incur large
opportunity costs associated with leaving the full-time
workforce for nearly two years. Consequently, their total
costs are large ($146,725) compared to the part-time
($33,726) and executive programs ($37,293). Thus, the ROI
is much higher for part-time and executive graduates and
the payback period is much shorter.(Holtom & Inderrieden,
2006) As seen in Figure 53, however, MBA graduates who
attended part-time or executive MBA programs are less
likely to rate the value of their degree as “outstanding”
when compared to graduates who earned their MBA from full-
time programs.

134
Figure 52. Impact of Program Type
Variable Full-Time Part-Time Executive
Pre-MBA Salary $49,329 $57,301 $77,609
Post-MBA Salary $78,221 $78,287 $91,026
Total Cost $146,725 $33,726 $37,293
Net Increase in Salary $28,892 $20,986 $13,417
Percent Increase in Salary 59% 37% 17%
10-Year Gain from MBA $362,228 $263,110 $168,217
Return on Investments (ROI) 147% 680% 351%
Annualized ROI 15% 68% 35%
Payback Period (years) 5.1 1.6 2.8
Figure 53. Overall Value of the MBA Degree, by Program Type
Response Full-Time (n = 2,048)
Part-Time (n = 533)
Executive (n = 215)
Outstanding 27% 13% 23% Excellent 34% 30% 35% Good 25% 36% 29% Fair 9% 14% 8% Poor 5% 7% 5% Total 100% 100% 100% *p < .05; Items in bold significantly affect the overall X2 statistic of the contingency table.
Typically, almost two-thirds of part-time MBA students
are receiving some form of financial subsidy from an
employer, according to a 2000 survey by AACSB International
and Educational Benchmarking, Inc.(Fisher, 2002)

135
E. ANALYSIS
As the requirement for business knowledge expands, the
opportunity for participants to enter the market expands.
Most new participants will not enter the market to directly
challenge industry leaders. They will enter the market to
offer very specific or focused offerings that appeal to
sub-sets of traditional school’s potential students. The
substitute offerings may be inferior in quality and provide
less benefit than what a traditional school offers.
However, less quality or inferior product does not mean
less value.
Buyers will evaluate trade-offs between the
convenience of acquiring a product that is “good enough”
and the rigid constraints of an education that might be
overkill. Substitutes that offer these types of trade-offs
are becoming more relevant and are finding niches in the
market that draw students away from traditional
institutions.
The ways that traditional business schools deal with
substitutes is critical to their survival. As upstarts
deliver business education through the Internet or
satellite campuses, or provide a unique training that
enhances business skills of employees, there becomes less
of a potential student pool. Traditional business schools
have for the most part, dealt with substitutes in three
ways: ignore, straddle or switch.
Some of the top-ranked business schools have little
need to worry about substitutes. The power of the brands
at top schools such as Wharton or Harvard suggests very
little threat from an online school. Only Harvard has a
license to sell Harvard degrees, and Harvard has no

136
intention of mass-producing MBAs. Consumer demand for the
“Harvard brand MBA” will always outpace the supply.
University of Phoenix or local corporate universities are
not in the market for Harvard MBA seekers.
The same threat to mid and lower tier schools,
however, is real. The online and distance learning schools
target the same students that would otherwise attend these
schools. The lower tiered schools often have to diversify
their offerings or “straddle.” This means that they would
continue to offer traditional education but would expand to
offer alternative distribution methods to maintain a
student population that can sustain operations.
Traditional business schools may even exercise the
option to challenge the substitutes in their own market.
If a school were to find that continuation of traditional
business school services were not profitable (or
sustainable), changing strategy to deliver education
through an alternate means would be a viable option. As
students demand more flexibility and fewer can afford the
two-year hiatus to attend school, traditional business
schools can find their pool of potential full time students
too shallow to support the weight of a bricks and mortar
operation. While the buildings and classrooms of a
traditional school might become excess property, the core
competencies of teaching and research are still valuable
commodities that can be sold through alternate distribution
channels such as distance learning or online services.
Substitutes are a factor that traditional business
schools must address. Non-traditional methods can siphon-
off potential students to the point that an exclusive full-
time residential program cannot sustain itself by

137
traditional means. Traditional schools have to understand
the threat of substitutes to their position in the market.
This understanding will provide the direction for future
strategy in an attempt to remain relevant and continue
operations.

138
THIS PAGE INTENTIONALLY LEFT BLANK

139
VII. ANALYSIS, CONCLUSIONS, AND RECOMMENDATIONS
A. ANALYSIS OF GSBPP IN RELATION TO THE MBA MARKET ANALYSIS
One of the drawbacks that the GSBPP faces is the fact
that the MBA industry is driven by reputation. Reputation
is driven by rankings in the various publications cited in
Chapter 3. Rankings are driven by student and faculty
preferences, recruiter and employer preferences, admission
standards, GMAT scores, and graduates’ salaries, just to
name a few criteria. However, the underlying factor in
each of these categories is that the schools that dominate
the Top 20 in rankings from year-to-year are the programs
that have been around for quite a long time and have
“ambassadors,” if you will, that champion the name of the
program in the real world.
For example, the business world has been exposed to
many Harvard MBAs that have collectively established the
reputation of the Harvard Business School as a quality MBA
program. This draws more students to apply because they
feel the Harvard MBA will get them whatever it is they want
(more money, access to a new career, and so on). In turn,
Harvard now has a broader range of students to choose from.
So, they are able to pick more of the high-caliber students
and less of the low-caliber students. Consequently, the
students do better because they started out more qualified.
Then Harvard MBA graduates go out in the business
world and excel, not necessarily because of the Harvard
MBA, but because they were high-caliber to begin with.
Regardless of why they succeed, the fact is that they do
and this further bolsters the reputation of the Harvard

140
Business School because the rest of the world doesn’t see
these students’ credentials prior to going to Harvard. All
the world sees is that these Harvard MBAs are excelling.
So now the demand for Harvard MBAs goes up because
businesses want them. So, more students apply to the
Harvard Business School and the cycle repeats itself.
Unfortunately, for the non-ranked or new schools, the
reverse is true. Fewer high-caliber and more low-caliber
students (probably those that got rejected from the higher-
ranked schools) attend the non-ranked or new schools. So,
they have less to choose from and one can draw conclusions
where it goes from there. The impact of MBA program
reputations creates both a “virtuous cycle” and “vicious
cycle” at the same time.
So, for the GSBPP, which only initiated the MBA in
2002 and only had its first graduating class in 2003, it
faces a difficult task if it aims to break into the Top 20
or even top 50 rankings. Because it is still in its
introductory stages, there haven’t been a lot of the
“ambassadors” out there from GSBPP who can carry the banner
of the school and who can vouch for the quality of the
program.(Trevino, Lertangtam, & Viera, 2004) This,
coupled with the fact that there is no GMAT requirement for
admissions, and the fact that only military officers (U.S.
or foreign) and DoD civilians can attend, does not bode
well for the hope of ever being ranked highly (or for
qualifying for these rankings at all).
The fact that the GSBPP has been successful in gaining
accreditation is a step in the right direction.
Unfortunately, there are too many things out of the realm
of its control to ever gain access into the upper echelon

141
of the MBA elite, at least in terms of rankings. The
accreditation serves more to validate its graduates and
entice officers to choose the GSBPP over civilian schools
when choosing to pursue an MBA, than it does to compete
with other MBA programs.
The GSBPP also faces budgetary constraints that most
other programs do not face. As noted previously, most
universities understand that tuition only covers a fraction
of the costs of running the MBA program. They rely on
additional funding from sources such as endowments from
alumni, donations, government subsidies, and executive MBA
programs, consulting fees, and research funding. The
endowments constitute the bulk of the supplemental income.
The only limit on this additional funding is the generosity
of the alumni. Thus, if a program needs additional funding
to expand, they can organize a fund raising drive and offer
to name buildings after alumni and whatnot.
The GSBPP, on the other hand, is to a large degree
constrained to its portion of the overall budget at NPS,
and the NPS budget is constrained by what the DoN allocates
and what the other services provide in terms of tuition.
They also have access to research funding, but since the
majority of the research projects are for the DoD, the pool
of money that the funds providers possess is limited as
well. The DoD does not have the same access to capital
resources as IBM. So, research funding is constrained as
well.
Most noticeably, however, is the lack of sizeable
endowments from alumni. Beyond the NPS Foundation, a large
pool of funds from philanthropic alumni doesn’t exist to
provide steady funding for GSBPP, or NPS for that matter.

142
If the GSBPP wants to expand the programs it offers, there
are very limited channels that it can access to alleviate
funding shortfalls. Thus, the GSBPP cannot be expected to
compete on the same level as the dominant MBA programs.
Another burden facing the GSBPP is the competition for
renowned professors that also assist in making a name for
the MBA program. As pointed out previously, demand for
faculty is up and so is the price. Unfortunately, due to
the congressional cap on what GSBPP can pay professors, it
falls out of the realm of competitiveness for faculty
salaries at the Associate Professor and Assistant Professor
ranks. With the additional stresses that the strong local
economy put on faculty members, especially in the housing
market, it further limits the pool of applicants to those
who are uniquely interested in defense-focused research or
those who love the Monterey area.
The defense-focused niche also limits the applicant
pool of professors. When young professors are hired to the
GSBPP, there is no guarantee of acceptance on the tenure
track. So, prior to being approved for the tenure track, a
professor must conduct a certain amount of research in the
defense area. With no guarantee of acceptance or of tenure
once accepted onto the tenure track, there is little
incentive to perform DoD-relevant research. This is for
the simple reason that faculty are leery of being
pigeonholed as a defense-focused professor by the broader
academic community.
A professor gains credibility in his/her discipline
based on the research he or she conducts and publishes in
that discipline. If junior faculty members primarily
conduct defense-focused research that is loosely tied, at

143
best, to their discipline during the early years of their
careers and they do not get tenure from the GSBPP, they
stand the chance of either being seen as an outsider from
the mainstream academic community or at least being behind
the power curve at their next place of employment. Thus,
incentives do not match up between all professors and the
GSBPP defense-focused MBA niche that is desired.
Lastly, in regards to what the GSBPP can do to curtail
the threat of substitutes, it is doing all that it can. By
branching out into distance education, GSBPP is taking full
advantage of the constraints it faces. As mentioned in the
Chapter 6 analysis, there are basically three basic avenues
to address the threat of substitutes. You can stop doing
what you do and start doing only what the substitutes do,
you can do both (called straddling), or you can ignore the
substitutes and focus on what you’re already doing.
Given the constrained resources and how the GBSPP
falls under the NPS mission, dropping the resident MBA and
focusing only on distance learning or executive education
would not be feasible. Because of how the GSBPP is
geographically isolated from operating bases, offering a
part-time MBA is not feasible either. There is no large
pool of officers in the local area that can attend night
classes or weekend classes, and since only officers can
attend, civilians can’t come here at night or on the
weekends to take courses either. You have to be stationed
in Monterey to have access to the GSBPP and you have to be
accepted into the full-time resident MBA program to get
stationed here.
To focus solely on the resident MBA is not the right
approach either. Due to the geographical isolation of NPS,

144
there are students who desire to earn an MBA, but do not
have access to the GSBPP. So, instead of ignoring them
and, consequently, forcing them to seek a MBA from
competitors, the smart avenue is to reach out to them
through distance education. Ignoring them would only hurt
the image of the GSBPP. For an infant program seeking
distinction, turning away students who desire to
participate in the MBA program offered is a poor strategy.
Trying to break into executive education is another
smart move. Currently executive education at NPS is taught
primarily at the Center for Continuing Education (CCE).
The CCE is located in the same building as the GSBPP yet,
as of now, there is no direct affiliation with the GSBPP
faculty, although moves are being made to incorporate GSBPP
influence into the CCE. This effort would expand GSBPP’s
avenues for funding as well as its overall reputation
without incurring too much additional cost.
B. CONCLUSIONS
Unlike other disciplines, business schools are torn
between two market realities: they must provide academic
value to their campus communities and meet the demands of
business for more immediate corporate training.(Bisoux,
2004) Graduate education is not about training, yet
early-career employers often want exactly this. This
speaks of trade-offs. The GSBPP is not immune to this
contradiction of desires. Officers want an MBA that will
educate them in a way that will create future opportunities
for them whether they are in the military or private
sector. Faculty members want to teach them how to innovate
with new ideas and be creative at problem solving. Both
focus on the “big picture” and on the students’ future

145
application of their graduate education. On the contrary,
the services want officers that can step in immediately and
create value in a certain billet, with minimal future
focus.
The question of how to bridge this divide is one that
is causing controversy in the MBA industry. For the GSBPP,
however, the niche strategy of being a defense-focused MBA
has served to satisfy both parties. By offering the typical
MBA curriculum that is accredited, officers get what they
want in an MBA education. The professors get to teach their
students how to think analytically and critically and apply
proven problem solving techniques in ambiguous situations.
By making the courses defense-focused and offering certain
specialized courses, the services get what they want in
officers prepared to go out and make an immediate impact.
By offering the distance education, the GSBPP is able to
reach officers that desire to attend NPS but cannot for
some reason or another. The GSBPP functions, in many
respects, as the DoD’s corporate university.
This niche strategy that the GSBPP has adopted is a
reasonable strategy for competing in the MBA industry.
When considering the constraints that the GSBPP faces in
regards to inability to compete in the rankings game, the
students that are allowed attend, the cost constraints that
it faces, and the ability to face the threats of
substitutes, there are few other viable options.
C. RECOMMENDATIONS
The most significant limitation that the defense-
focused niche places on the GSBPP is in terms of the
faculty. In today’s market of increased demand for faculty

146
due to the dwindling amount of doctoral professors, salary
becomes an important incentive to attract professors. As
already noted, the GSBPP is constrained in its ability to
be competitive in salaries that it offers to senior
professors. This is due to congressional ceilings.
Perhaps the most important incentive valued by faculty is
freedom. The original intent of the alternating quarters
for teaching and researching was designed to provide the
faculty enough freedom to focus on research without being
bogged down by teaching requirements. Unfortunately, not
being fully staffed has heaped additional teaching
requirements onto the already full laps of the faculty,
while the limited supply and scope of available research
funding has constrained the true academic freedom that
faculty enjoy when they are not required to teach.
The one recommendation that this paper offers is to
initiate a thorough investigation on ways to improve the
salary, incentive package, or a combination of the two that
is offered to professors. This would entice proven faculty
to seek a tenure-track position with the GSBPP and attract
proven faculty from other schools who would otherwise be
put off by the lack of salary incentive.
The other aspect of this investigation should be to
see what could be done to revamp the instruction/research
scheduling system in order to unburden the faculty and
allow them more time to conduct general academic research.
This would be another aspect that would entice current
faculty to stay and attract new faculty that normally would
not have been interested.

147
APPENDIX
Adopted: April 25, 2003 Revised: January 01, 2004 Revised: January 01, 2005 Revised: January 01, 2006
Eligibility Procedures and Accreditation Standards for Business Accreditation
AACSB International - The Association to Advance Collegiate Schools of Business
777 South Harbour Island Blvd., Suite 750, Tampa, FL 33602-5730 USA Tele: 1-813-769-6500 Fax: 1-813-769-6559 Web: http://www.aacsb.edu
AACSBINTERNATIONAL

148
EXCERPTS FROM SECTION 2 (pages 13-17):
STANDARDS FOR BUSINESS ACCREDITATION
STRATEGIC MANAGEMENT STANDARDS
1: The school publishes a mission statement or its equivalent that provides direction for making decisions. [MISSION STATEMENT] 2: The school’s mission statement is appropriate to higher education for management and consonant with the mission of any institution of which the school is part. The mission includes the production of intellectual contributions that advance the knowledge and practice of business and management. [MISSION APPROPRIATENESS] 3: The mission statement or supporting documents specify the student populations the school intends to serve. [STUDENT MISSION] 4: The school specifies action items that represent high priority continuous improvement efforts. [CONTINUOUS IMPROVEMENT OBJECTIVES] 5: The school has financial strategies to provide resources appropriate to, and sufficient for, achieving its mission action items. [FINANCIAL STRATEGIES]
PARTICIPANTS STANDARDS
6: The policies for admission to business degree programs offered by the school are clear and consistent with the school’s mission. [STUDENT ADMISSION] 7: The school has academic standards and retention practices that produce high quality graduates. [STUDENT RETENTION] 8: The school maintains a staff sufficient to provide stability and ongoing quality improvement for student support activities. [STAFF SUFFICIENCY—STUDENT SUPPORT] 9: The school maintains a faculty sufficient to provide stability and ongoing quality improvement for instructional programs offered. [FACULTY SUFFICIENCY]

149
10: The faculty has, and maintains, intellectual qualifications and current expertise to accomplish the mission… [FACULTY QUALIFICATIONS] 11: The school has well-documented and communicated processes in place to manage and support faculty members over the progression of their careers consistent with the school’s mission, to include:
• …the expectations the school holds for them on all mission-related activities.
• Providing orientation, guidance and mentoring. • Undertaking formal periodic review, promotion, and
reward processes. • Maintaining overall plans for faculty resources. [FACULTY MANAGEMENT AND SUPPORT]
12: The business school’s faculty…share responsibility to:
• Ensure adequate time is devoted to learning activities…
• Ensure adequate student-faculty contact… • Set high expectations for academic achievement… • Evaluate instructional effectiveness and overall
student achievement. • Continuously improve instructional programs. • Innovate in instructional processes. [AGGREGATE FACULTY AND STAFF EDUCATIONAL RESPONSIBILITY]
13: Individual teaching faculty members:
• Operate with integrity in their dealings with students and colleagues.
• Keep their own knowledge current with the continuing development of their teaching disciplines.
• Actively involve students in their learning process. • Encourage collaboration and cooperation among
participants. • Ensure frequent, prompt, feedback on student
performance. [INDIVIDUAL FACULTY EDUCATIONAL RESPONSIBILITY]
14: Individual Students:

150
• Operate with integrity in their dealings with faculty and other students.
• Engage the learning materials with appropriate attention and dedication.
• Maintain their engagement when challenged by difficult learning activities.
• Contribute to the learning of others. • Perform to standards set by the faculty. [STUDENT EDUCATIONAL RESPONSIBILITY]
ASSURANCE OF LEARNING STANDARDS
15: Management of Curricula: The school uses well-documented, systematic processes to develop, monitor, evaluate, and revise the substance and delivery of the curricula of degree programs and to assess the impact of the curricula on learning. The standard requires use of a systematic process for curriculum management but does not require any specific courses in the curriculum. Normally, the curriculum management process will result in undergraduate and master’s level general management degree programs that will include learning experiences in such management-specific knowledge and skills areas as:
• Ethical and legal responsibilities in organizations and society.
• Financial theories, analysis, reporting, and markets. • Creation of value through the integrated production
and distribution… • Group and individual dynamics in organizations.
• Statistical data analysis and management science… • Information technologies as they influence the
structure and processes of organizations and economies…
• Domestic and global economic environments of organizations.
• Other management-specific knowledge and abilities as identified by the school.
[MANAGEMENT OF CURRICULA]

151
18: Master’s level degree in general management (e.g., MBA) programs: Knowledge and skills…Learning at the master’s level is developed in a more integrative, interdisciplinary fashion than undergraduate education. The capacities developed through the knowledge and skills of a general master’s level program are:
• Capacity to lead in organizational situations. • Capacity to apply knowledge in new and unfamiliar
circumstances through a conceptual understanding of relevant disciplines.
• Capacity to adapt and innovate to solve problems, to cope with unforeseen events, and to manage in unpredictable environments.
[MASTER’S LEVEL GENERAL MANAGEMENT LEARNING GOALS] 20: The master’s level degree programs must provide sufficient time, content coverage, student effort, and student-faculty interaction to assure that the learning goals are accomplished. [MASTER’S EDUCATIONAL LEVEL]

152
THIS PAGE INTENTIONALLY LEFT BLANK

153
LIST OF REFERENCES
AACSB. (2006a). 2005-2006 salary survey executive summary.
AACSB. (2006b). AACSB guide to business education.
AACSB. (2003). Sustaining scholarship in business schools.
AACSB. (2002). Management education at risk report to the management education task force to the AACSB-international board of directors.
AACSB. (1998). Is a real shortage looming? doctoral faculty demand edges upward again. [Electronic version]. AACSB International.
Bisoux, T. (2006). Flex time for the MBA. BizEd, (July/August), 22.
Bisoux, T. (2004). Balancing the B-school budget. BizEd, May/June.
Briley, D. A. (1997). The Ph.D. project: The marketing of business school faculty diversity. Graduate School of Business, Stanford University.
Chronicle. (2007). Earned degrees conferred 203-4. [Electronic version]. The Chronicle of Higher Education, 53(1).
Chronicle. (2006). The Faculty. The Chronicle of Higher Education [Electronic version], 52, 27, A12.
Committee on Issues in Management Education. (2005). Why management education matters: Its impact on individuals, organizations, and society. Committee on Issues in Management Education Task Force on The Value Proposition for Management Education.
Conley, M. (2002). How corporate needs shape the B-school student body. Selections: The Magazine of the Graduate Management Admission Council, 2, 1, 14.
Dobni, D., & Dobni, B. (1996). Canadian business schools: Going out of business? Journal of Education For Business, September/October, 28.

154
Dulek, R. E. (1992). Why fight the system? the non-choice facing beleaguered business faculties - business schools. [Electronic version]. Business Horizons, September-October.
Economist Staff. (2004). But can you teach it? business schools. The Economist, May 22.
Edgington, R., & Olkin, J. (2002). The 'who' in who gets in. Selections: The Magazine of the Graduate Management Admission Council, 2(1) 8.
Ehrenberg, R. E., & Zhang Liang. (2004). Do tenured and tenure track faculty matter?.
Fairbank, J. F., Labianca, G., and LeClair, D. (2005). Forecast. BizEd, May/June.
Fields, D. M. (2006). Perfect storm. BizEd, January/February.
Fisher, C. (2002). The economy stumbles and applications surge. Selections: The Magazine of the Graduate Management Admission Council, 2(1) 18.
Gappa, J. M., Austin, A. E., & Trice, A. G. (2007). Rethinking faculty work. San Francisco: Jossey-Bass.
Gary, L. (1998). Corporate universities: The new pioneers of management education. an interview with Jeanne Meister. Harvard Management Update.
GMAC. (2006a). Corporate Recruiters Survey: March 2006, general data report Graduate Management Admission Council.
GMAC. (2006b). Global MBA graduate survey 2006. general data report.
GMAC. (2006c). MBA alumni perspectives survey: April 2006 comprehensive data report. Graduate Management Admission Council.
GMAC. (2006). MBA alumni perspectives survey. Graduate Management Admissions Council.
Greenbaum, S. (2006). B-school critics miss the mark. BizEd, July/August.

155
Holtom, B. C., & Inderrieden, E. J. (2006). Examining the value added by graduate management education (No. RR-06-16) Graduate Management Admission Council.
Hunt, S. C. (2004). Business faculty job selection: Factors affecting the choice of an initial position. Journal of Business and Management, 10, 1, 53.
Lathroum, J. A. (1998). A comparative analysis of graduate management education.
Lavelle, L., & Lehman, P. (2006, The best B-schools of 2006. [Electronic version]. Business Week, 4006, 54.
LeClair, D. (2004). The professor's paycheck. BizEd, March/April.
Mast, C. (2002). The art of admissions. Selections: The Magazine of the Graduate Management Admission Council, 2(1) 23.
Mast, C. (2001). The people behind the rankings. Selections: The Magazine of the Graduate Management Admission Council, 1(2) 16.
MBA.com. (2005a). MBA.com registrants survey.
MBA.com. (2005b). MBA.com registrants survey comprehensive data report. October 2005 Graduate Management Admission Council.
Montauk, R. (2002, Should you invest in an MBA? [Electronic version]. College Journal from the Wall Street Journal.
Murray, M. (2006). MBA salary No. RR-06-13) Graduate Management Admission Council.
Olkin, J. M. (2004). Informed sources. Selections: The Magazine of the Graduate Management Admission Council, 4(1) 8.
Policano, A. J. (2005, What price rankings? BizEd, (September/October) 26.
Pulley, L. (2006, An RX for the ailing MBA. BizEd, January/February.

156
Schmotter, J. W. (2004). A world of difference. Selections: The Magazine of the Graduate Management Admission Council, 4(1) 3.
Schoenfeld, G., & Bruce, G. D. (2005). School brand images and brand choices in MBA programs No. RR-05-10)Graduate Management Admission Council.
Shinn, S. (2005). How to hire. BizEd, November/December, 38.
Shinn, S. (2004a). Big payoffs. BizEd, May/June.
Shinn, S. (2004b) The B-school at company. BizEd, May/June, 32.
Sutton, T. P., & Bergerson, P. J. (2001). Faculty compensation systems: Impact on the quality of higher education. ERIC digest. ERIC Clearinghouse on Higher Education.
Syed, S. (2006). GMAC curriculum variation in MBA programs No. RR-06-03.
Thornton, S. (2006). The devaluing of higher education.
Trevino, R. L., Lertangtam, I., & Viera, N. (2004). Marketing plan for the naval postgraduate school master of business administration to the navy unrestricted line community.
Tyson, G. (2003).Deans talk about dollars. Selections: The Magazine of the Graduate Management Admission Council, 24.
Tyson, G. (2004).Management and the media. Selections: The Magazine of the Graduate Management Admission Council, 4(1), 17.
Tyson, G. (2002). Beyond cognitive testing. Selections: The Magazine of the Graduate Management Admission Council, 2(1), 31.
Tyson, G. (2001). A look behind the numbers. Selections: The Magazine of the Graduate Management Admission Council, 1(2), 8.
Westerbeck, T. (2004). Brave new world, bold new B-school. BizEd, July/August.

157
Wikipedia. (2007). Tenure. Retrieved 3-14-07, http://en.wikipedia.org/wiki/Tenure.
Wuorio, J. (2001). The impact of the rankings: Multiple perspectives. Selections: The Magazine of the Graduate Management Admission Council, 1(2),\ 28.
Zimmerman, J. (2001). Can American business schools survive? Bradley Research Policy Center.

158
THIS PAGE INTENTIONALLY LEFT BLANK

159
INITIAL DISTRIBUTION LIST
1. Defense Technical Information Center Ft. Belvoir, Virginia
2. Dudley Knox Library Naval Postgraduate School Monterey, California
Related Documents