NAVAL POSTGRADUATE SCHOOL Monterey, California THESIS Thesis V34235 DESIGN AND METHOD FOR THE EVALUATION OF THE COKING RESISTANCE OF SWIRL PLATES OF THE E-2C AIRCRAFT FUEL NOZZLES by Vassilios P. Vassiloyanakopoulos March 1 996 Thesis Advisor: J.Perkins Approved for public release; distribution is unlimited.

Welcome message from author
This document is posted to help you gain knowledge. Please leave a comment to let me know what you think about it! Share it to your friends and learn new things together.
Transcript
NAVAL POSTGRADUATE SCHOOLMonterey, California
THESIS
ThesisV34235
DESIGN AND METHOD FOR THE EVALUATIONOF THE COKING RESISTANCE OF SWIRLPLATES OF THE E-2C AIRCRAFT FUEL
NOZZLES
by
Vassilios P. Vassiloyanakopoulos
March 1 996
Thesis Advisor: J.Perkins
Approved for public release; distribution is unlimited.

DUDLEY KNOX LIBRARY
NAVAL POSTGRADUATESCHOOL
MONTEREY CA 93943-5101
REPORT DOCUMENTATION PAGE Form Approved OMB No. 07()4
Public reporting burden lor this collection ol information is estimated in average I hour per response, including the lime tor reviewing instruction, searching existing data
sources, gathering and maintaining the data needed, and completing and reviewing the collection ol information Send comments regarding this burden estimate or any other
.peel ol this collection ol information, including suggestions for reducing this burden, to Washington headquarters Services. Directorate lor Inlormaiiun Operations andReports. I 2 IS Jefferson Davis Highway. Suite 12(14. Arlington, VA 22202-431)2. and to the Office ol Management and Budget. Paperwork Reduction Protect (117(14-0 1 XX
I
Washington DC 2050.1
AGENCY USE ONLY (Leave blank) REPORT DATEMarch 1996
3. REPORT TYPE AND DATES COVEREDMaster's Thesis
4. TITLE AND SUBTITLE Design and method for the evaluation of the
coking resistance of swirl plates of the E-2C aircraft fuel nozzles
6. AUTHOR(S): Vassilios P Vassiloyanakopoulos
5. FUNDING NUMBERS
7. PERFORMING ORGANIZATION NAME(S) AND ADDRESS(ES)Naval Postgraduate School
Monterey CA 93943-5000
8 PERFORMING ORGANIZATIONREPORT NUMBER
9. SPONSORING/MONITORING AGENCY NAME(S) ANDADDRESS(ES)
10. SPONSORING/MONITORINGAGENCY REPORT NUMBER
1 1 . SUPPLEMENTARY NOTES The views expressed in this thesis are those of the author and do not reflect the official policy
or position of the Department of Defense or the U.S. Government.
12a. DISTRIBUTION/AVAILABILITY STATEMENT Approved for
public release; distribution is unlimited
12b. DISTRIBUTION CODE
ABSTRACT (maximum 200 words) The extensive coking observed on the swirl plates of the fuel nozzles of the E-2C
HAWKEYE aircraft is the initiative of this investigation Atesting ng reproducing the shut down procedure of the engine was
designed and a method for the evaluation of the resistance in coking for differnt types of swirl plates is presented The method
is based on measurements of weight increase and holes closure , and on microscopic examination. It can be applied to the
evaluation of any suggested modification of swirl plates in the future and provides the NAVY with a reliable easy to use and
modify experimental set-up able to produce comparative data. Results for two different types of swirl pltates with different
surface finish are presented, together with conclusions and comments arising from the experimental resulats and the design
process. Recommendations for future search objectives to the problem are also presented •
14. SUBJECT TERMS : Coking of swirl plates, surface finish, weight measurements,
hole's closure, oprical examination
15. NUMBER OF PAGES
123
16 PRICE CODE
7. SECURITYCLASSIFICATION OFREPORT
Unclassified
18 SECURITYCLASSIFICATIONOF THIS PAGE
Unclassified
19 SECURITYCLASSIFICATIONOF ABSTRACT
Unclassified
20. LIMITATION OF ABSTRACTUL
NSN 7540-0 1 -280-5500
2-89)
Standard Form 298 (Rev.
Prescribed by ANSI Sid 2.W-IX

Approved for public release; distribution is unlimited.
DESIGN AND METHOD FOR THE EVALUATION OF THE COKINGRESISTANCE OF SWIRL PLATES OF THE E-2C AIRCRAFT FUEL NOZZLES
Vassilios P. Vassiloyanakopoulos
Lieutenant Junior Grade, Hellenic Navy
B.S., Hellenic Naval Academy, 1989
Submitted in partial fulfillment
of the requirements for the degree of
MASTER OF SCIENCE IN MECHANICAL ENGINEERING
from the
NAVAL POSTGRADUATE SCHOOLMarch 1996

IV
DUDLEY KNOA lidivm^ i
Kl POSTGRADUATE SCHOOL
MONTEREY CA 93943-5101
ABSTRACT
The extensive coking observed on the swirl plates of the fuel nozzles of the E-2C
HAWKEYE aircraft is the initiative of this investigation. A testing rig reproducing the
shut down procedure of the engine was designed and a method for the evaluation of the
resistance in coking for different types of swirl plates is presented. The method is based
on measurements of weight increase and holes closure, and on microscopic examination.
It can be applied to the evaluation of any suggested modification of swirl plates in the
future and provides the NAVY with a reliable easy to use and modify experimental set-up
able to produce comparative data. Results for two different types of swirl plates with
different surface finish are presented, together with conclusions and comments arising
from the experimental results and the design process. Recommendations for future search
objectives relative to the problem are also presented.

VI
TABLE OF CONTENTS
I. INTRODUCTION 1
A. GENERAL 1
B. GAS TURBINES AND DEPOSITS 2
C. DEPOSITS ON SWIRL PLATES 4
D. BACKGROUND 9
E. OBJECTIVES 10
F. WEIGHT AND FLOW MEASUREMENTS 1
1
II. EXPERIMENTAL PROCEDURE 13
A. EXPERIMENATL SET-UP 13
B. DATA EXTRACTION 20
C. SAFETY FEATURES 25
III. RESULTS AND DISCUSSION 27
A. GENERAL 27
B. WEIGHT MEASUREMENTS 27
C. OPTICAL MICROSCOPY EXAMINATION 32
D. SEM EXAMINATION 52
E. FLOW - CLOSURE OF HOLES MEASUREMENTS 67
IV. CONCLUSIONS AND RECOMMENDATIONS 73
A. CONCLUSIONS 73
B. RECOMMENDATIONS 75
APPENDIX A: CORROSION AND DEPOSITS IN GAS TURBINES 77
APPENDIX B: CHEMICAL FACTORS 81
Vll

APPENDIX C: COATED SWIRL PLATES SUGGESTION 85
APPENDIX D: ISENTROPIC FLOW AND FLOW MEASUREMENTS 89
APPENDIX E: COMPUTER PROGRAMMING DESCRIPTION 97
APPENDIX F: PRINCIPLES FOR A PROPOSED GRADING SYSTEM
ON THE COKING RESISTANCE OF SWIRL PLATES 103
LIST OF REFERENCES 107
INITIAL DISTRIBUTION LIST 109
Vlll
LIST OF FIGURES
1
.
Physical factors participating in the deposition accumulation 4
2. Schematic of dual fuel nozzle 5
3. Side view of the dual fuel nozzle- Schematic of the swirl plate 6
4.Temperature-Time profile of the swirl plates at the soak back conditions 8
5. Schematic of the experimental set up for the Nozzle Project 14
6. Schematic of the data flow in the control program used 17
7. Temperature- Time profile for the swirl plates in 30 min. cycles 18
8. Temperature- Time profile obtained from the testing rig
(repeatable cycles) 19
9. Schematic of the "positions" of the swirl plate 21
10. Schematic of the flow measurements experimental set-up 22
1 1. Calibration curve of pressure transducer 24
12. Weight increase vs. cycles performed for A22 and A'26 29
1 3. Weight increase vs. cycles performed for A27 and B 1 8 3
1
14. Optical picture 1 2 o' clock, 80 cycles, A'26 (a) and A22 (b) 34
15. Optical picture 3 o
16. Optical picture 3 o
17. Optical picture 3 o
18. Optical picture 3 o
19. Optical picture 3 o
20. Optical picture 3 o
21. Optical picture 3 o
clock, 80 cycles, A'26 (a) and A22 (b) 35
clock, virgin, B18 (a) and A27 (b) 36
clock, 25 cycles, B18 (a) and A27 (b) 37
clock, 50 cycles, B 18 (a) and A27 (b) 38
clock, 75 cycles, B18 (a) and A27 (b) 39
clock, 100 cycles, B18 (a) and A27 (b) 40
clock, 125 cycles, B18 (a) and A27 (b) 41
22. Optical picture 3 o' clock, 1 50 cycles, B 1 8 (a) and A27 (b) 42
IX
23. Optical picture 6 o' clock, virgin , B 18 (a) and A27 (b) 43
24. Optical picture 6 o' clock, 25 cycles, B 18 (a) and A27 (b) 44
25. Optical picture 6 o' clock 50 cycles, B 1 8 (a) and A27 (b) 45
26. Optical picture 6 o' clock, 75 cycles, B 1 8 (a) and A27 (b) 46
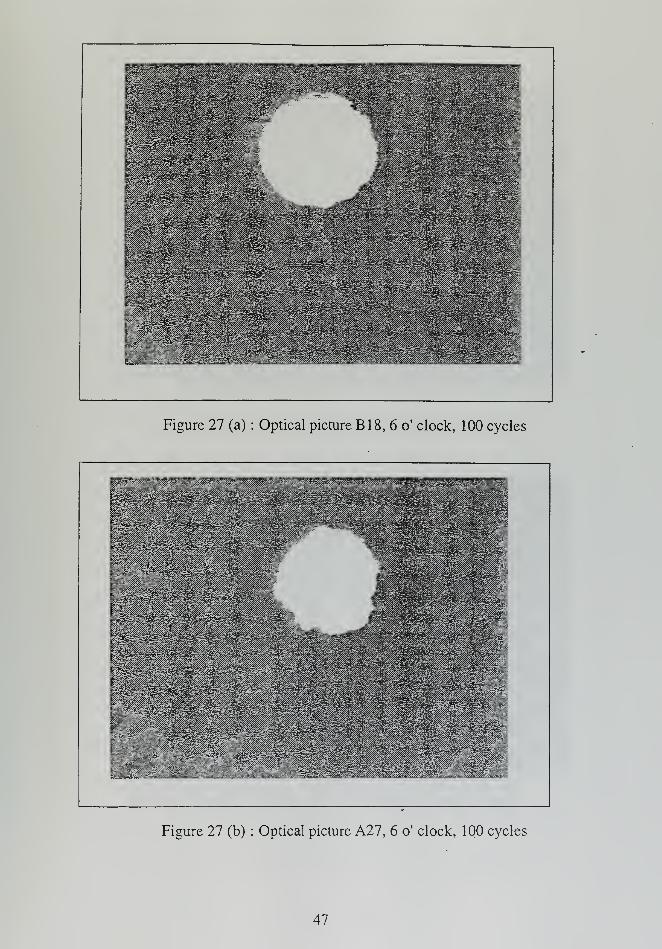
27. Optical picture 6 o' clock, 100 cycles, B 18 (a) and A27 (b) 47
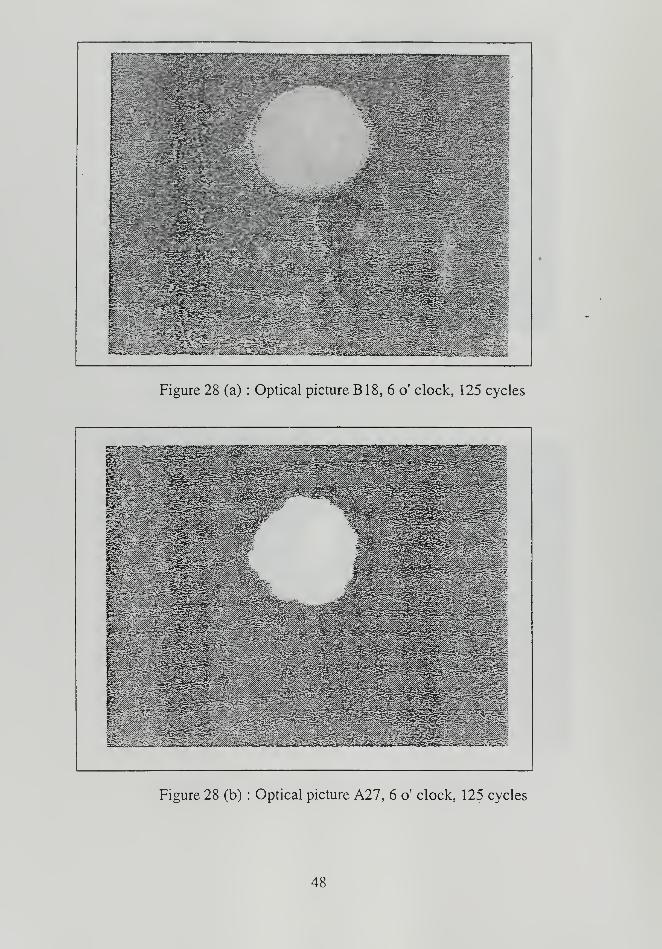
28. Optical picture 6 o' clock, 125 cycles, B 18 (a) and A27 (b) 48
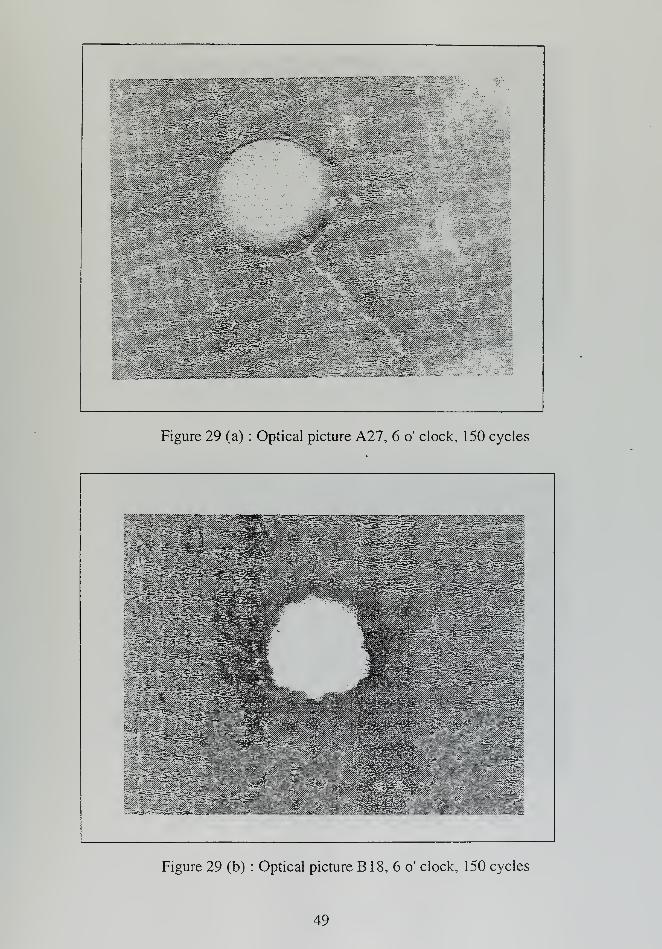
29 Optical picture 6 o' clock, 1 50 cycles, B 1 8 (a) and A27 (b) 49
30. Optical picture 2 o' clock 75 cycles A27 50
31. Optical picture 2 o' clock 100 cycles A27 50
32. Optical picture 2 o' clock 125 cycles A27 51
33. Optical picture 2 o' clock 150 cycles A27 51
34. SEM picture 12 o' clock, virgin A22 (a) and A'26 (b) 54
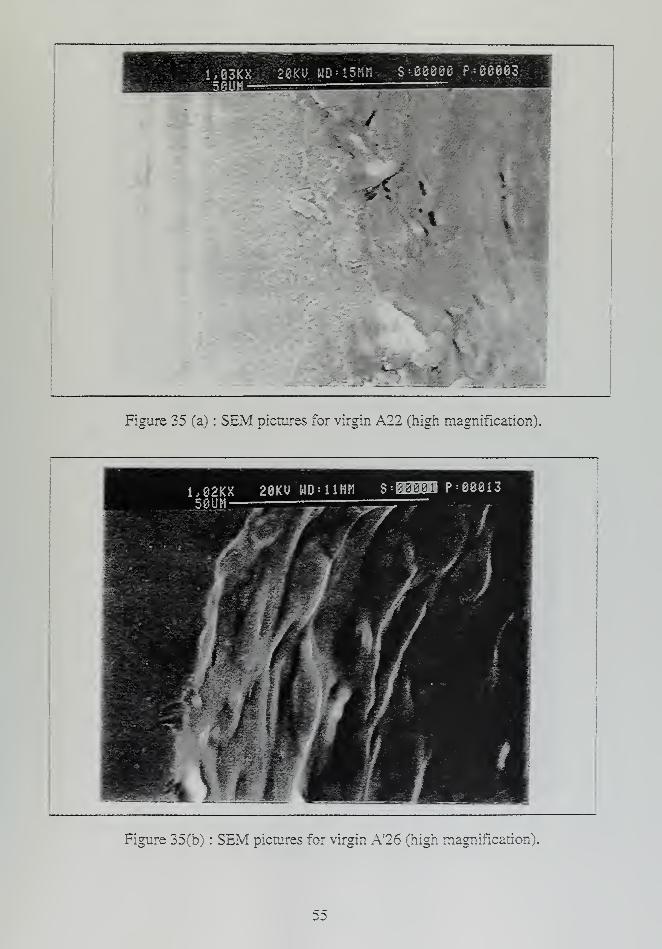
35. SEM picture 12 o' clock, virgin A22 (a) and A'26( b)
(high magnification) 55
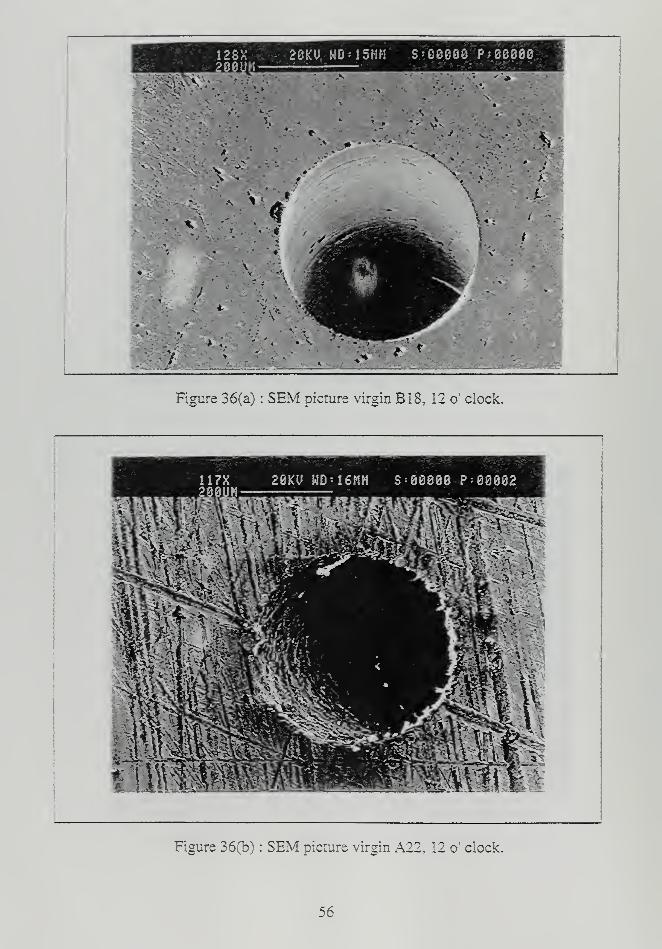
36. SEM picture 12 o' clock, virgin B18 (a) and A22 (b) 56
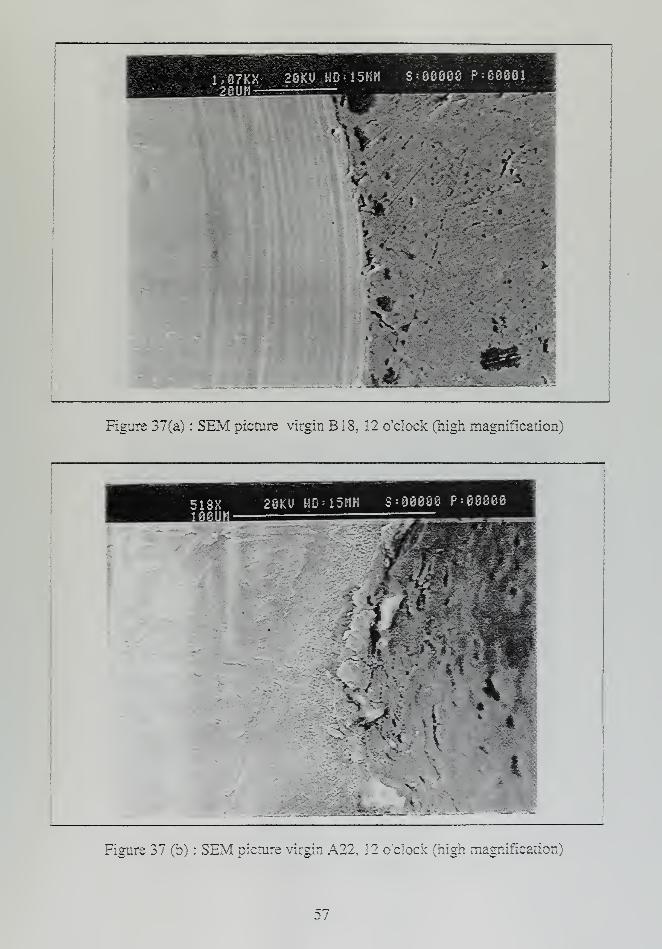
37. SEM picture 12 o' clock, virgin B 18 (a) and A22 (b)
(high magnification) 57
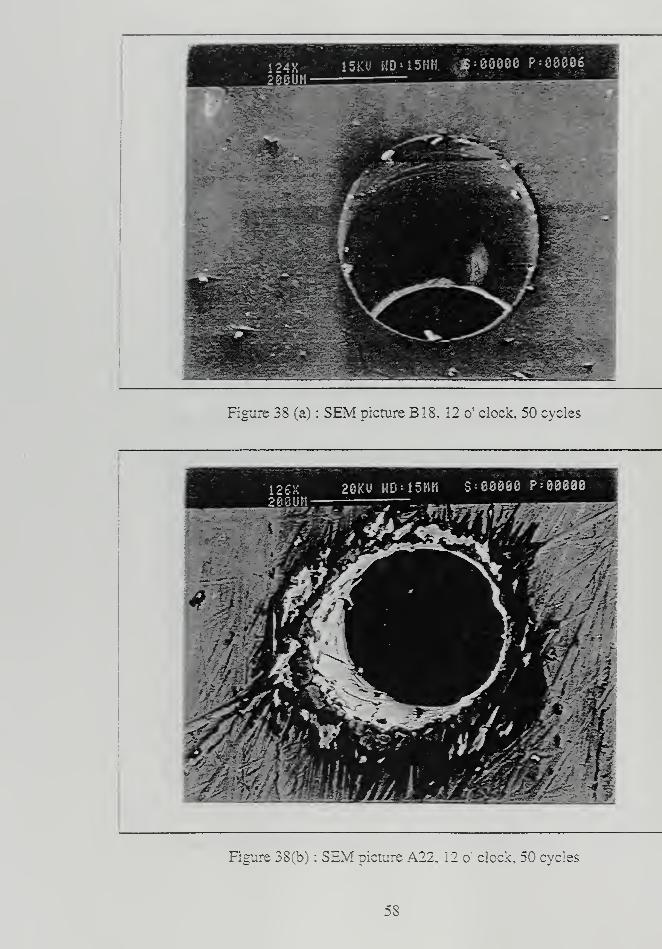
38. SEM picture 12 o' clock, 50 cycles, B 18 (a) and A22 (b) 58
39. SEM picture 12 o'clock, 100 cycles, B 18 (a) and A22 (b) 59
40. SEM picture 12 o'clock, 150 cycles, B 18 (a) and A22 (b) 60
41. SEM picture 3 o'clock, 50 cycles, B 18 (a) and A22 (b) 61
42. SEM picture 3 o' clock, 100 cycles, B 18 (a) and A22 (b) 62
43. SEM picture 3 o' clock, 150 cycles, B 18 (a) and A22 (b) 63
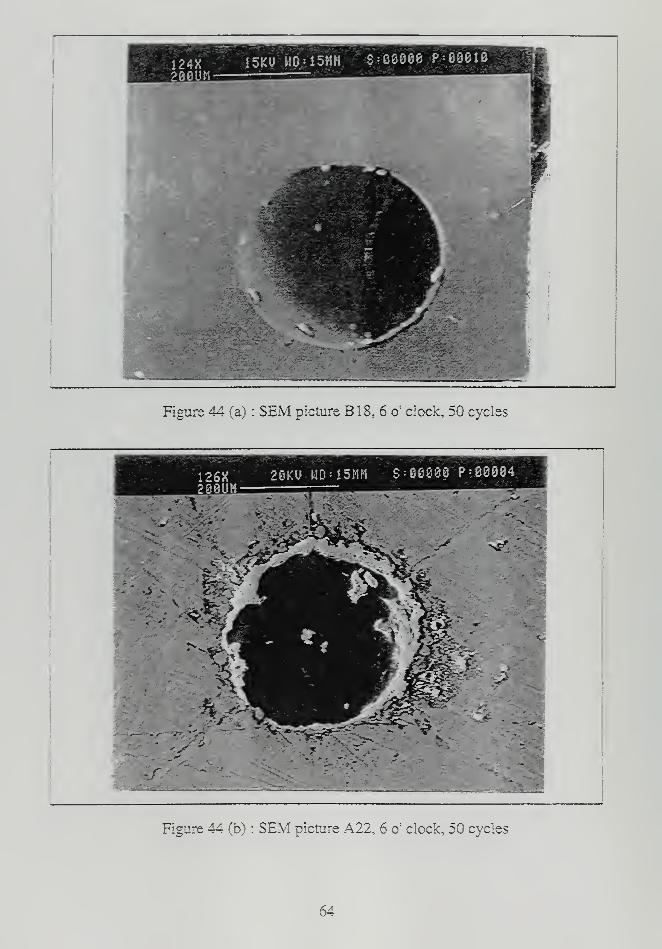
44. SEM picture 6 o'clock, 50 cycles, B18 (a) and A22 (b) 64
45. SEM picture 3 o' clock, 100 cycles, B 18 (a) and A22 (b) 65
46. SEM picture 3 o' clock, 1 50 cycles, B 1 8 (a) and A22 (b) 66
47. Flow characteristic curves for A22 swirl plate 68
48. Flow characteristic curves for B 1 8 swirl plate 69
49. Average percentage hole closure of swirl plates vs. cycles performed... 7
1
50. Schematic representation of a Jet Engine 77
51 Deposition on combustion chamber 79
52. Rate of deposits accumulation in gas turbines burning Bunker C fuel... 80
53. How coke forms (Heat break up followed by molecular growth from
fragments 86
54. Coke does not grow if fragments can disperse 86
55. Surface microcavities contain fragments and permit coke to grow 87
56 Sulfur or oxygen in fluid react with the metal atoms to form
surface microcavities 87
57. GE's suggestion of coating film on the surface 88
58. Compressible flow through a duct (a) real fluid velocity, (b) one
dimensional approximation 89
59. Area ratio vs. Mach number for isentropic flow of a perfect gas
withk=1.4 91
60. Various pressure and Mach number configurations for flow through
a nozzle 92
61. Area ratio vs. Mach number for subsonic flow 92
62. Operation of converging nozzle: (a) nozzle geometry, (b) pressure
distribution and (c) mass flow vs. back pressure 93
63. Schematic of operational principle of flow meter 95
64. Operation of coils in the flow meter 96
XI

65. Schematic of the progarmme used in controlling the
furnace 97
66. Schematic of the data display screen 100
67. Temperature- Time profile for the swirl plates and the furnace 101
xn
I. INTRODUCTION
A. GENERAL
The U.S.NAVAIR is currently investigating a major problem experienced in the
T56-A-427 turbine engine types of Allison Engine Co. The engine has been used in the
NAVY E-2C (HAWKEYE) aircraft since 1987 [Ref. I]. Fuel coking was evident on the
swirl plates of the fuel nozzles in engines operating with JP5 fuel. Some of the swirl plates
have been reported to become severely plugged with coke, and so they had to be
immediately replaced [Ref. 2]. Investigation of the problem has shown that coking occurs
at significant rates when the fuel nozzle interiors are subjected to temperatures above
320F during thermal soak back. This condition occurs within seconds of shut down from
High Speed Ground Idle (HSGI) in which case the temperature remains within the range
350-400F for approximately 30-50 minutes [Ref. 31. The most annoying fact in the
described situation is that the cycle for refurbishing of the fuel nozzles is less than a tenth
(10%) of the operational limit set by the US Navy at the range of 3000 hours [Ref. 3, 4].
A statistical study performed by Allison has shown that at least one swirl plate will be
blocked in 30 % of the operated engines after 200 hours and this percentage rises to up to
80% for 800 hours [Ref. 5|. As can be understood, this situation results to severe
demands on maintenance support and is crucial for the effectiveness of the turbine and the
availability and operational ability of the aircraft. The Navy is looking for the most reliable
and economic solution to face this problem, since E-2C still remains the major early
warning and control aircraft of the US Navy and represents an important unit on aircraft
carriers [Ref. 1J.
1

B. GAS TURBINES AND DEPOSITS
The general problem of coking depositions in gas turbines, as well as in boilers, is
not new. Numerous studies have already been submitted over the past four decades, in an
attempt to explain the problem and suggest solutions. Most of these studies were
concerned with the chemical reactions forming depositions. These reactions, prove to be
very complex, so that quite different results have been obtained from different studies.
A description of the problem of the coking is given in [Ref. 6J. According to this
study, deposits in gas turbines go hand in hand with corrosion, while also upsetting the
aerodynamic condition in the case of gases required to translate to kinetic energy and How
conditions through the swirl plates. Three major factors are considered to be involved in
the formation of deposits :
1
.
Temperature of metal and gas stream.
2. Composition of substances in contact with the metal surfaces and the nature of
these surfaces.
3. Aerodynamic considerations, involving gas and particle velocity and size
consist of deposited particles.
These problematic factors have been proved already severe enough in themselves
to have taxed the capabilities of engineers and chemists for the past decades. Although
advances have been made in understanding a few of the complex chemical and physical
relationships involved, the overall problem still needs complete solution, as deposits in gas
turbines continue to cause problems in the efficiency and maintenance of these devices.
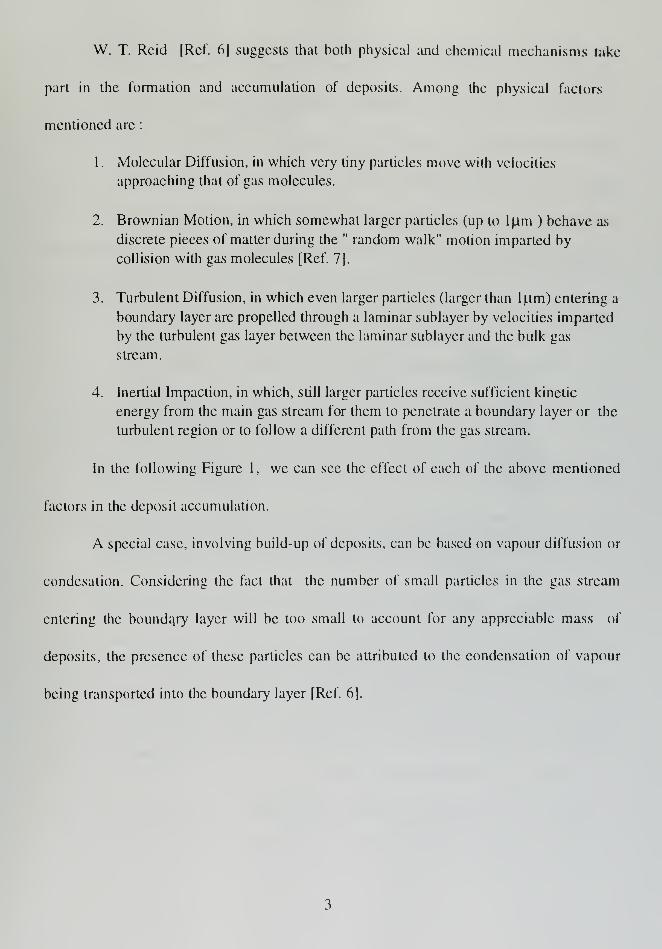
W. T. Reid [Rcf. 6] suggests that both physical and chemical mechanisms take
part in the formation and accumulation of deposits. Among the physical factors
mentioned are :
1
.
Molecular Diffusion, in which very tiny particles move with velocities
approaching that of gas molecules.
2. Brownian Motion, in which somewhat larger particles (up to ljim ) behave as
discrete pieces of matter during the " random walk" motion imparted by
collision with gas molecules [Ref. 7].
3. Turbulent Diffusion, in which even larger particles (larger than ljum) entering a
boundary layer are propelled through a laminar sublayer by velocities imparted
by the turbulent gas layer between the laminar sublayer and the bulk gas
stream.
4. Inertial Impaction, in which, still larger particles receive sufficient kinetic
energy from the main gas stream for them to penetrate a boundary layer or the
turbulent region or to follow a different path from the gas stream.
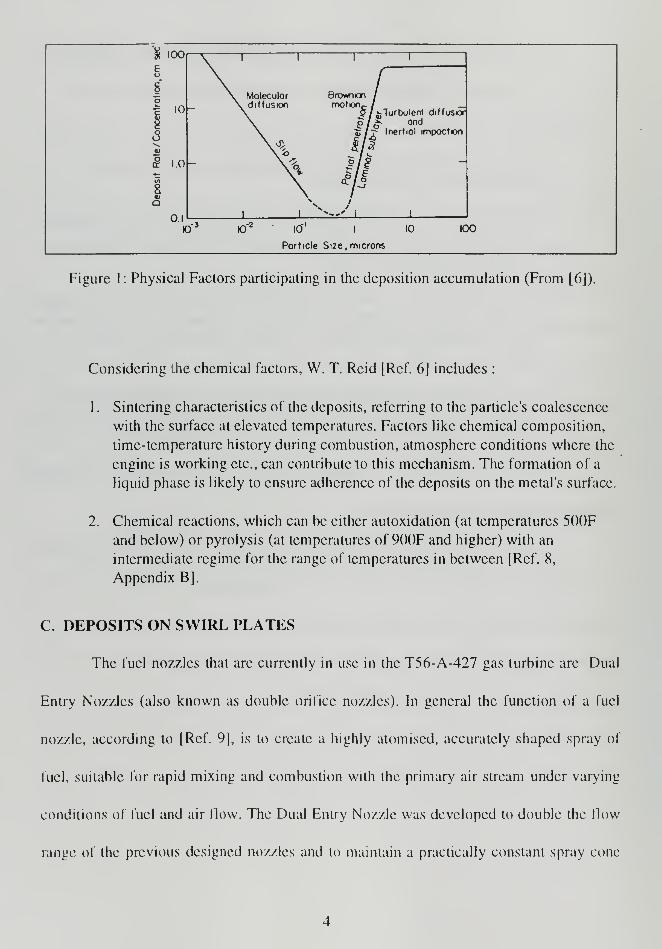
In the following Figure 1, we can see the effect of each of the above mentioned
factors in the deposit accumulation.
A special case, involving build-up of deposits, can be based on vapour diffusion or
condensation. Considering the fact that the number of small particles in the gas stream
entering the boundary layer will be too small to account for any appreciable mass of
deposits, the presence of these particles can be attributed to the condensation of vapour
being transported into the boundary layer [Ref. 6].
ft 1001 1 1 1
E>, /
8 \ Moleculor Brov*iiori /O
1 l0 \ diffusion motav / _\ * /»> Turbulent diffusior
8 \ P/o" onc*
ooV
\ t IT loertiol impocton
1 1.0 V& $ §5> \ a. 1 °a \ 10) \ J
01-3
I03
K)"2
10"' 1 10 100
Particle Size, microns
Figure 1: Physical Factors participating in the deposition accumulation (From [6J).
Considering the chemical factors, W. T. Reid [Rcf. 6] includes :
1
.
Sintering characteristics of the deposits, referring to the particle's coalescence
with the surface at elevated temperatures. Factors like chemical composition,
time-temperature history during combustion, atmosphere conditions where the
engine is working etc., can contribute "to this mechanism. The formation of a
liquid phase is likely to ensure adherence of the deposits on the metal's surface.
2. Chemical reactions, which can be either autoxidation (at temperatures 500F
and below) or pyrolysis (at temperatures of 900F and higher) with an
intermediate regime for the range of temperatures in between [Ref. 8,
Appendix B].
C. DEPOSITS ON SWIRL PLATES
The fuel nozzles that are currently in use in the T56-A-427 gas turbine arc Dual
Entry Nozzles (also known as double orifice nozzles). In general the function o\ a fuel
nozzle, according to [Rcf. 91, is to create a highly atomised, accurately shaped spray of
fuel, suitable for rapid mixing and combustion with the primary air stream under varying
conditions of fuel and air How. The Dual Entry Nozzle was developed to double the How
range of the previous designed nozzles and to maintain a practically constant spray cone
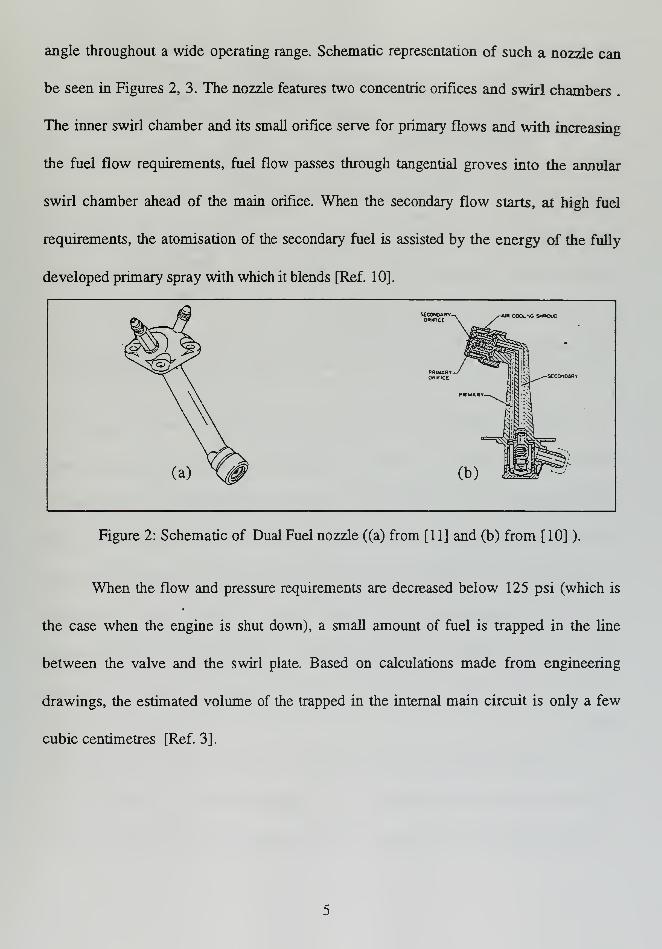
angle throughout a wide operating range. Schematic representation of such a nozzle can
be seen in Figures 2, 3. The nozzle features two concentric orifices and swirl chambers .
The inner swirl chamber and its small orifice serve for primary flows and with increasing
the fuel flow requirements, fuel flow passes through tangential groves into the annular
swirl chamber ahead of the main orifice. When the secondary flow starts, at high fuel
requirements, the atomisation of the secondary fuel is assisted by the energy of the fully
developed primary spray with which it blends [Ref. 10].
n co(x-«g sxouo
j*;j ^^^-secoNOAR*
Figure 2: Schematic of Dual Fuel nozzle ((a) from [11] and (b) from [10] ).
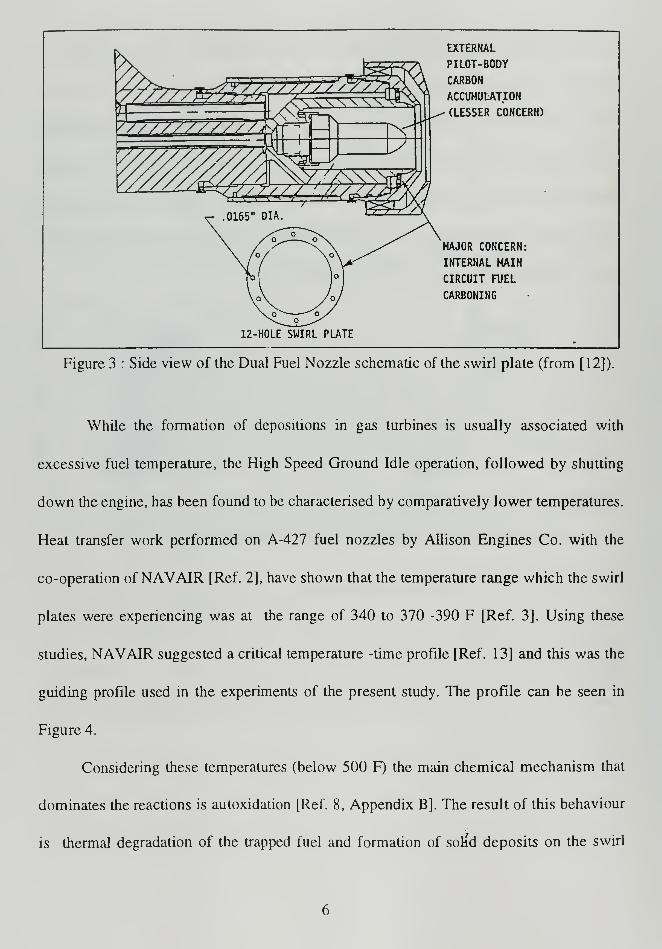
When the flow and pressure requirements are decreased below 125 psi (which is
the case when the engine is shut down), a small amount of fuel is trapped in the line
between the valve and the swirl plate. Based on calculations made from engineering
drawings, the estimated volume of the trapped in the internal main circuit is only a few
cubic centimetres [Ref. 3].
y&k"zal
12-HOLE SWIRL PLATE
EXTERNAL
PILOT-BODY
CARBON
ACCUMULATION
• (LESSER CONCERN)
MAJOR CONCERN:
INTERNAL MAIN
CIRCUIT FUEL
CARBONING
Figure 3 : Side view of the Dual Fuel Nozzle schematic of the swirl plate (from [12]).
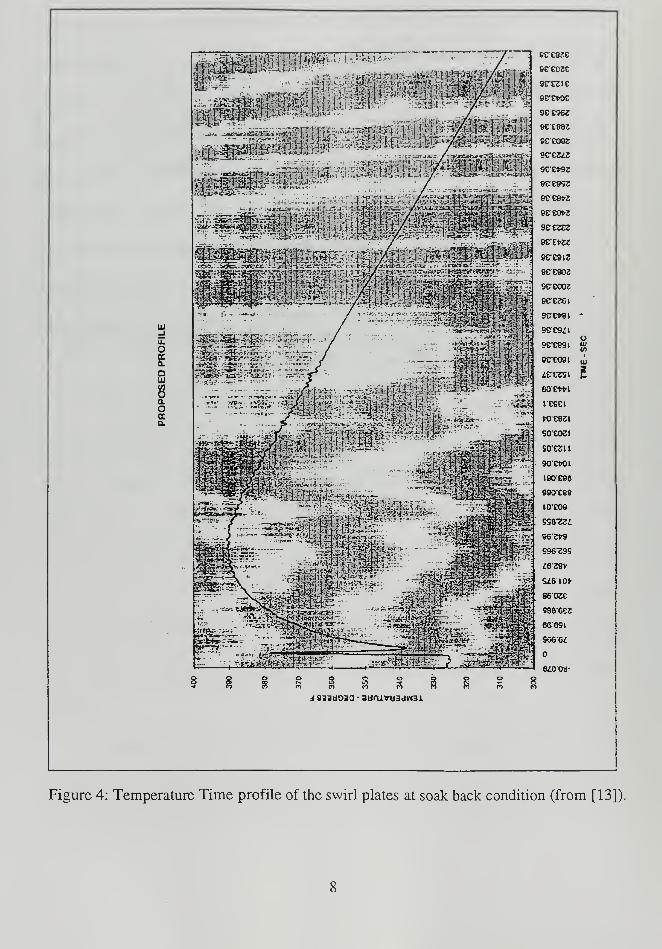
While the formation of depositions in gas turbines is usually associated with
excessive fuel temperature, the High Speed Ground Idle operation, followed by shutting
down the engine, has been found to be characterised by comparatively lower temperatures.
Heat transfer work performed on A-427 fuel nozzles by Allison Engines Co. with the
co-operation of NAVAIR [Ref. 2], have shown that the temperature range which the swirl
plates were experiencing was at the range of 340 to 370 -390 F [Ref. 3]. Using these
studies, NAVAIR suggested a critical temperature -time profile [Ref. 13] and this was the
guiding profile used in the experiments of the present study. The profile can be seen in
Figure 4.
Considering these temperatures (below 500 F) the main chemical mechanism that
dominates the reactions is autoxidation [Ref. 8, Appendix B]. The result of this behaviour
is thermal degradation of the trapped fuel and formation of solid deposits on the swirl

plates . According to Prof. Crooks [Ref. 3] the process of formation of these deposits is
known to be enhanced by the presence of copper ions and oxygen, resulting in the
formation of what are conveniently classified as "gums ". According to [Ref. 14], gums
are high molecular weight compounds containing hydrogen, carbon, oxygen and usually
sulfur and nitrogen. They may occur in refined fuels in either soluble or insoluble forms.
The soluble forms are expected to cause trouble when thin film of fuel is exposed to air.
This fuel then, evaporates, leaving gum deposits [Ref. 3]. Although fuel specifications do
not differentiate, between soluble and insoluble gums, they do limit the existence and
occasionally the potential, of gums [Ref. 14, 15]. The gums observed on the swirl plates
were soluble in organic solvents such as heptane or acetone.
o
otu
DL
OECa
4 saidoaa
-
auruv«3dW3i
Figure 4: Temperature Time profile of the swirl plates at soak back condition (from [13]).
D. BACKGROUND
In the attempt to find a solution to the problem several ideas have been presented
which can be summarised as follows:
1. The adoption of Low Speed Ground Idle (LSGI) as a shutdown procedure wasinitially proposed as an interim solution. This approach has somedisantvantages from a safety standpoint, especially in the case of aircraft
carriers. It is always preferable to shut off the engine and halt propeller motion
as soon as possible after landing on the carrier deck, rather than using a
cooling down period, such as the LSGI shutdown procedure [Ref. 3]. Despite
this limitation, since LSGI shutdown has been proved to be effective in
decreasing the amount of depositions, it is currently used as an interim
procedure as the search for a more permanent solution is continued.
2. The use of a Purge System (Low Pressure Fuel Purge System), to expel with
air pressure the trapped fuel before the swirl plates [Ref. 16]. The system was
suggested by the manufacturer Allison Engine Co., but has not been adopted
by the NAVY due to the enormous cost of its maintenance, an expected
increase in the weight of the aircraft, and the time required to be installed [Ref.
4, 17].
3. The use of different types of swirl plates, than those already in use. The
standard swirl plates manufactured by Parker Co., are made from Type 347
stainless steel. In our studies these are termed as A type; they do not have any
special surface finish treatment. Proposed solutions include the following
improved types of swirl plates that would hopefully proved to be more
effective in resisting coking accumulation than the A type:
a) The A' type with polished surface (using a 30 micron finish, performed by
Allison).
b) The B type with polished surface and polished holes surface ( by Du Pont).
Coated swirl plates which are swirl plates coated with a thin protective film of
Ta^ or a ceramic coating. A more detailed description of this kind of swirl plates with
information related to their production is given in Appendix C. [Ref. 12, 18, 3]. These
three types of swirl plates are in accordance with the suggestion of Prof. Roy Crooks
based on the concept that coking problems in general may be alleviated by improvement
in surface finish and the use of coating films resistant to the adhesion of coke [Ref. 3].
E. OBJECTIVES
The objectives of this project can be summarised as follows:
1
.
To design a testing rig that would be used to simulate the soak back condition
that the gas turbine experiences as soon as the normal shut down is performed.
The test rig must be able to work for two different swirl plates at the same time
so that a comparison under the same conditions to be possible.
2. To provide NAVAIR with the respective experimental data, concerning
deposits accumulation rate and the effect that these depositions have in the
swirl plates performance, as far as the holes closure concerns
3. To perform optical and SEM investigation on the swirl plates in order to get
comparative data between swirl plates of different types.
The success in achieving these objectives will provide the NAVY with a safe easy
to use and modify experimental set-up, one that can be used to justify the degree of
effectiveness of all kind of similar with above mentioned suggestions. With the appropriate
data available and easily reproducible the Navy will have an additional guide for the
optimum solution.
It should be mentioned that the problem of coking of swirl plates includes many
parameters which could alter the data obtained according to the focus of the investigation.
In this project the focus was in determining the effect that the surface finish of the swirl
plates has upon the amount of coking and the closure of holes. The temperature - time
profile was kept constant, as was the fuel used (JP 5) and the amount of air in the rig (no
ventilation method was used). By changing any of these other major parameters, data
could be obtained according to a different focus of interest.
10
F. WEIGHT AND FLOW MEASUREMENTS
An effective way to measure the deposition rate accumulated on the different types
of swirl plates was to measure the increase in their weight, namely by performing a
periodic measurement. In order to measure closure of the swirl plates holes due to the
deposits, which is very important for the fuel flow through them, a safe way is to perform
a flow measurement of a gas passed through the nozzles, with an accurate flow meter
calibrated to work for this specific gas. For this calculation, the isentropic flow model is
adopted.
In general, frictionless adiabatic or isentropic flow is an ideal that cannot be
reached in the flow of real gases. It can be approached, however, in flow through
transition, nozzles and venturi meters, where friction effects are minor owing to the short
distances travelled, and heat transfer is minor because the changes that a particle (air
molecules) undergoes are slow enough to keep the velocity and temperature gradients
small [Ref. 19].
Adopting the isentropic flow model we get:
For the gas mass flow rate m = pSv (1) where
m : mass flow rate
p : density of gas
S : area through which the gas flows
v : velocity of gas stream
11
Considering ideal gas p = ^ (2) where
P : pressure of gas (gage)
R : gas constant
T : temperature
From ( 1 ) and (2) and considering that the speed of sound is a = JyRT (3)
we get 2 = PQ)J& (4) (y=rv MS)
For the pressures and temperatures measured at a specific point we get
T = 7T1+T-M2] (6)
P =P[l+&-M2£] (7)
where the '0' subscript denotes stagnation values
Finally we get f = j^JJ[\ + y-j-M2^} (8)
In our case, while the air is passing through the swirl plates holes, we can assume
sonic flow (M=l) following the similarity with the case of the nozzle neck (Appendix D).
By denoting the area of the holes of the virgin swirl plate by Sj and for the used
swirl plate, after 1,2,3... experimental cycles performed, by SI, S2, S3..., we can calculate
the average closure of the swirl plate's holes.
The percent average closure after the completion of thej
lh
cycle for the different
types of swirl plates will be:
^ = ^•100 (9) J=l,2,3....
12
II. EXPERIMENTAL PROCEDURE
A. EXPERIMENTAL SET-UP
Maxwell Smith [Ref. 15] reasonably suggests that in regard to aviation the research
has kept ahead of demand in the matter of quality. Development work of this kind, to be
successful, is entirely dependent on the availability of means in order to predict or even
better determine whether the new products will give satisfactory performance. By using
test rigs, full scale engine bench tests or flight trials can be avoided. Rigs can be located in
laboratories where necessary research personnel and analytical equipment are ready to
hand. Also, they can be operated twenty four hours a day, seven days a week and get
results more quickly [Ref. 15].
The design concept was to reproduce actual soak back conditions for the fuel on
the swirl plates by simulating the suggested temperature-time profile. The original test rig,
designed by Professor Roy Crooks of the Naval Postgraduate School [Ref. 3], provided
the basis for design of a new nozzle test rig. The factors that lead to the need for a new
design were safety factors and the attempt to follow the temperature-time profile with a
more easy to use furnace, instead of the oven that had been previously used. The
experimental set-up includes the following:
1. A box furnace (220V of NEY Co., series II model 2-525)
2. Two fuel pumps (Zippettes ) activated with attached relays
3. Two three way valves controlled by two regulators (WHITEY)
4. Two, Dual Entry Fuel Injection Nozzles
13
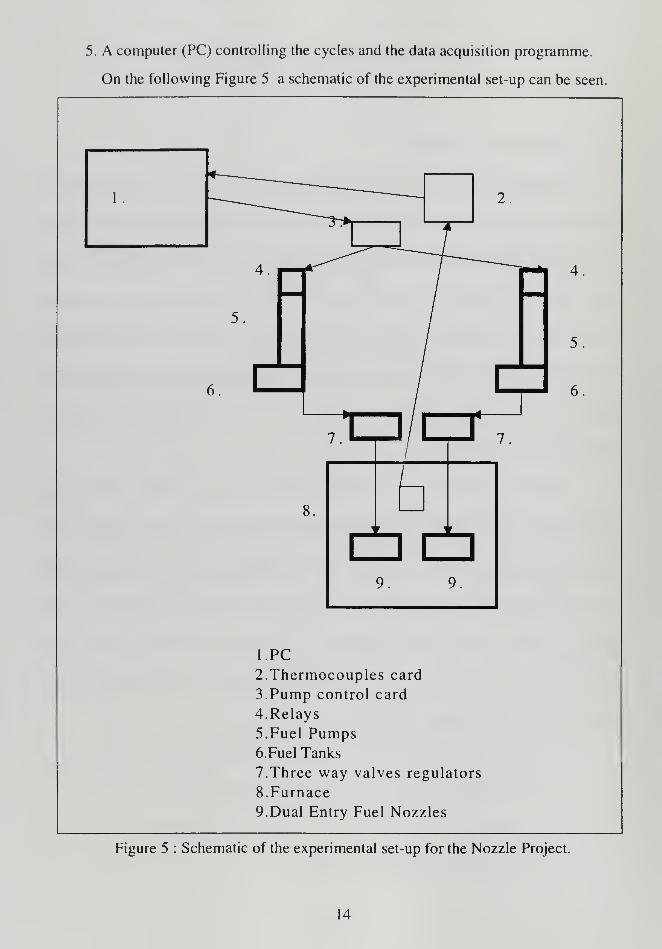
5. A computer (PC) controlling the cycles and the data acquisition programme.
On the following Figure 5 a schematic of the experimental set-up can be seen.
l.PC
2. Thermocouples card
3.Pump control card
4. Relays
5. Fuel Pumps6.Fuel Tanks
7. Three way valves regulators
8. Furnace
9. Dual Entry Fuel Nozzles
Figure 5 : Schematic of the experimental set-up for the Nozzle Project.
14

The data acquisition programme allows the user to view on the screen the
following parameters of the cycle operation :
1
.
The temperature of each of the swirl plates and of the furnace from the
respectively attached thermocouples.
2. The time and the number of cycles that the program is at any instant (time
measured in seconds).
3. The temperature time profile of the swirl plates. Additionally the values of the
temperature measured by the thermocouples are saved and transferred in
separate files, that can be retrieved for the control of the temperature time
profile.
The system is designed to cycle automatically while monitored and regulated by
the computer through the LABTECH NOTEBOOK package [Ref. 20]. This package
includes Block Menus which are control functions available to the user so that by
changing the parameters in them, they can be used for different applications. The Icon
View is an additional feature offered in order to have a schematic representation of the
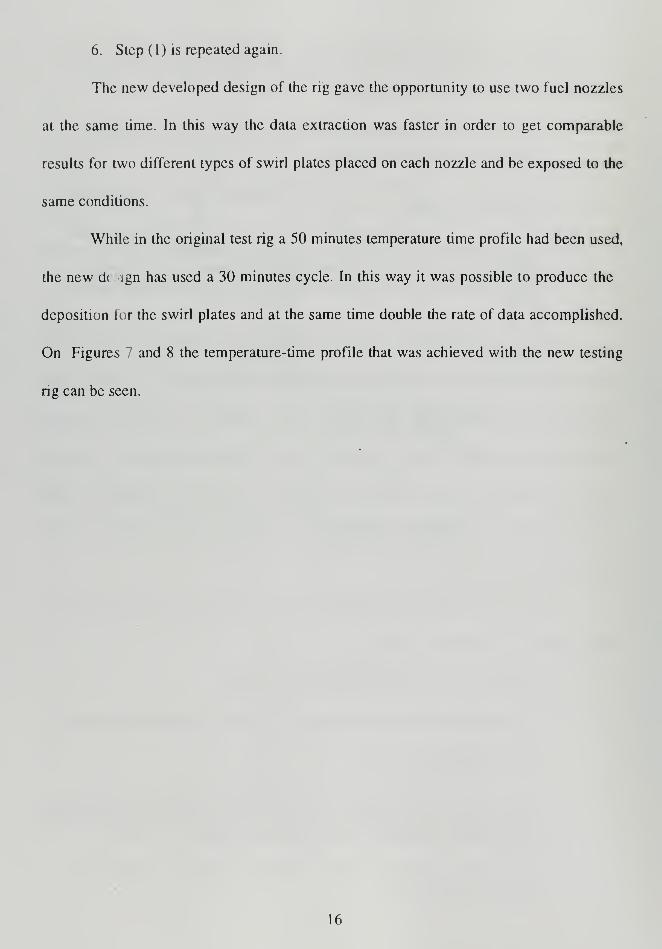
program written, with a data flow of the program. A schematic of the program used in the
application can be seen in Figure 6.
As currently configured, each cycle consists of the following events in order to
simulate the actual soak-back conditions:
1
.
The three way valve to the simulator nozzle opens.
2. A fixed quantity of fuel is injected into the fuel line and drains into the nozzle.
3. The valve closes.
4. The simulator nozzle is heated to normal operating conditions which for the
swirl plate temperature refer to 370 to 380 F. The suggested profile determines
the rate of the temperature increase of the swirl plates.
5. The simulator nozzles are cooled to 350F again following a cooling rate
suggested by the profile.
15
6. Step (1) is repeated again.
The new developed design of the rig gave the opportunity to use two fuel nozzles
at the same time. In this way the data extraction was faster in order to get comparable
results for two different types of swirl plates placed on each nozzle and be exposed to the
same conditions.
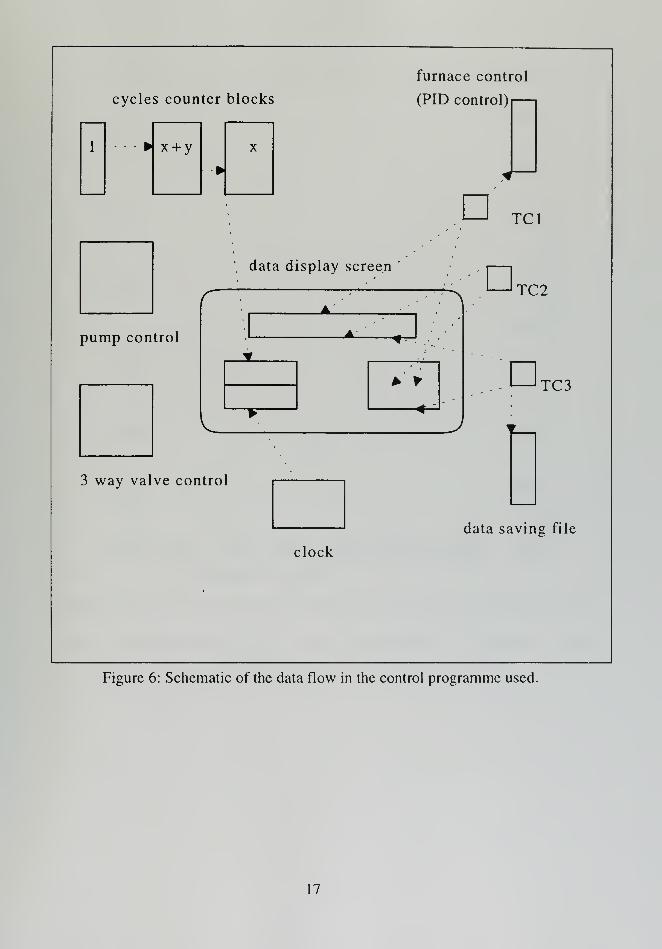
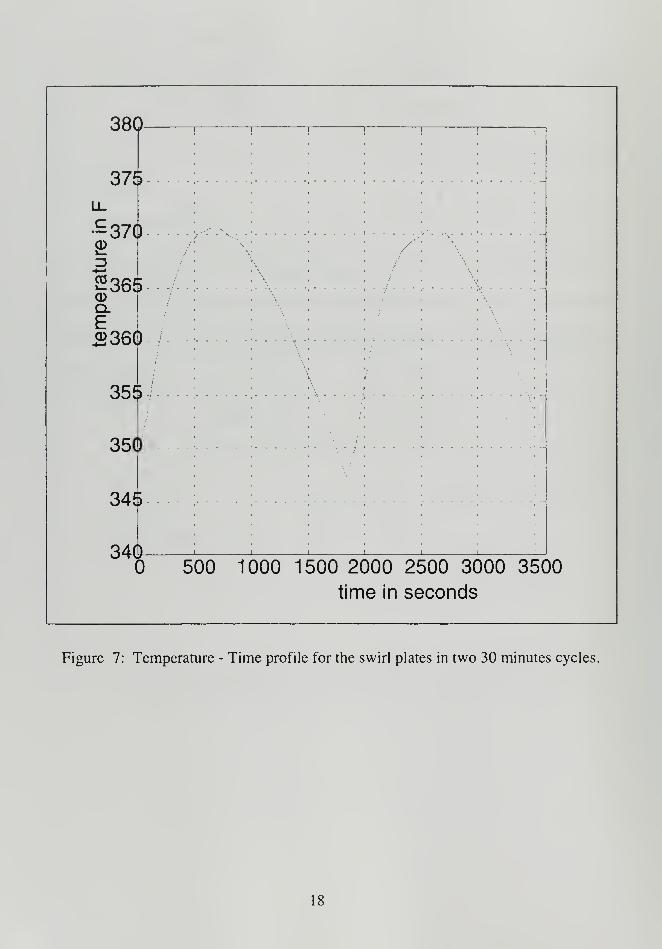
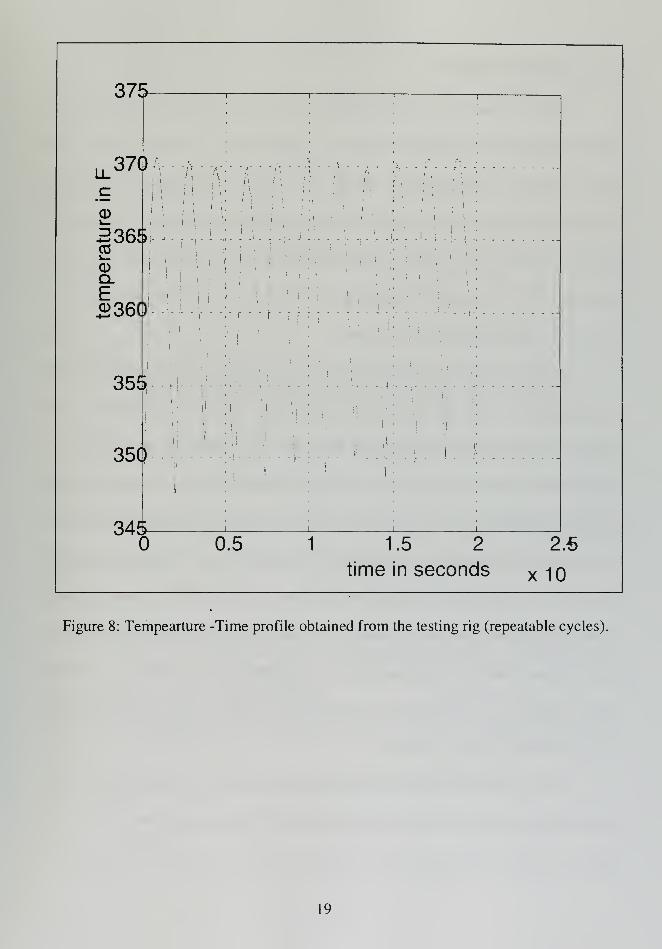
While in the original test rig a 50 minutes temperature time profile had been used,
the new d< jgn has used a 30 minutes cycle. In this way it was possible to produce the
deposition lor the swirl plates and at the same time double the rate of data accomplished.
On Figures 7 and 8 the temperature-time profile that was achieved with the new testing
rig can be seen.
16
cycles counter blocks
furnace control
(PID control)
1 - - x + y
>X
TCI
,data display screen
pump control
A :
*- *
TC2
—*-
TC3
3 way valve control
data saving file
clock
Figure 6: Schematic of the data flow in the control programme used.
17
380
371
LL
•g 37(CD
|36£Q.E.S>36(
35f
35(
34!
34C
ri
f
)V
t. . . ., - .
\ /'
)
j
f -7
)
;
*
)i
(3 500 1000 1500 2000 2500 3000 35(
time in seconds
)0
Figure 7: Temperature - Time profile for the swirl plates in two 30 minutes cycles.
375
CD
336$COv.CDQlE£360
355
350
345
[I--
||-
II II
i
j j
0.5
:
1 1.5 2
time in seconds
2.5
x10
Figure 8: Tempearture -Time profile obtained from the testing rig (repeatable cycles).
19
B. DATA EXTRACTION
Weight measurements: Every 25 cycles (or every 12.5 hours of rig's operation),
both swirl plates had been carefully weighted in an METTLER AT balance apparatus. The
results were then compared with the initial weight of the virgin (unused swirl plates).
According to this data, plots of weight with respect to the cycles performed (which can be
directly associated with the same number of shut downs of the engine), was able to be
produced and so give results comparable to the rate of accumulation of deposits in
between the different types of the swirl plates.
Optical Microscopy Examination: In order to be able to recognise the swirl plates
holes position, so as to explore whether the positioning of the hole is important in the
coking accumulation, a nomenclature has been followed to distinct the several holes. A
notch on the surface of the swirl plate was used to indicate the 12 o' clock position and
similarly the 3, 6, 9 o' clock positions were also indicated. Every 24 cycles the swirl plates
were examined with the optical microscope. If no specific features were seen in a hole,
pictures of the 12, 3, 6, 9 o' clock were taken and saved in the respective name
nomenclature of their position and number of cycles. Pictures of the surface of the swirl
plate were also taken each time and also of any additional hole with some interesting
feature depending on the deposition within that hole. Figure 9 shows a schematic of the
swirl plate's hole position nomenclature.
SEM investigation: This was similar to the optical microscope investigation as far
as the pictures taken and was performed after every 50 cycles. In both cases (optical and
SEM) the pictures were compared with the pictures of the virgin (unused ) swirl plates.
20
12 o'clock
9 o'clock / / \°\ 3 o'clock
6 o'clock
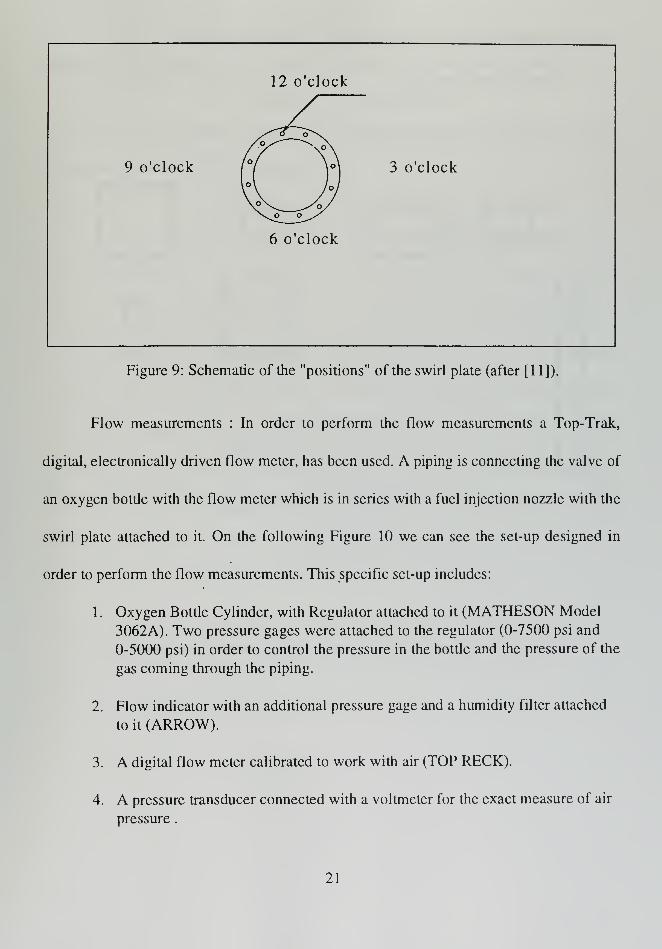
Figure 9: Schematic of the "positions" of the swirl plate (after [111).
Flow measurements : In order to perform the flow measurements a Top-Trak,
digital, electronically driven flow meter, has been used. A piping is connecting the valve of
an oxygen bottle with the flow meter which is in series with a fuel injection nozzle with the
swirl plate attached to it. On the following Figure 10 we can see the set-up designed in
order to perform the flow measurements. This specific set-up includes:
1
.
Oxygen Bottle Cylinder, with Regulator attached to it (MATHESON Model
3062A). Two pressure gages were attached to the regulator (0-7500 psi and
0-5000 psi) in order to control the pressure in the bottle and the pressure of the
gas coming through the piping.
2. Flow indicator with an additional pressure gage and a humidity filter attached
to it (ARROW).
3. A digital flow meter calibrated to work with air (TOP RECK).
4. A pressure transducer connected with a voltmeter for the exact measure of air
pressure .
21
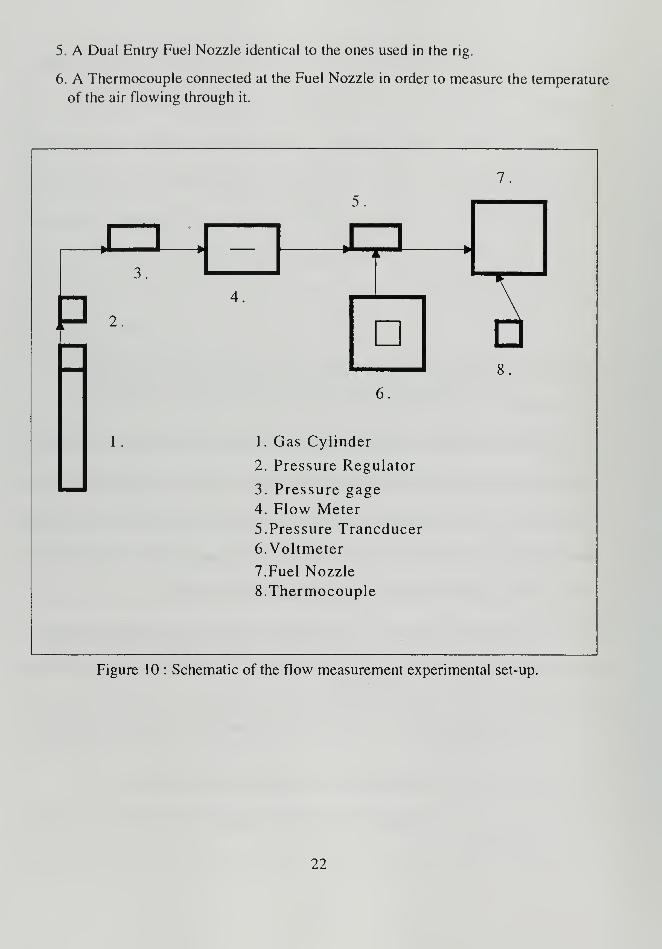
5. A Dual Entry Fuel Nozzle identical to the ones used in the rig.
6. A Thermocouple connected at the Fuel Nozzle in order to measure the temperature
of the air flowing through it.
7.
<;
»,n ,^^^^_ ,U^L
1
3.
A
P 2.
<+ .
68
6.
1. 1. Gas Cylinder
2. Pressure Regulator
3. Pressure gage
4. Flow Meter
5. Pressure Trancducer
6. Voltmeter
7. Fuel Nozzle
8. Thermocouple
Figure 10 : Schematic of the flow measurement experimental set-up.
22
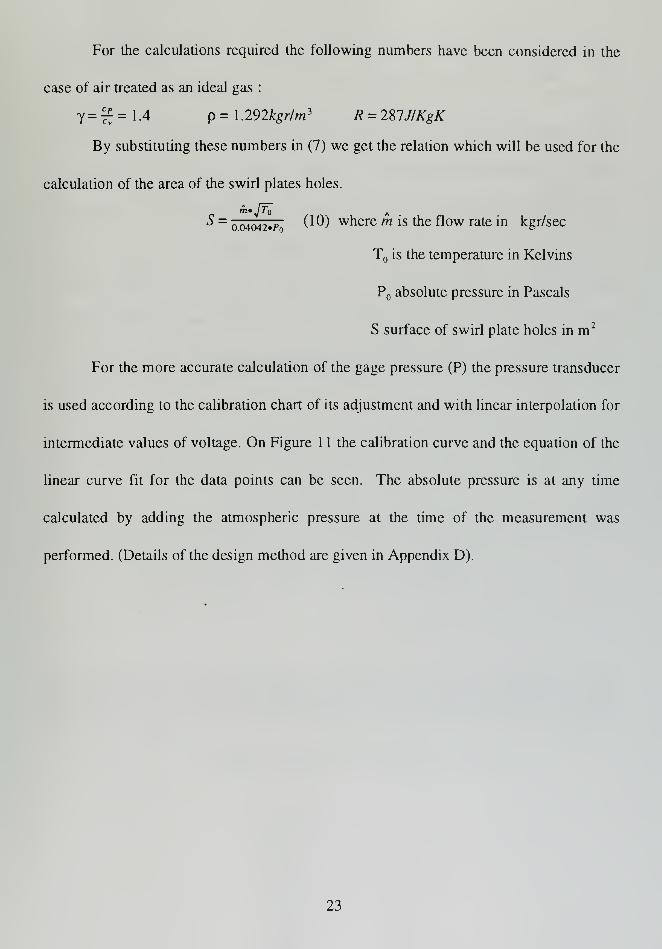
For the calculations required the following numbers have been considered in the
case of air treated as an ideal gas :
y = ££ = 1.4 p = 1 .292kgr/m 3 R = 2%UIKgK
By substituting these numbers in (7) we get the relation which will be used for the
calculation of the area of the swirl plates holes.
S =O4042.p 0-0) where m is the flow rate in kgr/sec
T is the temperature in Kelvins
P absolute pressure in Pascals
S surface of swirl plate holes in m 2
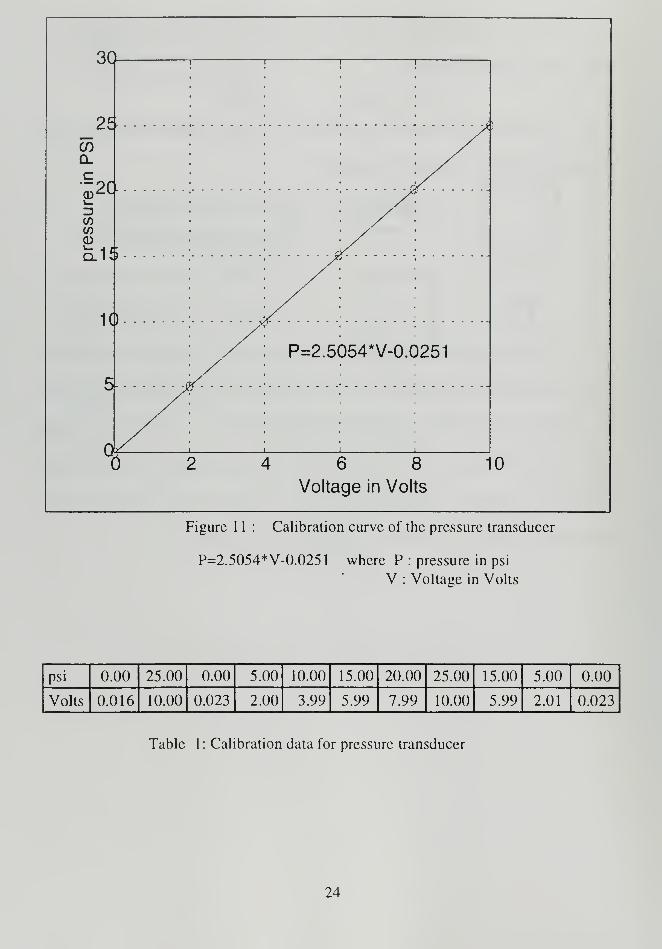
For the more accurate calculation of the gage pressure (P) the pressure transducer
is used according to the calibration chart of its adjustment and with linear interpolation for
intermediate values of voltage. On Figure 1 1 the calibration curve and the equation of the
linear curve fit for the data points can be seen. The absolute pressure is at any time
calculated by adding the atmospheric pressure at the time of the measurement was
performed. (Details of the design method are given in Appendix D).
23
30
23
Q_
I—
CO
(D
Q.1
10
ok-
'y4 '
P=2.5054*V-0.0251
... ^. ... .
4 6 8
Voltage in Volts
Figure 1 1 : Calibration curve of the pressure transducer
P=2.5054*V-0.0251 where P : pressure in psi
V : Voltage in Volts
psi 0.00 25.00 0.00 5.00 10.00 15.00 20.00 25.00 15.00 5.00 0.00
Volts 0.016 10.00 0.023 2.00 3.99 5.99 7.99 10.00 5.99 2.01 0.023
Table 1 : Calibration data for pressure transducer
24

C. SAFETY FEATURES
As mentioned earlier, a major reason for the redesign of the nozzle test rig were
considerations of lab safety. The new design has safety features that allow the operation of
the rig without continuous personnel attendance. For instance if the programme, for any
reason, fails to control the temperature, the furnace will turn off automatically as soon as
it reaches a pre-set by the user maximum temperature [Ref. 21]. The furnace is also
positioned within a fume hood of the Corrosion Lab in the Mechanical Engineering
Building. In this way, the possibility of fumes leakage is minimised with the most effective
available way, so that the personnel working the rig would not be affected from the fuel
fumes.
25

26
III. RESULTS AND DISCUSSION
A. GENERAL
Some of the results presented in this section have come from the old testing rig.
They were taken in account only as far as the accumulation rate of deposits in the holes
of the swirl plates, and not for closure measurements via the flow measurement method,
because at that time the latter was in the process of being set up. Despite this fact, the data
from the old rig can be used to lead to some conclusions relative to the different
behaviour among the different types of swirl plates.
The newly designed test rig has provided data for the comparative behaviour of A
and B types of swirl plates. This data was also used in calculations of the closure in the
swirl plates holes together with the information associated with the coking accumulation
rate and the optical and SEM examination.
B. WEIGHT MEASUREMENTS
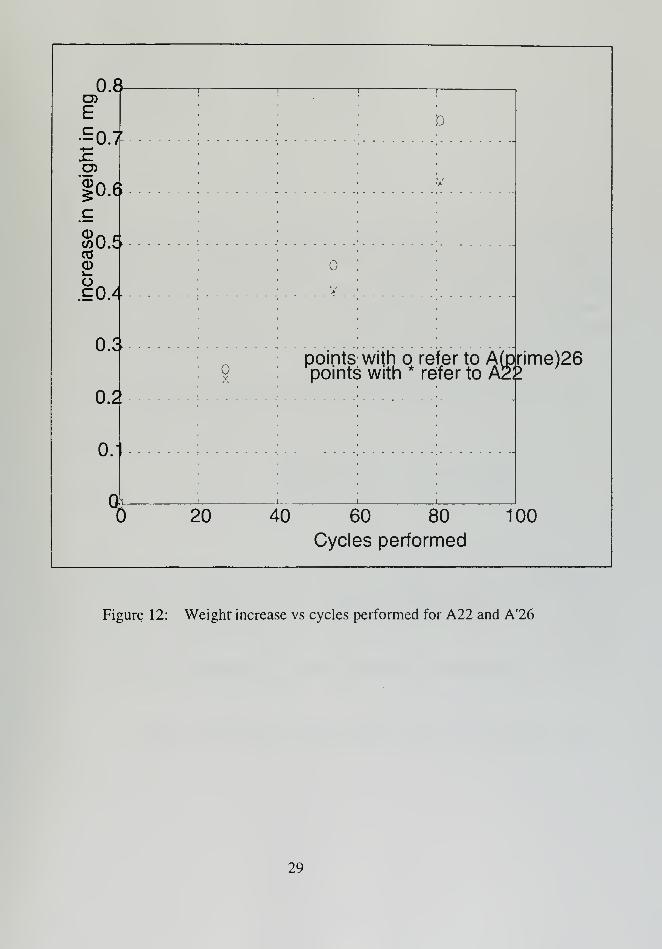
a) A vs. A'
A22 and A'27 were the two swirl plates that were used in the old testing rig. On
Figure 10 we can see the results of the weight measurements plotted based on the data
shown on Tables 2 and 3. No significant difference in the accumulation rate of coking
between the two swirl plates can be justified from the data obtained.
27
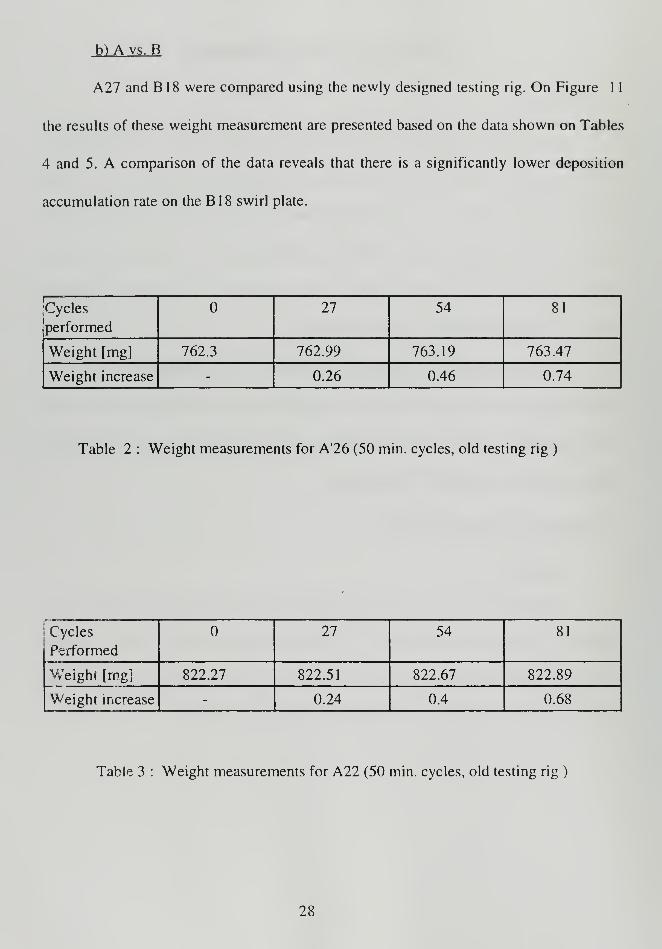
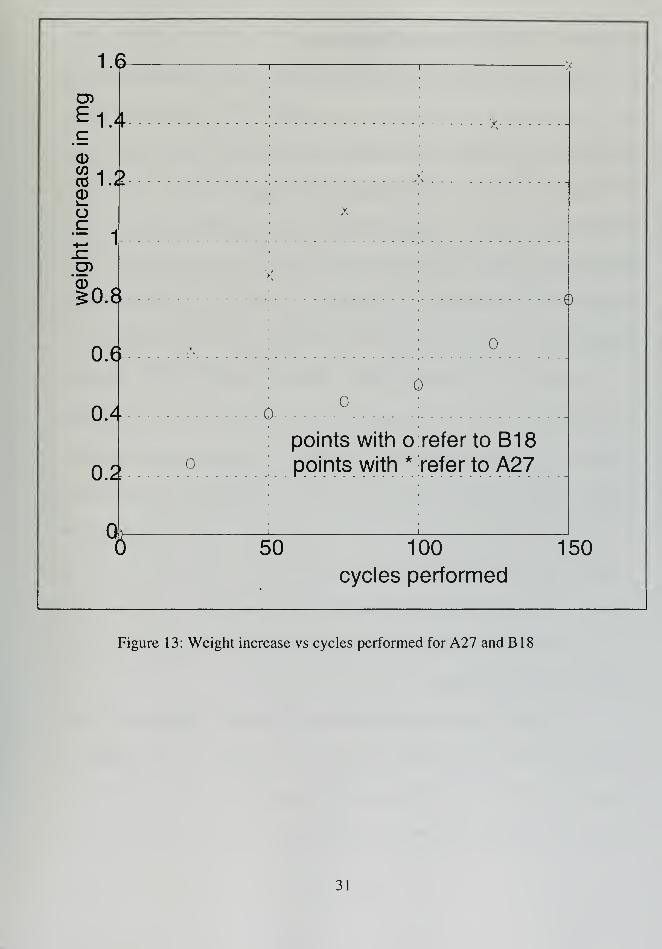
b) A vs. B
A27 and B 1 8 were compared using the newly designed testing rig. On Figure 1
1
the results of these weight measurement are presented based on the data shown on Tables
4 and 5. A comparison of the data reveals that there is a significantly lower deposition
accumulation rate on the B 1 8 swirl plate.
[Cycles
performed
27 54 81
Weight [mg] 762.3 762.99 763.19 763.47
Weight increase - 0.26 0.46 0.74
Table 2 : Weight measurements for A'26 (50 min. cycles, old testing rig )
: Cycles
Performed
27 54 81
Weight [mg] 822.27 822.51 822.67 822.89
Weight increase - 0.24 0.4 0.68
Table 3 : Weight measurements for A22 (50 min. cycles, old testing rig )
28
increase
in
weight
in
mg
o
p
p
p
p
p
p
pt
'
i 1 1
: d
rime)26
i •A
o : :
V
)
V
points with o refer to A(ppoints with * refer to A2!
i i i
i 20 40 60 80 100
Cycles performed
Figure 12: Weight increase vs cycles performed for A22 and A'26
29
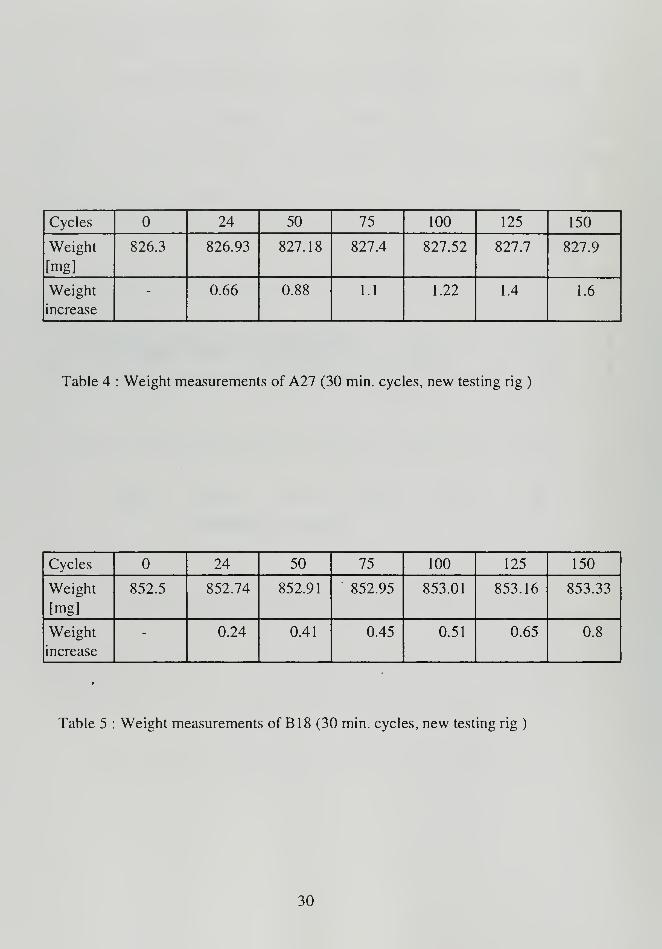
Cycles 24 50 75 100 125 150
Weight
[mg]
826.3 826.93 827.18 827.4 827.52 827.7 827.9
Weight
increase
- 0.66 0.88 1.1 1.22 1.4 1.6
Table 4 : Weight measurements of A27 (30 min. cycles, new testing rig )
Cycles 24 50 75 100 125 150
Weight
[mg]
852.5 852.74 852.91 852.95 853.01 853.16 853.33
Weight
increase
- 0.24 0.41 0.45 0.51 0.65 0.8
Table 5 : Weight measurements of B18 (30 min. cycles, new testing rig )
30
1.6
CD
£1.4
CDCO iCO 1.CD
o~ 1
_CD)CD
|0.8
O.i
o.«
0.:
Q8
£-
0-
points with o
points with*refer to B18refer to A27
50 100
cycles performed
150
Figure 13: Weight increase vs cycles performed for A27 and B18
31
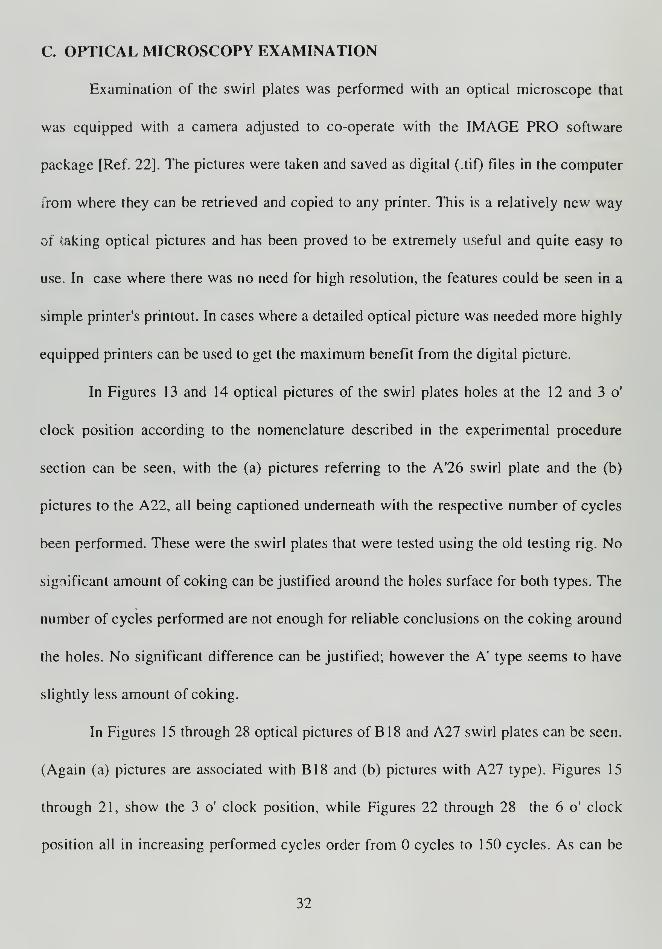
C. OPTICAL MICROSCOPY EXAMINATION
Examination of the swirl plates was performed with an optical microscope that
was equipped with a camera adjusted to co-operate with the IMAGE PRO software
package [Ref. 22]. The pictures were taken and saved as digital (.tif) files in the computer
i'rom where they can be retrieved and copied to any printer. This is a relatively new way
of faking optical pictures and has been proved to be extremely useful and quite easy to
use. In case where there was no need for high resolution, the features could be seen in a
simple printer's printout. In cases where a detailed optical picture was needed more highly
equipped printers can be used to get the maximum benefit from the digital picture.
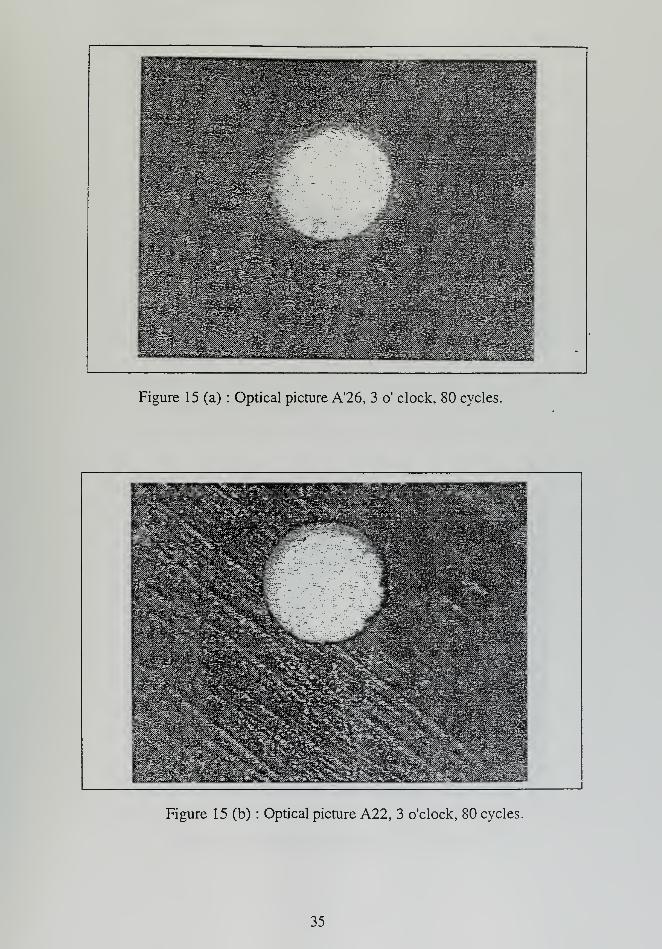
In Figures 13 and 14 optical pictures of the swirl plates holes at the 12 and 3 o'
clock position according to the nomenclature described in the experimental procedure
section can be seen, with the (a) pictures referring to the A'26 swirl plate and the (b)
pictures to the A22, all being captioned underneath with the respective number of cycles
been performed. These were the swirl plates that were tested using the old testing rig. No
significant amount of coking can be justified around the holes surface for both types. The
number of cycles performed are not enough for reliable conclusions on the coking around
the holes. No significant difference can be justified; however the A' type seems to have
slightly less amount of coking.
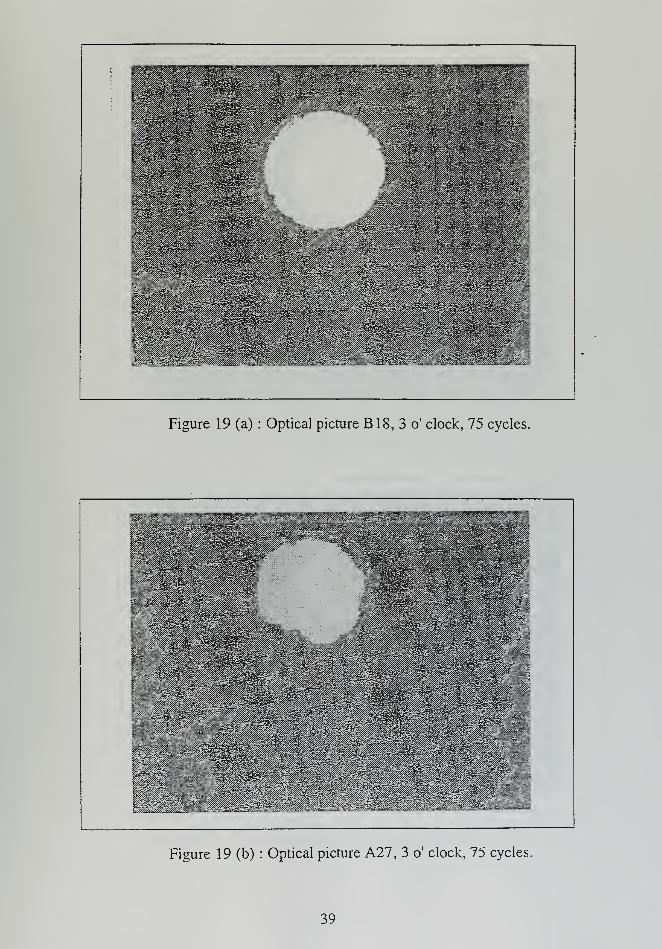
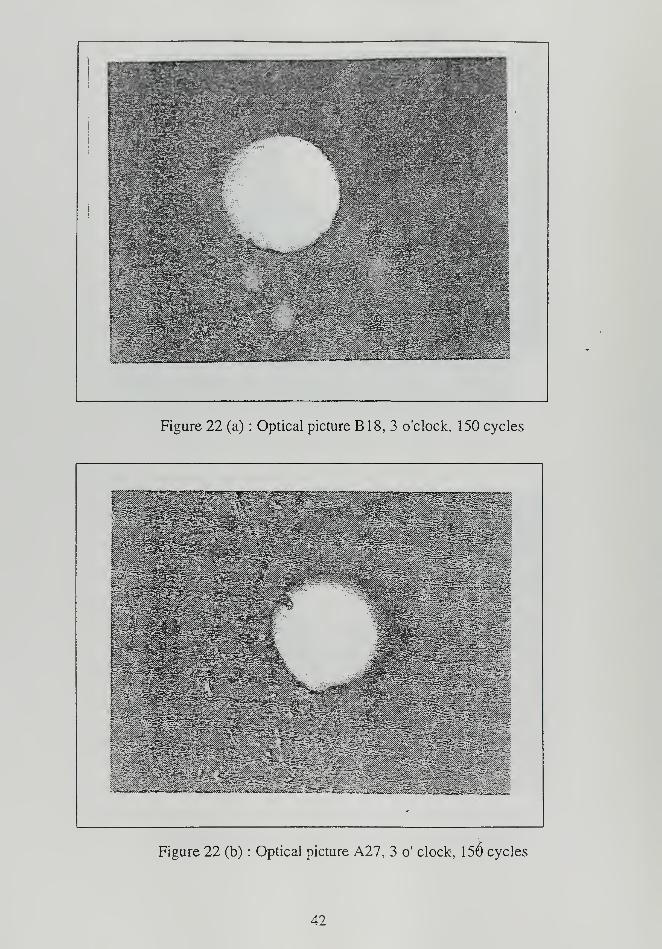
In Figures 15 through 28 optical pictures of B 1 8 and A27 swirl plates can be seen.
(Again (a) pictures are associated with B18 and (b) pictures with A27 type). Figures 15
through 21, show the 3 o' clock position, while Figures 22 through 28 the 6 o' clock
position all in increasing performed cycles order from cycles to 150 cycles. As can be
32
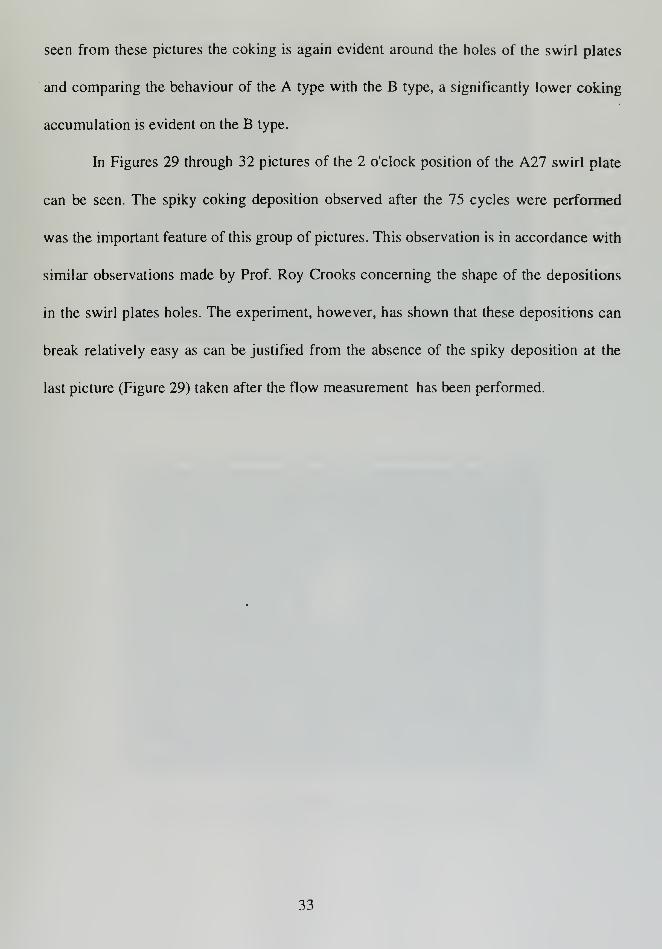
seen from these pictures the coking is again evident around the holes of the swirl plates
and comparing the behaviour of the A type with the B type, a significantly lower coking
accumulation is evident on the B type.
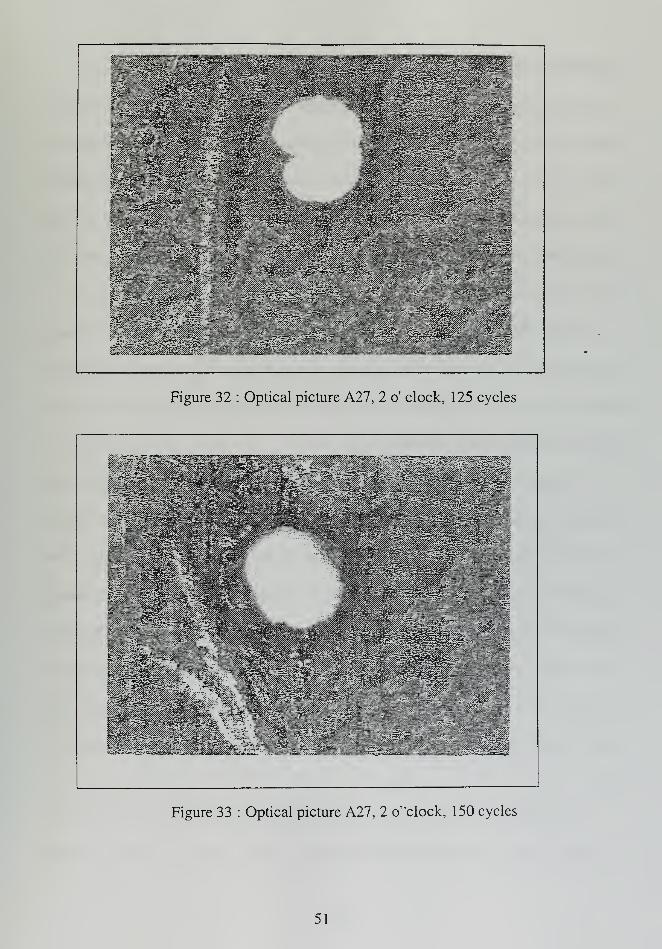
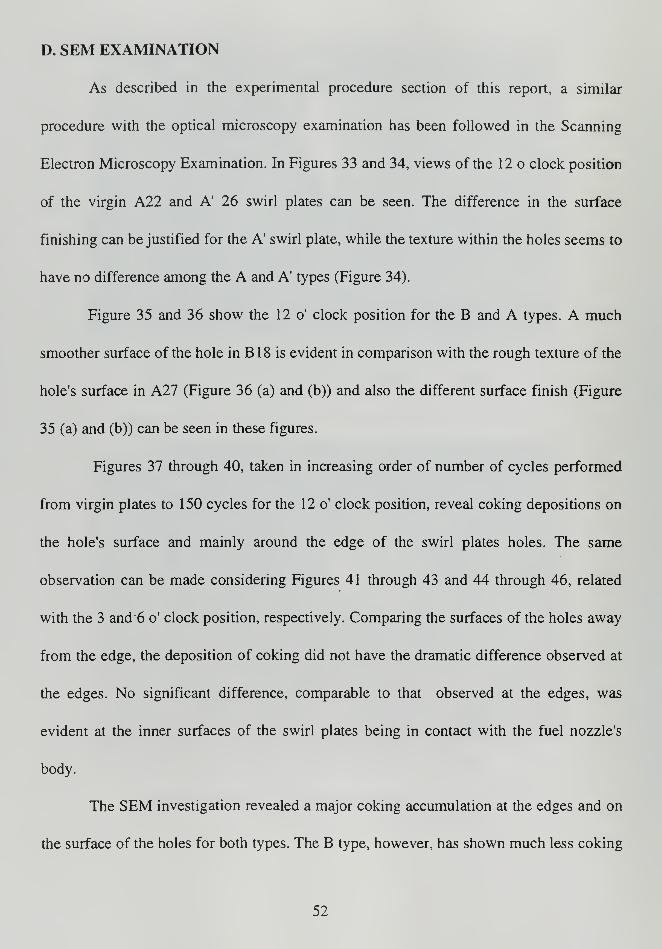
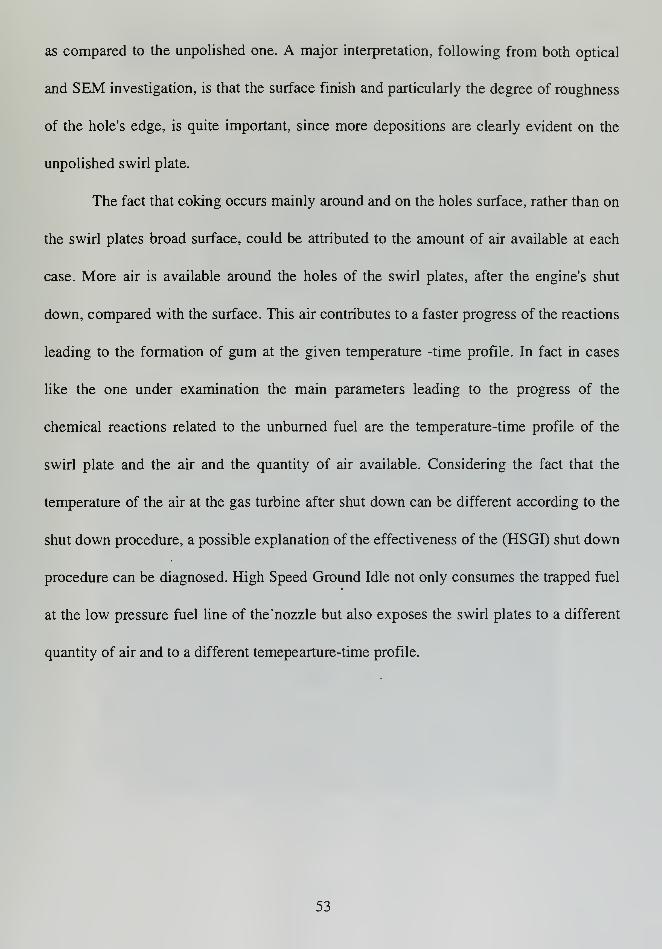
In Figures 29 through 32 pictures of the 2 o'clock position of the A27 swirl plate
can be seen. The spiky coking deposition observed after the 75 cycles were performed
was the important feature of this group of pictures. This observation is in accordance with
similar observations made by Prof. Roy Crooks concerning the shape of the depositions
in the swirl plates holes. The experiment, however, has shown that these depositions can
break relatively easy as can be justified from the absence of the spiky deposition at the
last picture (Figure 29) taken after the flow measurement has been performed.
33
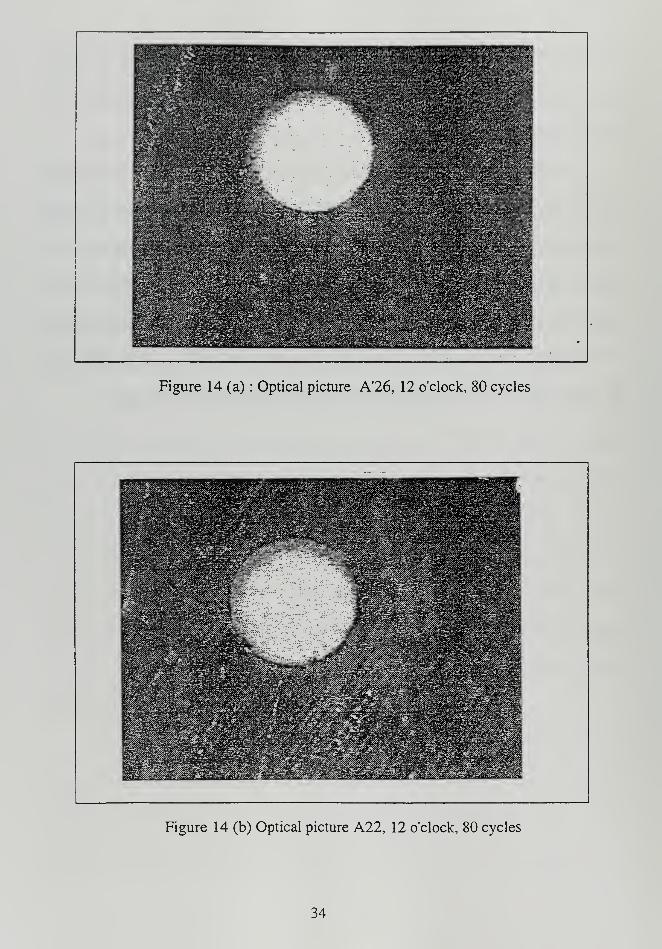
Figure 14 (a) : Optical picture A'26, 12 o'clock, 80 cycles
Figure 14 (b) Optical picture A22, 12 o'clock, 80 cycles
34
MM
Figure 15 (a) : Optical picture A'26, 3 o' clock, 80 cycles.
Figure 15 (b) : Optical picture A22, 3 o'clock, 80 cycles.
35
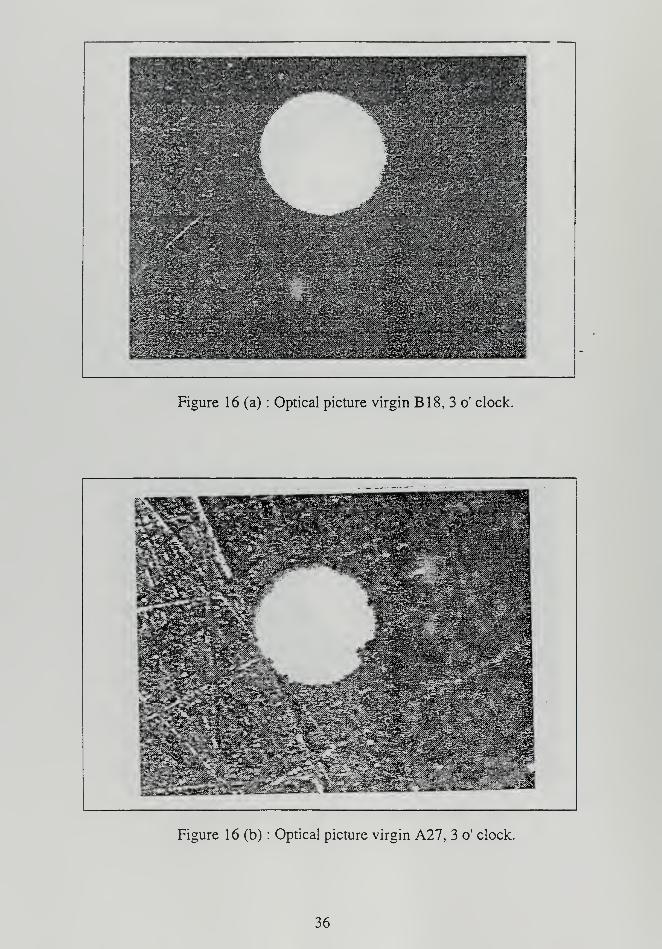
Figure 16 (a) : Optical picture virgin B18, 3 o' clock.
Figure 16 (b) : Optical picture virgin A27, 3 o' clock.
36
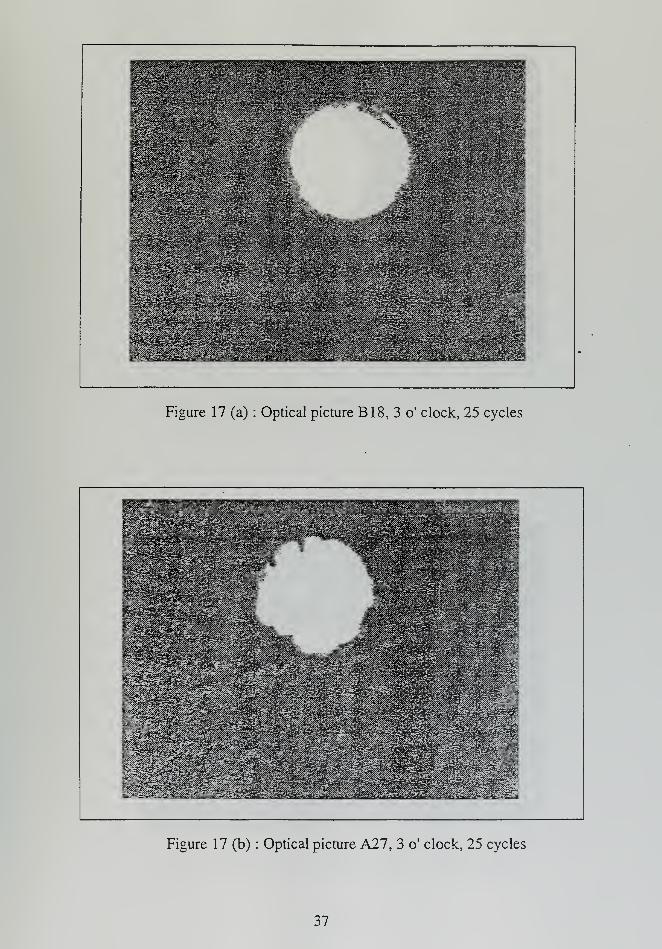
Figure 17 (a) : Optical picture B18, 3 o' clock, 25 cycles
WBm
Hi
ill' • Mm- .Jr
'':"''
Figure 17 (b) : Optical picture A27, 3 o' clock, 25 cycles
37
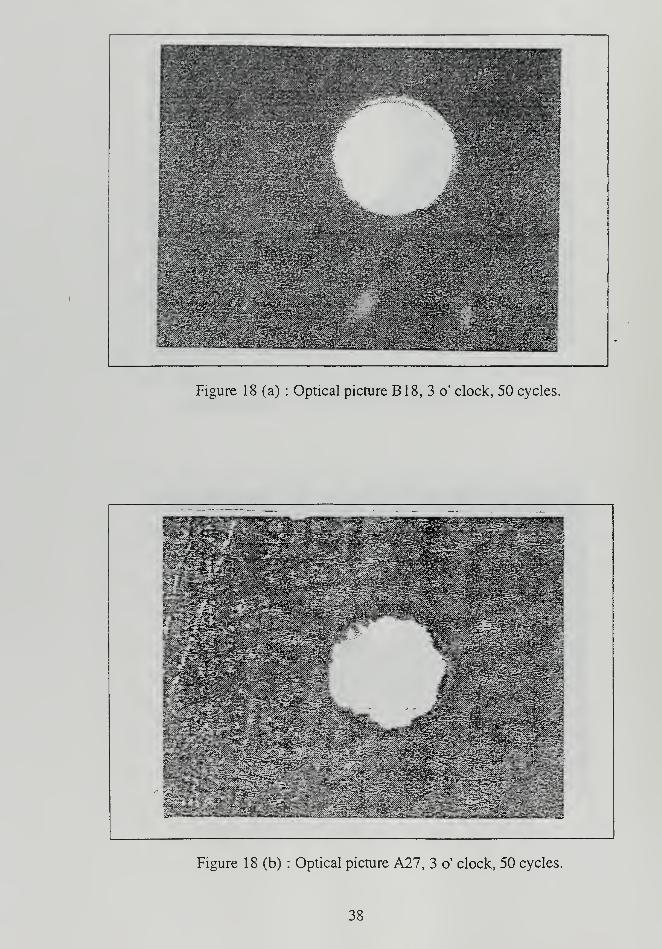
Figure 18 (a) : Optical picture B18, 3 o' clock, 50 cycles.
^WMr^&gM&Z^^
Figure 18 (b) : Optical picture A27, 3 o' clock, 50 cycles.
38
^,yt,„rr---v. .T ;.»*ly.jju^yyyy 555S5S3?r
**r%r*"r
...;. . '••
IlSti!mMmmm
;;:::::<V;::
ill
W't.
illP?r
iSIIillliSi
. - r ^ .- ^ : . - .
:
.':. V
;
mm
:-: ;.
: -.?:
-'^;:^v,-:
'-.:;.;:..;~.::.. .
/
Figure 19 (a) : Optical picture B18, 3 o' clock, 75 cycles.
Figure 19 (b) : Optical picture A27, 3 o' clock, 75 cycles.
39
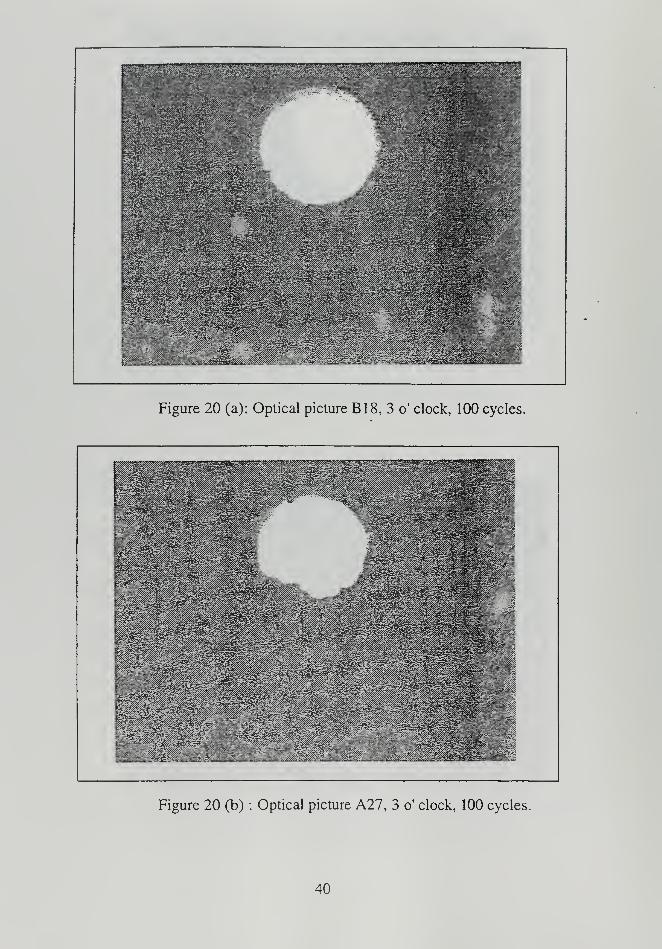
Figure 20 (a): Optical picture B18, 3 o' clock, 100 cycles.
Figure 20 (b) : Optical picture A27, 3 o' clock, 100 cycles.
40
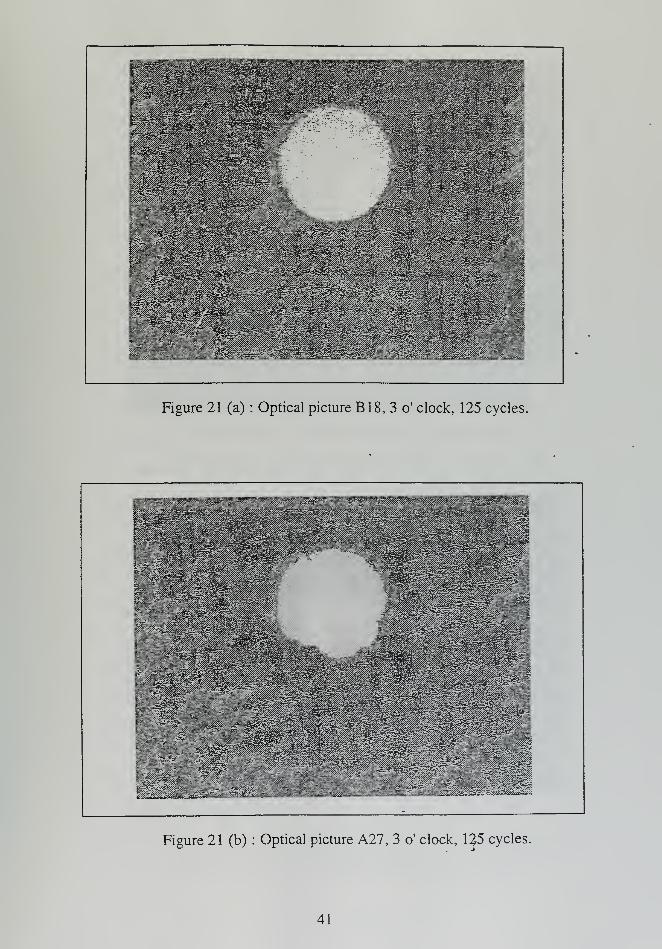
Figure 21 (a) : Optical picture B18, 3 o' clock, 125 cycles.
Figure 21 (b) : Optical picture A27, 3 o' clock, 12-5 cycles.
41
i Hii
glllllllh .
B38aells?42
Wsr^&eJviniiafe^"
ilfiillilljpsaslp*!
lllif'-
/J1111' zgExijeWw
WiSi^v&s&&a0&*zt <A
"->i: ../
^rT " ^^^^W
• ^ •*:.'.':..:..• H^tantlMss>^&££&3£®&iSuaiSSSSm*»"*' ftfr***
Figure 22 (a) : Optical picture B18, 3 o'clock, 150 cycles
Hail
Figure 22 (b) : Optical picture A27, 3 o' clock, 156 cycles
42
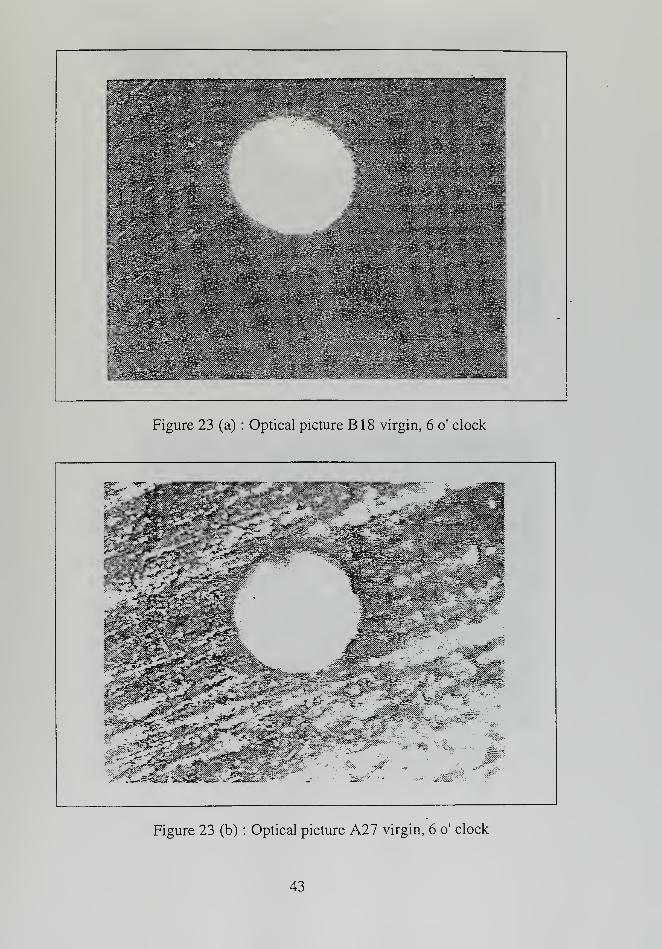
Figure 23 (a) : Optical picture B18 virgin, 6 o' clock
Figure 23 (b) : Optical picture A27 virgin, 6 o' clock
43
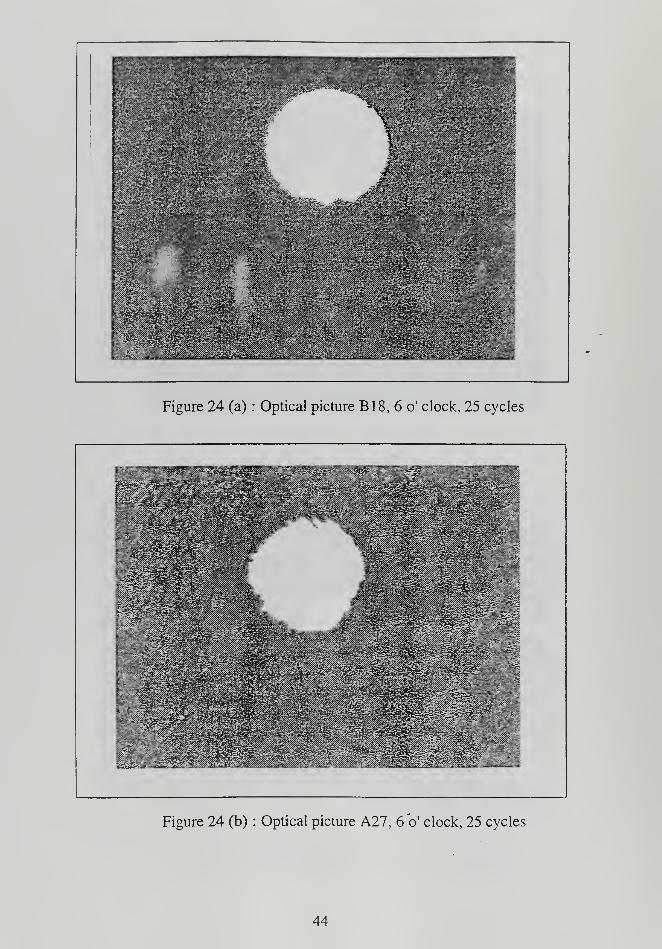
Figure 24 (a) : Optical picture B18, 6 o' clock, 25 cycles
" :.-
.
:.
..
'
,: .
'
'.
..
mmm.mmm
yg%X
Figure 24 (b) : Optical picture A27, 6 *o' clock, 25 cycles
44
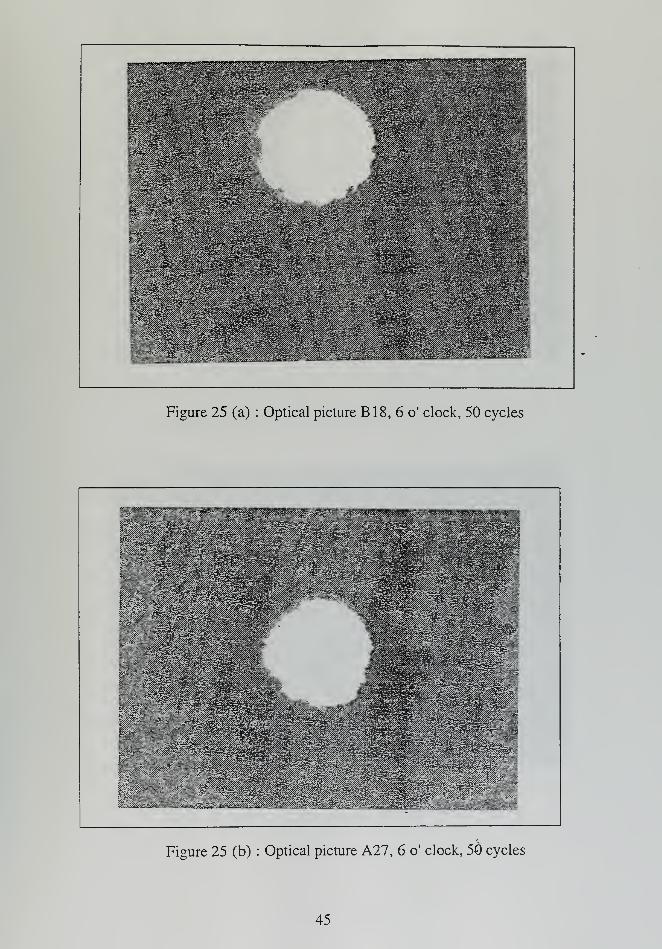
Figure 25 (a) : Optical picture B18, 6 o' clock, 50 cycles
<T.\, ... .
-;
;.'.'.:;...... :>.;., ...
^PIIIIIIIF-
As.'
. :
' : amH
:^:,..:,...^ i^:^.* :
Figure 25 (b) : Optical picture A27, 6 o' clock, 50 cycles
45
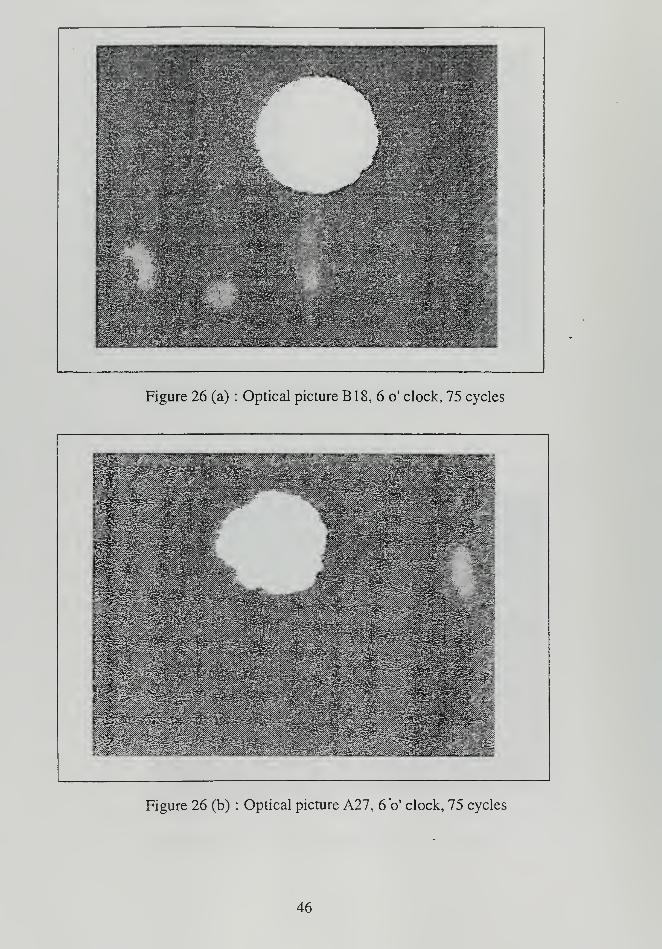
Figure 26 (a) : Optical picture B 18, 6 o' clock, 75 cycles
;-/ v
.......i -
m*
mm mmm'£ SKIPSi-:, •:.'
":"--.,.-. '.'•:
- .-:: - -.::
-'-,:
":; ' '
:.: :....
S^«lpS
till
' i
: .!
' :':'.:
:
' -.:'".'."-
IPiiiiiiiPis
Figure 26 (b) : Optical picture A27, 6b' clock, 75 cycles
46
':l
''.. ....
'.
'
.
' :' .-." .- '..-..
•;:• •
:•:-".
81I
.':...... -.
lilt*
;
....-
Figure 27 (a) : Optical picture B 18, 6 o' clock, 100 cycles
.-• ...:
'
•:
ill.^llllllwlli
r iHI
w&M?* %&>< mm?J '
...V;;.;;:.
-":
' '.';.; .';: >-. ,v.v:. -
:•
; '" : /- :
: :
:..''::
' :r:
:</> : :
:
v V. ;::.
:.;..•.;..':.
•=;:
-- > ' ---^ :
V-..., -.; .::.
..
.'.'.. . '. •
' ,.--. .
..'V
'
'
:
:
\
' '..'.
:
'
Figure 27 (b) : Optical picture A27, 6 o' clock, 100 cycles
47
~JL :;
Figure 28 (a) : Optical picture B18, 6 o' clock, 125 cycles
SiiPslllllll
t . $ggg|
Sfr^--.
Figure 28 (b) : Optical picture A27, 6 o' clock, 125 cycles
48
;--vv^
'.
'-".'. .
:... ',.: ;.'. . , ::.... "
•.
..,. '..
Figure 29 (a) : Optical picture A27, 6 o' clock, 150 cycles
'
.
'.... .'
.
;-:,:?.;;&:: ''
.'
...: .-.;.; .-.... .:
. ;..;. ' : ;;
.':'.' \ .'
.'
"'
V .
"
'.'
WMM& fS^Hs
Figure 29 (b) : Optical picture B 18, 6 o' clock, 150 cycles
49
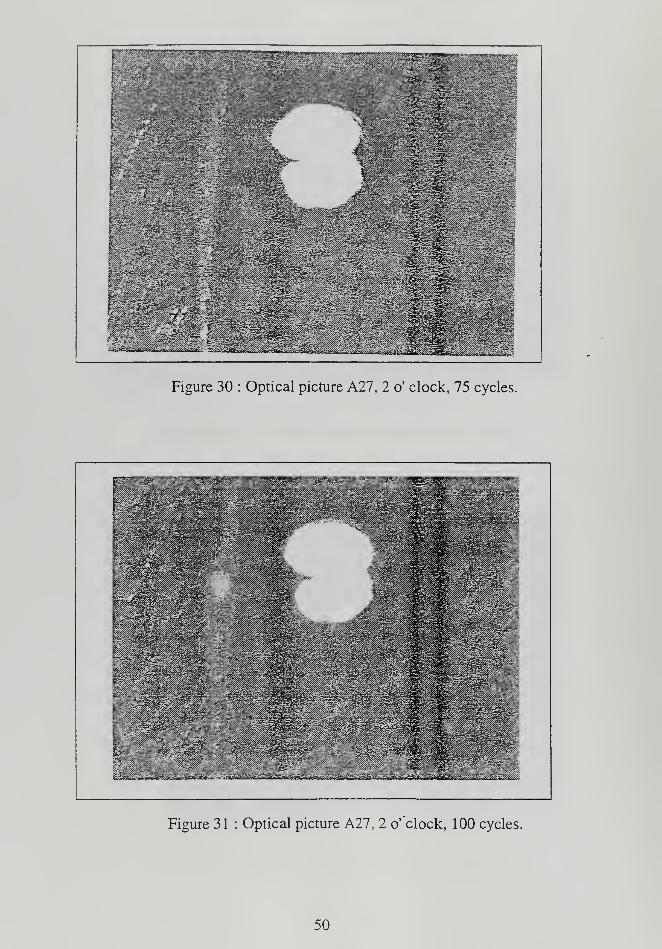
Figure 30 : Optical picture A27, 2 o' clock, 75 cycles.
mW
Figure 31 : Optical picture A27, 2 o' clock, 100 cycles.
50
ffiegggz
Figure 32 : Optical picture A27, 2 o' clock, 125 cycles
:,,.. l
''^£qSg6$&%..
"
>.: :::::--..-, ::.....:...:,
,
Figure 33 : Optical picture A27, 2 o'clock, 150 cycles
51
D. SEM EXAMINATION
As described in the experimental procedure section of this report, a similar
procedure with the optical microscopy examination has been followed in the Scanning
Electron Microscopy Examination. In Figures 33 and 34, views of the 12 o clock position
of the virgin A22 and A' 26 swirl plates can be seen. The difference in the surface
finishing can be justified for the A' swirl plate, while the texture within the holes seems to
have no difference among the A and A' types (Figure 34).
Figure 35 and 36 show the 12 o' clock position for the B and A types. A much
smoother surface of the hole in B 1 8 is evident in comparison with the rough texture of the
hole's surface in A27 (Figure 36 (a) and (b)) and also the different surface finish (Figure
35 (a) and (b)) can be seen in these figures.
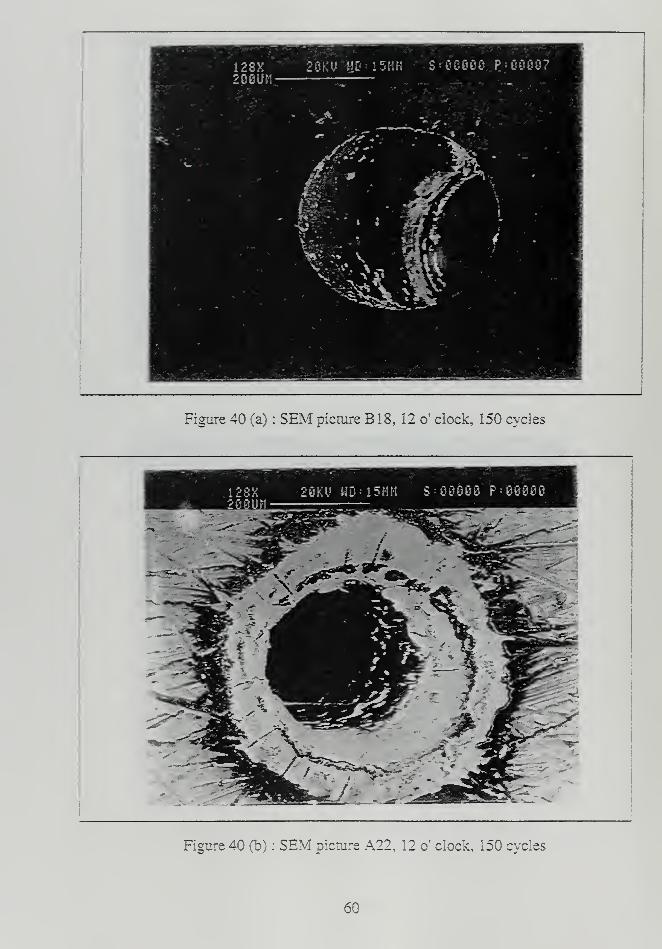
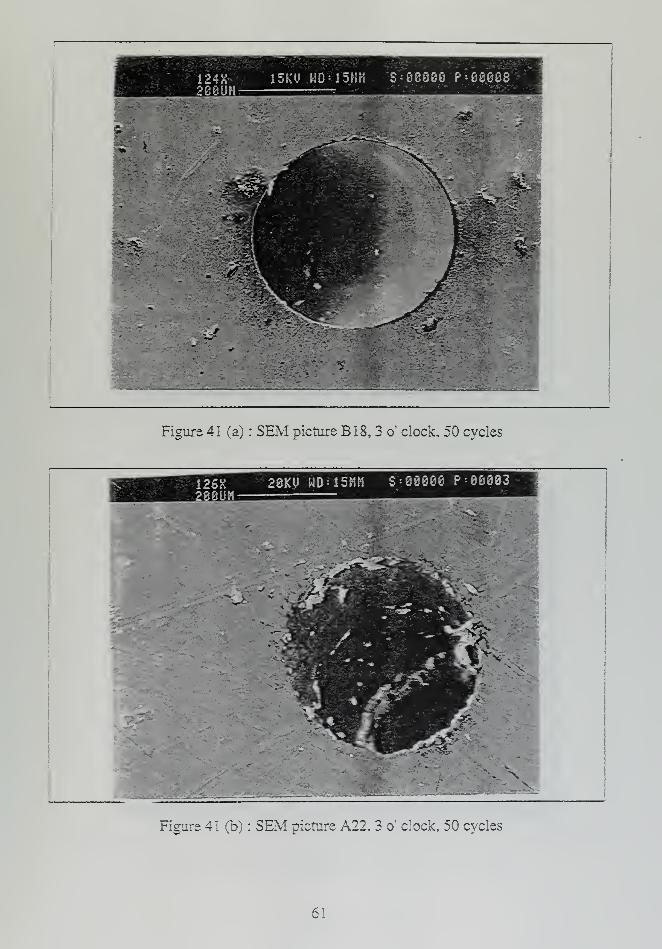
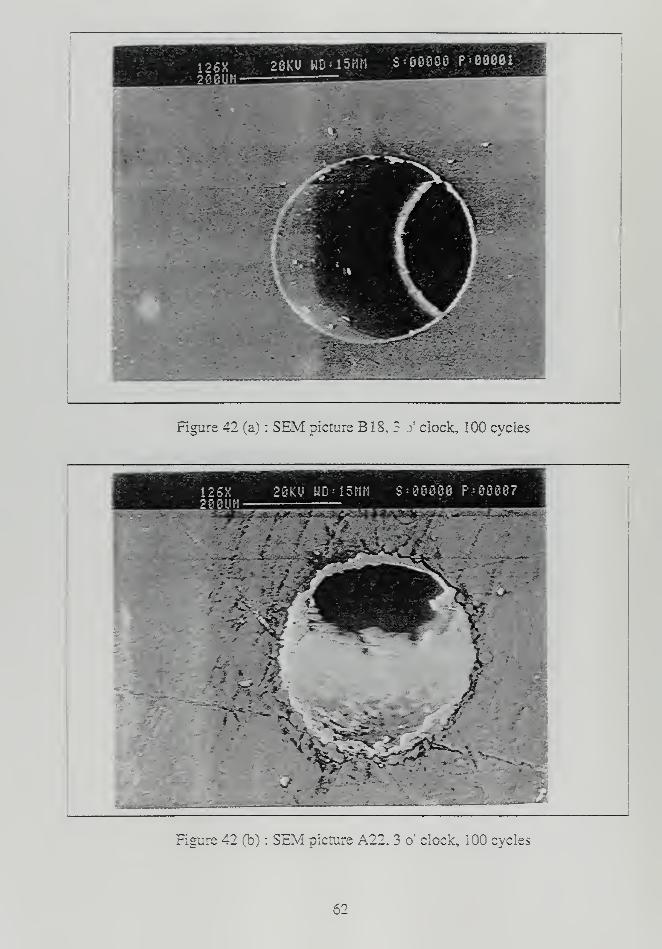
Figures 37 through 40, taken in increasing order of number of cycles performed
from virgin plates to 150 cycles for the 12 o' clock position, reveal coking depositions on
the hole's surface and mainly around the edge of the swirl plates holes. The same
observation can be made considering Figures 41 through 43 and 44 through 46, related
with the 3 and 6 o' clock position, respectively. Comparing the surfaces of the holes away
from the edge, the deposition of coking did not have the dramatic difference observed at
the edges. No significant difference, comparable to that observed at the edges, was
evident at the inner surfaces of the swirl plates being in contact with the fuel nozzle's
body.
The SEM investigation revealed a major coking accumulation at the edges and on
the surface of the holes for both types. The B type, however, has shown much less coking
52
as compared to the unpolished one. A major interpretation, following from both optical
and SEM investigation, is that the surface finish and particularly the degree of roughness
of the hole's edge, is quite important, since more depositions are clearly evident on the
unpolished swirl plate.
The fact that coking occurs mainly around and on the holes surface, rather than on
the swirl plates broad surface, could be attributed to the amount of air available at each
case. More air is available around the holes of the swirl plates, after the engine's shut
down, compared with the surface. This air contributes to a faster progress of the reactions
leading to the formation of gum at the given temperature -time profile. In fact in cases
like the one under examination the main parameters leading to the progress of the
chemical reactions related to the unburned fuel are the temperature-time profile of the
swirl plate and the air and the quantity of air available. Considering the fact that the
temperature of the air at the gas turbine after shut down can be different according to the
shut down procedure, a possible explanation of the effectiveness of the (HSGI) shut down
procedure can be diagnosed. High Speed Ground Idle not only consumes the trapped fuel
at the low pressure fuel line of the"nozzle but also exposes the swirl plates to a different
quantity of air and to a different temepearture-time profile.
53

126X 20KU HDVfSHM S-00006 'P = 06001268UM-
Figure 34 (a) : SEM picture for virgin All.
Figure 34 (b) : SEM picture for virgin A'26.
54
.•5BUM28KU WD ! 15Mfl. S : 88006 P : 86883
/
v-^- ' : te.
Figure 35 (a) : SEM pictures for virgin A22 (high magnification).
Figure 35(b) : SEM pictures for virgin A !
26 (high magnification).
55
128X2eeut'i
20KU WD = 15MM S-- 60080 P--8688e
?S* '*;•'
V Xr» ^
\ -
* ..
t A
A
t*"»i
*•-1
Figure 36(a) : SEM picture virgin B18 7 12 o' clock.
117X288UM
20KV WD=16MM S:08888 P=88002
Figure 36(b) : SEM picture virgin A22, 12 o:
clock.
56
1V87KX-28UH
28KU HD=!5MM S* 00060 P= 80881
t'c#
>*lA--t
'*
H
Figure 37(a) : SEM picture virgin B18, 12 o'clock (high magnification)
\ '
%
Figure 37 (b) : SEM picture virgin A22, 12 o'clock (high magnification)
57
124X266UH
15KU l!D = 15fUi VS= 66866 P= 86666
Figure 38 (a) : SEM picture B 18, 12 o' clock, 50 cycles
Figure 38(b) : SEM picture A22. 12 o' clock, 50 cycles
58
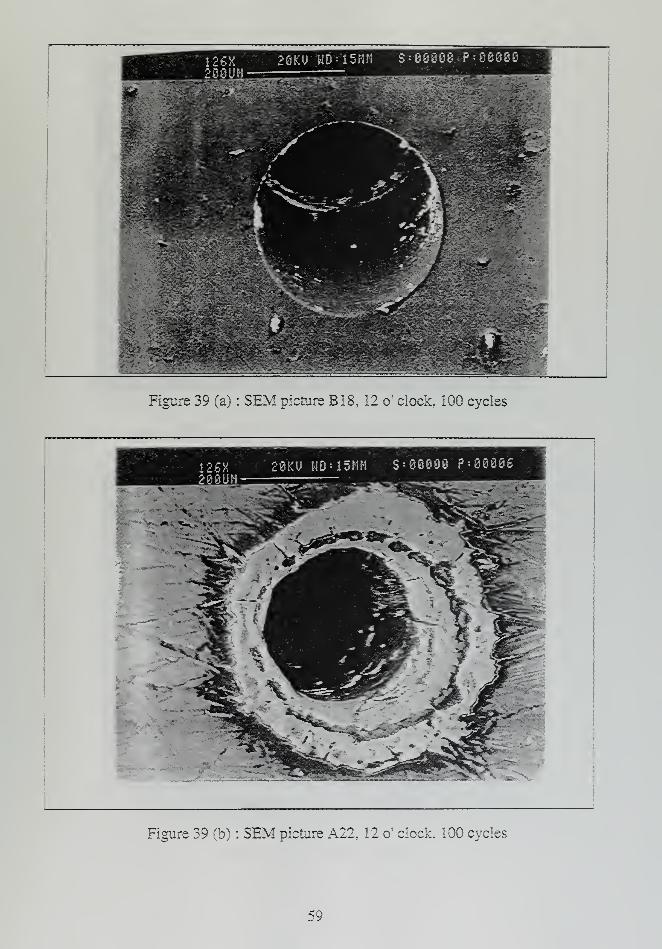
Figure 39 (a) : SEM picture B 18, 12 o!
clock, 100 cycles
28KU ND'15MH 5=88888 P= 88886280UM-
Figure 39 (b) : SEM picture A22, 12 o' clock. 100 cycles
59
i123X200UM:
2 O I- U !!D : ! 5 H H S = PJ
00 7
1
i - -a«S - £ . . f
m. | .
:
:
I iH^HIFigure 40 (a) : SEM picture B 18, 12 o" clock, 150 cycles
128M280OM
20KU H0-15HH S '80880 P= 00000
Figure 40 (b) : SEM picture A22, 12 o:
clock, 150 cycles
60
124X-260UM
15KU HD'l'SNH "5 = 88080 P= 88868
Sr >
i35E
Figure 41 (a) : SEM picture B 18, 3 o' clock, 50 cycles
Figure 41 (b) : SEM pictare A22, 3 o* clock, 50 cycles
61
126X288UM
28KU W0=15HM 8=08880 P : 00081
Figure 42 (a) : SEM picture B 18, 3 >' clock, 100 cycles
200UM20KU WD-15MM S = 88880 P= 8888?
£N ta
.'"VH X~ ~*tiN^P^Q
--,n *. a
i * £1±~~r 'Z-W
'***--«!.- 1 9 (t
i \ ~*~ «-T< 0. V\
"l 4 > ^^l*" *•**
*
*
J- ~
*
Figure 42 (b) : SEM picture A22, 3 o' clock, 100 cycles
62
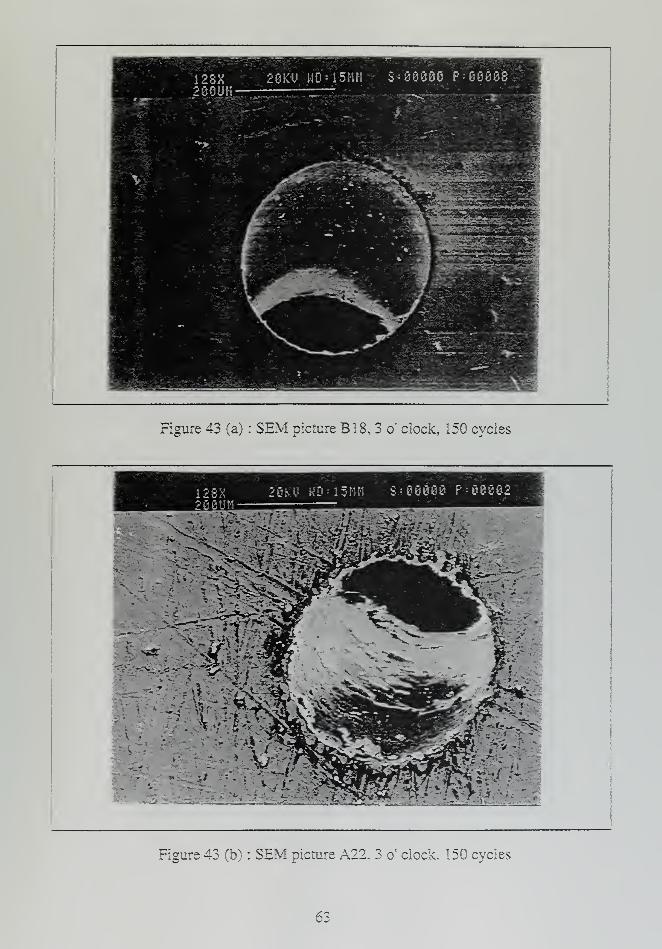
Figure 43 (a) : SEM picture B 18, 3 o" clock, 150 cycles
;"MM S= 88886 P= 68882
Figure 43 (b) : SEM picture A22, 3 o' clock, 150 cycles
63
124X206UM
15KU
"
WD'ISMH 5=08086 P-06610
Figure 44 (a) : SEM picture B 18, 6 o' clock, 50 cycles
Figure 44 (b) : SEM picture A22, 6 o!
clock, 50 cycles
64
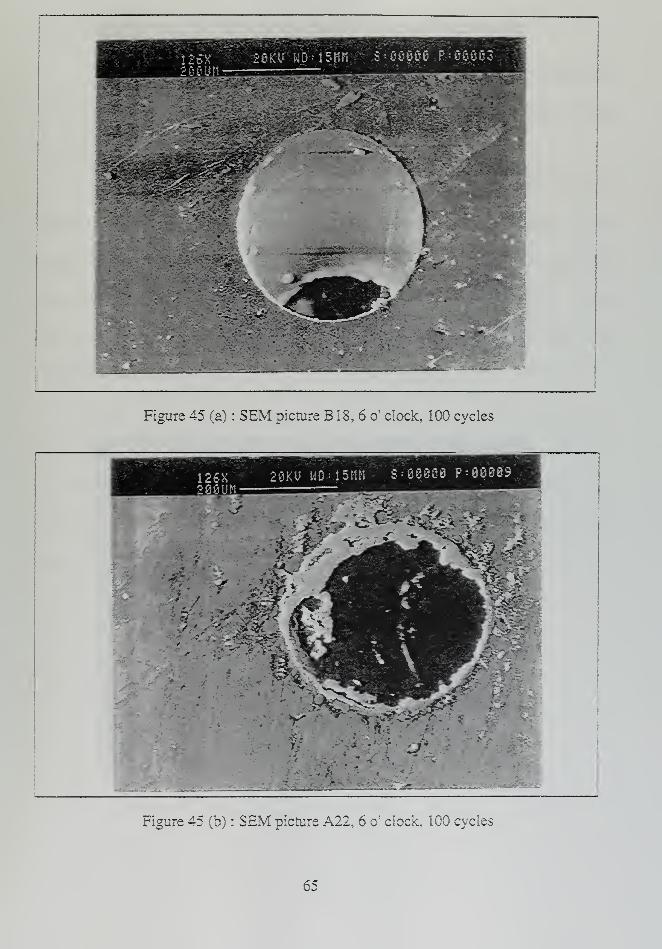
Figure 45 (a) : SEM picture B 18, 6 o' clock, 100 cycles
126X280lfM
28KU UD=15««- 5:08880 P:8800S
---f op
Figure 45 (b) : SEM picture A22, 6 or
clock, 100 cycles
65

Figure 46 (a) : SEM picture B 18, 6 o:
clock, 150 cycles
-•VTV'
Figure 46 (b) : SEM picture A22, 6 o!
clock, 150 cycles
66
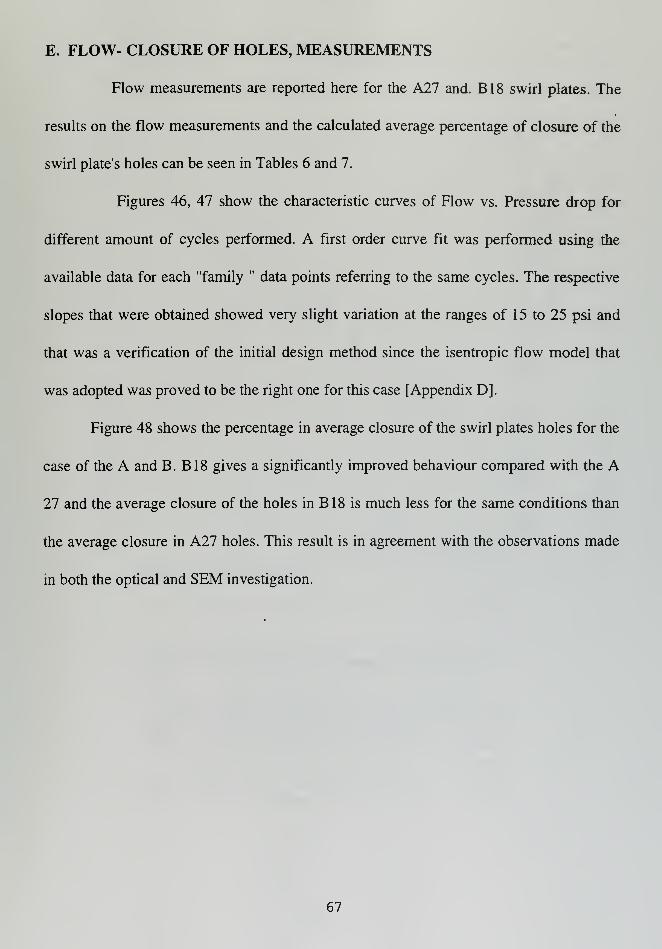
E. FLOW- CLOSURE OF HOLES, MEASUREMENTS
Flow measurements are reported here for the All and. B18 swirl plates. The
results on the flow measurements and the calculated average percentage of closure of the
swirl plate's holes can be seen in Tables 6 and 7.
Figures 46, 47 show the characteristic curves of Flow vs. Pressure drop for
different amount of cycles performed. A first order curve fit was performed using the
available data for each "family " data points referring to the same cycles. The respective
slopes that were obtained showed very slight variation at the ranges of 15 to 25 psi and
that was a verification of the initial design method since the isentropic flow model that
was adopted was proved to be the right one for this case [Appendix D].
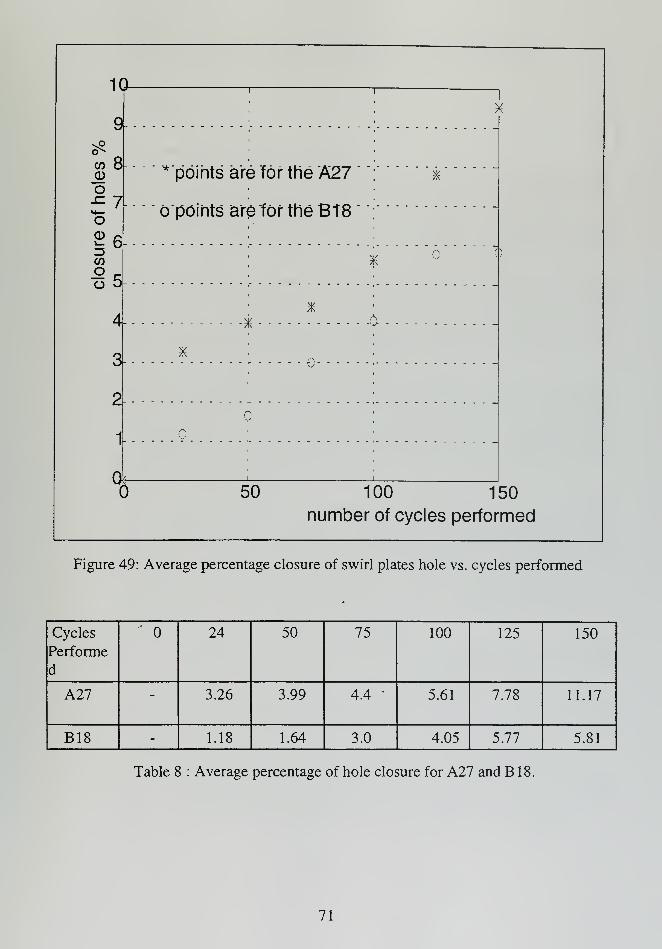
Figure 48 shows the percentage in average closure of the swirl plates holes for the
case of the A and B. B18 gives a significantly improved behaviour compared with the A
27 and the average closure of the holes in B 1 8 is much less for the same conditions than
the average closure in A27 holes. This result is in agreement with the observations made
in both the optical and SEM investigation.
67
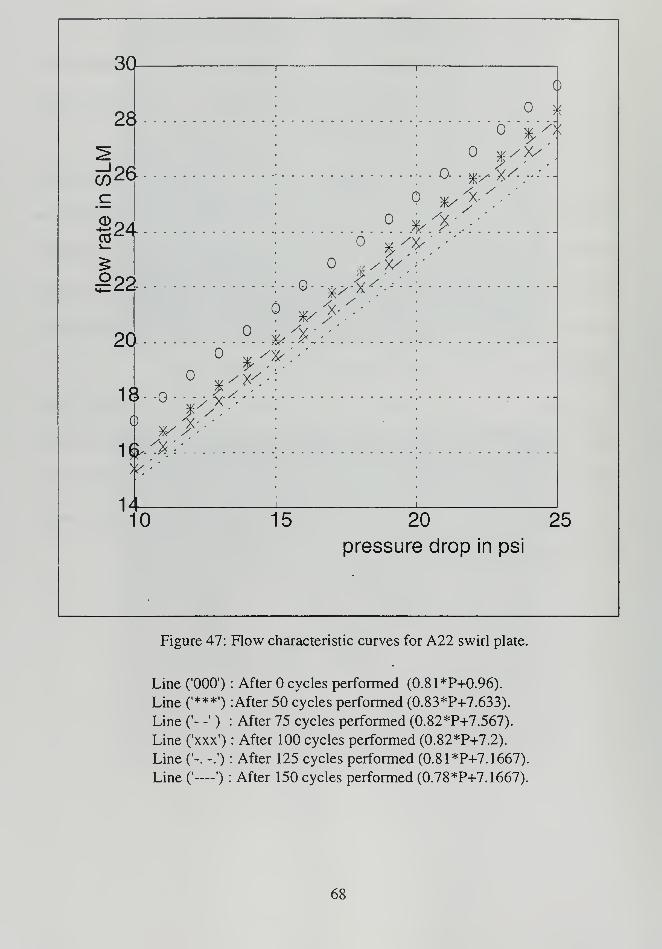
Figure 47: Flow characteristic curves for A22 swirl plate.
Line ('000') : After cycles performed (0.81*P+0.96).
Line ('***'):After 50 cycles performed (0.83*P+7.633).
Line ('- -' ) : After 75 cycles performed (0.82*P+7.567).
Line ('xxx') : After 100 cycles performed (0.82*P+7.2).
Line ('-. -.') : After 125 cycles performed (0.8 l*P+7. 1667).
Line ('—
') : After 150 cycles performed (0.78*P+7.1667).
68
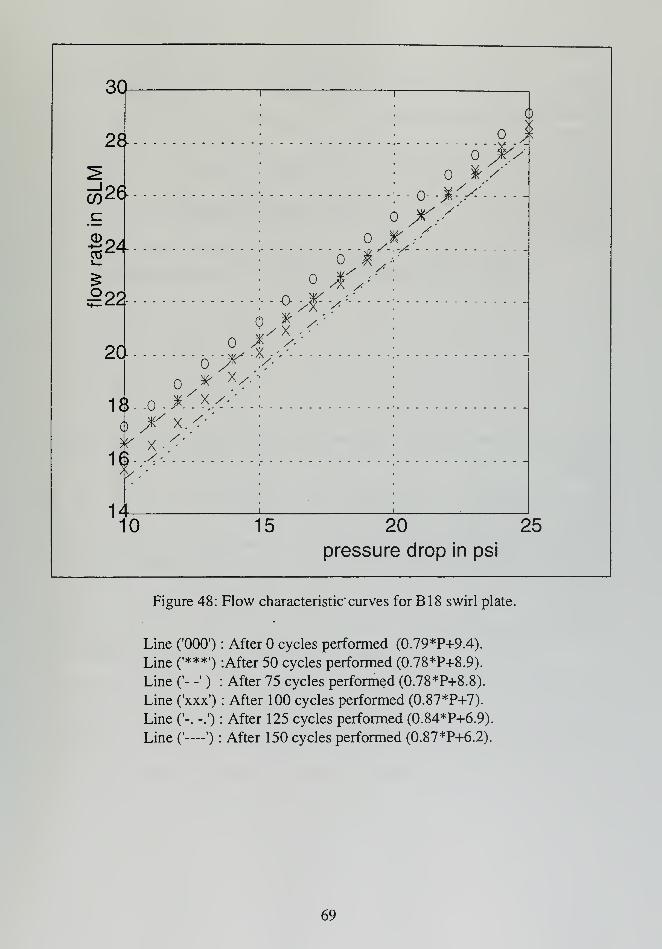
Figure 48: Flow characteristic" curves for B 18 swirl plate.
Line (
Line (
Line (
Line (
Line (
Line (
000') : After cycles performed (0.79*P+9.4).
****) :After 50 cycles performed (0.78*P+8.9).
- -' ) : After 75 cycles performed (0.78*P+8.8).
xxx') : After 100 cycles performed (0.87*P+7).
-. -.') : After 125 cycles performed (0.84*P+6.9).
— -•) : After 150 cycles performed (0.87*P+6.2).
69
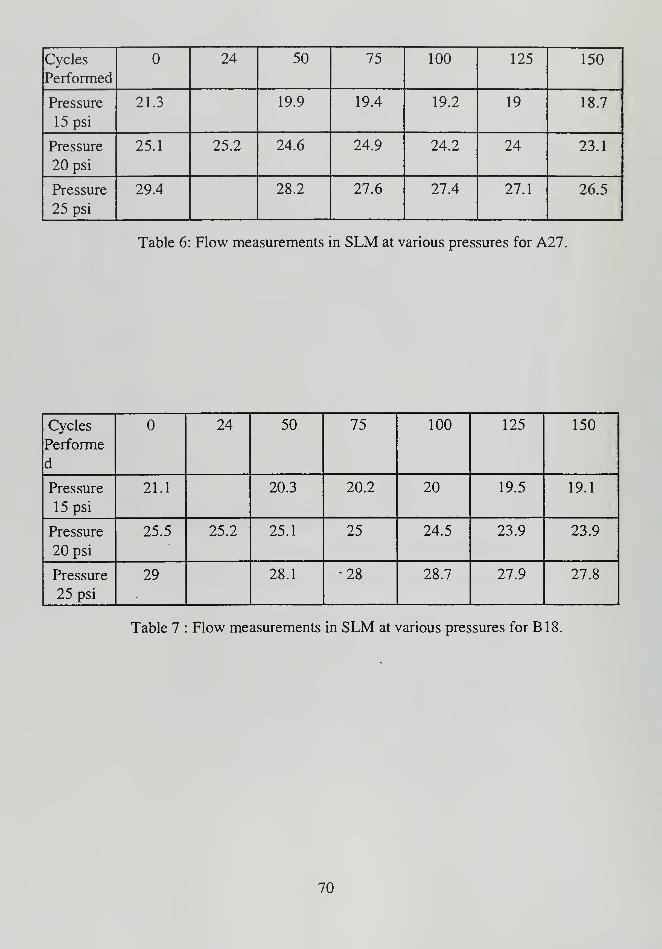
Cycles
Performed
24 50 75 100 125 150
Pressure
15 psi
21.3 19.9 19.4 19.2 19 18.7
Pressure
20 psi
25.1 25.2 24.6 24.9 24.2 24 23.1
Pressure
25 psi
29.4 28.2 27.6 27.4 27.1 26.5
Table 6: Flow measurements in SLM at various pressures for A27.
Cycles
Performe
d
24 50 75 100 125 150
Pressure
15 psi
21.1 20.3 20.2 20 19.5 19.1
Pressure
20 psi
25.5 25.2 25.1 25 24.5 23.9 23.9
Pressure
25 psi
29 28.1 •28 28.7 27.9 27.8
Table 7 : Flow measurements in SLM at various pressures for B 18.
70
10
8c/)
Oo^ 7*+—
o
|e,CO
*5
4-
Q
)(
* points are for the A27
o points are for the Bt8
x
5K
X - - -
50 100 150
number of cycles performed
Figure 49: Average percentage closure of swirl plates hole vs. cycles performed
Cycles
Performe
d
24 50 75 100 125 150
A27 - 3.26 3.99 4.4 5.61 7.78 11.17
B18 - 1.18 1.64 3.0 4.05 5.77 5.81
Table 8 : Average percentage of hole closure for A27 and B 18.
71

72
IV CONCLUSIONS AND RECOMMENDATIONS
A. CONCLUSIONS
1. Experimental Set-Up, Test Method
1. The testing rig that was developed in this study provides a reliable apparatus
that is both easy to use and to modify and is inexpensive and safe in its
operation. The test set-up, efficiently serves the purpose of to supplying the
NAVY (or any other interested part ) with comparative data relative to similar
coking problems of the swirl plates of fuel nozzles in gas turbine engines.
2. Periodic weight measurement of the swirl plate provides information about the
rate of accumulation of deposits. It does not give exact coking rate and cannot
provide information about the distribution of deposits on the plate surfaces or
in holes, but can give a comparative estimation of the potential behaviour of
coking accumulation under given conditions.
3. Optical microscopic examination provides information relative to the coking
distribution along the edge of the holes. It can also be used to further interpret
the estimations made from the weight measurement, either in a qualitative way,
by comparing the pictures taken, or in-a quantitative way by means of the size
of hole calculated from the optical picture using available image software
packages (Image Pro etc.).
4. SEM examination provides a detailed view of the holes, holes edges and the
broad surfaces of the swirl plates. In this way interpretation of the effects of
different surface finish treatments on the coking distribution on both holes and
surface can be made. Again, this interpretation can be quantitative or
qualitative in the same way as the optical pictures. In this study the qualitative
interpretation of the pictures has been used since the hole's size has been
measured with the flow measurements method.
5. The flow measurements can be used for the accurate calculation of the average
percentage closure of holes. However, the information provided is not directly
related to the fuel nozzle's efficiency in a quantitative way. The flow
measurements have considered the isentropic-chocked flow model, which is
an approximation of the actual flow through the holes. Atomization of the fuel
molecules and how this is directly affected by the closures has not been
considered. Also the effects on the spray pattern due to the closure have not
been investigated in this method. More tests related with the factors mentioned
above have to be performed before definite conclusions can be made relative to
the fuel nozzles efficiency and how is this affected by the swirl plates
73
depositions . The flow measurements can be used however to compare relative
flow differences which can be directly correlated to the hole closure for two
different types of swirl plates subjected to similar conditions.
6. The holes position nomenclature used in the experiment has been proved very
useful in the case of swirl plates which have holes drilled at different angles
depending on the manufacturer.
2. A , A' And B Types Of Swirl Plates Behaviour
1
.
The weight measurements have shown a significantly lower rate of
accumulation of deposits on the B (Du Pont) type of swirl plate as compared
with the A (Parker production) type swirl plate that is already in use on the
E- 2 aircraft, from 50 up to 70% less. Much less difference is observed in the
accumulation rate between A and A' (Parker polished swirl plates). A' had a
rate of accumulation at 20 % jess than A.
2. Optical microscopy investigation showed results that are in agreement with the
weight measurements. Much more coking was evident around the edges of the
holes for the A type swirl plate compares to the B type swirl plate. (Figures 15
through 29) following the higher accumulation rate observed in A type in
comparison with the B type.
3. SEM investigation revealed more coking for the A type than the B type of swirl
plate, and that this was mainly accumulated around the hole's and not on the
broad surface of the plate (Figures 38-46).
4. The average percentage closure of the holes showed significant closure for the
A type of swirl plate in comparison with the B (35% up to 50%), when both
subjected to the same conditions.
5. The results have not shown any position, according to the nomenclature
described on the swirl plate on which the accumulation of deposits is more
favoured.
6. The suggested solution of polishing of the swirl plates has proved to be
effective according to the data obtained so far. Weight measurements, optical
and SEM investigation and average hole closure has shown much less coking
effects on the B type in comparison with the A type. A significant observation
revealed from the SEM pictures (Figures 44-46) is that the polishing of the
inner hole surface is paricularly effective, since the major coking accumulation
is taking place around the holes and not on the swirl plates surface.
7. The choice between A' type and B type as a potential solution to the problem
seems to favour the B (Du Pont) type of swirl plate. However a final choice
may need to also take into consideration the higher cost of production of the Btype due to the extremely detailed drilling and polishing procedure, cost which
74
is based on today's technology, are much more for the B type than the A' type.
Thus more data should be obtained for the A' type swirl plate in parallel with
the B type. In this way we will be able to conclude which is definitely moreadvantageous from an economic point of view.
8. The pointed ("spiky") deposition observed in some instances on the A type of
swirl plate should not be considered as contributor to the overall holes closure
effect, because it has proved to break under usual flow measurement conditions
where the pressure of the air flowing through the holes is much smaller than
the actual one experienced in service. The effect, however, that might be
evident in the overall gas turbine coking problem (combustion chamber etc.)
need to be examined further since is not uncommon in the swirl plates
deposition (Figures 30-33).
B. RECOMMENDATIONS
1. Experimental Set-Up, Method
1
.
The NOTEBOOK package that was used to control the furnace has proved to
be quite effective but it could also be substituted by another data acquisition
package which includes more features in programming and display the data.
This would probably widen the range of temperature-time profiles that could
be achieved. In the same direction, the use of more strategically placed
thermocouples should provide an overall understanding of the temperature
gradients and heat flow in the rig at various selected places.
2. Instruments to monitor the quality of air in the rig (measuring humidity and
other properties) could be used to assist the understanding of the role that air
properties plays in the coking problem.
3. A future modification of the testing rig could also include the design of a
controlled ventilation system to adjust quantities of air into the rig in the
attempt to approximate working conditions of the fuel nozzle.
4. The results of the method could be used to categorise the quality of swirl
plates, as far the coking resistance concerns, according to a scale. In this way
the reference to a swirl plate type can be done by using this characterising
scaling number which can be directly related with the coking resistance
behaviour. This can be done by assigning a percentage on each one of the
individual parts of the method, namely the weight increase measurement, the
optical and SEM examination and the hole closure calculation. The percentage
has to be representative of the extent that this part of the method is considered
to contribute to the depositions problem. An easy way to do this is the by the
use of a multiplier serving this purpose. By adding the resulting products we
get a total number that can be related with the grading scale established.
75
get a total number that can be related with the grading scale established.
Experimental data based on a larger sampling size could be very helpful on this
direction (see Appendix F).
2. Future Study
1 . The comparative behaviour of A type and A' type of swirl plates has to follow
this investigation in parallel with the A type vs. B type and A' type vs. B type
in order to give more data based on a larger sample.
2. Different coating methods provided by several manufacturers can be tested in
the everlasting attempt of finding the most inexpensive but still effective way
to solve the problem. As the modern aircraft industry is designing higher
performance engines, the problems of coking may be increased and a
compromise has to be found between performance on one side and preventive -
repairing maintenance on the other. The Ta^ and the silica Si02coating
(Appendix C) could easily be the first candidates for an investigation following
this direction.
3. The testing rig can be used also to study the effects of different kind of fuel
types, subjected to the same experimental conditions and various temperature
time profiles. The results could be used for the evaluation of alternative type of
fuels that are currently investigated [Ref. 17, 3].
76
APPENDIX A: CORROSION AND DEPOSITS IN GAS TURBINES
A short description of the corrosion and deposits problem at various parts of a gas
turbine, except on the swirl plates, is included in this Appendix.
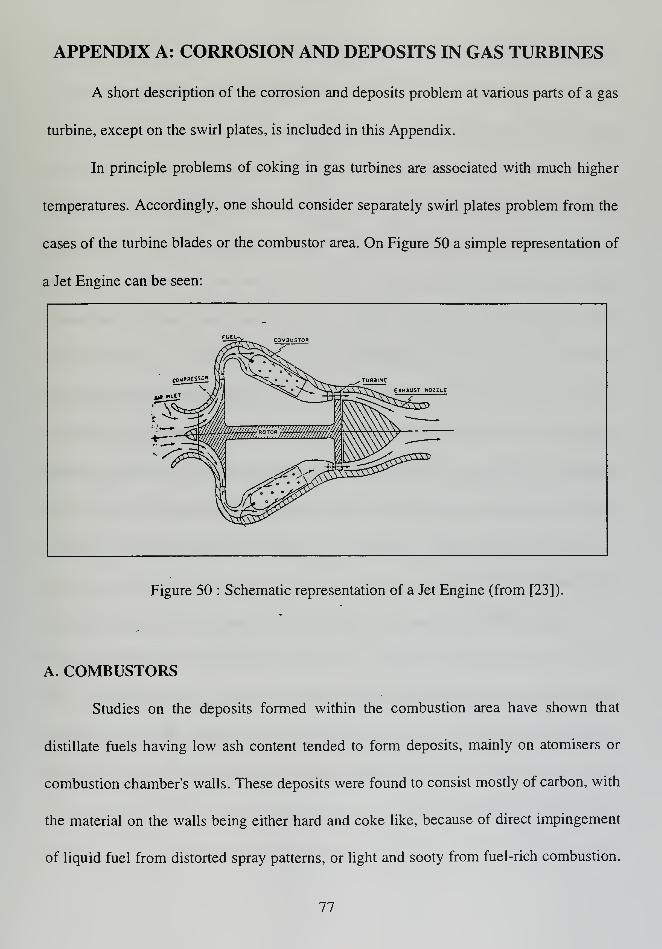
In principle problems of coking in gas turbines are associated with much higher
temperatures. Accordingly, one should consider separately swirl plates problem from the
cases of the turbine blades or the combustor area. On Figure 50 a simple representation of
a Jet Engine can be seen:
EXHAUST NOZZLE
Figure 50 : Schematic representation of a Jet Engine (from [231).
A. COMBUSTORS
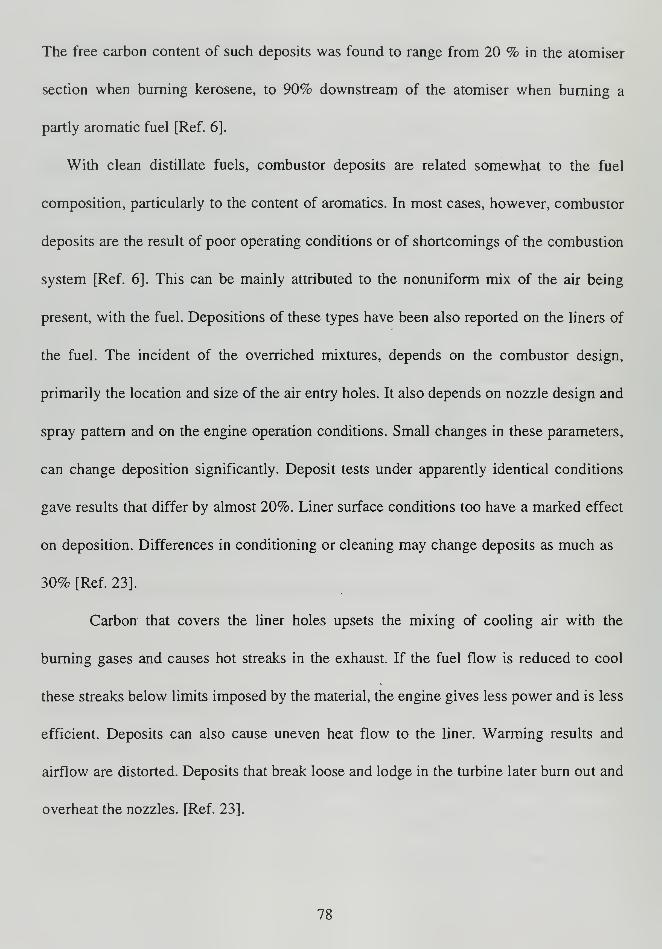
Studies on the deposits formed within the combustion area have shown that
distillate fuels having low ash content tended to form deposits, mainly on atomisers or
combustion chamber's walls. These deposits were found to consist mostly of carbon, with
the material on the walls being either hard and coke like, because of direct impingement
of liquid fuel from distorted spray patterns, or light and sooty from fuel-rich combustion.
77
The free carbon content of such deposits was found to range from 20 % in the atomiser
section when burning kerosene, to 90% downstream of the atomiser when burning a
partly aromatic fuel [Ref. 6].
With clean distillate fuels, combustor deposits are related somewhat to the fuel
composition, particularly to the content of aromatics. In most cases, however, combustor
deposits are the result of poor operating conditions or of shortcomings of the combustion
system [Ref. 6]. This can be mainly attributed to the nonuniform mix of the air being
present, with the fuel. Depositions of these types have been also reported on the liners of
the fuel. The incident of the overriched mixtures, depends on the combustor design,
primarily the location and size of the air entry holes. It also depends on nozzle design and
spray pattern and on the engine operation conditions. Small changes in these parameters,
can change deposition significantly. Deposit tests under apparently identical conditions
gave results that differ by almost 20%. Liner surface conditions too have a marked effect
on deposition. Differences in conditioning or cleaning may change deposits as much as
30% [Ref. 23].
Carbon that covers the liner holes upsets the mixing of cooling air with the
burning gases and causes hot streaks in the exhaust. If the fuel flow is reduced to cool
these streaks below limits imposed by the material, the engine gives less power and is less
efficient. Deposits can also cause uneven heat flow to the liner. Warming results and
airflow are distorted. Deposits that break loose and lodge in the turbine later burn out and
overheat the nozzles. [Ref. 23].
78
COMBUSTION ZONE COOLING ZONE
Figure 51: Deposition on Combustion Chamber (From [6]).
B. ROTORS AND STATORS
Distillate fuels seldom cause trouble with turbine blading. The ash in residual
fuels, however, can lead to serious problems, both in forming deposits and in causing
corrosion. It was evident that Vanadium commonly accounts for half of such typical
deposits and that alkalies are invariably present in at least moderate amounts. A
preferential deposition of Sodium was evident, being consistent with the relative vapour
of Sodium and Vanadium compounds. (Na^ and V2 5
respectively) [Ref. 6, pg. 45].
C. NOZZLES AND BURNERS
Study of the problems of most concern when burning residual fuel, that refer to
corrosion of metal parts by "slag - forming " constituents and deposit formation on
nozzles and buckets, has shown that in experimental gas turbines, only 1 to 2 lb. of ash
accumulation at the first stage nozzle can cause an appreciable decrease in efficiency and
capacity. This study gave some conclusions about what could be the preferable
79
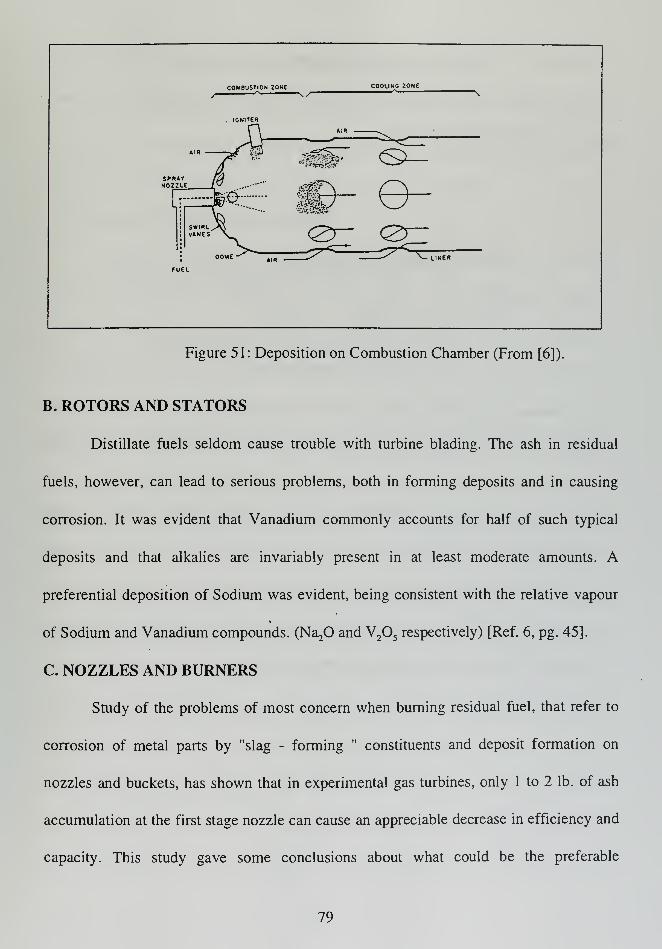
percentage of Vanadium, Sodium and Calcium in the ash formed. The results of the
experiment can be seen on Figure 52 for different cases. More studies are in progress for
the same problem [Ref. 6, pg. 46].
2300
2_ o
K 2100o2
| | I I I I 1 I I I I I I I I I
fNo=4Test 2-1 < Co = 6
-!«/(5Vih a'1 Li ,N
I I 1 I I
6 100 200 300 400 500 600 700 800 900
Hours Fired Operation on Residual Fuel
Figure 52: Rate of deposit accumulation in gas turbines burning Bunker C fuel (from [6]).
Jet engines used in aircrafts operate over a wide range of pressures. Ambient
pressure ranges from 1 atmosphere at sea level to less than 1/8 of atmosphere at 5000 ft.
The burner has to afford complete combustion at high altitude and yet not form deposits
at sea level. High altitude combustion is favoured by smaller openings in the dome and
consequently less air. But this favours deposition also and so a compromise has to be
achieved [Ref. 23].
80
APPENDIX B: CHEMICAL FACTORS
On the following appendix a description of the major chemical factors
participating in the depositions accumulation are described. The major references for this
part were from [Ref. 8, 6, 24].
A. SINTERING CHARACTERISTICS
According to a definition, sintering refers to particle coalescence of a powder
aggregate by diffusion that is accomplished by firing at an elevated temperature. [Ref. 25,
pg. 784]. Although the particles of ash may arrive at a surface by physical transport,
accumulation of ash to form massive deposits will depend largely on the adherence of
particle to particle. When the adherence is weak, only thin layers of deposits will be
formed, those being easy to break and removed (considering flowing gas conditions
within the combustion chambers or fuel flow through the nozzle's holes). When the
adherence is strong however, ash will continue to build up into thicker and thicker layers
[Ref. 6].
The sintering characteristics of the deposits are affected by factors like: chemical
composition, nature of minerals in the fuel, time-temperature history during combustion,
the atmosphere where the engine is working, the temperature and the time, at which the
ash particles are in contact together. Among these, time, temperature and turbulence
during combustion are probably the most important. Many of the initial chemical
reactions between solids, occur in the "flame", where the higher turbulence ensures
frequent collisions between particles and consequently more favourable conditions for
chemical reactions. A possible formation of a liquid phase by these reactions leads to
81
capture of other particles, by the liquid droplet and the eventual formation of a particle
large enough to be caught by a surface through inertial impaction. It should be mentioned
also, that a liquid phase is more likely to ensure adherence to a solid [Ref. 6].
Some of the particles included in deposits such as Si2 3
, although not molten,
may have a highly viscous surface, even at temperatures as low as 2000 F. Also, a lot of
refr actory particles sintei well below their melting point. For instance studies have shown
that A12 3
can be sintered into a thoirugnly vitrified body at 3300 F, even though the
melting point is 3660 F In general, these systems, are very complex and that makes it
difficult to relate composition to sintering tendency. Empirical and experimental methods
have been used to verify a relation of the above type. A general result found was that the
sintering behaviour increases, with the alkali content. Less direct relations have been
investigated wi'h Sodium and other deposits constituents [Ref. 6].
B. FLUXING EFFECT OF ALKALIES
Sodium and Potassium, can play an important role in inducing sintering.
Compounds of these elements are usually highly reactive and the alkalies can form low
melting silicates. The alkalies can also form eutectics with CaS04and MgS0
4that might
lead to serious fouling problems [Ref. 6].
C. CHEMICAL REACTIONS
The reaction patterns associated with the combustion of fuel in gas turbines can be
based on the basis of two schemes according to a basic study performed by Robert N.
Hazlett, James M Hall and Martha Matson ; autoxidation and pyrolysis [Ref. 8]. The
latter controls the high temperature reactions 900 F (482 C ) and above and autooxidation
82
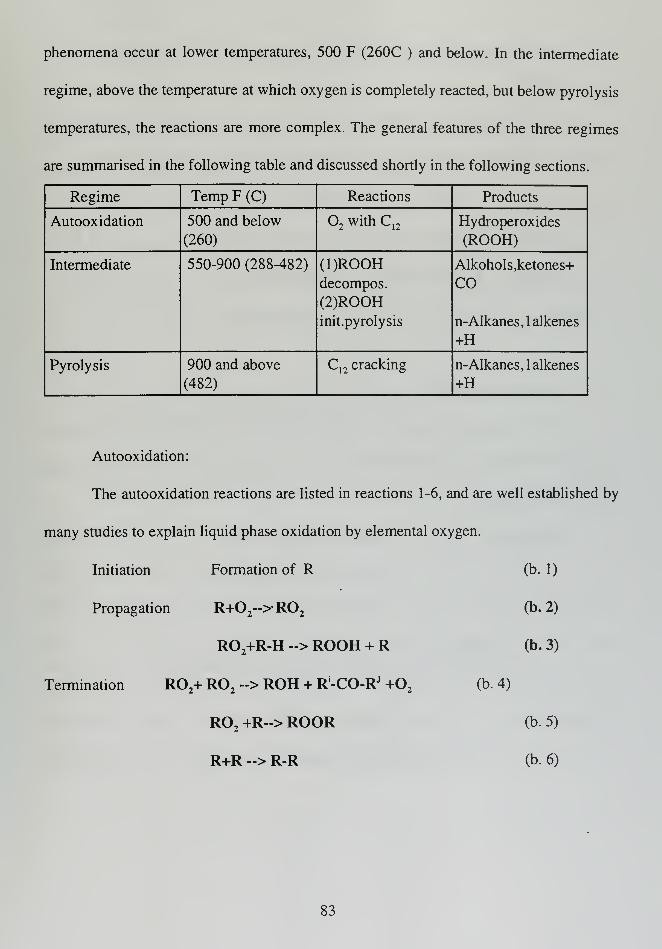
phenomena occur at lower temperatures, 500 F (260C ) and below. In the intermediate
regime, above the temperature at which oxygen is completely reacted, but below pyrolysis
temperatures, the reactions are more complex. The general features of the three regimes
are summarised in the following table and discussed shortly in the following sections.
Regime Temp F (C) Reactions Products
Autooxidation 500 and below2with C
12Hydroperoxides
(260) (ROOH)
Intermediate 550-900 (288-482) (l)ROOH Alkohols,ketones+
decompos. CO(2)ROOHinit.pyrolysis n-Alkanes, 1 alkenes
+H
Pyrolysis 900 and above C12cracking n-Alkanes, 1 alkenes
(482) +H
Autooxidation:
The autooxidation reactions are listed in reactions 1 -6, and are well established by
many studies to explain liquid phase oxidation by elemental oxygen.
Initiation Formation of R (b. 1)
Propagation
Termination
R+02~>R0
2
RO,+R-H --> ROOH + R
R02+ R0
2--> ROH + R-CO-RJ +0
2
RO, +R~> ROOR
(b.4)
R+R --> R-R
(b.2)
(b.3)
(b.5)
(b.6)
83
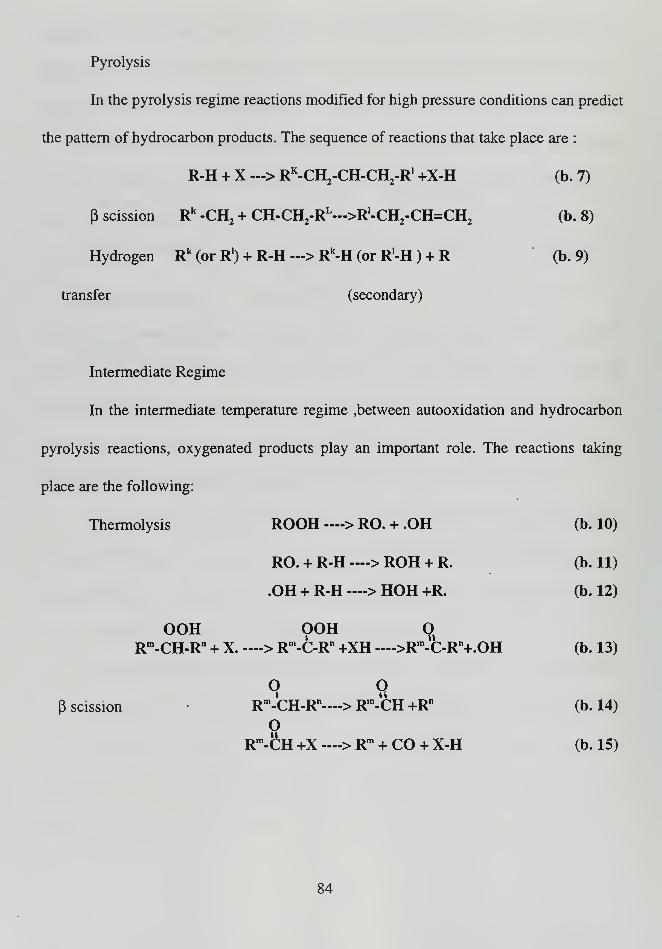
Pyrolysis
In the pyrolysis regime reactions modified for high pressure conditions can predict
the pattern of hydrocarbon products. The sequence of reactions that take place are :
R-H + X —> RK-CH2-CH-CH
2-RI +X-H (b. 7)
p scission Rk -CI^ + CH-CH^—>R'-CH2-CH=CH
2 (b. 8)
Hydrogen Rk(or R') + R-H —> Rk-H (or R'-H ) + R (b. 9)
transfer (secondary)
Intermediate Regime
In the intermediate temperature regime ,between autooxidation and hydrocarbon
pyrolysis reactions, oxygenated products play an important role. The reactions taking
place are the following:
Thermolysis ROOH—> RO. + .OH (b. 10)
RO. + R-H—> ROH + R. (b. 11)
.OH + R-H—> HOH +R. (b. 12)
OOH OOH ORm-CH-Rn + X.—> Rm-C-Rn +XH—>Rm-C-Rn+.OH (b. 13)
o qp scission Rm-CH-Rn—> Rm-CH +Rn
(b. 14)
ORm-£H +X—> Rm + CO + X-H (b. 15)
84
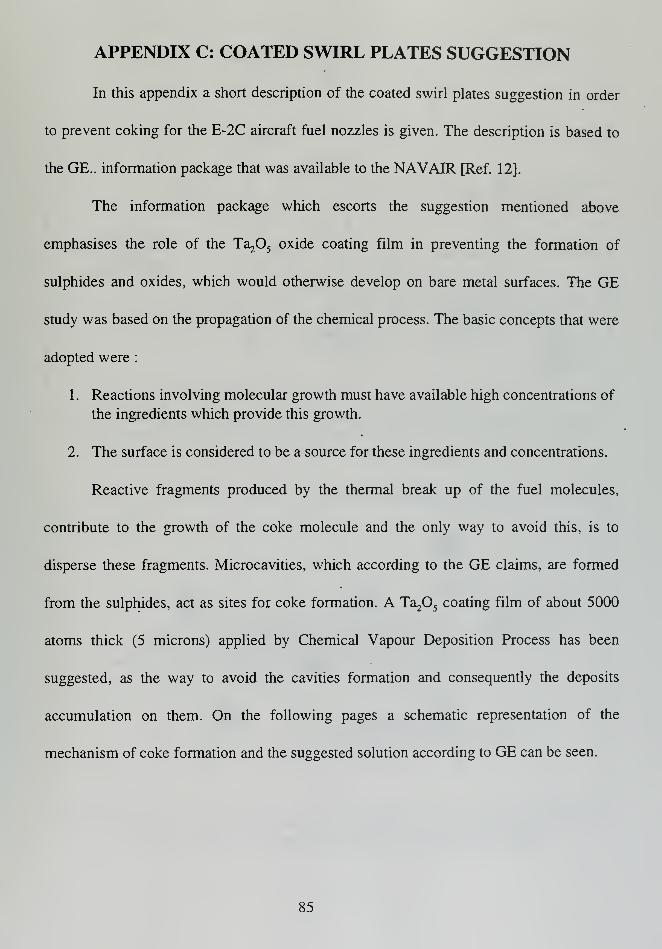
APPENDIX C: COATED SWIRL PLATES SUGGESTION
In this appendix a short description of the coated swirl plates suggestion in order
to prevent coking for the E-2C aircraft fuel nozzles is given. The description is based to
the GE.. information package that was available to the NAVAIR [Ref. 12].
The information package which escorts the suggestion mentioned above
emphasises the role of the TajOj oxide coating film in preventing the formation of
sulphides and oxides, which would otherwise develop on bare metal surfaces. The GE
study was based on the propagation of the chemical process. The basic concepts that were
adopted were :
1
.
Reactions involving molecular growth must have available high concentrations of
the ingredients which provide this growth.
2. The surface is considered to be a source for these ingredients and concentrations.
Reactive fragments produced by the thermal break up of the fuel molecules,
contribute to the growth of the coke molecule and the only way to avoid this, is to
disperse these fragments. Microcavities, which according to the GE claims, are formed
from the sulphides, act as sites for coke formation. A Ta^ coating film of about 5000
atoms thick (5 microns) applied by Chemical Vapour Deposition Process has been
suggested, as the way to avoid the cavities formation and consequently the deposits
accumulation on them. On the following pages a schematic representation of the
mechanism of coke formation and the suggested solution according to GE can be seen.
85
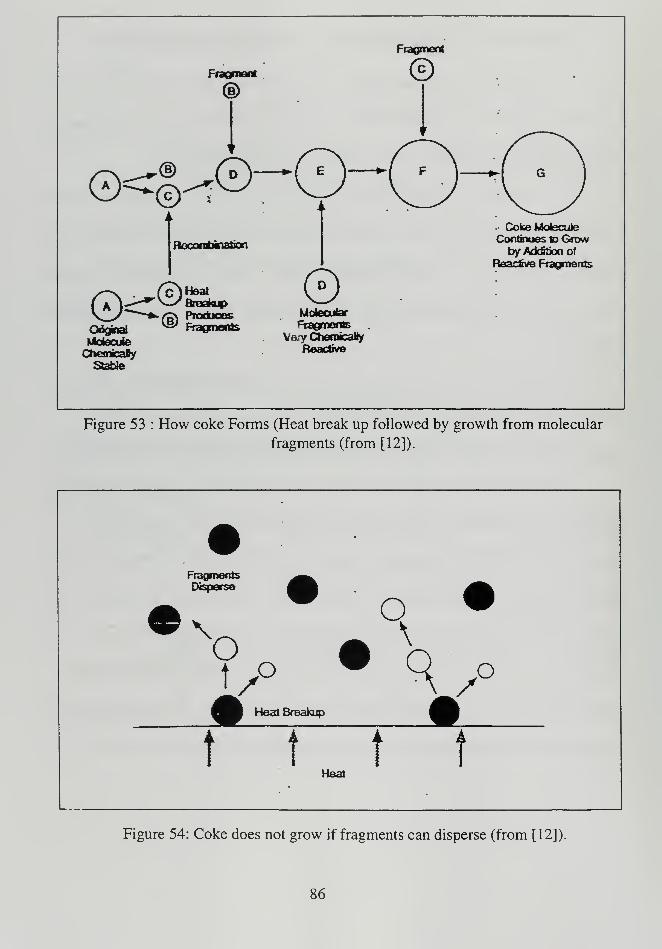
Original
MoteoJeChemicaBy
Stable
© Heat
Breakup©Produces
Fragments
©Coke Molecule
Continues to Growby Addition of
Reactive Fragments
Motecutar
FcagmentsVa^ ChernicaHy
Reactive
Figure 53 : How coke Forms (Heat break up followed by growth from molecular
fragments (from [12]).
•Fragments ^*.Disperse flB ^^^
fl Heal Breakup
t t t IHeat
Figure 54: Coke does not grow if fragments can disperse (from [12]).
86
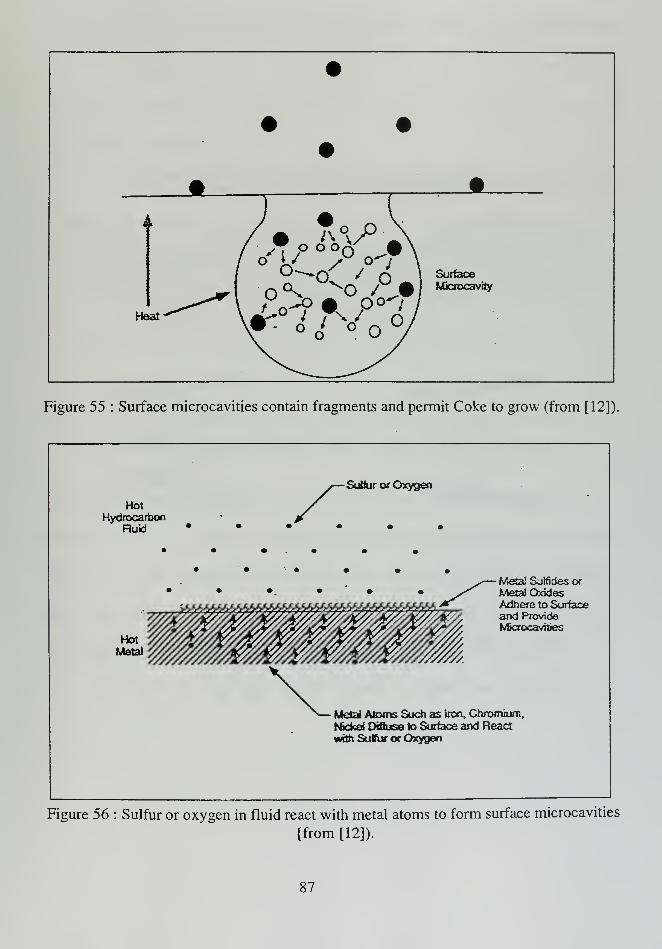
Figure 55 : Surface microcavities contain fragments and permit Coke to grow (from [12]).
Sulfur or Oxygen
HotHydrocarbon
Ruid
Metal Sulfides or
Metal OxidesAdhere to Surfaceand ProvideMicrocavities
Metal Atoms Such as Iron, Chromium.Nickel Diffuse to Surface and Reactwith Sulfur or Oxygen
Figure 56 : Sulfur or oxygen in fluid react with metal atoms to form surface microcavities
{from [12]).
87
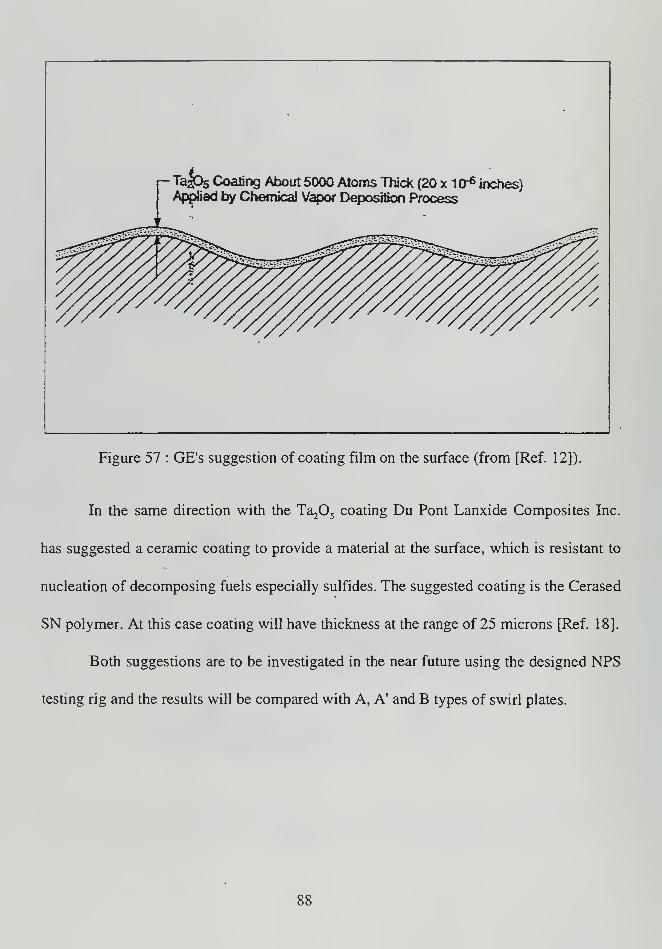
- TaJPs Coating About 5000 Atoms Thick (20 x 1-6
inches)Applied by Chemical Vapor Deposition Process
Figure 57 : GE's suggestion of coating film on the surface (from [Ref. 12]).
In the same direction with the Ta^ coating Du Pont Lanxide Composites Inc.
has suggested a ceramic coating to provide a material at the surface, which is resistant to
nucleation of decomposing fuels especially sulfides. The suggested coating is the Cerased
SN polymer. At this case coating will have thickness at the range of 25 microns [Ref. 18].
Both suggestions are to be investigated in the near future using the designed NPS
testing rig and the results will be compared with A, A' and B types of swirl plates.
88
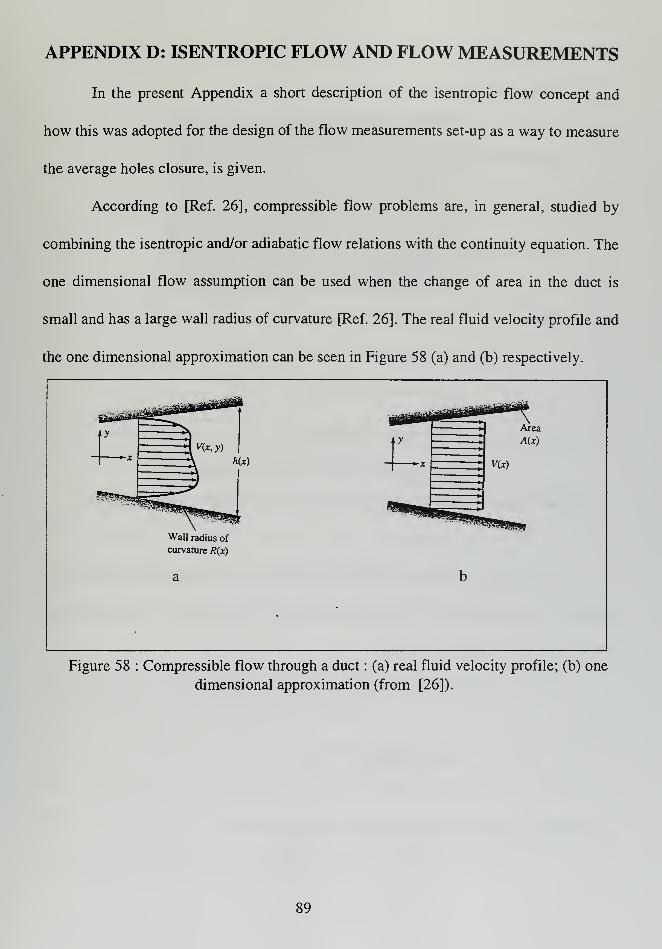
APPENDIX D: ISENTROPIC FLOW AND FLOW MEASUREMENTS
In the present Appendix a short description of the isentropic flow concept and
how this was adopted for the design of the flow measurements set-up as a way to measure
the average holes closure, is given.
According to [Ref. 26], compressible flow problems are, in general, studied by
combining the isentropic and/or adiabatic flow relations with the continuity equation. The
one dimensional flow assumption can be used when the change of area in the duct is
small and has a large wall radius of curvature [Ref. 26]. The real fluid velocity profile and
the one dimensional approximation can be seen in Figure 58 (a) and (b) respectively.
Wall radius of
curvature R(x)
Figure 58 : Compressible flow through a duct : (a) real fluid velocity profile; (b) one
dimensional approximation (from [26]).
89
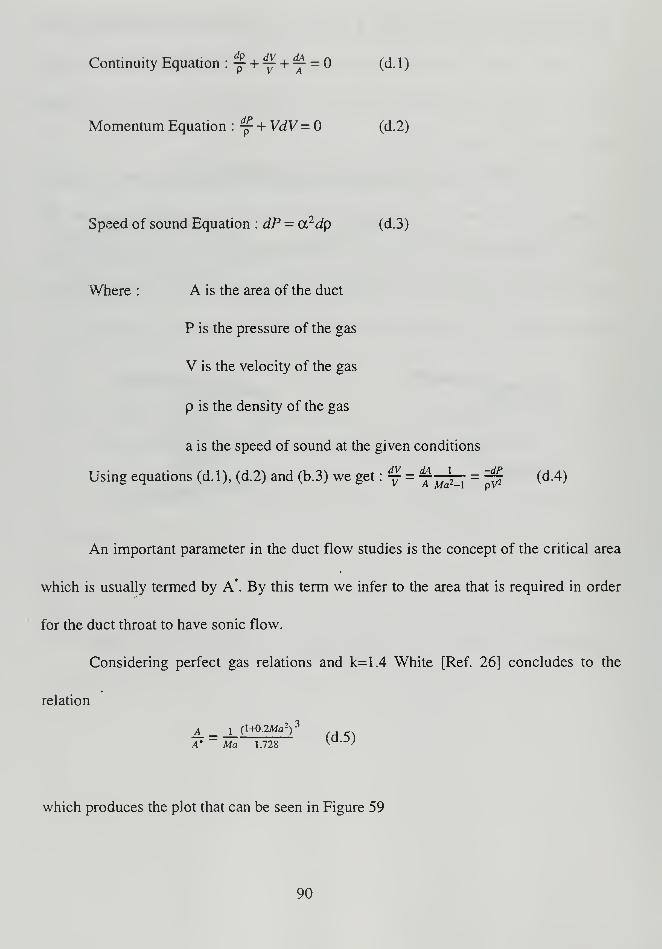
Continuity Equation : % +f + ^ = (d. 1
)
Momentum Equation : f- + VdV = (d.2)
Speed of sound Equation : dP = a2^p (d.3)
Where : A is the area of the duct
P is the pressure of the gas
V is the velocity of the gas
p is the density of the gas
a is the speed of sound at the given conditions
Using equations (d.l), (d.2) and (b.3) we get : f = f^ =^ (d.4)
An important parameter in the duct flow studies is the concept of the critical area
which is usually termed by A*. By this term we infer to the area that is required in order
for the duct throat to have sonic flow.
Considering perfect gas relations and k=1.4 White [Ref. 26] concludes to the
relation
A' Ma 1.728
which produces the plot that can be seen in Figure 59
90
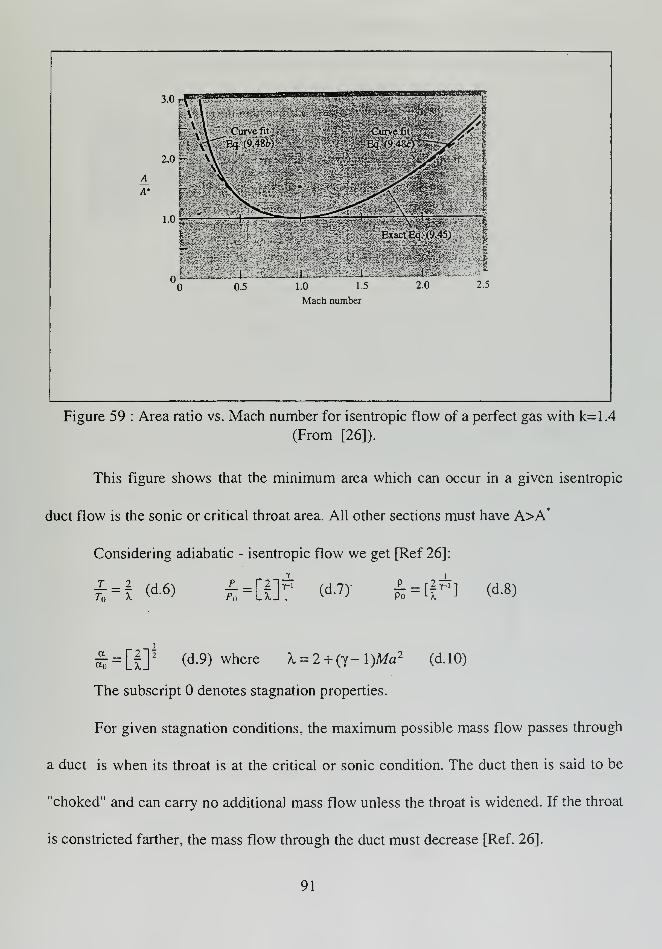
0.5 1.0 1.5
Mach number
Figure 59 : Area ratio vs. Mach number for isentropic flow of a perfect gas with k=1.4
(From [26]).
This figure shows that the minimum area which can occur in a given isentropic
duct flow is the sonic or critical throat area. All other sections must have A>A*
Considering adiabatic - isentropic flow we get [Ref 26]:
i=l (d -6) kAUv (djy
P<>l x J (d.8)
S = [IP (d9 ) where h = 2 + (y- \)Ma 2 (d.10)
The subscript denotes stagnation properties.
For given stagnation conditions, the maximum possible mass flow passes through
a duct is when its throat is at the critical or sonic condition. The duct then is said to be
"choked" and can carry no additional mass flow unless the throat is widened. If the throat
is constricted farther, the mass flow through the duct must decrease [Ref. 26].
91
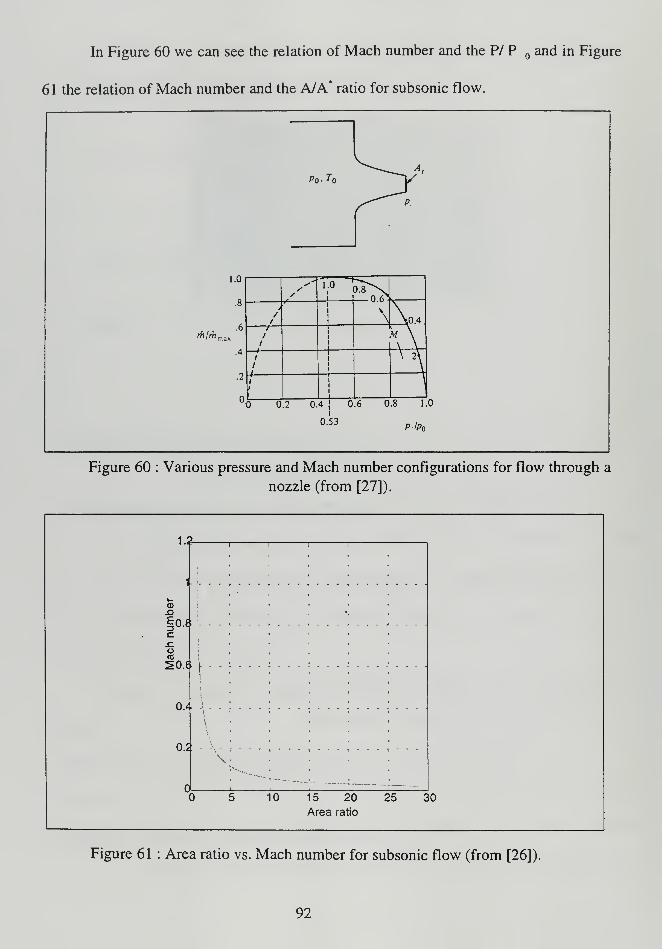
In Figure 60 we can see the relation of Mach number and the P/ P and in Figure
61 the relation of Mach number and the A/A* ratio for subsonic flow.
Po< To
^1.0
.8
.6
m /m mDX
.4
.2
o
//
1,° <
6i
// \ \0.4— /
// 1
M \\ \
/
/
\ rk
i
0.2 0.4 |0.6 0.8 1.0
°« pJp
Figure 60 : Various pressure and Mach number configurations for flow through a
nozzle (from [27]).
1.2
1.1.
JQ
|o.«.cJZo(0
iO.C L
0.^
O.i
"i r
V
10 15 20 25 30
Area ratio
Figure 61 : Area ratio vs. Mach number for subsonic flow (from [26]).
92
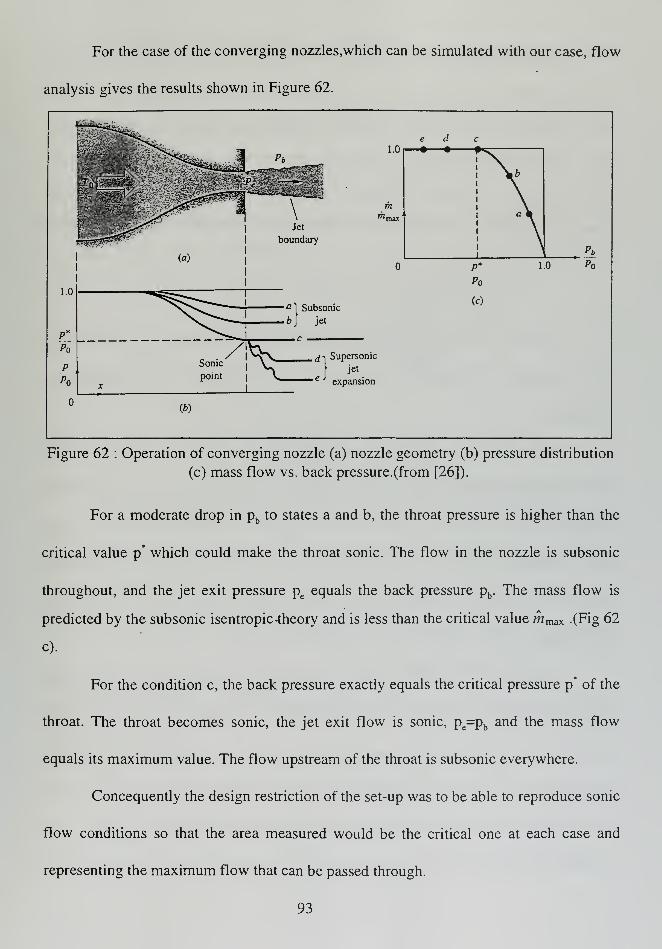
For the case of the converging nozzles,which can be simulated with our case, flow
analysis gives the results shown in Figure 62.
e d1.0 • •
PJ>
Po
a 1 Subsonic
b\ jet
(c)
d iSupersonic
|jet
e expansion
Figure 62 : Operation of converging nozzle (a) nozzle geometry (b) pressure distribution
(c) mass flow vs. back pressure.(from [26]).
For a moderate drop in pbto states a and b, the throat pressure is higher than the
critical value p* which could make the throat sonic. The flow in the nozzle is subsonic
throughout, and the jet exit pressure peequals the back pressure pb
. The mass flow is
predicted by the subsonic isentropic -theory and is less than the critical value m max .(Fig 62
c).
For the condition c, the back pressure exactly equals the critical pressure p* of the
throat. The throat becomes sonic, the jet exit flow is sonic, pe=pband the mass flow
equals its maximum value. The flow upstream of the throat is subsonic everywhere.
Concequently the design restriction of the set-up was to be able to reproduce sonic
flow conditions so that the area measured would be the critical one at each case and
representing the maximum flow that can be passed through.
93
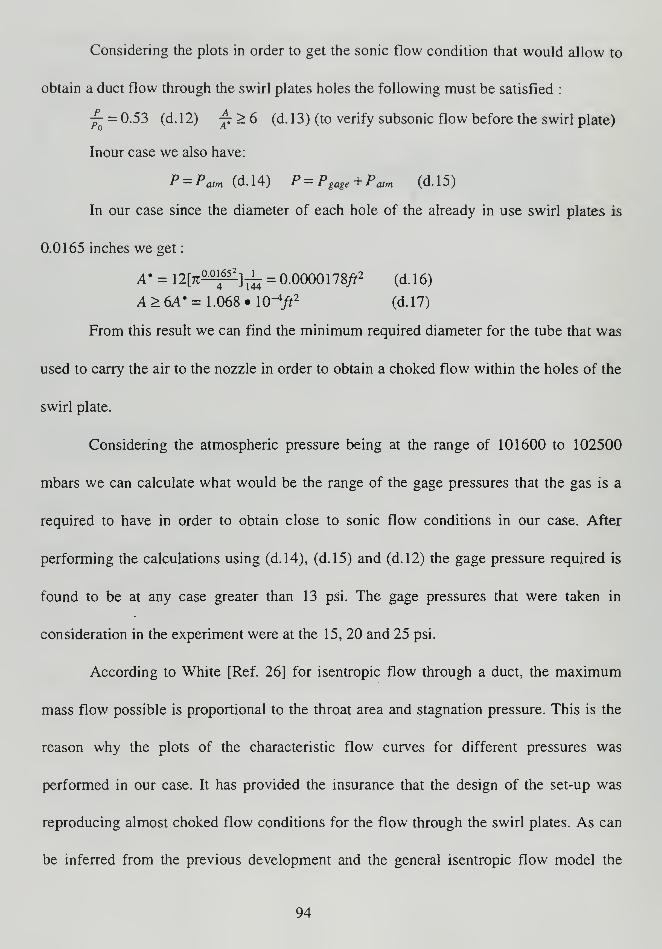
Considering the plots in order to get the sonic flow condition that would allow to
obtain a duct flow through the swirl plates holes the following must be satisfied :
jr = 0.53 (d. 1 2) ^ > 6 (d. 1 3) (to verify subsonic flow before the swirl plate)
Inour case we also have:
P = Patm (d.14) P = Pgage+Patm (d.15)
In our case since the diameter of each hole of the already in use swirl plates is
0.0165 inches we get
:
A* = \2[K^^-]-^ = 0.0000llSft2(d.16)
A>6A* = 1.068»10-4/f2 (d.17)
From this result we can find the minimum required diameter for the tube that was
used to carry the air to the nozzle in order to obtain a choked flow within the holes of the
swirl plate.
Considering the atmospheric pressure being at the range of 101600 to 102500
mbars we can calculate what would be the range of the gage pressures that the gas is a
required to have in order to obtain close to sonic flow conditions in our case. After
performing the calculations using (d.14), (d.15) and (d. 12) the gage pressure required is
found to be at any case greater than 13 psi. The gage pressures that were taken in
consideration in the experiment were at the 15, 20 and 25 psi.
According to White [Ref. 26] for isentropic flow through a duct, the maximum
mass flow possible is proportional to the throat area and stagnation pressure. This is the
reason why the plots of the characteristic flow curves for different pressures was
performed in our case. It has provided the insurance that the design of the set-up was
reproducing almost choked flow conditions for the flow through the swirl plates. As can
be inferred from the previous development and the general isentropic flow model the
94
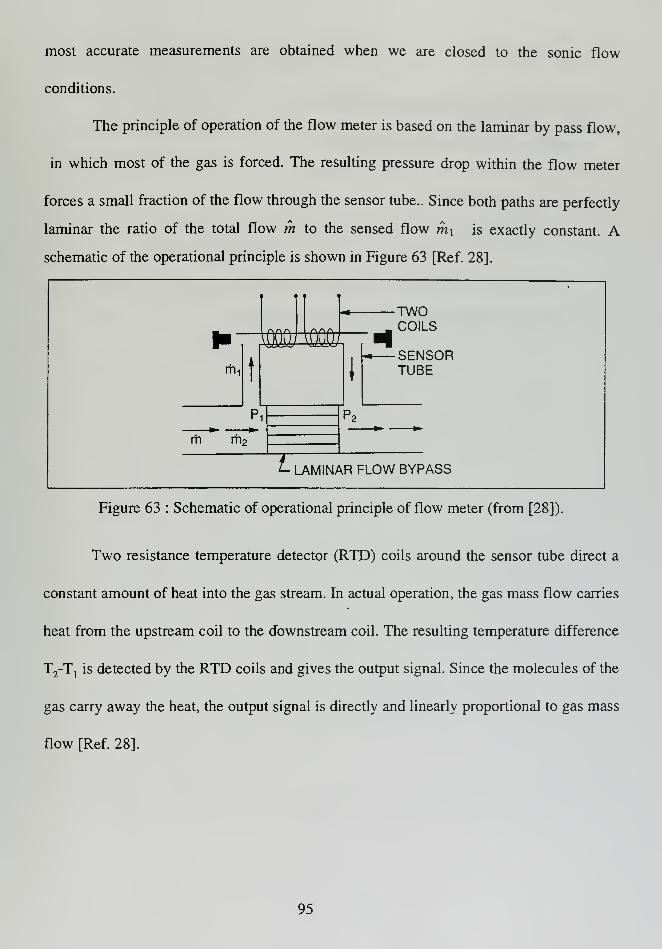
most accurate measurements are obtained when we are closed to the sonic flow
conditions.
The principle of operation of the flow meter is based on the laminar by pass flow,
in which most of the gas is forced. The resulting pressure drop within the flow meter
forces a small fraction of the flow through the sensor tube.. Since both paths are perfectly
laminar the ratio of the total flow m to the sensed flow rh\ is exactly constant. A
schematic of the operational principle is shown in Figure 63 [Ref. 28].
1
AAA r\r\r^
m T\Kir\
. COILS! ^OOOJ 1000/
SENSORTUBErfii
t \
P„"1
9
~2
rh rh
f- LAMINAR FLOW BYPASS
Figure 63 : Schematic of operational principle of flow meter (from [28]).
Two resistance temperature detector (RTD) coils around the sensor tube direct a
constant amount of heat into the gas stream. In actual operation, the gas mass flow carries
heat from the upstream coil to the downstream coil. The resulting temperature difference
T2-T, is detected by the RTD coils and gives the output signal. Since the molecules of the
gas carry away the heat, the output signal is directly and linearly proportional to gas mass
flow [Ref. 28].
95
RTD COILS
EJ^-Hr
FIRST LAW OF THERMODYNAMICS(HEAT IN = HEAT OUT)H = m
lCp(T2 -T 1 ) + H
:=a
m =H-HC
PAT
CONSTANT HEAT, H
Figure 64 : Operation of coils in the Flow meter (from [28]).
Also the flow meter has to be placed at a minimum distance of 10 inches away
from the pressure transducer to reduce turbulence [Ref. 28].
96

APPENDIX E: COMPUTER PROGRAMMING DESCRIPTION
On the following Appendix a desription of the main points of the programme used
to run the testing rig is presented. The references that are associated with this description
are [Ref.20] and [Ref. 29].
#7 #8 #6 #11
#3
1 - - - x + y
#4
#1
TCI
.data display screen #2
TC2-
a
V r
if '
' *-
#9
TC3
#10
#5
Figure 65: Schematic of the programme used in controlling the furnace.
97
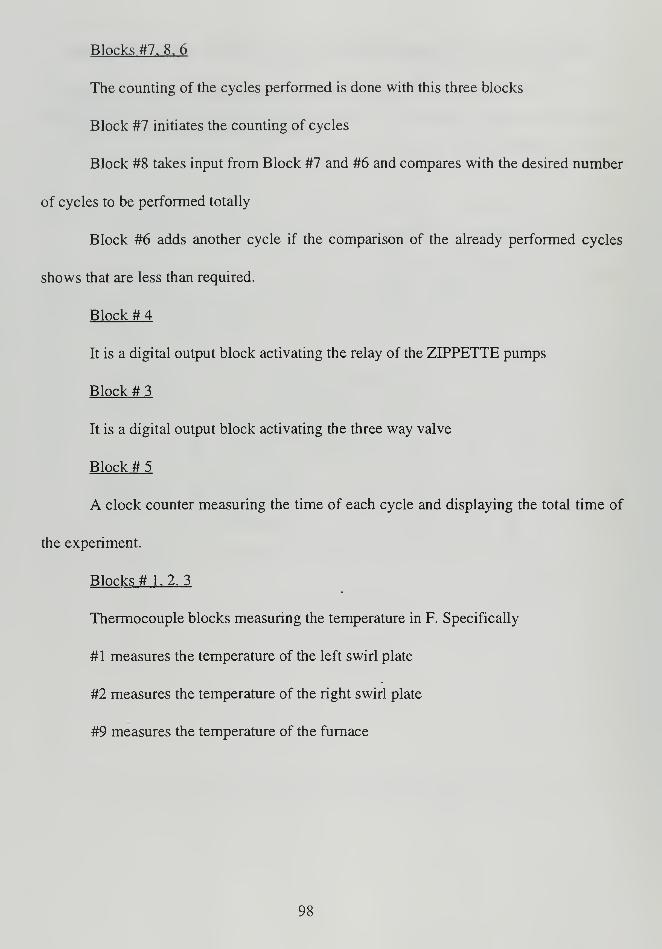
Blocks #7. 8. 6
The counting of the cycles performed is done with this three blocks
Block #7 initiates the counting of cycles
Block #8 takes input from Block #7 and #6 and compares with the desired number
of cycles to be performed totally
Block #6 adds another cycle if the comparison of the already performed cycles
shows that are less than required.
Block # 4
It is a digital output block activating the relay of the ZIPPETTE pumps
Block # 3
It is a digital output block activating the three way valve
Block # 5
A clock counter measuring the time of each cycle and displaying the total time of
the experiment.
Blocks # 1.2.3
Thermocouple blocks measuring the temperature in F. Specifically
#1 measures the temperature of the left swirl plate
#2 measures the temperature of the right swirl plate
#9 measures the temperature of the furnace
98
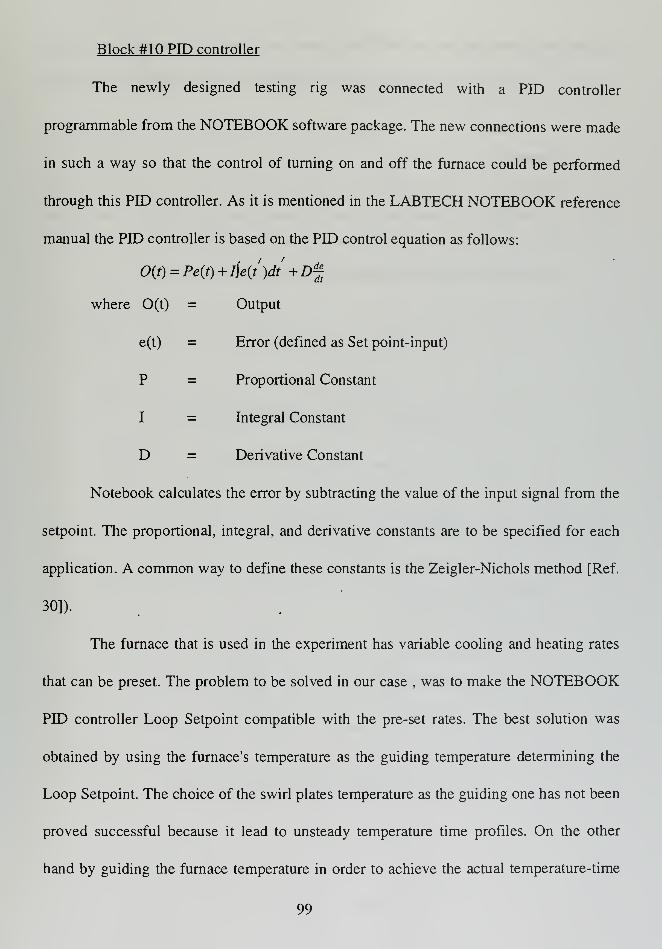
Block #10 PIP controller
The newly designed testing rig was connected with a PID controller
programmable from the NOTEBOOK software package. The new connections were made
in such a way so that the control of turning on and off the furnace could be performed
through this PID controller. As it is mentioned in the LABTECH NOTEBOOK reference
manual the PID controller is based on the PID control equation as follows:
0(f) = Pe(t) + lie(t)dt +Df
where O(t) = Output
e(t) = Error (defined as Set point-input)
P = Proportional Constant
I = Integral Constant
D = Derivative Constant
Notebook calculates the error by subtracting the value of the input signal from the
setpoint. The proportional, integral, and derivative constants are to be specified for each
application. A common way to define these constants is the Zeigler-Nichols method [Ref.
30]).
The furnace that is used in the experiment has variable cooling and heating rates
that can be preset. The problem to be solved in our case , was to make the NOTEBOOK
PID controller Loop Setpoint compatible with the pre-set rates. The best solution was
obtained by using the furnace's temperature as the guiding temperature determining the
Loop Setpoint. The choice of the swirl plates temperature as the guiding one has not been
proved successful because it lead to unsteady temperature time profiles. On the other
hand by guiding the furnace temperature in order to achieve the actual temperature-time
99
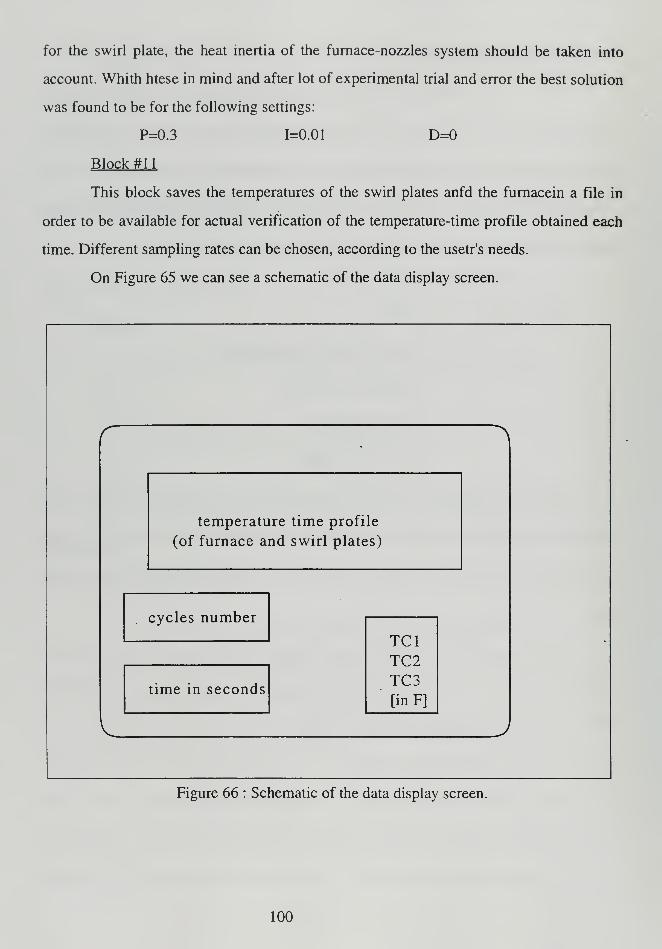
for the swirl plate, the heat inertia of the furnace-nozzles system should be taken into
account. Whith htese in mind and after lot of experimental trial and error the best solution
was found to be for the following settings:
P=0.3 1=0.01 D=0
Block #11
This block saves the temperatures of the swirl plates anfd the furnacein a file in
order to be available for actual verification of the temperature-time profile obtained each
time. Different sampling rates can be chosen, according to the usetr's needs.
On Figure 65 we can see a schematic of the data display screen.
temperature time profile
(of furnace and swirl plates)
cycles number
time in seconds
TCITC2TC3[inF]
Figure 66 : Schematic of the data display screen.
100
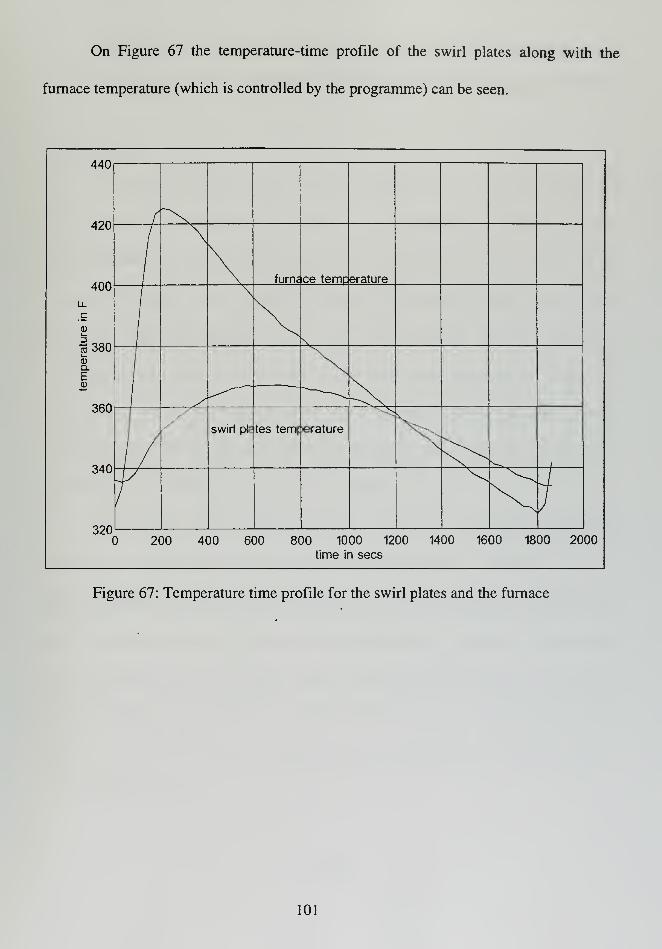
On Figure 67 the temperature-time profile of the swirl plates along with the
furnace temperature (which is controlled by the programme) can be seen.
440
420 \
400
LL
furn< ice temperature
_C
temperature
>
CO
)
CO
>
o
oou
340
320(
swirl pla tes temp>erature
) 200 400 600 800 1000 1200 1400 1600 1800 2000time in sees
Figure 67: Temperature time profile for the swirl plates and the furnace
101

102
APPENDIX F: PRINCIPLES FOR A PROPOSED GRADING
SYSTEM ON THE COKING RESISTANCE OF SWIRL PLATES
A. GENERAL
As mentioned in the last part of the recommendations section, the results obtained
from the methods described in this study can be incorporated to establish a grading
system for the evaluation of coking resistance for the swirl plates. The purpose of this
system is to associate the data obtained from several experiments, and come up with a
numerical value on a grading scale. In this way the people working on practical
applications, who need to know early if the swirl plate suggested is within their
expectations, can decide without getting into the details of the experimental results.
Instead they have to just refer to the grading scale that has been established and check the
number that is available for the questioned swirl plate.
For example in the present programme the experimental method is comprised by
four different measurements/examinations: weight measurements, optical examination ,
SEM examination and flow measurements. Each of these measurements examinations
can be associated with a percentage number representing how reliable the measurement
is in examining the coking problem. In order for these percentage numbers to be assigned
a large number of experiments has to be performed so that a large sampling size is
achieved. This number will be characteristic of the method and can be called the
"characteristic number".
103

Considering the results obtained from each kind of measurement examination,
one could grade them (or put them in a scale) based on comparison with "model"
measurements available and assign them a number. The "model" measurements -
examination results can be either pictures from previous experiments at various coking
conditions (in the case of the optical or SEM examination ), or weight increase and hole
closure numbers (in the case of the weight and flow measurements). The number assigned
will be representative of the result and could be called the "scalar factor".
By multiplying the scalar factor with the respective " characteristic number" and
adding the products we get a number which can be directly associated with a grading
system established in the form of tables with all possible results. This number could be
calle-" the "quality number" and could be arranged such that the higher the numerical
value, the better the resistance to the potential coking accumulation of the swirl plate is.
B. EXAMPLE
A simple example of how the method could be incorporated is shown:
Measurement • Examination method Characteristic number (%)
Weight increase A
Optical Examination B
SEM Examination C
Flow measurements / Hole closure D
Table 9: "Characteristic numbers" of measurements - examinations
( A+B+C+D=100%)
104
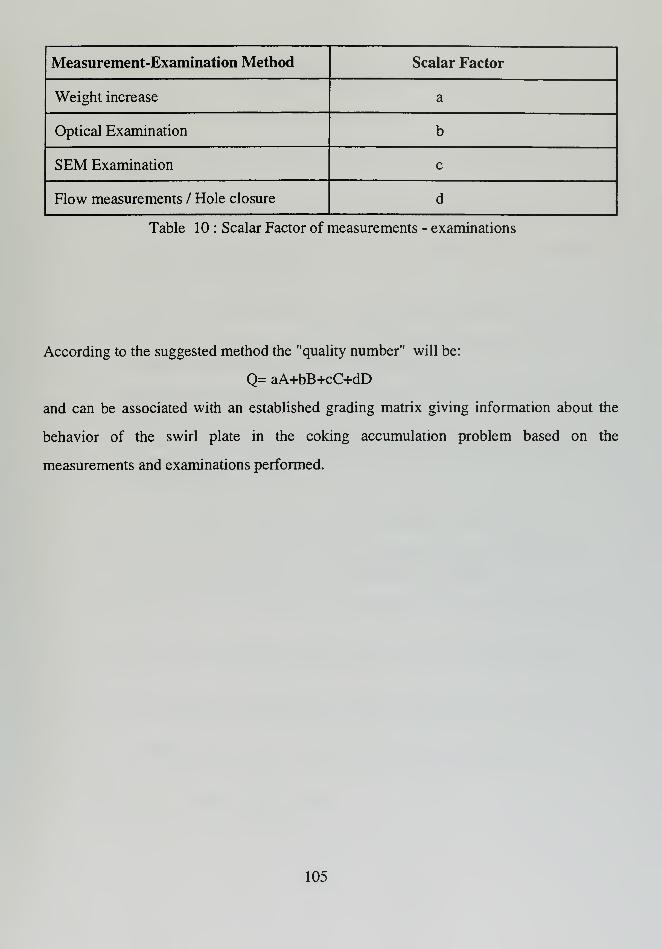
Measurement-Examination Method Scalar Factor
Weight increase a
Optical Examination b
SEM Examination c
Flow measurements / Hole closure d
Table 10 : Scalar Factor of measurements - examinations
According to the suggested method the "quality number" will be:
Q= aA+bB+cC+dD
and can be associated with an established grading matrix giving information about the
behavior of the swirl plate in the coking accumulation problem based on the
measurements and examinations performed.
105

106
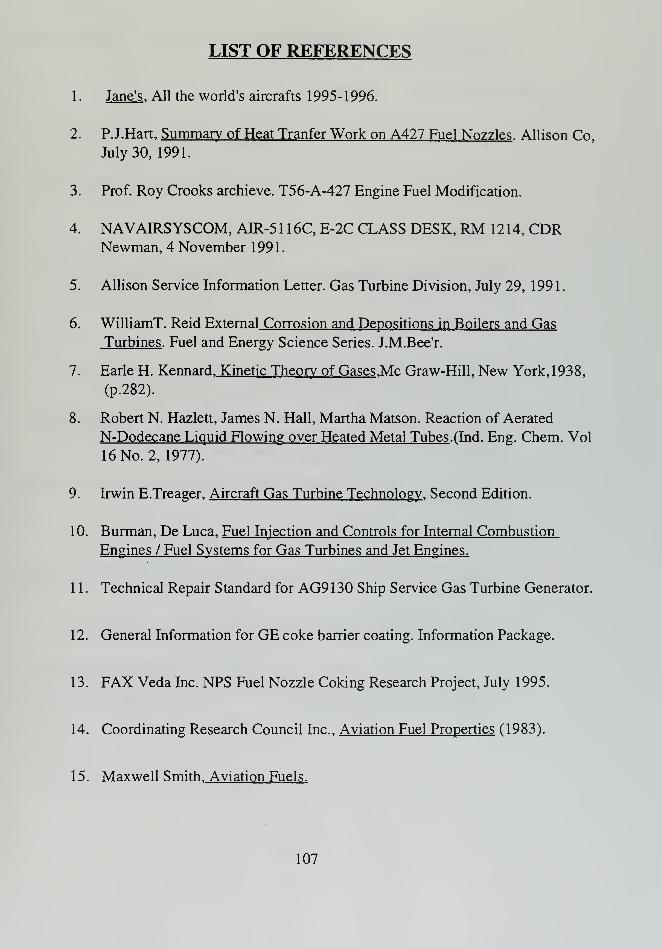
LIST OF REFERENCES
1
.
Jane's . All the world's aircrafts 1995-1 996.
2. P.J.Hart, Summary of Heat Tranfer Work on A427 Fuel Nozzles . Allison Co,
July 30, 1991.
3. Prof. Roy Crooks archieve. T56-A-427 Engine Fuel Modification.
4. NAVAIRSYSCOM, AIR-51 16C, E-2C CLASS DESK, RM 1214, CDRNewman, 4 November 1991.
5. Allison Service Information Letter. Gas Turbine Division, July 29, 1991.
6. WilliamT. Reid External Corrosion and Depositions in Boilers and Gas
Turbines . Fuel and Energy Science Series. J.M.Bee'r.
7. Earle H. Kennard. Kinetic Theory of Gases.Mc Graw-Hill, New York, 1938,
(p.282).
8. Robert N. Hazlett, James N. Hall, Martha Matson. Reaction of Aerated
N-Dodecane Liquid Flowing over Heated Metal Tubes .(Ind. Eng. Chem. Vol
16 No. 2, 1977).
9. Irwin E.Treager, Aircraft Gas Turbine Technology . Second Edition.
10. Burman, De Luca, Fuel Injection and Controls for Internal Combustion
Engines / Fuel Systems for Gas Turbines and Jet Engines.
1 1
.
Technical Repair Standard for AG9130 Ship Service Gas Turbine Generator.
12. General Information for GE coke barrier coating. Information Package.
13. FAX Veda Inc. NPS Fuel Nozzle Coking Research Project, July 1995.
14. Coordinating Research Council Inc., Aviation Fuel Properties (1983).
15. Maxwell Smith. Aviation Fuels.
107
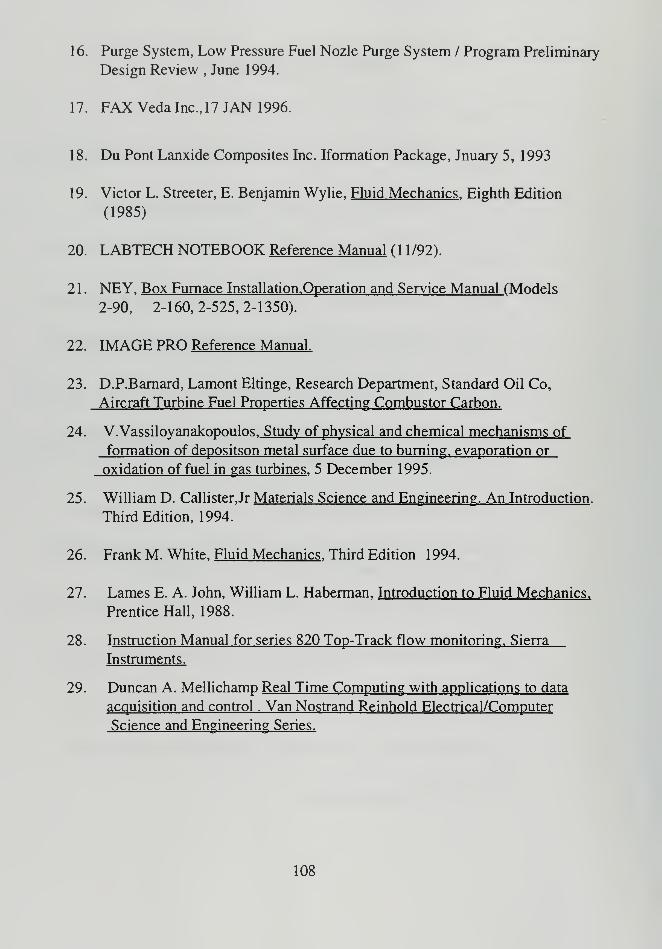
16. Purge System, Low Pressure Fuel Nozle Purge System / Program Preliminary
Design Review , June 1994.
17. FAX Veda Inc., 17 JAN 1996.
18. Du Pont Lanxide Composites Inc. Iformation Package, Jnuary 5, 1993
19. Victor L. Streeter, E. Benjamin Wylie, Fluid Mechanics . Eighth Edition
(1985)
20. LABTECH NOTEBOOK Reference Manual (1 1/92).
2 1
.
NEY, Box Furnace Installation.Operation and Service Manual (Models
2-90, 2-160,2-525,2-1350).
22. IMAGE PRO Reference Manual.
23. D.P.Barnard, Lamont Eltinge, Research Department, Standard Oil Co,
Aircraft Turbine Fuel Properties Affecting Combustor Carbon.
24. V.Vassiloyanakopoulos. Study of physical and chemical mechanisms of
formation of depositson metal surface due to burning, evaporation or
oxidation of fuel in gas turbines . 5 December 1995.
25. William D. Callisterjr Materials Science and Engineering. An Introduction .
Third Edition, 1994.
26. Frank M. White. Fluid Mechanics . Third Edition 1994.
27. Lames E. A. John, William L. Haberman, Introduction to Fluid Mechanics.
Prentice Hall, 1988.
28. Instruction Manual for series 820 Top-Track flow monitoring. Sierra
Instruments.
29. Duncan A. Mellichamp Real Time Computing with applications to data
acquisition and control . Van Nostrand Reinhold Electrical/Computer
Science and Engineering Series.
108
INITIAL DISTRIBUTION LIST
No. of copies
1
.
Defence Technical Information Center 28725 John J. Kingman Rd., STE 0944
Ft. Belvoir, VA 22304-6145
2. Dudley Knox Library 2Naval Postgraduate School
411 DyerRd.
Monterey, CA 93943-5002
3
.
Professor Jeff Perkins Code ME/PS 3Department of Mechanical Engineering
Naval Postgraduate School
Monterey, California 93943-5004
4. CDR Jim Cliftonj
NAVAIR Code 411
1421 Jefferson Davis Hwy.
Arlington, Virginia 22243-5169
5. Mr. Earl Eckj
NAVAIR Code 441
1421 Jefferson Davis Hwy.
Arlington, Virginia 22243-5169
6. Mr. Doug Mearns1
NAVAIR Code : AIR 4-4
<Mgr. Fuels and Lubricants>
Propulsion and Power Division
1421 Jefferson Davis Hwy.
Arlington, Virginia 22243-5169
7. Mr. Wayne Osgood1
VEDA Inc. 1800 North Beaurequet St.
Alexandria, Virginia 2231 1-1708
8. Dean of Instruction Code 061
Naval Postgraduate School
Monterey, California 93943-5000
9. Research Administration, Code 08\
Naval Postgraduate School
Monterey, California 93943-5000
109

10. Department Chairman, Code ME/McDepartment of Mechanical Engineering
Naval Postgraduate School
Monterey, California 93943-5004
1 1
.
Naval Engineering Curricular Office, Code 34
Naval Postgraduate School
Monterey, California 93943-5004
12. Embassy of Greece
Naval Attache
2228 Massachusetts Ave., N.W.
13. LTJG Vassilis Vassiloyanakopoulos
ITTriantafylouSt.
PatissiaGR 11 55
Athens, Greece
110

DUDLEY KNOX LIBRARY
NAVAL POSTGRADUATE SCHOOL
MONTEREY CA 93943-5101

[Mllll I i KJO/ I II1HAH t
3 2768 00323124 2
Related Documents