BioMed Central Page 1 of 14 (page number not for citation purposes) BMC Systems Biology Open Access Research article Multivariate gene expression analysis reveals functional connectivity changes between normal/tumoral prostates André Fujita* 1 , Luciana Rodrigues Gomes 2 , João Ricardo Sato 3 , Rui Yamaguchi 1 , Carlos Eduardo Thomaz 4 , Mari Cleide Sogayar 2 and Satoru Miyano 1 Address: 1 Human Genome Center, Institute of Medical Science, University of Tokyo, 4-6-1 Shirokanedai, Minato-ku, Tokyo, 108-8639, Japan, 2 Chemistry Institute, University of São Paulo, Av. Lineu Prestes, 748, São Paulo-SP, 05508-900, Brazil, 3 Mathematics, Computation and Cognition Center, Universidade Federal do ABC, Rua Santa Adélia, 166 – Santo André, 09210-170, Brazil and 4 Department of Electrical Engineering, Centro Universitário da FEI, Av. Humberto de Alencar Castelo Branco, 3972 – São Bernardo do Campo, 09850-901, Brazil Email: André Fujita* - [email protected] ; Luciana Rodrigues Gomes - [email protected]; João Ricardo Sato - [email protected]; Rui Yamaguchi - [email protected]; Carlos Eduardo Thomaz - [email protected]; Mari Cleide Sogayar - [email protected]; Satoru Miyano - [email protected] * Corresponding author Abstract Background: Prostate cancer is a leading cause of death in the male population, therefore, a comprehensive study about the genes and the molecular networks involved in the tumoral prostate process becomes necessary. In order to understand the biological process behind potential biomarkers, we have analyzed a set of 57 cDNA microarrays containing ~25,000 genes. Results: Principal Component Analysis (PCA) combined with the Maximum-entropy Linear Discriminant Analysis (MLDA) were applied in order to identify genes with the most discriminative information between normal and tumoral prostatic tissues. Data analysis was carried out using three different approaches, namely: (i) differences in gene expression levels between normal and tumoral conditions from an univariate point of view; (ii) in a multivariate fashion using MLDA; and (iii) with a dependence network approach. Our results show that malignant transformation in the prostatic tissue is more related to functional connectivity changes in their dependence networks than to differential gene expression. The MYLK, KLK2, KLK3, HAN11, LTF, CSRP1 and TGM4 genes presented significant changes in their functional connectivity between normal and tumoral conditions and were also classified as the top seven most informative genes for the prostate cancer genesis process by our discriminant analysis. Moreover, among the identified genes we found classically known biomarkers and genes which are closely related to tumoral prostate, such as KLK3 and KLK2 and several other potential ones. Conclusion: We have demonstrated that changes in functional connectivity may be implicit in the biological process which renders some genes more informative to discriminate between normal and tumoral conditions. Using the proposed method, namely, MLDA, in order to analyze the multivariate characteristic of genes, it was possible to capture the changes in dependence networks which are related to cell transformation. Published: 5 December 2008 BMC Systems Biology 2008, 2:106 doi:10.1186/1752-0509-2-106 Received: 29 August 2008 Accepted: 5 December 2008 This article is available from: http://www.biomedcentral.com/1752-0509/2/106 © 2008 Fujita et al; licensee BioMed Central Ltd. This is an Open Access article distributed under the terms of the Creative Commons Attribution License (http://creativecommons.org/licenses/by/2.0 ), which permits unrestricted use, distribution, and reproduction in any medium, provided the original work is properly cited.

Welcome message from author
This document is posted to help you gain knowledge. Please leave a comment to let me know what you think about it! Share it to your friends and learn new things together.
Transcript
BioMed CentralBMC Systems Biology
ss
Open AcceResearch articleMultivariate gene expression analysis reveals functional connectivity changes between normal/tumoral prostatesAndré Fujita*1, Luciana Rodrigues Gomes2, João Ricardo Sato3, Rui Yamaguchi1, Carlos Eduardo Thomaz4, Mari Cleide Sogayar2 and Satoru Miyano1Address: 1Human Genome Center, Institute of Medical Science, University of Tokyo, 4-6-1 Shirokanedai, Minato-ku, Tokyo, 108-8639, Japan, 2Chemistry Institute, University of São Paulo, Av. Lineu Prestes, 748, São Paulo-SP, 05508-900, Brazil, 3Mathematics, Computation and Cognition Center, Universidade Federal do ABC, Rua Santa Adélia, 166 – Santo André, 09210-170, Brazil and 4Department of Electrical Engineering, Centro Universitário da FEI, Av. Humberto de Alencar Castelo Branco, 3972 – São Bernardo do Campo, 09850-901, Brazil
Email: André Fujita* - [email protected] ; Luciana Rodrigues Gomes - [email protected]; João Ricardo Sato - [email protected]; Rui Yamaguchi - [email protected]; Carlos Eduardo Thomaz - [email protected]; Mari Cleide Sogayar - [email protected]; Satoru Miyano - [email protected]
* Corresponding author
AbstractBackground: Prostate cancer is a leading cause of death in the male population, therefore, acomprehensive study about the genes and the molecular networks involved in the tumoral prostateprocess becomes necessary. In order to understand the biological process behind potentialbiomarkers, we have analyzed a set of 57 cDNA microarrays containing ~25,000 genes.
Results: Principal Component Analysis (PCA) combined with the Maximum-entropy LinearDiscriminant Analysis (MLDA) were applied in order to identify genes with the most discriminativeinformation between normal and tumoral prostatic tissues. Data analysis was carried out usingthree different approaches, namely: (i) differences in gene expression levels between normal andtumoral conditions from an univariate point of view; (ii) in a multivariate fashion using MLDA; and(iii) with a dependence network approach. Our results show that malignant transformation in theprostatic tissue is more related to functional connectivity changes in their dependence networksthan to differential gene expression. The MYLK, KLK2, KLK3, HAN11, LTF, CSRP1 and TGM4genes presented significant changes in their functional connectivity between normal and tumoralconditions and were also classified as the top seven most informative genes for the prostate cancergenesis process by our discriminant analysis. Moreover, among the identified genes we foundclassically known biomarkers and genes which are closely related to tumoral prostate, such asKLK3 and KLK2 and several other potential ones.
Conclusion: We have demonstrated that changes in functional connectivity may be implicit in thebiological process which renders some genes more informative to discriminate between normaland tumoral conditions. Using the proposed method, namely, MLDA, in order to analyze themultivariate characteristic of genes, it was possible to capture the changes in dependence networkswhich are related to cell transformation.
Published: 5 December 2008
BMC Systems Biology 2008, 2:106 doi:10.1186/1752-0509-2-106
Received: 29 August 2008Accepted: 5 December 2008
This article is available from: http://www.biomedcentral.com/1752-0509/2/106
© 2008 Fujita et al; licensee BioMed Central Ltd. This is an Open Access article distributed under the terms of the Creative Commons Attribution License (http://creativecommons.org/licenses/by/2.0), which permits unrestricted use, distribution, and reproduction in any medium, provided the original work is properly cited.
Page 1 of 14(page number not for citation purposes)
BMC Systems Biology 2008, 2:106 http://www.biomedcentral.com/1752-0509/2/106
BackgroundCancer is one of the main public health problems in theUnited States and worldwide [1]. Among the diverse typesof neoplasia, prostate cancer is the third most commoncancer in the World [2], being ranked as the second lead-ing cause of death in men, the first being lung cancer [1].Its incidence and mortality varies in different parts of theWorld, being highest in Western countries, mainly amongAfricans [3].
With the widespread use of the prostate-specific antigen(PSA) test, more men are examined, and consequently,identification of patients with asymptomatic low-stagetumors has increased considerably [4,5]. Although themajority of prostate cancers is confined to the prostategland, rarely affecting life expectancy, in about 30% of thecases, a specialized group of cells from the primary tumormass may invade and colonize other distant tissues caus-ing death, therefore, metastatic disease rather than the pri-mary tumor itself is responsible for death, causing theprognosis to be directly related to the spread of the tumor.Unfortunately, the therapeutic approaches used nowa-days against advanced stages of prostatic cancers are noteffective [6]. Therefore, it is extremely important to under-stand the basic molecular biology involved in this diseasein order to prevent the progression of the tumor [6]. How-ever, the identification and analysis of these molecularmechanisms has been hampered by the heterogeneity andhigh molecular complexity of the process involved in thedevelopment of this disease.
In the last few years, several efforts have been madetowards determining the genetic mechanisms involved inthe development of this tumor [6,7]. A widely usedapproach in studying the development of several types ofcancers has been the high-throughput gene expressionmicroarray analysis, which has provided a wealth of infor-mation about tumor marker genes. Conventional meth-ods of microarray data analysis have been systematicallyused to examine the differentially expressed genes [8], andmolecular pathways [9] and discriminative methods havebeen used in order to identify biomarkers [10,11].
In general, discriminant studies focus only on the classifi-cation accuracy of the method and on a pre-step selectionof the features (genes) which best classifies the samples[12]. This selection of features is often carried out byselecting a subgroup of the most differentially expressedgenes [13] or in a multivariate fashion [12]. However,understanding of the structure responsible for regulationof these discriminative set of genes in prostatic cancer isrequired [14].
Many years of intensive research have demonstrated thatsignaling molecules are organized into complex biochem-ical networks. These signaling circuits are complicated sys-
tems consisting of multiple elements interacting in amultifarious fashion. Signaling networks are regulatedboth in time and space [15]; allow the cell to decide whichcellular process (cell division, differentiation, transforma-tion, or apoptosis) is the most appropriate response foreach situation. Due to the high connectivity and complex-ity of these biological systems, small modifications in afew members ("hub" genes, i.e., highly functionally con-nected genes) of these biochemical networks are sufficientto perturb the whole system [16], consequently resultingin a change on the cell's phenotype [17]. Frequently,changes in the relative concentration of molecules, suchas mRNAs and proteins, are the unique parameter ana-lyzed in biological systems. However, the biomolecules'concentration is not the only important variable, but theircompartmentalization and diffusion are also determi-nants of the cell's phenotype. Therefore, these approachesare reductionists in defining a good biomarker as the mostdifferentially expressed gene or protein when comparingdistinct cellular contexts.
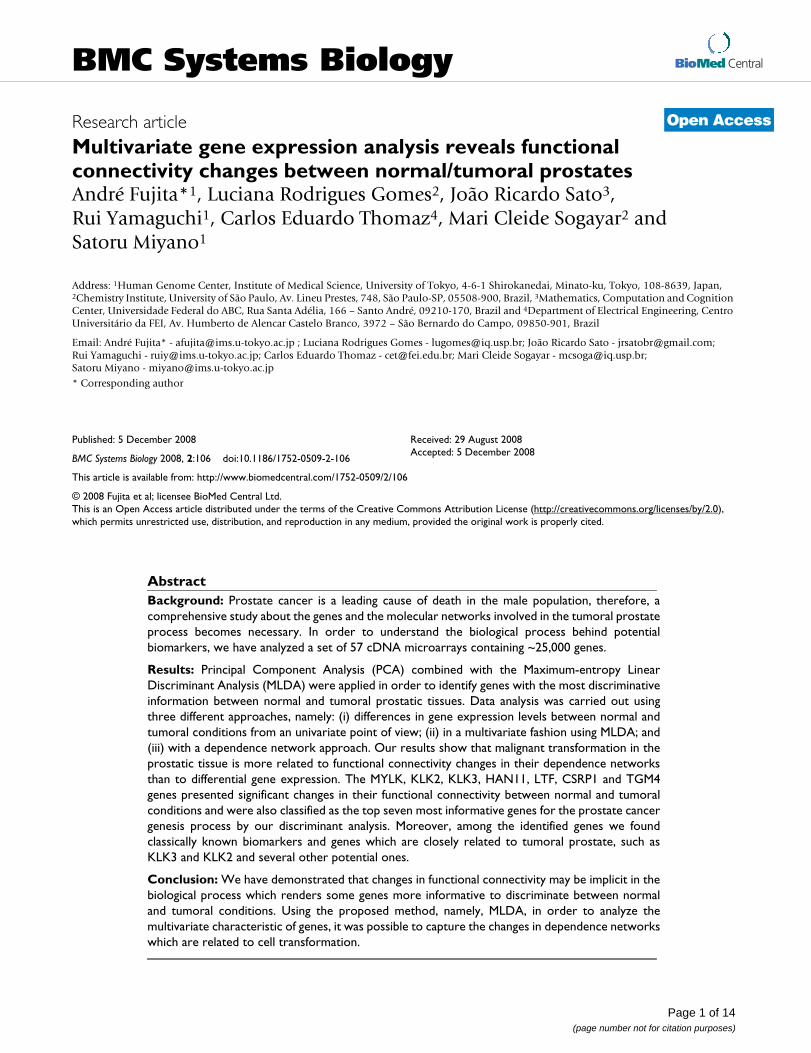
Here, we report a cDNA microarray-based study in pros-tatic cancer aimed at understanding why some genes aregood predictors in discriminating normal versus tumoralsamples and others are not. We demonstrate that the dis-criminative information between normal and tumoralprostates is related to the change in functional connectiv-ity between certain genes and not necessarily in their dif-ferential expression, as has often been assumed.Moreover, we present a systematic and straightforwardapproach based on MLDA (Maximum-entropy Linear Dis-criminant Analysis) to identify putative biomarkers inhigh dimensional data (when the number of features isgreater than the number of observations), and a depend-ence network analysis in order to interprete sets of dis-criminative genes. This idea is illustrated in Figure 1.
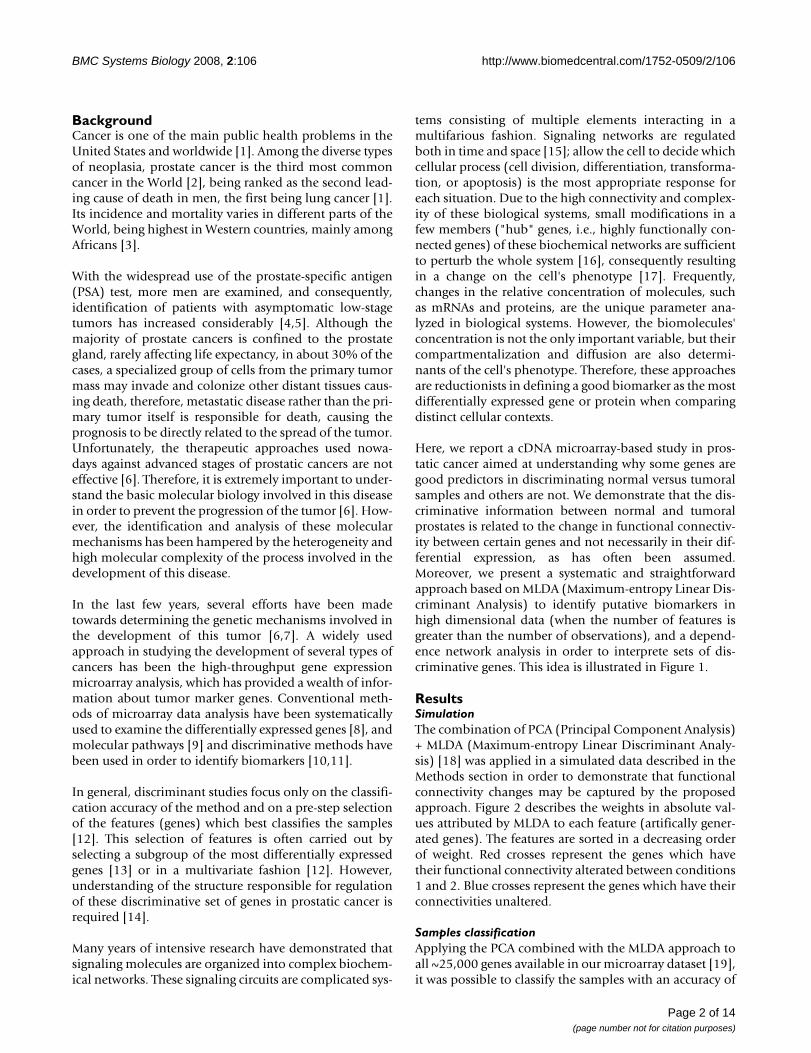
ResultsSimulationThe combination of PCA (Principal Component Analysis)+ MLDA (Maximum-entropy Linear Discriminant Analy-sis) [18] was applied in a simulated data described in theMethods section in order to demonstrate that functionalconnectivity changes may be captured by the proposedapproach. Figure 2 describes the weights in absolute val-ues attributed by MLDA to each feature (artifically gener-ated genes). The features are sorted in a decreasing orderof weight. Red crosses represent the genes which havetheir functional connectivity alterated between conditions1 and 2. Blue crosses represent the genes which have theirconnectivities unaltered.
Samples classificationApplying the PCA combined with the MLDA approach toall ~25,000 genes available in our microarray dataset [19],it was possible to classify the samples with an accuracy of
Page 2 of 14(page number not for citation purposes)
BMC Systems Biology 2008, 2:106 http://www.biomedcentral.com/1752-0509/2/106
96.5% (a misclassification of 2 out of 57 samples), usinga leave-one-out cross validation.
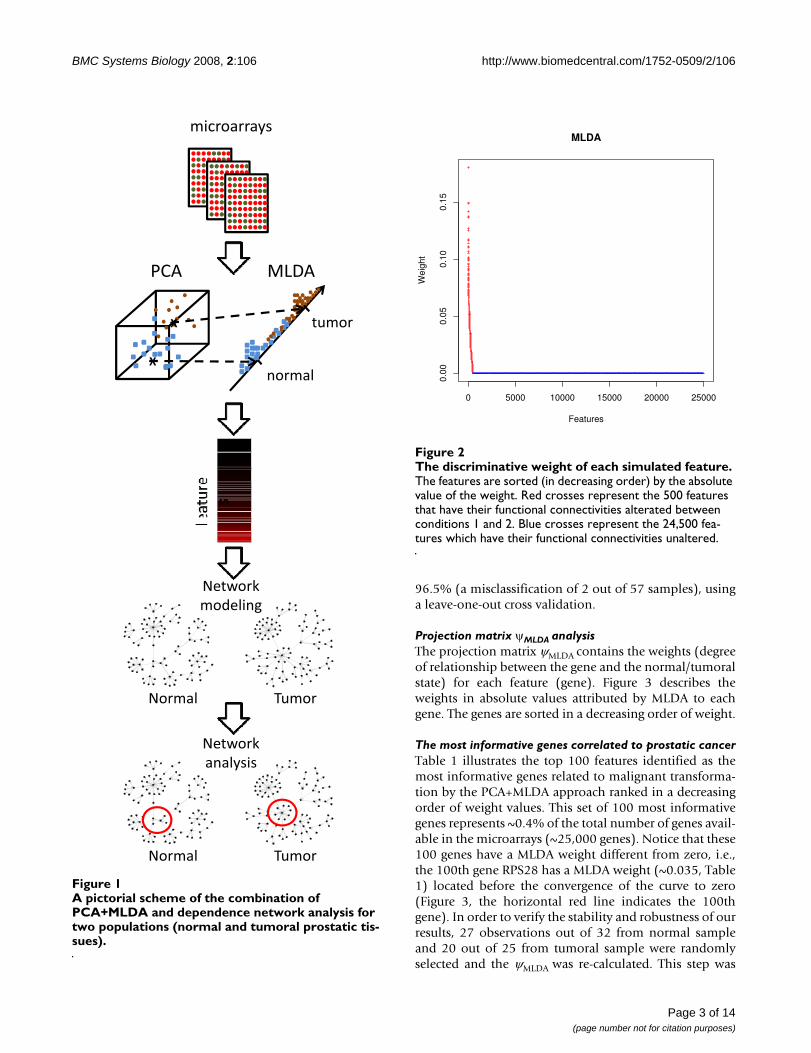
Projection matrix ψMLDA analysisThe projection matrix ψMLDA contains the weights (degreeof relationship between the gene and the normal/tumoralstate) for each feature (gene). Figure 3 describes theweights in absolute values attributed by MLDA to eachgene. The genes are sorted in a decreasing order of weight.
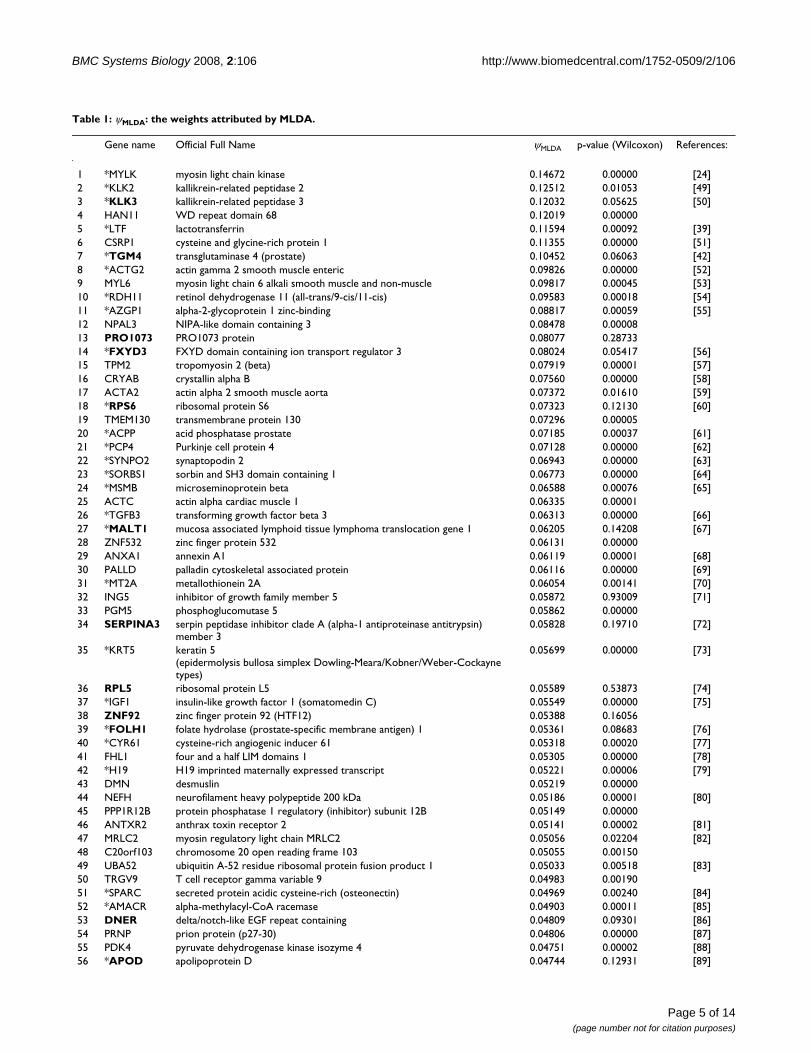
The most informative genes correlated to prostatic cancerTable 1 illustrates the top 100 features identified as themost informative genes related to malignant transforma-tion by the PCA+MLDA approach ranked in a decreasingorder of weight values. This set of 100 most informativegenes represents ~0.4% of the total number of genes avail-able in the microarrays (~25,000 genes). Notice that these100 genes have a MLDA weight different from zero, i.e.,the 100th gene RPS28 has a MLDA weight (~0.035, Table1) located before the convergence of the curve to zero(Figure 3, the horizontal red line indicates the 100thgene). In order to verify the stability and robustness of ourresults, 27 observations out of 32 from normal sampleand 20 out of 25 from tumoral sample were randomlyselected and the ψMLDA was re-calculated. This step was
A pictorial scheme of the combination of PCA+MLDA and dependence network analysis for two populations (normal and tumoral prostatic tissues)Figure 1A pictorial scheme of the combination of PCA+MLDA and dependence network analysis for two populations (normal and tumoral prostatic tis-sues).
����������
����
� �
�
�
����
������
������ �����
�������
��������
������ �����
�������
������
The discriminative weight of each simulated featureFigure 2The discriminative weight of each simulated feature. The features are sorted (in decreasing order) by the absolute value of the weight. Red crosses represent the 500 features that have their functional connectivities alterated between conditions 1 and 2. Blue crosses represent the 24,500 fea-tures which have their functional connectivities unaltered.
0 5000 10000 15000 20000 25000
0.00
0.05
0.10
0.15
MLDA
FeaturesW
eigh
t
Page 3 of 14(page number not for citation purposes)
BMC Systems Biology 2008, 2:106 http://www.biomedcentral.com/1752-0509/2/106
performed 100 times and the mean rank for each gene wasobtained. About 80% of the originally obtained top 100most discriminative genes were ranked as the top 100most discriminative genes.
We have also manually annotated (which we believe bemore accurate than automatic computer-based annota-tion, since it may be more efficient to capture semanticinformation from published articles) this set of 100 genes[see Table 1 and Additional file 1].
Putative differentially expressed genesWe have also searched for differentially expressed genes.About 25% of the genes listed in Table 1 do not presentstatistical evidence to be differentially expressed betweennormal and tumoral conditions.
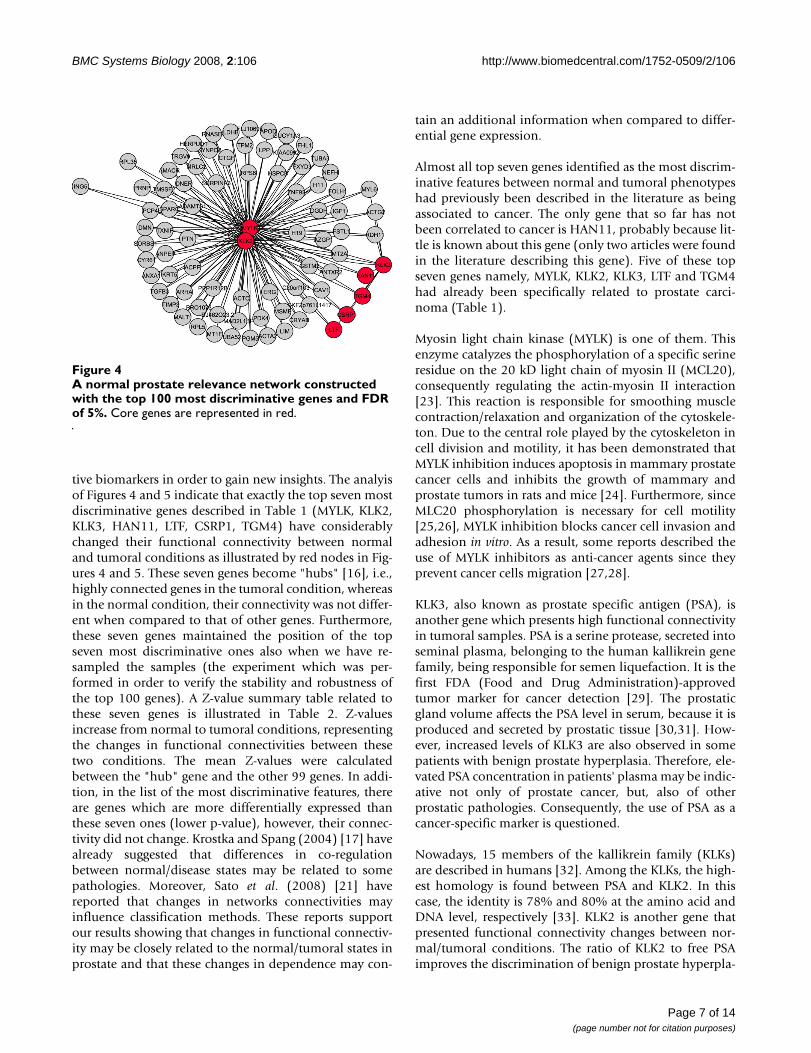
Relevance networksBoth normal and tumoral relevance networks with the top100 most informative genes were constructed, consider-ing a false discovery rate of 5%, being illustrated in Figures4 and 5, respectively. Nodes in red are the genes whichhave their functional connectivity (estimated using thenon-parametric Hoeffding's D measure [20]) changedconsiderably between normal versus tumoral conditions,i.e., they become "hubs" (highly connected genes) [16] intumoral prostates. "Hub" genes were maintained also
when relevance networks were constructed under differ-ent FDR thresholds (1, 5 and 10%).
DiscussionFirstly, the PCA+MLDA approach was applied to a simu-lated data set in order to illustrate that differences in con-nectivity may be behind the oncogenesis process. Sato etal. (2008) [21] have already demonstrated in another con-text (neuroscience) that the information contained in theconnectivity may be useful to sample classification. Thesimulation was performed in a large scale multidimen-sional condition, where the relevant features (genes whichhave the connectivity changed) are only 2% (500 out of25,000 genes). Interestinlgy, MLDA was able to correctlyidentify the discriminative features, represented by redcrosses in Figure 2. Notice that the relevant features fordiscrimination do not present differential expressionbetween conditions 1 and 2 (by construction).
In order to verify whether gene expression data containthe information to discriminate normal from tumoralprostatic samples, we have applied the PCA+MLDAapproach to actual biological data, obtaining a high clas-sification accuracy (96.5%) by the leave-one-out cross-validation. In this case, we have used all the principalcomponents in order to avoid losing information. PCA isapplied regarding computational cost and memory limi-tation. It is important to mention that the numericalresults are identical in the absence of the PCA step [22].Notice that MLDA does not require a pre-step featureselection, because it may also work for high dimensionaldata. Therefore, it was possible to include all of the 25,000genes of the microarray dataset.
Since it was possible to verify that gene expression dataretains information for classification, we analyzed theψMLDA projection matrix which contains the weight valuesfor each feature (gene). Notice that the majority of thegenes shown in Figure 3 have weights near zero, and onlya few genes actually have discriminative information(high weight).
By analyzing Table 1, it is possible to verify that most ofthe 100 informative genes had already been described inthe literature as genes related to cancer (76 genes) and 45genes had specifically been associated to prostate tumor.Interestingly, most of the other 24 genes do not have ref-erences describing their functionality. Therefore, they maybe associated to cancer but have not been studied yet. Thedescription of the 76 genes in the literature corroboratesthe results obtained by the PCA+MLDA method, indicat-ing that these genes are informative to discriminatebetween normal and tumoral samples. The stability androbustnees of this result were verified by obtainingaround 80% of the same top 100 genes when five obser-
The discriminative weight of each geneFigure 3The discriminative weight of each gene. The genes are sorted (in decreasing order) by the absolute value of the weight. The horizontal red line indicates the 100th gene.
Page 4 of 14(page number not for citation purposes)
BMC Systems Biology 2008, 2:106 http://www.biomedcentral.com/1752-0509/2/106
Table 1: ψMLDA: the weights attributed by MLDA.
Gene name Official Full Name ψMLDA p-value (Wilcoxon) References:
1 *MYLK myosin light chain kinase 0.14672 0.00000 [24]2 *KLK2 kallikrein-related peptidase 2 0.12512 0.01053 [49]3 *KLK3 kallikrein-related peptidase 3 0.12032 0.05625 [50]4 HAN11 WD repeat domain 68 0.12019 0.000005 *LTF lactotransferrin 0.11594 0.00092 [39]6 CSRP1 cysteine and glycine-rich protein 1 0.11355 0.00000 [51]7 *TGM4 transglutaminase 4 (prostate) 0.10452 0.06063 [42]8 *ACTG2 actin gamma 2 smooth muscle enteric 0.09826 0.00000 [52]9 MYL6 myosin light chain 6 alkali smooth muscle and non-muscle 0.09817 0.00045 [53]10 *RDH11 retinol dehydrogenase 11 (all-trans/9-cis/11-cis) 0.09583 0.00018 [54]11 *AZGP1 alpha-2-glycoprotein 1 zinc-binding 0.08817 0.00059 [55]12 NPAL3 NIPA-like domain containing 3 0.08478 0.0000813 PRO1073 PRO1073 protein 0.08077 0.2873314 *FXYD3 FXYD domain containing ion transport regulator 3 0.08024 0.05417 [56]15 TPM2 tropomyosin 2 (beta) 0.07919 0.00001 [57]16 CRYAB crystallin alpha B 0.07560 0.00000 [58]17 ACTA2 actin alpha 2 smooth muscle aorta 0.07372 0.01610 [59]18 *RPS6 ribosomal protein S6 0.07323 0.12130 [60]19 TMEM130 transmembrane protein 130 0.07296 0.0000520 *ACPP acid phosphatase prostate 0.07185 0.00037 [61]21 *PCP4 Purkinje cell protein 4 0.07128 0.00000 [62]22 *SYNPO2 synaptopodin 2 0.06943 0.00000 [63]23 *SORBS1 sorbin and SH3 domain containing 1 0.06773 0.00000 [64]24 *MSMB microseminoprotein beta 0.06588 0.00076 [65]25 ACTC actin alpha cardiac muscle 1 0.06335 0.0000126 *TGFB3 transforming growth factor beta 3 0.06313 0.00000 [66]27 *MALT1 mucosa associated lymphoid tissue lymphoma translocation gene 1 0.06205 0.14208 [67]28 ZNF532 zinc finger protein 532 0.06131 0.0000029 ANXA1 annexin A1 0.06119 0.00001 [68]30 PALLD palladin cytoskeletal associated protein 0.06116 0.00000 [69]31 *MT2A metallothionein 2A 0.06054 0.00141 [70]32 ING5 inhibitor of growth family member 5 0.05872 0.93009 [71]33 PGM5 phosphoglucomutase 5 0.05862 0.0000034 SERPINA3 serpin peptidase inhibitor clade A (alpha-1 antiproteinase antitrypsin)
member 30.05828 0.19710 [72]
35 *KRT5 keratin 5 (epidermolysis bullosa simplex Dowling-Meara/Kobner/Weber-Cockayne types)
0.05699 0.00000 [73]
36 RPL5 ribosomal protein L5 0.05589 0.53873 [74]37 *IGF1 insulin-like growth factor 1 (somatomedin C) 0.05549 0.00000 [75]38 ZNF92 zinc finger protein 92 (HTF12) 0.05388 0.1605639 *FOLH1 folate hydrolase (prostate-specific membrane antigen) 1 0.05361 0.08683 [76]40 *CYR61 cysteine-rich angiogenic inducer 61 0.05318 0.00020 [77]41 FHL1 four and a half LIM domains 1 0.05305 0.00000 [78]42 *H19 H19 imprinted maternally expressed transcript 0.05221 0.00006 [79]43 DMN desmuslin 0.05219 0.0000044 NEFH neurofilament heavy polypeptide 200 kDa 0.05186 0.00001 [80]45 PPP1R12B protein phosphatase 1 regulatory (inhibitor) subunit 12B 0.05149 0.0000046 ANTXR2 anthrax toxin receptor 2 0.05141 0.00002 [81]47 MRLC2 myosin regulatory light chain MRLC2 0.05056 0.02204 [82]48 C20orf103 chromosome 20 open reading frame 103 0.05055 0.0015049 UBA52 ubiquitin A-52 residue ribosomal protein fusion product 1 0.05033 0.00518 [83]50 TRGV9 T cell receptor gamma variable 9 0.04983 0.0019051 *SPARC secreted protein acidic cysteine-rich (osteonectin) 0.04969 0.00240 [84]52 *AMACR alpha-methylacyl-CoA racemase 0.04903 0.00011 [85]53 DNER delta/notch-like EGF repeat containing 0.04809 0.09301 [86]54 PRNP prion protein (p27-30) 0.04806 0.00000 [87]55 PDK4 pyruvate dehydrogenase kinase isozyme 4 0.04751 0.00002 [88]56 *APOD apolipoprotein D 0.04744 0.12931 [89]
Page 5 of 14(page number not for citation purposes)
BMC Systems Biology 2008, 2:106 http://www.biomedcentral.com/1752-0509/2/106
vations were excluded randomly from normal sample andfive from tumoral sample in 100 re-calculations. For moredetails about annotation of the top 100 genes and thecomplete list of the ~25,000 genes, please see Additionalfile 2.
Comparing the weights obtained by MLDA and the differ-entially expressed genes, it is surprising that the most dif-ferentially expressed genes are not necessarily the most
discriminative ones. In other words, a multivariate combi-nation of genes may be regulating the normal/tumoralstate, i.e., the combination of genes may contain moreinformation about normal/tumoral conditions than anunivariate differentially expressed gene.
Since it is known that a complex network is involved inthe regulation of several molecular processes, we furtheranalyzed the dependence network involved in these puta-
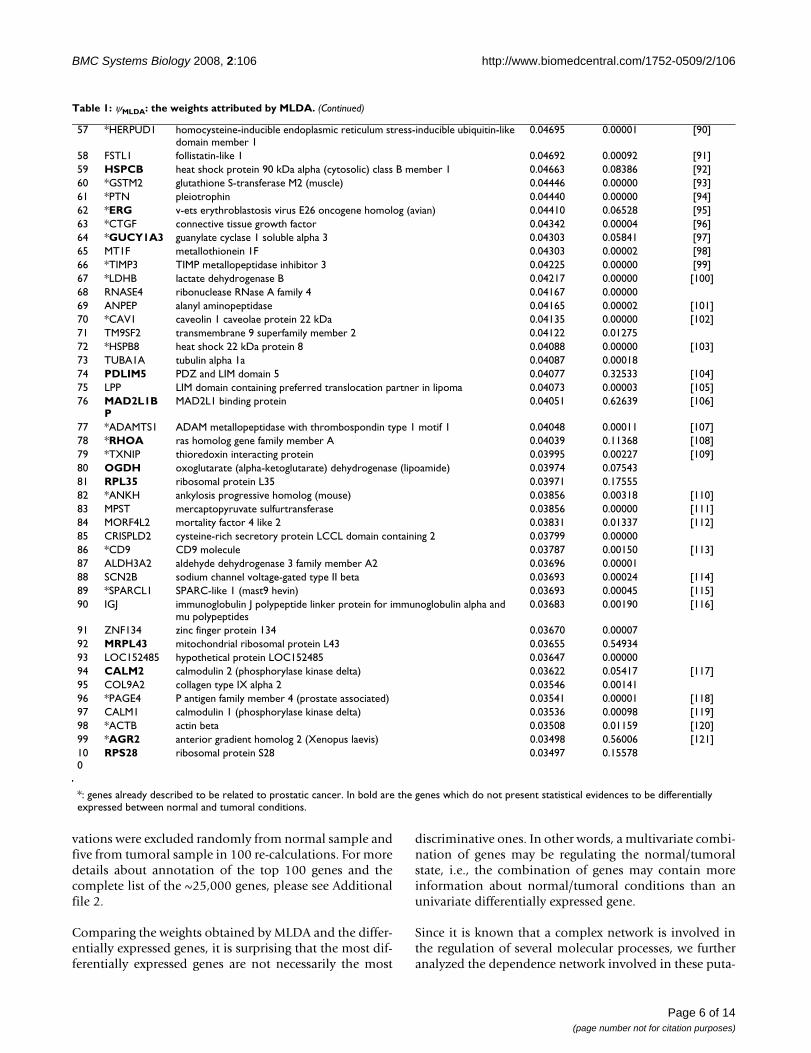
57 *HERPUD1 homocysteine-inducible endoplasmic reticulum stress-inducible ubiquitin-like domain member 1
0.04695 0.00001 [90]
58 FSTL1 follistatin-like 1 0.04692 0.00092 [91]59 HSPCB heat shock protein 90 kDa alpha (cytosolic) class B member 1 0.04663 0.08386 [92]60 *GSTM2 glutathione S-transferase M2 (muscle) 0.04446 0.00000 [93]61 *PTN pleiotrophin 0.04440 0.00000 [94]62 *ERG v-ets erythroblastosis virus E26 oncogene homolog (avian) 0.04410 0.06528 [95]63 *CTGF connective tissue growth factor 0.04342 0.00004 [96]64 *GUCY1A3 guanylate cyclase 1 soluble alpha 3 0.04303 0.05841 [97]65 MT1F metallothionein 1F 0.04303 0.00002 [98]66 *TIMP3 TIMP metallopeptidase inhibitor 3 0.04225 0.00000 [99]67 *LDHB lactate dehydrogenase B 0.04217 0.00000 [100]68 RNASE4 ribonuclease RNase A family 4 0.04167 0.0000069 ANPEP alanyl aminopeptidase 0.04165 0.00002 [101]70 *CAV1 caveolin 1 caveolae protein 22 kDa 0.04135 0.00000 [102]71 TM9SF2 transmembrane 9 superfamily member 2 0.04122 0.0127572 *HSPB8 heat shock 22 kDa protein 8 0.04088 0.00000 [103]73 TUBA1A tubulin alpha 1a 0.04087 0.0001874 PDLIM5 PDZ and LIM domain 5 0.04077 0.32533 [104]75 LPP LIM domain containing preferred translocation partner in lipoma 0.04073 0.00003 [105]76 MAD2L1B
PMAD2L1 binding protein 0.04051 0.62639 [106]
77 *ADAMTS1 ADAM metallopeptidase with thrombospondin type 1 motif 1 0.04048 0.00011 [107]78 *RHOA ras homolog gene family member A 0.04039 0.11368 [108]79 *TXNIP thioredoxin interacting protein 0.03995 0.00227 [109]80 OGDH oxoglutarate (alpha-ketoglutarate) dehydrogenase (lipoamide) 0.03974 0.0754381 RPL35 ribosomal protein L35 0.03971 0.1755582 *ANKH ankylosis progressive homolog (mouse) 0.03856 0.00318 [110]83 MPST mercaptopyruvate sulfurtransferase 0.03856 0.00000 [111]84 MORF4L2 mortality factor 4 like 2 0.03831 0.01337 [112]85 CRISPLD2 cysteine-rich secretory protein LCCL domain containing 2 0.03799 0.0000086 *CD9 CD9 molecule 0.03787 0.00150 [113]87 ALDH3A2 aldehyde dehydrogenase 3 family member A2 0.03696 0.0000188 SCN2B sodium channel voltage-gated type II beta 0.03693 0.00024 [114]89 *SPARCL1 SPARC-like 1 (mast9 hevin) 0.03693 0.00045 [115]90 IGJ immunoglobulin J polypeptide linker protein for immunoglobulin alpha and
mu polypeptides0.03683 0.00190 [116]
91 ZNF134 zinc finger protein 134 0.03670 0.0000792 MRPL43 mitochondrial ribosomal protein L43 0.03655 0.5493493 LOC152485 hypothetical protein LOC152485 0.03647 0.0000094 CALM2 calmodulin 2 (phosphorylase kinase delta) 0.03622 0.05417 [117]95 COL9A2 collagen type IX alpha 2 0.03546 0.0014196 *PAGE4 P antigen family member 4 (prostate associated) 0.03541 0.00001 [118]97 CALM1 calmodulin 1 (phosphorylase kinase delta) 0.03536 0.00098 [119]98 *ACTB actin beta 0.03508 0.01159 [120]99 *AGR2 anterior gradient homolog 2 (Xenopus laevis) 0.03498 0.56006 [121]100
RPS28 ribosomal protein S28 0.03497 0.15578
*: genes already described to be related to prostatic cancer. In bold are the genes which do not present statistical evidences to be differentially expressed between normal and tumoral conditions.
Table 1: ψMLDA: the weights attributed by MLDA. (Continued)
Page 6 of 14(page number not for citation purposes)
BMC Systems Biology 2008, 2:106 http://www.biomedcentral.com/1752-0509/2/106
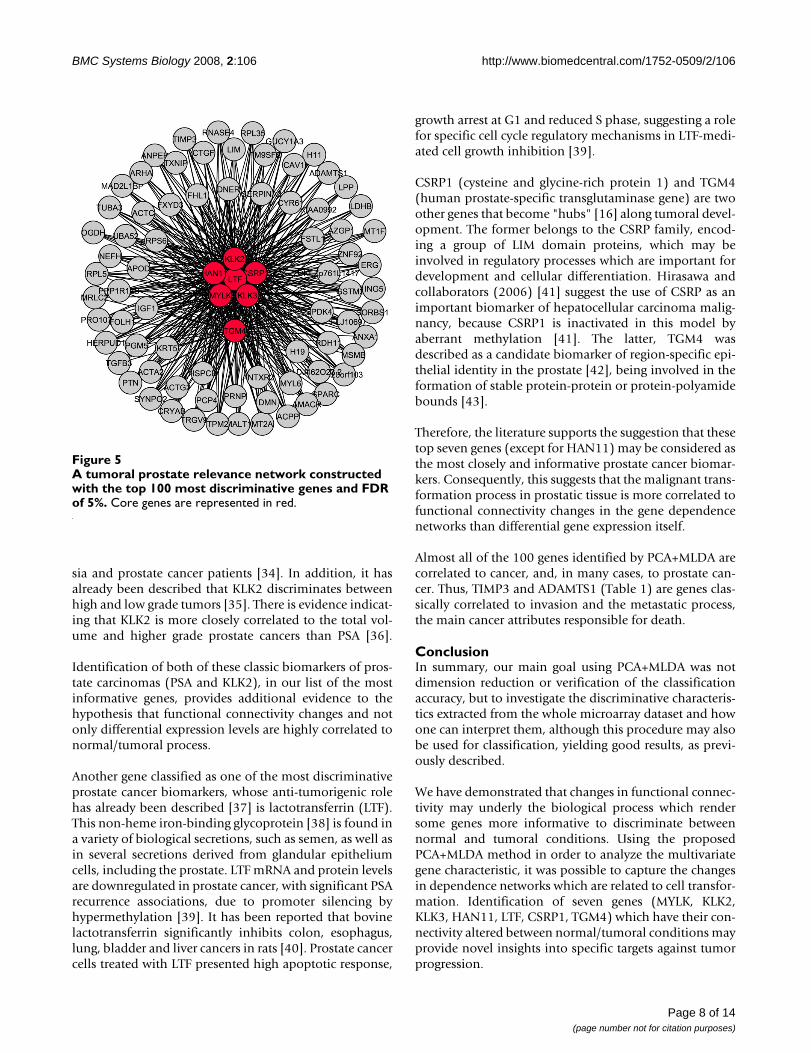
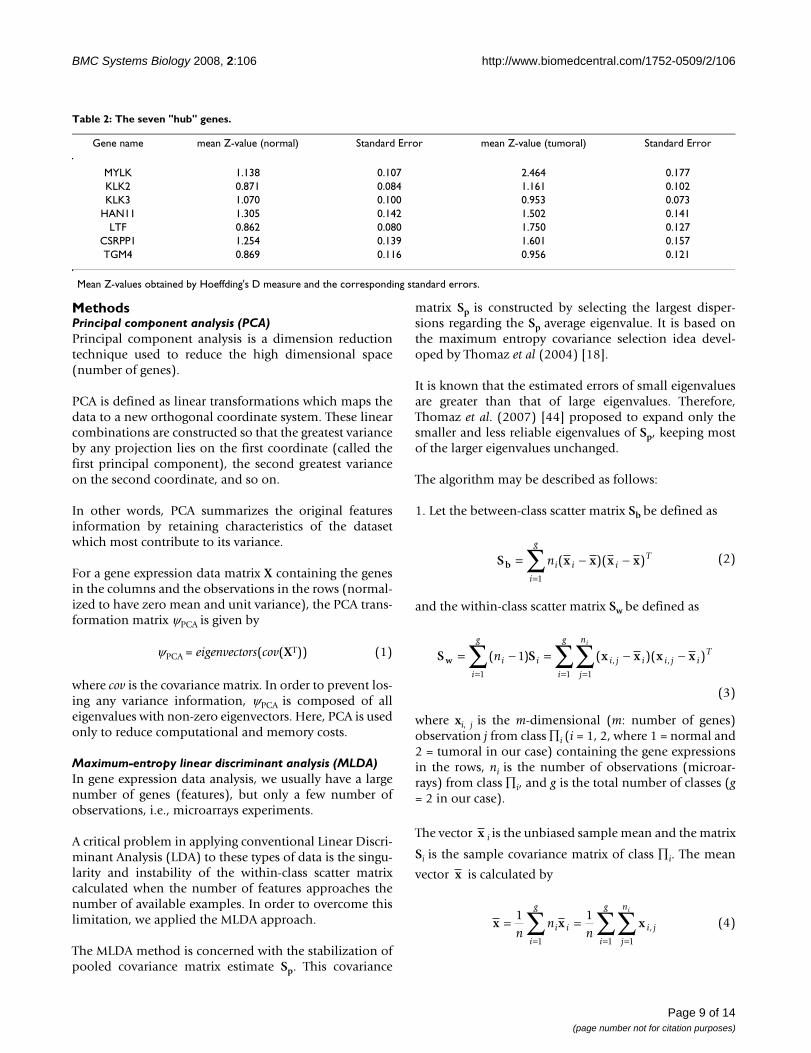
tive biomarkers in order to gain new insights. The analyisof Figures 4 and 5 indicate that exactly the top seven mostdiscriminative genes described in Table 1 (MYLK, KLK2,KLK3, HAN11, LTF, CSRP1, TGM4) have considerablychanged their functional connectivity between normaland tumoral conditions as illustrated by red nodes in Fig-ures 4 and 5. These seven genes become "hubs" [16], i.e.,highly connected genes in the tumoral condition, whereasin the normal condition, their connectivity was not differ-ent when compared to that of other genes. Furthermore,these seven genes maintained the position of the topseven most discriminative ones also when we have re-sampled the samples (the experiment which was per-formed in order to verify the stability and robustness ofthe top 100 genes). A Z-value summary table related tothese seven genes is illustrated in Table 2. Z-valuesincrease from normal to tumoral conditions, representingthe changes in functional connectivities between thesetwo conditions. The mean Z-values were calculatedbetween the "hub" gene and the other 99 genes. In addi-tion, in the list of the most discriminative features, thereare genes which are more differentially expressed thanthese seven ones (lower p-value), however, their connec-tivity did not change. Krostka and Spang (2004) [17] havealready suggested that differences in co-regulationbetween normal/disease states may be related to somepathologies. Moreover, Sato et al. (2008) [21] havereported that changes in networks connectivities mayinfluence classification methods. These reports supportour results showing that changes in functional connectiv-ity may be closely related to the normal/tumoral states inprostate and that these changes in dependence may con-
tain an additional information when compared to differ-ential gene expression.
Almost all top seven genes identified as the most discrim-inative features between normal and tumoral phenotypeshad previously been described in the literature as beingassociated to cancer. The only gene that so far has notbeen correlated to cancer is HAN11, probably because lit-tle is known about this gene (only two articles were foundin the literature describing this gene). Five of these topseven genes namely, MYLK, KLK2, KLK3, LTF and TGM4had already been specifically related to prostate carci-noma (Table 1).
Myosin light chain kinase (MYLK) is one of them. Thisenzyme catalyzes the phosphorylation of a specific serineresidue on the 20 kD light chain of myosin II (MCL20),consequently regulating the actin-myosin II interaction[23]. This reaction is responsible for smoothing musclecontraction/relaxation and organization of the cytoskele-ton. Due to the central role played by the cytoskeleton incell division and motility, it has been demonstrated thatMYLK inhibition induces apoptosis in mammary prostatecancer cells and inhibits the growth of mammary andprostate tumors in rats and mice [24]. Furthermore, sinceMLC20 phosphorylation is necessary for cell motility[25,26], MYLK inhibition blocks cancer cell invasion andadhesion in vitro. As a result, some reports described theuse of MYLK inhibitors as anti-cancer agents since theyprevent cancer cells migration [27,28].
KLK3, also known as prostate specific antigen (PSA), isanother gene which presents high functional connectivityin tumoral samples. PSA is a serine protease, secreted intoseminal plasma, belonging to the human kallikrein genefamily, being responsible for semen liquefaction. It is thefirst FDA (Food and Drug Administration)-approvedtumor marker for cancer detection [29]. The prostaticgland volume affects the PSA level in serum, because it isproduced and secreted by prostatic tissue [30,31]. How-ever, increased levels of KLK3 are also observed in somepatients with benign prostate hyperplasia. Therefore, ele-vated PSA concentration in patients' plasma may be indic-ative not only of prostate cancer, but, also of otherprostatic pathologies. Consequently, the use of PSA as acancer-specific marker is questioned.
Nowadays, 15 members of the kallikrein family (KLKs)are described in humans [32]. Among the KLKs, the high-est homology is found between PSA and KLK2. In thiscase, the identity is 78% and 80% at the amino acid andDNA level, respectively [33]. KLK2 is another gene thatpresented functional connectivity changes between nor-mal/tumoral conditions. The ratio of KLK2 to free PSAimproves the discrimination of benign prostate hyperpla-
A normal prostate relevance network constructed with the top 100 most discriminative genes and FDR of 5%Figure 4A normal prostate relevance network constructed with the top 100 most discriminative genes and FDR of 5%. Core genes are represented in red.
Page 7 of 14(page number not for citation purposes)
BMC Systems Biology 2008, 2:106 http://www.biomedcentral.com/1752-0509/2/106
sia and prostate cancer patients [34]. In addition, it hasalready been described that KLK2 discriminates betweenhigh and low grade tumors [35]. There is evidence indicat-ing that KLK2 is more closely correlated to the total vol-ume and higher grade prostate cancers than PSA [36].
Identification of both of these classic biomarkers of pros-tate carcinomas (PSA and KLK2), in our list of the mostinformative genes, provides additional evidence to thehypothesis that functional connectivity changes and notonly differential expression levels are highly correlated tonormal/tumoral process.
Another gene classified as one of the most discriminativeprostate cancer biomarkers, whose anti-tumorigenic rolehas already been described [37] is lactotransferrin (LTF).This non-heme iron-binding glycoprotein [38] is found ina variety of biological secretions, such as semen, as well asin several secretions derived from glandular epitheliumcells, including the prostate. LTF mRNA and protein levelsare downregulated in prostate cancer, with significant PSArecurrence associations, due to promoter silencing byhypermethylation [39]. It has been reported that bovinelactotransferrin significantly inhibits colon, esophagus,lung, bladder and liver cancers in rats [40]. Prostate cancercells treated with LTF presented high apoptotic response,
growth arrest at G1 and reduced S phase, suggesting a rolefor specific cell cycle regulatory mechanisms in LTF-medi-ated cell growth inhibition [39].
CSRP1 (cysteine and glycine-rich protein 1) and TGM4(human prostate-specific transglutaminase gene) are twoother genes that become "hubs" [16] along tumoral devel-opment. The former belongs to the CSRP family, encod-ing a group of LIM domain proteins, which may beinvolved in regulatory processes which are important fordevelopment and cellular differentiation. Hirasawa andcollaborators (2006) [41] suggest the use of CSRP as animportant biomarker of hepatocellular carcinoma malig-nancy, because CSRP1 is inactivated in this model byaberrant methylation [41]. The latter, TGM4 wasdescribed as a candidate biomarker of region-specific epi-thelial identity in the prostate [42], being involved in theformation of stable protein-protein or protein-polyamidebounds [43].
Therefore, the literature supports the suggestion that thesetop seven genes (except for HAN11) may be considered asthe most closely and informative prostate cancer biomar-kers. Consequently, this suggests that the malignant trans-formation process in prostatic tissue is more correlated tofunctional connectivity changes in the gene dependencenetworks than differential gene expression itself.
Almost all of the 100 genes identified by PCA+MLDA arecorrelated to cancer, and, in many cases, to prostate can-cer. Thus, TIMP3 and ADAMTS1 (Table 1) are genes clas-sically correlated to invasion and the metastatic process,the main cancer attributes responsible for death.
ConclusionIn summary, our main goal using PCA+MLDA was notdimension reduction or verification of the classificationaccuracy, but to investigate the discriminative characteris-tics extracted from the whole microarray dataset and howone can interpret them, although this procedure may alsobe used for classification, yielding good results, as previ-ously described.
We have demonstrated that changes in functional connec-tivity may underly the biological process which rendersome genes more informative to discriminate betweennormal and tumoral conditions. Using the proposedPCA+MLDA method in order to analyze the multivariategene characteristic, it was possible to capture the changesin dependence networks which are related to cell transfor-mation. Identification of seven genes (MYLK, KLK2,KLK3, HAN11, LTF, CSRP1, TGM4) which have their con-nectivity altered between normal/tumoral conditions mayprovide novel insights into specific targets against tumorprogression.
A tumoral prostate relevance network constructed with the top 100 most discriminative genes and FDR of 5%Figure 5A tumoral prostate relevance network constructed with the top 100 most discriminative genes and FDR of 5%. Core genes are represented in red.
Page 8 of 14(page number not for citation purposes)
BMC Systems Biology 2008, 2:106 http://www.biomedcentral.com/1752-0509/2/106
MethodsPrincipal component analysis (PCA)Principal component analysis is a dimension reductiontechnique used to reduce the high dimensional space(number of genes).
PCA is defined as linear transformations which maps thedata to a new orthogonal coordinate system. These linearcombinations are constructed so that the greatest varianceby any projection lies on the first coordinate (called thefirst principal component), the second greatest varianceon the second coordinate, and so on.
In other words, PCA summarizes the original featuresinformation by retaining characteristics of the datasetwhich most contribute to its variance.
For a gene expression data matrix X containing the genesin the columns and the observations in the rows (normal-ized to have zero mean and unit variance), the PCA trans-formation matrix ψPCA is given by
ψPCA = eigenvectors(cov(XT)) (1)
where cov is the covariance matrix. In order to prevent los-ing any variance information, ψPCA is composed of alleigenvalues with non-zero eigenvectors. Here, PCA is usedonly to reduce computational and memory costs.
Maximum-entropy linear discriminant analysis (MLDA)In gene expression data analysis, we usually have a largenumber of genes (features), but only a few number ofobservations, i.e., microarrays experiments.
A critical problem in applying conventional Linear Discri-minant Analysis (LDA) to these types of data is the singu-larity and instability of the within-class scatter matrixcalculated when the number of features approaches thenumber of available examples. In order to overcome thislimitation, we applied the MLDA approach.
The MLDA method is concerned with the stabilization ofpooled covariance matrix estimate Sp. This covariance
matrix Sp is constructed by selecting the largest disper-sions regarding the Sp average eigenvalue. It is based onthe maximum entropy covariance selection idea devel-oped by Thomaz et al (2004) [18].
It is known that the estimated errors of small eigenvaluesare greater than that of large eigenvalues. Therefore,Thomaz et al. (2007) [44] proposed to expand only thesmaller and less reliable eigenvalues of Sp, keeping mostof the larger eigenvalues unchanged.
The algorithm may be described as follows:
1. Let the between-class scatter matrix Sb be defined as
and the within-class scatter matrix Sw be defined as
where xi, j is the m-dimensional (m: number of genes)observation j from class ∏i (i = 1, 2, where 1 = normal and2 = tumoral in our case) containing the gene expressionsin the rows, ni is the number of observations (microar-rays) from class ∏i, and g is the total number of classes (g= 2 in our case).
The vector i is the unbiased sample mean and the matrix
Si is the sample covariance matrix of class ∏i. The mean
vector is calculated by
S x x x xb = − −=∑ni i i
T
i
g
( )( )1
(2)
S S x x x xw = − = − −= ==∑ ∑∑( ) ( )( ), ,ni i
i
g
i j i i j iT
j
n
i
g i
11 11
(3)
x
x
x x x= == ==∑ ∑∑1 1
1 11n
nni i
i
g
i j
j
n
i
g i
, (4)
Table 2: The seven "hub" genes.
Gene name mean Z-value (normal) Standard Error mean Z-value (tumoral) Standard Error
MYLK 1.138 0.107 2.464 0.177KLK2 0.871 0.084 1.161 0.102KLK3 1.070 0.100 0.953 0.073
HAN11 1.305 0.142 1.502 0.141LTF 0.862 0.080 1.750 0.127
CSRPP1 1.254 0.139 1.601 0.157TGM4 0.869 0.116 0.956 0.121
Mean Z-values obtained by Hoeffding's D measure and the corresponding standard errors.
Page 9 of 14(page number not for citation purposes)
BMC Systems Biology 2008, 2:106 http://www.biomedcentral.com/1752-0509/2/106
where n is the total number of microarrays, i.e.,
.
2. Calculate the ψ eigenvectors and Λ eigenvalues of Sp,where Sp = Sw/[n - g].
3. Calculate , i.e., the average eigenvalue
4. Construct the new matrix of eigenvalues based on the
following largest dispersion criterion Λ* = diag [max(λi,
),..., max(λm, )]
5. Construct the modified within-class scatter matrix
6. Finally, calculate the projection matrix ψMLDA whichmaximizes the ratio of the determinant of the between-class scatter matrix to the determinant of the within-classscatter matrix (Fisher's criterion):
The main advantage of MLDA is that it avoids both thesingularity and instability of the within-class scattermatrix Sw when applied directly to gene expression data,which consists of a low number of observations and ahigh number of features.
The implemented R code is available in the Additional file3.
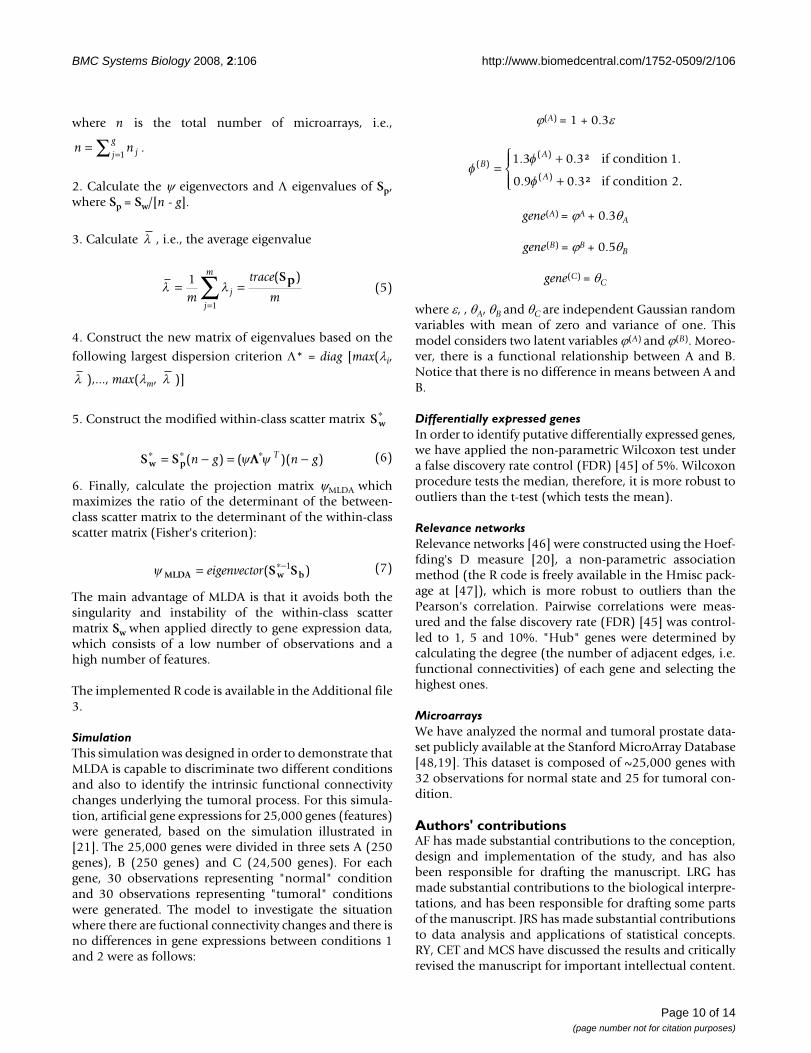
SimulationThis simulation was designed in order to demonstrate thatMLDA is capable to discriminate two different conditionsand also to identify the intrinsic functional connectivitychanges underlying the tumoral process. For this simula-tion, artificial gene expressions for 25,000 genes (features)were generated, based on the simulation illustrated in[21]. The 25,000 genes were divided in three sets A (250genes), B (250 genes) and C (24,500 genes). For eachgene, 30 observations representing "normal" conditionand 30 observations representing "tumoral" conditionswere generated. The model to investigate the situationwhere there are fuctional connectivity changes and there isno differences in gene expressions between conditions 1and 2 were as follows:
ϕ(A) = 1 + 0.3ε
gene(A) = ϕA + 0.3θA
gene(B) = ϕB + 0.5θB
gene(C) = θC
where ε, , θA, θB and θC are independent Gaussian randomvariables with mean of zero and variance of one. Thismodel considers two latent variables ϕ(A) and ϕ(B). Moreo-ver, there is a functional relationship between A and B.Notice that there is no difference in means between A andB.
Differentially expressed genesIn order to identify putative differentially expressed genes,we have applied the non-parametric Wilcoxon test undera false discovery rate control (FDR) [45] of 5%. Wilcoxonprocedure tests the median, therefore, it is more robust tooutliers than the t-test (which tests the mean).
Relevance networksRelevance networks [46] were constructed using the Hoef-fding's D measure [20], a non-parametric associationmethod (the R code is freely available in the Hmisc pack-age at [47]), which is more robust to outliers than thePearson's correlation. Pairwise correlations were meas-ured and the false discovery rate (FDR) [45] was control-led to 1, 5 and 10%. "Hub" genes were determined bycalculating the degree (the number of adjacent edges, i.e.functional connectivities) of each gene and selecting thehighest ones.
MicroarraysWe have analyzed the normal and tumoral prostate data-set publicly available at the Stanford MicroArray Database[48,19]. This dataset is composed of ~25,000 genes with32 observations for normal state and 25 for tumoral con-dition.
Authors' contributionsAF has made substantial contributions to the conception,design and implementation of the study, and has alsobeen responsible for drafting the manuscript. LRG hasmade substantial contributions to the biological interpre-tations, and has been responsible for drafting some partsof the manuscript. JRS has made substantial contributionsto data analysis and applications of statistical concepts.RY, CET and MCS have discussed the results and criticallyrevised the manuscript for important intellectual content.
n n jj
g= =∑ 1
l
l l= ==
∑1
1m
trace
mj
j
m ( )Sp(5)
l l
Sw∗
S Sw p∗ ∗ ∗= − = −( ) ( )( )n g n gTy yLL (6)
y MLDA w bS S= ∗−eigenvector( )1 (7)
ff
f( )
( )
( )
. . .
. .
BA
A=
+
+
1 3 0 3 1
0 9 0 3 2
²
²
if condition
if condition ..
⎧⎨⎪
⎩⎪
Page 10 of 14(page number not for citation purposes)
BMC Systems Biology 2008, 2:106 http://www.biomedcentral.com/1752-0509/2/106
SM has directed the work and has given the final approvalof the version to be published.
Additional material
AcknowledgementsThis work was supported by grants of the Genome Network Project from the Ministry of Education, Culture, Sports, Science and Technology, Japan.
References1. Jemal A, Siegel R, Ward E, Hao Y, Xu J, Murray T, Thun MJ: Cancer
statistics. Cancer J Clin 2008, 58:71-96.2. Parkin DM, Bray FI, Devesa SS: Cancer burden in the year 2000.
The global picture. Eur J Cancer 2001, 37:S4-S66.3. Hsing AW, Tsao L, Devesa SS: International trends and patterns
in prostate cancer incidence and mortality. Int J Cancer 2000,85:60-67.
4. Farkas A, Schneider D, Perrotti M, Cummings KB, Ward WS:National trends in the epidemiology of prostate cancer, 1973to 94: evidence for the effectiveness o prostate-specific anti-gen screening. Urology 1998, 52:444-448.
5. Han M, Partin AW, Piantadosi S, Epstein JI, Walsh PC: Era specificbiochemical recurrence-free survival following radical pros-tatectomy for clinically localized prostate cancer. J Urology2001, 166:416-419.
6. Karan D, Lin MF, Hohansson SL, Batra SK: Current status of themolecular genetics of human prostatic adenocarcinomas. IntJ Cancer 2003, 103(3):285-293.
7. Reis EM, Nakaya H, Louro R, Canavez FC, Flatschart AVF, AlmeidaGT, Egidio CM, Paquola AC, Machado AA, Festa F, Yamamoto D,Alvarenga R, da Silva CC, Brito GC, Simon SD, Moreira-Filho CA,Leite KR, Camara-Lopes LH, Campos FS, Gimba E, Vignal GM, El-Dorry H, Sogayar MC, Barcinski MA, da Silva AM, Verjovski-AlmeidaS: Antisense intronic non-coding RNA levels correlate to thedegree of tumor differentiation in prostate cancer. Oncogene2004, 23:6684-6692.
8. Singh D, Febbo PG, Ross K, Jackson DG, Manola J, Ladd C, Tamayo P,Renshaw AA, D'Amico AV, Richie JP, Lander ES, Loda M, Kantoff PW,Golub TR, Sellers WR: Gene expression correlates of clinicalprostate cancer behavior. Cancer cell 2002, 1:203-209.
9. Setlur SR, Royce TE, Sboner A, Mosquera JM, Demichelis F, HoferMD, Mertz KD, Gerstein M, Rubin MA: Integrative microarrayanalysis of pathways dysregulated in metastatic prostatecancer. Cancer Research 2007, 67:10296-10303.
10. Golub TR, Slonim DK, Tamayo P, Huard C, Gaasenbeek M, MesirovJP, Coller H, Loh ML, Downing JR, Caligiuri MA, Bloomfield CD,Lander ES: Molecular classification of cancer: class discoveryand class prediction by gene expression monitoring. Science1999, 286:531-537.
11. Bittner M, Meltzer P, Chen Y, Jiang Y, Seftor E, Hendrix M, Rad-macher M, Simon R, Yakhini Z, Ben-Dor A, Sampas N, Dougherty E,Wang E, Marincola F, Gooden C, Lueders J, Glatfelter A, Pollock P,Carpten J, Gillanders E, Leja D, Dietrich K, Beaudry C, Berens M,Alberts D, Sondak V: Molecular classification of cutaneousmalignant melanoma by gene expression profiling. Nature2000, 406:536-540.
12. Saeys Y, Inza I, Larrañaga P: A review of feature selection tech-niques in bioinformatics. Bioinformatics 2007, 23:2507-2517.
13. Nguyen DV, Rocke DM: Tumor classification by partial leastsquares using microarray gene expression data. Bioinformatics2002, 18:39-50.
14. Hara T, Miyazaki H, Lee A, Tran CP, Reiter RE: Androgen receptorand invasion in prostate cancer. Cancer Research 2008,68:1128-1135.
15. Levchenko A: Dynamical and integrative cell signaling chal-lenges for the new biology. Biotechnol Bioeng 2003, 30:773-82.
16. Jeong H, Tombor B, Albert R, Oltvai ZN, Barabási AL: The large-scale organization of metabolic networks. Nature 2000,407(6804):651-654.
17. Krostka D, Spang R: Finding disease specific alterations in theco-expression of genes. Bioinformatics 2004, 20 Suppl1:i194-i199.
18. Thomaz CE, Gillies DF, Feitosa RQ: A new covariance estimatefor bayesian classifiers in biometric recognition. IEEE Transac-tions on circuits and systems for video technology 2004, 14:214-223.
19. Lapointe J, Li C, Higgins JP, Tijn M van de, Bair E, Montgomery K, Fer-rari M, Egevad L, Rayford W, Bergerheim U, Ekman P, DeMarzo AM,Tibshirani R, Botstein D, Brown PO, Brooks JD, Pollack JR: Geneexpression profiling identifies clinically relevant subtypes ofprostate cancer. PNAS 2004, 101:811-816.
20. Hoeffding W: A non-parametric test of independence. TheAnnals of Mathematical Statistics 1948, 19:546-557.
21. Sato JR, Mourão Miranda J, Amaro EJ, Morettin PA, Brammer MJ: Theimpact of functional connectivity changes on support vectormachines mapping of fMRI data. J Neurosci Methods 2008,172:94-104.
22. Thomaz CE, Kitani EC, Gillies DF: A Maximum UncertaintyLDA-based approach for limited sample size problems withapplication to face recognition. Journal of the Brazilian ComputerSociety 2006, 12:7-18.
23. Adelstein RS, Koonin EV, Altschul SF, Bork P: Regulation of con-tractile proteins by phosphorylation. Journal of Clinical Investiga-tion 1983, 72:1863-1866.
24. Gu LZ, Hu WY, Antic N, Mehta R, Turner JR, de Lanerolle P: Inhib-iting myosin light chain kinase retards the growth of mam-mary and prostate cancer cells. European Journal of Cancer 2006,42:948-957.
25. Wilson AK, Gorgas G, Claypool WD, de Lanerolle P: An increaseor a decrease in myosin II phosphorylation inhibits macro-phage motility. Journal of Cell Biology 1991, 114:277-283.
26. Klemke RL, Cai S, Giannini AL, Gallagher PJ, de Lanerolle P, ChereshDA: Regulation of cell motility by mitogen-activated proteinkinase. Journal of Cell Biology 1997, 137:481-92.
27. Kaneko K, Satoh K, Masamune A, Satoh A, Shimosegawa T: Myosinlight chain kinase inhibitors can block invasion and adhesionof human pancreatic cancer cell lines. Pancreas 2002, 24:34-41.
28. Tohtong R, Phattarasakul K, Jiraviriyakul A, Sutthiphongchai T:Dependence of metastatic cancer cell invasion on MLCK-catalyzed phosphorilation of myosin regulatory light chain.Prostate Cancer and Prostatic Diseases 2003, 6:212-216.
29. Stephan C, Jung K, Lein M, Diamandis EP: PSA and other tissuekallikreins for prostate cancer detection. European Journal ofCancer 2007, 43:1918-1926.
30. Catalona WJ, Smith DS, Wolfert RL, Wang TJ, Rittenhouse HG, RatliffTL, Nadler RB: Evaluation of percentage of free serum pros-tate-specific antigen to improve specificity of prostate can-cer screening. Journal of the American Medical Association 1995,274:1214-1220.
31. Partin AW, Catalona WJ, Southwick PC, Subong EM, Gasior DW,Chan DW: Analysis of percent free prostate-specific antigen
Additional file 1Manual annotation. The manual annotation of the 100 genes described in Table 1.Click here for file[http://www.biomedcentral.com/content/supplementary/1752-0509-2-106-S1.doc]
Additional file 2MLDA hyperplane weight. The MLDA hyperplane weight and the p-val-ues (Wilcoxon test) for all the ~25,000 genes.Click here for file[http://www.biomedcentral.com/content/supplementary/1752-0509-2-106-S2.xls]
Additional file 3R code. Implemented R code for MLDA.Click here for file[http://www.biomedcentral.com/content/supplementary/1752-0509-2-106-S3.r]
Page 11 of 14(page number not for citation purposes)
http://www.ncbi.nlm.nih.gov/entrez/query.fcgi?cmd=Retrieve&db=PubMed&dopt=Abstract&list_uids=9730458
http://www.ncbi.nlm.nih.gov/entrez/query.fcgi?cmd=Retrieve&db=PubMed&dopt=Abstract&list_uids=9730458
http://www.ncbi.nlm.nih.gov/entrez/query.fcgi?cmd=Retrieve&db=PubMed&dopt=Abstract&list_uids=9730458
http://www.ncbi.nlm.nih.gov/entrez/query.fcgi?cmd=Retrieve&db=PubMed&dopt=Abstract&list_uids=6315773
http://www.ncbi.nlm.nih.gov/entrez/query.fcgi?cmd=Retrieve&db=PubMed&dopt=Abstract&list_uids=6315773
http://www.ncbi.nlm.nih.gov/entrez/query.fcgi?cmd=Retrieve&db=PubMed&dopt=Abstract&list_uids=2071674
http://www.ncbi.nlm.nih.gov/entrez/query.fcgi?cmd=Retrieve&db=PubMed&dopt=Abstract&list_uids=2071674
http://www.ncbi.nlm.nih.gov/entrez/query.fcgi?cmd=Retrieve&db=PubMed&dopt=Abstract&list_uids=2071674
http://www.ncbi.nlm.nih.gov/entrez/query.fcgi?cmd=Retrieve&db=PubMed&dopt=Abstract&list_uids=9128257
http://www.ncbi.nlm.nih.gov/entrez/query.fcgi?cmd=Retrieve&db=PubMed&dopt=Abstract&list_uids=9128257
http://www.ncbi.nlm.nih.gov/entrez/query.fcgi?cmd=Retrieve&db=PubMed&dopt=Abstract&list_uids=7563511
http://www.ncbi.nlm.nih.gov/entrez/query.fcgi?cmd=Retrieve&db=PubMed&dopt=Abstract&list_uids=7563511
BMC Systems Biology 2008, 2:106 http://www.biomedcentral.com/1752-0509/2/106
(PSA) for prostate cancer detection: influence of total PSA,prostate volume, and age. Urology 1996, 48:55-61.
32. Shaw JL, Diamandis EP: Distribution of 15 human kallikreins intissues and biological fluids. Clinical Chemistry 2007,53:1423-1432.
33. Yousef GM, Diamandis EP: The new human tissue kallikreingene family: structure, function, and association to disease.Endocrine Reviews 2001, 22:184-204.
34. Kwiatkowski MK, Recker F, Piironen T, Pettersson K, Otto T, WernliM, Tscholl R: In prostatism patients the ratio of human glan-dular kallikrein to free PSA improves the discriminationbetween prostate cancer and benign hyperplasia within thediagnostic "gray zone" of total PSA 4 to 10 ng/mL. Urology1998, 52:360-365.
35. Haese A, Becker C, Noldus J, Graefen M, Huland E, Huland H, Lilja H:Human glandular kallikrein 2: a potential serum marker forpredicting the organ confined versus non-organ confinedgrowth of prostate cancer. Journal of Urology 2000,163:1491-1497.
36. Haese A, Graefen M, Steuber T, Becker C, Noldus J, Erbersdobler A,Huland E, Huland H, Lilja H: Total and Gleason grade 4/5 cancervolumes are major contributors of human kallikrein 2,whereas free prostate specific antigen is largely contributedby benign gland volume in serum from patients with pros-tate cancer or benign prostatic biopsies. Journal of Urology 2003,170:2269-2273.
37. Brock JH: The physiology of lactoferrin. Biochemistry and Cell Biol-ogy 2000, 80:1-6.
38. Teng CT: Lactoferrin gene expression and regulation: Anoverview. Biochemistry and Cell Biology 2002, 80:7-16.
39. Shaheduzzaman S, Vishwanath A, Furusato B, Cullen J, Chen Y, BañezL, Nau M, Ravindranath L, Kim KH, Mohammed A, Chen Y, Ehrich M,Srikantan V, Sesterhenn IA, McLeod DG, Vahey M, Petrovics G, DobiA, Srivastava S: Silencing of Lactotransferrin Expression byMethylation in Prostate Cancer Progression. Cancer Biology &Therapy in press.
40. Tsuda H, Sekine K, Fujita K, Ligo M: Cancer prevention by bovinelactoferrin and underlying mechanisms – A review of exper-imental and clinical studies. Biochemistry and Cell Biology 2002,80:131-136.
41. Hirasawa Y, Arai M, Imazeki F, Tada M, Mikata R, Fukai K, Miyazaki M,Ochiai T, Saisho H, Yokosuka O: Methylation status of genesupregulated by demethylating agent 5-aza-2'-deoxycytidinein hepatocellular carcionoma. Oncology 2006, 71:77-85.
42. Thielen JL, Volzing KG, Collier LS, Green LE, Largaespada DA, MarkerPC: Markers of prostate region-specific epithelial identitydefine anatomical locations in the mouse prostate that aremolecularly similar to human prostate cancers. Differentiation2007, 75:49-61.
43. Porta R, Esposito C, De Santis A, Fusco A, Iannone M, Metafora S:Sperm maturation in human semen: role of transglutami-nase-mediated reactions. Biology of Reproduction 1986,35:965-970.
44. Thomaz CE, Duran FLS, Busatto GF, Gillies DF, Rueckert D: Multi-variate statistical differences of MRI samples of the humanbrain. Journal of mathematical imaging and vision 2007, 29:95-106.
45. Benjamini Y, Hochberg Y: Controlling the false discovery rate: apractical and powerful approach to multiple testing. Journal ofthe Royal Statistical Society Series B 1995, 57:289-300.
46. Butte A, Tamayo P, Slonim D, Golub TR, Kohane IS: Discoveringfunctional relationships between RNA expression and chem-otherapeutic susceptibility using relevance networks. PNAS2000, 7:12182-6.
47. The R Project for Statistical Computing [http://www.r-project.org/]
48. Stanford MicroArray Database [http://smd-www.stanford.edu/]49. Lilja H, Ulmert D, Björk T, Becker C, Serio AM, Nilsson JA, Abraham-
sson PA, Vickers AJ, Berglund G: Long-term prediction of pros-tate cancer up to 25 years before diagnosis of prostatecancer using prostate kallikreins measured at age 44 to 50years. Journal of Clinical Oncology 2007, 25:431-436.
50. Dhanasekaran SM, Barrette TR, Ghosh D, Shah R, Varambally S, Kura-chi K, Pienta KJ, Rubin MA, Chinnaiyan AM: Delineation of prog-nostic biomarkers in prostate cancer. Nature 2001,412:822-826.
51. Miyasaka KY, Kida YS, Sato T, Minami M, Ogura T: Csrp1 regulatesdynamic cell movements of the mesendoderm and cardiacmesoderm through interactions with Dishevelled andDiversin. PNAS 2007, 104:11274-11279.
52. Untergasser G, Gander R, Lilg C, Lepperdinger G, Plas E, Berger P:Profiling molecular targets of TGF-beta1 in prostate fibrob-last-to-myofibroblast transdifferentiation. Mechanisms of age-ing and development 2005, 126:59-69.
53. Li C, Kato M, Shiue L, Shively JE, Ares MJ, Lin RJ: Cell type and cul-ture condition-dependent alternative splicing in humanbreast cancer cells revealed by splicing-sensitive microar-rays. Cancer Research 2006, 66:1990-1999.
54. Edwards S, Campbell C, Flohr P, Shipley J, Giddings I, Te-Poele R,Dodson A, Foster C, Clark J, Jhavar S, Kovacs G, Cooper CS:Expression analysis onto microarrays of randomly selectedcDNA clones highlights HOXB13 as a marker of humanprostate cancer. British journal of cancer 2005, 92:376-381.
55. Bondar OP, Barnidge DR, Klee EW, Davis BJ, Klee GG: LC-MS/MSquantification of Zn-alpha2 glycoprotein: a potential serumbiomarker for prostate cancer. Clinical Chemistry 2007,53:673-678.
56. Kayed H, Kleeff J, Kolb A, Ketterer K, Keleg S, Felix K, Giese T, PenzelR, Zentgraf H, Büchler MW, Korc M, Friess H: FXYD3 is overex-pressed in pancreatic ductal adenocarcinoma and influencespancreatic cancer cell growth. International journal of cancer 2006,118:43-54.
57. Varga AE, Stourman NV, Zheng Q, Saña AF, Quan L, Li X, Sossey-Alaoui K, Bakin AV: Silencing of the Tropomyosin-1 gene byDNA methylation alters tumor suppressor function of TGF-beta. Oncogene 2005, 24(32):5034-5052.
58. Wittig R, Nessling M, Will RD, Mollenhauer J, Salowsky R, Münster-mann E, Schick M, Helmbach H, Gschwendt B, Korn B, Kioschis P,Lichter P, Schadendorf D, Poustka A: Candidate genes for cross-resistance against DNA-damaging drugs. Cancer Research 2002,62:6698-6705.
59. Casey TM, Eneman J, Crocker A, White J, Tessitore J, Stanley M, Har-low S, Bunn JY, Weaver D, Muss H, Plaut K: Cancer associatedfibroblasts stimulated by transforming growth factor beta1(TGF-beta1) increase invasion rate of tumor cells: a popula-tion study. Breast Cancer Res Treat 2008, 110(1):39-49.
60. Martin PM, Aeder SE, Chrestensen CA, Sturgill TW, Hussaini IM:Phorbol 12-myristate 13-acetate and serum synergize topromote rapamycin-insensitive cell proliferation via proteinkinase C-eta. Oncogene 2007, 26:407-414.
61. Sharief FS, Mohler JL, Sharief Y, Li SS: Expression of human pros-tatic acid phosphatase and prostate specific antigen genes inneoplastic and benign tissues. Biochem Mol Biol Int 1994,33(3):567-574.
62. Wei T, Geiser AG, Qian HR, Su C, Helvering LM, Kulkarini NH, ShouJ, N'Cho M, Bryant HU, Onyia JE: DNA microarray data integra-tion by ortholog gene analysis reveals potential molecularmechanisms of estrogen-dependent growth of human uter-ine fibroids. BMC Women's Health 2007, 7:5.
63. Yu YP, Luo JH: Myopodin-mediated suppression of prostatecancer cell migration involves interaction with zyxin. CancerResearch 2006, 66:7414-7419.
64. Vanaja DK, Ballman KV, Morlan BW, Cheville JC, Neumann RM, Lie-ber MM, Tindall DJ, Young CY: PDLIM4 repression by hyper-methylation as a potential biomarker for prostate cancer.Clinical cancer research 2006, 12:1128-1136.
65. Eeles RA, Z KJ, Giles GG, Olama AA, Guy M, Jugurnauth SK, Mulhol-land S, Leongamornlert DA, Edwards SM, Morrison J, Field HI,Southey MC, Severi G, Donovan JL, Hamdy FC, Dearnaley DP, MuirKR, Smith C, Bagnato M, Ardern-Jones AT, Hall AL, O'Brien LT,Gehr-Swain BN, Wilkinson RA, Cox A, Lewis S, Brown PM, JhavarSG, Tymrakiewicz M, Lophatananon A, Bryant SL, CollaboratorsUGPCS, of Urological Surgeons' Section of Oncology BA, Collabora-tors UPS, Horwich A, Huddart RA, Khoo VS, Parker CC, Wood-house CJ, Thompson A, Christmas T, Ogden C, Fisher C, Jamieson C,Cooper CS, English DR, Hopper JL, Neal DE, Easton DF: Multiplenewly identified loci associated with prostate cancer suscep-tibility. Nature Genetics 2008, 40:316-321.
66. Hisataki T, Itoh N, Suzuki K, Takahashi A, Masumori N, Tohse N,Ohmori Y, Yamada S, Tsukamoto T: Modulation of phenotype ofhuman prostatic stromal cells by transforming growth fac-tor-betas. Prostate 2004, 58:174-182.
Page 12 of 14(page number not for citation purposes)
http://www.ncbi.nlm.nih.gov/entrez/query.fcgi?cmd=Retrieve&db=PubMed&dopt=Abstract&list_uids=8973701
http://www.ncbi.nlm.nih.gov/entrez/query.fcgi?cmd=Retrieve&db=PubMed&dopt=Abstract&list_uids=8973701
http://www.ncbi.nlm.nih.gov/entrez/query.fcgi?cmd=Retrieve&db=PubMed&dopt=Abstract&list_uids=9730444
http://www.ncbi.nlm.nih.gov/entrez/query.fcgi?cmd=Retrieve&db=PubMed&dopt=Abstract&list_uids=9730444
http://www.ncbi.nlm.nih.gov/entrez/query.fcgi?cmd=Retrieve&db=PubMed&dopt=Abstract&list_uids=9730444
http://www.ncbi.nlm.nih.gov/entrez/query.fcgi?cmd=Retrieve&db=PubMed&dopt=Abstract&list_uids=2880611
http://www.ncbi.nlm.nih.gov/entrez/query.fcgi?cmd=Retrieve&db=PubMed&dopt=Abstract&list_uids=2880611
http://www.ncbi.nlm.nih.gov/entrez/query.fcgi?cmd=Retrieve&db=PubMed&dopt=Abstract&list_uids=2880611
http://www.ncbi.nlm.nih.gov/entrez/query.fcgi?cmd=Retrieve&db=PubMed&dopt=Abstract&list_uids=7524903
http://www.ncbi.nlm.nih.gov/entrez/query.fcgi?cmd=Retrieve&db=PubMed&dopt=Abstract&list_uids=7524903
BMC Systems Biology 2008, 2:106 http://www.biomedcentral.com/1752-0509/2/106
67. Li C, Hibino M, Komatsu H, Sakuma H, Sakakura T, Ueda R, EimotoT, Inagaki H: Primary mucosa-associated lymphoid tissue lym-phoma of the prostate: Tumor relapse 7 years after localtherapy. Pathology International 2008, 58:191-195.
68. Gianni-Barrera R, Gariboldi M, De Cecco L, Manenti G, Dragani TA:Specific gene expression profiles distinguish among func-tional allelic variants of the mouse Pthlh gene in transfectedhuman cancer cells. Oncogene 2006, 25:4501-4504.
69. Pogue-Geile KL, Chen R, Bronner MP, Crnogorac-Jurcevic T, MoyesKW, Dowen S, Otey CA, Crispin DA, George RD, Whitcomb DC,Brentnall TA: Palladin mutation causes familial pancreaticcancer and suggests a new cancer mechanism. PLoS Medicine2006, 3:e516.
70. Yamasaki M, Nomura T, Sato F, Mimata H: Metallothionein is up-regulated under hypoxia and promotes the survival ofhuman prostate cancer cells. Oncology Reports 2007,18:1145-1153.
71. Shiseki M, Nagashima M, Pedeux RM, Kitahama-Shiseki M, Miura K,Okamura S, Onogi H, Higashimoto Y, Appella E, Yokota J, Harris CC:p29ING4 and p28ING5 bind to p53 and p300, and enhancep53 activity. Cancer Research 2003, 63:2373-2378.
72. Demeo DL, Campbell EJ, Barker AF, Brantly ML, Eden E, McElvaneyNG, Rennard SI, Sandhaus RA, Stocks JM, Stoller JK, Strange C,Turino G, Silverman EK: IL10 polymorphisms are associatedwith air flow obstruction in severe alpha1-antitrypsin defi-ciency. American Journal of Respiratory Cell and Molecular Biology 2008,38:114-120.
73. Rumpold H, Heinrich E, Untergasser G, Hermann M, Pfister G, Plas E,Berger P: Neuroendocrine differentiation of human prostaticprimary epithelial cells in vitro. Prostate 2002, 53:101-108.
74. Lü B, Xu J, Zhu Y, Zhang H, Lai M: Systemic analysis of the differ-ential gene expression profile in a colonic adenoma-normalSSH library. Clinica Chimica Acta 2007, 378:42-47.
75. Johansson M, McKay JD, Stattin P, Canzian F, Boillot C, Wiklund F,Adami HO, Bälter K, Grönberg H, Kaaks R: Comprehensive eval-uation of genetic variation in the IGF1 gene and risk of pros-tate cancer. International Journal of Cancer 2007, 120:539-542.
76. Burger MJ, Tebay MA, Keith PA, Samaratunga HM, Clements J, LavinMF, Gardiner RA: Expression analysis of delta-catenin andprostate-specific membrane antigen: their potential as diag-nostic markers for prostate cancer. International Journal of Can-cer 2002, 100:228-237.
77. Pilarsky CP, Schmidt U, Eissrich C, Stade J, Froschermaier SE, HaaseM, Faller G, Kirchner TW, Wirth MP: Expression of the extracel-lular matrix signaling molecule Cyr61 is downregulated inprostate cancer. Prostate 1998, 36:85-91.
78. Shen Y, Jia Z, Nagele RG, Ichikawa H, Goldberg GS: SRC uses Casto suppress Fhl1 in order to promote nonanchored growthand migration of tumor cells. Cancer Research 2006,66:1543-1552.
79. Berteaux N, Lottin S, Adriaenssens E, van Coppenolle F, Leroy X, CollJ, Dugimont T, Curgy JJ: Hormonal regulation of H19 geneexpression in prostate epithelial cells. Journal of Endocrinology2004, 183:69-78.
80. Sanson M, Marineau C, Desmaze C, Lutchman M, Ruttledge M, BaronC, Narod S, Delattre O, Lenoir G, Thomas G, et al.: Germline dele-tion in a neurofibromatosis type 2 kindred inactivates theNF2 gene and a candidate meningioma locus. Human MolecularGenetics 1993, 2:1215-1220.
81. Rogers MS, Christensen KA, Birsner AE, Short SM, Wigelsworth DJ,Collier RJ, D'Amato RJ: Mutant anthrax toxin B moiety (protec-tive antigen) inhibits angiogenesis and tumor growth. CancerResearch 2007, 67:9980-9985.
82. Umeda D, Tachibana H, Yamada K: Epigallocatechin-3-O-gallatedisrupts stress fibers and the contractile ring by reducingmyosin regulatory light chain phosphorylation mediatedthrough the target molecule 67 kDa laminin receptor. Bio-chemical and Biophysical Research Communications 2005, 333:628-635.
83. Kanayama H, Tanaka K, Aki M, Kagawa S, Miyaji H, Satoh M, OkadaF, Sato S, Shimbara N, Ichihara A: Changes in expressions of pro-teasome and ubiquitin genes in human renal cancer cells.Cancer Research 1991, 51:6677-6685.
84. Hooi CF, Blancher C, Qiu W, Revet IM, Williams LH, Ciavarella ML,Anderson RL, Thompson EW, Connor A, Phillips WA, Campbell IG:ST7-mediated suppression of tumorigenicity of prostate
cancer cells is characterized by remodeling of the extracel-lular matrix. Oncogene 2006, 25:3924-3933.
85. Yemelyanov A, Czwornog J, Chebotaev D, Karseladze A, Kulevitch E,Yang X, Budunova I: Tumor suppressor activity of glucocorti-coid receptor in the prostate. Oncogene 2007, 26:1885-1896.
86. Kato K, Horiuchi S, Takahashi A, Ueoka Y, Arima T, Matsuda T, KatoH, Nishida J, Ji J, Nakabeppu Y, Wake N: Contribution of estrogenreceptor alpha to oncogenic K-Ras-mediated NIH3T3 celltransformation and its implication for escape from senes-cence by modulating the p53 pathway. Journal of Biological Chem-istry 2002, 277:11217-11224.
87. Kaiser S, Park YK, Franklin JL, Halberg RB, Yu M, Jessen WJ, Freuden-berg J, Chen X, Haigis K, Jegga AG, Kong S, Sakthivel B, Xu H, Reich-ling T, Azhar M, Boivin GP, Roberts RB, Bissahoyo AC, Gonzales F,Bloom GC, Eschrich S, Carter SL, Aronow JE, Kleimeyer J, KleimeyerM, Ramaswamy V, Settle SH, Boone B, Levy S, Graff JM, DoetschmanT, Groden J, Dove WF, Threadgill DW, Yeatman TJ, Coffey RJJ,Aronow BJ: Transcriptional recapitulation and subversion ofembryonic colon development by mouse colon tumor mod-els and human colon cancer. Genome Biology 2007, 8:R131.
88. Zhang Y, Ma K, Sadana P, Chowdhury F, Gaillard S, Wang F, McDon-nell DP, Unterman TG, Elam MB, Park EA: Estrogen-relatedreceptors stimulate pyruvate dehydrogenase kinase isoform4 gene expression. Journal of Biological Chemistry 2006,281:39897-39906.
89. Ashida S, Nakagawa H, Katagiri T, Furihata M, Iiizumi M, Anazawa Y,Tsunoda T, Takata R, Kasahara K, Miki T, Fujioka T, Shuin T, Naka-mura Y: Molecular features of the transition from prostaticintraepithelial neoplasia (PIN) to prostate cancer: genome-wide gene-expression profiles of prostate cancers and PINs.Cancer Research 2004, 64:5963-5972.
90. Segawa T, Nau ME, Xu LL, Chilukuri RN, Makarem M, Zhang W,Petrovics G, Sesterhenn IA, McLeod DG, Moul JW, Vahey M, Srivas-tava S: Androgen-induced expression of endoplasmic reticu-lum (ER) stress response genes in prostate cancer cells.Oncogene 2002, 21:8749-8758.
91. Hodgson G, Hager JH, Volik S, Hariono S, Wernick M, Moore D,Nowak N, Albertson DG, Pinkel D, Collins C, Hanahan D, Gray JW:Genome scanning with array CGH delineates regional alter-ations in mouse islet carcinomas. Nature Genetics 2001,29:459-464.
92. Chan CT, Paulmurugan R, Gheysens OS, Kim J, Chiosis G, GambhirSS: Molecular imaging of the efficacy of heat shock protein 90inhibitors in living subjects. Cancer Research 2008, 68:216-226.
93. Ricci G, De Maria F, Antonini G, Turella P, Bullo A, Stella L, FilomeniG, Federici G, Caccuri AM: 7-Nitro-2,1,3-benzoxadiazole deriv-atives, a new class of suicide inhibitors for glutathione S-transferases. Mechanism of action of potential anticancerdrugs. Journal of Biological Chemistry 2005, 280:26397-26405.
94. Yamashita S, Wakazono K, Nomoto T, Tsujino Y, Kuramoto T, Ush-ijima T: Expression quantitative trait loci analysis of 13 genesin the rat prostate. Genetics 2005, 171:1231-1238.
95. Attard G, Clark J, Ambroisine L, Fisher G, Kovacs G, Flohr P, BerneyD, Foster CS, Fletcher A, Gerald WL, Moller H, Reuter V, De BonoJS, Scardino P, Cuzick J, Cooper CS: Duplication of the fusion ofTMPRSS2 to ERG sequences identifies fatal human prostatecancer. Oncogene 2008, 27:253-263.
96. Yang F, Tuxhorn JA, Ressler SJ, McAlhany SJ, Dang TD, Rowley DR:Stromal expression of connective tissue growth factor pro-motes angiogenesis and prostate cancer tumorigenesis. Can-cer Research 2005, 65:8887-8895.
97. Dong Y, Zhang H, Gao AC, Marshall JR, Ip C: Androgen receptorsignaling intensity is a key factor in determining the sensitiv-ity of prostate cancer cells to selenium inhibition of growthand cancer-specific biomarkers. Molecular Cancer Therapeutics2005, 4:1047-1055.
98. Lee S, Bang S, Song K, Lee I: Differential expression in normal-adenoma-carcinoma sequence suggests complex molecularcarcinogenesis in colon. Oncology Reports 2006, 16:747-754.
99. Yegnasubramanian S, Kowalski J, Gonzalgo ML, Zahurak M, PiantadosiS, Walsh PC, Bova GS, De Marzo AM, Isaacs WB, Nelson WG:Hypermethylation of CpG islands in primary and metastatichuman prostate cancer. Cancer Research 2004, 64:1975-1986.
100. Leiblich A, Cross SS, Catto JW, Phillips JT, Leung HY, Hamdy FC, Reh-man I: Lactate dehydrogenase-B is silenced by promoter
Page 13 of 14(page number not for citation purposes)
http://www.ncbi.nlm.nih.gov/entrez/query.fcgi?cmd=Retrieve&db=PubMed&dopt=Abstract&list_uids=9655260
http://www.ncbi.nlm.nih.gov/entrez/query.fcgi?cmd=Retrieve&db=PubMed&dopt=Abstract&list_uids=9655260
http://www.ncbi.nlm.nih.gov/entrez/query.fcgi?cmd=Retrieve&db=PubMed&dopt=Abstract&list_uids=9655260
http://www.ncbi.nlm.nih.gov/entrez/query.fcgi?cmd=Retrieve&db=PubMed&dopt=Abstract&list_uids=8401504
http://www.ncbi.nlm.nih.gov/entrez/query.fcgi?cmd=Retrieve&db=PubMed&dopt=Abstract&list_uids=1660345
BMC Systems Biology 2008, 2:106 http://www.biomedcentral.com/1752-0509/2/106
Publish with BioMed Central and every scientist can read your work free of charge
"BioMed Central will be the most significant development for disseminating the results of biomedical research in our lifetime."
Sir Paul Nurse, Cancer Research UK
Your research papers will be:
available free of charge to the entire biomedical community
peer reviewed and published immediately upon acceptance
cited in PubMed and archived on PubMed Central
yours — you keep the copyright
Submit your manuscript here:http://www.biomedcentral.com/info/publishing_adv.asp
BioMedcentral
hypermethylation in human prostate cancer. Oncogene 2006,25:2953-2960.
101. Wiese AH, Auer J, Lassmann S, Nährig J, Rosenberg R, Höfler H,Rüger R, Werner M: Identification of gene signatures for inva-sive colorectal tumor cells. Cancer Detection and Prevention 2007,31:282-295.
102. Karam JA, Lotan Y, Roehrborn CG, Ashfaq R, Karakiewicz PI, ShariatSF: Caveolin-1 overexpression is associated with aggressiveprostate cancer recurrence. Prostate 2007, 67:614-622.
103. Gober MD, Smith CC, Ueda K, Toretsky JA, Aurelian L: Forcedexpression of the H11 heat shock protein can be regulatedby DNA methylation and trigger apoptosis in human cells.Journal of Biological Chemistry 2003, 278:37600-37609.
104. Eeckhoute J, Carroll JS, Geistlinger TR, Torres-Arzayus MI, Brown M:A cell-type-specific transcriptional network required forestrogen regulation of cyclin D1 and cell cycle progression inbreast cancer. Genes & Development 2006, 20:2513-2526.
105. Crombez KR, Vanoirbeek EM, Ven WJ Van de, Petit MM: Transac-tivation functions of the tumor-specific HMGA2/LPP fusionprotein are augmented by wild-type HMGA2. Molecular CancerResearch 2005, 3:63-70.
106. Yun MY, Kim SB, Park S, Han CJ, Han YH, Yoon SH, Kim SH, Kim CM,Choi DW, Cho MH, Park GH, Lee KH: Mutation analysis ofp31comet gene, a negative regulator of Mad2, in humanhepatocellular carcinoma. Experimental & molecular medicine2007, 39:508-513.
107. Gustavsson H, Jennbacken K, Welén K, Damber JE: Altered expres-sion of genes regulating angiogenesis in experimental andro-gen-independent prostate cancer. Prostate 2008, 68:161-170.
108. Ghosh PM, Ghosh-Choudhury N, Moyer ML, Mott GE, Thomas CA,Foster BA, Greenberg NM, Kreisberg JI: Role of RhoA activationin the growth and morphology of a murine prostate tumorcell line. Oncogene 1999, 18:4120-4130.
109. Xu W, Ngo L, Perez G, Dokmanovic M, Marks PA: Intrinsic apop-totic and thioredoxin pathways in human prostate cancercell response to histone deacetylase inhibitor. PNAS 2006,103:15540-15545.
110. Coe BP, Henderson LJ, Garnis C, Tsao MS, Gazdar AF, Minna J, LamS, Macaulay C, Lam WL: High-resolution chromosome arm 5parray CGH analysis of small cell lung carcinoma cell lines.Genes Chromosomes & Cancer 2005, 42:308-313.
111. Wlodek L, Wróbel M, Czubak J: Transamination and transsul-phuration of L-cysteine in Ehrlich ascites tumor cells andmouse liver. The nonenzymatic reaction of L-cysteine withpyruvate. International journal of biochemistry 1993, 25:107-112.
112. Shadeo A, Chari R, Lonergan KM, Pusic A, Miller D, Ehlen T, vanNiekerk D, Matisic J, Richards-Kortum R, Follen M, Guillaud M, LamWL, Macaulay C: Up regulation in gene expression of chroma-tin remodelling factors in cervical intraepithelial neoplasia.BMC Genomics 2008, 9:64.
113. Zhang XA, Lane WS, Charrin S, Rubinstein E, Liu L: EWI2/PGRLassociates with the metastasis suppressor KAI1/CD82 andinhibits the migration of prostate cancer cells. Cancer Research2003, 63:2665-2674.
114. Pertin M, Ji RR, Berta T, Powell AJ, Karchewski L, Tate SN, Isom LL,Woolf CJ, Gilliard N, Spahn DR, Decosterd I: Upregulation of thevoltage-gated sodium channel beta2 subunit in neuropathicpain models: characterization of expression in injured andnon-injured primary sensory neurons. Journal of Neuroscience2005, 25:10970-10980.
115. Nelson PS, Plymate SR, Wang K, True LD, Ware JL, Gan L, Liu AY,Hood L: Hevin, an antiadhesive extracellular matrix protein,is down-regulated in metastatic prostate adenocarcinoma.Cancer Research 1998, 58:232-236.
116. Yao R, Rich SA, Schneider E: Validation of sixteen leukemia andlymphoma cell lines as controls for molecular gene rear-rangement assays. Clinical Chemistry 2002, 48:1344-1351.
117. Rust R, Visser L, Leij J van der, Harms G, Blokzijl T, Deloulme JC, VliesP van der, Kamps W, Kok K, Lim M, Poppema S, Berg A van den:High expression of calcium-binding proteins, S100A10,S100A11 and CALM2 in anaplastic large cell lymphoma. Brit-ish Journal of Haematology 2005, 131:596-608.
118. Sampson N, Untergasser G, Lilg C, Tadic L, Plas E, Berger P:GAGEC1, a cancer/testis associated antigen family member,is a target of TGF-beta1 in age-related prostatic disease.Mechanisms of Ageing and Development 2007, 128:64-66.
119. Toutenhoofd SL, Foletti D, Wicki R, Rhyner JA, Garcia F, Tolon R,Strehler EE: Characterization of the human CALM2 calmodu-lin gene and comparison of the transcriptional activity ofCALM1, CALM2 and CALM3. Cell Calcium 1998, 23:323-338.
120. Chaib H, Cockrell EK, Rubin MA, Macoska JA: Profiling and verifi-cation of gene expression patterns in normal and malignanthuman prostate tissues by cDNA microarray analysis. Neo-plasia 2001, 3:43-52.
121. Wang Z, Hao Y, Lowe AW: The adenocarcinoma-associatedantigen, AGR2, promotes tumor growth, cell migration, andcellular transformation. Cancer Research 2008, 68:492-497.
Page 14 of 14(page number not for citation purposes)
http://www.ncbi.nlm.nih.gov/entrez/query.fcgi?cmd=Retrieve&db=PubMed&dopt=Abstract&list_uids=8094343
http://www.ncbi.nlm.nih.gov/entrez/query.fcgi?cmd=Retrieve&db=PubMed&dopt=Abstract&list_uids=8094343
http://www.ncbi.nlm.nih.gov/entrez/query.fcgi?cmd=Retrieve&db=PubMed&dopt=Abstract&list_uids=8094343
http://www.ncbi.nlm.nih.gov/entrez/query.fcgi?cmd=Retrieve&db=PubMed&dopt=Abstract&list_uids=9443398
http://www.ncbi.nlm.nih.gov/entrez/query.fcgi?cmd=Retrieve&db=PubMed&dopt=Abstract&list_uids=9443398
http://www.ncbi.nlm.nih.gov/entrez/query.fcgi?cmd=Retrieve&db=PubMed&dopt=Abstract&list_uids=9681195
http://www.ncbi.nlm.nih.gov/entrez/query.fcgi?cmd=Retrieve&db=PubMed&dopt=Abstract&list_uids=9681195
Related Documents