Multidimensional Fourier spectroscopy of semiconductors. II. Decoherence effects Kuljit S. Virk* and J. E. Sipe † Department of Physics and Institute for Optical Sciences, University of Toronto, 60 St. George Street, Toronto, Ontario, Canada M5S 1A7 Received 6 July 2009; revised manuscript received 26 August 2009; published 15 October 2009 We study decoherence between the states of optically excited excitons embedded in an electron gas and compare it to the decoherence between the excitons and the ground state. The problem is examined within the context of two-dimensional Fourier spectroscopy using the formalism discussed in the first paper of this series K. S. Virk and J. E. Sipe, Phys. Rev. B 80, 165318 2009. Two-time correlation functions for excitons are constructed and a dynamical equation describing their evolution is derived. The equation is compared to the corresponding equation for the interband polarization. It is argued, and verified by numerical calculation, that the decay of Raman coherence between exciton states is much slower than the decay of interband polarization and that it depends explicitly on how differently the superimposed exciton states interact with modes of the electron gas. The equations are generally non-Markov. Numerical results are obtained for a simple model of low-energy excitations of a GaAs quantum well. DOI: 10.1103/PhysRevB.80.165319 PACS numbers: 78.47.p, 71.35.y, 42.50.Md, 78.67.n I. INTRODUCTION Decoherence forms an important part of the dynamics of electrons in semiconductors at ultrafast time scales. The coherent optical excitation of a semiconductor induces a su- perposition of many-body states, which eventually decays due to interactions. The interference resulting from this coherence is an important feature of four-wave mixing experiments, 1 plays a central role in the generation of current and photon echos, 2–6 and has been exploited to optically in- ject charge and spin currents. 7,8 More recently, the technique of multidimensional Fourier spectroscopy has been success- fully applied to semiconductor quantum wells 9–11 and has already proved useful in identifying the effects of decoher- ence on signals generated by the laser-semiconductor inter- action. In the first paper 12 of this series, hereafter referred to as I, we presented a formalism that uses nonequilibrium Green’s functions to model three-pulse excitation of semiconductors. The formalism is general enough to handle a variety of initial states, including a quasiequilibrium distribution of carriers established prior to the excitation. We also developed a dia- gram method that is useful in analyzing the many-body in- teractions and optical excitation on an equal footing. In this paper, we complement the abstract nature of paper I by applying the formalism to a specific problem: the decoher- ence of exciton states in a background electron gas. We focus on systems in which the hole and exciton densities prior to optical excitation densities are vanishing. The argument for studying this problem is threefold. First, excitons are arguably the most experimentally accessible many-body states. Second, exciton states represent the sim- plest many-body excitations that can be used as a concrete example for testing any formalism. Third, their interaction with an electron gas presents a new regime of decoherence, where the usual system-bath separation does not exist owing to the indistinguishability of the electron in the exciton from that in the gas. In this paper, we show that, at least within a physically motivated set of approximations, decoherence ef- fects in this scenario can be brought into direct comparison to the conventional system-bath models while respecting the indistinguishability. In studying the dynamics of optically excited excitons, the specific property of interest is Raman coherence. 13 Raman coherence refers to the coherence between excited states of the semiconductor. Being a coherence between excited states, it is not directly injected by linear optical excitation, in contrast to interband polarization, which is a coherence between the ground state and an excited state. Raman coher- ences can be dominated by the exchange and correlation in the multiparticle states and can thus be fundamentally differ- ent from the mere beating of interband coherences. The for- malism that we apply in the present paper is built to handle precisely this exchange-correlation part and we quantify the extent to which the exchange and correlation dominate. Nonetheless, it is the beating of interband coherences that gives rise to a driving term, which leads to the rise of coher- ences in multiparticle correlations. The first major result of the present paper is the microscopic description of one such mechanism of this transfer of coherence. The mechanism in question is driven by the dynamical response of the electron gas, more precisely the density- density correlation. This response leads to a nonfactorizable correlation among two interband polarization amplitudes. At the same time, the continuum of excitations in the electron gas, consisting of plasmons and pair excitations, leads to a “measurement” of this coherence. The same dynamical re- sponse thus also leads to the diminishing of the coherence it helps build. Yet the two processes do not cancel. While the appearance of this coherence originates from the strength of the multipole moments of the two exciton states, the deco- herence depends sensitively on how differently the two mul- tipoles interact with the electron gas. Incidentally, this is also the origin of decoherence in traditional models where differ- ent system states scatter a bath state into two different states with vanishing overlap. The reasoning applies also to the interband coherence, which is a superposition of the presence and absence of exciton. In terms of scattering, the two states are distinguished by any scattering event. The second major result of the paper is the explicit analytical and numerical demonstration of these facts. We find that exciton states with similar momentum space profiles tend to have Raman coher- PHYSICAL REVIEW B 80, 165319 2009 1098-0121/2009/8016/16531928 ©2009 The American Physical Society 165319-1

Welcome message from author
This document is posted to help you gain knowledge. Please leave a comment to let me know what you think about it! Share it to your friends and learn new things together.
Transcript
Multidimensional Fourier spectroscopy of semiconductors. II. Decoherence effects
Kuljit S. Virk* and J. E. Sipe†
Department of Physics and Institute for Optical Sciences, University of Toronto, 60 St. George Street, Toronto, Ontario,Canada M5S 1A7
Received 6 July 2009; revised manuscript received 26 August 2009; published 15 October 2009
We study decoherence between the states of optically excited excitons embedded in an electron gas andcompare it to the decoherence between the excitons and the ground state. The problem is examined within thecontext of two-dimensional Fourier spectroscopy using the formalism discussed in the first paper of this seriesK. S. Virk and J. E. Sipe, Phys. Rev. B 80, 165318 2009. Two-time correlation functions for excitons areconstructed and a dynamical equation describing their evolution is derived. The equation is compared to thecorresponding equation for the interband polarization. It is argued, and verified by numerical calculation, thatthe decay of Raman coherence between exciton states is much slower than the decay of interband polarizationand that it depends explicitly on how differently the superimposed exciton states interact with modes of theelectron gas. The equations are generally non-Markov. Numerical results are obtained for a simple model oflow-energy excitations of a GaAs quantum well.
DOI: 10.1103/PhysRevB.80.165319 PACS numbers: 78.47.p, 71.35.y, 42.50.Md, 78.67.n
I. INTRODUCTION
Decoherence forms an important part of the dynamics ofelectrons in semiconductors at ultrafast time scales. Thecoherent optical excitation of a semiconductor induces a su-perposition of many-body states, which eventually decaysdue to interactions. The interference resulting from thiscoherence is an important feature of four-wave mixingexperiments,1 plays a central role in the generation of currentand photon echos,2–6 and has been exploited to optically in-ject charge and spin currents.7,8 More recently, the techniqueof multidimensional Fourier spectroscopy has been success-fully applied to semiconductor quantum wells9–11 and hasalready proved useful in identifying the effects of decoher-ence on signals generated by the laser-semiconductor inter-action.
In the first paper12 of this series, hereafter referred to as I,we presented a formalism that uses nonequilibrium Green’sfunctions to model three-pulse excitation of semiconductors.The formalism is general enough to handle a variety of initialstates, including a quasiequilibrium distribution of carriersestablished prior to the excitation. We also developed a dia-gram method that is useful in analyzing the many-body in-teractions and optical excitation on an equal footing. In thispaper, we complement the abstract nature of paper I byapplying the formalism to a specific problem: the decoher-ence of exciton states in a background electron gas. We focuson systems in which the hole and exciton densities prior tooptical excitation densities are vanishing.
The argument for studying this problem is threefold. First,excitons are arguably the most experimentally accessiblemany-body states. Second, exciton states represent the sim-plest many-body excitations that can be used as a concreteexample for testing any formalism. Third, their interactionwith an electron gas presents a new regime of decoherence,where the usual system-bath separation does not exist owingto the indistinguishability of the electron in the exciton fromthat in the gas. In this paper, we show that, at least within aphysically motivated set of approximations, decoherence ef-fects in this scenario can be brought into direct comparisonto the conventional system-bath models while respecting theindistinguishability.
In studying the dynamics of optically excited excitons, thespecific property of interest is Raman coherence.13 Ramancoherence refers to the coherence between excited states ofthe semiconductor. Being a coherence between excitedstates, it is not directly injected by linear optical excitation,in contrast to interband polarization, which is a coherencebetween the ground state and an excited state. Raman coher-ences can be dominated by the exchange and correlation inthe multiparticle states and can thus be fundamentally differ-ent from the mere beating of interband coherences. The for-malism that we apply in the present paper is built to handleprecisely this exchange-correlation part and we quantify theextent to which the exchange and correlation dominate.Nonetheless, it is the beating of interband coherences thatgives rise to a driving term, which leads to the rise of coher-ences in multiparticle correlations. The first major result ofthe present paper is the microscopic description of one suchmechanism of this transfer of coherence.
The mechanism in question is driven by the dynamicalresponse of the electron gas, more precisely the density-density correlation. This response leads to a nonfactorizablecorrelation among two interband polarization amplitudes. Atthe same time, the continuum of excitations in the electrongas, consisting of plasmons and pair excitations, leads to a“measurement” of this coherence. The same dynamical re-sponse thus also leads to the diminishing of the coherence ithelps build. Yet the two processes do not cancel. While theappearance of this coherence originates from the strength ofthe multipole moments of the two exciton states, the deco-herence depends sensitively on how differently the two mul-tipoles interact with the electron gas. Incidentally, this is alsothe origin of decoherence in traditional models where differ-ent system states scatter a bath state into two different stateswith vanishing overlap. The reasoning applies also to theinterband coherence, which is a superposition of the presenceand absence of exciton. In terms of scattering, the two statesare distinguished by any scattering event. The second majorresult of the paper is the explicit analytical and numericaldemonstration of these facts. We find that exciton states withsimilar momentum space profiles tend to have Raman coher-
PHYSICAL REVIEW B 80, 165319 2009
1098-0121/2009/8016/16531928 ©2009 The American Physical Society165319-1
ences that far outlive their respective coherences with theground state.
Furthermore, an exciton is a composite particle, consist-ing of an electron and a hole. In the limit of low density ofthe surrounding electron gas, the composite nature of theexciton can largely be ignored. However, as the density rises,the electron and hole, besides being bound to each other, canindividually interact with the electrons in the gas. This inter-action includes not only the Coulomb interaction but also theexchange interaction, since the electrons in the gas can beexchanged with that bound to the hole. It then becomes nec-essary to take into account these new effects in describingthe dynamics of excitons embedded in an electron gas.
This brings us to the third major result of the paper. Wefind that the dynamical equations for the excitons involvetwo classes of functions: those that treat exciton as indivis-ible and thus are sensitive only to its multipole moments andthose that treat exciton as a composite particle and take intoaccount the individual propagation of the electron and thehole. The latter is connected to excitations of the N-particlemany-body system in the N1-particle Hilbert space. Wefind that for densities involved for our choice of materialparameters, the composite nature of the exciton makes littlecontribution. Therefore, we ignore it in our analysis, but itsappearance in the equations will be useful for future analysesin different parameter regimes.
In the calculations described below, we first study the ex-citon levels in the presence of static screening. The screeningoriginates from the conduction-band electrons that are as-sumed to be present in the samples via doping and we takethe hole and exciton densities to be equal to zero in the initialquasiequilibrium state. The screening is controlled by asingle parameter, which is calculated self-consistently for afixed density of the electron gas. For at least three boundexciton states to exist, we find that a density lower than anelectron per exciton radius is required. We study decoherencebetween 2s and 2p states, neglecting spin as well as aniso-tropy of energy bands.
This paper is organized as follows. In Sec. II, we begin byestablishing the link between our approach and the moreconventional descriptions based on wave functions or densitymatrices. We then discuss the relevance of our theoreticalapproach, and the calculations we make, to signals that canbe observed in two-dimensional Fourier spectroscopyTDFS experiments. In Sec. III, we present the equations ofmotion for our dynamical quantities and a discussion of thenature of the approximations made. The dynamics governedby the equations of motion is analyzed in Sec. IV, where wepresent and analyze the dynamics in a way that makes thethree results sketched above analytically explicit. In Sec. V,we discuss our numerical technique for solving the two-timenon-Markov equations, as well as the model for the electrongas we have used in our calculations. In Sec. VI, we presentresults of three different calculations and discuss them in thecontext of our analysis of the dynamical model; our conclu-sions are presented in Sec. VII. For some of the quantitiesintroduced as part of the general formalism in I, but whichappear often in this paper, it is convenient to adopt a short-hand notation here. In Appendix A, we include some techni-cal definitions and a table listing the key theoretical quanti-
ties in both the general and the shorthand notations, theirphysical significance, and references to defining equations.Some details of calculations are also relegated to AppendixesB and C. In Appendix B, we discuss our approximationmethod to restrict four-point functions to depend only on twotime variables. In Appendix C, Sec. C 1, we discuss thederivation of the equation of motion EOM for the excitoncorrelation function, and in Appendix C, Sec. C 2, we dis-cuss the similar derivation for the interband polarization.
II. BACKGROUND
A. Conceptual motivation
In this section, we discuss various types of coherencesand the issues related to them on formal grounds. In particu-lar, we begin with a traditional wave-function perspective toidentify the two main types of coherences that are accessibleoptically in semiconductors. We then recast them in theGreen’s function language and point out the important physi-cal aspects of the dynamics of these coherences that can behandled naturally within our formalism.
Consider an optical excitation of a quantum well close toits band-gap energy with a pulse so weak that the dominanteffect is the generation of an interband polarization. In theindependent-particle approximation, we can describe thestate of the system as
t 0 + kcvktcv,k ,
where 0 is the ground state of the system and cv ,k is astate with a conduction electron and a valence hole. Theamplitudes cvkt are proportional to the dipole matrix ele-ments and the electric field. In a perfectly coherent system,the unitary evolution of this state is fully captured by theamplitudes cvkt. To step beyond this regime, we write thecorresponding density matrix
t 00 + k
cvktcv,k0 − cvk t0cv,k
+ kk
cvktcvk tcv,kcv,k . 1
Here we interpret the second term as a coherence betweenthe ground state and an excited state containing one electron-hole pair. It arises from the superposition between existenceand nonexistence of the electron-hole pair. The third termdescribes another superposition, in which both states in-volved contain an electron-hole pair but in different states ofthe two-particle Hilbert space. These are often referred to asRaman coherences.13 In other words, the second term is acoherence between two different Hilbert spaces namely,zero and two-particle, while the third term is a coherencewithin a single Hilbert space.
We can abstract from this perspective a more general ex-pression for t in the form
t 00 + 1t + 2t . 2
Elements of 1t are coherences between the ground stateand the excited states interband coherences and those of
KULJIT S. VIRK AND J. E. SIPE PHYSICAL REVIEW B 80, 165319 2009
165319-2
2t are coherences among the excited states intraband co-herences. While their relationship is fixed by Eq. 1 withinthe noninteracting particle picture, their evolution can be dra-matically different when interactions are taken into account.When interactions are present, of course, the very idea of a“single-particle state” loses its validity. Nonetheless, at short-enough time scales, the concepts of quasiparticle bands andcrystal momentum retain an approximate validity. This “qua-siparticle regime” is discussed, within our approach, in Sec.IV of I. It is an underlying assumption in the present calcu-lation that this quasiparticle regime extends to picosecondtime scales.
We now turn to a Green’s function description of the sce-nario of Eq. 1. Very generally, the single and two-particleGreen’s functions are defined as
G12 = − iTCa1a†2 , 3
G14;23 = − TCa1a4a†3a†2 , 4
in the standard notation of I; a and a† are, respectively,annihilation and creation operators and indices such as 1 canbe taken to label a space and time point, or alternately anindex of a nominal band and a crystal momentum, togetherwith a time. A usual decomposition of G14;23 is
G14;23 = G12G43 − X214;23 , 5
where the first term alone is the Hartree approximation andthe second is a correction that accounts for exchange andcorrelation; the second term is written in notation of I.14 In asemiconductor, once the conduction c and valence vbands have been identified, the interband coherences cvkarising in the simple description Eqs. 1 and 2 are de-scribed in the Green’s function formalism by the equal-timelimit of the component
Gcv12 = − iTCac1av†2
of the Green’s function 3. Here, we explicitly display thebands associated with the indices c with 1 and v with 2 andthe indices themselves only indicate a crystal momentum andtime. The quasiequilibrium background state is subjected tothe condition Gcv12=0, which means that no coherenceexists in the system prior to optical excitation. The two-particle propagation involved in exciton states is handled bya component of the four-point Green’s function 4 in whichone electron resides in the conduction and one in valenceband
Gcvvc14;23 = − TCac1av4ac†3av
†2 .
This Green’s function describes the propagation of two elec-trons, added to the system at times t2 and t3, and subsequentremoval at times t1 and t2, respectively. The equal-time limitt2= t1 t , t4= t3= t1
+ describes the coherences that are givenby cvktcvk
t in the simple description Eqs. 1 and 2.More generally,
Gcvvc14;1+4+ = Gcv11+Gvc44+ − Xcvvc2 14;1+4+ ,
6
where Gcv11+ describes the interband coherence. In theequal-time limit and with interactions turned off,
Gcvvckat,kdt;kbt+,kct+ = Gcvkat,kbt+Gvckdt,kct
+
− Gcckat,kct+Gvvkdt,kbt+ .
7
Comparing Eq. 7 to the product cvktcvk t and recall-
ing Eq. 1, it becomes clear that a wave-function descriptionis possible only if the carrier density can be ignored so thatthe exchange interaction among electrons is negligible. Thesecond term in the last equation represents the effect of in-distinguishability of electrons that prevents one from treatingan electron-hole pair as a closed system in the presence ofelectron gas, even with all interactions turned off. If the Cou-lomb interactions are allowed but Gcckat ,kct
+0, thenthey bind electron and hole into an exciton that can betreated as a particle in the semiconductor vacuum.
Further interactions also screen the Coulomb interactionvia the response of the medium surrounding the exciton. Ifthat response is such that the screening is effectively static,then Gcvvckat ,kdt ;kbt+ ,kct
+Gcvkat ,kbt+Gvckdt ,kct+
continues to hold, but the exciton states associated with thepoles of the two-particle Green’s function will be modified.If the dynamic nature of the response is taken into account,then correlations between the screening medium and the ex-citon will contribute to X2, thus destroying a wave-functiondescription of the state of the system. So we see that ingeneral, there are two reasons why it is impossible to main-tain Eq. 1 as the state of the system: the presence of ex-change interaction and the presence of interaction with a sur-rounding medium including electrons.
In following the excitation of the system by optical fields,we track the deviations induced in the original, quasiequilib-rium X1G and X2. The deviations at order n in the ef-fective field, U, are identified by the functions Xn
1 and Xn2
with additional subscripts indicating bands. With some cave-ats, U, can be identified as the optical perturbation drivingtransitions between the valence and conduction bands.12,15 Atn=2, X2;cvvc
2 will contribute significantly to Gcvvc. At fre-quencies corresponding to the exciton states, the opticallygenerated densities may indeed be small and the dominantcorrection will arise mainly from dynamical interactions. Thepurely exchange term will be important if the coupling be-tween exciton dynamics and the optically injected electronand hole densities is large.
The dynamical interactions will drive the system toward anew quasiequilibrium state involving excited electron-holepairs, electron gas, and other quasiparticles, such as phonons,that may be important. Since it is a good approximation toneglect any interband transitions via Coulomb interaction,this quasiequilibrium state will be devoid of any interbandpolarization, i.e., Gcv→0. Thus, as the system moves froman initial excitation of interband coherence to quasiequilib-rium, the functions Xcvvc
2 entirely take over the contributionto the two-particle states of the system. Furthermore, when
MULTIDIMENSIONAL… . II. DECOHERENCE EFFECTS PHYSICAL REVIEW B 80, 165319 2009
165319-3
bound excitons can be formed, the dynamics of Xcvvc2 is
much richer than the dynamics of Gcv alone. This is becausethe decay of Gcv is sensitive to any scattering event involvingthe excited pair, while the decay of Xcvvc
2 is sensitive to howdifferent are the scattering properties of the two superim-posed states. This point becomes explicit in the equations ofmotion we introduce below for the two objects, which can becompared on an equal footing.
We also remark that both the rise of coherence in Xcvvc2
associated with the optical excitation and the subsequent de-coherence are mediated by dynamical interactions. Neglect-ing phonons, as we do in this paper, these dynamical inter-actions in turn require that the density-density correlation inthe many-body electronic system is nonzero, i.e.,
X2rt,rt;rt+rt+ = nr,tnr,t − nr,tnr,t
0,
where nr , t is the electron-density operator. In the originalquasiequilibrium state, we associate this fluctuation with thequasiparticle density in the partially filled conduction bandand treat the filled valence bands as inert. Fluctuations in thesemiconductor vacuum must involve the formation of virtualelectron-hole pairs with energy close to the fundamental gapand therefore they are very short lived. Only the much longertime scale of fluctuations of the gas formed in the conductionband is of relevance in this work. The role of dynamicalinteractions in both coherence and decoherence will also beseen explicitly below when comparing the dynamical mapfor X2 to the source terms driving it.
Thus we see that it is natural to study the decoherence ofexcitons using only the function Xcvvc
2 , which is free of theshort-lived contributions of interband polarization to the totaltwo-particle Green’s functions. As functions of four argu-ments, these are too large for computation and describe farmore effects than we aim to capture in this work. In thefollowing section, we will describe a set of approximationsthat restricts these functions to describe excitons in a waysimilar to quasiparticles, while being sensitive to their com-posite nature as well.
B. Relationship to experiment
The main quantity studied in this paper is the two-particlecorrelation function for excitons and the main property ofthis function that we focus on is Raman coherence. In thissection, we discuss how this quantity is related to experimen-tally measurable signals. For concreteness, we pick the exci-ton states 2s and 2p, which lie within a few meV of theconduction-band edge for the electron density involved. The2s state is excited by single-photon absorption while the 2pstate is excited by two-photon absorption. We assume thatthe first two pulses in the excitation sequence are coincidentand predominantly excite these states. This restriction on ex-citations holds for optical frequencies that resonate with ex-citation from the ground state to exciton states. At muchlower frequencies, field-driven transitions from exciton tohigher-particle correlations may become important, but theycan be safely ignored here. We are not interested in the dy-namics with respect to the delay between the first and the
second pulses and have thus taken the pulses to be overlap-ping in time. This minimizes the effects of first-order devia-tions in multiparticle correlations, such that the coherencebetween two-particle states is driven mainly by interbandpolarization only. We let the third pulse arrive a time td afterthe first two pulses and we let be the time after the thirdpulse when the signal is detected. The process is illustrateddiagrammatically in Fig. 11 of I. Henceforth, we will refer toequations and figures of Virk and Sipe12 I as “I-” followedby the corresponding number in that paper.
As discussed in Sec. I-IVC, the electromagnetic signalcorresponding to TDFS for this scenario is given by the cur-rent density I-115,
J3qt = − eq − k1 + k2 − k3 dk
42cvkvckX3;cv1
kt;kt+ + c.c., 8
where vck is the matrix element of the position operator,cvk= Eck−Evk /, where Ec and Ev are the conduc-tion and valence-band energies, and X3;cv
1 is the third-orderdeviation in the effective field in the single-particle Green’sfunction. In the following, we set cvk equal to the funda-mental gap frequency, g, and neglect the small contributionarising from its dependence on k. We estimate X3;cv
1 by itssource terms alone and ignore the convolution effects of thedecoherence causing terms in this interband polarization seeI.
There are two contributions to the third-order interbandpolarization, as shown in Fig. I-11. The first arises from thePauli blocking due to the optically injected carriers and thesecond due to the Raman coherence of exciton states. It is thesecond contribution that is of primary interest to us in thispaper and it appears in a different region of two-dimensionalspectrum than the former. Thus we study only this contribu-tion. To indicate that only the exciton contribution is in-cluded, we put the superscript “ex” on J3.
Based on the above approximations and substitutingI-110 in I-115, we obtain
J3exq;td, = − eq − k1 + k2 − k3g
n
dmnPnmtd +
2,
e−inmtde−in/2 + c.c. 9
Here, the vector coefficients dmn are given by the projectionof optical transition matrix elements onto the exciton states.The arguments td and correspond to the delays between thefirst two and the third pulse and between the third pulse and
the time of measurement, respectively. The function Pt , isthe exciton correlation function of second order in the effec-tive field. It is the exchange-correlation part of the excitonGreen’s function that gives an amplitude for the system withan exciton removed from state m at time td to evolve into thestate with an exciton removed from level n at time td+ /2. Itis also a restricted form of the more general correlation func-tions, X2;cvvc
2 , of the formalism of I.16 When the radiatedelectromagnetic field is calculated from this current density,there are additional effects arising from the propagation in-side the well and radiation reaction and their treatment is
KULJIT S. VIRK AND J. E. SIPE PHYSICAL REVIEW B 80, 165319 2009
165319-4
discussed at length in Appendix IA. We do not consider themin this paper.
Due to the dependence of the right-hand side of Eq. 9 ontd and , J3
ex also becomes a function of these two variables.The two-dimensional Fourier transform of the signal withrespect to the two time delays is then given by
J3exq;, = − eq − k1 + k2 − k3cv0
nm
dmnPnm − nm, −
2−n + m
2 ,
10
where Pnm , is the two-dimensional Fourier transform
of Pnmt ,. Thus the signal can also be viewed as the trans-fer of Raman coherence back to interband coherence, whichradiates at optical frequencies.
The two-dimensional spectrum in Eq. 10 is a sum of the
matrix elements Pnm , and in the numerical calculationsthe dominant matrix elements are those between the 2s and
2p states. The different components Pnm , appear aspeaks in different parts of the two-dimensional spectrum.Furthermore, we show in Sec. III A 2 that, at least under the
assumption of isotropic bands, Pnm , and Pmn , lead to radiation in different directions. Therefore, when pre-
senting results in Sec. VI, we plot the functions Pnm , .The pulse sequence is such that only the beating of the
interband polarizations appears in the two-dimensional spec-trum. However each interband polarization also emits a sig-nal. Though it may be difficult to detect, it is nonethelessrelated directly to the projection of X1;cv
1 11+ onto the exci-ton basis. In the equations below, we write this OU devia-tion in single-particle density matrix as
1 − iX1;cv1 11+ . 11
III. EQUATIONS OF MOTION
A. From general formalism to specific model
It is clear from the discussion in the previous section thatthe results of measurements in the parameter regime of in-terest are sensitive primarily to the single and two-particlecorrelations, X1
1 and X22. As discussed at length in I, these
functions are part of a generalized susceptibility expansion,which is a response to the effective field inside the semicon-ductor. These functions have components labeled by both theband indices and sometimes the Keldysh contour branch in-dices, which we denote by superscripts + and −. The impor-tant component of the function X1
1 is the interband polariza-tion, while the important component of X2
2 is the exchange-correlation part of the electron-hole propagation. Naturally,these functions are coupled to the rest of their own compo-nents and to functions of different order in both particle num-ber and the effective field. These couplings are through ef-fective interactions for which models must be specified. Theremaining part of Sec. II is devoted to this and the key quan-tities that arise in construction of the models are listed inTable I.
The formal structure of the equations of motion is givenin Eqs. I-63–I-68, which we now apply to the presentproblem. While the formalism in I identifies many-body con-tributions in full generality to the third order in the drivingfield, in a particular application only a few of those contri-butions may be of interest. In this section, we identify therelevant contributions based on the fact that the density ofelectron gas is less than one electron per exciton radius.
The equations for the two functions, X11 and X2
2, arereproduced here for easy reference
i
tjX1
112 = M111;j
X11 + M1
12;jX1
2 + S11;j, 12
i
tjX2
214;23 = M221;j
X21 + M2
22;jX2
2 + S22;j.
13
Here, j corresponds to the argument of the function beingdifferentiated. There are two kinds of terms: Mn
ab;j are thecouplings and Sn
i;j are the sources or driving terms. In thenext two sections, we derive expressions for those.
1. Dynamical couplings
Equation 12 contains coupling to the function X12.
Within the low-density regime, this coupling, M112;j, can be
subsumed into M111;j see Eqs. C4 and C5. In Eq. 13,
M221;j couples X2
2 to the function X21, which in the two-
band model we adopt is identified with electron and holedensities. This coupling, along with Eq. I-66 for X2
1, de-scribes effects of excitation induced carrier density on thedynamics of excitons; M2
21;j also describes contributions toexcitation-induced dephasing EID, which corresponds to apartial resummation to all orders in the field. This is not thetopic of the present paper.17 At strictly second order in theelectric field, one can verify that the coupling term M2
21;j
has one higher factor of electron density compared toM2
22;j. This is due to the vanishing hole and exciton densi-ties in the background state.18 Therefore, we drop this cou-pling in the following.
So we only need the couplings M111;j and M2
22;j. Thecoupling M1
11;j is given by I-69 and I-71–I-74 andM2
22;j by I-82, I-85, I-88, I-89, and I-92. In prac-tice, M1
11;j is obtained from the same derivation as M222;j
by demanding consistency in the approximations to many-body physics in Eqs. 12 and 13; explicit steps are given inAppendix C, Sec. C 2.
Our remaining task is to determine M222;j. Here, we nec-
essarily rely heavily on the development in I and use thenotation introduced and defined there. The remainder of thissection is thus unavoidably formal; the final result is given inEqs. 21–23.
We begin by writing M222;1
X22 in the expanded form
using I-71,
MULTIDIMENSIONAL… . II. DECOHERENCE EFFECTS PHYSICAL REVIEW B 80, 165319 2009
165319-5
M222;1
X22 = H111X2
214;23 + Q1122
+ GQ22IQ212;21X2
214;23
+ K22;114;2314;23X2214;23 ,
14
where the quantities on the right-hand side are defined in I;we note that the subscript “Q” denotes evaluation in the qua-siequilibrium state. The above equation, and the expressionfor K22;1 given by I-85, shows that the only effective in-teraction needed is I2.19 We use our particular approxima-tion scheme for I2 to transform this expression into a sim-pler one that depends only on X2 and the dynamicalinteraction WQ.
We mention only the key points involved in the derivationof the effective interaction I2 and leave the algebraic ma-nipulations elsewhere.20 We neglect optically induced carrierdensities in comparison to the background electron gas,which is what simplifies the interaction to just a function ofX2 and WQ. We obtain I2 by restricting the three-time func-
tions such that they are a product of fully interacting two-particle propagation and an independent propagation of theremaining quasiparticle after one of them is destroyed. Thisapproximation yields an effective two-particle interaction I2
that depends only on two times. Transforming four-pointfunction that depends on three times into those that dependon two times is a common objective of the various approxi-mations made in this section. In this regard, we give thegeneral definition we have adopted for the two-time limit ofa four-point function
Ftt limt1→t
limt2→t
limt2→t1
+lim
t3→t4+
F14;23 = F14;1+4+ .
15
The limits in Eq. 15 apply only to the value of the timevariable; the two branch indices of the Keldysh contour arestill arbitrary. As shown in Appendix B, when Eq. 15 isapplied to the Green’s function, Gcvvc, the branch indicesyield a 44 matrix in the Keldysh space with six differentfunctions that have a clear physical interpretation. The ap-
TABLE I. List of symbols for key theoretical quantities.
Notation of Ia This paper Eqs. Description
J3ex 9
Contribution of exciton correlations to the totalcurrent density.
X3;cv1 8 Third-order interband polarization.
Pnmtd , 9
A component of exciton correlation function in
J3ex . Pnmtd ,=Pnm
td+ , td. See below for Pnm .
Pnm , 10Fourier transform of Pt ,. The function plotted
in the TDFS plots.
W14;23 WQ A1
Dynamically screened interaction. Alwaysevaluated at equilibrium in this paper.
X1;cv1+−11+ i1, iqnt1 11,25
Interband polarization at OU. The second formis the projection onto exciton basis. It also drivesthe Raman coherence for exciton correlations seebelow. Quantity characterizing coherence between
ground and exciton states.
X2;cvvc2+−+−12;1+2+ Pt1 , t2 B4
Correlation function for an exciton in the two-timelimit at OU2. Quantity characterizing
exchange-correlation contribution to Ramancoherence.
X2;cvvc2−+−+12;1+2+ Pt1 , t2 B4
Correlation function for an exciton in the two-timelimit at OU2 with reverse ordering of operators
compared to P.
Jcvvc2+−+−12;1+2+ Jt1 , t2 16
Component of the effective potential for the EOMfor excitons. It is a functional of W and P.
Jcvvc2−+−+12;1+2+ Jt1 , t2 16
Component of the effective potential for the EOMfor excitons. It is a functional of W and P.
S2;cvvc2;l+−+−14;23 Sq,nm
2;l t1 , t2 31,32
Source term driving the exciton correlation P forexternal vertex l. The form in the second column
corresponds to projection onto the exciton basis. Itis generated by qnt defined above.
Qt 54A phenomenological characterization of the nature
of exchange-correlation in Raman coherences.
aReference 12.
KULJIT S. VIRK AND J. E. SIPE PHYSICAL REVIEW B 80, 165319 2009
165319-6
proximation employed is also convenient in computationsince it closes the dynamical equations within a set of two-time functions.
The other key technical points are rooted in the relativelylow density of the electron gas. In this limit, excitations inthe valence band are predominantly holelike and those in theconduction band are particlelike. The mathematical conse-quences of this are discussed in Sec. III B. In the limit of lowdensity of optically injected carriers, the equation for Xcvvc
2
also decouples from the equation for G, which is equivalentto neglecting the coupling M2
21;j in Eq. 13 and yields asimpler effective interaction that acts like a two-time poten-tial in the equation for X2. Higher-level approximationswould consist of picking higher-order diagrams in both theself-energy, , and I2, which correspond to certain kinds ofvertex corrections. In the present simpler description, we ne-glect these corrections.
A qualitatively important aspect of the derivation is totreat the self-energy terms at the same footing as I2 so thatthey are subsumed into a single effective interaction drivenby Xcvvc
2 explicitly. Also, we consider only the Hartree-Fockcontribution to . This is done for consistency, since weperform a resummation of diagrams for I2 after making thetwo-time approximations, so that the resulting diagrams areexplicitly of first order in the dynamically screened two-particle interaction.
Upon employing the above approximations, the last threeterms of Eq. 14 are all captured by a single two-time func-tion denoted below as J, an effective two-particle two-timeinteraction,
JWQ,X214;1+4+ = iWQ14;41X214;1+4
− iWQ14;41X214;1+4+
+ iWQ41;1+4X214;14+
− iWQ41;1+4+X214;14 ,
16
which can be considered a function of W and X2. We define
JQ JWQ,XQ2 ,
J2 JWQ,X22 .
Within the two-time approximation, the dynamical mapsM2
22;1 and M222;2 can thus be identified from Eq. 16 and
can be written as
M222;1
X2cvvc2 14;1+4+ = Hcc1X2cvvc
2 14;1+4+
+ 11JQcvvc11+;1+1X2cvvc2
14;1+4+ , 17
M222;2
X2cvvc2 14;1+4+ = − Hvv1+X2cvvc
2 14;1+4+
+ J2cvvc11;1+1+14XQcvvc2
1+4;14+ . 18
In the last two terms, 11t1t1 and we define tt tobe +1 if t t and −1 otherwise. The couplings M2
22;j forj=3,4 can be constructed in by ensuring the symmetriesdiscussed in Sec. IVC of I, which we use in Sec. IV below.
By exploiting the structure of X2cvvc2 14;1+4+ on the
Keldysh contour and the relationship iWQtt= iWQ
tt, wecan verify that the Keldysh matrix for J14;1+4+ has thesame matrix structure as X2cvvc
2 14;1+4+. Therefore, a ma-
trix with components J,, J, and J can be defined, asdiscussed in Appendix B. This provides a natural definitionfor the retarded and advanced two-particle interaction sinceit follows that the linear combination,
Jrtt − i ,=
Jtt , 19
of the Keldysh components of J vanishes for t t, while
Jatt i ,=
Jtt 20
vanishes for t t. These definitions are used in Sec. IV,where we analyze the full equations for X2
2 and discuss theirsolutions.
Comparing Eq. 16 to the diagrams in Figures I-6a–I-6c, we see that the contributions retained correspond to thetop row of Fig. I-6a. Diagrams in the bottom row of thatfigure either vanish due to vanishing hole density or contrib-ute with one higher factor of electron density than those inthe top row. Diagrams of Fig. I-6c will contribute toexcitation-induced carrier density effects, mainly EID. Wehave neglected this as discussed in the previous section andwe also comment in Sec. IV on the relevance of this effect toour calculations. Our two-time approximation eliminates dia-grams in the top row of Fig. I-6b. As explained in Appen-dix B, the two-time approximation for the four-point func-tions is constructed using the semigroup approximation forthe single-particle functions. The latter allows us to subsumethe field-dressed quasiparticle lines in these diagrams into Jor X2 in the two-time approximation. In other words, thesediagrams are a property of three-time equations only. Dia-grams of Figs. I-6b and I-6c also involve three-particleeffects and we turn to our arguments for neglecting them inSec. III B of this paper.
We conclude with the explicit form of dynamical equa-tions for X1
1 and X22 under our approximations for the cou-
plings. In Eq. 12, it is the “+−” Keldysh component that isof interest to us. The derivation in Appendix C, Sec. C 2shows that for j=1,2,
i
t1X1;cv
1+−12 = S1;cv1;112 + Hcc1 + Q;cc
s 1X1;cv1+−11+ − iVs14;23X1;cv
1+−13GQvv+− 12
− iWQ+−14;41 · XQ;cvvc
2+−14;1+4+X1;cv14+4++ − XQ;cvvc
2+−14;1+4+X1;cv14−4 , 21
MULTIDIMENSIONAL… . II. DECOHERENCE EFFECTS PHYSICAL REVIEW B 80, 165319 2009
165319-7
i
t2X1;cv
1+−12 = S2;cv1;112 + Hvv2 + Q;vv
s 1X1;cv1+−12 − iGQcc
+− 12X1;cv1+−13Vs14;23
+ iWQ+−14;41 · XQ;cvvc
2+−14;24+X1;cv14+4++ − XQ;cvvc
2+−14;24+X1;cv14−4 . 22
In the above equations, Qs is the singular component of the Hartree-Fock self-energy in which interaction corresponds to the
static Coulomb interaction, Vs.The derivation of the couplings for the exciton correlation in the above text yields M2
22;j for j=1,2 while the equations forj=3,4 follow by conjugation. We here write only the former explicitly. In the two-time approximation,
limt2→t1
+i
t1+
t2 X2cvvc
2 14;24+ = S2;cvvc2;1 − S2;cvvc
2;2 Hcc1 − Hvv1+X2cvvc2 14;1+4+ + 11JQcvvc11+;1+1X2cvvc
2
14;1+4+ + J2cvvc11;1+1+14XQcvvc2 1+4;14+ . 23
It remains to be found the source terms S2;cv1;j and S2;cvvc
2;j . Wenow turn to these.
2. Source terms
The source terms, Spj, from which Sp
j;l can be deter-mined as shown in I, originate from the application of theoptical pulses to the system and the physical effects capturedby them. The interband polarization is driven by the opticalfields and these fields are resonant with exciton states; it isthus most conveniently represented in the exciton basis. Werepresent an exciton state by the ket n ,q, which stands forthe exciton state with quantum numbers n and total momen-tum q. By defining c=mv / mv−mc and v=mc / mv−mc, momenta for conduction and valence electron in thepair are kc=k−vq and kv=k−cq, respectively,such that k is equal to the reduced mass times relative ve-locity of the pair. Letting kc ,kv represent the direct productof conduction and valence electron states, we write theeigenfunctions in momentum space as
qnk = k − vq,k − cqn,q . 24
It is often convenient to express various functions below inthe basis n ,q instead of kc ,kv. We write the projection oftwo point functions, fcvkt ;kt, onto the exciton basis as
fqntt = dk
42 fcvkt;ktqn k . 25
For deviation of order j in U, such as X j;cv1 , we write X j;qn
1 ,etc. Similarly, exploiting the conservation of total momen-tum of the electron-hole pair, we write the exciton correla-tion function Xcvvc
2 14;23 in momentum space as Xcvvc2 k
+q , t1 ;k−q , t4 k , t2 ;k , t3. The transformation to the exci-ton basis and its inverse are given by
Xqnm2 t1,t4;t2t3 = dk
42 dk
42qn k + cqXcvvc
2 k + q,t1;k
− q,t4k,t2;k,t3qmk + vq , 26
Xcvvc2 k + q,t1;k − q,t4k,t2;k,t3 =
nm
qnk + cqXqnm2
t1,t4;t2t3qm k + vq , 27
which also applies to Sn;cvvcj;l .
We turn now to optical excitation. For states with theparity opposite to the states at the top of the valence band,the source driving first-order interband polarization can becharacterized by its projection onto the exciton states12
Uqnt = q dk
42Ucvkt;kt+qn k
Ucvkt;kt+ = −e
Ete−itcvk . 28
Here, Et is the envelope function. Parity-forbidden statesare excited by two-photon absorption15
Ucvkt;kt+ = −e
EitEjte−i2tcv
ij ,
where cvij are the Cartesian tensor components of the two-
photon transition. The center frequencies and 2 are as-sumed to overlap with the excitation energy of exciton stateswith respect to the ground state. Only excitons with a zerototal momentum, q=0, are generated owing to the neglect ofthe photon momentum. The source terms S1
1;j that drivefirst-order deviation of the Green’s function 21 and 22 areessentially these effective energies
S1;cv1;112 = Ucv1Gvv12 , 29
S1;cv1;212 = Gcc12Ucv2 . 30
The two-particle source terms are considerably morecomplicated and the approach presented in I was in largemeasure developed to allow for their formulation. Again, werely on I and sketch the derivation of the expressions forthese terms within our approximations. One of the advantageof the approach of I is the establishment of a diagrammaticapproach that simplifies the identification and use of suchapproximations and depicts the underlying many-body phys-
KULJIT S. VIRK AND J. E. SIPE PHYSICAL REVIEW B 80, 165319 2009
165319-8
ics. We follow this approach below, where we must refer thereader to I for many of the equations and the diagrammaticrules; the final result, in the exciton basis, is given by Eqs.34 and 35. The result shows that the interband coherencedrives the source for the correlation function for excitons.This makes explicit the transfer of interband coherence to theexchange-correlation part of the Raman coherence.
The source terms S2;cvvc2;j tt are related to the optical field
only via the effect of the field on the single-particle propa-gators. More precisely, the source term of second order in thefield arises from the products of the first-order correlationssee I-102. We are interested in the “lesser” component,“+−+−.” Leaving the details elsewhere20 and in the notationof I, we have
S2;cvvc2;1 t1,t2 = X1;cv
1 22
I1;cvcc12;21PQcvvc14;23
+
IQ;cc12;21X1;vc2 14;23 ,
31
S2;cvvc2;2 t1,t2 = X1;cv
1 11
I1;vvvc12;21PQcvvc14;23
+
IQ;vv12;21X1;vc2 14;23 .
32
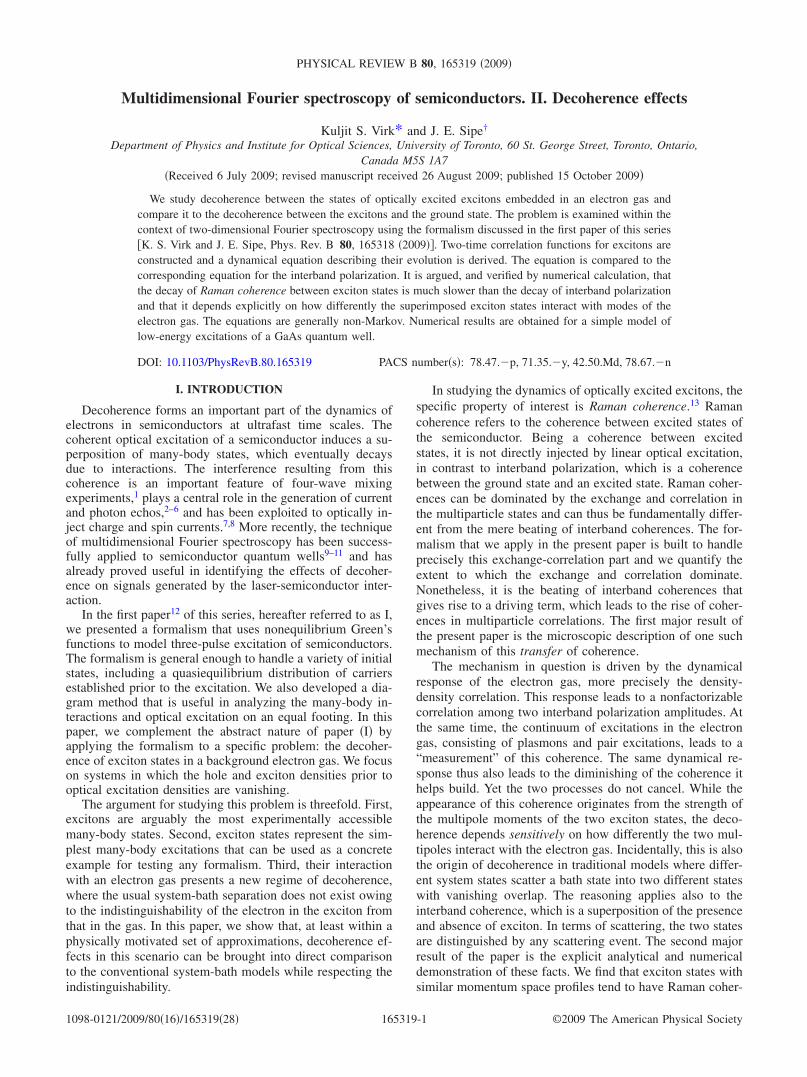
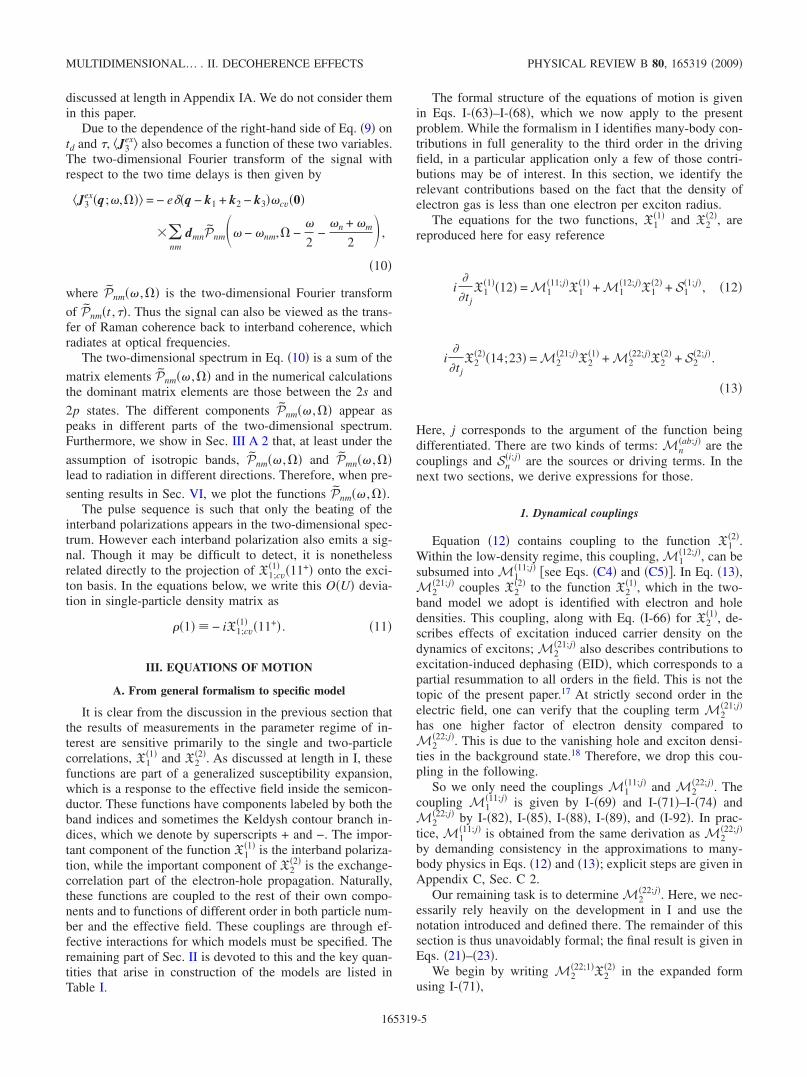
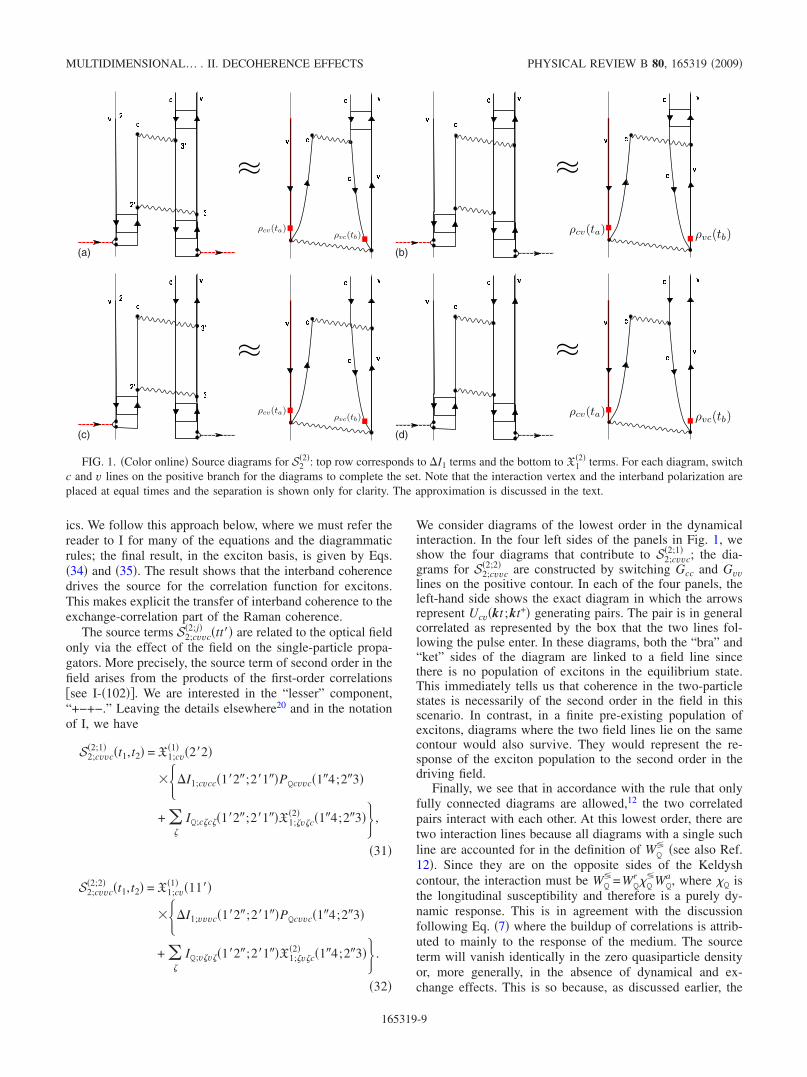
We consider diagrams of the lowest order in the dynamicalinteraction. In the four left sides of the panels in Fig. 1, weshow the four diagrams that contribute to S2;cvvc
2;1 ; the dia-grams for S2;cvvc
2;2 are constructed by switching Gcc and Gvvlines on the positive contour. In each of the four panels, theleft-hand side shows the exact diagram in which the arrowsrepresent Ucvkt ;kt+ generating pairs. The pair is in generalcorrelated as represented by the box that the two lines fol-lowing the pulse enter. In these diagrams, both the “bra” and“ket” sides of the diagram are linked to a field line sincethere is no population of excitons in the equilibrium state.This immediately tells us that coherence in the two-particlestates is necessarily of the second order in the field in thisscenario. In contrast, in a finite pre-existing population ofexcitons, diagrams where the two field lines lie on the samecontour would also survive. They would represent the re-sponse of the exciton population to the second order in thedriving field.
Finally, we see that in accordance with the rule that onlyfully connected diagrams are allowed,12 the two correlatedpairs interact with each other. At this lowest order, there aretwo interaction lines because all diagrams with a single suchline are accounted for in the definition of WQ
see also Ref.12. Since they are on the opposite sides of the Keldyshcontour, the interaction must be WQ
=WQrQWQ
a , where Q isthe longitudinal susceptibility and therefore is a purely dy-namic response. This is in agreement with the discussionfollowing Eq. 7 where the buildup of correlations is attrib-uted to mainly to the response of the medium. The sourceterm will vanish identically in the zero quasiparticle densityor, more generally, in the absence of dynamical and ex-change effects. This is so because, as discussed earlier, the
(b)(a)
(c) (d)
FIG. 1. Color online Source diagrams for S22: top row corresponds to I1 terms and the bottom to X1
2 terms. For each diagram, switchc and v lines on the positive branch for the diagrams to complete the set. Note that the interaction vertex and the interband polarization areplaced at equal times and the separation is shown only for clarity. The approximation is discussed in the text.
MULTIDIMENSIONAL… . II. DECOHERENCE EFFECTS PHYSICAL REVIEW B 80, 165319 2009
165319-9
“amplitudes” Gcv11+ in this case fully describe the systemwith a perfectly coherent evolution.
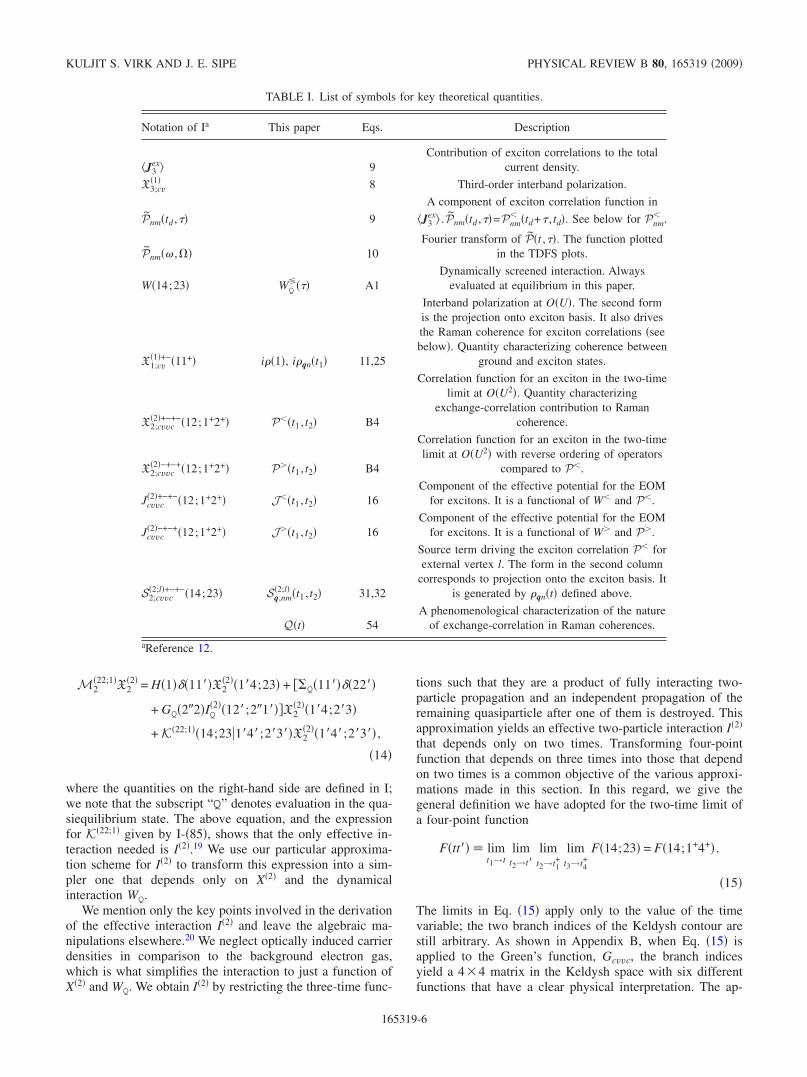
In these diagrams, the pulse connected to a two-particlecorrelation yields the functions X1;cv
1 22 on the positivebranch and X1;vc
1 33 on the negative branch by definition.Therefore, a full solution of the Dyson equation varied tofirst order in the field can be inserted to compute the dia-grams. However, it is useful to analyze these diagrams usingthe approximate semigroup approximation, which in thiscase is also equivalent to using the generalized Kadanoff-Baym ansatz. In this approximation, only the advancedGreen’s function contributes since the time ordering, t2 t2,is fixed by the zero hole density of the equilibrium state andthus
X1;cv1 22 = 2GQvv
a 22 , 33
where is defined in Eq. 11. In the four right-hand panelsof Fig. 1, we show the result of applying this approximationto the diagrams in the left-hand panels. We have representedcv and vc in the right-hand panels by squares. Note thatthere is no interaction placed between the GQcc and GQvv tomake another correlated pair on the right-hand sidediagrams.21
The diagrams in the right-hand panels connect the inter-band coherence with the memory of the system and showmore clearly how the coherence in X2;cvvc
2 arises. To see thisin detail, we begin by noting that by definition, Gcv
can bewritten as
Gcv tt = i Trav
†Ut,tacUt,t0QUt0,t = i Trav†Ut,t
act ,
where Q is the many-body statistical operator describing theequilibrium background state. The U are exact evolution op-erators and we use the cyclic property of the trace to obtainthe second line. The term act represents the removal of a
conduction electron from the state as it evolves from theinitial time t0 to the time t. It is clear from Fig. 2a that t t and therefore the modified state evolves from t to t andat the latter time a valence electron is added to it. The suffi-cient condition for the trace to be nonzero is that coherencebetween the conduction and the valence band exist in t.Beyond time t, the state evolves with an extra valence holeor a missing valence electron. This is described precisely bythe function GQvvtt as the interaction with the field hasoccurred before time t. Now, the phase-breaking time of thequasiparticle propagator GQvv is given by the on-shell inverseimaginary self-energy, IQvv, and it can be much longer thanthe decoherence time of the interband polarization. There-fore, the amplitude X1;cv
1 22 exists for t2 beyond t2+ tdec,where tdec is the time span over which cv vanishes. Since thetwo-particle correlation forms from the interaction of single-particle correlations, it becomes clear that coherence in thetwo-particle function can form within the phase-breakingtime of the quasiparticle once an interband polarization hasformed. This is essentially the content of the propagatorslinking the two interaction lines in the right-hand panels ofFig. 2a. Once a summation over momentum of the propa-gators is performed, the inhomogeneous broadening will fur-ther restrict the temporal spread of the coherence. The inter-action lines themselves control the maximum delay betweenthe interband polarizations that is allowed such that coher-ence can be transferred to X2;cvvc
2 . Therefore, the time delaybetween the two optical pulses, which is an experimentalparameter, is equal to in WQ
and its variation leads to aprobe of that function.
As mentioned earlier, the 44 matrix in contour indicescorresponding to X2 takes a special form with six differentcomponents. We use these components, and Eqs. 25 and26, to write source term S2;cvvc
2;1 in the exciton bases. Thesubscript used for indicating the order in U in S2
2 is always2 when appearing explicitly. For brevity, we will omit thissubscript.22 Thus, we will write S2;cvvc
2;1 as Scvvc2;1 and its pro-
jection onto the exciton states as
(b)
(a)
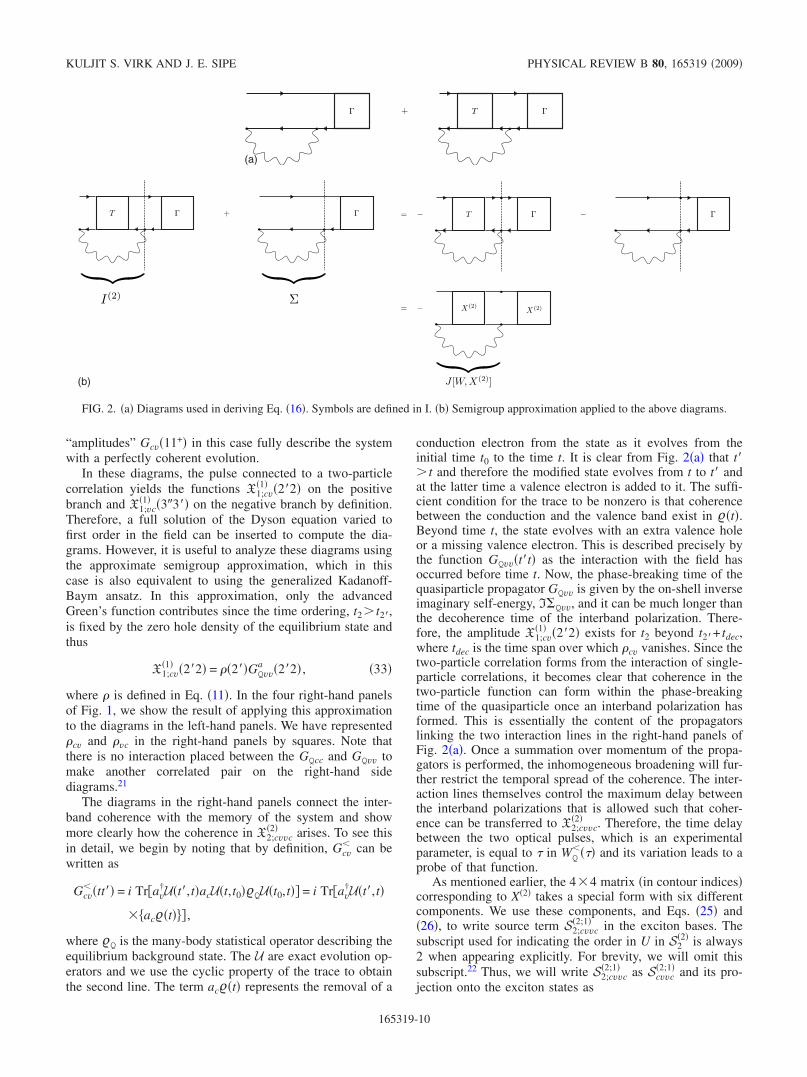
FIG. 2. a Diagrams used in deriving Eq. 16. Symbols are defined in I. b Semigroup approximation applied to the above diagrams.
KULJIT S. VIRK AND J. E. SIPE PHYSICAL REVIEW B 80, 165319 2009
165319-10
Sqnm2;1t,t = e−iqnt−mt
0
da0
db0
dPQ;qmm
− Rqnm;nmc a,b,qnt − aqm
t − b
− , 34
Sqnm2;2t,t = S2;qnm
2;1 t,t
= e−int−mt0
da0
db0
dPQ;qmm
− Rqnm;nmv a,b,qnt − aqm
t − b
− , 35
where the “response function” is
Rqnm;nm a,b, = dqWQ
q − q,WQq, + + b
− afnn q − q,qa
1
− 2fmm
q − q,qb . 36
The correlation functions of the bath are represented by WQ
and can be interpreted as absorption and emission of theelectron gas excitations, where a total momentum of q isgained by the pair via the two interactions. The factor 1−2 accounts for the change in sign of the interactionwhen conduction electron and a valence hole are involved.The functions fnn· , · , · are defined as
fnnq − q,q, = dk
42qn k + q − q0nk
− qGQcck − vq,GQvvk − cq,
− , 37
where the propagators in Eq. 37 represent the evolution ofthe pair for a time delay, , between the two scatteringevents.
In the two-time plane t , t, the direction of macroscopicevolution of the system occurs along lines of constant = t− t. Along this line, the propagation is driven by the differ-ence of the two source terms, which vanishes for q=q=0.Thus, any nonzero momentum exchange necessarily occursin the driving terms. From Eq. 37, we also see that thedistribution of the state in momentum space strongly “filters”the memory effects of the quasiparticles. States that aretightly bound would generally produce less smearing of theinterband polarization than those that are loosely bound andtherefore their driving terms will more closely follow thedirect beating of the interband polarizations. Higher-energystates will restrict the total number of excitations of the elec-tron gas contributing to this source to fewer numbers andwill therefore have longer-lasting driving term but it willhave a lower amplitude. Furthermore, we see the competingeffects of density, whereby the larger density yields a larger
source term, but lowers its duration at the same time. Theseobservations are confirmed in the numerical calculations pre-sented below.
When we restrict the above expressions to the isotropicmodel, the angular integrations over q suppress transitionsamong states of different parity. Thus, the elements Rqnm;nmare nonzero only if the difference in parity between n and nis the same as that between m and m. In particular, thisimplies that if the directions for fields that excite the two
states n ,q and m ,q are kn and km, then the coherence
driven by Snm and Smn will radiate in directions kn− km+ k3
and km− kn+ k3, respectively; the vector k3 is the direction ofthe third field amplitude that generates the signal. This cleanseparation is an advantage of two-dimensional Fourier spec-troscopy.
Equations 34 and 35 express the source terms in exci-ton basis. Their transformation back to the single-particlebasis is effected by Eq. 27. Substitution of Eqs. 28 and34 after transformation to single-particle basis into Eqs.21 and 22, respectively, completes the equations of mo-tion within the set of approximations adopted here. In thenext section, we discuss the regime of validity of these ap-proximations and the physics that is retained or neglected.Section IV below is devoted to the solution of these equa-tions, where they are put into a simplified form suitable forboth the analysis in that section and the numerical calcula-tions that follow.
B. Discussion of approximations
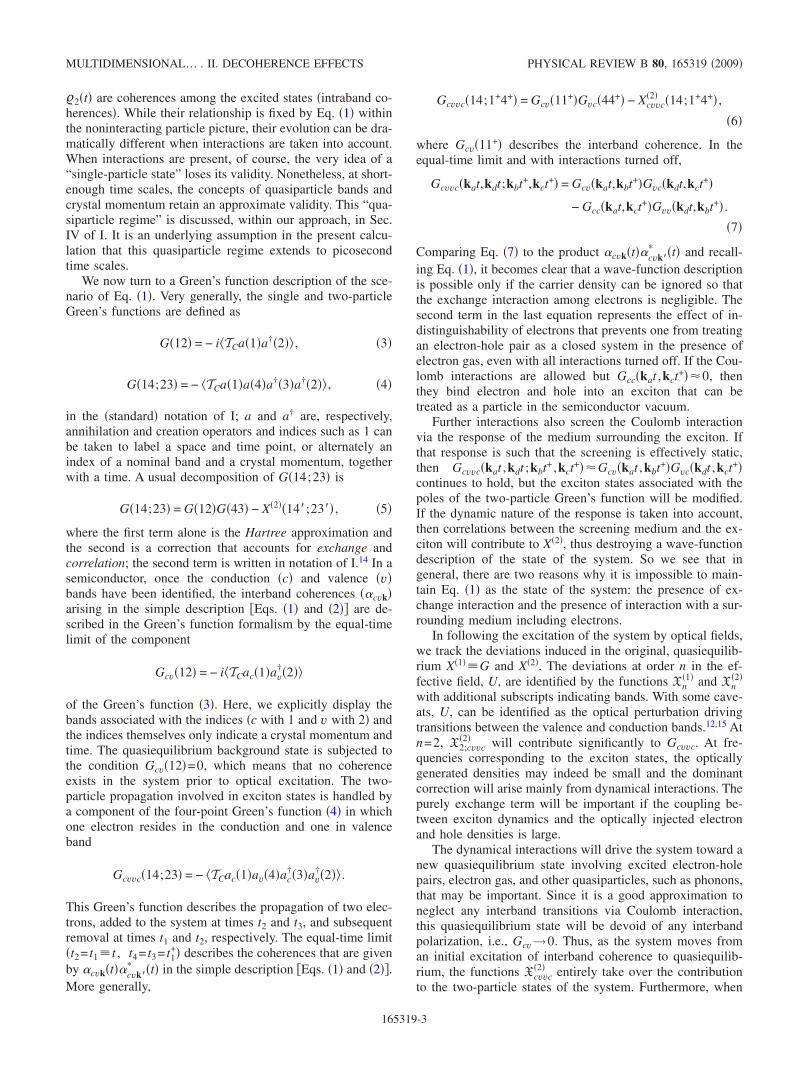
The mathematical details of the reduction from three-timeto two-time equations are elaborated in Appendix B. It is thesemigroup approximation for the fully interacting Green’sfunctions mentioned earlier. We applied it to diagrams shownin Fig. 2a, arising in expressions such as Eqs. 12 and 13and obtained the results Eqs. 21–23 of Sec. III. In thissection, we discuss a the diagrams that are beyond those inFig. 2a and b the diagrams that are in Fig. 2a but havebeen neglected by the semigroup approximation.
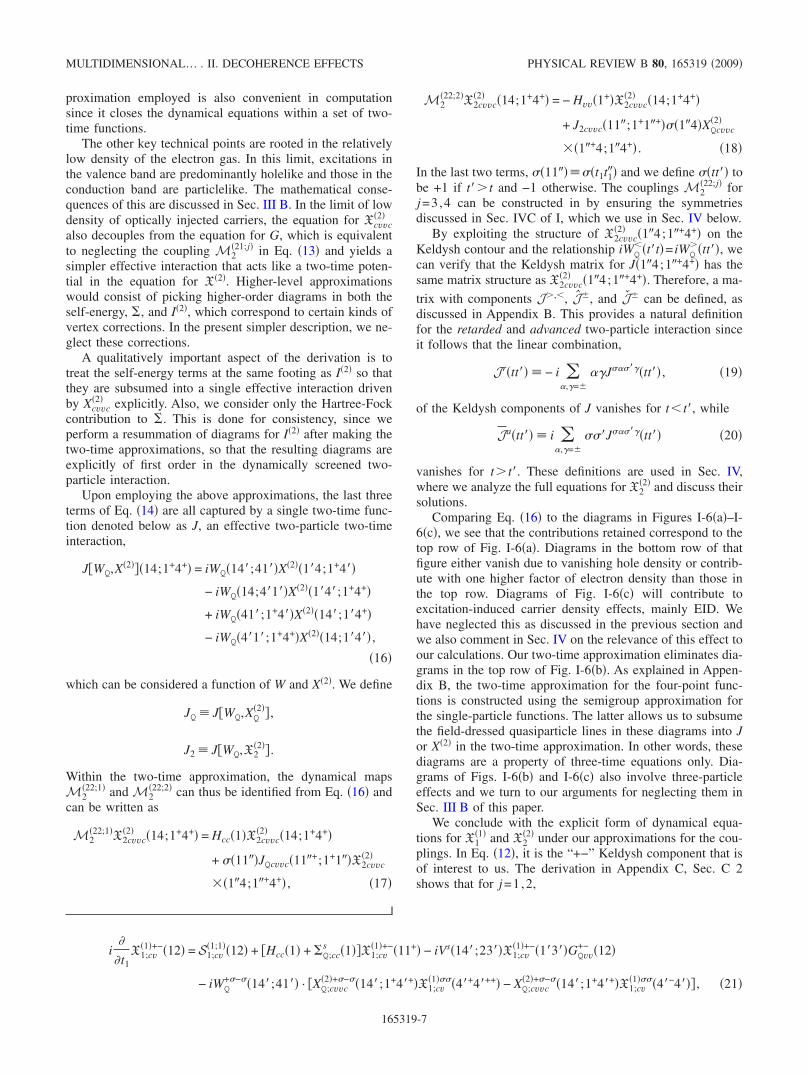
We first return to the mathematical consequences of ne-glecting holelike excitations in the conduction band and par-ticlelike in the valence band. When applying the semigroupapproximation to diagrams such as those in Fig. 2a, thediagram is cut in two pieces at the vertex where the interac-tion line joins the particle line as shown in Fig. 2b. Theapproximation is in insisting on the temporal direction of theGreen’s function lines at the top of the diagram where thereis no interaction placed. Thus, in these diagrams, the line atthe top corresponds to valence electron and is assumed toflow backward at the point where it is cut. This introduces aminus sign, as shown on the right-hand side of the diagram-matic equation in that figure.
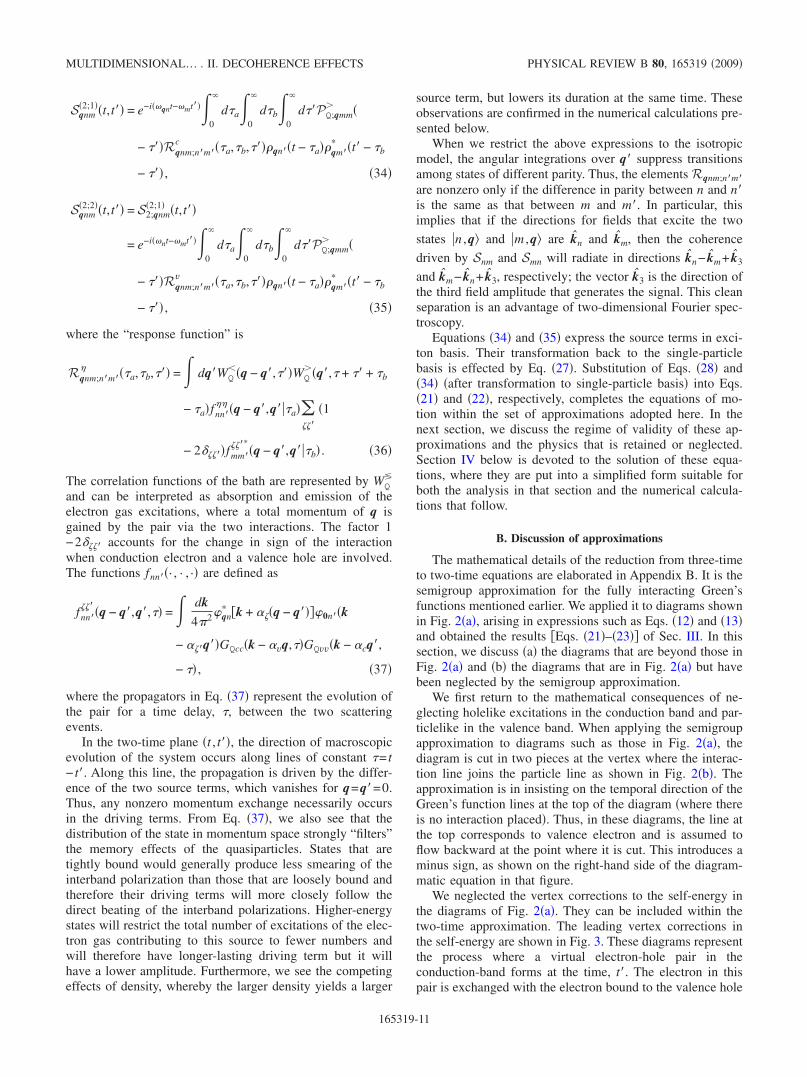
We neglected the vertex corrections to the self-energy inthe diagrams of Fig. 2a. They can be included within thetwo-time approximation. The leading vertex corrections inthe self-energy are shown in Fig. 3. These diagrams representthe process where a virtual electron-hole pair in theconduction-band forms at the time, t. The electron in thispair is exchanged with the electron bound to the valence hole
MULTIDIMENSIONAL… . II. DECOHERENCE EFFECTS PHYSICAL REVIEW B 80, 165319 2009
165319-11
in X2 while the electron from X2 annihilates the conduc-tion hole at time t. Applying the diagram rules in I, the effectof these diagrams is to add the exchange corrections to thescreened interaction W in Eq. 16. Naturally, the contribu-tion of the additional term exists only at high densities wherethe exchange process can be significant. In any case, at lowfrequencies, it is dominated by the plasma excitations con-tained in W, which contribute a large response. In the calcu-lations below, we neglect this particular contribution of ex-change process but remark that the subsequent analysisremains valid even if it is included.
The leading diagrams that are part of Fig. 2a but areneglected in the two-time approximation are of the form
These diagrams are proportional to one higher power ofdensity of the electron gas than the ones retained. This is sobecause they involve a finite-time interval over which a vir-tual electron-hole pair must propagate and interact with thetwo correlated electrons. Such four-particle complexes maybecome important in high-density plasmas, but not at smalldensities in the present parameter regime. Furthermore, in-cluding them will not introduce new poles in the two-particlespectrum; they will only adjust the spectrum quantitatively inthe complex domain. It should be noted that including thesediagrams does not necessarily break the two-time structure.They can be decomposed further into a product of two-timecorrelations, but doing so transforms a single expression forthree-time effective interaction to a sum over infinite two-time effective interactions in the equations of motion. None-theless, when a finite number of these can be identified ascapturing the desired physics, the two-time approximationbecomes useful a computational tool.
We emphasize the difference between our approach andthat of Bornath et al.,23 who also employed the semigroupproperties up to second order in their perturbation expansionand identified a two-particle self-energy by regrouping theexpressions. Their expressions for the two-particle self-energy, which are analogous to J in Eq. 16, depend only onthe single-particle propagators. Their procedure must be in-finitely repeated to identify the contribution of the two-particle propagator. The expressions obtained are the kindsthat are useful in discussing high-density plasmas where col-lisions among electrons rather than the self-consistent propa-gation of a bound pair dominate the physics. On the other
hand, in the ansatz 16, the contribution of a pair of conduc-tion and valence electrons to the self-energy is assumed to bedominated by the two-particle properties of the pair ratherthan single-particle properties. This is done to include self-consistently the back-action of an exciton on itself via itsinteraction with the electron gas. Such a back-action makesan important qualitative contribution to the decoherence phe-nomenon as discussed below. Besides the contribution of theexciton, there are also contributions of two-particle functionswhere both particles belong to the same band. We neglectthese, since their effect does not change the dynamics quali-tatively.
IV. DYNAMICS
We now return to Eqs. 21–23 and substitute into themthe source expressions Eqs. 29, 30, 34, and 35 de-rived above. These are the dynamical equations we wish tosolve.
We will first obtain a physically intuitive form for Eq.23. In Appendix C, Sec. C 1, we define a set of six func-tions for the two-time approximation to the components ofKeldysh matrix of four-point functions. We show that withinthe two-time limit, the function Pt , t from this set corre-sponds to Xcvvc
2+−+−14;1+4+ and thus also toXcvvc
2+−+−14;1+4+. The derivation in Appendix C results inthe following equation:
i
tPtt − Hef fPtt = Xvv
tt − Xcctt
− tmin
tmax
JQr ttPtt + JQ
ttPatt
− i−
tmin
JQttPtt + JQ
ttPttdt
+ tmin
tmax
JrttPQtt + JttPQ
att
+ i−
tmin
JttPQtt + JttPQ
ttdt
+ i−
tmin
JQ−ttP+tt + JQ
+ttP−ttdt 38
− i−
tmin
J−ttPQ+tt + J+ttPQ
−ttdt. 39
Here, Hef f is an effective Hamiltonian that defines thenominal exciton energies calculated self-consistently withina model for the equilibrium electron gas see Sec. V. Therow vector Jtt has been discussed in Sec. III. The precise
form of all its components, J , J , J, is derived in Ap-pendix C, Sec. C 3. The equation applies to both above andbelow the time diagonal t= t, where tmin=mint , t andtmax=maxt , t. The equation for derivative with respect tothe second argument, Ptt /t, is obtained by using therelation Pt , t=P†t , t. We will explicitly treat only the
FIG. 3. Leading-order vertex corrections to self-energy. Thesediagrams exchange an electron in the bound pair with one in avirtual excitation in the background gas. Symbols are defined in I.
KULJIT S. VIRK AND J. E. SIPE PHYSICAL REVIEW B 80, 165319 2009
165319-12
region t t since the other half of the time plane is relatedby Hermitian conjugation and time reversal.
Equation 38 is not restricted to vanishing density ofholes and excitons in the equilibrium state, but we take thislimit by setting PQ
and JQ equal to zero. We also omit the
first term on the right-hand side, which involves single-particle Green’s functions, and the last term which involves
P functions, etc. The former will cancel out when the equa-tions are subtracted to obtain dynamics parallel to the timediagonal in the two-time plane. The latter is one order ofdensity higher than others and so is small in the regimewhere at least two exciton states are stable. We drop all thoseterms containing JQ
and PQ because they are proportional to
the equilibrium density of excitons, which is zero. Note thatin keeping with the approximation to neglect the terms in-
volving JQ , JQ, we have dropped them from the retardedfunctions as well and thus
JQr tt − iJQ
ttt − t ,
PQr tt − iPQ
ttt − t .
Substitution of these expressions and their conjugates forthe advanced functions into Eq. 38 yields
i
tPtt − Hef fPtt = S2;1tt
+ i−
tJttPQ
ttdt − i−
t
JQttPttdt,
40
− i
tPtt − PttHef f = S2;2tt
− i−
t
PQttJttdt + i
−
tJttPQ
ttdt.
41
When the expressions for J, given in Appendix C, Sec. C3, are substituted in Eqs. 40 and 41, we obtain
t1+
t2 Pqnm
t1,t2 + iHef f,Pqnm t1,t2 = Sqnmt1,t2
+ −
t2
dt− Pqnm t1tBmmqt − t2
+ dq
42Cnm;nmq,qt1 − t,t
− t2Pqnm t1t
−
t1
dt− Bnnqt1 − tPqnm tt2
+ dq
42Cnm;nmq,qt − t2,t1 − tPqnm tt2 .
42
The source term follows from the difference of Eqs. 34and 35 and the addition of the conjugate terms for the restof the two arguments
Sqnmt,t = Sqnm2;1t,t − Sqnm
2;2t,t + Sqmn2;1t,t
− Sqmn2;2t,t .
We have written the expression for the interaction as a su-peroperator, C, that maps matrices to matrices
Cnm;nmq,q, = iWQq
− qAnnq,qAmmq,qPQ;qmm
43
and as a matrix B related to C via
Bmmq = j dqC j j;mmq,q− , . 44
The matrix A is given by
Anmq,q Onmcq,cq − Onmvq,vq , 45
with
Onmq,q = n,qe−iq−q·rm,q = dk
42q,n k + qqmk
+ q .
The leading contribution to A for small q−q is the dipoleor the quadrupole matrix elements of the exciton.
Thus the physical process that determines A or C is thescattering of the surrounding gas by the electron-hole pair. Ina calculation, the transfer of momentum to the pair as a resultof this scattering appears through virtual or real transitionsamong the internal states of the exciton. The transfer of mo-mentum via electron or hole corresponds to Onmcq ,cqor Onmvq ,vq, respectively. A quasiparticle interactingwith the exciton sees a neutral particle, unless the scatteringprocess is sensitive to the composite nature of the exciton. Asshown in Appendix C, Sec. C 3, this matrix arises naturallyin the derivation where contributions from the compositefunctions are also retained.
We note that when Eq. 44 is substituted into Eq. 42, aconservation law follows
t
n dqPqnn
t,t = n dqSqnntt .
Physically, this is a consequence of ascribing all the inter-band transitions to the optical excitation so that the Coulombinteraction composing the dynamical map cannot create orannihilate excitons. Thus, the set of approximations em-ployed in deriving this map respects this property of theHamiltonian exactly.
The single-particle equation, written for the qnt definedin Eq. 25, obeys an equation that involves only the B ma-trix see Appendix C, Sec.C 2
MULTIDIMENSIONAL… . II. DECOHERENCE EFFECTS PHYSICAL REVIEW B 80, 165319 2009
165319-13
d
dt+ iqn qnt = Uqnt +
0
dBnmqqmt − .
46
Equations 42 and 46 are the main results of this paper.The rest of this section is devoted to their analysis and de-termining the main properties of their solutions.
A defining property of the map C, which is expected tohold at any level of approximation, can be taken to be itsrelationship 44 to B and the single particle Eq. 46. This isso because all those diagrams in the equation where the in-teraction acts only on one side of the function P can beclosed on the other side using a X1;cv line to form a contri-bution to the equation for interband polarization. Thus, thesediagrams generate self-coupling in the equation for X1;cv.Diagrams that contribute to C contain at least two opticalexcitations already and therefore can only contribute tosources at third or higher order, or they can appear as crosscoupling in the full set of second-order equations.
We now consider the generation of excitons with a finitetotal momentum, q. While Eq. 28 strictly restricts the in-terband polarization to q=0, the interactions of these polar-izations via pair excitations can result in a transfer of mo-mentum from the electron gas to the exciton. While themomentum transferred will have an average value of zero,q2 will in general be finite so that Sqnm
2 tt will have afinite spread in momentum space. As the Kubo-Martin-Schwinger KMS relations24–26 imply that Wq ,VqIQ
−1q ,, this spread decays at least as 1 /q. It isfurther suppressed by the form factors, which at large q de-cay as q−3 for s states and q−4 for p states, as implied by theanalytical expressions for the ideal two-dimensional hydro-gen atom. Therefore. large momentum transfers are signifi-cantly suppressed and we expect that the spread of Sqnm
2 inmomentum space is only on the order of the inverse excitonradius. We use this result to reduce the numerical effort insolving for correlation functions by replacing all quantitiesby their average over q.
We also assume that the effective-mass approximationEMA applies within this region and that band anisotropycan be neglected. In this case, the internal and external mo-tions of excitons decouple and wave functions become sepa-rable in the relative and total momentum variables. The cor-relation functions Pqnm
t , t can then depend on q via thecenter-of-mass kinetic energy of the exciton, q=2q2 /2M. Furthermore, within the EMA, the matrix ele-ments Anmq ,q also depend only on the difference of mo-menta, i.e., the momentum transferred and not how fast theexciton moves in initial and final states. Thus the superop-erator C has the simpler form
Cmn;mnq,q, = Cmn;mnq − qPQ;qnn ,
where
Cmn;mnq iWQqAmmqAnnq .
Apart from the factor PQ;qnn t− t2, the integral over q in
Eq. 42 becomes a convolution. By switching to the inter-action picture with respect to q, the main contribution of
PQ;qnn t− t2 to the integrand in Eq. 42 is a factor
ei q− qt1−t. This can be taken to be unity to a good ap-proximation, since the time difference t1− t for which thereis significant contribution is restricted by the inverse band-width of the kernel. The kinetic-energy transfer q− qwill be large only for large values of q, which are expectedto lie in the pair-excitation continuum and thus have a largebandwidth. Thus, ei q− qt1−t will deviate from onlyslightly from unity. In the preliminary study here, we neglectthis deviation and introduce the exciton correlations tracedover the total momentum states,
Pnm t,t = dq
42Pqnm t,t ,
and also define Snmt , t as the result of a similar integrationof Sqnmt , t.
Integrating over q in Eq. 42 and neglecting the kineticenergy of the exciton motion, we get
t1+
t2 Pnm
t1,t2 + iH,Pnm t1,t2 − Snmt1,t2
= −
t2
dtCnm;nmt1 − t,t − t2Pnm t1t
− Pnm t1tBmmt − t2 +
−
t1
dtCnm;nmt − t2,t1
− tPnm tt2 − Bnnt1 − tPnm
tt2 . 47
Similarly, we define nt be equal to qn summed over all qand obtain
d
dt+ in nt = Unt +
0
dBnmmt − . 48
Here, C and B represent the integration of Eqs. 43 and 44over the momentum arguments, while the relation between Cand B in the new form is
Bmm = j
C j j;mm− , . 49
Note that due to the assumption of isotropic bands, the ele-ments Cnm;nm are nonzero only if the difference in paritybetween n and n is the same as that between m and m.
Equation 48 has the formal solution
nt = 0
t
dtnt − tUnt , 50
where nt is the solution obtained by replacing Unt by
t. We write the Laplace transform of a function ft as fzand obtain the Laplace transform of nt in the form
z = zI − Bz−1,
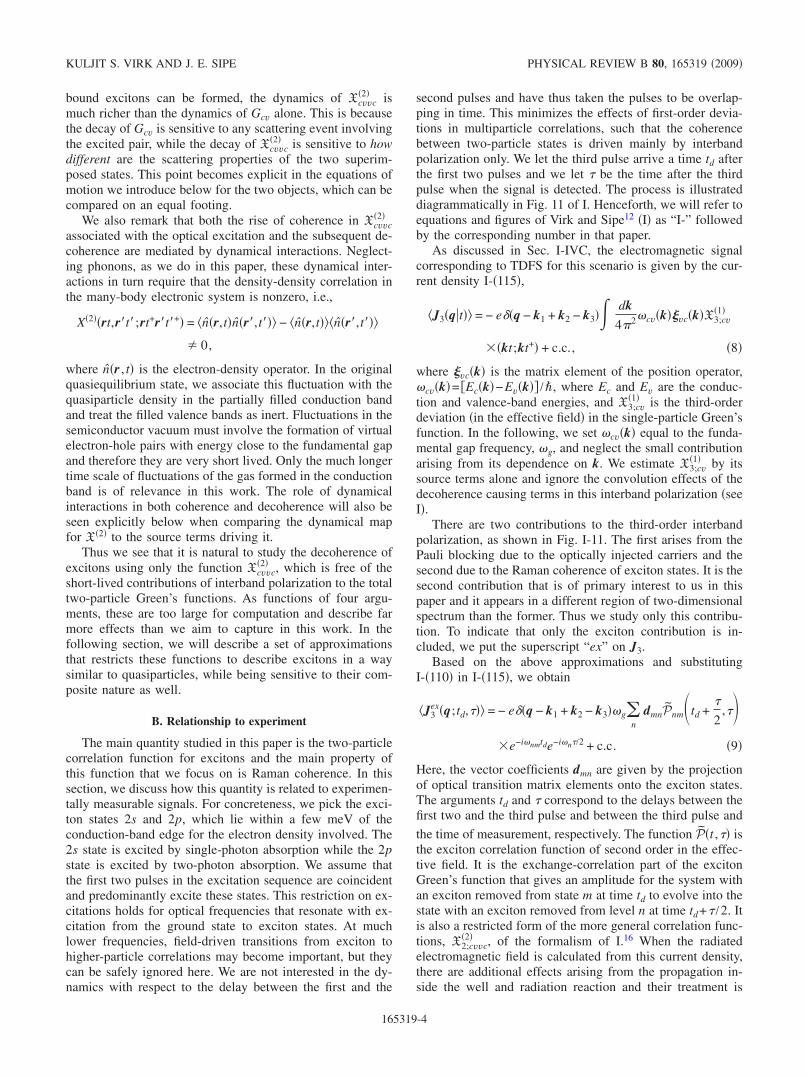
where I is the identity matrix of the same dimension as B. Inthe case of 2s and 2p superpositions, the use of isotropicmodel, and the neglect of coupling to states of principalquantum number n2, the matrix B becomes diagonal. In
KULJIT S. VIRK AND J. E. SIPE PHYSICAL REVIEW B 80, 165319 2009
165319-14
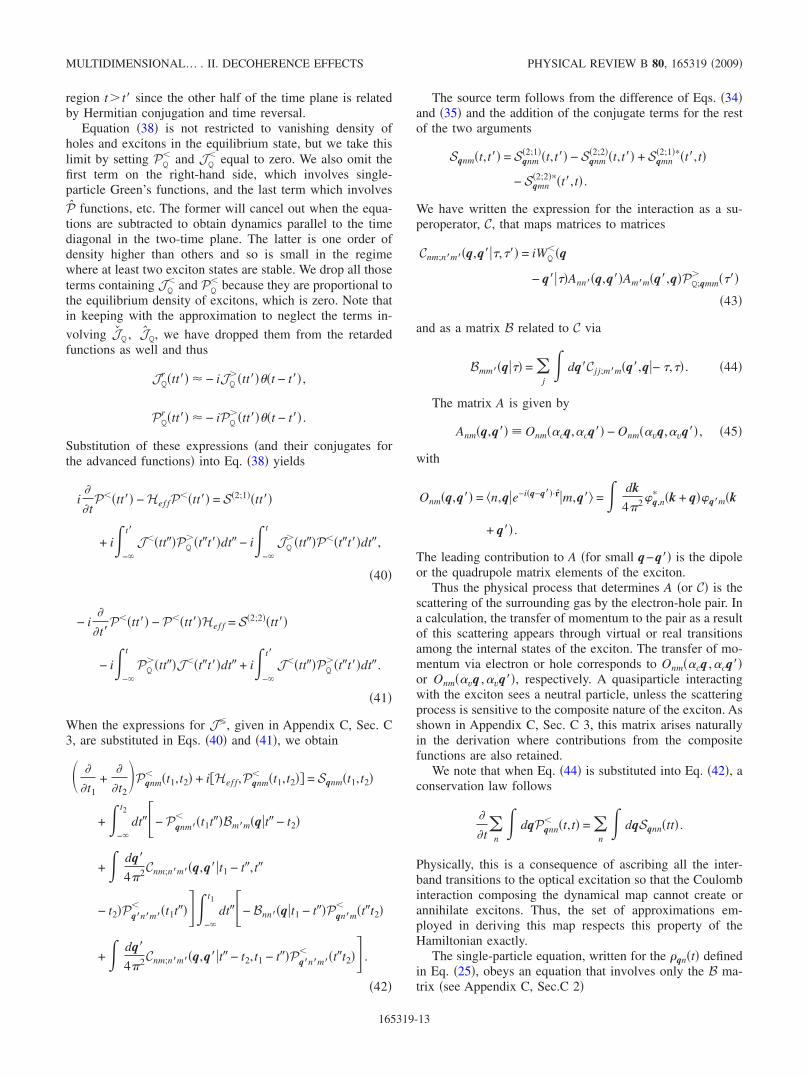
the following sections, we discuss the calculation of B,but it is convenient to use the result obtained there in thepresent analysis. As shown in Fig. 4, the shapes of functionsBnn are close to damped exponentials and thus may beapproximate as the functions −bne−nt, where n lie in theright half complex plane. Then the Laplace transform may beinverted to obtain
nt = 0
t
dte−nt/2coshnt +n
nsinhntUnt − t ,
n n2
4− bn. 51
This simple formula is useful in explaining the behavior ofnt determined by numerical calculation.
When short pulses of less then 100 fs are used, the func-tions multiplying Unt− t in Eq. 51 may be taken out ofthe integral and evaluated at t= t. Thus we expect two ratesof decay that are mixed together after convolution with theoptical pulse. The temporal behavior naturally approachesMarkovian at times beyond few time constants of the fasterdecay rate but only if In vanishes. The system becomesmanifestly non-Markov for large values of bn, which corre-sponds to large coupling to the dynamical environment.Similarly, a small n also results in non-Markov behavior,which is due to the coupling to fewer modes of the environ-ment and therefore a slower rate at which the phase informa-tion is lost.
We now turn to the two-particle equation 47. At first, forpurely pedagogical reasons, let us consider only the diagonalterms in both C and B so that the integrand in Eq. 47 takesthe form
=−1
2
0
d dqiWQq,Ammq − Annq2Pnm
t,t −
+ Pnm t − ,t −
1
2
0
d dqiWQq,Amm
2 q
− Ann2 qPnm
t,t − − Pnm t − ,t . 52
By the relation P†tt=Ptt, the first term plays thedominant role in decay of Pnm, while the second contributesto oscillations. Analogous formula for Eq. 48 reads
−1
2
0
d dqiWQq,Ann
2 qnt − . 53
Thus the rate of decoherence of each state with the groundstate depends on how strongly the state scatters the surround-ing quasiparticles. On the other hand, the factor Ammq−Annq in Eq. 52 shows that their decoherence with re-spect to each other depends on how differently they scatterthe quasiparticles. Therefore, states that decohere at a veryfast time scale may continue to be coherent with each other iftheir spatial profiles are such that their multipole momentsare similar. Similarly, if the rates are vastly different, themutual decoherence will be only slightly less than the fasterdecay rate of interband polarizations. Note that in both cases,one or both interband polarizations can completely vanishwhile a substantial mutual coherence remains. This is veri-fied in the numerical calculations below.
In general, the off-diagonal terms in C are also important.However, they involve overlaps between eigenfunctions ofdifferent energies, which tend to be smaller. Furthermore,due to the dominance of low frequencies in WQ
, the con-tribution of off-diagonal terms is also small on average whenEq. 47 is integrated. This is confirmed in our numericalcalculations below.
We now turn to the conditions that determine how far thesystem is from Markov dynamics. It is obvious from theintegrals in Eq. 47 that the width of C , in its firstargument, , controls how close the dynamical system is tobeing Markovian. This width is in turn controlled by thematrix elements Anmq, which depend on the nature of theexciton states involved in scattering, and the functionWQq ,, which connects the static properties of these states
to dynamics. The matrix elements Anmq can be expanded inan infinite sum over the multipole moments of the exciton.The profile for Anmq is broader and centered at larger mo-mentum for more tightly bound states than for loosely boundstates. The dielectric function generally has sharper peaks inthe frequency domain at smaller q owing to the presence ofthe plasmon branch at low momenta. At higher frequencieswhere there is a continuum of particle-hole excitations, thecorrelation functions WQ
q , acquire a broad frequencydistribution. As a result, virtual excitations among lower en-ergy, more tightly bound states, will have broader spectra or,in other words, will be closer to Markov than the higher-energy states.
Furthermore, only very fast quasiparticles of the back-ground gas will significantly scatter from tightly boundstates. If such a quasiparticle has a velocity uq, then it willtypically interact with the state of size a for a time a /uq,and for it to be effective in causing decoherence, the quantityCa /uq must be significant. It follows then that the lower-lying states, besides being less affected by memory terms,also have slower decoherence rates due to their smaller size.In two-dimensions, the n+1 /2−2 dependence of energy lev-els enhances the size difference between the lowest and the
0 0.5 1 1.5 2 2.5 3−0.5
0
6
t [ps]
−ℜ B2p,2p
−ℑ B2p,2p
FIG. 4. Color online Typical Bnn.
MULTIDIMENSIONAL… . II. DECOHERENCE EFFECTS PHYSICAL REVIEW B 80, 165319 2009
165319-15
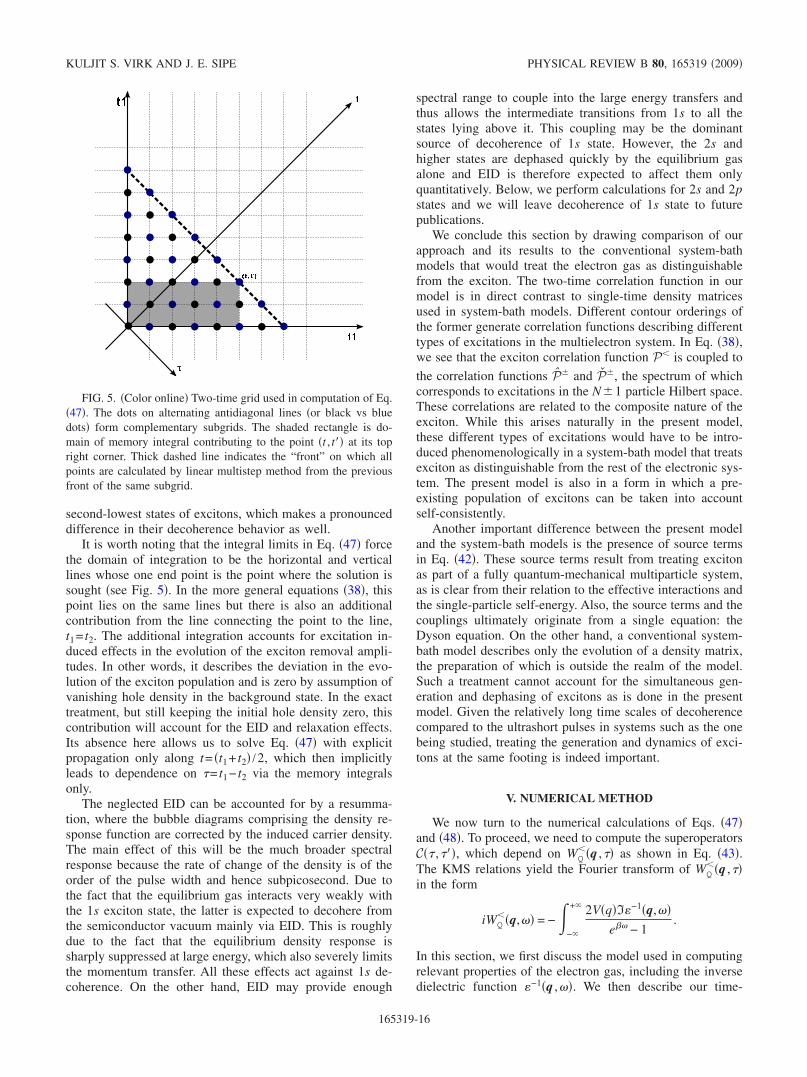
second-lowest states of excitons, which makes a pronounceddifference in their decoherence behavior as well.
It is worth noting that the integral limits in Eq. 47 forcethe domain of integration to be the horizontal and verticallines whose one end point is the point where the solution issought see Fig. 5. In the more general equations 38, thispoint lies on the same lines but there is also an additionalcontribution from the line connecting the point to the line,t1= t2. The additional integration accounts for excitation in-duced effects in the evolution of the exciton removal ampli-tudes. In other words, it describes the deviation in the evo-lution of the exciton population and is zero by assumption ofvanishing hole density in the background state. In the exacttreatment, but still keeping the initial hole density zero, thiscontribution will account for the EID and relaxation effects.Its absence here allows us to solve Eq. 47 with explicitpropagation only along t= t1+ t2 /2, which then implicitlyleads to dependence on = t1− t2 via the memory integralsonly.
The neglected EID can be accounted for by a resumma-tion, where the bubble diagrams comprising the density re-sponse function are corrected by the induced carrier density.The main effect of this will be the much broader spectralresponse because the rate of change of the density is of theorder of the pulse width and hence subpicosecond. Due tothe fact that the equilibrium gas interacts very weakly withthe 1s exciton state, the latter is expected to decohere fromthe semiconductor vacuum mainly via EID. This is roughlydue to the fact that the equilibrium density response issharply suppressed at large energy, which also severely limitsthe momentum transfer. All these effects act against 1s de-coherence. On the other hand, EID may provide enough
spectral range to couple into the large energy transfers andthus allows the intermediate transitions from 1s to all thestates lying above it. This coupling may be the dominantsource of decoherence of 1s state. However, the 2s andhigher states are dephased quickly by the equilibrium gasalone and EID is therefore expected to affect them onlyquantitatively. Below, we perform calculations for 2s and 2pstates and we will leave decoherence of 1s state to futurepublications.
We conclude this section by drawing comparison of ourapproach and its results to the conventional system-bathmodels that would treat the electron gas as distinguishablefrom the exciton. The two-time correlation function in ourmodel is in direct contrast to single-time density matricesused in system-bath models. Different contour orderings ofthe former generate correlation functions describing differenttypes of excitations in the multielectron system. In Eq. 38,we see that the exciton correlation function P is coupled to
the correlation functions P and P, the spectrum of whichcorresponds to excitations in the N1 particle Hilbert space.These correlations are related to the composite nature of theexciton. While this arises naturally in the present model,these different types of excitations would have to be intro-duced phenomenologically in a system-bath model that treatsexciton as distinguishable from the rest of the electronic sys-tem. The present model is also in a form in which a pre-existing population of excitons can be taken into accountself-consistently.
Another important difference between the present modeland the system-bath models is the presence of source termsin Eq. 42. These source terms result from treating excitonas part of a fully quantum-mechanical multiparticle system,as is clear from their relation to the effective interactions andthe single-particle self-energy. Also, the source terms and thecouplings ultimately originate from a single equation: theDyson equation. On the other hand, a conventional system-bath model describes only the evolution of a density matrix,the preparation of which is outside the realm of the model.Such a treatment cannot account for the simultaneous gen-eration and dephasing of excitons as is done in the presentmodel. Given the relatively long time scales of decoherencecompared to the ultrashort pulses in systems such as the onebeing studied, treating the generation and dynamics of exci-tons at the same footing is indeed important.
V. NUMERICAL METHOD
We now turn to the numerical calculations of Eqs. 47and 48. To proceed, we need to compute the superoperatorsC ,, which depend on WQ
q , as shown in Eq. 43.The KMS relations yield the Fourier transform of WQ
q ,in the form
iWQq, = −
−
+ 2VqI−1q,e − 1
.
In this section, we first discuss the model used in computingrelevant properties of the electron gas, including the inversedielectric function −1q ,. We then describe our time-
FIG. 5. Color online Two-time grid used in computation of Eq.47. The dots on alternating antidiagonal lines or black vs bluedots form complementary subgrids. The shaded rectangle is do-main of memory integral contributing to the point t , t at its topright corner. Thick dashed line indicates the “front” on which allpoints are calculated by linear multistep method from the previousfront of the same subgrid.
KULJIT S. VIRK AND J. E. SIPE PHYSICAL REVIEW B 80, 165319 2009
165319-16
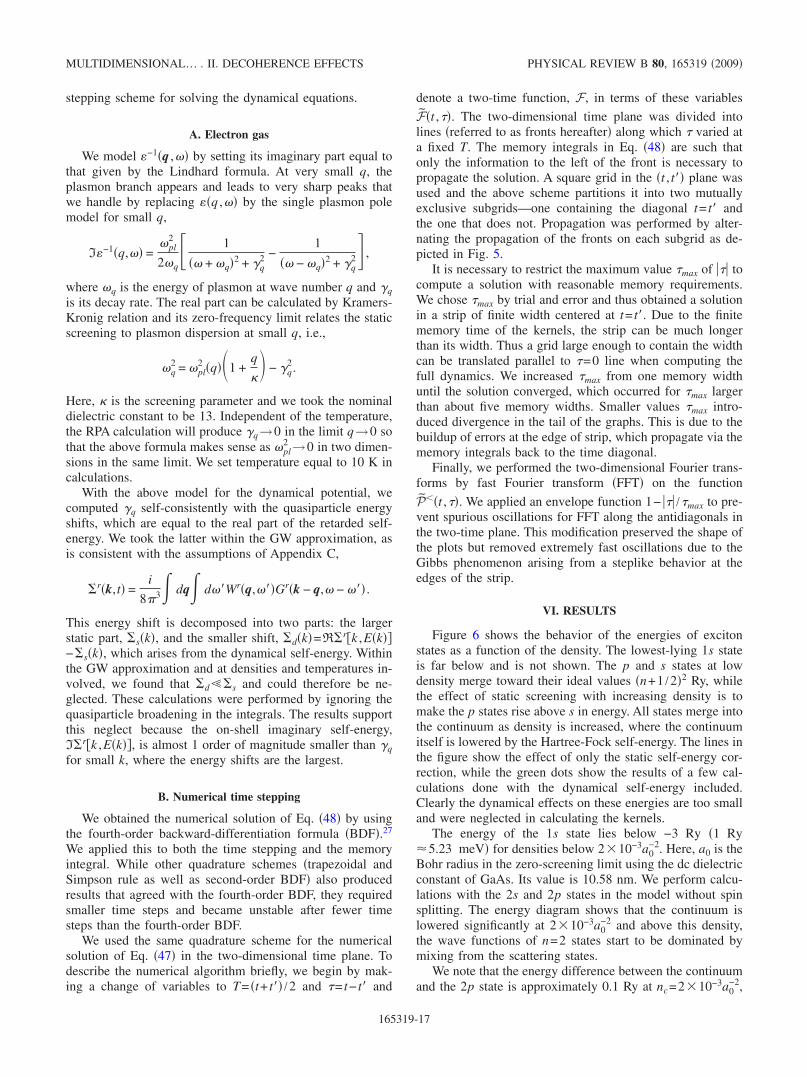
stepping scheme for solving the dynamical equations.
A. Electron gas
We model −1q , by setting its imaginary part equal tothat given by the Lindhard formula. At very small q, theplasmon branch appears and leads to very sharp peaks thatwe handle by replacing q , by the single plasmon polemodel for small q,
I−1q, =pl
2
2q 1
+ q2 + q2 −
1
− q2 + q2 ,
where q is the energy of plasmon at wave number q and qis its decay rate. The real part can be calculated by Kramers-Kronig relation and its zero-frequency limit relates the staticscreening to plasmon dispersion at small q, i.e.,
q2 = pl
2 q1 +q
− q
2.
Here, is the screening parameter and we took the nominaldielectric constant to be 13. Independent of the temperature,the RPA calculation will produce q→0 in the limit q→0 sothat the above formula makes sense as pl
2 →0 in two dimen-sions in the same limit. We set temperature equal to 10 K incalculations.
With the above model for the dynamical potential, wecomputed q self-consistently with the quasiparticle energyshifts, which are equal to the real part of the retarded self-energy. We took the latter within the GW approximation, asis consistent with the assumptions of Appendix C,
rk,t =i
83 dq dWrq,Grk − q, − .
This energy shift is decomposed into two parts: the largerstatic part, sk, and the smaller shift, dk=Rrk ,Ek−sk, which arises from the dynamical self-energy. Withinthe GW approximation and at densities and temperatures in-volved, we found that ds and could therefore be ne-glected. These calculations were performed by ignoring thequasiparticle broadening in the integrals. The results supportthis neglect because the on-shell imaginary self-energy,Irk ,Ek, is almost 1 order of magnitude smaller than qfor small k, where the energy shifts are the largest.
B. Numerical time stepping
We obtained the numerical solution of Eq. 48 by usingthe fourth-order backward-differentiation formula BDF.27
We applied this to both the time stepping and the memoryintegral. While other quadrature schemes trapezoidal andSimpson rule as well as second-order BDF also producedresults that agreed with the fourth-order BDF, they requiredsmaller time steps and became unstable after fewer timesteps than the fourth-order BDF.
We used the same quadrature scheme for the numericalsolution of Eq. 47 in the two-dimensional time plane. Todescribe the numerical algorithm briefly, we begin by mak-ing a change of variables to T= t+ t /2 and = t− t and
denote a two-time function, F, in terms of these variables
Ft ,. The two-dimensional time plane was divided intolines referred to as fronts hereafter along which varied ata fixed T. The memory integrals in Eq. 48 are such thatonly the information to the left of the front is necessary topropagate the solution. A square grid in the t , t plane wasused and the above scheme partitions it into two mutuallyexclusive subgrids—one containing the diagonal t= t andthe one that does not. Propagation was performed by alter-nating the propagation of the fronts on each subgrid as de-picted in Fig. 5.
It is necessary to restrict the maximum value max of tocompute a solution with reasonable memory requirements.We chose max by trial and error and thus obtained a solutionin a strip of finite width centered at t= t. Due to the finitememory time of the kernels, the strip can be much longerthan its width. Thus a grid large enough to contain the widthcan be translated parallel to =0 line when computing thefull dynamics. We increased max from one memory widthuntil the solution converged, which occurred for max largerthan about five memory widths. Smaller values max intro-duced divergence in the tail of the graphs. This is due to thebuildup of errors at the edge of strip, which propagate via thememory integrals back to the time diagonal.
Finally, we performed the two-dimensional Fourier trans-forms by fast Fourier transform FFT on the function
Pt ,. We applied an envelope function 1− /max to pre-vent spurious oscillations for FFT along the antidiagonals inthe two-time plane. This modification preserved the shape ofthe plots but removed extremely fast oscillations due to theGibbs phenomenon arising from a steplike behavior at theedges of the strip.
VI. RESULTS
Figure 6 shows the behavior of the energies of excitonstates as a function of the density. The lowest-lying 1s stateis far below and is not shown. The p and s states at lowdensity merge toward their ideal values n+1 /22 Ry, whilethe effect of static screening with increasing density is tomake the p states rise above s in energy. All states merge intothe continuum as density is increased, where the continuumitself is lowered by the Hartree-Fock self-energy. The lines inthe figure show the effect of only the static self-energy cor-rection, while the green dots show the results of a few cal-culations done with the dynamical self-energy included.Clearly the dynamical effects on these energies are too smalland were neglected in calculating the kernels.
The energy of the 1s state lies below −3 Ry 1 Ry5.23 meV for densities below 210−3a0
−2. Here, a0 is theBohr radius in the zero-screening limit using the dc dielectricconstant of GaAs. Its value is 10.58 nm. We perform calcu-lations with the 2s and 2p states in the model without spinsplitting. The energy diagram shows that the continuum islowered significantly at 210−3a0
−2 and above this density,the wave functions of n=2 states start to be dominated bymixing from the scattering states.
We note that the energy difference between the continuumand the 2p state is approximately 0.1 Ry at nc=210−3a0
−2,
MULTIDIMENSIONAL… . II. DECOHERENCE EFFECTS PHYSICAL REVIEW B 80, 165319 2009
165319-17
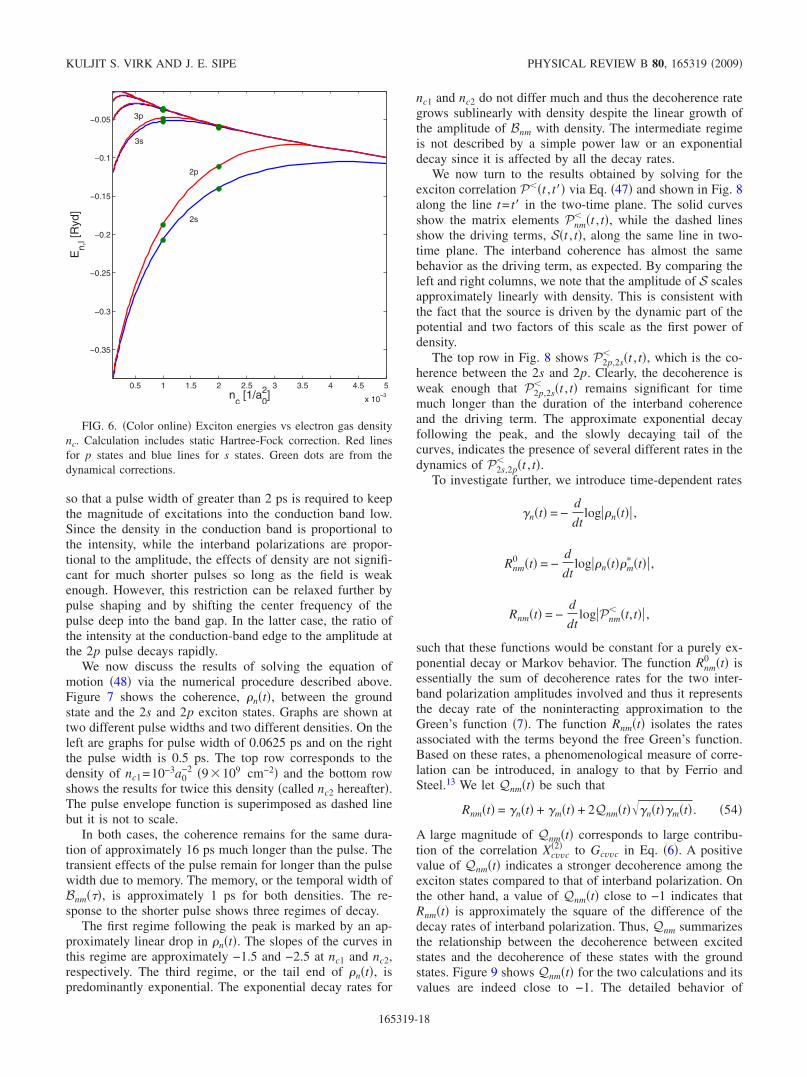
so that a pulse width of greater than 2 ps is required to keepthe magnitude of excitations into the conduction band low.Since the density in the conduction band is proportional tothe intensity, while the interband polarizations are propor-tional to the amplitude, the effects of density are not signifi-cant for much shorter pulses so long as the field is weakenough. However, this restriction can be relaxed further bypulse shaping and by shifting the center frequency of thepulse deep into the band gap. In the latter case, the ratio ofthe intensity at the conduction-band edge to the amplitude atthe 2p pulse decays rapidly.
We now discuss the results of solving the equation ofmotion 48 via the numerical procedure described above.Figure 7 shows the coherence, nt, between the groundstate and the 2s and 2p exciton states. Graphs are shown attwo different pulse widths and two different densities. On theleft are graphs for pulse width of 0.0625 ps and on the rightthe pulse width is 0.5 ps. The top row corresponds to thedensity of nc1=10−3a0
−2 9109 cm−2 and the bottom rowshows the results for twice this density called nc2 hereafter.The pulse envelope function is superimposed as dashed linebut it is not to scale.
In both cases, the coherence remains for the same dura-tion of approximately 16 ps much longer than the pulse. Thetransient effects of the pulse remain for longer than the pulsewidth due to memory. The memory, or the temporal width ofBnm, is approximately 1 ps for both densities. The re-sponse to the shorter pulse shows three regimes of decay.
The first regime following the peak is marked by an ap-proximately linear drop in nt. The slopes of the curves inthis regime are approximately −1.5 and −2.5 at nc1 and nc2,respectively. The third regime, or the tail end of nt, ispredominantly exponential. The exponential decay rates for
nc1 and nc2 do not differ much and thus the decoherence rategrows sublinearly with density despite the linear growth ofthe amplitude of Bnm with density. The intermediate regimeis not described by a simple power law or an exponentialdecay since it is affected by all the decay rates.
We now turn to the results obtained by solving for theexciton correlation Pt , t via Eq. 47 and shown in Fig. 8along the line t= t in the two-time plane. The solid curvesshow the matrix elements Pnm
t , t, while the dashed linesshow the driving terms, St , t, along the same line in two-time plane. The interband coherence has almost the samebehavior as the driving term, as expected. By comparing theleft and right columns, we note that the amplitude of S scalesapproximately linearly with density. This is consistent withthe fact that the source is driven by the dynamic part of thepotential and two factors of this scale as the first power ofdensity.
The top row in Fig. 8 shows P2p,2s t , t, which is the co-
herence between the 2s and 2p. Clearly, the decoherence isweak enough that P2p,2s
t , t remains significant for timemuch longer than the duration of the interband coherenceand the driving term. The approximate exponential decayfollowing the peak, and the slowly decaying tail of thecurves, indicates the presence of several different rates in thedynamics of P2s,2p
t , t.To investigate further, we introduce time-dependent rates
nt = −d
dtlognt ,
Rnm0 t = −
d
dtlogntm
t ,
Rnmt = −d
dtlogPnm
t,t ,
such that these functions would be constant for a purely ex-ponential decay or Markov behavior. The function Rnm
0 t isessentially the sum of decoherence rates for the two inter-band polarization amplitudes involved and thus it representsthe decay rate of the noninteracting approximation to theGreen’s function 7. The function Rnmt isolates the ratesassociated with the terms beyond the free Green’s function.Based on these rates, a phenomenological measure of corre-lation can be introduced, in analogy to that by Ferrio andSteel.13 We let Qnmt be such that
Rnmt = nt + mt + 2Qnmtntmt . 54
A large magnitude of Qnmt corresponds to large contribu-tion of the correlation Xcvvc
2 to Gcvvc in Eq. 6. A positivevalue of Qnmt indicates a stronger decoherence among theexciton states compared to that of interband polarization. Onthe other hand, a value of Qnmt close to −1 indicates thatRnmt is approximately the square of the difference of thedecay rates of interband polarization. Thus, Qnm summarizesthe relationship between the decoherence between excitedstates and the decoherence of these states with the groundstates. Figure 9 shows Qnmt for the two calculations and itsvalues are indeed close to −1. The detailed behavior of
0.5 1 1.5 2 2.5 3 3.5 4 4.5 5
x 10−3
−0.35
−0.3
−0.25
−0.2
−0.15
−0.1
−0.05
nc
[1/a02]
En,
l[Ryd
]
2p
2s
3s
3p
FIG. 6. Color online Exciton energies vs electron gas densitync. Calculation includes static Hartree-Fock correction. Red linesfor p states and blue lines for s states. Green dots are from thedynamical corrections.
KULJIT S. VIRK AND J. E. SIPE PHYSICAL REVIEW B 80, 165319 2009
165319-18
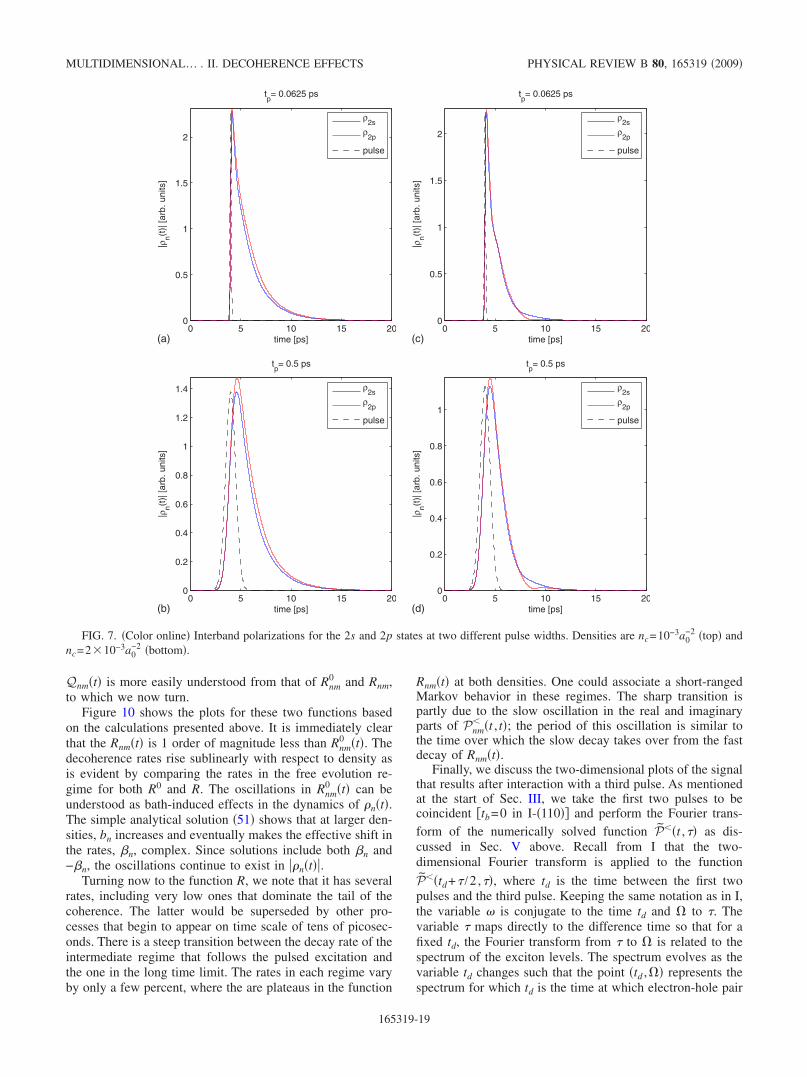
Qnmt is more easily understood from that of Rnm0 and Rnm,
to which we now turn.Figure 10 shows the plots for these two functions based
on the calculations presented above. It is immediately clearthat the Rnmt is 1 order of magnitude less than Rnm
0 t. Thedecoherence rates rise sublinearly with respect to density asis evident by comparing the rates in the free evolution re-gime for both R0 and R. The oscillations in Rnm
0 t can beunderstood as bath-induced effects in the dynamics of nt.The simple analytical solution 51 shows that at larger den-sities, bn increases and eventually makes the effective shift inthe rates, n, complex. Since solutions include both n and−n, the oscillations continue to exist in nt.
Turning now to the function R, we note that it has severalrates, including very low ones that dominate the tail of thecoherence. The latter would be superseded by other pro-cesses that begin to appear on time scale of tens of picosec-onds. There is a steep transition between the decay rate of theintermediate regime that follows the pulsed excitation andthe one in the long time limit. The rates in each regime varyby only a few percent, where the are plateaus in the function
Rnmt at both densities. One could associate a short-rangedMarkov behavior in these regimes. The sharp transition ispartly due to the slow oscillation in the real and imaginaryparts of Pnm
t , t; the period of this oscillation is similar tothe time over which the slow decay takes over from the fastdecay of Rnmt.
Finally, we discuss the two-dimensional plots of the signalthat results after interaction with a third pulse. As mentionedat the start of Sec. III, we take the first two pulses to becoincident tb=0 in I-110 and perform the Fourier trans-form of the numerically solved function Pt , as dis-cussed in Sec. V above. Recall from I that the two-dimensional Fourier transform is applied to the function
Ptd+ /2,, where td is the time between the first twopulses and the third pulse. Keeping the same notation as in I,the variable is conjugate to the time td and to . Thevariable maps directly to the difference time so that for afixed td, the Fourier transform from to is related to thespectrum of the exciton levels. The spectrum evolves as thevariable td changes such that the point td , represents thespectrum for which td is the time at which electron-hole pair
0 5 10 15 200
0.5
1
1.5
2
|ρn(t
)|[a
rb.u
nits
]
time [ps]
tp= 0.0625 ps
ρ2s
ρ2p
pulse
0 5 10 15 200
0.2
0.4
0.6
0.8
1
1.2
1.4
|ρn(t
)|[a
rb.u
nits
]
time [ps]
tp= 0.5 ps
ρ2s
ρ2p
pulse
0 5 10 15 200
0.5
1
1.5
2
|ρn(t
)|[a
rb.u
nits
]
time [ps]
tp= 0.0625 ps
ρ2s
ρ2p
pulse
0 5 10 15 200
0.2
0.4
0.6
0.8
1|ρ
n(t)|
[arb
.uni
ts]
time [ps]
tp= 0.5 ps
ρ2s
ρ2p
pulse
(b)
(a) (c)
(d)
FIG. 7. Color online Interband polarizations for the 2s and 2p states at two different pulse widths. Densities are nc=10−3a0−2 top and
nc=210−3a0−2 bottom.
MULTIDIMENSIONAL… . II. DECOHERENCE EFFECTS PHYSICAL REVIEW B 80, 165319 2009
165319-19
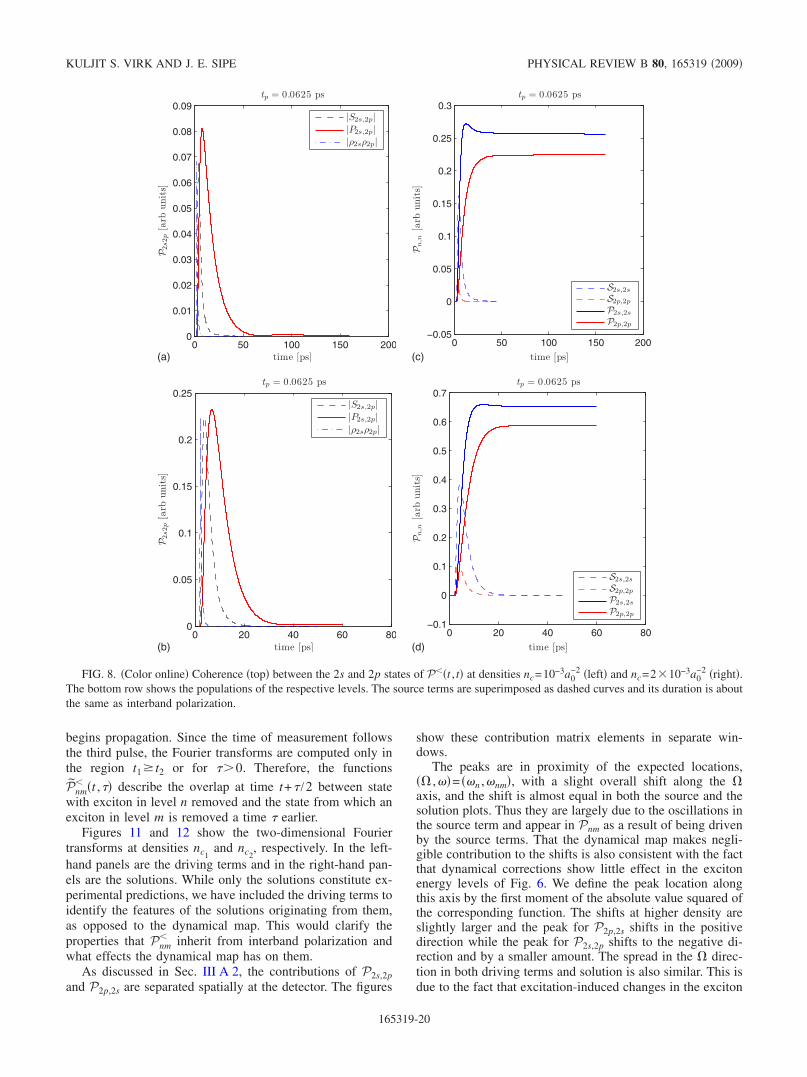
begins propagation. Since the time of measurement followsthe third pulse, the Fourier transforms are computed only inthe region t1 t2 or for 0. Therefore, the functions
Pnm t , describe the overlap at time t+ /2 between state
with exciton in level n removed and the state from which anexciton in level m is removed a time earlier.
Figures 11 and 12 show the two-dimensional Fouriertransforms at densities nc1
and nc2, respectively. In the left-
hand panels are the driving terms and in the right-hand pan-els are the solutions. While only the solutions constitute ex-perimental predictions, we have included the driving terms toidentify the features of the solutions originating from them,as opposed to the dynamical map. This would clarify theproperties that Pnm
inherit from interband polarization andwhat effects the dynamical map has on them.
As discussed in Sec. III A 2, the contributions of P2s,2pand P2p,2s are separated spatially at the detector. The figures
show these contribution matrix elements in separate win-dows.
The peaks are in proximity of the expected locations, ,= n ,nm, with a slight overall shift along the axis, and the shift is almost equal in both the source and thesolution plots. Thus they are largely due to the oscillations inthe source term and appear in Pnm as a result of being drivenby the source terms. That the dynamical map makes negli-gible contribution to the shifts is also consistent with the factthat dynamical corrections show little effect in the excitonenergy levels of Fig. 6. We define the peak location alongthis axis by the first moment of the absolute value squared ofthe corresponding function. The shifts at higher density areslightly larger and the peak for P2p,2s shifts in the positivedirection while the peak for P2s,2p shifts to the negative di-rection and by a smaller amount. The spread in the direc-tion in both driving terms and solution is also similar. This isdue to the fact that excitation-induced changes in the exciton
0 50 100 150 2000
0.01
0.02
0.03
0.04
0.05
0.06
0.07
0.08
0.09tp = 0.0625 ps
P2s2p
[arb
unit
s]
time [ps]
|S2s,2p|
|P2s,2p|
|ρ2sρ2p|
0 20 40 60 800
0.05
0.1
0.15
0.2
0.25tp = 0.0625 ps
P2s2p
[arb
unit
s]
time [ps]
|S2s,2p|
|P2s,2p|
|ρ2sρ2p|
0 50 100 150 200−0.05
0
0.05
0.1
0.15
0.2
0.25
0.3tp = 0.0625 ps
Pn
,n
[arb
unit
s]
time [ps]
S2s,2s
S2p,2p
P2s,2s
P2p,2p
0 20 40 60 80−0.1
0
0.1
0.2
0.3
0.4
0.5
0.6
0.7tp = 0.0625 ps
Pn
,n
[arb
unit
s]
time [ps]
S2s,2s
S2p,2p
P2s,2s
P2p,2p
(b)
(a) (c)
(d)
FIG. 8. Color online Coherence top between the 2s and 2p states of Pt , t at densities nc=10−3a0−2 left and nc=210−3a0
−2 right.The bottom row shows the populations of the respective levels. The source terms are superimposed as dashed curves and its duration is aboutthe same as interband polarization.
KULJIT S. VIRK AND J. E. SIPE PHYSICAL REVIEW B 80, 165319 2009
165319-20
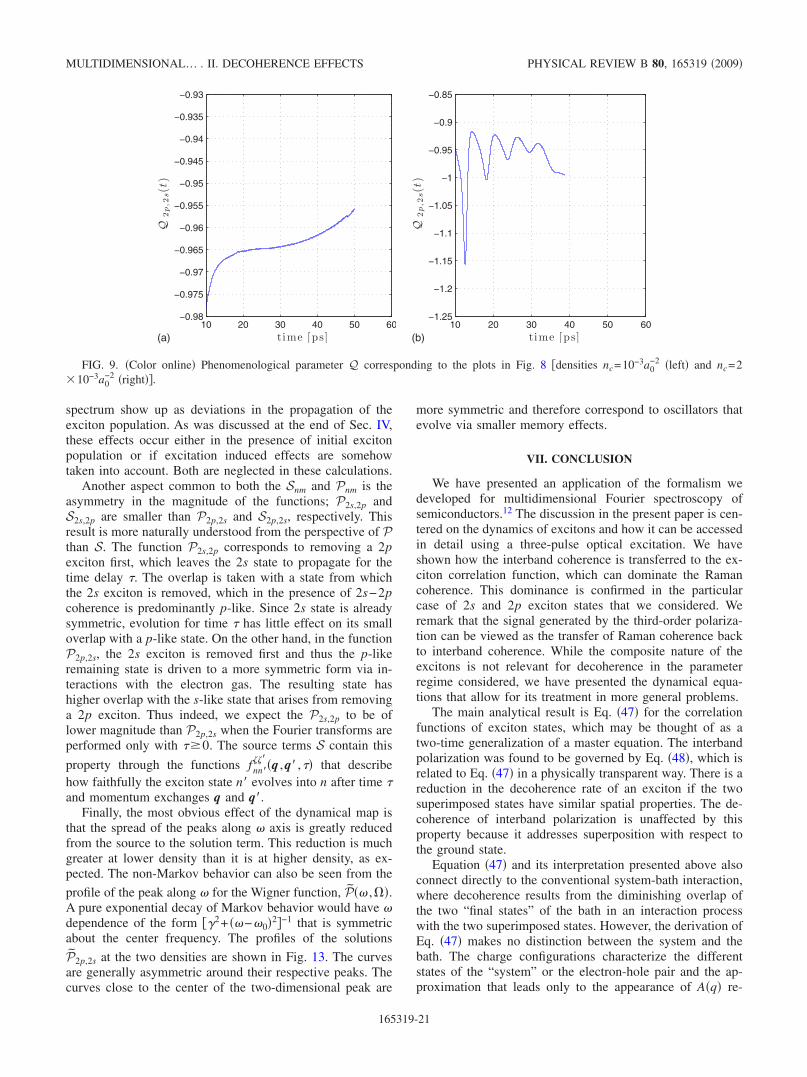
spectrum show up as deviations in the propagation of theexciton population. As was discussed at the end of Sec. IV,these effects occur either in the presence of initial excitonpopulation or if excitation induced effects are somehowtaken into account. Both are neglected in these calculations.
Another aspect common to both the Snm and Pnm is theasymmetry in the magnitude of the functions; P2s,2p andS2s,2p are smaller than P2p,2s and S2p,2s, respectively. Thisresult is more naturally understood from the perspective of Pthan S. The function P2s,2p corresponds to removing a 2pexciton first, which leaves the 2s state to propagate for thetime delay . The overlap is taken with a state from whichthe 2s exciton is removed, which in the presence of 2s−2pcoherence is predominantly p-like. Since 2s state is alreadysymmetric, evolution for time has little effect on its smalloverlap with a p-like state. On the other hand, in the functionP2p,2s, the 2s exciton is removed first and thus the p-likeremaining state is driven to a more symmetric form via in-teractions with the electron gas. The resulting state hashigher overlap with the s-like state that arises from removinga 2p exciton. Thus indeed, we expect the P2s,2p to be oflower magnitude than P2p,2s when the Fourier transforms areperformed only with 0. The source terms S contain this
property through the functions fnnq ,q , that describe
how faithfully the exciton state n evolves into n after time and momentum exchanges q and q.
Finally, the most obvious effect of the dynamical map isthat the spread of the peaks along axis is greatly reducedfrom the source to the solution term. This reduction is muchgreater at lower density than it is at higher density, as ex-pected. The non-Markov behavior can also be seen from the
profile of the peak along for the Wigner function, P , .A pure exponential decay of Markov behavior would have dependence of the form 2+ −02−1 that is symmetricabout the center frequency. The profiles of the solutions
P2p,2s at the two densities are shown in Fig. 13. The curvesare generally asymmetric around their respective peaks. Thecurves close to the center of the two-dimensional peak are
more symmetric and therefore correspond to oscillators thatevolve via smaller memory effects.
VII. CONCLUSION
We have presented an application of the formalism wedeveloped for multidimensional Fourier spectroscopy ofsemiconductors.12 The discussion in the present paper is cen-tered on the dynamics of excitons and how it can be accessedin detail using a three-pulse optical excitation. We haveshown how the interband coherence is transferred to the ex-citon correlation function, which can dominate the Ramancoherence. This dominance is confirmed in the particularcase of 2s and 2p exciton states that we considered. Weremark that the signal generated by the third-order polariza-tion can be viewed as the transfer of Raman coherence backto interband coherence. While the composite nature of theexcitons is not relevant for decoherence in the parameterregime considered, we have presented the dynamical equa-tions that allow for its treatment in more general problems.
The main analytical result is Eq. 47 for the correlationfunctions of exciton states, which may be thought of as atwo-time generalization of a master equation. The interbandpolarization was found to be governed by Eq. 48, which isrelated to Eq. 47 in a physically transparent way. There is areduction in the decoherence rate of an exciton if the twosuperimposed states have similar spatial properties. The de-coherence of interband polarization is unaffected by thisproperty because it addresses superposition with respect tothe ground state.
Equation 47 and its interpretation presented above alsoconnect directly to the conventional system-bath interaction,where decoherence results from the diminishing overlap ofthe two “final states” of the bath in an interaction processwith the two superimposed states. However, the derivation ofEq. 47 makes no distinction between the system and thebath. The charge configurations characterize the differentstates of the “system” or the electron-hole pair and the ap-proximation that leads only to the appearance of Aq re-
10 20 30 40 50 60−0.98
−0.975
−0.97
−0.965
−0.96
−0.955
−0.95
−0.945
−0.94
−0.935
−0.93
Q2p,2s(t
)
t ime [ps]10 20 30 40 50 60
−1.25
−1.2
−1.15
−1.1
−1.05
−1
−0.95
−0.9
−0.85
Q2p,2s(t
)
t ime [ps](b)(a)
FIG. 9. Color online Phenomenological parameter Q corresponding to the plots in Fig. 8 densities nc=10−3a0−2 left and nc=2
10−3a0−2 right.
MULTIDIMENSIONAL… . II. DECOHERENCE EFFECTS PHYSICAL REVIEW B 80, 165319 2009
165319-21
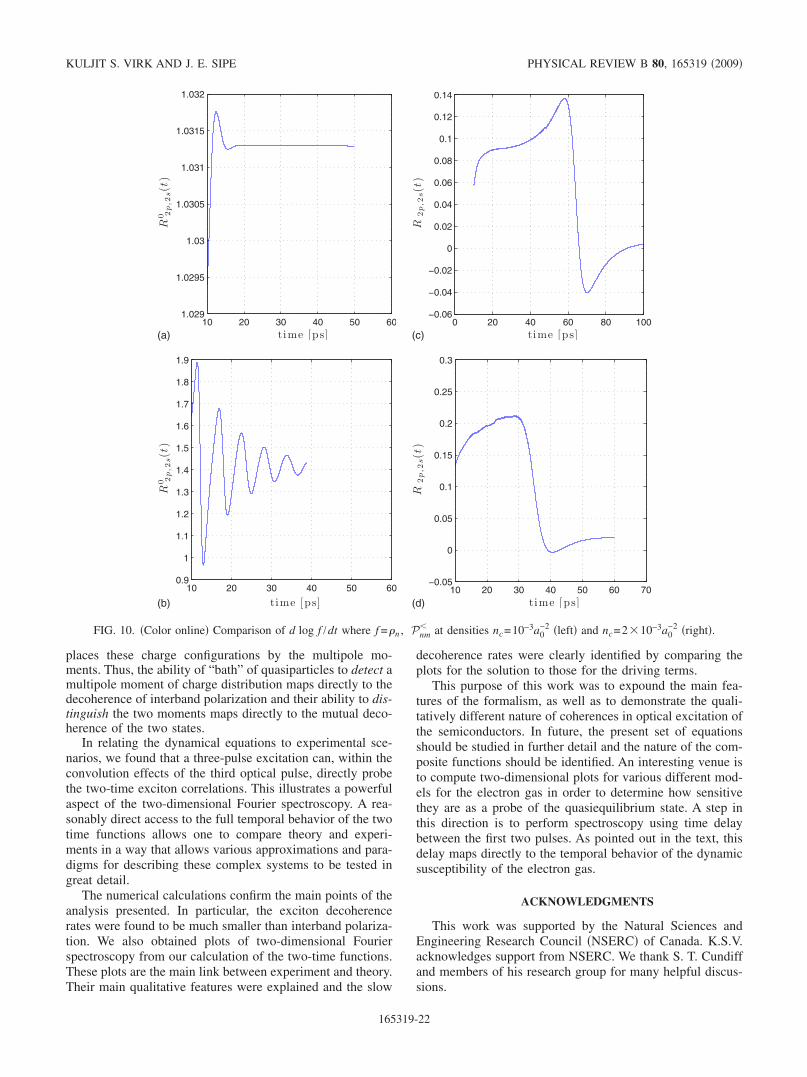
places these charge configurations by the multipole mo-ments. Thus, the ability of “bath” of quasiparticles to detect amultipole moment of charge distribution maps directly to thedecoherence of interband polarization and their ability to dis-tinguish the two moments maps directly to the mutual deco-herence of the two states.
In relating the dynamical equations to experimental sce-narios, we found that a three-pulse excitation can, within theconvolution effects of the third optical pulse, directly probethe two-time exciton correlations. This illustrates a powerfulaspect of the two-dimensional Fourier spectroscopy. A rea-sonably direct access to the full temporal behavior of the twotime functions allows one to compare theory and experi-ments in a way that allows various approximations and para-digms for describing these complex systems to be tested ingreat detail.
The numerical calculations confirm the main points of theanalysis presented. In particular, the exciton decoherencerates were found to be much smaller than interband polariza-tion. We also obtained plots of two-dimensional Fourierspectroscopy from our calculation of the two-time functions.These plots are the main link between experiment and theory.Their main qualitative features were explained and the slow
decoherence rates were clearly identified by comparing theplots for the solution to those for the driving terms.
This purpose of this work was to expound the main fea-tures of the formalism, as well as to demonstrate the quali-tatively different nature of coherences in optical excitation ofthe semiconductors. In future, the present set of equationsshould be studied in further detail and the nature of the com-posite functions should be identified. An interesting venue isto compute two-dimensional plots for various different mod-els for the electron gas in order to determine how sensitivethey are as a probe of the quasiequilibrium state. A step inthis direction is to perform spectroscopy using time delaybetween the first two pulses. As pointed out in the text, thisdelay maps directly to the temporal behavior of the dynamicsusceptibility of the electron gas.
ACKNOWLEDGMENTS
This work was supported by the Natural Sciences andEngineering Research Council NSERC of Canada. K.S.V.acknowledges support from NSERC. We thank S. T. Cundiffand members of his research group for many helpful discus-sions.
10 20 30 40 50 601.029
1.0295
1.03
1.0305
1.031
1.0315
1.032
R0 2
p,2s(t
)
t ime [ps]
10 20 30 40 50 600.9
1
1.1
1.2
1.3
1.4
1.5
1.6
1.7
1.8
1.9
R0 2
p,2s(t
)
t ime [ps]
0 20 40 60 80 100−0.06
−0.04
−0.02
0
0.02
0.04
0.06
0.08
0.1
0.12
0.14
R2p,2s(t
)
t ime [ps]
10 20 30 40 50 60 70−0.05
0
0.05
0.1
0.15
0.2
0.25
0.3
R2p,2s(t
)
t ime [ps](b)
(a) (c)
(d)
FIG. 10. Color online Comparison of d log f /dt where f =n , Pnm at densities nc=10−3a0
−2 left and nc=210−3a0−2 right.
KULJIT S. VIRK AND J. E. SIPE PHYSICAL REVIEW B 80, 165319 2009
165319-22
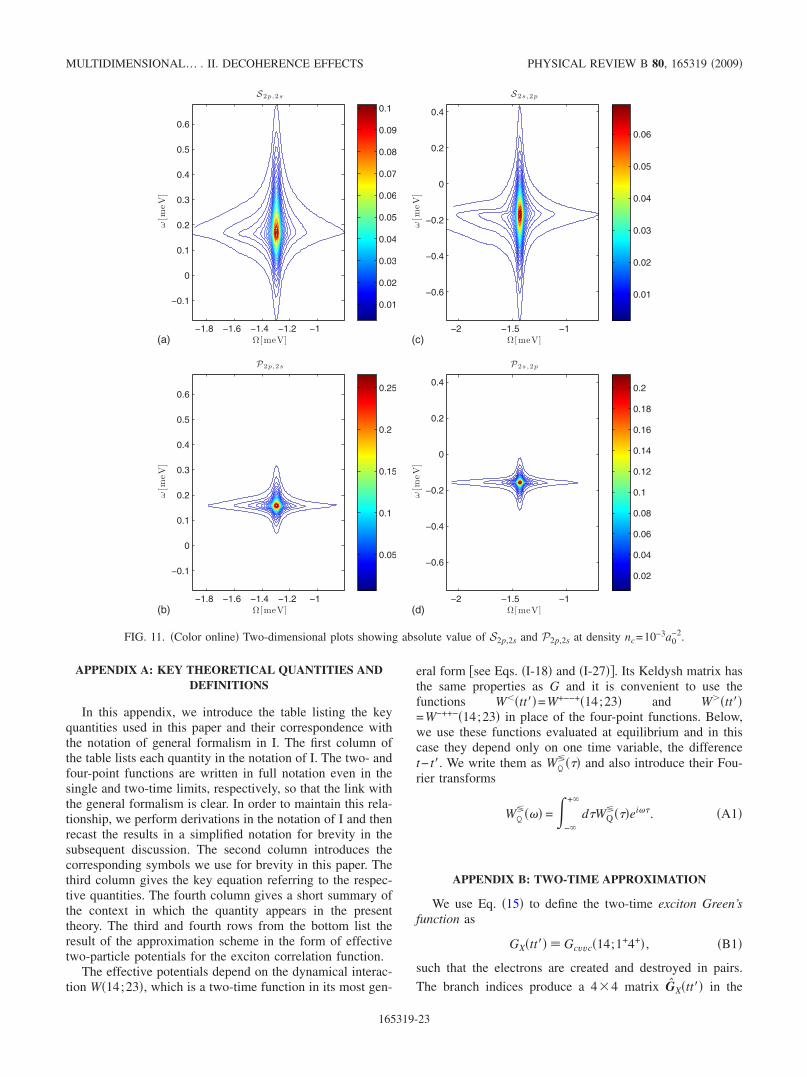
APPENDIX A: KEY THEORETICAL QUANTITIES ANDDEFINITIONS
In this appendix, we introduce the table listing the keyquantities used in this paper and their correspondence withthe notation of general formalism in I. The first column ofthe table lists each quantity in the notation of I. The two- andfour-point functions are written in full notation even in thesingle and two-time limits, respectively, so that the link withthe general formalism is clear. In order to maintain this rela-tionship, we perform derivations in the notation of I and thenrecast the results in a simplified notation for brevity in thesubsequent discussion. The second column introduces thecorresponding symbols we use for brevity in this paper. Thethird column gives the key equation referring to the respec-tive quantities. The fourth column gives a short summary ofthe context in which the quantity appears in the presenttheory. The third and fourth rows from the bottom list theresult of the approximation scheme in the form of effectivetwo-particle potentials for the exciton correlation function.
The effective potentials depend on the dynamical interac-tion W14;23, which is a two-time function in its most gen-
eral form see Eqs. I-18 and I-27. Its Keldysh matrix hasthe same properties as G and it is convenient to use thefunctions Wtt=W+−−+14;23 and Wtt=W−++−14;23 in place of the four-point functions. Below,we use these functions evaluated at equilibrium and in thiscase they depend only on one time variable, the differencet− t. We write them as WQ
and also introduce their Fou-rier transforms
WQ =
−
+
dWQei. A1
APPENDIX B: TWO-TIME APPROXIMATION
We use Eq. 15 to define the two-time exciton Green’sfunction as
GXtt Gcvvc14;1+4+ , B1
such that the electrons are created and destroyed in pairs.
The branch indices produce a 44 matrix GXtt in the
Ω[meV]
ω[m
eV
]
S2p,2s
−1.8 −1.6 −1.4 −1.2 −1
−0.1
0
0.1
0.2
0.3
0.4
0.5
0.6
0.01
0.02
0.03
0.04
0.05
0.06
0.07
0.08
0.09
0.1
Ω[meV]
ω[m
eV
]
P2p,2s
−1.8 −1.6 −1.4 −1.2 −1
−0.1
0
0.1
0.2
0.3
0.4
0.5
0.6
0.05
0.1
0.15
0.2
0.25
(b)
(a) Ω[meV]
ω[m
eV
]
S2s ,2p
−2 −1.5 −1
−0.6
−0.4
−0.2
0
0.2
0.4
0.01
0.02
0.03
0.04
0.05
0.06
Ω[meV]
ω[m
eV
]
P2s ,2p
−2 −1.5 −1
−0.6
−0.4
−0.2
0
0.2
0.4
0.02
0.04
0.06
0.08
0.1
0.12
0.14
0.16
0.18
0.2
(c)
(d)
FIG. 11. Color online Two-dimensional plots showing absolute value of S2p,2s and P2p,2s at density nc=10−3a0−2.
MULTIDIMENSIONAL… . II. DECOHERENCE EFFECTS PHYSICAL REVIEW B 80, 165319 2009
165319-23
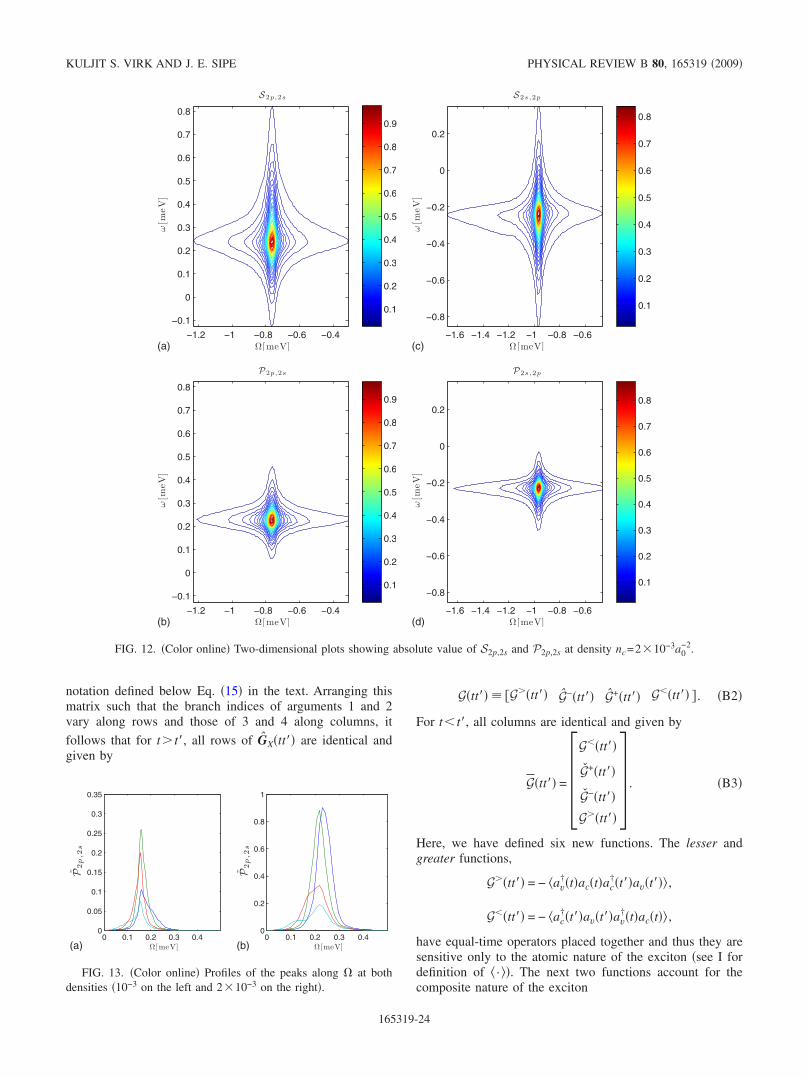
notation defined below Eq. 15 in the text. Arranging thismatrix such that the branch indices of arguments 1 and 2vary along rows and those of 3 and 4 along columns, it
follows that for t t, all rows of GXtt are identical andgiven by
Gtt Gtt G−tt G+tt Gtt . B2
For t t, all columns are identical and given by
Gtt = Gtt
G+tt
G−tt
Gtt . B3
Here, we have defined six new functions. The lesser andgreater functions,
Gtt = − av†tactac
†tavt ,
Gtt = − ac†tavtav
†tact ,
have equal-time operators placed together and thus they aresensitive only to the atomic nature of the exciton see I fordefinition of · . The next two functions account for thecomposite nature of the exciton
Ω[meV]
ω[m
eV
]
S2p,2s
−1.2 −1 −0.8 −0.6 −0.4
−0.1
0
0.1
0.2
0.3
0.4
0.5
0.6
0.7
0.8
0.1
0.2
0.3
0.4
0.5
0.6
0.7
0.8
0.9
Ω[meV]
ω[m
eV
]
P2p,2s
−1.2 −1 −0.8 −0.6 −0.4
−0.1
0
0.1
0.2
0.3
0.4
0.5
0.6
0.7
0.8
0.1
0.2
0.3
0.4
0.5
0.6
0.7
0.8
0.9
Ω[meV]
ω[m
eV
]
S2s ,2p
−1.6 −1.4 −1.2 −1 −0.8 −0.6
−0.8
−0.6
−0.4
−0.2
0
0.2
0.1
0.2
0.3
0.4
0.5
0.6
0.7
0.8
Ω[meV]
ω[m
eV
]
P2s ,2p
−1.6 −1.4 −1.2 −1 −0.8 −0.6
−0.8
−0.6
−0.4
−0.2
0
0.2
0.1
0.2
0.3
0.4
0.5
0.6
0.7
0.8
(b)
(a) (c)
(d)
FIG. 12. Color online Two-dimensional plots showing absolute value of S2p,2s and P2p,2s at density nc=210−3a0−2.
0 0.1 0.2 0.3 0.40
0.05
0.1
0.15
0.2
0.25
0.3
0.35
Ω[meV]
P2p
,2s
0 0.1 0.2 0.3 0.40
0.2
0.4
0.6
0.8
1
Ω[meV]
P2p
,2s
(b)(a)
FIG. 13. Color online Profiles of the peaks along at bothdensities 10−3 on the left and 210−3 on the right.
KULJIT S. VIRK AND J. E. SIPE PHYSICAL REVIEW B 80, 165319 2009
165319-24
G−tt = ac†tactav
†tavt ,
G+tt = avtav†tactac
†t ,
G−tt = av†tavtac
†tact ,
G+tt = actac†tavtav
†t .
The superscripts on these functions do not stand for thecontour index. Rather, they signify the fact that G representthe annihilation of the electron-hole pair at time t in a statethat evolves from N1 particle state at time t. This is incontrast to the functions G! the Lehmann representations ofwhich are described by states only within the N-particle Hil-bert space. Exploiting the equal-time anticommutation rela-tion ac
†t ,avt=0, it can be verified that the equalities be-tween Keldysh components of G carry over to X2 as well.
Thus, the matrix X2 has identical rows,
Xtt = Ptt P−tt P+tt Ptt , B4
for t t, and identical columns,
Xtt = Ptt
P+tt
P−tt
Ptt , B5
for t t. As with the Green’s functions above, the functionsPt , t treat exciton as an indivisible particle, couplingonly to its multipole moments. Besides being related to the
evolution in N1 particle Hilbert space, the functions Pand P may also be seen as being sensitive to the individualpropagation of the electron and the hole, as is clear from theoperator ordering in the corresponding Green’s function.
As discussed in the text, we make further approximationsto close the equations of motion within the space of two-timefunctions. To formulate them mathematically, we begin withthe semigroup property obeyed by noninteracting Green’sfunctions
G0rtt = iG0
rttG0rtt , B6
G0att = − iG0
attG0att . B7
Note that no integration is performed over the time variables,but all other degrees of freedom are summed using the ma-trix notation. The two-time limit is constructed by construct-ing the analog of semigroup property of the ideal single-particle Green’s functions, which holds approximately forthe full Green’s functions23,28,29
Grtt iGrttGrtt , B8
Gatt − iGattGatt . B9
The “” here denotes the neglect of all those diagramswhere the time t lies inside at least one self-energy inser-
tion. This is seen from the diagrammatic expansion of Dysonequation, in which we start with G0, pick a time t, and applythe properties B6 and B7. Then we dress each of the twoG0 with self-energy insertions and reject all those diagramsthat cannot be cut at t by only cutting a propagator.
Substituting the approximate Eqs. B8 and B9 in theDyson equation in turn implies
Gtt iGrttGtt t t t
− iGttGatt t t t.
Collecting these functions in the matrix form and transform-ing back to the contour indices, we get
Gtt = iGttzGtt t t t
− iGttzGtt t t t.
APPENDIX C: DERIVATION OF EOM
1. Derivation of two-particle EOM
For brevity, we show how to write the JQX22 part of Eq.
17 using the Keldysh matrix representation, with the spe-cial structure Eqs. B4 and B5. The J2XQ
2 term is ob-tained analogously.
To proceed, we write the interaction part of the equationas
Itt;t+t+ = JQtt;t+t+ZPtt;t+t+dt,
where
Z = 1
− 1
− 1
1 .
To further simplify this, we divide the integration over tinto three regions
Icvvc1 tt;t+t+ =
tmin
tmax
JQ;cvvctt;t+t+ZPtt;t+t+dt,
Icvvc2 tt;t+t+ =
tmax
JQ;cvvctt;t+t+ZPtt;t+t+dt,
Icvvc3 tt;t+t+ =
−
tmin
JQ;cvvctt;t+t+ZPtt;t+t+dt.
where tmin=mint , t and tmax=maxt , t. For t t, we ob-tain
Icvvc1 tt =
t
t
JQ;cvvcr ttPttdt,
Icvvc2 tt = 0,
MULTIDIMENSIONAL… . II. DECOHERENCE EFFECTS PHYSICAL REVIEW B 80, 165319 2009
165319-25
Icvvc3 tt =
−
tJQttZPttdt.
Here, Ij are the row vectors of the same form as P with thecorresponding elements. From the properties of J, it alsofollows that
IQ;cvvc3tt = 0.
In the equation for P, it is I that contributes. In the tworegimes, t t and t t, it is
Itt = t
t
dtJQr ttPtt
+ i−
tJQttZPttdt, t t,
Itt = t
tdtJQttPatt
+ i−
t
JQttZPttdt, t t.
By expanding the last term into a sum over its components,we obtain
Ittt − t + Ittt − t = itmin
tmax
JQr ttPtt
+ JQttPatt + i
−
tmin
JQttPtt
+ JQttPttdt − i
−
tmin
JQ−ttP+tt
+ JQ+ttP−ttdt, C1
where tmin=mint , t and tmax=maxt , t. Similar steps leadto an expression, in terms of the Keldysh components, forthe term J2XQ
2 in Eq. 17. After restoring the 11 and14 in Eq. 17 as discussed just above that equation andadding JQX2
2 and J2XQ2 terms, we obtain Eq. 38 in Sec. IV.
2. Derivation of single-particle EOM
We now derive an expression for the interband polariza-tion by using the semigroup approximation, which is thesame as generalized Kadanoff Baym ansatz GKBA in thiscase. We will consider the dynamically screened Hartree-Fock self-energy with a vertex correction arising fromelectron-hole interaction. From the Dyson equation, the “+−” Keldysh components of the couplings in Eq. 12 are
M111;1
X11 = Qcc
s k,t1X1;cv+− kt1t2 , C2
M112;1
X12 = iWQ
+qt − tX1;cvvv+;− k,k,qtt;t+t+
+ X1;ccvc+;−k,k,qtt;t+t+ . C3
We obtained these by separating the self-energy into the
static part s and a purely dynamical part and we haveindicated the first-order variation in the self-energy by super-script “1.” The above formula gives M1
12;1 Eq. 12 sinceit is coupled to the functions X1;cvvv and X1;ccvc.
We now employ the GKBA Ref. 30 in the form
X1;cv+− 12 = X1;cv
−+ 12 = X1;cv+− 1Gvv
a 12 − Gccr 12X1;cv
+− 2 ,
X1;cv++ 12 = X1;cv
−− 12 = X1;cv+− 1Gvv
a 12 − Gccr 12X1;cv
+− 2 .
Note that all OU components of the Keldysh matrix for Gcvare equal and this is due to the anticommutation relationavk ,ack= avk ,ack
† =0. We apply GKBA to approximateX1;cvvv and X1;ccvc functions by a product of particle-conserving exciton correlation X1;cvvc and the interband po-larization as follows:
X1;cvvv2+−k,k,qtt;tt
= − XQ;cvvc2+−k,k,qtt;ttX1;cv
k,t;kt , C4
X1;ccvc2+−k,k,qtt;tt = XQ;cvvc
2+−k,k,qtt;ttX1;cv k
+ q,t;k + q,t . C5
This approximation is most easily understood diagrammati-cally by directly performing vertex corrections correspond-ing to electron-hole interaction in the Hartree-Fock self-energy.
Combining Eqs. C3 and C2 with their adjoint, impos-ing the GKBA, setting t1= t2= t, and writing Xcv
+−tt= icvtfor brevity, we get
t+ ick cvk,t − iUcvkt;kt+fvk − fck
− Qccs k,tcvk,t = fvk − fck dk
42Vsk
− kcvk,t + dt dq
42 iWQ+qt
− t dkdk
164 X1;cvvv2+−k,k,qtt;tt
+ X1;ccvc2+−k,k,qtt;tt − dt dq
42 iWQ−qt
− t dkdk
164 X1;cvvv2+−k − q,k,qtt;tt + X1;ccvc
2+−k
− q,k,qtt;tt . C6
Here, Vs is the static part of screened interaction. We havenot yet substituted Eqs. C4 and C5, but will do so whenprojecting this equation onto the exciton basis using Eq. 25.The condition of zero-exciton density in equilibrium whenapplied to the last two terms in Eq. C6 allows only thepositive contour index, i.e., =+. With =−, there is alwaysat least one occurrence of GQvv
, which vanishes. To projectEq. C6 onto the exciton basis, we substitute Eqs. C4 andC5 and integrate them over k and k as follows:
KULJIT S. VIRK AND J. E. SIPE PHYSICAL REVIEW B 80, 165319 2009
165319-26
dk
42nk dk
42X1cvvv++−+ k,k,qtt;tt
+ X1ccvc++−+k,k,qtt;tt =
− jm
PQj j ttmt dk
42nk jk
+ cq dk
42 jk − vqmk − j
k − vqmk
+ q = jm
Onj0,cqAjmqPQj j ttmt ,
where Aq=A0 ,q see discussion below Eq. 45 in text.To obtain the last line, we have used the relation c=1+v inthe integral over k,
dk
42 jk − vqmk + q = dk
42 jkmk + 1
+ vq = Ojm0,cq .
The integrals in the last term of Eq. C6 are handled simi-larly, obtaining
dk
42nk dkX1cvvv
++−+ k − q,k,qtt;tt + X1ccvc++−+k
− q,k,qtt;tt = − jm
PQj j ttmt dk
42nk jk
− vq dk
42 jk − vqmk − j
k − vqmk
+ q = jm
Onj0,− vqAqPQj j ttmt .
The differential equation now takes the form
t+ in nt − Unt =
jm dt dq
42 iWQq,
Onj0,cq
− Onj0,vqAjmqPQj j mt
− = m dt
j dq
42 iWQq,
− AnjqAjmqPQj j mt −
= m dtBnmmt − .
In the last equality, we have used the definition 44 of thematrix B, while on the left-hand side we have combinedthe coulomb interaction terms and the band energies into theexciton energy levels, n. The projection ofiUcvkt ;kt+fvk− fck on the exciton states is denoted by
Unt. Thus, the single-particle equation takes the formshown in Eq. 42 or 47.
3. Expressions for interaction matrix components
After several algebraic steps starting from the expression16 defined on the Keldysh contour, the expressions for thecomponents of Jq are as follows:
Jqtt = − i dq
42Wq − qttAq,qPq ttAq,q ,
Jqtt = − i dq
42Wq − qttAq,qPq ttAq,q .
While we mainly work with these components in the text, wealso give expressions for the rest for completeness
Jq−tt = − i dq
42Wq − qttAq,qPq−q− ttAq
−1
2iWq − qtt − iWq
− qttFqPq− ttAq,q ,
Jq+tt = − i dq
42Wq − qttAq,qPq+ ttAq,q
−1
2iWq − qtt − iWq
− qttFq,qPq+ ttAq,q ,
Jq+tt = i dq
42Wq − qttAq,qPq+ ttAq,q
+1
2iWq − qtt − iWq
− qttAq,qPq+ ttFq,q
Jq−tt = i dq
42Wq − qttAq,qPq− ttAq,q
+1
2iWq − qtt − iWQ
q
− qttAq,qPq− ttFq,q .
Note that only the matrix A appears in expressions for J,which are sensitive only to the multipole moments of theexciton. On the other hand, the composite functions alwayscontain a contribution from F,
Fnmq,q Onmcq,cq + Onmvq,vq ,
which is sensitive to the states of the electron and hole indi-vidually. Since we have neglected the latter functions, theequation we obtain is entirely in terms of A.
MULTIDIMENSIONAL… . II. DECOHERENCE EFFECTS PHYSICAL REVIEW B 80, 165319 2009
165319-27
*[email protected]†[email protected]
1 F. Rossi, S. Haas, and T. Kuhn, Phys. Rev. Lett. 72, 152 1994.2 V. L. Gurevich, M. I. Muradov, and D. A. Parshin, EPL 12, 375
1990.3 P. C. Becker, H. L. Fragnito, C. H. Brito Cruz, R. L. Fork, J. E.
Cunningham, J. E. Henry, and C. V. Shank, Phys. Rev. Lett. 61,1647 1988.
4 W. A. Hügel, M. F. Heinrich, M. Wegener, Q. T. Vu, L. Bányai,and H. Haug, Phys. Rev. Lett. 83, 3313 1999.
5 M. Lindberg, R. Binder, and S. W. Koch, Phys. Rev. A 45, 18651992.
6 L. Schultheis, M. D. Sturge, and J. Hegarty, Appl. Phys. Lett.47, 995 1985.
7 R. D. R. Bhat and J. E. Sipe, Phys. Rev. Lett. 85, 5432 2000.8 H. van Driel and J. Sipe, Coherent Control of Photocurrents in
Semiconductors Springer, New York, 1999, Chap. 5, p. 261.9 I. Kuznetsova, P. Thomas, T. Meier, T. Zhang, X. Li, R. Mirin,
and S. Cundiff, Solid State Commun. 142, 154 2007.10 X. Li, T. Zhang, C. N. Borca, and S. T. Cundiff, Phys. Rev. Lett.
96, 057406 2006.11 L. Yang, I. V. Schweigert, S. T. Cundiff, and S. Mukamel, Phys.
Rev. B 75, 125302 2007.12 K. S. Virk and J. E. Sipe, preceding paper, Phys. Rev. B 80,
165318 2009.13 K. B. Ferrio and D. G. Steel, Phys. Rev. Lett. 80, 786 1998.14 Here, −134;43, which is the inverse dielectric function that
transforms the response to effective field into the response to theexternal field, should multiply X2. We do not display it herebecause in Eq. 6, we set 3v;4c
−1 34;43 equal to unity. This
approximation neglects the matrix elements of Coulomb interac-tion across the fundamental gap, as well as the effects on theresponse due to the motion of carriers perpendicular to the planeof the quantum well.
15 P. Kral and J. Sipe, Phys. Rev. B 61, 5381 2000.
16 In the following sections, we discuss the set of physical andmathematical approximations within which this correlation func-tion alone captures the entire TDFS signal generated by Ramancoherence among exciton states.
17 We also argue in Sec. IV that EID makes only a quantitativedifference in the type of decoherence studied.
18 The diagrams that contribute to this coupling inevitably containat least one GQ line from negative to the positive contour, whichas discussed in I is proportional to density.
19 The most general form for I2 is displayed diagrammatically inFigs. I-6a–I-6c.
20 K. Virk, Ph.D. thesis, University of Toronto, 2009.21 Doing so would be inconsistent with the left-hand side because,
in the full diagram, the pair of propagators is GcvGcc or GvvGvc,etc. It would also be inconsistent because it would modify theeffective interaction in such a way that it would include bothpulses, which is a second-order deviation that should be in thedynamical map and not the source term.
22 We will continue using “Q” explicitly when a function is to beevaluated at equilibrium.
23 T. Bornath, D. Kremp, and M. Schlanges, Phys. Rev. E 60, 63821999.
24 P. Martin and J. Schwinger, Phys. Rev. 115, 1342 1959.25 R. Zimmermann, Many-Particle Theory of Highly Excited Semi-
conductors Teubner, Leipzig, 1988.26 J. Negele, Quantum Many-Particle Systems Addison-Wesley
Publishing Company, Reading, MA, 1988.27 P. Linz, Analytical and Numerical Methods for Volterra Equa-
tions SIAM, Philadelphia, 1985.28 B. Velicky, A. Kalvova, and V. Spicka, Phys. Rev. B 75, 195125
2007.29 B. Velický, A. Kalvová, and V. Špička, Phys. Rev. B 77,
041201R 2008.30 W. Schafer and M. Wegener, Semiconductor Optics and Trans-
port Phenomena Springer, Berlin, 2001.
KULJIT S. VIRK AND J. E. SIPE PHYSICAL REVIEW B 80, 165319 2009
165319-28
Related Documents