Computer Engineering Mekelweg 4, 2628 CD Delft The Netherlands http://ce.et.tudelft.nl/ 2003 MSc THESIS PROSA Profiling-based State Assignment for Low Power Dissipation Robbert Eggermont Abstract Delft University of Technology Faculty of Electrical Engineering, Mathematics and Computer Science CE-MS-2003-11 In this thesis we address the problem of state assignment for finite state machines (FSMs). We target the reduction of power dissipation in FSM circuits by minimizing the switching activity in the state register. We in- troduce a novel method that utilizes dynamic loop information extracted from FSM profiling data. We propose three different loop-based state assignment algorithms, trading off quality for computational effort. The depth-first search (DFS) algorithm performs an exhaustive search of the FSM encoding space, using the loop information for intermediate cost es- timates of an encoding. The loop-based DFS algorithm performs a similar search on a loop-by-loop basis, where the loops are ordered in descending order of weight. The heuristic algorithm encodes the states individually, on the same loop-by-loop basis. The algorithms have been implemented and evaluated on the standard FSM benchmark suite MCNC/LGSynth ’89. Simulation results indicate an 8% average reduction of the switching ac- tivity in the state register for the heuristic algorithm when compared with POW3, a state of the art state assignment algorithms for low power dissi- pation. Additionally, our experiments suggest that no current state assign- ment algorithm that utilizes state register switching activity as metric for power minimization is able to achieve a consistent reduction in power con- sumption. Therefore, we conclude that the cost metric utilized for FSM state assignment algorithms for low power dissipation should be extended to also reflect the switching activity in the combinatorial circuit.

Welcome message from author
This document is posted to help you gain knowledge. Please leave a comment to let me know what you think about it! Share it to your friends and learn new things together.
Transcript

Computer EngineeringMekelweg 4,
2628 CD DelftThe Netherlands
http://ce.et.tudelft.nl/
2003
MSc THESIS
PROSAProfiling-based State Assignment for Low Power Dissipation
Robbert Eggermont
Abstract
Delft University of Technology Faculty of Electrical Engineering, Mathematics and Computer Science
CE-MS-2003-11
In this thesis we address the problem of state assignment for finite statemachines (FSMs). We target the reduction of power dissipation in FSMcircuits by minimizing the switching activity in the state register. We in-troduce a novel method that utilizes dynamic loop information extractedfrom FSM profiling data. We propose three different loop-based stateassignment algorithms, trading off quality for computational effort. Thedepth-first search (DFS) algorithm performs an exhaustive search of theFSM encoding space, using the loop information for intermediate cost es-timates of an encoding. The loop-based DFS algorithm performs a similarsearch on a loop-by-loop basis, where the loops are ordered in descendingorder of weight. The heuristic algorithm encodes the states individually,on the same loop-by-loop basis. The algorithms have been implementedand evaluated on the standard FSM benchmark suite MCNC/LGSynth ’89.Simulation results indicate an 8% average reduction of the switching ac-tivity in the state register for the heuristic algorithm when compared withPOW3, a state of the art state assignment algorithms for low power dissi-pation. Additionally, our experiments suggest that no current state assign-ment algorithm that utilizes state register switching activity as metric forpower minimization is able to achieve a consistent reduction in power con-sumption. Therefore, we conclude that the cost metric utilized for FSMstate assignment algorithms for low power dissipation should be extendedto also reflect the switching activity in the combinatorial circuit.


PROSAProfiling-based State Assignment for Low Power Dissipation
THESIS
submitted in partial fulfillment of therequirements for the degree of
MASTER OF SCIENCE
in
COMPUTER ENGINEERING
by
Robbert Eggermontborn in Amsterdam, the Netherlands
Computer EngineeringDepartment of Electrical EngineeringFaculty of Electrical Engineering, Mathematics and Computer ScienceDelft University of Technology

PROSAProfiling-based State Assignment for Low Power Dissipation
by Robbert Eggermont
Abstract
�n this thesis we address the problem of state assignment for finite state machines (FSMs). We targetthe reduction of power dissipation in FSM circuits by minimizing the switching activity in the stateregister. We introduce a novel method that utilizes dynamic loop information extracted from FSM
profiling data. We propose three different loop-based state assignment algorithms, trading off quality forcomputational effort. The depth-first search (DFS) algorithm performs an exhaustive search of the FSMencoding space, using the loop information for intermediate cost estimates of an encoding. The loop-based DFS algorithm performs a similar search on a loop-by-loop basis, where the loops are ordered indescending order of weight. The heuristic algorithm encodes the states individually, on the same loop-by-loop basis. The algorithms have been implemented and evaluated on the standard FSM benchmarksuite MCNC/LGSynth ’89. Simulation results indicate an 8% average reduction of the switching activityin the state register for the heuristic algorithm when compared with POW3, a state of the art state assign-ment algorithms for low power dissipation. Additionally, our experiments suggest that no current stateassignment algorithm that utilizes state register switching activity as metric for power minimization isable to achieve a consistent reduction in power consumption. Therefore, we conclude that the cost metricutilized for FSM state assignment algorithms for low power dissipation should be extended to also reflectthe switching activity in the combinatorial circuit.
Laboratory : Computer Engineering
Codenumber : CE-MS-2003-11
Committee Members :
Advisor: Sorin Cotofana, CE, TU Delft
Member: Ben Juurlink, CE, TU Delft
Member: Stephan Wong, CE, TU Delft
i

ii

Contents
List of Figures v
List of Tables vii
Acknowledgments ix
1 Introduction 11.1 Research Questions . . . . . . . . . . . . . . . . . . . . . . . . . . . . . . . . 11.2 Contributions . . . . . . . . . . . . . . . . . . . . . . . . . . . . . . . . . . . 21.3 Report Overview . . . . . . . . . . . . . . . . . . . . . . . . . . . . . . . . . 3
2 Background 52.1 Power Consumption in Digital CMOS . . . . . . . . . . . . . . . . . . . . . . 52.2 Finite State Machines . . . . . . . . . . . . . . . . . . . . . . . . . . . . . . . 62.3 Design Approaches & Tools . . . . . . . . . . . . . . . . . . . . . . . . . . . 8
2.3.1 Finite State Machine synthesis . . . . . . . . . . . . . . . . . . . . . . 82.4 Terminology . . . . . . . . . . . . . . . . . . . . . . . . . . . . . . . . . . . . 92.5 State of the Art in State Encoding . . . . . . . . . . . . . . . . . . . . . . . . 10
2.5.1 POW3 . . . . . . . . . . . . . . . . . . . . . . . . . . . . . . . . . . . 112.5.2 Noth-Kolla . . . . . . . . . . . . . . . . . . . . . . . . . . . . . . . . 11
3 Profiling based FSM state assignment algorithms 133.1 Introduction . . . . . . . . . . . . . . . . . . . . . . . . . . . . . . . . . . . . 133.2 General Approach . . . . . . . . . . . . . . . . . . . . . . . . . . . . . . . . . 133.3 FSM state profiling . . . . . . . . . . . . . . . . . . . . . . . . . . . . . . . . 143.4 Loop detection . . . . . . . . . . . . . . . . . . . . . . . . . . . . . . . . . . 15
3.4.1 Examples . . . . . . . . . . . . . . . . . . . . . . . . . . . . . . . . . 163.5 Loop-based FSM state assignment algorithms . . . . . . . . . . . . . . . . . . 20
3.5.1 Basic FSM state assignment algorithm . . . . . . . . . . . . . . . . . . 213.5.2 Loop-based DFS state assignment algorithm . . . . . . . . . . . . . . 243.5.3 Loop-based heuristic state assignment algorithm . . . . . . . . . . . . 263.5.4 Optimized loop-based heuristic state assignment algorithm . . . . . . . 283.5.5 Example . . . . . . . . . . . . . . . . . . . . . . . . . . . . . . . . . 30
3.6 Implementation . . . . . . . . . . . . . . . . . . . . . . . . . . . . . . . . . . 323.6.1 FSM data structures . . . . . . . . . . . . . . . . . . . . . . . . . . . 333.6.2 Loop data structures . . . . . . . . . . . . . . . . . . . . . . . . . . . 333.6.3 Functions . . . . . . . . . . . . . . . . . . . . . . . . . . . . . . . . . 33
iii

4 Experimental Results 374.1 Introduction . . . . . . . . . . . . . . . . . . . . . . . . . . . . . . . . . . . . 374.2 Method . . . . . . . . . . . . . . . . . . . . . . . . . . . . . . . . . . . . . . 37
4.2.1 Setup . . . . . . . . . . . . . . . . . . . . . . . . . . . . . . . . . . . 384.2.2 FSM Profiling and State Assignment . . . . . . . . . . . . . . . . . . . 404.2.3 Circuit Synthesis . . . . . . . . . . . . . . . . . . . . . . . . . . . . . 404.2.4 Simulation . . . . . . . . . . . . . . . . . . . . . . . . . . . . . . . . 40
4.3 Benchmarks . . . . . . . . . . . . . . . . . . . . . . . . . . . . . . . . . . . . 414.4 Results . . . . . . . . . . . . . . . . . . . . . . . . . . . . . . . . . . . . . . . 43
4.4.1 DFS . . . . . . . . . . . . . . . . . . . . . . . . . . . . . . . . . . . . 434.4.2 Loop-based DFS . . . . . . . . . . . . . . . . . . . . . . . . . . . . . 454.4.3 Loop-based Heuristic . . . . . . . . . . . . . . . . . . . . . . . . . . . 464.4.4 Profiling-based POW3 . . . . . . . . . . . . . . . . . . . . . . . . . . 494.4.5 Noth e.a. . . . . . . . . . . . . . . . . . . . . . . . . . . . . . . . . . 504.4.6 Pow3 . . . . . . . . . . . . . . . . . . . . . . . . . . . . . . . . . . . 524.4.7 Jedi . . . . . . . . . . . . . . . . . . . . . . . . . . . . . . . . . . . . 534.4.8 Comparison . . . . . . . . . . . . . . . . . . . . . . . . . . . . . . . . 54
5 Conclusions 595.1 Summary . . . . . . . . . . . . . . . . . . . . . . . . . . . . . . . . . . . . . 595.2 Main contributions . . . . . . . . . . . . . . . . . . . . . . . . . . . . . . . . 615.3 Future work . . . . . . . . . . . . . . . . . . . . . . . . . . . . . . . . . . . . 62
Bibliography 63
iv

List of Figures
2.1 A CMOS inverter with current flows. . . . . . . . . . . . . . . . . . . . . . . . 62.2 Finite State Machine . . . . . . . . . . . . . . . . . . . . . . . . . . . . . . . 7
3.1 FSM state profiling and loop detection . . . . . . . . . . . . . . . . . . . . . . 143.2 FSM with sequential loops . . . . . . . . . . . . . . . . . . . . . . . . . . . . 173.3 FSM with nested loops . . . . . . . . . . . . . . . . . . . . . . . . . . . . . . 183.4 FSM with intersecting loops . . . . . . . . . . . . . . . . . . . . . . . . . . . 193.5 FSM BBTAS: KISS description (left) and State Transition Graph . . . . . . . . 313.6 FSM data structures . . . . . . . . . . . . . . . . . . . . . . . . . . . . . . . . 333.7 Loop data structures . . . . . . . . . . . . . . . . . . . . . . . . . . . . . . . . 34
4.1 Experimental method . . . . . . . . . . . . . . . . . . . . . . . . . . . . . . . 384.2 Setup step . . . . . . . . . . . . . . . . . . . . . . . . . . . . . . . . . . . . . 39
v

vi
List of Tables
3.1 Iterations of Algorithm 2 for sequential loops . . . . . . . . . . . . . . . . . . 173.2 Iterations of Algorithm 2 for nested loops . . . . . . . . . . . . . . . . . . . . 183.3 Iterations of Algorithm 2 for intersecting loops . . . . . . . . . . . . . . . . . 19
4.1 Benchmarks Statistics . . . . . . . . . . . . . . . . . . . . . . . . . . . . . . . 414.2 DFS average switching activity . . . . . . . . . . . . . . . . . . . . . . . . . . 434.3 Loop-based DFS average switching activity . . . . . . . . . . . . . . . . . . . 454.4 Loop-based Heuristic average switching activity . . . . . . . . . . . . . . . . . 464.5 Loop-based Dynamic Latch-allocation Heuristic average switching activity . . 484.6 Profiling-based Pow3 average switching activity . . . . . . . . . . . . . . . . . 494.7 Noth e.a. average switching activity . . . . . . . . . . . . . . . . . . . . . . . 504.8 Pow3 average switching activity . . . . . . . . . . . . . . . . . . . . . . . . . 524.9 Jedi average switching activity . . . . . . . . . . . . . . . . . . . . . . . . . . 534.10 Overall state register switching activity . . . . . . . . . . . . . . . . . . . . . . 554.11 Overall circuit switching activity . . . . . . . . . . . . . . . . . . . . . . . . . 57
vii

viii
Acknowledgments
First of all, I would like to thank professor Stamatis Vassiliadis for providing me with the chanceto graduate at the Computer Engineering department. Furthermore, I would like to thank my su-pervisor, professor Sorin Cotofana, for his patience, and acknowledge his efforts to successfullyfinish this project. Finally, I would like to acknowledge the understanding, support and advice Ireceived from all CE members, my colleagues, friends, and last but not least, my family. Withoutyou, this thesis would not have become what it is know.
Robbert EggermontDelft, The NetherlandsAugust 29, 2003
ix

x
Introduction
With the increase in speed, mobility and miniaturization of current electronic products, the powerconsumption of these products has become a major design factor. Especially for mobile devices,the power consumption determines the battery life-time, the generated heat and the required heatdispersion measures. Therefore, the designers and consumers of electronic devices, as well asenvironmental considerations, demand a reduction in the power dissipation of digital circuits.
Digital circuits consists of a number of interconnected logic gates which together perform afunction on one of more input signals. Every time an input signal changes, the change propagatesvia the gates through the circuit, causing signal switching activity in every place where the signalpropagates to. This signal switching activity causes a current to charge or discharge the capaci-tive load of CMOS gates, which results in power dissipation. This power dissipation depends onthe CMOS fabrication technology, operating frequency, but most of all on the switching activityper clock cycle within the digital circuit.
Current integrated circuits (ICs) are designed to perform a large number of complex func-tions. To ensure the correct (inter)operation of the functions, control logic is needed to managethe functions. This control logic is often implemented as a finite state machine (FSM), whichkeeps track of the “state” the IC is in using a state register. The (control) output of the FSMdepends on the state it is in.
To implement an FSM in a digital circuit, the states of the FSM need to be assigned uniquebinary codes to represent the states in the state register. The encoding of the states determinesthe logic functions which operate on the state register, therefore the encoding determines theswitching activity, and thus the power dissipation, in the FSM and the entire circuit.
This thesis addresses the state assignment of FSMs for low power dissipation. A novel stateassignment approach is proposed and evaluated that uses FSM profiling data to assign states forlower switching activity.
1.1 Research Questions
With computer programs, in order to create faster programs, profiling is used to find the sectionsof code the program spends most of it’s cycles in. Often this code will be one or more loopsthat gets executed repeatedly. The largest performance gain can be achieved by optimizing theinstructions in the most executed loops.
Similarly, most FSMs are designed to run one or more fixed sequences of states over andover again, returning to a certain “default” state when one sequence is completed to wait for thenext task. Therefore, these FSMs contain loops: one for each (sub)task. Along the lines of theprogram profiling above, one might theorize that the most effective way to optimize an FSMstate assignment for low power dissipation is to perform an FSM profiling, and detect the loopsthat contribute the most to the FSM’s power dissipation. Then, assign the states of those loopsin a way that reduces the power dissipation of the FSM.
1

2 CHAPTER 1. INTRODUCTION
Current state assignment algorithms for low power dissipation use static FSM descriptions toperform the state assignment on. In this thesis we propose a novel method that utilizes dynamicinformation, extracted from FSM profiling data. Therefore, the first question we have to addressis: �
What kind of loops are of interest, and how can we detect these loops?
As the main goal of our research is to find an FSM state assignment approach for low powerdissipation, the main research question can be formulated as follows:�
How can we use the loop information to assign the states of an FSM most optimally inorder to reduce the power dissipation?
And the final question to be answered is:�How does the performance of our profiling, loop-based state assignment approach com-pare to that of current state of the art state assignment algorithms for low power dissipa-tion?
1.2 Contributions
This report presents the results of our investigation related to the research questions stated in theprevious section. In particular, the main contributions can be summarized as follows:�
We present a novel loop-based profiling FSM state assignment approach for low powerdissipation.�We propose a loop detection algorithm.�We propose three loop-based FSM state assignment algorithms that minimizes the powerdissipation of the FSM:
– DFS performs an exhaustive search of all possible encodings of the FSM, and usesthe loop data to estimate the cost of an encoding.
– Loop-based DFS performs a similar search on a loop-by-loop basis, in descending-weight order of the loops.
– Heuristic encodes the states indicidually, on a loop-by-loop basis in descending or-der of weight.
In order to evaluate the efficiency of our proposal we compared our approach with other state ofthe art FSM state assignment methods. Our experimental results indicate the following:�
For fixed width state registers, our heuristic state assignment approach shows an 8% re-duction in average state register switching activity when compared to the power-basedPOW3 [1] algorithm, and a 41% reduction when compared to the area-based JEDI [4]algorithm.

1.3. REPORT OVERVIEW 3�
The variable state register width Noth and Kolla algorithm [6], although it requires a largerstate register, then more area, achieves a 6% reduction when compared with our fixedwidth heuristic. This suggests that state algorithms for low power dissipation should usea variable state register width approach to achieve the largest possible reduction in stateregister switching activity. Our preliminary Dynamic Heuristic is at a too early stage ofdevelopment to be able to match the results of Noth and Kolla’s algorithm.�Our experiments indicate that no current state assignment algorithm that utilizes state reg-ister switching activity as metric for power minimization is able to achieve a consistentreduction in power consumption. This clearly suggests that the switching activity in thestate register only is not a suitable metric to reduce the power consumption in FSMs. In-stead, a metric should be used that also reflects the switching activity in the combinatorialcircuit.
1.3 Report Overview
This thesis is organized as follows:�In Chapter 2 we present the general problem of state assignment for low power dissipation.We introduce the FSM and state assignment terminology and give a short overview of thestate of the art state assignment algorithms.�In Chapter 3 we present the profiling, loop detection and state assignment algorithms, aswell as some examples.�In Chapter 4 we describe the method used to compare the different algorithms, and com-pare our state assignment approaches to other current algorithms.�In Chapter 5 we present the conclusions of our work described in this thesis.

4 CHAPTER 1. INTRODUCTION

Background
In the introduction we defined the main goal of our research: finite state machine (FSM) stateassignment for low power dissipation. In this chapter, we first discuss the general considerationsfor power consumption in digital circuits. Next, we introduce the finite state machine, in theoryand as a digital circuit, and the process of FSM state assignment. Following this, we describethe general FSM design approach from model to circuit, including the evaluation of an FSM’spower dissipation. Then, we explain the terminology used in FSM state assignment. Finally,we discuss the history of state assignment algorithm, and we describe two state of the art stateassignment algorithms for low power dissipation.
2.1 Power Consumption in Digital CMOS
Complimentary metal oxide semiconductor (CMOS) is at the moment the most widely usedtechnology for the digital integrated circuits (ICs) that are present in all digital electronic equip-ment. One of the main reasons CMOS is the dominant logic style in use today is it’s lack of staticpower consumption. CMOS logic cells consist of complementary NMOS and PMOS transistorpairs, which belong to the family of MOS field-effect transistors. These transistors have a veryhigh input impedance ( ��������� Ohm), which is capacitive. In steady state, CMOS has importantadvantages over other technologies:�
Because of the high input impedance, virtually no current is running from the output ofone gate to the input of the next gate.�Of the PMOS and NMOS transistor pairs between supply and ground, only one transistorof each pair is conducting. Thus, there is no conducting path between supply and ground,and there is no current flow.
Therefore, the static power consumption, caused by leakage currents related to the fabricationtechnology, is minimal ( �� � nW/gate at 5V supply voltage).
In contrast to the minimal steady state power consumption, CMOS-technology can have asignificant dynamic power consumption (as much as 100 Watt for a modern microprocessor with42 million transistors). The dynamic power consumption of a CMOS-based digital IC is madeup of three main components, as shown in the following equation:
�������������������� �!"�$#%��&����('�)*�+ ,&.-0/0#213�4�$/��657�$#8)*��9;:0��<=��'>:(2.1)
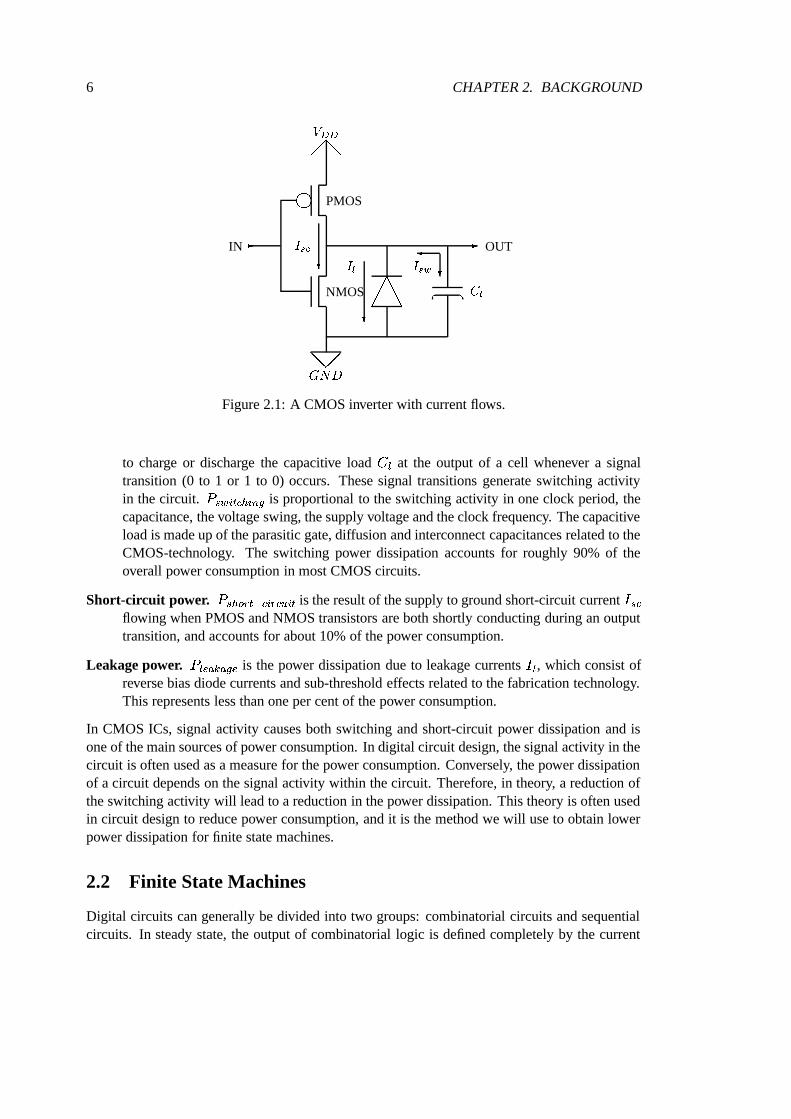
Figure 2.1 shows a CMOS inverter with the current flows that result in these power con-sumption components:
Switching or capacitive power.�? 4!"��#%�4&����('
represents the signal-switching related componentof the power consumption. This power consumption is caused by the current @ 4! needed
5
6 CHAPTER 2. BACKGROUND
���� ������
�PMOS
�IN � OUT
NMOS
���� �� �
����� � � � ����
������
�
� � � ������
Figure 2.1: A CMOS inverter with current flows.
to charge or discharge the capacitive load � 9 at the output of a cell whenever a signaltransition (0 to 1 or 1 to 0) occurs. These signal transitions generate switching activityin the circuit.
� 4!"��#%�4&����('is proportional to the switching activity in one clock period, the
capacitance, the voltage swing, the supply voltage and the clock frequency. The capacitiveload is made up of the parasitic gate, diffusion and interconnect capacitances related to theCMOS-technology. The switching power dissipation accounts for roughly 90% of theoverall power consumption in most CMOS circuits.
Short-circuit power.� ,&.-0/0#213�4�$/��657�$#
is the result of the supply to ground short-circuit current @ ��flowing when PMOS and NMOS transistors are both shortly conducting during an outputtransition, and accounts for about 10% of the power consumption.
Leakage power.�+9;:0��<=��'�:
is the power dissipation due to leakage currents @ 9 , which consist ofreverse bias diode currents and sub-threshold effects related to the fabrication technology.This represents less than one per cent of the power consumption.
In CMOS ICs, signal activity causes both switching and short-circuit power dissipation and isone of the main sources of power consumption. In digital circuit design, the signal activity in thecircuit is often used as a measure for the power consumption. Conversely, the power dissipationof a circuit depends on the signal activity within the circuit. Therefore, in theory, a reduction ofthe switching activity will lead to a reduction in the power dissipation. This theory is often usedin circuit design to reduce power consumption, and it is the method we will use to obtain lowerpower dissipation for finite state machines.
2.2 Finite State Machines
Digital circuits can generally be divided into two groups: combinatorial circuits and sequentialcircuits. In steady state, the output of combinatorial logic is defined completely by the current

2.2. FINITE STATE MACHINES 7
�iCombinatorial Logic
� o
State Register
�s
�s’
Figure 2.2: Finite State Machine
input. No combination of input signals can have more than one resulting combination of outputsignals. Sequential circuits, on the other hand, have at least one combination of input signalsthat has more than one possible combination of output signals. The output is not defined solelyby the current input, but also by the “state” the circuit is in. The state of the sequential circuit isdetermined by the state of one or more latches, also known as a register. Sequential circuits areideal for control functions, and are found in many digital circuits, from traffic light-controllersto microprocessors.
One way to describe sequential circuits is a Finite State Machine (FSM) model. An FSMis a computational model consisting of a (finite) set of states � , a set of input vectors @ , a setof output vectors � , and two functions � and � - . Each FSM state has zero or more transitionsto itself or other states. The transition function � ���� ����@�� � ��� maps the current state andinput vector � to the next state �� . The output transition function maps the current state (Mooremachine; � -���� ���� � ��� ) or the transition (Mealy machine; � -���� ����@�� � ��� ) to the outputvector � . A special case of the Moore machine, where the output vector resembles the statevector, is called the Medvedev machine.
An FSM sequential circuit consists of two distinct, but strongly related, parts (see Fig-ure 2.2):�
the state register, which defines the current state the circuit is in, and�the combinatorial logic, that computes the next state and output vector based on the currentstate and input vector according to � � and � � .
When the FSM changes state, or the input vector changes, the combinatorial logic computes thenew state and output vector. On the next clock-cycle, the state register stores the new state value.
Each state of the FSM needs to have a unique representation in the state register in order forthe combinatorial logic to be able to determine the correct state transition. For a binary circuit,the number of states �� ��������� in the FSM forces the width, or the number of bits �� !�"�� , of thestate register, to be at least �� !�"�� �$#&% �('�)��� ��������� �* . The maximum width of the state registeris only limited by the available chip area. The available number of unique codes ��+,�.-/�( forthe states is ��+,�.-/�( � �10�2 ��# . A state can be assigned every code, as long as the assignment isunique. If ��+3�.-4�� is larger than �� ��������� , some codes will be left unused.
The binary codes of the states determine the structure of the combinatorial logic. Thus, thestate assignment influences the area requirements (circuit size) and power consumption (switch-ing activity) of the resulting circuit. Ideally, both area requirements and power consumption

8 CHAPTER 2. BACKGROUND
should be minimized. However, the size of the logic and its switching activity are related, soa trade off is needed. For low-power designs, the state assignment algorithms minimize theswitching activity.
In this thesis, we consider the minimization of the power consumption only. More in partic-ular, we investigate FSM state assignment algorithms that utilize the switching activity withinthe state register as a measure of the entire FSM power consumption.
2.3 Design Approaches & Tools
Current integrated circuits consists of millions of transistors wired together to form digital func-tion. These circuits are so complex, that it is no longer possible to design them solely on tran-sistor, or even on (logic) gate level. Instead, these circuits are designed using Computer-AidedDesign (CAD) tools, which synthesize the circuit from a high-level description. A typical designtrajectory for an integrated circuit usually follows the following path:
High-level description The designer uses a hardware description language (HDL) to model thestructure or behavior of a circuit:�
Combinatorial logic can be expressed as truth tables or logic equations of Booleanfunctions.
�Sequential circuits can be described as finite-state machines or state transitiongraphs.
Logic synthesis The HDL model is transformed into a gate-level implementation.
Logic simulation The gate-level implementation is simulated to verify the correctness of thedigital model.
Layout The gates are placed onto a chip-layout, and connections are routed.
Layout simulation The circuit is extracted from the chip-layout, and simulated to verify theworking of the actual implementation.
The purpose of this project is to devise an FSM state assignment algorithm, which takes anFSM description and assigns binary codes to every possible state of the FSM. This places ouralgorithm between the high-level description and the logic synthesis. However, to determinethe power dissipation of the FSM encoding, we need to synthesize and simulate the gate-level(logic) implementation. For the logic synthesis of the FSMs we use the existing synthesis systemSIS [2]. The implementation is then simulated using the MERCURY simulator from the StanfordOlympus Synthesis System [5] to determine the switching activity.
2.3.1 Finite State Machine synthesis
The synthesis system transforms a high level FSM description in several steps into a gate-levelimplementation. During this transformation the system applies optimizations according to acost-function specified by the designer, such as chip area, latency or power consumption. Thesynthesis path for an FSM typically consists of the following steps:

2.4. TERMINOLOGY 9�
State assignment: the symbolic states of the FSM description are assigned binary codes.�Logic synthesis: the FSM description is translated into logic functions for the state transi-tions and the output signals.�Technology mapping: the logic functions are rewritten to use only the logic gates availableto the target chip technology.
The SIS synthesis system incorporates the JEDI [4] and NOVA [8] state assignment programs,logic synthesis tools, technology mapping including several example libraries of gates, and alarge number of optimization routines. For the experiments, our state assignment approach willperform the first step, and SIS finishes the synthesis.
2.4 Terminology
Before presenting the state assignment algorithms, we briefly describe the terminology utilizedin the description of the state assignment algorithms.
State register The set of latches whose values determine the FSM state in a logic circuit. Eachlatch can have two possible values, high logic level (one) or low logic level (zero).
FSM state assignment The process which assigns to each state a unique binary code to rep-resent that state in the state register. The code is the logic level equivalent of the state’sname or number in the FSM model description. Each latch corresponds to one bit, so thenumber of bits in a state’s code must match the number of latches in the state register.
Encoding A set of codes for all FSM states. An FSM has many different possible encodings.
Hamming distance The number of bits that differ between the codes + � and +�� , correspondingto the states � and � : � � � � � � � � ����� � � + ��� + � � .
Switching activity The level switching of signals within a logic circuit, triggered by a changein the input vector or state register. The state register switching activity reflects the bitsthat differ between successive states, and can therefore be calculated using the Hammingdistance between the states.
Cost metric The measure utilized by the state assignment algorithm to determine the successof a state assignment. In our FSM state assignment approach the cost metric is (an esti-mate of) the state register switching activity based upon the FSM profiling data. Lowerswitching activity equals lower cost, thus a better solution.
FSM state profiling The process of collecting a state register trace from the FSM during a runwith a relevant input vector data set, consisting of a sequence of input vectors.
State register trace The sequence of states that the FSM has been in during the FSM stateprofiling.
Loop A sequence of states within the state trace that forms a cycle, i.e., at the end of the se-quence of states the FSM returns to the first state of the sequence. A loop has the followingproperties:
10 CHAPTER 2. BACKGROUND�
it consists of multiple (different) states,�
it can be entered through any of the states,�
it has a specific order in which the states occur, and�
it is exited from the same state through which it was entered.
Simple loop A sequence of states containing only one loop, i.e., each state occurs only oncewithin the sequence.
Nested loop A sequence of states featuring one or more inner loops within one or more outerloops. With nested loops, the FSM first enters the outer loop. At a certain state in the outerloop, the FSM enters an inner loop. When the inner loop is completed, the FSM returns tothe same state in the outer loop, and completes the outer loop. The inner and outer loopsare separate entities, i.e., when the inner loop is removed from the state trace, the outerloop does not change.
Frequency The number of occurrences of states, transitions, or loops in the trace.
Loop weight A value specifying the impact of the state assignment of the states in that loop onthe cost of the complete FSM assignment. In our state assignment algorithms, the weightdepends on the loop’s frequency, and in some cases the number of states in the loop.
2.5 State of the Art in State Encoding
In the beginning of ICs, FSMs were small, i.e., they had few states. Computers where hard tocome by, costly and very slow, therefore state assignment was done by hand. One of earliestalgorithms used was the One Hot encoding, where each state code has exactly one high (hot) bit.Consequently, the size of the state register needs to be equal to the number of states. Becauseevery two state encodings differ in exactly two places, the ones, One Hot encoding guaranteesa fixed two bit switching activity in the state register for each transition. Although this methodis favorable for an FSM’s power consumption, the area required by the state register prohibits ituse for the large real-life FSMs used nowadays.
As the FSMs grew larger and computers became available to synthesize the combinatoriallogic, the main concern became the area that the FSM circuit occupied on chip. Algorithms likeJEDI [4] and NOVA [8] assign codes with the least possible number of bits (and thus the smalleststate register) in such a way that the combinatorial logic network is minimized. Furthermore, thealgorithms are able to reduce the switching activity to one bit for some of the transitions.
Recently, IC power dissipation has become a concern, while logic area has become less of aproblem due to smaller transistor sizes. Therefore, current state assignment algorithms attemptto minimize the switching activity, and thus reduce the power dissipation, in the circuit. Theideal result is an FSM encoding whereby, for each state transition to every possible state, onlyone bit switches in the state register. Such an encoding is called a Gray code. However, mosttimes such a solution is not possible, and advanced algorithms try to find a solution with themost optimal encoding, in terms of switching activity, possible. Up to now, most sophisticatedstate assignment algorithms utilize static state transition probabilities to target switching activity.Two such algorithms have been proposed: POW3 [1] and Noth and Kolla’s Spanning Tree Basedalgorithm [6].

2.5. STATE OF THE ART IN STATE ENCODING 11
2.5.1 POW3
The POW3 [1] state assignment algorithm for low power dissipation, by Luca Benini and G.De Michelli, targets the reduction of switching activity in the state register during state transi-tions. The algorithm utilizes a probabilistic description of the FSMs, and minimizes the Booleandistance between the codes of states with a high transition probability. The Greedy heuristicalgorithm assigns state codes bit by bit, and attempts to give states with a high transition proba-bility the same bit value. If one of the states’ bit is already assigned, the other state will receivethe same bit value. The algorithm takes into account the constraints on bit assignments posed bythe requirement for unique state codes. The heuristic uses a cost function based on the weightedsum of the Hamming distance between state codes.
2.5.2 Noth-Kolla
Winfried Noth and Reiner Kolla [6] propose a spanning tree based state encoding which also usesstate transition possibilities. The FSM state transition graph is transformed into an undirectedgraph, and each edge is assigned a weight corresponding to the state transition probabilities.Using a modified version of Prim’s algorithm [7], a maximum spanning tree is constructed fromthis graph. The state assignment problem is formulated as an embedding of the spanning treeinto a Boolean hypercube. Two algorithms are proposed, a fast embedding algorithm, and aGreedy embedding algorithm.
The fast embedding algorithm chooses an edge which separates the tree into two evenly sizedsubtrees. The edge is mapped onto an edge of the hypercube, and the states that are connectedthrough that edge are mapped to the corresponding nodes. Then, the algorithm recursively pro-cess the two subtrees. When all states are assigned to nodes, the nodes are assigned codes insuch a way, that the codes of two nodes that are connected by an edge will differ in exactly onebit position.
The Greedy embedding algorithm expands the fast algorithm by a Greedy selection proce-dure for the hypercube edge to which a graph edge is mapped. For this, the algorithm takes intoaccount the nodes that are already assigned. If one of the states of the edge is already assigned toa node, the algorithm calculates the cost for the assignment of the unassigned state to a node onthe other side of a free edge. This cost is a function from the Hamming distance and transitionprobability of all assigned edges connected to the free node. The state is assigned to the nodewith the lowest cost.
The state assignment approach we propose resembles the current state assignment algorithmsin the fact that it uses a cost function based upon the Hamming distance between connectedstates. However, the approach differs from the current state assignment algorithms in the factthat it utilizes profiling info and does not rely on state transition probabilities. The next chapterpresents our proposed state assignment approach in detail.

12 CHAPTER 2. BACKGROUND

Profiling based FSM stateassignment algorithms
3.1 Introduction
Until now, finite state machine (FSM) state assignment for low power dissipation was mostlybased on the static FSM description (POW3[1], Noth et.al.[6], JEDI[4], NOVA[8]). This does nottake into consideration an important aspect of the behavior of an FSM, the interaction betweenthe FSM and the outside world.
In this chapter we propose an FSM state assignment approach based on dynamic FSM stateprofiling. The profiling data allows us to identify the most frequently executed states or se-quences of states within the FSM. More specifically, our approach targets frequently executedcycles of states, or loops. We introduce several state assignment algorithms that utilize thisprofiling data to minimize the power dissipation of the FSMs.
The outline of the chapter is as follows: We start by describing the general approach, and anexplanation of the utilized terminology. Section 3.3 discusses the concept and implementation ofFSM state profiling, followed by the proposed loop detection algorithm in Section 3.4. Finally,in Section 3.5 we present a number of state assignment heuristics.
3.2 General Approach
We present a general approach to FSM state assignment based on dynamic FSM state profilingdata. The main goal of this method is to minimize the switching activity within the FSM stateregister in an attempt to lower power dissipation. This approach is based on the idea that theoperation of many FSMs consists of recurring cycles (loops) of the same states, and the FSMsspend most of their time walking through these loops. Therefore, the state assignments of thestates in these loops have the largest impact on the overall switching activity in the FSM stateregister, and by targeting these loops with our state assignment algorithm the largest reductionin switching activity can potentially be realized.
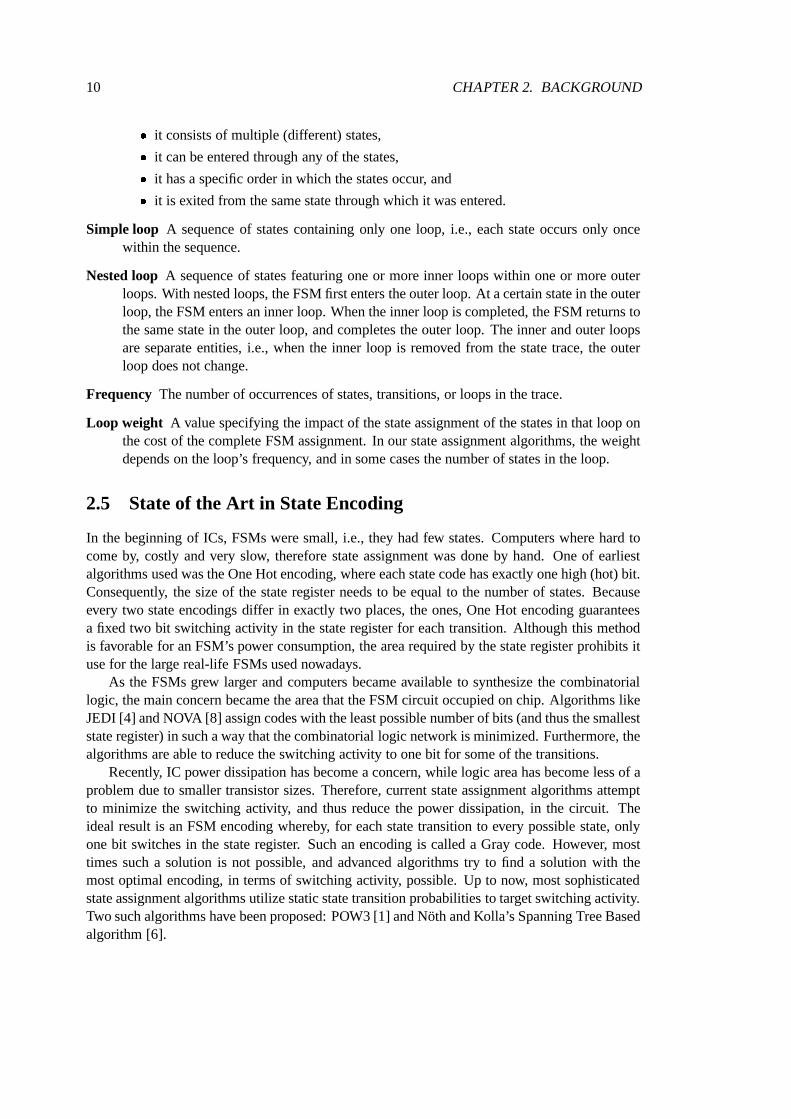
The approach can be divided into the following three steps:
1. FSM state profiling collects information about the dynamic behavior of the FSM. A (sim-ulated) FSM run under a relevant input data set generates an FSM state register trace, andfrom this trace, state and transition statistics are collected.
2. Loop detection searches for loops in the state trace. Loops are identified by the repeatedoccurrence of the same state in the trace, and each discovered loop is stored and countedto obtain the frequency of the loops.
3. FSM state assignment assigns each state of the FSM a unique code (bit vector) to repre-sent it in the state register. The data gathered in the first two steps are utilized to minimizethe switching activity in the FSM state register.
13
14 CHAPTER 3. PROFILING BASED FSM STATE ASSIGNMENT ALGORITHMS
� �� �
Inputset
� SimulateFSM
� � �� �
Statetrace
� Findloops
� � �� �Loops
Figure 3.1: FSM state profiling and loop detection
A successful execution of these steps requires an FSM description and a relevant input vectordata set and results in a valid encoding for all states of the FSM, which attempts to minimize theswitching activity of the FSM for the given input data set. The rest of this chapter describes thedifferent steps in detail.
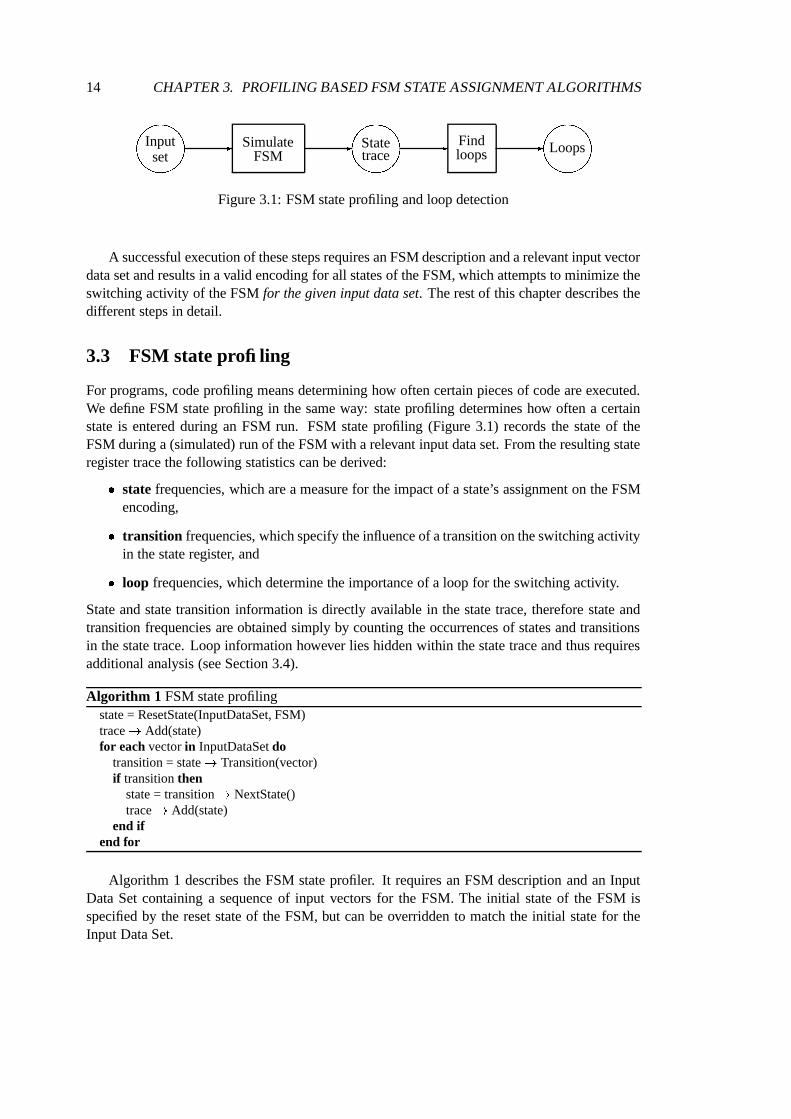
3.3 FSM state profiling
For programs, code profiling means determining how often certain pieces of code are executed.We define FSM state profiling in the same way: state profiling determines how often a certainstate is entered during an FSM run. FSM state profiling (Figure 3.1) records the state of theFSM during a (simulated) run of the FSM with a relevant input data set. From the resulting stateregister trace the following statistics can be derived:�
state frequencies, which are a measure for the impact of a state’s assignment on the FSMencoding,�transition frequencies, which specify the influence of a transition on the switching activityin the state register, and�loop frequencies, which determine the importance of a loop for the switching activity.
State and state transition information is directly available in the state trace, therefore state andtransition frequencies are obtained simply by counting the occurrences of states and transitionsin the state trace. Loop information however lies hidden within the state trace and thus requiresadditional analysis (see Section 3.4).
Algorithm 1 FSM state profilingstate = ResetState(InputDataSet, FSM)trace � Add(state)for each vector in InputDataSet do
transition = state � Transition(vector)if transition then
state = transition � NextState()trace � Add(state)
end ifend for
Algorithm 1 describes the FSM state profiler. It requires an FSM description and an InputData Set containing a sequence of input vectors for the FSM. The initial state of the FSM isspecified by the reset state of the FSM, but can be overridden to match the initial state for theInput Data Set.

3.4. LOOP DETECTION 15
The algorithm simulates the FSM run by repeatedly matching an input vector to the possibletransitions of the state the FSM is in. If a match is found, the FSM state is changed to thedestination state of the transition, and that state is added to the state trace. If no match is found,the FSM is assumed to remain in the same state.
For the cause of reducing the switching activity of the FSM state register, the operations thatdo not cause a state change are irrelevant, therefore repeated entries are omitted from the statetrace.
3.4 Loop detection
FSMs consists of a finite number of states, between which the FSM switches during its operation.Unless the FSM enters a state from which no state transitions to other states are possible, it isvery likely that the FSM at some time will enter a certain state for the second time. The FSMhas no memory of its previous states, thus for the FSM there is no difference between the firstand the second time the state was entered, and the FSM has in effect looped back to this state.We call the cycle, formed by the sequence of states from the first occurrence of a state (up) tothe second occurrence of that same state, an FSM state loop.
FSM loops can be nested, i.e., an outer loop can contain one or more inner loops. Severalstrategies can be followed to count nested loops:
1. count the complete set of nested loops as one, or
2. count every subset of the outermost loop that is itself a loop, or
3. count each simple (inner or outer) loop separately.
Our FSM state assignment approach attempts to lower the FSM’s power dissipation by reducingthe state register switching activity. Conflicting state sequences between loops inhibit an optimalencoding of all loops, therefore the best results are obtained by assuring that at least the loopsthat contribute the most to the overall state register switching activity are encoded optimally.This contribution, or weight, is a function of the loop’s frequency. Thus, our approach is mostsuccessful for FSMs that feature a small number of loops with a significantly higher frequencythan the other loops.
The first strategy counts only the sets of nested loops. However, unless the inner loops areexecuted in exactly the same way every time the outermost loop is executed, most detected loopswill not be duplicates. Therefore this strategy most likely finds only a large number of lowfrequency loops, which makes it unsuitable for our approach.
The second and the third strategy count all loops separately, whereby the second strategycounts loops both separately, and in all possible nested forms. The most probable highest fre-quency loop is a simple loop, because a simple loop occurs at least as often as any nested loopit is a part of. If a simple loop occurs in more than one nested loop, the simple loop will havethe combined frequency of the nested loops. Both strategies will correctly find all simple loops,and are therefore functionally equivalent for simple loops. If the loop with the highest frequencyis a nested loop, the third strategy will only find the simple loops it consists of. However, thesesimple loops will have the same frequency as the nested loop. During the state assignment, thesesimple loops will all be assigned before any lower frequency loops, just like the nested loop.
16 CHAPTER 3. PROFILING BASED FSM STATE ASSIGNMENT ALGORITHMS
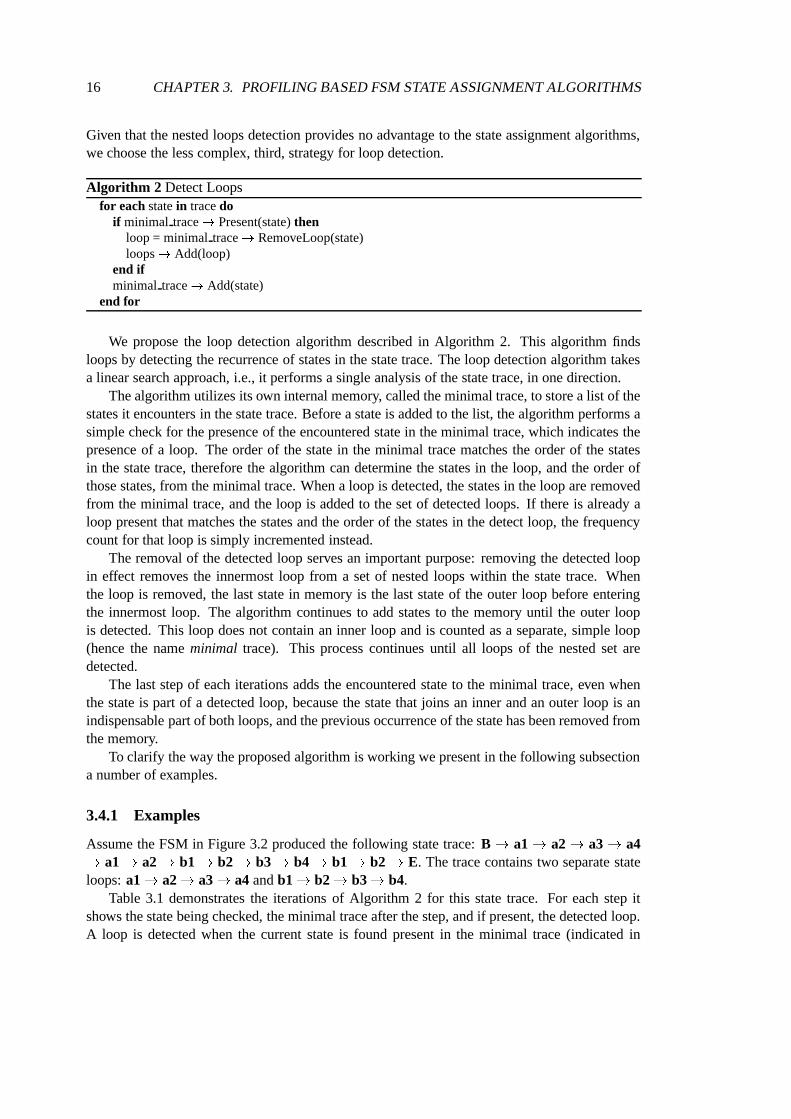
Given that the nested loops detection provides no advantage to the state assignment algorithms,we choose the less complex, third, strategy for loop detection.
Algorithm 2 Detect Loopsfor each state in trace do
if minimal trace � Present(state) thenloop = minimal trace � RemoveLoop(state)loops � Add(loop)
end ifminimal trace � Add(state)
end for
We propose the loop detection algorithm described in Algorithm 2. This algorithm findsloops by detecting the recurrence of states in the state trace. The loop detection algorithm takesa linear search approach, i.e., it performs a single analysis of the state trace, in one direction.
The algorithm utilizes its own internal memory, called the minimal trace, to store a list of thestates it encounters in the state trace. Before a state is added to the list, the algorithm performs asimple check for the presence of the encountered state in the minimal trace, which indicates thepresence of a loop. The order of the state in the minimal trace matches the order of the statesin the state trace, therefore the algorithm can determine the states in the loop, and the order ofthose states, from the minimal trace. When a loop is detected, the states in the loop are removedfrom the minimal trace, and the loop is added to the set of detected loops. If there is already aloop present that matches the states and the order of the states in the detect loop, the frequencycount for that loop is simply incremented instead.
The removal of the detected loop serves an important purpose: removing the detected loopin effect removes the innermost loop from a set of nested loops within the state trace. Whenthe loop is removed, the last state in memory is the last state of the outer loop before enteringthe innermost loop. The algorithm continues to add states to the memory until the outer loopis detected. This loop does not contain an inner loop and is counted as a separate, simple loop(hence the name minimal trace). This process continues until all loops of the nested set aredetected.
The last step of each iterations adds the encountered state to the minimal trace, even whenthe state is part of a detected loop, because the state that joins an inner and an outer loop is anindispensable part of both loops, and the previous occurrence of the state has been removed fromthe memory.
To clarify the way the proposed algorithm is working we present in the following subsectiona number of examples.
3.4.1 Examples
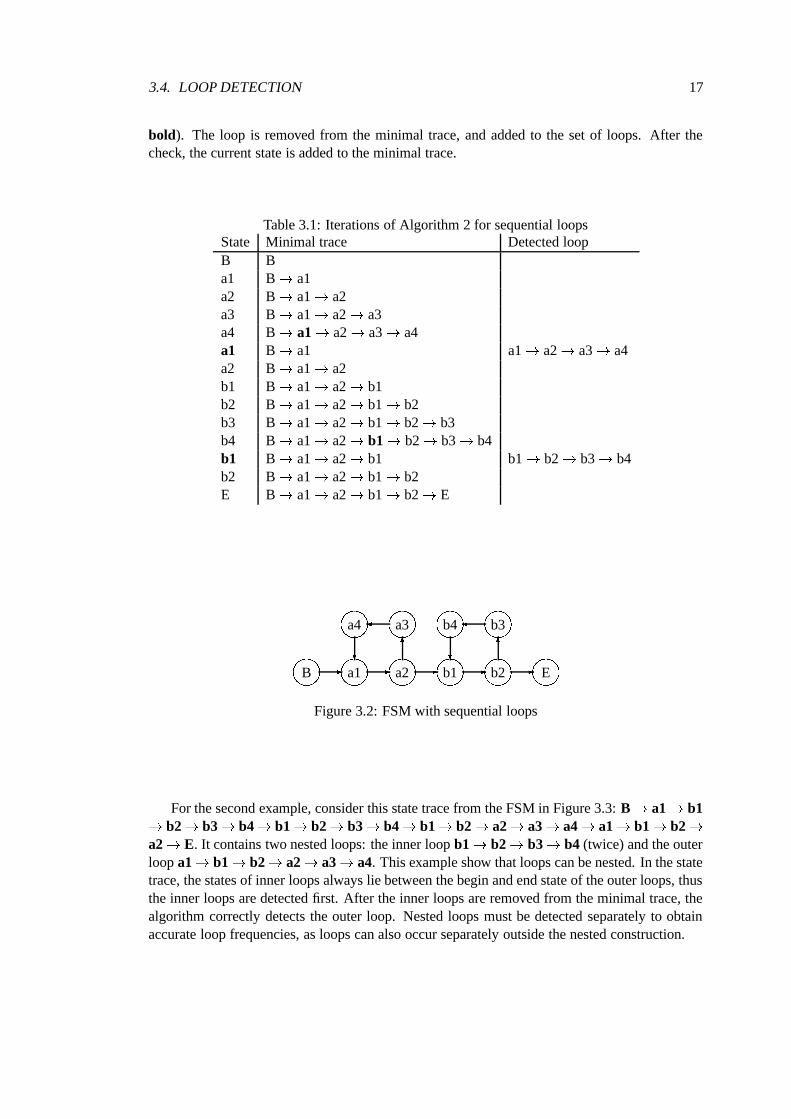
Assume the FSM in Figure 3.2 produced the following state trace: B a1 a2 a3 a4 a1 a2 b1 b2 b3 b4 b1 b2 E. The trace contains two separate stateloops: a1 a2 a3 a4 and b1 b2 b3 b4.
Table 3.1 demonstrates the iterations of Algorithm 2 for this state trace. For each step itshows the state being checked, the minimal trace after the step, and if present, the detected loop.A loop is detected when the current state is found present in the minimal trace (indicated in
3.4. LOOP DETECTION 17
bold). The loop is removed from the minimal trace, and added to the set of loops. After thecheck, the current state is added to the minimal trace.
Table 3.1: Iterations of Algorithm 2 for sequential loopsState Minimal trace Detected loopB Ba1 B a1a2 B a1 a2a3 B a1 a2 a3a4 B a1 a2 a3 a4a1 B a1 a1 a2 a3 a4a2 B a1 a2b1 B a1 a2 b1b2 B a1 a2 b1 b2b3 B a1 a2 b1 b2 b3b4 B a1 a2 b1 b2 b3 b4b1 B a1 a2 b1 b1 b2 b3 b4b2 B a1 a2 b1 b2E B a1 a2 b1 b2 E
������
B � ������a1 � ������a2
�������
a3�������
a4
� � ������b1 � ������b2
�������
b3�������
b4
� � ������EFigure 3.2: FSM with sequential loops
For the second example, consider this state trace from the FSM in Figure 3.3: B a1 b1 b2 b3 b4 b1 b2 b3 b4 b1 b2 a2 a3 a4 a1 b1 b2 a2 E. It contains two nested loops: the inner loop b1 b2 b3 b4 (twice) and the outerloop a1 b1 b2 a2 a3 a4. This example show that loops can be nested. In the statetrace, the states of inner loops always lie between the begin and end state of the outer loops, thusthe inner loops are detected first. After the inner loops are removed from the minimal trace, thealgorithm correctly detects the outer loop. Nested loops must be detected separately to obtainaccurate loop frequencies, as loops can also occur separately outside the nested construction.

18 CHAPTER 3. PROFILING BASED FSM STATE ASSIGNMENT ALGORITHMS
Table 3.2: Iterations of Algorithm 2 for nested loops
State Minimal trace Detected loopB Ba1 B a1b1 B a1 b1b2 B a1 b1 b2b3 B a1 b1 b2 b3b4 B a1 b1 b2 b3 b4b1 B a1 b1 b1 b2 b3 b4b2 B a1 b1 b2b3 B a1 b1 b2 b3b4 B a1 b1 b2 b3 b4b1 B a1 b1 b1 b2 b3 b4 (2nd)b2 B a1 b1 b2a2 B a1 b1 b2 a2a3 B a1 b1 b2 a2 a3a4 B a1 b1 b2 a2 a3 a4a1 B a1 a1 b1 b2 a2 a3 a4b1 B a1 b1b2 B a1 b1 b2a2 B a1 b1 b2 a2E B a1 b1 b2 a2 E
������
B � ������a1 � ������b1 � ������b2
�������
b3�������
b4
� � ������a2
�������
a3�������
a4
� � ������EFigure 3.3: FSM with nested loops
Table 3.2 illustrates that Algorithm 2 first finds the second and third occurrence of state b1,indicating the inner loop. Then, the search detects the second occurrence of state a1, markingthe outer loop.
The last example involves an FSM (Figure 3.4) state trace featuring intersecting loops: B a1 b4 b1 b2 b3 b4 b5 b6 b1 b2 b3 b4 b5 b6 b1 a2 a3 a4 a1 b4 b1 a2 E. The inner loop b1 b2 b3 b4 b5 b6 appears twice, the outer loop a1 b4 b1 a2 a3 a4 once.

3.4. LOOP DETECTION 19
Table 3.3: Iterations of Algorithm 2 for intersecting loops
State Minimal trace Detected loopB Ba1 B a1b4 B a1 b4b1 B a1 b4 b1b2 B a1 b4 b1 b2b3 B a1 b4 b1 b2 b3b4 B a1 b4 b4 b1 b2 b3b5 B a1 b4 b5b6 B a1 b4 b5 b6b1 B a1 b4 b5 b6 b1b2 B a1 b4 b5 b6 b1 b2b3 B a1 b4 b5 b6 b1 b2 b3b4 B a1 b4 b4 b5 b6 b5 B a1 b4 b5 b1 b2 b3b6 B a1 b4 b5 b6b1 B a1 b4 b5 b6 b1a2 B a1 b4 b5 b6 b1 a2a3 B a1 b4 b5 b6 b1 a2 a3a4 B a1 b4 b5 b6 b1 a2 a3 a4a1 B a1 a1 b4 b5 b6 b4 B a1 b4 b1 a2 a3 a4b1 B a1 b4 b1a2 B a1 b4 b1 a2E B a1 b4 b1 a2 E
������
B � ������a1 � ������b4 � ������b1
�������
b2�������
b3
�
�������
b5 � ������b6
�� ������a2
�������
a3�������
a4
� � ������E
Figure 3.4: FSM with intersecting loops
Table 3.3 presents the iterations of the algorithm. It detects these three loops: b4 b1 b2 b3, b4 b5 b6 b1 b2 b3 (which matches the inner loop) and a1 b4 b5

20 CHAPTER 3. PROFILING BASED FSM STATE ASSIGNMENT ALGORITHMS
b6 b1 a2 a3 a4. Although they differ from the previously specified inner and outerloops, these are all valid loops, and no loops are left undetected in the minimal trace. Therefore,this example shows that for some state traces more than one result is possible.
3.5 Loop-based FSM state assignment algorithms
The object of a state assignment algorithm is to assign a unique code (state register bit vec-tor) to every state in the FSM. There are many ways to perform an FSM state assignment, theeasiest (and probably the fastest) one just assigns an increasing binary number to the states ofthe FSM (in no particular order). While this approach results in a valid FSM state assignment,the encoding will not be optimized for any target (except for ease of assignment possibly). Wepropose several loop-based state assignment algorithms that specifically target the reduction ofFSM power dissipation.
A state assignment algorithm has a significant influence on the power dissipation of the re-sulting FSM circuit. Through the state codes, the encoding determines not only the switchingactivity in the state register, but also the structure of the combinatorial logic circuit of the FSMand its switching activity. Ideally, a state assignment algorithm for low power dissipation shouldconsider both state register and combinatorial circuit switch activity when searching for a lowpower state assignment. The state register switching activity can be determined by evaluating the(known) FSM’s state transitions, which renders it possible for the algorithm to evaluate the costof each choice for the state register switching activity. However, to be able to evaluate the com-binatorial circuit switching activity, the FSM needs to be synthesized. Synthesis is a complex,and time consuming, process, which makes it unfeasible to evaluate the cost of each choice forthe circuit switching activity. Therefore, low power state assignment algorithms consider onlythe state register switching activity.
Under our assumptions, an optimal solution of the state assignment problem is a solutionwhich results in the minimal amount of switching activity in the state register. A zero bit changein the state register leaves the FSM in the same state, therefore the minimal amount of switchingactivity for one transition is one bit change in the state register. This requires that the codesof two subsequent states differ in only one bit position, i.e., the states must have a Hammingdistance of one. Therefore, the optimal state assignment solution is a state assignment for whichthe Hamming distance for all possible state transitions is one. However, it is clear that this resultcannot be obtained if an FSM with more than two states contains a fully connected state, i.e., astate with a transition to each other state. The same is true for most FSMs with a normal level ofconnectivity.
The FSM state assignment problem has a computational complexity that is exponential inthe number of states �� of the FSM: the best solution can only be determined by trying everycombination of possible codes for the states of the FSM. The number of possible codes ��+ isdetermined by the width, or number of bits �� , of the state register: ��+ � � 0�2 . To minimizethe complexity of the assignment, the number of possible codes should be chosen as the smallestpower of two needed to assign each state a unique code: ��+ � ����������10 � . The number ofpossible FSM encodings ��� then becomes:
� � � ��+ �� ��+ �� ������ (3.1)

3.5. LOOP-BASED FSM STATE ASSIGNMENT ALGORITHMS 21
For FSMs with a large number of states, the exponential complexity makes it unfeasibleto try every possible encoding even with a minimal number of possible encodings. Therefore,we present several algorithms that evolve from an exhaustive search exponential computationalcomplexity algorithm to a linear complexity state assignment heuristic featuring a “best guess”approach. Although the heuristic cannot guarantee an optimal solution, the computational com-plexity of the heuristic allows large size FSMs to be assigned. Even more, the computationalcomplexity allows several runs of the heuristics, for example to compare different loop weight-ing strategies, and choose the best solution.
The FSM state assignment algorithms we propose are based on the loops detected in thestate trace. Each loop is assigned a weight that represents the significance of the loop’s stateassignments on the overall switching activity of the state register for the state trace. By assigningthe states loop by loop in descending loop weight order, the loops which contribute most to thestate register switching activity are most optimally assigned, and the state assignment algorithmcan achieve the largest reduction in switching activity.
First, we describe the basic FSM state assignment approach. This algorithm tries everypossible combination of state codes, and assigns the combination for which the cost is the lowest.The cost metric is the switching activity of the state register for the provided profiling data. Thisalgorithm guarantees the best state assignment solution, and can thus be utilized to evaluate theefficiency of other state assignment algorithms for low power dissipation, including the otheralgorithms described here. This algorithm has an exponential complexity, therefore it is onlysuited for FSMs with very few states. To alleviate this problem we present several enhancementswhich expand the workable range.
A well-known solution to the exponential computation time problem is to divide the probleminto smaller problems which can be solved much faster. The loops found during profiling providea partitioning of the states of the FSM which lends itself naturally to the minimization of theswitching activity of the state register. Therefore, we propose a loop-based state assignmentalgorithm which processes loops in a serial manner in the order of decreasing weight of theloops. During the assignment of a loop, the algorithm respects the codes of states that wherealready assigned in previous loops, but no backtracking will be performed. Therefore, only thefirst loop to be assigned is guaranteed to be assigned optimal.
In order to assign FSMs with a large number of states, a solution with a linear complexityis required. The last algorithm we present does not perform a search of the solution space, butinstead chooses (for each state) a code that is optimal considering the previous assignments. Thestates are assigned in the order in which they occur in the loops, which are sorted by decreasingweight. As with the previous algorithm, the complete FSM’s state assignment is not guaranteedto be optimally, only the first loop’s state assignment is.
3.5.1 Basic FSM state assignment algorithm
The basic FSM state assignment algorithm finds the FSM state assignment solution with thelowest switching activity by trying every possible combination of state codes for the states. Thealgorithm performs a depth-first search (DFS) in a search tree, where each state is represented bya level, each node of a level corresponds to an unassigned code, and each incoming branch to anode symbolizes a state assignment. The top level (zero) represents the unassigned FSM. Whenthe search reaches the bottom level, the resulting search path corresponds to a valid encoding for
22 CHAPTER 3. PROFILING BASED FSM STATE ASSIGNMENT ALGORITHMS
the FSM.To find the best state encoding for low power consumption, the algorithm uses the state
register switching activity as its cost metric, and minimizes this. The cost of an encoding is anestimate of the state register switching activity defined as:
+,� � � �9�� ��� �����
��� ������������� � % �����#����� � � ����! � (3.2)
where " 9 is the set of transitions in loop%, and � � � � is the Hamming distance between the codes
of the begin and end state of transition � . Therefore, the complexity of the cost estimate is linearlyrelated to the combined number of states for all loops. After the evaluation of all possible searchpaths, the encoding with the lowest cost is assigned to the FSM.
The algorithm consists of two parts, the initialization routine (Algorithm 3) and the (recur-sive) DFS function (Algorithm 4).
3.5.1.1 Initialization
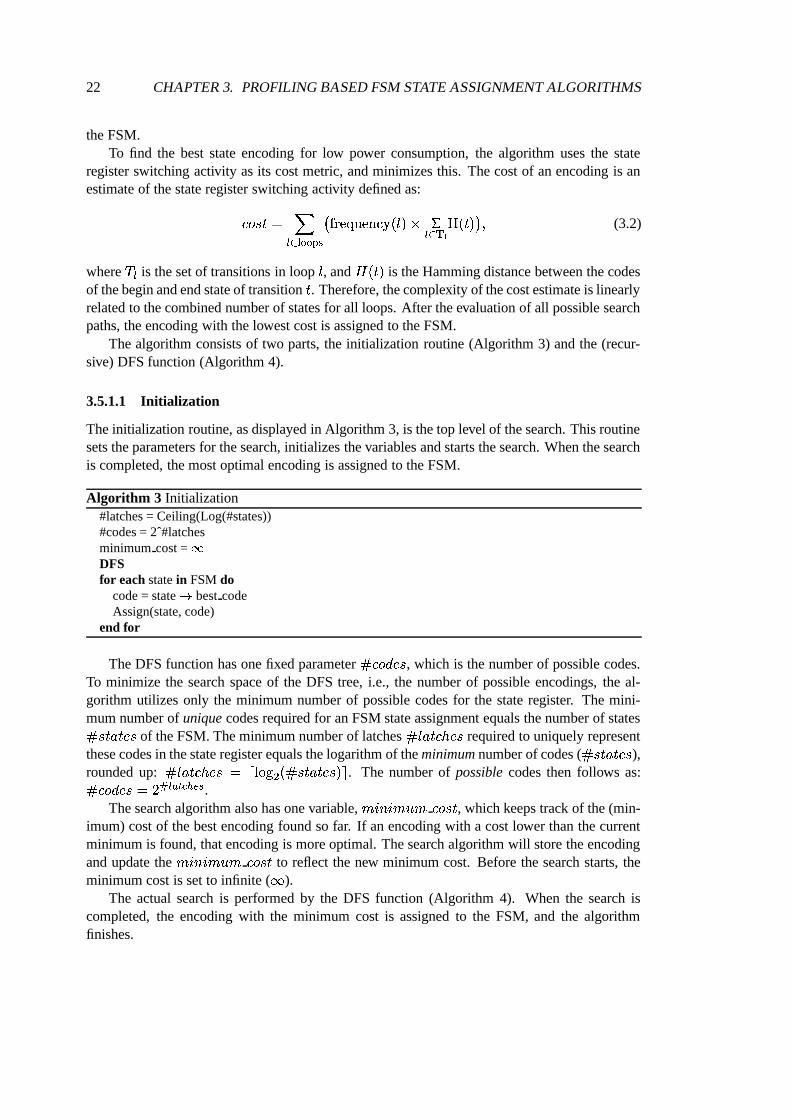
The initialization routine, as displayed in Algorithm 3, is the top level of the search. This routinesets the parameters for the search, initializes the variables and starts the search. When the searchis completed, the most optimal encoding is assigned to the FSM.
Algorithm 3 Initialization#latches = Ceiling(Log(#states))#codes = 2ˆ#latchesminimum cost = #DFSfor each state in FSM do
code = state � best codeAssign(state, code)
end for
The DFS function has one fixed parameter ��+,�.-/�( , which is the number of possible codes.To minimize the search space of the DFS tree, i.e., the number of possible encodings, the al-gorithm utilizes only the minimum number of possible codes for the state register. The mini-mum number of unique codes required for an FSM state assignment equals the number of states�� �� �/���� of the FSM. The minimum number of latches � % �/��+�$ �� required to uniquely representthese codes in the state register equals the logarithm of the minimum number of codes ( �� ��������� ),rounded up: � % �/� +%$ �( � #�&('*) ) � �� ���/���( �� * . The number of possible codes then follows as:��+,�.-/�( � � 0 9 ��#%�4&7:0 .
The search algorithm also has one variable, + � � �,+ ��+ +,� � , which keeps track of the (min-imum) cost of the best encoding found so far. If an encoding with a cost lower than the currentminimum is found, that encoding is more optimal. The search algorithm will store the encodingand update the + � � �,+ ��+ +,� � to reflect the new minimum cost. Before the search starts, theminimum cost is set to infinite ( - ).
The actual search is performed by the DFS function (Algorithm 4). When the search iscompleted, the encoding with the minimum cost is assigned to the FSM, and the algorithmfinishes.

3.5. LOOP-BASED FSM STATE ASSIGNMENT ALGORITHMS 23
3.5.1.2 DFS function
The initialization (Algorithm 3) starts the search for an optimal FSM encoding by calling therecursive DFS function (Algorithm 4). The DFS function recursively traverses the search treeof possible FSM encodings in a depth-first manner. Each level in the search tree corresponds toa state. A node on that level indicates a partial FSM encoding for the first “level” states. Eachbranch in the search tree corresponds to a code assignment to a state. Every time a leaf node (atthe bottom) of the tree is reached, the serach path correspond to a possible FSM encoding, andthe algorithm estimates the cost of that FSM encoding. If the cost of the encoding is lower thanthe minimum cost so far, the minimum cost is updated and the encoding is stored. When theentire tree has been traversed, the algorithm ends.
Algorithm 4 DFS functionstate = UnassignedState(FSM)if state then
for each code in unassigned codes doAssign(state, code)DFSRelease(code)
end forelse
cost = Estimate(Loops)if cost � minimum cost then
minimum cost = costfor each state in FSM do
state � best code = state � codeend for
end ifend if
The search algorithm arbitrarily selects an unassigned state for the next level of the searchtree. The available (unassigned) codes correspond to the nodes of that level. The assignment of acode to the state symbolizes the traversal of a branch from the current level to a node on the nextlevel. Then, this process is repeated for the next level(s). When a search path has been traversed,the algorithm returns to the previous level by releasing the code, i.e., going back up the branch.
When all states are assigned, the cost of the encoding is estimated using Equation 3.2. If thecost is less than the minimum cost found so far, the minimum cost is updated and the codes inthe search path are stored as the minimum cost encoding.
The basic DFS function has an exponential computational complexity described by Equa-tion 3.1, which makes it impossible to find the best solution for an FSM with a larger number ofstates. To find the best solution for larger FSMs, the search space for the best solution must bereduced.
3.5.1.3 Intermediate-cost DFS function
Algorithm 5 is a direct replacement for Algorithm 4 that implements a method to reduce thesearch space. This method reduces the search space by aborting search paths which can onlylead to worse, i.e., higher than minimum cost, encodings. The viability of the search path is

24 CHAPTER 3. PROFILING BASED FSM STATE ASSIGNMENT ALGORITHMS
determined by performing an intermediate, lower bound, estimate of the cost after each stateassignment. For the intermediate estimate, the same cost function (Equation 3.2) is used. How-ever, for all transitions from and to unassigned states, a minimal Hamming distance of one isassumed. The result is a lower bound cost estimate. If the estimate is equal or higher than theminimum cost, the search path cannot result in an encoding with a lower cost, and it is thereforeaborted.
Algorithm 5 Intermediate-cost DFS function (DFS’)state = UnassignedState(Loops)if state then
for each code in unassigned codes doAssign(state, code)cost = Estimate(Loops)if cost � minimum cost then
DFS’end ifRelease(code)
end forelse
minimum cost = costfor each state in FSM do
state � best code = state � codeend for
end if
For the largest reduction in search space, the states must be assigned loop by loop in theorder of descending loop frequencies. Because the estimate is a function of the loop frequencies,a high-cost assignment contributes more to the cost for states from high frequency loops thanfrom low frequency loops. And the faster the intermediate cost estimate increases, the quickerthe minimum cost is exceeded, and the search path is aborted.
The lower the minimum cost becomes, the higher up in the tree a high cost search path willbe aborted, and the fewer the estimates. Furthermore, for higher level estimates, when only afew states are assigned, only a few Hamming distances need to be calculated. Together with thereduced search space, this significantly reduces the execution time of the intermediate-cost DFSfunction as compared to the non-optimized DFS function (Algorithm 4).
3.5.2 Loop-based DFS state assignment algorithm
The basic state assignment algorithm has an exponential computational complexity to the num-ber of states, which makes it unsuitable for FSMs with many states. A well-known solution isto divide the FSMs in several smaller groups, and assign each group of states separately. Thisway the computational complexity is only exponential to the number of unassigned states in thelargest unassigned group. However, the algorithm is only able to find the best solution if allgroups are completely unrelated. But in FSMs all states are connected, because all states can bereached from the starting state of the FSM. Therefore the solution cannot be guaranteed to beoptimal.
The best way to partition an FSM is to group together strongly connected states, so that
3.5. LOOP-BASED FSM STATE ASSIGNMENT ALGORITHMS 25
at least the assignments within each group are optimal. The FSM is already partitioned intostrongly connected groups in the form of the loops found during the FSM profiling, becausethe higher the frequency of a loop, the stronger the connection between it’s states. We pro-pose a loop-based state assignment algorithm that assigns the states in a loop by loop manner indescending order of loop frequencies. Thus the stronger connected groups are assigned first. Be-cause several loops can contain the same state, loops do not divide the FSM in disjunct partitions,and the algorithm has to take into account the states that were encoded previously. Therefore,only the first loop is guaranteed to be assigned optimally, and other loops might not be assignedoptimally.
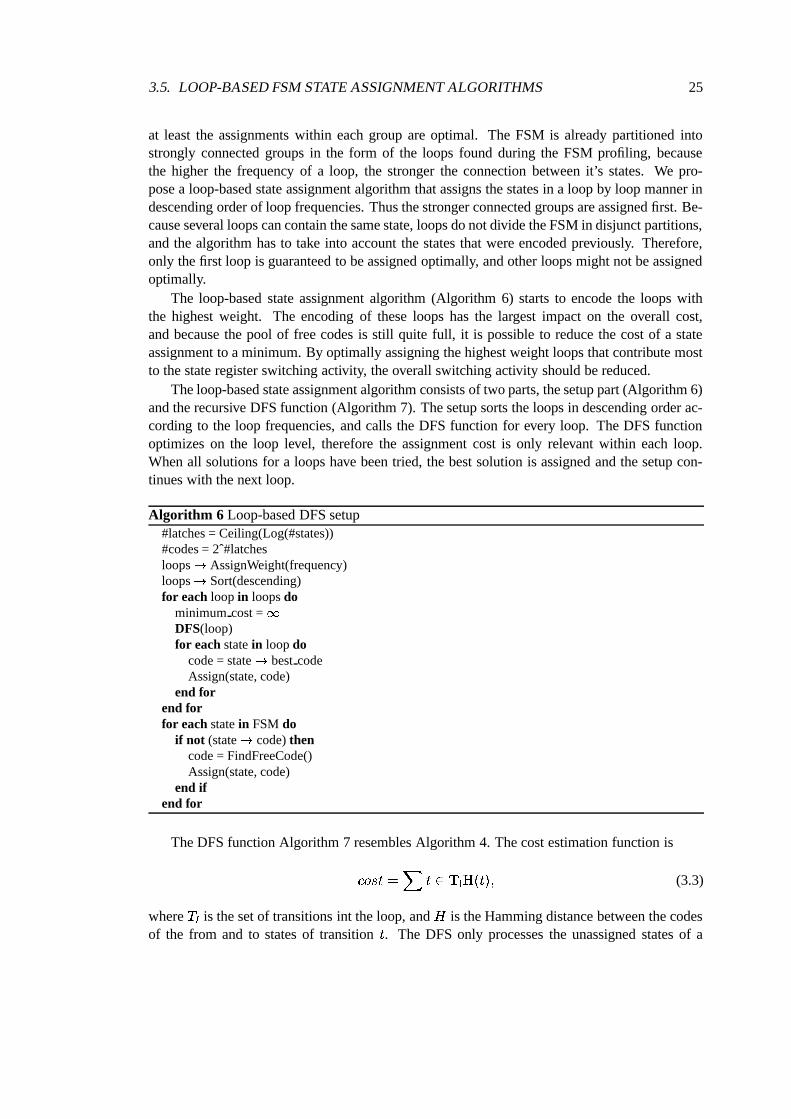
The loop-based state assignment algorithm (Algorithm 6) starts to encode the loops withthe highest weight. The encoding of these loops has the largest impact on the overall cost,and because the pool of free codes is still quite full, it is possible to reduce the cost of a stateassignment to a minimum. By optimally assigning the highest weight loops that contribute mostto the state register switching activity, the overall switching activity should be reduced.
The loop-based state assignment algorithm consists of two parts, the setup part (Algorithm 6)and the recursive DFS function (Algorithm 7). The setup sorts the loops in descending order ac-cording to the loop frequencies, and calls the DFS function for every loop. The DFS functionoptimizes on the loop level, therefore the assignment cost is only relevant within each loop.When all solutions for a loops have been tried, the best solution is assigned and the setup con-tinues with the next loop.
Algorithm 6 Loop-based DFS setup#latches = Ceiling(Log(#states))#codes = 2ˆ#latchesloops � AssignWeight(frequency)loops � Sort(descending)for each loop in loops do
minimum cost = #DFS(loop)for each state in loop do
code = state � best codeAssign(state, code)
end forend forfor each state in FSM do
if not (state � code) thencode = FindFreeCode()Assign(state, code)
end ifend for
The DFS function Algorithm 7 resembles Algorithm 4. The cost estimation function is
+,� �� � � ����� � � � ���,� (3.3)
where " 9 is the set of transitions int the loop, and � is the Hamming distance between the codesof the from and to states of transition � . The DFS only processes the unassigned states of a

26 CHAPTER 3. PROFILING BASED FSM STATE ASSIGNMENT ALGORITHMS
loop, but the cost estimate takes into account all states, including the states that were assignedpreviously.
Algorithm 7 Loop-based DFS functionstate = UnassignedState(loop)if state then
for each code in unassigned codes doAssign(state, code)DFSRelease(code)
end forelse
cost = Estimate(loop)if cost � minimum cost then
minimum cost = costfor each state in loop do
state � best code = state � codeend for
end ifend if
3.5.3 Loop-based heuristic state assignment algorithm
The previous state assignment algorithms both have an exponential computational complexity tothe number of (unassigned) states in the FSM or the loop. In practice, when the number of states,and thus the computational complexity, is large, these methods cannot be used. We propose aloop-based heuristic state assignment algorithm that uses a “best guess” approach to assign a freecode to an unassigned state. The heuristic has a linear computational complexity to the numberof states in the FSM, which is very well suited to large FSMs. Because the cost of the generatedsolution depends heavily on the quality of the guess, the heuristic chooses a code based upon aminimal Hamming distance to its previous and next states.
The first step of the Algorithm 8 sets the number of latches (and thus the number ofpossible codes) of the FSM to the minimum required for the number of states in the FSM(#�&('*) ) � �� ���/���( �� * ).
The second preliminary step of the algorithm assigns a weight to each loop according to aspecified function. Our approach assumes a difference in the frequency of occurrence of loops,therefore the loop frequency obtained by the profiling algorithm is the primary variable of theweight function. However, the number of states in a loop can also be a factor, because the chanceof finding an optimal encoding for large loops is higher when less states of the loops are assignedpreviously and more free codes are still available. Therefore, several weighing functions wereconsidered:�
� � � ' $ � � % � � ���1����� � � +�� � % � ,where ���1����� � � +�� � % � is the occurrence frequency of loop
%,�
� � � ' $ � � ���1����� � � +�� � % � � � �������� � % � ,where �� �� �/���( � % � is the number of states in loop
%, thus favoring loops with more states,
3.5. LOOP-BASED FSM STATE ASSIGNMENT ALGORITHMS 27
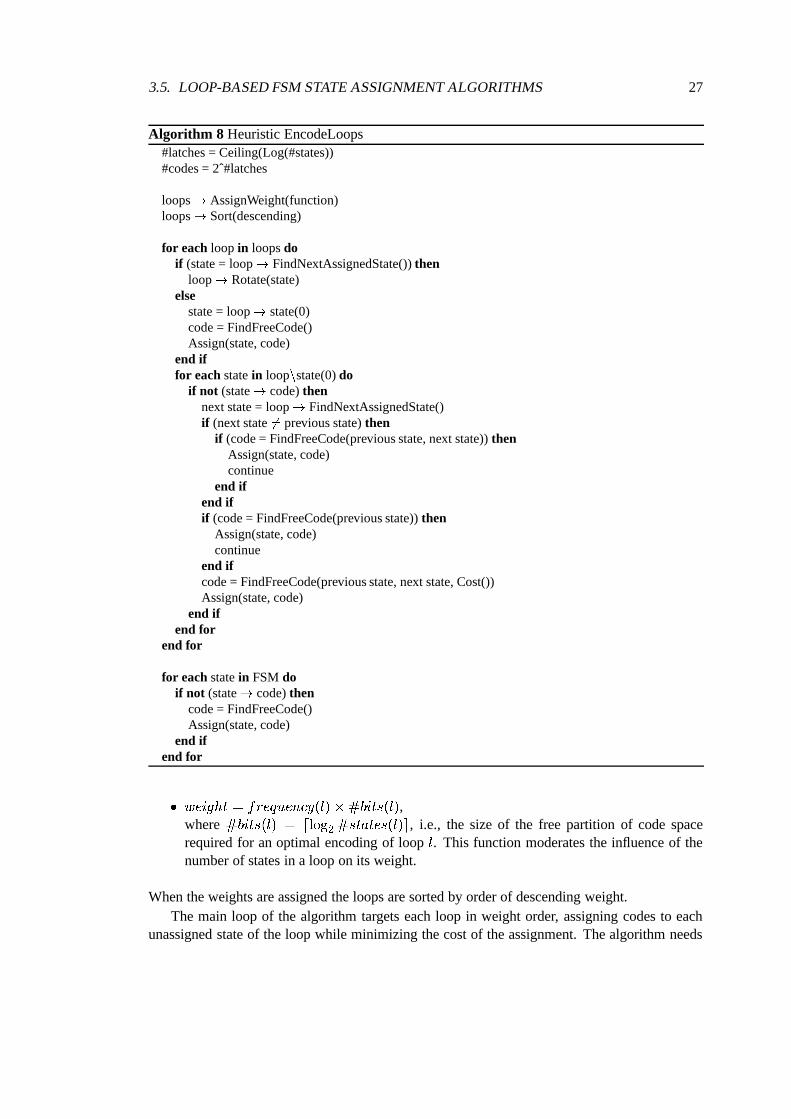
Algorithm 8 Heuristic EncodeLoops#latches = Ceiling(Log(#states))#codes = 2ˆ#latches
loops � AssignWeight(function)loops � Sort(descending)
for each loop in loops doif (state = loop � FindNextAssignedState()) then
loop � Rotate(state)else
state = loop � state(0)code = FindFreeCode()Assign(state, code)
end iffor each state in loop � state(0) do
if not (state � code) thennext state = loop � FindNextAssignedState()if (next state �� previous state) then
if (code = FindFreeCode(previous state, next state)) thenAssign(state, code)continue
end ifend ifif (code = FindFreeCode(previous state)) then
Assign(state, code)continue
end ifcode = FindFreeCode(previous state, next state, Cost())Assign(state, code)
end ifend for
end for
for each state in FSM doif not (state � code) then
code = FindFreeCode()Assign(state, code)
end ifend for
�� � � ' $ � � ���1����� � � +�� � % � � � � �� � % � ,where �� !�"�� � % � � #�&('*) ) �� ��������� � % �"* , i.e., the size of the free partition of code spacerequired for an optimal encoding of loop
%. This function moderates the influence of the
number of states in a loop on its weight.
When the weights are assigned the loops are sorted by order of descending weight.The main loop of the algorithm targets each loop in weight order, assigning codes to each
unassigned state of the loop while minimizing the cost of the assignment. The algorithm needs
28 CHAPTER 3. PROFILING BASED FSM STATE ASSIGNMENT ALGORITHMS
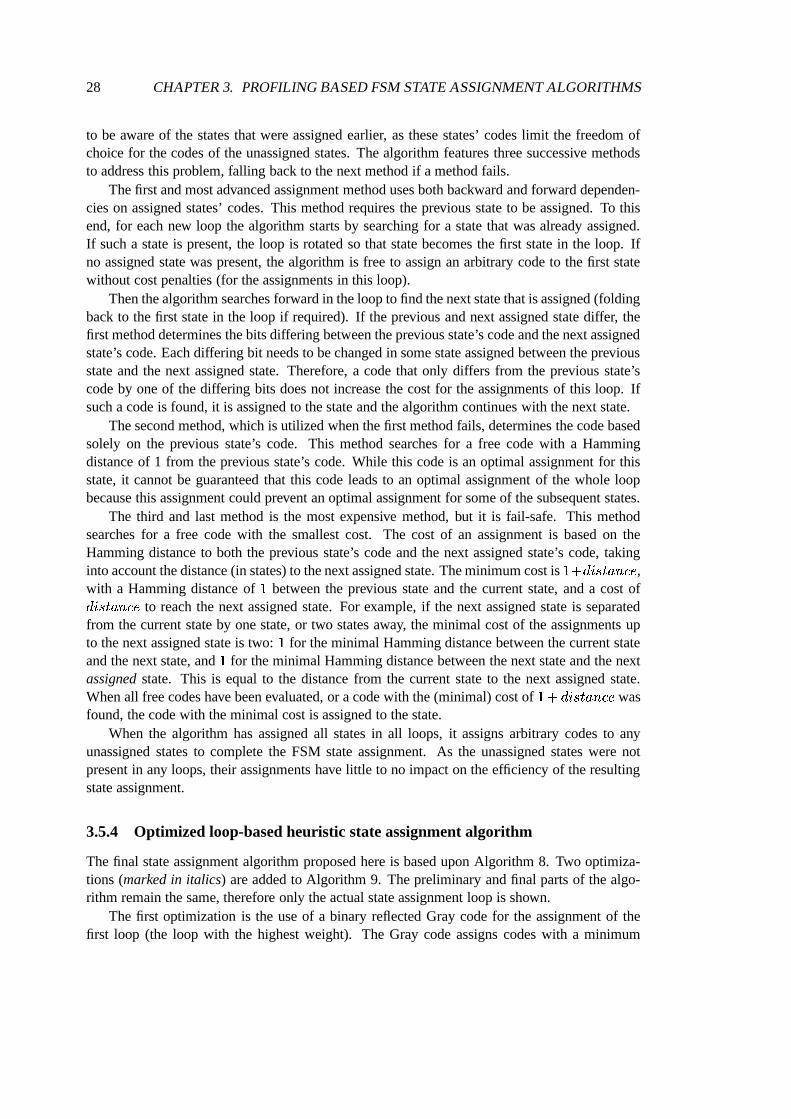
to be aware of the states that were assigned earlier, as these states’ codes limit the freedom ofchoice for the codes of the unassigned states. The algorithm features three successive methodsto address this problem, falling back to the next method if a method fails.
The first and most advanced assignment method uses both backward and forward dependen-cies on assigned states’ codes. This method requires the previous state to be assigned. To thisend, for each new loop the algorithm starts by searching for a state that was already assigned.If such a state is present, the loop is rotated so that state becomes the first state in the loop. Ifno assigned state was present, the algorithm is free to assign an arbitrary code to the first statewithout cost penalties (for the assignments in this loop).
Then the algorithm searches forward in the loop to find the next state that is assigned (foldingback to the first state in the loop if required). If the previous and next assigned state differ, thefirst method determines the bits differing between the previous state’s code and the next assignedstate’s code. Each differing bit needs to be changed in some state assigned between the previousstate and the next assigned state. Therefore, a code that only differs from the previous state’scode by one of the differing bits does not increase the cost for the assignments of this loop. Ifsuch a code is found, it is assigned to the state and the algorithm continues with the next state.
The second method, which is utilized when the first method fails, determines the code basedsolely on the previous state’s code. This method searches for a free code with a Hammingdistance of 1 from the previous state’s code. While this code is an optimal assignment for thisstate, it cannot be guaranteed that this code leads to an optimal assignment of the whole loopbecause this assignment could prevent an optimal assignment for some of the subsequent states.
The third and last method is the most expensive method, but it is fail-safe. This methodsearches for a free code with the smallest cost. The cost of an assignment is based on theHamming distance to both the previous state’s code and the next assigned state’s code, takinginto account the distance (in states) to the next assigned state. The minimum cost is � ) -�� ��� � +,� ,with a Hamming distance of � between the previous state and the current state, and a cost of-1� ��� � + � to reach the next assigned state. For example, if the next assigned state is separatedfrom the current state by one state, or two states away, the minimal cost of the assignments upto the next assigned state is two: � for the minimal Hamming distance between the current stateand the next state, and � for the minimal Hamming distance between the next state and the nextassigned state. This is equal to the distance from the current state to the next assigned state.When all free codes have been evaluated, or a code with the (minimal) cost of � ) -�� ��� � +,� wasfound, the code with the minimal cost is assigned to the state.
When the algorithm has assigned all states in all loops, it assigns arbitrary codes to anyunassigned states to complete the FSM state assignment. As the unassigned states were notpresent in any loops, their assignments have little to no impact on the efficiency of the resultingstate assignment.
3.5.4 Optimized loop-based heuristic state assignment algorithm
The final state assignment algorithm proposed here is based upon Algorithm 8. Two optimiza-tions (marked in italics) are added to Algorithm 9. The preliminary and final parts of the algo-rithm remain the same, therefore only the actual state assignment loop is shown.
The first optimization is the use of a binary reflected Gray code for the assignment of thefirst loop (the loop with the highest weight). The Gray code assigns codes with a minimum
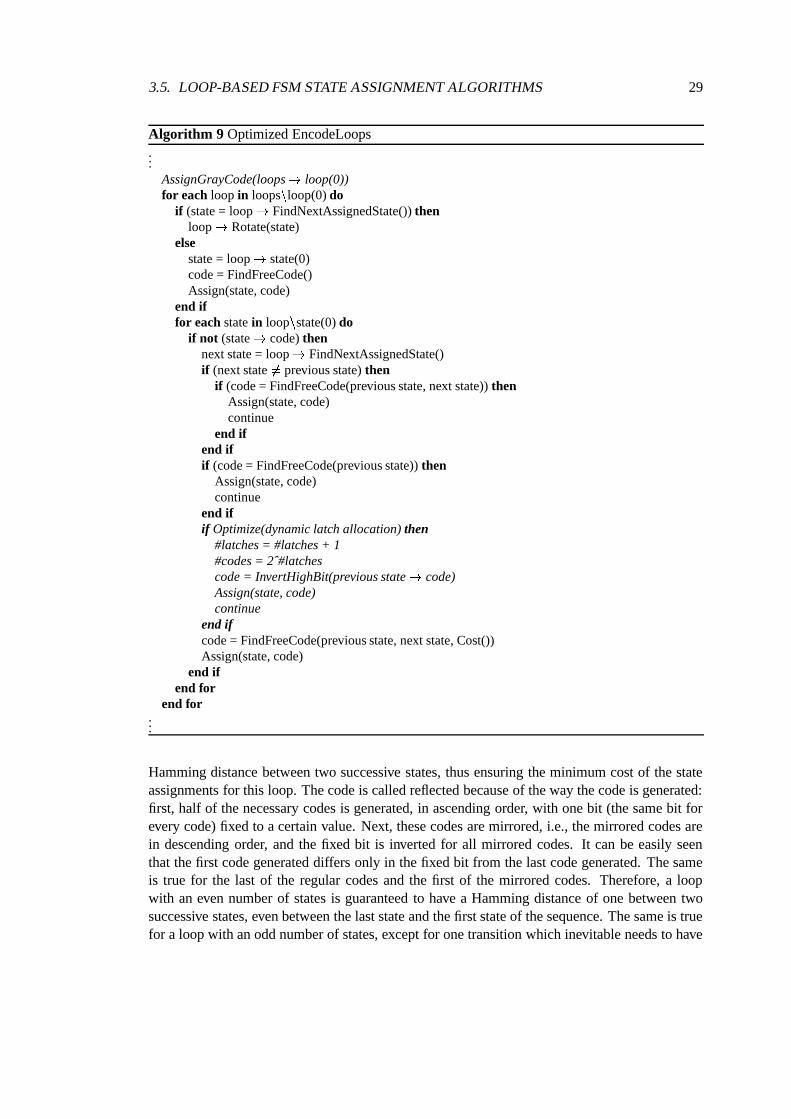
3.5. LOOP-BASED FSM STATE ASSIGNMENT ALGORITHMS 29
Algorithm 9 Optimized EncodeLoops...
AssignGrayCode(loops � loop(0))for each loop in loops � loop(0) do
if (state = loop � FindNextAssignedState()) thenloop � Rotate(state)
elsestate = loop � state(0)code = FindFreeCode()Assign(state, code)
end iffor each state in loop � state(0) do
if not (state � code) thennext state = loop � FindNextAssignedState()if (next state �� previous state) then
if (code = FindFreeCode(previous state, next state)) thenAssign(state, code)continue
end ifend ifif (code = FindFreeCode(previous state)) then
Assign(state, code)continue
end ifif Optimize(dynamic latch allocation) then
#latches = #latches + 1#codes = 2ˆ#latchescode = InvertHighBit(previous state � code)Assign(state, code)continue
end ifcode = FindFreeCode(previous state, next state, Cost())Assign(state, code)
end ifend for
end for...
Hamming distance between two successive states, thus ensuring the minimum cost of the stateassignments for this loop. The code is called reflected because of the way the code is generated:first, half of the necessary codes is generated, in ascending order, with one bit (the same bit forevery code) fixed to a certain value. Next, these codes are mirrored, i.e., the mirrored codes arein descending order, and the fixed bit is inverted for all mirrored codes. It can be easily seenthat the first code generated differs only in the fixed bit from the last code generated. The sameis true for the last of the regular codes and the first of the mirrored codes. Therefore, a loopwith an even number of states is guaranteed to have a Hamming distance of one between twosuccessive states, even between the last state and the first state of the sequence. The same is truefor a loop with an odd number of states, except for one transition which inevitable needs to have
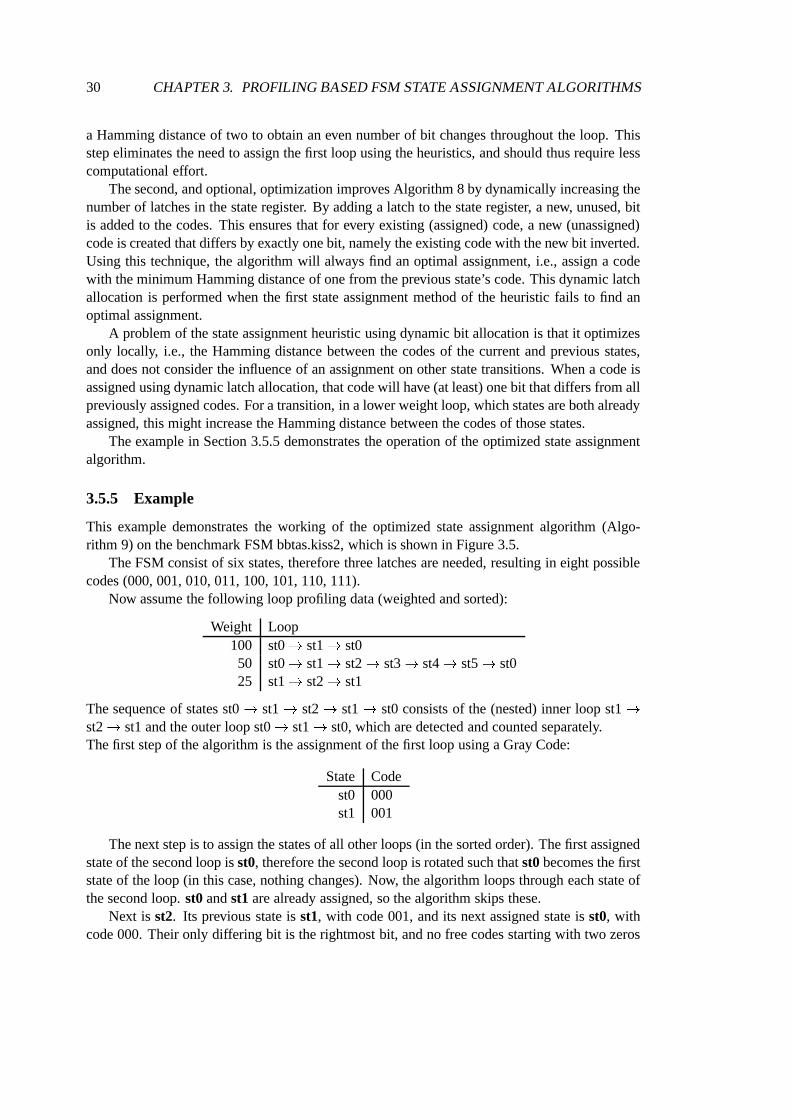
30 CHAPTER 3. PROFILING BASED FSM STATE ASSIGNMENT ALGORITHMS
a Hamming distance of two to obtain an even number of bit changes throughout the loop. Thisstep eliminates the need to assign the first loop using the heuristics, and should thus require lesscomputational effort.
The second, and optional, optimization improves Algorithm 8 by dynamically increasing thenumber of latches in the state register. By adding a latch to the state register, a new, unused, bitis added to the codes. This ensures that for every existing (assigned) code, a new (unassigned)code is created that differs by exactly one bit, namely the existing code with the new bit inverted.Using this technique, the algorithm will always find an optimal assignment, i.e., assign a codewith the minimum Hamming distance of one from the previous state’s code. This dynamic latchallocation is performed when the first state assignment method of the heuristic fails to find anoptimal assignment.
A problem of the state assignment heuristic using dynamic bit allocation is that it optimizesonly locally, i.e., the Hamming distance between the codes of the current and previous states,and does not consider the influence of an assignment on other state transitions. When a code isassigned using dynamic latch allocation, that code will have (at least) one bit that differs from allpreviously assigned codes. For a transition, in a lower weight loop, which states are both alreadyassigned, this might increase the Hamming distance between the codes of those states.
The example in Section 3.5.5 demonstrates the operation of the optimized state assignmentalgorithm.
3.5.5 Example
This example demonstrates the working of the optimized state assignment algorithm (Algo-rithm 9) on the benchmark FSM bbtas.kiss2, which is shown in Figure 3.5.
The FSM consist of six states, therefore three latches are needed, resulting in eight possiblecodes (000, 001, 010, 011, 100, 101, 110, 111).
Now assume the following loop profiling data (weighted and sorted):
Weight Loop100 st0 st1 st050 st0 st1 st2 st3 st4 st5 st025 st1 st2 st1
The sequence of states st0 st1 st2 st1 st0 consists of the (nested) inner loop st1 st2 st1 and the outer loop st0 st1 st0, which are detected and counted separately.The first step of the algorithm is the assignment of the first loop using a Gray Code:
State Codest0 000st1 001
The next step is to assign the states of all other loops (in the sorted order). The first assignedstate of the second loop is st0, therefore the second loop is rotated such that st0 becomes the firststate of the loop (in this case, nothing changes). Now, the algorithm loops through each state ofthe second loop. st0 and st1 are already assigned, so the algorithm skips these.
Next is st2. Its previous state is st1, with code 001, and its next assigned state is st0, withcode 000. Their only differing bit is the rightmost bit, and no free codes starting with two zeros

3.5. LOOP-BASED FSM STATE ASSIGNMENT ALGORITHMS 31
.i 2
.o 2
.p 24
.s 600 st0 st0 0001 st0 st1 0010 st0 st1 0011 st0 st1 0000 st1 st0 0001 st1 st2 0010 st1 st2 0011 st1 st2 0000 st2 st1 0001 st2 st3 0010 st2 st3 0011 st2 st3 0000 st3 st4 0001 st3 st3 0110 st3 st3 1011 st3 st3 1100 st4 st5 0001 st4 st4 0010 st4 st4 0011 st4 st4 0000 st5 st0 0001 st5 st5 0010 st5 st5 0011 st5 st5 00
� �� �
st0
� �� �
st1
� �� �
st2
� �� �
st3 � �� �
st4
� �� �
st5
��� � �00/00
�01/0010/0011/00
�
00/00
�01/0010/0011/00
�
00/00
�01/0010/0011/00
� ���
�
01/0110/1011/11
�00/00 � �
���
01/0010/0011/00
�
00/00
� ���
�
01/0010/0011/00
� 00/00
Figure 3.5: FSM BBTAS: KISS description (left) and State Transition Graph
can be found. Therefore, the algorithm has to find a free code only based on the previous state’scode 001. The first free code differing only one bit from 001 is 011, so this code is assigned tost2:
State Codest0 000st1 001st2 011
The algorithm continues with st3. Its previous state (st2) code is 011, its next assigned state(st0) code is 000, so the codes differ in the two rightmost bits. The algorithm now searches for afree code differing one bit from the two rightmost bits of the previous state code 011, and finds010:

32 CHAPTER 3. PROFILING BASED FSM STATE ASSIGNMENT ALGORITHMS
State Codest0 000st1 001st2 011st3 010
Now, the algorithm starts with st4. No free code can be found based on the the previous andnext assigned states’ codes only differing middle bit. The first free code differing one bit fromthe previous state’s code is 110:
State Codest0 000st1 001st2 011st3 010st4 110
Last in this loop is st5. The algorithm searches for a code differing from 110 in one of thetwo leftmost bits, and finds 100:
State Codest0 000st1 001st2 011st3 010st4 110st5 100
The algorithm continues with the last two loops, and finds their states are already assigned.Finally, the algorithm checks for states that were not assigned in any loops, but all six states ofthe FSM are assigned, so the algorithm is finishes.The resulting state assignment for this FSM has a Hamming distance of one for each state transi-tion in each loop, and is therefore (by definition) optimal. Of course, the possibility of this idealresult depends on the structure of the FSM, and can most probably not be obtained for morecomplex FSMs.
3.6 Implementation
We have created a C++ framework for the FSM data structures necessary to implement the pro-posed algorithms. This framework includes FSM input/output functions, a Hamming distancefunction, a random input vector set generator and an FSM simulator. The profiling, loop detec-tion and state assignment algorithms which we proposed in this chapter are implemented on topof this framework.
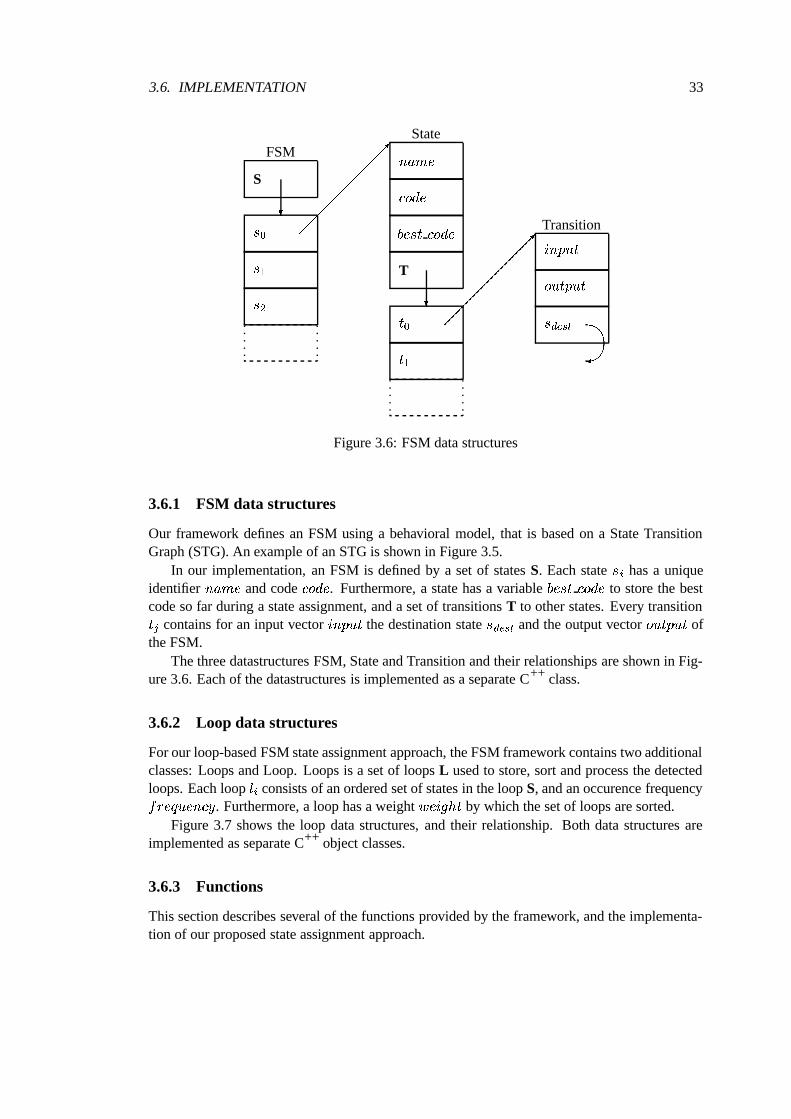
3.6. IMPLEMENTATION 33
FSM
S
� �
�
()
� � � �� �
��� State
� � + �+,��-4� ,�� �� +3�.-4�T
�� �
� �
� �� � �
� ��� Transition
� ����� ���� ��� � �
��: 4#����
Figure 3.6: FSM data structures
3.6.1 FSM data structures
Our framework defines an FSM using a behavioral model, that is based on a State TransitionGraph (STG). An example of an STG is shown in Figure 3.5.
In our implementation, an FSM is defined by a set of states S. Each state � has a uniqueidentifier � � + � and code +,�.-/� . Furthermore, a state has a variable ,�( � +,�.-/� to store the bestcode so far during a state assignment, and a set of transitions T to other states. Every transition� � contains for an input vector � ��� � � the destination state ��:0 �# and the output vector ��� ��� � � ofthe FSM.
The three datastructures FSM, State and Transition and their relationships are shown in Fig-ure 3.6. Each of the datastructures is implemented as a separate C++ class.
3.6.2 Loop data structures
For our loop-based FSM state assignment approach, the FSM framework contains two additionalclasses: Loops and Loop. Loops is a set of loops L used to store, sort and process the detectedloops. Each loop
% �consists of an ordered set of states in the loop S, and an occurence frequency
���1����� � � +�� . Furthermore, a loop has a weight � � � '�$ � by which the set of loops are sorted.Figure 3.7 shows the loop data structures, and their relationship. Both data structures are
implemented as separate C++ object classes.
3.6.3 Functions
This section describes several of the functions provided by the framework, and the implementa-tion of our proposed state assignment approach.

34 CHAPTER 3. PROFILING BASED FSM STATE ASSIGNMENT ALGORITHMS
Loops
L
�% �% �% )
� � � �� �
��� Loop
���1����� � � +��� � � '�$ �S
� �
�
� �� � �
� ��� State
Figure 3.7: Loop data structures
First, the framework provides functions for reading and writing FSM descriptions in KISSand BLIF formats [2]. The BLIF format contains both the KISS FSM description and the stateassignments. The framework can also read and write input vector data sets, or randomly generateinput vector data sets for a specified FSM, seed and data set length.
Furthermore, the framework provides several functions to support the state assignment algo-rithms and the evalutation of encodings:
EliminateThis function eliminates states that are unreachable from the reset state. The resultingminimal FSM ensures that different state assignment implementations encode the sameFSM.
HammingDistanceThis function returns the Hamming distance between two codes, which is used in the stateassignment cost estimates.
SimulateThis functions simulates an encoded FSM, and returns the state register switching activityfor the provided input vector data set.
Our loop-based profiling state assignment approach is implemented using two main entryfunctions:
DetectLoopsThis function integrates an FSM state profiler with the proposed loop detection algorithm(Algorithm 2). The FSM is simulated using a provided input vector data set, and the resultis a set of loops with their frequencies. By integrating the FSM profiling and the loopdetection algorithm, the intermediate state trace does not have to be stored.
3.6. IMPLEMENTATION 35
EncodeThis functions encodes the FSM using the requested state assignment algorithm, the pro-vided loops, and the selected weight function (if applicable).
In the following chapter we evaluate the proposed state assignment approaches using this imple-mentation.

36 CHAPTER 3. PROFILING BASED FSM STATE ASSIGNMENT ALGORITHMS

Experimental Results
4.1 Introduction
In this chapter, we evaluate the algorithms we proposed in Chapter 3 utilizing an finite statemachine (FSM) benchmark suite, and compare the results with state of the art state assignmentalgorithms. The algorithms are evaluated based upon the switching activity both in the state reg-ister and the gate-level circuit generated from the synthesis of the assigned FSMs. We compareour new state assignment algorithms with two state of the art low-power FSM state assignmentalgorithms, POW3 [1] and the algorithm by Noth and Kolla [6], as well as with the base for allstate assignment algorithm comparisons, the area-oriented JEDI [4] state assignment algorithm.To evaluate the algorithms we use the industry-standard MCNC/LGSynth ’89 FSM benchmarksuite [3].
The sections of this chapter are outlined as follows. First, we describe the method, andthe programs, we use to perform the experiments. Then, we present the results from our newalgorithms, followed by the result from the existing algorithms. Finally, we compare the resultsof all algorithms.
4.2 Method
The aim of FSM state assignment algorithms for low power dissipation is to minimize the powerconsumption of the resulting real circuits. For our experiments, the switching activity of thegate-level FSM circuit provides a good estimate of the power dissipation of the circuit, withwhich to compare the algorithms. The experimental method we present consist of the followingsteps:
1. Setup,
2. FSM profiling and loop detection,
3. FSM state assignment,
4. Synthesis of a gate level FSM circuit, and
5. Simulation of the resulting circuit.
The setup prepares the FSM descriptions and the input vector data sets. The FSM profilingsimulates the FSM under an input vector data set to obtain the loops in the state trace. This stepis not required by the algorithms we compare with, as the existing algorithms all operate on thestatic FSM description.
Figure 4.1 shows the steps common to all state assignment algorithms. Each algorithm per-forms a state assignment, either based on the profiling data or based on the static FSM descrip-tion. From the assigned FSM, a gate level FSM circuit is synthesized. During the simulation
37

38 CHAPTER 4. EXPERIMENTAL RESULTS
� �� �
FSM
�� �� �
loops � StateAssignment
�Circuit
Synthesis
�� �� �inputs � Simulation
�� �� �activity
Figure 4.1: Experimental method
of the circuit, the switching activity of the FSM state register and the complete circuit is mea-sured in order to evaluate the overall power consumption. The steps are described in detail in thefollowing sections.
4.2.1 Setup
Before the experiments are run, we set up the FSM and input vector data sets for the experi-ments. The source for the experiments is the industry-standard MCNC/LGSynth ’89 [3] FSMbenchmark suite, which was also used by Benini et al [1] and Noth et al [6]. We utilize the FSMsin the high level KISS description [2].
The profiling and simulation of the FSM requires a set of relevant input vectors which specifythe interaction of the outside world with the FSM. Actual (recorded) input vector data sets arenot available for the benchmark FSMs, therefore we use several randomly generated data setsto obtain an average result. The starting state of the FSM for the simulation needs to match thestarting state for the profiling, therefore we specify the starting state for the data set to be thereset state of that FSM.
The first step of the setup, as shown in Figure 4.2, is to prepare the proper KISS format FSM
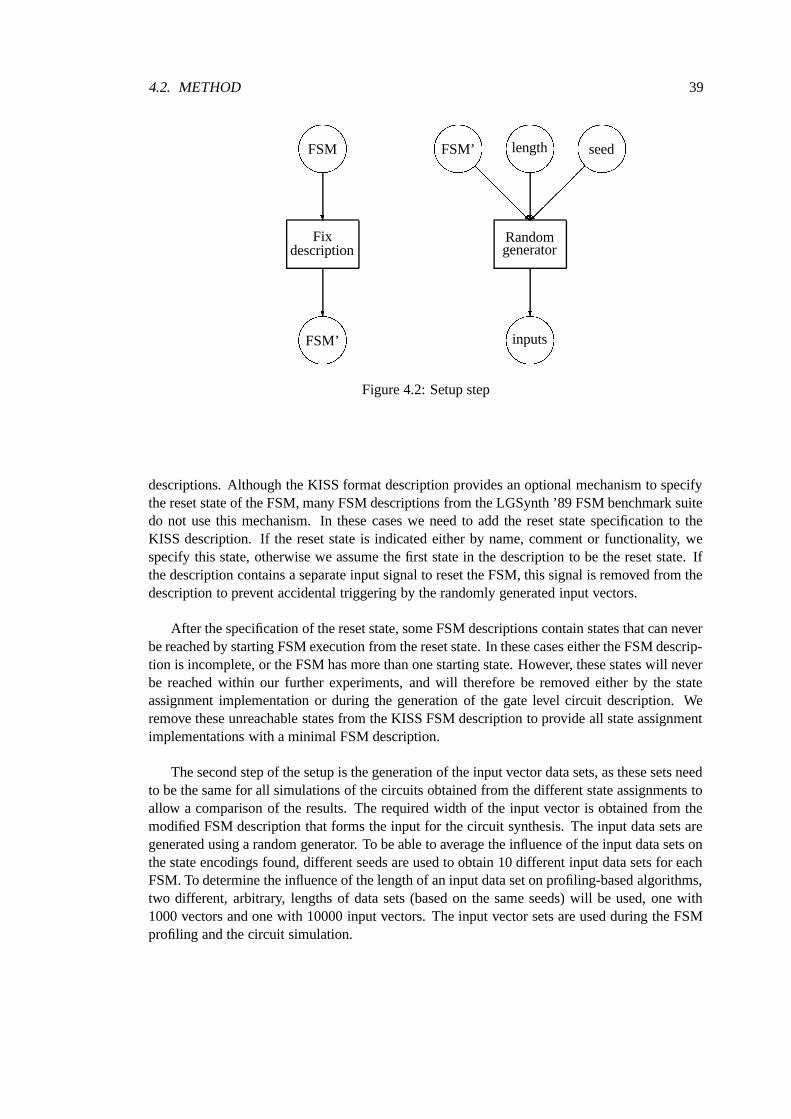
4.2. METHOD 39
� �� �
FSM
�Fix
description
�� �� �FSM’
� �� �FSM’� � � � ���
� �� �length
�
� �� �
seed������
Randomgenerator
�� �� �inputs
Figure 4.2: Setup step
descriptions. Although the KISS format description provides an optional mechanism to specifythe reset state of the FSM, many FSM descriptions from the LGSynth ’89 FSM benchmark suitedo not use this mechanism. In these cases we need to add the reset state specification to theKISS description. If the reset state is indicated either by name, comment or functionality, wespecify this state, otherwise we assume the first state in the description to be the reset state. Ifthe description contains a separate input signal to reset the FSM, this signal is removed from thedescription to prevent accidental triggering by the randomly generated input vectors.
After the specification of the reset state, some FSM descriptions contain states that can neverbe reached by starting FSM execution from the reset state. In these cases either the FSM descrip-tion is incomplete, or the FSM has more than one starting state. However, these states will neverbe reached within our further experiments, and will therefore be removed either by the stateassignment implementation or during the generation of the gate level circuit description. Weremove these unreachable states from the KISS FSM description to provide all state assignmentimplementations with a minimal FSM description.
The second step of the setup is the generation of the input vector data sets, as these sets needto be the same for all simulations of the circuits obtained from the different state assignments toallow a comparison of the results. The required width of the input vector is obtained from themodified FSM description that forms the input for the circuit synthesis. The input data sets aregenerated using a random generator. To be able to average the influence of the input data sets onthe state encodings found, different seeds are used to obtain 10 different input data sets for eachFSM. To determine the influence of the length of an input data set on profiling-based algorithms,two different, arbitrary, lengths of data sets (based on the same seeds) will be used, one with1000 vectors and one with 10000 input vectors. The input vector sets are used during the FSMprofiling and the circuit simulation.

40 CHAPTER 4. EXPERIMENTAL RESULTS
4.2.2 FSM Profiling and State Assignment
Chapter 3 describes the method for FSM state assignment using FSM profiling that is evaluatedduring these experiments. The FSM profiler simulates the operation of the FSM under a certaininput vector data set, and returns a set of state loops and a set of state transitions. Our stateassignment algorithms utilize the loop data to produce a state encoding for the FSM optimizedfor that specific input vector data set. This results in a separate state encoding, and thus a separatecircuit, for each input vector data set.
The state assignment algorithms that we compare with operate on the static FSM description,and therefore produce only one state encoding (and one circuit) for an FSM. However, POW3 [1]performs the state assignment based upon the state transition probabilities of the FSM. For com-parison, we have run POW3 with both the static FSM state transitions probabilities, and the statetransition probabilities determined during the FSM profiling. Like the other profiling-based stateassignment algorithms, this results in a separate state encoding for each input set.
The resulting state assignment is added to the KISS FSM description to produce a BLIFFSM description [2] suitable for the circuit synthesis.
4.2.3 Circuit Synthesis
The gate level circuit description is generated by the sequential circuit synthesis system SIS [2].The circuit simulator we use requires requires the code of the reset state to correspond to thereset value of the state register, for which all latches are zero. If this is not the case for the FSMencoding under evaluation, the bits that are one for the reset state’s code are inverted for all statecodes. Because the same bits are inverted for all state codes, the state register switching activityis unaffected. The standard SIS script script.rugged translates the high level FSM descriptionwith encoding into a set of logical functions, and minimizes these functions to reduce the numberof gates required for a gate level implementation. This approach minimizes the required area,but it does not necessarily minimize the power dissipation of the circuit. Finally, the logicalfunctions are mapped onto the standard SIS MCNC gate-library mcnc.genlib to obtain a gatelevel description. Because the output signal of certain gates such as NANDs and NORs areinverted, extra inverters are inserted to compensate for this. A last optimization evaluates foreach interconnecting node if complementing that node will eliminate inverters, thus minimizingthe required area. The gate level circuit is returned in SLIF format. The input and output signalsare ordered as they appear in the high level FSM description. After specifying a clock signal forthe latches, this description is suitable for simulation by the logic simulator.
4.2.4 Simulation
The simulation of the circuit is performed by the Mercury logic simulator, part of the OlympusSynthesis System [5]. Using the settings set sim view all and reset sim view io only, the outputof the simple simulate plot command contains the changes of all internal signals of the circuit,including the state register latches. From this output, the state register and circuit switchingactivities are determined.
For the profiling-based state assignment methods, each input vector data set is input intoits matching, unique, circuit. The reference state assignment approaches produce only a singlecircuit, which is simulated (separately) for all input sets.

4.3. BENCHMARKS 41
4.3 Benchmarks
The FSMs we use as benchmarks to evaluate the performance of the state assignment algorithmscome from the MCNC/LGSynth ’89 [3] FSM benchmark suite. This is the industry-standardbenchmark suite for FSM state assignment. The benchmarks use the table-based KISS format [2]to describe the FSM.
As explained in Section 4.2.1, the KISS descriptions of some examples need to be modifiedto allow proper operation of the different state assignment algorithms and the simulation. Whereneeded, we write out the wild-cards in the description in full, and add a reset state specifica-tion. This specification replaces explicitly specified reset functionality using a reset input signal,which is removed, as are any states which cannot be reached from the reset state.
Table 4.1 shows the benchmarks, the number of states each FSM consists of, and the numberof codes available to the state assignment algorithms for the minimum size of the state register.Furthermore, the table lists the average number of loops detected in the state trace for boththe 1000 input vector and the 10000 input vector data sets, and the average number of statetransitions to another state that occurred. The last value is used to determine the percentage ofbit changes in the state register for each state transition. The transitions, for which the FSM doesnot change its state, do not cause bit changes in the register, so these are excluded.
Table 4.1: Benchmarks Statistics
Benchmark States Codes Loops Transitions1000 10000 1000 10000
bbara 10 16 20.3 35.7 228.1 2211.2bbsse
�
13 16 15.4 22.8 683.1 6748.4bbtas 6 8 3.0 3.0 438.4 4459.7beecount 7 8 8.0 10.0 417.8 4076.9cse 16 16 8.5 13.9 229.7 2272.8dk14 7 8 38.9 59.4 827.6 8236.8dk15 4 4 7.0 7.0 706.6 7072.5dk16 27 32 134.3 799.9 962.4 9622.0dk17 8 8 17.9 23.0 837.1 8387.9dk27 7 8 12.0 12.0 1000.0 10000.0dk512
�
14 16 26.8 29.0 1000.0 10000.0donfile
�
24 32 89.0 427.7 754.5 7509.7ex1 20 32 32.4 72.4 516.2 5182.7ex2
�
19 32 0.3 0.3 2.9 2.9ex3
�
10 16 0.2 0.2 2.9 2.9ex4 14 16 3.0 3.0 439.6 4347.4ex5
�
9 16 0.4 0.4 3.5 3.5ex6 8 8 30.9 43.5 806.7 8021.8ex7
�
10 16 0.0 0.0 1.2 1.2keyb 19 32 5.9 9.1 542.2 5496.1kirkman
���
16 16 1.0 1.0 501.1 4995.0lion 4 4 3.0 3.0 380.5 3734.0lion9
�
9 16 8.0 8.0 446.0 4442.1mark1
� � �
13 16 8.0 8.0 1000.0 10000.0mc 4 4 1.0 1.0 423.3 4288.9�
Unreachable state(s)�
Terminating state(s)�
Wild-card(s)�
Constant output(s)�
Reset functionality�
Reset state unknown

42 CHAPTER 4. EXPERIMENTAL RESULTS
Table 4.1: Benchmarks Statistics (Continued)
Benchmark States Codes Loops Transitions1000 10000 1000 10000
modulo12�
12 16 1.0 1.0 507.8 5005.3opus
�
10 16 6.0 6.0 736.7 7340.1planet 48 64 27.4 50.1 959.0 9602.3planet1 48 64 27.4 50.1 959.0 9602.3pma 24 32 28.3 62.0 442.8 4359.3s1 20 32 91.9 341.8 733.0 7311.9s1488 48 64 9.2 18.3 303.1 2894.8s1494 48 64 9.2 18.3 303.1 2894.8s1a
�
20 32 91.9 341.8 733.0 7311.9s208
�
18 32 4.4 5.7 454.8 4387.5s27 6 8 32.5 40.4 685.0 6817.5s298 218 256 74.3 352.3 745.6 7525.8s386 13 16 14.8 22.8 673.4 6709.5s420
�
18 32 4.4 5.7 454.8 4387.5s510 47 64 6.0 6.0 650.7 6706.6s8
�
5 8 4.0 4.0 124.8 1300.9s820 25 32 6.8 13.4 535.6 5371.0s832 25 32 6.8 13.4 535.6 5371.0sand 32 32 29.8 48.6 476.0 4843.9scf
� � �
115 128 32.6 132.5 1000.0 10000.0shiftreg 8 8 16.9 17.0 877.0 8750.8sse
�
13 16 15.4 22.8 683.1 6748.4styr 30 32 10.6 16.9 511.2 5073.2tav 4 4 1.0 1.0 1000.0 10000.0tbk 32 32 73.1 257.4 568.5 5716.5tma
�
20 32 7.8 17.0 164.6 1571.5train11
�
11 16 4.0 4.0 332.8 3335.8train4
�
4 4 1.0 1.0 391.0 4002.1�
Unreachable state(s)�
Terminating state(s)�
Wild-card(s)�
Constant output(s)�
Reset functionality�
Reset state unknown
Some benchmark FSMs contain states from which no transition is possible. If an FSM enterssuch a terminating state, it will remain trapped in that state for the remainder of the simulation.These benchmarks, ex2, ex3, ex5 and ex7, do not generate valid results during simulation andare unsuited for our experiments. On the other hand, for kirkman, mc, modulo12, tav andtrain4, only one even-length loop containing all FSM states, is detected. These benchmarksultimately benefit from our loop-based state assignment approach. Furthermore, these FSMs canbe assigned optimally (one bit change for each state change) by utilizing some form of (binaryreflected) Gray code. The same holds true for bbtas (Figure 3.5), for which in our experimentsthe most frequently detected loop always contains all states. The other loops of bbtas formtransitions of the first loop, so they are always assigned optimally.
The states of the FSMs lion and lion9 form an open-ended chain, i.e., each state only hastransitions back to the previous state, or forward to a single next state. A state assignment basedon a Gray code will result in an optimal solution.
The benchmarks donfile, modulo12, s1a and s8 have only constant outputs. When a circuit

4.4. RESULTS 43
is generated from these descriptions, the simplification step reduces the complete circuit to onlythe constant outputs, so the total circuit switching activity can not be determined. Benchmarks1a is the constant output equivalent of benchmark s1, so it is excluded. The benchmarks planetand planet1 are exact duplicates, so only the first one is included in the test set.
The following sections present the results from the experiments with the remaining bench-marks.
4.4 Results
We have applied our experimental method to all algorithms and for all FSM benchmarks, andhere we present a summary of the results. FSM state assignment algorithms for low powerdissipation do not target the circuit switching activity directly, but instead minimize only thestate register switching activity. However, we compare not only the state register switchingactivity, but also the gate-level circuit switching activity.
The switching activity is expressed as the number of bit changes in the state register, or thenumber of signal changes in the circuit, that occurred during the simulation. During the simu-lation, each state transition will cause at least one bit to change in the state register. Therefore,the number of state transitions forms a lower bound for the state register switching activity. Inthe experimental results, we provide both the actual state register activity and the value normal-ized to the lower bound. The circuit switching activity can not be normalized to an ideal value,therefore those results need to be compared to the results of the other algorithms during theconcluding algorithm comparison. For the comparison with other algorithms, any incompleteresults will be ignored.
The experiments are run using two sets of 10 input data vector sets each. The first set has1000 input vectors per data set, the second set has 10000 input vectors per data set. The resultsof the experiments for each of the 10 data sets are averaged, and listed separately for the twodata set sizes.
First, we present the results from the new algorithms we propose in this report. Then, wepresent the results of the best, known, existing algorithms. Finally, we will compare the resultsof the algorithms to determine the efficiency of the algorithms we propose.
4.4.1 DFS
In this section, we discuss the results from the implementation of the intermediate-cost DFSstate assignment algorithm, Algorithm 5. This algorithm guarantees to find the optimal stateassignment solution for the FSM for a minimal width state register, at the cost of computingtime. Table 4.2 displays the benchmark results.
Table 4.2: DFS average switching activity
Benchmark 1000 Input Vectors Data Set 10000 Input Vectors Data SetState Register Circuit State Register Circuit
bbara 283.2 124.2% 3893.1 2729.3 123.4% 41512.8bbsse 786.2 115.1% 8358.2 7771.4 115.2% 89415.3bbtas 438.4 100.0% 1955.3 4459.7 100.0% 20078.0beecount 439.3 105.1% 3376.4 4296.0 105.4% 33554.4

44 CHAPTER 4. EXPERIMENTAL RESULTS
Table 4.2: DFS average switching activity (Continued)
Benchmark 1000 Input Vectors Data Set 10000 Input Vectors Data SetState Register Circuit State Register Circuit
cse 240.5 104.7% 8922.4 2374.4 104.5% 88387.5dk14 1108.6 133.9% 14533.2 11061.0 134.3% 156378.2dk15 844.2 119.5% 9301.0 8497.0 120.1% 92876.1dk16 - - - - - -dk17 1024.8 122.4% 9158.1 10327.4 123.1% 89671.4dk27 1186.3 118.6% 4677.5 11887.7 118.9% 49641.2dk512 1183.6 118.4% 9322.6 11834.1 118.3% 98681.2donfile - - - - - -ex1 660.4 127.9% 9498.8 6738.3 130.0% 101464.8ex4 485.5 110.4% 3000.7 4785.7 110.1% 29812.6ex6 1017.3 126.1% 10408.0 10062.9 125.4% 98476.7keyb 548.7 101.2% 16553.1 5570.2 101.3% 159576.3kirkman 501.1 100.0% 9282.9 4995.0 100.0% 93045.1lion 380.5 100.0% 1574.9 3734.0 100.0% 15551.1lion9 446.0 100.0% 1516.0 4442.1 100.0% 14666.3mark1 1300.5 130.1% 8558.4 13039.7 130.4% 87259.3mc 423.3 100.0% 2312.2 4288.9 100.0% 23307.6modulo12 507.8 100.0% - 5005.3 100.0% -opus 937.2 127.2% 7023.2 9355.0 127.5% 71531.0planet - - - - - -pma 536.2 121.1% 8899.3 5309.5 121.8% 88108.0s1 - - - - - -s1488 345.8 114.0% 26777.0 - - -s1494 346.1 114.1% 27526.0 - - -s208 495.0 108.8% 5518.0 4758.1 108.4% 57285.5s27 890.0 129.9% 3675.3 8879.4 130.2% 34044.7s298 - - - - - -s386 775.1 115.1% 9094.7 7730.9 115.2% 89046.7s420 495.0 108.8% 5541.0 4758.1 108.4% 57296.1s510 - - - - - -s8 143.9 115.4% - 1478.5 113.7% -s820 545.2 101.8% 18436.0 5473.4 101.9% 170828.1s832 545.2 101.8% 15968.9 5473.4 101.9% 148959.6sand - - - - - -scf - - - - - -shiftreg 999.9 114.0% 4444.7 9998.7 114.3% 44393.0sse 786.2 115.1% 8358.2 7771.4 115.2% 89415.3styr 551.5 107.9% 25645.0 5483.1 108.1% 236871.6tav 1000.0 100.0% 2499.7 10000.0 100.0% 25000.2tbk - - - - - -tma 188.3 114.4% 2553.9 1804.6 114.9% 21843.1train11 403.1 121.2% 1994.7 4127.5 123.7% 22354.8train4 391.0 100.0% 1126.6 4002.1 100.0% 11522.2
The special benchmarks bbtas, kirkman, lion, lion9, mc, modulo12, tav and train4, de-scribed in Section 4.3, are assigned optimally, resulting in an average state register switchingactivity of 100%, or only one bit change for each state transition. On the other hand, the dk14
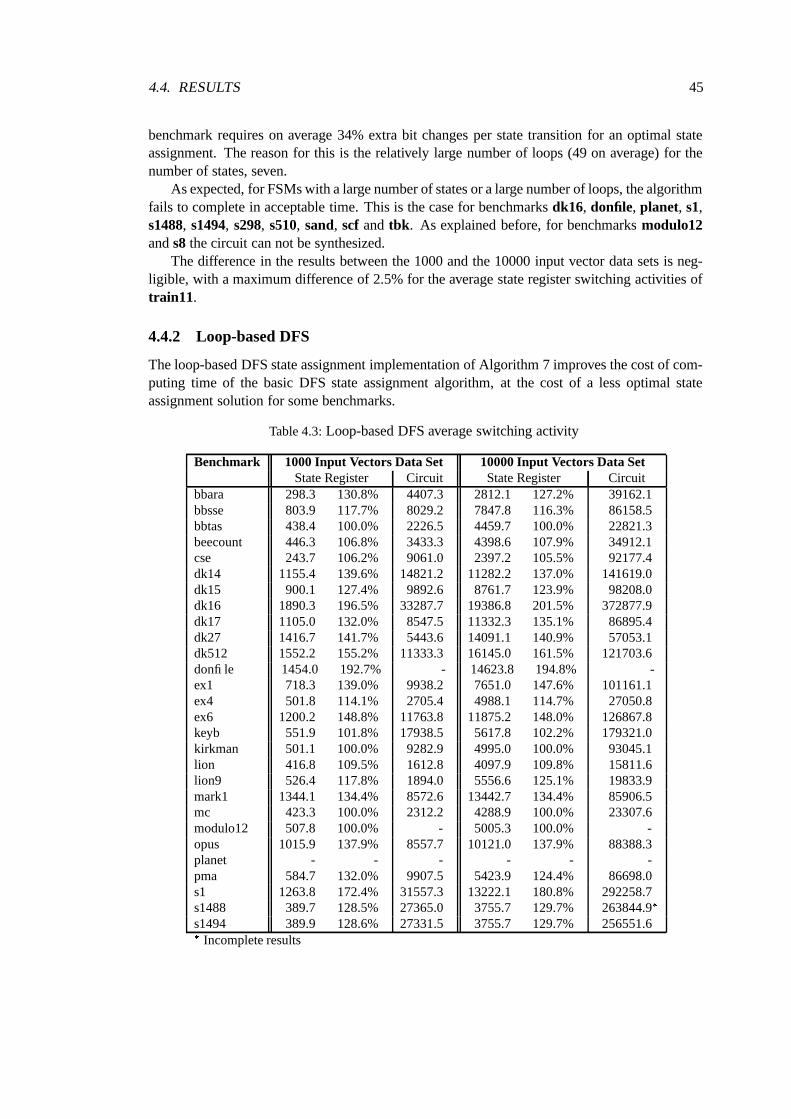
4.4. RESULTS 45
benchmark requires on average 34% extra bit changes per state transition for an optimal stateassignment. The reason for this is the relatively large number of loops (49 on average) for thenumber of states, seven.
As expected, for FSMs with a large number of states or a large number of loops, the algorithmfails to complete in acceptable time. This is the case for benchmarks dk16, donfile, planet, s1,s1488, s1494, s298, s510, sand, scf and tbk. As explained before, for benchmarks modulo12and s8 the circuit can not be synthesized.
The difference in the results between the 1000 and the 10000 input vector data sets is neg-ligible, with a maximum difference of 2.5% for the average state register switching activities oftrain11.
4.4.2 Loop-based DFS
The loop-based DFS state assignment implementation of Algorithm 7 improves the cost of com-puting time of the basic DFS state assignment algorithm, at the cost of a less optimal stateassignment solution for some benchmarks.
Table 4.3: Loop-based DFS average switching activity
Benchmark 1000 Input Vectors Data Set 10000 Input Vectors Data SetState Register Circuit State Register Circuit
bbara 298.3 130.8% 4407.3 2812.1 127.2% 39162.1bbsse 803.9 117.7% 8029.2 7847.8 116.3% 86158.5bbtas 438.4 100.0% 2226.5 4459.7 100.0% 22821.3beecount 446.3 106.8% 3433.3 4398.6 107.9% 34912.1cse 243.7 106.2% 9061.0 2397.2 105.5% 92177.4dk14 1155.4 139.6% 14821.2 11282.2 137.0% 141619.0dk15 900.1 127.4% 9892.6 8761.7 123.9% 98208.0dk16 1890.3 196.5% 33287.7 19386.8 201.5% 372877.9dk17 1105.0 132.0% 8547.5 11332.3 135.1% 86895.4dk27 1416.7 141.7% 5443.6 14091.1 140.9% 57053.1dk512 1552.2 155.2% 11333.3 16145.0 161.5% 121703.6donfile 1454.0 192.7% - 14623.8 194.8% -ex1 718.3 139.0% 9938.2 7651.0 147.6% 101161.1ex4 501.8 114.1% 2705.4 4988.1 114.7% 27050.8ex6 1200.2 148.8% 11763.8 11875.2 148.0% 126867.8keyb 551.9 101.8% 17938.5 5617.8 102.2% 179321.0kirkman 501.1 100.0% 9282.9 4995.0 100.0% 93045.1lion 416.8 109.5% 1612.8 4097.9 109.8% 15811.6lion9 526.4 117.8% 1894.0 5556.6 125.1% 19833.9mark1 1344.1 134.4% 8572.6 13442.7 134.4% 85906.5mc 423.3 100.0% 2312.2 4288.9 100.0% 23307.6modulo12 507.8 100.0% - 5005.3 100.0% -opus 1015.9 137.9% 8557.7 10121.0 137.9% 88388.3planet - - - - - -pma 584.7 132.0% 9907.5 5423.9 124.4% 86698.0s1 1263.8 172.4% 31557.3 13222.1 180.8% 292258.7s1488 389.7 128.5% 27365.0 3755.7 129.7% 263844.9
�
s1494 389.9 128.6% 27331.5 3755.7 129.7% 256551.6�
Incomplete results

46 CHAPTER 4. EXPERIMENTAL RESULTS
Table 4.3: Loop-based DFS average switching activity (Continued)
Benchmark 1000 Input Vectors Data Set 10000 Input Vectors Data SetState Register Circuit State Register Circuit
s208 519.9 114.3% 6603.5 5008.9 114.2% 54666.6s27 980.9 143.1% 4653.0 10179.8 149.3% 50626.0s298 1118.6
�
149.8%�
88218.7�
11952.0 158.8% 1006787.2�
s386 802.3 119.1% 9397.7 7801.5 116.3% 86259.7s420 519.9 114.3% 6048.3 5008.9 114.2% 49019.2s510 - - - - - -s8 150.4 121.1% - 1478.5 113.7% -s820 551.8 103.0% 19941.9 5546.8 103.3% 191724.0s832 551.8 103.0% 16289.1 5546.8 103.3% 159608.7sand 599.5
�
127.8%�
36343.8�
6275.4�
128.7%�
355033.8�
scf - - - - - -shiftreg 1296.3 147.8% 5051.3 12617.0 144.2% 47092.8sse 803.9 117.7% 8029.2 7847.8 116.3% 86158.5styr 555.7 108.7% 26180.8 5523.7 108.9% 235782.9
�
tav 1000.0 100.0% 2499.7 10000.0 100.0% 25000.2tbk 984.2 173.2% 31468.1 10556.0 184.7% 350766.9tma 200.3 121.9% 2670.2 1811.4 115.3% 23701.3train11 403.1 121.2% 1994.7 4127.5 123.7% 21634.0train4 391.0 100.0% 1126.6 4002.1 100.0% 11522.2
�
Incomplete results
This implementation is able to complete almost all state assignments, in acceptable time.Again, the single-loop benchmarks are assigned optimally, lion and lion9 however are not. Thestate assignment solutions for dk16, donfile and sand, benchmarks that the DFS algorithm failedto assign, are the best of all our proposed state assignment algorithms. On average, the resultsare 7.2% worse than the solutions of the DFS algorithm.
For some input vector data sets, the algorithm fails to find a state assignment or circuitsolution in acceptable time. The average results shown in the table only take into account thevalid solutions, thus care must be taken when comparing the resulting average to averages fromcomplete results.
4.4.3 Loop-based Heuristic
The loop-based state assignment heuristic (Algorithm 9) is tested with each of the three differentloop sorting weight functions we propose. Table 4.4 shows the best average state register resultsobtained, and the weight function(s) that produced them. The circuit switching activity resultsshown correspond to that weight function.
Table 4.4: Loop-based Heuristic average switching activity
Benchmark 1000 Input Vectors Data Set 10000 Input Vectors Data SetState Register Circuit State Register Circuit
bbara 292.8�
128.4%�
4033.6�
2797.9�
126.6%�
41168.2�
�
Incomplete results����������� � ��� ������������� ������������ � ��� �����������������! "$#%$�& ����������� � ��� �����������������('���)
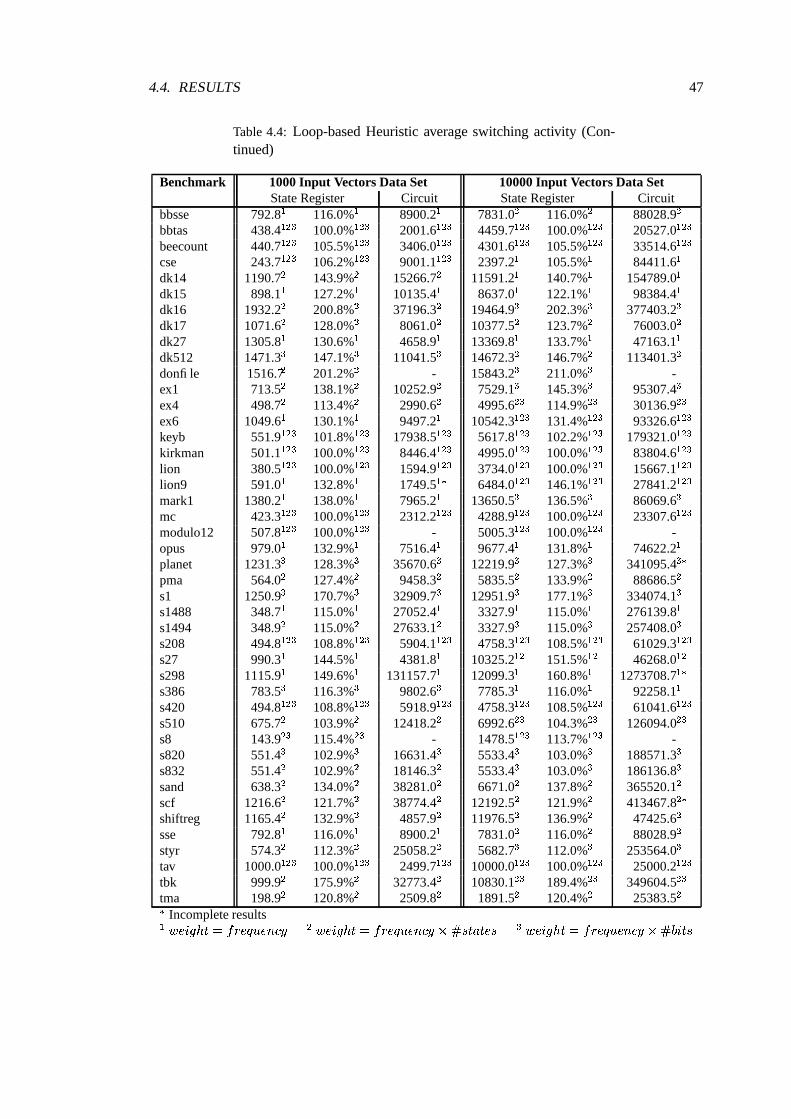
4.4. RESULTS 47
Table 4.4: Loop-based Heuristic average switching activity (Con-tinued)
Benchmark 1000 Input Vectors Data Set 10000 Input Vectors Data SetState Register Circuit State Register Circuit
bbsse 792.8�
116.0%�
8900.2�
7831.0�
116.0%�
88028.9�
bbtas 438.4� � �
100.0%� � �
2001.6� � �
4459.7� � �
100.0%� � �
20527.0� � �
beecount 440.7� � �
105.5%� � �
3406.0� � �
4301.6� � �
105.5%� � �
33514.6� � �
cse 243.7� � �
106.2%� � �
9001.1� � �
2397.2�
105.5%�
84411.6�
dk14 1190.7�
143.9%�
15266.7�
11591.2�
140.7%�
154789.0�
dk15 898.1�
127.2%�
10135.4�
8637.0�
122.1%�
98384.4�
dk16 1932.2�
200.8%�
37196.3�
19464.9�
202.3%�
377403.2�
dk17 1071.6�
128.0%�
8061.0�
10377.5�
123.7%�
76003.0�
dk27 1305.8�
130.6%�
4658.9�
13369.8�
133.7%�
47163.1�
dk512 1471.3�
147.1%�
11041.5�
14672.3�
146.7%�
113401.3�
donfile 1516.7�
201.2%�
- 15843.2�
211.0%�
-ex1 713.5
�
138.1%�
10252.9�
7529.1�
145.3%�
95307.4�
ex4 498.7�
113.4%�
2990.6�
4995.6� �
114.9%� �
30136.9� �
ex6 1049.6�
130.1%�
9497.2�
10542.3� � �
131.4%� � �
93326.6� � �
keyb 551.9� � �
101.8%� � �
17938.5� � �
5617.8� � �
102.2%� � �
179321.0� � �
kirkman 501.1� � �
100.0%� � �
8446.4� � �
4995.0� � �
100.0%� � �
83804.6� � �
lion 380.5� � �
100.0%� � �
1594.9� � �
3734.0� � �
100.0%� � �
15667.1� � �
lion9 591.0�
132.8%�
1749.5� �
6484.0� � �
146.1%� � �
27841.2� � �
mark1 1380.2�
138.0%�
7965.2�
13650.5�
136.5%�
86069.6�
mc 423.3� � �
100.0%� � �
2312.2� � �
4288.9� � �
100.0%� � �
23307.6� � �
modulo12 507.8� � �
100.0%� � �
- 5005.3� � �
100.0%� � �
-opus 979.0
�
132.9%�
7516.4�
9677.4�
131.8%�
74622.2�
planet 1231.3�
128.3%�
35670.6�
12219.9�
127.3%�
341095.4� �
pma 564.0�
127.4%�
9458.3�
5835.5�
133.9%�
88686.5�
s1 1250.9�
170.7%�
32909.7�
12951.9�
177.1%�
334074.1�
s1488 348.7�
115.0%�
27052.4�
3327.9�
115.0%�
276139.8�
s1494 348.9�
115.0%�
27633.1�
3327.9�
115.0%�
257408.0�
s208 494.8� � �
108.8%� � �
5904.1� � �
4758.3� � �
108.5%� � �
61029.3� � �
s27 990.3�
144.5%�
4381.8�
10325.2� �
151.5%� �
46268.0� �
s298 1115.9�
149.6%�
131157.7�
12099.3�
160.8%�
1273708.7� �
s386 783.5�
116.3%�
9802.6�
7785.3�
116.0%�
92258.1�
s420 494.8� � �
108.8%� � �
5918.9� � �
4758.3� � �
108.5%� � �
61041.6� � �
s510 675.7�
103.9%�
12418.2�
6992.6� �
104.3%� �
126094.0� �
s8 143.9� �
115.4%� �
- 1478.5� � �
113.7%� � �
-s820 551.4
�
102.9%�
16631.4�
5533.4�
103.0%�
188571.3�
s832 551.4�
102.9%�
18146.3�
5533.4�
103.0%�
186136.8�
sand 638.3�
134.0%�
38281.0�
6671.0�
137.8%�
365520.1�
scf 1216.6�
121.7%�
38774.4�
12192.5�
121.9%�
413467.8� �
shiftreg 1165.4�
132.9%�
4857.9�
11976.5�
136.9%�
47425.6�
sse 792.8�
116.0%�
8900.2�
7831.0�
116.0%�
88028.9�
styr 574.3�
112.3%�
25058.2�
5682.7�
112.0%�
253564.0�
tav 1000.0� � �
100.0%� � �
2499.7� � �
10000.0� � �
100.0%� � �
25000.2� � �
tbk 999.9�
175.9%�
32773.4�
10830.1� �
189.4%� �
349604.5� �
tma 198.9�
120.8%�
2509.8�
1891.5�
120.4%�
25383.5�
�
Incomplete results����������� � ��� ������������� ������������ � ��� �����������������! "$#%$�& ����������� � ��� �����������������('���)

48 CHAPTER 4. EXPERIMENTAL RESULTS
Table 4.4: Loop-based Heuristic average switching activity (Con-tinued)
Benchmark 1000 Input Vectors Data Set 10000 Input Vectors Data SetState Register Circuit State Register Circuit
train11 406.8� � �
122.3%� � �
2272.0� � �
4150.0� � �
124.4%� � �
23615.0� � �
train4 391.0� � �
100.0%� � �
1126.6� � �
4002.1� � �
100.0%� � �
11522.2� � �
�
Incomplete results����������� � ��� ������������� ������������ � ��� �����������������! "$#%$�& ����������� � ��� �����������������('���)
The heuristic is able to determine a state assignment solution (nearly) instantly, and forall benchmarks. The algorithm performs optimally for the single-loop benchmarks and lion,however the result for lion9 is not optimal. For s1488, s1494 and s298, the results are betterthan the solutions of the other algorithms, and for many other benchmarks, the best solution isequaled. Overall, the results are 5.0% worse than the solutions of the DFS algorithm, but 5.3%better than the loop-based DFS algorithm solutions.
The second weight function has a small advantage over the weight functions: 48 times, thesecond function results in the best solution, versus 44 times for the first function, and 40 times forthe third function. However, the heuristic is fast enough that all three functions can be comparedto obtain the best solution, by utilizing the loops statistics to estimate the state register switchingactivity.
4.4.3.1 Dynamic Heuristic
The loop-based state assignment heuristic (Algorithm 9) offers the preliminary option to dynam-ically increase the number of latches of the state register. By expanding the state register, thedynamic heuristic can always find a code that differs in only one bit from the previous state’scode. The results are obtained utilizing the first weight function, � � � '�$ � � ���1����� � � +�� . If theheuristic does not require a wider register, the results equal the basic loop-based heuristic results.To highlight the differences between the basic results and the new results, only the benchmarksfor which more than half of the encodings utilize a wider register are shown in Table 4.5.
Table 4.5: Loop-based Dynamic Latch-allocation Heuristic averageswitching activity
Benchmark 1000 Input Vectors Data Set 10000 Input Vectors Data SetState Register Circuit State Register Circuit
dk15 885.9 125.5% 10209.9 8451.0 119.5% 100641.7dk16 1985.7 206.4% 36747.6 19561.9 203.3% 370429.4dk17 1189.3 142.1% 9818.3 12131.3 144.7% 99971.9dk512 1543.5 154.4% 10712.2 16813.6 168.1% 117584.4donfile 1622.9 215.2% - 17342.4 230.9% -mark1 1357.1 135.7% 8420.3 13622.4 136.2% 88290.6opus 975.2 132.3% 7303.2 9677.4 131.8% 77249.8planet 1239.7 129.3% 36808.4 12161.2 126.6% 412652.4
�
s1 1326.5 181.1% 36194.3 13101.7 179.2% 357042.2sand 678.5 142.4% 39335.1 6814.8 140.7% 356968.9
�
Incomplete results
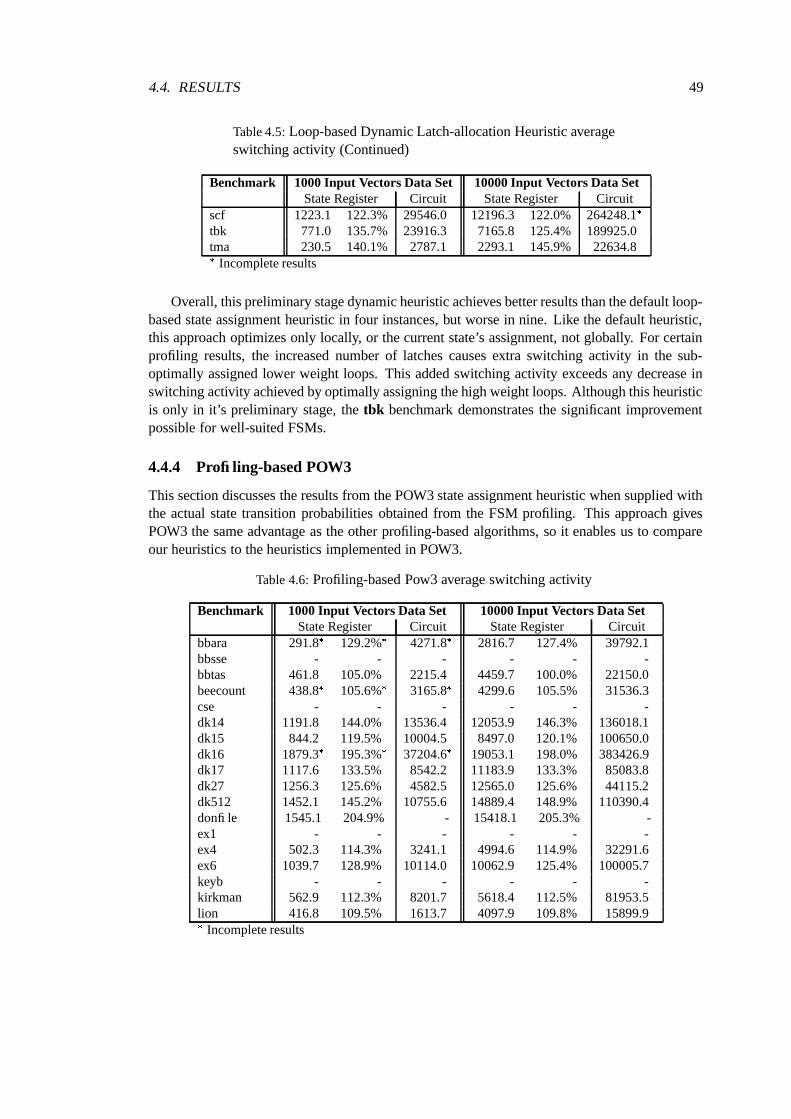
4.4. RESULTS 49
Table 4.5: Loop-based Dynamic Latch-allocation Heuristic averageswitching activity (Continued)
Benchmark 1000 Input Vectors Data Set 10000 Input Vectors Data SetState Register Circuit State Register Circuit
scf 1223.1 122.3% 29546.0 12196.3 122.0% 264248.1�
tbk 771.0 135.7% 23916.3 7165.8 125.4% 189925.0tma 230.5 140.1% 2787.1 2293.1 145.9% 22634.8
�
Incomplete results
Overall, this preliminary stage dynamic heuristic achieves better results than the default loop-based state assignment heuristic in four instances, but worse in nine. Like the default heuristic,this approach optimizes only locally, or the current state’s assignment, not globally. For certainprofiling results, the increased number of latches causes extra switching activity in the sub-optimally assigned lower weight loops. This added switching activity exceeds any decrease inswitching activity achieved by optimally assigning the high weight loops. Although this heuristicis only in it’s preliminary stage, the tbk benchmark demonstrates the significant improvementpossible for well-suited FSMs.
4.4.4 Profiling-based POW3
This section discusses the results from the POW3 state assignment heuristic when supplied withthe actual state transition probabilities obtained from the FSM profiling. This approach givesPOW3 the same advantage as the other profiling-based algorithms, so it enables us to compareour heuristics to the heuristics implemented in POW3.
Table 4.6: Profiling-based Pow3 average switching activity
Benchmark 1000 Input Vectors Data Set 10000 Input Vectors Data SetState Register Circuit State Register Circuit
bbara 291.8�
129.2%�
4271.8�
2816.7 127.4% 39792.1bbsse - - - - - -bbtas 461.8 105.0% 2215.4 4459.7 100.0% 22150.0beecount 438.8
�
105.6%�
3165.8�
4299.6 105.5% 31536.3cse - - - - - -dk14 1191.8 144.0% 13536.4 12053.9 146.3% 136018.1dk15 844.2 119.5% 10004.5 8497.0 120.1% 100650.0dk16 1879.3
�
195.3%�
37204.6�
19053.1 198.0% 383426.9dk17 1117.6 133.5% 8542.2 11183.9 133.3% 85083.8dk27 1256.3 125.6% 4582.5 12565.0 125.6% 44115.2dk512 1452.1 145.2% 10755.6 14889.4 148.9% 110390.4donfile 1545.1 204.9% - 15418.1 205.3% -ex1 - - - - - -ex4 502.3 114.3% 3241.1 4994.6 114.9% 32291.6ex6 1039.7 128.9% 10114.0 10062.9 125.4% 100005.7keyb - - - - - -kirkman 562.9 112.3% 8201.7 5618.4 112.5% 81953.5lion 416.8 109.5% 1613.7 4097.9 109.8% 15899.9
�
Incomplete results

50 CHAPTER 4. EXPERIMENTAL RESULTS
Table 4.6: Profiling-based Pow3 average switching activity (Con-tinued)
Benchmark 1000 Input Vectors Data Set 10000 Input Vectors Data SetState Register Circuit State Register Circuit
lion9 518.9 116.3% 1785.6 5556.6 125.1% 20095.7mark1 1376.2 137.6% 8587.3 13767.5 137.7% 85788.9mc 423.3 100.0% 2312.2 4288.9 100.0% 23307.6modulo12 507.8 100.0% - 5005.3 100.0% -opus 1028.5 139.6% 9245.2 10272.6 139.9% 92128.8planet 1428.8
�
147.8%�
50327.5�
14852.1 154.7% -pma - - - - - -s1 1210.0 165.0% 33356.1
�
12145.1 166.1% 332168.2s1488 - - - - - -s1494 - - - - - -s208 - - - - - -s27 915.5 133.7% 4175.8 9002.4 132.1% 37536.5s298 - - - - - -s386 - - - - - -s420 - - - - - -s510 771.9 118.6% 17162.8 8052.5 120.1% 154454.9s8 167.7 134.3% - 1732.1 133.1% -s820 - - - - - -s832 - - - - - -sand 834.0
�
178.2%�
41683.0�
8323.5 171.9% 397018.9�
scf - - - - - -shiftreg 1283.4 146.3% 5234.1 13195.3 150.8% 58367.8sse - - - - - -styr - - - - - -tav 1000.0 100.0% 2499.7 10000.0 100.0% 25000.2tbk 961.9 169.2% 34208.6 10225.3 178.9% 335687.2tma - - - 2296.7
�
144.1%�
27251.7�
train11 418.4 125.8% 2170.7 4182.4 125.4% 19856.2train4 391.0 100.0% 1126.0 4002.1 100.0% 11521.6
�
Incomplete results
Problems with the implementation of the POW3 algorithm result in a lot of missing results.For the remaining results, this approach is on average 7.6% worse than our heuristic approach.
4.4.5 Noth e.a.
The spanning tree based state assignment algorithm by Noth and Kolla [6] has been implementedutilizing four different heuristics. The best results are shown in Table 4.7.
Table 4.7: Noth e.a. average switching activity
Benchmark 1000 Input Vectors Data Set 10000 Input Vectors Data SetState Register Circuit State Register Circuit
bbara 288.8� �
126.6%� �
4083.2� �
2771.7� �
125.4%� �
40313.2� �
�
Wider register�
fastk�
fastp�
greedyk�
greedyp
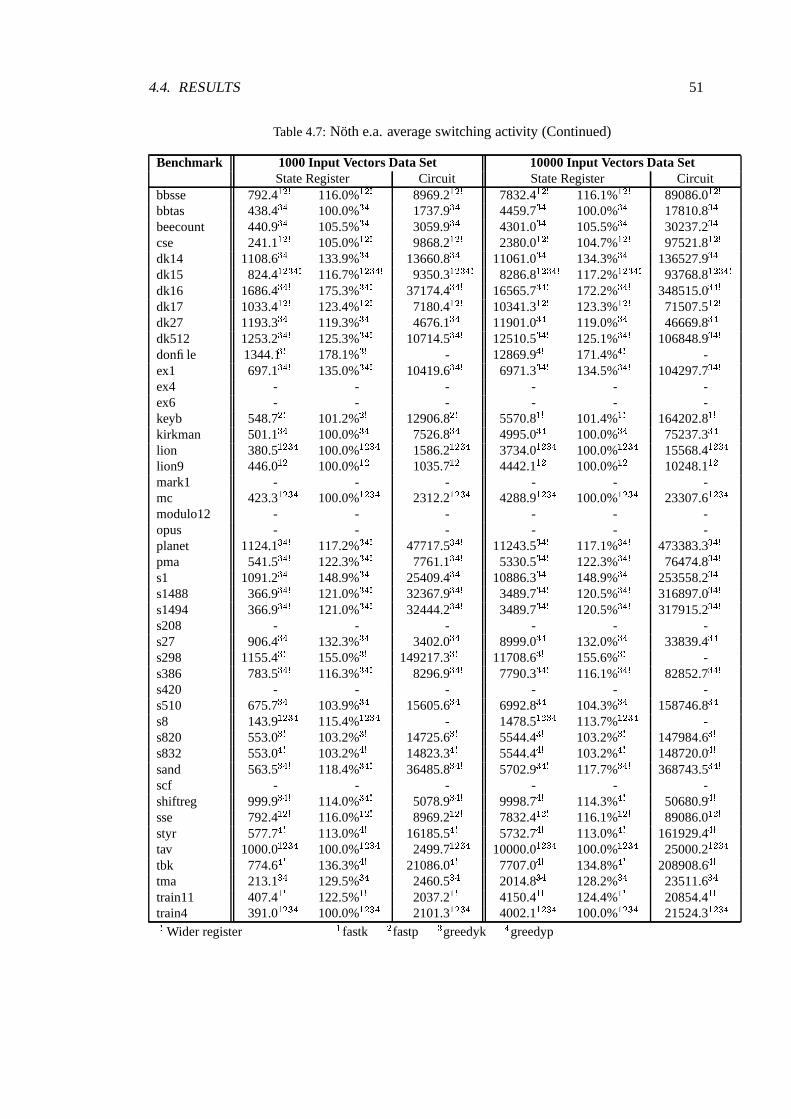
4.4. RESULTS 51
Table 4.7: Noth e.a. average switching activity (Continued)
Benchmark 1000 Input Vectors Data Set 10000 Input Vectors Data SetState Register Circuit State Register Circuit
bbsse 792.4� � �
116.0%� � �
8969.2� � �
7832.4� � �
116.1%� � �
89086.0� � �
bbtas 438.4� �
100.0%� �
1737.9� �
4459.7� �
100.0%� �
17810.8� �
beecount 440.9� �
105.5%� �
3059.9� �
4301.0� �
105.5%� �
30237.2� �
cse 241.1� � �
105.0%� � �
9868.2� � �
2380.0� � �
104.7%� � �
97521.8� � �
dk14 1108.6� �
133.9%� �
13660.8� �
11061.0� �
134.3%� �
136527.9� �
dk15 824.4� � � � �
116.7%� � � � �
9350.3� � � � �
8286.8� � � � �
117.2%� � � � �
93768.8� � � � �
dk16 1686.4� � �
175.3%� � �
37174.4� � �
16565.7� � �
172.2%� � �
348515.0� � �
dk17 1033.4� � �
123.4%� � �
7180.4� � �
10341.3� � �
123.3%� � �
71507.5� � �
dk27 1193.3� �
119.3%� �
4676.1� �
11901.0� �
119.0%� �
46669.8� �
dk512 1253.2� � �
125.3%� � �
10714.5� � �
12510.5� � �
125.1%� � �
106848.9� � �
donfile 1344.1� �
178.1%� �
- 12869.9� �
171.4%� �
-ex1 697.1
� � �
135.0%� � �
10419.6� � �
6971.3� � �
134.5%� � �
104297.7� � �
ex4 - - - - - -ex6 - - - - - -keyb 548.7
� �
101.2%� �
12906.8� �
5570.8� �
101.4%� �
164202.8� �
kirkman 501.1� �
100.0%� �
7526.8� �
4995.0� �
100.0%� �
75237.3� �
lion 380.5� � � �
100.0%� � � �
1586.2� � � �
3734.0� � � �
100.0%� � � �
15568.4� � � �
lion9 446.0� �
100.0%� �
1035.7� �
4442.1� �
100.0%� �
10248.1� �
mark1 - - - - - -mc 423.3
� � � �
100.0%� � � �
2312.2� � � �
4288.9� � � �
100.0%� � � �
23307.6� � � �
modulo12 - - - - - -opus - - - - - -planet 1124.1
� � �
117.2%� � �
47717.5� � �
11243.5� � �
117.1%� � �
473383.3� � �
pma 541.5� � �
122.3%� � �
7761.1� � �
5330.5� � �
122.3%� � �
76474.8� � �
s1 1091.2� �
148.9%� �
25409.4� �
10886.3� �
148.9%� �
253558.2� �
s1488 366.9� � �
121.0%� � �
32367.9� � �
3489.7� � �
120.5%� � �
316897.0� � �
s1494 366.9� � �
121.0%� � �
32444.2� � �
3489.7� � �
120.5%� � �
317915.2� � �
s208 - - - - - -s27 906.4
� �
132.3%� �
3402.0� �
8999.0� �
132.0%� �
33839.4� �
s298 1155.4� �
155.0%� �
149217.3� �
11708.6� �
155.6%� �
-s386 783.5
� � �
116.3%� � �
8296.9� � �
7790.3� � �
116.1%� � �
82852.7� � �
s420 - - - - - -s510 675.7
� �
103.9%� �
15605.6� �
6992.8� �
104.3%� �
158746.8� �
s8 143.9� � � �
115.4%� � � �
- 1478.5� � � �
113.7%� � � �
-s820 553.0
� �
103.2%� �
14725.6� �
5544.4� �
103.2%� �
147984.6� �
s832 553.0� �
103.2%� �
14823.3� �
5544.4� �
103.2%� �
148720.0� �
sand 563.5� � �
118.4%� � �
36485.8� � �
5702.9� � �
117.7%� � �
368743.5� � �
scf - - - - - -shiftreg 999.9
� � �
114.0%� � �
5078.9� � �
9998.7� �
114.3%� �
50680.9� �
sse 792.4� � �
116.0%� � �
8969.2� � �
7832.4� � �
116.1%� � �
89086.0� � �
styr 577.7� �
113.0%� �
16185.5� �
5732.7� �
113.0%� �
161929.4� �
tav 1000.0� � � �
100.0%� � � �
2499.7� � � �
10000.0� � � �
100.0%� � � �
25000.2� � � �
tbk 774.6� �
136.3%� �
21086.0� �
7707.0� �
134.8%� �
208908.6� �
tma 213.1� �
129.5%� �
2460.5� �
2014.8� �
128.2%� �
23511.6� �
train11 407.4� �
122.5%� �
2037.2� �
4150.4� �
124.4%� �
20854.4� �
train4 391.0� � � �
100.0%� � � �
2101.3� � � �
4002.1� � � �
100.0%� � � �
21524.3� � � �
�
Wider register�
fastk�
fastp�
greedyk�
greedyp
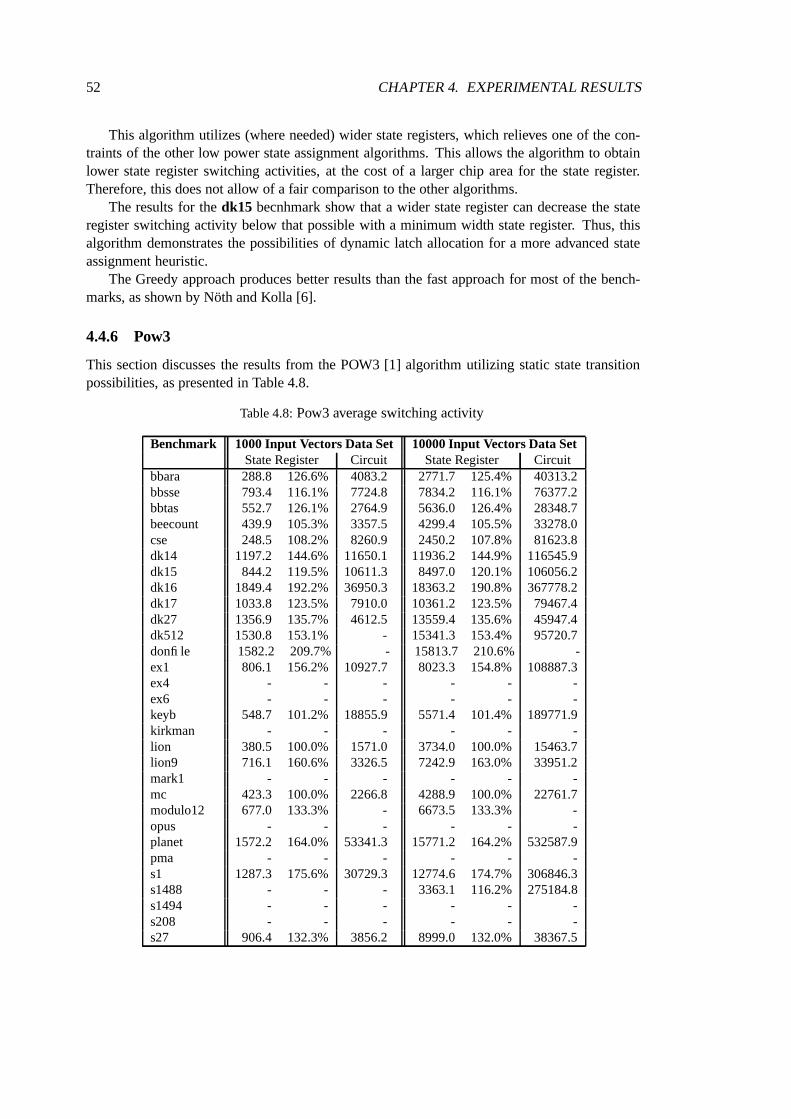
52 CHAPTER 4. EXPERIMENTAL RESULTS
This algorithm utilizes (where needed) wider state registers, which relieves one of the con-traints of the other low power state assignment algorithms. This allows the algorithm to obtainlower state register switching activities, at the cost of a larger chip area for the state register.Therefore, this does not allow of a fair comparison to the other algorithms.
The results for the dk15 becnhmark show that a wider state register can decrease the stateregister switching activity below that possible with a minimum width state register. Thus, thisalgorithm demonstrates the possibilities of dynamic latch allocation for a more advanced stateassignment heuristic.
The Greedy approach produces better results than the fast approach for most of the bench-marks, as shown by Noth and Kolla [6].
4.4.6 Pow3
This section discusses the results from the POW3 [1] algorithm utilizing static state transitionpossibilities, as presented in Table 4.8.
Table 4.8: Pow3 average switching activity
Benchmark 1000 Input Vectors Data Set 10000 Input Vectors Data SetState Register Circuit State Register Circuit
bbara 288.8 126.6% 4083.2 2771.7 125.4% 40313.2bbsse 793.4 116.1% 7724.8 7834.2 116.1% 76377.2bbtas 552.7 126.1% 2764.9 5636.0 126.4% 28348.7beecount 439.9 105.3% 3357.5 4299.4 105.5% 33278.0cse 248.5 108.2% 8260.9 2450.2 107.8% 81623.8dk14 1197.2 144.6% 11650.1 11936.2 144.9% 116545.9dk15 844.2 119.5% 10611.3 8497.0 120.1% 106056.2dk16 1849.4 192.2% 36950.3 18363.2 190.8% 367778.2dk17 1033.8 123.5% 7910.0 10361.2 123.5% 79467.4dk27 1356.9 135.7% 4612.5 13559.4 135.6% 45947.4dk512 1530.8 153.1% - 15341.3 153.4% 95720.7donfile 1582.2 209.7% - 15813.7 210.6% -ex1 806.1 156.2% 10927.7 8023.3 154.8% 108887.3ex4 - - - - - -ex6 - - - - - -keyb 548.7 101.2% 18855.9 5571.4 101.4% 189771.9kirkman - - - - - -lion 380.5 100.0% 1571.0 3734.0 100.0% 15463.7lion9 716.1 160.6% 3326.5 7242.9 163.0% 33951.2mark1 - - - - - -mc 423.3 100.0% 2266.8 4288.9 100.0% 22761.7modulo12 677.0 133.3% - 6673.5 133.3% -opus - - - - - -planet 1572.2 164.0% 53341.3 15771.2 164.2% 532587.9pma - - - - - -s1 1287.3 175.6% 30729.3 12774.6 174.7% 306846.3s1488 - - - 3363.1 116.2% 275184.8s1494 - - - - - -s208 - - - - - -s27 906.4 132.3% 3856.2 8999.0 132.0% 38367.5
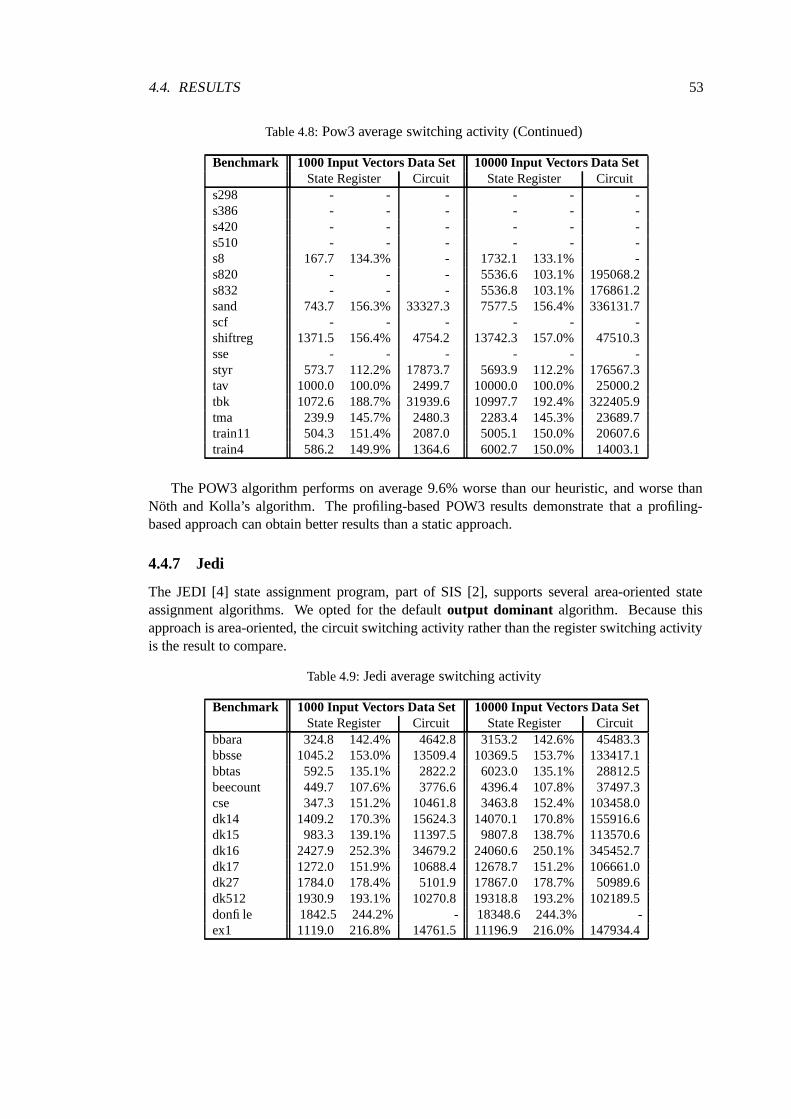
4.4. RESULTS 53
Table 4.8: Pow3 average switching activity (Continued)
Benchmark 1000 Input Vectors Data Set 10000 Input Vectors Data SetState Register Circuit State Register Circuit
s298 - - - - - -s386 - - - - - -s420 - - - - - -s510 - - - - - -s8 167.7 134.3% - 1732.1 133.1% -s820 - - - 5536.6 103.1% 195068.2s832 - - - 5536.8 103.1% 176861.2sand 743.7 156.3% 33327.3 7577.5 156.4% 336131.7scf - - - - - -shiftreg 1371.5 156.4% 4754.2 13742.3 157.0% 47510.3sse - - - - - -styr 573.7 112.2% 17873.7 5693.9 112.2% 176567.3tav 1000.0 100.0% 2499.7 10000.0 100.0% 25000.2tbk 1072.6 188.7% 31939.6 10997.7 192.4% 322405.9tma 239.9 145.7% 2480.3 2283.4 145.3% 23689.7train11 504.3 151.4% 2087.0 5005.1 150.0% 20607.6train4 586.2 149.9% 1364.6 6002.7 150.0% 14003.1
The POW3 algorithm performs on average 9.6% worse than our heuristic, and worse thanNoth and Kolla’s algorithm. The profiling-based POW3 results demonstrate that a profiling-based approach can obtain better results than a static approach.
4.4.7 Jedi
The JEDI [4] state assignment program, part of SIS [2], supports several area-oriented stateassignment algorithms. We opted for the default output dominant algorithm. Because thisapproach is area-oriented, the circuit switching activity rather than the register switching activityis the result to compare.
Table 4.9: Jedi average switching activity
Benchmark 1000 Input Vectors Data Set 10000 Input Vectors Data SetState Register Circuit State Register Circuit
bbara 324.8 142.4% 4642.8 3153.2 142.6% 45483.3bbsse 1045.2 153.0% 13509.4 10369.5 153.7% 133417.1bbtas 592.5 135.1% 2822.2 6023.0 135.1% 28812.5beecount 449.7 107.6% 3776.6 4396.4 107.8% 37497.3cse 347.3 151.2% 10461.8 3463.8 152.4% 103458.0dk14 1409.2 170.3% 15624.3 14070.1 170.8% 155916.6dk15 983.3 139.1% 11397.5 9807.8 138.7% 113570.6dk16 2427.9 252.3% 34679.2 24060.6 250.1% 345452.7dk17 1272.0 151.9% 10688.4 12678.7 151.2% 106661.0dk27 1784.0 178.4% 5101.9 17867.0 178.7% 50989.6dk512 1930.9 193.1% 10270.8 19318.8 193.2% 102189.5donfile 1842.5 244.2% - 18348.6 244.3% -ex1 1119.0 216.8% 14761.5 11196.9 216.0% 147934.4

54 CHAPTER 4. EXPERIMENTAL RESULTS
Table 4.9: Jedi average switching activity (Continued)
Benchmark 1000 Input Vectors Data Set 10000 Input Vectors Data SetState Register Circuit State Register Circuit
ex4 905.4 206.0% 5023.3 8915.8 205.1% 49962.6ex6 1267.1 157.1% 11381.4 12724.6 158.6% 113984.8keyb 643.1 118.6% 25679.2 6505.2 118.4% 258140.5kirkman 814.7 162.6% 9567.4 8117.0 162.5% 95420.5lion 510.9 134.2% 1696.1 4981.5 133.4% 16420.6lion9 547.3 122.8% 1031.2 5587.4 125.8% 10709.5mark1 1797.7 179.8% 9624.2 17977.7 179.8% 96291.0mc 423.3 100.0% 2266.8 4288.9 100.0% 22761.7modulo12 507.8 100.0% - 5005.3 100.0% -opus 1070.2 145.3% 7483.6 10690.6 145.6% 74764.7planet 3249.4 338.9% 66576.3 32540.5 338.9% 665284.7pma 899.8 203.2% 12614.4 8851.0 203.0% 123867.8s1 1338.0 182.5% 23696.2 13316.3 182.1% 236549.6s1488 638.8 210.7% 26050.6 6102.8 210.8% 254273.1s1494 639.1 210.8% 31213.9 6099.4 210.7% 304712.5s208 521.9 114.7% 7282.9 5010.6 114.2% 70658.1s27 916.8 133.8% 2638.9 9104.6 133.6% 26294.3s298 2059.2 276.1% 107735.8 20905.0 277.8% -s386 908.4 134.9% 8838.3 8962.6 133.6% 87722.3s420 626.9 137.8% 8769.1 5999.6 136.7% 84705.8s510 1510.0 232.1% 26310.1 15481.5 230.8% 268001.0s8 143.9 115.4% - 1478.5 113.7% -s820 1585.4 296.0% 24116.0 15902.2 296.1% 242430.0s832 1579.8 295.0% 28877.1 15842.4 295.0% 289800.9sand 750.7 157.7% 39191.8 7665.9 158.3% 394476.4scf 3661.2 366.1% 80041.1 36654.0 366.5% 799571.7shiftreg 1500.1 171.0% 2496.5 15004.7 171.5% 24999.8sse 1045.2 153.0% 13509.4 10369.5 153.7% 133417.1styr 613.7 120.0% 27833.6 6086.7 120.0% -tav 1500.0 150.0% 3498.7 15000.0 150.0% 34999.2tbk 1013.2 178.3% 15418.6 10345.7 181.0% 155867.4tma 376.5 228.9% 4129.1 3597.9 229.0% 39708.4train11 510.5 153.3% 1985.3 5039.5 151.1% 19383.9train4 391.0 100.0% 1959.5 4002.1 100.0% 20046.8
The state register switching activities obtained by this area-oriented approach are generallysignificantly worse than the results from the other algorithms. On average, the results from JEDIare 41% worse than the results for our heuristic. Only for the s27 benchmark is JEDI’s resultbetter.
4.4.8 Comparison
FSM state assignment algorithms for low power target the power dissipation of FSMs throughthe switching activity in the state register, an approach shared by our algorithms as well as theNoth and Kolla and POW3 algorithms. Therefore, a comparison of the resulting state registerswitching activity is a valid means to determine the effectiveness of our algorithms.

4.4. RESULTS 55
As the individual results show, the difference in the results for the 1000 and the 10000 inputvector data sets is insignificant. Therefore, we compare the algorithms by the average of all 1000and 10000 input vector state register switching activity results. Table 4.10 shows the resultingaverage state register switching activity for all algorithms. Incomplete results are excluded fromthe overall average and the number of best results.
Table 4.10: Overall state register switching activity
Benchmark DFSLoopDFS Heuristic
DynamicHeuristic
ProfilingPOW3 Noth POW3 JEDI
bbara 123.8% 129.0% 127.5% � 127.9%�
126.0% 126.0% 142.5%bbsse 115.1% 117.0% 116.0% � - 116.0%
�
116.1% 153.3%bbtas 100.0% 100.0% 100.0% � 102.5% 100.0% 126.3% 135.1%beecount 105.3% 107.4% 105.5% � 105.5%
�
105.5% 105.4% 107.7%cse 104.6% 105.8% 105.8% � - 104.9%
�
108.0% 151.8%dk14 134.1% 138.3% 142.3% � 145.2% 134.1% 144.8% 170.5%dk15 119.8% 125.7% 124.6% 122.5% 119.8% 116.9%
�
119.8% 138.9%dk16 - 199.0% 201.5% 204.9% 196.7%
�
173.7%�
191.5% 251.2%dk17 122.8% 133.6% 125.9% 143.4% 133.4% 123.4%
�
123.5% 151.6%dk27 118.8% 141.3% 132.1% � 125.6% 119.2% 135.6% 178.5%dk512 118.4% 158.3% 146.9% 161.2% 147.1% 125.2%
�
153.2% 193.1%donfile - 193.7% 206.1% 223.1% 205.1% 174.8%
�
210.1% 244.3%ex1 129.0% 143.3% 141.7% � - 134.8%
�
155.5% 216.4%ex4 110.3% 114.4% 114.2% � 114.6% - - 205.5%ex6 125.8% 148.4% 130.8% � 127.2% - - 157.9%keyb 101.3% 102.0% 102.0% � - 101.3%
�
101.3% 118.5%kirkman 100.0% 100.0% 100.0% � 112.4% 100.0% - 162.5%lion 100.0% 109.7% 100.0% � 109.7% 100.0% 100.0% 133.8%lion9 100.0% 121.5% 139.5% � 120.7% 100.0% 161.8% 124.3%mark1 130.2% 134.4% 137.3% 136.0% 137.6% - - 179.8%mc 100.0% 100.0% 100.0% � 100.0% 100.0% 100.0% 100.0%modulo12 100.0% 100.0% 100.0% � 100.0% - 133.3% 100.0%opus 127.3% 137.9% 132.4% 132.1% 139.8% - - 145.5%planet - - 127.8% 128.0% 152.4%
�
117.2%�
164.1% 338.9%pma 121.4% 128.2% 130.6% � - 122.3%
�
- 203.1%s1 - 176.6% 173.9% 180.2% 165.6% 148.9% 175.2% 182.3%s1488 114.0%
�
129.1% 115.0% � - 120.8%�
116.2%�
210.7%s1494 114.1%
�
129.1% 115.0% � - 120.8%�
- 210.7%s208 108.6% 114.2% 108.6% � - - - 114.5%s27 130.1% 146.2% 148.0% � 132.9% 132.2% 132.2% 133.7%s298 - 154.5%
�
155.2% � - 155.3%�
- 277.0%s386 115.2% 117.7% 116.2% � - 116.2%
�
- 134.2%s420 108.6% 114.2% 108.6% � - - - 137.3%s510 - - 104.1% � 119.3% 104.1% - 231.4%s8 114.5% 117.4% 114.5% � 133.7% 114.5% 133.7% 114.5%s820 101.8% 103.1% 103.0% � - 103.2%
�
103.1%�
296.1%s832 101.8% 103.1% 103.0% � - 103.2%
�
103.1%�
295.0%sand - 128.3%
�
135.9% 141.6% 172.4%�
118.1%�
156.4% 158.0%scf - - 121.8% 122.1% - - - 366.3%shiftreg 114.1% 146.0% 134.9% � 148.6% 114.1%
�
156.7% 171.2%�
Incomplete results�
Wider register

56 CHAPTER 4. EXPERIMENTAL RESULTS
Table 4.10: Overall state register switching activity (Continued)
Benchmark DFSLoopDFS Heuristic
DynamicHeuristic
ProfilingPOW3 Noth POW3 JEDI
sse 115.1% 117.0% 116.0% � - 116.0%�
- 153.3%styr 108.0% 108.8% 112.2% � - 113.0%
�
112.2% 120.0%tav 100.0% 100.0% 100.0% � 100.0% 100.0% 100.0% 150.0%tbk - 178.9% 182.7% 130.5% 174.1% 135.5%
�
190.6% 179.6%tma 114.6% 118.6% 120.6% 143.0% 144.1%
�
128.9% 145.5% 228.9%train11 122.4% 122.4% 123.4% � 125.6% 123.5%
�
150.7% 152.2%train4 100.0% 100.0% 100.0% � 100.0% 100.0% 150.0% 100.0%Average 112.9% 127.7% 125.6% 126.3% 129.6% 119.6% 139.3% 177.1%Best results 35 7 15 15 4 18 4 4
�
Incomplete results�
Wider register
Except for our heuristic and JEDI, the implementations all fail for one or more benchmarks,therefore the overall average and the number of best results do not allow a direct comparison,but only provide an indication. Furthermore, the dynamic latch allocation heuristic and Nothand Kolla’s algorithm produce codes for wider state registers. When compared to the otheralgorithms, this allows for a lower state register switching activities at the cost of extra chip area.Therefore, the results of these algorithms are not suitable for a fair comparison.
The DFS state assignment algorithm is clearly superior to all other algorithms with respect tothe lowest average register switching activity. When we only compare the complete results, theaverage state register switching activity result of the FSM-based DFS is 6.6% lower than the nextbest algorithm, our heuristic. However, the DFS algorithm is computationally time consuming,and even fails to produce (within reasonable time) results for the larger FSMs. The loop-basedDFS state assignment algorithm suffers from much the same problem, and on average it’s resultsare worse than the results of our heuristic.
Our loop-based heuristic state assignment approach is very fast, and with the exception of theDFS state assignment algorithm, the heuristic achieves better results than all the other algorithmswith a fixed width state register. When we only compare the valid results, the average stateregister switching activity result of the heuristic is 8.5% lower than the state of the art POW3algorithm, and 41% lower than the area-based JEDI approach.
When we compare our heuristic to Noth and Kolla’s approach width a variable state registerwidth, our average state register switching activity result is 6.3% higher. Their lower averagecan be contributed largely to the benchmarks for which a wider register is used. Our preliminarystage dynamic heuristic fails to take advantage of variable state register width, and it’s averageresult is worse than that of the standard heuristic. However, Noth and Kolla’s approach showsthe improvements possible using a wider register.
The profiling-based POW3 results show the improvement profiling brings for some bench-marks when compared to the original static approach. However, the results for other benchmarkindicate that the POW3 algorithm is not optimally suited to the profiling-based approach.
The actual objective of state assignment for low power dissipation is not to reduce the stateregister switching activity, but to lower the power consumption of the resulting circuit. Thecircuit switching activity is a good measure for the real circuit’s power dissipation. To be able toaverage the results of the 1000 and 10000 input vector data sets, we divide the measured circuit

4.4. RESULTS 57
switching activity by the length of the data sets to obtain the average circuit switching per inputvector. Table 4.11 shows the resulting average circuit switching activity for all algorithms.
Table 4.11: Overall circuit switching activity
Benchmark DFSLoopDFS Heuristic
DynamicHeuristic
ProfilingPOW3 Noth POW3 JEDI
bbara 4.02 4.16 4.08 � 4.06�
4.06 4.06 4.60bbsse 8.65 8.32 8.85 � - 8.94 7.68 13.43bbtas 1.98 2.25 2.03 � 2.22 1.76 2.80 2.85beecount 3.37 3.46 3.38 � 3.16
�
3.04 3.34 3.76cse 8.88 9.14 8.72 � - 9.81 8.21 10.40dk14 15.09 14.49 15.37 � 13.57 13.66 11.65 15.61dk15 9.29 9.86 9.99 10.14 10.03 9.36 10.61 11.38dk16 - 35.29 37.47 36.90 37.80
�
36.01 36.86 34.61dk17 9.06 8.62 7.83 9.91 8.53 7.17 7.93 10.68dk27 4.82 5.57 4.69 � 4.50 4.67 4.60 5.10dk512 9.60 11.75 11.19 11.24 10.90 10.70 9.57
�
10.24donfile - - - - - - - -ex1 9.82 10.03 9.89 � - 10.42 10.91 14.78ex4 2.99 2.71 3.00 � 3.24 - - 5.01ex6 10.13 12.23 9.41 � 10.06 - - 11.39keyb 16.26 17.94 17.94 � - 14.66 18.92 25.75kirkman 9.29 9.29 8.41 � 8.20 7.53 - 9.55lion 1.57 1.60 1.58 � 1.60 1.57 1.56 1.67lion9 1.49 1.94 2.49
�
� 1.90 1.03 3.36 1.05mark1 8.64 8.58 8.29 8.62 8.58 - - 9.63mc 2.32 2.32 2.32 � 2.32 2.32 2.27 2.27modulo12 - - - - - - - -opus 7.09 8.70 7.49 7.51 9.23 - - 7.48planet - - 35.15
�
38.92�
50.33�
47.53 53.30 66.55pma 8.86 9.29 9.16 � - 7.70 - 12.50s1 - 30.39 33.16 35.95 33.28
�
25.38 30.71 23.68s1488 26.78
�
26.90�
27.33 � - 32.03 27.52�
25.74s1494 27.53
�
26.49 26.69 � - 32.12 - 30.84s208 5.62 6.04 6.00 � - - - 7.17s27 3.54 4.86 4.50 � 3.96 3.39 3.85 2.63s298 - 93.20
�
129.74�
� - 149.22�
- 107.74�
s386 9.00 9.01 9.51 � - 8.29 - 8.81s420 5.64 5.48 6.01 � - - - 8.62s510 - - 12.51 � 16.30 15.74 - 26.56s8 - - - - - - - -s820 17.76 19.56 17.74 � - 14.76 19.51
�
24.18s832 15.43 16.12 18.38 � - 14.85 17.69
�
28.93sand - 35.88
�
37.42 37.52 39.90�
36.68 33.47 39.32scf - - 39.99
�
28.16�
- - - 80.00shiftreg 4.44 4.88 4.80 � 5.54 5.07 4.75 2.50sse 8.65 8.32 8.85 � - 8.94 - 13.43styr 24.67 24.95
�
25.21 � - 16.19 17.77 27.83�
tav 2.50 2.50 2.50 � 2.50 2.50 2.50 3.50tbk - 33.27 33.87 21.45 33.89 20.99 32.09 15.50
�
Incomplete results

58 CHAPTER 4. EXPERIMENTAL RESULTS
Table 4.11: Overall circuit switching activity (Continued)
Benchmark DFSLoopDFS Heuristic
DynamicHeuristic
ProfilingPOW3 Noth POW3 JEDI
tma 2.37 2.52 2.52 2.53 2.73�
2.41 2.42 4.05train11 2.12 2.08 2.32 � 2.08 2.06 2.07 1.96train4 1.14 1.14 1.14 � 1.14 2.13 1.38 1.98Average 7.53 10.01 11.79 11.60 7.63 12.37 12.27 15.23Best results 9 6 5 5 3 13 7 9
�
Incomplete results
Due to the missing and incomplete results, a direct comparison of the overall average and thenumber of best results is not possible, so these values only provide an indication. The low aver-age switching activity of the FSM-based DFS and profiling-based POW3 approaches is mainlythe result of a number of missing high switching activity results.
Our experiments indicate that no algorithm is able to achieve consistent low circuit switchingactivity. On average, the low-power approaches do not perform better than the area-orientedJEDI approach. Furthermore, there is no correlation between the best state register results andthe best circuit switching activity results. Therefore, it seems that the state register switchingactivity is not a good measure for the circuit switching activity.
Overall, the results of the current state assignment algorithms are close together, and the resultsfor the DFS approach show that there is not much room for further improvement when onlythe state register switching activity is considered as metric. This clearly suggest that switchingactivity within the combinatorial circuit should be also included in the cost function utilized inalgorithms for low power FSM state assignment.
Conclusions
In this chapter we summarize the results of our work, highlight our main contributions to thefield of finite state machine state encoding for low power dissipation, and discuss future workfor our approach.
5.1 Summary
Chapter 2 discusses the background of finite state machine (FSM) state assignment for low powerdissipation.
First, we presented several considerations related to power consumption in CMOS digitalcircuits. Next, we introduced FSMs, and we explained FSM state assignment, followed by atypical design approach for FSM circuits, in relation to FSM power consumption. Then weexplained the terminology used in our thesis.
Finally, we presented an historical overview of state assignment algorithms, and we dis-cussed two state of the art low power FSM state assignment algorithms.
In Chapter 3, we proposed a novel low power FSM state assignment approach that consists ofthree steps:�
FSM state profiling: collects dynamic data related to the FSM behavior in the form of astate trace.�Loop detection algorithm: finds the loops in the state trace.�FSM state assignment: generates a state encoding which minimizes the state registerswitching activity utilizing the data gathered in the first two steps.
First, we discussed three strategies for the detection of nested loops. Based on this discussion,we proposed a linear search loop detection algorithm that separately detects simple loops withinnested loops. The algorithm recognizes duplicate loops, and counts the frequency of occurrencesfor each loop.
Second, we assumed that the state register switching activity is the cost metric for the lowpower FSM assignment, and that the width of the state register is fixed to the minimal widthrequired for a valid encoding, and we proposed three loop-based state assignment algorithms asfollows:�
DFS performs an exhaustive (depth-first) search of all possible encodings of the FSM,using the loop data to estimate the intermediate cost of an encoding.�Loop-based DFS performs an exhaustive search of all possible encodings per loop, indescending-weight order of the loops, and with a loop’s weight equal to it’s frequency.
59
60 CHAPTER 5. CONCLUSIONS�
Heuristic assigns the states in the order of occurrence in the loops while minimizing thecost of the state transitions for that state in the loop.
For DFS, we additionaly presented an optimization which utilizes an intermediate cost estimateto reduce the search space.
For Heuristic, we proposed three weight functions for the loops:�
� � � ' $ � � ���1����� � � +�� ,�� � � ' $ � � ���1����� � � +�� � � �������� , where �� �� �/���( is the number of states in the loop, and�� � � ' $ � � ���1����� � � +�� !�"�� , where �� !�"�� � #�&�'*) ) �� ���/���( * .
Based on Heuristic, we also proposed the preliminary stage Dynamic Heuristic, that dynami-cally increases the state register width in an attempt to further reduce the state register switchingactivity.
Finally, we described the C++ framework that we created to implement the proposed stateassignment approach.
In Chapter 4, we proposed an experimental method for the evaluation of FSM state assignmentalgorithm for low power. This method consist of the following steps:
�Setup of the FSM benchmarks from the MCNC/LGSynth ’89 FSM benchmark suite [3],including the generation of random input vector data sets.�FSM profiling and loop detection.�FSM state assignment.�Synthesis of a gate-level circuit using SIS [2].�Simulation of the resulting circuit by Mercury [5].
We discussed the characteristics of the benchmark FSMs, followed by the results of the exper-iments. We compared DFS, Loop-based DFS, and Heuristic with the power-based POW3 [1]algorithm, as well as the area-based JEDI [4] algorithm.
DFS produced the lowest average state register switching activity results of all the algorithmswith a restricted state register width, but the algorithm failed to produce results for large FSMsdue to it’s complexity. The same holds true for Loop-based DFS. Heuristic’s approach wasvery fast, and it achieved better results than the POW3 and JEDI algorithms with respectively8% and 41% lower average state register switching activities.
The variable state register width Noth and Kolla algorithm [6], although it requires a largerstate register, then more area, achieved a 6% reduction when compared with our fixed widthheuristic. This suggests that state algorithms for low power dissipation should use a variablestate register width approach to achieve the largest possible reduction in state register switchingactivity. Our preliminary Dynamic Heuristic is at a too early stage of development to be able tomatch the results of Noth and Kolla’s algorithm.
Our experiments indicated that no current state assignment algorithm that utilizes state regis-ter switching activity as metric for power minimization is able to achieve a consistent reductionin power consumption. This clearly suggests that the switching activity in the state register onlyis not a suitable metric to reduce the power consumption in FSMs. Instead, a metric should beused that also reflects the switching activity in the combinatorial circuit.

5.2. MAIN CONTRIBUTIONS 61
5.2 Main contributions
The main contributions can be summarized as follows:�We have presented a novel loop-based profiling FSM state assignment approach for lowpower dissipation consisting of three steps:
– FSM profiling,
– Loop detection, and
– FSM state assignment.�We have proposed a linear search loop detection algorithm that separately detects simpleloops within nested or intersecting loops.�We have proposed three loop-based FSM state assignment algorithms that minimize theswitching activity in the state register:
– DFS performs an exhaustive search of all possible encodings of the FSM, and usesthe loop data to obtain an intermediate estimate of the cost of an encoding.
– Loop-based DFS performs an exhaustive search of all possible encodings for a sin-gle loop, for all loops in descending-weight order.
– Heuristic assigns the FSM states on-by-one, in the order of occurrence of the stateswithin the loops, while the loops are sorted in descending-weight order. This heuris-tic minimizes the cost of a state assignment for the state transitions to and from thatstate in the current loop.�
We have developed a general C++ framework to implement FSM profiling, loop detectionand FSM state assignment algorithms.�We have proposed a method to compare different state assignment algorithms based uponstate register and circuit switching activity.
In order to evaluate the efficiency of our proposal we compared our approach with other state ofthe art FSM state assignment methods. Our experimental results indicated the following:�
For fixed width state registers, our heuristic state assignment approach showed an 8%reduction in average state register switching activity when compared to the power-basedPOW3 [1] algorithm, and a 41% reduction when compared to the area-based JEDI [4]algorithm.�The variable state register width Noth and Kolla algorithm [6], although it requires a largerstate register, then more area, achieved a 6% reduction when compared with our fixedwidth heuristic. This suggests that state algorithms for low power dissipation should usea variable state register width approach to achieve the largest possible reduction in stateregister switching activity. Our preliminary Dynamic Heuristic is at a too early stage ofdevelopment to be able to match the results of Noth and Kolla’s algorithm.

62 CHAPTER 5. CONCLUSIONS�
Our experiments indicated that no current state assignment algorithm that utilizes stateregister switching activity as metric for power minimization is able to achieve a consistentreduction in power consumption. This clearly suggests that the switching activity in thestate register only is not a suitable metric to reduce the power consumption in FSMs. In-stead, a metric should be used that also reflects the switching activity in the combinatorialcircuit.
5.3 Future work
This study of loop-based profiling FSM state assignment methods leaves some questions unan-swered, and some further possibilities to be explored.
The most important question is the suitability of the state register switching activity as ameasure for the circuit switching activity, a metric that is used by all the current power-basedstate assignment algorithms. An alternative metric should be devised that is easy to be evaluatedand reflects the combinatorical switching activity.
The experimental results show that wider state registers can provide an extra reduction of thestate register switching activity. However, our preliminary stage Dynamic Heuristic approachis unable to take full advantage of this, therefore the heuristic should be developed further.
We have described several methods for the loop detection, and chosen one based on our as-sumptions. These assumptions should be verified, and based on the conclusions, another methodfor the loop detection might be devised.
Finally, we obtained the results from the experiments using randomly generated input se-quences. However, we believe that realistic input data might improve the efficiency of the ap-proach we proposed. Therefore, the experiments should be repeated using FSMs with actualinput sequences.

Bibliography
[1] L. Benini and G. Micheli. State assignment for low power dissipation. IEEE Journal ofSolid-State Circuits, 30:258–268, March 1995. Available from World Wide Web: http://citeseer.nj.nec.com/benini95state.html.
[2] E. M. Sentovich, K. J. Singh, L. Lavagno, C. Moon, R. Murgai, A. Saldanha, H. Savoj, P.R. Stephan, R. K. Brayton and A. Sangiovanni-Vincentelli. SIS: A system for sequentialcircuit synthesis. Technical report, Dept. of Electrical Engineering and Computer Science,University of California, Berkeley, 1992. Available from World Wide Web: http://citeseer.nj.nec.com/sentovich92sis.html.
[3] LGSynth89 Benchmark Suite [online]. Available from World Wide Web: http://www.cbl.ncsu.edu/CBL_Docs/lgs89.html.
[4] B. Lin and A.R. Newton. Synthesis of Multiple Level Logic from Symbolic High-LevelDescription Languages. In Proceedings of the International Conference on VLSI, pages187–196, Munich, August 16 - 18 1989.
[5] G. De Micheli, D.C. Ku, F. Mailhot, and T. Truong. The Olympus Synthesis System forDigital Design. IEEE Design and Test of Computers, pages 37–53, 1990. Available fromWorld Wide Web: http://akebono.stanford.edu/users/cad/synthesis/olympus/doc/olympus.ps.
[6] Winfried Noth and Reiner Kolla. Spanning Tree Based State Encoding for Low PowerDissipation. Technical report, Department of Computer Science, University of Wurzburg,1998. Available from World Wide Web: http://citeseer.nj.nec.com/25222.html.
[7] R. C. Prim. Shortest connection networks and some generalizations. Technical report, BellSystems Technical Journal, 1957.
[8] Tiziano Villa and Alberto L. Sangiovanni-Vincentelli. NOVA: State Assignment of FiniteState Machines for Optimal Two-level Logic Implementations. In Proceedings of the 198926th ACM/IEEE conference on Design automation conference, pages 327–332, 1989.
63

64 BIBLIOGRAPHY
Curriculum Vitae
Robbert Eggermont was born in Amsterdam, theNetherlands, on November 12 1973. He attendedthe Alfrink College high school in Zoetermeer, fromwhich he graduated in 1992. In the same year, he wasadmitted to Electrical Engineering faculty of the DelftUniversity of Technology in the Netherlands. Afterreceiving his Bachelor degree, he joined the Com-puter Engineering laboratory, led by professor Stama-tis Vassiliadis, to start his MSc graduation project un-der the supervision of professor Sorin Cotofana. Histhesis was titled PROSA: Profiling-based State As-signment for Low Power Dissipation. His researchinterests include computer architecture and networks.
Related Documents